Table of Contents
UNITED STATES
SECURITIES AND EXCHANGE COMMISSION
Washington, D.C. 20549
FORM N-CSR
CERTIFIED SHAREHOLDER REPORT OF REGISTERED
MANAGEMENT INVESTMENT COMPANIES
Investment Company Act file number: 811-06557
RidgeWorth Funds
(Exact name of registrant as specified in charter)
RidgeWorth Capital Management LLC
3333 Piedmont Road, Suite 1500
Atlanta, GA 30305
(Address of principal executive offices)(Zip code)
| (Name and Address of Agent for Service) | Copy to: | |
Julia R. Short RidgeWorth Funds 3333 Piedmont Road, Suite 1500 Atlanta, GA 30305 | W. John McGuire, Esq. Thomas S. Harman, Esq. Morgan, Lewis & Bockius LLP 1111 Pennsylvania Avenue, NW Washington, DC 20004 |
Registrant’s telephone number, including area code: 1-888-784-3863
Date of fiscal year end: March 31
Date of reporting period: March 31, 2016
Table of Contents
Item 1. Reports to Shareholders.
Table of Contents

2016 ANNUAL REPORT
EQUITY FUNDS
MARCH 31, 2016

RidgeWorth Investments is the trade name of RidgeWorth Capital Management LLC.
Table of Contents
RIDGEWORTH FUNDS March 31, 2016
| Letter to Shareholders | 1 | |||
| Management Discussion of Fund Performance | ||||
| Equity Funds: | ||||
| 2 | ||||
Capital Innovations Global Resources and Infrastructure Fund | 4 | |||
| 6 | ||||
| 8 | ||||
| 10 | ||||
| 12 | ||||
| 14 | ||||
| 16 | ||||
| Allocation Strategies: | ||||
| 18 | ||||
| 20 | ||||
| 22 | ||||
| 24 | ||||
| Financial Statements | ||||
| Schedules of Portfolio Investments | 26 | |||
| Statements of Assets and Liabilities | 43 | |||
| Statements of Operations | 46 | |||
| Statements of Changes in Net Assets | 50 | |||
| Financial Highlights | 55 | |||
| Notes to Financial Statements | 62 | |||
| Report of Independent Registered Public Accounting Firm | 83 | |||
| Other Information | ||||
| Other Federal Tax Information | 84 | |||
| Trustees and Officers of the RidgeWorth Funds | 86 | |||
| Additional Information | 91 | |||
Table of Contents
RIDGEWORTH FUNDS March 31, 2016
Dear Valued Shareholder,
We sincerely thank you for your continued business and support. Our primary objective is to help you achieve your investment goals, and we’re grateful you have placed your confidence in us. We aim to earn your trust through competitive investment performance and excellent client service. We hope we have met your expectations in both of these measures, and we look forward to continuing to serve as your asset manager in the months and years to come.
During the 12 months through March 31, 2016, the U.S. economy continued to grow, albeit at a slower pace than last year. The U.S. Federal Reserve in December 2015 took its first steps toward unwinding its long-running stimulus efforts, raising the federal funds rate by 25 basis points. However, the relatively weak improvement of the U.S. economy suggests that the Fed will move slowly to raise interest rates in the near term.
Two major themes during the period were the sharp decline in commodity prices and the strength of the U.S. dollar. These factors caused corporate earnings to struggle, posing headwinds for stocks. However, these headwinds currently appear to be ebbing as commodity prices—particularly the price of oil—have rebounded and the dollar has given back some of the considerable gains experienced since 2014.
Outside the U.S., countries such as China and Brazil struggled to realign economic priorities, contain excess debt and limit political turmoil, while slow economic growth challenged the euro zone. Central banks in many international markets adopted increasingly aggressive stimulus measures. We remain concerned that monetary policies abroad may be nearing the limits of their effectiveness, and we believe the decision by the European Central Bank and other central banks to push interest rates into uncharted negative territory has the potential to disrupt the global economy. We do expect, however, international developed markets to continue to recover, due in part to the continued strength of the U.S. economy, which is shouldering much of the burden of the global economic recovery.
Looking ahead, we believe bond yields will remain relatively low, but the Fed’s intention is to normalize monetary policy. The decline in commodity prices stoked concerns about certain bond issuers over the past year, especially those in the energy sector. This year will be key in terms of observing which ones will be able to service their debt.
Our outlook for the equity markets remains favorable, but with increased volatility due to the presidential race and global macro-headlines. We see opportunities in all equity styles. Finally, we continue to believe that a gradually firming economic environment will offer fresh opportunities to selective investors. We expect this opportunistic environment should mesh well with RidgeWorth’s bottom-up approach to security selection. We at RidgeWorth wish to thank you again for the trust and confidence you have placed in us, and we look forward to another successful year together.
Sincerely,

Ashi Parikh
Chief Executive Officer, Chief Investment Officer
RidgeWorth Investments
1
Table of Contents
Portfolio Managers
| • | Nancy Zevenbergen, CFA, CIC |
| • | Brooke de Boutray, CFA, CIC |
| • | Leslie Tubbs, CFA, CIC |
INVESTMENT CONCERNS
Equity securities (stocks) are more volatile and carry more risk than other forms of investments, including investments in high-grade fixed income securities. The net asset value per share of this Fund will fluctuate as the value of the securities in the portfolio changes. Common stocks, and funds investing in common stocks, generally provide greater return potential when compared with other types of investments.
Small- and mid-capitalization funds typically carry additional risks as smaller companies generally have a higher risk of failure.
MANAGEMENT DISCUSSION OF FUND PERFORMANCE
How did the Fund perform against its benchmark for the fiscal year ended March 31, 2016?
The Aggressive Growth Stock Fund (I Shares) returned -4.74%. That compared to a 1.34% return for the Russell 3000® Growth Index.
What factors influenced the Fund’s performance for the fiscal year ended March 31, 2016?
Global and domestic economic mayhem created two record-level spikes in equity volatility during the 12-month period. The Fund’s higher beta holdings bore the brunt of selling pressure. While the Fund rebounded significantly two out of four quarters, gains were not enough to compensate for the remaining quarters’ weakness, and absolute returns suffered during the 12 months through March 31, 2016.
The Fund’s underperformance relative to its benchmark was attributable to active stock selection in the financial services, healthcare and technology sectors. Consumer discretionary holdings added positive excess returns.
Among the Fund’s key detractors: XPO Logistics, Inc., underperformed amid negative response to acquisitions and exposure to the industrial business cycle. Chinese macroeconomic issues and competitor-related concerns were reflected in Vipshop Holdings Limited share performance. While concerns over possible legal and regulatory issues pressured shares of LendingClub Corporation.
Key contributors to relative returns included the following: Netflix, Inc., exceeded domestic and international subscriber guidance, while delivering profitability in new markets. Amazon.com, Inc., achieved record revenues through growth in web services, fulfillment and third-party seller participation. Tesla Motors, Inc., shares advanced on unit volume growth, ahead-of-schedule build-out for its Gigafactory and anticipation of its Model 3 automobile debut.
How do you plan to position the Fund, based on market conditions?
Underperformance in the Fund does not necessarily lead us to make position changes as we continue to focus on company fundamentals. Many of the same companies that underperformed during the past year are still in the portfolio, and given the pull-back in stock prices, represent good potential drivers to future returns.
In times of significant stock volatility, we find great comfort in companies with excellent management teams— especially those that are founder-led. These companies tend to be more innovative, likely to make bold investments to renew or adapt business models and demonstrate a willingness to take risk to invent the future. An owner’s mindset is imperative, with speed to act and personal responsibility for risk and cost—a key strategic asset. Nearly 70% of the Fund’s holdings have founders among its leadership teams.
Investors likely still harbor excessive pessimism: Recent short interest figures are higher than the March 2009 nadir. As yet another panic and recovery demonstrates, the price of overreaction—and non-participation—may be the difference between exceeding objectives and being left in the dust. Invest with conviction.
2
Table of Contents
AGGRESSIVE GROWTH STOCK FUND
Growth of a $10,000 Investment (as of March 31, 2016)
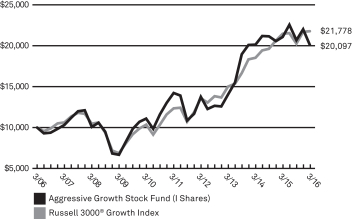 | This chart assumes an initial hypothetical investment of $10,000 made on 3/31/06. Total return is based on net change in the Net Asset Value (“NAV”) assuming reinvestment of distributions. Returns shown on this page include reinvestment of all dividends and other distributions.
The Fund’s performance is compared to the Russell 3000® Growth Index, which measures the performance of the broad growth segment of the U.S. equity universe. It includes those Russell 3000® companies with higher price-to-book ratios and higher forecasted growth values. The Index is unmanaged and does not reflect the deduction of fees, such as investment and fund accounting fees, associated with a mutual fund. Investors cannot invest directly in an index. Frank Russell Company is the source and owner of the trademarks, service marks and copyrights related to the Russell Indexes. Russell® is a trademark of Frank Russell Company. |
| Average Annual Total Returns as of 3/31/16 | ||||||||||||||||||
| Aggressive Growth Stock Fund | 1 Year | 3 Year | 5 Year | 10 Year | ||||||||||||||
A Shares | without sales charge | –4.96% | 12.51% | 6.92% | 6.96% | |||||||||||||
| with sales charge* | –10.44% | 10.32% | 5.66% | 6.33% | ||||||||||||||
I Shares | –4.74% | 12.72% | 7.15% | 7.23% | ||||||||||||||
| Russell 3000® Growth Index | 1.34% | 13.16% | 12.00% | 8.09% | ||||||||||||||
| Prospectus Expense Ratio1 | Gross | |||||||||||||||||
| A Shares | 1.45% | |||||||||||||||||
| I Shares | 1.34% | |||||||||||||||||
Because equity markets may be volatile in the short-term, resulting in unusually high or low performance, investors should evaluate long-term performance before making an investment.
The Adviser has contractually agreed to waive fees and reimburse expenses until at least August 1, 2016 in order to keep total operating expenses (excluding underlying fund fees and expenses) from exceeding 1.50% and 1.30% for A and I Shares, respectively. Without these fee waivers, performance would have been lower.
Past performance does not guarantee future results. The performance data quoted represents past performance and current returns may be lower or higher. Total return figures include change in share price, reinvestment of dividends and capital gains and do not reflect taxes that a shareholder would pay on fund distributions or on the redemption of fund shares. The investment return and principal value will fluctuate so that an investor’s shares, when redeemed, may be worth more or less than the original cost. For performance data current to the most recent month end, visit our website at www.ridgeworth.com.
| * | Class A Share performance reflects the maximum front-end sales charge of 5.75%. |
| 1 | This information is included in the most current prospectus available to current and prospective shareholders of the Fund. Additional information pertaining to the 3/31/16 expense ratios can be found in the financial highlights. |
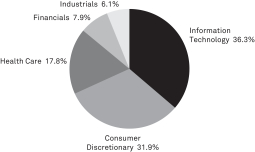
Sector Weightings (as of March 31, 2016)
as a percentage of investments
3
Table of Contents
CAPITAL INNOVATIONS GLOBAL RESOURCES AND INFRASTRUCTURE FUND
Portfolio Managers
| • | Michael D. Underhill |
| • | Susan L. Dambekaln |
INVESTMENT CONCERNS
Companies within the infrastructure, agribusiness and timber industries are susceptible to adverse economic or regulatory factors which may affect the Fund’s performance.
Equity securities (stocks) are more volatile and carry more risk than other forms of investments, including investments in high-grade fixed income securities. The net asset value per share of this Fund will fluctuate as the value of the securities in the portfolio changes. Common stocks, and funds investing in common stocks, generally provide greater return potential when compared with other types of investments.
Small- and Mid-capitalization funds typically carry additional risks since smaller companies generally have a higher risk of failure.
Large-capitalization stocks can perform differently from other segments of the equity market or the equity market as a whole. Large capitalization companies may be less flexible in evolving markets or unable to implement change as quickly as smaller capitalization companies.
MANAGEMENT DISCUSSION OF FUND PERFORMANCE
How did the Fund perform against its benchmark for the period ended March 31, 2016?
The Capital Innovations Global Resources and Infrastructure Fund (I Shares) delivered a -20.48% return. That compared to a -15.30% return for the S&P Global Natural Resources Index.
What factors influenced the Fund’s performance for the period ended March 31, 2016?
The U.S. dollar gained against most major currencies during the period under review, while commodity prices declined substantially. Oil prices in particular declined sharply; major Middle East oil-producing nations maintained production levels while North American drillers decreased output. This environment contributed to the Fund’s negative absolute returns.
The Fund’s relative performance was hurt by an overweight position in the paper and forest products industry, which was impacted by investors’ fears about falling prices. Exposure to cyclical commodities also detracted from performance, as fertilizers, containerboard and timber came under pressure during the first three quarters of the period. In particular, oversupply of fertilizer, especially in China and India, pushed down fertilizer producers’ valuations. Exposure to shares of a global energy firm detracted from relative performance, as concerns mounted over its long-term earnings ability. An investment in a Texas energy infrastructure company also dragged on the Fund’s returns, as its shares declined following a dividend cut in response to the falling price of crude oil.
An underweight position in metals and mining stocks—part of the materials sector—helped the Fund’s relative returns. That said, the Fund benefited from an overweight position in a Canadian gold mining firm, as fears about a potential global recession drove up prices for gold and shares of gold-mining firms. An underweight position in a multinational metals, mining and petroleum firm also helped performance relative to the benchmark, as the company’s shares dropped following an accident at one of its facilities. In addition, an underweight position in a diversified metals and commodities producer aided relative performance, as investors grew concerned about the firm’s ability to repay its debt.
How do you plan to position the Fund, based on market conditions?
We remain moderately upbeat about the global economic outlook, even as investor skepticism remains widespread. We expect industrial production growth to solidify gradually over the next several months, which we believe will provide a tailwind for commodity demand and prices. In addition, as global growth concerns dwindle we expect commodity prices to move higher.
Our research indicates that we are in the later stages of the economic cycle. As a result, inflation may become more of a concern going forward. Within this framework, sectors such as energy and commodities tend to benefit.
4
Table of Contents
CAPITAL INNOVATIONS GLOBAL RESOURCES AND INFRASTRUCTURE FUND
Growth of a $10,000 Investment (as of March 31, 2016)
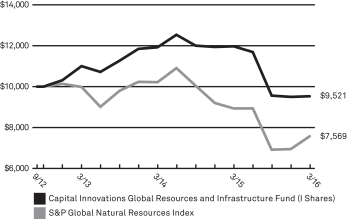 | This chart assumes an initial hypothetical investment of $10,000 made on 9/28/12 (inception date of Predecessor Fund). Total return is based on net change in the Net Asset Value (“NAV”) assuming reinvestment of distributions. Returns shown on this page include reinvestment of all dividends and other distributions.
The Fund’s performance is compared to the S&P Global Natural Resources Index. S&P Global Natural Resources Sector Index includes 90 of the largest publicly-traded companies in natural resources and commodities businesses that meet specific investability requirements, offering investors diversified and investable equity exposure across three primary commodity-related sectors: agribusiness, energy, and metals & mining. Investors cannot invest directly in an index. |
| Average Annual Total Returns as of 3/31/16 | ||||||||||||
| Capital Innovations Global Resources and Infrastructure Fund | 1 Year | 3 Year | Since Inception | |||||||||
A Shares | without sales charge | –20.60% | –4.91% | –1.63% | ||||||||
| with sales charge* | –25.18% | –6.77% | –3.27% | |||||||||
C Shares | without CDSC | –21.25% | –5.64% | –2.37% | ||||||||
| with CDSC* | –22.02% | –5.64% | –2.37% | |||||||||
I Shares | –20.48% | –4.70% | –1.39% | |||||||||
| S&P Global Natural Resources Index | –15.30% | –8.78% | –7.65% | |||||||||
| Prospectus Expense Ratio1 | Gross | |||||||||||
| A Shares | 2.73% | |||||||||||
| C Shares | 3.33% | |||||||||||
| I Shares | 2.48% | |||||||||||
Because equity markets may be volatile in the short-term, resulting in unusually high or low performance, investors should evaluate long-term performance before making an investment.
The Adviser has contractually agreed to waive fees and reimburse expenses until at least August 1, 2016 in order to keep total operating expenses (excluding underlying fund fees and expenses) from exceeding 1.40%, 2.15% and 1.15% for A, C and I Shares, respectively. Without these fee waivers, performance would have been lower.
Past performance does not guarantee future results. The performance data quoted represents past performance and current returns may be lower or higher. Total return figures include change in share price, reinvestment of dividends and capital gains and do not reflect taxes that a shareholder would pay on fund distributions or on the redemption of fund shares. The investment return and principal value will fluctuate so that an investor’s shares, when redeemed, may be worth more or less than the original cost. For performance data current to the most recent month end, visit our website at www.ridgeworth.com.
| * | Class A Share performance reflects the maximum front-end sales charge of 5.75% and Class C Shares reflect the maximum CDSC (contingent deferred sales charge) of 1.00% in year one only. |
| 1 | This information is included in the most current prospectus available to current and prospective shareholders of the Fund. Additional information pertaining to the 3/31/16 expense ratios can be found in the financial highlights. |
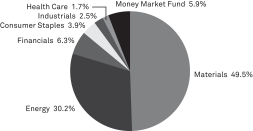
Sector Weightings (as of March 31, 2016)
as a percentage of investments
5
Table of Contents
Portfolio Managers
| • | Paul R. Black |
| • | Peter J. Hunkel |
| • | Michael B. Trigg |
| • | Kurt R. Winrich |
INVESTMENT CONCERNS
International investing involves increased risk and volatility.
Equity securities (stocks) are more volatile and carry more risk than other forms of investments, including investments in high-grade fixed income securities. The net asset value per share of this Fund will fluctuate as the value of the securities in the portfolio changes.
MANAGEMENT DISCUSSION OF FUND PERFORMANCE
How did the Fund perform against its benchmark for the fiscal year ended March 31, 2016?
The International Equity Fund (I Shares) delivered a -1.59% return. That compared to a -9.19% for the MSCI ACWI Ex-U.S. Index.
What factors influenced the Fund’s performance for the fiscal year ended March 31, 2016?
International equity markets generally declined during the period under review. Concerns about the health of the euro zone economy prompted the European Central Bank (ECB) to strengthen stimulus measures intended to spur economic growth. Other central banks around the world, including in China and Japan, also adopted stimulus measures to prop up weak economies. Meanwhile, flagging commodity prices, including sharp declines in the price of oil, put pressure on emerging markets. The U.S. dollar gained against most major currencies, and U.S. stocks outperformed international stocks. In this environment, strong stock selection helped the Fund post positive absolute returns.
The Fund’s relative performance also benefited from effective stock selection. Individual holdings in the health care, information technology and materials sectors particularly helped the Fund out-perform its benchmark. Shares of two Danish companies generated especially strong results. One, a developer of natural ingredients, enjoyed strong demand for its products, especially animal feed; the other, a provider of kidney, gastroenterology, and other intimate health care products and services, debuted a new product in collaboration with another Danish medical technology company. A Canadian software company and a Japanese electronics manufacturer also boosted the Fund’s relative return.
The Fund’s bottom-up structural biases—underweight positions in the financial and energy sectors, and overweight positions in information technology and consumer staples—benefited its return relative to the benchmark. Consumer staples was the best-performing sector in the index, while financial services was the second-worst.
The Fund’s relative performance was dampened by the selection of industrial stocks, chiefly exposure to a Dutch manufacturer of sensors and to a Canadian railway line that failed in its acquisition bid of an American railroad. From a sector perspective, our overweight position in health care and underweight position in telecommunications and utilities softened the Fund’s performance.
How do you plan to position the Fund, based on market conditions?
The firm plans to maintain its bottom-up sector biases, with an overweight position in information technology, health care, and consumer staples, and an underweight position in financial services, energy and telecommunications. We will continue to focus on stock selection through our bottom-up investment approach.
6
Table of Contents
INTERNATIONAL EQUITY FUND
Growth of a $10,000 Investment (as of March 31, 2016)
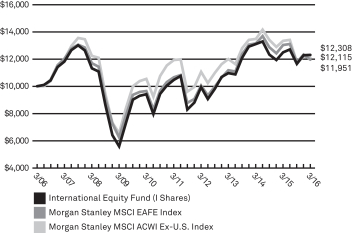 | This chart assumes an initial hypothetical investment of $10,000 made on 3/31/06. Total return is based on net change in the Net Asset Value (“NAV”) assuming reinvestment of distributions. Returns shown on this page include reinvestment of all dividends and other distributions.
Effective September 1, 2015 the benchmark index for the Fund changed from the Morgan Stanley Capital International Europe, Australasia and Far East (“MSCI EAFE”) Index to the Morgan Stanley Capital International All Country World Index excluding United States Index (“MSCI ACWI ex-U.S.”) in connection with the change of the Fund’s Subadviser and related investment strategy changes.
MSCI ACWI Ex-U.S. is a market capitalization-weighted index maintained by Morgan Stanley Capital International (MSCI) and designed to provide a broad measure of stock performance throughout the world, with the exception of U.S.-based companies. The MSCI All Country World Index Ex-U.S. includes both developed and emerging markets. MSCI EAFE Index is a free float-adjusted market capitalization index that is designed to measure the equity market performance of developed markets, excluding the U.S. & Canada. The MSCI EAFE Index consists of 21 developed market country indices. EAFE performance data is calculated in U.S. dollars and in local currency. |
| Average Annual Total Returns as of 3/31/16 | ||||||||||||||||
| International Equity Fund | 1 Year | 3 Year | 5 Year | 10 Year | ||||||||||||
A Shares | without sales charge | –1.77% | 3.81% | 3.06% | 1.86% | |||||||||||
| with sales charge* | –7.41% | 1.79% | 1.85% | 1.26% | ||||||||||||
I Shares | –1.59% | 3.91% | 3.25% | 2.10% | ||||||||||||
IS Shares** | –1.49% | 3.95% | 3.28% | 2.11% | ||||||||||||
| Morgan Stanley MSCI ACWI Ex-U.S. Index | –9.19% | 0.32% | 0.31% | 1.94% | ||||||||||||
| Morgan Stanley MSCI EAFE Index | –8.27% | 2.23% | 2.29% | 1.80% | ||||||||||||
| Prospectus Expense Ratio1 | Gross | |||||||||||||||
| A Shares | 1.57% | |||||||||||||||
| I Shares | 1.39% | |||||||||||||||
| IS Shares | 1.26% | |||||||||||||||
Because equity markets may be volatile in the short-term, resulting in unusually high or low performance, investors should evaluate long-term performance before making an investment.
The Adviser has contractually agreed to waive fees and reimburse expenses until at least September 1, 2016 in order to keep total operating expenses (excluding underlying fund fees and expenses) from exceeding 1.50%, 1.25% and 1.10% for A, I and IS Shares, respectively. Without these fee waivers, performance would have been lower.
Past performance does not guarantee future results. The performance data quoted represents past performance and current returns may be lower or higher. Total return figures include change in share price, reinvestment of dividends and capital gains and do not reflect taxes that a shareholder would pay on fund distributions or on the redemption of fund shares. The investment return and principal value will fluctuate so that an investor’s shares, when redeemed, may be worth more or less than the original cost. For performance data current to the most recent month end, visit our website at www.ridgeworth.com.
| * | Class A Share performance reflects the maximum front-end sales charge of 5.75%. |
| ** | IS Shares were offered beginning on 9/1/15. The performance shown prior to such dates is based on performance of the I Shares of the Fund, and has not been adjusted to reflect IS Share expenses. If it had been, performance would have been higher. |
| 1 | This information is included in the most current prospectus available to current and prospective shareholders of the Fund. Additional information pertaining to the 3/31/16 expense ratios can be found in the financial highlights. |
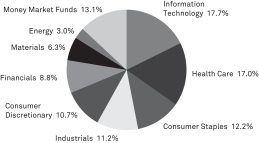
Sector Weightings (as of March 31, 2016)
as a percentage of investments
7
Table of Contents
Portfolio Managers
| • | Michael A. Sansoterra |
| • | Sandeep Bhatia, PhD, CFA |
INVESTMENT CONCERNS
Equity securities (stocks) are more volatile and carry more risk than other forms of investments, including investments in high-grade fixed income securities. The net asset value per share of this Fund will fluctuate as the value of the securities in the portfolio changes. Common stocks, and funds investing in common stocks, generally provide greater return potential when compared with other types of investments.
Small- and Mid-capitalization funds typically carry additional risks since smaller companies generally have a higher risk of failure.
Large-capitalization stocks can perform differently from other segments of the equity market or the equity market as a whole. Large capitalization companies may be less flexible in evolving markets or unable to implement change as quickly as smaller capitalization companies.
MANAGEMENT DISCUSSION OF FUND PERFORMANCE
How did the Fund perform against its benchmark for the fiscal year ended March 31, 2016?
The Large Cap Growth Stock Fund (I Shares) returned -1.79%. That compared to a 2.52% return for the Russell 1000 Growth Index.
What factors influenced the Fund’s performance for the fiscal year ended March 31, 2016?
The period was marked by economic challenges both domestically and internationally. Investors worried about slowing economic growth in the U.S., Europe and China, as well as about volatile commodities prices and the U.S. Federal Reserve’s interest rate strategy. These factors contributed to record-level spikes in market volatility during the 12-month period. The Fund’s absolute returns suffered in this environment.
The majority of the Fund’s underperformance relative to the benchmark index was due to stock selection within the consumer staples, financials and healthcare sectors. The healthcare sector was the largest relative underperformer, as biotechnology stocks sold off amid election-year rhetoric about prescription drug price controls.
The Fund’s relative performance also suffered from lack of exposure to the telecommunications sector, which led sector performance during the period under review. An underweight position in consumer staples relative to the benchmark also dragged on performance. In addition, a position in a major financial services firm hurt relative returns.
How do you plan to position the Fund, based on market conditions?
The portfolio managers seek to eliminate investment results that are directly attributed to market conditions, and instead attempt to drive performance through stock selection. Therefore, the Fund will continue to invest in companies with reasonable valuations and improving fundamentals. Generally, we look for companies that have shown year-over-year increases in operating margins, revenue growth and return on incremental invested capital. By combining income statement, balance sheet and cash flow metrics to evaluate earnings quality, capital efficiency and relative valuations, we can avoid making investment decisions based on a single factor.
8
Table of Contents
LARGE CAP GROWTH STOCK FUND
Growth of a $10,000 Investment (as of March 31, 2016)
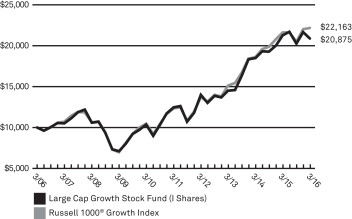 | This chart assumes an initial hypothetical investment of $10,000 made on 3/31/06. Total return is based on net change in the Net Asset Value (“NAV”) assuming reinvestment of distributions. Returns shown on this page include reinvestment of all dividends and other distributions.
The Fund’s performance is compared to the Russell 1000® Growth Index, which measures the performance of the large-cap growth segment of the U.S. equity universe. It includes those Russell 1000® companies with higher price-to-book ratios and higher forecasted growth values. The Index is unmanaged and does not reflect the deduction of fees, such as investment and fund accounting fees, associated with a mutual fund. Investors cannot invest directly in an index. Frank Russell Company is the source and owner of the trademarks, service marks and copyrights related to the Russell Indexes. Russell® is a trademark of Frank Russell Company. |
| Average Annual Total Returns as of 3/31/16 | ||||||||||||||||||
| Large Cap Growth Stock Fund | 1 Year | 3 Year | 5 Year | 10 Year | ||||||||||||||
A Shares | without sales charge | –2.13% | 12.59% | 10.53% | 7.33% | |||||||||||||
| with sales charge* | –7.72% | 10.40% | 9.24% | 6.70% | ||||||||||||||
C Shares | without CDSC | –2.77% | 11.87% | 9.79% | 6.60% | |||||||||||||
| with CDSC* | –3.62% | 11.87% | 9.79% | 6.60% | ||||||||||||||
I Shares | –1.79% | 12.89% | 10.83% | 7.64% | ||||||||||||||
IS Shares** | –1.80% | 12.92% | 10.84% | 7.65% | ||||||||||||||
| Russell 1000® Growth Index | 2.52% | 13.61% | 12.38% | 8.28% | ||||||||||||||
| Prospectus Expense Ratio1 | Gross | |||||||||||||||||
| A Shares | 1.19% | |||||||||||||||||
| C Shares | 1.87% | |||||||||||||||||
| I Shares | 1.17% | |||||||||||||||||
| IS Shares | 0.87% | |||||||||||||||||
Because equity markets may be volatile in the short-term, resulting in unusually high or low performance, investors should evaluate long-term performance before making an investment.
The Adviser has contractually agreed to waive fees and reimburse expenses until at least August 1, 2016 in order to keep total operating expenses (excluding underlying fund fees and expenses) from exceeding 1.25%, 1.95%, 0.97% and 0.90% for A, C, I and IS Shares, respectively. Without these fee waivers, performance would have been lower.
Past performance does not guarantee future results. The performance data quoted represents past performance and current returns may be lower or higher. Total return figures include change in share price, reinvestment of dividends and capital gains and do not reflect taxes that a shareholder would pay on fund distributions or on the redemption of fund shares. The investment return and principal value will fluctuate so that an investor’s shares, when redeemed, may be worth more or less than the original cost. For performance data current to the most recent month end, visit our website at www.ridgeworth.com.
| * | Class A Share performance reflects the maximum front-end sales charge of 5.75% and Class C Shares reflect the maximum CDSC (contingent deferred sales charge) of 1.00% in year one only. |
| ** | IS Shares were offered beginning on 8/1/14. The performance shown prior to such dates is based on performance of the I Shares of the Fund, and has not been adjusted to reflect IS Share expenses. If it had been, performance would have been higher. |
| 1 | This information is included in the most current prospectus available to current and prospective shareholders of the Fund. Additional information pertaining to the 3/31/16 expense ratios can be found in the financial highlights. |
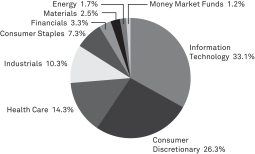
Sector Weightings (as of March 31, 2016)
as a percentage of investments
9
Table of Contents
Portfolio Manager
| • | Mills Riddick, CFA |
INVESTMENT CONCERNS
Equity securities (stocks) are more volatile and carry more risk than other forms of investments, including investments in high-grade fixed income securities. The net asset value per share of this Fund will fluctuate as the value of the securities in the portfolio changes.
Value-based investments are subject to the risk that the broad market may not recognize their intrinsic value.
MANAGEMENT DISCUSSION OF FUND PERFORMANCE
How did the Fund perform against its benchmark for the fiscal year ended March 31, 2016?
The Large Cap Value Equity Fund (I Shares) delivered a -2.19% return. That compared to a -1.54% return for the Russell 1000 Value Index.
What factors influenced the Fund’s performance for the fiscal year ended March 31, 2016?
During the 12-month period, stocks faced major headwinds, including debt negotiations between Greece and the euro zone, Puerto Rico’s debt restructuring, re-emerging volatility in oil prices, and anxiety surrounding the U.S. Federal Reserve’s strategy for raising interest rates. Instability in international and U.S. markets weighed on the Fund’s absolute returns.
The portfolio management team does not attempt to position the Fund based on predictions of macro-economic conditions. The Fund employs a bottom-up investment approach to stock selection that seeks out dividend-paying stocks trading at the lower end of their historical trading ranges, and which display characteristics of financial strength and possess an improving fundamental situation. The Fund does not make active sector allocations but allows its bottom-up investment process to define sector weights.
The Fund’s relative performance was hurt by underweight positions in the consumer staples and utilities sectors. Exposure to three energy companies during a time of volatility in that sector detracted from relative performance, as did holdings in a global mass media company and a financial services company.
The Fund benefited from individual exposure to shares of a leading technology and software company, a healthcare company, a telecommunications company, and a supplier of semiconductor materials.
How do you plan to position the Fund, based on market conditions?
We will continue to maintain our disciplined, bottom-up fundamental stock analysis when choosing investments for the Fund. Our investment philosophy seeks out investments that meet three key criteria: the existence of a dividend, low valuations and improving fundamentals. In the current environment, we expect to maintain a pro-cyclical bias that includes overweight positions in the information technology and healthcare sectors, and underweight positions in the utilities and consumer staples sectors.
10
Table of Contents
LARGE CAP VALUE EQUITY FUND
Growth of a $10,000 Investment (as of March 31, 2016)
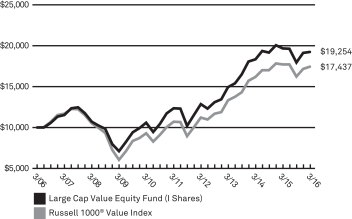 | This chart assumes an initial hypothetical investment of $10,000 made on 3/31/06. Total return is based on net change in the Net Asset Value (“NAV”) assuming reinvestment of distributions. Returns shown on this page include reinvestment of all dividends and other distributions.
The Fund’s performance is compared to the Russell 1000® Value Index, which measures the performance of the large-cap value segment of the U.S. equity universe. It includes those Russell 1000® companies with lower price-to-book ratios and lower expected growth values. The Index is unmanaged and does not reflect the deduction of fees, such as investment and fund accounting fees, associated with a mutual fund. Investors cannot invest directly in an index. Frank Russell Company is the source and owner of the trademarks, service marks and copyrights related to the Russell Indexes. Russell® is a trademark of Frank Russell Company. |
| Average Annual Total Returns as of 3/31/16 | ||||||||||||||||
| Large Cap Value Equity Fund | 1 Year | 3 Year | 5 Year | 10 Year | ||||||||||||
A Shares | without sales charge | –2.46% | 8.55% | 8.96% | 6.46% | |||||||||||
| with sales charge* | –8.09% | 6.42% | 7.68% | 5.83% | ||||||||||||
C Shares | without CDSC | –2.88% | 8.06% | 8.38% | 5.80% | |||||||||||
| with CDSC* | –3.76% | 8.06% | 8.38% | 5.80% | ||||||||||||
I Shares | –2.19% | 8.85% | 9.27% | 6.77% | ||||||||||||
IS Shares** | –1.90% | 9.03% | 9.38% | 6.82% | ||||||||||||
| Russell 1000® Value Index | –1.54% | 9.38% | 10.25% | 5.72% | ||||||||||||
| Prospectus Expense Ratio1 | Gross | |||||||||||||||
| A Shares | 1.36% | |||||||||||||||
| C Shares | 1.71% | |||||||||||||||
| I Shares | 1.07% | |||||||||||||||
| IS Shares | 0.71% | |||||||||||||||
Because equity markets may be volatile in the short-term, resulting in unusually high or low performance, investors should evaluate long-term performance before making an investment.
The Adviser has contractually agreed to waive fees and reimburse expenses until at least August 1, 2016 in order to keep total operating expenses (excluding underlying fund fees and expenses) from exceeding 1.27%, 1.97%, 0.97% and 0.85% for A, C, I and IS Shares, respectively. Without these fee waivers, performance would have been lower.
Past performance does not guarantee future results. The performance data quoted represents past performance and current returns may be lower or higher. Total return figures include change in share price, reinvestment of dividends and capital gains and do not reflect taxes that a shareholder would pay on fund distributions or on the redemption of fund shares. The investment return and principal value will fluctuate so that an investor’s shares, when redeemed, may be worth more or less than the original cost. For performance data current to the most recent month end, visit our website at www.ridgeworth.com.
| * | Class A Share performance reflects the maximum front-end sales charge of 5.75% and Class C Shares reflect the maximum CDSC (contingent deferred sales charge) of 1.00% in year one only. |
| ** | IS Shares were offered beginning on 8/1/14. The performance shown prior to such dates is based on performance of the I Shares of the Fund, and has not been adjusted to reflect IS Share expenses. If it had been, performance would have been higher. |
| 1 | This information is included in the most current prospectus available to current and prospective shareholders of the Fund. Additional information pertaining to the 3/31/16 expense ratios can be found in the financial highlights. |
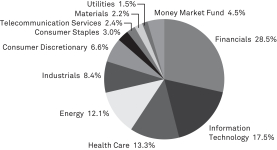
Sector Weightings (as of March 31, 2016)
as a percentage of investments
11
Table of Contents
Portfolio Manager
| • | Don Wordell, CFA |
INVESTMENT CONCERNS
Equity securities (stocks) are more volatile and carry more risk than other forms of investments, including investments in high-grade fixed income securities. The net asset value per share of this Fund will fluctuate as the value of the securities in the portfolio changes.
Mid-capitalization funds typically carry additional risks since smaller companies generally have a higher risk of failure.
Value-based investments are subject to the risk that the broad market may not recognize their intrinsic value.
MANAGEMENT DISCUSSION OF FUND PERFORMANCE
How did the Fund perform against its benchmark for the fiscal year ended March 31, 2016?
The Mid-Cap Value Equity Fund (I Shares) delivered a -3.85% return. That compared to a -3.39% return for the Russell Midcap Value Index.
What factors influenced the Fund’s performance for the fiscal year ended March 31, 2016?
During the 12-month period, stocks faced major headwinds, including debt negotiations between Greece and the euro zone, Puerto Rico’s debt restructuring, re-emerging volatility in oil prices, and anxiety surrounding the U.S. Federal Reserve’s strategy for raising interest rates. Instability in international and U.S. markets weighed on the Fund’s absolute returns.
The portfolio management team does not attempt to position the Fund based on predictions of macro-economic conditions. The Fund employs a bottom-up investment approach to stock selection that seeks out dividend-paying stocks trading at the lower end of their historical trading ranges, and which display characteristics of financial strength and possess an improving fundamental situation. The Fund does not make active sector allocations but allows its bottom-up investment process to define sector weights.
An overweight position and stock selection in the energy sector detracted from the Fund’s relative performance, as several energy holdings suffered from oil price volatility. An underweight position in the consumer staples sector also dragged on relative returns, as did exposure to a global mass media company, a packaging company and a semiconductor manufacturing company.
The Fund benefited from individual exposure to shares of an information technology company, a biopharmaceutical company, a healthcare company and a utility company.
How do you plan to position the Fund, based on market conditions?
We will continue to maintain our disciplined, bottom-up fundamental stock analysis when choosing investments for the Fund. Our investment philosophy seeks out investments that meet three key criteria: the existence of a dividend, low valuations and improving fundamentals. In the current environment, we expect to maintain a pro-cyclical bias includes overweight positions in the information technology, industrial and healthcare sectors, and underweight positions in the utilities and consumer staples sectors. We also expect to maintain an underweight position in REIT investments in the financials sector.
12
Table of Contents
MID-CAP VALUE EQUITY FUND
Growth of a $10,000 Investment (as of March 31, 2016)
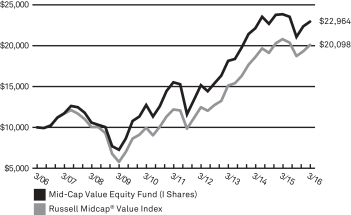 | This chart assumes an initial hypothetical investment of $10,000 made on 3/31/06. Total return is based on net change in the Net Asset Value (“NAV”) assuming reinvestment of distributions. Returns shown on this page include reinvestment of all dividends and other distributions.
The Fund’s performance is compared to the Russell Midcap® Value Index, which measures the performance of the mid-cap value segment of the U.S. equity universe. It includes those Russell Midcap Index companies with lower price-to-book ratios and lower forecasted growth values. The Index is unmanaged and does not reflect the deduction of fees, such as investment and fund accounting fees, associated with a mutual fund. Investors cannot invest directly in an index. Frank Russell Company is the source and owner of the trademarks, service marks and copyrights related to the Russell Indexes. Russell® is a trademark of Frank Russell Company. |
| Average Annual Total Returns as of 3/31/16 | ||||||||||||||||||
| Mid-Cap Value Equity Fund | 1 Year | 3 Year | 5 Year | 10 Year | ||||||||||||||
A Shares | without sales charge | –4.11% | 7.83% | 7.83% | 8.36% | |||||||||||||
| with sales charge* | –9.63% | 5.72% | 6.56% | 7.72% | ||||||||||||||
C Shares | without CDSC | –4.49% | 7.43% | 7.32% | 7.72% | |||||||||||||
| with CDSC* | –5.39% | 7.43% | 7.32% | 7.72% | ||||||||||||||
I Shares | –3.85% | 8.14% | 8.14% | 8.67% | ||||||||||||||
IS Shares** | –3.45% | 8.36% | 8.27% | 8.73% | ||||||||||||||
| Russell Midcap® Value Index | –3.39% | 9.88% | 10.52% | 7.23% | ||||||||||||||
| Prospectus Expense Ratio1 | Gross | |||||||||||||||||
| A Shares | 1.41% | |||||||||||||||||
| C Shares | 1.75% | |||||||||||||||||
| I Shares | 1.10% | |||||||||||||||||
| IS Shares | 0.75% | |||||||||||||||||
Because equity markets may be volatile in the short-term, resulting in unusually high or low performance, investors should evaluate long-term performance before making an investment.
The Adviser has contractually agreed to waive fees and reimburse expenses until at least August 1, 2016 in order to keep total operating expenses (excluding underlying fund fees and expenses) from exceeding 1.40%, 1.95%, 1.15% and 0.95% for A, C, I and IS Shares, respectively. Without these fee waivers, performance would have been lower.
Past performance does not guarantee future results. The performance data quoted represents past performance and current returns may be lower or higher. Total return figures include change in share price, reinvestment of dividends and capital gains and do not reflect taxes that a shareholder would pay on fund distributions or on the redemption of fund shares. The investment return and principal value will fluctuate so that an investor’s shares, when redeemed, may be worth more or less than the original cost. For performance data current to the most recent month end, visit our website at www.ridgeworth.com.
| * | Class A Share performance reflects the maximum front-end sales charge of 5.75% and Class C Shares reflect the maximum CDSC (contingent deferred sales charge) of 1.00% in year one only. |
| ** | IS Shares were offered beginning on 8/1/14. The performance shown prior to such dates is based on performance of the I Shares of the Fund, and has not been adjusted to reflect IS Share expenses. If it had been, performance would have been higher. |
| 1 | This information is included in the most current prospectus available to current and prospective shareholders of the Fund. Additional information pertaining to the 3/31/16 expense ratios can be found in the financial highlights. |
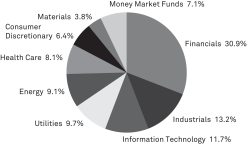
Sector Weightings (as of March 31, 2016)
as a percentage of investments
13
Table of Contents
Portfolio Managers
| • | Sandeep Bhatia, PhD, CFA |
| • | Michael A. Sansoterra |
INVESTMENT CONCERNS
Equity securities (stocks) are more volatile and carry more risk than other forms of investments, including investments in high-grade fixed income securities. The net asset value per share of this Fund will fluctuate as the value of the securities in the portfolio changes.
Small-capitalization funds typically carry additional risks since smaller companies generally have a higher risk of failure.
MANAGEMENT DISCUSSION OF FUND PERFORMANCE
How did the Fund perform against its benchmark for the fiscal year ended March 31, 2016?
The Small Cap Growth Stock Fund (I Shares) returned -13.30%. That compared to a -11.84% return for the Russell 2000 Growth Index.
What factors influenced the Fund’s performance for the fiscal year ended March 31, 2016?
The period was marked by economic challenges both domestically and internationally. Investors worried about slowing economic growth in the U.S., Europe and China, as well as about volatile commodities prices and the U.S. Federal Reserve’s interest rate strategy. These factors contributed to record-level spikes in market volatility during the 12-month period. The Fund’s absolute returns suffered in this environment.
Stock selection within the consumer discretionary sector was responsible for most of the Fund’s underperformance relative to the benchmark index. Specifically, holdings in an educational services provider, a home décor chain and automobile components manufacturer dragged on returns, as did holdings in a new home builder and an automotive sales and service firm. The Fund’s relative performance also was hurt by lack of exposure to a ski resort company that contributed to the benchmark’s performance.
How do you plan to position the Fund, based on market conditions?
The portfolio managers seek to eliminate investment results that are directly attributed to market conditions, and instead attempt to drive performance through stock selection. Therefore, the Fund will continue to invest in companies with reasonable valuations and improving fundamentals. Generally, we look for companies that have shown year-over-year increases in operating margins, revenue growth and return on incremental invested capital. By combining income statement, balance sheet and cash flow metrics to evaluate earnings quality, capital efficiency and relative valuations, we can avoid making investment decisions based on a single factor.
14
Table of Contents
SMALL CAP GROWTH STOCK FUND
Growth of a $10,000 Investment (as of March 31, 2016)
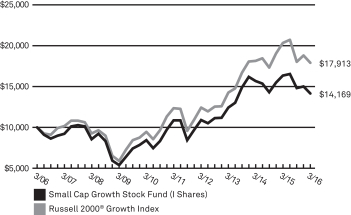 | This chart assumes an initial hypothetical investment of $10,000 made on 3/31/06. Total return is based on net change in the Net Asset Value (“NAV”) assuming reinvestment of distributions. Returns shown on this page include reinvestment of all dividends and other distributions.
The Fund’s performance is compared to the Russell 2000® Growth Index, which measures the performance of the small-cap growth segment of the U.S. equity universe. It includes those Russell 2000® companies with higher price-to-book ratios and higher forecasted growth values. The Index is unmanaged and does not reflect the deduction of fees, such as investment and fund accounting fees, associated with a mutual fund. Investors cannot invest directly in an index. Frank Russell Company is the source and owner of the trademarks, service marks and copyrights related to the Russell Indexes. Russell® is a trademark of Frank Russell Company. |
| Average Annual Total Returns as of 3/31/16 | ||||||||||||||||
| Small Cap Growth Stock Fund | 1 Year | 3 Year | 5 Year | 10 Year | ||||||||||||
A Shares | without sales charge | –13.38% | 4.36% | 5.32% | 3.33% | |||||||||||
| with sales charge* | –18.38% | 2.33% | 4.08% | 2.72% | ||||||||||||
C Shares | without CDSC | –13.91% | 3.70% | 4.64% | 2.64% | |||||||||||
| with CDSC* | –14.32% | 3.70% | 4.64% | 2.64% | ||||||||||||
I Shares | –13.30% | 4.42% | 5.44% | 3.55% | ||||||||||||
IS Shares** | –13.13% | 4.56% | 5.52% | 3.59% | ||||||||||||
| Russell 2000® Growth Index | –11.84% | 7.91% | 7.70% | 6.00% | ||||||||||||
| Prospectus Expense Ratio1 | Gross | |||||||||||||||
| A Shares | 1.32% | |||||||||||||||
| C Shares | 1.96% | |||||||||||||||
| I Shares | 1.34% | |||||||||||||||
| IS Shares | 0.96% | |||||||||||||||
Because equity markets may be volatile in the short-term, resulting in unusually high or low performance, investors should evaluate long-term performance before making an investment.
The Adviser has contractually agreed to waive fees and reimburse expenses until at least August 1, 2016 in order to keep total operating expenses (excluding underlying fund fees and expenses) from exceeding 1.50%, 2.20%, 1.30% and 1.05% for A, C, I and IS Shares, respectively. Without these fee waivers, performance would have been lower.
Past performance does not guarantee future results. The performance data quoted represents past performance and current returns may be lower or higher. Total return figures include change in share price, reinvestment of dividends and capital gains and do not reflect taxes that a shareholder would pay on fund distributions or on the redemption of fund shares. The investment return and principal value will fluctuate so that an investor’s shares, when redeemed, may be worth more or less than the original cost. For performance data current to the most recent month end, visit our website at www.ridgeworth.com.
| * | Class A Share performance reflects the maximum front-end sales charge of 5.75% and Class C Shares reflect the maximum CDSC (contingent deferred sales charge) of 1.00% in year one only. |
| ** | IS Shares were offered beginning on 8/1/14. The performance shown prior to such dates is based on performance of the I Shares of the Fund, and has not been adjusted to reflect IS Share expenses. If it had been, performance would have been higher. |
| 1 | This information is included in the most current prospectus available to current and prospective shareholders of the Fund. Additional information pertaining to the 3/31/16 expense ratios can be found in the financial highlights. |
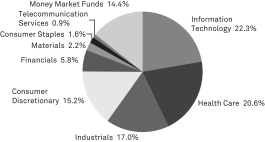
Sector Weightings (as of March 31, 2016)
as a percentage of Investments
15
Table of Contents
Portfolio Manager
| • | Brett Barner, CFA |
INVESTMENT CONCERNS
Equity securities (stocks) are more volatile and carry more risk than other forms of investments, including investments in high-grade fixed income securities. The net asset value per share of this Fund will fluctuate as the value of the securities in the portfolio changes.
Small-capitalization funds typically carry additional risks since smaller companies generally have a higher risk of failure.
Value-based investments are subject to the risk that the broad market may not recognize their intrinsic value.
MANAGEMENT DISCUSSION OF FUND PERFORMANCE
How did the Fund perform against its benchmark for the fiscal year ended March 31, 2016?
The Small Cap Value Equity Fund (I Shares) delivered a -0.64% return. That compared to a -7.72% return for the Russell Small Cap Value Index.
What factors influenced the Fund’s performance for the fiscal year ended March 31, 2016?
During the 12-month period, stocks faced major headwinds, including debt negotiations between Greece and the euro zone, Puerto Rico’s debt restructuring, re-emerging volatility in oil prices, and anxiety surrounding the U.S. Federal Reserve’s strategy for raising interest rates. Instability in international and U.S. markets weighed on the Fund’s absolute returns.
The portfolio management team does not attempt to position the Fund based on predictions of macro-economic conditions. The Fund employs a bottom-up investment approach to stock selection that seeks out dividend-paying stocks trading at the lower end of their historical trading ranges, and which display characteristics of financial strength and possess an improving fundamental situation. The Fund does not make active sector allocations but allows its bottom-up investment process to define sector weights.
The Fund’s relative performance was boosted by exposure to individual stocks in the financial services sector, including three insurance companies. Holdings in a waste management company and a software company that measures consumer credit risk also contributed to the Fund’s relative returns.
An underweight position and stock selection in the energy sector detracted from the Fund’s relative performance. An overweight position in consumer discretionary stocks also dragged on relative returns, as did exposure to shares of an entertainment company, an interactive retailer and an electronics company.
How do you plan to position the Fund, based on market conditions?
We will continue to maintain our disciplined, bottom-up fundamental stock analysis when choosing investments for the Fund. Our investment philosophy seeks out investments that meet three key criteria: the existence of a dividend, low valuations and improving fundamentals. In the current environment, we expect to maintain a pro-cyclical bias that includes overweight positions in the consumer discretionary and industrials sectors, and underweight positions in the utilities sector. We also expect to maintain an underweight position in REITs and banks in the financials sector.
16
Table of Contents
SMALL CAP VALUE EQUITY FUND
Growth of a $10,000 Investment (as of March 31, 2016)
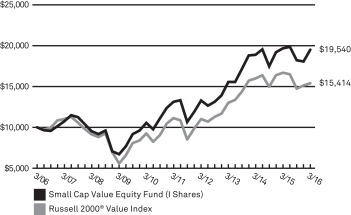 | This chart assumes an initial hypothetical investment of $10,000 made on 3/31/06. Total return is based on net change in the Net Asset Value (“NAV”) assuming reinvestment of distributions. Returns shown on this page include reinvestment of all dividends and other distributions.
The Fund’s performance is compared to the Russell 2000® Value Index, which measures the performance of the small-cap value segment of the U.S. equity universe. It includes those Russell 2000® companies with lower price-to-book ratios and lower forecasted growth values. The Index is unmanaged and does not reflect the deduction of fees, such as investment and fund accounting fees, associated with a mutual fund. Investors cannot invest directly in an index. Frank Russell Company is the source and owner of the trademarks, service marks and copyrights related to the Russell Indexes. Russell® is a trademark of Frank Russell Company. |
| Average Annual Total Returns as of 3/31/16 | ||||||||||||||||
| Small Cap Value Equity Fund | 1 Year | 3 Year | 5 Year | 10 Year | ||||||||||||
A Shares | without sales charge | –0.98% | 7.53% | 7.91% | 6.62% | |||||||||||
| with sales charge* | –6.67% | 5.42% | 6.65% | 5.99% | ||||||||||||
C Shares | without CDSC | –1.34% | 7.14% | 7.42% | 6.18% | |||||||||||
| with CDSC* | –2.04% | 7.14% | 7.42% | 6.18% | ||||||||||||
I Shares | –0.64% | 7.86% | 8.24% | 6.93% | ||||||||||||
| Russell 2000® Value Index | –7.72% | 5.73% | 6.67% | 4.42% | ||||||||||||
| Prospectus Expense Ratio1 | Gross | |||||||||||||||
| A Shares | 1.52% | |||||||||||||||
| C Shares | 1.88% | |||||||||||||||
| I Shares | 1.21% | |||||||||||||||
Because equity markets may be volatile in the short-term, resulting in unusually high or low performance, investors should evaluate long-term performance before making an investment.
Past performance does not guarantee future results. The performance data quoted represents past performance and current returns may be lower or higher. Total return figures include change in share price, reinvestment of dividends and capital gains and do not reflect taxes that a shareholder would pay on fund distributions or on the redemption of fund shares. The investment return and principal value will fluctuate so that an investor’s shares, when redeemed, may be worth more or less than the original cost. For performance data current to the most recent month end, visit our website at www.ridgeworth.com.
| * | Class A Share performance reflects the maximum front-end sales charge of 5.75% and Class C Shares reflect the maximum CDSC (contingent deferred sales charge) of 1.00% in year one only. |
| 1 | This information is included in the most current prospectus available to current and prospective shareholders of the Fund. Additional information pertaining to the 3/31/16 expense ratios can be found in the financial highlights. |
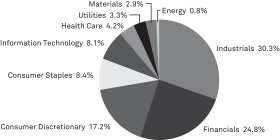
Sector Weightings (as of March 31, 2016)
as a percentage of Investments
17
Table of Contents
AGGRESSIVE GROWTH ALLOCATION STRATEGY
Portfolio Manager
| • | Alan Gayle |
INVESTMENT CONCERNS
Equity Securities (Stocks) are more volatile and carry more risk and return potential than other forms of investments. Bonds offer a relatively stable level of income, although bond prices will fluctuate, providing the potential for principal gain or loss. Cash equivalents offer low risk and low return potential.
MANAGEMENT DISCUSSION OF FUND PERFORMANCE
How did the Fund perform against its benchmark for the fiscal year ended March 31, 2016?
The Aggressive Growth Allocation Strategy (I Shares) returned -4.67%, compared to a -4.67% return for the Lipper Mixed-Asset Target Allocation (Growth Classification)*, and a 1.98% return for its hybrid benchmark made up of an 80% weighting in the S&P 500 Index and a 20% weighting in the Barclays U.S. Aggregate Bond Index.
What factors influenced the Fund’s performance for the fiscal year ended March 31, 2016?
RidgeWorth Investments manages four distinct asset allocation strategies, each structured to align investment portfolios with specific levels of investor risk tolerance and income requirements. The underlying mutual funds and ETFs typically are the same across the Strategies, but different stock, bond and alternatives allocations create noticeably different total return characteristics, which are intended to align with investor needs and constraints.
The equity market rose very modestly during the 12-month period, despite being buffeted by a drop in oil prices and global economic uncertainty. Stocks gained when the Federal Reserve raised its target short-term interest rate in December, but then fell due to fears about the economy’s strength.
Amid those concerns, risk-averse investors sought relatively conservative options and defensive sectors. While large-cap stocks and longer-duration fixed income positions faired moderately well over the period, small-, mid-cap, and international stocks and high yield bonds struggled. Commodities declined sharply during the year, but erased some declines late in the period. That environment challenged the Fund’s absolute return.
Broadly speaking, since the S&P 500 equity index slightly underperformed the Barclays U.S. Aggregate bond index for the year, the strategy’s overweight to stocks was a net detractor in terms of relative performance versus its hybrid index. However, selected funds also detracted from relative total returns versus the blended benchmark, most notably from pronounced weakness in international mandates, as well as large-cap and small-cap growth mandates. In the fixed income space, exposure to cash, core, high yield and ultra-short mandates detracted from performance.
We actively and opportunistically reduced risk in the Fund throughout the period by trimming equities, rebuilding a long-dormant position in the GDX (Gold Miners) ETF, and maintaining bond portfolio durations close that of the Barclays U.S. Aggregate index.
How do you plan to position the Fund, based on market conditions?
We believe equities remain attractive relative to bonds in a period of rising rates, especially given historically low interest rates and upticks in inflation and wages. As such, we are maintaining a slightly overweight position in equities relative to the Fund’s target benchmarks, with a core equity position tilted slightly towards growth. The Fund holds overweight stakes in the technology, financials, industrials and consumer discretionary sectors, while maintaining relatively low exposures to developed international and emerging markets equities.
The Fund holds a nearly neutral duration to the Barclays U.S. Aggregate Index. We would not be surprised to see the equity and fixed income markets undergo a period of consolidation in the short run, but we think it could be short-lived. In our estimation, investors facing near-zero interest rates are likely to continue to venture out the risk spectrum in search of income and total return.
| * | Lipper Mixed-Asset Target Allocation (Growth Classification): Funds that, by portfolio practice, maintain a mix of between 60%-80% equity securities, with the remainder invested in bonds, cash, and cash equivalents. |
18
Table of Contents
AGGRESSIVE GROWTH ALLOCATION STRATEGY
Growth of a $10,000 Investment (as of March 31, 2016)
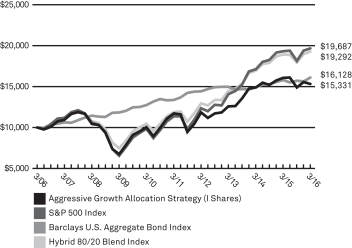 | This chart assumes an initial hypothetical investment of $10,000 made on 3/31/06. Total return is based on net change in the Net Asset Value (“NAV”) assuming reinvestment of distributions. Returns shown on this page include reinvestment of all dividends and other distributions.
Effective September 30, 2012, the benchmark index for the Fund changed from the Standard & Poors 500 Index (“S&P 500 Index”) to the Hybrid 80/20 Blend Index. The Fund's performance is compared to the Hybrid 80/20 Blend Index.
The S&P 500 Index is widely regarded as a gauge of the U.S. equities market. This index includes 500 leading companies in leading industries of the U.S. economy. Although the S&P 500 Index focuses on the large cap segment of the market, with approximately 75% coverage of U.S. equities, it is also an ideal proxy for the total market. The Barclays U.S. Aggregate Bond Index is a measure of the overall performance of the U.S. bond market. These indices are unmanaged and do not reflect the deduction of fees, such as investment and fund accounting fees, associated with a mutual fund. Investors cannot invest directly in an index. |
| Average Annual Total Returns as of 3/31/16 | ||||||||||||||||||
| Aggressive Growth Allocation Strategy | 1 Year | 3 Year | 5 Year | 10 Year | ||||||||||||||
A Shares | without sales charge | –4.88% | 6.51% | 5.22% | 4.08% | |||||||||||||
| with sales charge** | –10.35% | 4.44% | 3.98% | 3.47% | ||||||||||||||
C Shares* | without CDSC | –5.31% | 5.95% | 4.59% | 3.40% | |||||||||||||
| with CDSC** | –6.06% | 5.95% | 4.59% | 3.40% | ||||||||||||||
I Shares | –4.67% | 6.76% | 5.50% | 4.37% | ||||||||||||||
| Hybrid 80/20 Blend Index (80% of the S&P 500 Index, 20% of the Barclays U.S. Aggregate Bond Index) | 1.98% | 10.01% | 10.12% | 6.79% | ||||||||||||||
| S&P 500 Index | 1.78% | 11.82% | 11.58% | 7.01% | ||||||||||||||
| Barclays U.S. Aggregate Bond Index | 1.96% | 2.50% | 3.78% | 4.90% | ||||||||||||||
| Prospectus Expense Ratio1 | Gross | |||||||||||||||||
| A Shares | 1.85% | |||||||||||||||||
| C Shares | 2.46% | |||||||||||||||||
| I Shares | 1.85% | |||||||||||||||||
Because equity markets may be volatile in the short-term, resulting in unusually high or low performance, investors should evaluate long-term performance before making an investment.
The Adviser has contractually agreed to waive fees and reimburse expenses until at least August 1, 2016 in order to keep total operating expenses (excluding underlying fund fees and expenses) from exceeding 0.70%, 1.30% and 0.50% for A, C and I Shares, respectively. Without these fee waivers, performance would have been lower. The indirect expenses of the Fund, which represent a pro-rata share of the expenses of the underlying funds in which the Fund invests, totaled 0.73% of net assets and are included in the expense ratios listed in the table above.
Past performance does not guarantee future results. The performance data quoted represents past performance and current returns may be lower or higher. Total return figures include change in share price, reinvestment of dividends and capital gains and do not reflect taxes that a shareholder would pay on fund distributions or on the redemption of fund shares. The investment return and principal value will fluctuate so that an investor’s shares, when redeemed, may be worth more or less than the original cost. For performance data current to the most recent month end, visit our website at www.ridgeworth.com.
| * | C Shares were offered beginning on 4/1/05. The performance shown prior to such dates is based on performance of the I Shares of the Fund, and has not been adjusted to reflect C Share expenses. If it had been, performance would have been lower. |
| ** | Class A Share performance reflects the maximum front-end sales charge of 5.75% and Class C Shares reflect the maximum CDSC (contingent deferred sales charge) of 1.00% in year one only. |
| 1 | This information is included in the most current prospectus available to current and prospective shareholders of the Fund. Additional information pertaining to the 3/31/16 expense ratios can be found in the financial highlights. |
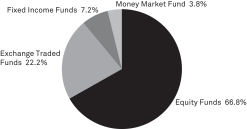
Sector Weightings (as of March 31, 2016)
as a percentage of Investments
19
Table of Contents
CONSERVATIVE ALLOCATION STRATEGY
Portfolio Manager
| • | Alan Gayle |
INVESTMENT CONCERNS
Equity Securities (Stocks) are more volatile and carry more risk and return potential than other forms of investments. Bonds offer a relatively stable level of income, although bond prices will fluctuate, providing the potential for principal gain or loss. Cash equivalents offer low risk and low return potential.
MANAGEMENT DISCUSSION OF FUND PERFORMANCE
How did the Fund perform against its benchmark for the fiscal year ended March 31, 2016?
The Conservative Allocation Strategy (I Shares) returned -1.73%, compared to a -1.73% return for the Lipper Mixed-Asset Target Allocation (Conservative Classification)*, and a 2.12% return for its hybrid benchmark made up of a 30% weighting in the S&P 500 Index and a 70% weighting in the Barclays U.S. Aggregate Bond Index.
What factors influenced the Fund’s performance for the fiscal year ended March 31, 2016?
RidgeWorth Investments manages four distinct asset allocation strategies, each structured to align investment portfolios with specific levels of investor risk tolerance and income requirements. The underlying mutual funds and ETFs typically are the same across the Strategies, but different stock, bond and alternatives allocations create noticeably different total return characteristics, which are intended to align with investor needs and constraints.
The equity market rose very modestly during the 12-month period, despite being buffeted by a drop in oil prices and global economic uncertainty. Stocks gained when the Federal Reserve raised its target short-term interest rate in December, but then fell due to fears about the economy’s strength.
Amid those concerns, risk-averse investors sought relatively conservative options and defensive sectors. While large-cap stocks and longer-duration fixed income positions faired moderately well over the period, small-, mid-cap, and international stocks and high yield bonds struggled. Commodities declined sharply during the year, but erased some declines late in the period. That environment challenged the Fund’s absolute return.
Broadly speaking, since the S&P 500 equity index slightly underperformed the Barclays U.S. Aggregate bond index for the year, the strategy’s overweight to stocks was a net detractor in terms of relative performance versus its hybrid index. However, selected funds also detracted from relative total returns versus the blended benchmark, most notably from pronounced weakness in international mandates, as well as large-cap and small-cap growth mandates. In the fixed income space, exposure to cash, core, high yield and ultra-short mandates detracted from performance.
We actively and opportunistically reduced risk in the Fund throughout the period by trimming equities, rebuilding a long-dormant position in the GDX (Gold Miners) ETF, and maintaining bond portfolio durations close that of the Barclays U.S. Aggregate index.
How do you plan to position the Fund, based on market conditions?
We believe equities remain attractive relative to bonds in a period of rising rates, especially given historically low interest rates and upticks in inflation and wages. As such, we are maintaining a slightly overweight position in equities relative to the Fund’s target benchmarks, with a core equity position tilted slightly towards growth. The Fund holds overweight stakes in the technology, financials, industrials and consumer discretionary sectors, while maintaining relatively low exposures to developed international and emerging markets equities.
The Fund holds a nearly neutral duration to the Barclays U.S. Aggregate Index. We would not be surprised to see the equity and fixed income markets undergo a period of consolidation in the short run, but we think it could be short-lived. In our estimation, investors facing near-zero interest rates are likely to continue to venture out the risk spectrum in search of income and total return.
| * | Lipper Mixed-Asset Target Allocation (Conservative Classification): Funds that, by portfolio practice, maintain a mix of between 20%-40% equity securities, with the remainder invested in bonds, cash, and cash equivalents. |
20
Table of Contents
CONSERVATIVE ALLOCATION STRATEGY
Growth of a $10,000 Investment (as of March 31, 2016)
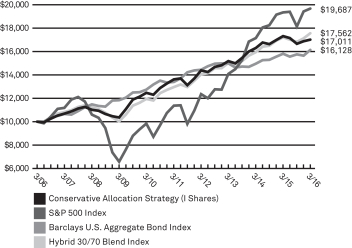 | This chart assumes an initial hypothetical investment of $10,000 made on 3/31/06. Total return is based on net change in the Net Asset Value (“NAV”) assuming reinvestment of distributions. Returns shown on this page include reinvestment of all dividends and other distributions.
The Fund’s performance is compared to the Hybrid 30/70 Blend Index. The Standard & Poors 500 Index (“S&P 500 Index”) is widely regarded as a gauge of the U.S. equities market. This index includes 500 leading companies in leading industries of the U.S. economy. Although the S&P 500 Index focuses on the large cap segment of the market, with approximately 75% coverage of U.S. equities, it is also an ideal proxy for the total market. The Barclays U.S. Aggregate Bond Index is a measure of the overall performance of the U.S. bond market. These indices are unmanaged and do not reflect the deduction of fees, such as investment and fund accounting fees, associated with a mutual fund. Investors cannot invest directly in an index. |
| Average Annual Total Returns as of 3/31/16 | ||||||||||||||||||
| Conservative Allocation Strategy | 1 Year | 3 Year | 5 Year | 10 Year | ||||||||||||||
A Shares | without sales charge | –1.98% | 3.59% | 4.27% | 5.15% | |||||||||||||
| with sales charge** | –6.66% | 1.94% | 3.27% | 4.64% | ||||||||||||||
C Shares* | without CDSC | –2.71% | 2.85% | 3.53% | 4.41% | |||||||||||||
| with CDSC** | –3.65% | 2.85% | 3.53% | 4.41% | ||||||||||||||
I Shares | –1.73% | 3.89% | 4.56% | 5.46% | ||||||||||||||
Hybrid 30/70 Blend Index (30% of the S&P 500 Index, 70% of the Barclays U.S. Aggregate Bond Index) | 2.12% | 5.37% | 6.25% | 5.79% | ||||||||||||||
S&P 500 Index | 1.78% | 11.82% | 11.58% | 7.01% | ||||||||||||||
Barclays U.S. Aggregate Bond Index | 1.96% | 2.50% | 3.78% | 4.90% | ||||||||||||||
| Prospectus Expense Ratio1 | Gross | |||||||||||||||||
| A Shares | 1.17% | |||||||||||||||||
| C Shares | 1.83% | |||||||||||||||||
| I Shares | 0.95% | |||||||||||||||||
Because equity markets may be volatile in the short-term, resulting in unusually high or low performance, investors should evaluate long-term performance before making an investment.
The Adviser has contractually agreed to waive fees and reimburse expenses until at least August 1, 2016 in order to keep total operating expenses (excluding underlying fund fees and expenses) from exceeding 0.60%, 1.30% and 0.30% for A, C and I Shares, respectively. Without these fee waivers, performance would have been lower. The indirect expenses of the Fund, which represent a pro-rata share of the expenses of the underlying funds in which the Fund invests, totaled 0.50% of net assets and are included in the expense ratios listed in the table above.
Past performance does not guarantee future results. The performance data quoted represents past performance and current returns may be lower or higher. Total return figures include change in share price, reinvestment of dividends and capital gains and do not reflect taxes that a shareholder would pay on fund distributions or on the redemption of fund shares. The investment return and principal value will fluctuate so that an investor’s shares, when redeemed, may be worth more or less than the original cost. For performance data current to the most recent month end, visit our website at www.ridgeworth.com.
| * | Class C Shares were offered beginning on 4/1/05. The performance shown prior to such dates is based on performance of the B Shares of the Fund, and has not been adjusted to reflect C Share expenses. If it had been, performance for C Shares would have been lower. Effective close of business on 7/16/10, B Shares converted into A Shares. |
| ** | Class A Share performance reflects the maximum front-end sales charge of 4.75% and Class C Shares reflect the maximum CDSC (contingent deferred sales charge) of 1.00% in year one only. |
| 1 | This information is included in the most current prospectus available to current and prospective shareholders of the Fund. Additional information pertaining to the 3/31/16 expense ratios can be found in the financial highlights. |
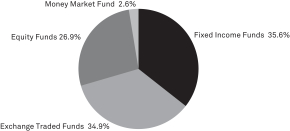
Sector Weightings (as of March 31, 2016)
as a percentage of Investments
21
Table of Contents
Portfolio Manager
| • | Alan Gayle |
INVESTMENT CONCERNS
Equity Securities (Stocks) are more volatile and carry more risk and return potential than other forms of investments. Bonds offer a relatively stable level of income, although bond prices will fluctuate, providing the potential for principal gain or loss. Cash equivalents offer low risk and low return potential.
MANAGEMENT DISCUSSION OF FUND PERFORMANCE
How did the Fund perform against its benchmark for the fiscal year ended March 31, 2016?
The Growth Allocation Strategy (I Shares) returned -3.74%, compared to a -3.09% return for the Lipper Mixed-Asset Target Allocation (Growth Classification)*, and a 2.04% return for its hybrid benchmark made up of a 70% weighting in the S&P 500 Index and a 30% weighting in the Barclays U.S. Aggregate Bond Index.
What factors influenced the Fund’s performance for the fiscal year ended March 31, 2016?
RidgeWorth Investments manages four distinct asset allocation strategies, each structured to align investment portfolios with specific levels of investor risk tolerance and income requirements. The underlying mutual funds and ETFs typically are the same across the Strategies, but different stock, bond and alternatives allocations create noticeably different total return characteristics, which are intended to align with investor needs and constraints.
The equity market rose very modestly during the 12-month period, despite being buffeted by a drop in oil prices and global economic uncertainty. Stocks gained when the Federal Reserve raised its target short-term interest rate in December, but then fell due to fears about the economy’s strength.
Amid those concerns, risk-averse investors sought relatively conservative options and defensive sectors. While large-cap stocks and longer-duration fixed income positions faired moderately well over the period, small-, mid-cap, and international stocks and high yield bonds struggled. Commodities declined sharply during the year, but erased some declines late in the period. That environment challenged the Fund’s absolute return.
Broadly speaking, since the S&P 500 equity index slightly underperformed the Barclays U.S. Aggregate bond index for the year, the strategy’s overweight to stocks was a net detractor in terms of relative performance versus its hybrid index. However, selected funds also detracted from relative total returns versus the blended benchmark, most notably from pronounced weakness in international mandates, as well as large-cap and small-cap growth mandates. In the fixed income space, exposure to cash, core, high yield and ultra-short mandates detracted from performance.
We actively and opportunistically reduced risk in the Fund throughout the period by trimming equities, rebuilding a long-dormant position in the GDX (Gold Miners) ETF, and maintaining bond portfolio durations close that of the Barclays U.S. Aggregate index.
How do you plan to position the Fund, based on market conditions?
We believe equities remain attractive relative to bonds in a period of rising rates, especially given historically low interest rates and upticks in inflation and wages. As such, we are maintaining a slightly overweight position in equities relative to the Fund’s target benchmarks, with a core equity position tilted slightly towards growth. The Fund holds overweight stakes in the technology, financials, industrials and consumer discretionary sectors, while maintaining relatively low exposures to developed international and emerging markets equities.
The Fund holds a nearly neutral duration to the Barclays U.S. Aggregate Index. We would not be surprised to see the equity and fixed income markets undergo a period of consolidation in the short run, but we think it could be short-lived. In our estimation, investors facing near-zero interest rates are likely to continue to venture out the risk spectrum in search of income and total return.
| * | Lipper Mixed-Asset Target Allocation (Growth Classification): Funds that, by portfolio practice, maintain a mix of between 60%-80% equity securities, with the remainder invested in bonds, cash, and cash equivalents. |
22
Table of Contents
GROWTH ALLOCATION STRATEGY
Growth of a $10,000 Investment (as of March 31, 2016)
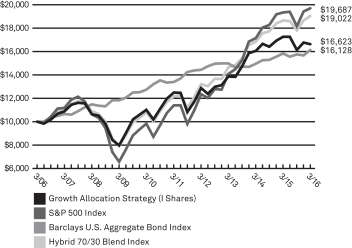 | This chart assumes an initial hypothetical investment of $10,000 made on 3/31/06. Total return is based on net change in the Net Asset Value (“NAV”) assuming reinvestment of distributions. Returns shown on this page include reinvestment of all dividends and other distributions.
The Fund’s performance is compared to the Hybrid 70/30 Blend Index. The Standard & Poors 500 Index (“S&P 500 Index”) is widely regarded as a gauge of the U.S. equities market. This index includes 500 leading companies in leading industries of the U.S. economy. Although the S&P 500 Index focuses on the large cap segment of the market, with approximately 75% coverage of U.S. equities, it is also an ideal proxy for the total market. The Barclays U.S. Aggregate Bond Index is a measure of the overall performance of the U.S. bond market. These indices are unmanaged and do not reflect the deduction of fees, such as investment and fund accounting fees, associated with a mutual fund. Investors cannot invest directly in an index. |
| Average Annual Total Returns as of 3/31/16 | ||||||||||||||||||
| Growth Allocation Strategy | 1 Year | 3 Year | 5 Year | 10 Year | ||||||||||||||
A Shares | without sales charge | –4.02% | 6.09% | 5.63% | 4.94% | |||||||||||||
| with sales charge** | –9.57% | 4.00% | 4.39% | 4.32% | ||||||||||||||
C Shares* | without CDSC | –4.60% | 5.41% | 4.95% | 4.22% | |||||||||||||
| with CDSC** | –5.48% | 5.41% | 4.95% | 4.22% | ||||||||||||||
I Shares | –3.74% | 6.28% | 5.87% | 5.21% | ||||||||||||||
| Hybrid 70/30 Blend Index (70% of the S&P 500 Index, 30% of the Barclays U.S. Aggregate Bond Index) | 2.04% | 9.10% | 9.37% | 6.64% | ||||||||||||||
| S&P 500 Index | 1.78% | 11.82% | 11.58% | 7.01% | ||||||||||||||
| Barclays U.S. Aggregate Bond Index | 1.96% | 2.50% | 3.78% | 4.90% | ||||||||||||||
| Prospectus Expense Ratio1 | Gross | |||||||||||||||||
| A Shares | 1.36% | |||||||||||||||||
| C Shares | 1.98% | |||||||||||||||||
| I Shares | 1.37% | |||||||||||||||||
Because equity markets may be volatile in the short-term, resulting in unusually high or low performance, investors should evaluate long-term performance before making an investment.
The Adviser has contractually agreed to waive fees and reimburse expenses until at least August 1, 2016 in order to keep total operating expenses (excluding underlying fund fees and expenses) from exceeding 0.70%, 1.30% and 0.50% for the A, C and I Shares, respectively. Without these fee waivers, performance would have been lower. The indirect expenses of the Fund, which represent a pro-rata share of the expenses of the underlying funds in which the Fund invests, totaled 0.68% of net assets and are included in the expense ratios listed in the table above.
Past performance does not guarantee future results. The performance data quoted represents past performance and current returns may be lower or higher. Total return figures include change in share price, reinvestment of dividends and capital gains and do not reflect taxes that a shareholder would pay on fund distributions or on the redemption of fund shares. The investment return and principal value will fluctuate so that an investor’s shares, when redeemed, may be worth more or less than the original cost. For performance data current to the most recent month end, visit our website at www.ridgeworth.com.
| * | Class C Shares were offered beginning on 4/05/05. The performance shown prior to such dates is based on performance of the I Shares of the Fund, and has not been adjusted to reflect C Share expenses. If it had been, performance would have been lower. |
| ** | Class A Share performance reflects the maximum front-end sales charge of 5.75% and Class C Shares reflect the maximum CDSC (contingent deferred sales charge) of 1.00% in year one only. |
| 1 | This information is included in the most current prospectus available to current and prospective shareholders of the Fund. Additional information pertaining to the 3/31/16 expense ratios can be found in the financial highlights. |
Sector Weightings (as of March 31, 2016)
as a percentage of Investments
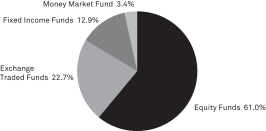
23
Table of Contents
Portfolio Manager
| • | Alan Gayle |
INVESTMENT CONCERNS
Equity Securities (Stocks) are more volatile and carry more risk and return potential than other forms of investments. Bonds offer a relatively stable level of income, although bond prices will fluctuate, providing the potential for principal gain or loss. Cash equivalent offer low risk and low return potential.
MANAGEMENT DISCUSSION OF FUND PERFORMANCE
How did the Fund perform against its benchmark for the fiscal year ended March 31, 2016?
The Moderate Allocation Strategy (I Shares) returned -2.96%, compared to a -2.70% return for the Lipper Mixed-Asset Target Allocation (Moderate Classification)*, and a 2.12% return for its hybrid benchmark made up of a 50% weighting in the S&P 500 Index and a 50% weighting in the Barclays U.S. Aggregate Bond Index.
What factors influenced the Fund’s performance for the fiscal year ended March 31, 2016?
RidgeWorth Investments manages four distinct asset allocation strategies, each structured to align investment portfolios with specific levels of investor risk tolerance and income requirements. The underlying mutual funds and ETFs typically are the same across the Strategies, but different stock, bond and alternatives allocations create noticeably different total return characteristics, which are intended to align with investor needs and constraints.
The equity market rose very modestly during the 12-month period, despite being buffeted by a drop in oil prices and global economic uncertainty. Stocks gained when the Federal Reserve raised its target short-term interest rate in December, but then fell due to fears about the economy’s strength.
Amid those concerns, risk-averse investors sought relatively conservative options and defensive sectors. While large-cap stocks and longer-duration fixed income positions faired moderately well over the period, small-, mid-cap, and international stocks and high yield bonds struggled. Commodities declined sharply during the year, but erased some declines late in the period. That environment challenged the Fund’s absolute return.
Broadly speaking, since the S&P 500 equity index slightly underperformed the Barclays U.S. Aggregate bond index for the year, the strategy’s overweight to stocks was a net detractor in terms of relative performance versus its hybrid index. However, selected funds also detracted from relative total returns versus the blended benchmark, most notably from pronounced weakness in international mandates, as well as large-cap and small-cap growth mandates. In the fixed income space, exposure to cash, core, high yield and ultra-short mandates detracted from performance.
We actively and opportunistically reduced risk in the Fund throughout the period by trimming equities, rebuilding a long-dormant position in the GDX (Gold Miners) ETF, and maintaining bond portfolio durations close that of the Barclays U.S. Aggregate index.
How do you plan to position the Fund, based on market conditions?
We believe equities remain attractive relative to bonds in a period of rising rates, especially given historically low interest rates and upticks in inflation and wages. As such, we are maintaining a slightly overweight position in equities relative to the Fund’s target benchmarks, with a core equity position tilted slightly towards growth. The Fund holds overweight stakes in the technology, financials, industrials and consumer discretionary sectors, while maintaining relatively low exposures to developed international and emerging markets equities.
The Fund holds a nearly neutral duration to the Barclays U.S. Aggregate Index. We would not be surprised to see the equity and fixed income markets undergo a period of consolidation in the short run, but we think it could be short-lived. In our estimation, investors facing near-zero interest rates are likely to continue to venture out the risk spectrum in search of income and total return.
| * | Lipper Mixed-Asset Target Allocation (Moderate Classification): Funds that, by portfolio practice, maintain a mix of between 40%-60% equity securities, with the remainder invested in bonds, cash, and cash equivalents. |
24
Table of Contents
MODERATE ALLOCATION STRATEGY
Growth of a $10,000 Investment (as of March 31, 2016)
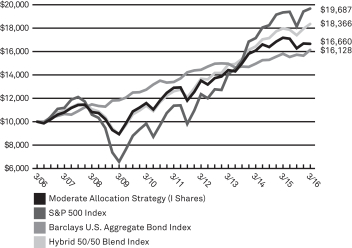 | This chart assumes an initial hypothetical investment of $10,000 made on 3/31/06. Total return is based on net change in the Net Asset Value (“NAV”) assuming reinvestment of distributions. Returns shown on this page include reinvestment of all dividends and other distributions.
The Fund’s performance is compared to the Hybrid 50/50 Blend Index. The Standard & Poors 500 Index (“S&P 500 Index”) is widely regarded as a gauge of the U.S. equities market. This index includes 500 leading companies in leading industries of the U.S. economy. Although the S&P 500 Index focuses on the large cap segment of the market, with approximately 75% coverage of U.S. equities, it is also an ideal proxy for the total market. The Barclays U.S. Aggregate Bond Index is a measure of the overall performance of the U.S. bond market. These indices are unmanaged and do not reflect the deduction of fees, such as investment and fund accounting fees, associated with a mutual fund. Investors cannot invest directly in an index. |
| Average Annual Total Returns as of 3/31/16 | ||||||||||||||||||
| Moderate Allocation Strategy | 1 Year | 3 Year | 5 Year | 10 Year | ||||||||||||||
A Shares | without sales charge | –3.13% | 4.82% | 5.03% | 4.99% | |||||||||||||
| with sales charge** | –8.67% | 2.76% | 3.79% | 4.37% | ||||||||||||||
C Shares* | without CDSC | –3.65% | 4.24% | 4.40% | 4.30% | |||||||||||||
| with CDSC** | –4.46% | 4.24% | 4.40% | 4.30% | ||||||||||||||
I Shares | –2.96% | 4.95% | 5.21% | 5.24% | ||||||||||||||
| Hybrid 50/50 Blend Index (50% of the Barclays U.S. Aggregate Bond Index, 50% of the S&P 500 Index ) | 2.12% | 7.25% | 7.83% | 6.27% | ||||||||||||||
| S&P 500 Index | 1.78% | 11.82% | 11.58% | 7.01% | ||||||||||||||
| Barclays U.S. Aggregate Bond Index | 1.96% | 2.50% | 3.78% | 4.90% | ||||||||||||||
| Prospectus Expense Ratio1 | Gross | |||||||||||||||||
| A Shares | 1.26% | |||||||||||||||||
| C Shares | 1.82% | |||||||||||||||||
| I Shares | 1.11% | |||||||||||||||||
Because equity markets may be volatile in the short-term, resulting in unusually high or low performance, investors should evaluate long-term performance before making an investment.
The Adviser has contractually agreed to waive fees and reimburse expenses until at least August 1, 2016 in order to keep total operating expenses (excluding underlying fund fees and expenses) from exceeding 0.70%, 1.30% and 0.50% for A, C and I Shares, respectively. Without these fee waivers, performance would have been lower. The indirect expenses of the Fund, which represent a pro-rata share of the expenses of the underlying funds in which the Fund invests, totaled 0.59% of net assets and are included in the expense ratios listed in the table above.
Past performance does not guarantee future results. The performance data quoted represents past performance and current returns may be lower or higher. Total return figures include change in share price, reinvestment of dividends and capital gains and do not reflect taxes that a shareholder would pay on fund distributions or on the redemption of fund shares. The investment return and principal value will fluctuate so that an investor’s shares, when redeemed, may be worth more or less than the original cost. For performance data current to the most recent month end, visit our website at www.ridgeworth.com.
| * | Class C Shares were offered beginning on 4/5/05. The performance shown prior to such dates is based on performance of the I Shares of the Fund, and has not been adjusted to reflect C Share expenses. If it had been, performance would have been lower. |
| ** | Class A Share performance reflects the maximum front-end sales charge of 5.75% and Class C Shares reflect the maximum CDSC (contingent deferred sales charge) of 1.00% in year one only. |
| 1 | This information is included in the most current prospectus available to current and prospective shareholders of the Fund. Additional information pertaining to the 3/31/16 expense ratios can be found in the financial highlights. |
Sector Weightings (as of March 31, 2016)
as a percentage of Investments
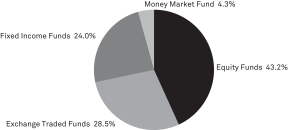
25
Table of Contents
SCHEDULES OF PORTFOLIO INVESTMENTS
RIDGEWORTH FUNDS March 31, 2016
Aggressive Growth Stock Fund
| Shares | Value($) | |||||||
| Common Stocks 99.6% | ||||||||
Consumer Discretionary 31.8% | ||||||||
Amazon.com, Inc.* | 3,200 | 1,899,648 | ||||||
Chipotle Mexican Grill, Inc.* | 1,700 | 800,649 | ||||||
Lululemon Athletica, Inc.* | 10,200 | 690,642 | ||||||
Netflix, Inc.* | 15,000 | 1,533,450 | ||||||
Priceline Group, Inc. (The)* | 500 | 644,480 | ||||||
Starbucks Corp. | 7,500 | 447,750 | ||||||
Tesla Motors, Inc.* | 7,700 | 1,769,229 | ||||||
Under Armour, Inc., Cl A* | 7,000 | 593,810 | ||||||
|
| |||||||
| 8,379,658 | ||||||||
|
| |||||||
Financials 7.9% | ||||||||
Charles Schwab Corp. (The) | 34,100 | 955,482 | ||||||
First Republic Bank | 9,200 | 613,088 | ||||||
Signature Bank* | 3,700 | 503,644 | ||||||
|
| |||||||
| 2,072,214 | ||||||||
|
| |||||||
Health Care 17.7% | ||||||||
Alexion Pharmaceuticals, Inc.* | 4,700 | 654,334 | ||||||
BioMarin Pharmaceutical, Inc.* | 5,800 | 478,384 | ||||||
Celgene Corp.* | 12,600 | 1,261,134 | ||||||
DexCom, Inc.* | 4,500 | 305,595 | ||||||
Exact Sciences Corp.* | 34,100 | 229,834 | ||||||
Gilead Sciences, Inc. | 2,000 | 183,720 | ||||||
Illumina, Inc.* | 2,300 | 372,853 | ||||||
Medidata Solutions, Inc.* | 13,500 | 522,585 | ||||||
Regeneron Pharmaceuticals, Inc.* | 1,800 | 648,792 | ||||||
|
| |||||||
| 4,657,231 | ||||||||
|
| |||||||
Industrials 6.1% | ||||||||
XPO Logistics, Inc.* | 52,500 | 1,611,750 | ||||||
|
| |||||||
| Shares | Value($) | |||||||
Information Technology 36.1% | ||||||||
Alliance Data Systems Corp.* | 2,200 | 484,000 | ||||||
Alphabet, Inc., Cl A* | 1,600 | 1,220,640 | ||||||
Baidu, Inc. SP ADR* | 2,400 | 458,112 | ||||||
Ellie Mae, Inc.* | 3,000 | 271,920 | ||||||
Facebook, Inc., Cl A* | 13,700 | 1,563,170 | ||||||
LendingClub Corp.* | 88,200 | 732,060 | ||||||
LinkedIn Corp., Cl A* | 2,000 | 228,700 | ||||||
MercadoLibre, Inc. | 7,300 | 860,305 | ||||||
Monolithic Power Systems, Inc. | 5,600 | 356,384 | ||||||
Palo Alto Networks, Inc.* | 4,800 | 783,072 | ||||||
Pandora Media, Inc.* | 43,500 | 389,325 | ||||||
Salesforce.com, Inc.* | 9,450 | 697,693 | ||||||
ServiceNow, Inc.* | 3,000 | 183,540 | ||||||
Splunk, Inc.* | 2,700 | 132,111 | ||||||
Zillow Group, Inc., Cl C* | 32,400 | 768,852 | ||||||
Zillow Group, Inc., Cl A* | 14,800 | 378,141 | ||||||
|
| |||||||
| 9,508,025 | ||||||||
|
| |||||||
Total Common Stocks | 26,228,878 | |||||||
|
| |||||||
Total Investments | 26,228,878 | |||||||
Other Assets in Excess of | 101,312 | |||||||
|
| |||||||
Net Assets — 100.0% | $ | 26,330,190 | ||||||
|
| |||||||
| * | Non-income producing security. |
Investment Abbreviation
SP ADR — Sponsored American Depositary Receipt
See Notes to Financial Statements.
26
Table of Contents
SCHEDULES OF PORTFOLIO INVESTMENTS
RIDGEWORTH FUNDS March 31, 2016
Capital Innovations Global Resources and Infrastructure Fund
| Shares | Value($) | |||||||
| Common Stocks 93.4% | ||||||||
Consumer Staples 3.9% | ||||||||
Adecoagro SA* | 1,140 | 13,167 | ||||||
Archer-Daniels-Midland Co. | 980 | 35,584 | ||||||
Bunge Ltd. | 305 | 17,284 | ||||||
Mead Johnson Nutrition Co. | 410 | 34,838 | ||||||
Snyder’s-Lance, Inc. | 985 | 31,008 | ||||||
|
| |||||||
| 131,881 | ||||||||
|
| |||||||
Energy 30.0% | ||||||||
Anadarko Petroleum Corp. | 2,535 | 118,055 | ||||||
BP PLC SP ADR | 4,015 | 121,173 | ||||||
California Resources Corp. | 215 | 221 | ||||||
Canadian Natural Resources Ltd. | 1,030 | 27,810 | ||||||
ConocoPhillips | 820 | 33,021 | ||||||
Eni SpA SP ADR | 550 | 16,621 | ||||||
Exxon Mobil Corp. | 1,420 | 118,698 | ||||||
Gazprom PAO SP ADR | 5,400 | 23,274 | ||||||
Kinder Morgan, Inc. | 1,450 | 25,897 | ||||||
Lukoil PJSC SP ADR | 415 | 15,942 | ||||||
Occidental Petroleum Corp. | 2,170 | 148,493 | ||||||
Royal Dutch Shell PLC SP ADR | 1,415 | 68,557 | ||||||
Schlumberger Ltd. | 2,070 | 152,663 | ||||||
Suncor Energy, Inc. | 1,580 | 43,940 | ||||||
Total SA SP ADR | 2,374 | 107,827 | ||||||
|
| |||||||
| 1,022,192 | ||||||||
|
| |||||||
Financials 6.3% | ||||||||
Potlatch Corp., REIT | 1,200 | 37,800 | ||||||
Rayonier, Inc., REIT | 820 | 20,237 | ||||||
Weyerhaeuser Co., REIT | 5,058 | 156,697 | ||||||
|
| |||||||
| 214,734 | ||||||||
|
| |||||||
Health Care 1.7% | ||||||||
Zoetis, Inc. | 1,330 | 58,959 | ||||||
|
| |||||||
Industrials 2.4% | ||||||||
Grupo Aeroportuario del Sureste SAB de CV ADR | 165 | 24,778 | ||||||
Waste Management, Inc. | 1,000 | 59,000 | ||||||
|
| |||||||
| 83,778 | ||||||||
|
| |||||||
Materials 49.1% | ||||||||
Agrium, Inc. | 990 | 87,407 | ||||||
Alcoa, Inc. | 6,825 | 65,384 | ||||||
ArcelorMittal | 2,000 | 9,160 | ||||||
Barrick Gold Corp. | 8,040 | 109,183 | ||||||
BHP Billiton Ltd. SP ADR | 5,225 | 135,328 | ||||||
CF Industries Holdings, Inc. | 2,115 | 66,284 | ||||||
Domtar Corp. | 1,490 | 60,345 | ||||||
E.I. du Pont de Nemours & Co. | 1,060 | 67,119 | ||||||
Freeport-McMoRan, Inc. | 6,000 | 62,040 | ||||||
Goldcorp, Inc. | 3,455 | 56,075 | ||||||
| Shares | Value($) | |||||||
Materials—continued | ||||||||
Interfor Corp.* | 5,000 | 55,322 | ||||||
International Paper Co. | 1,655 | 67,921 | ||||||
KapStone Paper and Packaging Corp. | 3,155 | 43,697 | ||||||
Louisiana-Pacific Corp.* | 2,320 | 39,718 | ||||||
Monsanto Co. | 980 | 85,985 | ||||||
Mosaic Co. (The) | 1,710 | 46,170 | ||||||
Newmont Mining Corp. | 2,295 | 61,001 | ||||||
Nucor Corp. | 1,000 | 47,300 | ||||||
Packaging Corp. of America | 810 | 48,924 | ||||||
Potash Corp. of Saskatchewan, Inc. | 1,290 | 21,956 | ||||||
Rio Tinto PLC SP ADR | 2,600 | 73,502 | ||||||
Silver Wheaton Corp. | 1,730 | 28,683 | ||||||
Southern Copper Corp. | 735 | 20,367 | ||||||
United States Steel Corp. | 6,085 | 97,664 | ||||||
West Fraser Timber Co. Ltd. | 3,000 | 120,370 | ||||||
WestRock Co. | 2,480 | 96,794 | ||||||
|
| |||||||
| 1,673,699 | ||||||||
|
| |||||||
Total Common Stocks | 3,185,243 | |||||||
|
| |||||||
Rights 0.1% | ||||||||
Materials 0.1% | ||||||||
ArcelorMittal* | 2,000 | 2,730 | ||||||
|
| |||||||
Total Rights | 2,730 | |||||||
|
| |||||||
Money Market Fund 5.8% | ||||||||
State Street Institutional Liquid Reserves Fund, Institutional Class, 0.44%(a) | 198,321 | 198,321 | ||||||
|
| |||||||
Total Money Market Fund | 198,321 | |||||||
|
| |||||||
Total Investments | 3,386,294 | |||||||
Other Assets in Excess of | 22,334 | |||||||
|
| |||||||
Net Assets — 100.0% | $ | 3,408,628 | ||||||
|
| |||||||
| * | Non-income producing security. |
| (a) | Rate disclosed, the 7 day yield, is as of March 31, 2016. |
Investment Abbreviation
| ADR | — | American Depositary Receipt | ||
| REIT | — | Real Estate Investment Trust | ||
| SAB de CV | — | Sociedad Anónima Bursátil de Capital Variable is the Spanish equivalent to Variable Capital Company | ||
| SP ADR | — | Sponsored American Depositary Receipt |
See Notes to Financial Statements.
27
Table of Contents
SCHEDULES OF PORTFOLIO INVESTMENTS
RIDGEWORTH FUNDS March 31, 2016
International Equity Fund
| Shares | Value($) | |||||||
| Common Stocks 93.9% | ||||||||
Australia 3.2% | ||||||||
CSL Ltd. | 15,951 | 1,240,331 | ||||||
|
| |||||||
Bermuda 2.1% | ||||||||
Lazard Ltd., Cl A | 20,674 | 802,151 | ||||||
|
| |||||||
Canada 6.3% | ||||||||
Canadian Pacific Railway Ltd. | 10,768 | 1,428,806 | ||||||
Constellation Software, Inc. | 2,400 | 982,711 | ||||||
|
| |||||||
| 2,411,517 | ||||||||
|
| |||||||
China 6.9% | ||||||||
Ctrip.com International Ltd. ADR* | 27,022 | 1,195,994 | ||||||
Kaisa Group Holdings Ltd.*(a)(b)(c) | 423,000 | 85,065 | ||||||
Tencent Holdings Ltd. | 66,500 | 1,358,744 | ||||||
|
| |||||||
| 2,639,803 | ||||||||
|
| |||||||
Denmark 14.1% | ||||||||
Chr Hansen Holding A/S | 21,880 | 1,468,802 | ||||||
Coloplast A/S, Cl B | 16,200 | 1,227,524 | ||||||
Novo Nordisk A/S SP ADR(b) | 29,129 | 1,578,500 | ||||||
Novozymes A/S, Cl B | 25,084 | 1,127,698 | ||||||
|
| |||||||
| 5,402,524 | ||||||||
|
| |||||||
France 2.7% | ||||||||
LVMH Moet Hennessy Louis Vuitton SE | 6,005 | 1,028,380 | ||||||
|
| |||||||
India 2.9% | ||||||||
HDFC Bank Ltd. ADR | 18,051 | 1,112,483 | ||||||
|
| |||||||
Ireland 8.4% | ||||||||
Experian PLC | 61,792 | 1,104,922 | ||||||
ICON PLC* | 16,532 | 1,241,553 | ||||||
Perrigo Co. PLC | 6,895 | 882,077 | ||||||
|
| |||||||
| 3,228,552 | ||||||||
|
| |||||||
Japan 6.9% | ||||||||
Keyence Corp.(b) | 1,900 | 1,036,395 | ||||||
Sysmex Corp.(b) | 13,900 | 869,483 | ||||||
Uni-Charm Corp. | 34,000 | 739,846 | ||||||
|
| |||||||
| 2,645,724 | ||||||||
|
| |||||||
Mexico 1.7% | ||||||||
Wal-Mart de Mexico SAB de CV | 275,300 | 651,715 | ||||||
|
| |||||||
Netherlands 7.5% | ||||||||
Core Laboratories NV(b) | 10,972 | 1,233,363 | ||||||
Sensata Technologies Holding NV* | 25,649 | 996,207 | ||||||
Yandex NV, Cl A* | 42,029 | 643,884 | ||||||
|
| |||||||
| 2,873,454 | ||||||||
|
| |||||||
South Africa 1.3% | ||||||||
Shoprite Holdings Ltd. | 41,141 | 483,813 | ||||||
|
| |||||||
Spain 1.5% | ||||||||
Industria de Diseno Textil SA | 17,195 | 578,474 | ||||||
|
| |||||||
| Shares | Value($) | |||||||
Switzerland 12.6% | ||||||||
Chubb Ltd. | 13,710 | 1,633,547 | ||||||
Nestle SA | 21,559 | 1,610,955 | ||||||
SGS SA | 530 | 1,120,025 | ||||||
Swatch Group AG (The) BS | 1,380 | 478,059 | ||||||
|
| |||||||
| 4,842,586 | ||||||||
|
| |||||||
Taiwan 5.9% | ||||||||
Taiwan Semiconductor Manufacturing Co. Ltd. SP ADR | 86,740 | 2,272,588 | ||||||
|
| |||||||
United Kingdom 9.9% | ||||||||
ARM Holdings PLC SP ADR(b) | 25,076 | 1,095,570 | ||||||
Compass Group PLC | 64,877 | 1,144,245 | ||||||
Reckitt Benckiser Group PLC | 16,194 | 1,565,305 | ||||||
|
| |||||||
| 3,805,120 | ||||||||
|
| |||||||
Total Common Stocks | 36,019,215 | |||||||
|
| |||||||
Money Market Funds 14.2% | ||||||||
State Street Institutional Liquid Reserves Fund, Institutional Class, 0.44%(d) | 2,089,694 | 2,089,694 | ||||||
State Street Institutional U.S. Government Money Market Fund, Institutional Class, 0.24%(d)(e) | 3,345,648 | 3,345,648 | ||||||
|
| |||||||
Total Money Market Funds | 5,435,342 | |||||||
|
| |||||||
Total Investments | 41,454,557 | |||||||
Liabilities in Excess of Other | (3,110,962 | ) | ||||||
|
| |||||||
Net Assets — 100.0% | $ | 38,343,595 | ||||||
|
| |||||||
| * | Non-income producing security. |
| (a) | Valued at fair value using procedures approved by the Board of Trustees (See Note 2(a)). Fair valued securities held by the Fund represent 0.2% of net assets as of March 31, 2016. |
| (b) | The security or a partial position of the security was on loan as of March 31, 2016. The total value of securities on loan as of March 31, 2016 was $3,320,910. |
| (c) | The Fund’s investment adviser/subadviser has deemed this security to be illiquid based upon procedures approved by the Board of Trustees. |
| (d) | Rate disclosed, the 7 day yield, is as of March 31, 2016. |
| (e) | Purchased with cash collateral held from securities lending. The total value of the collateral held by the Fund was $3,435,536. The total value of the collateral includes non-cash U.S. Government securities collateral having a value of $89,888. The value of the collateral could include collateral held for securities that were sold on or before March 31, 2016 (See Note 2(g)). |
See Notes to Financial Statements.
28
Table of Contents
SCHEDULES OF PORTFOLIO INVESTMENTS
RIDGEWORTH FUNDS March 31, 2016
International Equity Fund — concluded
Investment Abbreviations
| ADR | — | American Depositary Receipt | ||
| BS | — | Bearer Shares | ||
| SAB de CV | — | Sociedad Anónima Bursátil de Capital Variable is the Spanish equivalent to Variable Capital Company | ||
| SP ADR | — | Sponsored American Depositary Receipt |
See Notes to Financial Statements.
29
Table of Contents
SCHEDULES OF PORTFOLIO INVESTMENTS
RIDGEWORTH FUNDS March 31, 2016
Large Cap Growth Stock Fund
| Shares | Value($) | |||||||
| Common Stocks 99.9% | ||||||||
Consumer Discretionary 26.6% | ||||||||
Amazon.com, Inc.* | 18,045 | 10,712,234 | ||||||
Chipotle Mexican Grill, Inc.* | 7,234 | 3,406,997 | ||||||
DR Horton, Inc. | 148,123 | 4,477,758 | ||||||
Harman International Industries, Inc. | 20,893 | 1,860,313 | ||||||
Johnson Controls, Inc. | 53,385 | 2,080,413 | ||||||
Netflix, Inc.* | 45,556 | 4,657,190 | ||||||
NIKE, Inc., Cl B | 63,791 | 3,921,233 | ||||||
Priceline Group, Inc. (The)* | 5,287 | 6,814,732 | ||||||
Royal Caribbean Cruises Ltd. | 61,020 | 5,012,793 | ||||||
Scripps Networks Interactive, Cl A | 35,893 | 2,350,991 | ||||||
Starbucks Corp. | 141,098 | 8,423,551 | ||||||
Ulta Salon Cosmetics & Fragrance, Inc.* | 14,828 | 2,872,777 | ||||||
Under Armour, Inc., Cl A* | 79,910 | 6,778,765 | ||||||
VF Corp. | 46,191 | 2,991,329 | ||||||
|
| |||||||
| 66,361,076 | ||||||||
|
| |||||||
Consumer Staples 7.4% | ||||||||
Blue Buffalo Pet Products, Inc.* | 40,379 | 1,036,125 | ||||||
Colgate-Palmolive Co. | 66,180 | 4,675,617 | ||||||
Costco Wholesale Corp. | 32,797 | 5,168,151 | ||||||
Estee Lauder Cos., Inc. (The), Cl A | 40,013 | 3,773,626 | ||||||
WhiteWave Foods Co. (The)* | 91,775 | 3,729,736 | ||||||
|
| |||||||
| 18,383,255 | ||||||||
|
| |||||||
Energy 1.7% | ||||||||
Devon Energy Corp. | 32,988 | 905,191 | ||||||
EOG Resources, Inc. | 46,831 | 3,398,994 | ||||||
|
| |||||||
| 4,304,185 | ||||||||
|
| |||||||
Financials 3.3% | ||||||||
Charles Schwab Corp. (The) | 98,808 | 2,768,600 | ||||||
Discover Financial Services | 48,680 | 2,478,786 | ||||||
Morgan Stanley | 121,995 | 3,051,095 | ||||||
|
| |||||||
| 8,298,481 | ||||||||
|
| |||||||
Health Care 14.5% | ||||||||
Alexion Pharmaceuticals, Inc.* | 41,065 | 5,717,069 | ||||||
Biogen Inc.* | 16,926 | 4,406,176 | ||||||
Cerner Corp.* | 49,799 | 2,637,355 | ||||||
Edwards Lifesciences Corp.* | 19,286 | 1,701,218 | ||||||
Gilead Sciences, Inc. | 100,500 | 9,231,930 | ||||||
HCA Holdings, Inc.* | 28,816 | 2,249,089 | ||||||
Illumina, Inc.* | 14,201 | 2,302,124 | ||||||
McKesson Corp. | 18,395 | 2,892,614 | ||||||
Mylan NV*(a) | 108,248 | 5,017,295 | ||||||
|
| |||||||
| 36,154,870 | ||||||||
|
| |||||||
Industrials 10.4% | ||||||||
A.O. Smith Corp. | 14,813 | 1,130,380 | ||||||
BE Aerospace, Inc. | 28,159 | 1,298,693 | ||||||
| Shares | Value($) | |||||||
Industrials—continued | ||||||||
Delta Air Lines, Inc. | 100,705 | 4,902,319 | ||||||
Fluor Corp. | 34,994 | 1,879,178 | ||||||
Fortune Brands Home & Security, Inc. | 51,711 | 2,897,885 | ||||||
HD Supply Holdings, Inc.* | 103,852 | 3,434,386 | ||||||
Honeywell International, Inc. | 48,279 | 5,409,662 | ||||||
IHS, Inc., Cl A* | 12,415 | 1,541,446 | ||||||
J.B. Hunt Transport Services, Inc. | 24,192 | 2,037,934 | ||||||
WABCO Holdings, Inc.* | 14,621 | 1,563,277 | ||||||
|
| |||||||
| 26,095,160 | ||||||||
|
| |||||||
Information Technology 33.5% | ||||||||
Adobe Systems, Inc.* | 27,075 | 2,539,635 | ||||||
Alphabet, Inc., Cl A* | 11,225 | 8,563,552 | ||||||
Alphabet, Inc., Cl C* | 11,527 | 8,587,039 | ||||||
Analog Devices, Inc. | 63,412 | 3,753,356 | ||||||
Apple, Inc. | 159,873 | 17,424,558 | ||||||
ARM Holdings PLC SP ADR(a) | 43,099 | 1,882,995 | ||||||
Cognizant Technology Solutions Corp., Cl A* | 52,646 | 3,300,904 | ||||||
Facebook, Inc., Cl A* | 112,137 | 12,794,832 | ||||||
Palo Alto Networks, Inc.* | 20,412 | 3,330,014 | ||||||
Red Hat, Inc.* | 37,324 | 2,781,011 | ||||||
Salesforce.com, Inc.* | 69,443 | 5,126,977 | ||||||
Splunk, Inc.* | 41,232 | 2,017,482 | ||||||
Visa, Inc., Cl A | 123,318 | 9,431,361 | ||||||
Workday, Inc., Cl A*(a) | 28,285 | 2,173,419 | ||||||
|
| |||||||
| 83,707,135 | ||||||||
|
| |||||||
Materials 2.5% | ||||||||
Monsanto Co. | 23,880 | 2,095,231 | ||||||
PPG Industries, Inc. | 12,557 | 1,399,980 | ||||||
Vulcan Materials Co. | 26,212 | 2,767,201 | ||||||
|
| |||||||
| 6,262,412 | ||||||||
|
| |||||||
Total Common Stocks | 249,566,574 | |||||||
|
| |||||||
Money Market Funds 1.2% | ||||||||
State Street Institutional Liquid Reserves Fund, Institutional Class, 0.44%(b) | 331,142 | 331,142 | ||||||
State Street Institutional U.S. Government Money Market Fund, Institutional Class, 0.24%(b)(c) | 2,753,300 | 2,753,300 | ||||||
|
| |||||||
Total Money Market Funds | 3,084,442 | |||||||
|
| |||||||
Total Investments |
| 252,651,016 | ||||||
Liabilities in Excess of Other | (2,801,511 | ) | ||||||
|
| |||||||
Net Assets — 100.0% | $ | 249,849,505 | ||||||
|
| |||||||
See Notes to Financial Statements.
30
Table of Contents
SCHEDULES OF PORTFOLIO INVESTMENTS
RIDGEWORTH FUNDS March 31, 2016
Large Cap Growth Stock Fund — concluded
| * | Non-income producing security. |
| (a) | The security or a partial position of the security was on loan as of March 31, 2016. The total value of securities on loan as of March 31, 2016 was $7,711,018. |
| (b) | Rate disclosed, the 7 day yield, is as of March 31, 2016. |
| (c) | Purchased with cash collateral held from securities lending. The total value of the collateral held by the Fund was $7,895,080. The total value of the collateral includes non-cash U.S. Government securities collateral having a value of $5,141,780. The value of the collateral could include collateral held for securities that were sold on or before March 31, 2016 (See Note 2(g)). |
Investment Abbreviation
SP ADR — Sponsored American Depositary Receipt
See Notes to Financial Statements.
31
Table of Contents
SCHEDULES OF PORTFOLIO INVESTMENTS
RIDGEWORTH FUNDS March 31, 2016
Large Cap Value Equity Fund
| Shares | Value($) | |||||||
| Common Stocks 95.9% | ||||||||
Consumer Discretionary 6.6% |
| |||||||
Comcast Corp., Cl A | 884,685 | 54,036,560 | ||||||
Johnson Controls, Inc. | 1,170,307 | 45,606,863 | ||||||
Macy’s, Inc. | 365,933 | 16,133,986 | ||||||
PulteGroup, Inc. | 949,880 | 17,772,255 | ||||||
Ralph Lauren Corp. | 51,489 | 4,956,331 | ||||||
|
| |||||||
| 138,505,995 | ||||||||
|
| |||||||
Consumer Staples 3.0% |
| |||||||
Procter & Gamble Co. (The) | 707,524 | 58,236,301 | ||||||
Wal-Mart Stores, Inc. | 73,880 | 5,060,041 | ||||||
|
| |||||||
| 63,296,342 | ||||||||
|
| |||||||
Energy 12.1% | ||||||||
Chevron Corp. | 695,345 | 66,335,913 | ||||||
EOG Resources, Inc. | 719,221 | 52,201,060 | ||||||
Exxon Mobil Corp. | 838,554 | 70,094,729 | ||||||
Pioneer Natural Resources Co. | 120,286 | 16,929,052 | ||||||
Schlumberger Ltd. | 659,539 | 48,641,001 | ||||||
|
| |||||||
| 254,201,755 | ||||||||
|
| |||||||
Financials 28.6% | ||||||||
Allstate Corp. (The) | 617,470 | 41,598,954 | ||||||
American Express Co. | 505,825 | 31,057,655 | ||||||
American Tower Corp., REIT | 232,285 | 23,779,015 | ||||||
Ameriprise Financial, Inc. | 341,697 | 32,122,935 | ||||||
Aon PLC | 407,551 | 42,568,702 | ||||||
BlackRock, Inc. | 122,350 | 41,668,740 | ||||||
Chubb Ltd. | 336,365 | 40,077,890 | ||||||
Citigroup, Inc. | 826,750 | 34,516,813 | ||||||
Crown Castle International Corp., REIT | 180,045 | 15,573,893 | ||||||
Franklin Resources, Inc. | 778,140 | 30,386,367 | ||||||
JPMorgan Chase & Co. | 965,238 | 57,161,394 | ||||||
MetLife, Inc. | 480,230 | 21,101,306 | ||||||
Morgan Stanley | 1,715,042 | 42,893,200 | ||||||
U.S. Bancorp | 1,341,685 | 54,458,994 | ||||||
Wells Fargo & Co. | 1,531,395 | 74,058,262 | ||||||
Willis Towers Watson PLC | 138,985 | 16,491,960 | ||||||
|
| |||||||
| 599,516,080 | ||||||||
|
| |||||||
Health Care 13.4% | ||||||||
Agilent Technologies, Inc. | 862,509 | 34,370,984 | ||||||
Baxalta, Inc. | 260,389 | 10,519,716 | ||||||
Cigna Corp. | 291,081 | 39,947,956 | ||||||
Johnson & Johnson | 553,791 | 59,920,186 | ||||||
Pfizer, Inc. | 2,522,000 | 74,752,080 | ||||||
UnitedHealth Group, Inc. | 475,090 | 61,239,101 | ||||||
|
| |||||||
| 280,750,023 | ||||||||
|
| |||||||
| Shares | Value($) | |||||||
Industrials 8.4% | ||||||||
Caterpillar, Inc. | 402,906 | 30,838,425 | ||||||
CSX Corp. | 1,419,137 | 36,542,778 | ||||||
FedEx Corp. | 215,540 | 35,072,669 | ||||||
General Electric Co. | 1,732,073 | 55,062,601 | ||||||
Honeywell International, Inc. | 167,290 | 18,744,844 | ||||||
|
| |||||||
| 176,261,317 | ||||||||
|
| |||||||
Information Technology 17.6% |
| |||||||
Applied Materials, Inc. | 1,811,745 | 38,372,759 | ||||||
Cisco Systems, Inc. | 1,725,855 | 49,135,092 | ||||||
EMC Corp. | 1,247,754 | 33,252,644 | ||||||
Intel Corp. | 934,815 | 30,241,265 | ||||||
Maxim Integrated Products, Inc. | 290,440 | 10,682,383 | ||||||
Microsoft Corp. | 1,475,365 | 81,484,409 | ||||||
Oracle Corp. | 2,083,046 | 85,217,412 | ||||||
Texas Instruments, Inc. | 692,492 | 39,762,891 | ||||||
|
| |||||||
| 368,148,855 | ||||||||
|
| |||||||
Materials 2.2% | ||||||||
Dow Chemical Co. (The) | 662,473 | 33,693,377 | ||||||
WestRock Co. | 310,918 | 12,135,129 | ||||||
|
| |||||||
| 45,828,506 | ||||||||
|
| |||||||
Telecommunication Services 2.5% |
| |||||||
Verizon Communications, Inc. | 949,500 | 51,348,960 | ||||||
|
| |||||||
Utilities 1.5% | ||||||||
NextEra Energy, Inc. | 261,979 | 31,002,595 | ||||||
|
| |||||||
Total Common Stocks | 2,008,860,428 | |||||||
|
| |||||||
Money Market Fund 4.5% | ||||||||
State Street Institutional Liquid Reserves Fund, Institutional Class, 0.44%(a) | 95,041,854 | 95,041,854 | ||||||
|
| |||||||
Total Money Market Fund | 95,041,854 | |||||||
|
| |||||||
Total Investments |
| 2,103,902,282 | ||||||
Liabilities in Excess of Other |
| (8,596,304 | ) | |||||
|
| |||||||
Net Assets — 100.0% | $ | 2,095,305,978 | ||||||
|
| |||||||
| (a) | Rate disclosed, the 7 day yield, is as of March 31, 2016. |
Investment Abbreviation
REIT — Real Estate Investment Trust
See Notes to Financial Statements.
32
Table of Contents
SCHEDULES OF PORTFOLIO INVESTMENTS
RIDGEWORTH FUNDS March 31, 2016
Mid-Cap Value Equity Fund
| Shares | Value($) | |||||||
| Common Stocks 97.0% | ||||||||
Consumer Discretionary 6.7% |
| |||||||
Hanesbrands, Inc. | 715,000 | 20,263,100 | ||||||
Johnson Controls, Inc. | 1,435,000 | 55,921,950 | ||||||
Marriott International, Inc., Cl A(a) | 465,000 | 33,098,700 | ||||||
Newell Rubbermaid, Inc.(a) | 575,000 | 25,466,750 | ||||||
Ralph Lauren Corp. | 425,000 | 40,910,500 | ||||||
Royal Caribbean Cruises Ltd. | 235,000 | 19,305,250 | ||||||
Whirlpool Corp. | 175,000 | 31,559,500 | ||||||
|
| |||||||
| 226,525,750 | ||||||||
|
| |||||||
Energy 9.5% | ||||||||
Anadarko Petroleum Corp. | 1,025,000 | 47,734,250 | ||||||
Cabot Oil & Gas Corp. | 1,200,000 | 27,252,000 | ||||||
Marathon Petroleum Corp. | 1,300,000 | 48,334,000 | ||||||
Noble Energy, Inc. | 1,550,000 | 48,685,500 | ||||||
Patterson-UTI Energy, Inc. | 2,500,000 | 44,050,000 | ||||||
Pioneer Natural Resources Co. | 750,000 | 105,555,000 | ||||||
|
| |||||||
| 321,610,750 | ||||||||
|
| |||||||
Financials 32.3% | ||||||||
Allstate Corp. (The) | 1,200,000 | 80,844,000 | ||||||
American Campus Communities, Inc., REIT | 950,000 | 44,735,500 | ||||||
Ameriprise Financial, Inc. | 985,000 | 92,599,850 | ||||||
BankUnited, Inc. | 900,000 | 30,996,000 | ||||||
BB&T Corp. | 1,040,000 | 34,600,800 | ||||||
Capital One Financial Corp. | 525,000 | 36,387,750 | ||||||
Corporate Office Properties Trust, REIT | 1,600,000 | 41,984,000 | ||||||
Crown Castle International Corp., REIT | 565,000 | 48,872,500 | ||||||
General Growth Properties, Inc., REIT | 1,400,000 | 41,622,000 | ||||||
Hartford Financial Services Group, Inc. (The) | 1,765,000 | 81,331,200 | ||||||
Invesco Ltd. | 2,175,000 | 66,924,750 | ||||||
Lazard Ltd., Cl A | 2,500,000 | 97,000,000 | ||||||
MB Financial, Inc. | 1,400,000 | 45,430,000 | ||||||
PacWest Bancorp | 475,000 | 17,646,250 | ||||||
Progressive Corp. (The) | 1,350,000 | 47,439,000 | ||||||
Prologis, Inc., REIT | 850,000 | 37,553,000 | ||||||
SL Green Realty Corp., REIT | 175,000 | 16,954,000 | ||||||
Umpqua Holdings Corp. | 2,650,000 | 42,029,000 | ||||||
Weyerhaeuser Co., REIT | 1,115,000 | 34,542,700 | ||||||
Willis Towers Watson PLC | 610,000 | 72,382,600 | ||||||
XL Group PLC | 2,100,000 | 77,280,000 | ||||||
|
| |||||||
| 1,089,154,900 | ||||||||
|
| |||||||
Health Care 8.4% | ||||||||
Agilent Technologies, Inc. | 1,475,000 | 58,778,750 | ||||||
Baxalta, Inc. | 600,000 | 24,240,000 | ||||||
| Shares | Value($) | |||||||
Health Care—continued | ||||||||
Cigna Corp. | 810,000 | 111,164,400 | ||||||
Perrigo Co. PLC | 385,000 | 49,253,050 | ||||||
STERIS PLC | 565,000 | 40,143,250 | ||||||
|
| |||||||
| 283,579,450 | ||||||||
|
| |||||||
Industrials 13.8% | ||||||||
Allison Transmission Holdings, Inc. | 655,000 | 17,671,900 | ||||||
CSX Corp. | 980,000 | 25,235,000 | ||||||
Delta Air Lines, Inc. | 625,000 | 30,425,000 | ||||||
Donaldson Co., Inc.(a) | 404,200 | 12,898,022 | ||||||
Hubbell, Inc. | 360,000 | 38,134,800 | ||||||
Ingersoll-Rand PLC | 650,000 | 40,306,500 | ||||||
ITT Corp. | 1,125,000 | 41,501,250 | ||||||
J.B. Hunt Transport Services, Inc. | 300,000 | 25,272,000 | ||||||
Macquarie Infrastructure Corp. | 740,000 | 49,905,600 | ||||||
Orbital ATK, Inc. | 415,000 | 36,080,100 | ||||||
Oshkosh Corp.(a) | 865,000 | 35,352,550 | ||||||
Republic Services, Inc. | 175,000 | 8,338,750 | ||||||
Rockwell Automation, Inc. | 200,000 | 22,750,000 | ||||||
Stanley Black & Decker, Inc. | 200,000 | 21,042,000 | ||||||
Tyco International PLC | 1,115,000 | 40,931,650 | ||||||
Wabtec Corp. | 250,000 | 19,822,500 | ||||||
|
| |||||||
| 465,667,622 | ||||||||
|
| |||||||
Information Technology 12.2% |
| |||||||
Analog Devices, Inc. | 450,000 | 26,635,500 | ||||||
Applied Materials, Inc. | 2,900,000 | 61,422,000 | ||||||
Cypress Semiconductor Corp.(a) | 12,500,000 | 108,250,000 | ||||||
Harris Corp. | 840,000 | 65,402,400 | ||||||
Hewlett Packard Enterprise Co. | 1,100,000 | 19,503,000 | ||||||
Intersil Corp., Cl A | 1,960,800 | 26,215,896 | ||||||
KLA-Tencor Corp. | 600,000 | 43,686,000 | ||||||
Maxim Integrated Products, Inc. | 695,000 | 25,562,100 | ||||||
Skyworks Solutions, Inc. | 460,000 | 35,834,000 | ||||||
|
| |||||||
| 412,510,896 | ||||||||
|
| |||||||
Materials 4.0% | ||||||||
Ashland, Inc. | 390,000 | 42,884,400 | ||||||
Martin Marietta Materials, Inc. | 70,000 | 11,165,700 | ||||||
Sherwin-Williams Co. (The) | 60,800 | 17,307,936 | ||||||
WestRock Co. | 1,600,000 | 62,448,000 | ||||||
|
| |||||||
| 133,806,036 | ||||||||
|
| |||||||
Utilities 10.1% | ||||||||
Ameren Corp. | 930,000 | 46,593,000 | ||||||
American Electric Power Co., Inc. | 590,000 | 39,176,000 | ||||||
See Notes to Financial Statements.
33
Table of Contents
SCHEDULES OF PORTFOLIO INVESTMENTS
RIDGEWORTH FUNDS March 31, 2016
Mid-Cap Value Equity Fund — concluded
| Shares | Value($) | |||||||
Utilities—continued | ||||||||
Edison International | 660,000 | 47,447,400 | ||||||
Exelon Corp. | 1,000,000 | 35,860,000 | ||||||
NextEra Energy Partners LP | 1,950,000 | 53,020,500 | ||||||
PG&E Corp. | 450,000 | 26,874,000 | ||||||
PPL Corp. | 1,150,000 | 43,780,500 | ||||||
Sempra Energy | 455,000 | 47,342,750 | ||||||
|
| |||||||
| 340,094,150 | ||||||||
|
| |||||||
Total Common Stocks | 3,272,949,554 | |||||||
|
| |||||||
Money Market Funds 7.4% |
| |||||||
State Street Institutional Liquid Reserves Fund, Institutional Class, 0.44%(b) | 90,734,439 | 90,734,439 | ||||||
State Street Institutional U.S. Government Money Market Fund, Institutional Class, 0.24%(b)(c) | 157,843,909 | 157,843,909 | ||||||
|
| |||||||
Total Money Market Funds (Cost $248,578,348) | 248,578,348 | |||||||
|
| |||||||
Total Investments |
| 3,521,527,902 | ||||||
Liabilities in Excess of Other | (149,368,353 | ) | ||||||
|
| |||||||
Net Assets — 100.0% | $ | 3,372,159,549 | ||||||
|
| |||||||
| (a) | The security or a partial position of the security was on loan as of March 31, 2016. The total value of securities on loan as of March 31, 2016 was $152,604,064. |
| (b) | Rate disclosed, the 7 day yield, is as of March 31, 2016. |
| (c) | Purchased with cash collateral held from securities lending. The value of the collateral could include collateral held for securities that were sold on or before March 31, 2016 (See Note 2(g)). |
Investment Abbreviation
REIT — Real Estate Investment Trust
See Notes to Financial Statements.
34
Table of Contents
SCHEDULES OF PORTFOLIO INVESTMENTS
RIDGEWORTH FUNDS March 31, 2016
Small Cap Growth Stock Fund
| Shares | Value($) | |||||||
| Common Stocks 99.7% | ||||||||
Consumer Discretionary 17.7% | ||||||||
American Axle & Manufacturing Holdings, Inc.* | 27,666 | 425,780 | ||||||
Cheesecake Factory, Inc. (The) | 11,834 | 628,267 | ||||||
Cracker Barrel Old Country Store, Inc.(a) | 5,052 | 771,289 | ||||||
Denny’s Corp.* | 58,987 | 611,105 | ||||||
Dorman Products, Inc.* | 7,035 | 382,845 | ||||||
Five Below, Inc.*(a) | 10,369 | 428,654 | ||||||
G-III Apparel Group Ltd.* | 14,319 | 700,056 | ||||||
Gray Television, Inc.* | 64,231 | 752,787 | ||||||
Group 1 Automotive, Inc. | 7,522 | 441,466 | ||||||
Kirkland’s, Inc. | 26,298 | 460,478 | ||||||
Lithia Motors, Inc., Cl A | 3,891 | 339,801 | ||||||
Monro Muffler Brake, Inc. | 8,662 | 619,073 | ||||||
Penn National Gaming, Inc.* | 36,783 | 613,908 | ||||||
Sinclair Broadcast Group, Inc., Cl A(a) | 23,357 | 718,228 | ||||||
Tenneco, Inc.* | 16,215 | 835,235 | ||||||
Wayfair, Inc., Cl A*(a) | 7,734 | 334,264 | ||||||
|
| |||||||
| 9,063,236 | ||||||||
|
| |||||||
Consumer Staples 1.8% | ||||||||
Casey’s General Stores, Inc. | 4,842 | 548,695 | ||||||
Energizer Holdings, Inc. | 9,668 | 391,651 | ||||||
|
| |||||||
| 940,346 | ||||||||
|
| |||||||
Financials 6.7% | ||||||||
AMERISAFE, Inc. | 9,277 | 487,414 | ||||||
Cardinal Financial Corp. | 26,691 | 543,162 | ||||||
Evercore Partners, Inc., Cl A | 9,686 | 501,250 | ||||||
Home BancShares, Inc. | 13,699 | 560,974 | ||||||
MarketAxess Holdings, Inc. | 6,593 | 823,004 | ||||||
Texas Capital Bancshares, Inc.* | 13,361 | 512,795 | ||||||
|
| |||||||
| 3,428,599 | ||||||||
|
| |||||||
Health Care 24.0% | ||||||||
ABIOMED, Inc.* | 10,168 | 964,028 | ||||||
Adeptus Health, Inc., Cl A*(a) | 7,585 | 421,271 | ||||||
AMN Healthcare Services, Inc.* | 21,180 | 711,860 | ||||||
Amsurg Corp.* | 5,601 | 417,835 | ||||||
Array BioPharma, Inc.*(a) | 67,073 | 197,865 | ||||||
Cambrex Corp.* | 12,031 | 529,364 | ||||||
Chemed Corp. | 2,786 | 377,364 | ||||||
Depomed, Inc.*(a) | 24,894 | 346,773 | ||||||
HealthSouth Corp. | 18,750 | 705,562 | ||||||
ICON PLC* | 6,636 | 498,364 | ||||||
Idera Pharmaceuticals, Inc.*(a) | 158,539 | 313,907 | ||||||
Inogen, Inc.* | 13,513 | 607,815 | ||||||
Insmed, Inc.*(a) | 19,602 | 248,357 | ||||||
Keryx Biopharmaceuticals, Inc.*(a) | 55,878 | 260,950 | ||||||
Ligand Pharmaceuticals, Inc.*(a) | 8,906 | 953,744 | ||||||
| Shares | Value($) | |||||||
Health Care—continued | ||||||||
Molina Healthcare, Inc.* | 9,801 | 632,066 | ||||||
Neurocrine Biosciences, Inc.* | 11,970 | 473,414 | ||||||
NuVasive, Inc.* | 11,878 | 577,865 | ||||||
NxStage Medical, Inc.* | 38,496 | 577,055 | ||||||
Omnicell, Inc.* | 22,808 | 635,659 | ||||||
Portola Pharmaceuticals, Inc.* | 14,080 | 287,232 | ||||||
Radius Health, Inc.*(a) | 8,926 | 280,633 | ||||||
Team Health Holdings, Inc.* | 12,565 | 525,343 | ||||||
Ultragenyx Pharmaceutical, Inc.* | 5,829 | 369,034 | ||||||
Vanda Pharmaceuticals, Inc.*(a) | 46,193 | 386,173 | ||||||
|
| |||||||
| 12,299,533 | ||||||||
|
| |||||||
Industrials 19.8% | ||||||||
AAON, Inc. | 29,296 | 820,288 | ||||||
Allegiant Travel Co. | 2,379 | 423,605 | ||||||
American Woodmark Corp.* | 5,696 | 424,865 | ||||||
AZZ, Inc. | 8,604 | 486,986 | ||||||
Badger Meter, Inc.(a) | 9,009 | 599,189 | ||||||
Beacon Roofing Supply, Inc.* | 14,164 | 580,866 | ||||||
Comfort Systems USA, Inc. | 20,377 | 647,377 | ||||||
Dycom Industries, Inc.*(a) | 10,789 | 697,725 | ||||||
Forward Air Corp. | 14,032 | 635,930 | ||||||
Hawaiian Holdings, Inc.* | 10,713 | 505,546 | ||||||
Healthcare Services Group, Inc. | 14,688 | 540,665 | ||||||
HEICO Corp. | 10,257 | 616,753 | ||||||
HNI Corp. | 14,934 | 584,965 | ||||||
Knight Transportation, Inc. | 11,708 | 306,164 | ||||||
Korn/Ferry International | 12,940 | 366,073 | ||||||
Simpson Manufacturing Co., Inc. | 18,922 | 722,253 | ||||||
Trex Co., Inc.* | 13,494 | 646,767 | ||||||
Universal Forest Products, Inc. | 6,371 | 546,759 | ||||||
|
| |||||||
| 10,152,776 | ||||||||
|
| |||||||
Information Technology 26.0% | ||||||||
Aspen Technology, Inc.* | 18,526 | 669,344 | ||||||
Cavium, Inc.* | 10,138 | 620,040 | ||||||
CSG Systems International, Inc. | 17,543 | 792,242 | ||||||
Demandware, Inc.* | 15,080 | 589,628 | ||||||
Ellie Mae, Inc.* | 7,963 | 721,766 | ||||||
Euronet Worldwide, Inc.* | 7,799 | 577,984 | ||||||
FleetMatics Group PLC* | 11,548 | 470,119 | ||||||
Guidewire Software, Inc.* | 13,168 | 717,393 | ||||||
Heartland Payment Systems, Inc. | 5,379 | 519,450 | ||||||
Imperva, Inc.*(a) | 15,367 | 776,034 | ||||||
Inphi Corp.* | 19,224 | 640,928 | ||||||
Integrated Device Technology, Inc.* | 34,814 | 711,598 | ||||||
Littelfuse, Inc. | 7,350 | 904,859 | ||||||
LogMeIn, Inc.* | 7,064 | 356,449 | ||||||
Manhattan Associates, Inc.* | 17,674 | 1,005,120 | ||||||
NIC, Inc. | 17,319 | 312,262 | ||||||
Paycom Software, Inc.* | 11,217 | 399,325 | ||||||
Proofpoint, Inc.*(a) | 16,937 | 910,872 | ||||||
See Notes to Financial Statements.
35
Table of Contents
SCHEDULES OF PORTFOLIO INVESTMENTS
RIDGEWORTH FUNDS March 31, 2016
Small Cap Growth Stock Fund — concluded
| Shares | Value($) | |||||||
Information Technology—continued |
| |||||||
Q2 Holdings, Inc.* | 29,455 | 708,098 | ||||||
Synaptics, Inc.* | 6,109 | 487,132 | ||||||
Virtusa Corp.* | 11,843 | 443,639 | ||||||
|
| |||||||
| 13,334,282 | ||||||||
|
| |||||||
Materials 2.6% | ||||||||
Balchem Corp. | 9,740 | 604,075 | ||||||
GCP Applied Technologies, Inc.* | 15,896 | 316,966 | ||||||
HB Fuller Co. | 9,575 | 406,459 | ||||||
|
| |||||||
| 1,327,500 | ||||||||
|
| |||||||
Telecommunication Services 1.1% |
| |||||||
8x8, Inc.* | 55,726 | 560,604 | ||||||
|
| |||||||
Total Common Stocks | 51,106,876 | |||||||
|
| |||||||
| Shares | Value($) | |||||||
Money Market Funds 16.7% | ||||||||
State Street Institutional Liquid Reserves Fund, Institutional Class, 0.44%(b) | 333,280 | 333,280 | ||||||
State Street Institutional U.S. Government Money Market Fund, Institutional Class, 0.24%(b)(c) | 8,244,601 | 8,244,601 | ||||||
|
| |||||||
Total Money Market Funds | 8,577,881 | |||||||
|
| |||||||
Total Investments | 59,684,757 | |||||||
Liabilities in Excess of Other Assets — (16.4)% | (8,418,669 | ) | ||||||
|
| |||||||
Net Assets — 100.0% | $ | 51,266,088 | ||||||
|
| |||||||
| * | Non-income producing security. |
| (a) | The security or a partial position of the security was on loan as of March 31, 2016. The total value of securities on loan as of March 31, 2016 was $7,995,415. |
| (b) | Rate disclosed, the 7 day yield, is as of March 31, 2016. |
| (c) | Purchased with cash collateral held from securities lending. The value of the collateral could include collateral held for securities that were sold on or before March 31, 2016 (See Note 2(g)). |
See Notes to Financial Statements.
36
Table of Contents
SCHEDULES OF PORTFOLIO INVESTMENTS
RIDGEWORTH FUNDS March 31, 2016
Small Cap Value Equity Fund
| Shares | Value($) | |||||||
| Common Stocks 98.9% | ||||||||
Consumer Discretionary 17.0% | ||||||||
AMC Entertainment Holdings, Inc., Cl A | 993,140 | 27,797,988 | ||||||
Chico’s FAS, Inc. | 1,051,000 | 13,946,770 | ||||||
Guess?, Inc. | 1,155,854 | 21,695,379 | ||||||
HSN, Inc. | 489,060 | 25,582,729 | ||||||
Matthews International Corp., Cl A | 58,040 | 2,987,319 | ||||||
MDC Partners, Inc., Cl A | 275,700 | 6,506,520 | ||||||
Meredith Corp. | 11,690 | 555,275 | ||||||
Papa John’s International, Inc. | 16,300 | 883,297 | ||||||
Regal Entertainment Group, Cl A | 747,900 | 15,810,606 | ||||||
Ruth’s Hospitality Group, Inc. | 208,670 | 3,841,615 | ||||||
Scholastic Corp. | 238,990 | 8,931,056 | ||||||
Sonic Automotive, Inc., Cl A | 594,470 | 10,985,806 | ||||||
Thor Industries, Inc. | 313,980 | 20,022,505 | ||||||
Tupperware Brands Corp. | 77,700 | 4,505,046 | ||||||
Wolverine World Wide, Inc. | 23,500 | 432,870 | ||||||
|
| |||||||
| 164,484,781 | ||||||||
|
| |||||||
Consumer Staples 8.4% | ||||||||
B&G Foods, Inc. | 677,700 | 23,590,737 | ||||||
Calavo Growers, Inc. | 27,100 | 1,546,326 | ||||||
Energizer Holdings, Inc. | 821,600 | 33,283,016 | ||||||
Inter Parfums, Inc. | 229,200 | 7,082,280 | ||||||
PriceSmart, Inc. | 23,200 | 1,962,256 | ||||||
Sanderson Farms, Inc. | 153,501 | 13,842,720 | ||||||
|
| |||||||
| 81,307,335 | ||||||||
|
| |||||||
Energy 0.8% | ||||||||
Bristow Group, Inc. | 406,260 | 7,686,439 | ||||||
|
| |||||||
Financials 24.5% | ||||||||
Alexander & Baldwin, Inc. | 326,010 | 11,958,047 | ||||||
Banco Latinoamericano de Expectaciones SA, Cl E | 59,670 | 1,445,207 | ||||||
Bank of Hawaii Corp. | 298,040 | 20,350,171 | ||||||
Cohen & Steers, Inc. | 401,200 | 15,614,704 | ||||||
Evercore Partners, Inc., Cl A | 383,720 | 19,857,510 | ||||||
Hanover Insurance Group, Inc. (The) | 354,070 | 31,944,195 | ||||||
Horace Mann Educators Corp. | 388,200 | 12,302,058 | ||||||
Medical Properties Trust, Inc., REIT | 1,988,130 | 25,805,927 | ||||||
Monmouth Real Estate Investment Corp., Cl A REIT | 68,650 | 816,249 | ||||||
Oppenheimer Holdings, Inc., Cl A | 14,910 | 235,280 | ||||||
Outfront Media, Inc., REIT | 932,195 | 19,669,314 | ||||||
Parkway Properties, Inc., REIT | 1,113,250 | 17,433,495 | ||||||
Post Properties, Inc., REIT | 141,104 | 8,429,553 | ||||||
Primerica, Inc. | 433,500 | 19,303,755 | ||||||
Tanger Factory Outlet Centers, Inc., REIT | 370,100 | 13,467,939 | ||||||
Trust Co Bank Corp. NY | 251,250 | 1,522,575 | ||||||
| Shares | Value($) | |||||||
Financials—continued | ||||||||
UMB Financial Corp. | 335,450 | 17,319,284 | ||||||
|
| |||||||
| 237,475,263 | ||||||||
|
| |||||||
Health Care 4.2% | ||||||||
Ensign Group, Inc. | 171,440 | 3,881,401 | ||||||
Hill-Rom Holdings, Inc. | 546,530 | 27,490,459 | ||||||
Landauer, Inc. | 273,640 | 9,049,275 | ||||||
|
| |||||||
| 40,421,135 | ||||||||
|
| |||||||
Industrials 29.9% | ||||||||
AAR Corp. | 340,170 | 7,915,756 | ||||||
ABM Industries, Inc. | 478,627 | 15,464,438 | ||||||
Advanced Drainage Systems, Inc. | 204,600 | 4,357,980 | ||||||
Badger Meter, Inc. | 229,391 | 15,256,796 | ||||||
BWX Technologies, Inc. | 183,300 | 6,151,548 | ||||||
China Yuchai International Ltd. | 73,190 | 720,922 | ||||||
CLARCOR, Inc. | 384,750 | 22,234,703 | ||||||
Covanta Holding Corp. | 1,195,400 | 20,154,444 | ||||||
Cubic Corp. | 272,300 | 10,881,108 | ||||||
EMCOR Group, Inc. | 339,840 | 16,516,224 | ||||||
Fortress Transportation & Infrastructure Investors LLC | 116,500 | 1,159,175 | ||||||
Forward Air Corp. | 407,700 | 18,476,964 | ||||||
Granite Construction, Inc. | 53,340 | 2,549,652 | ||||||
Herman Miller, Inc. | 746,880 | 23,071,123 | ||||||
Interface, Inc. | 20,261 | 375,639 | ||||||
Kelly Services, Inc., Cl A | 946,910 | 18,104,919 | ||||||
Kforce, Inc. | 234,400 | 4,589,552 | ||||||
Knoll, Inc. | 590,400 | 12,782,160 | ||||||
Luxfer Holdings PLC ADR | 212,510 | 2,254,731 | ||||||
MSA Safety, Inc. | 176,702 | 8,543,542 | ||||||
Mueller Water Products, Inc., Cl A | 2,031,630 | 20,072,504 | ||||||
Multi-Color Corp. | 91,200 | 4,865,520 | ||||||
NN, Inc. | 124,100 | 1,697,688 | ||||||
Progressive Waste Solutions Ltd. | 1,081,364 | 33,554,725 | ||||||
Sun Hydraulics Corp. | 31,120 | 1,032,873 | ||||||
Tennant Co. | 40,680 | 2,094,206 | ||||||
Tetra Tech, Inc. | 300,600 | 8,963,892 | ||||||
Viad Corp. | 212,190 | 6,187,460 | ||||||
|
| |||||||
| 290,030,244 | ||||||||
|
| |||||||
Information Technology 7.9% | ||||||||
Black Box Corp. | 54,500 | 734,115 | ||||||
Daktronics, Inc. | 690,450 | 5,454,555 | ||||||
Fair Isaac Corp. | 473,850 | 50,270,747 | ||||||
Plantronics, Inc. | 529,660 | 20,757,375 | ||||||
|
| |||||||
| 77,216,792 | ||||||||
|
| |||||||
Materials 2.9% | ||||||||
A. Schulman, Inc. | 10,600 | 288,532 | ||||||
Carpenter Technology Corp. | 236,500 | 8,095,395 | ||||||
See Notes to Financial Statements.
37
Table of Contents
SCHEDULES OF PORTFOLIO INVESTMENTS
RIDGEWORTH FUNDS March 31, 2016
Small Cap Value Equity Fund — concluded
| Shares | Value($) | |||||||
Materials—continued | ||||||||
Haynes International, Inc. | 116,530 | 4,253,345 | ||||||
Hecla Mining Co. | 5,455,440 | 15,166,123 | ||||||
|
| |||||||
| 27,803,395 | ||||||||
|
| |||||||
Utilities 3.3% | ||||||||
ALLETE, Inc. | 202,240 | 11,339,597 | ||||||
California Water Service Group | 383,990 | 10,260,213 | ||||||
NorthWestern Corp. | 169,800 | 10,485,150 | ||||||
|
| |||||||
| 32,084,960 | ||||||||
|
| |||||||
Total Common Stocks | 958,510,344 | |||||||
|
| |||||||
Total Investments | 958,510,344 | |||||||
Other Assets in Excess of Liabilities — 1.1% | 10,389,808 | |||||||
|
| |||||||
Net Assets — 100.0% | $ | 968,900,152 | ||||||
|
| |||||||
Investment Abbreviations
| ADR | — | American Depositary Receipt | ||
| REIT | — | Real Estate Investment Trust |
See Notes to Financial Statements.
38
Table of Contents
SCHEDULES OF PORTFOLIO INVESTMENTS
RIDGEWORTH FUNDS March 31, 2016
Aggressive Growth Allocation Strategy
| Shares | Value($) | |||||||
Equity Funds 67.7% | ||||||||
RidgeWorth International Equity Fund(a) | 36,978 | 344,261 | ||||||
RidgeWorth Large Cap Growth Stock Fund(a) | 228,443 | 2,145,082 | ||||||
RidgeWorth Large Cap Value Equity Fund(a) | 98,912 | 1,460,925 | ||||||
RidgeWorth Mid-Cap Value Equity Fund(a) | 46,042 | 569,076 | ||||||
RidgeWorth Small Cap Growth Stock Fund(a) | 15,500 | 132,837 | ||||||
RidgeWorth Small Cap Value Equity Fund(b) | 12,445 | 140,623 | ||||||
|
| |||||||
Total Equity Funds | 4,792,804 | |||||||
|
| |||||||
Fixed Income Funds 7.2% | ||||||||
RidgeWorth Seix Core Bond Fund(a) | 28 | 307 | ||||||
RidgeWorth Seix Corporate Bond Fund(b) | 3,115 | 26,354 | ||||||
RidgeWorth Seix Floating Rate High Income Fund(a) | 1,023 | 8,522 | ||||||
RidgeWorth Seix High Income Fund(a) | 1,484 | 8,784 | ||||||
RidgeWorth Seix High Yield Fund(b) | 1,114 | 8,689 | ||||||
RidgeWorth Seix Total Return Bond Fund(a) | 37,107 | 395,935 | ||||||
RidgeWorth Seix U.S. Government Securities Ultra-Short Bond Fund(b) | 6,466 | 64,857 | ||||||
|
| |||||||
Total Fixed Income Funds | 513,448 | |||||||
|
| |||||||
Exchange Traded Funds 22.4% | ||||||||
Consumer Discretionary Select Sector SPDR Fund | 525 | 41,501 | ||||||
Consumer Staples Select Sector SPDR Fund | 251 | 13,316 | ||||||
Energy Select Sector SPDR Fund | 188 | 11,641 | ||||||
Financial Select Sector SPDR Fund | 2,161 | 48,644 | ||||||
Health Care Select Sector SPDR Fund | 680 | 46,090 | ||||||
Industrial Select Sector SPDR Fund | 520 | 28,844 | ||||||
iShares Barclays 20+ Year Treasury Bond Fund | 98 | 12,800 | ||||||
iShares Barclays U.S. Treasury Inflation Protected Securities Fund | 92 | 10,547 | ||||||
| Shares | Value($) | |||||||
Exchange Traded Funds—continued |
| |||||||
iShares Core S&P 500 Fund | 230 | 47,530 | ||||||
iShares Core U.S. Aggregate Bond Fund | 5,395 | 597,982 | ||||||
iShares Currency Hedged MSCI EAFE Fund | 20,937 | 499,766 | ||||||
iShares Currency Hedged MSCI Emerging Markets Fund | 82 | 1,696 | ||||||
iShares Dow Jones U.S. Real Estate Index Fund | 80 | 6,229 | ||||||
iShares MSCI EAFE Fund | 32 | 1,828 | ||||||
iShares MSCI Emerging Markets Index Fund | 61 | 2,089 | ||||||
iShares Russell 2000 Index Fund | 151 | 16,704 | ||||||
Market Vectors Gold Miners Fund | 6,991 | 139,680 | ||||||
Materials Select Sector SPDR Fund | 77 | 3,450 | ||||||
Technology Select Sector SPDR Fund | 1,283 | 56,914 | ||||||
Utilities Select Sector SPDR Fund | 8 | 397 | ||||||
|
| |||||||
Total Exchange Traded Funds | 1,587,648 | |||||||
|
| |||||||
Money Market Fund 3.8% | ||||||||
State Street Institutional Treasury Money Market Fund, Institutional Class, 0.19%(c) | 271,087 | 271,087 | ||||||
|
| |||||||
Total Money Market Fund | 271,087 | |||||||
|
| |||||||
Total Investments | 7,164,987 | |||||||
Liabilities in Excess of Other | (81,334 | ) | ||||||
|
| |||||||
Net Assets — 100.0% | $ | 7,083,653 | ||||||
|
| |||||||
| (a) | Affiliated investments. Investments are in each Fund’s IS Shares. |
| (b) | Affiliated investments. Investments are in each Fund’s I Shares. |
| (c) | Rate disclosed, the 7 day yield, is as of March 31, 2016. |
Investment Abbreviations
| EAFE | — | Europe, Australasia and Far East | ||
| MSCI | — | Morgan Stanley Capital International | ||
| SPDR | — | Standard & Poor’s Depositary Receipt |
See Notes to Financial Statements.
39
Table of Contents
SCHEDULES OF PORTFOLIO INVESTMENTS
RIDGEWORTH FUNDS March 31, 2016
Conservative Allocation Strategy
| Shares | Value($) | |||||||
Equity Funds 26.9% | ||||||||
RidgeWorth International Equity | 133,433 | 1,242,262 | ||||||
RidgeWorth Large Cap Growth Stock | 831,070 | 7,803,743 | ||||||
RidgeWorth Large Cap Value Equity | 361,137 | 5,333,996 | ||||||
RidgeWorth Mid-Cap Value Equity | 166,150 | 2,053,609 | ||||||
RidgeWorth Small Cap Growth Stock | 55,867 | 478,779 | ||||||
RidgeWorth Small Cap Value Equity | 44,961 | 508,059 | ||||||
|
| |||||||
Total Equity Funds | 17,420,448 | |||||||
|
| |||||||
Fixed Income Funds 35.7% | ||||||||
RidgeWorth Seix Core Bond Fund(a) | 787 | 8,551 | ||||||
RidgeWorth Seix Corporate Bond Fund(b) | 126,239 | 1,067,983 | ||||||
RidgeWorth Seix Floating Rate High Income | 42,104 | 350,728 | ||||||
RidgeWorth Seix High Income Fund(a) | 61,354 | 363,213 | ||||||
RidgeWorth Seix High Yield Fund(b) | 46,057 | 359,242 | ||||||
RidgeWorth Seix Total Return Bond Fund(a) | 1,711,650 | 18,263,309 | ||||||
RidgeWorth Seix U.S. Government Securities Ultra-Short Bond Fund(b) | 264,754 | 2,655,483 | ||||||
|
| |||||||
Total Fixed Income Funds | 23,068,509 | |||||||
|
| |||||||
Exchange Traded Funds 35.0% | ||||||||
Consumer Discretionary Select Sector SPDR Fund | 1,672 | 132,172 | ||||||
Consumer Staples Select Sector SPDR Fund | 789 | 41,856 | ||||||
Energy Select Sector SPDR Fund | 611 | 37,833 | ||||||
Financial Select Sector SPDR Fund | 6,877 | 154,801 | ||||||
Health Care Select Sector SPDR Fund | 2,172 | 147,218 | ||||||
Industrial Select Sector SPDR Fund | 1,657 | 91,914 | ||||||
iShares Barclays 20+ Year Treasury Bond Fund | 4,032 | 526,619 | ||||||
iShares Barclays U.S. Treasury Inflation Protected Securities Fund | 3,793 | 434,830 | ||||||
| Shares | Value($) | |||||||
Exchange Traded Funds—continued |
| |||||||
iShares Core S&P 500 Fund | 799 | 165,113 | ||||||
iShares Core U.S. Aggregate Bond Fund | 164,749 | 18,260,779 | ||||||
iShares Currency Hedged MSCI EAFE Fund | 75,680 | 1,806,482 | ||||||
iShares Currency Hedged MSCI Emerging Markets Fund | 277 | 5,728 | ||||||
iShares Dow Jones U.S. Real Estate Index Fund | 303 | 23,592 | ||||||
iShares MSCI EAFE Fund | 122 | 6,970 | ||||||
iShares MSCI Emerging Markets Index Fund | 195 | 6,679 | ||||||
iShares Russell 2000 Index Fund | 565 | 62,500 | ||||||
Market Vectors Gold Miners Fund | 25,268 | 504,855 | ||||||
Materials Select Sector SPDR Fund | 254 | 11,382 | ||||||
Technology Select Sector SPDR Fund | 4,080 | 180,989 | ||||||
Utilities Select Sector SPDR Fund | 10 | 496 | ||||||
|
| |||||||
Total Exchange Traded Funds | 22,602,808 | |||||||
|
| |||||||
Money Market Fund 2.6% | ||||||||
State Street Institutional Treasury Money Market Fund, Institutional Class, | 1,686,970 | 1,686,970 | ||||||
|
| |||||||
Total Money Market Fund | 1,686,970 | |||||||
|
| |||||||
Total Investments | 64,778,735 | |||||||
Liabilities in Excess of Other | (113,081 | ) | ||||||
|
| |||||||
Net Assets — 100.0% | $ | 64,665,654 | ||||||
|
| |||||||
| (a) | Affiliated investments. Investments are in each Fund’s IS Shares. |
| (b) | Affiliated investments. Investments are in each Fund’s I Shares. |
| (c) | Rate disclosed, the 7 day yield, is as of March 31, 2016. |
Investment Abbreviations
| EAFE | — | Europe, Australasia and Far East | ||
| MSCI | — | Morgan Stanley Capital International | ||
| SPDR | — | Standard & Poor’s Depositary Receipt |
See Notes to Financial Statements.
40
Table of Contents
SCHEDULES OF PORTFOLIO INVESTMENTS
RIDGEWORTH FUNDS March 31, 2016
Growth Allocation Strategy
| Shares | Value($) | |||||||
Equity Funds 61.0% | ||||||||
RidgeWorth International Equity Fund(a) | 225,468 | 2,099,109 | ||||||
RidgeWorth Large Cap Growth Stock | 1,397,584 | 13,123,312 | ||||||
RidgeWorth Large Cap Value Equity | 606,458 | 8,957,381 | ||||||
RidgeWorth Mid-Cap Value Equity | 280,471 | 3,466,626 | ||||||
RidgeWorth Small Cap Growth Stock | 93,941 | 805,071 | ||||||
RidgeWorth Small Cap Value Equity | 75,768 | 856,181 | ||||||
|
| |||||||
Total Equity Funds | 29,307,680 | |||||||
|
| |||||||
Fixed Income Funds 12.9% | ||||||||
RidgeWorth Seix Core Bond Fund(a) | 259 | 2,809 | ||||||
RidgeWorth Seix Corporate Bond Fund(b) | 33,890 | 286,705 | ||||||
RidgeWorth Seix Floating Rate High Income | 11,197 | 93,273 | ||||||
RidgeWorth Seix High Income Fund(a) | 16,517 | 97,783 | ||||||
RidgeWorth Seix High Yield Fund(b) | 12,268 | 95,690 | ||||||
RidgeWorth Seix Total Return Bond Fund(a) | 459,115 | 4,898,755 | ||||||
RidgeWorth Seix U.S. Government Securities Ultra-Short Bond Fund(b) | 70,891 | 711,041 | ||||||
|
| |||||||
Total Fixed Income Funds | 6,186,056 | |||||||
|
| |||||||
Exchange Traded Funds 22.7% | ||||||||
Consumer Discretionary Select Sector SPDR Fund | 3,023 | 238,968 | ||||||
Consumer Staples Select Sector SPDR Fund | 1,460 | 77,453 | ||||||
Energy Select Sector SPDR Fund | 1,068 | 66,131 | ||||||
Financial Select Sector SPDR Fund | 12,419 | 279,552 | ||||||
Health Care Select Sector SPDR Fund | 3,885 | 263,325 | ||||||
Industrial Select Sector SPDR Fund | 3,030 | 168,074 | ||||||
iShares Barclays 20+ Year Treasury Bond Fund | 1,083 | 141,451 | ||||||
iShares Barclays U.S. Treasury Inflation Protected Securities Fund | 1,013 | 116,130 | ||||||
| Shares | Value($) | |||||||
Exchange Traded Funds—continued |
| |||||||
iShares Core S&P 500 Fund | 1,327 | 274,225 | ||||||
iShares Core U.S. Aggregate Bond Fund | 44,022 | 4,879,399 | ||||||
iShares Currency Hedged MSCI EAFE Fund | 127,520 | 3,043,902 | ||||||
iShares Currency Hedged MSCI Emerging Markets Fund | 533 | 11,022 | ||||||
iShares Dow Jones U.S. Real Estate Index Fund | 526 | 40,954 | ||||||
iShares MSCI EAFE Fund | 213 | 12,169 | ||||||
iShares MSCI Emerging Markets Index Fund | 328 | 11,234 | ||||||
iShares Russell 2000 Index Fund | 968 | 107,080 | ||||||
Market Vectors Gold Miners Fund | 42,755 | 854,245 | ||||||
Materials Select Sector SPDR Fund | 510 | 22,853 | ||||||
Technology Select Sector SPDR Fund | 7,389 | 327,776 | ||||||
Utilities Select Sector SPDR Fund | 23 | 1,141 | ||||||
|
| |||||||
Total Exchange Traded Funds | 10,937,084 | |||||||
|
| |||||||
Money Market Fund 3.4% | ||||||||
State Street Institutional Treasury Money Market Fund, Institutional Class, | 1,646,538 | 1,646,538 | ||||||
|
| |||||||
Total Money Market Fund | 1,646,538 | |||||||
|
| |||||||
Total Investments | 48,077,358 | |||||||
Liabilities in Excess of Other | (15,539 | ) | ||||||
|
| |||||||
Net Assets — 100.0% | $ | 48,061,819 | ||||||
|
| |||||||
| (a) | Affiliated investments. Investments are in each Fund’s IS Shares. |
| (b) | Affiliated investments. Investments are in each Fund’s I Shares. |
| (c) | Rate disclosed, the 7 day yield, is as of March 31, 2016. |
| (d) | Less than 0.05% of Net Assets. |
Investment Abbreviations
| EAFE | — | Europe, Australasia and Far East | ||
| MSCI | — | Morgan Stanley Capital International | ||
| SPDR | — | Standard & Poor’s Depositary Receipt |
See Notes to Financial Statements.
41
Table of Contents
SCHEDULES OF PORTFOLIO INVESTMENTS
RIDGEWORTH FUNDS March 31, 2016
Moderate Allocation Strategy
| Shares | Value($) | |||||||
Equity Funds 43.2% | ||||||||
RidgeWorth International Equity | 229,673 | 2,138,257 | ||||||
RidgeWorth Large Cap Growth Stock | 1,427,377 | 13,403,070 | ||||||
RidgeWorth Large Cap Value Equity | 619,860 | 9,155,333 | ||||||
RidgeWorth Mid-Cap Value Equity | 285,572 | 3,529,675 | ||||||
RidgeWorth Small Cap Growth Stock | 96,134 | 823,866 | ||||||
RidgeWorth Small Cap Value Equity | 77,312 | 873,622 | ||||||
|
| |||||||
Total Equity Funds | 29,923,823 | |||||||
|
| |||||||
Fixed Income Funds 24.1% | ||||||||
RidgeWorth Seix Core Bond Fund(a) | 704 | 7,647 | ||||||
RidgeWorth Seix Corporate Bond Fund(b) | 91,110 | 770,788 | ||||||
RidgeWorth Seix Floating Rate High Income Fund(a) | 30,547 | 254,453 | ||||||
RidgeWorth Seix High Income Fund(a) | 44,701 | 264,632 | ||||||
RidgeWorth Seix High Yield Fund(b) | 33,272 | 259,521 | ||||||
RidgeWorth Seix Total Return Bond | 1,234,708 | 13,174,330 | ||||||
RidgeWorth Seix U.S. Government Securities Ultra-Short Bond Fund(b) | 191,200 | 1,917,741 | ||||||
|
| |||||||
Total Fixed Income Funds | 16,649,112 | |||||||
|
| |||||||
Exchange Traded Funds 28.5% | ||||||||
Consumer Discretionary Select Sector SPDR Fund | 2,953 | 233,435 | ||||||
Consumer Staples Select Sector SPDR Fund | 1,465 | 77,718 | ||||||
Energy Select Sector SPDR Fund | 1,055 | 65,326 | ||||||
Financial Select Sector SPDR Fund | 12,254 | 275,838 | ||||||
Health Care Select Sector SPDR Fund | 3,849 | 260,885 | ||||||
Industrial Select Sector SPDR Fund | 2,909 | 161,362 | ||||||
iShares Barclays 20+ Year Treasury Bond Fund | 2,915 | 380,728 | ||||||
iShares Barclays U.S. Treasury Inflation Protected Securities Fund | 2,735 | 313,540 | ||||||
| Shares | Value($) | |||||||
Exchange Traded Funds—continued |
| |||||||
iShares Core S&P 500 Fund | 1,293 | 267,198 | ||||||
iShares Core U.S. Aggregate Bond Fund | 119,361 | 13,229,973 | ||||||
iShares Currency Hedged MSCI EAFE Fund | 129,946 | 3,101,811 | ||||||
iShares Currency Hedged MSCI Emerging Markets Fund | 508 | 10,505 | ||||||
iShares Dow Jones U.S. Real Estate Index Fund | 515 | 40,098 | ||||||
iShares MSCI EAFE Fund | 205 | 11,712 | ||||||
iShares MSCI Emerging Markets Index Fund | 390 | 13,357 | ||||||
iShares Russell 2000 Index Fund | 958 | 105,974 | ||||||
Market Vectors Gold Miners Fund | 43,415 | 867,432 | ||||||
Materials Select Sector SPDR Fund | 497 | 22,271 | ||||||
Technology Select Sector SPDR Fund | 7,255 | 321,832 | ||||||
Utilities Select Sector SPDR Fund | 17 | 844 | ||||||
|
| |||||||
Total Exchange Traded Funds | 19,761,839 | |||||||
|
| |||||||
Money Market Fund 4.3% | ||||||||
State Street Institutional Treasury Money Market Fund, Institutional Class, | 2,950,327 | 2,950,327 | ||||||
|
| |||||||
Total Money Market Fund | 2,950,327 | |||||||
|
| |||||||
Total Investments | 69,285,101 | |||||||
Liabilities in Excess of Other | (54,147 | ) | ||||||
|
| |||||||
Net Assets — 100.0% | $ | 69,230,954 | ||||||
|
| |||||||
| (a) | Affiliated investments. Investments are in each Fund’s IS Shares. |
| (b) | Affiliated investments. Investments are in each Fund’s I Shares. |
| (c) | Rate disclosed, the 7 day yield, is as of March 31, 2016. |
Investment Abbreviations
| EAFE | — | Europe, Australasia and Far East | ||
| MSCI | — | Morgan Stanley Capital International | ||
| SPDR | — | Standard & Poor’s Depositary Receipt |
See Notes to Financial Statements.
42
Table of Contents
STATEMENTS OF ASSETS AND LIABILITIES
RIDGEWORTH FUNDS March 31, 2016
| Aggressive Growth Stock Fund | Capital Innovations Global Resources and Infrastructure Fund | International Equity Fund | Large Cap Growth Stock Fund | |||||||||||||
Assets: | ||||||||||||||||
Total Investments, at Cost | $16,602,924 | $3,570,177 | $40,087,598 | $137,611,128 | ||||||||||||
|
|
|
|
|
|
|
| |||||||||
Total Investments, at Value* | $26,228,878 | $3,386,294 | $41,454,557 | $252,651,016 | ||||||||||||
Cash | — | 976 | — | — | ||||||||||||
Interest and Dividends Receivable | 2,274 | 13,653 | 28,560 | 38,904 | ||||||||||||
Securities Lending Income Receivable | — | — | 1,499 | 1,301 | ||||||||||||
Receivable for Capital Shares Issued | 61,303 | 60 | 79,296 | 139,022 | ||||||||||||
Receivable for Investment Securities Sold | 272,240 | — | — | 5,389,386 | ||||||||||||
Reclaims Receivable | — | 2,789 | 164,540 | — | ||||||||||||
Receivable from Investment Adviser | 2,481 | 73,143 | 27,561 | 26,360 | ||||||||||||
Prepaid Expenses and Other Assets | 10,108 | 11,865 | 21,776 | 25,623 | ||||||||||||
|
|
|
|
|
|
|
| |||||||||
Total Assets | 26,577,284 | 3,488,780 | 41,777,789 | 258,271,612 | ||||||||||||
|
|
|
|
|
|
|
| |||||||||
Liabilities: | ||||||||||||||||
Payable for Investment Securities Purchased | 100,872 | — | — | 5,126,127 | ||||||||||||
Payable for Capital Shares Redeemed | 14,064 | 96 | 26,291 | 183,876 | ||||||||||||
Payable Upon Return of Securities Loaned | — | — | 3,345,648 | 2,753,300 | ||||||||||||
Line of Credit Payable | 89,949 | — | — | — | ||||||||||||
Investment Advisory Fees Payable | 18,220 | 2,780 | 25,712 | 144,662 | ||||||||||||
Compliance and Fund Services Fees Payable | 559 | 33 | 777 | 5,368 | ||||||||||||
Distribution and Service Fees Payable | 2,084 | 700 | 931 | 48,624 | ||||||||||||
Trustee Fees Payable | 1 | 1 | 1 | 10 | ||||||||||||
Filing Fee Payable | — | 45,536 | — | — | ||||||||||||
Other Accrued Expenses | 21,345 | 31,006 | 34,834 | 160,140 | ||||||||||||
|
|
|
|
|
|
|
| |||||||||
Total Liabilities | 247,094 | 80,152 | 3,434,194 | 8,422,107 | ||||||||||||
|
|
|
|
|
|
|
| |||||||||
Total Net Assets | $26,330,190 | $3,408,628 | $38,343,595 | $249,849,505 | ||||||||||||
|
|
|
|
|
|
|
| |||||||||
Net Assets Consist of: | ||||||||||||||||
Capital | $16,867,720 | $4,421,525 | $38,243,075 | $133,584,729 | ||||||||||||
Accumulated Net Investment Income (Loss) | (79,099 | ) | 18,707 | 225,036 | (192,950 | ) | ||||||||||
Accumulated Net Realized Gain (Loss) from Investments and Foreign Currency Transactions | (84,385 | ) | (847,725 | ) | (1,498,181 | ) | 1,417,838 | |||||||||
Net Unrealized Appreciation (Depreciation) on Investments and Foreign Currencies | 9,625,954 | (183,879 | ) | 1,373,665 | 115,039,888 | |||||||||||
|
|
|
|
|
|
|
| |||||||||
Net Assets | $26,330,190 | $3,408,628 | $38,343,595 | $249,849,505 | ||||||||||||
|
|
|
|
|
|
|
| |||||||||
Net Assets: | ||||||||||||||||
I Shares | $18,203,368 | $1,954,768 | $28,756,151 | $110,561,826 | ||||||||||||
A Shares | 8,126,822 | 1,249,560 | 3,755,587 | 62,114,564 | ||||||||||||
C Shares | — | 204,300 | — | 40,086,031 | ||||||||||||
IS Shares | — | — | 5,831,857 | 37,087,084 | ||||||||||||
Shares Outstanding (unlimited number of shares authorized, no par value) | ||||||||||||||||
I Shares | 952,672 | 216,199 | 3,091,970 | 11,792,766 | ||||||||||||
A Shares | 442,350 | 138,390 | 409,092 | 7,951,140 | ||||||||||||
C Shares | — | 22,953 | — | 7,358,367 | ||||||||||||
IS Shares | — | — | 626,667 | 3,947,575 | ||||||||||||
Net Asset Value and Redemption Price Per Share: | ||||||||||||||||
I Shares | $19.11 | $9.04 | $9.30 | $9.38 | ||||||||||||
A Shares | 18.37 | 9.03 | 9.18 | 7.81 | ||||||||||||
C Shares(a) | — | 8.90 | — | 5.45 | ||||||||||||
IS Shares | — | — | 9.31 | 9.39 | ||||||||||||
Offering Price per Share (100%/(100%-maximum sales charge x net asset value) adjusted to the nearest cent): | ||||||||||||||||
A Shares | $19.49 | $9.58 | $9.74 | $8.29 | ||||||||||||
Maximum Sales Charge — A Shares | 5.75 | % | 5.75 | % | 5.75 | % | 5.75 | % | ||||||||
| * | Investments include securities on loan of $—, $—, $3,320,910 and $7,711,018, respectively. |
| (a) | Redemption price per share varies based on length of time shares are held. |
See Notes to Financial Statements.
43
Table of Contents
STATEMENTS OF ASSETS AND LIABILITIES
RIDGEWORTH FUNDS March 31, 2016
| Large Cap Value Equity Fund | Mid-Cap Value Equity Fund | Small Cap Growth Stock Fund | Small Cap Value Equity Fund | |||||||||||||
Assets: | ||||||||||||||||
Total Investments, at Cost | $1,780,885,924 | $3,301,280,381 | $54,603,690 | $798,359,044 | ||||||||||||
|
|
|
|
|
|
|
| |||||||||
Total Investments, at Value* | $2,103,902,282 | $3,521,527,902 | $59,684,757 | $958,510,344 | ||||||||||||
Cash | — | — | — | 1,253 | ||||||||||||
Interest and Dividends Receivable | 2,922,315 | 5,773,669 | 5,701 | 2,018,822 | ||||||||||||
Securities Lending Income Receivable | — | 34,240 | 8,920 | — | ||||||||||||
Receivable for Capital Shares Issued | 848,682 | 2,030,203 | 26,259 | 711,771 | ||||||||||||
Receivable for Investment Securities Sold | 3,794,428 | 71,263,838 | — | 15,056,331 | ||||||||||||
Reclaims Receivable | — | — | — | 38,346 | ||||||||||||
Receivable from Investment Adviser | 197,635 | 26,605 | 2,515 | — | ||||||||||||
Prepaid Expenses and Other Assets | 47,647 | 85,220 | 22,229 | 34,469 | ||||||||||||
|
|
|
|
|
|
|
| |||||||||
Total Assets | 2,111,712,989 | 3,600,741,677 | 59,750,381 | 976,371,336 | ||||||||||||
|
|
|
|
|
|
|
| |||||||||
Liabilities: | ||||||||||||||||
Payable for Investment Securities Purchased | 10,104,813 | 55,498,089 | — | 3,843,825 | ||||||||||||
Payable for Capital Shares Redeemed | 3,273,272 | 10,146,380 | 141,726 | 1,830,737 | ||||||||||||
Payable Upon Return of Securities Loaned | — | 157,843,909 | 8,244,601 | — | ||||||||||||
Line of Credit Payable | — | — | — | 253,160 | ||||||||||||
Investment Advisory Fees Payable | 1,144,486 | 1,947,914 | 35,816 | 666,450 | ||||||||||||
Compliance and Fund Services Fees Payable | 45,453 | 73,283 | 1,098 | 20,740 | ||||||||||||
Distribution and Service Fees Payable | 106,469 | 155,723 | 5,527 | 53,318 | ||||||||||||
Trustee Fees Payable | 84 | 136 | 2 | 38 | ||||||||||||
Other Accrued Expenses | 1,732,434 | 2,916,694 | 55,523 | 802,916 | ||||||||||||
|
|
|
|
|
|
|
| |||||||||
Total Liabilities | 16,407,011 | 228,582,128 | 8,484,293 | 7,471,184 | ||||||||||||
|
|
|
|
|
|
|
| |||||||||
Total Net Assets | $2,095,305,978 | $3,372,159,549 | $51,266,088 | $968,900,152 | ||||||||||||
|
|
|
|
|
|
|
| |||||||||
Net Assets Consist of: | ||||||||||||||||
Capital | $1,822,757,550 | $3,204,947,716 | $43,963,455 | $836,798,787 | ||||||||||||
Accumulated Net Investment Income (Loss) | 5,948,067 | 10,555,383 | (82,836 | ) | 1,382,858 | |||||||||||
Accumulated Net Realized Gain (Loss) from Investments Transactions | (56,415,997 | ) | (63,591,071 | ) | 2,304,402 | (29,434,357 | ) | |||||||||
Net Unrealized Appreciation on Investments | 323,016,358 | 220,247,521 | 5,081,067 | 160,152,864 | ||||||||||||
|
|
|
|
|
|
|
| |||||||||
Net Assets | $2,095,305,978 | $3,372,159,549 | $51,266,088 | $968,900,152 | ||||||||||||
|
|
|
|
|
|
|
| |||||||||
Net Assets: | ||||||||||||||||
I Shares | $1,440,586,702 | $2,717,760,957 | $36,436,225 | $820,123,791 | ||||||||||||
A Shares | 362,805,449 | 397,599,185 | 6,855,673 | 121,366,611 | ||||||||||||
C Shares | 19,052,655 | 64,159,800 | 4,685,688 | 27,409,750 | ||||||||||||
IS Shares | 272,861,172 | 192,639,607 | 3,288,502 | — | ||||||||||||
Shares Outstanding (unlimited number of shares authorized, no par value) | ||||||||||||||||
I Shares | 97,902,458 | 220,188,355 | 4,277,691 | 72,579,973 | ||||||||||||
A Shares | 24,848,747 | 32,534,988 | 962,057 | 11,068,919 | ||||||||||||
C Shares | 1,334,652 | 5,363,771 | 1,208,637 | 2,730,695 | ||||||||||||
IS Shares | 18,476,040 | 15,591,718 | 383,644 | — | ||||||||||||
Net Asset Value and Redemption Price Per Share: | ||||||||||||||||
I Shares | $14.71 | $12.34 | $8.52 | $11.30 | ||||||||||||
A Shares | 14.60 | 12.22 | 7.13 | 10.96 | ||||||||||||
C Shares(a) | 14.28 | 11.96 | 3.88 | 10.04 | ||||||||||||
IS Shares | 14.77 | 12.36 | 8.57 | — | ||||||||||||
Offering Price per Share (100%/(100%-maximum sales charge x net asset value) adjusted to the nearest cent): | ||||||||||||||||
A Shares | $15.49 | $12.97 | $7.56 | $11.63 | ||||||||||||
Maximum Sales Charge — A Shares | 5.75 | % | 5.75 | % | 5.75 | % | 5.75 | % | ||||||||
| * | Investments include securities on loan of $—, $152,604,064, $7,995,415 and $—, respectively. |
| (a) | Redemption price per share varies based on length of time shares are held. |
See Notes to Financial Statements.
44
Table of Contents
STATEMENTS OF ASSETS AND LIABILITIES
RIDGEWORTH FUNDS March 31, 2016
| Aggressive Growth Allocation Strategy | Conservative Allocation Strategy | Growth Allocation Strategy | Moderate Allocation Strategy | |||||||||||||
Assets: | ||||||||||||||||
Total Investments, at Cost | $6,099,997 | $63,038,748 | $42,618,420 | $61,638,727 | ||||||||||||
|
|
|
|
|
|
|
| |||||||||
Investments in Affiliates, at Value | 5,306,252 | 40,488,957 | 35,493,736 | 46,572,935 | ||||||||||||
Investments in Unaffiliated, at Value | $1,858,735 | $24,289,778 | $12,583,622 | $22,712,166 | ||||||||||||
|
|
|
|
|
|
|
| |||||||||
Total Investments | 7,164,987 | 64,778,735 | 48,077,358 | 69,285,101 | ||||||||||||
|
|
|
|
|
|
|
| |||||||||
Dividends Receivable | 1,058 | 45,701 | 12,204 | 33,318 | ||||||||||||
Receivable for Capital Shares Issued | 3,810 | 70,303 | 34,789 | 54,592 | ||||||||||||
Receivable from Investment Adviser | 7,080 | 5,839 | 7,808 | 7,936 | ||||||||||||
Prepaid Expenses and Other Assets | 19,578 | 18,999 | 20,434 | 20,204 | ||||||||||||
|
|
|
|
|
|
|
| |||||||||
Total Assets | 7,196,513 | 64,919,577 | 48,152,593 | 69,401,151 | ||||||||||||
|
|
|
|
|
|
|
| |||||||||
Liabilities: | ||||||||||||||||
Payable for Investment Securities Purchased | 1,032 | 47,394 | 12,415 | 34,389 | ||||||||||||
Payable for Capital Shares Redeemed | 96,159 | 155,527 | 14,649 | 57,503 | ||||||||||||
Investment Advisory Fees Payable | 602 | 5,458 | 4,049 | 5,781 | ||||||||||||
Compliance and Fund Services Fees Payable | 157 | 1,415 | 1,046 | 1,505 | ||||||||||||
Distribution and Service Fees Payable | 1,567 | 19,856 | 4,091 | 12,473 | ||||||||||||
Trustee Fees Payable | — | 3 | 2 | 3 | ||||||||||||
Other Accrued Expenses | 13,343 | 24,270 | 54,522 | 58,543 | ||||||||||||
|
|
|
|
|
|
|
| |||||||||
Total Liabilities | 112,860 | 253,923 | 90,774 | 170,197 | ||||||||||||
|
|
|
|
|
|
|
| |||||||||
Total Net Assets | $7,083,653 | $64,665,654 | $48,061,819 | $69,230,954 | ||||||||||||
|
|
|
|
|
|
|
| |||||||||
Net Assets Consist of: | ||||||||||||||||
Capital | $5,685,276 | $63,122,496 | $41,045,294 | $59,469,970 | ||||||||||||
Accumulated Net Investment Income (Loss) | — | 125,029 | 14,594 | 62,876 | ||||||||||||
Accumulated Net Realized Gain (Loss) from Investments Transactions | 333,387 | (321,858 | ) | 1,542,993 | 2,051,734 | |||||||||||
Net Unrealized Appreciation on Investments | 1,064,990 | 1,739,987 | 5,458,938 | 7,646,374 | ||||||||||||
|
|
|
|
|
|
|
| |||||||||
Net Assets | $7,083,653 | $64,665,654 | $48,061,819 | $69,230,954 | ||||||||||||
|
|
|
|
|
|
|
| |||||||||
Net Assets: | ||||||||||||||||
I Shares | $2,581,511 | $31,067,315 | $38,193,796 | $45,979,621 | ||||||||||||
A Shares | 3,806,919 | 14,462,088 | 7,255,071 | 11,972,410 | ||||||||||||
C Shares | 695,223 | 19,136,251 | 2,612,952 | 11,278,923 | ||||||||||||
Shares Outstanding (unlimited number of shares authorized, no par value) | ||||||||||||||||
I Shares | 430,308 | 2,586,652 | 3,772,066 | 5,078,840 | ||||||||||||
A Shares | 643,704 | 1,204,663 | 720,184 | 1,328,849 | ||||||||||||
C Shares | 122,661 | 1,613,371 | 265,456 | 1,263,302 | ||||||||||||
Net Asset Value and Redemption Price Per Share: | ||||||||||||||||
I Shares | $6.00 | $12.01 | $10.13 | $9.05 | ||||||||||||
A Shares | 5.91 | 12.01 | 10.07 | 9.01 | ||||||||||||
C Shares(a) | 5.67 | 11.86 | 9.84 | 8.93 | ||||||||||||
Offering Price per Share (100%/(100%-maximum sales charge x net asset value) adjusted to the nearest cent): | ||||||||||||||||
A Shares | $6.27 | $12.61 | $10.68 | $9.56 | ||||||||||||
Maximum Sales Charge — A Shares | 5.75 | % | 4.75 | % | 5.75 | % | 5.75 | % | ||||||||
| (a) | Redemption price per share varies based on length of time shares are held. |
See Notes to Financial Statements.
45
Table of Contents
RIDGEWORTH FUNDS For the Fiscal Year or Period Ended March 31, 2016
| Aggressive Growth Stock Fund | Capital Innovations Global Resources and Infrastructure Fund* | Capital Innovations Global Resources and Infrastructure Fund** | International Equity Fund | |||||||||||||
Investment Income: | ||||||||||||||||
Dividend Income | $36,281 | $46,942 | $322,106 | $654,494 | ||||||||||||
Interest Income | — | — | 7 | — | ||||||||||||
Net Income from Securities Lending | — | — | — | 15,269 | ||||||||||||
Less: Foreign Taxes Withheld | — | (748 | ) | (13,797 | ) | (59,006 | ) | |||||||||
|
|
|
|
|
|
|
| |||||||||
Total Investment Income | 36,281 | 46,194 | 308,316 | 610,757 | ||||||||||||
|
|
|
|
|
|
|
| |||||||||
Expenses: | ||||||||||||||||
Investment Advisory Fees | 281,146 | 12,828 | 131,221 | 228,606 | ||||||||||||
Administration Fees | 3,333 | 9,783 | 49,199 | 2,643 | ||||||||||||
Fund Accounting Fees | 3,172 | 2,331 | 28,014 | 2,637 | ||||||||||||
Transfer Agency Fees | 18,396 | 15,257 | 57,648 | 16,042 | ||||||||||||
Compliance & Fund Services Fees | 2,595 | 3,110 | 16,263 | 2,147 | ||||||||||||
Distribution and Service Fees — A Shares | 36,331 | 1,012 | 6,667 | 11,734 | ||||||||||||
Distribution and Service Fees — C Shares | — | 753 | 5,409 | — | ||||||||||||
Shareholder Servicing Fees | — | — | 11,367 | — | ||||||||||||
Shareholder Servicing Fees — I Shares | 57,480 | 107 | — | 30,427 | ||||||||||||
Shareholder Servicing Fees — A Shares | 9,268 | 62 | — | 406 | ||||||||||||
Custodian Fees | 8,994 | 2,570 | 16,279 | 39,011 | ||||||||||||
Printing Fees | 4,357 | 10,461 | 6,931 | 11,971 | ||||||||||||
Registration Fees | 31,349 | 33,735 | 42,118 | 40,461 | ||||||||||||
Trustee Fees | 1,401 | 3,500 | 5,551 | 1,115 | ||||||||||||
Professional Fees | 1,389 | 28,428 | 39,421 | 17,941 | ||||||||||||
Other Fees | 12,894 | 50,480 | 3,675 | 31,555 | ||||||||||||
|
|
|
|
|
|
|
| |||||||||
Total Expenses | 472,105 | 174,417 | 419,763 | 436,696 | ||||||||||||
Less: Investment Advisory Fees Waived/Expenses Reimbursed | (17,391 | ) | (157,164 | ) | (246,563 | ) | (94,494 | ) | ||||||||
|
|
|
|
|
|
|
| |||||||||
Net Expenses | 454,714 | 17,253 | 173,200 | 342,202 | ||||||||||||
|
|
|
|
|
|
|
| |||||||||
Net Investment Income (Loss) | (418,433 | ) | 28,941 | 135,116 | 268,555 | |||||||||||
|
|
|
|
|
|
|
| |||||||||
Net Realized and Unrealized Gain (Loss) on Investments: | ||||||||||||||||
Net Realized Gain (Loss) from: | ||||||||||||||||
Investment Transactions and Foreign Currency Transactions | 2,936,733 | (405,694 | ) | (197,517 | ) | 2,971,796 | ||||||||||
Net Change in Unrealized Depreciation on: | ||||||||||||||||
Investments | (4,840,884 | ) | (22,799 | ) | (1,484,391 | ) | (3,563,428 | ) | ||||||||
|
|
|
|
|
|
|
| |||||||||
Net Realized and Unrealized Loss on Investments | (1,904,151 | ) | (428,493 | ) | (1,681,908 | ) | (591,632 | ) | ||||||||
|
|
|
|
|
|
|
| |||||||||
Change in Net Assets from Operations | $(2,322,584 | ) | $(399,552 | ) | $(1,546,792 | ) | $(323,077 | ) | ||||||||
|
|
|
|
|
|
|
| |||||||||
| * | Period from December 1, 2015 to March 31, 2016. The Fund had a fiscal year end change from November 30 to March 31. |
| ** | Year ended November 30, 2015. |
See Notes to Financial Statements.
46
Table of Contents
STATEMENTS OF OPERATIONS
RIDGEWORTH FUNDS For the Fiscal Year or Period Ended March 31, 2016
| Large Cap Growth Stock Fund | Large Cap Value Equity Fund | Mid-Cap Value Equity Fund | Small Cap Growth Stock Fund | |||||||||||||
Investment Income: | ||||||||||||||||
Dividend Income | $2,220,888 | $52,337,290 | $88,768,255 | $398,571 | ||||||||||||
Net Income from Securities Lending | 7,022 | — | 100,574 | 134,072 | ||||||||||||
|
|
|
|
|
|
|
| |||||||||
Total Investment Income | 2,227,910 | 52,337,290 | 88,868,829 | 532,643 | ||||||||||||
|
|
|
|
|
|
|
| |||||||||
Expenses: | ||||||||||||||||
Investment Advisory Fees | 1,911,815 | 14,465,035 | 26,903,880 | 796,245 | ||||||||||||
Administration Fees | 27,498 | 222,768 | 393,073 | 9,462 | ||||||||||||
Fund Accounting Fees | 29,259 | 237,380 | 419,981 | 9,631 | ||||||||||||
Transfer Agency Fees | 284,640 | 202,131 | 1,485,155 | 27,936 | ||||||||||||
Compliance & Fund Services Fees | 21,666 | 176,948 | 309,220 | 7,290 | ||||||||||||
Distribution and Service Fees — A Shares | 192,678 | 1,210,266 | 1,450,719 | 24,387 | ||||||||||||
Distribution and Service Fees — C Shares | 440,942 | 199,395 | 772,054 | 55,337 | ||||||||||||
Shareholder Servicing Fees — I Shares | 419,331 | 6,408,922 | 10,805,249 | 290,138 | ||||||||||||
Shareholder Servicing Fees — A Shares | 14,979 | 1,429,282 | 1,790,853 | 4,414 | ||||||||||||
Custodian Fees | 10,106 | 38,613 | 62,765 | 10,336 | ||||||||||||
Printing Fees | 19,965 | 68,742 | 268,809 | 4,982 | ||||||||||||
Registration Fees | 57,168 | 66,434 | 105,417 | 53,478 | ||||||||||||
Trustee Fees | 11,522 | 94,648 | 167,079 | 4,123 | ||||||||||||
Professional Fees | 24,974 | 97,106 | 164,358 | 3,270 | ||||||||||||
Other Fees | 23,779 | 133,218 | 227,505 | 14,547 | ||||||||||||
|
|
|
|
|
|
|
| |||||||||
Total Expenses | 3,490,322 | 25,050,888 | 45,326,117 | 1,315,576 | ||||||||||||
Less: Investment Advisory Fees Waived/Expenses Reimbursed | (331,753 | ) | (2,457,755 | ) | (239,140 | ) | (63,957 | ) | ||||||||
|
|
|
|
|
|
|
| |||||||||
Net Expenses | 3,158,569 | 22,593,133 | 45,086,977 | 1,251,619 | ||||||||||||
|
|
|
|
|
|
|
| |||||||||
Net Investment Income (Loss) | (930,659 | ) | 29,744,157 | 43,781,852 | (718,976 | ) | ||||||||||
|
|
|
|
|
|
|
| |||||||||
Net Realized and Unrealized Gain (Loss) on Investments: | ||||||||||||||||
Net Realized Gain from: | ||||||||||||||||
Investment Transactions | 12,550,924 | 61,008,493 | 58,903,761 | 23,215,285 | ||||||||||||
Net Change in Unrealized Depreciation on: | ||||||||||||||||
Investments | (16,825,838 | ) | (146,176,551 | ) | (309,127,228 | ) | (34,291,359 | ) | ||||||||
|
|
|
|
|
|
|
| |||||||||
Net Realized and Unrealized Loss on Investments | (4,274,914 | ) | (85,168,058 | ) | (250,223,467 | ) | (11,076,074 | ) | ||||||||
|
|
|
|
|
|
|
| |||||||||
Change in Net Assets from Operations | $(5,205,573 | ) | $(55,423,901 | ) | $(206,441,615 | ) | $(11,795,050 | ) | ||||||||
|
|
|
|
|
|
|
| |||||||||
See Notes to Financial Statements.
47
Table of Contents
STATEMENTS OF OPERATIONS
RIDGEWORTH FUNDS For the Fiscal Year or Period Ended March 31, 2016
| Small Cap Value Equity Fund | Aggressive Growth Allocation Strategy | Conservative Allocation Strategy | Growth Allocation Strategy | |||||||||||||
Investment Income: | ||||||||||||||||
Dividend Income | $23,226,805 | $42,133 | $338,366 | $289,414 | ||||||||||||
Dividend Income from Affiliated Investment Companies | — | 66,996 | 947,491 | 526,906 | ||||||||||||
Less: Foreign Taxes Withheld | (115,340 | ) | — | — | — | |||||||||||
|
|
|
|
|
|
|
| |||||||||
Total Investment Income | 23,111,465 | 109,129 | 1,285,857 | 816,320 | ||||||||||||
|
|
|
|
|
|
|
| |||||||||
Expenses: | ||||||||||||||||
Investment Advisory Fees | 8,848,043 | 8,749 | 65,950 | 58,074 | ||||||||||||
Administration Fees | 108,274 | 881 | 6,636 | 5,849 | ||||||||||||
Fund Accounting Fees | 108,691 | 20,041 | 20,041 | 20,041 | ||||||||||||
Transfer Agency Fees | 161,285 | 9,794 | 32,333 | 16,185 | ||||||||||||
Compliance & Fund Services Fees | 85,690 | 673 | 5,275 | 4,571 | ||||||||||||
Distribution and Service Fees — A Shares | 415,433 | 12,223 | 44,927 | 23,641 | ||||||||||||
Distribution and Service Fees — C Shares | 302,685 | 6,799 | 188,510 | 28,988 | ||||||||||||
Shareholder Servicing Fees — I Shares | 2,806,727 | 14,412 | 37,228 | 182,902 | ||||||||||||
Shareholder Servicing Fees — A Shares | 479,239 | 1,921 | 7,060 | 4,280 | ||||||||||||
Custodian Fees | 29,279 | 14,830 | 16,886 | 15,440 | ||||||||||||
Printing Fees | 139,507 | 1,125 | 6,369 | 2,402 | ||||||||||||
Registration Fees | 50,104 | 41,198 | 42,626 | 43,534 | ||||||||||||
Trustee Fees | 46,846 | 370 | 2,820 | 2,511 | ||||||||||||
Professional Fees | 47,007 | 361 | 2,975 | 2,364 | ||||||||||||
Other Fees | 81,121 | 7,529 | 9,966 | 9,713 | ||||||||||||
|
|
|
|
|
|
|
| |||||||||
Total Expenses | 13,709,931 | 140,906 | 489,602 | 420,495 | ||||||||||||
Less: Investment Advisory Fees Waived/Expenses Reimbursed | — | (83,420 | ) | (57,158 | ) | (92,983 | ) | |||||||||
|
|
|
|
|
|
|
| |||||||||
Net Expenses | 13,709,931 | 57,486 | 432,444 | 327,512 | ||||||||||||
|
|
|
|
|
|
|
| |||||||||
Net Investment Income | 9,401,534 | 51,643 | 853,413 | 488,808 | ||||||||||||
|
|
|
|
|
|
|
| |||||||||
Net Realized and Unrealized Gain (Loss) on Investments: | ||||||||||||||||
Net Realized Gain (Loss) from: | ||||||||||||||||
Investment Transactions | 160,397,157 | 246,155 | (1,841,808 | ) | (808,051 | ) | ||||||||||
Capital Gain Received from Investments in Affiliated Investment Companies | — | 573,905 | 1,911,790 | 3,366,199 | ||||||||||||
Net Change in Unrealized Depreciation on: | ||||||||||||||||
Investments | (185,414,369 | ) | (1,306,041 | ) | (2,319,723 | ) | (5,495,254 | ) | ||||||||
|
|
|
|
|
|
|
| |||||||||
Net Realized and Unrealized Loss on Investments | (25,017,212 | ) | (485,981 | ) | (2,249,741 | ) | (2,937,106 | ) | ||||||||
|
|
|
|
|
|
|
| |||||||||
Change in Net Assets from Operations | $(15,615,678 | ) | $(434,338 | ) | $(1,396,328 | ) | $(2,448,298 | ) | ||||||||
|
|
|
|
|
|
|
| |||||||||
See Notes to Financial Statements.
48
Table of Contents
STATEMENTS OF OPERATIONS
RIDGEWORTH FUNDS For the Fiscal Year or Period Ended March 31, 2016
| Moderate Allocation Strategy | ||||
Investment Income: | ||||
Dividend Income | $515,987 | |||
Dividend Income from Affiliated Investment Companies | 1,035,254 | |||
|
| |||
Total Investment Income | 1,551,241 | |||
|
| |||
Expenses: | ||||
Investment Advisory Fees | 95,865 | |||
Administration Fees | 9,666 | |||
Fund Accounting Fees | 20,041 | |||
Transfer Agency Fees | 30,476 | |||
Compliance & Fund Services Fees | 7,570 | |||
Distribution and Service Fees — A Shares | 39,071 | |||
Distribution and Service Fees — C Shares | 124,378 | |||
Shareholder Servicing Fees — I Shares | 221,556 | |||
Shareholder Servicing Fees — A Shares | 14,803 | |||
Custodian Fees | 18,533 | |||
Printing Fees | 4,187 | |||
Registration Fees | 40,960 | |||
Trustee Fees | 4,256 | |||
Professional Fees | 3,684 | |||
Other Fees | 11,845 | |||
|
| |||
Total Expenses | 646,891 | |||
Less: Investment Advisory Fees Waived/Expenses Reimbursed | (48,623 | ) | ||
|
| |||
Net Expenses | 598,268 | |||
|
| |||
Net Investment Income | 952,973 | |||
|
| |||
Net Realized and Unrealized Gain (Loss) on Investments: | ||||
Net Realized Gain from: | ||||
Investment Transactions | 3,096,497 | |||
Capital Gain Received from Investments in Affiliated Investment Companies | 3,284,842 | |||
Net Change in Unrealized Depreciation on: | ||||
Investments | (10,430,565 | ) | ||
|
| |||
Net Realized and Unrealized Loss on Investments | (4,049,226 | ) | ||
|
| |||
Change in Net Assets from Operations | $(3,096,253 | ) | ||
|
| |||
See Notes to Financial Statements.
49
Table of Contents
STATEMENTS OF CHANGES IN NET ASSETS
RIDGEWORTH FUNDS For the Fiscal Years or Period Indicated
| Aggressive Growth Stock Fund | Capital Innovations Global Resources and Infrastructure Fund | |||||||||||||||||||
| 04/01/15- 03/31/16 | 04/01/14- 03/31/15 | 12/01/15- 03/31/16* | 12/01/14- 11/30/15 | 12/01/13- 11/30/14 | ||||||||||||||||
Operations: | ||||||||||||||||||||
Net Investment Income (Loss) | $ | (418,433 | ) | $ | (589,682 | ) | $ | 28,941 | $ | 135,116 | $ | 146,968 | ||||||||
Net Realized Gain (Loss) | 2,936,733 | 3,104,323 | (405,694 | ) | (197,517 | ) | (496,628 | ) | ||||||||||||
Net Change in Unrealized Appreciation (Depreciation) | (4,840,884 | ) | (1,753,720 | ) | (22,799 | ) | (1,484,391 | ) | 844,308 | |||||||||||
|
|
|
|
|
|
|
|
|
| |||||||||||
Change in Net Assets from Operations | (2,322,584 | ) | 760,921 | (399,552 | ) | (1,546,792 | ) | 494,648 | ||||||||||||
|
|
|
|
|
|
|
|
|
| |||||||||||
Dividends and Distributions to Shareholders: | ||||||||||||||||||||
Net Investment Income: | ||||||||||||||||||||
I Shares | — | — | (47,940 | ) | (100,601 | ) | (27,499 | ) | ||||||||||||
A Shares | — | — | (29,983 | ) | (32,013 | ) | (12,244 | ) | ||||||||||||
C Shares | — | — | (4,305 | ) | (3,437 | ) | (506 | ) | ||||||||||||
Tax Return of Capital: | ||||||||||||||||||||
I Shares | — | — | — | — | (32,182 | ) | ||||||||||||||
A Shares | — | — | — | — | (15,062 | ) | ||||||||||||||
C Shares | — | — | — | — | (733 | ) | ||||||||||||||
Net Realized Gains: | ||||||||||||||||||||
I Shares | (1,394,244 | ) | (848,209 | ) | — | — | (24,267 | ) | ||||||||||||
A Shares | (701,510 | ) | (446,147 | ) | — | — | (25,198 | ) | ||||||||||||
C Shares | — | — | — | — | (3,529 | ) | ||||||||||||||
|
|
|
|
|
|
|
|
|
| |||||||||||
Total Dividends and Distributions | (2,095,754 | ) | (1,294,356 | ) | (82,228 | ) | (136,051 | ) | (141,220 | ) | ||||||||||
|
|
|
|
|
|
|
|
|
| |||||||||||
Change in Net Assets from Capital Transactions | (4,108,103 | ) | (24,055,093 | ) | (1,509,530 | ) | (9,219,400 | ) | 4,124,853 | |||||||||||
|
|
|
|
|
|
|
|
|
| |||||||||||
Change in Net Assets | (8,526,441 | ) | (24,588,528 | ) | (1,991,310 | ) | (10,902,243 | ) | 4,478,281 | |||||||||||
|
|
|
|
|
|
|
|
|
| |||||||||||
Net Assets: | ||||||||||||||||||||
Beginning of Period | 34,856,631 | 59,445,159 | 5,399,938 | 16,302,181 | 11,823,900 | |||||||||||||||
|
|
|
|
|
|
|
|
|
| |||||||||||
End of Period | $ | 26,330,190 | $ | 34,856,631 | $ | 3,408,628 | $ | 5,399,938 | $ | 16,302,181 | ||||||||||
|
|
|
|
|
|
|
|
|
| |||||||||||
Accumulated Net Investment Income (Loss), End of Period | $ | (79,099 | ) | $ | (129,949 | ) | $ | 18,707 | $ | (111,545 | ) | $ | (72,441 | ) | ||||||
|
|
|
|
|
|
|
|
|
| |||||||||||
| * | The Fund had a fiscal year end change from November 30 to March 31. |
See Notes to Financial Statements.
50
Table of Contents
STATEMENTS OF CHANGES IN NET ASSETS (continued)
RIDGEWORTH FUNDS For the Fiscal Years or Period Indicated
| International Equity Fund | Large Cap Growth Stock Fund | Large Cap Value Equity Fund | ||||||||||||||||||||||
| 04/01/15- 03/31/16 | 04/01/14- 03/31/15 | 04/01/15- 03/31/16 | 04/01/14- 03/31/15 | 04/01/15- 03/31/16 | 04/01/14- 03/31/15 | |||||||||||||||||||
Operations: | ||||||||||||||||||||||||
Net Investment Income (Loss) | $ | 268,555 | $ | 544,062 | $ | (930,659 | ) | $ | (486,719 | ) | $ | 29,744,157 | $ | 29,935,953 | ||||||||||
Net Realized Gain | 2,971,796 | 2,381,923 | 12,550,924 | 29,833,223 | 61,008,493 | 160,664,758 | ||||||||||||||||||
Net Change in Unrealized Appreciation (Depreciation) | (3,563,428 | ) | (4,309,109 | ) | (16,825,838 | ) | 9,728,182 | (146,176,551 | ) | (30,015,618 | ) | |||||||||||||
|
|
|
|
|
|
|
|
|
|
|
| |||||||||||||
Change in Net Assets from Operations | (323,077 | ) | (1,383,124 | ) | (5,205,573 | ) | 39,074,686 | (55,423,901 | ) | 160,585,093 | ||||||||||||||
|
|
|
|
|
|
|
|
|
|
|
| |||||||||||||
Dividends and Distributions to Shareholders: | ||||||||||||||||||||||||
Net Investment Income: | ||||||||||||||||||||||||
I Shares | (121,394 | ) | (384,870 | ) | — | — | (24,293,067 | ) | (24,539,040 | ) | ||||||||||||||
A Shares | (23,586 | ) | (82,910 | ) | — | — | (4,596,165 | ) | (4,101,116 | ) | ||||||||||||||
C Shares | — | — | — | — | (151,415 | ) | (119,169 | ) | ||||||||||||||||
IS Shares | — | — | — | — | (1,930,728 | ) | (449,243 | ) | ||||||||||||||||
Net Realized Gains: | ||||||||||||||||||||||||
I Shares | (879,695 | ) | (1,839,409 | ) | (9,096,956 | ) | (9,151,015 | ) | (130,478,463 | ) | (149,057,379 | ) | ||||||||||||
A Shares | (354,394 | ) | (429,694 | ) | (5,723,860 | ) | (5,499,119 | ) | (31,413,333 | ) | (32,303,093 | ) | ||||||||||||
C Shares | — | — | (5,426,509 | ) | (3,786,190 | ) | (1,618,805 | ) | (1,679,941 | ) | ||||||||||||||
IS Shares* | (765,921 | ) | — | (3,074,932 | ) | (3,925,659 | ) | (8,723,251 | ) | (3,099,374 | ) | |||||||||||||
|
|
|
|
|
|
|
|
|
|
|
| |||||||||||||
Total Dividends and Distributions | (2,144,990 | ) | (2,736,883 | ) | (23,322,257 | ) | (22,361,983 | ) | (203,205,227 | ) | (215,348,355 | ) | ||||||||||||
|
|
|
|
|
|
|
|
|
|
|
| |||||||||||||
Change in Net Assets from Capital Transactions | 17,666,205 | (4,468,167 | ) | (14,457,456 | ) | (10,709,008 | ) | (93,522,505 | ) | 303,056,171 | ||||||||||||||
|
|
|
|
|
|
|
|
|
|
|
| |||||||||||||
Change in Net Assets | 15,198,138 | (8,588,174 | ) | (42,985,286 | ) | 6,003,695 | (352,151,633 | ) | 248,292,909 | |||||||||||||||
|
|
|
|
|
|
|
|
|
|
|
| |||||||||||||
Net Assets: | ||||||||||||||||||||||||
Beginning of Year | 23,145,457 | 31,733,631 | 292,834,791 | 286,831,096 | 2,447,457,611 | 2,199,164,702 | ||||||||||||||||||
|
|
|
|
|
|
|
|
|
|
|
| |||||||||||||
End of Year | $ | 38,343,595 | $ | 23,145,457 | $ | 249,849,505 | $ | 292,834,791 | $ | 2,095,305,978 | $ | 2,447,457,611 | ||||||||||||
|
|
|
|
|
|
|
|
|
|
|
| |||||||||||||
Accumulated Net Investment Income (Loss), End of Year | $ | 225,036 | $ | 226,301 | $ | (192,950 | ) | $ | (5,858 | ) | $ | 5,948,067 | $ | 7,175,285 | ||||||||||
|
|
|
|
|
|
|
|
|
|
|
| |||||||||||||
| * | IS Shares commenced operations on August 1, 2014 (September 1, 2015 for International Equity Fund). |
See Notes to Financial Statements.
51
Table of Contents
STATEMENTS OF CHANGES IN NET ASSETS (continued)
RIDGEWORTH FUNDS For the Fiscal Years or Period Indicated
| Mid-Cap Value Equity Fund | Small Cap Growth Stock Fund | Small Cap Value Equity Fund | ||||||||||||||||||||||
| 04/01/15- 03/31/16 | 04/01/14- 03/31/15 | 04/01/15- 03/31/16 | 04/01/14- 03/31/15 | 04/01/15- 03/31/16 | 04/01/14- 03/31/15 | |||||||||||||||||||
Operations: | ||||||||||||||||||||||||
Net Investment Income (Loss) | $ | 43,781,852 | $ | 35,676,749 | $ | (718,976 | ) | $ | (1,490,321 | ) | $ | 9,401,534 | $ | 17,100,890 | ||||||||||
Net Realized Gain | 58,903,761 | 271,198,162 | 23,215,285 | 12,370,880 | 160,397,157 | 90,229,132 | ||||||||||||||||||
Net Change in Unrealized Depreciation | (309,127,228 | ) | (8,092,608 | ) | (34,291,359 | ) | (6,929,715 | ) | (185,414,369 | ) | (61,974,776 | ) | ||||||||||||
|
|
|
|
|
|
|
|
|
|
|
| |||||||||||||
Change in Net Assets from Operations | (206,441,615 | ) | 298,782,303 | (11,795,050 | ) | 3,950,844 | (15,615,678 | ) | 45,355,246 | |||||||||||||||
|
|
|
|
|
|
|
|
|
|
|
| |||||||||||||
Dividends and Distributions to Shareholders: | ||||||||||||||||||||||||
Net Investment Income: | ||||||||||||||||||||||||
I Shares | (35,723,021 | ) | (28,937,883 | ) | — | — | (11,307,431 | ) | (11,480,111 | ) | ||||||||||||||
A Shares | (3,557,031 | ) | (3,327,424 | ) | — | — | (1,360,683 | ) | (916,870 | ) | ||||||||||||||
C Shares | (401,359 | ) | (182,658 | ) | — | — | (231,971 | ) | (96,253 | ) | ||||||||||||||
IS Shares | (2,319,371 | ) | (145,326 | ) | — | — | — | — | ||||||||||||||||
Net Realized Gains: | ||||||||||||||||||||||||
I Shares | (161,562,467 | ) | (302,444,965 | ) | (14,333,125 | ) | (19,925,036 | ) | (207,814,500 | ) | (208,085,068 | ) | ||||||||||||
A Shares | (23,673,405 | ) | (53,249,128 | ) | (2,962,694 | ) | (1,656,015 | ) | (33,547,089 | ) | (26,472,803 | ) | ||||||||||||
C Shares | (4,181,619 | ) | (7,435,108 | ) | (2,793,870 | ) | (1,401,026 | ) | (8,088,193 | ) | (5,818,147 | ) | ||||||||||||
IS Shares* | (7,897,241 | ) | (1,428,255 | ) | (1,477,592 | ) | (945,692 | ) | — | — | ||||||||||||||
|
|
|
|
|
|
|
|
|
|
|
| |||||||||||||
Total Dividends and Distributions | (239,315,514 | ) | (397,150,747 | ) | (21,567,281 | ) | (23,927,769 | ) | (262,349,867 | ) | (252,869,252 | ) | ||||||||||||
|
|
|
|
|
|
|
|
|
|
|
| |||||||||||||
Change in Net Assets from Capital Transactions | (435,212,555 | ) | 498,071,026 | (64,115,362 | ) | (19,823,631 | ) | (67,849,231 | ) | (239,450,919 | ) | |||||||||||||
|
|
|
|
|
|
|
|
|
|
|
| |||||||||||||
Change in Net Assets | (880,969,684 | ) | 399,702,582 | (97,477,693 | ) | (39,800,556 | ) | (345,814,776 | ) | (446,964,925 | ) | |||||||||||||
|
|
|
|
|
|
|
|
|
|
|
| |||||||||||||
Net Assets: | ||||||||||||||||||||||||
Beginning of Year | 4,253,129,233 | 3,853,426,651 | 148,743,781 | 188,544,337 | 1,314,714,928 | 1,761,679,853 | ||||||||||||||||||
|
|
|
|
|
|
|
|
|
|
|
| |||||||||||||
End of Year | $ | 3,372,159,549 | $ | 4,253,129,233 | $ | 51,266,088 | $ | 148,743,781 | $ | 968,900,152 | $ | 1,314,714,928 | ||||||||||||
|
|
|
|
|
|
|
|
|
|
|
| |||||||||||||
Accumulated Net Investment Income (Loss), End of Year | $ | 10,555,383 | $ | 9,380,404 | $ | (82,836 | ) | $ | (349,877 | ) | $ | 1,382,858 | $ | 6,099,362 | ||||||||||
|
|
|
|
|
|
|
|
|
|
|
| |||||||||||||
| * | IS Shares commenced operations on August 1, 2014. |
See Notes to Financial Statements.
52
Table of Contents
STATEMENTS OF CHANGES IN NET ASSETS (continued)
RIDGEWORTH FUNDS For the Fiscal Years or Period Indicated
| Aggressive Growth Allocation Strategy | Conservative Allocation Strategy | Growth Allocation Strategy | ||||||||||||||||||||||
| 04/01/15- 03/31/16 | 04/01/14- 03/31/15 | 04/01/15- 03/31/16 | 04/01/14- 03/31/15 | 04/01/15- 03/31/16 | 04/01/14- 03/31/15 | |||||||||||||||||||
Operations: | ||||||||||||||||||||||||
Net Investment Income | $ | 51,643 | $ | 68,764 | $ | 853,413 | $ | 903,432 | $ | 488,808 | $ | 471,673 | ||||||||||||
Net Realized Gain | 820,060 | 2,781,951 | 69,982 | 2,181,193 | 2,558,148 | 5,182,845 | ||||||||||||||||||
Net Change in Unrealized Appreciation (Depreciation) | (1,306,041 | ) | (1,638,362 | ) | (2,319,723 | ) | 508,047 | (5,495,254 | ) | (920,555 | ) | |||||||||||||
|
|
|
|
|
|
|
|
|
|
|
| |||||||||||||
Change in Net Assets from Operations | (434,338 | ) | 1,212,353 | (1,396,328 | ) | 3,592,672 | (2,448,298 | ) | 4,733,963 | |||||||||||||||
|
|
|
|
|
|
|
|
|
|
|
| |||||||||||||
Dividends and Distributions to Shareholders: | ||||||||||||||||||||||||
Net Investment Income: | ||||||||||||||||||||||||
I Shares | (34,085 | ) | (161,145 | ) | (572,569 | ) | (762,134 | ) | (479,108 | ) | (1,049,547 | ) | ||||||||||||
A Shares | (24,643 | ) | (86,990 | ) | (204,021 | ) | (339,565 | ) | (67,349 | ) | (165,023 | ) | ||||||||||||
C Shares | (966 | ) | (10,001 | ) | (157,737 | ) | (266,817 | ) | (11,099 | ) | (42,123 | ) | ||||||||||||
Net Realized Gains: | ||||||||||||||||||||||||
I Shares | (771,787 | ) | (1,301,686 | ) | (799,647 | ) | (674,179 | ) | (3,232,886 | ) | (2,308,978 | ) | ||||||||||||
A Shares | (772,140 | ) | (763,286 | ) | (349,352 | ) | (341,200 | ) | (545,095 | ) | (399,136 | ) | ||||||||||||
C Shares | (149,331 | ) | (116,340 | ) | (480,071 | ) | (388,227 | ) | (202,838 | ) | (138,486 | ) | ||||||||||||
|
|
|
|
|
|
|
|
|
|
|
| |||||||||||||
Total Dividends and Distributions | (1,752,952 | ) | (2,439,448 | ) | (2,563,397 | ) | (2,772,122 | ) | (4,538,375 | ) | (4,103,293 | ) | ||||||||||||
|
|
|
|
|
|
|
|
|
|
|
| |||||||||||||
Change in Net Assets from Capital Transactions | (1,157,894 | ) | (7,913,651 | ) | 1,826,875 | 4,702,957 | (10,236,774 | ) | (986,685 | ) | ||||||||||||||
|
|
|
|
|
|
|
|
|
|
|
| |||||||||||||
Change in Net Assets | (3,345,184 | ) | (9,140,746 | ) | (2,132,850 | ) | 5,523,507 | (17,223,447 | ) | (356,015 | ) | |||||||||||||
|
|
|
|
|
|
|
|
|
|
|
| |||||||||||||
Net Assets: | ||||||||||||||||||||||||
Beginning of Year | 10,428,837 | 19,569,583 | 66,798,504 | 61,274,997 | 65,285,266 | 65,641,281 | ||||||||||||||||||
|
|
|
|
|
|
|
|
|
|
|
| |||||||||||||
End of Year | $ | 7,083,653 | $ | 10,428,837 | $ | 64,665,654 | $ | 66,798,504 | $ | 48,061,819 | $ | 65,285,266 | ||||||||||||
|
|
|
|
|
|
|
|
|
|
|
| |||||||||||||
Accumulated Net Investment Income (Loss), End of Year | $ | — | $ | (4,198 | ) | $ | 125,029 | $ | 167,083 | $ | 14,594 | $ | 25,955 | |||||||||||
|
|
|
|
|
|
|
|
|
|
|
| |||||||||||||
See Notes to Financial Statements.
53
Table of Contents
STATEMENTS OF CHANGES IN NET ASSETS (concluded)
RIDGEWORTH FUNDS For the Fiscal Years or Period Indicated
| Moderate Allocation Strategy | ||||||||
| 04/01/15- 03/31/16 | 04/01/14- 03/31/15 | |||||||
Operations: | ||||||||
Net Investment Income | $ | 952,973 | $ | 1,428,147 | ||||
Net Realized Gain | 6,381,339 | 9,725,324 | ||||||
Net Change in Unrealized Depreciation | (10,430,565 | ) | (2,565,429 | ) | ||||
|
|
|
| |||||
Change in Net Assets from Operations | (3,096,253 | ) | 8,588,042 | |||||
|
|
|
| |||||
Dividends and Distributions to Shareholders: | ||||||||
Net Investment Income: | ||||||||
I Shares | (805,343 | ) | (2,171,028 | ) | ||||
A Shares | (206,746 | ) | (373,163 | ) | ||||
C Shares | (124,573 | ) | (212,350 | ) | ||||
Net Realized Gains: | ||||||||
I Shares | (6,865,380 | ) | (4,896,911 | ) | ||||
A Shares | (1,841,985 | ) | (894,369 | ) | ||||
C Shares | (1,721,546 | ) | (701,661 | ) | ||||
|
|
|
| |||||
Total Dividends and Distributions | (11,565,573 | ) | (9,249,482 | ) | ||||
|
|
|
| |||||
Change in Net Assets from Capital Transactions | (41,933,238 | ) | (17,731,499 | ) | ||||
|
|
|
| |||||
Change in Net Assets | (56,595,064 | ) | (18,392,939 | ) | ||||
|
|
|
| |||||
Net Assets: | ||||||||
Beginning of Year | 125,826,018 | 144,218,957 | ||||||
|
|
|
| |||||
End of Year | $ | 69,230,954 | $ | 125,826,018 | ||||
|
|
|
| |||||
Accumulated Net Investment Income, End of Year | $ | 62,876 | $ | 186,987 | ||||
|
|
|
| |||||
See Notes to Financial Statements.
54
Table of Contents
RIDGEWORTH FUNDS Selected Data For a Share of Beneficial Interest Outstanding Throughout the Periods Indicated.
| Net Asset Value, Beginning of Period | Net Investment Income (Loss)(a) | Net Realized and Unrealized Gains (Losses) on Investments | Total from Operations | Dividends from Net Investment Income | Distributions from Tax Return of Capital | Distributions from Realized Capital Gains | Total Dividends and Distributions | Net Asset Value, End of Period | Net Assets End of Period (000) | Total Return(b) | Ratio of Net Expenses to Average Net Assets(c) | Ratio of Expenses to Average Net Assets (Excluding Waivers and Reimbursements)(c) | Ratio of Net Investment Income to Average Net Assets(c) | Portfolio Turnover Rate(d) | ||||||||||||||||||||||||||||||||||||||||||||||
Aggressive Growth Stock Fund | ||||||||||||||||||||||||||||||||||||||||||||||||||||||||||||
I Shares | ||||||||||||||||||||||||||||||||||||||||||||||||||||||||||||
Year Ended March 31, 2016 | $21.49 | $(0.26 | ) | $(0.59 | ) | $(0.85 | ) | $— | $— | $(1.53 | ) | $(1.53 | ) | $19.11 | $18,203 | (4.74 | )% | 1.31 | % | 1.39 | % | (1.20 | )% | 59 | % | |||||||||||||||||||||||||||||||||||
Year Ended March 31, 2015 | 21.20 | (0.26 | ) | 1.21 | 0.95 | — | — | (0.66 | ) | (0.66 | ) | 21.49 | 24,321 | 4.61 | 1.31 | 1.34 | (1.20 | ) | 42 | |||||||||||||||||||||||||||||||||||||||||
Year Ended March 31, 2014 | 15.60 | (0.22 | ) | 7.01 | 6.79 | — | — | (1.19 | ) | (1.19 | ) | 21.20 | 39,495 | 43.70 | 1.29 | 1.37 | (1.08 | ) | 49 | |||||||||||||||||||||||||||||||||||||||||
Year Ended March 31, 2013 | 15.94 | (0.14 | ) | 0.42 | 0.28 | — | — | (0.62 | ) | (0.62 | ) | 15.60 | 15,840 | 1.84 | 1.20 | 1.21 | (0.98 | ) | 24 | |||||||||||||||||||||||||||||||||||||||||
Year Ended March 31, 2012 | 16.45 | (0.15 | ) | (0.36 | ) | (0.51 | ) | — | — | — | — | 15.94 | 88,132 | (3.16 | ) | 1.22 | 1.22 | (0.98 | ) | 30 | ||||||||||||||||||||||||||||||||||||||||
A Shares | ||||||||||||||||||||||||||||||||||||||||||||||||||||||||||||
Year Ended March 31, 2016 | 20.76 | (0.29 | ) | (0.57 | ) | (0.86 | ) | — | — | (1.53 | ) | (1.53 | ) | 18.37 | 8,127 | (4.96 | ) | 1.49 | 1.49 | (1.38 | ) | 59 | ||||||||||||||||||||||||||||||||||||||
Year Ended March 31, 2015 | 20.53 | (0.28 | ) | 1.17 | 0.89 | — | — | (0.66 | ) | (0.66 | ) | 20.76 | 10,535 | 4.47 | 1.45 | 1.45 | (1.34 | ) | 42 | |||||||||||||||||||||||||||||||||||||||||
Year Ended March 31, 2014 | 15.16 | (0.24 | ) | 6.80 | 6.56 | — | — | (1.19 | ) | (1.19 | ) | 20.53 | 19,950 | 43.45 | 1.40 | 1.40 | (1.18 | ) | 49 | |||||||||||||||||||||||||||||||||||||||||
Year Ended March 31, 2013 | 15.54 | (0.18 | ) | 0.42 | 0.24 | — | — | (0.62 | ) | (0.62 | ) | 15.16 | 3,580 | 1.63 | 1.49 | 1.53 | (1.24 | ) | 24 | |||||||||||||||||||||||||||||||||||||||||
Year Ended March 31, 2012 | 16.10 | (0.18 | ) | (0.38 | ) | (0.56 | ) | — | — | — | — | 15.54 | 3,803 | (3.48 | ) | 1.53 | 1.53 | (1.28 | ) | 30 | ||||||||||||||||||||||||||||||||||||||||
Capital Innovations Global Resources and Infrastructure Fund |
| |||||||||||||||||||||||||||||||||||||||||||||||||||||||||||
I Shares | ||||||||||||||||||||||||||||||||||||||||||||||||||||||||||||
Period Ended March 31, 2016(e) | 9.91 | 0.07 | (0.76 | ) | (0.69 | ) | (0.18 | ) | — | — | (0.18 | ) | 9.04 | 1,955 | (6.93 | ) | 1.28 | 14.19 | 2.52 | 23 | ||||||||||||||||||||||||||||||||||||||||
Year Ended November 30, 2015 | 11.84 | 0.14 | (1.90 | ) | (1.76 | ) | (0.17 | ) | — | — | (0.17 | ) | 9.91 | 3,336 | (14.92 | ) | 1.35 | 3.42 | 1.23 | 19 | ||||||||||||||||||||||||||||||||||||||||
Year Ended November 30, 2014 | 11.50 | 0.13 | 0.34 | 0.47 | (0.04 | ) | (0.04 | ) | (0.05 | ) | (0.13 | ) | 11.84 | 12,532 | 4.12 | 1.35 | 3.29 | 1.13 | 24 | |||||||||||||||||||||||||||||||||||||||||
Year Ended November 30, 2013 | 10.03 | 0.09 | 1.43 | 1.52 | (0.05 | ) | — | — | (0.05 | ) | 11.50 | 5,436 | 15.15 | 1.35 | 6.57 | 0.85 | 7 | |||||||||||||||||||||||||||||||||||||||||||
Period Ended November 30, 2012(f) | 10.00 | 0.01 | 0.02 | 0.03 | — | — | — | — | 10.03 | 256 | 0.30 | 1.35 | 122.10 | 0.55 | 3 | |||||||||||||||||||||||||||||||||||||||||||||
A Shares | ||||||||||||||||||||||||||||||||||||||||||||||||||||||||||||
Period Ended March 31, 2016(e) | 9.90 | 0.07 | (0.76 | ) | (0.69 | ) | (0.18 | ) | — | — | (0.18 | ) | 9.03 | 1,250 | (7.01 | ) | 1.53 | 14.70 | 2.34 | 23 | ||||||||||||||||||||||||||||||||||||||||
Year Ended November 30, 2015 | 11.83 | 0.11 | (1.90 | ) | (1.79 | ) | (0.14 | ) | — | — | (0.14 | ) | 9.90 | 1,756 | (15.14 | ) | 1.60 | 3.67 | 0.98 | 19 | ||||||||||||||||||||||||||||||||||||||||
Year Ended November 30, 2014 | 11.49 | 0.10 | 0.34 | 0.44 | (0.02 | ) | (0.03 | ) | (0.05 | ) | (0.10 | ) | 11.83 | 3,033 | 3.84 | 1.60 | 3.54 | 0.88 | 24 | |||||||||||||||||||||||||||||||||||||||||
Year Ended November 30, 2013 | 10.02 | 0.07 | 1.43 | 1.50 | (0.03 | ) | — | — | (0.03 | ) | 11.49 | 5,569 | 14.98 | 1.60 | 6.82 | 0.60 | 7 | |||||||||||||||||||||||||||||||||||||||||||
Period Ended November 30, 2012(f) | 10.00 | 0.01 | 0.01 | 0.02 | — | — | — | — | 10.02 | 14 | 0.20 | 1.60 | 122.35 | 0.30 | 3 | |||||||||||||||||||||||||||||||||||||||||||||
C Shares | ||||||||||||||||||||||||||||||||||||||||||||||||||||||||||||
Period Ended March 31, 2016(e) | 9.76 | 0.04 | (0.75 | ) | (0.71 | ) | (0.15 | ) | — | — | (0.15 | ) | 8.90 | 204 | (7.24 | ) | 2.28 | 15.42 | 1.50 | 23 | ||||||||||||||||||||||||||||||||||||||||
Year Ended November 30, 2015 | 11.69 | 0.03 | (1.87 | ) | (1.84 | ) | (0.09 | ) | — | — | (0.09 | ) | 9.76 | 308 | (15.76 | ) | 2.35 | 4.42 | 0.23 | 19 | ||||||||||||||||||||||||||||||||||||||||
Year Ended November 30, 2014 | 11.41 | 0.02 | 0.33 | 0.35 | (0.01 | ) | (0.01 | ) | (0.05 | ) | (0.07 | ) | 11.69 | 737 | 3.04 | 2.35 | 4.29 | 0.13 | 24 | |||||||||||||||||||||||||||||||||||||||||
Year Ended November 30, 2013 | 10.01 | (0.02 | ) | 1.42 | 1.40 | — | (g) | — | — | — | 11.41 | 819 | 14.03 | 2.35 | 7.57 | (0.15 | ) | 7 | ||||||||||||||||||||||||||||||||||||||||||
Period Ended November 30, 2012(f) | 10.00 | (0.01 | ) | 0.02 | 0.01 | — | — | — | — | 10.01 | 7 | 0.10 | 2.35 | 123.10 | (0.45 | ) | 3 | |||||||||||||||||||||||||||||||||||||||||||
International Equity Fund | ||||||||||||||||||||||||||||||||||||||||||||||||||||||||||||
I Shares | ||||||||||||||||||||||||||||||||||||||||||||||||||||||||||||
Year Ended March 31, 2016 | 10.45 | 0.13 | (0.29 | ) | (0.16 | ) | (0.07 | ) | — | (0.92 | ) | (0.99 | ) | 9.30 | 28,756 | (1.59 | ) | 1.30 | 1.67 | 1.28 | 114 | |||||||||||||||||||||||||||||||||||||||
Year Ended March 31, 2015 | 12.45 | 0.25 | (0.90 | ) | (0.65 | ) | (0.23 | ) | — | (1.12 | ) | (1.35 | ) | 10.45 | 19,023 | (4.59 | ) | 1.37 | 1.48 | 2.15 | 41 | |||||||||||||||||||||||||||||||||||||||
Year Ended March 31, 2014 | 11.64 | 0.55 | 1.65 | 2.20 | (1.17 | ) | — | (0.22 | ) | (1.39 | ) | 12.45 | 26,932 | 19.52 | 1.20 | 1.20 | 4.55 | (h) | 43 | |||||||||||||||||||||||||||||||||||||||||
Year Ended March 31, 2013 | 10.74 | 0.22 | 0.89 | 1.11 | (0.21 | ) | — | — | (0.21 | ) | 11.64 | 272,552 | 10.38 | 1.12 | 1.12 | 2.02 | 52 | |||||||||||||||||||||||||||||||||||||||||||
Year Ended March 31, 2012 | 11.62 | 0.25 | (0.90 | ) | (0.65 | ) | (0.23 | ) | — | — | (0.23 | ) | 10.74 | 261,561 | (5.24 | ) | 1.29 | 1.29 | 2.33 | 78 | ||||||||||||||||||||||||||||||||||||||||
See Notes to Financial Highlights and Notes to Financial Statements.
55
Table of Contents
FINANCIAL HIGHLIGHTS
RIDGEWORTH FUNDS Selected Data For a Share of Beneficial Interest Outstanding Throughout the Periods Indicated.
| Net Asset Value, Beginning of Period | Net Investment Income (Loss)(a) | Net Realized and Unrealized Gains (Losses) on Investments | Total from Operations | Dividends from Net Investment Income | Distributions from Tax Return of Capital | Distributions from Realized Capital Gains | Total Dividends and Distributions | Net Asset Value, End of Period | Net Assets End of Period (000) | Total Return(b) | Ratio of Net Expenses to Average Net Assets(c) | Ratio of Expenses to Average Net Assets (Excluding Waivers and Reimbursements)(c) | Ratio of Net Investment Income to Average Net Assets(c) | Portfolio Turnover Rate(d) | ||||||||||||||||||||||||||||||||||||||||||||||
A Shares | ||||||||||||||||||||||||||||||||||||||||||||||||||||||||||||
Year Ended March 31, 2016 | $10.34 | $0.09 | $(0.27 | ) | $(0.18 | ) | $(0.06 | ) | $— | $(0.92 | ) | $(0.98 | ) | $9.18 | $3,756 | (1.77 | )% | 1.51 | % | 1.77 | % | 0.89 | % | 114 | % | |||||||||||||||||||||||||||||||||||
Year Ended March 31, 2015 | 12.35 | 0.20 | (0.87 | ) | (0.67 | ) | (0.22 | ) | — | (1.12 | ) | (1.34 | ) | 10.34 | 4,123 | (4.87 | ) | 1.57 | 1.66 | 1.79 | 41 | |||||||||||||||||||||||||||||||||||||||
Year Ended March 31, 2014 | 11.51 | 0.20 | 2.00 | 2.20 | (1.14 | ) | — | (0.22 | ) | (1.36 | ) | 12.35 | 4,802 | 19.72 | 1.47 | 1.47 | 1.66 | 43 | ||||||||||||||||||||||||||||||||||||||||||
Year Ended March 31, 2013 | 10.63 | 0.18 | 0.87 | 1.05 | (0.17 | ) | — | — | (0.17 | ) | 11.51 | 4,565 | 9.95 | 1.45 | 1.45 | 1.73 | 52 | |||||||||||||||||||||||||||||||||||||||||||
Year Ended March 31, 2012 | 11.49 | 0.21 | (0.87 | ) | (0.66 | ) | (0.20 | ) | — | — | (0.20 | ) | 10.63 | 5,500 | (5.48 | ) | 1.59 | 1.59 | 2.02 | 78 | ||||||||||||||||||||||||||||||||||||||||
IS Shares(i) | ||||||||||||||||||||||||||||||||||||||||||||||||||||||||||||
Period Ended March 31, 2016 | 9.85 | — | (g) | 0.38 | 0.38 | — | — | (0.92 | ) | (0.92 | ) | 9.31 | 5,832 | 3.81 | 1.14 | 1.54 | 0.09 | 114 | ||||||||||||||||||||||||||||||||||||||||||
Large Cap Growth Stock Fund | ||||||||||||||||||||||||||||||||||||||||||||||||||||||||||||
I Shares | ||||||||||||||||||||||||||||||||||||||||||||||||||||||||||||
Year Ended March 31, 2016 | 10.32 | (0.02 | ) | (0.12 | ) | (0.14 | ) | — | — | (0.80 | ) | (0.80 | ) | 9.38 | 110,562 | (1.79 | ) | 0.97 | 1.24 | (0.15 | ) | 10 | ||||||||||||||||||||||||||||||||||||||
Year Ended March 31, 2015 | 9.70 | — | 1.40 | 1.40 | — | — | (0.78 | ) | (0.78 | ) | 10.32 | 127,236 | 15.03 | 0.94 | 1.17 | (0.04 | ) | 13 | ||||||||||||||||||||||||||||||||||||||||||
Year Ended March 31, 2014 | 8.31 | 0.01 | 2.24 | 2.25 | — | — | (0.86 | ) | (0.86 | ) | 9.70 | 188,294 | 27.35 | 0.92 | 1.09 | 0.07 | 21 | |||||||||||||||||||||||||||||||||||||||||||
Year Ended March 31, 2013 | 12.95 | 0.03 | 0.24 | 0.27 | (0.01 | ) | — | (4.90 | ) | (4.91 | ) | 8.31 | 167,887 | 3.64 | 0.94 | 0.94 | 0.23 | 40 | ||||||||||||||||||||||||||||||||||||||||||
Year Ended March 31, 2012 | 11.55 | (0.02 | ) | 1.42 | 1.40 | — | — | — | — | 12.95 | 261,090 | 12.12 | 1.07 | 1.07 | (0.17 | ) | 19 | |||||||||||||||||||||||||||||||||||||||||||
A Shares | ||||||||||||||||||||||||||||||||||||||||||||||||||||||||||||
Year Ended March 31, 2016 | 8.75 | (0.03 | ) | (0.11 | ) | (0.14 | ) | — | — | (0.80 | ) | (0.80 | ) | 7.81 | 62,115 | (2.13 | ) | 1.20 | 1.21 | (0.39 | ) | 10 | ||||||||||||||||||||||||||||||||||||||
Year Ended March 31, 2015 | 8.35 | (0.02 | ) | 1.20 | 1.18 | — | — | (0.78 | ) | (0.78 | ) | 8.75 | 65,953 | 14.83 | 1.18 | 1.19 | (0.26 | ) | 13 | |||||||||||||||||||||||||||||||||||||||||
Year Ended March 31, 2014 | 7.27 | (0.02 | ) | 1.96 | 1.94 | — | — | (0.86 | ) | (0.86 | ) | 8.35 | 64,288 | 26.99 | 1.19 | 1.20 | (0.20 | ) | 21 | |||||||||||||||||||||||||||||||||||||||||
Year Ended March 31, 2013 | 11.96 | — | (g) | 0.21 | 0.21 | — | — | (4.90 | ) | (4.90 | ) | 7.27 | 56,511 | 3.43 | 1.20 | 1.20 | (0.01 | ) | 40 | |||||||||||||||||||||||||||||||||||||||||
Year Ended March 31, 2012 | 10.70 | (0.05 | ) | 1.31 | 1.26 | — | — | — | — | 11.96 | 45,854 | 11.78 | 1.37 | 1.37 | (0.45 | ) | 19 | |||||||||||||||||||||||||||||||||||||||||||
C Shares | ||||||||||||||||||||||||||||||||||||||||||||||||||||||||||||
Year Ended March 31, 2016 | 6.38 | (0.06 | ) | (0.07 | ) | (0.13 | ) | — | — | (0.80 | ) | (0.80 | ) | 5.45 | 40,086 | (2.77 | ) | 1.88 | 1.89 | (1.06 | ) | 10 | ||||||||||||||||||||||||||||||||||||||
Year Ended March 31, 2015 | 6.32 | (0.06 | ) | 0.90 | 0.84 | — | — | (0.78 | ) | (0.78 | ) | 6.38 | 46,678 | 14.20 | 1.86 | 1.87 | (0.90 | ) | 13 | |||||||||||||||||||||||||||||||||||||||||
Year Ended March 31, 2014 | 5.71 | (0.06 | ) | 1.53 | 1.47 | — | — | (0.86 | ) | (0.86 | ) | 6.32 | 34,249 | 26.09 | 1.88 | 1.88 | (0.90 | ) | 21 | |||||||||||||||||||||||||||||||||||||||||
Year Ended March 31, 2013 | 10.52 | (0.06 | ) | 0.15 | 0.09 | — | — | (4.90 | ) | (4.90 | ) | 5.71 | 31,625 | 2.69 | 1.89 | 1.89 | (0.70 | ) | 40 | |||||||||||||||||||||||||||||||||||||||||
Year Ended March 31, 2012 | 9.48 | (0.11 | ) | 1.15 | 1.04 | — | — | — | — | 10.52 | 17,363 | 10.97 | 2.07 | 2.07 | (1.15 | ) | 19 | |||||||||||||||||||||||||||||||||||||||||||
IS Shares | ||||||||||||||||||||||||||||||||||||||||||||||||||||||||||||
Year Ended March 31, 2016 | 10.33 | (0.01 | ) | (0.13 | ) | (0.14 | ) | — | — | (0.80 | ) | (0.80 | ) | 9.39 | 37,087 | (1.80 | ) | 0.88 | 0.89 | (0.06 | ) | 10 | ||||||||||||||||||||||||||||||||||||||
Period Ended March 31, 2015(j) | 9.97 | 0.01 | 1.13 | 1.14 | — | — | (0.78 | ) | (0.78 | ) | 10.33 | 52,967 | 12.02 | 0.85 | 0.87 | 0.16 | 13 | |||||||||||||||||||||||||||||||||||||||||||
Large Cap Value Equity Fund | ||||||||||||||||||||||||||||||||||||||||||||||||||||||||||||
I Shares | ||||||||||||||||||||||||||||||||||||||||||||||||||||||||||||
Year Ended March 31, 2016 | 16.60 | 0.22 | (0.57 | ) | (0.35 | ) | (0.24 | ) | — | (1.30 | ) | (1.54 | ) | 14.71 | 1,440,587 | (2.19 | ) | 0.97 | 1.09 | 1.40 | 66 | |||||||||||||||||||||||||||||||||||||||
Year Ended March 31, 2015 | 17.02 | 0.23 | 0.99 | 1.22 | (0.23 | ) | — | (1.41 | ) | (1.64 | ) | 16.60 | 1,927,039 | 7.25 | 0.95 | 1.07 | 1.33 | 73 | ||||||||||||||||||||||||||||||||||||||||||
Year Ended March 31, 2014 | 15.76 | 0.24 | 3.29 | 3.53 | (0.23 | ) | — | (2.04 | ) | (2.27 | ) | 17.02 | 1,799,158 | 22.94 | 0.91 | 1.06 | 1.42 | 81 | ||||||||||||||||||||||||||||||||||||||||||
Year Ended March 31, 2013 | 13.77 | 0.24 | 1.97 | 2.21 | (0.22 | ) | — | — | (0.22 | ) | 15.76 | 1,442,154 | 16.24 | 0.89 | 0.89 | 1.74 | 78 | |||||||||||||||||||||||||||||||||||||||||||
Year Ended March 31, 2012 | 13.47 | 0.22 | 0.28 | 0.50 | (0.20 | ) | — | — | (0.20 | ) | 13.77 | 1,985,434 | 3.92 | 0.82 | 0.82 | 1.74 | 110 | |||||||||||||||||||||||||||||||||||||||||||
A Shares | ||||||||||||||||||||||||||||||||||||||||||||||||||||||||||||
Year Ended March 31, 2016 | 16.48 | 0.17 | (0.56 | ) | (0.39 | ) | (0.19 | ) | — | (1.30 | ) | (1.49 | ) | 14.60 | 362,805 | (2.46 | ) | 1.27 | 1.37 | 1.09 | 66 | |||||||||||||||||||||||||||||||||||||||
Year Ended March 31, 2015 | 16.90 | 0.18 | 0.99 | 1.17 | (0.18 | ) | — | (1.41 | ) | (1.59 | ) | 16.48 | 461,642 | 6.98 | 1.25 | 1.36 | 1.03 | 73 | ||||||||||||||||||||||||||||||||||||||||||
Year Ended March 31, 2014 | 15.67 | 0.19 | 3.27 | 3.46 | (0.19 | ) | — | (2.04 | ) | (2.23 | ) | 16.90 | 379,768 | 22.60 | 1.19 | 1.37 | 1.13 | 81 | ||||||||||||||||||||||||||||||||||||||||||
Year Ended March 31, 2013 | 13.70 | 0.21 | 1.95 | 2.16 | (0.19 | ) | — | — | (0.19 | ) | 15.67 | 287,957 | 15.93 | 1.16 | 1.26 | 1.48 | 78 | |||||||||||||||||||||||||||||||||||||||||||
Year Ended March 31, 2012 | 13.41 | 0.19 | 0.27 | 0.46 | (0.17 | ) | — | — | (0.17 | ) | 13.70 | 233,782 | 3.58 | 1.12 | 1.12 | 1.50 | 110 | |||||||||||||||||||||||||||||||||||||||||||
See Notes to Financial Highlights and Notes to Financial Statements.
56
Table of Contents
FINANCIAL HIGHLIGHTS
RIDGEWORTH FUNDS Selected Data For a Share of Beneficial Interest Outstanding Throughout the Periods Indicated.
| Net Asset Value, Beginning of Period | Net Investment Income (Loss)(a) | Net Realized and Unrealized Gains (Losses) on Investments | Total from Operations | Dividends from Net Investment Income | Distributions from Tax Return of Capital | Distributions from Realized Capital Gains | Total Dividends and Distributions | Net Asset Value, End of Period | Net Assets End of Period (000) | Total Return(b) | Ratio of Net Expenses to Average Net Assets(c) | Ratio of Expenses to Average Net Assets (Excluding Waivers and Reimbursements)(c) | Ratio of Net Investment Income to Average Net Assets(c) | Portfolio Turnover Rate(d) | ||||||||||||||||||||||||||||||||||||||||||||||
C Shares | ||||||||||||||||||||||||||||||||||||||||||||||||||||||||||||
Year Ended March 31, 2016 | $16.15 | $0.10 | $(0.55 | ) | $(0.45 | ) | $(0.12 | ) | $— | $(1.30 | ) | $(1.42 | ) | $14.28 | $19,053 | (2.88 | )% | 1.71 | % | 1.71 | % | 0.65 | % | 66 | % | |||||||||||||||||||||||||||||||||||
Year Ended March 31, 2015 | 16.59 | 0.10 | 0.97 | 1.07 | (0.10 | ) | — | (1.41 | ) | (1.51 | ) | 16.15 | 21,207 | 6.50 | 1.71 | 1.71 | 0.57 | 73 | ||||||||||||||||||||||||||||||||||||||||||
Year Ended March 31, 2014 | 15.42 | 0.10 | 3.22 | 3.32 | (0.11 | ) | — | (2.04 | ) | (2.15 | ) | 16.59 | 20,239 | 21.98 | 1.71 | 1.71 | 0.62 | 81 | ||||||||||||||||||||||||||||||||||||||||||
Year Ended March 31, 2013 | 13.50 | 0.12 | 1.92 | 2.04 | (0.12 | ) | — | — | (0.12 | ) | 15.42 | 16,394 | 15.25 | 1.75 | 1.75 | 0.89 | 78 | |||||||||||||||||||||||||||||||||||||||||||
Year Ended March 31, 2012 | 13.21 | 0.08 | 0.29 | 0.37 | (0.08 | ) | — | — | (0.08 | ) | 13.50 | 17,027 | 2.86 | 1.82 | 1.82 | 0.68 | 110 | |||||||||||||||||||||||||||||||||||||||||||
IS Shares | ||||||||||||||||||||||||||||||||||||||||||||||||||||||||||||
Year Ended March 31, 2016 | 16.66 | 0.23 | (0.53 | ) | (0.30 | ) | (0.29 | ) | — | (1.30 | ) | (1.59 | ) | 14.77 | 272,861 | (1.90 | ) | 0.72 | 0.72 | 1.48 | 66 | |||||||||||||||||||||||||||||||||||||||
Period Ended March 31, 2015(j) | 17.54 | 0.19 | 0.54 | 0.73 | (0.20 | ) | — | (1.41 | ) | (1.61 | ) | 16.66 | 37,570 | 4.26 | 0.71 | 0.71 | 1.65 | 73 | ||||||||||||||||||||||||||||||||||||||||||
Mid-Cap Value Equity Fund | ||||||||||||||||||||||||||||||||||||||||||||||||||||||||||||
I Shares | ||||||||||||||||||||||||||||||||||||||||||||||||||||||||||||
Year Ended March 31, 2016 | 13.74 | 0.15 | (0.71 | ) | (0.56 | ) | (0.15 | ) | — | (0.69 | ) | (0.84 | ) | 12.34 | 2,717,761 | (3.85 | ) | 1.12 | 1.12 | 1.16 | 98 | |||||||||||||||||||||||||||||||||||||||
Year Ended March 31, 2015 | 14.09 | 0.13 | 0.93 | 1.06 | (0.12 | ) | — | (1.29 | ) | (1.41 | ) | 13.74 | 3,552,288 | 7.76 | 1.10 | 1.10 | 0.92 | 94 | ||||||||||||||||||||||||||||||||||||||||||
Year Ended March 31, 2014 | 13.06 | 0.14 | 2.64 | 2.78 | (0.12 | ) | — | (1.63 | ) | (1.75 | ) | 14.09 | 3,159,585 | 22.03 | 1.09 | 1.10 | 1.02 | 108 | ||||||||||||||||||||||||||||||||||||||||||
Year Ended March 31, 2013 | 11.07 | 0.16 | 2.00 | 2.16 | (0.14 | ) | — | (0.03 | ) | (0.17 | ) | 13.06 | 2,168,210 | 19.73 | 1.08 | 1.08 | 1.44 | 123 | ||||||||||||||||||||||||||||||||||||||||||
Year Ended March 31, 2012 | 12.70 | 0.17 | (0.66 | ) | (0.49 | ) | (0.17 | ) | — | (0.97 | ) | (1.14 | ) | 11.07 | 1,679,244 | (2.33 | ) | 1.04 | 1.04 | 1.56 | 182 | |||||||||||||||||||||||||||||||||||||||
A Shares | ||||||||||||||||||||||||||||||||||||||||||||||||||||||||||||
Year Ended March 31, 2016 | 13.60 | 0.11 | (0.70 | ) | (0.59 | ) | (0.10 | ) | — | (0.69 | ) | (0.79 | ) | 12.22 | 397,599 | (4.11 | ) | 1.40 | 1.45 | 0.86 | 98 | |||||||||||||||||||||||||||||||||||||||
Year Ended March 31, 2015 | 13.96 | 0.09 | 0.92 | 1.01 | (0.08 | ) | — | (1.29 | ) | (1.37 | ) | 13.60 | 590,327 | 7.45 | 1.38 | 1.41 | 0.64 | 94 | ||||||||||||||||||||||||||||||||||||||||||
Year Ended March 31, 2014 | 12.96 | 0.10 | 2.62 | 2.72 | (0.09 | ) | — | (1.63 | ) | (1.72 | ) | 13.96 | 611,880 | 21.68 | 1.35 | 1.40 | 0.76 | 108 | ||||||||||||||||||||||||||||||||||||||||||
Year Ended March 31, 2013 | 10.99 | 0.13 | 1.98 | 2.11 | (0.11 | ) | — | (0.03 | ) | (0.14 | ) | 12.96 | 490,381 | 19.43 | 1.34 | 1.38 | 1.17 | 123 | ||||||||||||||||||||||||||||||||||||||||||
Year Ended March 31, 2012 | 12.62 | 0.15 | (0.67 | ) | (0.52 | ) | (0.14 | ) | — | (0.97 | ) | (1.11 | ) | 10.99 | 433,674 | (2.63 | ) | 1.34 | 1.34 | 1.40 | 182 | |||||||||||||||||||||||||||||||||||||||
C Shares | ||||||||||||||||||||||||||||||||||||||||||||||||||||||||||||
Year Ended March 31, 2016 | 13.34 | 0.06 | (0.68 | ) | (0.62 | ) | (0.07 | ) | — | (0.69 | ) | (0.76 | ) | 11.96 | 64,160 | (4.49 | ) | 1.78 | 1.78 | 0.50 | 98 | |||||||||||||||||||||||||||||||||||||||
Year Ended March 31, 2015 | 13.72 | 0.04 | �� | 0.90 | 0.94 | (0.03 | ) | — | (1.29 | ) | (1.32 | ) | 13.34 | 87,115 | 7.06 | 1.75 | 1.75 | 0.28 | 94 | |||||||||||||||||||||||||||||||||||||||||
Year Ended March 31, 2014 | 12.77 | 0.05 | 2.58 | 2.63 | (0.05 | ) | — | (1.63 | ) | (1.68 | ) | 13.72 | 81,961 | 21.26 | 1.76 | 1.76 | 0.36 | 108 | ||||||||||||||||||||||||||||||||||||||||||
Year Ended March 31, 2013 | 10.85 | 0.07 | 1.95 | 2.02 | (0.07 | ) | — | (0.03 | ) | (0.10 | ) | 12.77 | 53,893 | 18.75 | 1.86 | 1.86 | 0.65 | 123 | ||||||||||||||||||||||||||||||||||||||||||
Year Ended March 31, 2012 | 12.48 | 0.07 | (0.66 | ) | (0.59 | ) | (0.07 | ) | — | (0.97 | ) | (1.04 | ) | 10.85 | 42,272 | (3.32 | ) | 2.04 | 2.04 | 0.65 | 182 | |||||||||||||||||||||||||||||||||||||||
IS Shares | ||||||||||||||||||||||||||||||||||||||||||||||||||||||||||||
Year Ended March 31, 2016 | 13.76 | 0.21 | (0.72 | ) | (0.51 | ) | (0.20 | ) | — | (0.69 | ) | (0.89 | ) | 12.36 | 192,640 | (3.45 | ) | 0.80 | 0.80 | 1.68 | 98 | |||||||||||||||||||||||||||||||||||||||
Period Ended March 31, 2015(j) | 14.28 | 0.13 | 0.77 | 0.90 | (0.13 | ) | — | (1.29 | ) | (1.42 | ) | 13.76 | 23,398 | 6.54 | 0.75 | 0.75 | 1.39 | 94 | ||||||||||||||||||||||||||||||||||||||||||
Small Cap Growth Stock Fund | ||||||||||||||||||||||||||||||||||||||||||||||||||||||||||||
I Shares | ||||||||||||||||||||||||||||||||||||||||||||||||||||||||||||
Year Ended March 31, 2016 | 14.83 | (0.10 | ) | (1.54 | ) | (1.64 | ) | — | — | (4.67 | ) | (4.67 | ) | 8.52 | 36,436 | (13.36 | )(k) | 1.30 | 1.39 | (0.74 | ) | 73 | ||||||||||||||||||||||||||||||||||||||
Year Ended March 31, 2015 | 16.82 | (0.14 | ) | 0.65 | 0.51 | — | — | (2.50 | ) | (2.50 | ) | 14.83 | 126,223 | 4.31 | (k) | 1.28 | 1.34 | (0.92 | ) | 31 | ||||||||||||||||||||||||||||||||||||||||
Year Ended March 31, 2014 | 15.66 | (0.16 | ) | 4.23 | 4.07 | — | — | (2.91 | ) | (2.91 | ) | 16.82 | 170,409 | 25.98 | 1.26 | 1.31 | (0.91 | ) | 90 | |||||||||||||||||||||||||||||||||||||||||
Year Ended March 31, 2013 | 17.21 | (0.08 | ) | 2.19 | 2.11 | — | — | (3.66 | ) | (3.66 | ) | 15.66 | 152,674 | 14.20 | 1.21 | 1.21 | (0.50 | ) | 50 | |||||||||||||||||||||||||||||||||||||||||
Year Ended March 31, 2012 | 17.17 | (0.10 | ) | 0.14 | (l) | 0.04 | — | — | — | — | 17.21 | 267,694 | 0.23 | 1.23 | 1.23 | (0.62 | ) | 71 | ||||||||||||||||||||||||||||||||||||||||||
A Shares | ||||||||||||||||||||||||||||||||||||||||||||||||||||||||||||
Year Ended March 31, 2016 | 13.23 | (0.08 | ) | (1.35 | ) | (1.43 | ) | — | — | (4.67 | ) | (4.67 | ) | 7.13 | 6,856 | (13.38 | ) | 1.37 | 1.37 | (0.76 | ) | 73 | ||||||||||||||||||||||||||||||||||||||
Year Ended March 31, 2015 | 15.30 | (0.13 | ) | 0.56 | 0.43 | — | — | (2.50 | ) | (2.50 | ) | 13.23 | 9,889 | 4.21 | 1.32 | 1.32 | (0.96 | ) | 31 | |||||||||||||||||||||||||||||||||||||||||
Year Ended March 31, 2014 | 14.46 | (0.15 | ) | 3.90 | 3.75 | — | — | (2.91 | ) | (2.91 | ) | 15.30 | 10,880 | 25.92 | 1.29 | 1.29 | (0.94 | ) | 90 | |||||||||||||||||||||||||||||||||||||||||
Year Ended March 31, 2013 | 16.18 | (0.11 | ) | 2.05 | 1.94 | — | — | (3.66 | ) | (3.66 | ) | 14.46 | 10,226 | 14.07 | 1.37 | 1.37 | (0.69 | ) | 50 | |||||||||||||||||||||||||||||||||||||||||
Year Ended March 31, 2012 | 16.19 | (0.14 | ) | 0.13 | (l) | (0.01 | ) | — | — | — | — | 16.18 | 10,032 | (0.06 | ) | 1.54 | 1.54 | (0.91 | ) | 71 | ||||||||||||||||||||||||||||||||||||||||
See Notes to Financial Highlights and Notes to Financial Statements.
57
Table of Contents
FINANCIAL HIGHLIGHTS
RIDGEWORTH FUNDS Selected Data For a Share of Beneficial Interest Outstanding Throughout the Periods Indicated.
| Net Asset Value, Beginning of Period | Net Investment Income (Loss)(a) | Net Realized and Unrealized Gains (Losses) on Investments | Total from Operations | Dividends from Net Investment Income | Distributions from Tax Return of Capital | Distributions from Realized Capital Gains | Total Dividends and Distributions | Net Asset Value, End of Period | Net Assets End of Period (000) | Total Return(b) | Ratio of Net Expenses to Average Net Assets(c) | Ratio of Expenses to Average Net Assets (Excluding Waivers and Reimbursements)(c) | Ratio of Net Investment Income to Average Net Assets(c) | Portfolio Turnover Rate(d) | ||||||||||||||||||||||||||||||||||||||||||||||
C Shares | ||||||||||||||||||||||||||||||||||||||||||||||||||||||||||||
Year Ended March 31, 2016 | $9.53 | $(0.10 | ) | $(0.88 | ) | $(0.98 | ) | $— | $— | $(4.67 | ) | $(4.67 | ) | $3.88 | $4,686 | (13.91 | )% | 2.02 | % | 2.02 | % | (1.40 | )% | 73 | % | |||||||||||||||||||||||||||||||||||
Year Ended March 31, 2015 | 11.82 | (0.17 | ) | 0.38 | 0.21 | — | — | (2.50 | ) | (2.50 | ) | 9.53 | 6,397 | 3.55 | 1.96 | 1.96 | (1.60 | ) | 31 | |||||||||||||||||||||||||||||||||||||||||
Year Ended March 31, 2014 | 11.77 | (0.20 | ) | 3.16 | 2.96 | — | — | (2.91 | ) | (2.91 | ) | 11.82 | 7,255 | 25.10 | 1.94 | 1.94 | (1.59 | ) | 90 | |||||||||||||||||||||||||||||||||||||||||
Year Ended March 31, 2013 | 13.91 | (0.18 | ) | 1.70 | 1.52 | — | — | (3.66 | ) | (3.66 | ) | 11.77 | 6,757 | 13.30 | 2.05 | 2.05 | (1.39 | ) | 50 | |||||||||||||||||||||||||||||||||||||||||
Year Ended March 31, 2012 | 14.01 | (0.21 | ) | 0.11 | (l) | (0.10 | ) | — | — | — | — | 13.91 | 8,129 | (0.71 | ) | 2.24 | 2.24 | (1.61 | ) | 71 | ||||||||||||||||||||||||||||||||||||||||
IS Shares | ||||||||||||||||||||||||||||||||||||||||||||||||||||||||||||
Year Ended March 31, 2016 | 14.85 | (0.05 | ) | (1.56 | ) | (1.61 | ) | — | — | (4.67 | ) | (4.67 | ) | 8.57 | 3,289 | (13.13 | ) | 1.02 | 1.02 | (0.42 | ) | 73 | ||||||||||||||||||||||||||||||||||||||
Period Ended March 31, 2015(j) | 15.61 | (0.06 | ) | 1.80 | 1.74 | — | — | (2.50 | ) | (2.50 | ) | 14.85 | 6,235 | 12.53 | 0.96 | 0.96 | (0.56 | ) | 31 | |||||||||||||||||||||||||||||||||||||||||
Small Cap Value Equity Fund | ||||||||||||||||||||||||||||||||||||||||||||||||||||||||||||
I Shares | ||||||||||||||||||||||||||||||||||||||||||||||||||||||||||||
Year Ended March 31, 2016 | 15.59 | 0.13 | (0.50 | ) | (0.37 | ) | (0.20 | ) | — | (3.72 | ) | (3.92 | ) | 11.30 | 820,124 | (0.64 | ) | 1.21 | 1.21 | 0.93 | 36 | |||||||||||||||||||||||||||||||||||||||
Year Ended March 31, 2015 | 17.95 | 0.20 | 0.38 | 0.58 | (0.15 | ) | — | (2.79 | ) | (2.94 | ) | 15.59 | 1,118,190 | 4.07 | 1.21 | 1.21 | 1.16 | 10 | ||||||||||||||||||||||||||||||||||||||||||
Year Ended March 31, 2014 | 15.45 | 0.17 | 3.11 | 3.28 | (0.14 | ) | — | (0.64 | ) | (0.78 | ) | 17.95 | 1,528,174 | 21.34 | 1.22 | 1.22 | 1.01 | 37 | ||||||||||||||||||||||||||||||||||||||||||
Year Ended March 31, 2013 | 13.80 | 0.20 | 2.08 | 2.28 | (0.23 | ) | — | (0.40 | ) | (0.63 | ) | 15.45 | 1,408,597 | 17.07 | 1.20 | 1.20 | 1.44 | 27 | ||||||||||||||||||||||||||||||||||||||||||
Year Ended March 31, 2012 | 14.54 | 0.12 | (0.07 | )(l) | 0.05 | (0.12 | ) | — | (0.67 | ) | (0.79 | ) | 13.80 | 1,169,093 | 1.15 | 1.20 | 1.20 | 0.92 | 46 | |||||||||||||||||||||||||||||||||||||||||
A Shares | ||||||||||||||||||||||||||||||||||||||||||||||||||||||||||||
Year Ended March 31, 2016 | 15.25 | 0.08 | (0.50 | ) | (0.42 | ) | (0.15 | ) | — | (3.72 | ) | (3.87 | ) | 10.96 | 121,367 | (1.07 | )(k) | 1.55 | 1.55 | 0.62 | 36 | |||||||||||||||||||||||||||||||||||||||
Year Ended March 31, 2015 | 17.61 | 0.15 | 0.38 | 0.53 | (0.10 | ) | — | (2.79 | ) | (2.89 | ) | 15.25 | 162,732 | 3.79 | 1.52 | 1.52 | 0.89 | 10 | ||||||||||||||||||||||||||||||||||||||||||
Year Ended March 31, 2014 | 15.19 | 0.12 | 3.05 | 3.17 | (0.11 | ) | — | (0.64 | ) | (0.75 | ) | 17.61 | 195,098 | 20.96 | 1.50 | 1.50 | 0.73 | 37 | ||||||||||||||||||||||||||||||||||||||||||
Year Ended March 31, 2013 | 13.58 | 0.15 | 2.05 | 2.20 | (0.19 | ) | — | (0.40 | ) | (0.59 | ) | 15.19 | 181,308 | 16.77 | 1.50 | 1.50 | 1.14 | 27 | ||||||||||||||||||||||||||||||||||||||||||
Year Ended March 31, 2012 | 14.33 | 0.08 | (0.08 | )(l) | — | (0.08 | ) | — | (0.67 | ) | (0.75 | ) | 13.58 | 169,100 | 0.81 | 1.50 | 1.50 | 0.63 | 46 | |||||||||||||||||||||||||||||||||||||||||
C Shares | ||||||||||||||||||||||||||||||||||||||||||||||||||||||||||||
Year Ended March 31, 2016 | 14.31 | 0.03 | (0.47 | ) | (0.44 | ) | (0.11 | ) | — | (3.72 | ) | (3.83 | ) | 10.04 | 27,410 | (1.34 | ) | 1.90 | 1.90 | 0.28 | 36 | |||||||||||||||||||||||||||||||||||||||
Year Ended March 31, 2015 | 16.71 | 0.08 | 0.36 | 0.44 | (0.05 | ) | — | (2.79 | ) | (2.84 | ) | 14.31 | 33,793 | 3.42 | 1.88 | 1.88 | 0.54 | 10 | ||||||||||||||||||||||||||||||||||||||||||
Year Ended March 31, 2014 | 14.47 | 0.06 | 2.90 | 2.96 | (0.08 | ) | — | (0.64 | ) | (0.72 | ) | 16.71 | 38,408 | 20.53 | 1.87 | 1.87 | 0.36 | 37 | ||||||||||||||||||||||||||||||||||||||||||
Year Ended March 31, 2013 | 12.98 | 0.08 | 1.95 | 2.03 | (0.14 | ) | — | (0.40 | ) | (0.54 | ) | 14.47 | 36,015 | 16.17 | 1.99 | 1.99 | 0.65 | 27 | ||||||||||||||||||||||||||||||||||||||||||
Year Ended March 31, 2012 | 13.76 | (0.01 | ) | (0.08 | )(l) | (0.09 | ) | (0.02 | ) | — | (0.67 | ) | (0.69 | ) | 12.98 | 38,107 | 0.12 | 2.20 | 2.20 | (0.08 | ) | 46 | ||||||||||||||||||||||||||||||||||||||
Aggressive Growth Allocation Strategy(m) |
| |||||||||||||||||||||||||||||||||||||||||||||||||||||||||||
I Shares | ||||||||||||||||||||||||||||||||||||||||||||||||||||||||||||
Year Ended March 31, 2016 | 7.97 | 0.06 | (0.41 | ) | (0.35 | ) | (0.07 | ) | — | (1.55 | ) | (1.62 | ) | 6.00 | 2,582 | (4.67 | ) | 0.50 | 1.55 | 0.77 | 43 | |||||||||||||||||||||||||||||||||||||||
Year Ended March 31, 2015 | 8.98 | 0.04 | 0.62 | 0.66 | (0.18 | ) | — | (1.49 | ) | (1.67 | ) | 7.97 | 4,920 | 7.79 | 0.50 | 1.12 | 0.46 | 36 | ||||||||||||||||||||||||||||||||||||||||||
Year Ended March 31, 2014 | 8.95 | 0.09 | 1.50 | 1.59 | (0.29 | ) | — | (1.27 | ) | (1.56 | ) | 8.98 | 14,143 | 18.41 | 0.50 | 0.94 | 0.99 | 12 | ||||||||||||||||||||||||||||||||||||||||||
Year Ended March 31, 2013 | 8.50 | 0.06 | 0.48 | 0.54 | (0.09 | ) | — | — | (0.09 | ) | 8.95 | 18,577 | 6.45 | 0.40 | 0.81 | 0.77 | 35 | |||||||||||||||||||||||||||||||||||||||||||
Year Ended March 31, 2012 | 8.57 | 0.08 | (0.02 | ) | 0.06 | (0.13 | ) | — | — | (0.13 | ) | 8.50 | 18,993 | 0.89 | 0.20 | 0.45 | 0.98 | 55 | ||||||||||||||||||||||||||||||||||||||||||
A Shares | ||||||||||||||||||||||||||||||||||||||||||||||||||||||||||||
Year Ended March 31, 2016 | 7.87 | 0.04 | (0.40 | ) | (0.36 | ) | (0.05 | ) | — | (1.55 | ) | (1.60 | ) | 5.91 | 3,807 | (4.88 | ) | 0.70 | 1.57 | 0.52 | 43 | |||||||||||||||||||||||||||||||||||||||
Year Ended March 31, 2015 | 8.89 | 0.04 | 0.60 | 0.64 | (0.17 | ) | — | (1.49 | ) | (1.66 | ) | 7.87 | 4,815 | 7.56 | 0.70 | 1.12 | 0.46 | 36 | ||||||||||||||||||||||||||||||||||||||||||
Year Ended March 31, 2014 | 8.88 | 0.09 | 1.46 | 1.55 | (0.27 | ) | — | (1.27 | ) | (1.54 | ) | 8.89 | 4,752 | 18.11 | 0.70 | 0.95 | 0.95 | 12 | ||||||||||||||||||||||||||||||||||||||||||
Year Ended March 31, 2013 | 8.43 | 0.04 | 0.49 | 0.53 | (0.08 | ) | — | — | (0.08 | ) | 8.88 | 4,110 | 6.30 | 0.63 | 0.90 | 0.51 | 35 | |||||||||||||||||||||||||||||||||||||||||||
Year Ended March 31, 2012 | 8.52 | 0.05 | (0.03 | ) | 0.02 | (0.11 | ) | — | — | (0.11 | ) | 8.43 | 4,982 | 0.42 | 0.50 | 0.75 | 0.61 | 55 | ||||||||||||||||||||||||||||||||||||||||||
See Notes to Financial Highlights and Notes to Financial Statements.
58
Table of Contents
FINANCIAL HIGHLIGHTS
RIDGEWORTH FUNDS Selected Data For a Share of Beneficial Interest Outstanding Throughout the Periods Indicated.
| Net Asset Value, Beginning of Period | Net Investment Income (Loss)(a) | Net Realized and Unrealized Gains (Losses) on Investments | Total from Operations | Dividends from Net Investment Income | Distributions from Tax Return of Capital | Distributions from Realized Capital Gains | Total Dividends and Distributions | Net Asset Value, End of Period | Net Assets End of Period (000) | Total Return(b) | Ratio of Net Expenses to Average Net Assets(c) | Ratio of Expenses to Average Net Assets (Excluding Waivers and Reimbursements)(c) | Ratio of Net Investment Income to Average Net Assets(c) | Portfolio Turnover Rate(d) | ||||||||||||||||||||||||||||||||||||||||||||||
C Shares | ||||||||||||||||||||||||||||||||||||||||||||||||||||||||||||
Year Ended March 31, 2016 | $7.61 | $— | (g) | $(0.38 | ) | $(0.38 | ) | $(0.01 | ) | $— | $(1.55 | ) | $(1.56 | ) | $5.67 | $695 | (5.31 | )% | 1.30 | % | 2.23 | % | (0.01 | )% | 43 | % | ||||||||||||||||||||||||||||||||||
Year Ended March 31, 2015 | 8.66 | (0.01 | ) | 0.58 | 0.57 | (0.13 | ) | — | (1.49 | ) | (1.62 | ) | 7.61 | 694 | 6.89 | 1.30 | 1.73 | (0.16 | ) | 36 | ||||||||||||||||||||||||||||||||||||||||
Year Ended March 31, 2014 | 8.69 | 0.03 | 1.44 | 1.47 | (0.23 | ) | — | (1.27 | ) | (1.50 | ) | 8.66 | 675 | 17.50 | 1.30 | 1.56 | 0.31 | 12 | ||||||||||||||||||||||||||||||||||||||||||
Year Ended March 31, 2013 | 8.28 | (0.01 | ) | 0.46 | 0.45 | (0.04 | ) | — | — | (0.04 | ) | 8.69 | 704 | 5.47 | 1.27 | 1.56 | (0.10 | ) | 35 | |||||||||||||||||||||||||||||||||||||||||
Year Ended March 31, 2012 | 8.39 | (0.01 | ) | (0.02 | ) | (0.03 | ) | (0.08 | ) | — | — | (0.08 | ) | 8.28 | 811 | (0.21 | ) | 1.20 | 1.45 | (0.12 | ) | 55 | ||||||||||||||||||||||||||||||||||||||
Conservative Allocation Strategy(m) | ||||||||||||||||||||||||||||||||||||||||||||||||||||||||||||
I Shares | ||||||||||||||||||||||||||||||||||||||||||||||||||||||||||||
Year Ended March 31, 2016 | 12.76 | 0.20 | (0.42 | ) | (0.22 | ) | (0.22 | ) | — | (0.31 | ) | (0.53 | ) | 12.01 | 31,067 | (1.73 | ) | 0.30 | 0.44 | 1.65 | 40 | |||||||||||||||||||||||||||||||||||||||
Year Ended March 31, 2015 | 12.60 | 0.23 | 0.53 | 0.76 | (0.32 | ) | — | (0.28 | ) | (0.60 | ) | 12.76 | 32,606 | 6.17 | (k) | 0.30 | 0.45 | 1.77 | 17 | |||||||||||||||||||||||||||||||||||||||||
Year Ended March 31, 2014 | 12.54 | 0.24 | 0.68 | 0.92 | (0.34 | ) | — | (0.52 | ) | (0.86 | ) | 12.60 | 28,894 | 7.48 | (k) | 0.30 | 0.38 | 1.88 | 24 | |||||||||||||||||||||||||||||||||||||||||
Year Ended March 31, 2013 | 12.27 | 0.21 | 0.46 | 0.67 | (0.27 | ) | — | (0.13 | ) | (0.40 | ) | 12.54 | 27,387 | 5.55 | 0.27 | 0.39 | 1.72 | 40 | ||||||||||||||||||||||||||||||||||||||||||
Year Ended March 31, 2012 | 12.07 | 0.27 | 0.38 | 0.65 | (0.34 | ) | — | (0.11 | ) | (0.45 | ) | 12.27 | 21,585 | 5.61 | 0.20 | 0.40 | 2.24 | 28 | ||||||||||||||||||||||||||||||||||||||||||
A Shares | ||||||||||||||||||||||||||||||||||||||||||||||||||||||||||||
Year Ended March 31, 2016 | 12.75 | 0.16 | (0.41 | ) | (0.25 | ) | (0.18 | ) | — | (0.31 | ) | (0.49 | ) | 12.01 | 14,462 | (1.98 | ) | 0.60 | 0.67 | 1.33 | 40 | |||||||||||||||||||||||||||||||||||||||
Year Ended March 31, 2015 | 12.59 | 0.19 | 0.53 | 0.72 | (0.28 | ) | — | (0.28 | ) | (0.56 | ) | 12.75 | 15,991 | 5.86 | 0.60 | 0.67 | 1.47 | 17 | ||||||||||||||||||||||||||||||||||||||||||
Year Ended March 31, 2014 | 12.53 | 0.20 | 0.67 | 0.87 | (0.29 | ) | — | (0.52 | ) | (0.81 | ) | 12.59 | 15,271 | 7.14 | 0.60 | 0.66 | 1.57 | 24 | ||||||||||||||||||||||||||||||||||||||||||
Year Ended March 31, 2013 | 12.26 | 0.17 | 0.47 | 0.64 | (0.24 | ) | — | (0.13 | ) | (0.37 | ) | 12.53 | 16,940 | 5.29 | 0.56 | 0.68 | 1.37 | 40 | ||||||||||||||||||||||||||||||||||||||||||
Year Ended March 31, 2012 | 12.06 | 0.22 | 0.39 | 0.61 | (0.30 | ) | — | (0.11 | ) | (0.41 | ) | 12.26 | 24,322 | 5.32 | 0.50 | 0.70 | 1.83 | 28 | ||||||||||||||||||||||||||||||||||||||||||
C Shares | ||||||||||||||||||||||||||||||||||||||||||||||||||||||||||||
Year Ended March 31, 2016 | 12.61 | 0.08 | (0.42 | ) | (0.34 | ) | (0.10 | ) | — | (0.31 | ) | (0.41 | ) | 11.86 | 19,136 | (2.71 | ) | 1.30 | 1.32 | 0.65 | 40 | |||||||||||||||||||||||||||||||||||||||
Year Ended March 31, 2015 | 12.46 | 0.10 | 0.53 | 0.63 | (0.20 | ) | — | (0.28 | ) | (0.48 | ) | 12.61 | 18,201 | 5.11 | (k) | 1.30 | 1.33 | 0.76 | 17 | |||||||||||||||||||||||||||||||||||||||||
Year Ended March 31, 2014 | 12.42 | 0.11 | 0.67 | 0.78 | (0.22 | ) | — | (0.52 | ) | (0.74 | ) | 12.46 | 17,110 | 6.38 | (k) | 1.30 | 1.32 | 0.89 | 24 | |||||||||||||||||||||||||||||||||||||||||
Year Ended March 31, 2013 | 12.18 | 0.09 | 0.47 | 0.56 | (0.19 | ) | — | (0.13 | ) | (0.32 | ) | 12.42 | 15,410 | 4.58 | 1.27 | 1.35 | 0.73 | 40 | ||||||||||||||||||||||||||||||||||||||||||
Year Ended March 31, 2012 | 11.99 | 0.15 | 0.38 | 0.53 | (0.23 | ) | — | (0.11 | ) | (0.34 | ) | 12.18 | 12,447 | 4.56 | 1.20 | 1.40 | 1.27 | 28 | ||||||||||||||||||||||||||||||||||||||||||
Growth Allocation Strategy(m) |
| |||||||||||||||||||||||||||||||||||||||||||||||||||||||||||
I Shares | ||||||||||||||||||||||||||||||||||||||||||||||||||||||||||||
Year Ended March 31, 2016 | 11.46 | 0.10 | (0.52 | ) | (0.42 | ) | (0.12 | ) | — | (0.79 | ) | (0.91 | ) | 10.13 | 38,194 | (3.74 | ) | 0.50 | 0.70 | 0.91 | 29 | |||||||||||||||||||||||||||||||||||||||
Year Ended March 31, 2015 | 11.38 | 0.09 | 0.75 | 0.84 | (0.24 | ) | — | (0.52 | ) | (0.76 | ) | 11.46 | 53,293 | 7.54 | 0.50 | 0.69 | 0.78 | 23 | ||||||||||||||||||||||||||||||||||||||||||
Year Ended March 31, 2014 | 11.28 | 0.14 | 1.61 | 1.75 | (0.35 | ) | — | (1.30 | ) | (1.65 | ) | 11.38 | 53,043 | 15.96 | 0.50 | 0.67 | 1.16 | 14 | ||||||||||||||||||||||||||||||||||||||||||
Year Ended March 31, 2013 | 10.64 | 0.11 | 0.68 | 0.79 | (0.15 | ) | — | — | (0.15 | ) | 11.28 | 55,222 | 7.52 | 0.40 | 0.55 | 1.04 | 20 | |||||||||||||||||||||||||||||||||||||||||||
Year Ended March 31, 2012 | 10.56 | 0.15 | 0.15 | 0.30 | (0.22 | ) | — | — | (0.22 | ) | 10.64 | 57,078 | 3.06 | 0.20 | 0.26 | 1.53 | 49 | |||||||||||||||||||||||||||||||||||||||||||
A Shares | ||||||||||||||||||||||||||||||||||||||||||||||||||||||||||||
Year Ended March 31, 2016 | 11.41 | 0.08 | (0.53 | ) | (0.45 | ) | (0.10 | ) | — | (0.79 | ) | (0.89 | ) | 10.07 | 7,255 | (4.02 | ) | 0.67 | 0.67 | 0.74 | 29 | |||||||||||||||||||||||||||||||||||||||
Year Ended March 31, 2015 | 11.33 | 0.07 | 0.75 | 0.82 | (0.22 | ) | — | (0.52 | ) | (0.74 | ) | 11.41 | 8,801 | 7.38 | 0.68 | 0.68 | 0.63 | 23 | ||||||||||||||||||||||||||||||||||||||||||
Year Ended March 31, 2014 | 11.23 | 0.12 | 1.61 | 1.73 | (0.33 | ) | — | (1.30 | ) | (1.63 | ) | 11.33 | 9,609 | 15.84 | 0.67 | 0.67 | 1.06 | 14 | ||||||||||||||||||||||||||||||||||||||||||
Year Ended March 31, 2013 | 10.61 | 0.09 | 0.66 | 0.75 | (0.13 | ) | — | — | (0.13 | ) | 11.23 | 8,975 | 7.16 | 0.61 | 0.64 | 0.84 | 20 | |||||||||||||||||||||||||||||||||||||||||||
Year Ended March 31, 2012 | 10.53 | 0.12 | 0.15 | 0.27 | (0.19 | ) | — | — | (0.19 | ) | 10.61 | 11,092 | 2.76 | 0.50 | 0.56 | 1.22 | 49 | |||||||||||||||||||||||||||||||||||||||||||
C Shares | ||||||||||||||||||||||||||||||||||||||||||||||||||||||||||||
Year Ended March 31, 2016 | 11.18 | 0.01 | (0.52 | ) | (0.51 | ) | (0.04 | ) | — | (0.79 | ) | (0.83 | ) | 9.84 | 2,613 | (4.60 | ) | 1.30 | 1.31 | 0.08 | 29 | |||||||||||||||||||||||||||||||||||||||
Year Ended March 31, 2015 | 11.13 | — | (g) | 0.73 | 0.73 | (0.16 | ) | — | (0.52 | ) | (0.68 | ) | 11.18 | 3,192 | 6.70 | 1.30 | 1.30 | — | (g) | 23 | ||||||||||||||||||||||||||||||||||||||||
Year Ended March 31, 2014 | 11.08 | 0.06 | 1.56 | 1.62 | (0.27 | ) | — | (1.30 | ) | (1.57 | ) | 11.13 | 2,989 | 15.05 | 1.28 | 1.28 | 0.49 | 14 | ||||||||||||||||||||||||||||||||||||||||||
Year Ended March 31, 2013 | 10.48 | 0.02 | 0.66 | 0.68 | (0.08 | ) | — | — | (0.08 | ) | 11.08 | 2,602 | 6.55 | 1.25 | 1.28 | 0.22 | 20 | |||||||||||||||||||||||||||||||||||||||||||
Year Ended March 31, 2012 | 10.41 | 0.05 | 0.15 | 0.20 | (0.13 | ) | — | — | (0.13 | ) | 10.48 | 2,793 | 2.03 | 1.20 | 1.26 | 0.50 | 49 | |||||||||||||||||||||||||||||||||||||||||||
See Notes to Financial Highlights and Notes to Financial Statements.
59
Table of Contents
FINANCIAL HIGHLIGHTS
RIDGEWORTH FUNDS Selected Data For a Share of Beneficial Interest Outstanding Throughout the Periods Indicated.
| Net Asset Value, Beginning of Period | Net Investment Income (Loss)(a) | Net Realized and Unrealized Gains (Losses) on Investments | Total from Operations | Dividends from Net Investment Income | Distributions from Tax Return of Capital | Distributions from Realized Capital Gains | Total Dividends and Distributions | Net Asset Value, End of Period | Net Assets End of Period (000) | Total Return(b) | Ratio of Net Expenses to Average Net Assets(c) | Ratio of Expenses to Average Net Assets (Excluding Waivers and Reimbursements)(c) | Ratio of Net Investment Income to Average Net Assets(c) | Portfolio Turnover Rate(d) | ||||||||||||||||||||||||||||||||||||||||||||||
Moderate Allocation Strategy(m) | ||||||||||||||||||||||||||||||||||||||||||||||||||||||||||||
I Shares | ||||||||||||||||||||||||||||||||||||||||||||||||||||||||||||
Year Ended March 31, 2016 | $11.07 | $0.11 | $(0.43) | $(0.32 | ) | $(0.18 | ) | $— | $(1.52 | ) | $(1.70 | ) | $9.05 | $45,980 | (2.96 | )% | 0.50 | % | 0.57 | % | 1.08 | % | 26 | % | ||||||||||||||||||||||||||||||||||||
Year Ended March 31, 2015 | 11.18 | 0.13 | 0.61 | 0.74 | (0.26 | ) | — | (0.59 | ) | (0.85 | ) | 11.07 | 94,978 | 6.77 | 0.50 | 0.52 | 1.18 | 18 | ||||||||||||||||||||||||||||||||||||||||||
Year Ended March 31, 2014 | 11.11 | 0.16 | 1.09 | 1.25 | (0.31 | ) | — | (0.87 | ) | (1.18 | ) | 11.18 | 109,457 | 11.56 | 0.50 | 0.54 | 1.44 | 18 | ||||||||||||||||||||||||||||||||||||||||||
Year Ended March 31, 2013 | 10.77 | 0.15 | 0.54 | 0.69 | (0.18 | ) | — | (0.17 | ) | (0.35 | ) | 11.11 | 139,912 | 6.60 | 0.40 | 0.43 | 1.37 | 29 | ||||||||||||||||||||||||||||||||||||||||||
Year Ended March 31, 2012 | 10.60 | 0.20 | 0.27 | 0.47 | (0.28 | ) | — | (0.02 | ) | (0.30 | ) | 10.77 | 133,382 | 4.63 | 0.20 | 0.22 | 1.96 | 38 | ||||||||||||||||||||||||||||||||||||||||||
A Shares | ||||||||||||||||||||||||||||||||||||||||||||||||||||||||||||
Year Ended March 31, 2016 | 11.04 | 0.11 | (0.45 | ) | (0.34 | ) | (0.17 | ) | — | (1.52 | ) | (1.69 | ) | 9.01 | 11,972 | (3.13 | ) | 0.68 | 0.68 | 1.05 | 26 | |||||||||||||||||||||||||||||||||||||||
Year Ended March 31, 2015 | 11.15 | 0.11 | 0.62 | 0.73 | (0.25 | ) | — | (0.59 | ) | (0.84 | ) | 11.04 | 17,295 | 6.65 | 0.67 | 0.67 | 1.00 | 18 | ||||||||||||||||||||||||||||||||||||||||||
Year Ended March 31, 2014 | 11.08 | 0.15 | 1.09 | 1.24 | (0.30 | ) | — | (0.87 | ) | (1.17 | ) | 11.15 | 20,171 | 11.48 | 0.62 | 0.62 | 1.32 | 18 | ||||||||||||||||||||||||||||||||||||||||||
Year Ended March 31, 2013 | 10.75 | 0.13 | 0.54 | 0.67 | (0.17 | ) | — | (0.17 | ) | (0.34 | ) | 11.08 | 19,622 | 6.36 | 0.58 | 0.59 | 1.19 | 29 | ||||||||||||||||||||||||||||||||||||||||||
Year Ended March 31, 2012 | 10.58 | 0.18 | 0.26 | 0.44 | (0.25 | ) | — | (0.02 | ) | (0.27 | ) | 10.75 | 20,366 | 4.33 | 0.50 | 0.52 | 1.70 | 38 | ||||||||||||||||||||||||||||||||||||||||||
C Shares | ||||||||||||||||||||||||||||||||||||||||||||||||||||||||||||
Year Ended March 31, 2016 | 10.95 | 0.05 | (0.44 | ) | (0.39 | ) | (0.11 | ) | — | (1.52 | ) | (1.63 | ) | 8.93 | 11,279 | (3.65 | ) | 1.26 | 1.26 | 0.45 | 26 | |||||||||||||||||||||||||||||||||||||||
Year Ended March 31, 2015 | 11.06 | 0.05 | 0.61 | 0.66 | (0.18 | ) | — | (0.59 | ) | (0.77 | ) | 10.95 | 13,553 | 6.07 | 1.23 | 1.23 | 0.47 | 18 | ||||||||||||||||||||||||||||||||||||||||||
Year Ended March 31, 2014 | 11.00 | 0.08 | 1.08 | 1.16 | (0.23 | ) | — | (0.87 | ) | (1.10 | ) | 11.06 | 14,591 | 10.81 | 1.21 | 1.21 | 0.73 | 18 | ||||||||||||||||||||||||||||||||||||||||||
Year Ended March 31, 2013 | 10.69 | 0.06 | 0.54 | 0.60 | (0.12 | ) | — | (0.17 | ) | (0.29 | ) | 11.00 | 14,106 | 5.69 | 1.20 | 1.21 | 0.56 | 29 | ||||||||||||||||||||||||||||||||||||||||||
Year Ended March 31, 2012 | 10.52 | 0.10 | 0.27 | 0.37 | (0.18 | ) | — | (0.02 | ) | (0.20 | ) | 10.69 | 15,028 | 3.60 | 1.20 | 1.22 | 0.95 | 38 | ||||||||||||||||||||||||||||||||||||||||||
See Notes to Financial Highlights and Notes to Financial Statements.
60
Table of Contents
NOTES TO FINANCIAL HIGHLIGHTS
| (a) | Per share data calculated using average shares outstanding method. |
| (b) | Total return excludes sales charge. Not annualized for periods less than one year. |
| (c) | Annualized for periods less than one year. |
| (d) | Not annualized for periods less than one year. |
| (e) | The Fund had a fiscal year end change from November 30 to March 31 and adopted the historical performance of its corresponding Predecessor Fund. The returns may differ from the management’s discussion of Fund performance due to the historical performance of the Predecessor Fund (See Note 8). |
| (f) | The Fund commenced operations on September 28, 2012. |
| (g) | Rounds to less than $0.005 per share |
| (h) | The amount shown for the net investment income ratio does not represent the actual prorata amount allocated to the share class due to large redemptions during the year. |
| (i) | IS Shares commenced operations on September 1, 2015. |
| (j) | IS Shares commenced operations on August 1, 2014. |
| (k) | Generally accepted accounting principles require adjustments to be made to the net assets of the Fund at period end for financial reporting purposes, and as such, the net asset values for shareholder transactions and the returns based on those net asset values may differ from the net asset values and returns reported in the management’s discussion of Fund performance. |
| (l) | Realized and unrealized gain (loss) per share does not correlate to the aggregate of the net realized and unrealized gain (loss) in the Statements of Operations for the year ended March 31, 2012, primarily due to the timing of the sales and repurchases of the Fund’s shares in relation to fluctuating market values for the Fund’s portfolio. |
| (m) | The Fund and its shareholders indirectly bear a pro rata share of the acquired fund fees and expenses incurred by the underlying investment companies in which the Fund is invested. The expense ratios do not include such acquired fund fees and expenses. |
61
Table of Contents
RIDGEWORTH FUNDS March 31, 2016
| 1. | Organization |
RidgeWorth Funds (the “Trust”) is organized as a Massachusetts business trust and is registered under the Investment Company Act of 1940, as amended (the “1940 Act”), as an open-end management investment company. The Trust is authorized to issue an unlimited number of shares without par value. The financial statements presented herein are those of the Aggressive Growth Stock Fund, Capital Innovations Global Resources and Infrastructure Fund, International Equity Fund, Large Cap Growth Stock Fund, Large Cap Value Equity Fund, Mid-Cap Value Equity Fund, Small Cap Growth Stock Fund, Small Cap Value Equity Fund, Aggressive Growth Allocation Strategy, Conservative Allocation Strategy, Growth Allocation Strategy and Moderate Allocation Strategy (each, a “Fund” and collectively, the “Funds”), which are each a diversified series of the Trust. Effective the close of business on February 19, 2016, Capital Innovations Global Resources and Infrastructure Fund, a new series of the Trust, acquired the assets and assumed the liabilities of the Capital Innovations Global Agri, Timber, Infrastructure Fund (“Predecessor Fund”), a series of Investment Managers Series Trust, in a tax-free reorganization.
The Aggressive Growth Stock Fund offers I Shares and A Shares. The International Equity Fund offers I Shares, A Shares and IS Shares. The Capital Innovations Global Resources and Infrastructure Fund, Small Cap Value Equity Fund, Aggressive Growth Allocation Strategy, Conservative Allocation Strategy, Growth Allocation Strategy and Moderate Allocation Strategy offer I Shares, A Shares and C Shares. The Large Cap Growth Stock Fund, Large Cap Value Equity Fund, Mid-Cap Value Equity Fund and Small Cap Growth Stock Fund offer I Shares, A Shares, C Shares and IS Shares.
The assets of each Fund are segregated and a shareholder’s interest is limited to the Fund in which shares are held. Each class of shares has identical rights and privileges except with respect to fees paid under the Distribution and Service Plan and the Shareholder Servicing Plan (“Plan”), voting rights on matters affecting a single class of shares and sales charges. The A Shares of the Funds (except Conservative Allocation Strategy) have a maximum sales charge on purchases of 5.75% as a percentage of original purchase price. Conservative Allocation Strategy A Shares have a maximum sales charge on purchases of 4.75% as a percentage of original purchase price. Certain purchases of A Shares will not be subject to a front-end sales charge but will be subject to a contingent deferred sales charge (“CDSC”) of 0.75%, if redeemed within two years of purchase. The deferred sales charge may be waived from time to time for certain broker-dealers that waive payment of compensation to them. The C Shares have a maximum CDSC of 1.00% as a percentage of either the original purchase price or the next calculated price after the Funds receive a redemption request, whichever is less, if shares are redeemed within one year of purchase. There is no sales charge on purchases of I Shares or IS Shares.
The Trust’s officers and trustees are indemnified against certain liabilities arising out of the performance of their duties to the Trust. In addition, in the normal course of business, the Trust enters into contracts with its vendors and others that provide for general indemnifications. The Trust’s maximum exposure under these arrangements is unknown as this would involve future claims that may be made against the Trust. However, based on experience, the Trust expects that risk of loss to be remote.
The Funds are each an investment company and accordingly follow the investment company accounting and reporting guidance of the Financial Accounting Standards Board Codification Topic 946 Financial Services – Investment Companies.
| 2. | Significant Accounting Policies |
The following are significant accounting policies consistently followed by the Funds which are in conformity with accounting principles generally accepted in the U.S. (“GAAP”). Estimates and assumptions are required to be made regarding assets, liabilities and changes in net assets resulting from operations when financial statements are prepared. Changes in the economic environment, financial markets and any other parameters used in determining these estimates could cause actual results to differ.
(a) Investment Valuation — Equity securities for which market quotations are available are valued at the last reported sales price or official closing price on the primary market or exchange on which they trade. The prices are provided by independent pricing vendors approved by the Board of Trustees of the Trust (the “Board”).
The Funds, in accordance with GAAP, have adopted Financial Accounting Standards Board Codification Topic 820 (“ASC Topic 820”). ASC Topic 820 establishes a single definition of fair value, creates a three-tier hierarchy as a
62
Table of Contents
NOTES TO FINANCIAL STATEMENTS (continued)
RIDGEWORTH FUNDS March 31, 2016
framework for measuring fair value based on inputs used to value the Funds’ investments, and requires additional disclosure about fair value. The hierarchy of inputs is summarized below:
| • | Level 1 — Investments whose values are based on quoted market prices in active markets, and whose values are therefore classified as Level 1 prices, include active listed equities. Investments in underlying funds are valued at their Net Asset Value (“NAV”) daily and are classified as Level 1 prices. |
| • | Level 2 — Investments that trade in markets that are not considered to be active, but whose values are based on quoted market prices, dealer quotations or valuations provided by alternative pricing sources supported by observable inputs are classified as Level 2 prices. These generally include less liquid equities and certain equity securities listed or traded on foreign security exchanges which include a fair valuation adjustment factor applied to their equity prices as of the end of the period. |
| • | Level 3 — Investments whose values are classified as Level 3 prices have significant unobservable inputs, as they may trade infrequently or not at all. When observable prices are not available for these securities, the Funds use one or more valuation techniques for which sufficient and reliable data is available. The inputs used by the Funds in estimating the value of Level 3 prices may include the original transaction price, quoted prices for similar securities or assets in active markets, completed or pending third-party transactions in the underlying investment or comparable issuers, and changes in financial ratios or cash flows. Level 3 prices may also be adjusted to reflect illiquidity and/or non transferability, with the amount of such discount estimated by the Funds in the absence of market information. Assumptions used by the Funds due to the lack of observable inputs may significantly impact the resulting fair value and therefore the Funds’ results of operations. |
The inputs or methodology used for valuing securities are not necessarily an indication of the risk associated with investing in those securities.
The Funds use valuation techniques to measure fair value that are consistent with the market approach and/or income approach, depending on the type of security and the particular circumstance. The market approach uses prices and other relevant information generated by market transactions involving identical or comparable securities. The income approach uses valuation techniques to discount estimated future cash flows to present value. Exchange Traded Funds are traded on a securities exchange. The market prices of index-based investments will fluctuate in accordance with changes in the underlying portfolio securities of the investment company and also due to supply and demand of the investment company’s shares on the exchange upon which the shares are traded.
When reliable prices are not readily available, such as when the value of a security has been significantly affected by events after the close of the exchange or market on which the security is principally traded, but before each Fund calculates its NAV, each of the Funds will value the security as determined in accordance with the Pricing and Valuation Procedures approved by the Board. The Pricing and Valuation Procedures are performed and monitored by a Valuation Committee (the “Committee”) designated by the Board. Some of the more common reasons which may necessitate that a security be fair valued in accordance with the Pricing and Valuation Procedures include, but are not limited to: the security’s trading has been halted or suspended; the security has been de-listed from a national exchange; the security’s primary trading market is temporarily closed at a time when, under normal conditions, it would be open; or the security’s primary pricing source is not able or willing to provide a price. When a security is fair valued in accordance with the Pricing and Valuation Procedures, the Committee determines the value after taking into consideration relevant information reasonably available to the Committee. Under the Pricing and Valuation Procedures, such securities may be considered Level 2 or Level 3 in the fair value hierarchy. Short-term obligations with maturities of 60 days or less are valued at amortized cost, which approximates fair value, and such securities are considered Level 2 in the fair value hierarchy. Certain Funds hold securities or other assets that are denominated in a foreign currency. The Funds will normally use the currency exchange rates as of 4:00 p.m. (Eastern Time) when valuing such assets.
The assets of Aggressive Growth Allocation Strategy, Conservative Allocation Strategy, Growth Allocation Strategy and Moderate Allocation Strategy (the “Allocation Strategies”) consist of investments in other funds including affiliated Funds (See Note 7), which are valued at their respective daily net asset values. Recognition of net investment income by the Allocation Strategies is affected by the timing of the declaration of dividends by the other funds in which the Allocation Strategies invest. Also, in addition to the Allocation Strategies’ direct expenses, shareholders bear a proportionate share of the underlying funds’ expenses. Each underlying fund’s accounting policies and investment holdings are outlined in the underlying funds’ financial statements and are available upon request.
63
Table of Contents
NOTES TO FINANCIAL STATEMENTS (continued)
RIDGEWORTH FUNDS March 31, 2016
The following is a summary of the inputs used in valuing the Funds’ assets and liabilities carried at fair value as of March 31, 2016:
| Level 1 - Quoted Prices | Level 2 - Other Significant Observable Inputs | Level 3 - Significant Unobservable Inputs | Total | |||||||||||||
Aggressive Growth Stock Fund | ||||||||||||||||
Assets | ||||||||||||||||
Common Stocks1 | $26,228,878 | $— | $— | $26,228,878 | ||||||||||||
|
|
|
|
|
|
|
| |||||||||
Total Investments | 26,228,878 | — | — | 26,228,878 | ||||||||||||
|
|
|
|
|
|
|
| |||||||||
Capital Innovations Global Resources and Infrastructure Fund | ||||||||||||||||
Assets | ||||||||||||||||
Common Stocks1 | 3,185,243 | — | — | 3,185,243 | ||||||||||||
Rights | 2,730 | — | — | 2,730 | ||||||||||||
Money Market Fund | 198,321 | — | — | 198,321 | ||||||||||||
|
|
|
|
|
|
|
| |||||||||
Total Investments | 3,386,294 | — | — | 3,386,294 | ||||||||||||
|
|
|
|
|
|
|
| |||||||||
International Equity Fund | ||||||||||||||||
Assets | ||||||||||||||||
Common Stocks | ||||||||||||||||
Australia | 1,240,331 | — | — | 1,240,331 | ||||||||||||
Bermuda | 802,151 | — | — | 802,151 | ||||||||||||
Canada | 2,411,517 | — | — | 2,411,517 | ||||||||||||
China | 2,554,738 | 85,065 | — | 2,639,803 | ||||||||||||
Denmark | 5,402,524 | — | — | 5,402,524 | ||||||||||||
France | 1,028,380 | — | — | 1,028,380 | ||||||||||||
India | 1,112,483 | — | — | 1,112,483 | ||||||||||||
Ireland | 3,228,552 | — | — | 3,228,552 | ||||||||||||
Japan | 2,645,724 | — | — | 2,645,724 | ||||||||||||
Mexico | 651,715 | — | — | 651,715 | ||||||||||||
Netherlands | 2,873,454 | — | — | 2,873,454 | ||||||||||||
South Africa | 483,813 | — | — | 483,813 | ||||||||||||
Spain | 578,474 | — | — | 578,474 | ||||||||||||
Switzerland | 4,842,586 | — | — | 4,842,586 | ||||||||||||
Taiwan | 2,272,588 | — | — | 2,272,588 | ||||||||||||
United Kingdom | 3,805,120 | — | — | 3,805,120 | ||||||||||||
|
|
|
|
|
|
|
| |||||||||
Total Common Stocks | 35,934,150 | 85,065 | — | 36,019,215 | ||||||||||||
|
|
|
|
|
|
|
| |||||||||
Money Market Funds | 5,435,342 | — | — | 5,435,342 | ||||||||||||
|
|
|
|
|
|
|
| |||||||||
Total Investments | 41,369,492 | 85,065 | — | 41,454,557 | ||||||||||||
|
|
|
|
|
|
|
| |||||||||
Large Cap Growth Stock Fund | ||||||||||||||||
Assets | ||||||||||||||||
Common Stocks1 | 249,566,574 | — | — | 249,566,574 | ||||||||||||
Money Market Funds | 3,084,442 | — | — | 3,084,442 | ||||||||||||
|
|
|
|
|
|
|
| |||||||||
Total Investments | 252,651,016 | — | — | 252,651,016 | ||||||||||||
|
|
|
|
|
|
|
| |||||||||
Large Cap Value Equity Fund | ||||||||||||||||
Assets | ||||||||||||||||
Common Stocks1 | 2,008,860,428 | — | — | 2,008,860,428 | ||||||||||||
Money Market Fund | 95,041,854 | — | — | 95,041,854 | ||||||||||||
|
|
|
|
|
|
|
| |||||||||
Total Investments | 2,103,902,282 | — | — | 2,103,902,282 | ||||||||||||
|
|
|
|
|
|
|
| |||||||||
Mid-Cap Value Equity Fund | ||||||||||||||||
Assets | ||||||||||||||||
Common Stocks1 | 3,272,949,554 | — | — | 3,272,949,554 | ||||||||||||
Money Market Funds | 248,578,348 | — | — | 248,578,348 | ||||||||||||
|
|
|
|
|
|
|
| |||||||||
Total Investments | 3,521,527,902 | — | — | 3,521,527,902 | ||||||||||||
|
|
|
|
|
|
|
| |||||||||
64
Table of Contents
NOTES TO FINANCIAL STATEMENTS (continued)
RIDGEWORTH FUNDS March 31, 2016
| Level 1 - Quoted Prices | Level 2 - Other Significant Observable Inputs | Level 3 - Significant Unobservable Inputs | Total | |||||||||||||
Small Cap Growth Stock Fund | ||||||||||||||||
Assets | ||||||||||||||||
Common Stocks1 | $51,106,876 | $— | $— | $51,106,876 | ||||||||||||
Money Market Funds | 8,577,881 | — | — | 8,577,881 | ||||||||||||
|
|
|
|
|
|
|
| |||||||||
Total Investments | 59,684,757 | — | — | 59,684,757 | ||||||||||||
|
|
|
|
|
|
|
| |||||||||
Small Cap Value Equity Fund | ||||||||||||||||
Assets | ||||||||||||||||
Common Stocks1 | 958,510,344 | — | — | 958,510,344 | ||||||||||||
|
|
|
|
|
|
|
| |||||||||
Total Investments | 958,510,344 | — | — | 958,510,344 | ||||||||||||
|
|
|
|
|
|
|
| |||||||||
Aggressive Growth Allocation Strategy2 | ||||||||||||||||
Assets | ||||||||||||||||
Equity Funds | 4,792,804 | — | — | 4,792,804 | ||||||||||||
Fixed Income Funds | 513,448 | — | — | 513,448 | ||||||||||||
Exchange Traded Funds | 1,587,648 | — | — | 1,587,648 | ||||||||||||
Money Market Fund | 271,087 | — | — | 271,087 | ||||||||||||
|
|
|
|
|
|
|
| |||||||||
Total Investments | 7,164,987 | — | — | 7,164,987 | ||||||||||||
|
|
|
|
|
|
|
| |||||||||
Conservative Allocation Strategy2 | ||||||||||||||||
Assets | ||||||||||||||||
Equity Funds | 17,420,448 | — | — | 17,420,448 | ||||||||||||
Fixed Income Funds | 23,068,509 | — | — | 23,068,509 | ||||||||||||
Exchange Traded Funds | 22,602,808 | — | — | 22,602,808 | ||||||||||||
Money Market Fund | 1,686,970 | — | — | 1,686,970 | ||||||||||||
|
|
|
|
|
|
|
| |||||||||
Total Investments | 64,778,735 | — | — | 64,778,735 | ||||||||||||
|
|
|
|
|
|
|
| |||||||||
Growth Allocation Strategy2 | ||||||||||||||||
Assets | ||||||||||||||||
Equity Funds | 29,307,680 | — | — | 29,307,680 | ||||||||||||
Fixed Income Funds | 6,186,056 | — | — | 6,186,056 | ||||||||||||
Exchange Traded Funds | 10,937,084 | — | — | 10,937,084 | ||||||||||||
Money Market Fund | 1,646,538 | — | — | 1,646,538 | ||||||||||||
|
|
|
|
|
|
|
| |||||||||
Total Investments | 48,077,358 | — | — | 48,077,358 | ||||||||||||
|
|
|
|
|
|
|
| |||||||||
Moderate Allocation Strategy2 | ||||||||||||||||
Assets | ||||||||||||||||
Equity Funds | 29,923,823 | — | — | 29,923,823 | ||||||||||||
Fixed Income Funds | 16,649,112 | — | — | 16,649,112 | ||||||||||||
Exchange Traded Funds | 19,761,839 | — | — | 19,761,839 | ||||||||||||
Money Market Fund | 2,950,327 | — | — | 2,950,327 | ||||||||||||
|
|
|
|
|
|
|
| |||||||||
Total Investments | 69,285,101 | — | — | 69,285,101 | ||||||||||||
|
|
|
|
|
|
|
| |||||||||
| 1 | Please see the Schedule of Portfolio Investments for Sector or Country Classification. |
| 2 | For additional information regarding the investments of the underlying RidgeWorth Funds, please call 1-888-784-3863 or visit www.ridgeworthfunds.com. |
The Funds’ policy is to disclose transfers between levels based on valuations at the end of the reporting period. Each portfolio may hold securities which are periodically fair valued in accordance with the Pricing and Valuation Procedures. This may result in movements between Level 1 and Level 2 throughout the fiscal year. As of March 31, 2016, securities valued at $16,554,943 were transferred from Level 2 to Level 1 pursuant to the Pricing and Valuation Procedures for International Equity Fund. The transfers were a result of certain foreign equity securities including a fair valuation adjustment factor no longer being applied to their equity prices as of March 31, 2016.
(b) Security Transactions and Investment Income — Security transactions are accounted for on a trade date basis. Domestic and foreign dividend income is recorded on the ex-dividend date or as soon as practicable after the Funds determine the existence of a dividend declaration after exercising reasonable due diligence. The cost of
65
Table of Contents
NOTES TO FINANCIAL STATEMENTS (continued)
RIDGEWORTH FUNDS March 31, 2016
investments sold is determined by use of the specific identification method. Distributions from gains from underlying funds, if any, are recorded as realized gains on the ex-dividend date.
(c) Distributions to Shareholders — Distributions from net investment income of each of the Funds are declared and paid annually to shareholders of record. Distributions of net realized capital gains, if any, are declared at least annually. Distributions to shareholders from each of the Funds are recorded on the ex-dividend date and are determined in accordance with income tax regulations, which may differ from GAAP.
(d) Distributions from Underlying Funds — Distributions received from underlying funds, whether in the form of cash or securities, are applied as a reduction of the investment’s cost when identified by the underlying fund as a return of capital. Once the investment’s cost is received, any further distributions are recognized as realized gains.
(e) Expenses and Share Class Accounting — Expenses that are directly related to a specific Fund are charged to that Fund. Other operating expenses of the Trust are allocated pro-rata to the Funds on the basis of relative net assets or another appropriate basis. Investment income, common expenses, and realized/unrealized capital gains (losses) on investments are allocated to the various share classes of the Funds on the basis of relative daily net assets of each share class. Fees relating to a specific share class are charged directly to the share class.
(f) Foreign Currency Translation — Investment securities and other assets and liabilities denominated in foreign currencies are translated into U.S. dollar amounts based upon prevailing exchange rates, as of the close of regular trading on the New York Stock Exchange (usually 4:00 p.m. Eastern Time), on the date of valuation. Purchases and sales of investment securities and income and expense items denominated in foreign currencies are translated into U.S. dollar amounts based upon prevailing exchange rates on the respective dates of such transactions.
The Funds do not isolate that portion of the results of operations resulting from fluctuations in foreign exchange rates on investments from the fluctuations arising from changes in market prices of securities held. Such fluctuations are included with the net realized and unrealized gain or loss on investments and foreign currencies.
Net realized foreign exchange gains or losses arise from sales of foreign currencies, including gains and losses on forward foreign currency contracts, currency gains or losses realized between the trade and settlement dates on securities transactions, and the difference between the amounts of dividends, interest and foreign withholding taxes recorded and the amount actually received.
(g) Securities Lending — Each Fund may lend portfolio securities to brokers, dealers and other financial organizations that meet capital and other credit requirements or other criteria established by the Board. These loans may not exceed either (i) 50% of the sum of the market value of all securities of the Fund and the market value of securities purchased with cash collateral or (ii) 33.33% of the total market value of all securities of the Fund. No Fund will lend portfolio securities to its investment adviser, subadviser, or its affiliates unless it has applied for and received specific authority to do so from the Securities and Exchange Commission. Loans of portfolio securities are required to be fully collateralized by cash, letters of credit or U.S. government securities. The initial value of the collateral must be at least 102% of the market value of the securities loaned, if the securities loaned are U.S. securities (105% for non-U.S. securities); and maintained in an amount equal to at least 100% (103% for non-U.S. securities) thereafter. However, due to market fluctuations during the day, the value of securities loaned on a particular day may exceed the value of collateral. On each business day, the amount of collateral is adjusted based on the prior day’s market fluctuations and the current day’s lending activity. Income from lending activity is determined by the amount of interest earned on collateral, less any amounts payable to the borrowers of the securities and the lending agent. Lending securities involves certain risks; including the risk that a Fund may be delayed or prevented from recovering the collateral if the borrower fails to return the securities. A fee will be obtained from the borrower if letters of credit or U.S. government securities are used as collateral. For International Equity Fund, Large Cap Growth Stock Fund, Mid-Cap Value Equity Fund and Small Cap Growth Stock Fund, all of the securities on loan are classified as Common Stock in each Fund’s Schedule of Investments, and remaining contractual maturity of agreements are classified as overnight and continuous as of March 31, 2016.
The Funds, in accordance with guidance presented, have adopted FASB Accounting Standards Update (‘‘ASU 2014-11”), Balance Sheet (Topic) 860: Repurchase-to-Maturity Transactions, Repurchase Financings, and Disclosures. ASU 2014-11 is intended to provide increased transparency about the types of collateral pledged in repurchase agreements and other similar transactions that are accounted for as secured borrowing.
66
Table of Contents
NOTES TO FINANCIAL STATEMENTS (continued)
RIDGEWORTH FUNDS March 31, 2016
(h) Real Estate Investment Trusts — Certain Funds may own shares of real estate investment trusts (“REITs”) which report information on the source of their distributions annually. The Funds re-characterize distributions received from REIT investments based on information provided by the REITs into the following categories: ordinary income, long-term capital gains, and return of capital. If information is not available on a timely basis from the REITs, the re-characterization will be estimated based on available information which may include the previous year’s allocation. If new or additional information becomes available from the REITs at a later date, a re-characterization will be made in the following year. The Funds record as dividend income the amount re-characterized as ordinary income and as realized gain the amount re-characterized as long-term capital gain in the Statements of Operations, and the amount re-characterized as a return of capital as a reduction to the cost of investments in the Statements of Assets and Liabilities and in the Schedules of Portfolio Investments. These re-characterizations are reflected in the accompanying financial statements.
(i) Restricted Securities — Certain Funds’ investments are restricted as to resale. All of these restricted securities have been deemed liquid by the Funds’ Investment Adviser based upon procedures approved by the Board, unless stated otherwise in the Funds’ Schedules of Portfolio Investments. As of March 31, 2016, the Funds did not have any restricted securities.
(j) Foreign Investment Risks — Certain Funds may invest in securities of foreign issuers in various countries. Investments in securities of foreign issuers carry certain risks not ordinarily associated with investments in securities of U.S. issuers. These risks include future political and economic developments, and the possible imposition of exchange controls or other foreign governmental laws and restrictions. In addition, with respect to certain countries, there is a possibility of expropriation of assets, confiscatory taxation, political or social instability or diplomatic developments, which could adversely affect investments in those countries. Emerging market countries are countries that the World Bank or the United Nations considers to be emerging or developing. Emerging markets may be more likely to experience political turmoil or rapid changes in market or economic conditions than more developed countries. In addition, the financial stability of issuers, including governments, in emerging market countries may be more precarious than in other countries. As a result, there may be an increased risk of price volatility associated with a Fund’s investments in emerging market countries, which may be magnified by currency fluctuations relative to the U.S. dollar. Please refer to each Fund’s prospectus for additional risks that may be associated with the Funds.
For securities subject to foreign withholding tax upon disposition, liabilities are recorded on the Statements of Assets and Liabilities for the estimated tax withholding based on the securities’ current market value. Upon disposition, realized gains or losses on such securities are recorded net of foreign withholding tax.
(k) Federal and Other Taxes — It is the Funds’ policy to comply with the federal income and excise tax requirements of the Internal Revenue Code of 1986 (the “Code”), as amended, applicable to regulated investment companies. Accordingly, the Funds intend to distribute taxable income and net realized gains, if any, to shareholders in accordance with timing requirements imposed by the Code. Therefore, no federal or state income tax provision is required in the Funds’ financial statements.
Management has analyzed the Funds’ tax positions taken on income tax returns for all open tax years and has concluded that as of March 31, 2016, no provision for income tax is required in the Funds’ financial statements. The Funds’ federal and state income and federal excise tax returns for tax years for which the applicable statutes of limitations have not expired are subject to examination by the Internal Revenue Service and state departments of revenue. As of March 31, 2016, open tax years include the tax years of March 31, 2013 through 2016.
Under the applicable foreign tax laws, a withholding tax may be imposed on interest, dividends and capital gains at various rates. The Funds will accrue such taxes and recoveries as applicable, based upon their current interpretation of tax rules and regulations that exist in the markets in which they invest.
(l) Reclassification — GAAP requires that certain components of net assets be reclassified to reflect permanent differences between financial and tax reporting. These reclassifications have no effect on net assets or NAV per share.
(m) Line of Credit —The Funds entered into a committed unsecured revolving line of credit agreement (“LOC”) with a syndicate of banks which includes State Street Bank and Trust (“State Street Bank”) and Royal Bank of Canada (“RBC”), for an aggregate amount of $200,000,000. The proceeds may be used only to (1) temporarily finance the
67
Table of Contents
NOTES TO FINANCIAL STATEMENTS (continued)
RIDGEWORTH FUNDS March 31, 2016
purchase and sale of securities; or (2) finance the redemption of shares of the Funds. The Funds will pay a commitment fee on a pro rata basis to State Street Bank and RBC, in the amount of 0.15% per annum on the daily unused portion of the LOC. Borrowings under the LOC will accrue interest at the higher of (a) the Federal Funds Rate, or (b) the One-month LIBOR Rate, plus 1.25% per annum. Generally, repayments must be made within 60 days of the borrowings. Commitment fees and interest expense paid to State Street Bank and RBC pursuant to this agreement are reflected on the Statements of Operations as a component of Other Fees. Prior to the September 23, 2015 syndicated agreement, a credit agreement with State Street Bank permitted an aggregate amount of $250,000,000 under similar terms and interest rates as described above. As of March 31, 2016, the Aggressive Growth Stock Fund and Small Cap Value Equity Fund had outstanding borrowings under the LOC.
The following Funds had an outstanding loan during the year. The borrowings were valued at cost, which approximates fair value.
Fund | Interest Incurred on Borrowing | Average Dollar Amount of Borrowing | Weighted Average Interest Rate on Borrowing | Days Loan was Open | ||||||||||||
Aggressive Growth Stock Fund | $2,567 | $790,712 | 1.49 | % | 80 | |||||||||||
International Equity Fund | 126 | 539,405 | 1.71 | 5 | ||||||||||||
Large Cap Growth Stock Fund | 202 | 275,259 | 1.49 | 18 | ||||||||||||
Large Cap Value Equity Fund | 318 | 7,967,953 | 1.46 | 1 | ||||||||||||
Small Cap Growth Stock Fund | 482 | 839,079 | 1.50 | 14 | ||||||||||||
Small Cap Value Equity Fund | 6,650 | 1,833,334 | 1.51 | 88 | ||||||||||||
(n) Master Limited Partnership — Certain Funds may invest in domestic master limited partnership (“MLPs”). MLPs are publicly traded companies organized as limited partnerships or limited liability companies and treated as partnerships for federal income tax purposes. An investment in MLP units involves risks in addition to the risks associated with a similar investment in equity securities, such as common stock, of a corporation. As compared to common shareholders of a corporation, holders of MLP units have more limited control and limited rights to vote on matters affecting the partnership. Additional risks inherent to investments in MLP units include cash flow risk, tax risk, risk associated with a potential conflict of interest between unit holders and the MLP’s general partner, and capital markets risk. Moreover, the value of the Fund’s investment in MLPs depends largely on the MLPs being treated as partnerships for U.S. federal income tax purposes. If an MLP does not meet current legal requirements to maintain eligibility for partnership tax treatment, or if it is unable to do so because of tax law changes, it could be taxed as a corporation and there could be a material decrease in the value of its securities. Certain MLP securities may trade in lower volumes due to their smaller capitalizations. Accordingly, those MLPs may be subject to more abrupt or erratic price movements and may lack sufficient market liquidity to enable the Fund to effect sales at an advantageous time or without a substantial drop in price. MLPs are generally considered interest-rate sensitive investments. During periods of interest rate volatility, these investments may not provide attractive returns.
Distributions received from each Fund’s investments in MLPs may be comprised of both income and return of capital. Each Fund records investment income and return of capital based on estimates made at the time such distributions are received. Such estimates are based on historical information available from each MLP and other industry sources. These estimates may subsequently be revised based on information received from MLPs after their tax reporting periods are concluded.
| 3. | Investment Adviser and Other Service Providers |
Investment Adviser — RidgeWorth Investments (“Investment Adviser”) serves as the investment adviser to the Funds. The Trust and the Investment Adviser have entered into an investment advisory agreement (“Advisory Agreement”). The Investment Adviser is a money–management holding company with multiple style-focused investment boutiques which, along with certain unaffiliated advisory firms, serve as subadvisers to the Funds (“Subadvisers”). The Subadvisers for each of the Funds, other than the Allocation Strategies, which are not subadvised, are as follows: Capital Innovations LLC serves as the Subadviser for the Capital Innovations Global Resources and Infrastructure Fund; Ceredex Value Advisors LLC serves as the Subadviser for the Large Cap Value Equity Fund, Mid-Cap Value Equity Fund and Small Cap Value Equity Fund; Certium Asset Management LLC served as the Subadviser for the International Equity Fund through August 31, 2015 and beginning September 1, 2015, WCM Investment Management serves as Subadviser for the International Equity Fund; Silvant Capital Management LLC serves as the Subadviser for the Large Cap Growth
68
Table of Contents
NOTES TO FINANCIAL STATEMENTS (continued)
RIDGEWORTH FUNDS March 31, 2016
Stock Fund and Small Cap Growth Stock Fund; and Zevenbergen Capital Investments LLC serves as the Subadviser for the Aggressive Growth Stock Fund. Zevenbergen Capital Investments LLC is a minority-owned subsidiary of the Investment Adviser. Capital Innovations LLC and WCM Investment Management are not affiliated with the Investment Adviser. Ceredex and Silvant are wholly-owned subsidiaries of the Investment Adviser. The Investment Adviser pays the Subadvisers out of the investment advisory fees it receives from the Funds.
The Predecessor Fund had an Advisory Agreement with Liberty Street Advisors, Inc. (“Liberty Street”). Liberty Street engaged Capital Innovations LLC (the “Sub-Advisor”) to manage the Fund and paid the Sub-Advisor from its advisory fees.
Under the terms of the Advisory Agreement, the Funds are charged annual advisory fees, which are computed daily and paid monthly based upon average daily net assets. Breakpoints are used in computing the overall annual advisory fee. The maximum annual advisory fee is charged on average daily net assets of each Fund up to $500 million. A discount of 5% applies on the next $500 million, a discount of 10% applies on the next $4 billion and a discount of 15% applies on amounts over $5 billion. Fee rates for the period or fiscal year ended March 31, 2016 were as follows:
Fund | Maximum Annual Advisory Fee | Discounted Annual Advisory Fee | Advisory Fees Waived | Net Annual Fees Paid* | ||||||||||||
Aggressive Growth Stock Fund | 0.85 | % | 0.85 | % | — | % | 0.85 | % | ||||||||
Capital Innovations Global Resources and Infrastructure Fund** | 1.00 | 1.00 | (1.00 | ) | — | |||||||||||
International Equity Fund*** | 0.85 | 0.85 | (0.27 | ) | 0.58 | |||||||||||
Large Cap Growth Stock Fund | 0.70 | 0.70 | (0.01 | ) | 0.69 | |||||||||||
Large Cap Value Equity Fund | 0.70 | 0.65 | — | 0.65 | ||||||||||||
Mid-Cap Value Equity Fund | 0.75 | 0.69 | — | 0.69 | ||||||||||||
Small Cap Growth Stock Fund | 0.85 | 0.85 | — | 0.85 | ||||||||||||
Small Cap Value Equity Fund | 0.85 | 0.82 | — | 0.82 | ||||||||||||
Aggressive Growth Allocation Strategy | 0.10 | 0.10 | (0.10 | ) | — | |||||||||||
Conservative Allocation Strategy | 0.10 | 0.10 | (0.02 | ) | 0.08 | |||||||||||
Growth Allocation Strategy | 0.10 | 0.10 | — | 0.10 | ||||||||||||
Moderate Allocation Strategy | 0.10 | 0.10 | — | 0.10 | ||||||||||||
| * | Aggregate annual fees paid to the Investment Adviser, who pays the applicable Subadviser a portion of the fees for its services to the Funds. |
| ** | The Predecessor Fund paid a monthly investment advisory fee to Liberty Street at the annual rate of 1.10% of the Fund’s average daily net assets. |
| *** | Effective September 1, 2015, the International Equity Fund’s investment advisory fee was reduced from 0.90% to 0.85%. The Maximum and Discounted Annual Advisory Fee reflects the reduced annual advisory fee for the period September 1, 2015 through March 31, 2016. For the period ended August 31, 2015, the Maximum and Discounted Annual Advisory Fee would have been 0.90%, respectively. |
Amounts designated as “—” are 0%.
The Investment Adviser and the applicable Subadviser have contractually agreed, until at least August 1, 2016, to waive fees and/or reimburse expenses, at a class level, for each of the following Funds to the extent necessary to maintain each Fund’s total annual fund operating expenses (excluding, as applicable, taxes, brokerage commissions, substitute dividend expenses on securities sold short, interest expense, extraordinary expenses and indirect expenses attributable to the Fund’s investment in other funds), expressed as a percentage of average daily net assets, as noted below:
| Contractual Expense Limitations August 1, 2015 to March 31, 2016* | ||||||||||||||||
Fund | I Shares | A Shares | C Shares | IS Shares | ||||||||||||
Aggressive Growth Stock Fund | 1.30 | % | 1.50 | % | N/A | % | N/A | % | ||||||||
International Equity Fund** | 1.25 | 1.50 | N/A | 1.10 | ||||||||||||
Large Cap Growth Stock Fund** | 0.97 | 1.25 | 1.95 | 0.90 | ||||||||||||
Large Cap Value Equity Fund | 0.97 | 1.27 | 1.97 | 0.85 | ||||||||||||
Mid-Cap Value Equity Fund** | 1.15 | 1.40 | 1.95 | 0.95 | ||||||||||||
Small Cap Growth Stock Fund** | 1.30 | 1.50 | 2.20 | 1.05 | ||||||||||||
Small Cap Value Equity Fund | 1.30 | 1.55 | 2.15 | N/A | ||||||||||||
Aggressive Growth Allocation Strategy | 0.50 | 0.70 | 1.30 | N/A | ||||||||||||
Conservative Allocation Strategy | 0.30 | 0.60 | 1.30 | N/A | ||||||||||||
69
Table of Contents
NOTES TO FINANCIAL STATEMENTS (continued)
RIDGEWORTH FUNDS March 31, 2016
| Contractual Expense Limitations August 1, 2015 to March 31, 2016* | ||||||||||||||||
Fund | I Shares | A Shares | C Shares | IS Shares | ||||||||||||
Growth Allocation Strategy | 0.50 | % | 0.70 | % | 1.30 | % | N/A | % | ||||||||
Moderate Allocation Strategy | 0.50 | 0.70 | 1.30 | N/A | ||||||||||||
| * | These contractual Expense Limitations were in effect for the entire fiscal year except for the Funds listed below. |
| ** | For the period April 1, 2015 to July 31, 2015 (International Equity Fund was April 1, 2015 to August 31, 2015), the Contractual Expense Limitations were as follows: |
Fund | I Shares | A Shares | C Shares | IS Shares | ||||||||||||
International Equity Fund | 1.37 | % | 1.57 | % | N/A | % | N/A | % | ||||||||
Large Cap Growth Stock Fund | 0.97 | 1.25 | 1.95 | 0.85 | ||||||||||||
Mid-Cap Value Equity Fund | 1.15 | 1.40 | 2.00 | 0.95 | ||||||||||||
Small Cap Growth Stock Fund | 1.30 | 1.55 | 2.20 | 1.05 | ||||||||||||
Fund | I Shares | A Shares | C Shares | IS Shares | ||||||||||||
Capital Innovations Global Resources and Infrastructure Fund* | 1.15 | % | 1.40 | % | 2.15 | % | N/A | % | ||||||||
Capital Innovations Global Resources and Infrastructure Fund** | 1.35 | 1.60 | 2.35 | N/A | ||||||||||||
| * | For the period February 20, 2016 to March 31, 2016. |
| ** | For the period December 1, 2014 to February 19, 2016. |
Under the Expense Limitation Agreement, the Investment Adviser may retain the difference between the Contractual Expense Limitations identified above and the actual total expenses to recapture any of its prior contractual waivers or reimbursements at a date not to exceed three years from the date of such waivers or reimbursements. Such repayments shall be made monthly, but only to the extent that such repayments would not cause the annualized total expense ratio to exceed, if lower, the contractual expense limitation in place at the time of the waiver or reimbursement. Under certain circumstances, the Investment Adviser may choose to voluntarily waive fees. In the event that the Investment Adviser voluntarily waives any fees, these waived fees are not subject to recoupment by the Investment Adviser. During the fiscal year ended March 31, 2016, the Investment Adviser did not recapture any of its prior contractual waivers or reimbursements. As of March 31, 2016, the cumulative potential recoupments recoverable pursuant to this agreement are as follows:
| Expires | ||||||||||||
Fund | 2017 | 2018 | 2019 | |||||||||
Aggressive Growth Stock Fund | $21,142 | $10,874 | $17,391 | |||||||||
Capital Innovations Global Resources and Infrastructure Fund* | N/A | N/A | 78,147 | |||||||||
International Equity Fund | 388 | 28,095 | 94,494 | |||||||||
Large Cap Growth Stock Fund | 323,087 | 343,363 | 331,753 | |||||||||
Large Cap Value Equity Fund | 3,069,235 | 2,844,564 | 2,457,755 | |||||||||
Mid-Cap Value Equity Fund | 437,950 | 26,241 | 239,140 | |||||||||
Small Cap Growth Stock Fund | 78,271 | 79,058 | 63,957 | |||||||||
Aggressive Growth Allocation Strategy | 84,819 | 88,191 | 83,420 | |||||||||
Conservative Allocation Strategy | 37,397 | 62,624 | 57,158 | |||||||||
Growth Allocation Strategy | 90,194 | 100,956 | 92,983 | |||||||||
Moderate Allocation Strategy | 48,002 | 21,110 | 48,623 | |||||||||
| * | For the year ended November 30, 2015, Liberty Street waived all its fees and absorbed other expenses totaling $246,563. Liberty Street was able to recover from the Predecessor Fund fees and/or expenses previously waived and/or absorbed, if the Predecessor Fund’s expense ratio, including the recovered expenses, fell below the expense at which they were waived. Liberty Street was permitted to seek reimbursement from the Predecessor Fund for a period of three fiscal years following the fiscal year in which such reimbursements occurred. The amounts waived on the Predecessor Fund are not eligible for recapture by Liberty Street or the Investment Adviser. |
Fund Accounting, Custody, Administration, and Transfer Agency — State Street Bank and Trust Company (“State Street Bank”) serves as the fund accounting agent and custodian for the Trust pursuant to a Master Custodian Agreement. The custodian is responsible for the safekeeping of the assets of the Funds and the fund accounting agent is responsible for calculating the Funds’ NAVs. State Street Bank, as the Funds’ custodian and fund accounting agent, is paid on the basis of net assets and transaction costs of the Funds. State Street Bank also serves as the administrator for the Trust pursuant to an administration agreement. State Street Bank, as the
70
Table of Contents
NOTES TO FINANCIAL STATEMENTS (continued)
RIDGEWORTH FUNDS March 31, 2016
Funds’ administrator, is paid on the basis of net assets of the Funds which are allocated among the series of the Trust, on the basis of relative net assets. UMB Fund Services, Inc. (“UMBFS”) served as the Predecessor Fund’s fund accountant, transfer agent and co-administrator; and Mutual Fund Administration, LLC (“MFAC”) served as the Fund’s other co-administrator. UMB Bank, n.a., an affiliate of UMBFS, served as the Predecessor Fund’s custodian.
Boston Financial Data Services, Inc. (“BFDS”) serves as the transfer agent to the Trust pursuant to a Transfer Agency and Service Agreement. BFDS is paid on the basis of net assets, per account fees and certain transaction costs.
Custodian Credits — The Funds have an agreement with their custodian under which custody fees may be reduced by balance credits. These credits, if any, are shown as a reduction of custody expenses on the Statements of Operations.
Distribution — The Trust and RidgeWorth Distributors LLC (the “Distributor”) are parties to a Distribution Agreement. Foreside Fund Services, LLC (the “Predecessor Distributor”) served as the Predecessor Fund’s distributor.
In addition, with respect to the A Shares and C Shares, the Distributor receives amounts, pursuant to a Plan, based upon average daily net assets of each respective class, which are computed daily and paid monthly. For the period or fiscal year ended March 31, 2016, the Distributor did not retain any of the front end sales charges assessed on the sale of Class A Shares. For the period or fiscal year ended March 31, 2016, the Distributor did not retain any commissions from contingent deferred sales charges assessed on the redemption of Class C Shares. These fees, expressed as a percentage of average daily net assets, for the period or fiscal year ended March 31, 2016, were as follows:
Fund | A Share Distribution and Service Fee | C Share Distribution and Service Fee | ||||||
Aggressive Growth Stock Fund | 0.30 | % | N/A | % | ||||
Capital Innovations Global Resources and Infrastructure Fund* | 0.25 | 1.00 | ||||||
International Equity Fund | 0.30 | N/A | ||||||
Large Cap Growth Stock Fund | 0.30 | 1.00 | ||||||
Large Cap Value Equity Fund | 0.30 | 1.00 | ||||||
Mid-Cap Value Equity Fund | 0.30 | 1.00 | ||||||
Small Cap Growth Stock Fund | 0.30 | 1.00 | ||||||
Small Cap Value Equity Fund | 0.30 | 1.00 | ||||||
Aggressive Growth Allocation Strategy | 0.30 | 1.00 | ||||||
Conservative Allocation Strategy | 0.30 | 1.00 | ||||||
Growth Allocation Strategy | 0.30 | 1.00 | ||||||
Moderate Allocation Strategy | 0.30 | 1.00 | ||||||
| * | The Predecessor Fund, had adopted a Distribution Plan pursuant to Rule 12b-1 under the 1940 Act, that allowed the Predecessor Fund to pay distribution fees for the sale and distribution of its shares. With respect to the A Shares and C Shares, the Distribution Plan provided the payment of distribution fees at the annual rate of up to 0.25% and 1.00%, respectively, of average daily net assets, payable to the Predecessor Distributor. For the period from December 1, 2014 to November 31, 2015, $23,651 of net selling commissions and $18 of deferred sales charges from the Predecessor Fund’s Class A and Class C Shares were retained by the Predecessor Distributor, Liberty Street and/or a broker-dealer affiliated with Liberty Street. For the period from December 1, 2015 to February 19, 2016, the Predecessor Distributor, Liberty Street and/or a broker-dealer affiliated with Liberty Street did not retain any commissions from contingent deferred sales charges. |
Shareholder Servicing Fees — The Funds have adopted a shareholder services fee for the I Shares and A Shares. Each of these Funds (or class thereof, as the case may be) may pay a services fee to financial institutions that provide certain services to the Funds. The services under each of these Plans may include, among others, providing general shareholder liaison services (including responding to shareholder inquiries), providing information on shareholder investments, and establishing and maintaining shareholder accounts and records. The Funds may pay a fee under the Plan up to an annual rate of 0.40% (except for Conservative Allocation Strategy which may pay 0.20%) of average daily net assets of a Fund’s I Shares or A Shares.
Compliance & Fund Services Fees — The Investment Adviser provides compliance and certain administrative services to the Trust to ensure compliance with applicable laws and regulations. For the period or fiscal year ended March 31, 2016, the Investment Adviser was paid $1,483,680 for these services. Foreside Fund Officer Services,
71
Table of Contents
NOTES TO FINANCIAL STATEMENTS (continued)
RIDGEWORTH FUNDS March 31, 2016
LLC (‘‘FFOS’’) (formerly Foreside Compliance Services, LLC), an affiliate of the Distributor, provides an Anti-Money Laundering Officer/Identity Theft Prevention Officer (“AML Officer”) to the Trust. Effective October 2015, Foreside Management Services, LLC (“FMS”), an affiliate of the Distributor, provides Principal Financial Officer (“PFO”) support services to the Trust. Fees paid to FFOS and FMS pursuant to these agreements are reflected on the Statements of Operations as a component of the caption “Other Fees”.
Neither FFOS nor any of their officers or employees who serve as an officer of the Trust, have any role in determining the Funds’ investment policies or which securities are to be purchased or sold by the Trust or its Funds. Dziura Compliance Consulting, LLC. provided Chief Compliance Officer services to the Trust of the Predecessor Fund.
Certain officers of the Trust are also officers or employees of the Investment Adviser, FFOS and the administrator. Such officers receive no fees from the Trust for serving as officers of the Trust.
Each of the Trustees receives an annual retainer and an additional fee for each meeting attended, plus reimbursement for certain expenses incurred. Trustees receive an additional fee for committee service, paid on a per committee meeting basis. Information on the aggregate remuneration paid to the Trustees can be found on the Statements of Operations. Certain trustees and officers of the Predecessor Fund are employees of UMBFS or MFAC. The Predecessor Fund did not compensate trustees and officers affiliated with the Predecessor Fund’s co-administrators. For the year November 30, 2015, the Predecessor Fund’s allocated fees incurred to Trustees who are not affiliated with the Fund’s co-administrators are reported on the Statement of Operations.
| 4. | Capital Stock Transactions |
Transactions in capital shares and dollars for the fiscal years or periods ended March 31 were as follows:
| Shares Issued | Shares Issued- Merger | Shares Reinvested | Shares Redeemed | Shares Acquired | Net Increase (Decrease) in Shares Outstanding | Proceeds from Shares Issued | Issued- Merger | Dividends Reinvested | Cost of Shares Redeemed | Dollars Acquired | Change in Net Assets from Capital Transactions | |||||||||||||||||||||||||||||||||||||
Aggressive Growth Stock Fund |
| |||||||||||||||||||||||||||||||||||||||||||||||
I Shares | ||||||||||||||||||||||||||||||||||||||||||||||||
3/31/2016 | 548,154 | — | 53,058 | (780,401 | ) | — | (179,189 | ) | $11,930,895 | $— | $1,137,563 | $(16,749,913 | ) | $— | $(3,681,455 | ) | ||||||||||||||||||||||||||||||||
3/31/2015 | 771,714 | — | 34,372 | (1,537,321 | ) | — | (731,235 | ) | 16,986,444 | — | 705,664 | (32,440,931 | ) | — | (14,748,823 | ) | ||||||||||||||||||||||||||||||||
A Shares | ||||||||||||||||||||||||||||||||||||||||||||||||
3/31/2016 | 491,401 | — | 32,204 | (588,841 | ) | — | (65,236 | ) | 10,889,054 | — | 664,359 | (11,980,061 | ) | — | (426,648 | ) | ||||||||||||||||||||||||||||||||
3/31/2015 | 333,753 | — | 20,893 | (818,818 | ) | — | (464,172 | ) | 7,023,331 | — | 414,515 | (16,744,116 | ) | — | (9,306,270 | ) | ||||||||||||||||||||||||||||||||
Capital Innovations Global Resources and Infrastructure Fund* |
| |||||||||||||||||||||||||||||||||||||||||||||||
I Shares | ||||||||||||||||||||||||||||||||||||||||||||||||
3/31/2016 | 3,035 | — | 5,161 | (128,484 | ) | — | (120,288 | ) | 59,395 | — | 46,705 | (1,183,254 | ) | — | (1,077,154 | ) | ||||||||||||||||||||||||||||||||
11/30/2015 | 151,688 | — | 9,145 | (882,873 | ) | — | (722,040 | ) | 1,779,840 | — | 97,384 | (9,919,217 | ) | — | (8,041,993 | ) | ||||||||||||||||||||||||||||||||
11/30/2014 | 661,436 | — | 6,892 | (82,279 | ) | — | 586,049 | 7,914,456 | — | 82,448 | (971,095 | ) | — | 7,025,809 | ||||||||||||||||||||||||||||||||||
A Shares | ||||||||||||||||||||||||||||||||||||||||||||||||
3/31/2016 | 43,130 | — | 3,308 | (85,449 | ) | — | (39,011 | ) | 370,255 | — | 29,907 | (757,555 | ) | — | (357,393 | ) | ||||||||||||||||||||||||||||||||
11/30/2015 | 21,244 | — | 3,097 | (103,382 | ) | — | (79,041 | ) | 243,958 | — | 31,531 | (1,100,279 | ) | — | (824,790 | ) | ||||||||||||||||||||||||||||||||
11/30/2014 | 282,071 | — | 4,367 | (514,794 | ) | — | (228,356 | ) | 3,305,759 | — | 52,142 | (6,157,386 | ) | — | (2,799,485 | ) | ||||||||||||||||||||||||||||||||
C Shares | ||||||||||||||||||||||||||||||||||||||||||||||||
3/31/2016 | 74 | — | 327 | (8,998 | ) | — | (8,597 | ) | 600 | — | 2,921 | (78,504 | ) | — | (74,983 | ) | ||||||||||||||||||||||||||||||||
11/30/2015 | 383 | — | 254 | (32,148 | ) | — | (31,511 | ) | 4,143 | — | 2,464 | (359,224 | ) | — | (352,617 | ) | ||||||||||||||||||||||||||||||||
11/30/2014 | 1,696 | — | 373 | (10,732 | ) | — | (8,663 | ) | 20,000 | — | 4,381 | (125,852 | ) | — | (101,471 | ) | ||||||||||||||||||||||||||||||||
International Equity Fund |
| |||||||||||||||||||||||||||||||||||||||||||||||
I Shares | ||||||||||||||||||||||||||||||||||||||||||||||||
3/31/2016 | 2,720,094 | — | 102,990 | (1,551,831 | ) | — | 1,271,253 | 25,253,022 | — | 965,887 | (14,988,624 | ) | — | 11,230,285 | ||||||||||||||||||||||||||||||||||
3/31/2015 | 273,200 | — | 219,862 | (834,676 | ) | — | (341,614 | ) | 3,132,311 | — | 2,174,438 | (9,864,306 | ) | — | (4,557,557 | ) | ||||||||||||||||||||||||||||||||
A Shares | ||||||||||||||||||||||||||||||||||||||||||||||||
3/31/2016 | 62,804 | — | 39,888 | (92,288 | ) | — | 10,404 | 607,480 | — | 368,947 | (879,026 | ) | — | 97,401 | ||||||||||||||||||||||||||||||||||
3/31/2015 | 38,135 | — | 50,709 | (79,055 | ) | — | 9,789 | 461,393 | �� | 496,445 | (868,448 | ) | — | 89,390 | ||||||||||||||||||||||||||||||||||
IS Shares** | ||||||||||||||||||||||||||||||||||||||||||||||||
3/31/2016 | 1,003,460 | — | 82,004 | (458,797 | ) | — | 626,667 | 9,776,110 | — | 765,921 | (4,203,512 | ) | — | 6,338,519 | ||||||||||||||||||||||||||||||||||
72
Table of Contents
NOTES TO FINANCIAL STATEMENTS (continued)
RIDGEWORTH FUNDS March 31, 2016
| Shares Issued | Shares Issued- Merger | Shares Reinvested | Shares Redeemed | Shares Acquired | Net Increase (Decrease) in Shares Outstanding | Proceeds from Shares Issued | Issued- Merger | Dividends Reinvested | Cost of Shares Redeemed | Dollars Acquired | Change in Net Assets from Capital Transactions | |||||||||||||||||||||||||||||||||||||
Large Cap Growth Stock Fund |
| |||||||||||||||||||||||||||||||||||||||||||||||
I Shares | ||||||||||||||||||||||||||||||||||||||||||||||||
3/31/2016 | 1,473,996 | — | 900,056 | (2,909,360 | ) | — | (535,308 | ) | $ 14,888,243 | $ — | $ 8,901,552 | $ (28,987,265 | ) | $ — | $ (5,197,470 | ) | ||||||||||||||||||||||||||||||||
3/31/2015 | 1,145,645 | 387,177 | 931,578 | (9,541,432 | ) | — | (7,077,032 | ) | 11,535,979 | 3,780,324 | 8,896,572 | (94,908,639 | ) | — | (70,695,764 | ) | ||||||||||||||||||||||||||||||||
A Shares | ||||||||||||||||||||||||||||||||||||||||||||||||
3/31/2016 | 852,332 | — | 636,361 | (1,077,242 | ) | — | 411,451 | 7,111,443 | — | 5,249,983 | (9,296,236 | ) | — | 3,065,190 | ||||||||||||||||||||||||||||||||||
3/31/2015 | 244,613 | 46,639 | 628,599 | (1,075,575 | ) | — | (155,724 | ) | 2,079,136 | 386,118 | 5,091,651 | (9,305,746 | ) | — | (1,748,841 | ) | ||||||||||||||||||||||||||||||||
C Shares | ||||||||||||||||||||||||||||||||||||||||||||||||
3/31/2016 | 206,005 | — | 923,411 | (1,092,958 | ) | — | 36,458 | 1,295,039 | — | 5,318,850 | (6,604,447 | ) | — | 9,442 | ||||||||||||||||||||||||||||||||||
3/31/2015 | 78,769 | 2,121,925 | 628,491 | (922,698 | ) | — | 1,906,487 | 499,853 | 12,809,849 | 3,714,383 | (5,927,526 | ) | — | 11,096,559 | ||||||||||||||||||||||||||||||||||
IS Shares** | ||||||||||||||||||||||||||||||||||||||||||||||||
3/31/2016 | 221,083 | — | 310,286 | (1,710,804 | ) | — | (1,179,435 | ) | 2,193,018 | — | 3,074,932 | (17,602,568 | ) | — | (12,334,618 | ) | ||||||||||||||||||||||||||||||||
3/31/2015 | 5,498,008 | — | 410,634 | (781,632 | ) | — | 5,127,010 | 54,700,339 | — | 3,925,660 | (7,986,961 | ) | — | 50,639,038 | ||||||||||||||||||||||||||||||||||
Large Cap Value Equity Fund |
| |||||||||||||||||||||||||||||||||||||||||||||||
I Shares | ||||||||||||||||||||||||||||||||||||||||||||||||
3/31/2016 | 20,150,176 | — | 10,337,408 | (48,665,920 | ) | — | (18,178,336 | ) | 313,559,680 | — | 153,510,502 | (757,220,055 | ) | — | (290,149,873 | ) | ||||||||||||||||||||||||||||||||
3/31/2015 | 28,004,437 | — | 10,411,299 | (28,071,259 | ) | — | 10,344,477 | 487,222,495 | — | 171,890,545 | (488,874,435 | ) | — | 170,238,605 | ||||||||||||||||||||||||||||||||||
A Shares | ||||||||||||||||||||||||||||||||||||||||||||||||
3/31/2016 | 5,044,971 | — | 2,344,910 | (10,555,409 | ) | — | (3,165,528 | ) | 77,627,924 | — | 34,587,431 | (162,541,146 | ) | — | (50,325,791 | ) | ||||||||||||||||||||||||||||||||
3/31/2015 | 9,474,829 | — | 2,094,788 | (6,025,065 | ) | — | 5,544,552 | 161,712,009 | — | 34,354,522 | (104,053,220 | ) | — | 92,013,311 | ||||||||||||||||||||||||||||||||||
C Shares | ||||||||||||||||||||||||||||||||||||||||||||||||
3/31/2016 | 168,986 | — | 104,345 | (252,165 | ) | — | 21,166 | 2,586,038 | — | 1,506,746 | (3,803,478 | ) | — | 289,306 | ||||||||||||||||||||||||||||||||||
3/31/2015 | 195,248 | — | 97,568 | (199,264 | ) | — | 93,552 | 3,295,166 | — | 1,569,872 | (3,367,738 | ) | — | 1,497,300 | ||||||||||||||||||||||||||||||||||
IS Shares** | ||||||||||||||||||||||||||||||||||||||||||||||||
3/31/2016 | 17,756,283 | — | 695,598 | (2,231,219 | ) | — | 16,220,662 | 272,105,222 | — | 10,357,452 | (35,798,821 | ) | — | 246,663,853 | ||||||||||||||||||||||||||||||||||
3/31/2015 | 2,414,485 | — | 214,418 | (373,525 | ) | — | 2,255,378 | 42,229,351 | — | 3,548,617 | (6,471,013 | ) | — | 39,306,955 | ||||||||||||||||||||||||||||||||||
Mid-Cap Value Equity Fund |
| |||||||||||||||||||||||||||||||||||||||||||||||
I Shares | ||||||||||||||||||||||||||||||||||||||||||||||||
3/31/2016 | 70,932,507 | — | 15,470,227 | (124,771,969 | ) | — | (38,369,235 | ) | 944,525,295 | — | 185,642,714 | (1,588,015,202 | ) | — | (457,847,193 | ) | ||||||||||||||||||||||||||||||||
3/31/2015 | 75,618,560 | — | 22,344,516 | (63,653,637 | ) | — | 34,309,439 | 1,077,018,496 | — | 299,639,961 | (900,329,838 | ) | — | 476,328,619 | ||||||||||||||||||||||||||||||||||
A Shares | ||||||||||||||||||||||||||||||||||||||||||||||||
3/31/2016 | 8,310,004 | — | 2,239,506 | (21,427,055 | ) | — | (10,877,545 | ) | 103,995,201 | — | 26,627,731 | (269,580,637 | ) | — | (138,957,705 | ) | ||||||||||||||||||||||||||||||||
3/31/2015 | 12,357,606 | — | 4,163,016 | (16,948,542 | ) | — | (427,920 | ) | 175,172,958 | — | 55,284,847 | (239,822,755 | ) | — | (9,364,950 | ) | ||||||||||||||||||||||||||||||||
C Shares | ||||||||||||||||||||||||||||||||||||||||||||||||
3/31/2016 | 727,265 | — | 319,531 | (2,214,544 | ) | — | (1,167,748 | ) | 9,133,165 | — | 3,722,533 | (26,768,700 | ) | — | (13,913,002 | ) | ||||||||||||||||||||||||||||||||
3/31/2015 | 1,386,234 | — | 465,316 | (1,295,312 | ) | — | 556,238 | 19,061,237 | — | 6,067,724 | (17,956,929 | ) | — | 7,172,032 | ||||||||||||||||||||||||||||||||||
IS Shares** | ||||||||||||||||||||||||||||||||||||||||||||||||
3/31/2016 | 15,707,999 | — | 732,470 | (2,549,531 | ) | — | 13,890,938 | 198,028,731 | — | 8,789,644 | (31,313,030 | ) | — | 175,505,345 | ||||||||||||||||||||||||||||||||||
3/31/2015 | 1,799,875 | — | 117,344 | (216,439 | ) | — | 1,700,780 | 25,429,162 | — | 1,573,581 | (3,067,418 | ) | — | 23,935,325 | ||||||||||||||||||||||||||||||||||
Small Cap Growth Stock Fund |
| |||||||||||||||||||||||||||||||||||||||||||||||
I Shares | ||||||||||||||||||||||||||||||||||||||||||||||||
3/31/2016 | 1,663,997 | — | 1,477,948 | (7,377,883 | ) | — | (4,235,938 | ) | 22,596,390 | — | 13,582,340 | (102,469,861 | ) | — | (66,291,131 | ) | ||||||||||||||||||||||||||||||||
3/31/2015 | 2,194,963 | — | 1,429,932 | (5,242,479 | ) | — | (1,617,584 | ) | 33,668,736 | — | 19,518,572 | (80,122,419 | ) | — | (26,935,111 | ) | ||||||||||||||||||||||||||||||||
A Shares | ||||||||||||||||||||||||||||||||||||||||||||||||
3/31/2016 | 21,550 | — | 375,807 | (182,679 | ) | — | 214,678 | 202,393 | — | 2,889,957 | (2,025,759 | ) | — | 1,066,591 | ||||||||||||||||||||||||||||||||||
3/31/2015 | 40,353 | — | 132,617 | (136,830 | ) | — | 36,140 | 573,081 | — | 1,615,276 | (1,863,978 | ) | — | 324,379 | ||||||||||||||||||||||||||||||||||
C Shares | ||||||||||||||||||||||||||||||||||||||||||||||||
3/31/2016 | 33,324 | — | 659,605 | (155,405 | ) | — | 537,524 | 169,847 | — | 2,763,745 | (1,031,867 | ) | — | 1,901,725 | ||||||||||||||||||||||||||||||||||
3/31/2015 | 11,684 | — | 157,551 | (112,020 | ) | — | 57,215 | 126,065 | — | 1,384,870 | (1,143,188 | ) | — | 367,747 | ||||||||||||||||||||||||||||||||||
IS Shares** | ||||||||||||||||||||||||||||||||||||||||||||||||
3/31/2016 | 139,519 | — | 159,913 | (335,556 | ) | — | (36,124 | ) | 1,172,382 | — | 1,477,592 | (3,442,521 | ) | — | (792,547 | ) | ||||||||||||||||||||||||||||||||
3/31/2015 | 420,184 | — | 69,231 | (69,647 | ) | — | 419,768 | 6,521,289 | — | 945,691 | (1,047,626 | ) | — | 6,419,354 | ||||||||||||||||||||||||||||||||||
73
Table of Contents
NOTES TO FINANCIAL STATEMENTS (continued)
RIDGEWORTH FUNDS March 31, 2016
| Shares Issued | Shares Issued- Merger | Shares Reinvested | Shares Redeemed | Shares Acquired | Net Increase (Decrease) in Shares Outstanding | Proceeds from Shares Issued | Issued- Merger | Dividends Reinvested | Cost of Shares Redeemed | Dollars Acquired | Change in Net Assets from Capital Transactions | |||||||||||||||||||||||||||||||||||||
Small Cap Value Equity Fund |
| |||||||||||||||||||||||||||||||||||||||||||||||
I Shares | ||||||||||||||||||||||||||||||||||||||||||||||||
3/31/2016 | 9,039,448 | — | 20,227,454 | (28,396,574 | ) | — | 870,328 | $ 119,891,772 | $ — | $ 214,208,737 | $ (401,188,555 | ) | $ | — | $ (67,088,046 | ) | ||||||||||||||||||||||||||||||||
3/31/2015 | 14,328,910 | — | 14,400,833 | (42,168,204 | ) | — | (13,438,461 | ) | 242,493,484 | — | 213,564,354 | (684,968,801 | ) | — | (228,910,963 | ) | ||||||||||||||||||||||||||||||||
A Shares | ||||||||||||||||||||||||||||||||||||||||||||||||
3/31/2016 | 1,418,812 | — | 3,276,571 | (4,299,801 | ) | — | 395,582 | 18,086,807 | — | 33,715,915 | (55,236,911 | ) | — | (3,434,189 | ) | |||||||||||||||||||||||||||||||||
3/31/2015 | 1,090,425 | — | 1,826,846 | (3,323,691 | ) | — | (406,420 | ) | 17,777,258 | — | 26,525,804 | (55,074,476 | ) | — | (10,771,414 | ) | ||||||||||||||||||||||||||||||||
C Shares | ||||||||||||||||||||||||||||||||||||||||||||||||
3/31/2016 | 125,149 | — | 824,781 | (580,956 | ) | — | 368,974 | 1,457,675 | — | 7,777,689 | (6,562,360 | ) | — | 2,673,004 | ||||||||||||||||||||||||||||||||||
3/31/2015 | 75,751 | — | 403,650 | (416,076 | ) | — | 63,325 | 1,148,740 | — | 5,505,787 | (6,423,069 | ) | — | 231,458 | ||||||||||||||||||||||||||||||||||
Aggressive Growth Allocation Strategy |
| |||||||||||||||||||||||||||||||||||||||||||||||
I Shares | ||||||||||||||||||||||||||||||||||||||||||||||||
3/31/2016 | 163,776 | — | 126,587 | (477,603 | ) | — | (187,240 | ) | 1,140,442 | — | 770,918 | (3,228,087 | ) | — | (1,316,727 | ) | ||||||||||||||||||||||||||||||||
3/31/2015 | 201,103 | — | 181,073 | (1,340,171 | ) | — | (957,995 | ) | 1,791,606 | — | 1,414,181 | (11,779,778 | ) | — | (8,573,991 | ) | ||||||||||||||||||||||||||||||||
A Shares | ||||||||||||||||||||||||||||||||||||||||||||||||
3/31/2016 | 64,769 | — | 131,644 | (164,335 | ) | — | 32,078 | 408,402 | — | 791,183 | (1,229,039 | ) | — | (29,454 | ) | |||||||||||||||||||||||||||||||||
3/31/2015 | 43,270 | — | 109,095 | (75,246 | ) | — | 77,119 | 381,295 | — | 842,214 | (659,540 | ) | — | 563,969 | ||||||||||||||||||||||||||||||||||
C Shares | ||||||||||||||||||||||||||||||||||||||||||||||||
3/31/2016 | 14,735 | — | 24,170 | (7,338 | ) | — | 31,567 | 105,683 | — | 139,463 | (56,859 | ) | — | 188,287 | ||||||||||||||||||||||||||||||||||
3/31/2015 | 10,616 | — | 15,736 | (13,195 | ) | — | 13,157 | 91,828 | — | 117,703 | (113,160 | ) | — | 96,371 | ||||||||||||||||||||||||||||||||||
Conservative Allocation Strategy |
| |||||||||||||||||||||||||||||||||||||||||||||||
I Shares | ||||||||||||||||||||||||||||||||||||||||||||||||
3/31/2016 | 852,015 | — | 89,107 | (910,633 | ) | — | 30,489 | 10,523,543 | — | 1,062,151 | (11,175,084 | ) | — | 410,610 | ||||||||||||||||||||||||||||||||||
3/31/2015 | 872,470 | — | 95,184 | (705,355 | ) | — | 262,299 | 11,155,782 | — | 1,189,804 | (9,026,545 | ) | — | 3,319,041 | ||||||||||||||||||||||||||||||||||
A Shares | ||||||||||||||||||||||||||||||||||||||||||||||||
3/31/2016 | 222,317 | — | 45,758 | (317,990 | ) | — | (49,915 | ) | 2,695,221 | — | 545,889 | (3,912,015 | ) | — | (670,905 | ) | ||||||||||||||||||||||||||||||||
3/31/2015 | 221,379 | — | 52,208 | (232,249 | ) | — | 41,338 | 2,826,361 | — | 652,605 | (2,962,704 | ) | — | 516,262 | ||||||||||||||||||||||||||||||||||
C Shares | ||||||||||||||||||||||||||||||||||||||||||||||||
3/31/2016 | 401,289 | — | 47,982 | (279,667 | ) | — | 169,604 | 4,921,132 | — | 566,671 | (3,400,633 | ) | — | 2,087,170 | ||||||||||||||||||||||||||||||||||
3/31/2015 | 301,977 | — | 45,992 | (277,773 | ) | — | 70,196 | 3,807,358 | — | 569,841 | (3,509,545 | ) | — | 867,654 | ||||||||||||||||||||||||||||||||||
Growth Allocation Strategy |
| |||||||||||||||||||||||||||||||||||||||||||||||
I Shares | ||||||||||||||||||||||||||||||||||||||||||||||||
3/31/2016 | 826,999 | — | 362,432 | (2,067,210 | ) | — | (877,779 | ) | 9,049,400 | — | 3,700,426 | (22,159,053 | ) | — | (9,409,227 | ) | ||||||||||||||||||||||||||||||||
3/31/2015 | 986,973 | — | 297,470 | (1,295,944 | ) | — | (11,501 | ) | 11,440,197 | — | 3,340,587 | (15,079,859 | ) | — | (299,075 | ) | ||||||||||||||||||||||||||||||||
A Shares | ||||||||||||||||||||||||||||||||||||||||||||||||
3/31/2016 | 52,273 | — | 60,102 | (163,704 | ) | — | (51,329 | ) | 527,166 | — | 610,632 | (1,773,011 | ) | — | (635,213 | ) | ||||||||||||||||||||||||||||||||
3/31/2015 | 33,828 | — | 50,310 | (160,865 | ) | — | (76,727 | ) | 386,582 | — | 562,471 | (1,821,475 | ) | — | (872,422 | ) | ||||||||||||||||||||||||||||||||
C Shares | ||||||||||||||||||||||||||||||||||||||||||||||||
3/31/2016 | 59,127 | — | 19,997 | (99,143 | ) | — | (20,019 | ) | 599,150 | — | 198,973 | (990,457 | ) | — | (192,334 | ) | ||||||||||||||||||||||||||||||||
3/31/2015 | 23,746 | — | 15,467 | (22,260 | ) | — | 16,953 | 266,165 | — | 169,832 | (251,185 | ) | — | 184,812 | ||||||||||||||||||||||||||||||||||
Moderate Allocation Strategy |
| |||||||||||||||||||||||||||||||||||||||||||||||
I Shares | ||||||||||||||||||||||||||||||||||||||||||||||||
3/31/2016 | 1,016,718 | — | 842,718 | (5,356,856 | ) | — | (3,497,420 | ) | 10,654,884 | — | 7,635,031 | (57,348,612 | ) | — | (39,058,697 | ) | ||||||||||||||||||||||||||||||||
3/31/2015 | 1,191,491 | — | 647,045 | (3,055,762 | ) | — | (1,217,226 | ) | 13,448,718 | — | 7,020,433 | (34,476,033 | ) | — | (14,006,882 | ) | ||||||||||||||||||||||||||||||||
A Shares | ||||||||||||||||||||||||||||||||||||||||||||||||
3/31/2016 | 75,028 | — | 222,574 | (535,529 | ) | — | (237,927 | ) | 766,987 | — | 2,007,615 | (5,698,032 | ) | — | (2,923,430 | ) | ||||||||||||||||||||||||||||||||
3/31/2015 | 53,654 | — | 115,957 | (412,530 | ) | — | (242,919 | ) | 605,069 | — | 1,254,652 | (4,640,926 | ) | — | (2,781,205 | ) | ||||||||||||||||||||||||||||||||
C Shares | ||||||||||||||||||||||||||||||||||||||||||||||||
3/31/2016 | 46,989 | — | 197,738 | (219,034 | ) | — | 25,693 | 476,260 | — | 1,771,729 | (2,199,100 | ) | — | 48,889 | ||||||||||||||||||||||||||||||||||
3/31/2015 | 56,352 | — | 78,989 | (216,841 | ) | — | (81,500 | ) | 621,754 | — | 849,127 | (2,414,293 | ) | — | (943,412 | ) | ||||||||||||||||||||||||||||||||
| * | Capital Innovations Global Resources and Infrastructure Fund had a fiscal year date change from November 30 to March 31 and a reorganization on February 19, 2016 (See Note 8). |
| ** | IS Shares commenced operations on August 1, 2014 (September 1, 2015 for International Equity Fund). |
74
Table of Contents
NOTES TO FINANCIAL STATEMENTS (continued)
RIDGEWORTH FUNDS March 31, 2016
| 5. | Investment Transactions |
The cost of security purchases and the proceeds from sales of securities, excluding securities maturing less than one year from acquisition and U.S. government securities, for the fiscal year or period ended March 31, 2016 were as follows:
| Purchases | Sales | |||||||
Aggressive Growth Stock Fund | $19,143,085 | $25,748,049 | ||||||
Capital Innovations Global Resources and Infrastructure Fund* | 878,176 | 2,650,085 | ||||||
International Equity Fund | 43,629,152 | 29,375,860 | ||||||
Large Cap Growth Stock Fund | 27,362,450 | 64,567,518 | ||||||
Large Cap Value Equity Fund | 1,406,462,194 | 1,668,313,036 | ||||||
Mid-Cap Value Equity Fund | 3,724,099,803 | 4,279,517,650 | ||||||
Small Cap Growth Stock Fund | 66,385,249 | 149,667,220 | ||||||
Small Cap Value Equity Fund | 383,676,495 | 711,637,360 | ||||||
Aggressive Growth Allocation Strategy | 3,666,602 | 5,935,041 | ||||||
Conservative Allocation Strategy | 26,790,663 | 25,719,354 | ||||||
Growth Allocation Strategy | 16,752,736 | 28,752,167 | ||||||
Moderate Allocation Strategy | 24,934,734 | 76,088,231 | ||||||
| * | For the period December 1, 2015 to March 31, 2016. |
| 6. | Federal Income Tax Information |
The following information is presented on an income tax basis and takes into consideration differences between amounts for financial statement and income tax purposes. These “book/tax” differences are either considered temporary or permanent in nature. To the extent these differences are permanent in nature (i.e., foreign currency transactions and return of capital on securities) such amounts are reclassified within the composition of net assets based on their U.S. federal tax-basis treatment; temporary differences do not require reclassification.
The effects of certain differences reclassified as of March 31, 2016 were as follows:
| Paid in Capital | Accumulated Net Realized Gain (Loss) | Undistributed Net Investment Income (Loss) | ||||||||||
Aggressive Growth Stock Fund | $ | (469,283 | ) | $— | $469,283 | |||||||
Capital Innovations Global Resources and Infrastructure Fund | (223,648 | ) | 40,109 | 183,539 | ||||||||
International Equity Fund | — | 124,840 | (124,840 | ) | ||||||||
Large Cap Growth Stock Fund | (743,567 | ) | — | 743,567 | ||||||||
Mid-Cap Value Equity Fund | (15,790 | ) | 621,881 | (606,091 | ) | |||||||
Small Cap Growth Stock Fund | (987,184 | ) | 1,167 | 986,017 | ||||||||
Small Cap Value Equity Fund | — | 1,217,953 | (1,217,953 | ) | ||||||||
Aggressive Growth Allocation Strategy | — | (12,249 | ) | 12,249 | ||||||||
Conservative Allocation Strategy | — | (38,860 | ) | 38,860 | ||||||||
Growth Allocation Strategy | — | (57,387 | ) | 57,387 | ||||||||
Moderate Allocation Strategy | — | (59,578 | ) | 59,578 | ||||||||
The cost of investments and aggregate gross unrealized appreciation and depreciation for securities held by the Funds as of March 31, 2016 were as follows:
Fund | Tax Cost | Aggregate Gross Unrealized Appreciation | Aggregate Gross Unrealized (Depreciation) | Net Unrealized Appreciation (Depreciation) | ||||||||||||
Aggressive Growth Stock Fund | $17,209,030 | $10,859,215 | $(1,839,367 | ) | $9,019,848 | |||||||||||
Capital Innovations Global Resources and Infrastructure Fund | 3,589,788 | 202,298 | (405,792 | ) | 203,494 | |||||||||||
International Equity Fund | 40,272,673 | 1,947,596 | (765,712 | ) | 1,181,884 | |||||||||||
75
Table of Contents
NOTES TO FINANCIAL STATEMENTS (continued)
RIDGEWORTH FUNDS March 31, 2016
Fund | Tax Cost | Aggregate Gross Unrealized Appreciation | Aggregate Gross Unrealized (Depreciation) | Net Unrealized Appreciation (Depreciation) | ||||||||||||
Large Cap Growth Stock Fund | $138,319,815 | $119,898,655 | $(5,567,454 | ) | $114,331,201 | |||||||||||
Large Cap Value Equity Fund | 1,788,053,491 | 363,101,198 | (47,252,407 | ) | 315,848,791 | |||||||||||
Mid-Cap Value Equity Fund | 3,322,126,297 | 318,389,892 | (118,988,287 | ) | 199,401,605 | |||||||||||
Small Cap Growth Stock Fund | 54,913,826 | 9,711,036 | (4,940,105 | ) | 4,770,931 | |||||||||||
Small Cap Value Equity Fund | 804,926,531 | 200,233,428 | (46,649,615 | ) | 153,583,813 | |||||||||||
Aggressive Growth Allocation Strategy | 6,183,497 | 1,052,598 | (71,108 | ) | 981,490 | |||||||||||
Conservative Allocation Strategy | 63,521,834 | 1,800,763 | (543,862 | ) | 1,256,901 | |||||||||||
Growth Allocation Strategy | 43,023,122 | 5,562,116 | (507,880 | ) | 5,054,236 | |||||||||||
Moderate Allocation Strategy | 61,927,611 | 7,853,975 | (496,485 | ) | 7,357,490 | |||||||||||
The tax character of distributions paid to shareholders during the period or fiscal year ended March 31, 2016 was as follows:
| Distributions paid from | ||||||||||||||||||||
Fund | Net Investment Income* | Net Long Term Capital Gains | Tax-Exempt Distributions** | Return of Capital | Total Distributions Paid | |||||||||||||||
Aggressive Growth Stock Fund | $— | $2,095,754 | $— | $— | $2,095,754 | |||||||||||||||
Capital Innovations Global Resources and Infrastructure Fund | 82,228 | — | — | — | 82,228 | |||||||||||||||
International Equity Fund | 144,980 | 2,000,010 | — | — | 2,144,990 | |||||||||||||||
Large Cap Growth Stock Fund | — | 23,322,257 | — | — | 23,322,257 | |||||||||||||||
Large Cap Value Equity Fund | 30,971,375 | 172,233,852 | — | — | 203,205,227 | |||||||||||||||
Mid-Cap Value Equity Fund | 113,394,437 | 125,921,077 | — | — | 239,315,514 | |||||||||||||||
Small Cap Growth Stock Fund | — | 21,567,281 | — | — | 21,567,281 | |||||||||||||||
Small Cap Value Equity Fund | 15,453,362 | 246,896,505 | — | — | 262,349,867 | |||||||||||||||
Aggressive Growth Allocation Strategy | 95,850 | 1,657,102 | — | — | 1,752,952 | |||||||||||||||
Conservative Allocation Strategy | 952,544 | 1,610,853 | — | — | 2,563,397 | |||||||||||||||
Growth Allocation Strategy | 689,495 | 3,848,880 | — | — | 4,538,375 | |||||||||||||||
Moderate Allocation Strategy | 1,314,012 | 10,251,561 | — | — | 11,565,573 | |||||||||||||||
| * | Total distributions paid are recognized on a when declared basis for the period or fiscal year ended March 31, 2016. |
| ** | Net Investment income includes taxable market discount income and net short-term capital gains, if any. |
Amounts designated as “—” are $0 or have been rounded to $0.
The tax character of distributions paid to shareholders during the period or fiscal year ended March 31, 2015 was as follows:
| Distributions paid from | ||||||||||||||||||||
Fund | Net Investment Income* | Net Long Term Capital Gains | Tax-Exempt Distributions** | Return of Capital | Total Distributions Paid | |||||||||||||||
Aggressive Growth Stock Fund | $— | $1,294,356 | $— | $— | $1,294,356 | |||||||||||||||
International Equity Fund | 467,780 | 2,269,103 | — | — | 2,736,883 | |||||||||||||||
Large Cap Growth Stock Fund | 2,744,037 | 19,617,946 | — | — | 22,361,983 | |||||||||||||||
Large Cap Value Equity Fund | 88,513,542 | 126,834,813 | — | — | 215,348,355 | |||||||||||||||
Mid-Cap Value Equity Fund | 225,539,947 | 171,610,800 | — | — | 397,150,747 | |||||||||||||||
Small Cap Growth Stock Fund | 2,542,173 | 21,385,596 | — | — | 23,927,769 | |||||||||||||||
Small Cap Value Equity Fund | 25,139,745 | 227,729,507 | — | — | 252,869,252 | |||||||||||||||
Aggressive Growth Allocation Strategy | 337,523 | 2,101,925 | — | — | 2,439,448 | |||||||||||||||
Conservative Allocation Strategy | 1,368,516 | 1,403,606 | — | — | 2,772,122 | |||||||||||||||
Growth Allocation Strategy | 1,301,918 | 2,801,375 | — | — | 4,103,293 | |||||||||||||||
Moderate Allocation Strategy | 2,783,658 | 6,465,824 | — | — | 9,249,482 | |||||||||||||||
| * | Total distributions paid are recognized on a when declared basis for the year ended March 31, 2015. |
| ** | Net Investment income includes taxable market discount income and net short-term capital gains, if any. |
Amounts designated as “—” are $0 or have been rounded to $0.
76
Table of Contents
NOTES TO FINANCIAL STATEMENTS (continued)
RIDGEWORTH FUNDS March 31, 2016
The tax character of distributions paid to shareholders during the fiscal years ended November 30 were as follows:
| Distributions paid from | ||||||||||||||||||||
Fund | Net Investment Income* | Net Long Term Capital Gains | Tax-Exempt Distributions** | Return of Capital | Total Distributions Paid | |||||||||||||||
Capital Innovations Global Resources and Infrastructure Fund*** | $136,051 | $— | $— | $— | $136,051 | |||||||||||||||
Capital Innovations Global Resources and Infrastructure Fund**** | 76,036 | 17,208 | — | 47,976 | 141,220 | |||||||||||||||
| * | Total distributions paid are recognized on a when declared basis for the fiscal years ended November 30, 2015 and 2014, respectively. |
| ** | Net Investment income includes taxable market discount income and net short-term capital gains, if any. |
| *** | Fiscal year ended November 30, 2015. |
| **** | Fiscal year ended November 30, 2014. |
Amounts designated as “—” are $0 or have been rounded to $0.
As of March 31, 2016, the components of distributable earnings (accumulated losses) on a federal income tax basis were as follows:
Fund | Undistributed Tax Exempt Income | Undistributed Ordinary Income | Undistributed Long Term Capital Gains | Net Unrealized Appreciation (Depreciation)* | Loss Carryforwards and Deferrals | Total | ||||||||||||||||||
Aggressive Growth Stock Fund | $— | $— | $1,894,557 | $9,019,851 | $(1,451,938) | $9,462,470 | ||||||||||||||||||
Capital Innovations Global Resources and Infrastructure Fund | — | 82,904 | — | (203,490 | ) | (892,311 | ) | (1,012,897 | ) | |||||||||||||||
International Equity Fund | — | 225,035 | 335,989 | 1,188,590 | (1,649,094 | ) | 100,520 | |||||||||||||||||
Large Cap Growth Stock Fund | — | — | 3,766,399 | 114,331,200 | (1,832,824 | ) | 116,264,775 | |||||||||||||||||
Large Cap Value Equity Fund | — | 5,948,067 | — | 315,848,792 | (49,248,431 | ) | 272,548,428 | |||||||||||||||||
Mid-Cap Value Equity Fund | — | 10,529,606 | — | 199,401,606 | (42,719,379 | ) | 167,211,833 | |||||||||||||||||
Small Cap Growth Stock Fund | — | — | 2,614,535 | 4,770,935 | (82,837 | ) | 7,302,633 | |||||||||||||||||
Small Cap Value Equity Fund | — | 1,382,858 | — | 153,585,376 | (22,866,869 | ) | 132,101,365 | |||||||||||||||||
Aggressive Growth Allocation Strategy | — | — | 416,887 | 981,490 | — | 1,398,377 | ||||||||||||||||||
Conservative Allocation Strategy | — | 125,027 | 161,228 | 1,256,903 | — | 1,543,158 | ||||||||||||||||||
Growth Allocation Strategy | — | 14,594 | 1,947,694 | 5,054,237 | — | 7,016,525 | ||||||||||||||||||
Moderate Allocation Strategy | — | 62,875 | 2,340,616 | 7,357,493 | — | 9,760,984 | ||||||||||||||||||
| * | The differences between book-basis and tax-basis unrealized appreciation is attributable primarily to: tax deferral of losses on wash sales, the realization for tax purposes of unrealized gains/losses on investments in passive foreign investment companies, return of capital adjustments, forward contracts marked to market and partnership basis adjustments. |
The Funds utilize the provisions of the federal income tax laws that provide for the carry forward of capital losses from prior years, offsetting such losses against any future realized capital gains. Under the Regulated Investment Company Modernization Act of 2010 (the “Act”), net capital losses recognized in taxable years beginning after December 22, 2010 (“post-enactment”), may be carried forward indefinitely, and their character is retained as short-term and/or long-term losses. Previously, net capital losses were carried forward for eight years and treated as short-term losses (“pre-enactment”). The Act requires that post-enactment net capital losses be used before pre-enactment net capital losses.
As of March 31, 2016, the post-enactment accumulated short-term and long-term capital loss carry forwards were as follows:
Fund | Short Term | Long Term | Total | |||||||||
Aggressive Growth Stock Fund* | $— | $— | $— | |||||||||
Capital Innovations Global Resources and Infrastructure Fund | 661,695 | 166,419 | 828,114 | |||||||||
| * | Of the $363,926 of remaining capital loss carryforwards acquired on April 27, 2012, in the merger with the RidgeWorth Emerging Growth Stock Fund and subject to limitations as a result of this acquisition, the entire amount was utilized. |
77
Table of Contents
NOTES TO FINANCIAL STATEMENTS (continued)
RIDGEWORTH FUNDS March 31, 2016
As of March 31, 2016, the pre-enactment accumulated capital loss carryforwards and expiration dates were as follows:
Fund | Expiring 2017 | Expiring 2018 | Total | |||||||||
Aggressive Growth Stock Fund* | $ | 1,372,837 | $— | $ | 1,372,837 | |||||||
International Equity Fund** | — | 1,649,094 | 1,649,094 | |||||||||
Large Cap Growth Stock Fund*** | 1,639,873 | — | 1,639,873 | |||||||||
| * | Of the $1,600,850 of remaining capital loss carryforwards acquired on April 27, 2012, in the merger with the RidgeWorth Emerging Growth Stock Fund and subject to limitations as a result of this acquisition, $228,013 was utilized. The remaining $1,372,837 will expire in 2017. |
| ** | Of the $2,473,641 of remaining capital loss carryforwards subject to limitations due to an ownership change on May 22, 2013, $824,547 was utilized, and the remaining $1,649,094, will expire in 2018. |
| *** | Of the $3,279,747 of remaining capital loss carryforwards acquired on March 1, 2013, in the merger with the RidgeWorth Large Cap Core Growth Stock Fund and subject to limitations as a result of this acquisition, $1,639,874 was utilized, and the remaining $1,639,873, will expire in 2017. |
Capital loss carryforwards may be applied to offset future realized capital gains and therefore may reduce future capital gain distributions.
During the fiscal year ended March 31, 2016, the following Funds utilized capital loss carry forwards as follows:
Fund | Amount | |||
Aggressive Growth Stock Fund | $591,939 | |||
International Equity Fund | 824,547 | |||
Large Cap Growth Stock Fund | 1,639,874 | |||
Net capital losses incurred after October 31, and within the taxable year are deemed to arise on the first business day of the Funds’ next fiscal year. During the fiscal year ended March 31, 2016, the following Funds had net capital losses:
Fund | Short Term | Long Term | Total | |||||||||
Large Cap Value Equity Fund | $76,570,240 | $(27,321,809 | ) | $49,248,431 | ||||||||
Mid-Cap Value Equity Fund | 57,488,324 | (14,768,945 | ) | 42,719,379 | ||||||||
Small Cap Value Equity Fund | 9,263,579 | 13,603,290 | 22,866,869 | |||||||||
Pursuant to federal income tax rules applicable to regulated investment companies, the Funds may elect to treat certain capital losses, between November 1 and March 31, and late year ordinary losses (i) ordinary losses between January 1 and March 31, and (ii) specified ordinary and currency losses between November 1 and March 31 as occurring on the first day of the following tax year. For the period or fiscal year ended March 31, 2016, any amount of losses elected as late year ordinary losses within the tax return will not be recognized for federal income tax purposes until April 1, 2016.
| 7. | Investments in Affiliated Issuers |
Affiliated holdings are holdings in mutual funds which are managed by the Investment Adviser or an affiliate of the Investment Adviser or which are distributed by an affiliate of the Funds’ distributor. An investment by a Fund representing greater than 10% of the voting securities of an issuer makes that issuer an affiliated holding of the Fund. With respect to each Fund, the Investment Adviser was paid an investment advisory fee by the affiliated investments listed beneath its name below. Investments in affiliated issuers as of March 31, 2016 were as follows:
Name of Affiliated Issuer | Share Balance at March 31, 2015 | Purchases | Sales | Share Balance at March 31, 2016 | Value at March 31, 2016 | Dividend Income | Realized Gain Distributions | Net Realized Gain (Loss) | ||||||||||||||||||||||||
Aggressive Growth Allocation Strategy |
| |||||||||||||||||||||||||||||||
RidgeWorth Intermediate Bond Fund* — I Shares | 30 | 0 | 30 | — | $— | $1 | $2 | $— | ||||||||||||||||||||||||
RidgeWorth International Equity Fund — I Shares | 53,242 | 7,061 | 60,303 | — | — | 3,482 | — | (703 | ) | |||||||||||||||||||||||
RidgeWorth International Equity Fund — IS Shares** | — | 64,628 | 27,650 | 36,978 | 344,261 | — | 48,387 | (37,554 | ) | |||||||||||||||||||||||
RidgeWorth Large Cap Growth Stock Fund — IS Shares | 289,497 | 49,375 | 110,429 | 228,443 | 2,145,082 | — | 192,051 | 34,757 | ||||||||||||||||||||||||
78
Table of Contents
NOTES TO FINANCIAL STATEMENTS (continued)
RIDGEWORTH FUNDS March 31, 2016
Name of Affiliated Issuer | Share Balance at March 31, 2015 | Purchases | Sales | Share Balance at March 31, 2016 | Value at March 31, 2016 | Dividend Income | Realized Gain Distributions | Net Realized Gain (Loss) | ||||||||||||||||||||||||
RidgeWorth Large Cap Value Equity Fund — IS Shares | 119,178 | 26,918 | 47,184 | 98,912 | $1,460,925 | $29,221 | $132,026 | $113,046 | ||||||||||||||||||||||||
RidgeWorth Mid-Cap Value Equity Fund — IS Shares | 64,981 | 6,848 | 25,787 | 46,042 | 569,076 | 10,140 | 34,529 | 73,268 | ||||||||||||||||||||||||
RidgeWorth Seix Core Bond Fund*† — I Shares | — | 31 | 31 | — | — | 1 | — | (8 | ) | |||||||||||||||||||||||
RidgeWorth Seix Core Bond Fund*† — IS Shares** | — | 28 | — | 28 | 307 | 4 | 1 | — | ||||||||||||||||||||||||
RidgeWorth Seix Corporate Bond Fund† — I Shares | 7,013 | 1,601 | 5,499 | 3,115 | 26,354 | 1,092 | 510 | (1,993 | ) | |||||||||||||||||||||||
RidgeWorth Seix Floating Rate High Income Fund — IS Shares | 5,709 | 965 | 5,651 | 1,023 | 8,522 | 1,604 | — | (2,152 | ) | |||||||||||||||||||||||
RidgeWorth Seix High Income Fund† — IS Shares | 5,686 | 1,250 | 5,452 | 1,484 | 8,784 | 1,757 | — | (5,113 | ) | |||||||||||||||||||||||
RidgeWorth Seix High Yield Fund — I Shares | 4,347 | 922 | 4,155 | 1,114 | 8,689 | 1,583 | — | (6,054 | ) | |||||||||||||||||||||||
RidgeWorth Seix Total Return Bond Fund† — IS Shares | 65,453 | 12,150 | 40,496 | 37,107 | 395,935 | 13,967 | 692 | (8,058 | ) | |||||||||||||||||||||||
RidgeWorth Seix U.S. Government Securities Ultra-Short Bond† Fund — I Shares | 5,014 | 5,016 | 3,564 | 6,466 | 64,857 | 401 | — | (131 | ) | |||||||||||||||||||||||
RidgeWorth Small Cap Growth Stock Fund — IS Shares | 25,991 | 12,054 | 22,545 | 15,500 | 132,837 | — | 96,911 | (15,565 | ) | |||||||||||||||||||||||
RidgeWorth Small Cap Value Equity Fund — I Shares | 22,908 | 8,229 | 18,692 | 12,445 | 140,623 | 3,743 | 68,796 | 31,686 | ||||||||||||||||||||||||
|
|
|
|
|
|
|
| |||||||||||||||||||||||||
Total | $5,306,252 | $66,996 | $573,905 | $175,426 | ||||||||||||||||||||||||||||
|
|
|
|
|
|
|
| |||||||||||||||||||||||||
Conservative Allocation Strategy |
| |||||||||||||||||||||||||||||||
RidgeWorth Intermediate Bond Fund* — I Shares | 846 | 11 | 857 | — | $— | $12 | $80 | $— | ||||||||||||||||||||||||
RidgeWorth International Equity Fund — I Shares | 140,074 | 25,848 | 165,922 | — | — | 10,607 | — | (818 | ) | |||||||||||||||||||||||
RidgeWorth International Equity Fund — IS Shares** | — | 198,489 | 65,056 | 133,433 | 1,242,262 | — | 152,302 | (137,970 | ) | |||||||||||||||||||||||
RidgeWorth Large Cap Growth Stock Fund — IS Shares | 800,484 | 132,202 | 101,616 | 831,070 | 7,803,743 | — | 636,015 | (124,270 | ) | |||||||||||||||||||||||
RidgeWorth Large Cap Value Equity Fund — IS Shares | 336,060 | 68,026 | 42,949 | 361,137 | 5,333,996 | 96,687 | 436,844 | (42,662) | ||||||||||||||||||||||||
RidgeWorth Mid-Cap Value Equity Fund — IS Shares | 170,731 | 26,525 | 31,106 | 166,150 | 2,053,609 | 33,542 | 114,209 | (26,227) | ||||||||||||||||||||||||
RidgeWorth Seix Core Bond Fund*† — I Shares | — | 859 | 859 | — | — | 13 | — | — | ||||||||||||||||||||||||
RidgeWorth Seix Core Bond Fund*† — IS Shares** | — | 787 | — | 787 | 8,551 | 99 | 21 | — | ||||||||||||||||||||||||
RidgeWorth Seix Corporate Bond Fund† — I Shares | 237,896 | 25,071 | 136,728 | 126,239 | 1,067,983 | 42,840 | 24,076 | (55,492 | ) | |||||||||||||||||||||||
RidgeWorth Seix Floating Rate High Income Fund — IS Shares | 193,727 | 21,265 | 172,888 | 42,104 | 350,728 | 63,140 | — | (108,553) | ||||||||||||||||||||||||
RidgeWorth Seix High Income Fund† — IS Shares | 193,100 | 27,916 | 159,662 | 61,354 | 363,213 | 69,966 | — | (162,280) | ||||||||||||||||||||||||
RidgeWorth Seix High Yield Fund — I Shares | 147,635 | 20,333 | 121,911 | 46,057 | 359,242 | 63,012 | — | (183,328) | ||||||||||||||||||||||||
RidgeWorth Seix Total Return Bond Fund† — IS Shares | 2,456,217 | 329,786 | 1,074,353 | 1,711,650 | 18,263,309 | 539,379 | 26,748 | (310,576) | ||||||||||||||||||||||||
79
Table of Contents
NOTES TO FINANCIAL STATEMENTS (continued)
RIDGEWORTH FUNDS March 31, 2016
Name of Affiliated Issuer | Share Balance at March 31, 2015 | Purchases | Sales | Share Balance at March 31, 2016 | Value at March 31, 2016 | Dividend Income | Realized Gain Distributions | Net Realized Gain (Loss) | ||||||||||||||||||||||||
RidgeWorth Seix U.S. Government Securities Ultra-Short Bond Fund† — I Shares | 170,248 | 145,834 | 51,328 | 264,754 | $2,655,483 | $16,383 | $— | $(1,739) | ||||||||||||||||||||||||
RidgeWorth Small Cap Growth Stock Fund — IS Shares | 65,213 | 39,002 | 48,348 | 55,867 | 478,779 | — | 304,420 | (303,895) | ||||||||||||||||||||||||
RidgeWorth Small Cap Value Equity Fund — I Shares | 59,404 | 26,957 | 41,400 | 44,961 | 508,059 | 11,811 | 217,075 | (130,297) | ||||||||||||||||||||||||
|
|
|
|
|
|
|
| |||||||||||||||||||||||||
Total | $40,488,957 | $947,491 | $1,911,790 | $(1,588,107 | ) | |||||||||||||||||||||||||||
|
|
|
|
|
|
|
| |||||||||||||||||||||||||
Growth Allocation Strategy |
| |||||||||||||||||||||||||||||||
RidgeWorth Intermediate Bond Fund* — I Shares | 278 | 4 | 282 | — | $— | $3 | $27 | $— | ||||||||||||||||||||||||
RidgeWorth International Equity Fund — I Shares | 293,689 | 28,393 | 322,082 | — | — | 20,485 | — | (5,715) | ||||||||||||||||||||||||
RidgeWorth International Equity Fund — IS Shares** | — | 353,642 | 128,174 | 225,468 | 2,099,109 | — | 288,805 | (287,246) | ||||||||||||||||||||||||
RidgeWorth Large Cap Growth Stock Fund — IS Shares | 1,670,450 | 153,903 | 426,769 | 1,397,584 | 13,123,311 | — | 1,139,700 | (112,681) | ||||||||||||||||||||||||
RidgeWorth Large Cap Value Equity Fund — IS Shares | 699,500 | 88,135 | 181,177 | 606,458 | 8,957,381 | 173,293 | 782,957 | 219,700 | ||||||||||||||||||||||||
RidgeWorth Mid-Cap Value Equity Fund — IS Shares | 358,060 | 30,855 | 108,444 | 280,471 | 3,466,626 | 60,098 | 204,628 | 157,668 | ||||||||||||||||||||||||
RidgeWorth Seix Core Bond Fund*† — I Shares | — | 282 | 282 | — | — | 4 | — | (3) | ||||||||||||||||||||||||
RidgeWorth Seix Core Bond Fund*† — IS Shares** | — | 259 | — | 259 | 2,809 | 33 | 7 | — | ||||||||||||||||||||||||
RidgeWorth Seix Corporate Bond Fund† — I Shares | 85,827 | 5,812 | 57,749 | 33,890 | 286,706 | 13,819 | 7,114 | (23,413) | ||||||||||||||||||||||||
RidgeWorth Seix Floating Rate High Income Fund — IS Shares | 69,713 | 5,150 | 63,666 | 11,197 | 93,273 | 20,550 | — | (22,900) | ||||||||||||||||||||||||
RidgeWorth Seix High Income Fund† — IS Shares | 69,443 | 6,483 | 59,409 | 16,517 | 97,783 | 22,444 | — | (56,858) | ||||||||||||||||||||||||
RidgeWorth Seix High Yield Fund — I Shares | 53,114 | 4,538 | 45,384 | 12,268 | 95,690 | 20,215 | — | (11,434) | ||||||||||||||||||||||||
RidgeWorth Seix Total Return Bond Fund† — IS Shares | 884,055 | 80,020 | 504,960 | 459,115 | 4,898,755 | 169,711 | 7,986 | (88,683) | ||||||||||||||||||||||||
RidgeWorth Seix U.S. Government Securities Ultra-Short Bond Fund† — I Shares | 61,330 | 41,735 | 32,174 | 70,891 | 711,041 | 5,061 | — | (820) | ||||||||||||||||||||||||
RidgeWorth Small Cap Growth Stock Fund — IS Shares | 136,435 | 63,332 | 105,826 | 93,941 | 805,071 | — | 545,542 | (305,935) | ||||||||||||||||||||||||
RidgeWorth Small Cap Value Equity Fund — I Shares | 124,172 | 42,872 | 91,276 | 75,768 | 856,181 | 21,190 | 389,433 | 24,908 | ||||||||||||||||||||||||
|
|
|
|
|
|
|
| |||||||||||||||||||||||||
Total | $35,493,736 | $526,906 | $3,366,199 | $(513,412 | ) | |||||||||||||||||||||||||||
|
|
|
|
|
|
|
| |||||||||||||||||||||||||
Moderate Allocation Strategy |
| |||||||||||||||||||||||||||||||
RidgeWorth Intermediate Bond Fund* — I Shares | 1,377 | 14 | 1,391 | — | $— | $23 | $93 | $(173 | ) | |||||||||||||||||||||||
RidgeWorth International Equity Fund — I Shares | 414,134 | 22,765 | 436,899 | — | — | 27,776 | — | (7,576) | ||||||||||||||||||||||||
RidgeWorth International Equity Fund — IS Shares** | — | 467,590 | 237,917 | 229,673 | 2,138,257 | — | 275,495 | (289,608) | ||||||||||||||||||||||||
RidgeWorth Large Cap Growth Stock Fund — IS Shares | 2,366,578 | 132,781 | 1,071,982 | 1,427,377 | 13,403,070 | — | 1,107,166 | 523,909 | ||||||||||||||||||||||||
80
Table of Contents
NOTES TO FINANCIAL STATEMENTS (continued)
RIDGEWORTH FUNDS March 31, 2016
Name of Affiliated Issuer | Share Balance at March 31, 2015 | Purchases | Sales | Share Balance at March 31, 2016 | Value at March 31, 2016 | Dividend Income | Realized Gain Distributions | Net Realized Gain (Loss) | ||||||||||||||||||||||||
RidgeWorth Large Cap Value Equity Fund — IS Shares | 994,919 | 77,447 | 452,506 | 619,860 | $9,155,333 | $168,382 | $760,768 | $1,766,551 | ||||||||||||||||||||||||
RidgeWorth Mid-Cap Value Equity Fund — IS Shares | 505,509 | 26,254 | 246,191 | 285,572 | 3,529,675 | 58,414 | 198,894 | 786,007 | ||||||||||||||||||||||||
RidgeWorth Seix Core Bond*† — I Shares | — | 998 | 998 | — | — | 15 | — | — | ||||||||||||||||||||||||
RidgeWorth Seix Core Bond*† — IS Shares** | — | 981 | 277 | 704 | 7,647 | 93 | 19 | (159) | ||||||||||||||||||||||||
RidgeWorth Seix Corporate Bond Fund† — I Shares | 307,648 | 25,590 | 242,128 | 91,110 | 770,788 | 44,567 | 18,248 | (86,217) | ||||||||||||||||||||||||
RidgeWorth Seix Floating Rate High Income Fund — IS Shares | 250,415 | 24,983 | 244,851 | 30,547 | 254,453 | 66,230 | — | (27,580) | ||||||||||||||||||||||||
RidgeWorth Seix High Income Fund† — IS Shares | 249,423 | 30,830 | 235,552 | 44,701 | 264,632 | 71,150 | — | (176,895) | ||||||||||||||||||||||||
RidgeWorth Seix High Yield Fund — I Shares | 190,705 | 23,092 | 180,525 | 33,272 | 259,521 | 63,922 | — | (4,743) | ||||||||||||||||||||||||
RidgeWorth Seix Total Return Bond Fund† — IS Shares | 3,177,401 | 185,706 | 2,128,399 | 1,234,708 | 13,174,330 | 498,573 | 15,438 | 203,257 | ||||||||||||||||||||||||
RidgeWorth Seix U.S. Government Securities Ultra-Short Bond Fund† — I Shares | 220,114 | 138,624 | 167,538 | 191,200 | 1,917,741 | 15,541 | — | 494 | ||||||||||||||||||||||||
RidgeWorth Small Cap Growth Stock Fund — IS Shares | 192,129 | 59,070 | 155,065 | 96,134 | 823,866 | — | 530,718 | (81,527) | ||||||||||||||||||||||||
RidgeWorth Small Cap Value Equity Fund — I Shares | 172,283 | 39,472 | 134,443 | 77,312 | 873,622 | 20,568 | 378,003 | 348,917 | ||||||||||||||||||||||||
|
|
|
|
|
|
|
| |||||||||||||||||||||||||
Total | $46,572,935 | $1,035,254 | $3,284,842 | $2,954,658 | ||||||||||||||||||||||||||||
|
|
|
|
|
|
|
| |||||||||||||||||||||||||
| * | On August 1, 2015, RidgeWorth Intermediate Bond Fund reorganized into RidgeWorth Seix Core Bond Fund. |
| ** | IS Shares commenced operations on August 3, 2015 for Seix Core Bond Fund and September 1, 2015 for International Equity Fund. |
| † | On August 1, 2015, affiliated fixed income funds were rebranded from “RidgeWorth” to “RidgeWorth Seix”. |
| 8. | Reorganizations |
On November 18, 2014, the Board approved the reorganization of the RidgeWorth Select Large Cap Growth Fund (the “Target Fund”) into the RidgeWorth Large Cap Growth Stock Fund (the “Acquiring Fund”), a separate series of the Trust. On January 26, 2015 the Acquiring Fund acquired all of the net assets of the Target Fund in a tax-free exchange of shares. The purpose of the transaction was to combine two portfolios with comparable investment objectives and strategies.
Target Fund | Shares Prior to Reorganization | Shares Issued by the Acquiring Fund | Net Assets Prior to Reorganization | |||||||||
I Shares | 180,651 | 387,177 | $3,780,324 | |||||||||
A Shares | 19,446 | 46,639 | 386,118 | |||||||||
C Shares | 864,356 | 2,121,925 | 12,809,849 | |||||||||
The appreciation (depreciation) of the acquired fund was $5,729,275 as of the date of the merger.
The combined net assets of the Acquiring Fund immediately after the reorganization were $287,227,781.
81
Table of Contents
NOTES TO FINANCIAL STATEMENTS (concluded)
RIDGEWORTH FUNDS March 31, 2016
Assuming the acquisition had been completed on April 1, 2014, the beginning of the reporting period of the Acquiring Fund, the Acquiring Fund’s pro forma results of operations for the fiscal year ended March 31, 2015 were as follows:
Net Investment Income (Loss) | $ | (645,883 | ) | |
Net Realized and Unrealized Gains/Losses on Investments | $ | 40,828,634 | ||
Net Increase/Decrease in Net Assets resulting from Operations | $ | 40,182,751 |
Because the combined investment portfolios have been managed as a single integrated portfolio since the acquisition was completed, it is not practicable to separate the amounts of revenue and earnings of the Target Fund that has been included in the Acquiring Fund’s Statement of Operations as of March 31, 2015.
Effective the close of business on February 19, 2016, Capital Innovations Global Resources and Infrastructure Fund, a new series of the Trust, acquired the assets and assumed the liabilities of the Predecessor Fund, a series of Investment Managers Series Trust. As part of the reorganization there was a change to the independent registered public accounting firm. The reorganization was accomplished by the following tax-free reorganization in which each shareholder of the Predecessor Fund received the same aggregate share net asset value in the corresponding classes as noted below:
| Shares Issued | Net Assets | |||||||
I Shares | 224,274 | $1,806,342 | ||||||
A Shares | 127,824 | 1,028,373 | ||||||
C Shares | 24,776 | 196,668 | ||||||
The appreciation (depreciation) of the Predecessor Fund was $588,102 as of the date of the acquisition.
The undistributed net investment income of the Predecessor Fund was $18,436 as of the date of the acquisition.
| 9. | Recently Issued Accounting Pronouncements |
In May 2015, the Financial Accounting Standards Board (“FASB”) issued Accounting Standards Update (“ASU”) No. 2015-07 Disclosure for Investments in Certain Entities that Calculate Net Asset Value per Share (or Its Equivalent). The amendments in ASU No. 2015-07 remove the requirement to categorize within the fair value hierarchy investments measured using the net asset value per share (“NAV”) practical expedient. The ASU also removes certain disclosure requirements for investments that qualify, but do not utilize, the NAV practical expedient. The amendments in the ASU are effective for fiscal years beginning after December 15, 2015, and interim periods within those fiscal years. Management is currently evaluating the impact these changes will have on the Fund’s financial statements and related disclosures.
| 10. | Subsequent Events |
Management has evaluated subsequent events through the date these financial statements were available to be issued. Management has determined that there are no material events that would require disclosure in the Funds’ financial statements through this date.
82
Table of Contents
REPORT OF INDEPENDENT REGISTERED PUBLIC ACCOUNTING FIRM
RIDGEWORTH FUNDS March 31, 2016
To the Board of Trustees and Shareholders of RidgeWorth Funds:
In our opinion, the accompanying statements of assets and liabilities, including the schedules of portfolio investments, and the related statements of operations and of changes in net assets and the financial highlights present fairly, in all material respects, the financial position of Aggressive Growth Stock Fund, Capital Innovations Global Resources and Infrastructure Fund, International Equity Fund, Large Cap Growth Stock Fund, Large Cap Value Equity Fund, Mid-Cap Value Equity Fund, Small Cap Growth Stock Fund, Small Cap Value Equity Fund, Aggressive Growth Allocation Strategy, Conservative Allocation Strategy, Growth Allocation Strategy, and Moderate Allocation Strategy (twelve of the funds constituting RidgeWorth Funds, collectively the “Funds”) at March 31, 2016, the results of their operations for the periods then ended, the changes in their net assets and the financial highlights for each of the periods indicated, in conformity with accounting principles generally accepted in the United States of America. These financial statements and financial highlights (hereafter referred to as “financial statements”) are the responsibility of the Funds’ management. Our responsibility is to express an opinion on these financial statements based on our audits. We conducted our audits of these financial statements in accordance with the standards of the Public Company Accounting Oversight Board (United States). Those standards require that we plan and perform the audits to obtain reasonable assurance about whether the financial statements are free of material misstatement. An audit includes examining, on a test basis, evidence supporting the amounts and disclosures in the financial statements, assessing the accounting principles used and significant estimates made by management, and evaluating the overall financial statement presentation. We believe that our audits, which included confirmation of securities at March 31, 2016 by correspondence with the custodian, transfer agent and brokers, and application of alternative auditing procedures where securities purchased had not been received, provide a reasonable basis for our opinion.
The statements of operations and of changes in net assets and the financial highlights of the Capital Innovations Global Resources and Infrastructure Fund for the year or periods ended on November 30, 2015 and prior were audited by another independent registered public accounting firm whose report dated January 29, 2016 expressed an unqualified opinion on those statements and financial highlights.
PricewaterhouseCoopers LLP
Boston, Massachusetts
May 26, 2016
83
Table of Contents
RIDGEWORTH FUNDS March 31, 2016
(Unaudited)
The following Funds have designated long term capital gain distributions as follows:
Fund | Amount | |||
Aggressive Growth Stock Fund | $2,095,754 | |||
International Equity Fund | 2,000,010 | |||
Large Cap Growth Stock Fund | 23,322,257 | |||
Large Cap Value Equity Fund | 172,233,852 | |||
Mid-Cap Value Equity Fund | 125,921,077 | |||
Small Cap Growth Stock Fund | 21,567,281 | |||
Small Cap Value Equity Fund | 246,896,505 | |||
Aggressive Growth Allocation Strategy | 1,657,102 | |||
Conservative Allocation Strategy | 1,610,853 | |||
Growth Allocation Strategy | 3,848,880 | |||
Moderate Allocation Strategy | 10,251,561 | |||
For corporate shareholders, the following percentages of the total ordinary income distributions paid by the following Funds during the fiscal year ended March 31, 2016 qualify for the corporate dividends received deductions:
Fund | Dividend Received Deduction | |||
Large Cap Value Equity Fund | 95.60 | % | ||
Capital Innovations Global Resources and Infrastructure Fund | | 79.95 | | |
Mid-Cap Value Equity Fund | 48.17 | |||
Small Cap Value Equity Fund | 100.00 | |||
Aggressive Growth Allocation Strategy | 54.09 | |||
Conservative Allocation Strategy | 15.51 | |||
Growth Allocation Strategy | 40.78 | |||
Moderate Allocation Strategy | 22.75 | |||
In addition, the Funds may elect to pass through foreign taxes paid by the Funds to shareholders under Section 853 of the Internal Revenue Code. For the fiscal year ended March 31, 2016 the following funds elected to pass through foreign taxes as follows:
Fund | Amount | |||
International Equity Fund | $58,858 | |||
Aggressive Growth Allocation Strategy | 8,353 | |||
Conservative Allocation Strategy | 26,092 | |||
Growth Allocation Strategy | 48,919 | |||
Moderate Allocation Strategy | 56,669 | |||
For the fiscal year ended March 31, 2016, the following Funds paid qualified dividend income:
Fund | Qualified Dividend Income | |||
International Equity Fund | 100.00 | % | ||
Capital Innovations Global Resources and Infrastructure Fund | 100.00 | |||
Large Cap Value Equity Fund | 97.32 | |||
Mid-Cap Value Equity Fund | 50.98 | |||
Small Cap Value Equity Fund | 100.00 | |||
Aggressive Growth Allocation Strategy | 73.08 | |||
Conservative Allocation Strategy | 24.52 | |||
Growth Allocation Strategy | 66.63 | |||
Moderate Allocation Strategy | 39.24 | |||
84
Table of Contents
OTHER FEDERAL TAX INFORMATION (concluded)
RIDGEWORTH FUNDS March 31, 2016
(Unaudited)
The following RidgeWorth Funds intend to elect to pass through to shareholders the income tax credit for taxes paid to foreign countries for the fiscal year ended March 31, 2016.
Fund | Foreign Source Income | Foreign Tax Expense | ||||||
International Equity Fund | $617,915 | $58,858 | ||||||
Aggressive Growth Allocation Strategy | 32,642 | 8,353 | ||||||
Conservative Allocation Strategy | 99,496 | 26,092 | ||||||
Growth Allocation Strategy | 190,223 | 48,919 | ||||||
Moderate Allocation Strategy | 229,043 | 56,669 | ||||||
85
Table of Contents
TRUSTEES AND OFFICERS OF THE RIDGEWORTH FUNDS
RIDGEWORTH FUNDS March 31, 2016
(Unaudited)
Set forth below are the names, age, position with the Trust, length of term of office, and the principal occupations and, if applicable, other directorships held during at least the last five years of each of the persons currently serving as a Trustee or officer of the Trust. Unless otherwise noted, the address of each Trustee and officer is c/o RidgeWorth Investments®, 3333 Piedmont Road, Suite 1500, Atlanta, Georgia 30305. The Funds’ Statement of Additional Information includes more information about the Trustees and is available without charge, upon request, by calling 1-888-784-3863 and on the Funds’ website at www.ridgeworth.com.
| Name and Age | Position Held with the Trust | Term of Office and Length of Time Served | Principal Occupation(s) During the Past 5 Years | Number of Portfolios in the RidgeWorth Complex Overseen by Trustees | Other Directorships Held By Trustee During the Past 5 Years | |||||||
INDEPENDENT TRUSTEE | ||||||||||||
Tim E. Bentsen (August 1953) | Trustee | Indefinite; since 2012 | Lecturer—J.M. Tull School of Accounting, Terry College of Business at University of Georgia (2013-Present); Retired. Audit Partner and Account Executive (1993-2012); Lead Area Managing Partner (2005-2009); Atlanta Office Managing Partner (2003-2009), KPMG LLP. | 29 | Synovus Financial Corp.: Krispy Kreme Doughnuts, Inc. | |||||||
Jeffrey M. Biggar (February 1950) | Trustee | Indefinite; since 2007 | Director of Special Gifts for Hawken School (since May 2013); Managing Director, Little Mountain Group, LLC (an independent Registered Investment Advisor consulting firm) (2011-2013); Chief Operating Officer, Cedar Brook Financial Partners LLC (2008-2010); Chief Executive Officer and Senior Managing Director, Sterling (National City Corp.) (2000-2006). | 29 | Multi-Manager Master Portfolios LLC (3 portfolios; thru 2013) | |||||||
George C. Guynn (December 1942) | Trustee | Indefinite; since 2008 | Retired. President and CEO, Federal Reserve Bank of Atlanta (1996-2006). | 29 | SUSA Registered Fund, LLC; Oxford Industries; Acuity Brands, Inc. (thru 2014); Multi-Manager Master Portfolios LLC (3 portfolios; thru 2013); Genuine Parts Company (thru 2015) | |||||||
Sidney E. Harris (July 1949) | Trustee | Indefinite; since 2004 | Professor and Dean Emeritus (since April 2015), Professor (1997-2014), Dean (1997-2004), J. Mack Robinson College of Business, Georgia State University. | 29 | Total System Services, Inc.; Multi-Manager Master Portfolios LLC (3 portfolios; thru 2013). | |||||||
Connie D. McDaniel (April 1958) | Trustee | Indefinite; since 2005 | Retired. Vice President, Chief of Internal Audit, Corporate Audit Department (2009-2013); Vice President Global Finance Transformation (2007-2009); Vice President and Controller (1999-2007), The Coca-Cola Company. | 29 | Total System Services, Inc. | |||||||
INTERESTED TRUSTEE | ||||||||||||
Ashi S. Parikh* (February 1966) | Trustee | Indefinite; since 2013 | Chief Executive Officer and Chief Investment Officer, RidgeWorth Investments (2010-present); President and Chief Investment Officer (2008-2010). | 29 | None | |||||||
| * | Mr. Parikh is an “interested person” of the Trust, as defined in the 1940 Act, because he is an employee of the Investment Adviser. |
86
Table of Contents
TRUSTEES AND OFFICERS OF THE RIDGEWORTH FUNDS (concluded)
RIDGEWORTH FUNDS March 31, 2016
(Unaudited)
Name, Address and Age | Position(s) Held with the Trust | Term of Office and Length of Time Served | Principal Occupation(s) During the Past 5 Years | |||
Julia R. Short (November 1972) | President and Chief Executive Officer | One year; since 2007 | Managing Director, Product Manager, RidgeWorth Investments (since 2004). | |||
James L. Love (December 1968) | Chief Compliance Officer | One year; since 2016 | Managing Director and Chief Compliance Officer, RidgeWorth Investments (since 2016); Chief Compliance Officer and Deputy General Counsel, U.S. Global Investors (2007–2015). | |||
Benjamin H. Lowe (March 1978) | Treasurer and Chief Financial Officer | One year; since 2015 | Director of Fund Administration, RidgeWorth Investments (since 2011); Fund Controller, ALPS Fund Services, Inc. (2005–2011). | |||
James Bacik State Street Bank and Trust Co. 1 Iron Street Boston, MA 02210 (May 1975) | Assistant Treasurer | One year; since 2010 | Vice President, State Street Bank and Trust Company (since 2001).* | |||
Patrick J. Keniston Foreside Fund Officer Services, LLC Three Canal Plaza, Suite 100 Portland, ME 04101 (January 1964) | Anti-Money Laundering Officer and Identity Theft Prevention Officer | One year; since 2013 | Managing Director, Foreside Fund Officer Services, LLC (October 2008 – present). | |||
Karen Jacoppo-Wood State Street Bank and Trust Company 100 Huntington Avenue Tower 2, Third Floor, CPH0326 Boston, MA 02116 (December 1966) | Secretary and Chief Legal Officer | One year; since 2014 | Vice President and Managing Counsel, State Street Bank and Trust Company (since 2014); Vice President, RMR Advisors, Inc./RMR Funds (2007–2014).* |
| * | During the period indicated the officer has held various positions at State Street Bank and Trust Company and has provided his or her current title. |
87
Table of Contents
APPROVAL OF INVESTMENT ADVISORY AND SUBADVISORY AGREEMENTS
RIDGEWORTH FUNDS March 31, 2016
(Unaudited)
Renewal of Advisory and Subadvisory Agreements
The continuance of the Trust’s investment advisory agreement with RidgeWorth Capital Management LLC (the “Adviser”) and subadvisory agreements between the Adviser and each of Ceredex Value Advisors LLC, Silvant Capital Management LLC, and Zevenbergen Capital Investments LLC (collectively, the “Subadvisers”) must be specifically approved at least annually by (i) the vote of the Trustees or a vote of the shareholders of the Funds and (ii) the vote of a majority of the Trustees who are not parties to the agreements or “interested persons” of any party thereto (the “Independent Trustees”), as defined in the Investment Company Act of 1940 (the “1940 Act”), cast in person at a meeting called for the purpose of voting on such approval. New advisory agreements for the Trust are also subject to such approval initially and annually after their initial term is complete.
Each year, the Board of Trustees calls and holds a meeting to decide whether to approve the continuance of the Trust’s agreements for another year. In preparation for the meeting, the Board requests and reviews a wide variety of information from the Adviser and Subadvisers. The Trustees use this information, as well as other information that the Adviser, Subadvisers, and other service providers may submit to the Board, to help them decide whether to approve the agreements.
In considering the renewal of the agreements with the Adviser and Subadvisers, the Board requested and received material from the Adviser and Subadvisers in preparation for a special meeting of the Board held on October 8, 2015, and requested and reviewed additional material from the Adviser and Subadvisers in preparation for its quarterly meeting held on November 16-17, 2015, at which it specifically considered the renewal of the agreements. Such material included, among other things, information about: (a) the quality of the Adviser’s and Subadvisers’ investment management and other services; (b) the Adviser’s and Subadvisers’ investment management personnel; (c) the Adviser’s and Subadvisers’ operations and financial condition; (d) the Adviser’s and Subadvisers’ brokerage practices (including any soft dollar arrangements) and investment strategies; (e) the level of the advisory fees that the Adviser and Subadvisers charge the Funds compared with the fees they charge to comparable mutual funds or accounts; (f) the Funds’ overall fees and operating expenses compared with similar mutual funds; (g) the level of the Adviser’s and Subadvisers’ profitability from their Fund-related operations; (h) the Adviser’s and Subadvisers’ compliance systems; (i) the Adviser’s and Subadvisers’ policies and procedures for personal securities transactions; (j) the Adviser’s and Subadvisers’ reputation, expertise, and resources in domestic financial markets; and (k) the Funds’ performance compared with similar mutual funds. The Board also received a memorandum from fund counsel regarding the responsibilities of the Trustees in connection with their consideration of the agreements.
At the meetings, representatives from the Adviser and Subadvisers presented additional oral and written information to the Board to help the Board evaluate the Adviser’s and Subadvisers’ fees and other aspects of the agreements. The Board also considered information presented by the Adviser, Subadvisers, and other service providers at meetings held throughout the year. The Trustees discussed the written materials, oral presentations, and any other information that the Board received, and considered the approval of the agreements in light of this information.
Based on the Board’s deliberations and evaluation of the information it received, the Board, all of whose members are Independent Trustees, approved the renewal of the agreements with the Adviser and Subadvisers and determined that the compensation under the agreements is fair and reasonable in light of the services to be performed. The Board considered the following specific factors, none of which was controlling, and made the following conclusions:
Nature, Extent, and Quality of Services. The Board received and considered information regarding the nature, extent, and quality of services provided to the Funds by the Adviser and Subadvisers. In this regard, the Trustees evaluated, among other things, the Adviser’s and Subadvisers’ personnel, experience, track record, and compliance program. The Board considered the background and experience of the Adviser’s and Subadvisers’ senior management and the expertise of, and amount of attention given to the Funds by, their portfolio management teams. The Board reviewed the qualifications and backgrounds of the portfolio managers responsible for the day-to-day management of the Funds. The Board also reviewed information pertaining to the Adviser’s and Subadvisers’ organizational structure, senior management, investment operations, and other relevant information. The Board concluded that, within the context of its full deliberations, the nature, extent, and quality of the services provided to the Funds by the Adviser and Subadvisers supported the approval of the agreements.
88
Table of Contents
APPROVAL OF INVESTMENT ADVISORY AND SUBADVISORY AGREEMENTS (continued)
RIDGEWORTH FUNDS March 31, 2016
(Unaudited)
Performance. The Board considered the investment performance of each Fund, including any periods of outperformance and underperformance, both on an absolute basis and a comparative basis to indices and other funds within the same investment categories. Specifically, the Board considered Fund performance relative to peer groups and appropriate benchmarks in light of total return, yield, and market trends. As part of this review, the Board considered the composition of the peer group and selection criteria, as well as market risk and shareholder risk expectations. The Board considered the Adviser’s and Subadvisers’ explanations regarding specific performance issues. The Board concluded that, within the context of its full deliberations, the performance of the Funds, the Adviser, and the Subadvisers supported the approval of the agreements.
Fund Expenses. With respect to advisory fees, the Board considered the rate of compensation under the agreements and each Fund’s net operating expense ratio in comparison to those of comparable mutual funds. The Trustees also considered information about average expense ratios of comparable mutual funds in each Fund’s peer group. Finally, the Trustees considered the effect of the Adviser’s and Subadvisers’ waiver and reimbursement of fees and expenses, where applicable, to prevent total expenses from exceeding a specified amount and that, due to these waivers and reimbursements, net operating expenses have been maintained at competitive levels. The Board concluded that, within the context of its full deliberations, the expenses of the Funds are reasonable and supported the approval of the agreements.
Profitability. The Board reviewed information about the profitability of the Funds to the Adviser and Subadvisers and considered whether the level of profitability, if any, was reasonable and justified in light of the quality of the services rendered to the Funds. The Board concluded that, within the context of its full deliberations, the profitability of the Adviser and Subadvisers is within the range the Board considered reasonable.
Economies of Scale. The Board considered the existence of economies of scale and whether they were passed along to Fund shareholders through a graduated advisory fee schedule or other means, including any fee waivers and expense reimbursements by the Adviser and Subadvisers. The Board concluded that, within the context of its full deliberations, the Funds obtain reasonable benefit from economies of scale.
Approval of New Advisory and Subadvisory Agreements
At a meeting held on November 16-17, 2015, the Board of Trustees considered the proposed advisory agreement between RidgeWorth Capital Management LLC (the “Adviser”) and the Trust and the proposed subadvisory agreement between the Adviser and Capital Innovations LLC (the “Subadviser”), both with respect to the RidgeWorth Capital Innovations Global Resources and Infrastructure Fund (the “Fund”). After their initial two-year term, the agreements must be specifically approved at least annually by (i) the vote of the Trustees or a vote of the shareholders of the Fund and (ii) the vote of a majority of the Trustees who are not parties to the agreements or “interested persons” of any party thereto (the “Independent Trustees”), as defined in the Investment Company Act of 1940, cast in person at a meeting called for the purpose of voting on such approval. Each year after the initial two-year term, the Board will call and hold a meeting to decide whether to continue the agreements for an additional one-year term. In preparation for such meetings, the Board will request and review a wide variety of information from the Adviser and the Subadviser. The Trustees use this information, as well as other information that the Adviser, the Subadviser, and other service providers may submit to the Board, to help them decide whether to renew the agreements.
Prior to and at the November meeting at which the Trustees considered the agreements, the Board requested and reviewed materials from the Adviser and Subadviser to help the Trustees evaluate the proposed fees and other aspects of the agreements. The agreements were considered as part of the proposed reorganization of the Capital Innovations Global Agri, Timber, Infrastructure Fund (the “Predecessor Fund”) into the Fund, which was being proposed at the meeting as a new series of the Trust.
In considering whether to approve the agreements, the Board considered and discussed information and analysis provided by the Adviser and Subadviser. The Board considered all factors that it deemed to be relevant. In its deliberations, the Board did not identify any single factor that was paramount or controlling and individual Trustees may have attributed different weights to various factors. Certain factors considered by the Board are addressed in more detail below.
Nature, Extent, and Quality of Services. In considering the nature, extent, and quality of the services proposed to be provided by the Adviser and Subadviser, the Board reviewed the services to be provided and the qualifications and
89
Table of Contents
APPROVAL OF INVESTMENT ADVISORY AND SUBADVISORY AGREEMENTS (concluded)
RIDGEWORTH FUNDS March 31, 2016
(Unaudited)
backgrounds of the portfolio managers proposed to be responsible for managing the Fund. The Board also reviewed information set forth in the Subadviser’s Form ADV, which provides information about the firm, its management, and its business activities and affiliations. The Board considered the professional experience and qualifications of the Subadviser’s senior management and key professional personnel. The Board also considered the Subadviser’s operational capabilities and resources and its experience in managing investment portfolios. The Board noted that the Subadviser serves as subadviser to the Predecessor Fund and reviewed the Subadviser’s record in that role. The Board also noted that the Adviser serves as investment adviser to each series of the Trust and that its advisory agreement with respect to the existing series of the Trust also was being considered for renewal at the meeting. Based on its review, within the context of its full deliberations, the Board determined that it was satisfied with the nature, extent, and quality of services to be provided to the Fund by the Adviser and Subadviser.
Performance. In connection with the assessment of the Subadviser’s ability to perform its duties under the subadvisory agreement, the Board considered the sufficiency of its resources and concluded that the Subadviser had the financial resources necessary to perform its obligations under the agreement. The Board heard an overview of the Subadviser’s investment philosophy, the proposed portfolio construction of the assets of the Fund, and the investment techniques to be employed. The Board also reviewed the Subadviser’s investment performance with respect to the strategies proposed to be used in managing the Fund and the investment performance of the Subadviser with respect to its other accounts, including mutual funds and other pooled investment vehicles, and, specifically, the Predecessor Fund. The Board also assessed the Adviser’s ability to perform its duties under the advisory agreement, noting that the Adviser’s performance with respect to the other series of the Trust also was being assessed at the meeting. Based on its review, within the context of its full deliberations, the Board determined that it was satisfied with the information regarding the performance of the Adviser and the Subadviser.
Cost of Services. The Board considered the cost of the services to be provided by the Adviser and Subadviser, including estimated profitability analyses, and reviewed the fees to be paid pursuant to the agreements. In addition, the Board discussed the fee arrangement between the Adviser and the Subadviser, noting that the Adviser would pay the Subadviser out of the advisory fee it receives from the Fund. The Board also reviewed information regarding advisory fees of comparable funds and evaluated the proposed fee arrangement in light of this information and the factors that judicial decisions have specified as pertinent generally. The Board also considered the Adviser’s and the Subadviser’s contractual arrangement with the Fund to waive the advisory fee and/or reimburse expenses in an effort to control the expense ratio of the Fund, if necessary. Based on its review, within the context of its full deliberations, the Board determined that the fees proposed to be paid to the Adviser and Subadviser were fair and reasonable.
Economies of Scale. The Board considered the potential for economies of scale and noted that both the Adviser’s and the Subadviser’s fees include breakpoints.
Conclusion. Based on its deliberations and evaluation of the information described above, the Board, including the Independent Trustees, unanimously: (i) concluded that the terms of the agreements are fair and reasonable; (ii) concluded that the proposed compensation for the Adviser and Subadviser is fair and reasonable in light of the services that they will provide to the Fund; and (iii) agreed to approve the agreements for an initial term of two years.
90
Table of Contents
RIDGEWORTH FUNDS March 31, 2016
(Unaudited)
Shareholder Meeting Results
The Capital Innovations Global Agri, Timber, Infrastructure Fund (“Target Fund”), a series of Investment Managers Series Trust, reorganized into the RidgeWorth Capital Innovations Global Resources and Infrastructure Fund on February 19, 2016. As part of the reorganization there was a change to the independent registered public accounting firm. The Target Fund was audited by Tait, Weller & Baker LLP. RidgeWorth Capital Innovations Global Resources and Infrastructure Fund will be audited by PricewaterhouseCoopers LLP. A special meeting of shareholders of the Target Fund was held on February 17, 2016 at which shareholders were asked to approve the following:
Proposal: An Agreement and Plan of Reorganization providing for (i) the transfer of all of the assets of the Target Fund to the RidgeWorth Capital Innovations Global Resources and Infrastructure Fund (the “Acquiring Fund”), a newly created series of RidgeWorth Funds (the “Trust”), in exchange for (a) shares of each class of the Acquiring Fund corresponding to an outstanding class of shares of the Target Fund with an aggregate net asset value (“NAV”) equal to the aggregate NAV of the corresponding class of shares of the Target Fund, and (b) the Acquiring Fund’s assumption of all of the liabilities of the Target Fund, followed by (ii) the liquidating distribution by the Target Fund to its shareholders holding each class of its shares of the shares of the corresponding class of the Acquiring Fund in proportion to their respective holdings of shares of the applicable class of the Target Fund.
The proposal received the required number of affirmative votes for approval. The voting results are shown below.
Affirmative Votes | Objecting Votes | Abstaining Votes | ||
225,887.424 | 50.000 | 184.831 |
Expense Examples
As a shareholder of the RidgeWorth Funds, you incur two types of costs: (1) transaction costs, including sales charges (loads) on purchases; and (2) ongoing costs, including management fees, 12b-1 distribution and/or service fees, and other Fund expenses. These examples are intended to help you understand your ongoing costs (in dollars) of investing in the RidgeWorth Funds and to compare these costs with the ongoing costs of investing in other mutual funds.
These examples are based on an investment of $1,000 invested at the beginning of the period and held for the entire period from October 1, 2015 through March 31, 2016.
Actual Expenses
The table below provides information about actual account values and actual expenses. You may use the information below, together with the amount you invested, to estimate the expenses that you paid over the period. Simply divide your account value by $1,000 (for example, an $8,600 account value divided by $1,000 = 8.6), then multiply the result by the number in the table under the heading entitled “Expenses Paid During Period” to estimate the expenses you paid on your account during this period.
Fund | Class | Beginning Account Value 10/01/15 | Ending Account Value 03/31/16 | Expenses Paid During Period* 10/01/15-03/31/16 | Expense Ratio During Period** 10/01/15-03/31/16 | |||||||||||||||
Aggressive Growth Stock Fund | I Shares | $1,000.00 | $970.20 | $6.45 | 1.31 | % | ||||||||||||||
| A Shares | 1,000.00 | 969.10 | 7.63 | 1.55 | ||||||||||||||||
Capital Innovations Global Resources and Infrastructure Fund*** | I Shares | 1,000.00 | 930.70 | 4.12 | 1.28 | |||||||||||||||
| A Shares | 1,000.00 | 929.90 | 4.92 | 1.53 | ||||||||||||||||
| C Shares | 1,000.00 | 927.60 | 7.32 | 2.28 | ||||||||||||||||
International Equity Fund | I Shares | 1,000.00 | 1,057.40 | 6.38 | 1.24 | |||||||||||||||
| A Shares | 1,000.00 | 1,055.80 | 7.56 | 1.47 | ||||||||||||||||
| IS Shares | 1,000.00 | 1,058.50 | 5.87 | 1.14 | ||||||||||||||||
Large Cap Growth Stock Fund | I Shares | 1,000.00 | 1,030.00 | 4.92 | 0.97 | |||||||||||||||
| A Shares | 1,000.00 | 1,028.10 | 6.19 | 1.22 | ||||||||||||||||
| C Shares | 1,000.00 | 1,025.30 | 9.62 | 1.90 | ||||||||||||||||
| IS Shares | 1,000.00 | 1,028.80 | 4.51 | 0.89 | ||||||||||||||||
Large Cap Value Equity Fund | I Shares | 1,000.00 | 1,073.90 | 5.03 | 0.97 | |||||||||||||||
| A Shares | 1,000.00 | 1,072.30 | 6.58 | 1.27 | ||||||||||||||||
| C Shares | 1,000.00 | 1,070.70 | 8.85 | 1.71 | ||||||||||||||||
| IS Shares | 1,000.00 | 1,076.00 | 3.68 | 0.71 | ||||||||||||||||
91
Table of Contents
ADDITIONAL INFORMATION (continued)
RIDGEWORTH FUNDS March 31, 2016
(Unaudited)
Fund | Class | Beginning Account Value 10/01/15 | Ending Account Value 03/31/16 | Expenses Paid During Period* 10/01/15-03/31/16 | Expense Ratio During Period** 10/01/15-03/31/16 | |||||||||||||||
Mid-Cap Value Equity Fund | I Shares | $1,000.00 | $1,088.30 | $5.85 | 1.12 | % | ||||||||||||||
| A Shares | 1,000.00 | 1,087.60 | 7.31 | 1.40 | ||||||||||||||||
| C Shares | 1,000.00 | 1,085.30 | 9.33 | 1.79 | ||||||||||||||||
| IS Shares | 1,000.00 | 1,091.60 | 4.18 | 0.80 | ||||||||||||||||
Small Cap Growth Stock Fund | I Shares | 1,000.00 | 956.70 | 6.36 | 1.30 | |||||||||||||||
| A Shares | 1,000.00 | 956.50 | 6.85 | 1.40 | ||||||||||||||||
| C Shares | 1,000.00 | 952.80 | 10.01 | 2.05 | ||||||||||||||||
| IS Shares | 1,000.00 | 957.00 | 5.14 | 1.05 | ||||||||||||||||
Small Cap Value Equity Fund | I Shares | 1,000.00 | 1,072.00 | 6.22 | 1.20 | |||||||||||||||
| A Shares | 1,000.00 | 1,070.20 | 8.02 | 1.55 | ||||||||||||||||
| C Shares | 1,000.00 | 1,068.00 | 9.77 | 1.89 | ||||||||||||||||
Aggressive Growth Allocation Strategy | I Shares | 1,000.00 | 1,029.50 | 2.54 | 0.50 | |||||||||||||||
| A Shares | 1,000.00 | 1,026.90 | 3.55 | 0.70 | ||||||||||||||||
| C Shares | 1,000.00 | 1,025.00 | 6.58 | 1.30 | ||||||||||||||||
Conservative Allocation Strategy | I Shares | 1,000.00 | 1,020.20 | 1.52 | 0.30 | |||||||||||||||
| A Shares | 1,000.00 | 1,019.40 | 3.03 | 0.60 | ||||||||||||||||
| C Shares | 1,000.00 | 1,015.60 | 6.55 | 1.30 | ||||||||||||||||
Growth Allocation Strategy | I Shares | 1,000.00 | 1,031.00 | 2.54 | 0.50 | |||||||||||||||
| A Shares | 1,000.00 | 1,029.30 | 3.30 | 0.65 | ||||||||||||||||
| C Shares | 1,000.00 | 1,025.60 | 6.58 | 1.30 | ||||||||||||||||
Moderate Allocation Strategy | I Shares | 1,000.00 | 1,024.10 | 2.53 | 0.50 | |||||||||||||||
| A Shares | 1,000.00 | 1,023.40 | 3.29 | 0.65 | ||||||||||||||||
| C Shares | 1,000.00 | 1,020.40 | 6.47 | 1.28 | ||||||||||||||||
| * | Expenses are equal to the average account value times the Fund’s annualized expense ratio multiplied by the number of days in the most recent fiscal half-year divided by the number of days in the fiscal year. |
| ** | Annualized. |
| *** | Effective February 22, 2016, Capital Innovations Global Resources and Infrastructure Fund had a fiscal year date change from November 30 to March 31. Expenses are equal to annualized expense ratio, multiplied by the average account value over the period, multiplied by 122 (the number of days since February 22, 2016), then divided by 366. |
Hypothetical Example
The table below provides information about hypothetical account values and hypothetical expenses based on each RidgeWorth Fund’s actual expense ratio and an assumed rate of return of 5% per year before expenses, which is not the Fund’s actual return. The hypothetical account values and expenses may not be used to estimate the actual ending account balance or expenses you paid for the period. You may use this information to compare this 5% hypothetical example with the 5% hypothetical examples that appear in the shareholder reports of other funds.
Please note that the expenses shown in the table are meant to highlight your ongoing costs only and do not reflect any transactional costs, such as sales charges (loads) or redemption fees. Therefore, the table is useful in comparing ongoing costs only, and will not help you determine the relative total costs of owning different funds. In addition, if these transactional costs were included, your costs would have been higher.
Fund | Class | Beginning Account Value 10/01/15 | Ending Account Value 03/31/16 | Expenses Paid During Period* 10/01/15-03/31/16 | Expense Ratio During Period** 10/01/15-03/31/16 | |||||||||||||||
Aggressive Growth Stock Fund | I Shares | $1,000.00 | $1,018.50 | $6.61 | 1.31 | % | ||||||||||||||
| A Shares | 1,000.00 | 1,017.30 | 7.82 | 1.55 | ||||||||||||||||
Capital Innovations Global Resources and Infrastructure Fund*** | I Shares | 1,000.00 | 1,012.40 | 4.29 | 1.28 | |||||||||||||||
| A Shares | 1,000.00 | 1,011.60 | 5.13 | 1.53 | ||||||||||||||||
| C Shares | 1,000.00 | 1,009.10 | 7.63 | 2.28 | ||||||||||||||||
International Equity Fund | I Shares | 1,000.00 | 1,018.80 | 6.26 | 1.24 | |||||||||||||||
| A Shares | 1,000.00 | 1,017.70 | 7.42 | 1.47 | ||||||||||||||||
| IS Shares | **** | 1,000.00 | 1,019.30 | 5.76 | 1.14 | |||||||||||||||
Large Cap Growth Stock Fund | I Shares | 1,000.00 | 1,020.20 | 4.90 | 0.97 | |||||||||||||||
| A Shares | 1,000.00 | 1,018.90 | 6.16 | 1.22 | ||||||||||||||||
| C Shares | 1,000.00 | 1,015.50 | 9.57 | 1.90 | ||||||||||||||||
| IS Shares | 1,000.00 | 1,020.55 | 4.50 | 0.89 | ||||||||||||||||
Large Cap Value Equity Fund | I Shares | 1,000.00 | 1,020.20 | 4.90 | 0.97 | |||||||||||||||
| A Shares | 1,000.00 | 1,018.70 | 6.41 | 1.27 | ||||||||||||||||
| C Shares | 1,000.00 | 1,016.50 | 8.62 | 1.71 | ||||||||||||||||
| IS Shares | 1,000.00 | 1,021.45 | 3.59 | 0.71 | ||||||||||||||||
92
Table of Contents
ADDITIONAL INFORMATION (concluded)
RIDGEWORTH FUNDS March 31, 2016
(Unaudited)
Fund | Class | Beginning Account Value 10/01/15 | Ending Account Value 03/31/16 | Expenses Paid During Period* 10/01/15-03/31/16 | Expense Ratio During Period** 10/01/15-03/31/16 | |||||||||||||||
Mid-Cap Value Equity Fund | I Shares | $1,000.00 | $1,019.40 | $5.65 | 1.12 | % | ||||||||||||||
| A Shares | 1,000.00 | 1,018.00 | 7.06 | 1.40 | ||||||||||||||||
| C Shares | 1,000.00 | 1,016.10 | 9.02 | 1.79 | ||||||||||||||||
| IS Shares | 1,000.00 | 1,021.00 | 4.04 | 0.80 | ||||||||||||||||
Small Cap Growth Stock Fund | I Shares | 1,000.00 | 1,018.50 | 6.56 | 1.30 | |||||||||||||||
| A Shares | 1,000.00 | 1,018.00 | 7.06 | 1.40 | ||||||||||||||||
| C Shares | 1,000.00 | 1,014.80 | 10.33 | 2.05 | ||||||||||||||||
| IS Shares | 1,000.00 | 1,019.75 | 5.30 | 1.05 | ||||||||||||||||
Small Cap Value Equity Fund | I Shares | 1,000.00 | 1,019.00 | 6.06 | 1.20 | |||||||||||||||
| A Shares | 1,000.00 | 1,017.30 | 7.82 | 1.55 | ||||||||||||||||
| C Shares | 1,000.00 | 1,015.60 | 9.52 | 1.89 | ||||||||||||||||
Aggressive Growth Allocation Strategy | I Shares | 1,000.00 | 1,022.50 | 2.53 | 0.50 | |||||||||||||||
| A Shares | 1,000.00 | 1,021.50 | 3.54 | 0.70 | ||||||||||||||||
| C Shares | 1,000.00 | 1,018.50 | 6.56 | 1.30 | ||||||||||||||||
Conservative Allocation Strategy | I Shares | 1,000.00 | 1,023.50 | 1.52 | 0.30 | |||||||||||||||
| A Shares | 1,000.00 | 1,022.00 | 3.03 | 0.60 | ||||||||||||||||
| C Shares | 1,000.00 | 1,018.50 | 6.56 | 1.30 | ||||||||||||||||
Growth Allocation Strategy | I Shares | 1,000.00 | 1,022.50 | 2.53 | 0.50 | |||||||||||||||
| A Shares | 1,000.00 | 1,021.80 | 3.29 | 0.65 | ||||||||||||||||
| C Shares | 1,000.00 | 1,018.50 | 6.56 | 1.30 | ||||||||||||||||
Moderate Allocation Strategy | I Shares | 1,000.00 | 1,022.50 | 2.53 | 0.50 | |||||||||||||||
| A Shares | 1,000.00 | 1,021.80 | 3.29 | 0.65 | ||||||||||||||||
| C Shares | 1,000.00 | 1,018.60 | 6.46 | 1.28 | ||||||||||||||||
| * | Expenses are equal to the average account value times the Fund’s annualized expense ratio multiplied by the number of days in the most recent fiscal half-year divided by the number of days in the fiscal year. |
| ** | Annualized. |
| *** | Effective February 22, 2016, Capital Innovations Global Resources and Infrastructure Fund had a fiscal year date change from November 30 to March 31. Expenses (hypothetical expenses if IS Shares had been in existence from April 1, 2015) are equal to the Fund’s annualized expense ratio, multiplied by the average account value over the period, multiplied by 183 (the number of days in the most recent six-month period), then divided by 366. |
| **** | IS Shares for International Equity Fund commenced operations on September 1, 2015. Expenses (hypothetical expenses if IS Shares had been in existence from April 1, 2015) are equal to the Fund’s annualized expense ratio, multiplied by the average account value over the period, multiplied by 183 (the number of days in the most recent six-month period), then divided by 366. |
Proxy Voting Information
Information regarding the policies and procedures that the Funds use to determine how to vote proxies relating to portfolio securities is available without charge, upon request, by calling 1-888-784-3863. The information also is included in the Funds’ Statement of Additional Information, which is available on the Funds’ website at www.ridgeworth.com and on the Securities and Exchange Commission’s (“SEC”) website at www.sec.gov.
Information relating to how each Fund voted proxies relating to portfolio securities held during the most recent twelve months ended June 30 is available on the Funds’ website at www.ridgeworth.com and on the SEC’s website at www.sec.gov.
Quarterly Portfolio Holdings Information
The Funds file their complete schedule of portfolio holdings with the SEC for the first and third quarters of each fiscal year on Form N-Q. The Funds’ Forms N-Q are available free of charge on the SEC’s website at www.sec.gov. You may also review or, for a fee, copy those documents by visiting the SEC’s Public Reference Room in Washington, D.C. Information on the operation of the Public Reference Room may be obtained by calling the SEC at 1-800-SEC-0330.
93
Table of Contents
INVESTMENT ADVISER:
RidgeWorth Investments
3333 Piedmont Road, NE, Suite 1500
Atlanta, Georgia 30305
www.ridgeworth.com
INVESTMENT SUBADVISERS:
Capital Innovations, LLC
325 Forest Grove Drive, Suite 100
Pewaukee, WI 53072
www.capinnovations.com
Silvant Capital Management LLC
3333 Piedmont Road, NE, Suite 1500
Atlanta, Georgia 30305
www.silvantcapital.com
Zevenbergen Capital Investments LLC
601 Union Street, Suite 4600
Seattle, Washington 98101
www.zci.com
Ceredex Value Advisors LLC
301 East Pine Street, Suite 500
Orlando, Florida 32801
www.ceredexvalue.com
WCM Investment Management
281 Brooks Street
Laguna Beach, CA 92651
www.wcminvest.com
This information must be preceded or accompanied by a current prospectus for each Fund described. Before investing, investors should carefully read the prospectus or summary prospectus and consider the fund’s investment objectives, risks, charges and expenses. Please call 888.784.3863 or visit ridgeworth.com to obtain a prospectus or summary prospectus, which contains this and other information about the funds.
DISTRIBUTOR:
RIDGEWORTH DISTRIBUTORS LLC
RFAR-EQ-0316

Table of Contents

2016 ANNUAL REPORT
FIXED INCOME FUNDS
MARCH 31, 2016

RidgeWorth Investments is the trade name of RidgeWorth Capital Management LLC.
Table of Contents
RIDGEWORTH FUNDS March 31, 2016
| Letter to Shareholders | 1 | |||
| Management Discussion of Fund Performance | ||||
| Fixed Income Funds: | ||||
| 2 | ||||
| 4 | ||||
| 6 | ||||
| 8 | ||||
| 10 | ||||
| 12 | ||||
| 14 | ||||
| 16 | ||||
| 18 | ||||
| 20 | ||||
| 22 | ||||
| 24 | ||||
| 26 | ||||
| 28 | ||||
| 30 | ||||
| 32 | ||||
| 34 | ||||
| Financial Statements | ||||
| Schedules of Portfolio Investments | 36 | |||
| Statements of Assets and Liabilities | 111 | |||
| Statements of Operations | 115 | |||
| Statements of Changes in Net Assets | 119 | |||
| Financial Highlights | 125 | |||
| Notes to Financial Statements | 132 | |||
| Report of Independent Registered Public Accounting Firm | 159 | |||
| Other Information | ||||
| Other Federal Tax Information | 160 | |||
| Trustees and Officers of the RidgeWorth Funds | 161 | |||
| Additional Information | 165 | |||
Table of Contents
RIDGEWORTH FUNDS March 31, 2016
Dear Valued Shareholder,
We sincerely thank you for your continued business and support. Our primary objective is to help you achieve your investment goals, and we’re grateful you have placed your confidence in us. We aim to earn your trust through competitive investment performance and excellent client service. We hope we have met your expectations in both of these measures, and we look forward to continuing to serve as your asset manager in the months and years to come.
During the 12 months through March 31, 2016, the U.S. economy continued to grow, albeit at a slower pace than last year. The U.S. Federal Reserve in December 2015 took its first steps toward unwinding its long-running stimulus efforts, raising the federal funds rate by 25 basis points. However, the relatively weak improvement of the U.S. economy suggests that the Fed will move slowly to raise interest rates in the near term.
Two major themes during the period were the sharp decline in commodity prices and the strength of the U.S. dollar. These factors caused corporate earnings to struggle, posing headwinds for stocks. However, these headwinds currently appear to be ebbing as commodity prices—particularly the price of oil—have rebounded and the dollar has given back some of the considerable gains experienced since 2014.
Outside the U.S., countries such as China and Brazil struggled to realign economic priorities, contain excess debt and limit political turmoil, while slow economic growth challenged the euro zone. Central banks in many international markets adopted increasingly aggressive stimulus measures. We remain concerned that monetary policies abroad may be nearing the limits of their effectiveness, and we believe the decision by the European Central Bank and other central banks to push interest rates into uncharted negative territory has the potential to disrupt the global economy. We do expect, however, international developed markets to continue to recover, due in part to the continued strength of the U.S. economy, which is shouldering much of the burden of the global economic recovery.
Looking ahead, we believe bond yields will remain relatively low, but the Fed’s intention is to normalize monetary policy. The decline in commodity prices stoked concerns about certain bond issuers over the past year, especially those in the energy sector. This year will be key in terms of observing which ones will be able to service their debt.
Our outlook for the equity markets remains favorable, but with increased volatility due to the presidential race and global macro- headlines. We see opportunities in all equity styles. Finally, we continue to believe that a gradually firming economic environment will offer fresh opportunities to selective investors. We expect this opportunistic environment should mesh well with RidgeWorth’s bottom-up approach to security selection. We at RidgeWorth wish to thank you again for the trust and confidence you have placed in us, and we look forward to another successful year together.
Sincerely,

Ashi Parikh
Chief Executive Officer, Chief Investment Officer
RidgeWorth Investments
1
Table of Contents
Portfolio Managers
| • | James F. Keegan |
| • | Perry Troisi |
| • | Michael Rieger |
| • | Jonathan Yozzo |
| • | Carlos Catoya |
INVESTMENT CONCERNS
Mutual fund investing involves risk, including possible loss of principal. Bonds offer a relatively stable level of income, although bond prices will fluctuate providing the potential for principal gain or loss. Intermediate-term, higher-quality bonds generally offer less risk than longer-term bonds and a lower rate of return.
Mortgage-backed investments involve risk of loss due to prepayments and, like any bond, due to default. Because of the sensitivity of mortgage-related securities to changes in interest rates, the Fund’s performance may be more volatile than if it did not hold these securities.
Debt securities will generally lose value if interest rates increase. Interest rate risk is generally higher for investments with longer maturities or durations. Debt securities are subject to the risk that an issuer will fail to make timely payments of interest or principal or go bankrupt, reducing the Fund’s return. The lower the rating of a debt security, the higher its credit risk.
MANAGEMENT DISCUSSION OF FUND PERFORMANCE
How did the Fund perform against its benchmark for the fiscal year ended March 31, 2016?
The Seix Core Bond Fund returned 1.18% (I Shares). That compared to a 1.96% return for the Barclays U.S. Aggregate Bond Index.
What factors influenced the Fund’s performance for the fiscal year ended March 31, 2016?
Treasuries and high-grade corporate bonds benefited from a flight to quality among investors concerned about global economic growth. Those worries were fueled in part by a slowdown in China, related weakness in commodities and questions about the Fed’s future rate path. Corporate spreads widened during the period, detracting from absolute returns.
Security selection and asset allocation in the corporate sector dragged on the Fund’s return relative to its benchmark. A consistent underweight position in government-related issues such as agency bonds contributed positively to relative performance.
How do you plan to position the Fund, based on market conditions?
We expect the U.S. economy’s anemic growth to cause the Fed to maintain a relatively soft approach to interest rate increases. The direction of the financial markets is likely to have an increasing impact on the Fed’s interest rate strategy in the near term.
Concerns persist about the health of U.S. and world economies. U.S. economic growth has consistently underwhelmed throughout this recovery. Across the globe, deflationary pressures continue to persist due to excessive debt, slow productivity growth and a surplus of productive capacity. Given this environment, we expect interest rates to remain range-bound, with a bias toward the lower end, and we think credit spreads will remain volatile for the foreseeable future. Our investment strategy continues to prioritize safe income at a reasonable price.
2
Table of Contents
SEIX CORE BOND FUND
Growth of a $10,000 Investment (as of March 31, 2016)
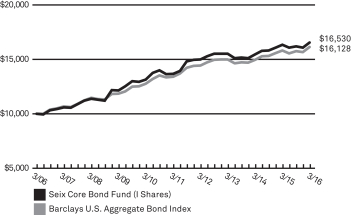 | This chart assumes an initial hypothetical investment of $10,000 made on 3/31/06. Total return is based on net change in the Net Asset Value (“NAV”) assuming reinvestment of distributions. Returns shown on this page include reinvestment of all dividends and other distributions.
The Fund’s performance is compared to the Barclays U.S. Aggregate Bond Index, which covers the U.S. dollar-denominated, investment-grade, fixed-rate, taxable bond market of SEC-registered securities. The Index includes bonds from the Treasury, Government-Related, Corporate, MBS (agency fixed-rate and hybrid ARM passthroughs), ABS and CMBS sectors. The Index is unmanaged and does not reflect the deduction of fees, such as investment management and fund accounting fees associated with a mutual fund. Investors cannot invest directly in an index. |
| Average Annual Total Returns as of 3/31/16 | ||||||||||||||||||||
| Seix Core Bond Fund | 1 Year | 3 Year | 5 Year | 10 Year | ||||||||||||||||
A Shares | without sales charge | 1.01% | 1.94% | 3.63% | 4.86% | |||||||||||||||
| with sales charge* | –3.78% | 0.29% | 2.62% | 4.35% | ||||||||||||||||
R Shares^ | 0.78% | 1.75% | 3.41% | 4.48% | ||||||||||||||||
I Shares | 1.18% | 2.17% | 3.89% | 5.15% | ||||||||||||||||
IS Shares** | 2.51% | 2.19% | 3.91% | 5.16% | ||||||||||||||||
| Barclays U.S. Aggregate Bond Index | 1.96% | 2.50% | 3.78% | 4.90% | ||||||||||||||||
| Prospectus Expense Ratio1 | Gross | |||||||||||||||||||
| A Shares | 0.62% | |||||||||||||||||||
| R Shares | 0.85% | |||||||||||||||||||
| I Shares | 0.45% | |||||||||||||||||||
| IS Shares | 0.33% | |||||||||||||||||||
Past performance does not guarantee future results. The performance data quoted represents past performance and current returns may be lower or higher. Total return figures include change in share price, reinvestment of dividends and capital gains and do not reflect taxes that a shareholder would pay on fund distributions or on the redemption of fund shares. The investment return and principal value will fluctuate so that an investor’s shares, when redeemed, may be worth more or less than the original cost. For performance data current to the most recent month end, visit our website at www.ridgeworth.com.
| * | Class A Share performance reflects the maximum front-end sales charge of 4.75%. |
| ^ | Effective at the close of business on 7/31/09, C Shares converted to R Shares and C Shares are no longer available for purchase. The performance shown prior to such date is based on the performance of the C Shares of the Fund and has not been adjusted to reflect R Shares expenses. |
| **IS | Shares were offered beginning on 8/3/15. The performance shown prior to such dates is based on performance of the I Shares of the Fund, and has not been adjusted to reflect IS Share expenses. If it had been, performance would have been higher. |
| 1 | This information is included in the most current prospectus available to current and prospective shareholders of the Fund. Additional information pertaining to the 3/31/16 expense ratios can be found in the financial highlights. |
Investment Weightings (as of March 31, 2016)
as a percentage of investments
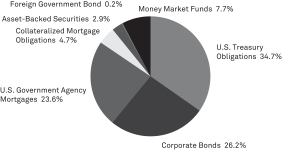
3
Table of Contents
Portfolio Managers
| • | James F. Keegan |
| • | Perry Troisi |
| • | Jonathan Yozzo |
| • | Carlos Catoya |
INVESTMENT CONCERNS
Mutual fund investing involves risk, including possible loss of principal. Bonds offer a relatively stable level of income, although bond prices will fluctuate providing the potential for principal gain or loss. Intermediate-term, higher-quality bonds generally offer less risk than longer-term bonds and a lower rate of return.
Debt securities will generally lose value if interest rates increase. Interest rate risk is generally higher for investments with longer maturities or durations. Debt securities are subject to the risk that an issuer will fail to make timely payments of interest or principal or go bankrupt, reducing the Fund’s return. The lower the rating of a debt security, the higher its credit risk.
MANAGEMENT DISCUSSION OF FUND PERFORMANCE
How did the Fund perform against its benchmark for the fiscal year ended March 31, 2016?
The Seix Corporate Bond Fund (I Shares) delivered a –0.29% return, versus 0.92% for the Barclays U.S. Corporate Investment Grade Index.
What factors influenced the Fund’s performance for the fiscal year ended March 31, 2016?
Treasuries and high-grade corporate bonds benefited from a flight to quality among investors concerned about global economic growth. Those worries were fueled in part by a slowdown in China, related weakness in commodities and questions about the Fed’s future rate path. Corporate spreads widened during the period, detracting from absolute returns.
The Fund’s performance relative to its benchmark benefited from tactical shifts in its allocation to the energy sector. The Fund’s underweight position in the financials sector also was a positive contributor.
Asset allocation and security selection within the oil field services and mid-stream energy sectors were the main detractors from performance relative to the index.
How do you plan to position the Fund, based on market conditions?
We expect the U.S. economy’s anemic growth to cause the Fed to maintain a relatively soft approach to interest rate increases. The direction of the financial markets is likely to have an increasing impact on the Fed’s interest rate strategy in the near term.
Concerns persist about the health of U.S. and world economies. U.S. economic growth has consistently underwhelmed throughout this recovery. Across the globe, deflationary pressures continue to persist due to excessive debt, slow productivity growth and a surplus of productive capacity. Given this environment, we expect interest rates to remain range-bound, with a bias toward the lower end, and we think credit spreads will remain volatile for the foreseeable future. Our investment strategy continues to prioritize safe income at a reasonable price.
4
Table of Contents
SEIX CORPORATE BOND FUND
Growth of a $10,000 Investment (as of March 31, 2016)
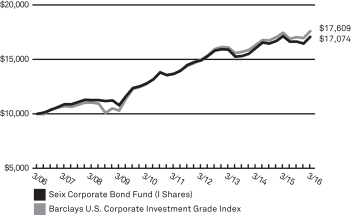 | This chart assumes an initial hypothetical investment of $10,000 made on 3/31/06. Total return is based on net change in the Net Asset Value (“NAV”) assuming reinvestment of distributions. Returns shown on this page include reinvestment of all dividends and other distributions.
The Fund’s performance is compared to the Barclays U.S. Corporate Investment Grade Index, which covers U.S. dollar-denominated, investment grade, fixed-rate, taxable securities sold by industrial, utility and financial issuers. The Index includes publicly issued U.S. corporate and foreign debentures and secured notes that meet specified maturity, liquidity, and quality requirements. The Index is unmanaged and does not reflect the deduction of fees, such as investment management and fund accounting fees associated with a mutual fund. Investors cannot invest directly in an index. |
| Average Annual Total Returns as of 3/31/16 | ||||||||||||||||||||
| Seix Corporate Bond Fund | 1 Year | 3 Year | 5 Year | 10 Year | ||||||||||||||||
A Shares | without sales charge | –0.52% | 2.09% | 4.25% | 5.17% | |||||||||||||||
| with sales charge* | –5.26% | 0.44% | 3.24% | 4.67% | ||||||||||||||||
C Shares | without CDSC | –1.22% | 1.42% | 3.56% | 4.46% | |||||||||||||||
| with CDSC* | –2.17% | 1.42% | 3.56% | 4.46% | ||||||||||||||||
I Shares | –0.29% | 2.41% | 4.57% | 5.50% | ||||||||||||||||
| Barclays U.S. Corporate Investment Grade Index | 0.92% | 3.03% | 5.17% | 5.82% | ||||||||||||||||
| Prospectus Expense Ratio1 | Gross | |||||||||||||||||||
| A Shares | 0.99% | |||||||||||||||||||
| C Shares | 1.67% | |||||||||||||||||||
| I Shares | 0.69% | |||||||||||||||||||
The Adviser has contractually agreed to waive fees and reimburse expenses until at least August 1, 2016 in order to keep total operating expenses (excluding underlying fund fees and expenses) from exceeding 0.95%, 1.65% and 0.70% for A, C and I Shares, respectively. Without these fee waivers, performance would have been lower.
Past performance does not guarantee future results. The performance data quoted represents past performance and current returns may be lower or higher. Total return figures include change in share price, reinvestment of dividends and capital gains and do not reflect taxes that a shareholder would pay on fund distributions or on the redemption of fund shares. The investment return and principal value will fluctuate so that an investor’s shares, when redeemed, may be worth more or less than the original cost. For performance data current to the most recent month end, visit our website at www.ridgeworth.com.
| * | Class A Share performance reflects the maximum front-end sales charge of 4.75% and Class C Shares reflect the maximum CDSC (contingent deferred sales charge) of 1.00% in year one only. |
| 1 | This information is included in the most current prospectus available to current and prospective shareholders of the Fund. Additional information pertaining to the 3/31/16 expense ratios can be found in the financial highlights. |
Investment Weightings (as of March 31, 2016)
as a percentage of investments
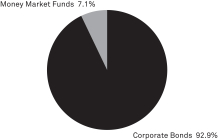
5
Table of Contents
SEIX FLOATING RATE HIGH INCOME FUND
Portfolio Managers
| • | George Goudelias |
| • | Vincent Flanagan, CFA |
INVESTMENT CONCERNS
Mutual fund investing involves risk, including possible loss of principal. Bond funds will tend to experience smaller fluctuations in value than stock funds. However, investors in any bond fund should anticipate fluctuations in price. Floating rate loans generally offer less interest rate risk than longer-term bonds and a lower rate of return.
Although the Fund’s yield may be higher than that of fixed income funds that purchase higher-rated securities, the potentially higher yield is a function of the greater risk that the Fund’s share price will decline.
Floating rate loans are typically senior and secured, in contrast to other below-investment grade securities. However, there is no guarantee that the value of the collateral will not decline, causing a loan to be substantially unsecured. Loans generally are subject to restrictions on resale, and they sometimes trade infrequently in the secondary market. Certain types of loans may limit the ability of the Fund to enforce its rights and may involve assuming additional credit risks.
Debt securities will generally lose value if interest rates increase. Interest rate risk is generally higher for investments with longer maturities or durations. Debt securities are subject to the risk that an issuer will fail to make timely payments of interest or principal or go bankrupt, reducing the Fund’s return. The lower the rating of a debt security, the higher its credit risk.
MANAGEMENT DISCUSSIONOF FUND PERFORMANCE
How did the Fund perform against its benchmark for the fiscal year ended March 31, 2016?
The Seix Floating Rate High Income Fund returned –1.50% (I Shares). That compared to a 1.70% return for the Credit Suisse Institutional Leveraged Loan Index, and a –1.11% return for the Credit Suisse Leveraged Loan Index.
The Fund employed the Credit Suisse Institutional Leveraged Loan Index for the first nine months of the 12-month period. Effective December 31, 2015, the Fund’s official benchmark has changed to the Credit Suisse Leveraged Loan Index, which we believe is more appropriate.
What factors influenced the Fund’s performance for the fiscal year ended March 31, 2016?
Investors sought out relatively safe parts of the fixed income markets during the period due to a range of macroeconomic issues, including worries about slower global economic growth, weakness in commodity prices and questions about the Federal Reserve’s interest rate strategy. Challenging technical factors, such as high levels of mutual fund redemptions, put pressure on the leveraged loan market and contributed to the Fund’s negative returns.
Even though security selection in the Energy sector was positive, the Fund’s overweight in the sector detracted from performance due to a decrease in oil prices, which impacted energy and energy-related credits. We tend to favor the Refiners sub-sector, which benefits from the decline in oil prices because it is their largest cost, and demand for diesel and gasoline has been consistent. Secondly, negative security selection in Broadcasting detracted from Fund performance; this underperformance mostly comes from one issuer—a large radio broadcasting credit with digital streaming services. The issuer is in the process of revising their earnings projections and providing more clarity on its capital structure.
Positive security selection in Utilities was additive to the Fund’s performance. Additionally, an overweight in BBs and split BB/Bs contributed, as these securities outperformed lower quality counterparts.
How do you plan to position the Fund, based on market conditions?
The outlook for leveraged loans remains constructive given attractive valuations. We will continue to watch fund flows and how they impact market technicals, as well as monitor corporate fundamentals throughout the upcoming earnings season. Ultimately, the current market conditions and global macro backdrop will steer investors towards active management, and further justify the need for fundamental analysis and risk mitigation; this is core to our investment style and management.
6
Table of Contents
SEIX FLOATING RATE HIGH INCOME FUND
Growth of a $10,000 Investment (as of March 31, 2016)
| This chart assumes an initial hypothetical investment of $10,000 made on 3/31/06. Total return is based on net change in the Net Asset Value (“NAV”) assuming reinvestment of distributions. Returns shown on this page include reinvestment of all dividends and other distributions.
Effective December 31, 2015 the benchmark index for the Fund changed from the Credit Suisse First Boston Leveraged Loan Index to the Credit Suisse Institutional Leveraged Loan Index.
Credit Suisse Leveraged Loan Index is a market-weighted index that tracks the performance of institutional leveraged loans. Credit Suisse Institutional Leveraged Loan Index is a subindex of the Credit Suisse Leveraged Loan Index which contains only institutional loan facilities priced above 90, excluding TL and TLa facilities and loans rated CC, C or in default. It is designed to more closely reflect the investment criteria of institutional investors. Investors cannot invest directly in an index. |
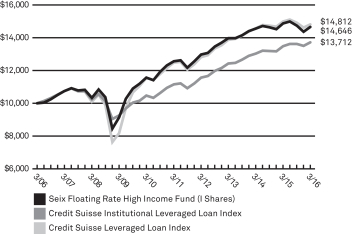
| Average Annual Total Returns as of 3/31/16 | ||||||||||||||||||||
| Seix Floating Rate High Income Fund | Inception Date† | 1 Year | 3 Year | 5 Year | 10 Year | |||||||||||||||
A Shares | without sales charge | 03/01/06 | –1.79% | 1.29% | 2.84% | 3.59% | ||||||||||||||
| with sales charge* | –4.27% | 0.44% | 2.32% | 3.32% | ||||||||||||||||
C Shares | without CDSC | 03/01/06 | –2.37% | 0.68% | 2.17% | 3.05% | ||||||||||||||
| with CDSC* | –3.31% | 0.68% | 2.17% | 3.05% | ||||||||||||||||
I Shares | 03/01/06 | –1.50% | 1.58% | 3.12% | 3.89% | |||||||||||||||
IS Shares** | 02/02/15 | –1.39% | 1.62% | 3.14% | 3.90% | |||||||||||||||
| Credit Suisse Leveraged Loan Index | –1.11% | 2.22% | 3.49% | 4.01% | ||||||||||||||||
Credit Suisse Institutional Leveraged Loan Index | 1.70% | 3.34% | 4.22% | 3.21% | ||||||||||||||||
| Prospectus Expense Ratio1 | Gross | |||||||||||||||||||
| A Shares | 0.91% | |||||||||||||||||||
| C Shares | 1.50% | |||||||||||||||||||
| I Shares | 0.61% | |||||||||||||||||||
| IS Shares | 0.47% | |||||||||||||||||||
Past performance does not guarantee future results. The performance data quoted represents past performance and current returns may be lower or higher. Total return figures include change in share price, reinvestment of dividends and capital gains and do not reflect taxes that a shareholder would pay on fund distributions or on the redemption of fund shares. The investment return and principal value will fluctuate so that an investor’s shares, when redeemed, may be worth more or less than the original cost. For performance data current to the most recent month end, visit our website at www.ridgeworth.com.
| * | Class A Share performance reflects the maximum front-end sales charge of 2.50% and Class C Shares reflect the maximum CDSC (contingent deferred sales charge) of 1.00% in year one only. |
| ** | IS Shares were offered beginning on 2/2/15. The performance shown prior to such dates is based on performance of the I Shares of the Fund, and has not been adjusted to reflect IS Share expenses. If it had been, performance would have been higher. |
| † | The A Shares and C Shares were offered beginning on 5/8/06 and 8/2/07, respectively. The performance shown prior to such dates is based on the performance of the I Shares of the Fund, and has not been adjusted to reflect A Share or C Share expenses. If it had been, the performance would have been lower. |
| 1 | This information is included in the most current prospectus available to current and prospective shareholders of the Fund. Additional information pertaining to the 3/31/16 expense ratios can be found in the financial highlights. |
Investment Weightings (as of March 31, 2016)
as a percentage of investments
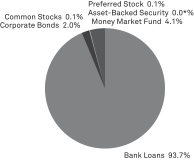
* Less than 0.05% of Net Assets.
7
Table of Contents
SEIX GEORGIA TAX-EXEMPT BOND FUND
Portfolio Manager
| • | Chris Carter, CFA |
INVESTMENT CONCERNS
Mutual fund investing involves risk, including possible loss of principal. Bonds offer a relatively stable level of income, although bond prices will fluctuate providing the potential for principal gain or loss. Intermediate-term, higher-quality bonds generally offer less risk than longer-term bonds and a lower rate of return.
The geographical concentration of portfolio holdings in the Fund may involve increased risk.
The Fund’s income may be subject to certain state and local taxes and, depending on your tax status, the federal alternative minimum tax.
The Fund is subject to the risk that principal value reacts in opposition to the movement of interest rates and that a rising interest rate environment increases the risk of loss of principal.
Debt securities will generally lose value if interest rates increase. Interest rate risk is generally higher for investments with longer maturities or durations. Debt securities are subject to the risk that an issuer will fail to make timely payments of interest or principal or go bankrupt, reducing the Fund’s return. The lower the rating of a debt security, the higher its credit risk.
MANAGEMENT DISCUSSION OF FUND PERFORMANCE
How did the Fund perform against its benchmark for the fiscal year ended March 31, 2016?
The Seix Georgia Tax-Exempt Bond Fund (I Shares) posted a total return of 3.50%. That compared to 12-month returns of 2.99% and 3.98% for the Lipper Other States Municipal Debt Funds Category and the Barclays U.S. Municipal Bond Index, respectively.
What factors influenced the Fund’s performance for the fiscal year ended March 31, 2016?
Municipal bonds (munis) benefited from increased investor demand, which helped drive prices up and yields down on five-, 10- and 30-year AAA-rated munis. Investors were attracted to munis as they searched for income and stability in a relatively volatile low-interest rate environment. Demand was strong enough to more than offset the impact of high new issuance.
Credit spreads tightened. Holdings issued by transportation and health care entities led performance among the larger sectors of the Fund’s benchmark.
The Fund’s greater-than-benchmark holdings of munis with maturities of 22 years or longer added to relative results, as the long bond sector outperformed the five-year bond sector by a wide margin. Overweight positions in the education and water and sewer sectors also helped boost the Fund’s relative return.
An underweight allocation to state general obligation bonds dragged on relative results, as did underweight allocations to the transportation and leasing sectors.
How do you plan to position the Fund, based on market conditions?
We remain constructive on the municipal sector because of its tax-exempt income, strong technical factors, healthy fundamentals, and attractive yields relative to other fixed income alternatives. Negative headlines still persist from some entities experiencing fiscal strain but do not reflect the financial condition of most municipal borrowers. Tight credit spreads continue to warrant a degree of caution at this point in the economic/credit cycle.
The Fund’s present curve posture and sector allocations seem appropriate given our forecasts for the economy and financial markets. We will continue to make tactical adjustments to the Fund, periodically, as a part of an active portfolio management process and all activity will occur within an investment grade construct.
8
Table of Contents
SEIX GEORGIA TAX-EXEMPT BOND FUND
Growth of a $10,000 Investment (as of March 31, 2016)
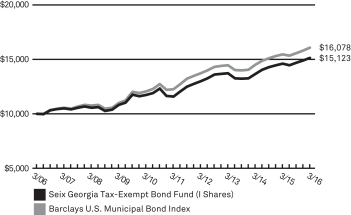 | This chart assumes an initial hypothetical investment of $10,000 made on 3/31/06. Total return is based on net change in the Net Asset Value (“NAV”) assuming reinvestment of distributions. Returns shown on this page include reinvestment of all dividends and other distributions.
The Fund’s performance is compared to the Barclays U.S. Municipal Bond Index, which covers the U.S. dollar-denominated long-term tax-exempt bond market. The Index has four main sectors: state and local general obligation bonds, revenue bonds, insured bonds, and prerefunded bonds. The Index is unmanaged and does not reflect the deduction of fees such as investment management and fund accounting fees associated with a mutual fund. Investors cannot invest directly in an index. |
| Average Annual Total Returns as of 3/31/16 | ||||||||||||||||||||
| Seix Georgia Tax-Exempt Bond Fund | 1 Year | 3 Year | 5 Year | 10 Year | ||||||||||||||||
A Shares | without sales charge | 3.40% | 3.21% | 5.36% | 4.07% | |||||||||||||||
| with sales charge* | –1.49% | 1.55% | 4.33% | 3.57% | ||||||||||||||||
I Shares | 3.50% | 3.33% | 5.50% | 4.22% | ||||||||||||||||
| Barclays U.S. Municipal Bond Index | 3.98% | 3.63% | 5.59% | 4.86% | ||||||||||||||||
| Prospectus Expense Ratio1 | Gross | |||||||||||||||||||
| A Shares | 0.73% | |||||||||||||||||||
| I Shares | 0.64% | |||||||||||||||||||
Past performance does not guarantee future results. The performance data quoted represents past performance and current returns may be lower or higher. Total return figures include change in share price, reinvestment of dividends and capital gains and do not reflect taxes that a shareholder would pay on fund distributions or on the redemption of fund shares. The investment return and principal value will fluctuate so that an investor’s shares, when redeemed, may be worth more or less than the original cost. For performance data current to the most recent month end, visit our website at www.ridgeworth.com.
| * | Class A Share performance reflects the maximum front-end sales charge of 4.75%. |
| 1 | This information is included in the most current prospectus available to current and prospective shareholders of the Fund. Additional information pertaining to the 3/31/16 expense ratios can be found in the financial highlights. |
Investment Weightings (as of March 31, 2016)
as a percentage of investments
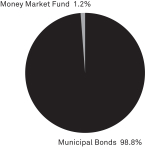
9
Table of Contents
SEIX HIGH GRADE MUNICIPAL BOND FUND
Portfolio Manager
| • | Ronald Schwartz, CFA |
INVESTMENT CONCERNS
Mutual fund investing involves risk, including possible loss of principal. Bonds offer a relatively stable level of income, although bond prices will fluctuate providing the potential for principal gain or loss. Intermediate-term, higher-quality bonds generally offer less risk than longer-term bonds and a lower rate of return.
The Fund is subject to the risk that principal value reacts in opposition to the movement of interest rates and that a rising interest rate environment increases the risk of loss of principal.
The geographical concentration of portfolio holdings in the Fund may involve increased risk.
The Fund’s income may be subject to certain state and local taxes and, depending on your tax status, the federal alternative minimum tax.
Debt securities will generally lose value if interest rates increase. Interest rate risk is generally higher for investments with longer maturities or durations. Debt securities are subject to the risk that an issuer will fail to make timely payments of interest or principal or go bankrupt, reducing the Fund’s return. The lower the rating of a debt security, the higher its credit risk.
MANAGEMENT DISCUSSION OF FUND PERFORMANCE
How did the Fund perform against its benchmark for the fiscal year ended March 31, 2016?
The Seix High Grade Municipal Bond Fund (I Shares) posted a total return of 3.85%. That compared to 12-month returns of 3.45% and 3.98% for the Lipper General & Insured Municipal Debt Funds Category and the Barclays U.S. Municipal Bond Index, respectively.
What factors influenced the Fund’s performance for the fiscal year ended March 31, 2016?
Municipal bonds (munis) benefited from rising investor demand during the 12-month period, which drove up prices on five-, 10- and 30-year AAA-rated munis and pushed yields down. Credit spreads continued to tighten as well. Investors were attracted to munis as they searched for income and stability amid low interest rates and relatively high volatility. The strong demand was enough to absorb the high volume of new munis issued during the period.
The Fund’s absolute performance benefited from holdings of transportation and health care issuers, which led returns among the larger sectors of the Fund’s benchmark. The Fund also benefited from exposure to bonds with maturities of 20 years or more, as longer duration bonds helped drive positive performance over the 12-month period.
In this positive environment, the Fund outperformed one benchmark while underperforming the other. The Fund’s greater-than-benchmark holdings with maturities of 22 years or longer added to relative results. Overweight positions in general obligation municipal bonds at the state and local levels also made strong contributions to relative performance. Meanwhile, underweight exposure to the strong-performing transportation sector detracted from relative performance, as did an underweight allocation to A-rated bonds, which also performed well during the period. The Fund’s allocation to cash dragged on relative performance.
How do you plan to position the Fund, based on market conditions?
Munis remain attractive based on their healthy fundamentals, strong technical factors, tax-exempt income and attractive yields relative to other fixed income investments. While fiscal strains on some issuers continue to generate negative headlines, the sector as a whole remains financially sound. However, the tight credit spreads at this late stage of the current economic and credit cycles mean a degree of caution is warranted.
10
Table of Contents
SEIX HIGH GRADE MUNICIPAL BOND FUND
Growth of a $10,000 Investment (as of March 31, 2016)
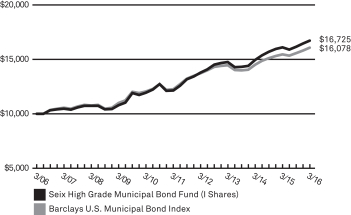 | This chart assumes an initial hypothetical investment of $10,000 made on 3/31/06. Total return is based on net change in the Net Asset Value (“NAV”) assuming reinvestment of distributions. Returns shown on this page include reinvestment of all dividends and other distributions.
The Fund’s performance is compared to the Barclays U.S. Municipal Bond Index, which covers the U.S. dollar-denominated long-term tax-exempt bond market. The Index has four main sectors: state and local general obligation bonds, revenue bonds, insured bonds, and prerefunded bonds. The Index is unmanaged and does not reflect the deduction of fees such as investment management and fund accounting fees associated with a mutual fund. Investors cannot invest directly in an index. |
| Average Annual Total Returns as of 3/31/16 | ||||||||||||||||||||
| Seix High Grade Municipal Bond Fund | 1 Year | 3 Year | 5 Year | 10 Year | ||||||||||||||||
A Shares | without sales charge | 3.70% | 4.08% | 6.45% | 5.11% | |||||||||||||||
| with sales charge* | –1.20% | 2.42% | 5.43% | 4.60% | ||||||||||||||||
I Shares | 3.85% | 4.26% | 6.61% | 5.28% | ||||||||||||||||
| Barclays U.S. Municipal Bond Index | 3.98% | 3.63% | 5.59% | 4.86% | ||||||||||||||||
| Prospectus Expense Ratio1 | Gross | |||||||||||||||||||
| A Shares | 0.81% | |||||||||||||||||||
| I Shares | 0.70% | |||||||||||||||||||
The Adviser has contractually agreed to waive fees and reimburse expenses until at least August 1, 2016 in order to keep total operating expenses (excluding underlying fund fees and expenses) from exceeding 0.80% and 0.65% for A and I Shares, respectively. Without these fee waivers, performance would have been lower. The indirect expenses of the Fund, which represent a pro-rata share of the expenses of the underlying funds in which the Fund invests, totaled 0.01% of net assets and are included in the expense ratios listed in the table above.
Past performance does not guarantee future results. The performance data quoted represents past performance and current returns may be lower or higher. Total return figures include change in share price, reinvestment of dividends and capital gains and do not reflect taxes that a shareholder would pay on fund distributions or on the redemption of fund shares. The investment return and principal value will fluctuate so that an investor’s shares, when redeemed, may be worth more or less than the original cost. For performance data current to the most recent month end, visit our website at www.ridgeworth.com.
| * | Class A Share performance reflects the maximum front–end sales charge of 4.75%. |
| 1 | This information is included in the most current prospectus available to current and prospective shareholders of the Fund. Additional information pertaining to the 3/31/16 expense ratios can be found in the financial highlights. |
Investment Weightings (as of March 31, 2016)
as a percentage of investments
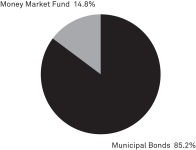
11
Table of Contents
Portfolio Managers
| • | Michael Kirkpatrick |
| • | James FitzPatrick, CFA |
INVESTMENT CONCERNS
Mutual fund investing involves risk, including possible loss of principal. Bonds offer a relatively stable level of income, although bond prices will fluctuate providing the potential for principal gain or loss. Intermediate-term, higher-quality bonds generally offer less risk than longer-term bonds and a lower rate of return.
Although the Fund’s yield may be higher than that of fixed income funds that purchase higher-rated securities, the potentially higher yield is a function of the greater risk that the Fund’s share price will decline.
The Fund is subject to the risk that principal value reacts in opposition to the movement of interest rates and that a rising interest rate environment increases the risk of loss of principal.
Debt securities will generally lose value if interest rates increase. Interest rate risk is generally higher for investments with longer maturities or durations. Debt securities are subject to the risk that an issuer will fail to make timely payments of interest or principal or go bankrupt, reducing the Fund’s return. The lower the rating of a debt security, the higher its credit risk.
MANAGEMENT DISCUSSION OF FUND PERFORMANCE
How did the Fund perform against its benchmark for the fiscal year ended March 31, 2016?
The Seix High Income Fund (I Shares) returned –5.31%. That compared to a –3.69% return for the Fund’s benchmark, the Barclays U.S. Corporate High Yield Bond Index.
What factors influenced the Fund’s performance for the fiscal year ended March 31, 2016?
The decrease in oil and other commodity prices was the largest negative influence on credit markets during the period. At the beginning of the 12-month period, the energy and metals and mining sectors accounted for nearly 20% of the benchmark. Although there were pockets of difficulty among some lower-quality issuers not related to energy or metals and mining, the majority of distress was experienced by issuers whose revenues were hurt by the downturn in commodity prices. The Fund’s absolute returns suffered in this environment.
Relative to its benchmark, the Fund benefited from underweight positions in both the energy and metals and mining sectors, and from an overweight position in the cable industry. Security selection among issuers in the chemical and retail industries also boosted relative results. Additionally, the Fund’s overweight position in cash positions helped buoy returns in a challenging market environment.
Underweight positions in the paper, construction and gaming industries hurt the Fund’s relative results. Security selection in the technology, satellite and transportation industries also weighed on relative performance.
How do you plan to position the Fund, based on market conditions?
Energy prices continue to stabilize and the fundamentals of non-commodity-related sectors remain moderately positive. Given that environment, we expect high-yield bonds to continue the recovery that began in February. We expect to see higher levels of defaults, especially in the energy and metals and mining sectors, but believe that current prices in those sectors more than account for the potential for losses. In our view, unfavorable technical factors pushed high-yield bond prices down to unsustainably low levels by the middle of February. Although high-yield bonds have rebounded, we believe that spreads have additional room to tighten, and more than compensate investors for any increase in defaults.
We have rotated into bonds with attractive potential upside, including specialty finance companies with stable cash flows that could provide a kind of backstop if the credit market deteriorates. We also have worked to identify investment grade energy companies that we expected to be downgraded to high-yield status, but offered very generous double-digit yields.
12
Table of Contents
SEIX HIGH INCOME FUND
Growth of a $10,000 Investment (as of March 31, 2016)
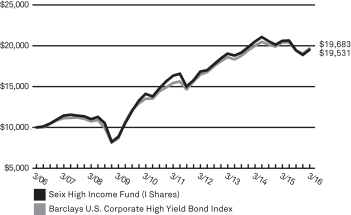 | This chart assumes an initial hypothetical investment of $10,000 made on 3/31/06. Total return is based on net change in the Net Asset Value (“NAV”) assuming reinvestment of distributions. Returns shown on this page include reinvestment of all dividends and other distributions.
The Fund’s performance is compared to the Barclays U.S. Corporate High Yield Bond Index, which covers the U.S. dollar-denominated, non-investment grade, fixed-rate, taxable corporate bond market. Securities are classified as high yield if the middle rating of Moody’s, Fitch, and S&P is Ba1/BB+/BB+ or below. The Index excludes Emerging Markets debt. The Index is unmanaged and does not reflect the deduction of fees, such as investment management and fund accounting fees associated with a mutual fund. Investors cannot invest directly in an index. |
| Average Annual Total Returns as of 3/31/16 | ||||||||||||||||||||
| Seix High Income Fund | 1 Year | 3 Year | 5 Year | 10 Year | ||||||||||||||||
A Shares | without sales charge | –5.68% | 0.54% | 3.34% | 6.61% | |||||||||||||||
| with sales charge* | –10.12% | –1.10% | 2.35% | 6.09% | ||||||||||||||||
R Shares^ | –5.87% | 0.37% | 3.09% | 6.20% | ||||||||||||||||
I Shares | –5.31% | 0.81% | 3.62% | 6.92% | ||||||||||||||||
IS Shares** | –5.30% | 0.90% | 3.67% | 6.95% | ||||||||||||||||
| Barclays U.S. Corporate High Yield Bond Index | –3.69% | 1.84% | 4.93% | 7.01% | ||||||||||||||||
| Prospectus Expense Ratio1 | Gross | |||||||||||||||||||
| A Shares | 0.99% | |||||||||||||||||||
| R Shares | 1.21% | |||||||||||||||||||
| I Shares | 0.77% | |||||||||||||||||||
| IS Shares | 0.63% | |||||||||||||||||||
Past performance does not guarantee future results. The performance data quoted represents past performance and current returns may be lower or higher. Total return figures include change in share price, reinvestment of dividends and capital gains and do not reflect taxes that a shareholder would pay on fund distributions or on the redemption of fund shares. The investment return and principal value will fluctuate so that an investor’s shares, when redeemed, may be worth more or less than the original cost. For performance data current to the most recent month end, visit our website at www.ridgeworth.com.
| * | Class A Share performance reflects the maximum front-end sales charge of 4.75%. |
| ^ | Effective at the close of business on 7/31/09, C Shares converted to R Shares and C Shares are no longer available for purchase. The performance shown prior to such date is based on the performance of the C Shares of the Fund and has not been adjusted to reflect R Share expenses. |
| ** | IS Shares were offered beginning on 8/1/14. The performance shown prior to such dates is based on performance of the I Shares of the Fund, and has not been adjusted to reflect IS Share expenses. If it had been, performance would have been higher. |
| 1 | This information is included in the most current prospectus available to current and prospective shareholders of the Fund. Additional information pertaining to the 3/31/16 expense ratios can be found in the financial highlights. |
Investment Weightings (as of March 31, 2016)
as a percentage of investments
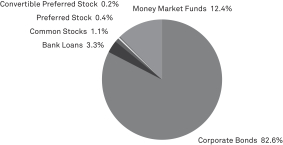
13
Table of Contents
Portfolio Managers
| • | Michael Kirkpatrick |
| • | James FitzPatrick, CFA |
INVESTMENT CONCERNS
Mutual fund investing involves risk, including possible loss of principal. Bond funds will tend to experience smaller fluctuations in value than stock funds. However, investors in any bond fund should anticipate fluctuations in price, especially for longer-term issues and in environments of rising interest rates.
Although the Fund’s yield may be higher than that of fixed income funds that purchase higher-rated securities, the potentially higher yield is a function of the greater risk that the Fund’s share price will decline.
Debt securities will generally lose value if interest rates increase. Interest rate risk is generally higher for investments with longer maturities or durations. Debt securities are subject to the risk that an issuer will fail to make timely payments of interest or principal or go bankrupt, reducing the Fund’s return. The lower the rating of a debt security, the higher its credit risk.
MANAGEMENT DISCUSSION OF FUND PERFORMANCE
How did the Fund perform against its benchmark for the fiscal year ended March 31, 2016?
The Seix High Yield Fund (I Shares) returned –5.23%. That compared to a –2.34% return for the Fund’s benchmark, the Bank of America Merrill Lynch U.S. High Yield BB-B Rated Constrained Index.
What factors influenced the Fund’s performance for the fiscal year ended March 31, 2016?
The decrease in oil and other commodity prices was the largest negative influence on credit markets during the period. At the beginning of the 12-month period, the energy and metals and mining sectors accounted for nearly 20% of the benchmark. Although there were pockets of difficulty among some lower-quality issuers not related to energy or metals and mining, the majority of distress was experienced by issuers whose revenues were hurt by the downturn in commodity prices. The Fund’s absolute returns suffered in this environment.
Relative to its benchmark, the Fund benefited from an underweight position in the energy sector, and from an overweight position in the cable industry. Security selection among issuers in the chemical and retail industries also boosted relative results. Additionally, the Fund’s overweight exposure to cash helped buoy returns in a challenging market environment.
Underweight positions in the telecommunications, gaming and healthcare industries hurt the Fund’s relative results. Security selection in the technology, satellite and steel industries also hurt relative performance.
How do you plan to position the Fund, based on market conditions?
Energy prices continue to stabilize and the fundamentals of non-commodity-related sectors remain moderately positive. Given that environment, we expect high-yield bonds to continue the recovery that began in February. We expect to see higher levels of defaults, especially in the energy and metals and mining sectors, but believe that current prices in those sectors more than account for the potential for losses. In our view, unfavorable technical factors pushed high-yield bond prices down to unsustainably low levels by the middle of February. And while high-yield bonds have rebounded, we believe that spreads have additional room to tighten, and more than compensate investors for any increase in defaults.
We have rotated into bonds with attractive potential upside, including specialty finance companies with stable cash flows that could provide a kind of backstop if the credit environment deteriorates. We also have worked to identify investment grade energy companies that we expected to be downgraded to high-yield status, but offered very generous double-digit yields.
14
Table of Contents
SEIX HIGH YIELD FUND
Growth of a $10,000 Investment (as of March 31, 2016)
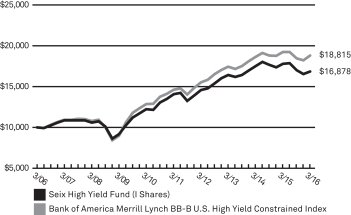 | This chart assumes an initial hypothetical investment of $10,000 made on 3/31/06. Total return is based on net change in the Net Asset Value (“NAV”) assuming reinvestment of distributions. Returns shown on this page include reinvestment of all dividends and other distributions.
The Fund’s performance is compared to the Bank of America Merrill Lynch BB-B U.S. High Yield Constrained Index, which tracks the performance of BB1 through B3 U.S. Dollar-denominated corporate bonds publicly issued in the U.S. domestic market and is restricted to a maximum of 2% per issuer. This Index is unmanaged and does not reflect the deduction of fees, such as investment management and fund accounting fees associated with a mutual fund. Investors cannot invest directly in an index. |
| Average Annual Total Returns as of 3/31/16 | ||||||||||||||||||||
| Seix High Yield Fund | 1 Year | 3 Year | 5 Year | 10 Year | ||||||||||||||||
A Shares | without sales charge | –5.36% | 0.64% | 3.44% | 5.21% | |||||||||||||||
| with sales charge* | –9.81% | –0.98% | 2.44% | 4.70% | ||||||||||||||||
R Shares^ | –5.52% | 0.41% | 3.16% | 4.67% | ||||||||||||||||
I Shares | –5.23% | 0.87% | 3.67% | 5.37% | ||||||||||||||||
| Bank of America Merrill Lynch BB-B U.S. High Yield Constrained Index | –2.34% | 2.53% | 5.15% | 6.52% | ||||||||||||||||
| Prospectus Expense Ratio1 | Gross | |||||||||||||||||||
| A Shares | 0.87% | |||||||||||||||||||
| R Shares | 1.04% | |||||||||||||||||||
| I Shares | 0.58% | |||||||||||||||||||
Past performance does not guarantee future results. The performance data quoted represents past performance and current returns may be lower or higher. Total return figures include change in share price, reinvestment of dividends and capital gains and do not reflect taxes that a shareholder would pay on fund distributions or on the redemption of fund shares. The investment return and principal value will fluctuate so that an investor’s shares, when redeemed, may be worth more or less than the original cost. For performance data current to the most recent month end, visit our website at www.ridgeworth.com.
| * | Class A Share performance reflects the maximum front-end sales charge of 4.75%. |
| ^ | Effective at the close of business on 7/31/09, C Shares converted to R Shares and C Shares are no longer available for purchase. The performance shown prior to such date is based on the performance of the C Shares of the Fund and has not been adjusted to reflect R Share expenses. |
| 1 | This information is included in the most current prospectus available to current and prospective shareholders of the Fund. Additional information pertaining to the 3/31/16 expense ratios can be found in the financial highlights. |
Investment Weightings (as of March 31, 2016)
as a percentage of investments
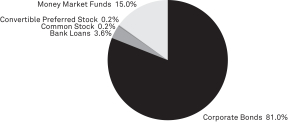
15
Table of Contents
SEIX INVESTMENT GRADE TAX-EXEMPT BOND FUND
Portfolio Manager
| • | Ronald Schwartz, CFA |
INVESTMENT CONCERNS
Mutual fund investing involves risk, including possible loss of principal. Bonds offer a relatively stable level of income, although bond prices will fluctuate providing the potential for principal gain or loss. Intermediate-term, higher-quality bonds generally offer less risk than longer-term bonds and a lower rate of return.
The Fund’s income may be subject to certain state and local taxes and, depending on your tax status, the federal alternative minimum tax.
The Fund is subject to the risk that principal value reacts in opposition to the movement of interest rates and that a rising interest rate environment increases the risk of loss of principal.
Debt securities will generally lose value if interest rates increase. Interest rate risk is generally higher for investments with longer maturities or durations. Debt securities are subject to the risk that an issuer will fail to make timely payments of interest or principal or go bankrupt, reducing the Fund’s return. The lower the rating of a debt security, the higher its credit risk.
MANAGEMENT DISCUSSION OF FUND PERFORMANCE
How did the Fund perform against its benchmark for the fiscal year ended March 31, 2016?
The Seix Investment Grade Tax-Exempt Bond Fund (I Shares) posted a total return of 2.96%. That compared to 12-month returns of 3.02% and 3.46% for the Lipper Intermediate Municipal Debt Funds Category and the Barclays U.S. Municipal Bond 1-15 Blend Index, respectively.
What factors influenced the Fund’s performance for the fiscal year ended March 31, 2016?
Municipal bonds (munis) benefited from rising investor demand during the 12-month period, which drove up prices on five-, 10- and 30-year AAA-rated munis and pushed yields down. Credit spreads continued to tighten. Investors were attracted to munis as they searched for income and stability amid low interest rates and relatively high volatility. The strong demand was enough to absorb the high volume of new munis issued during the period.
The Fund’s absolute performance benefited from its holdings of transportation and health care issuers, which led returns among the larger sectors of the Fund’s benchmark. The Fund also benefited from exposure to bonds with maturities of 20 years or more, as longer duration bonds helped drive positive performance over the 12-month period.
Underweight exposure to the strong-performing transportation sector detracted from relative performance, as did an underweight allocation to A-rated bonds, which also performed well during the period. The Fund’s allocation to cash also dragged on relative performance. The Fund’s greater-than-benchmark holdings of bonds with maturities of 20 years or longer added to relative results. An overweight position in the special tax sector also added to relative return, as did exposure to market refunding events.
How do you plan to position the Fund, based on market conditions?
Munis remain attractive based on their healthy fundamentals, strong technical factors, tax-exempt income and attractive yields relative to other fixed income investments. While fiscal strains on some issuers continue to generate negative headlines, the sector as a whole remains financially sound. However, the tight credit spreads at this late stage of the current economic and credit cycles warrant a degree of caution.
We feel the Fund’s current focus on longer term bonds targets the appropriate part of the yield curve. We will continue to take a tactical approach with a focus on a higher credit quality.
16
Table of Contents
SEIX INVESTMENT GRADE TAX-EXEMPT BOND FUND
Growth of a $10,000 Investment (as of March 31, 2016)
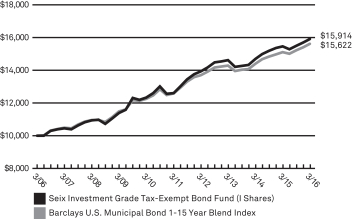 | This chart assumes an initial hypothetical investment of $10,000 made on 3/31/06. Total return is based on net change in the Net Asset Value (“NAV”) assuming reinvestment of distributions. Returns shown on this page include reinvestment of all dividends and other distributions.
The Barclays U.S. Municipal Bond 1-15 Year Blend Index is composed of tax-exempt bonds with maturities ranging between 1 and 15 years. The Index is unmanaged and does not reflect the deduction of fees, such as investment management and fund accounting fees associated with a mutual fund. Investors cannot invest directly in an index. |
| Average Annual Total Returns as of 3/31/16 | ||||||||||||||||||||
| Seix Investment Grade Tax-Exempt Bond Fund | 1 Year | 3 Year | 5 Year | 10 Year | ||||||||||||||||
A Shares | without sales charge | 2.89% | 2.72% | 4.61% | 4.51% | |||||||||||||||
| with sales charge* | –1.97% | 1.07% | 3.59% | 4.00% | ||||||||||||||||
I Shares | 2.96% | 2.88% | 4.78% | 4.76% | ||||||||||||||||
Barclays U.S. Municipal Bond 1-15 Year Blend Index | 3.46% | 3.05% | 4.42% | 4.56% | ||||||||||||||||
| Prospectus Expense Ratio1 | Gross | |||||||||||||||||||
| A Shares | 0.91% | |||||||||||||||||||
| I Shares | 0.68% | |||||||||||||||||||
The Adviser has contractually agreed to waive fees and reimburse expenses until at least August 1, 2016 in order to keep total operating expenses (excluding underlying fund fees and expenses) from exceeding 0.80% and 0.65% for A and I Shares, respectively. Without these fee waivers, performance would have been lower.
Past performance does not guarantee future results. The performance data quoted represents past performance and current returns may be lower or higher. Total return figures include change in share price, reinvestment of dividends and capital gains and do not reflect taxes that a shareholder would pay on fund distributions or on the redemption of fund shares. The investment return and principal value will fluctuate so that an investor’s shares, when redeemed, may be worth more or less than the original cost. For performance data current to the most recent month end, visit our website at www.ridgeworth.com.
| * | Class A Share performance reflects the maximum front-end sales charge of 4.75%. |
| 1 | This information is included in the most current prospectus available to current and prospective shareholders of the Fund. Additional information pertaining to the 3/31/16 expense ratios can be found in the financial highlights. |
Investment Weightings (as of March 31, 2016)
as a percentage of investments
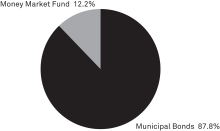
17
Table of Contents
Portfolio Managers
| • | James F. Keegan |
| • | Perry Troisi |
| • | Michael Rieger |
| • | Seth Antiles, Ph.D |
| • | Jonathan Yozzo |
| • | Carlos Catoya |
INVESTMENT CONCERNS
Mutual fund investing involves risk, including possible loss of principal. Bond funds will tend to experience smaller fluctuations in value than stock funds. However, investors in any bond fund should anticipate fluctuations in price, especially for longer-term issues and in environments of rising interest rates.
Mortgage-backed investments involve risk of loss due to prepayments and, like any bond, due to default. Because of the sensitivity of mortgage-related securities to changes in interest rates, the Fund’s performance may be more volatile than if it did not hold these securities.
Debt securities will generally lose value if interest rates increase. Interest rate risk is generally higher for investments with longer maturities or durations. Debt securities are subject to the risk that an issuer will fail to make timely payments of interest or principal or go bankrupt, reducing the Fund’s return. The lower the rating of a debt security, the higher its credit risk.
MANAGEMENT DISCUSSION OF FUND PERFORMANCE
How did the Fund perform against its benchmark for the fiscal year ended March 31, 2016?
The Seix Limited Duration Fund (I Shares) returned 0.26%. That compared to a 0.12% return for the Fund’s benchmark, the Bank of America Merrill Lynch 3 month U.S. Treasury Bill Index.
What factors influenced the Fund’s performance for the fiscal year ended March 31, 2016?
The U.S. Federal Reserve raised the federal funds rate by 25 basis points in December. Nevertheless, short-term interest rates remained near historical lows during the 12-month period. The Fund held a variety of short-duration mortgage- and asset-backed securities, which provided somewhat higher yields than Treasury bills of comparable durations. The income from such issues helped the Fund to provide a positive absolute return for the period, and to modestly outperform its Treasury-only benchmark index.
How do you plan to position the Fund, based on market conditions?
We expect the Fed to maintain a relatively soft approach to interest rate increases, given the U.S. economy’s anemic growth. The direction of the financial markets is likely to have an increasing impact on the Fed’s interest rate strategy in the near term.
Concerns persist about the health of U.S. and world economies. U.S. economic growth has consistently underwhelmed throughout this recovery. Across the globe, deflationary pressures continue to persist due to excessive debt, slow productivity growth and a surplus of productive capacity. Given this environment, we expect interest rates to remain range-bound, with a bias toward the lower end, and we think credit spreads will remain volatile for the foreseeable future. Our investment strategy continues to prioritize safe income at a reasonable price.
18
Table of Contents
SEIX LIMITED DURATION FUND
Growth of a $10,000 Investment (as of March 31, 2016)
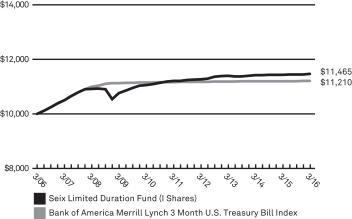 | This chart assumes an initial hypothetical investment of $10,000 made on 3/31/06. Total return is based on net change in the Net Asset Value (“NAV”) assuming reinvestment of distributions. Returns shown on this page include reinvestment of all dividends and other distributions.
The Fund’s performance is compared to the Bank of America Merrill Lynch 3 Month U.S. Treasury Bill Index, which tracks the monthly price-only and total return performance of a three-month Treasury bill, based on monthly average auction rates. The Index is unmanaged and does not reflect the deduction of fees, such as investment management and fund accounting fees associated with a mutual fund. Investors cannot invest directly in an index. |
| Average Annual Total Returns as of 3/31/16 | ||||||||||||||||||||
| Seix Limited Duration Fund | 1 Year | 3 Year | 5 Year | 10 Year | ||||||||||||||||
I Shares | 0.26% | 0.22% | 0.46% | 1.38% | ||||||||||||||||
| Bank of America Merrill Lynch 3 Month U.S. Treasury Bill Index | 0.12% | 0.07% | 0.08% | 1.15% | ||||||||||||||||
| Prospectus Expense Ratio1 | Gross | |||||||||||||||||||
| I Shares | 0.46% | |||||||||||||||||||
The Adviser has contractually agreed to waive fees and reimburse expenses until at least August 1, 2016 in order to keep total operating expenses (excluding underlying fund fees and expenses) from exceeding 0.35%. Without these fee waivers, performance would have been lower.
Past performance does not guarantee future results. The performance data quoted represents past performance and current returns may be lower or higher. Total return figures include change in share price, reinvestment of dividends and capital gains and do not reflect taxes that a shareholder would pay on fund distributions or on the redemption of fund shares. The investment return and principal value will fluctuate so that an investor’s shares, when redeemed, may be worth more or less than the original cost. For performance data current to the most recent month end, visit our website at www.ridgeworth.com.
| 1 | This information is included in the most current prospectus available to current and prospective shareholders of the Fund. Additional information pertaining to the 3/31/16 expense ratios can be found in the financial highlights. |
Investment Weightings (as of March 31, 2016)
as a percentage of investments
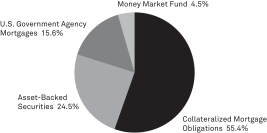
19
Table of Contents
SEIX NORTH CAROLINA TAX-EXEMPT BOND FUND
Portfolio Manager
| • | Chris Carter, CFA |
INVESTMENT CONCERNS
Mutual fund investing involves risk, including possible loss of principal. Bonds offer a relatively stable level of income, although bond prices will fluctuate providing the potential for principal gain or loss. Intermediate-term, higher-quality bonds generally offer less risk than longer-term bonds and a lower rate of return.
The geographical concentration of portfolio holdings in this Fund may involve increased risk.
The Fund’s income may be subject to certain state and local taxes and, depending on your tax status, the federal alternative minimum tax.
The Fund is subject to the risk that principal value reacts in opposition to the movement of interest rates and that a rising interest rate environment increases the risk of loss of principal.
Debt securities will generally lose value if interest rates increase. Interest rate risk is generally higher for investments with longer maturities or durations. Debt securities are subject to the risk that an issuer will fail to make timely payments of interest or principal or go bankrupt, reducing the Fund’s return. The lower the rating of a debt security, the higher its credit risk.
MANAGEMENT DISCUSSION OF FUND PERFORMANCE
How did the Fund perform relative to its benchmark for the fiscal year ended March 31, 2016?
The Seix North Carolina Tax-Exempt Bond Fund (I Shares) posted a total return of 3.39%. That compared to 12-month returns of 2.99% and 3.98% for the Lipper Other States Municipal Debt Funds Category and the Barclays U.S. Municipal Bond Index, respectively.
What factors influenced the Fund’s performance for the fiscal year ended March 31, 2016?
Municipal bonds (munis) benefited from increased investor demand, which helped drive prices up and yields down on five-, 10- and 30-year AAA-rated munis. Investors were attracted to munis as they searched for income and stability in a relatively volatile low-interest rate environment. Demand was strong enough to more than offset the impact of high new issuance.
Credit spreads tightened. Holdings issued by transportation and health care entities led performance among the larger sectors of the Fund’s benchmark.
The Fund’s greater-than-benchmark holdings of munis with maturities of 22 years or longer added to relative results, as the long bond sector outperformed the five-year bond sector by a wide margin. Overweight positions in the education and water and sewer sectors also helped boost the Fund’s relative return.
Underweight allocations to state and local general obligation bonds and to special tax and transportation sectors weighed on relative results, as did higher-than-benchmark holdings of AAA-rated securities.
How do you plan to position the Fund, based on market conditions?
We remain constructive on the municipal sector because of its tax-exempt income, strong technical factors, healthy fundamentals, and attractive yields relative to other fixed income alternatives. Negative headlines still persist from some entities experiencing fiscal strain but do not reflect the financial condition of most municipal borrowers. Tight credit spreads continue to warrant a degree of caution at this point in the economic/credit cycle.
The Fund’s present curve posture and sector allocations seem appropriate given our forecasts for the economy and financial markets. We will continue to make tactical adjustments to the Fund, periodically, as a part of an active portfolio management process and all activity will occur within an investment grade construct.
20
Table of Contents
SEIX NORTH CAROLINA TAX-EXEMPT BOND FUND
Growth of a $10,000 Investment (as of March 31, 2016)
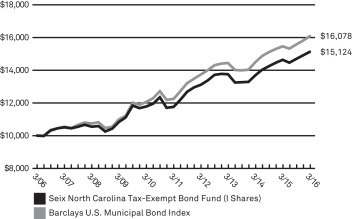 | This chart assumes an initial hypothetical investment of $10,000 made on 3/31/06. Total return is based on net change in the Net Asset Value (“NAV”) assuming reinvestment of distributions. Returns shown on this page include reinvestment of all dividends and other distributions.
The Fund’s performance is compared to the Barclays U.S. Municipal Bond Index, which covers the U.S. dollar-denominated long-term tax-exempt bond market. The Index has four main sectors: state and local general obligation bonds, revenue bonds, insured bonds, and prerefunded bonds. The Index is unmanaged and does not reflect the deduction of fees, such as investment management and fund accounting fees associated with a mutual fund. Investors cannot invest directly in an index. |
| Average Annual Total Returns as of 3/31/16 | ||||||||||||||||||||
| Seix North Carolina Tax-Exempt Bond Fund | 1 Year | 3 Year | 5 Year | 10 Year | ||||||||||||||||
A Shares | without sales charge | 3.23% | 3.08% | 5.02% | 4.06% | |||||||||||||||
| with sales charge* | –1.66% | 1.42% | 4.00% | 3.56% | ||||||||||||||||
I Shares | 3.39% | 3.23% | 5.17% | 4.22% | ||||||||||||||||
| Barclays U.S. Municipal Bond Index | 3.98% | 3.63% | 5.59% | 4.86% | ||||||||||||||||
| Prospectus Expense Ratio1 | Gross | |||||||||||||||||||
| A Shares | 0.79% | |||||||||||||||||||
| I Shares | 0.69% | |||||||||||||||||||
The Adviser has contractually agreed to waive fees and reimburse expenses until at least August 1, 2016 in order to keep total operating expenses (excluding underlying fund fees and expenses) from exceeding 0.80% and 0.65% for A and I Shares, respectively. Without these fee waivers, performance would have been lower.
Past performance does not guarantee future results. The performance data quoted represents past performance and current returns may be lower or higher. Total return figures include change in share price, reinvestment of dividends and capital gains and do not reflect taxes that a shareholder would pay on fund distributions or on the redemption of fund shares. The investment return and principal value will fluctuate so that an investor’s shares, when redeemed, may be worth more or less than the original cost. For performance data current to the most recent month end, visit our website at www.ridgeworth.com.
| * | Class A Share performance reflects the maximum front-end sales charge of 4.75% . |
| 1 | This information is included in the most current prospectus available to current and prospective shareholders of the Fund. Additional information pertaining to the 3/31/16 expense ratios can be found in the financial highlights |
Investment Weightings (as of March 31, 2016)
as a percentage of investments
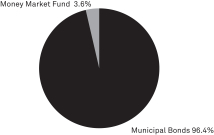
21
Table of Contents
Portfolio Managers
| • | James F. Keegan |
| • | Perry Troisi |
| • | Michael Rieger |
| • | Jonathan Yozzo |
| • | Carlos Catoya |
INVESTMENT CONCERNS
Mutual fund investing involves risk, including possible loss of principal. Bonds offer a relatively stable level of income, although bond prices will fluctuate providing the potential for principal gain or loss. Intermediate-term, higher-quality bonds generally offer less risk than longer-term bonds and a lower rate of return.
The Fund is subject to the risk that principal value reacts in opposition to the movement of interest rates and that a rising interest rate environment increases the risk of loss of principal.
Mortgage-backed investments involve risk of loss due to prepayments and, like any bond, due to default. Because of the sensitivity of mortgage-related securities to changes in interest rates, the Fund’s performance may be more volatile than if it did not hold these securities.
Debt securities will generally lose value if interest rates increase. Interest rate risk is generally higher for investments with longer maturities or durations. Debt securities are subject to the risk that an issuer will fail to make timely payments of interest or principal or go bankrupt, reducing the Fund’s return. The lower the rating of a debt security, the higher its credit risk.
MANAGEMENT DISCUSSION OF FUND PERFORMANCE
How did the Fund perform against its benchmark for the fiscal year ended March 31, 2016?
The Seix Short-Term Bond Fund (I Shares) returned 0.68%. That compares to a 1.04% return for the Fund’s benchmark, the Barclays 1-3 Year Government/Credit Index.
What factors influenced the Fund’s performance for the fiscal year ended March 31, 2016?
Treasuries and high-grade corporate bonds benefited from a flight to quality among investors concerned about global economic growth. Those worries were fueled in part by a slowdown in China, related weakness in commodities and questions about the Fed’s future rate path. The Federal Reserve’s December decision to raise the federal funds rate moved short-term Treasury yields higher, reducing absolute returns. Coupon income during the period helped offset the negative impact of higher interest rates.
The primary driver of the Fund’s performance relative to its benchmark was the overweight position in primary spread sectors, including corporate bonds, and securitized sectors such as asset-back securities (ABS), residential mortgage-backed securities (RMBS) and commercial mortgage-backed securities (CMBS). In this low-rate environment, the Fund’s fees were the largest detractor from relative results.
How do you plan to position the Fund, based on market conditions?
We expect the U.S. economy’s anemic growth to cause the Fed to maintain a relatively soft approach to interest rate increases. The direction of the financial markets is likely to have an increasing impact on the Fed’s interest rate strategy in the near term.
Concerns persist about the health of U.S. and world economies. U.S. economic growth has consistently underwhelmed throughout this recovery. Across the globe, deflationary pressures continue to persist due to excessive debt, slow productivity growth and a surplus of productive capacity. Given this environment, we expect interest rates to remain range-bound, with a bias toward the lower end, and we think credit spreads will remain volatile for the foreseeable future. Our investment strategy continues to prioritize safe income at a reasonable price.
22
Table of Contents
SEIX SHORT-TERM BOND FUND
Growth of a $10,000 Investment (as of March 31, 2016)
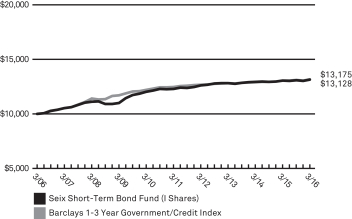 | This chart assumes an initial hypothetical investment of $10,000 made on 3/31/06. Total return is based on net change in the Net Asset Value (“NAV”) assuming reinvestment of distributions. Returns shown on this page include reinvestment of all dividends and other distributions.
The Fund’s performance is compared to the Barclays 1-3 Year Government/Credit Index. The Barclays 1-3 Year Government/Credit Index (Barclay’s Index) is the 1-3 year component of the U.S. Government/Credit Index. The Barclays Index includes securities in the Barclays Government and Credit Indices. The Government Index includes treasuries (i.e., public obligations of the U.S. Treasury that have remaining maturities of more than one year) and agencies (i.e., publicly issued debt of U.S. Government agencies, quasi-federal corporations, and corporate or foreign debt guaranteed by the U.S. Government). The Barclay’s Index includes publicly issued U.S. corporate and foreign debentures and secured notes that meet specified maturity, liquidity, and quality requirements. The Index is unmanaged and does not reflect the deduction of fees, such as investment management and fund accounting fees associated with a mutual fund. Investors cannot invest directly in an index. |
| Average Annual Total Returns as of 3/31/16 | ||||||||||||||||||||
| Seix Short-Term Bond Fund | 1 Year | 3 Year | 5 Year | 10 Year | ||||||||||||||||
A Shares | without sales charge | 0.58% | 0.58% | 1.09% | 2.54% | |||||||||||||||
| with sales charge* | –1.97% | –0.27% | 0.57% | 2.28% | ||||||||||||||||
C Shares | without CDSC | 0.00% | 0.02% | 0.44% | 1.81% | |||||||||||||||
| with CDSC* | –1.00% | 0.02% | 0.44% | 1.81% | ||||||||||||||||
I Shares | 0.68% | 0.79% | 1.32% | 2.76% | ||||||||||||||||
Barclays 1-3 Year Government/Credit Index | 1.04% | 0.95% | 1.14% | 2.80% | ||||||||||||||||
| Prospectus Expense Ratio1 | Gross | |||||||||||||||||||
| A Shares | 0.81% | |||||||||||||||||||
| C Shares | 1.58% | |||||||||||||||||||
| I Shares | 0.67% | |||||||||||||||||||
The Adviser has contractually agreed to waive fees and reimburse expenses until at least August 1, 2016 in order to keep total operating expenses (excluding underlying fund fees and expenses) from exceeding 0.80%, 1.60% and 0.60% for A, C and I Shares, respectively. Without these fee waivers, performance would have been lower.
Past performance does not guarantee future results. The performance data quoted represents past performance and current returns may be lower or higher. Total return figures include change in share price, reinvestment of dividends and capital gains and do not reflect taxes that a shareholder would pay on fund distributions or on the redemption of fund shares. The investment return and principal value will fluctuate so that an investor’s shares, when redeemed, may be worth more or less than the original cost. For performance data current to the most recent month end, visit our website at www.ridgeworth.com.
| * | Class A Share performance reflects the maximum front-end sales charge of 2.50% and Class C Shares reflect the maximum CDSC (contingent deferred sales charge) of 1.00% in year one only. |
| 1 | This information is included in the most current prospectus available to current and prospective shareholders of the Fund. Additional information pertaining to the 3/31/16 expense ratios can be found in the financial highlights. |
Investment Weightings (as of March 31, 2016)
as a percentage of investments
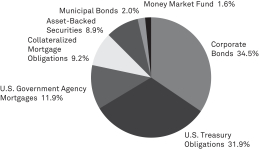
23
Table of Contents
SEIX SHORT-TERM MUNICIPAL BOND FUND
Portfolio Managers
| • | Ronald Schwartz, CFA |
| • | Dusty L. Self |
INVESTMENT CONCERNS
Mutual fund investing involves risk, including possible loss of principal. Bonds offer a relatively stable level of income, although bond prices will fluctuate providing the potential for principal gain or loss. Intermediate-term, higher-quality bonds generally offer less risk than longer-term bonds and a lower rate of return.
The geographical concentration of portfolio holdings in this fund may involve increased risk.
The Fund’s income may be subject to certain state and local taxes and, depending on your tax status, the federal alternative minimum tax.
The Fund is subject to the risk that principal value reacts in opposition to the movement of interest rates and that a rising interest rate environment increases the risk of loss of principal.
Debt securities will generally lose value if interest rates increase. Interest rate risk is generally higher for investments with longer maturities or durations. Debt securities are subject to the risk that an issuer will fail to make timely payments of interest or principal or go bankrupt, reducing the Fund’s return. The lower the rating of a debt security, the higher its credit risk.
MANAGEMENT DISCUSSION OF FUND PERFORMANCE
How did the Fund perform against its benchmark for the fiscal year ended March 31, 2016?
The Seix Short-Term Municipal Bond Fund (I Shares) posted a total return of 0.41%. That compares to 12-month returns of 0.56% and 1.51% for the Lipper Short Municipal Debt Funds Category and the Barclays 1-5 Year Municipal Bond Index, respectively.
What factors influenced the Fund’s performance for the fiscal year ended March 31, 2016?
Rising investor demand for longer-term municipal bonds (munis) resulted in a flattening of the yield curve during the 12-month period. Yields on five and 10-year AAA-rated munis declined while the yield on 2-year AAA-rated munis rose. Credit spreads continued to tighten as well. Investors were attracted to munis as they searched for income and stability amid low interest rates and relatively high volatility. The strong demand was enough to absorb the high volume of new munis issued during the period.
The Fund’s absolute performance benefited from holdings of pre-refunded and state general obligation bonds, which led performance among the larger sectors of the Fund’s benchmark.
An underweight allocation to the strong- performing pre-refunded sector dragged on relative results. The Fund’s allocation to cash also detracted, as did a lower-than-benchmark allocation to the three- and five-year durations section of the muni yield curve. Security selection in the lease sector and exposure to A-rated electric issuers also weighed on the Fund’s performance relative to its benchmarks. Meanwhile, the Fund’s overweight allocation to the water and sewer sector and to AAA-rated securities helped relative results.
How do you plan to position the Fund, based on market conditions?
Munis remain attractive based on their healthy fundamentals, strong technical factors, tax-exempt income and attractive yields relative to other fixed income investments. While fiscal strains on some issuers continue to generate negative headlines, the sector as a whole remains financially sound. However, the tight credit spreads at this late stage of the current economic and credit cycles mean a degree of caution is warranted.
We feel the Fund’s current yield curve focus and sector allocations remain appropriate given our economic forecasts. We will continue to take a tactical approach with a focus on a higher credit quality.
24
Table of Contents
SEIX SHORT-TERM MUNICIPAL BOND FUND
Growth of a $10,000 Investment (as of March 31, 2016)
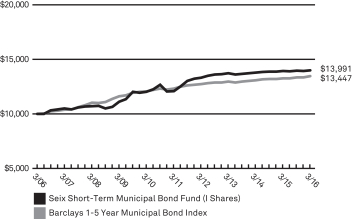 | This chart assumes an initial hypothetical investment of $10,000 made on 3/31/06. Total return is based on net change in the Net Asset Value (“NAV”) assuming reinvestment of distributions. Returns shown on this page include reinvestment of all dividends and other distributions.
The Fund’s performance is compared to the Barclays 1-5 Year Municipal Bond Index, which covers investment grade tax-exempt municipal bonds with maturities of 1-6 years. The Index is unmanaged and does not reflect the deduction of fees, such as investment management and fund accounting fees associated with a mutual fund. Investors cannot invest directly in an index. |
| Average Annual Total Returns as of 3/31/16 | ||||||||||||||||||||
| Seix Short-Term Municipal Bond Fund | 1 Year | 3 Year | 5 Year | 10 Year | ||||||||||||||||
A Shares* | without sales charge | 0.23% | 0.51% | 2.82% | 3.31% | |||||||||||||||
| with sales charge** | –2.31% | –0.34% | 2.30% | 3.05% | ||||||||||||||||
I Shares | 0.41% | 0.66% | 2.97% | 3.42% | ||||||||||||||||
| Barclays 1-5 Year Municipal Bond Index | 1.51% | 1.27% | 1.77% | 3.01% | ||||||||||||||||
| Prospectus Expense Ratio1 | Gross | |||||||||||||||||||
| A Shares | 0.76% | |||||||||||||||||||
| I Shares | 0.63% | |||||||||||||||||||
The Adviser has contractually agreed to waive fees and reimburse expenses until at least August 1, 2016 in order to keep total operating expenses (excluding underlying fund fees and expenses) from exceeding 0.68% and 0.48% for A and I Shares, respectively. Without these fee waivers, performance would have been lower. The indirect expenses of the Fund, which represent a pro-rata share of the expenses of the underlying funds in which the Fund invests, totaled 0.01% of net assets and are included in the expense ratios listed in the table above.
Past performance does not guarantee future results. The performance data quoted represents past performance and current returns may be lower or higher. Total return figures include change in share price, reinvestment of dividends and capital gains and do not reflect taxes that a shareholder would pay on fund distributions or on the redemption of fund shares. The investment return and principal value will fluctuate so that an investor’s shares, when redeemed, may be worth more or less than the original cost. For performance data current to the most recent month end, visit our website at www.ridgeworth.com.
| * | Prior to August 1, 2009, there were no assets in Class A Shares. The performance shown prior to such date is based on the performance of the I Shares of the Fund and has not been adjusted to reflect A Shares expenses. If it had been, performance would have been lower. |
| ** | Class A Shares performance reflects the maximum front-end sales charge of 2.50%. |
| 1 | This information is included in the most current prospectus available to current and prospective shareholders of the Fund. Additional information pertaining to the 3/31/16 expense ratios can be found in the financial highlights. |
Investment Weightings (as of March 31, 2016)
as a percentage of investments
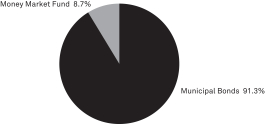
25
Table of Contents
Portfolio Managers
| • | James F. Keegan |
| • | Perry Troisi |
| • | Michael Rieger |
| • | Seth Antiles, Ph.D. |
| • | Jonathan Yozzo |
| • | Carlos Catoya |
INVESTMENT CONCERNS
Mutual fund investing involves risk, including possible loss of principal. Bond funds will tend to experience smaller fluctuations in value than stock funds. However, investors in any bond fund should anticipate fluctuations in price, especially for longer-term issues and in environments of rising interest rates.
Mortgage-backed investments involve risk of loss due to prepayments and, like any bond, due to default. Because of the sensitivity of mortgage-related securities to changes in interest rates, the Fund’s performance may be more volatile than if it did not hold these securities.
Debt securities will generally lose value if interest rates increase. Interest rate risk is generally higher for investments with longer maturities or durations. Debt securities are subject to the risk that an issuer will fail to make timely payments of interest or principal or go bankrupt, reducing the Fund’s return. The lower the rating of a debt security, the higher its credit risk.
MANAGEMENT DISCUSSION OF FUND PERFORMANCE
How did the Fund perform against its benchmark for the fiscal year ended March 31, 2016?
The Seix Total Return Bond Fund (I Shares) returned 1.35%. That compares to a 1.96% return for the Fund’s benchmark, the Barclays U.S. Aggregate Bond Index.
What factors influenced the Fund’s performance for the fiscal year ended March 31, 2016?
Treasuries and high-grade corporate bonds benefited from a flight to quality among investors concerned about global economic growth. Those worries were fueled in part by a slowdown in China, related weakness in commodities and questions about the Fed’s future rate path. Corporate spreads widened during the period, detracting from absolute returns.
An underweight position in agency bonds was a positive contributor to the Fund’s performance relative to its benchmark. The Fund also benefited modestly from its global overlay strategies. The Fund’s relative results were hurt by security selection and asset allocation within the corporate sector.
How do you plan to position the Fund, based on market conditions?
We expect the U.S. economy’s anemic growth to cause the Fed to maintain a relatively soft approach to interest rate increases. The direction of the financial markets is likely to have an increasing impact on the Fed’s interest rate strategy in the near term.
Concerns persist about the health of U.S. and world economies. U.S. economic growth has consistently underwhelmed throughout this recovery. Across the globe, deflationary pressures continue to persist due to excessive debt, slow productivity growth and a surplus of productive capacity. Given this environment, we expect interest rates to remain range-bound, with a bias toward the lower end, and we think credit spreads will remain volatile for the foreseeable future. Our investment strategy continues to prioritize safe income at a reasonable price.
26
Table of Contents
SEIX TOTAL RETURN BOND FUND
Growth of a $10,000 Investment (as of March 31, 2016)
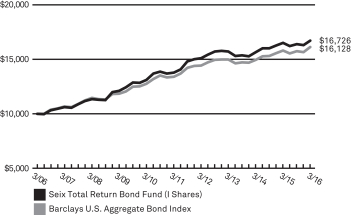 | This chart assumes an initial hypothetical investment of $10,000 made on 3/31/06. Total return is based on net change in the Net Asset Value (“NAV”) assuming reinvestment of distributions. Returns shown on this page include reinvestment of all dividends and other distributions.
The Fund’s performance is compared to the Barclays U.S. Aggregate Bond Index, which covers the U.S. dollar-denominated, investment-grade, fixed-rate, taxable bond market of SEC-registered securities. The Index includes bonds from the Treasury, Government-Related, Corporate, MBS (agency fixed-rate and hybrid ARM passthroughs), ABS and CMBS sectors. The Index is unmanaged and does not reflect the deduction of fees, such as investment management and fund accounting fees associated with a mutual fund. Investors cannot invest directly in an index. |
| Average Annual Total Returns as of 3/31/16 | ||||||||||||||||||||
| Seix Total Return Bond Fund | 1 Year | 3 Year | 5 Year | 10 Year | ||||||||||||||||
A Shares | without sales charge | 1.02% | 1.84% | 3.68% | 4.96% | |||||||||||||||
| with sales charge* | –3.74% | 0.19% | 2.66% | 4.44% | ||||||||||||||||
R Shares | 0.74% | 1.52% | 3.37% | 4.57% | ||||||||||||||||
I Shares | 1.35% | 2.11% | 3.95% | 5.28% | ||||||||||||||||
IS Shares** | 1.49% | 2.22% | 4.02% | 5.31% | ||||||||||||||||
| Barclays U.S. Aggregate Bond Index | 1.96% | 2.50% | 3.78% | 4.90% | ||||||||||||||||
| Prospectus Expense Ratio1 | Gross | |||||||||||||||||||
| A Shares | 0.71% | |||||||||||||||||||
| R Shares | 1.06% | |||||||||||||||||||
| I Shares | 0.44% | |||||||||||||||||||
| IS Shares | 0.31% | |||||||||||||||||||
The Adviser has contractually agreed to waive fees and reimburse expenses until at least August 1, 2016 in order to keep total operating expenses (excluding underlying fund fees and expenses) from exceeding 0.75%, 1.10%, 0.50% and 0.40% for A, R, I and IS Shares, respectively. Without these fee waivers, performance would have been lower.
Past performance does not guarantee future results. The performance data quoted represents past performance and current returns may be lower or higher. Total return figures include change in share price, reinvestment of dividends and capital gains and do not reflect taxes that a shareholder would pay on fund distributions or on the redemption of fund shares. The investment return and principal value will fluctuate so that an investor’s shares, when redeemed, may be worth more or less than the original cost. For performance data current to the most recent month end, visit our website at www.ridgeworth.com.
| * | Class A Share performance reflects the maximum front-end sales charge of 4.75%. |
| ** | IS Shares were offered beginning on 8/1/14. The performance shown prior to such dates is based on performance of the I Shares of the Fund, and has not been adjusted to reflect IS Share expenses. If it had been, performance would have been higher. |
| 1 | This information is included in the most current prospectus available to current and prospective shareholders of the Fund. Additional information pertaining to the 3/31/16 expense ratios can be found in the financial highlights. |
Investment Weightings (as of March 31, 2016)
as a percentage of investments
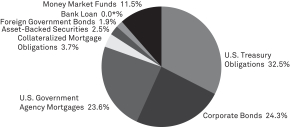
* Less than 0.05% of Net Assets.
27
Table of Contents
SEIX U.S. GOVERNMENT SECURITIES ULTRA-SHORT BOND FUND
Portfolio Managers
| • | James F. Keegan |
| • | Perry Troisi |
| • | Michael Rieger |
INVESTMENT CONCERNS
Bonds offer a relatively stable level of income, although bond prices will fluctuate providing the potential for principal gain or loss. Intermediate-term, higher-quality bonds generally offer less risk than longer-term bonds and a lower rate of return.
U.S. Government guarantees apply only to the underlying securities of the Fund’s portfolio and not the Fund’s shares.
The Fund is subject to the risk that principal value reacts in opposition to the movement of interest rates and that a rising interest rate environment increases the risk of loss of principal.
Mortgage-backed investments involve risk of loss due to prepayments and, like any bond, due to default. Because of the sensitivity of mortgage-related securities to changes in interest rates, the Fund’s performance may be more volatile than if it did not hold these securities.
Debt securities will generally lose value if interest rates increase. Interest rate risk is generally higher for investments with longer maturities or durations. Debt securities are subject to the risk that an issuer will fail to make timely payments of interest or principal or go bankrupt, reducing the Fund’s return. The lower the rating of a debt security, the higher its credit risk.
MANAGEMENT DISCUSSION OF FUND PERFORMANCE
How did the Fund perform against its benchmark for the fiscal year ended March 31, 2016?
The Seix U.S. Government Securities Ultra-Short Bond Fund (I Shares) returned –0.11%. That compared to a 0.24% return for the Fund’s benchmark, the Barclays 3-6 month U.S. Treasury Bill Index.
What factors influenced the Fund’s performance for the fiscal year ended March 31, 2016?
Short-term interest rates moved higher during the 12-month period as the U.S. Federal Reserve raised overnight interest rates in December 2015. The rising-rate environment hurt absolute returns.
The spreads between the yields on Treasuries and government-guaranteed securitized issues widened during the period, and was the primary detractor from relative performance. The Fund’s return relative to its benchmark benefited from an overweight exposure to higher-yielding securities.
How do you plan to position the Fund, based on market conditions?
We expect the U.S. economy’s anemic growth to cause the Fed to maintain a relatively soft approach to interest rate increases. The direction of the financial markets is likely to have an increasing impact on the Fed’s interest rate strategy in the near term.
Concerns persist about the health of U.S. and world economies. U.S. economic growth has consistently underwhelmed throughout this recovery. Across the globe, deflationary pressures continue to persist due to excessive debt, slow productivity growth and a surplus of production capacity. Given this environment, we expect interest rates to remain range-bound, with a bias toward the lower end, and we think credit spreads will remain volatile for the foreseeable future. Our investment strategy for the Fund will continue to emphasize well-structured short-duration government mortgage-backed securities (MBS) that will provide higher coupon income relative to its benchmark.
28
Table of Contents
SEIX U.S. GOVERNMENT SECURITIES ULTRA-SHORT BOND FUND
Growth of a $10,000 Investment (as of March 31, 2016)
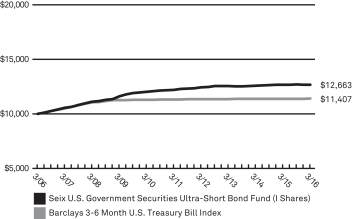 | This chart assumes an initial hypothetical investment of $10,000 made on 3/31/06. Total return is based on net change in the Net Asset Value (“NAV”) assuming reinvestment of distributions. Returns shown on this page include reinvestment of all dividends and other distributions.
The Fund’s performance is compared to the Barclays 3-6 Month U.S. Treasury Bill Index (“Index”). The Index is the 3-6 month component of the Barclays U.S. Treasury Bills Index, which includes U.S. Treasury bills with a remaining maturity from 1 up to (but not including) 12 months. It excludes zero coupon strips. The Index is unmanaged and does not reflect the deduction of fees, such as investment management and fund accounting fees associated with a mutual fund. Investors cannot invest directly in an index. |
| Average Annual Total Returns as of 3/31/16 | ||||||||||||||||||||
| Seix U.S. Government Securities Ultra-Short Bond Fund | 1 Year | 3 Year | 5 Year | 10 Year | ||||||||||||||||
I Shares | –0.11% | 0.26% | 0.73% | 2.39% | ||||||||||||||||
| Barclays 3-6 Month U.S. Treasury Bill Index | 0.24% | 0.14% | 0.15% | 1.32% | ||||||||||||||||
| Prospectus Expense Ratio1 | Gross | |||||||||||||||||||
| I Shares | 0.39% | |||||||||||||||||||
Past performance does not guarantee future results. The performance data quoted represents past performance and current returns may be lower or higher. Total return figures include change in share price, reinvestment of dividends and capital gains and do not reflect taxes that a shareholder would pay on fund distributions or on the redemption of fund shares. The investment return and principal value will fluctuate so that an investor’s shares, when redeemed, may be worth more or less than the original cost. For performance data current to the most recent month end, visit our website at www.ridgeworth.com.
| 1 | This information is included in the most current prospectus available to current and prospective shareholders of the Fund. Additional information pertaining to the 3/31/16 expense ratios can be found in the financial highlights. |
Investment Weightings (as of March 31, 2016)
as a percentage of investments
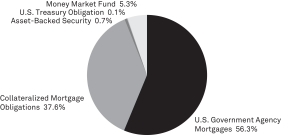
29
Table of Contents
Portfolio Managers
| • | James F. Keegan |
| • | Perry Troisi |
| • | Michael Rieger |
| • | Seth Antiles, Ph.D |
| • | Jonathan Yozzo |
| • | Carlos Catoya |
INVESTMENT CONCERNS
Mutual fund investing involves risk, including possible loss of principal. Bonds offer a relatively stable level of income, although bond prices will fluctuate providing the potential for principal gain or loss. Intermediate-term, higher-quality bonds generally offer less risk than longer-term bonds and a lower rate of return.
U.S. Government guarantees apply only to the underlying securities of the Fund’s portfolio and not the Fund’s shares.
Mortgage-backed investments involve risk of loss due to prepayments and, like any bond, due to default. Because of the sensitivity of mortgage-related securities to changes in interest rates, the Fund’s performance may be more volatile than if it did not hold these securities.
Debt securities will generally lose value if interest rates increase. Interest rate risk is generally higher for investments with longer maturities or durations. Debt securities are subject to the risk that an issuer will fail to make timely payments of interest or principal or go bankrupt, reducing the Fund’s return. The lower the rating of a debt security, the higher its credit risk.
MANAGEMENT DISCUSSION OF FUND PERFORMANCE
How did the Fund perform against its benchmark for the fiscal year ended March 31, 2016?
The Seix U.S. Mortgage Fund (I Shares) returned 1.84%. That compares to a 2.43% return for the Fund’s benchmark, the Barclays U.S. Mortgage Backed Securities Index.
What factors influenced the Fund’s performance for the fiscal year ended March 31, 2016?
Treasuries and high-grade corporate bonds benefited from a flight to quality among investors concerned about global economic growth. Those worries were fueled in part by a slowdown in China, related weakness in commodities and questions about the Fed’s future rate path. Corporate spreads widened during the period.
The Fund’s allocation to 30-year Government National Mortgage Association (GNMA) bonds detracted from performance relative to the benchmark. Conversely, relative performance benefited from an overweight position in commercial mortgage-backed securities. Another positive contributor was the Fund’s underweight position in conventional 15-year residential mortgage-backed securities (RMBS).
How do you plan to position the Fund, based on market conditions?
We expect the U.S. economy’s anemic growth to cause the Fed to maintain a relatively soft approach to interest rate increases. The direction of the financial markets is likely to have an increasing impact on the Fed’s interest rate strategy in the near term.
Concerns persist about the health of U.S. and world economies. U.S. economic growth has consistently underwhelmed throughout this recovery. Across the globe, deflationary pressures continue to persist due to excessive debt, slow productivity growth and a surplus of productive capacity. Given this environment, we expect interest rates to remain range-bound, with a bias toward the lower end, and we think credit spreads will remain volatile for the foreseeable future. Our investment strategy continues to prioritize safe income at a reasonable price.
30
Table of Contents
SEIX U.S. MORTGAGE FUND
Growth of a $10,000 Investment (as of March 31, 2016)
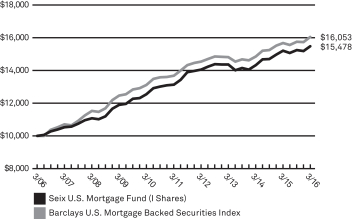 | This chart assumes an initial hypothetical investment of $10,000 made on 3/31/06. Total return is based on net change in the Net Asset Value (“NAV”) assuming reinvestment of distributions. Returns shown on this page include reinvestment of all dividends and other distributions.
The Fund’s performance is compared to the Barclays U.S. Mortgage Backed Securities Index, which covers agency pass-through securities (both fixed-rate and hybrid ARM) issued by Ginnie Mae (GNMA), Fannie Mae (FNMA), and Freddie Mac (FHLMC). The Index is unmanaged and does not reflect the deduction of fees, such as investment management and fund accounting fees associated with a mutual fund. Investors cannot invest directly in an index. |
| Average Annual Total Returns as of 3/31/16 | ||||||||||||||||||||
| Seix U.S. Mortgage Fund | 1 Year | 3 Year | 5 Year | 10 Year | ||||||||||||||||
A Shares | without sales charge | 1.72% | 2.30% | 3.14% | 4.25% | |||||||||||||||
| with sales charge* | –0.83% | 1.43% | 2.62% | 3.99% | ||||||||||||||||
C Shares | without CDSC | 0.88% | 1.52% | 2.33% | 3.43% | |||||||||||||||
| with CDSC* | –0.12% | 1.52% | 2.33% | 3.43% | ||||||||||||||||
I Shares | 1.84% | 2.51% | 3.34% | 4.47% | ||||||||||||||||
| Barclays U.S. Mortgage Backed Securities Index | 2.43% | 2.70% | 3.24% | 4.85% | ||||||||||||||||
| Prospectus Expense Ratio1 | Gross | |||||||||||||||||||
| A Shares | 1.33% | |||||||||||||||||||
| C Shares | 2.05% | |||||||||||||||||||
| I Shares | 1.16% | |||||||||||||||||||
The Adviser has contractually agreed to waive fees and reimburse expenses until at least August 1, 2016 in order to keep total operating expenses (excluding underlying fund fees and expenses) from exceeding 0.90%, 1.65% and 0.70% for A, C and I Shares, respectively. Without these fee waivers, performance would have been lower.
Past performance does not guarantee future results. The performance data quoted represents past performance and current returns may be lower or higher. Total return figures include change in share price, reinvestment of dividends and capital gains and do not reflect taxes that a shareholder would pay on fund distributions or on the redemption of fund shares. The investment return and principal value will fluctuate so that an investor’s shares, when redeemed, may be worth more or less than the original cost. For performance data current to the most recent month end, visit our website at www.ridgeworth.com.
| * | Class A Share performance reflects the maximum front-end sales charge of 2.50% and Class C Shares reflect the maximum CDSC (contingent deferred sales charge) of 1.00% in year one only. |
| 1 | This information is included in the most current prospectus available to current and prospective shareholders of the Fund. Additional information pertaining to the 3/31/16 expense ratios can be found in the financial highlights. |
Investment Weightings (as of March 31, 2016)
as a percentage of investments
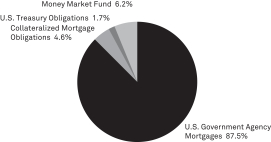
31
Table of Contents
Portfolio Managers
| • | James F. Keegan |
| • | Perry Troisi |
| • | Michael Rieger |
| • | Jonathan Yozzo |
| • | Carlos Catoya |
INVESTMENT CONCERNS
Bonds offer a relatively stable level of income, although bond prices will fluctuate providing the potential for principal gain or loss. Intermediate-term, higher-quality bonds generally offer less risk than longer-term bonds and a lower rate of return.
U.S. Government guarantees apply only to the underlying securities of the Fund’s portfolio and not the Fund’s shares.
Mortgage-backed investments involve risk of loss due to prepayments and, like any bond, due to default. Because of the sensitivity of mortgage-related securities to changes in interest rates, the Fund’s performance may be more volatile than if it did not hold these securities.
Debt securities will generally lose value if interest rates increase. Interest rate risk is generally higher for investments with longer maturities or durations. Debt securities are subject to the risk that an issuer will fail to make timely payments of interest or principal or go bankrupt, reducing the Fund’s return. The lower the rating of a debt security, the higher its credit risk.
MANAGEMENT DISCUSSIONOF FUND PERFORMANCE
How did the Fund perform relative to its benchmark for the fiscal year ended March 31, 2016?
The Seix Ultra-Short Bond Fund (I Shares) returned 0.42%. That compared to a 0.24% return for the Fund’s benchmark, the Barclays 3-6 Month Treasury Bill Index.
What factors influenced the Fund’s performance for the fiscal year ended March 31, 2016?
Short-term interest rates moved higher during the 12-month period as the U.S. Federal Reserve raised overnight interest rates in December 2015. The rising-rate environment muted absolute returns.
The Fund held an overweight position in “spread sectors” such as corporate paper and securitized bonds, which provide higher yield than Treasury bills. That positioning provided the largest positive contribution to relative performance during the fiscal year.
How do you plan to position the Fund, based on market conditions?
We expect the U.S. economy’s anemic growth to cause the Fed to maintain a relatively soft approach to interest rate increases. The direction of the financial markets is likely to have an increasing impact on the Fed’s interest rate strategy in the near term.
Concerns persist about the health of U.S. and world economies. U.S. economic growth has consistently underwhelmed throughout this recovery. Across the globe, deflationary pressures continue to persist due to excessive debt, slow productivity growth and a surplus of production capacity. Given this environment, we expect interest rates to remain range-bound, with a bias toward the lower end, and we think credit spreads will remain volatile for the foreseeable future. Our investment strategy for the Fund continues to emphasize higher quality short-duration spread product that will provide higher coupon income relative to its benchmark.
32
Table of Contents
SEIX ULTRA-SHORT BOND FUND
Growth of a $10,000 Investment (as of March 31, 2016)
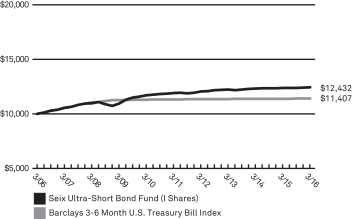 | This chart assumes an initial hypothetical investment of $10,000 made on 3/31/06. Total return is based on net change in the Net Asset Value (“NAV”) assuming reinvestment of distributions. Returns shown on this page include reinvestment of all dividends and other distributions.
The Fund’s performance is compared to the Barclays 3-6 Month U.S. Treasury Bill Index. The Barclays 3-6 Month U.S. Treasury Bill Index (“Index”) is the 3-6 month component of the Barclays U.S. Treasury Bills Index, which includes U.S. Treasury bills with a remaining maturity from 1 up to (but not including) 12 months. It excludes zero coupon strips. The Index is unmanaged and does not reflect the deduction of fees, such as investment management and fund accounting fees associated with a mutual fund. Investors cannot invest directly in an index. |
| Average Annual Total Returns as of 3/31/16 | ||||||||||||||||||||
| Seix Ultra-Short Bond Fund | 1 Year | 3 Year | 5 Year | 10 Year | ||||||||||||||||
I Shares | 0.42% | 0.58% | 0.89% | 2.20% | ||||||||||||||||
| Barclays 3-6 Month U.S. Treasury Bill Index | 0.24% | 0.14% | 0.15% | 1.32% | ||||||||||||||||
| Prospectus Expense Ratio1 | Gross | |||||||||||||||||||
| I Shares | 0.37% | |||||||||||||||||||
Past performance does not guarantee future results. The performance data quoted represents past performance and current returns may be lower or higher. Total return figures include change in share price, reinvestment of dividends and capital gains and do not reflect taxes that a shareholder would pay on fund distributions or on the redemption of fund shares. The investment return and principal value will fluctuate so that an investor’s shares, when redeemed, may be worth more or less than the original cost. For performance data current to the most recent month end, visit our website at www.ridgeworth.com.
| 1 | This information is included in the most current prospectus available to current and prospective shareholders of the Fund. Additional information pertaining to the 3/31/16 expense ratios can be found in the financial highlights. |
Investment Weightings (as of March 31, 2016)
as a percentage of investments
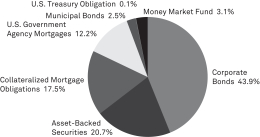
33
Table of Contents
SEIX VIRGINIA INTERMEDIATE MUNICIPAL BOND FUND
Portfolio Manager
| • | Chris Carter, CFA |
INVESTMENT CONCERNS
The geographical concentration of portfolio holdings in this Fund may involve increased risk.
Mutual fund investing involves risk, including possible loss of principal. Bonds offer a relatively stable level of income, although bond prices will fluctuate providing the potential for principal gain or loss. Intermediate-term, higher-quality bonds generally offer less risk than longer-term bonds and a lower rate of return.
The Fund’s income may be subject to certain state and local taxes and, depending on your tax status, the federal alternative minimum tax.
The Fund is subject to the risk that principal value reacts in opposition to the movement of interest rates and that a rising interest rate environment increases the risk of loss of principal.
Debt securities will generally lose value if interest rates increase. Interest rate risk is generally higher for investments with longer maturities or durations. Debt securities are subject to the risk that an issuer will fail to make timely payments of interest or principal or go bankrupt, reducing the Fund’s return. The lower the rating of a debt security, the higher its credit risk.
MANAGEMENT DISCUSSIONOF FUND PERFORMANCE
How did the Fund perform relative to its benchmark for the fiscal year ended March 31, 2016?
The Seix Virginia Intermediate Municipal Bond Fund (I Shares) posted a total return of 3.30%. That compared to 12-month returns of 2.82% and 3.46% for the Lipper Other States Intermediate Municipal Debt Funds Category and the Barclays U.S. Municipal Bond 1-15 Year Blend Index, respectively.
What factors influenced the Fund’s performance for the fiscal year ended March 31, 2016?
Municipal bonds (munis) benefited from increased investor demand, which helped drive prices up and yields down on five-, 10- and 30-year AAA-rated munis. Investors were attracted to munis as they searched for income and stability in a relatively volatile low-interest rate environment. Demand was strong enough to more than offset the impact of high new issuance.
Credit spreads tightened. Holdings issued by transportation and health care entities led performance among the larger sectors of the Fund’s benchmark.
The Fund’s greater-than-benchmark holdings of munis with maturities of 10 years and longer added to relative results, as the long bond sector outperformed the five-year bond sector by a wide margin. Overweight positions in the leasing and water and sewer sectors added to relative results, as did security selection in the special tax arena.
Underweight allocations to state and local general obligation bonds and to the power sector weighed on results, as did higher-than-benchmark holdings of AAA-rated securities.
How do you plan to position the Fund, based on market conditions?
We remain constructive on the municipal sector because of its tax-exempt income, strong technical factors, healthy fundamentals, and attractive yields relative to other fixed income alternatives. Negative headlines still persist from some entities experiencing fiscal strain but do not reflect the financial condition of most municipal borrowers. Tight credit spreads continue to warrant a degree of caution at this point in the economic/credit cycle.
The Fund’s present curve posture and sector allocations seem appropriate given our forecasts for the economy and financial markets. We will continue to make tactical adjustments to the Fund, periodically, as a part of an active portfolio management process and all activity will occur within an investment grade construct.
34
Table of Contents
SEIX VIRGINIA INTERMEDIATE MUNICIPAL BOND FUND
Growth of a $10,000 Investment (as of March 31, 2016)
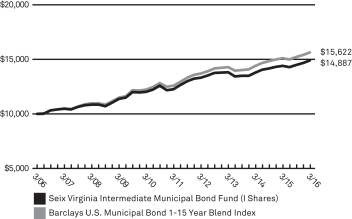 | This chart assumes an initial hypothetical investment of $10,000 made on 3/31/06. Total return is based on net change in the Net Asset Value (“NAV”) assuming reinvestment of distributions. Returns shown on this page include reinvestment of all dividends and other distributions.
The Fund’s performance is compared to the Barclays U.S. Municipal Bond 1-15 Year Blend Index (“Index”) which is an index of tax-exempt bonds with maturities ranging between 1 and 15 years. The Index is unmanaged and does not reflect the deduction of fees, such as investment management and fund accounting fees associated with a mutual fund. Investors cannot invest directly in an index. |
| Average Annual Total Returns as of 3/31/16 | ||||||||||||||||||||
| Seix Virginia Intermediate Municipal Bond Fund | 1 Year | 3 Year | 5 Year | 10 Year | ||||||||||||||||
A Shares | without sales charge | 3.29% | 2.44% | 3.81% | 3.92% | |||||||||||||||
| with sales charge* | –1.61% | 0.78% | 2.80% | 3.41% | ||||||||||||||||
I Shares | 3.30% | 2.53% | 3.94% | 4.06% | ||||||||||||||||
| Barclays U.S. Municipal Bond 1-15 Year Blend Index | 3.46% | 3.05% | 4.42% | 4.56% | ||||||||||||||||
| Prospectus Expense Ratio1 | Gross | |||||||||||||||||||
| A Shares | 0.74% | |||||||||||||||||||
| I Shares | 0.65% | |||||||||||||||||||
Past performance does not guarantee future results. The performance data quoted represents past performance and current returns may be lower or higher. Total return figures include change in share price, reinvestment of dividends and capital gains and do not reflect taxes that a shareholder would pay on fund distributions or on the redemption of fund shares. The investment return and principal value will fluctuate so that an investor’s shares, when redeemed, may be worth more or less than the original cost. For performance data current to the most recent month end, visit our website at www.ridgeworth.com.
| * | Class A Share performance reflects the maximum front-end sales charge of 4.75%. |
| 1 | This information is included in the most current prospectus available to current and prospective shareholders of the Fund. Additional information pertaining to the 3/31/16 expense ratios can be found in the financial highlights. |
Investment Weightings (as of March 31, 2016)
as a percentage of investments
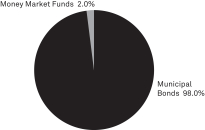
35
Table of Contents
SCHEDULES OF PORTFOLIO INVESTMENTS
RIDGEWORTH FUNDS March 31, 2016
Seix Core Bond Fund
| Shares or Principal Amount($) | Value($) | |||||||
Asset-Backed Securities 3.1% |
| |||||||
Automobiles 0.3% | ||||||||
Ford Credit Auto Owner Trust, Series 2016-1, Cl A, | 845,000 | 845,407 | ||||||
|
| |||||||
Credit Card 1.2% | ||||||||
Barclays Dryrock Issuance Trust, Series 2014-3, Cl A, | 2,125,000 | 2,176,090 | ||||||
Cabela’s Credit Card Master Note Trust, | 953,000 | 937,474 | ||||||
|
| |||||||
| 3,113,564 | ||||||||
|
| |||||||
Other 1.6% | ||||||||
DB Master Finance LLC, Series 2015-1A, Cl A2II, | 2,603,700 | 2,546,418 | ||||||
Domino’s Pizza Master Issuer LLC, Series 2012-1A, Cl A2, | 1,156,084 | 1,183,082 | ||||||
Ohio Phase-In-Recovery Funding LLC, Series 2013-1, Cl A2, 2.049%, 07/01/20 | 685,000 | 694,812 | ||||||
|
| |||||||
| 4,424,312 | ||||||||
|
| |||||||
Total Asset-Backed Securities | 8,383,283 | |||||||
|
| |||||||
Collateralized Mortgage Obligations 5.0% |
| |||||||
Commercial Mortgage Backed Securities 5.0% |
| |||||||
Federal Home Loan Mortgage Corporation | ||||||||
Series KP02, Cl A2, 2.355%, 04/25/21(b) | 1,967,000 | 2,015,158 | ||||||
|
| |||||||
FREMF Mortgage Trust | ||||||||
Series 2016-K52, Cl B, 3.921%, 01/25/49(a)(b) | 745,000 | 652,897 | ||||||
|
| |||||||
GS Mortgage Securities Corp. II | ||||||||
Series 2012-ALOH, Cl A, 3.551%, 04/10/34(a) | 980,000 | 1,043,191 | ||||||
Series 2012-BWTR, Cl B, 3.255%, 11/05/34(a) | 1,195,000 | 1,187,834 | ||||||
|
| |||||||
| 2,231,025 | ||||||||
|
| |||||||
GS Mortgage Securities Trust | ||||||||
Series 2010-C1, Cl A2, 4.592%, 08/10/43(a) | 1,011,000 | 1,104,770 | ||||||
|
| |||||||
JPMorgan Chase Commercial Mortgage Securities Trust | ||||||||
Series 2012-HSBC, Cl B, 3.722%, 07/05/32(a) | 380,000 | 388,088 | ||||||
|
| |||||||
| Shares or Principal Amount($) | Value($) | |||||||
Commercial Mortgage Backed Securities—continued |
| |||||||
Madison Avenue Trust | ||||||||
Series 2013-650M, Cl B, 4.034%, 10/12/32(a)(b) | 1,815,000 | 1,888,823 | ||||||
|
| |||||||
Morgan Stanley Capital I Trust | ||||||||
Series 2014-CPT, Cl A, 3.350%, 07/13/29(a) | 3,285,000 | 3,450,212 | ||||||
|
| |||||||
VNDO Mortgage Trust | ||||||||
Series 2013-PENN, Cl B, 3.947%, 12/13/29(a)(b) | 1,125,000 | 1,173,387 | ||||||
|
| |||||||
Wells Fargo Commercial Mortgage Trust | ||||||||
Series 2013-BTC, Cl A, 3.544%, 04/16/35(a) | 510,000 | 539,405 | ||||||
|
| |||||||
Total Collateralized Mortgage Obligations | 13,443,765 | |||||||
|
| |||||||
Corporate Bonds 27.7% | ||||||||
Aerospace/Defense 0.3% | ||||||||
L-3 Communications Corp., 3.950%, 05/28/24 | 244,000 | 234,832 | ||||||
Lockheed Martin Corp., | 447,000 | 499,805 | ||||||
|
| |||||||
| 734,637 | ||||||||
|
| |||||||
Agriculture 0.4% | ||||||||
Japan Tobacco, Inc., | 1,187,000 | 1,198,218 | ||||||
|
| |||||||
Airlines 1.3% | ||||||||
American Airlines Pass Through Trust, Series 2013-2, 4.950%, 07/15/24 | 819,993 | 877,327 | ||||||
American Airlines Pass Through Trust, Series 2015-2, 3.600%, 03/22/29 | 127,000 | 130,810 | ||||||
American Airlines Pass Through Trust, Series 2016-1, Cl A, 4.100%, 07/15/29 | 858,000 | 887,944 | ||||||
Delta Air Lines Pass Through Trust, Series 2015-1, 3.625%, 07/30/27 | 191,138 | 188,988 | ||||||
Southwest Airlines Co., 2.650%, 11/05/20 | 415,000 | 423,140 | ||||||
Spirit Airlines Pass Through Trust, Series 2015-1, 4.100%, 04/01/28 | 227,000 | 228,135 | ||||||
United Airlines Pass Through Trust, Series 2014-1, Cl A, 4.000%, 04/11/26 | 862,579 | 890,612 | ||||||
|
| |||||||
| 3,626,956 | ||||||||
|
| |||||||
See Notes to Financial Statements.
36
Table of Contents
SCHEDULES OF PORTFOLIO INVESTMENTS
RIDGEWORTH FUNDS March 31, 2016
Seix Core Bond Fund — continued
| Shares or Principal Amount($) | Value($) | |||||||
Auto Manufacturers 1.2% | ||||||||
Daimler Finance North America LLC, 2.250%, 03/02/20(a) | 564,000 | 567,485 | ||||||
Ford Motor Credit Co. LLC, 3.336%, 03/18/21 | 1,153,000 | 1,186,488 | ||||||
General Motors Co., 5.200%, 04/01/45 | 835,000 | 784,960 | ||||||
Volkswagen International Finance, 2.375%, 03/22/17(a) | 742,000 | 745,176 | ||||||
|
| |||||||
| 3,284,109 | ||||||||
|
| |||||||
Auto Parts & Equipment 0.5% | ||||||||
Delphi Automotive PLC, 4.250%, 01/15/26 | 482,000 | 503,121 | ||||||
Magna International, Inc., 4.150%, 10/01/25 | 811,000 | 859,294 | ||||||
|
| |||||||
| 1,362,415 | ||||||||
|
| |||||||
Banks 5.8% | ||||||||
Bank of America Corp., 1.700%, 08/25/17, MTN | 644,000 | 644,867 | ||||||
Bank of America Corp., 4.450%, 03/03/26 | 450,000 | 463,585 | ||||||
Bank of America NA, 1.750%, 06/05/18 | 498,000 | 497,881 | ||||||
BPCE SA, 2.650%, 02/03/21 | 715,000 | 721,479 | ||||||
Citigroup, Inc., 2.500%, 09/26/18 | 1,039,000 | 1,054,890 | ||||||
Cooperatieve Rabobank UA, 2.500%, 01/19/21, MTN | 479,000 | 483,481 | ||||||
Credit Suisse Group Funding Guernsey Ltd., 3.800%, 09/15/22 | 877,000 | 872,856 | ||||||
Fifth Third Bank, 3.850%, 03/15/26 | 980,000 | 1,003,910 | ||||||
Goldman Sachs Group, Inc. (The), 2.550%, 10/23/19 | 552,000 | 560,352 | ||||||
Goldman Sachs Group, Inc. (The), 5.150%, 05/22/45 | 558,000 | 566,863 | ||||||
Huntington National Bank (The), 1.300%, 11/20/16 | 1,072,000 | 1,072,045 | ||||||
ING Bank NV, 1.800%, 03/16/18(a) | 684,000 | 685,993 | ||||||
JPMorgan Chase & Co., 2.250%, 01/23/20 | 823,000 | 829,510 | ||||||
KeyCorp, 2.900%, 09/15/20, MTN | 423,000 | 429,933 | ||||||
Lloyds Bank PLC, 2.050%, 01/22/19 | 600,000 | 600,124 | ||||||
Morgan Stanley, 3.950%, 04/23/27 | 464,000 | 464,490 | ||||||
| Shares or Principal Amount($) | Value($) | |||||||
Banks—continued | ||||||||
Morgan Stanley, 4.300%, 01/27/45 | 1,458,000 | 1,467,099 | ||||||
US Bancorp, 2.350%, 01/29/21, MTN | 392,000 | 397,981 | ||||||
US Bancorp, 3.600%, 09/11/24, MTN | 639,000 | 673,377 | ||||||
US Bank NA, 1.100%, 01/30/17 | 1,229,000 | 1,231,731 | ||||||
Wells Fargo & Co., 4.300%, 07/22/27, MTN | 894,000 | 948,573 | ||||||
|
| |||||||
| 15,671,020 | ||||||||
|
| |||||||
Beverages 0.9% | ||||||||
Anheuser-Busch InBev Finance, Inc., 2.650%, 02/01/21 | 337,000 | 346,297 | ||||||
Anheuser-Busch InBev Finance, Inc., 3.650%, 02/01/26 | 209,000 | 219,787 | ||||||
Anheuser-Busch InBev Finance, Inc., 4.900%, 02/01/46 | 645,000 | 720,827 | ||||||
SABMiller Holdings, Inc., 2.450%, 01/15/17(a) | 1,133,000 | 1,143,390 | ||||||
|
| |||||||
| 2,430,301 | ||||||||
|
| |||||||
Biotechnology 0.5% | ||||||||
Biogen, Inc., 5.200%, 09/15/45 | 428,000 | 474,734 | ||||||
Celgene Corp., 4.625%, 05/15/44 | 288,000 | 293,424 | ||||||
Celgene Corp., 5.000%, 08/15/45 | 422,000 | 456,323 | ||||||
|
| |||||||
| 1,224,481 | ||||||||
|
| |||||||
Commercial Services 0.7% | ||||||||
ERAC USA Finance LLC, 2.750%, 03/15/17(a) | 567,000 | 573,742 | ||||||
ERAC USA Finance LLC, 3.850%, 11/15/24(a) | 310,000 | 324,076 | ||||||
ERAC USA Finance LLC, 4.500%, 02/15/45(a) | 337,000 | 331,967 | ||||||
ERAC USA Finance LLC, 5.250%, 10/01/20(a) | 504,000 | 555,956 | ||||||
|
| |||||||
| 1,785,741 | ||||||||
|
| |||||||
Computers 0.3% | ||||||||
Apple, Inc., 3.200%, 05/13/25 | 852,000 | 892,609 | ||||||
|
| |||||||
Diversified Financial Services 1.2% |
| |||||||
Air Lease Corp., 2.625%, 09/04/18 | 1,276,000 | 1,267,945 | ||||||
American Express Credit Corp., 2.375%, 03/24/17, MTN | 360,000 | 364,223 | ||||||
Lazard Group LLC, 3.750%, 02/13/25 | 1,189,000 | 1,097,466 | ||||||
See Notes to Financial Statements.
37
Table of Contents
SCHEDULES OF PORTFOLIO INVESTMENTS
RIDGEWORTH FUNDS March 31, 2016
Seix Core Bond Fund — continued
| Shares or Principal Amount($) | Value($) | |||||||
Diversified Financial Services—continued |
| |||||||
TD Ameritrade Holding Corp., 2.950%, 04/01/22 | 391,000 | 399,082 | ||||||
|
| |||||||
| 3,128,716 | ||||||||
|
| |||||||
Electric 0.3% | ||||||||
Berkshire Hathaway Energy Co., 6.125%, 04/01/36 | 220,000 | 272,366 | ||||||
Dominion Resources, Inc., 1.950%, 08/15/16 | 322,000 | 323,017 | ||||||
Exelon Generation Co. LLC, 6.200%, 10/01/17 | 291,000 | 309,418 | ||||||
|
| |||||||
| 904,801 | ||||||||
|
| |||||||
Healthcare-Products 0.3% | ||||||||
Becton Dickinson and Co., 4.685%, 12/15/44 | 211,000 | 227,914 | ||||||
Medtronic, Inc., 3.500%, 03/15/25 | 176,000 | 187,852 | ||||||
Medtronic, Inc., 4.625%, 03/15/45 | 450,000 | 503,648 | ||||||
|
| |||||||
| 919,414 | ||||||||
|
| |||||||
Healthcare-Services 0.2% | ||||||||
Howard Hughes Medical Institute, 3.500%, 09/01/23 | 405,000 | 433,305 | ||||||
|
| |||||||
Housewares 0.3% | ||||||||
Newell Rubbermaid, Inc., 5.500%, 04/01/46 | 620,000 | 673,566 | ||||||
|
| |||||||
Insurance 0.9% | ||||||||
Chubb INA Holdings, Inc., 4.350%, 11/03/45 | 270,000 | 294,249 | ||||||
MassMutual Global Funding LLC, 2.000%, 04/05/17(a) | 702,000 | 708,952 | ||||||
Nationwide Financial Services, Inc., 5.375%, 03/25/21(a) | 975,000 | 1,068,953 | ||||||
Reinsurance Group of America, Inc., 4.700%, 09/15/23, MTN | 259,000 | 270,058 | ||||||
|
| |||||||
| 2,342,212 | ||||||||
|
| |||||||
Media 0.5% | ||||||||
Comcast Corp., 4.650%, 07/15/42 | 1,167,000 | 1,298,125 | ||||||
|
| |||||||
Mining 1.6% | ||||||||
Barrick (PD) Australia Finance Property Ltd., 5.950%, 10/15/39 | 1,098,000 | 987,650 | ||||||
Barrick International Barbados Corp., 6.350%, 10/15/36(a) | 658,000 | 597,446 | ||||||
BHP Billiton Finance USA Ltd., 5.000%, 09/30/43 | 544,000 | 553,414 | ||||||
Newmont Mining Corp., 6.250%, 10/01/39 | 1,793,000 | 1,791,831 | ||||||
| Shares or Principal Amount($) | Value($) | |||||||
Mining—continued | ||||||||
Rio Tinto Finance USA Ltd., 3.750%, 06/15/25 | 445,000 | 433,686 | ||||||
|
| |||||||
| 4,364,027 | ||||||||
|
| |||||||
Miscellaneous Manufacturer 0.7% |
| |||||||
3M Co., 1.375%, 09/29/16 | 327,000 | 328,154 | ||||||
General Electric Co., 3.450%, 05/15/24, MTN | 940,000 | 1,013,079 | ||||||
General Electric Co., 4.125%, 10/09/42 | 240,000 | 253,104 | ||||||
General Electric Co., 5.250%, 12/06/17 | 247,000 | 264,692 | ||||||
|
| |||||||
| 1,859,029 | ||||||||
|
| |||||||
Oil & Gas 3.3% |
| |||||||
Apache Corp., 3.250%, 04/15/22 | 649,000 | 624,432 | ||||||
BP Capital Markets PLC, 2.248%, 11/01/16 | 471,000 | 474,631 | ||||||
ConocoPhillips Co., 5.950%, 03/15/46 | 696,000 | 748,730 | ||||||
Devon Energy Corp., | 649,000 | 626,439 | ||||||
Ensco PLC, 4.500%, 10/01/24(c) | 262,000 | 145,410 | ||||||
Ensco PLC, 5.200%, 03/15/25(c) | 337,000 | 188,720 | ||||||
Ensco PLC, 5.750%, 10/01/44 | 637,000 | 315,315 | ||||||
EOG Resources, Inc., 4.150%, 01/15/26 | 938,000 | 975,383 | ||||||
Exxon Mobil Corp., 1.912%, 03/06/20 | 625,000 | 632,015 | ||||||
Exxon Mobil Corp., 3.043%, 03/01/26 | 1,210,000 | 1,238,388 | ||||||
Marathon Oil Corp., 3.850%, 06/01/25(c) | 648,000 | 526,566 | ||||||
Marathon Petroleum Corp., 3.625%, 09/15/24 | 96,000 | 87,785 | ||||||
Marathon Petroleum Corp., 5.000%, 09/15/54 | 363,000 | 284,119 | ||||||
Shell International Finance BV, 3.250%, 05/11/25 | 737,000 | 743,954 | ||||||
Woodside Finance Ltd., 3.650%, 03/05/25(a) | 642,000 | 596,389 | ||||||
Woodside Finance Ltd., 4.600%, 05/10/21(a) | 590,000 | 611,359 | ||||||
|
| |||||||
| 8,819,635 | ||||||||
|
| |||||||
Oil & Gas Services 0.8% | ||||||||
FMC Technologies, Inc., 3.450%, 10/01/22 | 185,000 | 164,398 | ||||||
See Notes to Financial Statements.
38
Table of Contents
SCHEDULES OF PORTFOLIO INVESTMENTS
RIDGEWORTH FUNDS March 31, 2016
Seix Core Bond Fund — continued
| Shares or Principal Amount($) | Value($) | |||||||
Oil & Gas Services—continued | ||||||||
Schlumberger Holdings Corp., 3.000%, 12/21/20(a) | 515,000 | 522,125 | ||||||
Schlumberger Holdings Corp., 4.000%, 12/21/25(a) | 1,008,000 | 1,040,689 | ||||||
Schlumberger Investment SA, 3.300%, 09/14/21(a) | 442,000 | 455,256 | ||||||
|
| |||||||
| 2,182,468 | ||||||||
|
| |||||||
Pharmaceuticals 0.4% | ||||||||
AbbVie, Inc., 3.600%, 05/14/25 | 569,000 | 597,289 | ||||||
Express Scripts Holding Co., 2.650%, 02/15/17 | 358,000 | 362,676 | ||||||
Novartis Securities Investment Ltd., 5.125%, 02/10/19 | 215,000 | 238,006 | ||||||
|
| |||||||
| 1,197,971 | ||||||||
|
| |||||||
Pipelines 0.1% | ||||||||
Phillips 66 Partners LP, 3.605%, 02/15/25 | 105,000 | 95,414 | ||||||
Phillips 66 Partners LP, 4.680%, 02/15/45 | 131,000 | 108,796 | ||||||
|
| |||||||
| 204,210 | ||||||||
|
| |||||||
Real Estate Investment Trust 1.2% |
| |||||||
American Tower Corp., 3.500%, 01/31/23 | 361,000 | 364,422 | ||||||
American Tower Corp., 5.000%, 02/15/24 | 711,000 | 780,232 | ||||||
Boston Properties LP, 3.650%, 02/01/26 | 416,000 | 431,664 | ||||||
Digital Realty Trust LP, 3.950%, 07/01/22 | 730,000 | 743,301 | ||||||
Digital Realty Trust LP, 4.750%, 10/01/25 | 473,000 | 481,564 | ||||||
Simon Property Group LP, 3.300%, 01/15/26 | 306,000 | 317,564 | ||||||
|
| |||||||
| 3,118,747 | ||||||||
|
| |||||||
Retail 0.8% | ||||||||
CVS Health Corp., 5.125%, 07/20/45 | 375,000 | 434,296 | ||||||
Home Depot, Inc. (The), 2.625%, 06/01/22 | 364,000 | 376,534 | ||||||
Kohl’s Corp., 5.550%, 07/17/45 | 260,000 | 235,309 | ||||||
Wal-Mart Stores, Inc., 1.125%, 04/11/18 | 1,133,000 | 1,141,515 | ||||||
|
| |||||||
| 2,187,654 | ||||||||
|
| |||||||
Semiconductors 1.3% | ||||||||
Analog Devices, Inc., 5.300%, 12/15/45 | 933,000 | 1,047,036 | ||||||
Intel Corp., 1.950%, 10/01/16 | 380,000 | 382,638 | ||||||
Intel Corp., 4.900%, 07/29/45 | 366,000 | 410,494 | ||||||
| Shares or Principal Amount($) | Value($) | |||||||
Semiconductors—continued | ||||||||
TSMC Global Ltd., 1.625%, 04/03/18(a) | 1,673,000 | 1,663,464 | ||||||
|
| |||||||
| 3,503,632 | ||||||||
|
| |||||||
Software 0.4% |
| |||||||
Fidelity National Information Services, Inc., 4.500%, 10/15/22 | 494,000 | 526,804 | ||||||
Oracle Corp., 1.200%, 10/15/17 | 272,000 | 273,588 | ||||||
Oracle Corp., 2.375%, 01/15/19 | 305,000 | 316,174 | ||||||
|
| |||||||
| 1,116,566 | ||||||||
|
| |||||||
Telecommunication Services 1.5% |
| |||||||
AT&T, Inc., 2.375%, 11/27/18 | 532,000 | 543,457 | ||||||
AT&T, Inc., 3.950%, 01/15/25 | 168,000 | 174,608 | ||||||
AT&T, Inc., 4.350%, 06/15/45 | 208,000 | 190,548 | ||||||
AT&T, Inc., 4.750%, 05/15/46 | 400,000 | 390,183 | ||||||
CC Holdings GS V LLC/Crown Castle GS III Corp., 3.849%, 04/15/23 | 956,000 | 985,589 | ||||||
Cisco Systems, Inc., 2.125%, 03/01/19 | 460,000 | 473,272 | ||||||
Crown Castle Towers LLC, 3.222%, 05/15/42(a) | 675,000 | 676,012 | ||||||
Verizon Communications, Inc., 5.012%, 08/21/54 | 615,000 | 616,986 | ||||||
|
| |||||||
| 4,050,655 | ||||||||
|
| |||||||
Total Corporate Bonds | 74,515,220 | |||||||
|
| |||||||
U.S. Government Agency Mortgages 24.9% |
| |||||||
Federal Home Loan Mortgage Corporation | ||||||||
Pool #G30614, 3.500%, 12/01/32 | 943,669 | 1,000,958 | ||||||
Pool #C91768, 3.500%, 07/01/34 | 1,213,036 | 1,278,278 | ||||||
Pool #G01779, 5.000%, 04/01/35 | 153,638 | 170,411 | ||||||
Pool #G01837, 5.000%, 07/01/35 | 591,925 | 656,229 | ||||||
Pool #G01838, 5.000%, 07/01/35 | 33,827 | 37,530 | ||||||
Pool #G03296, 6.000%, 09/01/37 | 324,408 | 367,345 | ||||||
Pool #G05326, 5.000%, 02/01/38 | 149,843 | 165,988 | ||||||
Pool #G08347, 4.500%, 06/01/39 | 166,942 | 181,636 | ||||||
Pool #G08353, 4.500%, 07/01/39 | 213,140 | 231,914 | ||||||
See Notes to Financial Statements.
39
Table of Contents
SCHEDULES OF PORTFOLIO INVESTMENTS
RIDGEWORTH FUNDS March 31, 2016
Seix Core Bond Fund — continued
| Shares or Principal Amount($) | Value($) | |||||||
U.S. Government Agency Mortgages—continued |
| |||||||
Pool #G06079, 6.000%, 07/01/39 | 71,635 | 81,646 | ||||||
Pool #A89148, 4.000%, 10/01/39 | 387,968 | 415,197 | ||||||
Pool #A89384, 4.000%, 10/01/39 | 71,578 | 76,536 | ||||||
Pool #G08372, 4.500%, 11/01/39 | 624,258 | 679,537 | ||||||
Pool #A93101, 5.000%, 07/01/40 | 74,589 | 82,231 | ||||||
Pool #G06061, 4.000%, 10/01/40 | 560,542 | 601,945 | ||||||
Pool #A95085, 4.000%, 11/01/40 | 382,516 | 409,323 | ||||||
Pool #A95796, 4.000%, 12/01/40 | 232,319 | 248,791 | ||||||
Pool #A95822, 4.000%, 12/01/40 | 611,981 | 660,185 | ||||||
Pool #G60126, 4.500%, 11/01/41 | 62,322 | 67,798 | ||||||
Pool #Q18522, 3.500%, 05/01/43(d) | 1,223,088 | 1,286,011 | ||||||
Pool #849167, 2.947%, 10/01/43(b) | 861,067 | 892,115 | ||||||
Pool #G60019, 4.500%, 03/01/44 | 1,936,969 | 2,110,738 | ||||||
Pool #Q29416, 4.000%, 11/01/44 | 276,954 | 296,250 | ||||||
Pool #Q31066, 4.000%, 02/01/45 | 221,087 | 238,070 | ||||||
Pool #Q31645, 4.000%, 02/01/45 | 174,290 | 187,010 | ||||||
Pool #Q35611, 4.000%, 09/01/45 | 1,451,672 | 1,557,622 | ||||||
|
| |||||||
| 13,981,294 | ||||||||
|
| |||||||
Federal National Mortgage Association | ||||||||
Pool #AM6855, 3.150%, 11/01/24 | 90,000 | 94,671 | ||||||
Pool #AM6979, 3.310%, 11/01/24 | 378,000 | 402,289 | ||||||
Pool #AN0432, 2.970%, 12/01/25 | 520,000 | 544,489 | ||||||
Pool #AN0818, 3.050%, 01/01/26 | 207,000 | 218,186 | ||||||
Pool #AN0632, 3.210%, 01/01/26 | 1,550,000 | 1,625,601 | ||||||
Pool #AP9592, 3.500%, 10/01/32 | 970,864 | 1,029,449 | ||||||
Pool #MA1630, 4.000%, 10/01/33 | 339,568 | 366,233 | ||||||
| Shares or Principal Amount($) | Value($) | |||||||
U.S. Government Agency Mortgages—continued |
| |||||||
Pool #MA1763, 3.500%, 01/01/34 | 931,266 | 984,572 | ||||||
Pool #190370, 6.000%, 06/01/36 | 301,016 | 343,932 | ||||||
Pool #890248, 6.000%, 08/01/37 | 91,493 | 105,988 | ||||||
Pool #889529, 6.000%, 03/01/38 | 97,740 | 112,533 | ||||||
Pool #AE0814, 6.000%, 09/01/39 | 1,548,781 | 1,768,320 | ||||||
Pool #AC2817, 4.000%, 10/01/39 | 99,411 | 106,208 | ||||||
Pool #AX3605, 3.500%, 01/01/40 | 374,685 | 393,704 | ||||||
Pool #932441, 4.000%, 01/01/40 | 935,571 | 999,540 | ||||||
Pool #AC9564, 4.500%, 02/01/40 | 257,012 | 282,130 | ||||||
Pool #AL7497, 3.500%, 09/01/40 | 6,530,088 | 6,860,253 | ||||||
Pool #AD9725, 3.500%, 10/01/40 | 206,266 | 216,704 | ||||||
Pool #AE3860, 5.000%, 10/01/40 | 1,572,585 | 1,745,810 | ||||||
Pool #AE4414, 4.000%, 11/01/40 | 572,397 | 613,396 | ||||||
Pool #AE5143, 4.000%, 11/01/40 | 77,763 | 83,333 | ||||||
Pool #AE9284, 4.000%, 11/01/40 | 138,151 | 147,790 | ||||||
Pool #AB2071, 3.500%, 01/01/41 | 93,285 | 98,012 | ||||||
Pool #MA0639, 4.000%, 02/01/41 | 260,915 | 279,554 | ||||||
Pool #AL0215, 4.500%, 04/01/41 | 890,229 | 971,820 | ||||||
Pool #AB3274, 4.500%, 07/01/41 | 457,991 | 501,484 | ||||||
Pool #AB3865, 3.500%, 11/01/41 | 195,093 | 205,923 | ||||||
Pool #AT8263, 3.500%, 01/01/42 | 22,321 | 23,532 | ||||||
Pool #AW8154, 3.500%, 01/01/42 | 4,402,405 | 4,633,963 | ||||||
Pool #AB5188, 3.500%, 05/01/42 | 1,090,681 | 1,146,184 | ||||||
Pool #AP7874, 3.500%, 10/01/42 | 327,514 | 344,183 | ||||||
Pool #AB8726, 3.500%, 03/01/43 | 1,698,962 | 1,785,277 | ||||||
See Notes to Financial Statements.
40
Table of Contents
SCHEDULES OF PORTFOLIO INVESTMENTS
RIDGEWORTH FUNDS March 31, 2016
Seix Core Bond Fund — continued
| Shares or Principal Amount($) | Value($) | |||||||
U.S. Government Agency Mortgages—continued |
| |||||||
Pool #AL3657, 3.500%, 06/01/43 | 665,926 | 703,828 | ||||||
Pool #AU3742, 3.500%, 08/01/43 | 249,519 | 262,728 | ||||||
Pool #AL5939, 3.500%, 09/01/43(d) | 1,405,535 | 1,479,469 | ||||||
Pool #AL6223, 4.500%, 08/01/44 | 887,019 | 965,798 | ||||||
Pool #AY2685, 4.500%, 01/01/45 | 132,792 | 145,804 | ||||||
Pool #AX8835, 2.801%, 02/01/45(b) | 656,399 | 676,323 | ||||||
Pool #AZ7723, 4.500%, 10/01/45 | 213,202 | 232,603 | ||||||
Pool #BC2470, 3.500%, 02/01/46 | 564,003 | 594,945 | ||||||
|
| |||||||
| 34,096,561 | ||||||||
|
| |||||||
Government National Mortgage Association | ||||||||
Pool #MA0321, 5.000%, 08/20/42 | 96,691 | 107,789 | ||||||
Pool #666413, 4.000%, 09/15/43 | 270,300 | 291,916 | ||||||
Pool #MA2681, 5.000%, 03/20/45 | 405,879 | 441,939 | ||||||
Pool #AM0226, 4.000%, 05/15/45 | 2,819,752 | 3,020,415 | ||||||
Pool #AM9875, 4.000%, 06/15/45 | 459,852 | 493,918 | ||||||
Pool #AN7421, 4.000%, 06/15/45 | 247,100 | 264,959 | ||||||
Pool #AM7092, 4.500%, 06/15/45 | 394,554 | 429,933 | ||||||
Pool #AN8476, 3.500%, 07/15/45 | 774,014 | 818,440 | ||||||
Pool #626960, 3.500%, 07/15/45 | 1,544,897 | 1,641,781 | ||||||
Pool #AM8631, 4.000%, 07/15/45 | 673,409 | 721,501 | ||||||
Pool #AN5745, 4.000%, 07/15/45 | 939,278 | 1,009,007 | ||||||
Pool #AN5781, 4.000%, 07/15/45 | 509,258 | 546,236 | ||||||
Pool #AN5764, 4.000%, 07/15/45 | 383,434 | 411,959 | ||||||
Pool #AN5766, 4.000%, 07/15/45 | 421,336 | 452,019 | ||||||
Pool #AN6811, 4.000%, 07/15/45 | 196,739 | 210,762 | ||||||
Pool #AO0509, 3.500%, 08/15/45 | 1,009,051 | 1,068,148 | ||||||
| Shares or Principal Amount($) | Value($) | |||||||
U.S. Government Agency Mortgages—continued |
| |||||||
Pool #626970, 3.500%, 08/15/45 | 607,031 | 645,119 | ||||||
Pool #AO3608, 4.000%, 08/15/45 | 1,904,792 | 2,043,544 | ||||||
Pool #AM9046, 4.500%, 08/15/45 | 2,736,945 | 2,985,072 | ||||||
Pool #AB5970, 4.000%, 10/15/45 | 447,758 | 482,009 | ||||||
Pool #AB5975, 4.000%, 11/15/45 | 901,826 | 970,802 | ||||||
|
| |||||||
| 19,057,268 | ||||||||
|
| |||||||
Total U.S. Government Agency Mortgages |
| 67,135,123 | ||||||
|
| |||||||
| U.S. Treasury Obligations 36.6% | ||||||||
U.S. Treasury Bond 4.9% | ||||||||
3.000%, 11/15/45 | 12,210,000 | 13,181,550 | ||||||
|
| |||||||
U.S. Treasury Notes 31.7% |
| |||||||
0.500%, 06/15/16 | 37,600,000 | 37,616,882 | ||||||
1.250%, 10/31/18(e) | 13,389,000 | 13,534,391 | ||||||
1.375%, 02/29/20 | 4,798,000 | 4,850,668 | ||||||
1.625%, 02/15/26(c) | 29,779,000 | 29,346,281 | ||||||
|
| |||||||
| 85,348,222 | ||||||||
|
| |||||||
Total U.S. Treasury Obligations |
| 98,529,772 | ||||||
|
| |||||||
Foreign Government Bond 0.2% |
| |||||||
Sovereign 0.2% | ||||||||
Mexico Government International Bond, | 396,000 | 438,570 | ||||||
|
| |||||||
Total Foreign Government Bond |
| 438,570 | ||||||
|
| |||||||
Money Market Funds 8.1% |
| |||||||
State Street Institutional Treasury Money Market Fund, Institutional Class, 0.19%(f) | 8,951,394 | 8,951,394 | ||||||
State Street Institutional U.S. Government Money Market Fund, Institutional Class, 0.24%(f)(g) | 12,791,803 | 12,791,803 | ||||||
|
| |||||||
Total Money Market Funds |
| 21,743,197 | ||||||
|
| |||||||
Total Investments |
| 284,188,930 | ||||||
Liabilities in Excess of | (15,026,075 | ) | ||||||
|
| |||||||
Net Assets — 100.0% | $ | 269,162,855 | ||||||
|
| |||||||
See Notes to Financial Statements.
41
Table of Contents
SCHEDULES OF PORTFOLIO INVESTMENTS
RIDGEWORTH FUNDS March 31, 2016
Seix Core Bond Fund — concluded
| (a) | Rule 144A, Section 4(2) or other security which is restricted as to resale to institutional investors. The Fund’s investment adviser/subadviser has deemed this security to be liquid based upon procedures approved by the Board of Trustees. These securities represent 11.2% of net assets as of March 31, 2016. |
| (b) | Variable or floating rate security. Rate disclosed is as of March 31, 2016. |
| (c) | The security or a partial position of the security was on loan as of March 31, 2016. The total value of securities on loan as of March 31, 2016 was $12,492,396. |
| (d) | All or a portion of this security has been purchased on a when-issued or delayed-delivery basis. |
| (e) | All or a portion of this security has been segregated, or otherwise earmarked, in connection with obligations for when-issued or delayed-delivery purchase commitments. |
| (f) | Rate disclosed, the 7 day yield, is as of March 31, 2016. |
| (g) | Purchased with cash collateral held from securities lending. The value of the collateral could include collateral held for securities that were sold on or before March 31, 2016 (See Note 2(k)). |
Investment Abbreviation
MTN — Medium Term Note
See Notes to Financial Statements.
42
Table of Contents
SCHEDULES OF PORTFOLIO INVESTMENTS
RIDGEWORTH FUNDS March 31, 2016
Seix Corporate Bond Fund
| Shares or Principal Amount($) | Value($) | |||||||
| Corporate Bonds 95.3% | ||||||||
Aerospace/Defense 1.2% | ||||||||
L-3 Communications Corp., | 71,000 | 68,333 | ||||||
Lockheed Martin Corp., | 124,000 | 138,648 | ||||||
|
| |||||||
| 206,981 | ||||||||
|
| |||||||
Agriculture 1.4% | ||||||||
Japan Tobacco, Inc., | 250,000 | 252,363 | ||||||
|
| |||||||
Airlines 4.5% | ||||||||
American Airlines Pass Through Trust, Series 2015-2, | 128,000 | 131,840 | ||||||
American Airlines Pass Through Trust, Series 2016-1, Cl A, | 200,000 | 206,980 | ||||||
Delta Air Lines Pass Through Trust, Series 2015-1, | 66,653 | 65,903 | ||||||
Southwest Airlines Co., 2.650%, 11/05/20 | 117,000 | 119,295 | ||||||
Spirit Airlines Pass Through Trust, Series 2015-1, | 115,000 | 115,575 | ||||||
United Airlines Pass Through Trust, Series 2014-1, Cl A, 4.000%, 04/11/26 | 150,393 | 155,281 | ||||||
|
| |||||||
| 794,874 | ||||||||
|
| |||||||
Auto Manufacturers 3.1% | ||||||||
Ford Motor Credit Co. LLC, | 306,000 | 314,887 | ||||||
General Motors Co., | 235,000 | 220,917 | ||||||
|
| |||||||
| 535,804 | ||||||||
|
| |||||||
Auto Parts & Equipment 3.2% | ||||||||
Delphi Automotive PLC, | 128,000 | 133,609 | ||||||
Lear Corp., 4.750%, 01/15/23 | 135,000 | 138,713 | ||||||
Magna International, Inc., | 270,000 | 286,078 | ||||||
|
| |||||||
| 558,400 | ||||||||
|
| |||||||
Banks 17.0% | ||||||||
Bank of America Corp., | 206,000 | 212,218 | ||||||
Bank of America Corp., | 151,000 | 155,530 | ||||||
BPCE SA, 2.650%, 02/03/21 | 250,000 | 252,265 | ||||||
Fifth Third Bank, 3.850%, 03/15/26 | 259,000 | 265,319 | ||||||
| Shares or Principal Amount($) | Value($) | |||||||
Banks—continued | ||||||||
Goldman Sachs Group, Inc. (The), | 187,000 | 189,970 | ||||||
ING Bank NV, 1.800%, 03/16/18(a) | 200,000 | 200,583 | ||||||
JPMorgan Chase & Co., | 224,000 | 225,772 | ||||||
KeyCorp, 2.900%, 09/15/20, MTN | 138,000 | 140,262 | ||||||
Morgan Stanley, | 209,000 | 212,090 | ||||||
Morgan Stanley, | 181,000 | 181,191 | ||||||
Toronto-Dominion Bank, | 375,000 | 375,079 | ||||||
US Bancorp, | 109,000 | 110,663 | ||||||
US Bancorp, | 198,000 | 208,652 | ||||||
Wells Fargo & Co., | 233,000 | 247,223 | ||||||
|
| |||||||
| 2,976,817 | ||||||||
|
| |||||||
Beverages 1.5% | ||||||||
Anheuser-Busch InBev Finance, Inc., 3.650%, 02/01/26 | 57,000 | 59,942 | ||||||
Anheuser-Busch InBev Finance, Inc., 4.900%, 02/01/46 | 176,000 | 196,691 | ||||||
|
| |||||||
| 256,633 | ||||||||
|
| |||||||
Biotechnology 1.6% | ||||||||
Biogen, Inc., 5.200%, 09/15/45 | 124,000 | 137,540 | ||||||
Celgene Corp., 4.625%, 05/15/44 | 67,000 | 68,262 | ||||||
Celgene Corp., 5.000%, 08/15/45 | 69,000 | 74,612 | ||||||
|
| |||||||
| 280,414 | ||||||||
|
| |||||||
Commercial Services 3.0% | ||||||||
ERAC USA Finance LLC, 2.750%, 03/15/17(a) | 215,000 | 217,557 | ||||||
ERAC USA Finance LLC, 4.500%, 02/15/45(a) | 72,000 | 70,925 | ||||||
ERAC USA Finance LLC, 5.250%, 10/01/20(a) | 221,000 | 243,782 | ||||||
|
| |||||||
| 532,264 | ||||||||
|
| |||||||
Computers 1.4% | ||||||||
Apple, Inc., 3.200%, 05/13/25 | 230,000 | 240,963 | ||||||
|
| |||||||
Diversified Financial Services 4.8% | ||||||||
Air Lease Corp., 2.625%, 09/04/18 | 348,000 | 345,803 | ||||||
Lazard Group LLC, 3.750%, 02/13/25(e) | 401,000 | 370,130 | ||||||
TD Ameritrade Holding Corp., 2.950%, 04/01/22 | 115,000 | 117,377 | ||||||
|
| |||||||
| 833,310 | ||||||||
|
| |||||||
See Notes to Financial Statements.
43
Table of Contents
SCHEDULES OF PORTFOLIO INVESTMENTS
RIDGEWORTH FUNDS March 31, 2016
Seix Corporate Bond Fund — continued
| Shares or Principal Amount($) | Value($) | |||||||
Electric 2.6% | ||||||||
Berkshire Hathaway Energy Co., 6.125%, 04/01/36 | 91,000 | 112,660 | ||||||
Exelon Generation Co. LLC, 6.200%, 10/01/17 | 149,000 | 158,431 | ||||||
FirstEnergy Transmission LLC, 5.450%, 07/15/44(a) | 184,000 | 191,779 | ||||||
|
| |||||||
| 462,870 | ||||||||
|
| |||||||
Healthcare-Products 1.5% | ||||||||
Becton Dickinson and Co., 4.685%, 12/15/44 | 57,000 | 61,569 | ||||||
Medtronic, Inc., 3.500%, 03/15/25 | 56,000 | 59,771 | ||||||
Medtronic, Inc., 4.625%, 03/15/45 | 128,000 | 143,260 | ||||||
|
| |||||||
| 264,600 | ||||||||
|
| |||||||
Healthcare-Services 1.3% | ||||||||
Roche Holdings, Inc., 2.250%, 09/30/19(a) | 216,000 | 222,586 | ||||||
|
| |||||||
Housewares 1.0% | ||||||||
Newell Rubbermaid, Inc., 5.500%, 04/01/46 | 166,000 | 180,342 | ||||||
|
| |||||||
Insurance 1.0% | ||||||||
Chubb INA Holdings, Inc., 4.350%, 11/03/45 | 76,000 | 82,826 | ||||||
Reinsurance Group of America, Inc., 4.700%, 09/15/23, MTN | 92,000 | 95,928 | ||||||
|
| |||||||
| 178,754 | ||||||||
|
| |||||||
Media 0.6% | ||||||||
Comcast Corp., 4.650%, 07/15/42 | 92,000 | 102,337 | ||||||
|
| |||||||
Mining 4.4% | ||||||||
Barrick (PD) Australia Finance Property Ltd., 5.950%, 10/15/39 | 119,000 | 107,040 | ||||||
Barrick International Barbados Corp., 6.350%, 10/15/36(a) | 219,000 | 198,846 | ||||||
BHP Billiton Finance USA Ltd., 5.000%, 09/30/43 | 178,000 | 181,080 | ||||||
Newmont Mining Corp., 6.250%, 10/01/39 | 178,000 | 177,884 | ||||||
Rio Tinto Finance USA Ltd., 3.750%, 06/15/25 | 116,000 | 113,051 | ||||||
|
| |||||||
| 777,901 | ||||||||
|
| |||||||
Miscellaneous Manufacturer 3.2% | ||||||||
General Electric Co., 3.450%, 05/15/24, MTN | 253,000 | 272,669 | ||||||
General Electric Co., 4.125%, 10/09/42 | 112,000 | 118,115 | ||||||
General Electric Co., 5.250%, 12/06/17 | 158,000 | 169,317 | ||||||
|
| |||||||
| 560,101 | ||||||||
|
| |||||||
| Shares or Principal Amount($) | Value($) | |||||||
Oil & Gas 15.0% | ||||||||
Apache Corp., 3.250%, 04/15/22 | 176,000 | �� | 169,338 | |||||
ConocoPhillips Co., 5.950%, 03/15/46 | 181,000 | 194,713 | ||||||
Devon Energy Corp., 5.850%, 12/15/25(f) | 176,000 | 169,882 | ||||||
Ensco PLC, 4.500%, 10/01/24(f) | 143,000 | 79,365 | ||||||
Ensco PLC, 5.200%, 03/15/25(f) | 344,000 | 192,640 | ||||||
Ensco PLC, 5.750%, 10/01/44 | 125,000 | 61,875 | ||||||
EOG Resources, Inc., 4.150%, 01/15/26 | 257,000 | 267,242 | ||||||
Exxon Mobil Corp., 1.912%, 03/06/20 | 183,000 | 185,054 | ||||||
Exxon Mobil Corp., 3.043%, 03/01/26 | 338,000 | 345,930 | ||||||
Marathon Oil Corp., 3.850%, 06/01/25(f) | 177,000 | 143,831 | ||||||
Marathon Petroleum Corp., 3.625%, 09/15/24 | 27,000 | 24,689 | ||||||
Marathon Petroleum Corp., 5.000%, 09/15/54 | 211,000 | 165,149 | ||||||
Shell International Finance BV, 3.250%, 05/11/25 | 244,000 | 246,302 | ||||||
Woodside Finance Ltd., 3.650%, 03/05/25(a) | 96,000 | 89,180 | ||||||
Woodside Finance Ltd., 4.600%, 05/10/21(a)(e) | 277,000 | 287,028 | ||||||
|
| |||||||
| 2,622,218 | ||||||||
|
| |||||||
Oil & Gas Services 2.7% | ||||||||
FMC Technologies, Inc., 3.450%, 10/01/22 | 49,000 | 43,543 | ||||||
Schlumberger Holdings Corp., 3.000%, 12/21/20(a) | 142,000 | 143,965 | ||||||
Schlumberger Holdings Corp., 4.000%, 12/21/25(a) | 278,000 | 287,015 | ||||||
|
| |||||||
| 474,523 | ||||||||
|
| |||||||
Pharmaceuticals 2.7% | ||||||||
AbbVie, Inc., 3.600%, 05/14/25 | 188,000 | 197,347 | ||||||
Express Scripts Holding Co., 2.650%, 02/15/17 | 275,000 | 278,591 | ||||||
|
| |||||||
| 475,938 | ||||||||
|
| |||||||
Pipelines 1.8% | ||||||||
NuStar Logistics LP, 4.800%, 09/01/20(e) | 300,000 | 264,000 | ||||||
Phillips 66 Partners LP, 3.605%, 02/15/25 | 30,000 | 27,261 | ||||||
Phillips 66 Partners LP, 4.680%, 02/15/45 | 26,000 | 21,593 | ||||||
|
| |||||||
| 312,854 | ||||||||
|
| |||||||
See Notes to Financial Statements.
44
Table of Contents
SCHEDULES OF PORTFOLIO INVESTMENTS
RIDGEWORTH FUNDS March 31, 2016
Seix Corporate Bond Fund — concluded
| Shares or Principal Amount($) | Value($) | |||||||
Real Estate Investment Trust 5.6% | ||||||||
American Tower Corp., 3.500%, 01/31/23 | 190,000 | 191,801 | ||||||
American Tower Corp., 5.000%, 02/15/24 | 215,000 | 235,935 | ||||||
Boston Properties LP, 3.650%, 02/01/26 | 114,000 | 118,293 | ||||||
Digital Realty Trust LP, 3.950%, 07/01/22 | 220,000 | 224,008 | ||||||
Digital Realty Trust LP, 4.750%, 10/01/25 | 123,000 | 125,227 | ||||||
Simon Property Group LP, 3.300%, 01/15/26 | 84,000 | 87,175 | ||||||
|
| |||||||
| 982,439 | ||||||||
|
| |||||||
Retail 1.9% | ||||||||
CVS Health Corp., 5.125%, 07/20/45 | 110,000 | 127,393 | ||||||
Home Depot, Inc. (The), 2.625%, 06/01/22 | 122,000 | 126,201 | ||||||
Kohl’s Corp., 5.550%, 07/17/45 | 83,000 | 75,118 | ||||||
|
| |||||||
| 328,712 | ||||||||
|
| |||||||
Semiconductors 1.1% | ||||||||
TSMC Global Ltd., 1.625%, 04/03/18(a)(e) | 200,000 | 198,860 | ||||||
|
| |||||||
Software 1.6% | ||||||||
Fidelity National Information Services, Inc., 4.500%, 10/15/22 | 155,000 | 165,293 | ||||||
Microsoft Corp., 2.000%, 11/03/20 | 118,000 | 120,897 | ||||||
|
| |||||||
| 286,190 | ||||||||
|
| |||||||
Telecommunication Services 4.6% | ||||||||
AT&T, Inc., 3.950%, 01/15/25 | 54,000 | 56,124 | ||||||
AT&T, Inc., 4.350%, 06/15/45 | 37,000 | 33,896 | ||||||
AT&T, Inc., 4.750%, 05/15/46 | 165,000 | 160,950 | ||||||
CC Holdings GS V LLC/Crown Castle GS III Corp., 3.849%, 04/15/23 | 254,000 | 261,861 | ||||||
Verizon Communications, Inc., 5.012%, 08/21/54 | 300,000 | 300,969 | ||||||
|
| |||||||
| 813,800 | ||||||||
|
| |||||||
Total Corporate Bonds | 16,713,848 | |||||||
|
| |||||||
| Shares or Principal Amount($) | Value($) | |||||||
Money Market Funds 7.3% |
| |||||||
State Street Institutional Treasury Money Market Fund, Institutional Class, 0.19%(g) | 813,998 | 813,998 | ||||||
State Street Institutional U.S. Government Money Market Fund, Institutional Class, 0.24%(g)(h) | 471,458 | 471,458 | ||||||
|
| |||||||
Total Money Market Funds | 1,285,456 | |||||||
|
| |||||||
Total Investments | 17,999,304 | |||||||
Liabilities in Excess of | (450,994 | ) | ||||||
|
| |||||||
Net Assets — 100.0% | $ | 17,548,310 | ||||||
|
| |||||||
| (a) | Rule 144A, Section 4(2) or other security which is restricted as to resale to institutional investors. The Fund’s investment adviser/subadviser has deemed this security to be liquid based upon procedures approved by the Board of Trustees. These securities represent 14.8% of net assets as of March 31, 2016. |
| (b) | Variable or floating rate security. Rate disclosed is as of March 31, 2016. |
| (c) | Perpetual maturity. |
| (d) | All or a portion of this security has been purchased on a when-issued or delayed-delivery basis. |
| (e) | All or a portion of this security has been segregated, or otherwise earmarked, in connection with obligations for when-issued or delayed-delivery purchase commitments. |
| (f) | The security or a partial position of the security was on loan as of March 31, 2016. The total value of securities on loan as of March 31, 2016 was $452,997. |
| (g) | Rate disclosed, the 7 day yield, is as of March 31, 2016. |
| (h) | Purchased with cash collateral held from securities lending. The value of the collateral could include collateral held for securities that were sold on or before March 31, 2016 (See Note 2(k)). |
Investment Abbreviation
MTN —Medium Term Note
See Notes to Financial Statements.
45
Table of Contents
SCHEDULES OF PORTFOLIO INVESTMENTS
RIDGEWORTH FUNDS March 31, 2016
Seix Floating Rate High Income Fund
| Shares or Principal Amount($) | Value($) | |||||||
| Asset-Backed Security 0.0%(a) | ||||||||
Other 0.0%(a) | ||||||||
Cutwater 2015-I Ltd., Series 2015-1A, Cl D1, 4.522%, 07/15/27(b)(c) | 1,294,000 | 1,058,470 | ||||||
|
| |||||||
Total Asset-Backed Security | 1,058,470 | |||||||
|
| |||||||
| Bank Loans 93.8% | ||||||||
Aerospace 3.2% | ||||||||
Air Canada, 2015 Term Loan B, 4.000%, 09/26/19(b)(c) | 13,215,333 | 13,202,910 | ||||||
AM General LLC, Term Loan B, 10.250%, 03/22/18(c)(d) | 14,910,143 | 10,884,404 | ||||||
AWAS Finance Luxembourg S.A.R.L., Term Loan B, 06/10/16(b)(e)(f) | 10,216,294 | 10,193,920 | ||||||
Computer Sciences Government Services, Inc., Term Loan B, 3.750%, 11/28/22(b)(c) | 13,940,063 | 13,961,809 | ||||||
DAE Aviation Holdings, Inc., 1st Lien Term Loan, 5.250%, 07/07/22(b)(c) | 2,691,475 | 2,679,713 | ||||||
Engility Corp., 2014 Term Loan B, 7.000%, 05/30/20(b)(c) | 16,256,371 | 15,606,116 | ||||||
Engility Corp., 2nd Lien Term Loan, 12.000%, 05/30/21(b)(c) | 10,605,000 | 9,915,675 | ||||||
Transdigm, Inc., 2015 Term Loan E, 3.500%, 05/14/22(b)(c) | 24,330,934 | 23,935,557 | ||||||
Transdigm, Inc., Term Loan C, 3.750%, 02/28/20(b)(c) | 22,276,287 | 21,957,959 | ||||||
Transdigm, Inc., Term Loan D, 3.750%, 06/04/21(b)(c) | 8,876,887 | 8,740,538 | ||||||
US Airways Group, Inc., New Term Loan B1, 3.500%, 05/23/19(b)(c) | 1,650,608 | 1,646,069 | ||||||
WP CPP Holdings LLC, Term Loan B3, 4.500%, 12/28/19(b)(c) | 6,654,028 | 6,130,024 | ||||||
WP CPP Holdings LLC, New 2nd Lien Term Loan, 8.750%, 04/30/21(b)(c) | 1,413,475 | 1,206,161 | ||||||
|
| |||||||
| 140,060,855 | ||||||||
|
| |||||||
Broadcasting 4.1% | ||||||||
Cumulus Media Holdings, Inc., 2013 Term Loan, 4.250%, 12/23/20(b)(c) | 8,810,805 | 5,925,266 | ||||||
| Shares or Principal Amount($) | Value($) | |||||||
Broadcasting—continued | ||||||||
EIG Investors Corp., 2016 Term Loan, 02/02/23(b)(e)(f) | 6,915,000 | 6,396,375 | ||||||
iHeartCommunications, Inc., Term Loan D, 7.183%, 01/30/19(b)(c)(g) | 36,585,459 | 25,335,430 | ||||||
iHeartCommunications, Inc., USD Extended Term Loan E, 7.933%, 07/30/19(b)(c)(g) | 85,742,285 | 59,076,434 | ||||||
Tribune Media Co., Term Loan, 3.750%, 12/27/20(b)(c) | 33,452,776 | 33,299,563 | ||||||
Univision Communications, Inc., Term Loan C3, 4.000%, 03/01/20(b)(c) | 35,022,499 | 34,635,851 | ||||||
Univision Communications, Inc., Term Loan C4, 4.000%, 03/01/20(b)(c) | 15,488,066 | 15,318,627 | ||||||
|
| |||||||
| 179,987,546 | ||||||||
|
| |||||||
Cable/Wireless Video 6.5% |
| |||||||
CCO Safari III LLC, Term Loan H, 3.250%, 08/24/21(b)(c) | 8,260,000 | 8,231,338 | ||||||
CCO Safari III LLC, Term Loan I, 3.500%, 01/24/23(b)(c) | 3,880,000 | 3,881,086 | ||||||
Charter Communications Operating LLC, Term Loan E, 3.000%, 07/01/20(b)(c) | 25,437,748 | 25,306,489 | ||||||
Charter Communications Operating LLC, Term Loan F, 3.000%, 01/04/21(b)(c) | 3,852,016 | 3,833,449 | ||||||
CSC Holdings, Inc., New Term Loan B, 2.933%, 04/17/20(b)(c) | 2,499,967 | 2,496,842 | ||||||
Liberty Cablevision of Puerto Rico LLC, 1st Lien Term Loan, | 13,560,000 | 12,915,900 | ||||||
Liberty Cablevision of Puerto Rico LLC, 2nd Lien Term Loan, 7.750%, 07/07/23(b)(c)(e) | 7,945,000 | 7,349,125 | ||||||
MCC Iowa LLC, Term Loan H, 3.250%, 01/29/21(b)(c) | 11,373,336 | 11,297,476 | ||||||
Neptune Finco Corp., 2015 Term Loan B, 5.000%, 10/09/22(b)(c) | 17,935,000 | 17,932,130 | ||||||
Quebecor Media, Inc., Term Loan B1, 3.250%, 08/17/20(b)(c) | 29,159,832 | 28,734,682 | ||||||
UPC Financing Partnership, USD Term Loan AH, 3.344%, 06/30/21(b)(c) | 5,726,632 | 5,674,462 | ||||||
See Notes to Financial Statements.
46
Table of Contents
SCHEDULES OF PORTFOLIO INVESTMENTS
RIDGEWORTH FUNDS March 31, 2016
Seix Floating Rate High Income Fund — continued
| Shares or Principal Amount($) | Value($) | |||||||
Cable/Wireless Video—continued |
| |||||||
Virgin Media Investment Holdings Ltd., USD Term Loan F, 3.500%, 06/30/23(b)(c) | 38,273,621 | 37,924,565 | ||||||
WideOpenWest Finance LLC, Term Loan B1, 3.750%, 07/17/17(b)(c) | 736,224 | 730,048 | ||||||
WideOpenWest Finance LLC, 2015 Term Loan B, 4.500%, 04/01/19(b)(c) | 3,039,648 | 3,003,294 | ||||||
Ziggo Financing Partnership, USD Term Loan B1, 3.500%, 01/15/22(b)(c) | 42,336,940 | 41,895,790 | ||||||
Ziggo Financing Partnership, USD Term Loan B2A, 3.500%-3.601%, 01/15/22(b)(c) | 27,282,723 | 26,998,438 | ||||||
Ziggo Financing Partnership, USD Term Loan B3, 3.601%, 01/15/22(b)(c) | 44,870,336 | 44,402,787 | ||||||
|
| |||||||
| 282,607,901 | ||||||||
|
| |||||||
Chemicals 4.4% |
| |||||||
Axalta Coating Systems US Holdings, Inc., USD Term Loan, 3.750%, 02/01/20(b)(c) | 10,182,995 | 10,110,900 | ||||||
Chemours Co., (The), Term Loan B, 3.750%, 05/12/22(b)(c) | 10,024,250 | 9,548,098 | ||||||
Gemini HDPE LLC, Term Loan B, 4.750%, 08/07/21(b)(c)(e) | 15,741,229 | 15,524,787 | ||||||
Huntsman International LLC, 2016 Term Loan B, 03/23/23(b)(e)(f) | 13,200,000 | 13,134,000 | ||||||
Ineos Group Holdings S.A., US 2020 Term Loan, 3.750%, 12/15/20(b)(c) | 59,084,836 | 58,050,851 | ||||||
Ineos US Finance LLC, USD 6 Year Term Loan, 3.750%, 05/04/18(b)(c) | 8,496,409 | 8,390,204 | ||||||
Ineos US Finance LLC, 2015 USD Term Loan, 4.250%, 03/31/22(b)(c) | 5,172,723 | 5,091,925 | ||||||
Kraton Polymers LLC, Term Loan B, 6.000%, 01/06/22(b)(c)(e) | 8,385,000 | 7,896,574 | ||||||
MacDermid, Inc., USD 1st Lien Term Loan, 5.500%, 06/07/20(b)(c) | 11,278,855 | 10,873,493 | ||||||
| Shares or Principal Amount($) | Value($) | |||||||
Chemicals—continued |
| |||||||
MacDermid, Inc., USD Term Loan B3, 5.500%, 06/07/20(b)(c) | 8,044,575 | 7,762,049 | ||||||
Minerals Technologies, Inc., 2015 Term Loan B1, | 9,827,184 | 9,778,048 | ||||||
Minerals Technologies, Inc., Fixed Rate Term Loan, 4.750%, 05/09/21(b)(c) | 3,580,000 | 3,575,525 | ||||||
Styrolution US Holding LLC, USD Term Loan B, 6.500%, 11/07/19(b)(c) | 23,393,875 | 23,452,360 | ||||||
Univar Inc., 2015 Term Loan, 4.250%, 07/01/22(b)(c) | 8,905,250 | 8,766,150 | ||||||
|
| |||||||
| 191,954,964 | ||||||||
|
| |||||||
Consumer Durables 0.1% |
| |||||||
Steinway Musical Instruments, Inc., 1st Lien Term Loan, 4.750%, 09/19/19(b)(c) | 5,804,295 | 5,572,123 | ||||||
|
| |||||||
Consumer Non-Durables 0.9% |
| |||||||
Coty, Inc., USD Term Loan B, 3.750%, 10/27/22(b)(c) | 3,191,667 | 3,180,496 | ||||||
Eastman Kodak Co., Exit Term Loan, 7.250%, 09/03/19(b)(c) | 8,949,239 | 8,516,722 | ||||||
Galleria Co., USD Term Loan B, 3.750%, 01/26/23(b)(c) | 8,128,333 | 8,097,852 | ||||||
Party City Holdings, Inc., 2015 Term Loan B, 4.250%, 08/19/22(b)(c) | 6,129,420 | 6,073,213 | ||||||
Spectrum Brands, Inc., USD Term Loan, 3.500%, 06/23/22(b)(c) | 3,338,729 | 3,346,241 | ||||||
Varsity Brands, Inc., 1st Lien Term Loan, 5.000%-6.500%, 12/11/21(b)(c) | 8,870,088 | 8,836,825 | ||||||
|
| |||||||
| 38,051,349 | ||||||||
|
| |||||||
Diversified Media 6.4% |
| |||||||
Affinion Group, Inc., Term Loan B, 6.750%, 04/30/18(b)(c) | 5,003,344 | 4,424,407 | ||||||
ALM Media Holdings, Inc., 1st Lien Term Loan, 5.500%, 07/31/20(b)(c) | 5,144,563 | 4,887,334 | ||||||
AP NMT Acquisition BV, USD 1st Lien Term Loan, 6.750%, 08/13/21(b)(c) | 10,480,078 | 9,117,668 | ||||||
Deluxe Entertainment Services Group, Inc., Term Loan 2014, 6.500%, 02/28/20(b)(c) | 15,875,402 | 15,022,099 | ||||||
See Notes to Financial Statements.
47
Table of Contents
SCHEDULES OF PORTFOLIO INVESTMENTS
RIDGEWORTH FUNDS March 31, 2016
Seix Floating Rate High Income Fund — continued
| Shares or Principal Amount($) | Value($) | |||||||
Diversified Media—continued |
| |||||||
Emerald Expositions Holding, Inc., Term Loan B, 4.750%, 06/17/20(b)(c) | 5,972,762 | 5,927,966 | ||||||
Harland Clarke Holdings Corp., Extended Term Loan B2, 5.881%, 06/30/17(b)(c) | 20,038,031 | 19,737,460 | ||||||
Harland Clarke Holdings Corp., Term Loan B4, 6.000%, 08/04/19(b)(c) | 31,900,433 | 30,704,167 | ||||||
Harland Clarke Holdings Corp., Term Loan B3, 7.000%, 05/22/18(b)(c)(g) | 94,499,301 | 92,727,439 | ||||||
Learfield Communications, Inc., New 1st Lien Term Loan, 4.250%, 10/09/20(b)(c) | 4,073,672 | 4,048,212 | ||||||
Lions Gate Entertainment Corp., 2015 2nd Lien Term Loan, 5.000%, 03/17/22(b)(c) | 14,085,000 | 13,697,663 | ||||||
Live Nation Entertainment, Inc., 2020 Term Loan B1, 3.500%, 08/16/20(b)(c) | 9,487,717 | 9,475,858 | ||||||
McGraw-Hill Global Education Holdings LLC, 2015 Term Loan B, | 3,568,785 | 3,553,904 | ||||||
Merrill Communications LLC, 2015 Term Loan, 6.250%, 06/01/22(b)(c) | 8,707,612 | 6,987,858 | ||||||
Quincy Newspapers, Inc., Term Loan B, | 5,990,765 | 5,885,926 | ||||||
Rovi Solutions Corp., New Term Loan B, 3.750%, 07/02/21(b)(c) | 7,702,788 | 7,587,246 | ||||||
William Morris Endeavor Entertainment LLC, 1st Lien Term Loan, 5.250%, 05/06/21(b)(c) | 34,503,434 | 34,438,913 | ||||||
William Morris Endeavor Entertainment LLC, 2nd Lien Term Loan, 8.250%, 05/06/22(b)(c) | 8,855,000 | 8,412,250 | ||||||
WMG Acquisition Corp., New Term Loan, 3.750%, 07/01/20(b)(c) | 4,382,686 | 4,315,105 | ||||||
|
| |||||||
| 280,951,475 | ||||||||
|
| |||||||
Energy 4.7% | ||||||||
Alon USA Energy, Inc., Master Limited Partnership Term Loan, 9.250%, 11/26/18(b)(c) | 17,790,763 | 17,701,809 | ||||||
| Shares or Principal Amount($) | Value($) | |||||||
Energy—continued | ||||||||
Azure Midstream Energy LLC, Term Loan B, 7.500%, 11/15/18(b)(c) | 7,471,851 | 3,735,926 | ||||||
Chief Exploration & Development LLC, 2nd Lien Term Loan, 7.500%, 05/16/21(b)(c) | 3,210,000 | 1,875,186 | ||||||
CITGO Holding, Inc., 2015 Term Loan B, 9.500%, 05/12/18(b)(c) | 37,318,047 | 37,329,615 | ||||||
Drillships Financing Holding, Inc., Term Loan B1, 6.000%, 03/31/21(b)(c) | 25,293,030 | 8,994,960 | ||||||
EMG Utica LLC, Term Loan, 4.750%, 03/27/20(b)(c) | 20,710,530 | 15,947,108 | ||||||
Energy Transfer Equity, L.P., New Term Loan, 3.250%, 12/02/19(b)(c)(e) | 63,012,288 | 55,968,144 | ||||||
EP Energy LLC, Term Loan B2, 04/30/19(b)(e)(f) | 315,426 | 206,604 | ||||||
FTS International, Inc., New Term Loan B, 5.750%, 04/16/21(c)(d) | 15,936,000 | 1,872,480 | ||||||
Glenn Pool Oil & Gas Trust, Term Loan, 4.500%, 05/02/16(c)(d) | 1,847,611 | 1,829,135 | ||||||
HGIM Corp., Term Loan B, 5.500%, 06/18/20(b)(c) | 6,973,082 | 3,713,166 | ||||||
KCA Deutag US Finance LLC, Term Loan, 6.250%, 05/15/20(b)(c) | 6,159,781 | 4,147,566 | ||||||
Osum Productions Corp., Term Loan, 6.500%, 07/28/20(c)(d) | 1,302,600 | 560,118 | ||||||
Philadelphia Energy Solutions LLC, Term Loan B, 6.250%, 04/04/18(b)(c) | 14,716,419 | 13,980,598 | ||||||
Pinnacle Holdco S.A.R.L., Term Loan, 4.750%, 07/30/19(b)(c) | 3,269,485 | 2,354,029 | ||||||
Seadrill Partners Finco LLC, Term Loan B, 4.000%, 02/21/21(b)(c) | 17,063,712 | 7,508,033 | ||||||
Sheridan Investment Partners II L.P., Term Loan B, 4.250%, 12/16/20(c)(d) | 4,771,947 | 1,908,779 | ||||||
Sheridan Investment Partners II L.P., Term Loan A, 4.250%, 12/16/20(c)(d) | 663,812 | 265,525 | ||||||
Sheridan Investment Partners II L.P., Term Loan M, 4.250%, 12/16/20(c)(d) | 247,566 | 99,026 | ||||||
See Notes to Financial Statements.
48
Table of Contents
SCHEDULES OF PORTFOLIO INVESTMENTS
RIDGEWORTH FUNDS March 31, 2016
Seix Floating Rate High Income Fund — continued
| Shares or Principal Amount($) | Value($) | |||||||
Energy—continued | ||||||||
Southcross Holdings Borrower LP, Term Loan B, 7.500%, 08/04/21(b)(c) | 4,383,250 | 449,283 | ||||||
Stonewall Gas Gathering LLC, Term Loan B, 8.750%, 01/28/22(b)(c) | 8,652,746 | 8,522,954 | ||||||
Templar Energy LLC, New 2nd Lien Term Loan, 8.500%, 11/25/20(b)(c)(h) | 56,810,000 | 5,624,190 | ||||||
Western Refining, Inc., Term Loan B, 4.250%, 11/12/20(b)(c) | 10,012,317 | 9,711,948 | ||||||
|
| |||||||
| 204,306,182 | ||||||||
|
| |||||||
Financial 1.0% | ||||||||
Grosvenor Capital Management Holdings LLP, New Term Loan B, 3.750%, 01/04/21(b)(c) | 6,387,501 | 6,243,782 | ||||||
RCS Capital Corp., 1st Lien Term Loan, 7.500%, 04/29/19(c)(d) | 12,122,563 | 8,000,891 | ||||||
RCS Capital Corp., Delayed Draw DIP Term Loan, 8.000%, 08/08/16(b)(c) | 1,585,000 | 1,585,000 | ||||||
Starwood Property Trust, Inc., Term Loan B, 3.500%, 04/17/20(b)(c) | 6,146,233 | 6,084,771 | ||||||
USI, Inc., Term Loan B, 4.250%, 12/27/19(b)(c) | 9,592,293 | 9,432,390 | ||||||
Victory Capital Management, Inc., Term Loan B, 7.000%, 10/31/21(c)(d) | 5,711,875 | 5,511,959 | ||||||
Walter Investment Management Corp., 2013 Term Loan, 12/19/20(b)(e)(f) | 5,575,607 | 4,839,627 | ||||||
|
| |||||||
| 41,698,420 | ||||||||
|
| |||||||
Food and Drug 0.9% | ||||||||
Albertsons LLC, Term Loan B3, 5.125%, 08/25/19(b)(c) | 7,186,750 | 7,177,767 | ||||||
Albertsons LLC, Term Loan B2, 5.500%, 03/21/19(b)(c) | 28,237,048 | 28,221,235 | ||||||
Albertsons LLC, Term Loan B4, 5.500%, 08/25/21(b)(c) | 2,608,650 | 2,609,954 | ||||||
|
| |||||||
| 38,008,956 | ||||||||
|
| |||||||
Food/Tobacco 1.4% | ||||||||
1011778 B.C. Unlimited Liability Company, Term Loan B2, 3.750%, 12/10/21(b)(c) | 26,315,643 | 26,279,064 | ||||||
| Shares or Principal Amount($) | Value($) | |||||||
Food/Tobacco—continued | ||||||||
JBS USA LLC, Incremental Term Loan, 3.750%, 09/18/20(b)(c) | 10,900,500 | 10,818,746 | ||||||
JBS USA LLC, 2015 Term Loan B, 4.000%, 10/30/22(b)(c) | 6,578,513 | 6,537,397 | ||||||
Landry’s, Inc., Term Loan B, 4.000%, 04/24/18(b)(c) | 5,238,288 | 5,220,268 | ||||||
Maple Holdings Acquisition Corp., USD Term Loan B, 5.250%, 03/03/23(b)(c) | 12,874,667 | 12,853,166 | ||||||
|
| |||||||
| 61,708,641 | ||||||||
|
| |||||||
Forest Prod/Containers 1.5% |
| |||||||
Ardagh Holdings USA, Inc., Incremental Term Loan, 4.000%, 12/17/19(b)(c) | 7,207,900 | 7,195,863 | ||||||
Berry Plastics Holding Corp., Term Loan D, 3.500%, 02/08/20(b)(c)(g) | 33,420,207 | 33,253,106 | ||||||
Caraustar Industries, Inc., Term Loan B, 8.000%, 05/01/19(b)(c) | 9,310,580 | 9,054,539 | ||||||
Mauser US Corporate LLC, USD 2nd Lien Term Loan, 8.750%, 07/31/22(b)(c) | 3,610,000 | 3,107,993 | ||||||
Owens-Illinois Inc., Term Loan B, 3.500%, 09/01/22(b)(c) | 3,490,812 | 3,490,812 | ||||||
Signode Industrial Group US, Inc., USD Term Loan B, 3.750%, 05/01/21(b)(c)(e) | 10,320,392 | 10,010,780 | ||||||
|
| |||||||
| 66,113,093 | ||||||||
|
| |||||||
Gaming/Leisure 8.3% |
| |||||||
Amaya Holdings B.V., USD 1st Lien Term Loan, 5.000%, 08/01/21(b)(c) | 17,466,124 | 16,012,768 | ||||||
Belmond Interfin Ltd., USD Term Loan B, 4.000%, 03/21/21(b)(c) | 9,692,200 | 9,558,932 | ||||||
Boyd Gaming Corp., Term Loan B, 4.000%, 08/14/20(b)(c) | 5,475,118 | 5,469,971 | ||||||
Caesars Entertainment Operating Co., Term Loan B7(Non RSA), 03/01/17(b)(c)(h) | 18,571,675 | 17,039,512 | ||||||
Caesars Entertainment Operating Co., Extended Term Loan B6, 03/01/17(b)(c) | 75,756,845 | 69,453,118 | ||||||
Caesars Entertainment Resort Properties LLC, Term Loan B, 7.000%, 10/11/20(b)(c) | 45,942,721 | 42,313,246 | ||||||
See Notes to Financial Statements.
49
Table of Contents
SCHEDULES OF PORTFOLIO INVESTMENTS
RIDGEWORTH FUNDS March 31, 2016
Seix Floating Rate High Income Fund — continued
| Shares or Principal Amount($) | Value($) | |||||||
Gaming/Leisure—continued |
| |||||||
Diamond Resorts Corp., New Term Loan, 5.500%, 05/09/21(b)(c) | 9,910,200 | 9,612,894 | ||||||
Diamond Resorts Corp., Incremental Term Loan, 5.500%, 05/09/21(b)(c) | 4,355,000 | 4,202,575 | ||||||
Four Seasons Holdings, Inc., New 1st Lien Term Loan, 3.500%, 06/27/20(b)(c) | 14,931,698 | 14,805,675 | ||||||
Four Seasons Holdings, Inc., 2nd Lien Term Loan, 6.250%, 12/27/20(b)(c) | 7,111,600 | 7,028,608 | ||||||
Global Cash Access LLC, New Term Loan B, 6.250%, 12/18/20(b)(c) | 8,653,125 | 8,009,592 | ||||||
Hilton Worldwide Finance LLC, USD Term Loan B2, 3.500%, 10/26/20(b)(c) | 92,208,795 | 92,180,210 | ||||||
La Quinta Intermediate Holdings LLC, Term Loan B, 3.750%, 04/14/21(b)(c) | 15,106,533 | 14,816,941 | ||||||
LTF Merger Sub, Inc., Term Loan B, 4.250%, 06/10/22(b)(c) | 3,306,915 | 3,262,272 | ||||||
MGM Resorts International, Term Loan A, 3.183%, 12/20/17(b)(c) | 2,288,494 | 2,280,484 | ||||||
MGM Resorts International, Term Loan B, 3.500%, 12/20/19(b)(c) | 16,095,684 | 16,049,650 | ||||||
Mohegan Tribal Gaming Authority, New Term Loan B, 5.500%, 06/15/18(b)(c) | 8,596,684 | 8,301,216 | ||||||
Playa Resorts Holding B.V., Term Loan B, 4.000%, 08/09/19(b)(c) | 6,059,625 | 5,908,134 | ||||||
Scientific Games International, Inc., 2014 Term Loan B1, 6.000%, 10/18/20(b)(c) | 17,836,611 | 17,245,863 | ||||||
|
| |||||||
| 363,551,661 | ||||||||
|
| |||||||
Healthcare 6.7% | ||||||||
Alere, Inc., 2015 Term Loan A, 3.440%, 06/18/20(b)(c) | 6,422,314 | 6,352,761 | ||||||
Ardent Legacy Acquisitions, Inc., 2015 Term Loan B, 6.500%, 08/04/21(b)(c) | 4,363,075 | 4,363,075 | ||||||
CDRH Parent, Inc., New 1st Lien Term Loan, 5.250%, 07/01/21(b)(c) | 1,974,937 | 1,803,769 | ||||||
| Shares or Principal Amount($) | Value($) | |||||||
Healthcare—continued | ||||||||
Community Health Systems, Inc., New Term Loan A, 2.886%, 01/22/19(b)(c) | 8,250,000 | 8,002,500 | ||||||
Community Health Systems, Inc., Term Loan F, 3.683%-3.886%, 12/31/18(b)(c) | 28,893,863 | 28,579,787 | ||||||
Community Health Systems, Inc., Term Loan G, 3.750%, 12/31/19(b)(c) | 14,867,054 | 14,586,215 | ||||||
Community Health Systems, Inc., Term Loan H, 4.000%, 01/27/21(b)(c) | 13,844,965 | 13,596,863 | ||||||
Convatec, Inc., USD Term Loan, 4.250%, 06/15/20(b)(c) | 9,661,257 | 9,564,645 | ||||||
DPx Holdings B.V., 2014 USD Incremental Term Loan, 4.250%, 03/11/21(b)(c) | 8,378,938 | 8,062,968 | ||||||
Emdeon Business Services LLC, Term Loan B2, 3.750%, 11/02/18(b)(c) | 6,082,967 | 6,049,510 | ||||||
Endo Luxembourg Finance Co. I S.A R.L., 2015 Term Loan B, 3.750%, 09/26/22(b)(c) | 19,236,788 | 18,924,190 | ||||||
eResearchTechnology, Inc., Term Loan B, 5.500%, 05/08/22(b)(c) | 5,290,025 | 5,280,133 | ||||||
Genoa, a QoL Healthcare Co. LLC, 2nd Lien Term Loan, 8.750%, 04/30/23(b)(c) | 945,000 | 878,850 | ||||||
Greatbatch Ltd., Term Loan B, 5.250%, 10/27/22(b)(c)(e) | 11,150,000 | 11,132,606 | ||||||
Grifols Worldwide Operations USA, Inc., USD Term Loan B, 3.433%, 02/27/21(b)(c) | 16,288,867 | 16,266,877 | ||||||
Halyard Health, Inc., Term Loan B, 4.000%, 11/01/21(b)(c) | 5,592,358 | 5,564,396 | ||||||
IMS Health Incorporated, New USD Term Loan, 3.500%, 03/17/21(b)(c) | 5,958,714 | 5,940,123 | ||||||
Indivior Finance S.a.r.l., USD Term Loan B, 7.000%, 12/19/19(b)(c) | 9,558,503 | 9,048,748 | ||||||
inVentiv Health, Inc., Term Loan B4, 7.750%, 05/15/18(b)(c) | 11,200,000 | 11,172,000 | ||||||
Kindred Healthcare, Inc., New Term Loan, 4.250%, 04/09/21(b)(c) | 6,859,606 | 6,653,818 | ||||||
See Notes to Financial Statements.
50
Table of Contents
SCHEDULES OF PORTFOLIO INVESTMENTS
RIDGEWORTH FUNDS March 31, 2016
Seix Floating Rate High Income Fund — continued
| Shares or Principal Amount($) | Value($) | |||||||
Healthcare—continued | ||||||||
Kinetic Concepts, Inc., USD Term Loan E1, 4.500%, 05/04/18(b)(c) | 4,798,636 | 4,770,132 | ||||||
Lannett Co., Inc., Term Loan A, 11/25/20(b)(e)(f) | 4,270,938 | 3,971,972 | ||||||
MI Opco Holdings, Inc., Term Loan, 5.750%, 10/27/22(b)(c) | 8,497,125 | 8,475,882 | ||||||
MPH Acquisition Holdings LLC, Term Loan, 3.750%, 03/31/21(b)(c) | 24,146,079 | 23,892,545 | ||||||
RCHP, Inc., 1st Lien Term Loan, 6.000%, 04/23/19(b)(c) | 17,521,525 | 17,382,754 | ||||||
RCHP, Inc., 2nd Lien Term Loan, 11.250%, 10/23/19(b)(c) | 1,790,000 | 1,798,950 | ||||||
RPI Finance Trust, Term Loan B4, 3.500%, 11/09/20(b)(c) | 31,625,012 | 31,688,262 | ||||||
Surgical Care Affiliates, Inc., Term Loan B, 4.250%, 03/17/22(b)(c) | 985,025 | 980,918 | ||||||
U.S. Renal Care, Inc., 2015 Term Loan B, 5.250%, 12/31/22(b)(c) | 2,892,750 | 2,879,501 | ||||||
Valeant Pharmaceuticals International, Inc., Series A3 Tranche A, 10/20/18(b)(e)(f) | 2,590,000 | 2,470,212 | ||||||
|
| |||||||
| 290,134,962 | ||||||||
|
| |||||||
Housing 1.5% | ||||||||
ABC Supply Co., Inc., Term Loan, 3.500%, 04/16/20(b)(c) | 5,533,032 | 5,524,733 | ||||||
Beazer Homes USA, Inc., Term Loan, 6.406%, 03/11/18(b)(c) | 4,545,000 | 4,499,550 | ||||||
Continental Building Products LLC, 1st Lien Term Loan, 4.000%, 08/28/20(b)(c) | 7,959,389 | 7,772,820 | ||||||
DTZ U.S. Borrower LLC, 2nd Lien Term Loan, 11/04/22(b)(e)(f) | 2,530,000 | 2,479,400 | ||||||
DTZ U.S. Borrower LLC, 2015 1st Lien Term Loan, 4.250%, 11/04/21(b)(c) | 31,983,213 | 31,663,381 | ||||||
IMC OP, LP, 2nd Lien Term Loan, 08/15/21(b)(e)(f) | 500,000 | 455,000 | ||||||
Quikrete Holdings, Inc., 1st Lien Term Loan, 4.000%, 09/28/20(b)(c) | 4,715,492 | 4,703,703 | ||||||
Realogy Corp., New Term Loan B, 3.750%, 03/05/20(b)(c) | 9,484,023 | 9,468,185 | ||||||
|
| |||||||
| 66,566,772 | ||||||||
|
| |||||||
| Shares or Principal Amount($) | Value($) | |||||||
Information Technology 8.0% |
| |||||||
Active Network, Inc. (The), 1st Lien Term Loan, 5.500%, 11/13/20(c)(d) | 6,086,005 | 5,766,490 | ||||||
Aricent Technologies, 1st Lien Term Loan, 5.500%, 04/14/21(b)(c) | 3,082,998 | 2,705,331 | ||||||
Arris Group, Inc., 2015 Term Loan A, 06/18/20(b)(e)(f) | 3,430,449 | 3,400,432 | ||||||
Arris Group, Inc., 2015 Term Loan B, 3.250%, 04/17/20(b)(c) | 11,595,008 | 11,302,234 | ||||||
Avago Technologies Cayman Ltd., 2016 USD Term Loan B1, 4.250%, 02/01/23(b)(c) | 97,450,000 | 96,907,203 | ||||||
Avaya, Inc., Term Loan B7, 6.250%, 05/29/20(b)(c) | 58,985,032 | 39,246,281 | ||||||
Avaya, Inc., Term Loan B6, 6.500%, 03/30/18(b)(c) | 9,557,913 | 7,001,171 | ||||||
Blackboard, Inc., Term Loan B3, 4.750%, 10/04/18(b)(c) | 10,198,129 | 9,428,987 | ||||||
CompuCom Systems, Inc., Refinance Term Loan B, 4.250%, 05/11/20(b)(c) | 6,566,522 | 4,596,565 | ||||||
Dell International LLC, USD Term Loan B2, 4.000%, 04/29/20(b)(c) | 22,948,464 | 22,923,909 | ||||||
Imagine! Print Solutions, Inc., Term Loan B, 03/16/22(b)(e)(f) | 2,530,000 | 2,530,000 | ||||||
Infor(US), Inc., USD Term Loan B5, 3.750%, 06/03/20(b)(c) | 6,928,864 | 6,709,080 | ||||||
Infor(US), Inc., USD Term Loan B3, 3.750%, 06/03/20(b)(c) | 7,512,095 | 7,274,187 | ||||||
Internap Corp., Term Loan, 6.000%, 11/26/19(b)(c) | 9,167,256 | 8,067,185 | ||||||
iParadigms Holdings LLC, 1st Lien Term Loan, 5.000%, 07/31/21(b)(c) | 3,196,325 | 3,004,546 | ||||||
IPC Corp., 2015 Term Loan B, 5.500%, 08/06/21(b)(c) | 5,222,250 | 4,839,302 | ||||||
NXP B.V., 2015 Term Loan B, 3.750%, 12/07/20(b)(c) | 8,683,238 | 8,696,783 | ||||||
ON Semiconductor Corp., Term Loan B, 03/31/23(b)(e)(f) | 4,435,000 | 4,436,375 | ||||||
See Notes to Financial Statements.
51
Table of Contents
SCHEDULES OF PORTFOLIO INVESTMENTS
RIDGEWORTH FUNDS March 31, 2016
Seix Floating Rate High Income Fund — continued
| Shares or Principal Amount($) | Value($) | |||||||
Information Technology—continued |
| |||||||
Presidio, Inc., Refinance Term Loan, 5.250%, 02/02/22(b)(c) | 10,791,403 | 10,575,575 | ||||||
Riverbed Technology, Inc., Term Loan B, 6.000%, 04/24/22(b)(c) | 8,199,862 | 8,215,933 | ||||||
Semiconductor Components Industries LLC, Term Loan A, | 30,737,198 | 29,968,768 | ||||||
Sirius Computer Solutions, Inc., 1st Lien Term Loan, 6.000%, 10/30/22(b)(c) | 4,612,584 | 4,566,458 | ||||||
Solera Holdings, Inc., USD Term Loan B, 5.750%, 03/03/23(b)(c) | 2,000,000 | 1,996,080 | ||||||
Southern Graphics, Inc., New Term Loan B, | 6,734,000 | 6,658,243 | ||||||
SS&C Technologies, Inc., 2015 Term Loan B1, | 3,704,933 | 3,710,157 | ||||||
SS&C Technologies, Inc., 2015 Term Loan B2, | 537,052 | 537,809 | ||||||
TTM Technologies, Inc., 1st Lien Term Loan, 6.000%, 05/31/21(b)(c) | 10,471,685 | 9,921,921 | ||||||
Vertafore, Inc., 1st Lien Term Loan, 4.250%, 10/03/19(b)(c) | 4,840,598 | 4,830,530 | ||||||
Western Digital Corp., USD Term Loan B, 03/16/23(b)(e)(f) | 12,650,000 | 12,487,954 | ||||||
Zebra Technologies Corp., Term Loan B, 4.750%, 10/27/21(b)(c) | 7,105,506 | 7,143,094 | ||||||
|
| |||||||
| 349,448,583 | ||||||||
|
| |||||||
Manufacturing 0.6% | ||||||||
Dynacast International LLC, Term Loan B, 4.500%, 01/28/22(b)(c) | 6,900,300 | 6,839,922 | ||||||
LTI Holdings, Inc., 2nd Lien Term Loan, 10.250%, 04/16/23(b)(c) | 2,325,000 | 1,953,000 | ||||||
Mirror Bidco Corp., New Term Loan, 4.250%, 12/28/19(b)(c) | 11,586,867 | 11,466,132 | ||||||
Otter Products LLC, 2014 Term Loan, 5.750%, 06/03/20(b)(c) | 6,971,493 | 5,995,484 | ||||||
|
| |||||||
| 26,254,538 | ||||||||
|
| |||||||
| Shares or Principal Amount($) | Value($) | |||||||
Metals/Minerals 3.0% | ||||||||
Atkore International, Inc., 1st Lien Term Loan, 4.500%, 04/09/21(b)(c) | 11,647,463 | 11,327,158 | ||||||
Atkore International, Inc., 2nd Lien Term Loan, 7.750%, 10/09/21(b)(c) | 3,715,000 | 3,380,650 | ||||||
Atlas Iron Ltd., Term Loan B, 8.750%, 12/10/17(c)(d) | 8,473,792 | 932,117 | ||||||
FMG Resources (August 2006) Pty Ltd., New Term Loan B, 4.250%, 06/30/19(b)(c) | 114,878,108 | 96,880,155 | ||||||
Novelis, Inc., 2015 Term Loan B, 4.000%, 06/02/22(b)(c) | 18,436,471 | 17,929,468 | ||||||
|
| |||||||
| 130,449,548 | ||||||||
|
| |||||||
Retail 8.1% | ||||||||
BJ’s Wholesale Club, Inc., New 2nd Lien Term Loan, | 11,199,201 | 10,285,795 | ||||||
Capital Automotive LP, New Term Loan B, 4.000%, 04/10/19(b)(c)(g) | 29,678,498 | 29,678,498 | ||||||
Capital Automotive LP, New 2nd Lien Term Loan, 6.000%, 04/30/20(b)(c) | 19,425,000 | 19,352,156 | ||||||
CWGS Group LLC, Term Loan, 5.750%, 02/20/20(b)(c) | 14,950,067 | 14,613,691 | ||||||
Dollar Tree, Inc., Term Loan B1, 3.500%, 07/06/22(b)(c) | 24,621,510 | 24,695,375 | ||||||
Dollar Tree, Inc., Term Loan B2, 4.250%, 07/06/22(b)(c) | 25,055,000 | 25,013,158 | ||||||
Hudson’s Bay Co., 2015 Term Loan B, 4.750%, 09/30/22(b)(c) | 15,919,355 | 15,859,657 | ||||||
J. Crew Group, Inc., New Term Loan B, 4.000%, 03/05/21(b)(c) | 24,900,987 | 19,325,407 | ||||||
J.C. Penney Corp., Inc., 1st Lien Term Loan, 6.000%, 05/22/18(b)(c) | 52,042,239 | 52,094,281 | ||||||
Kate Spade & Co., Term Loan B, 4.000%, 04/10/21(b)(c) | 6,540,400 | 6,442,294 | ||||||
Men’s Wearhouse, Inc. (The), Term Loan B, 4.500%, 06/18/21(b)(c) | 3,042,256 | 2,922,482 | ||||||
See Notes to Financial Statements.
52
Table of Contents
SCHEDULES OF PORTFOLIO INVESTMENTS
RIDGEWORTH FUNDS March 31, 2016
Seix Floating Rate High Income Fund — continued
| Shares or Principal Amount($) | Value($) | |||||||
Retail—continued | ||||||||
Men’s Wearhouse, Inc. (The), 2015 Term Loan, 5.000%, 06/18/21(b)(c) | 425,000 | 401,625 | ||||||
Michaels Stores, Inc., Term Loan B, 3.750%, 01/28/20(b)(c) | 9,382,755 | 9,354,888 | ||||||
Neiman Marcus Group, Inc. (The), 2020 Term Loan, 4.250%, 10/25/20(b)(c) | 13,378,866 | 12,231,628 | ||||||
PetSmart, Inc., Term Loan B, 4.250%, 03/11/22(b)(c) | 13,454,492 | 13,390,583 | ||||||
Sears Holding Corp., Incremental Term Loan, 07/20/20(b)(e)(f) | 7,290,000 | 7,180,650 | ||||||
Sears Roebuck Acceptance Corp., 2015 Term Loan, 5.500%, 06/30/18(b)(c) | 35,365,136 | 33,596,880 | ||||||
Toys ‘R’ Us Property Co. I LLC, New Term Loan B, 6.000%, 08/21/19(b)(c) | 31,375,126 | 27,531,673 | ||||||
Toys ‘R’ Us-Delaware, Inc., Term Loan B3, 5.250%, 05/25/18(b)(c) | 1,132,738 | 953,391 | ||||||
Toys ‘R’ Us-Delaware, Inc., FILO Term Loan, 8.250%, 10/24/19(b)(c) | 3,404,464 | 3,298,075 | ||||||
Toys ‘R’ Us-Delaware, Inc., FILO CAD Term Loan, 8.250%, 10/24/19(b)(c) | 2,745,536 | 2,659,738 | ||||||
Toys ‘R’ Us-Delaware, Inc., Term Loan B4, 9.750%, 04/24/20(b)(c) | 25,219,338 | 20,259,451 | ||||||
|
| |||||||
| 351,141,376 | ||||||||
|
| |||||||
Service 9.1% | ||||||||
4L Holdings LLC, 1st Lien Term Loan, | 1,552,930 | 1,389,872 | ||||||
ADS Waste Holdings, Inc., Term Loan B2, 3.750%, 10/09/19(b)(c) | 10,790,895 | 10,691,942 | ||||||
Asurion LLC, New Term Loan B2, 4.250%, 07/08/20(b)(c) | 37,885,900 | 36,465,179 | ||||||
Asurion LLC, New Term Loan B1, 5.000%, 05/24/19(b)(c)(g) | 21,411,072 | 21,089,906 | ||||||
Asurion LLC, Term Loan B4, 5.000%, 08/04/22(b)(c) | 45,334,625 | 44,343,157 | ||||||
| Shares or Principal Amount($) | Value($) | |||||||
Service—continued | ||||||||
Asurion LLC, New 2nd Lien Term Loan, 8.500%, 03/03/21(b)(c) | 44,086,489 | 41,184,276 | ||||||
Evertec Group LLC, New Term Loan A, 2.682%, 04/17/18(b)(c) | 16,422,000 | 15,436,680 | ||||||
First Data Corp., Extended 2021 Term Loan, 03/24/21(b)(e)(f) | 7,175,000 | 7,151,466 | ||||||
First Data Corp., New 2018 Extended Term Loan, 3.932%, 03/24/18(b)(c) | 65,641,994 | 65,461,479 | ||||||
First Data Corp., New 2018 Term Loan, 3.932%, 09/24/18(b)(c) | 33,273,139 | 33,203,931 | ||||||
First Data Corp., 2022 Term Loan, 4.182%, 07/08/22(b)(c) | 19,347,407 | 19,211,975 | ||||||
IQOR US, Inc., Term Loan B, 6.000%, 04/01/21(b)(c) | 28,869,412 | 23,312,050 | ||||||
RedTop Luxembourg S.A.R.L., USD 2nd Lien Term Loan, | 5,252,800 | 4,924,500 | ||||||
Sedgwick Claims Management Services, Inc., 1st Lien Term Loan, 3.750%, 03/01/21(b)(c) | 24,696,517 | 23,996,865 | ||||||
Sedgwick Claims Management Services, Inc., 2nd Lien Term Loan, 6.750%, 02/28/22(b)(c) | 9,490,000 | 8,790,112 | ||||||
Spin Holdco, Inc., New Term Loan B, 4.250%, 11/14/19(b)(c) | 8,292,704 | 8,066,728 | ||||||
STG-Fairway Acquisitions, Inc., 2015 1st Lien Term Loan, 6.250%, 06/30/22(b)(c) | 3,294,254 | 3,195,427 | ||||||
TransUnion LLC, Term Loan B2, 3.500%, 04/09/21(b)(c)(e) | 9,133,333 | 9,037,433 | ||||||
Travelport Finance(Luxembourg) S.A.R.L., 2014 Term Loan B, 5.750%, 09/02/21(b)(c) | 19,161,929 | 19,128,395 | ||||||
Weight Watchers International, Inc., Term Loan B2, 04/02/20(b)(e)(f) | 1,994,859 | 1,466,221 | ||||||
|
| |||||||
| 397,547,594 | ||||||||
|
| |||||||
Telecommunications 7.2% | ||||||||
Altice Financing SA, USD Term Loan, 5.250%, 02/04/22(b)(c) | 4,396,775 | 4,400,424 | ||||||
See Notes to Financial Statements.
53
Table of Contents
SCHEDULES OF PORTFOLIO INVESTMENTS
RIDGEWORTH FUNDS March 31, 2016
Seix Floating Rate High Income Fund — continued
| Shares or Principal Amount($) | Value($) | |||||||
Telecommunications—continued |
| |||||||
Altice Financing SA, Delayed Draw Term Loan, 5.500%, 07/02/19(b)(c) | 73,170,082 | 73,279,837 | ||||||
Altice US Finance I Corp., USD Extended Term Loan, 4.250%, 12/14/22(b)(c) | 23,629,395 | 23,492,817 | ||||||
Frontier Communications Corp., Unsecured Term Loan, 2.815%, 10/14/16(b)(c) | 532,586 | 521,934 | ||||||
Integra Telecom, Inc., 2015 1st Lien Term Loan, 5.250%, 08/14/20(b)(c) | 7,829,248 | 7,363,408 | ||||||
Level 3 Financing, Inc., 2015 Term Loan B2, 3.500%, 05/31/22(b)(c) | 1,000,000 | 997,290 | ||||||
Level 3 Financing, Inc., 2013 Term Loan B, 4.000%, 01/15/20(b)(c)(g) | 86,095,000 | 86,283,548 | ||||||
LTS Buyer LLC, 1st Lien Term Loan, 4.000%, 04/13/20(b)(c) | 10,370,770 | 10,241,135 | ||||||
New Lightsquared LLC, 2015 2nd Lien Term Loan, 13.500%, 12/07/20(b)(c) | 13,054,146 | 9,072,631 | ||||||
Numericable Group SA, USD Term Loan B5, 4.563%, 07/31/22(b)(c) | 6,114,675 | 6,034,451 | ||||||
Numericable U.S. LLC, USD Term Loan B2, 4.500%, 05/21/20(b)(c) | 26,415,031 | 26,193,937 | ||||||
Numericable U.S. LLC, USD Term Loan B1, 4.500%, 05/21/20(b)(c) | 30,532,797 | 30,277,238 | ||||||
Sable International Finance Ltd., Term Loan B1, 11/23/22(b)(e)(f) | 3,718,000 | 3,703,388 | ||||||
Sable International Finance Ltd., Term Loan B2, 11/23/22(b)(e)(f) | 3,042,000 | 3,030,045 | ||||||
Zayo Group LLC, PIK, Term Loan B, 3.750%, 05/06/21(b)(c)(g) | 29,505,470 | 29,333,453 | ||||||
|
| |||||||
| 314,225,536 | ||||||||
|
| |||||||
Transportation 1.6% | ||||||||
Commercial Barge Line Co., 2015 1st Lien Term Loan, | 8,730,000 | 7,769,700 | ||||||
CS Intermediate Holdco 2 LLC, New Term Loan B, 4.000%, 04/04/21(b)(c) | 6,961,013 | 6,895,788 | ||||||
| Shares or Principal Amount($) | Value($) | |||||||
Transportation—continued | ||||||||
FCA US LLC, 2018 Term Loan B, 3.250%, 12/31/18(b)(c) | 6,217,481 | 6,205,855 | ||||||
FCA US LLC, New Term Loan B, 3.500%, 05/24/17(b)(c) | 3,171,222 | 3,169,034 | ||||||
Gruden Acquisition, Inc., 1st Lien Term Loan, | 4,374,038 | 3,780,831 | ||||||
KAR Auction Services, Inc., Term Loan B3, | 1,575,000 | 1,578,276 | ||||||
MPG Holdco I Inc., 2015 Term Loan B, 3.750%, 10/20/21(b)(c) | 6,467,062 | 6,371,414 | ||||||
Navios Maritime Midstream Partners L.P., Term Loan B, | 2,689,675 | 2,363,552 | ||||||
Navios Partners Finance (US), Inc., Term Loan B, 5.250%, 06/27/18(c)(d) | 15,811,197 | 13,755,741 | ||||||
Tower Automotive Holdings USA LLC, New Term Loan, | 8,589,071 | 8,513,916 | ||||||
Visteon Corp., Delayed Draw Term Loan B, | 2,746,667 | 2,737,520 | ||||||
Wabash National Corp., 2015 Term Loan B, | 7,749,231 | 7,716,917 | ||||||
|
| |||||||
| 70,858,544 | ||||||||
|
| |||||||
Utility 4.0% |
| |||||||
Bronco Midstream Funding LLC, Term Loan B, 5.000%, 08/15/20(c)(d) | 18,090,830 | 10,854,498 | ||||||
Calpine Construction Finance Co., L.P., Original Term Loan B1, 3.000%, 05/03/20(b)(c) | 22,348,050 | 21,845,219 | ||||||
Calpine Corp., Term Loan B3, 4.000%, 10/09/19(b)(c) | 32,524,755 | 32,362,132 | ||||||
Calpine Corp., Delayed Draw Term Loan, 4.000%, 10/31/20(b)(c) | 8,981,528 | 8,897,371 | ||||||
Empire Generating Co. LLC, Term Loan B, 5.250%, 03/14/21(b)(c) | 15,152,246 | 12,576,364 | ||||||
Empire Generating Co. LLC, Term Loan C, 5.250%, 03/14/21(b)(c) | 1,111,304 | 922,383 | ||||||
See Notes to Financial Statements.
54
Table of Contents
SCHEDULES OF PORTFOLIO INVESTMENTS
RIDGEWORTH FUNDS March 31, 2016
Seix Floating Rate High Income Fund — continued
| Shares or Principal Amount($) | Value($) | |||||||
Utility—continued |
| |||||||
Green Energy Partners/Stonewall LLC, Delayed Draw Term Loan B2, 6.500%, 11/10/21(b)(c) | 1,000,000 | 920,000 | ||||||
Green Energy Partners/Stonewall LLC, Term Loan B1, 6.500%, 11/13/21(b)(c) | 4,475,000 | 4,161,750 | ||||||
La Frontera Generation LLC, Term Loan, 4.500%, 09/30/20(b)(c) | 19,362,956 | 18,757,864 | ||||||
Lonestar Generation LLC, Term Loan B, 5.250%, 02/22/21(c)(d) | 6,812,769 | 4,326,108 | ||||||
Longview Power LLC, Term Loan B, 7.000%, 04/13/21(b)(c) | 4,549,640 | 4,015,057 | ||||||
NRG Energy, Inc., Refinance Term Loan B, 2.750%, 07/02/18(b)(c) | 5,447,064 | 5,385,784 | ||||||
Panda Temple II Power LLC, New Term Loan B, 7.250%, 04/03/19(b)(c) | 4,673,288 | 3,902,195 | ||||||
Power Team Services LLC, 1st Lien Term Loan, 4.250%, 05/06/20(b)(c) | 15,136,896 | 14,834,158 | ||||||
Power Team Services LLC, 2nd Lien Term Loan, 8.250%, 11/06/20(b)(c) | 7,890,000 | 7,298,250 | ||||||
Texas Competitive Electric Holdings Co. LLC, Non-Extended Term Loan, 10/10/16(b)(e)(f)(h) | 10,000,000 | 2,783,300 | ||||||
Texas Competitive Electric Holdings Co. LLC, Extended Term Loan, | 5,000,000 | 1,425,000 | ||||||
TPF Generation Holdings LLC, Term Loan B, 4.750%, 12/31/17(b)(c) | 22,295,457 | 21,069,207 | ||||||
|
| |||||||
| 176,336,640 | ||||||||
|
| |||||||
Wireless Communications 0.6% |
| |||||||
NTELOS, Inc., New Term Loan B, 5.750%, 11/09/19(b)(c) | 21,161,855 | 21,003,142 | ||||||
Syniverse Holdings, Inc., Term Loan B, 4.000%, 04/23/19(b)(c) | 6,682,042 | 4,933,552 | ||||||
| Shares or Principal Amount($) | Value($) | |||||||
Wireless Communications—continued |
| |||||||
Syniverse Holdings, Inc., Term Loan, 4.000%, 04/23/19(b)(c) | 1,113,013 | 821,548 | ||||||
|
| |||||||
| 26,758,242 | ||||||||
|
| |||||||
Total Bank Loans |
| 4,094,295,501 | ||||||
|
| |||||||
| Corporate Bonds 2.0% | ||||||||
Auto Manufacturers 0.0%(a) |
| |||||||
General Motors Co. Escrow, 7.200% (d)(h)(i)(j) | 10,000,000 | — | ||||||
General Motors Co. Escrow, 8.375% (d)(h)(i)(j) | 10,000,000 | — | ||||||
|
| |||||||
| — | ||||||||
|
| |||||||
Coal 0.0%(a) |
| |||||||
CONSOL Energy, Inc., 8.000%, 04/01/23 | 1,000,000 | 747,200 | ||||||
|
| |||||||
Commercial Services 0.2% |
| |||||||
Harland Clarke Holdings Corp., 9.250%, 03/01/21(b) | 5,330,000 | 4,084,112 | ||||||
Harland Clarke Holdings Corp., 9.750%, 08/01/18(b) | 3,715,000 | 3,659,275 | ||||||
|
| |||||||
| 7,743,387 | ||||||||
|
| |||||||
Media 0.7% |
| |||||||
Altice US Finance SA, 7.750%, 07/15/25(b) | 9,210,000 | 9,002,775 | ||||||
Cequel Communications Holdings I LLC/Cequel Capital Corp., 7.750%, 07/15/25(b) | 4,000,000 | 3,940,000 | ||||||
WideOpenWest Finance LLC/WideOpenWest Capital Corp., 10.250%, 07/15/19 | 10,000,000 | 10,000,000 | ||||||
WideOpenWest Finance LLC/WideOpenWest Capital Corp., 13.375%, 10/15/19 | 9,170,000 | 8,986,600 | ||||||
|
| |||||||
| 31,929,375 | ||||||||
|
| |||||||
Oil & Gas 0.6% | ||||||||
Carrizo Oil & Gas, Inc., 6.250%, 04/15/23 | 1,000,000 | 881,250 | ||||||
Linn Energy LLC/Linn Energy Finance Corp., 8.625%, 04/15/20 | 7,800,000 | 897,000 | ||||||
Glenn Pool Oil & Gas Trust, 6.000%, 08/02/21(d)(i) | 31,815,372 | 24,497,837 | ||||||
See Notes to Financial Statements.
55
Table of Contents
SCHEDULES OF PORTFOLIO INVESTMENTS
RIDGEWORTH FUNDS March 31, 2016
Seix Floating Rate High Income Fund — concluded
| Shares or Principal Amount($) | Value($) | |||||||
Oil & Gas—continued | ||||||||
SandRidge Energy, Inc., 8.750%, 06/01/20(b) | 745,000 | 180,663 | ||||||
Southwestern Energy Co., 7.500%, 02/01/18 | 1,000,000 | 837,500 | ||||||
|
| |||||||
| 27,294,250 | ||||||||
|
| |||||||
Telecommunication Services 0.5% |
| |||||||
Intelsat Luxembourg SA, 7.750%, 06/01/21 | 1,175,000 | 349,563 | ||||||
Trilogy International Partners LLC/Trilogy International Finance, Inc., 10.250%, 08/15/16(d) | 15,033,000 | 13,266,622 | ||||||
Wind Acquisition Finance SA, 7.375%, 04/23/21(b) | 9,000,000 | 8,145,000 | ||||||
|
| |||||||
| 21,761,185 | ||||||||
|
| |||||||
Total Corporate Bonds | 89,475,397 | |||||||
|
| |||||||
| Preferred Stock 0.1% | ||||||||
Banks 0.1% | ||||||||
GMAC Capital Trust I, Series 2, | 94,025 | 2,304,553 | ||||||
|
| |||||||
Total Preferred Stock | 2,304,553 | |||||||
|
| |||||||
| Common Stocks 0.1% | ||||||||
Oil & Gas 0.1% | ||||||||
Vantage Drilling International (Stapled Unit)* | 35,085 | 3,859,350 | ||||||
|
| |||||||
Telecommunication Services 0.0%(a) |
| |||||||
NII Holding, Inc.* | 303,451 | 1,678,084 | ||||||
|
| |||||||
Total Common Stocks | 5,537,434 | |||||||
|
| |||||||
| Shares or Principal Amount($) | Value($) | |||||||
Money Market Fund 4.1% | ||||||||
State Street Institutional U.S. Government Money Market Fund, Institutional Class, 0.24%(k) | 178,369,305 | 178,369,305 | ||||||
|
| |||||||
Total Money Market Fund | 178,369,305 | |||||||
|
| |||||||
Total Investments |
| 4,371,040,660 | ||||||
Liabilities in Excess of Other | (4,299,775 | ) | ||||||
|
| |||||||
Net Assets — 100.0% | $ | 4,366,740,885 | ||||||
|
| |||||||
| * | Non-income producing security. |
| (a) | Less than 0.05% of Net Assets. |
| (b) | Rule 144A, Section 4(2) or other security which is restricted as to resale to institutional investors. The Fund’s investment adviser/subadviser has deemed this security to be liquid based upon procedures approved by the Board of Trustees. These securities represent 92.2% of net assets as of March 31, 2016. |
| (c) | Variable or floating rate security. Rate disclosed is as of March 31, 2016. |
| (d) | The Fund’s investment adviser/subadviser has deemed this security to be illiquid based upon procedures approved by the Board of Trustees. These securities represent 3.2% of net assets as of March 31, 2016. |
| (e) | All or a portion of this security has been purchased on a when-issued or delayed-delivery basis. |
| (f) | The security does not have a stated settlement date and will receive a rate upon settling with the custodian. |
| (g) | All or a portion of this security has been segregated, or otherwise earmarked, in connection with obligations for when-issued or delayed-delivery purchase commitments. |
| (h) | Security is in default. |
| (i) | Valued at fair value using procedures approved by the Board of Trustees (See Note 2(a)). Fair valued securities held by the Fund represent 0.6% of net assets as of March 31, 2016. |
| (j) | Perpetual maturity. |
| (k) | Rate disclosed, the 7 day yield, is as of March 31, 2016. |
Investment Abbreviations
DIP | — | Debtor-in-Possession | ||
| PIK | — | Payment in-kind |
See Notes to Financial Statements.
56
Table of Contents
SCHEDULES OF PORTFOLIO INVESTMENTS
RIDGEWORTH FUNDS March 31, 2016
Seix Georgia Tax-Exempt Bond Fund
Shares or Principal Amount($) | Value($) | |||||||
| Municipal Bonds 97.9% | ||||||||
Alabama 0.6% | ||||||||
Birmingham, Series A, GO, 0.000%, 03/01/32(a) | 640,000 | 694,944 | ||||||
|
| |||||||
Georgia 92.0% | ||||||||
Athens-Clarke County Unified Government Development Authority, RB, 5.250%, 07/01/27 | 2,885,000 | 3,368,035 | ||||||
Athens-Clarke County Unified Government Development Authority, RB, 5.250%, 07/01/29 | 1,690,000 | 1,946,914 | ||||||
Athens-Clarke County Unified Government Development Authority, Catholic Health East, RB, 6.250%, 11/15/32 | 1,410,000 | 1,607,485 | ||||||
Athens-Clarke County Unified Government Water & Sewerage, RB, 5.000%, 01/01/17 | 1,185,000 | 1,224,223 | ||||||
Athens-Clarke County Unified Government Water & Sewerage, RB, | 4,000,000 | 4,500,960 | ||||||
Athens-Clarke County Unified Government Water & Sewerage, RB, | 3,000,000 | 3,385,890 | ||||||
Athens-Clarke County Unified Government Water & Sewerage Revenue, RB, | 1,250,000 | 1,564,787 | ||||||
Atlanta Airport Passenger Facility Charge, Series B, RB, 5.000%, 01/01/21 | 2,000,000 | 2,298,480 | ||||||
Atlanta Airport Project, Series B, RB, 5.000%, 01/01/23 | 2,500,000 | 2,863,800 | ||||||
Atlanta Airport Project, Series B, RB, 5.000%, 01/01/42 | 2,235,000 | 2,504,452 | ||||||
Atlanta Development Authority, RB, ETM, 5.000%, 09/01/19 | 1,025,000 | 1,163,846 | ||||||
Atlanta Development Authority, Series A, RB, 5.000%, 07/01/34 | 1,000,000 | 1,181,720 | ||||||
Atlanta Development Authority, Series A, RB, 5.250%, 07/01/40 | 2,500,000 | 2,973,550 | ||||||
Shares or Principal Amount($) | Value($) | |||||||
Georgia—continued | ||||||||
Atlanta GA Water & Wastewater Revenue, RB, 5.000%, 11/01/35 | 2,000,000 | 2,370,080 | ||||||
Atlanta GA Water & Wastewater Revenue, RB, 5.000%, 11/01/40 | 4,000,000 | 4,680,400 | ||||||
Bartow County School District, GO, 5.000%, 10/01/19 | 2,000,000 | 2,271,140 | ||||||
Carroll City-County Hospital Authority, Tanner Medical Center, Inc., RB, 5.000%, 07/01/41, Country Guaranteed | 3,000,000 | 3,463,050 | ||||||
Clarke County Hospital Authority, Athens Regional Medical Center, RB, 5.000%, 01/01/32, Country Guaranteed | 1,180,000 | 1,344,504 | ||||||
DeKalb County, Water & Sewerage Revenue, Series A, RB, 5.000%, 10/01/22 | 1,000,000 | 1,203,590 | ||||||
DeKalb County, Water & Sewerage Revenue, Series A, RB, 5.250%, 10/01/23 | 1,500,000 | 1,815,285 | ||||||
DeKalb County, Water & Sewerage Revenue, Series A, RB, 5.250%, 10/01/36 | 2,000,000 | 2,354,620 | ||||||
DeKalb Private Hospital Authority, Children’s Healthcare of Atlanta, Inc., RB, 5.000%, 11/15/29 | 4,300,000 | 4,832,641 | ||||||
Forsyth County, Series A, GO, 5.000%, 03/01/25, | 5,000,000 | 5,590,850 | ||||||
Fulton County Development Authority, Series A, RB, 5.000%, 03/15/36 | 2,000,000 | 2,330,800 | ||||||
Fulton County Development Authority, Series A, RB, 5.000%, 05/01/39 | 5,145,000 | 5,938,513 | ||||||
Fulton County Development Authority, Robert Woodruff Arts Center, Inc., Series B, RB, 5.250%, 03/15/24 | 1,300,000 | 1,439,295 | ||||||
Fulton County Water & Sewerage Revenue, RB, 5.000%, 01/01/18 | 1,600,000 | 1,717,104 | ||||||
Georgia State, Series A, GO, 5.000%, 01/01/19 | 2,360,000 | 2,627,671 | ||||||
Georgia State, Series A, GO, 5.000%, 02/01/28 | 1,000,000 | 1,254,190 | ||||||
See Notes to Financial Statements.
57
Table of Contents
SCHEDULES OF PORTFOLIO INVESTMENTS
RIDGEWORTH FUNDS March 31, 2016
Seix Georgia Tax-Exempt Bond Fund — concluded
Shares or Principal Amount($) | Value($) | |||||||
Georgia—continued | ||||||||
Georgia State, Series E, GO, 5.000%, 08/01/22, | 1,450,000 | 1,533,114 | ||||||
Greene County Development Authority, RB, 5.000%, 11/15/37 | 2,955,000 | 3,351,118 | ||||||
Gwinnett County School District, GO, 5.000%, 02/01/20, | 1,635,000 | 1,759,391 | ||||||
Henry County Water & Sewerage Authority, RB, 6.150%, 02/01/20, AMBAC | 2,100,000 | 2,463,888 | ||||||
Municipal Electric Authority of Georgia, Series A, RB, 5.000%, 01/01/21 | 2,000,000 | 2,340,760 | ||||||
Municipal Electric Authority of Georgia, Series D, RB, | 1,290,000 | 1,433,629 | ||||||
Private Colleges & Universities Authority, Emory University, Series C, RB, 5.250%, 09/01/39 | 2,000,000 | 2,240,320 | ||||||
Private Colleges & Universities Authority, Savannah College Of Art & Design, RB, 5.000%, 04/01/30 | 1,000,000 | 1,157,100 | ||||||
Private Colleges & Universities Authority, Savannah College Of Art & Design, RB, 5.000%, 04/01/44 | 3,500,000 | 3,873,870 | ||||||
Sandy Springs Public Facilities Authority, RB, 5.000%, 05/01/41 | 3,000,000 | 3,587,910 | ||||||
Thomasville Hospital Authority, John D. Archhold Memorial Hospital, RB, 5.375%, 11/01/40 | 2,510,000 | 2,860,296 | ||||||
|
| |||||||
| 102,419,271 | ||||||||
|
| |||||||
Guam 1.4% | ||||||||
Guam Waterworks Authority, RB, 5.000%, 01/01/46 | 1,065,000 | 1,208,424 | ||||||
Territory of Guam, Series D, RB, 5.000%, 11/15/39 | 350,000 | 395,615 | ||||||
|
| |||||||
| 1,604,039 | ||||||||
|
| |||||||
Shares or Principal Amount($) | Value($) | |||||||
North Carolina 1.7% | ||||||||
North Carolina Capital Facilities Finance Agency, Educational Facilities, RB, 5.000%, 05/01/32 | 1,700,000 | 1,867,569 | ||||||
|
| |||||||
South Carolina 2.2% | ||||||||
South Carolina State Public Service Authority, Series A, RB, 5.750%, 12/01/43 | 2,000,000 | 2,439,940 | ||||||
|
| |||||||
Total Municipal Bonds |
| 109,025,763 | ||||||
|
| |||||||
Money Market Fund 1.2% | ||||||||
Federated Tax-Free Obligations Fund, Institutional Shares, 0.14%(b) | 1,297,273 | 1,297,273 | ||||||
|
| |||||||
Total Money Market Fund |
| 1,297,273 | ||||||
|
| |||||||
Total Investments (Cost $103,135,940) — 99.1% |
| 110,323,036 | ||||||
Other Assets in Excess of Liabilities — 0.9% |
| 988,846 | ||||||
|
| |||||||
Net Assets — 100.0% | $ | 111,311,882 | ||||||
|
| |||||||
| (a) | Step bond. The rate shown is the rate in effect as of March 31, 2016. |
| (b) | Rate disclosed, the 7 day yield, is as of March 31, 2016. |
Investment Abbreviations
| AMBAC | — | Security guaranteed by American Municipal Bond Assurance Corporation | ||||
| ETM | — | Escrowed to Maturity | ||||
| GO | — | General Obligation | ||||
| RB | — | Revenue Bond |
See Notes to Financial Statements.
58
Table of Contents
SCHEDULES OF PORTFOLIO INVESTMENTS
RIDGEWORTH FUNDS March 31, 2016
Seix High Grade Municipal Bond Fund
| Shares or Principal Amount($) | Value($) | |||||||
| Municipal Bonds 87.5% | ||||||||
Alabama 3.9% | ||||||||
Birmingham, Series A, GO, | 2,000,000 | 2,134,760 | ||||||
Birmingham Special Care Facilities Financing Authority Health Care Facilities, Children’s Hospital of Alabama, RB, 6.000%, 06/01/39, AGC | 2,000,000 | 2,306,380 | ||||||
|
| |||||||
| 4,441,140 | ||||||||
|
| |||||||
Alaska 2.1% | ||||||||
Matanuska-Susitna Borough Lease, Goose Creek Correctional Center, RB, 6.000%, 09/01/28, AGC | 730,000 | 849,968 | ||||||
Matanuska-Susitna Borough Lease, Goose Creek Correctional Center, RB, 6.000%, 09/01/28, Pre-refunded 09/01/2019 @ 100, AGC | 1,270,000 | 1,485,557 | ||||||
|
| |||||||
| 2,335,525 | ||||||||
|
| |||||||
California 13.5% | ||||||||
California Infrastructure & Economic Development Bank, RB, 5.000%, 11/01/34 | 1,000,000 | 1,178,510 | ||||||
California Municipal Finance Authority, Series A, RB, 5.000%, 06/01/50 | 1,750,000 | 1,932,578 | ||||||
California State, GO, 4.000%, 09/01/45 | 1,000,000 | 1,078,650 | ||||||
California State, GO, 5.000%, 09/01/30 | 1,000,000 | 1,178,570 | ||||||
California State, GO, 5.000%, 08/01/35 | 1,000,000 | 1,197,720 | ||||||
California State, GO, 5.000%, 09/01/45 | 3,500,000 | 4,177,495 | ||||||
California State, GO, 6.500%, 04/01/33(b) | 2,000,000 | 2,332,060 | ||||||
San Diego Redevelopment Agency Successor, Series A, 5.000%, 09/01/28 | 500,000 | 620,715 | ||||||
San Diego Redevelopment Agency Successor, Series A, 5.000%, 09/01/29 | 405,000 | 499,802 | ||||||
Santa Clara Valley Water District, Series A, RB, 5.000%, 06/01/46 | 1,000,000 | 1,189,820 | ||||||
|
| |||||||
| 15,385,920 | ||||||||
|
| |||||||
| Shares or Principal Amount($) | Value($) | |||||||
District of Columbia 2.0% | ||||||||
District of Columbia, Income Tax, Series A, RB, 5.500%, 12/01/30(b) | 2,000,000 | 2,327,380 | ||||||
|
| |||||||
Florida 8.2% | ||||||||
Florida State, Series D, GO, 5.000%, 06/01/18 | 3,000,000 | 3,273,810 | ||||||
Orlando FL Contract Tourist DE, Series A, RB, 5.250%, 11/01/32 | 1,000,000 | 1,207,440 | ||||||
South Florida Water Management District, COP, 5.000%, 10/01/36 | 1,000,000 | 1,191,690 | ||||||
Tampa Bay Water, Series A, RB, 5.000%, 10/01/37 | 1,000,000 | 1,201,970 | ||||||
Tampa FL Health System Revenue, Series A, RB, 4.000%, 11/15/46(c) | 1,000,000 | 1,041,450 | ||||||
Tampa FL Health System Revenue, Series A, RB, 5.000%, 11/15/46(c) | 1,250,000 | 1,461,675 | ||||||
|
| |||||||
| 9,378,035 | ||||||||
|
| |||||||
Georgia 11.7% | ||||||||
Fulton County Development Authority, Georgia Tech Athletic Association, RB, 5.750%, 10/01/36 | 1,250,000 | 1,466,475 | ||||||
Gwinnett County School District, GO, 5.000%, 02/01/35 | 2,000,000 | 2,432,440 | ||||||
Private Colleges & Universities Authority, RB, 5.000%, 04/01/31 | 1,000,000 | 1,150,520 | ||||||
Private Colleges & Universities Authority, RB, 5.000%, 04/01/33 | 1,000,000 | 1,138,260 | ||||||
Sandy Springs Public Facilities Authority, RB, 5.000%, 05/01/41 | 3,000,000 | 3,587,910 | ||||||
Sandy Springs Public Facilities Authority, RB, 5.000%, 05/01/47 | 3,000,000 | 3,569,490 | ||||||
|
| |||||||
| 13,345,095 | ||||||||
|
| |||||||
Guam 1.0% | ||||||||
Guam Power Authority, Series A, RB, 5.000%, 10/01/31 | 1,000,000 | 1,136,220 | ||||||
|
| |||||||
Hawaii 1.3% |
| |||||||
University of Hawaii, Series E, RB, 5.000%, 10/01/32(c) | 1,205,000 | 1,493,453 | ||||||
|
| |||||||
See Notes to Financial Statements.
59
Table of Contents
SCHEDULES OF PORTFOLIO INVESTMENTS
RIDGEWORTH FUNDS March 31, 2016
Seix High Grade Municipal Bond Fund — continued
| Shares or Principal Amount($) | Value($) | |||||||
Idaho 2.5% |
| |||||||
Idaho Health Facilities Authority, Series A, RB, 6.750%, 11/01/37(b) | 2,500,000 | 2,821,100 | ||||||
|
| |||||||
Illinois 4.6% |
| |||||||
Chicago O’Hare International Airport, Series B, RB, 5.000%, 01/01/33 | 3,500,000 | 4,105,605 | ||||||
University of Illinois, Auxiliary Facilities System, Series A, RB, 5.750%, 04/01/38 | 1,000,000 | 1,141,000 | ||||||
|
| |||||||
| 5,246,605 | ||||||||
|
| |||||||
Kansas 1.5% |
| |||||||
Kansas State Development Finance Authority, Adventist Bolingbrook Hospital, RB, 5.750%, 11/15/38(b) | 1,500,000 | 1,722,765 | ||||||
|
| |||||||
Maine 2.6% |
| |||||||
Maine State Turnpike Authority, RB, 6.000%, 07/01/38(b) | 2,500,000 | 2,907,425 | ||||||
|
| |||||||
Massachusetts 1.6% |
| |||||||
Commonwealth of Massachusetts, Series A, GO, 5.000%, 04/01/25 | 1,500,000 | 1,775,025 | ||||||
|
| |||||||
Missouri 1.6% |
| |||||||
Metropolitan St Louis Sewer District, Series B, RB, 5.000%, 05/01/45 | 1,500,000 | 1,773,570 | ||||||
|
| |||||||
New York 8.3% |
| |||||||
Erie County Industrial Development Agency, City School District Buffalo, Series A, RB, 5.750%, 05/01/29, BHAC | 1,000,000 | 1,102,940 | ||||||
New York City Transitional Finance Authority Future Tax Secured Revenue, Series E-1, RB, 5.000%, 02/01/35 | 1,000,000 | 1,205,100 | ||||||
New York City Transitional Finance Authority Future Tax Secured Revenue, Series E-1, RB, 5.000%, 02/01/37 | 2,000,000 | 2,392,960 | ||||||
New York City Transitional Finance Authority Future Tax Secured Revenue, Series E-1, RB, 5.000%, 02/01/39 | 3,000,000 | 3,563,790 | ||||||
Utility Debt Securitization Authority, RB, 5.000%, 12/15/37 | 1,000,000 | 1,208,480 | ||||||
|
| |||||||
| 9,473,270 | ||||||||
|
| |||||||
| Shares or Principal Amount($) | Value($) | |||||||
Ohio 2.7% |
| |||||||
Ohio State, Series C, GO, | 3,005,000 | 3,067,624 | ||||||
|
| |||||||
Tennessee 1.5% |
| |||||||
Metropolitan Government Nashville & Davidson County Health & Educational Facilities Board, RB, 5.000%, 07/01/46(c) | 1,500,000 | 1,720,155 | ||||||
|
| |||||||
Texas 12.5% |
| |||||||
Arlington Higher Education Finance Corp., Series A, RB, 5.000%, 08/15/39, PSF-GTD | 1,000,000 | 1,142,300 | ||||||
Dallas Independent School District, GO, 6.375%, 02/15/34, | 4,000,000 | 4,416,320 | ||||||
New Hope Cultural Education Facilities Financing Corp., Student Housing Corp., Series A, RB, 5.000%, 07/01/35 | 2,000,000 | 2,195,420 | ||||||
San Antonio TX Water System, Series A, RB, 5.000%, 05/15/33 | 2,000,000 | 2,430,680 | ||||||
San Antonio TX Water System, Series A, RB, 5.000%, 05/15/34 | 1,250,000 | 1,511,738 | ||||||
Texas State, Series C, GO, 5.250%, 08/01/16 | 2,500,000 | 2,540,525 | ||||||
|
| |||||||
| 14,236,983 | ||||||||
|
| |||||||
Washington 4.4% |
| |||||||
Seattle Washington Municipal Light & Power, RB, | 1,635,000 | 1,868,151 | ||||||
Washington State, Series C, GO, 5.000%, 02/01/35 | 2,570,000 | 3,097,107 | ||||||
|
| |||||||
| 4,965,258 | ||||||||
|
| |||||||
Total Municipal Bonds | 99,552,548 | |||||||
|
| |||||||
Money Market Fund 15.2% |
| |||||||
Federated Tax-Free Obligations Fund, Institutional Shares, | 17,339,825 | 17,339,825 | ||||||
|
| |||||||
Total Money Market Fund |
| 17,339,825 | ||||||
|
| |||||||
See Notes to Financial Statements.
60
Table of Contents
SCHEDULES OF PORTFOLIO INVESTMENTS
RIDGEWORTH FUNDS March 31, 2016
Seix High Grade Municipal Bond Fund — concluded
| Shares or Principal Amount($) | Value($) | |||||
Total Investments | 116,892,373 | |||||
Liabilities in Excess of Other | (3,093,235 | ) | ||||
|
| |||||
Net Assets — 100.0% | $ | 113,799,138 | ||||
|
| |||||
| (a) | Step bond. The rate shown is the rate in effect as of March 31, 2016. |
| (b) | All or a portion of this security has been segregated, or otherwise earmarked, in connection with obligations for when-issued or delayed-delivery purchase commitments. |
| (c) | All or a portion of this security has been purchased on a when-issued or delayed-delivery basis. |
| (d) | Rate disclosed, the 7 day yield, is as of March 31, 2016. |
Investment Abbreviations
| AGC | — | Security guaranteed by Assured Guaranty Corporation | ||
| BHAC | — | Security guaranteed by Berkshire Hathaway Assurance Corporation | ||
| COP | — | Certificate of Participation | ||
| GO | — | General Obligation | ||
| PSF-GTD | — | Security guaranteed by Permanent School Fund Guarantee Program | ||
| RB | — | Revenue Bond |
See Notes to Financial Statements.
61
Table of Contents
SCHEDULES OF PORTFOLIO INVESTMENTS
RIDGEWORTH FUNDS March 31, 2016
Seix High Income Fund
| Shares or Principal Amount($) | Value($) | |||||||
| Bank Loans 3.6% | ||||||||
Broadcasting 0.3% | ||||||||
iHeartCommunications, Inc., Term Loan D, | 2,065,000 | 1,430,013 | ||||||
|
| |||||||
Energy 0.2% | ||||||||
Azure Midstream Energy LLC, Term Loan B, | 1,512,849 | 756,424 | ||||||
Templar Energy LLC, New 2nd Lien Term Loan, 8.500%, 11/25/20(a)(b)(c) | 6,572,409 | 650,669 | ||||||
|
| |||||||
| 1,407,093 | ||||||||
|
| |||||||
Healthcare 0.3% | ||||||||
inVentiv Health, Inc., | 1,925,000 | 1,920,188 | ||||||
|
| |||||||
Metals/Minerals 0.6% | ||||||||
FMG Resources (August 2006) Pty Ltd., New Term Loan B, | 4,531,899 | 3,821,886 | ||||||
|
| |||||||
Retail 1.5% | ||||||||
J.C. Penney Corporation, Inc., 1st Lien Term Loan, 6.000%, 05/22/18(a)(b) | 2,117,858 | 2,119,976 | ||||||
Sears Roebuck Acceptance Corp., 2015 Term Loan, 5.500%, 06/30/18(a)(b) | 4,943,683 | 4,696,499 | ||||||
Toys ‘R’ Us-Delaware, Inc., Term Loan B4, 9.750%, 04/24/20(a)(b) | 2,545,382 | 2,044,781 | ||||||
|
| |||||||
| 8,861,256 | ||||||||
|
| |||||||
Service 0.7% | ||||||||
Asurion LLC, New 2nd Lien Term Loan, 8.500%, 03/03/21(a)(b) | 4,360,000 | 4,072,981 | ||||||
|
| |||||||
Total Bank Loans |
| 21,513,417 | ||||||
|
| |||||||
| Corporate Bonds 89.7% | ||||||||
Advertising 0.3% | ||||||||
MDC Partners, Inc., 6.500%, 05/01/24(a) | 1,550,000 | 1,582,938 | ||||||
|
| |||||||
Aerospace/Defense 0.6% | ||||||||
TransDigm, Inc., | 3,400,000 | 3,387,250 | ||||||
|
| |||||||
Airlines 1.1% | ||||||||
American Airlines Pass Through Trust, Series 2013-2, Cl B, | 3,531,917 | 3,567,236 | ||||||
| Shares or Principal Amount($) | Value($) | |||||||
Airlines—continued | ||||||||
United Airlines Pass Through Trust, Series 2014-1, Cl B, 4.750%, 04/11/22 | 2,374,519 | 2,350,774 | ||||||
VistaJet Malta Finance PLC/VistaJet Co. Finance LLC, 7.750%, 06/01/20(d) | 2,220,000 | 982,350 | ||||||
|
| |||||||
| 6,900,360 | ||||||||
|
| |||||||
Auto Manufacturers 0.0%(e) | ||||||||
General Motors Co. Escrow, | 17,182,000 | — | ||||||
General Motors Co. Escrow, | 36,800,000 | — | ||||||
|
| |||||||
| — | ||||||||
|
| |||||||
Banks 1.0% | ||||||||
CIT Group, Inc., 5.375%, 05/15/20 | 1,650,000 | 1,711,875 | ||||||
Provident Funding Associates LP/PFG Finance Corp., 6.750%, 06/15/21(a) | 4,740,000 | 4,491,150 | ||||||
|
| |||||||
| 6,203,025 | ||||||||
|
| |||||||
Biotechnology 0.7% | ||||||||
Concordia Healthcare Corp., 9.500%, 10/21/22(a)(f) | 4,268,000 | 4,129,290 | ||||||
|
| |||||||
Building Materials 0.9% | ||||||||
GCP Applied Technologies, Inc., 9.500%, 02/01/23(a) | 897,000 | 973,245 | ||||||
Summit Materials LLC/Summit Materials Finance Corp., 6.125%, 07/15/23 | 1,225,000 | 1,163,750 | ||||||
US Concrete, Inc., 8.500%, 12/01/18 | 1,330,000 | 1,383,200 | ||||||
USG Corp., 5.875%, 11/01/21(a) | 1,730,000 | 1,807,850 | ||||||
|
| |||||||
| 5,328,045 | ||||||||
|
| |||||||
Chemicals 2.8% | ||||||||
Blue Cube Spinco, Inc., 9.750%, 10/15/23(a) | 2,543,000 | 2,905,377 | ||||||
Blue Cube Spinco, Inc., 10.000%, 10/15/25(a)(f) | 2,415,000 | 2,759,138 | ||||||
Chemours Co. (The), | 4,455,000 | 3,564,000 | ||||||
Kraton Polymers LLC/Kraton Polymers Capital Corp., 10.500%, 04/15/23(a) | 2,600,000 | 2,450,500 | ||||||
Nufarm Australia Ltd., | 1,685,000 | 1,651,300 | ||||||
Platform Specialty Products Corp., 10.375%, 05/01/21(a) | 4,010,000 | 3,879,675 | ||||||
|
| |||||||
| 17,209,990 | ||||||||
|
| |||||||
See Notes to Financial Statements.
62
Table of Contents
SCHEDULES OF PORTFOLIO INVESTMENTS
RIDGEWORTH FUNDS March 31, 2016
Seix High Income Fund — continued
| Shares or Principal Amount($) | Value($) | |||||||
Coal 1.1% | ||||||||
CONSOL Energy, Inc., | 6,120,000 | 4,410,194 | ||||||
CONSOL Energy, Inc., | 2,615,000 | 1,953,928 | ||||||
|
| |||||||
| 6,364,122 | ||||||||
|
| |||||||
Commercial Services 5.3% | ||||||||
Cenveo Corp., 6.000%, 08/01/19(a) | 2,040,000 | 1,484,100 | ||||||
Flexi-Van Leasing, Inc., 7.875%, 08/15/18(a) | 835,000 | 826,650 | ||||||
Harland Clarke Holdings Corp., 6.875%, 03/01/20(a)(i) | 1,680,000 | 1,495,200 | ||||||
Harland Clarke Holdings Corp., 9.250%, 03/01/21(a)(i) | 3,290,000 | 2,520,963 | ||||||
Harland Clarke Holdings Corp., 9.750%, 08/01/18(a)(i) | 8,877,000 | 8,743,845 | ||||||
Hertz Corp. (The), 4.250%, 04/01/18 | 180,000 | 180,000 | ||||||
Hertz Corp. (The), 5.875%, 10/15/20(f) | 3,030,000 | 3,065,148 | ||||||
Hertz Corp. (The), 6.750%, 04/15/19 | 3,074,000 | 3,118,542 | ||||||
Prospect Medical Holdings, Inc., 8.375%, 05/01/19(a) | 2,817,000 | 2,908,552 | ||||||
Quad/Graphics, Inc., 7.000%, 05/01/22 | 3,980,000 | 3,303,400 | ||||||
TMS International Corp., 7.625%, 10/15/21(d) | 4,350,000 | 2,544,750 | ||||||
United Rentals North America, Inc., 7.625%, 04/15/22 | 1,680,000 | 1,789,200 | ||||||
|
| |||||||
| 31,980,350 | ||||||||
|
| |||||||
Computers 0.4% | ||||||||
Project Homestake Merger Corp., 8.875%, 03/01/23(a) | 2,615,000 | 2,601,925 | ||||||
|
| |||||||
Distribution/Wholesale 0.7% | ||||||||
Univar USA, Inc., 6.750%, 07/15/23(a) | 4,395,000 | 4,290,619 | ||||||
|
| |||||||
Diversified Financial Services 9.9% |
| |||||||
AerCap Ireland Capital Ltd./AerCap Global Aviation Trust, 4.625%, 10/30/20 | 1,325,000 | 1,358,125 | ||||||
Ally Financial, Inc., 3.250%, 11/05/18 | 5,692,000 | 5,598,082 | ||||||
Ally Financial, Inc., 7.500%, 09/15/20 | 3,709,000 | 4,107,717 | ||||||
Ally Financial, Inc., 8.000%, 03/15/20 | 2,619,000 | 2,933,280 | ||||||
International Lease Finance Corp., 6.250%, 05/15/19 | 2,450,000 | 2,612,313 | ||||||
| Shares or Principal Amount($) | Value($) | |||||||
Diversified Financial Services—continued |
| |||||||
International Lease Finance Corp., 8.250%, 12/15/20 | 10,560,000 | 12,328,800 | ||||||
Jefferies Finance LLC/JFIN | 3,350,000 | 2,897,750 | ||||||
Nationstar Mortgage LLC/Nationstar Capital Corp., 6.500%, 08/01/18 | 4,640,000 | 4,495,000 | ||||||
Nationstar Mortgage LLC/Nationstar Capital Corp., 6.500%, 07/01/21 | 3,171,000 | 2,814,263 | ||||||
Nationstar Mortgage LLC/Nationstar Capital Corp., 7.875%, 10/01/20(f) | 3,890,000 | 3,724,675 | ||||||
Nationstar Mortgage LLC/Nationstar Capital Corp., 9.625%, 05/01/19(f) | 1,025,000 | 1,060,875 | ||||||
Navient Corp., 4.875%, 06/17/19, MTN | 2,600,000 | 2,509,000 | ||||||
Navient Corp., 5.000%, 10/26/20 | 2,010,000 | 1,824,075 | ||||||
Navient Corp., 5.500%, 01/15/19, MTN | 250,000 | 245,625 | ||||||
Navient Corp., | 1,855,000 | 1,845,725 | ||||||
Navient Corp., | 1,805,000 | 1,933,606 | ||||||
Quicken Loans, Inc., | 6,045,000 | 5,863,650 | ||||||
Walter Investment Management Corp., 7.875%, 12/15/21(f) | 2,905,000 | 1,888,250 | ||||||
|
| |||||||
| 60,040,811 | ||||||||
|
| |||||||
Electric 2.2% |
| |||||||
Dynegy, Inc., 6.750%, 11/01/19 | 3,775,000 | 3,756,125 | ||||||
Dynegy, Inc., 7.375%, 11/01/22 | 2,365,000 | 2,187,625 | ||||||
Dynegy, Inc., 7.625%, 11/01/24 | 985,000 | 893,888 | ||||||
GenOn Energy, Inc., 7.875%, 06/15/17 | 996,000 | 747,000 | ||||||
GenOn Energy, Inc., 9.500%, 10/15/18 | 3,370,000 | 2,460,100 | ||||||
NRG Energy, Inc., 8.250%, 09/01/20 | 3,535,000 | 3,561,512 | ||||||
|
| |||||||
| 13,606,250 | ||||||||
|
| |||||||
Electronics 0.3% | ||||||||
Allegion PLC, 5.875%, 09/15/23 | 1,743,000 | 1,834,508 | ||||||
|
| |||||||
See Notes to Financial Statements.
63
Table of Contents
SCHEDULES OF PORTFOLIO INVESTMENTS
RIDGEWORTH FUNDS March 31, 2016
Seix High Income Fund — continued
| Shares or Principal Amount($) | Value($) | |||||||
Entertainment 0.9% | ||||||||
Greektown Holdings LLC/Greektown Mothership Corp., | 3,345,000 | 3,428,625 | ||||||
WMG Acquisition Corp., 5.625%, 04/15/22(a) | 1,778,000 | 1,804,670 | ||||||
|
| |||||||
| 5,233,295 | ||||||||
|
| |||||||
Environmental Control 0.2% | ||||||||
GFL Environmental, Inc., 9.875%, 02/01/21(a) | 1,125,000 | 1,170,000 | ||||||
|
| |||||||
Food 2.2% | ||||||||
JBS USA LLC/JBS USA Finance, Inc., 5.750%, 06/15/25(a) | 3,610,000 | 3,158,750 | ||||||
JBS USA LLC/JBS USA Finance, Inc., 8.250%, 02/01/20(a) | 1,820,000 | 1,865,500 | ||||||
Post Holdings, Inc., 7.375%, 02/15/22 | 3,390,000 | 3,584,925 | ||||||
Post Holdings, Inc., | 4,425,000 | 4,911,750 | ||||||
|
| |||||||
| 13,520,925 | ||||||||
|
| |||||||
Forest Products & Paper 0.4% |
| |||||||
Resolute Forest Products, Inc., 5.875%, 05/15/23 | 3,984,000 | 2,689,200 | ||||||
|
| |||||||
Healthcare-Products 1.1% |
| |||||||
Greatbatch Ltd., 9.125%, 11/01/23(a) | 2,227,000 | 2,207,514 | ||||||
Kinetic Concepts, Inc./KCI USA, Inc., 7.875%, 02/15/21(a) | 449,000 | 474,818 | ||||||
Kinetic Concepts, Inc./KCI USA, Inc., 10.500%, 11/01/18 | 2,685,000 | 2,691,712 | ||||||
Teleflex, Inc., 5.250%, 06/15/24 | 1,208,000 | 1,236,690 | ||||||
|
| |||||||
| 6,610,734 | ||||||||
|
| |||||||
Healthcare-Services 5.9% | ||||||||
Centene Escrow Corp., 5.625%, 02/15/21(a) | 3,390,000 | 3,534,075 | ||||||
Centene Escrow Corp., 6.125%, 02/15/24(a) | 855,000 | 899,888 | ||||||
CHS/Community Health Systems, Inc., 6.875%, 02/01/22(f) | 2,335,000 | 2,107,338 | ||||||
CHS/Community Health Systems, Inc., 8.000%, 11/15/19 | 3,535,000 | 3,442,206 | ||||||
HCA Holdings, Inc., 6.250%, 02/15/21 | 2,865,000 | 3,079,875 | ||||||
HCA, Inc., 6.500%, 02/15/20 | 2,215,000 | 2,430,962 | ||||||
| Shares or Principal Amount($) | Value($) | |||||||
Healthcare-Services—continued |
| |||||||
IASIS Healthcare LLC/IASIS Capital Corp., 8.375%, 05/15/19 | 1,790,000 | 1,765,388 | ||||||
inVentiv Health, Inc., | 3,170,000 | 3,273,025 | ||||||
Kindred Healthcare, Inc., 8.000%, 01/15/20 | 2,425,000 | 2,406,812 | ||||||
Tenet Healthcare Corp., 6.750%, 06/15/23 | 1,945,000 | 1,862,338 | ||||||
Tenet Healthcare Corp., 8.000%, 08/01/20(f) | 680,000 | 699,550 | ||||||
Tenet Healthcare Corp., 8.125%, 04/01/22 | 8,730,000 | 8,980,987 | ||||||
WellCare Health Plans, Inc., 5.750%, 11/15/20 | 1,280,000 | 1,324,800 | ||||||
|
| |||||||
| 35,807,244 | ||||||||
|
| |||||||
Home Builders 1.2% | ||||||||
CalAtlantic Group, Inc., 5.875%, 11/15/24 | 1,650,000 | 1,736,625 | ||||||
DR Horton, Inc., 4.000%, 02/15/20 | 1,095,000 | 1,127,850 | ||||||
Lennar Corp., 4.750%, 04/01/21 | 1,230,000 | 1,245,375 | ||||||
PulteGroup, Inc., 4.250%, 03/01/21 | 878,000 | 891,170 | ||||||
Shea Homes LP/Shea Homes Funding Corp., 5.875%, 04/01/23(a) | 1,665,000 | 1,642,106 | ||||||
Taylor Morrison Communities, Inc./Monarch Communities, Inc., 5.250%, 04/15/21(a) | 680,000 | 666,400 | ||||||
|
| |||||||
| 7,309,526 | ||||||||
|
| |||||||
Household Products/Wares 0.1% |
| |||||||
Century Intermediate Holding Co. 2, PIK, 9.750%, 02/15/19(a) | 863,000 | 877,024 | ||||||
|
| |||||||
Insurance 1.1% | ||||||||
Assured Guaranty US Holdings, Inc., Series A, 6.400%, 12/15/66(b)(d) | 595,000 | 410,550 | ||||||
Radian Group, Inc., 5.500%, 06/01/19 | 2,880,000 | 2,930,400 | ||||||
Radian Group,Inc., 7.000%, 03/15/21 | 2,937,000 | 3,041,263 | ||||||
|
| |||||||
| 6,382,213 | ||||||||
|
| |||||||
Internet 0.3% | ||||||||
Zayo Group LLC/Zayo Capital, Inc., 6.000%, 04/01/23 | 1,770,000 | 1,766,672 | ||||||
|
| |||||||
See Notes to Financial Statements.
64
Table of Contents
SCHEDULES OF PORTFOLIO INVESTMENTS
RIDGEWORTH FUNDS March 31, 2016
Seix High Income Fund — continued
| Shares or Principal Amount($) | Value($) | |||||||
Iron/Steel 0.5% | ||||||||
Signode Industrial Group Lux SA/Signode Industrial Group US, Inc., 6.375%, 05/01/22(a) | 1,805,000 | 1,640,294 | ||||||
Steel Dynamics, Inc., 5.125%, 10/01/21 | 1,470,000 | 1,484,700 | ||||||
|
| |||||||
| 3,124,994 | ||||||||
|
| |||||||
Leisure Time 0.6% | ||||||||
NCL Corp. Ltd., 5.250%, 11/15/19(a) | 1,175,000 | 1,198,500 | ||||||
Viking Cruises Ltd., 8.500%, 10/15/22(a) | 2,860,000 | 2,702,700 | ||||||
|
| |||||||
| 3,901,200 | ||||||||
|
| |||||||
Lodging 0.7% | ||||||||
Boyd Gaming Corp., 9.000%, 07/01/20 | 935,000 | 988,762 | ||||||
Downstream Development Authority of the Quapaw Tribe of Oklahoma, 10.500%, 07/01/19(a)(i) | 3,240,000 | 3,078,000 | ||||||
|
| |||||||
| 4,066,762 | ||||||||
|
| |||||||
Media 7.1% | ||||||||
Altice Financing SA, | 1,030,000 | 1,048,025 | ||||||
Altice Financing SA, | 2,205,000 | 2,210,512 | ||||||
Altice Luxembourg SA, 7.750%, 05/15/22(a) | 1,175,000 | 1,156,294 | ||||||
Altice US Finance SA, | 5,260,000 | 5,141,650 | ||||||
CCO Holdings LLC/Cap Corp., 5.750%, 09/01/23 | 1,060,000 | 1,099,750 | ||||||
Cequel Communications Holdings I LLC/Cequel Capital Corp., 5.125%, 12/15/21(a) | 1,940,000 | 1,809,050 | ||||||
Cequel Communications Holdings I LLC/Cequel Capital Corp., 7.750%, 07/15/25(a)(f) | 3,175,000 | 3,127,375 | ||||||
Clear Channel Worldwide Holdings, Inc., Series B, 6.500%, 11/15/22 | 2,640,000 | 2,626,800 | ||||||
DISH DBS Corp., 5.125%, 05/01/20 | 6,310,000 | 6,262,675 | ||||||
DISH DBS Corp., 7.875%, 09/01/19 | 560,000 | 616,000 | ||||||
iHeartCommunications, Inc., 10.625%, 03/15/23 | 465,000 | 322,013 | ||||||
| Shares or Principal Amount($) | Value($) | |||||||
Media—continued | ||||||||
Lee Enterprises, Inc., | 2,960,000 | 2,911,900 | ||||||
McGraw-Hill Global Education Holdings LLC/McGraw-Hill Global Education Finance, 9.750%, 04/01/21 | 825,000 | 895,125 | ||||||
MHGE Parent LLC/MHGE Parent Finance, Inc., 8.500%, 08/01/19(a)(f) | 3,470,000 | 3,452,650 | ||||||
Numericable-SFR, 6.000%, 05/15/22(a) | 2,425,000 | 2,364,375 | ||||||
Univision Communications, Inc., 6.750%, 09/15/22(a) | 1,434,000 | 1,520,040 | ||||||
VTR Finance BV, | 3,000,000 | 2,925,000 | ||||||
WideOpenWest Finance LLC/WideOpenWest Capital Corp., 10.250%, 07/15/19 | 2,405,000 | 2,405,000 | ||||||
Ziggo Bond Finance BV, 5.875%, 01/15/25(a) | 1,315,000 | 1,288,700 | ||||||
|
| |||||||
| 43,182,934 | ||||||||
|
| |||||||
Metal Fabricate/Hardware 0.5% |
| |||||||
JMC Steel Group, Inc., | 3,365,000 | 2,994,850 | ||||||
|
| |||||||
Mining 1.0% | ||||||||
FMG Resources August 2006 Pty Ltd., 9.750%, 03/01/22(a)(f) | 1,225,000 | 1,221,937 | ||||||
Imperial Metals Corp., | 5,860,000 | 5,098,200 | ||||||
|
| |||||||
| 6,320,137 | ||||||||
|
| |||||||
Miscellaneous Manufacturer 1.4% |
| |||||||
Bombardier, Inc., 7.500%, 03/15/18(a) | 7,730,000 | 7,614,050 | ||||||
Gates Global LLC/Gates Global Co., 6.000%, 07/15/22(a)(f) | 805,000 | 688,275 | ||||||
|
| |||||||
| 8,302,325 | ||||||||
|
| |||||||
Oil & Gas 10.0% | ||||||||
Antero Resources Corp., 6.000%, 12/01/20 | 5,014,000 | 4,763,300 | ||||||
Atwood Oceanics, Inc., 6.500%, 02/01/20(f) | 3,400,000 | 1,615,000 | ||||||
Carrizo Oil & Gas, Inc., 7.500%, 09/15/20(f) | 3,155,000 | 2,942,037 | ||||||
Chesapeake Energy Corp., 5.750%, 03/15/23(f) | 5,405,000 | 1,837,700 | ||||||
Chesapeake Energy Corp., 6.625%, 08/15/20(f) | 4,845,000 | 1,889,550 | ||||||
See Notes to Financial Statements.
65
Table of Contents
SCHEDULES OF PORTFOLIO INVESTMENTS
RIDGEWORTH FUNDS March 31, 2016
Seix High Income Fund — continued
| Shares or Principal Amount($) | Value($) | |||||||
Oil & Gas—continued | ||||||||
Chesapeake Energy Corp., 6.875%, 11/15/20 | 5,310,000 | 2,084,175 | ||||||
CITGO Petroleum Corp., 6.250%, 08/15/22(a) | 1,870,000 | 1,804,550 | ||||||
Concho Resources, Inc., 7.000%, 01/15/21 | 1,015,000 | 1,025,150 | ||||||
Continental Resources, Inc., 5.000%, 09/15/22 | 675,000 | 581,766 | ||||||
Continental Resources, Inc., 7.125%, 04/01/21 | 80,000 | 74,800 | ||||||
Eclipse Resources Corp., 8.875%, 07/15/23(a) | 3,705,000 | 1,926,600 | ||||||
EP Energy LLC/Everest Acquisition Finance, Inc., 9.375%, 05/01/20 | 1,890,000 | 953,269 | ||||||
Halcon Resources Corp., 8.625%, 02/01/20(a)(f) | 3,095,000 | 2,197,450 | ||||||
Hilcorp Energy I LP/Hilcorp Finance Co., 5.000%, 12/01/24(a) | 3,410,000 | 2,872,925 | ||||||
Hilcorp Energy I LP/Hilcorp Finance Co., 7.625%, 04/15/21(a)(f) | 3,489,000 | 3,323,272 | ||||||
Linn Energy LLC/Linn Energy Finance Corp., 8.625%, 04/15/20(c) | 6,487,000 | 746,005 | ||||||
Offshore Drilling Holding SA, 8.375%, 09/20/20(a) | 2,380,000 | 1,136,450 | ||||||
PBF Holding Co. LLC/PBF Finance Corp., 7.000%, 11/15/23(a) | 2,115,000 | 2,006,606 | ||||||
Petrobras Global Finance BV, 5.625%, 05/20/43 | 2,635,000 | 1,712,750 | ||||||
Precision Drilling Corp., 5.250%, 11/15/24 | 2,285,000 | 1,616,638 | ||||||
Precision Drilling Corp., 6.625%, 11/15/20 | 1,689,843 | 1,351,875 | ||||||
Range Resources Corp., 5.750%, 06/01/21 | 2,659,000 | 2,346,567 | ||||||
Rice Energy, Inc., 6.250%, 05/01/22 | 2,885,000 | 2,509,950 | ||||||
Rowan Cos., Inc., 5.000%, 09/01/17 | 1,890,000 | 1,819,478 | ||||||
Sanchez Energy Corp., 7.750%, 06/15/21(f) | 3,045,000 | 1,788,938 | ||||||
SandRidge Energy, Inc., 8.125%, 10/15/22(c) | 1,935,000 | 111,263 | ||||||
SandRidge Energy, Inc., 8.750%, 06/01/20(a) | 1,615,000 | 391,638 | ||||||
Seven Generations Energy Ltd., 6.750%, 05/01/23(a)(f) | 2,521,000 | 2,376,042 | ||||||
| Shares or Principal Amount($) | Value($) | |||||||
Oil & Gas—continued | ||||||||
Southwestern Energy Co., 4.050%, 01/23/20 | 1,890,000 | 1,370,250 | ||||||
Southwestern Energy Co., 7.500%, 02/01/18(f) | 5,035,000 | 4,216,812 | ||||||
Whiting Petroleum Corp., 5.000%, 03/15/19 | 1,305,000 | 903,713 | ||||||
Whiting Petroleum Corp., 6.250%, 04/01/23(f) | 3,860,000 | 2,595,850 | ||||||
WPX Energy, Inc., 5.250%, 01/15/17(f) | 1,495,000 | 1,472,575 | ||||||
|
| |||||||
| 60,364,944 | ||||||||
|
| |||||||
Oil & Gas Services 0.5% | ||||||||
FTS International, Inc., | 2,095,000 | 1,413,054 | ||||||
KCA Deutag UK Finance PLC, 7.250%, 05/15/21(d) | 2,820,000 | 1,762,500 | ||||||
|
| |||||||
| 3,175,554 | ||||||||
|
| |||||||
Pharmaceuticals 2.5% | ||||||||
Endo Finance LLC/Endo Finco, Inc., 7.750%, 01/15/22(a) | 1,715,000 | 1,749,317 | ||||||
Endo Finance LLC/Endo Ltd./Endo Finco, Inc., 6.000%, 07/15/23(a) | 4,075,000 | 3,835,594 | ||||||
Valeant Pharmaceuticals International, 6.750%, 08/15/21(a) | 1,975,000 | 1,609,625 | ||||||
Valeant Pharmaceuticals International, 7.000%, 10/01/20(a) | 3,375,000 | 2,835,000 | ||||||
Valeant Pharmaceuticals International, Inc., 6.750%, 08/15/18(a)(f) | 5,280,000 | 4,791,600 | ||||||
|
| |||||||
| 14,821,136 | ||||||||
|
| |||||||
Pipelines 5.4% | ||||||||
Crestwood Midstream Partners LP/Crestwood Midstream Finance Corp., 6.125%, 03/01/22 | 4,075,000 | 3,056,250 | ||||||
DCP Midstream Operating LP, 2.500%, 12/01/17 | 2,285,000 | 2,176,478 | ||||||
Energy Transfer Equity LP, 7.500%, 10/15/20 | 2,860,000 | 2,752,750 | ||||||
Kinder Morgan Energy Partners LP, 9.000%, 02/01/19 | 3,825,000 | 4,341,031 | ||||||
Rockies Express Pipeline LLC, 6.000%, 01/15/19(a) | 3,175,000 | 3,095,625 | ||||||
Rockies Express Pipeline LLC, 6.850%, 07/15/18(a) | 1,241,000 | 1,237,897 | ||||||
See Notes to Financial Statements.
66
Table of Contents
SCHEDULES OF PORTFOLIO INVESTMENTS
RIDGEWORTH FUNDS March 31, 2016
Seix High Income Fund — continued
| Shares or Principal Amount($) | Value($) | |||||||
Pipelines—continued | ||||||||
Sabine Pass Liquefaction LLC, 5.625%, 02/01/21 | 9,720,000 | 9,343,350 | ||||||
Targa Resources Partners LP/Targa Resources Partners Finance Corp., 5.000%, 01/15/18 | 605,000 | 603,488 | ||||||
Targa Resources Partners LP/Targa Resources Partners Finance Corp., 5.250%, 05/01/23 | 1,115,000 | 1,028,588 | ||||||
Tesoro Logistics LP/Tesoro Logistics Finance Corp., 5.500%, 10/15/19(a) | 3,004,000 | 2,988,980 | ||||||
Tesoro Logistics LP/Tesoro Logistics Finance Corp., 6.125%, 10/15/21 | 875,000 | 875,000 | ||||||
Williams Cos., Inc. (The), 5.750%, 06/24/44 | 1,840,000 | 1,223,600 | ||||||
|
| |||||||
| 32,723,037 | ||||||||
|
| |||||||
Private Equity 0.7% | ||||||||
Icahn Enterprises LP/Icahn Enterprises Finance Corp., 6.000%, 08/01/20 | 4,515,000 | 4,390,837 | ||||||
|
| |||||||
Real Estate 1.4% | ||||||||
Greystar Real Estate Partners LLC, 8.250%, 12/01/22(a) | 370,000 | 382,025 | ||||||
Howard Hughes Corp. (The), 6.875%, 10/01/21(a) | 5,770,000 | 5,683,450 | ||||||
Realogy Group LLC/Realogy Co-Issuer Corp., 5.250%, 12/01/21(a)(f) | 2,195,000 | 2,266,337 | ||||||
|
| |||||||
| 8,331,812 | ||||||||
|
| |||||||
Real Estate Investment Trust 2.1% |
| |||||||
iStar, Inc., 5.000%, 07/01/19 | 1,450,000 | 1,392,000 | ||||||
iStar, Inc., 6.500%, 07/01/21 | 3,303,000 | 3,216,296 | ||||||
iStar, Inc., 7.125%, 02/15/18 | 5,765,000 | 5,837,063 | ||||||
iStar, Inc., 9.000%, 06/01/17 | 2,220,000 | 2,308,800 | ||||||
|
| |||||||
| 12,754,159 | ||||||||
|
| |||||||
Retail 3.0% | ||||||||
Guitar Center, Inc., 6.500%, 04/15/19(a) | 3,285,000 | 2,956,500 | ||||||
JC Penney Corp., Inc., 6.375%, 10/15/36 | 3,552,000 | 2,921,520 | ||||||
Landry’s Holdings II, Inc., 10.250%, 01/01/18(a) | 720,000 | 716,400 | ||||||
Men’s Wearhouse, Inc. (The), 7.000%, 07/01/22 | 2,060,000 | 1,745,850 | ||||||
New Albertsons, Inc., 7.450%, 08/01/29 | 1,050,000 | 952,875 | ||||||
| Shares or Principal Amount($) | Value($) | |||||||
Retail—continued | ||||||||
Rite Aid Corp., 6.125%, 04/01/23(a) | 3,700,000 | 3,922,000 | ||||||
Rite Aid Corp., 6.750%, 06/15/21 | 2,515,000 | 2,656,469 | ||||||
Toys R Us Property Co. II LLC, 8.500%, 12/01/17 | 2,441,000 | 2,379,975 | ||||||
|
| |||||||
| 18,251,589 | ||||||||
|
| |||||||
Semiconductors 0.5% | ||||||||
Micron Technology, Inc., 5.625%, 01/15/26(a) | 2,070,000 | 1,635,300 | ||||||
Micron Technology, Inc., 5.875%, 02/15/22 | 1,365,000 | 1,180,725 | ||||||
|
| |||||||
| 2,816,025 | ||||||||
|
| |||||||
Software 1.0% | ||||||||
First Data Corp., 7.000%, 12/01/23(a) | 4,360,000 | 4,403,600 | ||||||
Solera LLC/Solera Finance, Inc., 10.500%, 03/01/24(a) | 1,610,000 | 1,618,050 | ||||||
|
| |||||||
| 6,021,650 | ||||||||
|
| |||||||
Telecommunication Services 8.6% |
| |||||||
Avaya, Inc., 7.000%, 04/01/19(a)(f) | 1,835,000 | 1,238,625 | ||||||
Avaya, Inc., 9.000%, 04/01/19(a) | 580,000 | 391,500 | ||||||
CenturyLink, Inc., Series Y, 7.500%, 04/01/24(j) | 2,270,000 | 2,275,675 | ||||||
DigitalGlobe, Inc., 5.250%, 02/01/21(d) | 1,690,000 | 1,537,900 | ||||||
Intelsat Jackson Holdings SA, 7.250%, 04/01/19 | 3,125,000 | 2,304,688 | ||||||
Intelsat Jackson Holdings SA, 7.250%, 10/15/20 | 2,090,000 | 1,348,050 | ||||||
Intelsat Jackson Holdings SA, 8.000%, 02/15/24(a)(f) | 1,102,000 | 1,135,060 | ||||||
Intelsat Luxembourg SA, 7.750%, 06/01/21 | 1,354,000 | 402,815 | ||||||
Level 3 Financing, Inc., 6.125%, 01/15/21 | 6,895,000 | 7,222,512 | ||||||
Sprint Capital Corp., 8.750%, 03/15/32 | 3,335,000 | 2,609,638 | ||||||
Sprint Communications, Inc., 11.500%, 11/15/21 | 3,795,000 | 3,377,550 | ||||||
Sprint Corp., 7.875%, 09/15/23 | 9,350,000 | 7,150,786 | ||||||
T-Mobile USA, Inc., 6.500%, 01/15/24 | 1,990,000 | 2,069,600 | ||||||
T-Mobile USA, Inc., 6.542%, 04/28/20 | 1,940,000 | 2,003,050 | ||||||
T-Mobile USA, Inc., 6.633%, 04/28/21 | 2,490,000 | 2,602,050 | ||||||
See Notes to Financial Statements.
67
Table of Contents
SCHEDULES OF PORTFOLIO INVESTMENTS
RIDGEWORTH FUNDS March 31, 2016
Seix High Income Fund — concluded
| Shares or Principal Amount($) | Value($) | |||||||
Telecommunication Services—continued |
| |||||||
Trilogy International Partners LLC/Trilogy International Finance, Inc., 10.250%, 08/15/16(d)(i) | 8,260,000 | 7,289,450 | ||||||
ViaSat, Inc., 6.875%, 06/15/20 | 3,945,000 | 4,097,869 | ||||||
West Corp., | 670,000 | 614,591 | ||||||
Wind Acquisition Finance SA, 7.375%, 04/23/21(a) | 2,885,000 | 2,610,925 | ||||||
|
| |||||||
| 52,282,334 | ||||||||
|
| |||||||
Transportation 1.5% |
| |||||||
Eletson Holdings, | 2,420,000 | 1,887,600 | ||||||
Florida East Coast Holdings Corp., 6.750%, 05/01/19(a) | 2,985,000 | 2,985,000 | ||||||
Hornbeck Offshore Services, Inc., 1.500%, 09/01/19 | 1,985,000 | 1,177,353 | ||||||
Hornbeck Offshore Services, Inc., 5.000%, 03/01/21(d) | 4,575,000 | 2,745,000 | ||||||
|
| |||||||
| 8,794,953 | ||||||||
|
| |||||||
Total Corporate Bonds | 543,447,548 | |||||||
|
| |||||||
Convertible Preferred Stock 0.2% |
| |||||||
Telecommunication Services 0.2% |
| |||||||
T-Mobile US, Inc., | 16,490 | 1,091,638 | ||||||
|
| |||||||
Total Convertible Preferred Stock |
| 1,091,638 | ||||||
|
| |||||||
Preferred Stock 0.5% |
| |||||||
Banks 0.5% | ||||||||
GMAC Capital Trust I, | 121,110 | 2,968,406 | ||||||
|
| |||||||
Total Preferred Stock | 2,968,406 | |||||||
|
| |||||||
Common Stocks 1.2% |
| |||||||
Auto Manufacturers 0.9% | ||||||||
General Motors Co. | 179,362 | 5,637,348 | ||||||
|
| |||||||
Energy-Alternate Sources 0.0%(e) |
| |||||||
Pacific Ethanol, Inc.* | 55,001 | 257,402 | ||||||
|
| |||||||
Telecommunication Services 0.3% |
| |||||||
NII Holding, Inc.*(f) | 284,455 | 1,573,036 | ||||||
|
| |||||||
Total Common Stocks | 7,467,786 | |||||||
|
| |||||||
Money Market Funds 13.4% |
| |||||||
State Street Institutional Treasury Money Market Fund, Institutional Class, 0.19%(k) | 19,562,804 | 19,562,804 | ||||||
| Shares or Principal Amount($) | Value($) | |||||||
Money Market Funds—continued |
| |||||||
State Street Institutional U.S. Government Money Market Fund, Institutional Class, 0.24%(k)(l) | 61,871,816 | 61,871,816 | ||||||
|
| |||||||
Total Money Market Funds | 81,434,620 | |||||||
|
| |||||||
Total Investments | 657,923,415 | |||||||
Liabilities in Excess of Other | (52,005,218 | ) | ||||||
|
| |||||||
Net Assets — 100.0% | $ | 605,918,197 | ||||||
|
| |||||||
| * | Non-income producing security. |
| (a) | Rule 144A, Section 4(2) or other security which is restricted as to resale to institutional investors. The Fund’s investment adviser/subadviser has deemed this security to be liquid based upon procedures approved by the Board of Trustees. These securities represent 40.1% of net assets as of March 31, 2016. |
| (b) | Variable or floating rate security. Rate disclosed is as of March 31, 2016. |
| (c) | Security is in default. |
| (d) | The Fund’s investment adviser/subadviser has deemed this security to be illiquid based upon procedures approved by the Board of Trustees. These securities represent 4.0% of net assets as of March 31, 2016. |
| (e) | Less than 0.05% of Net Assets. |
| (f) | The security or a partial position of the security was on loan as of March 31, 2016. The total value of securities on loan as of March 31, 2016 was $61,452,599. |
| (g) | Valued at fair value using procedures approved by the Board of Trustees (See Note 2(a)). Fair valued securities held by the Fund represent 0.0% of net assets as of March 31, 2016. |
| (h) | Perpetual maturity. |
| (i) | All or a portion of this security has been segregated, or otherwise earmarked, in connection with obligations for when-issued or delayed-delivery purchase commitments. |
| (j) | All or a portion of this security has been purchased on a when-issued or delayed-delivery basis. |
| (k) | Rate disclosed, the 7 day yield, is as of March 31, 2016. |
| (l) | Purchased with cash collateral held from securities lending. The total value of the collateral held by the Fund was $64,192,704. The total value of the collateral includes non-cash U.S. Government securities collateral having a value of $2,320,888. The value of the collateral could include collateral held for securities that were sold on or before March 31, 2016 (See Note 2(k)). |
Investment Abbreviations
| MTN | — | Medium Term Note | ||
| PIK | — | Payment in-kind |
See Notes to Financial Statements.
68
Table of Contents
SCHEDULES OF PORTFOLIO INVESTMENTS
RIDGEWORTH FUNDS March 31, 2016
Seix High Yield Fund
| Shares or Principal Amount($) | Value($) | |||||||
Bank Loans 3.8% | ||||||||
Chemicals 0.4% | ||||||||
Kraton Polymers LLC, Term Loan B, 6.000%, 01/06/22(a)(b)(c) | 2,220,000 | 2,090,685 | ||||||
|
| |||||||
Energy 0.2% | ||||||||
Azure Midstream Energy LLC, Term Loan B, 7.500%, 11/15/18(a)(b) | 1,200,846 | 600,423 | ||||||
Templar Energy LLC, New 2nd Lien Term Loan, 8.500%, 11/25/20(a)(b)(d) | 5,525,271 | 547,002 | ||||||
|
| |||||||
| 1,147,425 | ||||||||
|
| |||||||
Healthcare 0.3% | ||||||||
inVentiv Health, Inc., Term Loan B4, 7.750%, 05/15/18(a)(b) | 1,735,000 | 1,730,662 | ||||||
|
| |||||||
Metals/Minerals 0.6% | ||||||||
FMG Resources (August 2006) Pty Ltd., New Term Loan B, | 3,860,506 | 3,255,681 | ||||||
|
| |||||||
Retail 1.9% | ||||||||
J.C. Penney Corp., Inc., 1st Lien Term Loan, 6.000%, 05/22/18(a)(b) | 4,206,603 | 4,210,809 | ||||||
Sears Roebuck Acceptance Corp., 2015 Term Loan, 5.500%, 06/30/18(a)(b) | 4,283,252 | 4,069,089 | ||||||
Toys ‘R’ Us-Delaware, Inc., | 2,301,202 | 1,848,625 | ||||||
|
| |||||||
| 10,128,523 | ||||||||
|
| |||||||
Service 0.4% | ||||||||
Asurion LLC, New Term | 2,213,501 | 2,180,299 | ||||||
|
| |||||||
Total Bank Loans | 20,533,275 | |||||||
|
| |||||||
Corporate Bonds 87.8% | ||||||||
Advertising 0.3% | ||||||||
MDC Partners, Inc., 6.500%, 05/01/24(b) | 1,340,000 | 1,368,475 | ||||||
|
| |||||||
Airlines 1.9% | ||||||||
Air Canada, 6.750%, 10/01/19(b) | 2,600,000 | 2,691,000 | ||||||
American Airlines Pass Through Trust, Series 2013-2, Cl B, | 3,427,545 | 3,461,821 | ||||||
| Shares or Principal Amount($) | Value($) | |||||||
Airlines—continued | ||||||||
United Airlines Pass Through Trust, Series 2014-1, Cl B, 4.750%, 04/11/22 | 3,256,157 | 3,223,595 | ||||||
VistaJet Malta Finance PLC/VistaJet Co. Finance LLC, 7.750%, 06/01/20(e) | 1,850,000 | 818,625 | ||||||
|
| |||||||
| 10,195,041 | ||||||||
|
| |||||||
Banks 1.1% | ||||||||
CIT Group, Inc., 5.375%, 05/15/20 | 1,452,000 | 1,506,450 | ||||||
Provident Funding Associates LP/PFG Finance Corp., 6.750%, 06/15/21(b) | 4,320,000 | 4,093,200 | ||||||
|
| |||||||
| 5,599,650 | ||||||||
|
| |||||||
Building Materials 1.0% | ||||||||
GCP Applied Technologies, Inc., 9.500%, 02/01/23(b) | 813,000 | 882,105 | ||||||
Summit Materials LLC/Summit Materials Finance Corp., 6.125%, 07/15/23 | 1,080,000 | 1,026,000 | ||||||
USG Corp., 5.875%, 11/01/21(b) | 3,385,000 | 3,537,325 | ||||||
|
| |||||||
| 5,445,430 | ||||||||
|
| |||||||
Chemicals 2.4% | ||||||||
Blue Cube Spinco, Inc., 9.750%, 10/15/23(b) | 2,285,000 | 2,610,612 | ||||||
Blue Cube Spinco, Inc., 10.000%, 10/15/25(b) | 2,060,000 | 2,353,550 | ||||||
Chemours Co. (The), | 2,705,000 | 2,164,000 | ||||||
Nufarm Australia Ltd., | 2,480,000 | 2,430,400 | ||||||
Platform Specialty Products Corp., 10.375%, 05/01/21(b) | 3,570,000 | 3,453,975 | ||||||
|
| |||||||
| 13,012,537 | ||||||||
|
| |||||||
Coal 1.0% | ||||||||
CONSOL Energy, Inc., | 5,379,000 | 3,876,215 | ||||||
CONSOL Energy, Inc., | 2,250,000 | 1,681,200 | ||||||
|
| |||||||
| 5,557,415 | ||||||||
|
| |||||||
Commercial Services 6.2% | ||||||||
Flexi-Van Leasing, Inc., 7.875%, 08/15/18(b) | 1,600,000 | 1,584,000 | ||||||
Harland Clarke Holdings Corp., | 5,195,000 | 4,623,550 | ||||||
Harland Clarke Holdings Corp., | 7,474,000 | 7,361,890 | ||||||
See Notes to Financial Statements.
69
Table of Contents
SCHEDULES OF PORTFOLIO INVESTMENTS
RIDGEWORTH FUNDS March 31, 2016
Seix High Yield Fund — continued
| Shares or Principal Amount($) | Value($) | |||||||
Commercial Services—continued |
| |||||||
Hertz Corp. (The), 4.250%, 04/01/18 | 160,000 | 160,000 | ||||||
Hertz Corp. (The), 5.875%, 10/15/20(f) | 3,170,000 | 3,206,772 | ||||||
Hertz Corp. (The), 6.750%, 04/15/19 | 2,662,000 | 2,700,572 | ||||||
Prospect Medical Holdings, Inc., 8.375%, 05/01/19(b) | 2,535,000 | 2,617,388 | ||||||
Quad/Graphics, Inc., 7.000%, 05/01/22 | 3,530,000 | 2,929,900 | ||||||
TMS International Corp., 7.625%, 10/15/21(e)(g) | 8,591,000 | 5,025,735 | ||||||
United Rentals North America, Inc., 7.625%, 04/15/22 | 2,530,000 | 2,694,450 | ||||||
|
| |||||||
| 32,904,257 | ||||||||
|
| |||||||
Distribution/Wholesale 0.6% | ||||||||
Univar USA, Inc., 6.750%, 07/15/23(b) | 3,270,000 | 3,192,338 | ||||||
|
| |||||||
Diversified Financial Services 10.4% |
| |||||||
AerCap Ireland Capital Ltd./AerCap Global Aviation Trust, 4.625%, 10/30/20 | 1,200,000 | 1,230,000 | ||||||
Alliance Data Systems Corp., 5.375%, 08/01/22(b) | 1,395,000 | 1,307,813 | ||||||
Ally Financial, Inc., 3.250%, 11/05/18 | 1,450,000 | 1,426,075 | ||||||
Ally Financial, Inc., 7.500%, 09/15/20 | 5,201,000 | 5,760,107 | ||||||
Ally Financial, Inc., 8.000%, 03/15/20 | 5,673,000 | 6,353,760 | ||||||
ILFC E-Capital Trust I, | 6,750,000 | 5,467,500 | ||||||
International Lease Finance Corp., 8.250%, 12/15/20 | 5,890,000 | 6,876,575 | ||||||
Jefferies Finance LLC/JFIN Co-Issuer Corp., 7.375%, 04/01/20(b) | 2,765,000 | 2,391,725 | ||||||
Nationstar Mortgage LLC/Nationstar Capital Corp., 6.500%, 08/01/18 | 3,985,000 | 3,860,469 | ||||||
Nationstar Mortgage LLC/Nationstar Capital Corp., 6.500%, 07/01/21 | 4,115,000 | 3,652,062 | ||||||
Nationstar Mortgage LLC/Nationstar Capital Corp., 7.875%, 10/01/20(f) | 2,055,000 | 1,967,663 | ||||||
Nationstar Mortgage LLC/Nationstar Capital Corp., 9.625%, 05/01/19(f) | 855,000 | 884,925 | ||||||
| Shares or Principal Amount($) | Value($) | |||||||
Diversified Financial Services—continued |
| |||||||
Navient Corp., 4.875%, 06/17/19, MTN | 2,000,000 | 1,930,000 | ||||||
Navient Corp., 5.000%, 10/26/20 | 1,690,000 | 1,533,675 | ||||||
Navient Corp., 5.500%, 01/15/19, MTN | 225,000 | 221,063 | ||||||
Navient Corp., 8.000%, 03/25/20, MTN | 1,545,000 | 1,537,275 | ||||||
Navient Corp., 8.450%, 06/15/18, MTN | 1,900,000 | 2,035,375 | ||||||
Quicken Loans, Inc., | 5,390,000 | 5,228,300 | ||||||
Walter Investment Management Corp., 7.875%, 12/15/21(f) | 2,585,000 | 1,680,250 | ||||||
|
| |||||||
| 55,344,612 | ||||||||
|
| |||||||
Electric 1.8% | ||||||||
Dynegy, Inc., 6.750%, 11/01/19 | 3,755,000 | 3,736,225 | ||||||
Dynegy, Inc., 7.375%, 11/01/22 | 2,010,000 | 1,859,250 | ||||||
Dynegy, Inc., 7.625%, 11/01/24 | 865,000 | 784,988 | ||||||
NRG Energy, Inc., 8.250%, 09/01/20 | 3,105,000 | 3,128,287 | ||||||
|
| |||||||
| 9,508,750 | ||||||||
|
| |||||||
Electronics 0.3% | ||||||||
Allegion PLC, 5.875%, 09/15/23 | 1,563,000 | 1,645,058 | ||||||
|
| |||||||
Entertainment 0.6% | ||||||||
Greektown Holdings LLC/Greektown Mothership Corp., | 2,940,000 | 3,013,500 | ||||||
|
| |||||||
Environmental Control 0.2% | ||||||||
GFL Environmental, Inc., 9.875%, 02/01/21(b) | 1,006,000 | 1,046,240 | ||||||
|
| |||||||
Food 2.6% | ||||||||
JBS USA LLC/JBS USA Finance, Inc., 5.750%, 06/15/25(b) | 3,400,000 | 2,975,000 | ||||||
JBS USA LLC/JBS USA Finance, Inc., 8.250%, 02/01/20(b) | 1,610,000 | 1,650,250 | ||||||
Pilgrim’s Pride Corp., | 1,730,000 | 1,736,487 | ||||||
Post Holdings, Inc., 7.375%, 02/15/22 | 3,510,000 | 3,711,825 | ||||||
Post Holdings, Inc., | 3,475,000 | 3,857,250 | ||||||
|
| |||||||
| 13,930,812 | ||||||||
|
| |||||||
See Notes to Financial Statements.
70
Table of Contents
SCHEDULES OF PORTFOLIO INVESTMENTS
RIDGEWORTH FUNDS March 31, 2016
Seix High Yield Fund — continued
| Shares or Principal Amount($) | Value($) | |||||||
Forest Products & Paper 0.4% |
| |||||||
Resolute Forest Products, Inc., 5.875%, 05/15/23(f) | 3,447,000 | 2,326,725 | ||||||
|
| |||||||
Healthcare-Products 0.8% |
| |||||||
Kinetic Concepts, Inc./KCI USA, Inc., 7.875%, 02/15/21(b) | 3,216,000 | 3,400,920 | ||||||
Teleflex, Inc., 5.250%, 06/15/24 | 1,078,000 | 1,103,603 | ||||||
|
| |||||||
| 4,504,523 | ||||||||
|
| |||||||
Healthcare-Services 6.6% | ||||||||
Centene Escrow Corp., 5.625%, 02/15/21(b) | 3,535,000 | 3,685,237 | ||||||
Centene Escrow Corp., | 760,000 | 799,900 | ||||||
CHS/Community Health Systems, Inc., 5.125%, 08/15/18 | 1,260,000 | 1,269,450 | ||||||
CHS/Community Health Systems, Inc., 6.875%, 02/01/22(f) | 2,075,000 | 1,872,688 | ||||||
CHS/Community Health Systems, Inc., 8.000%, 11/15/19(f) | 3,160,000 | 3,077,050 | ||||||
HCA Holdings, Inc., 6.250%, 02/15/21 | 2,548,000 | 2,739,100 | ||||||
HCA, Inc., 5.250%, 06/15/26 | 2,085,000 | 2,137,125 | ||||||
HCA, Inc., 6.500%, 02/15/20 | 3,195,000 | 3,506,512 | ||||||
inVentiv Health, Inc., | 2,735,000 | 2,823,888 | ||||||
Kindred Healthcare, Inc., 8.000%, 01/15/20 | 2,405,000 | 2,386,963 | ||||||
Tenet Healthcare Corp., 6.000%, 10/01/20 | 3,575,000 | 3,807,375 | ||||||
Tenet Healthcare Corp., 6.750%, 06/15/23 | 5,170,000 | 4,950,275 | ||||||
Tenet Healthcare Corp., 8.000%, 08/01/20(f) | 595,000 | 612,106 | ||||||
WellCare Health Plans, Inc., 5.750%, 11/15/20 | 1,250,000 | 1,293,750 | ||||||
|
| |||||||
| 34,961,419 | ||||||||
|
| |||||||
Home Builders 1.9% | ||||||||
DR Horton, Inc., 4.000%, 02/15/20 | 1,895,000 | 1,951,850 | ||||||
Lennar Corp., 4.750%, 04/01/21 | 2,022,000 | 2,047,275 | ||||||
PulteGroup, Inc., 4.250%, 03/01/21 | 2,187,000 | 2,219,805 | ||||||
Shea Homes LP/Shea Homes Funding Corp., 5.875%, 04/01/23(b) | 1,755,000 | 1,730,869 | ||||||
| Shares or Principal Amount($) | Value($) | |||||||
Home Builders—continued | ||||||||
Shea Homes LP/Shea Homes Funding Corp., 6.125%, 04/01/25(b) | 1,755,000 | 1,719,900 | ||||||
Taylor Morrison Communities, Inc./Monarch Communities, Inc., 5.250%, 04/15/21(b) | 595,000 | 583,100 | ||||||
|
| |||||||
| 10,252,799 | ||||||||
|
| |||||||
Household Products/Wares 0.3% |
| |||||||
Century Intermediate Holding Co. 2, PIK, 9.750%, 02/15/19(b) | 1,368,000 | 1,390,230 | ||||||
|
| |||||||
Insurance 1.7% | ||||||||
Assured Guaranty US Holdings, Inc., Series A, 6.400%, 12/15/66(a)(e) | 337,000 | 232,530 | ||||||
Radian Group, Inc., 5.500%, 06/01/19 | 3,549,000 | 3,611,107 | ||||||
Radian Group,Inc., 7.000%, 03/15/21 | 1,617,000 | 1,674,404 | ||||||
Sirius International Group Ltd., | 3,570,000 | 3,525,375 | ||||||
|
| |||||||
| 9,043,416 | ||||||||
|
| |||||||
Iron/Steel 0.3% | ||||||||
Steel Dynamics, Inc., 5.125%, 10/01/21 | 1,380,000 | 1,393,800 | ||||||
|
| |||||||
Leisure Time 0.7% | ||||||||
NCL Corp. Ltd., 5.250%, 11/15/19(b) | 1,285,000 | 1,310,700 | ||||||
Viking Cruises Ltd., 8.500%, 10/15/22(b) | 2,825,000 | 2,669,625 | ||||||
|
| |||||||
| 3,980,325 | ||||||||
|
| |||||||
Lodging 0.8% | ||||||||
Downstream Development Authority of the Quapaw Tribe of Oklahoma, 10.500%, 07/01/19(b)(g) | 2,690,000 | 2,555,500 | ||||||
MGM Resorts International, 6.000%, 03/15/23(f) | 1,485,000 | 1,536,975 | ||||||
|
| |||||||
| 4,092,475 | ||||||||
|
| |||||||
Media 7.0% | ||||||||
Altice Financing SA, | 2,655,000 | 2,701,462 | ||||||
Altice Financing SA, | 2,510,000 | 2,516,275 | ||||||
Altice Finco SA, 7.625%, 02/15/25(b) | 1,675,000 | 1,603,813 | ||||||
Altice Luxembourg SA, 7.750%, 05/15/22(b) | 1,625,000 | 1,599,130 | ||||||
See Notes to Financial Statements.
71
Table of Contents
SCHEDULES OF PORTFOLIO INVESTMENTS
RIDGEWORTH FUNDS March 31, 2016
Seix High Yield Fund — continued
| Shares or Principal Amount($) | Value($) | |||||||
Media—continued | ||||||||
Cablevision Systems Corp., 8.000%, 04/15/20 | 2,140,000 | 2,075,800 | ||||||
CCO Holdings LLC/Cap Corp., 5.750%, 09/01/23 | 2,485,000 | 2,578,187 | ||||||
Clear Channel Worldwide Holdings, Inc., Series B, 6.500%, 11/15/22 | 2,265,000 | 2,253,675 | ||||||
DISH DBS Corp., 5.125%, 05/01/20 | 4,600,000 | 4,565,500 | ||||||
DISH DBS Corp., 6.750%, 06/01/21 | 2,335,000 | 2,410,888 | ||||||
DISH DBS Corp., 7.875%, 09/01/19 | 500,000 | 550,000 | ||||||
Lee Enterprises, Inc., | 2,590,000 | 2,547,912 | ||||||
McGraw-Hill Global Education Holdings LLC/McGraw-Hill Global Education Finance, 9.750%, 04/01/21 | 2,790,000 | 3,027,150 | ||||||
Numericable-SFR, 6.000%, 05/15/22(b) | 2,615,000 | 2,549,625 | ||||||
Univision Communications, Inc., 5.125%, 05/15/23(b) | 1,655,000 | 1,646,725 | ||||||
Univision Communications, Inc., 6.750%, 09/15/22(b) | 1,495,000 | 1,584,700 | ||||||
VTR Finance BV, 6.875%, 01/15/24(b) | 2,000,000 | 1,950,000 | ||||||
Ziggo Bond Finance BV, 5.875%, 01/15/25(b) | 815,000 | 798,700 | ||||||
|
| |||||||
| 36,959,542 | ||||||||
|
| |||||||
Mining 0.8% | ||||||||
FMG Resources August 2006 Pty Ltd., 9.750%, 03/01/22(b)(f) | 2,140,000 | 2,134,650 | ||||||
Imperial Metals Corp., | 2,314,000 | 2,013,180 | ||||||
|
| |||||||
| 4,147,830 | ||||||||
|
| |||||||
Miscellaneous Manufacturer 1.2% |
| |||||||
Bombardier, Inc., 7.500%, 03/15/18(b)(f) | 6,640,000 | 6,540,400 | ||||||
|
| |||||||
Office/Business Equipment 0.2% |
| |||||||
CDW LLC/CDW Finance Corp., 6.000%, 08/15/22 | 1,230,000 | 1,299,950 | ||||||
|
| |||||||
Oil & Gas 9.1% | ||||||||
Antero Resources Corp., 6.000%, 12/01/20 | 4,480,000 | 4,256,000 | ||||||
Atwood Oceanics, Inc., 6.500%, 02/01/20(f) | 2,933,000 | 1,393,175 | ||||||
| Shares or Principal Amount($) | Value($) | |||||||
Oil & Gas—continued | ||||||||
Carrizo Oil & Gas, Inc., 7.500%, 09/15/20(f) | 3,080,000 | 2,872,100 | ||||||
Chesapeake Energy Corp., 5.750%, 03/15/23(f) | 4,725,000 | 1,606,500 | ||||||
Chesapeake Energy Corp., 6.625%, 08/15/20(f) | 855,000 | 333,450 | ||||||
Chesapeake Energy Corp., 6.875%, 11/15/20 | 4,625,000 | 1,815,313 | ||||||
CITGO Petroleum Corp., 6.250%, 08/15/22(b) | 1,670,000 | 1,611,550 | ||||||
Concho Resources, Inc., 7.000%, 01/15/21 | 920,000 | 929,200 | ||||||
Continental Resources, Inc., 5.000%, 09/15/22 | 1,190,000 | 1,025,631 | ||||||
Continental Resources, Inc., 7.125%, 04/01/21 | 70,000 | 65,450 | ||||||
Diamondback Energy, Inc., 7.625%, 10/01/21(f) | 1,440,000 | 1,483,200 | ||||||
EP Energy LLC/Everest Acquisition Finance, Inc., 9.375%, 05/01/20 | 915,000 | 461,503 | ||||||
Hilcorp Energy I LP/Hilcorp Finance Co., 5.000%, 12/01/24(b) | 2,810,000 | 2,367,425 | ||||||
Hilcorp Energy I LP/Hilcorp Finance Co., 7.625%, 04/15/21(b)(f) | 3,065,000 | 2,919,412 | ||||||
Oasis Petroleum, Inc., | 1,925,000 | 1,467,813 | ||||||
Offshore Drilling Holding SA, 8.375%, 09/20/20(b) | 2,020,000 | 964,550 | ||||||
PBF Holding Co. LLC/PBF Finance Corp., 7.000%, 11/15/23(b) | 1,745,000 | 1,655,569 | ||||||
Petrobras Global Finance BV, 5.625%, 05/20/43 | 2,335,000 | 1,517,750 | ||||||
Precision Drilling Corp., 5.250%, 11/15/24 | 2,167,000 | 1,533,153 | ||||||
Precision Drilling Corp., 6.625%, 11/15/20 | 1,491,588 | 1,193,270 | ||||||
Range Resources Corp., 5.750%, 06/01/21 | 2,860,000 | 2,523,950 | ||||||
Rice Energy, Inc., 6.250%, 05/01/22 | 430,000 | 374,100 | ||||||
Rice Energy, Inc., 7.250%, 05/01/23 | 2,200,000 | 1,925,000 | ||||||
Rowan Cos., Inc., 5.000%, 09/01/17 | 1,640,000 | 1,578,807 | ||||||
RSP Permian, Inc., 6.625%, 10/01/22 | 1,865,000 | 1,837,025 | ||||||
See Notes to Financial Statements.
72
Table of Contents
SCHEDULES OF PORTFOLIO INVESTMENTS
RIDGEWORTH FUNDS March 31, 2016
Seix High Yield Fund — continued
| Shares or Principal Amount($) | Value($) | |||||||
Oil & Gas—continued | ||||||||
Seven Generations Energy Ltd., 6.750%, 05/01/23(b)(f) | 2,858,000 | 2,693,665 | ||||||
Southwestern Energy Co., 4.050%, 01/23/20 | 1,720,000 | 1,247,000 | ||||||
Southwestern Energy Co., 7.500%, 02/01/18(f) | 3,215,000 | 2,692,562 | ||||||
Whiting Petroleum Corp., 5.000%, 03/15/19 | 780,000 | 540,150 | ||||||
WPX Energy, Inc., 5.250%, 01/15/17(f) | 1,290,000 | 1,270,650 | ||||||
|
| |||||||
| 48,154,923 | ||||||||
|
| |||||||
Oil & Gas Services 0.8% |
| |||||||
FTS International, Inc., | 1,755,000 | 1,183,728 | ||||||
KCA Deutag UK Finance PLC, 7.250%, 05/15/21(e) | 2,670,000 | 1,668,750 | ||||||
Oceaneering International, Inc., 4.650%, 11/15/24 | 1,440,000 | 1,240,127 | ||||||
|
| |||||||
| 4,092,605 | ||||||||
|
| |||||||
Pharmaceuticals 2.5% |
| |||||||
Endo Finance LLC/Endo Finco, Inc., 7.750%, 01/15/22(b) | 1,370,000 | 1,397,414 | ||||||
Endo Finance LLC/Endo Ltd./Endo Finco, Inc., 6.000%, 07/15/23(b) | 4,025,000 | 3,788,531 | ||||||
Valeant Pharmaceuticals International, 6.750%, 08/15/21(b) | 1,680,000 | 1,369,200 | ||||||
Valeant Pharmaceuticals International, 7.000%, 10/01/20(b) | 2,900,000 | 2,436,000 | ||||||
Valeant Pharmaceuticals International, Inc., 6.750%, 08/15/18(b)(f) | 4,605,000 | 4,179,037 | ||||||
|
| |||||||
| 13,170,182 | ||||||||
|
| |||||||
Pipelines 5.2% |
| |||||||
Crestwood Midstream Partners LP/Crestwood Midstream Finance Corp., 6.125%, 03/01/22 | 3,725,000 | 2,793,750 | ||||||
DCP Midstream Operating LP, 2.500%, 12/01/17 | 2,040,000 | 1,943,114 | ||||||
Energy Transfer Equity LP, 7.500%, 10/15/20 | 2,095,000 | 2,016,437 | ||||||
Kinder Morgan Energy Partners LP, 9.000%, 02/01/19 | 3,420,000 | 3,881,392 | ||||||
Rockies Express Pipeline LLC, 6.000%, 01/15/19(b) | 2,650,000 | 2,583,750 | ||||||
| Shares or Principal Amount($) | Value($) | |||||||
Pipelines—continued |
| |||||||
Rockies Express Pipeline LLC, 6.850%, 07/15/18(b) | 1,105,000 | 1,102,238 | ||||||
Sabine Pass Liquefaction LLC, 5.625%, 02/01/21 | 7,085,000 | 6,810,456 | ||||||
Sabine Pass Liquefaction LLC, 5.625%, 04/15/23 | 1,515,000 | 1,439,250 | ||||||
Targa Resources Partners LP/Targa Resources Partners Finance Corp., 5.000%, 01/15/18 | 535,000 | 533,663 | ||||||
Targa Resources Partners LP/Targa Resources Partners Finance Corp., 5.250%, 05/01/23 | 989,000 | 912,353 | ||||||
Tesoro Logistics LP/Tesoro Logistics Finance Corp., 5.500%, 10/15/19(b) | 2,591,000 | 2,578,045 | ||||||
Williams Cos., Inc. (The), 5.750%, 06/24/44 | 1,590,000 | 1,057,350 | ||||||
|
| |||||||
| 27,651,798 | ||||||||
|
| |||||||
Private Equity 0.7% |
| |||||||
Icahn Enterprises LP/Icahn Enterprises Finance Corp., 6.000%, 08/01/20 | 4,005,000 | 3,894,862 | ||||||
|
| |||||||
Real Estate 1.8% |
| |||||||
Greystar Real Estate Partners LLC, 8.250%, 12/01/22(b) | 326,000 | 336,595 | ||||||
Howard Hughes Corp. (The), 6.875%, 10/01/21(b) | 7,195,000 | 7,087,075 | ||||||
Realogy Group LLC/Realogy Co-Issuer Corp., 5.250%, 12/01/21(b)(f) | 1,935,000 | 1,997,887 | ||||||
|
| |||||||
| 9,421,557 | ||||||||
|
| |||||||
Real Estate Investment Trust 2.1% |
| |||||||
iStar, Inc., 5.000%, 07/01/19 | 1,100,000 | 1,056,000 | ||||||
iStar, Inc., 6.500%, 07/01/21 | 2,900,000 | 2,823,875 | ||||||
iStar, Inc., 7.125%, 02/15/18 | 5,030,000 | 5,092,875 | ||||||
iStar, Inc., 9.000%, 06/01/17 | 1,990,000 | 2,069,600 | ||||||
|
| |||||||
| 11,042,350 | ||||||||
|
| |||||||
Retail 2.0% | ||||||||
Guitar Center, Inc., | 2,893,000 | 2,603,700 | ||||||
Limited Brands, Inc., 6.625%, 04/01/21 | 1,135,000 | 1,276,762 | ||||||
Men’s Wearhouse, Inc. (The), 7.000%, 07/01/22 | 1,785,000 | 1,512,787 | ||||||
Rite Aid Corp., 6.125%, 04/01/23(b) | 3,175,000 | 3,365,500 | ||||||
See Notes to Financial Statements.
73
Table of Contents
SCHEDULES OF PORTFOLIO INVESTMENTS
RIDGEWORTH FUNDS March 31, 2016
Seix High Yield Fund — continued
| Shares or Principal Amount($) | Value($) | |||||||
Retail—continued | ||||||||
Toys R Us Property Co. II LLC, 8.500%, 12/01/17 | 2,120,000 | 2,067,000 | ||||||
|
| |||||||
| 10,825,749 | ||||||||
|
| |||||||
Semiconductors 0.5% |
| |||||||
Micron Technology, Inc., 5.625%, 01/15/26(b) | 1,855,000 | 1,465,450 | ||||||
Micron Technology, Inc., 5.875%, 02/15/22 | 1,110,000 | 960,150 | ||||||
|
| |||||||
| 2,425,600 | ||||||||
|
| |||||||
Software 0.4% |
| |||||||
First Data Corp., 6.750%, 11/01/20(b) | 2,020,000 | 2,124,030 | ||||||
|
| |||||||
Telecommunication Services 8.1% |
| |||||||
Avaya, Inc., 7.000%, 04/01/19(b)(f) | 750,000 | 506,250 | ||||||
Avaya, Inc., 9.000%, 04/01/19(b) | 1,385,000 | 934,875 | ||||||
CenturyLink, Inc., Series Y, 7.500%, 04/01/24(c) | 1,995,000 | 1,999,987 | ||||||
DigitalGlobe, Inc., 5.250%, 02/01/21(e) | 1,450,000 | 1,319,500 | ||||||
Intelsat Jackson Holdings SA, 8.000%, 02/15/24(b)(f) | 2,632,000 | 2,710,960 | ||||||
Level 3 Financing, Inc., 6.125%, 01/15/21 | 5,500,000 | 5,761,250 | ||||||
Sprint Capital Corp., | 2,430,000 | 1,901,475 | ||||||
Sprint Communications, Inc., 7.000%, 03/01/20(b)(f) | 2,590,000 | 2,590,000 | ||||||
Sprint Communications, Inc., 9.000%, 11/15/18(b) | 2,430,000 | 2,545,425 | ||||||
Sprint Communications, Inc., 11.500%, 11/15/21 | 3,740,000 | 3,328,600 | ||||||
Sprint Corp., 7.875%, 09/15/23 | 2,995,000 | 2,290,546 | ||||||
T-Mobile USA, Inc., 6.500%, 01/15/24 | 1,930,000 | 2,007,200 | ||||||
T-Mobile USA, Inc., 6.542%, 04/28/20 | 1,655,000 | 1,708,787 | ||||||
T-Mobile USA, Inc., 6.633%, 04/28/21 | 4,865,000 | 5,083,925 | ||||||
ViaSat, Inc., 6.875%, 06/15/20 | 5,285,000 | 5,489,794 | ||||||
West Corp., 5.375%, 07/15/22(b) | 585,000 | 536,621 | ||||||
Wind Acquisition Finance SA, 7.375%, 04/23/21(b) | 2,560,000 | 2,316,800 | ||||||
|
| |||||||
| 43,031,995 | ||||||||
|
| |||||||
Transportation 1.5% | ||||||||
Eletson Holdings, 9.625%, 01/15/22(e) | 2,070,000 | 1,614,600 | ||||||
| Shares or Principal Amount($) | Value($) | |||||||
Transportation—continued | ||||||||
Florida East Coast Holdings Corp., 6.750%, 05/01/19(b) | 3,035,000 | 3,035,000 | ||||||
Hornbeck Offshore Services, Inc., 1.500%, 09/01/19 | 1,775,000 | 1,052,797 | ||||||
Hornbeck Offshore Services, Inc., 5.000%, 03/01/21(e) | 4,045,000 | 2,427,000 | ||||||
|
| |||||||
| 8,129,397 | ||||||||
|
| |||||||
Total Corporate Bonds | 466,622,597 | |||||||
|
| |||||||
| Convertible Preferred Stock 0.2% | ||||||||
Telecommunication Services 0.2% |
| |||||||
T-Mobile US, Inc., 5.500%, 12/15/17 | 14,325 | 948,315 | ||||||
|
| |||||||
Total Convertible Preferred Stock |
| 948,315 | ||||||
|
| |||||||
| Common Stock 0.2% | ||||||||
Telecommunication Services 0.2% |
| |||||||
NII Holding, Inc.*(f) | 174,597 | 965,521 | ||||||
|
| |||||||
Total Common Stock | 965,521 | |||||||
|
| |||||||
Money Market Funds 16.3% |
| |||||||
State Street Institutional Treasury Money Market Fund, Institutional Class, | 39,832,036 | 39,832,036 | ||||||
State Street Institutional U.S. Government Money Market Fund, Institutional Class, 0.24%(i)(j) | 46,697,565 | 46,697,565 | ||||||
|
| |||||||
Total Money Market Funds | 86,529,601 | |||||||
|
| |||||||
Total Investments |
| 575,599,309 | ||||||
Liabilities in Excess of Other | (44,357,233 | ) | ||||||
|
| |||||||
Net Assets — 100.0% | $ | 531,242,076 | ||||||
|
| |||||||
| * | Non-income producing security. |
| (a) | Variable or floating rate security. Rate disclosed is as of March 31, 2016. |
| (b) | Rule 144A, Section 4(2) or other security which is restricted as to resale to institutional investors. The Fund’s investment adviser/subadviser has deemed this security to be liquid based upon procedures approved by the Board of Trustees. These securities represent 40.2% of net assets as of March 31, 2016. |
| (c) | All or a portion of this security has been purchased on a when-issued or delayed-delivery basis. |
| (d) | Security is in default. |
See Notes to Financial Statements.
74
Table of Contents
SCHEDULES OF PORTFOLIO INVESTMENTS
RIDGEWORTH FUNDS March 31, 2016
Seix High Yield Fund — concluded
| (e) | The Fund’s investment adviser/subadviser has deemed this security to be illiquid based upon procedures approved by the Board of Trustees. These securities represent 3.9% of net assets as of March 31, 2016. |
| (f) | The security or a partial position of the security was on loan as of March 31, 2016. The total value of securities on loan as of March 31, 2016 was $46,040,107. |
| (g) | All or a portion of this security has been segregated, or otherwise earmarked, in connection with obligations for when-issued or delayed-delivery purchase commitments. |
| (h) | Perpetual maturity. |
| (i) | Rate disclosed, the 7 day yield, is as of March 31, 2016. |
| (j) | Purchased with cash collateral held from securities lending. The total value of the collateral held by the Fund was $47,835,215. The total value of the collateral includes non-cash U.S. Government securities collateral having a value of $1,137,650. The value of the collateral could include collateral held for securities that were sold on or before March 31, 2016 (See Note 2(k)). |
Investment Abbreviations
| MTN | — | Medium Term Note | ||
| PIK | — | Payment in-kind |
See Notes to Financial Statements.
75
Table of Contents
SCHEDULES OF PORTFOLIO INVESTMENTS
RIDGEWORTH FUNDS March 31, 2016
Seix Investment Grade Tax-Exempt Bond Fund
| Shares or Principal Amount($) | Value($) | |||||||
| Municipal Bonds 88.5% | ||||||||
Alabama 2.5% | ||||||||
Birmingham, Series A, GO, 0.000%, 03/01/27(a) | 2,500,000 | 2,778,775 | ||||||
Birmingham, Series A, GO, 0.000%, 03/01/37(a) | 3,000,000 | 3,202,140 | ||||||
Birmingham Special Care Facilities Financing Authority Health Care Facilities, Children’s Hospital of Alabama, RB, 6.000%, 06/01/39, | 9,000,000 | 10,378,710 | ||||||
|
| |||||||
| 16,359,625 | ||||||||
|
| |||||||
Alaska 7.2% | ||||||||
Matanuska-Susitna Borough Lease, Goose Creek Correctional Center, RB, 5.500%, 09/01/23, AGC(b) | 18,000,000 | 20,602,800 | ||||||
Matanuska-Susitna Borough Lease, Goose Creek Correctional Center, RB, 6.000%, 09/01/28, Pre-refunded 09/01/2019 @ 100, AGC | 9,850,000 | 11,521,840 | ||||||
Matanuska-Susitna Borough Lease, Goose Creek Correctional Center, RB, 6.000%, 09/01/28, AGC | 5,650,000 | 6,578,521 | ||||||
Matanuska-Susitna Borough Lease, Goose Creek Correctional Center, RB, 6.000%, 09/01/32, AGC | 7,250,000 | 8,480,543 | ||||||
|
| |||||||
| 47,183,704 | ||||||||
|
| |||||||
Arizona 1.4% | ||||||||
Salt River Project Agricultural Improvement & Power District, Series A, RB, 5.000%, 12/01/36 | 7,500,000 | 8,966,175 | ||||||
|
| |||||||
California 17.9% | ||||||||
California Health Facilities Financing Authority, Series C, RB, 6.250%, 10/01/24 | 3,500,000 | 3,977,750 | ||||||
California Health Facilities Financing Authority, Series C, RB, 6.500%, 10/01/38(b) | 5,400,000 | 6,164,694 | ||||||
California Infrastructure & Economic Development Bank, RB, 5.000%, 11/01/35 | 2,000,000 | 2,347,940 | ||||||
| Shares or Principal Amount($) | Value($) | |||||||
California—continued | ||||||||
California State, GO, 4.000%, 09/01/35 | 1,800,000 | 1,976,886 | ||||||
California State, GO, 4.000%, 09/01/36 | 1,000,000 | 1,093,560 | ||||||
California State, GO, 5.000%, 08/01/35 | 1,000,000 | 1,197,720 | ||||||
California State, GO, 5.000%, 09/01/35 | 5,000,000 | 6,088,750 | ||||||
California State, GO, 5.000%, 09/01/36 | 2,000,000 | 2,425,340 | ||||||
California State, GO, 5.000%, 09/01/45 | 6,980,000 | 8,331,119 | ||||||
California State, GO, | 24,500,000 | 28,567,735 | ||||||
California State, Series C, GO, 5.000%, 09/01/32 | 9,950,000 | 12,099,896 | ||||||
Los Angeles California Wastewater System, Series A, RB, 5.750%, 06/01/34 | 2,225,000 | 2,544,243 | ||||||
Los Angeles California Wastewater System, Series A, RB, 5.750%, 06/01/34, Pre-refunded | 2,775,000 | 3,201,129 | ||||||
Los Angeles County Regional Financing Authority, Series B-2, RB, 3.000%, 11/15/20, CA MTG INS | 1,500,000 | 1,503,315 | ||||||
San Diego Redevelopment Agency Successor Agency, Series A, 5.000%, 09/01/27 | 500,000 | 625,720 | ||||||
San Francisco City & County Airports Commission, AMT, RB, 5.750%, 05/01/24, AGM | 5,000,000 | 5,509,550 | ||||||
Santa Clara Valley Water District, Series A, RB, 5.000%, 06/01/46 | 4,000,000 | 4,759,280 | ||||||
University of California, Series A, RB, 5.000%, 11/01/31(c) | 3,000,000 | 3,697,650 | ||||||
University of California, Series O, RB, 5.750%, 05/15/27 | 3,000,000 | 3,457,500 | ||||||
University of California, Series O, RB, 5.750%, 05/15/28(b) | 10,000,000 | 11,525,000 | ||||||
University of California, Series O, RB, 5.750%, 05/15/29(b) | 5,095,000 | 5,871,988 | ||||||
|
| |||||||
| 116,966,765 | ||||||||
|
| |||||||
See Notes to Financial Statements.
76
Table of Contents
SCHEDULES OF PORTFOLIO INVESTMENTS
RIDGEWORTH FUNDS March 31, 2016
Seix Investment Grade Tax-Exempt Bond Fund — continued
| Shares or Principal Amount($) | Value($) | |||||||
Delaware 0.3% | ||||||||
Delaware Transportation Authority, RB, 5.000%, 06/01/45 | 1,750,000 | 2,034,708 | ||||||
|
| |||||||
District of Columbia 1.4% | ||||||||
District of Columbia, Income Tax, Series A, RB, 5.500%, 12/01/30(b) | 8,000,000 | 9,309,520 | ||||||
|
| |||||||
Florida 5.0% | ||||||||
Florida State, Series D, GO, 5.000%, 06/01/18 | 5,000,000 | 5,456,350 | ||||||
Miami Beach Redevelopment Agency, 5.000%, 02/01/34 | 1,470,000 | 1,701,598 | ||||||
Miami-Dade County, Building Better Communities Program, Series B, GO, 6.000%, 07/01/23 | 2,000,000 | 2,227,640 | ||||||
Miami-Dade County, Building Better Communities Program, Series B, GO, 6.125%, 07/01/25 | 3,000,000 | 3,349,800 | ||||||
Orlando FL Contract Tourist DE, Series A, RB, 5.250%, 11/01/34 | 3,785,000 | 4,533,257 | ||||||
South Florida Water Management District, COP, 5.000%, 10/01/36 | 4,000,000 | 4,766,760 | ||||||
Tampa Bay Water, Series A, RB, 5.000%, 10/01/36 | 3,760,000 | 4,538,433 | ||||||
Tampa Bay Water, Series A, RB, 5.000%, 10/01/37 | 4,000,000 | 4,807,880 | ||||||
Tampa FL Health System Revenue, Series A, RB, 4.000%, 11/15/46(c) | 1,000,000 | 1,041,450 | ||||||
|
| |||||||
| 32,423,168 | ||||||||
|
| |||||||
Georgia 4.7% | ||||||||
Georgia State, Series A, GO, 5.000%, 01/01/26 | 5,000,000 | 6,104,950 | ||||||
Gwinnett County School District, GO, 5.000%, 02/01/35 | 11,000,000 | 13,378,420 | ||||||
Sandy Springs Public Facilities Authority, RB, 5.000%, 05/01/41 | 9,660,000 | 11,553,070 | ||||||
|
| |||||||
| 31,036,440 | ||||||||
|
| |||||||
Guam 0.2% | ||||||||
Guam Power Authority, Series A, RB, 5.000%, 10/01/28 | 1,000,000 | 1,153,940 | ||||||
|
| |||||||
| Shares or Principal Amount($) | Value($) | |||||||
Hawaii 2.7% | ||||||||
Hawaii State, Series EE, GO, 5.000%, 11/01/29 | 6,750,000 | 8,050,455 | ||||||
University of Hawaii, Series E, RB, 5.000%, 10/01/32(c) | 8,000,000 | 9,915,040 | ||||||
|
| |||||||
| 17,965,495 | ||||||||
|
| |||||||
Illinois 3.2% | ||||||||
Chicago O’Hare International Airport, AMT, RB, 4.000%, 01/01/27 | 2,730,000 | 2,885,746 | ||||||
Chicago O’Hare International Airport, RB, 5.000%, 01/01/31 | 9,080,000 | 10,744,092 | ||||||
Chicago O’Hare International Airport, Series B, RB, 5.000%, 01/01/33 | 4,080,000 | 4,785,962 | ||||||
University of Illinois, Auxiliary Facilities System, Series A, RB, 5.750%, 04/01/38 | 2,000,000 | 2,282,000 | ||||||
|
| |||||||
| 20,697,800 | ||||||||
|
| |||||||
Kansas 4.9% | ||||||||
Kansas State Development Finance Authority, Adventist Bolingbrook Hospital, RB, 5.750%, 11/15/38(b) | 26,090,000 | 29,964,626 | ||||||
Kansas State Development Finance Authority, Adventist Bolingbrook Hospital, Series D, RB, 5.000%, 11/15/22 | 2,000,000 | 2,129,980 | ||||||
|
| |||||||
| 32,094,606 | ||||||||
|
| |||||||
Maryland 2.7% | ||||||||
Maryland State, Series A, GO, 5.000%, 03/01/24 | 3,640,000 | 4,306,156 | ||||||
Maryland State, Series B, GO, 5.000%, 08/01/25 | 5,920,000 | 7,216,599 | ||||||
Montgomery County, Series A, GO, 5.000%, 11/01/27 | 5,000,000 | 6,262,600 | ||||||
|
| |||||||
| 17,785,355 | ||||||||
|
| |||||||
Massachusetts 4.6% | ||||||||
Commonwealth of Massachusetts, Series A, GO, 5.000%, 04/01/25 | 5,520,000 | 6,532,092 | ||||||
Massachusetts School Building Authority, Series C, RB, 5.000%, 08/15/36 | 5,000,000 | 5,973,900 | ||||||
Massachusetts State, Series A, GO, 5.000%, 07/01/30 | 2,525,000 | 3,165,264 | ||||||
Massachusetts State, Series A, GO, 5.000%, 07/01/31 | 2,500,000 | 3,113,150 | ||||||
See Notes to Financial Statements.
77
Table of Contents
SCHEDULES OF PORTFOLIO INVESTMENTS
RIDGEWORTH FUNDS March 31, 2016
Seix Investment Grade Tax-Exempt Bond Fund — continued
| Shares or Principal Amount($) | Value($) | |||||||
Massachusetts—continued | ||||||||
Massachusetts State, Series A, GO, 5.000%, 07/01/32 | 2,000,000 | 2,476,100 | ||||||
Massachusetts State College Building Authority, Series B, RB, 5.000%, 05/01/34, ST INTERCEPT | 4,045,000 | 4,771,158 | ||||||
Massachusetts State College Building Authority, Series B, RB, 5.000%, 05/01/39, ST INTERCEPT | 3,250,000 | 3,771,593 | ||||||
|
| |||||||
| 29,803,257 | ||||||||
|
| |||||||
Michigan 2.9% | ||||||||
Michigan Finance Authority, RB, 5.000%, 07/01/21 | 14,000,000 | 15,325,100 | ||||||
University of Michigan, RB, 5.000%, 04/01/36 | 3,000,000 | 3,651,090 | ||||||
|
| |||||||
| 18,976,190 | ||||||||
|
| |||||||
Missouri 1.2% | ||||||||
Metropolitan St Louis Sewer District, Series B, RB, 5.000%, 05/01/35 | 1,500,000 | 1,811,130 | ||||||
Metropolitan St Louis Sewer District, Series B, RB, 5.000%, 05/01/36 | 5,000,000 | 6,010,000 | ||||||
|
| |||||||
| 7,821,130 | ||||||||
|
| |||||||
New York 10.9% | ||||||||
Erie County Industrial Development Agency, City School District Buffalo, Series A, RB, 5.750%, 05/01/29, BHAC-CR-AGM | 5,340,000 | 5,889,700 | ||||||
New York City Municipal Water Finance Authority, Water & Sewer System, Series A, RB, 5.750%, 06/15/40(b) | 15,330,000 | 16,936,584 | ||||||
New York City Transitional Finance Authority, Building Aid, Series S-2, RB, 6.000%, 07/15/38, State Aid Withholding(b) | 7,500,000 | 8,342,325 | ||||||
New York City Transitional Finance Authority Future Tax Secured Revenue, RB, 5.000%, 02/01/28 | 5,000,000 | 5,384,200 | ||||||
New York City Transitional Finance Authority Future Tax Secured Revenue, Series E-1, RB, 5.000%, 02/01/35 | 3,500,000 | 4,217,850 | ||||||
| Shares or Principal Amount($) | Value($) | |||||||
New York—continued | ||||||||
New York City Transitional Finance Authority Future Tax Secured Revenue, Series E-1, RB, 5.000%, 02/01/37 | 8,000,000 | 9,571,840 | ||||||
New York City Transitional Finance Authority Future Tax Secured Revenue, Series E-1, RB, 5.000%, 02/01/39 | 7,000,000 | 8,315,510 | ||||||
New York State Dormitory Authority, Series A, RB, 5.000%, 03/15/28 | 2,500,000 | 3,077,550 | ||||||
Utility Debt Securitization Authority, RB, 5.000%, 12/15/37 | 8,000,000 | 9,667,840 | ||||||
|
| |||||||
| 71,403,399 | ||||||||
|
| |||||||
North Carolina 0.3% | ||||||||
North Carolina State, Series C, GO, 5.000%, 05/01/18 | 1,880,000 | 2,046,361 | ||||||
|
| |||||||
Ohio 0.8% | ||||||||
Ohio State Water Development Authority Water Pollution Control Revenue, Series B, 5.000%, 12/01/28 | 4,140,000 | 5,219,008 | ||||||
|
| |||||||
Pennsylvania 2.8% | ||||||||
Pennsylvania Economic Development Financing Authority, RB, 5.000%, 07/01/21 | 7,500,000 | 8,046,225 | ||||||
University of Pittsburgh, Commonwealth System of Higher Education, Series B, RB, 5.500%, 09/15/23, GO of University | 6,750,000 | 7,654,770 | ||||||
University of Pittsburgh, Commonwealth System of Higher Education, Series B, RB, 5.500%, 09/15/24, GO of University | 2,500,000 | 2,832,750 | ||||||
|
| |||||||
| 18,533,745 | ||||||||
|
| |||||||
Tennessee 0.4% | ||||||||
Metropolitan Government Nashville & Davidson County Health & Educational Facilities Board, Series A, RB, 5.000%, 07/01/40(c) | 2,000,000 | 2,304,760 | ||||||
|
| |||||||
Texas 5.1% | ||||||||
Dallas Community College District, GO, 5.000%, 02/15/24 | 5,850,000 | 6,291,967 | ||||||
See Notes to Financial Statements.
78
Table of Contents
SCHEDULES OF PORTFOLIO INVESTMENTS
RIDGEWORTH FUNDS March 31, 2016
Seix Investment Grade Tax-Exempt Bond Fund — concluded
| Shares or Principal Amount($) | Value($) | |||||||
Texas—continued | ||||||||
Dallas Independent School District, GO, 6.375%, 02/15/34, PSF-GTD(b) | 6,000,000 | 6,624,480 | ||||||
New Hope Cultural Education Facilities Financing Corp., Student Housing Corp., Series A, RB, 5.000%, 07/01/35 | 7,100,000 | 7,793,741 | ||||||
San Antonio City Water System Revenue, Series A, RB, 5.000%, 05/15/31 | 1,750,000 | 2,149,613 | ||||||
Texas State Public Finance Authority, Unemployment Comp., Series B, RB, 4.000%, 07/01/17 | 10,000,000 | 10,268,500 | ||||||
|
| |||||||
| 33,128,301 | ||||||||
|
| |||||||
Washington 5.4% | ||||||||
Energy Northwest, RB, 5.000%, 07/01/24, Pre-refunded | 965,000 | 1,054,504 | ||||||
Energy Northwest, RB, 5.000%, 07/01/24 | 3,035,000 | 3,300,138 | ||||||
Energy Northwest, Series A, RB, 5.000%, 07/01/26(c) | 3,250,000 | 4,166,077 | ||||||
Washington State, Series A, GO, 5.000%, 08/01/24 | 8,880,000 | 10,560,806 | ||||||
Washington State, Series C, GO, 5.000%, 02/01/35 | 13,500,000 | 16,268,850 | ||||||
|
| |||||||
| 35,350,375 | ||||||||
|
| |||||||
Total Municipal Bonds | 578,563,827 | |||||||
|
| |||||||
Money Market Fund 12.3% | ||||||||
Federated Tax-Free Obligations Fund, Institutional Shares, 0.14%(d) | 80,641,465 | 80,641,465 | ||||||
|
| |||||||
Total Money Market Fund | 80,641,465 | |||||||
|
| |||||||
| Shares or Principal Amount($) | Value($) | |||||
Total Investments | 659,205,292 | |||||
Liabilities in Excess of Other | (4,909,619 | ) | ||||
|
| |||||
Net Assets — 100.0% | $ | 654,295,673 | ||||
|
| |||||
| (a) | Step bond. The rate shown is the rate in effect as of March 31, 2016. |
| (b) | All or a portion of this security has been segregated, or otherwise earmarked, in connection with obligations for when-issued or delayed-delivery purchase commitments. |
| (c) | All or a portion of this security has been purchased on a when-issued or delayed-delivery basis. |
| (d) | Rate disclosed, the 7 day yield, is as of March 31, 2016. |
Investment Abbreviations
| AGC | — | Security guaranteed by Assured Guaranty Corporation | ||
| AGM | — | Security guaranteed by Assured Guaranty Municipal Corporation | ||
| AMT | — | Income subject to Alternative Minimum Tax | ||
| BHAC | — | Security guaranteed by Berkshire Hathaway Assurance Corporation | ||
| CA MTG INS | — | California Mortgage Insurance | ||
| COP | — | Certificate of Participation | ||
| CR | — | Custodial Receipts | ||
| GO | — | General Obligation | ||
| PSF-GTD | — | Security guaranteed by Permanent School Fund Guarantee Program | ||
| RB | — | Revenue Bond | ||
| ST INTERCEPT | — | State Interception |
See Notes to Financial Statements.
79
Table of Contents
SCHEDULES OF PORTFOLIO INVESTMENTS
RIDGEWORTH FUNDS March 31, 2016
Seix Limited Duration Fund
Shares or Principal Amount($) | Value($) | |||||||
| Asset-Backed Securities 24.5% | ||||||||
Automobiles 7.9% | ||||||||
Fifth Third Auto Trust, Series 2015-1, Cl A2B, 0.986%, 05/15/18(a) | 270,000 | 270,137 | ||||||
Harley-Davidson Motorcycle Trust, | 85,656 | 85,644 | ||||||
World Omni Automobile Lease Securitization Trust, Series 2014-A, Cl A2A, 0.710%, 03/15/17 | 171,295 | 171,110 | ||||||
|
| |||||||
| 526,891 | ||||||||
|
| |||||||
Credit Card 15.0% | ||||||||
American Express Issuance Trust II, Series 2013-1, Cl B, 0.886%, 02/15/19(a) | 400,000 | 398,102 | ||||||
Barclays Dryrock Issuance Trust, Series 2014-1, Cl A, 0.796%, 12/16/19(a) | 300,000 | 299,910 | ||||||
Cabela’s Credit Card Master Note Trust, Series 2014-2, Cl A, 0.886%, 07/15/22(a) | 300,000 | 295,113 | ||||||
|
| |||||||
| 993,125 | ||||||||
|
| |||||||
Student Loan Asset Backed Security 1.6% |
| |||||||
SLM Student Loan Trust, Series 2013-1, Cl A2, 0.683%, 09/25/19(a) | 109,837 | 108,484 | ||||||
|
| |||||||
Total Asset-Backed Securities | 1,628,500 | |||||||
|
| |||||||
| Collateralized Mortgage Obligations 55.4% | ||||||||
Agency Collateralized Mortgage Obligations 35.2% |
| |||||||
Federal Home Loan Mortgage Corporation | ||||||||
Series 3066, Cl FG, REMIC, | 889,726 | 892,763 | ||||||
Series 4231, Cl FD, REMIC, | 719,029 | 720,278 | ||||||
|
| |||||||
| 1,613,041 | ||||||||
|
| |||||||
Federal National Mortgage Association | ||||||||
Series 2004-79, Cl FM, 0.733%, 11/25/24(a) | 668,873 | 670,873 | ||||||
Series 2005-107, Cl PF, 0.883%, 11/25/32(a) | 40,385 | 40,396 | ||||||
Series 2010-90, Cl MF, 0.833%, 04/25/28(a) | 15,176 | 15,178 | ||||||
|
| |||||||
| 726,447 | ||||||||
|
| |||||||
Shares or Principal Amount($) | Value($) | |||||||
Commercial Mortgage Backed Securities 20.2% |
| |||||||
Federal Home Loan Mortgage Corporation | ||||||||
Series KF03, Cl A, 0.781%, 01/25/21(a) | 522,180 | 521,096 | ||||||
Series KF05, Cl A, 0.782%, 09/25/21(a) | 822,393 | 819,083 | ||||||
|
| |||||||
| 1,340,179 | ||||||||
|
| |||||||
Total Collateralized Mortgage Obligations | 3,679,667 | |||||||
|
| |||||||
U.S. Government Agency Mortgages 15.6% |
| |||||||
Federal National Mortgage Association | ||||||||
Pool #AM6261, 0.645%, 07/01/19(a) | 620,000 | 619,973 | ||||||
Pool #AM7028, 0.665%, 10/01/19(a) | 420,000 | 419,825 | ||||||
|
| |||||||
Total U.S. Government Agency Mortgages | 1,039,798 | |||||||
|
| |||||||
Money Market Fund 4.5% | ||||||||
State Street Institutional Treasury Money Market Fund, Institutional Class, 0.19%(b) | 299,524 | 299,524 | ||||||
|
| |||||||
Total Money Market Fund | 299,524 | |||||||
|
| |||||||
Total Investments | 6,647,489 | |||||||
Other Assets in Excess of Liabilities — 0.0%(c) | 1,077 | |||||||
|
| |||||||
Net Assets — 100.0% | $ | 6,648,566 | ||||||
|
| |||||||
| (a) | Variable or floating rate security. Rate disclosed is as of March 31, 2016. |
| (b) | Rate disclosed, the 7 day yield, is as of March 31, 2016. |
| (c) | Less than 0.05% of Net Assets. |
Investment Abbreviation
REMIC — Real Estate Mortgage Investment Conduit
See Notes to Financial Statements.
80
Table of Contents
SCHEDULES OF PORTFOLIO INVESTMENTS
RIDGEWORTH FUNDS March 31, 2016
Seix North Carolina Tax-Exempt Bond Fund
| Shares or Principal Amount($) | Value($) | |||||||
| Municipal Bonds 95.8% | ||||||||
Alabama 0.8% | ||||||||
Birmingham, Series A, GO, 0.000%, 03/01/32(a) | 215,000 | 233,458 | ||||||
|
| |||||||
Guam 5.4% | ||||||||
Guam Power Authority, Series A, RB, 5.000%, 10/01/44, AGM | 1,000,000 | 1,145,040 | ||||||
Guam Waterworks Authority, RB, 5.000%, 01/01/46 | 270,000 | 306,361 | ||||||
Territory of Guam, Series D, RB, 5.000%, 11/15/39 | 100,000 | 113,033 | ||||||
|
| |||||||
| 1,564,434 | ||||||||
|
| |||||||
North Carolina 86.5% | ||||||||
Buncombe County Metropolitan Sewerage District, RB, 5.000%, 07/01/39 | 1,000,000 | 1,165,020 | ||||||
Charlotte Airport Revenue, Series B, AMT, RB, 5.500%, 07/01/23 | 700,000 | 808,605 | ||||||
Charlotte Water & Sewer System, RB, 5.000%, 07/01/21 | 1,080,000 | 1,182,719 | ||||||
Charlotte Water & Sewer System, RB, 5.000%, 07/01/40 | 1,000,000 | 1,196,160 | ||||||
Charlotte-Mecklenburg Hospital Authority (The), Series A, RB, 5.250%, 01/15/42 | 1,000,000 | 1,133,980 | ||||||
Forsyth County, GO, 5.000%, 02/01/22, Pre-refunded 02/01/2019 @ 100 | 750,000 | 836,865 | ||||||
New Hanover County Hospital, New Hanover Regional Medical Center, Series B, RB, 5.125%, 10/01/31, AGM(b) | 1,000,000 | 1,106,910 | ||||||
North Carolina Capital Facilities Finance Agency, RB, 5.000%, 04/01/30 | 1,000,000 | 1,162,950 | ||||||
North Carolina Capital Facilities Finance Agency, RB, 5.250%, 03/01/33 | 1,000,000 | 1,105,010 | ||||||
North Carolina Infrastructure Finance Corp., Series A, COP, 5.000%, 02/01/24, | 1,000,000 | 1,036,960 | ||||||
North Carolina Medical Care Commission Health Care Facilities, University Health Systems, Series D, RB, | 1,500,000 | 1,712,955 | ||||||
| Shares or Principal Amount($) | Value($) | |||||||
North Carolina—continued | ||||||||
North Carolina Municipal Power Agency No. 1, Series A, RB, 5.000%, 01/01/30, Pre-refunded 01/01/2019 @ 100 | 710,000 | 789,293 | ||||||
North Carolina Municipal Power Agency No. 1, Series A, RB, 5.000%, 01/01/30 | 290,000 | 318,475 | ||||||
North Carolina State, Series A, GO, 5.000%, 06/01/17 | 1,450,000 | 1,524,283 | ||||||
North Carolina State Ports Authority Facilities, Series A, RB, 5.250%, 02/01/40(b) | 1,000,000 | 1,119,610 | ||||||
North Carolina State University at Raleigh, Series A, RB, 5.000%, 10/01/37 | 1,000,000 | 1,182,760 | ||||||
Pitt County, RB, 5.000%, 04/01/28 | 1,000,000 | 1,224,290 | ||||||
Raleigh, RB, 5.000%, 02/01/23 | 850,000 | 1,043,180 | ||||||
Raleigh Combined Enterprise System Revenue, Series B, RB, 5.000%, 12/01/24 | 1,000,000 | 1,278,740 | ||||||
University of North Carolina at Charlotte, RB, 5.000%, 04/01/45 | 1,500,000 | 1,750,545 | ||||||
Wake County, Series A, GO, 4.000%, 02/01/27 | 1,000,000 | 1,138,060 | ||||||
Western Carolina University, Student Housing Project, RB, | 1,250,000 | 1,326,775 | ||||||
|
| |||||||
| 25,144,145 | ||||||||
|
| |||||||
South Carolina 3.1% | ||||||||
South Carolina State Public Service Authority, Series A, RB, 5.750%, 12/01/43 | 750,000 | 914,977 | ||||||
|
| |||||||
Total Municipal Bonds | 27,857,014 | |||||||
|
| |||||||
Money Market Fund 3.6% | ||||||||
Federated Tax-Free Obligations Fund, Institutional Shares, 0.14%(d) | 1,042,292 | 1,042,292 | ||||||
|
| |||||||
Total Money Market Fund (Cost $1,042,292) | 1,042,292 | |||||||
|
| |||||||
Total Investments | 28,899,306 | |||||||
Other Assets in Excess of Liabilities — 0.6% | 168,825 | |||||||
|
| |||||||
Net Assets — 100.0% | $ | 29,068,131 | ||||||
|
| |||||||
See Notes to Financial Statements.
81
Table of Contents
SCHEDULES OF PORTFOLIO INVESTMENTS
RIDGEWORTH FUNDS March 31, 2016
Seix North Carolina Tax-Exempt Bond Fund — concluded
| (a) | Step bond. The rate shown is the rate in effect as of March 31, 2016. |
| (b) | All or a portion of this security has been segregated, or otherwise earmarked, in connection with obligations for when-issued or delayed-delivery purchase commitments. |
| (c) | All or a portion of this security has been purchased on a when-issued or delayed-delivery basis. |
| (d) | Rate disclosed, the 7 day yield, is as of March 31, 2016. |
Investment Abbreviations
| AGM | — | Security guaranteed by Assured Guaranty Municipal Corporation | ||
| AMT | — | Income subject to Alternative Minimum Tax | ||
| COP | — | Certificate of Participation | ||
| GO | — | General Obligation | ||
| RB | — | Revenue Bond |
See Notes to Financial Statements.
82
Table of Contents
SCHEDULES OF PORTFOLIO INVESTMENTS
RIDGEWORTH FUNDS March 31, 2016
Seix Short-Term Bond Fund
| Shares or Principal Amount($) | Value($) | |||||||
| Asset-Backed Securities 9.0% | ||||||||
Automobiles 0.7% | ||||||||
AmeriCredit Automobile Receivables Trust 2014-2, Series 2014-2, Cl B, 1.600%, 07/08/19 | 110,000 | 109,796 | ||||||
California Republic Auto Receivables Trust, Series 2014-1, Cl A3, 0.850%, 05/15/18 | 77,822 | 77,759 | ||||||
Nissan Auto Lease Trust, Series 2015-A, Cl A2A, 0.990%, 11/15/17 | 200,472 | 200,446 | ||||||
|
| |||||||
| 388,001 | ||||||||
|
| |||||||
Credit Card 5.2% | ||||||||
BA Credit Card Trust, Series 2015-A2, Cl A, 1.360%, 09/15/20 | 490,000 | 491,666 | ||||||
Cabela’s Master Credit Card Trust, Series 2014-1, Cl A, 0.786%, 03/16/20(a) | 627,000 | 626,178 | ||||||
Capital One Multi-Asset Execution Trust, Series 2014-A5, Cl A, 1.480%, 07/15/20 | 325,000 | 326,742 | ||||||
Capital One Multi-Asset Execution Trust, Series 2015-A1, Cl A, 1.390%, 01/15/21 | 312,000 | 313,006 | ||||||
Chase Issuance Trust, Series 2014-A7, Cl A, 1.380%, 11/15/19 | 500,000 | 501,629 | ||||||
Discover Card Execution Note Trust, Series 2013-A1, Cl A1, 0.736%, 08/17/20(a) | 272,000 | 271,932 | ||||||
Discover Card Execution Note Trust, Series 2016-A1, Cl A1, 1.640%, 07/15/21 | 275,000 | 277,065 | ||||||
|
| |||||||
| 2,808,218 | ||||||||
|
| |||||||
Other 2.3% | ||||||||
AEP Texas Central Transition Funding III LLC, Series 2012-1, Cl A1, 0.880%, 12/01/18 | 239,182 | 238,885 | ||||||
Centerpoint Energy Transition Bond Co. II LLC, Series 2005-A, Cl A4, 5.170%, 08/01/19 | 60,816 | 62,508 | ||||||
CenterPoint Energy Transition Bond Co. IV LLC, Series 2012-1, Cl A1, 0.901%, 04/15/18 | 161,263 | 161,134 | ||||||
FirstEnergy Ohio PIRB Special Purpose Trust, Series 2013-1, Cl A2, 1.726%, 01/15/22 | 440,000 | 442,868 | ||||||
| Shares or Principal Amount($) | Value($) | |||||||
Other—continued | ||||||||
Ohio Phase-In-Recovery Funding LLC, Series 2013-1, Cl A1, 0.958%, 07/01/18 | 309,141 | 308,433 | ||||||
Oncor Electric Delivery Transition Bond Co. LLC, Series 2004-1, Cl A3, 5.290%, 05/15/18 | 14,479 | 14,553 | ||||||
|
| |||||||
| 1,228,381 | ||||||||
|
| |||||||
Student Loan Asset Backed Security 0.8% |
| |||||||
SLM Student Loan Trust, Series 2013-1, Cl A2, 0.683%, 09/25/19(a) | 412,986 | 407,901 | ||||||
|
| |||||||
Total Asset-Backed Securities (Cost $4,826,206) | 4,832,501 | |||||||
|
| |||||||
| Collateralized Mortgage Obligations 9.3% | ||||||||
Commercial Mortgage Backed Securities 9.3% |
| |||||||
Citigroup Commercial Mortgage Trust | ||||||||
Series 2012-GC8, Cl A1, 0.685%, 09/10/45 | 26,971 | 26,915 | ||||||
|
| |||||||
Commercial Mortgage Trust | ||||||||
Series 2012-9W57, Cl A, 2.365%, 02/10/29(b) | 500,000 | 503,120 | ||||||
Series 2013-CR9, Cl A1, 1.344%, 07/10/45 | 51,619 | 51,608 | ||||||
|
| |||||||
| 554,728 | ||||||||
|
| |||||||
Credit Suisse Commercial Mortgage Trust | ||||||||
Series 2006-C5, Cl A3, 5.311%, 12/15/39 | 483,402 | 486,439 | ||||||
|
| |||||||
GS Mortgage Securities Trust | ||||||||
Series 2012-GCJ7, Cl A2, 2.318%, 05/10/45 | 385,000 | 387,440 | ||||||
Series 2013-GC14, Cl A1, 1.217%, 08/10/46 | 46,102 | 45,971 | ||||||
|
| |||||||
| 433,411 | ||||||||
|
| |||||||
JPMorgan Chase Commercial Mortgage Securities Trust | ||||||||
Series 2010-C2, Cl A2, 3.616%, 11/15/43(b) | 780,000 | 798,123 | ||||||
Series 2011-C3, Cl A3, 4.388%, 02/15/46(b) | 325,000 | 339,200 | ||||||
Series 2013-C13, Cl A1, 1.303%, 01/15/46 | 232,876 | 232,438 | ||||||
|
| |||||||
| 1,369,761 | ||||||||
|
| |||||||
Morgan Stanley Bank of America Merrill Lynch Trust | ||||||||
Series 2013-C12, Cl A1, 1.313%, 10/15/46 | 379,861 | 377,953 | ||||||
See Notes to Financial Statements.
83
Table of Contents
SCHEDULES OF PORTFOLIO INVESTMENTS
RIDGEWORTH FUNDS March 31, 2016
Seix Short-Term Bond Fund — continued
| Shares or Principal Amount($) | Value($) | |||||||
Commercial Mortgage Backed Securities—continued |
| |||||||
Series 2014-C14, Cl A1, 1.250%, 02/15/47 | 117,748 | 117,042 | ||||||
|
| |||||||
| 494,995 | ||||||||
|
| |||||||
Morgan Stanley Capital I Trust | ||||||||
Series 2012-C4, Cl A3, 2.991%, 03/15/45 | 196,000 | 202,262 | ||||||
|
| |||||||
WFRBS Commercial Mortgage Trust | ||||||||
Series 2012-C10, Cl A2, 1.765%, 12/15/45 | 600,000 | 601,126 | ||||||
Series 2012-C8, Cl A2, 1.881%, 08/15/45 | 785,731 | 788,286 | ||||||
|
| |||||||
| 1,389,412 | ||||||||
|
| |||||||
Total Collateralized Mortgage Obligations (Cost $4,963,744) | 4,957,923 | |||||||
|
| |||||||
Corporate Bonds 34.8% | ||||||||
Aerospace/Defense 2.2% | ||||||||
Boeing Co. (The), 0.743%, 10/30/17(a) | 530,000 | 529,683 | ||||||
L-3 Communications Corp., 1.500%, 05/28/17 | 379,000 | 377,701 | ||||||
Lockheed Martin Corp., 1.850%, 11/23/18 | 265,000 | 268,026 | ||||||
|
| |||||||
| 1,175,410 | ||||||||
|
| |||||||
Auto Manufacturers 0.8% | ||||||||
PACCAR Financial Corp., 1.236%, 12/06/18, MTN(a) | 200,000 | 200,429 | ||||||
PACCAR Financial Corp., 1.450%, 03/09/18, MTN | 239,000 | 239,551 | ||||||
|
| |||||||
| 439,980 | ||||||||
|
| |||||||
Banks 8.4% | ||||||||
Citigroup, Inc., 1.350%, 03/10/17 | 541,000 | 541,222 | ||||||
Credit Suisse New York, 1.375%, 05/26/17, MTN | 845,000 | 842,602 | ||||||
Goldman Sachs Group, Inc. (The), 5.950%, 01/18/18 | 783,000 | 839,682 | ||||||
ING Bank NV, 1.800%, 03/16/18(b) | 414,000 | 415,206 | ||||||
JPMorgan Chase & Co., 6.125%, 06/27/17 | 558,000 | 587,300 | ||||||
Lloyds Bank PLC, 1.750%, 05/14/18 | 543,000 | 541,749 | ||||||
Wells Fargo & Co., 1.250%, 07/20/16, MTN | 740,000 | 741,312 | ||||||
|
| |||||||
| 4,509,073 | ||||||||
|
| |||||||
| Shares or Principal Amount($) | Value($) | |||||||
Beverages 1.2% | ||||||||
Anheuser-Busch InBev Finance, Inc., 1.900%, 02/01/19 | 642,000 | 651,168 | ||||||
|
| |||||||
Biotechnology 0.6% | ||||||||
Celgene Corp., | 309,000 | 312,499 | ||||||
|
| |||||||
Chemicals 1.1% | ||||||||
Chevron Phillips Chemical Co. LLC, 1.700%, 05/01/18(b) | 602,000 | 597,710 | ||||||
|
| |||||||
Commercial Services 1.2% | ||||||||
ERAC USA Finance LLC, 1.400%, 04/15/16(b) | 632,000 | 632,105 | ||||||
|
| |||||||
Computers 1.0% | ||||||||
Apple, Inc., | 266,000 | 267,009 | ||||||
Hewlett Packard Enterprise Co., 2.850%, 10/05/18(b) | 257,000 | 261,315 | ||||||
|
| |||||||
| 528,324 | ||||||||
|
| |||||||
Diversified Financial Services 2.2% |
| |||||||
Air Lease Corp., 2.625%, 09/04/18 | 266,000 | 264,321 | ||||||
American Express Credit Corp., 1.300%, 07/29/16 | 916,000 | 917,500 | ||||||
|
| |||||||
| 1,181,821 | ||||||||
|
| |||||||
Electric 0.3% | ||||||||
Duke Energy Corp., 1.009%, 04/03/17(a) | 141,000 | 140,055 | ||||||
|
| |||||||
Healthcare-Products 1.4% | ||||||||
Becton Dickinson and Co., 1.800%, 12/15/17 | 265,000 | 266,114 | ||||||
Medtronic, Inc., 1.500%, 03/15/18 | 498,000 | 502,287 | ||||||
|
| |||||||
| 768,401 | ||||||||
|
| |||||||
Healthcare-Services 0.6% | ||||||||
UnitedHealth Group, Inc., 1.875%, 11/15/16 | 349,000 | 351,438 | ||||||
|
| |||||||
Housewares 0.8% | ||||||||
Newell Rubbermaid, Inc., 2.600%, 03/29/19 | 424,000 | 430,166 | ||||||
|
| |||||||
Insurance 3.1% | ||||||||
Berkshire Hathaway Finance Corp., 1.700%, 03/15/19 | 266,000 | 269,691 | ||||||
Berkshire Hathaway, Inc., 1.900%, 01/31/17 | 596,000 | 601,314 | ||||||
MetLife, Inc., 6.750%, 06/01/16 | 800,000 | 807,672 | ||||||
|
| |||||||
| 1,678,677 | ||||||||
|
| |||||||
Internet 0.4% | ||||||||
eBay, Inc., 2.500%, 03/09/18 | 222,000 | 225,601 | ||||||
|
| |||||||
See Notes to Financial Statements.
84
Table of Contents
SCHEDULES OF PORTFOLIO INVESTMENTS
RIDGEWORTH FUNDS March 31, 2016
Seix Short-Term Bond Fund — continued
| Shares or Principal Amount($) | Value($) | |||||||
Machinery-Diversified 1.0% | ||||||||
John Deere Capital Corp., 1.350%, 01/16/18, MTN | 528,000 | 529,206 | ||||||
|
| |||||||
Oil & Gas 2.1% | ||||||||
Chevron Corp., 1.365%, 03/02/18 | 552,000 | 553,966 | ||||||
Exxon Mobil Corp., 1.305%, 03/06/18 | 553,000 | 555,483 | ||||||
|
| |||||||
| 1,109,449 | ||||||||
|
| |||||||
Oil & Gas Services 0.9% | ||||||||
Schlumberger Holdings Corp., 1.900%, 12/21/17(b) | 461,000 | 459,905 | ||||||
|
| |||||||
Pharmaceuticals 0.6% | ||||||||
AbbVie, Inc., 1.800%, 05/14/18 | 318,000 | 320,136 | ||||||
|
| |||||||
Pipelines 0.8% | ||||||||
Kinder Morgan, Inc., 2.000%, 12/01/17 | 269,000 | 266,118 | ||||||
Spectra Energy Partners LP, 2.950%, 09/25/18 | 158,000 | 158,620 | ||||||
|
| |||||||
| 424,738 | ||||||||
|
| |||||||
Real Estate Investment Trust 0.4% |
| |||||||
American Tower Corp., 4.500%, 01/15/18 | 225,000 | 234,450 | ||||||
|
| |||||||
Retail 0.6% | ||||||||
CVS Health Corp., 1.900%, 07/20/18 | 306,000 | 310,465 | ||||||
|
| |||||||
Semiconductors 0.4% | ||||||||
TSMC Global Ltd., 1.625%, 04/03/18(b) | 200,000 | 198,860 | ||||||
|
| |||||||
Software 0.5% | ||||||||
Fidelity National Information Services, Inc., 2.850%, 10/15/18 | 276,000 | 280,499 | ||||||
|
| |||||||
Telecommunication Services 1.2% |
| |||||||
AT&T, Inc., | 488,000 | 522,831 | ||||||
Verizon Communications, Inc., 2.500%, 09/15/16 | 97,000 | 97,747 | ||||||
|
| |||||||
| 620,578 | ||||||||
|
| |||||||
Transportation 1.0% | ||||||||
Canadian National Railway Co., 0.787%, 11/14/17(a) | 554,000 | 552,615 | ||||||
|
| |||||||
Total Corporate Bonds | 18,663,329 | |||||||
|
| |||||||
| Shares or Principal Amount($) | Value($) | |||||||
Municipal Bonds 2.0% |
| |||||||
Louisiana 1.0% | ||||||||
Louisiana Local Government Environmental Facilities & Community Development Authority, Series 2010-ELL, CI A3, RB, 3.450%, 02/01/22 | 515,000 | 533,319 | ||||||
|
| |||||||
New Jersey 1.0% | ||||||||
New Jersey Economic Development Authority, Series Q, RB, 1.096%, 06/15/16 | 530,000 | 530,037 | ||||||
|
| |||||||
Total Municipal Bonds | 1,063,356 | |||||||
|
| |||||||
U.S. Government Agency Mortgages 12.0% |
| |||||||
Federal Home Loan Mortgage Corporation | ||||||||
Pool #J06026, 5.500%, 11/01/20 | 96,008 | 98,798 | ||||||
Pool #G14525, 2.500%, 08/01/22 | 205,201 | 211,583 | ||||||
Pool #J22421, 2.000%, 02/01/23 | 141,867 | 144,690 | ||||||
Pool #J23435, 2.500%, 04/01/23 | 544,056 | 560,995 | ||||||
Pool #J24206, 2.000%, 06/01/23 | 160,274 | 163,461 | ||||||
Pool #J28472, 3.000%, 06/01/24 | 1,204,359 | 1,261,752 | ||||||
|
| |||||||
| 2,441,279 | ||||||||
|
| |||||||
Federal National Mortgage Association | ||||||||
Pool #958815, 4.506%, 06/01/19 | 361,000 | 376,117 | ||||||
Pool #AB4704, 2.500%, 03/01/22 | 282,029 | 290,269 | ||||||
Pool #AP9597, 2.500%, 10/01/22(c) | 622,734 | 641,006 | ||||||
Pool #AL3486, 2.000%, 05/01/23 | 130,711 | 133,292 | ||||||
Pool #AL5640, 2.271%, 08/01/44(a) | 276,085 | 284,890 | ||||||
Pool #AX3644, 2.397%, 10/01/44(a) | 331,134 | 340,981 | ||||||
Pool #AX2167, 2.501%, 11/01/44(a) | 1,326,953 | 1,362,385 | ||||||
Pool #AX5937, 2.581%, 11/01/44(a) | 531,239 | 547,242 | ||||||
|
| |||||||
| 3,976,182 | ||||||||
|
| |||||||
Total U.S. Government Agency Mortgages | 6,417,461 | |||||||
|
| |||||||
See Notes to Financial Statements.
85
Table of Contents
SCHEDULES OF PORTFOLIO INVESTMENTS
RIDGEWORTH FUNDS March 31, 2016
Seix Short-Term Bond Fund — concluded
| Shares or Principal Amount($) | Value($) | |||||||
U.S. Treasury Obligations 32.2% |
| |||||||
U.S. Treasury Notes 32.2% | ||||||||
1.250%, 10/31/18(d) | 10,062,000 | 10,171,263 | ||||||
1.500%, 01/31/19 | 6,957,000 | 7,082,824 | ||||||
|
| |||||||
Total U.S. Treasury Obligations | 17,254,087 | |||||||
|
| |||||||
Money Market Fund 1.6% | ||||||||
State Street Institutional U.S. Government Money Market Fund, Institutional Class, 0.24%(e) | 876,056 | 876,056 | ||||||
|
| |||||||
Total Money Market Fund (Cost $876,056) | 876,056 | |||||||
|
| |||||||
Total Investments | 54,064,713 | |||||||
|
| |||||||
Liabilities in Excess of Other Assets — (0.9)% | (470,595 | ) | ||||||
|
| |||||||
Net Assets — 100.0% | $ | 53,594,118 | ||||||
|
| |||||||
| (a) | Variable or floating rate security. Rate disclosed is as of March 31, 2016. |
| (b) | Rule 144A, Section 4(2) or other security which is restricted as to resale to institutional investors. The Fund’s investment adviser/subadviser has deemed this security to be liquid based upon procedures approved by the Board of Trustees. These securities represent 7.8% of net assets as of March 31, 2016. |
| (c) | All or a portion of this security has been purchased on a when-issued or delayed-delivery basis. |
| (d) | All or a portion of this security has been segregated, or otherwise earmarked, in connection with obligations for when-issued or delayed-delivery purchase commitments. |
| (e) | Rate disclosed, the 7 day yield, is as of March 31, 2016. |
Investment Abbreviations
MTN — Medium Term Note
PIRB — Phase-in-Recovery Bonds
RB — Revenue Bond
See Notes to Financial Statements.
86
Table of Contents
SCHEDULES OF PORTFOLIO INVESTMENTS
RIDGEWORTH FUNDS March 31, 2016
Seix Short-Term Municipal Bond Fund
| Shares or Principal Amount($) | Value($) | |||||||
| Municipal Bonds 93.3% | ||||||||
| Alabama 3.6% | ||||||||
Baldwin County Board of Education, RB, 5.000%, 06/01/19 | 1,250,000 | 1,406,988 | ||||||
|
| |||||||
Arizona 5.1% | ||||||||
Arizona Department of Transportation State Highway Fund Revenue, RB, 5.000%, 07/01/25, Pre-refunded 07/01/2016 @ 100 | 1,000,000 | 1,011,420 | ||||||
Phoenix Civic Improvement Corp., Series B, RB, 5.000%, 07/01/16 | 1,000,000 | 1,011,480 | ||||||
|
| |||||||
| 2,022,900 | ||||||||
|
| |||||||
California 8.2% | ||||||||
California Municipal Finance Authority, Series A, RB, 4.000%, 06/01/21 | 200,000 | 220,334 | ||||||
California State, GO, 5.000%, 08/01/17 | 1,000,000 | 1,058,220 | ||||||
Los Angeles County Regional Financing Authority, Series B-1, RB, 3.000%, 11/15/21, CA MTG INS | 1,500,000 | 1,503,375 | ||||||
Santa Clara Valley Water District, Series C, RB, 5.000%, 06/01/21 | 400,000 | 476,620 | ||||||
|
| |||||||
| 3,258,549 | ||||||||
|
| |||||||
District of Columbia 2.9% | ||||||||
District of Columbia Water & Sewer Authority, Series A, RB, 6.000%, 10/01/35, Pre-refunded 10/01/2018 @ 100 | 1,000,000 | 1,128,850 | ||||||
|
| |||||||
Illinois 4.2% | ||||||||
Chicago O’Hare International Airport, RB, 5.000%, 01/01/19 | 1,500,000 | 1,658,445 | ||||||
|
| |||||||
Indiana 5.5% | ||||||||
Indiana Finance Authority, Series B, RB, 5.000%, 02/01/21(a) | 1,000,000 | 1,179,780 | ||||||
Indiana University, Series R, RB, 5.000%, 08/01/16, AMBAC | 1,000,000 | 1,015,240 | ||||||
|
| |||||||
| 2,195,020 | ||||||||
|
| |||||||
Maryland 9.3% | ||||||||
Maryland State, GO, 5.000%, 08/01/18, Pre-refunded 08/01/2016 @ 100 | 1,000,000 | 1,015,000 | ||||||
| Shares or Principal Amount($) | Value($) | |||||||
Maryland—continued | ||||||||
Maryland State, Series A, GO, 5.000%, 11/01/16 | 1,000,000 | 1,026,550 | ||||||
Maryland State Transportation Authority, Transportation Facilities Project, RB, 5.000%, 07/01/23(b) | 500,000 | 544,440 | ||||||
Montgomery County, Series A, GO, 5.000%, 07/01/17 | 1,040,000 | 1,096,888 | ||||||
|
| |||||||
| 3,682,878 | ||||||||
|
| |||||||
Massachusetts 2.7% | ||||||||
Commonwealth of Massachusetts, | 1,000,000 | 1,056,770 | ||||||
|
| |||||||
Missouri 3.3% | ||||||||
Missouri State Board of Public Buildings, Series B, RB, 4.000%, 04/01/18 | 1,235,000 | 1,315,164 | ||||||
|
| |||||||
Nevada 2.7% | ||||||||
Clark County Department of Aviation, | 1,000,000 | 1,050,060 | ||||||
|
| |||||||
North Carolina 2.8% | ||||||||
Raleigh Combined Enterprise System Revenue, Series B, RB, 5.000%, 12/01/18 | 1,000,000 | 1,110,910 | ||||||
|
| |||||||
Ohio 5.1% | ||||||||
Crawford County, RB, 1.430%, 11/01/17 | 2,000,000 | 1,999,560 | ||||||
|
| |||||||
Rhode Island 8.0% | ||||||||
Rhode Island Health & Educational Building Corp., RB, 4.000%, 05/15/20, AGM, ST APPROP | 750,000 | 823,222 | ||||||
State of Rhode Island, GO, 5.000%, 08/01/18(b) | 2,150,000 | 2,352,874 | ||||||
|
| |||||||
| 3,176,096 | ||||||||
|
| |||||||
South Carolina 1.9% | ||||||||
SCAGO Educational Facilities Corp. for Pickens School District, RB, 5.000%, 12/01/16 | 750,000 | 771,825 | ||||||
|
| |||||||
Texas 17.6% | ||||||||
Metropolitan Transit Authority of Harris County, Series A, RB, 5.000%, 08/15/18 | 1,255,000 | 1,377,212 | ||||||
See Notes to Financial Statements.
87
Table of Contents
SCHEDULES OF PORTFOLIO INVESTMENTS
RIDGEWORTH FUNDS March 31, 2016
Seix Short-Term Municipal Bond Fund — concluded
| Shares or Principal Amount($) | Value($) | |||||||
Texas—continued | ||||||||
New Hope Cultural Education Facilities Financing Corp., Student Housing Corp., Series A, RB, 4.000%, 04/01/17, AGM | 200,000 | 205,824 | ||||||
New Hope Cultural Education Facilities Financing Corp., Student Housing Corp., Series A, RB, 4.000%, 04/01/18, AGM | 200,000 | 210,566 | ||||||
Nueces River Authority, RB, 3.000%, 07/15/17 | 1,000,000 | 1,028,220 | ||||||
Plano, GO, 5.000%, 09/01/18 | 1,000,000 | 1,099,470 | ||||||
Texas Public Finance Authority, Series B, RB, 4.000%, 01/01/18(b) | 3,000,000 | 3,027,390 | ||||||
|
| |||||||
| 6,948,682 | ||||||||
|
| |||||||
Virginia 4.7% | ||||||||
Chesterfield County, GO, 4.000%, 01/01/17, State Aid Withholding | 1,795,000 | 1,841,688 | ||||||
|
| |||||||
Washington 5.7% | ||||||||
Port of Seattle, AMT, GO, 5.250%, 12/01/20 | 1,030,000 | 1,216,430 | ||||||
Snohomish County Public Utility District No. 1, RB, 5.000%, 12/01/16 | 1,000,000 | 1,030,290 | ||||||
|
| |||||||
| 2,246,720 | ||||||||
|
| |||||||
Total Municipal Bonds | 36,871,105 | |||||||
|
| |||||||
| Shares or Principal Amount($) | Value($) | |||||||
Money Market Fund 8.8% | ||||||||
Federated Tax-Free Obligations Fund, Institutional Shares, 0.14%(c) | 3,491,966 | 3,491,966 | ||||||
|
| |||||||
Total Money Market Fund (Cost $3,491,966) | 3,491,966 | |||||||
|
| |||||||
Total Investments | 40,363,071 | |||||||
Liabilities in Excess of Other Assets — (2.1)% | (824,338 | ) | ||||||
|
| |||||||
Net Assets — 100.0% | $ | 39,538,733 | ||||||
|
| |||||||
| (a) | All or a portion of this security has been purchased on a when-issued or delayed-delivery basis. |
| (b) | All or a portion of this security has been segregated, or otherwise earmarked, in connection with obligations for when-issued or delayed-delivery purchase commitments. |
| (c) | Rate disclosed, the 7 day yield, is as of March 31, 2016. |
Investment Abbreviations
| AGM | — | Security guaranteed by Assured Guaranty Municipal Corporation | ||
| AMBAC | — | Security guaranteed by American Municipal Bond Assurance Corporation | ||
| AMT | — | Income subject to Alternative Minimum Tax | ||
| CA MTG INS | — | California Mortgage Insurance | ||
| GO | — | General Obligation | ||
| RB | — | Revenue Bond | ||
| ST APPROP | — | State Appropriation |
See Notes to Financial Statements.
88
Table of Contents
SCHEDULES OF PORTFOLIO INVESTMENTS
RIDGEWORTH FUNDS March 31, 2016
Seix Total Return Bond Fund
| Shares or Principal Amount($) | Value($) | |||||||
Asset-Backed Securities 2.7% |
| |||||||
Automobiles 0.3% | ||||||||
Ford Credit Auto Owner Trust, Series 2016-1, Cl A, 2.310%, 08/15/27(a) | 3,525,000 | 3,526,697 | ||||||
|
| |||||||
Credit Card 1.2% | ||||||||
Barclays Dryrock Issuance Trust, Series 2014-3, Cl A, 2.410%, 07/15/22 | 8,995,000 | 9,211,259 | ||||||
Cabela’s Credit Card Master Note Trust, Series 2014-2, Cl A, 0.886%, 07/15/22(b) | 4,063,000 | 3,996,808 | ||||||
|
| |||||||
| 13,208,067 | ||||||||
|
| |||||||
Other 1.2% | ||||||||
DB Master Finance LLC, Series 2015-1A, Cl A2II, 3.980%, 02/20/45(a) | 6,108,300 | 5,973,917 | ||||||
Domino’s Pizza Master Issuer LLC, Series 2012-1A, Cl A2, 5.216%, 01/25/42(a) | 4,828,738 | 4,941,502 | ||||||
Ohio Phase-In-Recovery Funding LLC, Series 2013-1, Cl A2, 2.049%, 07/01/20 | 2,895,000 | 2,936,467 | ||||||
|
| |||||||
| 13,851,886 | ||||||||
|
| |||||||
Total Asset-Backed Securities | 30,586,650 | |||||||
|
| |||||||
Collateralized Mortgage Obligations 4.0% |
| |||||||
Commercial Mortgage Backed Securities 4.0% |
| |||||||
Extended Stay America Trust | ||||||||
Series 2013-ESH5, Cl B5, 2.278%, 12/05/31(a) | 254,282 | 253,779 | ||||||
|
| |||||||
Federal Home Loan Mortgage Corporation | ||||||||
Series KP02, Cl A2, 2.355%, 04/25/21(b) | 6,205,000 | 6,356,915 | ||||||
|
| |||||||
FREMF Mortgage Trust | ||||||||
Series 2016-K52, Cl B, 3.921%, 01/25/49(a)(b) | 3,170,000 | 2,778,100 | ||||||
|
| |||||||
GS Mortgage Securities Corp. II | ||||||||
Series 2012-ALOH, Cl A, 3.551%, 04/10/34(a) | 8,728,000 | 9,290,789 | ||||||
Series 2012-BWTR, Cl A, 2.954%, 11/05/34(a) | 3,111,000 | 3,167,366 | ||||||
Series 2012-BWTR, Cl B, 3.255%, 11/05/34(a) | 2,890,000 | 2,872,668 | ||||||
|
| |||||||
| 15,330,823 | ||||||||
|
| |||||||
| Shares or Principal Amount($) | Value($) | |||||||
Commercial Mortgage Backed Securities—continued |
| |||||||
GS Mortgage Securities Trust | ||||||||
Series 2010-C1, Cl A2, 4.592%, 08/10/43(a) | 3,822,000 | 4,176,490 | ||||||
|
| |||||||
JPMorgan Chase Commercial Mortgage Securities Trust | ||||||||
Series 2012-HSBC, Cl B, 3.722%, 07/05/32(a) | 1,790,000 | 1,828,100 | ||||||
|
| |||||||
Morgan Stanley Capital I Trust | ||||||||
Series 2014-CPT, Cl A, 3.350%, 07/13/29(a) | 4,815,000 | 5,057,160 | ||||||
|
| |||||||
OBP Depositor LLC Trust | ||||||||
Series 2010-OBP, Cl A, 4.646%, 07/15/45(a) | 2,126,000 | 2,352,876 | ||||||
|
| |||||||
VNDO 2013-PENN Mortgage Trust | ||||||||
Series 2013-PENN, Cl A, 3.808%, 12/13/29(a) | 3,315,000 | 3,497,418 | ||||||
|
| |||||||
Wells Fargo Commercial Mortgage Trust | ||||||||
Series 2013-BTC, Cl A, 3.544%, 04/16/35(a) | 2,900,000 | 3,067,206 | ||||||
|
| |||||||
Total Collateralized Mortgage Obligations | 44,698,867 | |||||||
|
| |||||||
Bank Loan 0.0%(c) | ||||||||
Information Technology 0.0%(c) |
| |||||||
Semiconductor Components Industries LLC, Term Loan A, 2.362%, 01/02/18(b)(d) | 240,625 | 234,610 | ||||||
|
| |||||||
Total Bank Loan | 234,610 | |||||||
|
| |||||||
Corporate Bonds 26.7% | ||||||||
Aerospace/Defense 0.3% | ||||||||
L-3 Communications Corp., 3.950%, 05/28/24 | 1,092,000 | 1,050,969 | ||||||
Lockheed Martin Corp., 4.700%, 05/15/46 | 1,863,000 | 2,083,078 | ||||||
|
| |||||||
| 3,134,047 | ||||||||
|
| |||||||
Agriculture 0.2% | ||||||||
Japan Tobacco, Inc., 2.100%, 07/23/18(a) | 2,346,000 | 2,368,172 | ||||||
|
| |||||||
Airlines 1.2% | ||||||||
American Airlines Pass Through Trust, Series 2013-2, 4.950%, 01/15/23 | 2,702,785 | 2,891,764 | ||||||
See Notes to Financial Statements.
89
Table of Contents
SCHEDULES OF PORTFOLIO INVESTMENTS
RIDGEWORTH FUNDS March 31, 2016
Seix Total Return Bond Fund — continued
| Shares or Principal Amount($) | Value($) | |||||||
Airlines—continued | ||||||||
American Airlines Pass Through Trust, Series 2015-2, 3.600%, 09/22/27 | 1,887,000 | 1,943,610 | ||||||
American Airlines Pass Through Trust, Series 2016-1, Cl A, 4.100%, 01/15/28, Series A | 2,366,000 | 2,448,573 | ||||||
Delta Air Lines Pass Through Trust, Series 2015-1, 3.625%, 07/30/27, Series 15-1 | 867,471 | 857,712 | ||||||
Southwest Airlines Co., 2.650%, 11/05/20 | 1,717,000 | 1,750,676 | ||||||
Spirit Airlines Pass Through Trust, Series 2015-1, 4.100%, 04/01/28, Series A | 1,820,000 | 1,829,100 | ||||||
United Airlines Pass Through Trust, Series 2014-1, Cl A, 4.000%, 04/11/26, Series A | 1,362,272 | 1,406,546 | ||||||
|
| |||||||
| 13,127,981 | ||||||||
|
| |||||||
Auto Manufacturers 1.2% | ||||||||
Daimler Finance North America LLC, 2.250%, 03/02/20(a) | 1,622,000 | 1,632,024 | ||||||
Ford Motor Credit Co. LLC, 3.336%, 03/18/21 | 4,908,000 | 5,050,548 | ||||||
General Motors Co., 5.200%, 04/01/45 | 5,520,000 | 5,189,197 | ||||||
Volkswagen International Finance, 2.375%, 03/22/17(a) | 1,539,000 | 1,545,587 | ||||||
|
| |||||||
| 13,417,356 | ||||||||
|
| |||||||
Auto Parts & Equipment 0.7% |
| |||||||
Delphi Automotive PLC, 4.250%, 01/15/26 | 2,014,000 | 2,102,251 | ||||||
Lear Corp., 4.750%, 01/15/23 | 1,338,000 | 1,374,795 | ||||||
Magna International, Inc., 4.150%, 10/01/25 | 4,038,000 | 4,278,459 | ||||||
|
| |||||||
| 7,755,505 | ||||||||
|
| |||||||
Banks 4.9% | ||||||||
Bank of America Corp., 4.450%, 03/03/26 | 2,000,000 | 2,060,378 | ||||||
Bank of America Corp., 6.300%(b)(e) | 2,380,000 | 2,451,400 | ||||||
| Shares or Principal Amount($) | Value($) | |||||||
Banks—continued | ||||||||
BPCE SA, 2.650%, 02/03/21 | 3,090,000 | 3,118,002 | ||||||
Cooperatieve Rabobank UA, 2.500%, 01/19/21, MTN | 2,039,000 | 2,058,073 | ||||||
Credit Suisse Group Funding Guernsey Ltd., 3.800%, 09/15/22 | 3,366,000 | 3,350,096 | ||||||
Fifth Third Bank, 3.850%, 03/15/26 | 4,032,000 | 4,130,373 | ||||||
Goldman Sachs Group, Inc. (The), 5.150%, 05/22/45 | 2,940,000 | 2,986,696 | ||||||
Huntington National Bank (The), 1.300%, 11/20/16 | 1,869,000 | 1,869,078 | ||||||
ING Bank NV, 1.800%, 03/16/18(a) | 1,452,000 | 1,456,230 | ||||||
JPMorgan Chase & Co., 2.250%, 01/23/20 | 3,742,000 | 3,771,599 | ||||||
KeyCorp, 2.900%, 09/15/20, MTN | 2,118,000 | 2,152,712 | ||||||
Lloyds Bank PLC, 2.050%, 01/22/19 | 2,240,000 | 2,240,461 | ||||||
Morgan Stanley, 2.650%, 01/27/20 | 2,379,000 | 2,414,174 | ||||||
Morgan Stanley, 3.950%, 04/23/27 | 1,498,000 | 1,499,583 | ||||||
Morgan Stanley, 4.300%, 01/27/45 | 6,246,000 | 6,284,981 | ||||||
Regions Bank, 2.250%, 09/14/18 | 1,095,000 | 1,093,120 | ||||||
US Bancorp, 2.350%, 01/29/21, MTN | 1,639,000 | 1,664,006 | ||||||
US Bancorp, 3.600%, 09/11/24, MTN | 3,148,000 | 3,317,356 | ||||||
US Bank NA, 1.100%, 01/30/17 | 2,968,000 | 2,974,595 | ||||||
Wells Fargo & Co., 4.300%, 07/22/27, MTN | 3,709,000 | 3,935,412 | ||||||
|
| |||||||
| 54,828,325 | ||||||||
|
| |||||||
Beverages 0.7% | ||||||||
Anheuser-Busch InBev Finance, Inc., 2.650%, 02/01/21 | 1,488,000 | 1,529,049 | ||||||
Anheuser-Busch InBev Finance, Inc., 3.650%, 02/01/26 | 921,000 | 968,536 | ||||||
Anheuser-Busch InBev Finance, Inc., 4.900%, 02/01/46 | 2,747,000 | 3,069,943 | ||||||
SABMiller Holdings, Inc., 2.450%, 01/15/17(a) | 2,020,000 | 2,038,523 | ||||||
|
| |||||||
| 7,606,051 | ||||||||
|
| |||||||
See Notes to Financial Statements.
90
Table of Contents
SCHEDULES OF PORTFOLIO INVESTMENTS
RIDGEWORTH FUNDS March 31, 2016
Seix Total Return Bond Fund — continued
| Shares or Principal Amount($) | Value($) | |||||||
Biotechnology 0.4% | ||||||||
Biogen, Inc., 5.200%, 09/15/45 | 1,850,000 | 2,052,007 | ||||||
Celgene Corp., 4.625%, 05/15/44 | 1,038,000 | 1,057,548 | ||||||
Celgene Corp., 5.000%, 08/15/45 | 1,217,000 | 1,315,983 | ||||||
|
| |||||||
| 4,425,538 | ||||||||
|
| |||||||
Commercial Services 0.4% | ||||||||
ERAC USA Finance LLC, 2.750%, 03/15/17(a) | 935,000 | 946,118 | ||||||
ERAC USA Finance LLC, 3.850%, 11/15/24(a) | 1,167,000 | 1,219,989 | ||||||
ERAC USA Finance LLC, 4.500%, 02/15/45(a) | 1,078,000 | 1,061,899 | ||||||
ERAC USA Finance LLC, 5.250%, 10/01/20(a) | 1,149,000 | 1,267,448 | ||||||
|
| |||||||
| 4,495,454 | ||||||||
|
| |||||||
Computers 0.3% | ||||||||
Apple, Inc., 3.200%, 05/13/25 | 3,568,000 | 3,738,062 | ||||||
|
| |||||||
Diversified Financial Services 1.2% |
| |||||||
Air Lease Corp., 2.625%, 09/04/18 | 5,155,000 | 5,122,456 | ||||||
American Express Credit Corp., 2.375%, 03/24/17, MTN | 1,487,000 | 1,504,443 | ||||||
Lazard Group LLC, 3.750%, 02/13/25 | 5,127,000 | 4,732,303 | ||||||
TD Ameritrade Holding Corp., 2.950%, 04/01/22 | 1,836,000 | 1,873,952 | ||||||
|
| |||||||
| 13,233,154 | ||||||||
|
| |||||||
Electric 0.7% | ||||||||
Berkshire Hathaway Energy Co., 6.125%, 04/01/36 | 1,331,000 | 1,647,814 | ||||||
Dominion Resources, Inc., 1.950%, 08/15/16 | 468,000 | 469,479 | ||||||
Exelon Generation Co. LLC, 6.200%, 10/01/17 | 1,189,000 | 1,264,255 | ||||||
FirstEnergy Transmission LLC, 5.450%, 07/15/44(a) | 4,376,000 | 4,561,013 | ||||||
|
| |||||||
| 7,942,561 | ||||||||
|
| |||||||
Healthcare-Products 0.4% | ||||||||
Becton Dickinson and Co., 4.685%, 12/15/44 | 964,000 | 1,041,275 | ||||||
Medtronic, Inc., 3.500%, 03/15/25 | 730,000 | 779,159 | ||||||
Medtronic, Inc., 4.625%, 03/15/45 | 2,024,000 | 2,265,297 | ||||||
|
| |||||||
| 4,085,731 | ||||||||
|
| |||||||
| Shares or Principal Amount($) | Value($) | |||||||
Healthcare-Services 0.2% | ||||||||
Howard Hughes Medical Institute, 3.500%, 09/01/23 | 1,842,000 | 1,970,736 | ||||||
|
| |||||||
Housewares 0.3% | ||||||||
Newell Rubbermaid, Inc., 5.500%, 04/01/46 | 2,561,000 | 2,782,260 | ||||||
|
| |||||||
Insurance 0.5% | ||||||||
Chubb INA Holdings, Inc., 4.350%, 11/03/45 | 1,114,000 | 1,214,049 | ||||||
MassMutual Global Funding LLC, 2.000%, 04/05/17(a) | 1,291,000 | 1,303,785 | ||||||
Nationwide Financial Services, Inc., 5.375%, 03/25/21(a) | 2,212,000 | 2,425,153 | ||||||
Reinsurance Group of America, Inc., 4.700%, 09/15/23, MTN | 1,080,000 | 1,126,113 | ||||||
|
| |||||||
| 6,069,100 | ||||||||
|
| |||||||
Media 0.5% | ||||||||
Comcast Corp., 4.650%, 07/15/42 | 5,267,000 | 5,858,805 | ||||||
|
| |||||||
Mining 1.5% | ||||||||
Barrick(PD) Australia Finance Property Ltd., 5.950%, 10/15/39 | 4,512,000 | 4,058,539 | ||||||
Barrick International Barbados Corp., 6.350%, 10/15/36(a) | 1,083,000 | 983,334 | ||||||
BHP Billiton Finance USA Ltd., 5.000%, 09/30/43 | 2,676,000 | 2,722,311 | ||||||
Newmont Mining Corp., 6.250%, 10/01/39 | 7,239,000 | 7,234,280 | ||||||
Rio Tinto Finance USA Ltd., 3.750%, 06/15/25 | 1,852,000 | 1,804,913 | ||||||
|
| |||||||
| 16,803,377 | ||||||||
|
| |||||||
Miscellaneous Manufacturer 0.7% |
| |||||||
3M Co., 1.375%, 09/29/16 | 971,000 | 974,428 | ||||||
General Electric Co., 2.700%, 10/09/22 | 1,444,000 | 1,501,806 | ||||||
General Electric Co., 3.450%, 05/15/24, MTN | 2,615,000 | 2,818,301 | ||||||
General Electric Co., 4.125%, 10/09/42 | 1,142,000 | 1,204,353 | ||||||
General Electric Co., 5.250%, 12/06/17 | 1,036,000 | 1,110,203 | ||||||
|
| |||||||
| 7,609,091 | ||||||||
|
| |||||||
See Notes to Financial Statements.
91
Table of Contents
SCHEDULES OF PORTFOLIO INVESTMENTS
RIDGEWORTH FUNDS March 31, 2016
Seix Total Return Bond Fund — continued
| Shares or Principal Amount($) | Value($) | |||||||
Oil & Gas 3.7% | ||||||||
Apache Corp., 3.250%, 04/15/22 | 2,775,000 | 2,669,952 | ||||||
BP Capital Markets PLC, 2.248%, 11/01/16 | 2,052,000 | 2,067,817 | ||||||
ConocoPhillips Co., 5.950%, 03/15/46 | 2,873,000 | 3,090,664 | ||||||
Devon Energy Corp., 5.850%, 12/15/25(f) | 2,771,000 | 2,674,675 | ||||||
Ensco PLC, 4.500%, 10/01/24(f) | 1,419,000 | 787,545 | ||||||
Ensco PLC, 5.200%, 03/15/25(f) | 5,836,000 | 3,268,160 | ||||||
Ensco PLC, 5.750%, 10/01/44 | 2,369,000 | 1,172,655 | ||||||
EOG Resources, Inc., 4.150%, 01/15/26 | 3,987,000 | 4,145,898 | ||||||
Exxon Mobil Corp., 1.912%, 03/06/20 | 2,976,000 | 3,009,403 | ||||||
Exxon Mobil Corp., 3.043%, 03/01/26 | 5,005,000 | 5,122,422 | ||||||
Marathon Oil Corp., 3.850%, 06/01/25(f) | 2,774,000 | 2,254,158 | ||||||
Marathon Petroleum Corp., 3.625%, 09/15/24 | 442,000 | 404,175 | ||||||
Marathon Petroleum Corp., 5.000%, 09/15/54 | 3,017,000 | 2,361,400 | ||||||
Shell International Finance BV, 3.250%, 05/11/25 | 3,302,000 | 3,333,158 | ||||||
Woodside Finance Ltd., 3.650%, 03/05/25(a) | 1,995,000 | 1,853,263 | ||||||
Woodside Finance Ltd., 4.600%, 05/10/21(a) | 2,643,000 | 2,738,679 | ||||||
|
| |||||||
| 40,954,024 | ||||||||
|
| |||||||
Oil & Gas Services 0.8% | ||||||||
FMC Technologies, Inc., 3.450%, 10/01/22 | 656,000 | 582,946 | ||||||
Schlumberger Holdings Corp., 3.000%, 12/21/20(a) | 2,187,000 | 2,217,257 | ||||||
Schlumberger Holdings Corp., 4.000%, 12/21/25(a) | 4,297,000 | 4,436,352 | ||||||
Schlumberger Investment SA, 3.300%, 09/14/21(a) | 1,659,000 | 1,708,755 | ||||||
|
| |||||||
| 8,945,310 | ||||||||
|
| |||||||
Pharmaceuticals 0.5% | ||||||||
AbbVie, Inc., 3.600%, 05/14/25 | 2,751,000 | 2,887,771 | ||||||
Express Scripts Holding Co., 2.650%, 02/15/17 | 1,560,000 | 1,580,374 | ||||||
| Shares or Principal Amount($) | Value($) | |||||||
Pharmaceuticals—continued |
| |||||||
Novartis Securities Investment Ltd., 5.125%, 02/10/19 | 969,000 | 1,072,688 | ||||||
|
| |||||||
| 5,540,833 | ||||||||
|
| |||||||
Pipelines 0.3% | ||||||||
NuStar Logistics LP, 4.800%, 09/01/20 | 2,870,000 | 2,525,600 | ||||||
Phillips 66 Partners LP, 3.605%, 02/15/25 | 468,000 | 425,274 | ||||||
Phillips 66 Partners LP, 4.680%, 02/15/45 | 595,000 | 494,149 | ||||||
|
| |||||||
| 3,445,023 | ||||||||
|
| |||||||
Real Estate Investment Trust 1.3% |
| |||||||
American Tower Corp., 3.500%, 01/31/23 | 1,779,000 | 1,795,865 | ||||||
American Tower Corp., 5.000%, 02/15/24 | 3,313,000 | 3,635,593 | ||||||
Boston Properties LP, 3.650%, 02/01/26 | 1,857,000 | 1,926,924 | ||||||
Digital Realty Trust LP, 3.950%, 07/01/22 | 3,127,000 | 3,183,974 | ||||||
Digital Realty Trust LP, 4.750%, 10/01/25 | 1,965,000 | 2,000,578 | ||||||
Simon Property Group LP, 3.300%, 01/15/26 | 1,321,000 | 1,370,923 | ||||||
|
| |||||||
| 13,913,857 | ||||||||
|
| |||||||
Retail 0.9% | ||||||||
CVS Health Corp., 5.125%, 07/20/45 | 1,738,000 | 2,012,816 | ||||||
Home Depot, Inc. (The), 2.625%, 06/01/22 | 2,008,000 | 2,077,143 | ||||||
Kohl’s Corp., 5.550%, 07/17/45 | 1,201,000 | 1,086,946 | ||||||
Wal-Mart Stores, Inc., 1.125%, 04/11/18 | 5,246,000 | 5,285,429 | ||||||
|
| |||||||
| 10,462,334 | ||||||||
|
| |||||||
Semiconductors 1.0% | ||||||||
Analog Devices, Inc., 5.300%, 12/15/45 | 3,949,000 | 4,431,667 | ||||||
Intel Corp., 1.950%, 10/01/16 | 1,031,000 | 1,038,156 | ||||||
Intel Corp., 4.900%, 07/29/45 | 1,677,000 | 1,880,871 | ||||||
TSMC Global Ltd., | 3,589,000 | 3,568,543 | ||||||
|
| |||||||
| 10,919,237 | ||||||||
|
| |||||||
Software 0.5% | ||||||||
Fidelity National Information Services, Inc., 4.500%, 10/15/22 | 2,243,000 | 2,391,949 | ||||||
See Notes to Financial Statements.
92
Table of Contents
SCHEDULES OF PORTFOLIO INVESTMENTS
RIDGEWORTH FUNDS March 31, 2016
Seix Total Return Bond Fund — continued
| Shares or Principal Amount($) | Value($) | |||||||
Software—continued | ||||||||
Oracle Corp., 1.200%, 10/15/17 | 1,341,000 | 1,348,829 | ||||||
Oracle Corp., 2.375%, 01/15/19 | 1,638,000 | 1,698,008 | ||||||
|
| |||||||
| 5,438,786 | ||||||||
|
| |||||||
Telecommunication Services 1.4% |
| |||||||
AT&T, Inc., 2.375%, 11/27/18 | 2,349,000 | 2,399,586 | ||||||
AT&T, Inc., 3.950%, 01/15/25 | 750,000 | 779,499 | ||||||
AT&T, Inc., 4.350%, 06/15/45 | 886,000 | 811,661 | ||||||
AT&T, Inc., 4.750%, 05/15/46 | 2,192,000 | 2,138,202 | ||||||
CC Holdings GS V LLC/Crown Castle GS III Corp., 3.849%, 04/15/23 | 3,187,000 | 3,285,641 | ||||||
Cisco Systems, Inc., 2.125%, 03/01/19 | 2,111,000 | 2,171,909 | ||||||
Crown Castle Towers LLC, 3.222%, 05/15/22(a) | 1,465,000 | 1,467,197 | ||||||
Verizon Communications, Inc., 5.012%, 08/21/54 | 2,406,000 | 2,413,769 | ||||||
|
| |||||||
| 15,467,464 | ||||||||
|
| |||||||
Total Corporate Bonds | 296,338,174 | |||||||
|
| |||||||
U.S. Government Agency Mortgages 26.0% |
| |||||||
Federal Home Loan Mortgage Corporation | ||||||||
Pool #G30614, 3.500%, 12/01/32 | 4,724,107 | 5,010,902 | ||||||
Pool #C91768, 3.500%, 07/01/34 | 2,048,856 | 2,159,052 | ||||||
Pool #G01779, 5.000%, 04/01/35 | 336,351 | 373,072 | ||||||
Pool #G01838, 5.000%, 07/01/35 | 300,229 | 333,099 | ||||||
Pool #G01837, 5.000%, 07/01/35 | 2,259,283 | 2,504,721 | ||||||
Pool #A47828, 3.500%, 08/01/35 | 1,071,986 | 1,131,945 | ||||||
Pool #G05326, 5.000%, 02/01/38 | 1,390,107 | 1,539,891 | ||||||
Pool #G07135, 6.000%, 10/01/38 | 1,766,304 | 2,015,849 | ||||||
Pool #G08347, 4.500%, 06/01/39 | 2,795,022 | 3,041,040 | ||||||
Pool #G08353, 4.500%, 07/01/39 | 3,484,795 | 3,791,744 | ||||||
| Shares or Principal Amount($) | Value($) | |||||||
U.S. Government Agency Mortgages—continued |
| |||||||
Pool #G06079, 6.000%, 07/01/39 | 855,322 | 974,849 | ||||||
Pool #A89384, 4.000%, 10/01/39 | 198,146 | 211,870 | ||||||
Pool #A89148, 4.000%, 10/01/39 | 1,512,753 | 1,618,926 | ||||||
Pool #G08372, 4.500%, 11/01/39 | 2,031,798 | 2,211,714 | ||||||
Pool #A93101, 5.000%, 07/01/40 | 1,472,759 | 1,623,653 | ||||||
Pool #G06061, 4.000%, 10/01/40 | 2,991,193 | 3,212,126 | ||||||
Pool #A95796, 4.000%, 12/01/40 | 1,235,542 | 1,323,143 | ||||||
Pool #A95822, 4.000%, 12/01/40 | 2,986,249 | 3,221,467 | ||||||
Pool #Q04085, 3.500%, 10/01/41 | 158,750 | 167,098 | ||||||
Pool #G60126, 4.500%, 11/01/41 | 463,154 | 503,851 | ||||||
Pool #G07491, 4.500%, 03/01/42 | 56,924 | 62,096 | ||||||
Pool #Q18522, 3.500%, 05/01/43(g) | 5,045,526 | 5,305,095 | ||||||
Pool #849167, 2.947%, 10/01/43(b) | 4,249,175 | 4,402,393 | ||||||
Pool #G60019, 4.500%, 03/01/44 | 8,753,825 | 9,539,150 | ||||||
Pool #Q29416, 4.000%, 11/01/44 | 2,136,472 | 2,285,330 | ||||||
Pool #Q31066, 4.000%, 02/01/45 | 1,249,480 | 1,345,455 | ||||||
Pool #Q31645, 4.000%, 02/01/45 | 6,042,357 | 6,483,337 | ||||||
Pool #Q35611, 4.000%, 09/01/45 | 6,198,914 | 6,651,341 | ||||||
|
| |||||||
| 73,044,209 | ||||||||
|
| |||||||
Federal National Mortgage Association |
| |||||||
Pool #AM6855, 3.150%, 11/01/24 | 2,168,000 | 2,280,528 | ||||||
Pool #AM6979, 3.310%, 11/01/24 | 5,084,000 | 5,410,687 | ||||||
Pool #AM7421, 3.030%, 12/01/24 | 9,316,000 | 9,714,917 | ||||||
Pool #AN0818, 3.050%, 01/01/26 | 923,000 | 972,877 | ||||||
Pool #AN0632, 3.210%, 01/01/26 | 6,555,000 | 6,874,721 | ||||||
Pool #AP9592, 3.500%, 10/01/32 | 3,311,726 | 3,511,565 | ||||||
Pool #MA1630, 4.000%, 10/01/33 | 1,996,203 | 2,152,954 | ||||||
See Notes to Financial Statements.
93
Table of Contents
SCHEDULES OF PORTFOLIO INVESTMENTS
RIDGEWORTH FUNDS March 31, 2016
Seix Total Return Bond Fund — continued
| Shares or Principal Amount($) | Value($) | |||||||
U.S. Government Agency Mortgages—continued |
| |||||||
Pool #MA1688, 3.500%, 12/01/33 | 135,431 | 143,192 | ||||||
Pool #MA1763, 3.500%, 01/01/34 | 6,187,275 | 6,541,436 | ||||||
Pool #190370, 6.000%, 06/01/36 | 1,717,935 | 1,962,865 | ||||||
Pool #745950, 6.000%, 11/01/36 | 1,736,669 | 1,983,050 | ||||||
Pool #888128, 6.000%, 01/01/37 | 274,378 | 313,392 | ||||||
Pool #890248, 6.000%, 08/01/37 | 399,045 | 462,263 | ||||||
Pool #889529, 6.000%, 03/01/38 | 142,247 | 163,776 | ||||||
Pool #889579, 6.000%, 05/01/38 | 677,669 | 772,809 | ||||||
Pool #995724, 6.000%, 04/01/39 | 1,266,868 | 1,460,788 | ||||||
Pool #AE0814, 6.000%, 09/01/39 | 271,940 | 310,487 | ||||||
Pool #AC2817, 4.000%, 10/01/39 | 495,405 | 529,278 | ||||||
Pool #AX3605, 3.500%, 01/01/40 | 2,806,207 | 2,948,651 | ||||||
Pool #932441, 4.000%, 01/01/40 | 6,737,387 | 7,198,050 | ||||||
Pool #AC9564, 4.500%, 02/01/40 | 805,328 | 884,032 | ||||||
Pool #AL7497, 3.500%, 09/01/40 | 23,939,194 | 25,149,575 | ||||||
Pool #AD9725, 3.500%, 10/01/40 | 1,260,398 | 1,324,177 | ||||||
Pool #AE3860, 5.000%, 10/01/40 | 528,582 | 586,806 | ||||||
Pool #AE4414, 4.000%, 11/01/40 | 3,142,569 | 3,367,660 | ||||||
Pool #AE5143, 4.000%, 11/01/40 | 414,432 | 444,116 | ||||||
Pool #AE9284, 4.000%, 11/01/40 | 696,004 | 744,563 | ||||||
Pool #AH4161, 3.500%, 01/01/41 | 1,082,975 | 1,137,865 | ||||||
Pool #AB2071, 3.500%, 01/01/41 | 569,769 | 598,645 | ||||||
Pool #AL0215, 4.500%, 04/01/41 | 4,525,670 | 4,940,456 | ||||||
Pool #AB3274, 4.500%, 07/01/41 | 1,912,873 | 2,094,529 | ||||||
Pool #AB3865, 3.500%, 11/01/41 | 1,199,415 | 1,265,995 | ||||||
| Shares or Principal Amount($) | Value($) | |||||||
U.S. Government Agency Mortgages—continued |
| |||||||
Pool #AW8154, 3.500%, 01/01/42 | 12,651,697 | 13,317,150 | ||||||
Pool #AT8263, 3.500%, 01/01/42 | 1,663,366 | 1,753,615 | ||||||
Pool #AB5188, 3.500%, 05/01/42 | 6,686,049 | 7,026,289 | ||||||
Pool #AP7874, 3.500%, 10/01/42 | 2,004,676 | 2,106,701 | ||||||
Pool #AB8726, 3.500%, 03/01/43 | 7,304,720 | 7,675,835 | ||||||
Pool #AL3657, 3.500%, 06/01/43 | 4,098,114 | 4,331,368 | ||||||
Pool #AU3742, 3.500%, 08/01/43 | 1,020,760 | 1,074,795 | ||||||
Pool #AL5939, | 5,779,859 | 6,083,889 | ||||||
Pool #AS2037, 4.500%, 03/01/44 | 3,169,850 | 3,452,940 | ||||||
Pool #AL6223, 4.500%, 08/01/44 | 3,686,115 | 4,013,488 | ||||||
Pool #AY2685, 4.500%, 01/01/45 | 757,645 | 831,889 | ||||||
Pool #AX8835, | 3,650,173 | 3,760,969 | ||||||
Pool #AZ7723, 4.500%, 10/01/45 | 1,066,418 | 1,163,460 | ||||||
Pool #BC2470, 3.500%, 02/01/46 | 2,323,893 | 2,451,384 | ||||||
|
| |||||||
| 157,290,477 | ||||||||
|
| |||||||
Government National Mortgage Association | ||||||||
Pool #MA0321, 5.000%, 08/20/42 | 550,028 | 613,159 | ||||||
Pool #666413, 4.000%, 09/15/43 | 1,534,805 | 1,657,542 | ||||||
Pool #MA2681, 5.000%, 03/20/45 | 2,302,528 | 2,507,097 | ||||||
Pool #AM0226, 4.000%, 05/15/45 | 1,252,359 | 1,341,481 | ||||||
Pool #AM9875, 4.000%, 06/15/45 | 1,724,665 | 1,852,428 | ||||||
Pool #AN7421, 4.000%, 06/15/45 | 1,509,335 | 1,618,426 | ||||||
Pool #AM7092, 4.500%, 06/15/45 | 2,427,618 | 2,645,304 | ||||||
Pool #626960, 3.500%, 07/15/45 | 4,622,852 | 4,912,763 | ||||||
Pool #AN8476, 3.500%, 07/15/45 | 3,212,887 | 3,397,299 | ||||||
Pool #AM8631, 4.000%, 07/15/45 | 2,527,614 | 2,708,125 | ||||||
See Notes to Financial Statements.
94
Table of Contents
SCHEDULES OF PORTFOLIO INVESTMENTS
RIDGEWORTH FUNDS March 31, 2016
Seix Total Return Bond Fund — continued
| Shares or Principal Amount($) | Value($) | |||||||
U.S. Government Agency Mortgages—continued |
| |||||||
Pool #AN5745, 4.000%, 07/15/45 | 3,506,534 | 3,766,847 | ||||||
Pool #AN5781, 4.000%, 07/15/45 | 1,901,712 | 2,039,796 | ||||||
Pool #AN5764, 4.000%, 07/15/45 | 1,431,751 | 1,538,265 | ||||||
Pool #AN5766, 4.000%, 07/15/45 | 1,577,360 | 1,692,229 | ||||||
Pool #AN6811, 4.000%, 07/15/45 | 1,142,478 | 1,223,910 | ||||||
Pool #AO0509, 3.500%, 08/15/45 | 3,658,284 | 3,872,540 | ||||||
Pool #626970, 3.500%, 08/15/45 | 2,232,292 | 2,372,356 | ||||||
Pool #AO3608, 4.000%, 08/15/45 | 7,116,554 | 7,634,953 | ||||||
Pool #AM9046, 4.500%, 08/15/45 | 1,536,448 | 1,675,740 | ||||||
Pool #AP5075, 4.000%, 09/15/45 | 1,068,467 | 1,161,818 | ||||||
Pool #AP5076, 4.000%, 09/15/45 | 1,136,417 | 1,235,785 | ||||||
Pool #AP5077, 4.000%, 09/15/45 | 1,010,125 | 1,098,588 | ||||||
Pool #AB5970, 4.000%, 10/15/45 | 2,571,070 | 2,767,738 | ||||||
Pool #AB5975, 4.000%, 11/15/45 | 2,332,307 | 2,510,694 | ||||||
|
| |||||||
| 57,844,883 | ||||||||
|
| |||||||
Total U.S. Government Agency Mortgages |
| 288,179,569 | ||||||
|
| |||||||
| U.S. Treasury Obligations 35.8% | ||||||||
U.S. Treasury Bond 4.2% | ||||||||
3.000%, 11/15/45 | 43,578,000 | 47,045,501 | ||||||
|
| |||||||
U.S. Treasury Notes 31.6% | ||||||||
0.500%, 06/15/16(h) | 102,584,000 | 102,630,060 | ||||||
0.875%, 07/15/17 | 40,105,000 | 40,202,134 | ||||||
0.625%, 09/30/17 | 32,635,000 | 32,592,934 | ||||||
1.250%, 10/31/18 | 44,036,000 | 44,514,187 | ||||||
1.500%, 10/31/19 | 21,028,000 | 21,390,249 | ||||||
1.375%, 02/29/20 | 10,454,000 | 10,568,754 | ||||||
1.625%, 02/15/26(f) | 99,671,000 | 98,222,681 | ||||||
|
| |||||||
| 350,120,999 | ||||||||
|
| |||||||
Total U.S. Treasury Obligations |
| 397,166,500 | ||||||
|
| |||||||
| Foreign Government Bonds 2.1% | ||||||||
Sovereign 2.1% | ||||||||
Argentina Bonar Bonds, 8.750%, 05/07/24(f) | 20,310,000 | 21,264,570 | ||||||
| Shares or Principal Amount($) | Value($) | |||||||
Sovereign—continued |
| |||||||
Mexico Government International Bond, 4.600%, 01/23/46 | 1,600,000 | 1,560,000 | ||||||
|
| |||||||
Total Foreign Government Bonds |
| 22,824,570 | ||||||
|
| |||||||
Money Market Funds 12.7% | ||||||||
State Street Institutional Treasury Money Market Fund, Institutional Class, 0.19%(i) | 37,082,162 | 37,082,162 | ||||||
State Street Institutional U.S. Government Money Market Fund, Institutional Class, 0.24%(i)(j) | 103,422,458 | 103,422,458 | ||||||
|
| |||||||
Total Money Market Funds |
| 140,504,620 | ||||||
|
| |||||||
Total Investments |
| 1,220,533,560 | ||||||
Liabilities in Excess of Other | (110,473,972 | ) | ||||||
|
| |||||||
Net Assets — 100.0% | $ | 1,110,059,588 | ||||||
|
| |||||||
| (a) | Rule 144A, Section 4(2) or other security which is restricted as to resale to institutional investors. The Fund’s investment adviser/subadviser has deemed this security to be liquid based upon procedures approved by the Board of Trustees. These securities represent 8.4% of net assets as of March 31, 2016. |
| (b) | Variable or floating rate security. Rate disclosed is as of March 31, 2016. |
| (c) | Less than 0.05% of Net Assets. |
| (d) | The Fund’s investment adviser/subadviser has deemed this security to be illiquid based upon procedures approved by the Board of Trustees. These securities represent 0.0% of net assets as of March 31, 2016. |
| (e) | Perpetual maturity. |
| (f) | The security or a partial position of the security was on loan as of March 31, 2016. The total value of securities on loan as of March 31, 2016 was $101,018,998. |
| (g) | All or a portion of this security has been purchased on a when-issued or delayed-delivery basis. |
| (h) | All or a portion of this security has been segregated, or otherwise earmarked, in connection with obligations for when-issued or delayed-delivery purchase commitments. |
| (i) | Rate disclosed, the 7 day yield, is as of March 31, 2016. |
| (j) | Purchased with cash collateral held from securities lending. The value of the collateral could include collateral held for securities that were sold on or before March 31, 2016 (See Note 2(k)). |
| Investment Abbreviation | ||||
| MTN | — | Medium Term Note | ||
See Notes to Financial Statements.
95
Table of Contents
SCHEDULES OF PORTFOLIO INVESTMENTS
RIDGEWORTH FUNDS March 31, 2016
Seix Total Return Bond Fund — concluded
Forward Foreign Currency Contracts
At March 31, 2016, the Fund’s open forward foreign currency contracts were as follows:
Currency | Counterparty | Delivery Date | Contract Amount in Local Currency | Contract Value in USD | Market Value | Unrealized Appreciation (Depreciation) | ||||||||||||||||
Short: | ||||||||||||||||||||||
Australian Dollar | JPMorgan | 04/13/16 | 15,608,887 | $ | 11,125,000 | $ | 11,960,135 | $ | (835,135 | ) | ||||||||||||
Australian Dollar | JPMorgan | 04/19/16 | 15,568,118 | 11,140,000 | 11,925,564 | (785,564 | ) | |||||||||||||||
Chilean Peso | JPMorgan | 04/04/16 | 4,873,519,600 | 6,861,793 | 7,274,996 | (413,203 | ) | |||||||||||||||
Euro | JPMorgan | 04/11/16 | 19,934,897 | 22,000,000 | 22,688,899 | (688,899 | ) | |||||||||||||||
Mexican Peso | JPMorgan | 04/04/16 | 377,105,679 | 22,023,856 | 21,826,845 | 197,011 | ||||||||||||||||
Mexican Peso | JPMorgan | 07/05/16 | 191,801,581 | 11,080,000 | 11,011,562 | 68,438 | ||||||||||||||||
New Zealand Dollar | JPMorgan | 04/08/16 | 16,888,379 | 11,125,000 | 11,670,740 | (545,740 | ) | |||||||||||||||
New Zealand Dollar | JPMorgan | 04/15/16 | 16,625,104 | 11,100,000 | 11,484,520 | (384,520 | ) | |||||||||||||||
New Zealand Dollar | JPMorgan | 06/07/16 | 16,037,796 | 11,080,000 | 11,048,600 | 31,400 | ||||||||||||||||
Yuan Renminbi Offshore | JPMorgan | 08/19/16 | 148,957,310 | 22,300,000 | 22,896,061 | (596,061 | ) | |||||||||||||||
|
|
|
|
|
| |||||||||||||||||
Total Short Contracts | $ | 139,835,649 | $ | 143,787,922 | $ | (3,952,273 | ) | |||||||||||||||
|
|
|
|
|
| |||||||||||||||||
Long: | ||||||||||||||||||||||
Australian Dollar | JPMorgan | 04/19/16 | 15,568,118 | $ | 11,053,286 | $ | 11,925,564 | $ | 872,278 | |||||||||||||
Chilean Peso | JPMorgan | 04/04/16 | 4,873,519,600 | 6,784,797 | 7,274,996 | 490,199 | ||||||||||||||||
Mexican Peso | JPMorgan | 04/04/16 | 377,105,679 | 20,294,390 | 21,826,845 | 1,532,455 | ||||||||||||||||
Mexican Peso | JPMorgan | 07/05/16 | 377,105,679 | 21,846,508 | 21,650,095 | (196,413 | ) | |||||||||||||||
New Zealand Dollar | JPMorgan | 04/15/16 | 16,625,104 | 11,030,241 | 11,484,520 | 454,279 | ||||||||||||||||
|
|
|
|
|
| |||||||||||||||||
Total Long Contracts | $ | 71,009,222 | $ | 74,162,020 | $ | 3,152,798 | ||||||||||||||||
|
|
|
|
|
| |||||||||||||||||
See Notes to Financial Statements.
96
Table of Contents
SCHEDULES OF PORTFOLIO INVESTMENTS
RIDGEWORTH FUNDS March 31, 2016
Seix U.S. Government Securities Ultra-Short Bond Fund
| Shares or Principal Amount($) | Value($) | |||||||
| Asset-Backed Security 0.7% | ||||||||
Agency Collateralized Mortgage Obligation 0.7% |
| |||||||
NCUA Guaranteed Notes Trust 2010-A1, Series 2010-A1, Cl A, 0.792%, 12/07/20(a) | 11,442,120 | 11,415,574 | ||||||
|
| |||||||
Total Asset-Backed Security | 11,415,574 | |||||||
|
| |||||||
Collateralized Mortgage Obligations 37.5% |
| |||||||
Agency Collateralized Mortgage Obligations 19.5% |
| |||||||
Federal Home Loan Mortgage Corporation | ||||||||
Series 3135, Cl FC, 0.736%, 04/15/26(a) | 1,910,111 | 1,914,831 | ||||||
Series 3223, Cl FP, REMIC, 0.836%, 04/15/32(a) | 2,866,496 | 2,870,043 | ||||||
Series 328, Cl F4, STRIPS, 0.776%, 02/15/38(a) | 20,362,819 | 20,331,289 | ||||||
Series 3320, Cl FC, 0.606%, 05/15/37(a) | 3,928,468 | 3,917,666 | ||||||
Series 3418, Cl FB, REMIC, 0.736%, 04/15/20(a) | 9,761,610 | 9,782,731 | ||||||
Series 3511, Cl FA, 1.436%, 02/15/39(a) | 3,877,247 | 3,937,063 | ||||||
Series 3593, Cl F, | 3,868,153 | 3,884,142 | ||||||
Series 4093, Cl FB, REMIC, 0.786%, 07/15/39(a) | 6,798,370 | 6,814,406 | ||||||
Series 4247, Cl EF, REMIC, 0.836%, 03/15/32(a) | 2,320,503 | 2,331,830 | ||||||
Series 4281, Cl BA, REMIC, 1.250%, 11/15/33 | 390,132 | 390,009 | ||||||
Series 4413, Cl WF, REMIC, 0.776%, 10/15/41(a) | 6,490,947 | 6,481,570 | ||||||
Series 4416, Cl FB, REMIC, 0.746%, 01/15/40(a) | 15,200,923 | 15,156,980 | ||||||
Series 4448, Cl TF, REMIC, 0.746%, 05/15/40(a) | 22,928,903 | 22,855,735 | ||||||
Series 4474, Cl WF, REMIC, 0.776%, 12/15/36(a) | 26,348,311 | 26,319,644 | ||||||
|
| |||||||
| 126,987,939 | ||||||||
|
| |||||||
Federal National Mortgage Association | ||||||||
Series 2010-110, Cl AP, REMIC, 2.000%, 06/25/35 | 1,223,759 | 1,226,605 | ||||||
Series 2012-120, Cl AF, REMIC, 0.683%, 02/25/32(a) | 1,976,054 | 1,975,191 | ||||||
Series 2012-73, Cl LF, REMIC, 0.883%, 06/25/39(a) | 4,061,660 | 4,052,919 | ||||||
Series 2014-75, Cl FK, REMIC, 0.783%, 12/25/41(a) | 4,797,897 | 4,820,306 | ||||||
| Shares or Principal Amount($) | Value($) | |||||||
Agency Collateralized Mortgage Obligations—continued |
| |||||||
Series 2015-42, Cl BF, REMIC, 0.736%, 06/25/45(a) | 29,932,169 | 29,858,344 | ||||||
|
| |||||||
| 41,933,365 | ||||||||
|
| |||||||
Government National Mortgage Association | ||||||||
Series 2012-98, Cl FM, 0.632%, 12/20/38(a) | 2,332,594 | 2,330,299 | ||||||
|
| |||||||
NCUA Guaranteed Notes | ||||||||
Series 2010-R1, Cl 1A, 0.888%, 10/07/20(a) | 28,314,855 | 28,297,558 | ||||||
Series 2010-R2, Cl 1A, 0.808%, 11/06/17(a) | 47,910,320 | 47,860,958 | ||||||
Series 2010-R2, Cl 2A, 0.908%, 11/05/20(a) | 27,297,585 | 27,271,928 | ||||||
Series 2010-R3, Cl 1A, 0.998%, 12/08/20(a) | 2,792,249 | 2,796,244 | ||||||
Series 2011-R1, Cl 1A, 0.888%, 01/08/20(a) | 11,353,518 | 11,347,453 | ||||||
Series 2011-R2, Cl 1A, 0.838%, 02/06/20(a) | 14,904,762 | 14,867,186 | ||||||
|
| |||||||
| 132,441,327 | ||||||||
|
| |||||||
| 303,692,930 | ||||||||
|
| |||||||
Agency Collateralized Planned Amortization Class Mortgage Obligations 3.0% |
| |||||||
Federal Home Loan Mortgage Corporation | ||||||||
Series 3071, Cl ZX, REMIC, 0.736%, 04/15/35(a) | 2,368,443 | 2,352,716 | ||||||
Series 3767, Cl JF, REMIC, 0.736%, 02/15/39(a) | 1,904,905 | 1,910,640 | ||||||
Series 3925, Cl FD, REMIC, 0.886%, 07/15/40(a) | 2,410,567 | 2,417,486 | ||||||
Series 4203, Cl PF, REMIC, 0.686%, 09/15/42(a) | 24,246,149 | 24,289,908 | ||||||
|
| |||||||
| 30,970,750 | ||||||||
|
| |||||||
Federal National Mortgage Association | ||||||||
Series 2006-113, Cl NF, REMIC, 0.783%, 09/25/36(a) | 11,770,512 | 11,801,616 | ||||||
Series 2008-24, Cl PF, REMIC, 1.083%, 02/25/38(a) | 2,458,024 | 2,472,640 | ||||||
Series 2012-113, Cl PF, REMIC, 0.783%, 10/25/40(a) | 1,326,973 | 1,326,843 | ||||||
|
| |||||||
| 15,601,099 | ||||||||
|
| |||||||
| 46,571,849 | ||||||||
|
| |||||||
See Notes to Financial Statements.
97
Table of Contents
SCHEDULES OF PORTFOLIO INVESTMENTS
RIDGEWORTH FUNDS March 31, 2016
Seix U.S. Government Securities Ultra-Short Bond Fund — continued
| Shares or Principal Amount($) | Value($) | |||||||
Agency Collateralized Support Mortgage |
| |||||||
Federal National Mortgage Association | ||||||||
Series 1994-22, Cl F, REMIC, 1.633%, 01/25/24(a) | 331,770 | 338,247 | ||||||
|
| |||||||
Commercial Mortgage Backed Securities 15.0% |
| |||||||
Federal Home Loan Mortgage Corporation | ||||||||
Series KF03, Cl A, | 2,744,345 | 2,738,649 | ||||||
Series KF04, Cl A, | 5,090,923 | 5,067,163 | ||||||
Series KF05, Cl A, | 12,018,157 | 11,969,786 | ||||||
Series KF09, Cl A, | 14,139,004 | 13,914,162 | ||||||
Series KF10, Cl A, | 11,896,621 | 11,699,012 | ||||||
Series KF11, Cl A, | 17,000,000 | 16,968,797 | ||||||
|
| |||||||
| 62,357,569 | ||||||||
|
| |||||||
Federal National Mortgage Association | ||||||||
Series 2011-M1, Cl FA, 0.883%, 06/25/21(a) | 29,179,135 | 28,970,624 | ||||||
Series 2012-M13, Cl ASQ2, 1.246%, 08/25/17 | 94,521 | 94,450 | ||||||
Series 2012-M9, Cl ASQ2, 1.513%, 12/25/17 | 4,041,455 | 4,053,581 | ||||||
Series 2013-M14, Cl FA, 0.783%, 08/25/18(a) | 24,079,267 | 24,004,012 | ||||||
Series 2014-M5, Cl ASQ2, 2.034%, 03/25/19 | 10,000,000 | 10,143,216 | ||||||
Series 2014-M6, Cl FA, 0.692%, 12/25/17(a) | 2,439,937 | 2,433,203 | ||||||
Series 2014-M8, Cl FA, 0.653%, 05/25/18(a) | 6,487,762 | 6,446,486 | ||||||
Series 2015-M1, Cl ASQ2, 1.626%, 02/25/18 | 6,557,000 | 6,599,725 | ||||||
Series 2015-M10, Cl FA, 0.653%, 03/25/19(a) | 22,754,537 | 22,662,616 | ||||||
Series 2015-M12, Cl FA, 0.764%, 04/25/20(a) | 37,072,172 | 36,910,593 | ||||||
Series 2015-M13, Cl ASQ2, 1.646%, 09/25/19 | 10,615,000 | 10,686,476 | ||||||
Series 2015-M14, Cl FA, 1.053%, 10/25/25(a) | 9,984,985 | 9,887,035 | ||||||
| Shares or Principal Amount($) | Value($) | |||||||
Commercial Mortgage Backed Securities—continued |
| |||||||
Series 2015-M7, Cl ASQ2, 1.550%, 04/25/18 | 7,215,000 | 7,241,740 | ||||||
Series 2015-M8, Cl FA, 0.576%, 11/25/18(a) | 1,094,500 | 1,085,323 | ||||||
|
| |||||||
| 171,219,080 | ||||||||
|
| |||||||
| 233,576,649 | ||||||||
|
| |||||||
Total Collateralized Mortgage Obligations | 584,179,675 | |||||||
|
| |||||||
U.S. Government Agency Mortgages 56.2% |
| |||||||
Federal Home Loan Mortgage Corporation | ||||||||
Pool #G14742, 2.000%, 05/01/23 | 500,069 | 510,014 | ||||||
Pool #847615, 2.728%, 07/01/33(a) | 4,438,788 | 4,686,373 | ||||||
Pool #1B8683, 2.577%, 04/01/34(a) | 12,120,700 | 12,755,862 | ||||||
Pool #848744, 2.580%, 05/01/34(a) | 17,027,563 | 17,860,977 | ||||||
Pool #847991, 2.518%, 03/01/35(a) | 8,188,851 | 8,591,398 | ||||||
Pool #848736, 2.536%, 05/01/35(a) | 26,987,755 | 28,252,060 | ||||||
Pool #848797, 2.488%, 07/01/35(a) | 4,338,436 | 4,563,343 | ||||||
Pool #1Q0025, 2.564%, 02/01/36(a) | 3,053,242 | 3,205,592 | ||||||
Pool #1H2602, 2.570%, 03/01/36(a) | 3,365,444 | 3,511,624 | ||||||
Pool #1Q1407, 2.557%, 07/01/36(a) | 9,497,948 | 10,017,180 | ||||||
Pool #848747, 2.590%, 07/01/36(a) | 15,311,682 | 16,155,010 | ||||||
Pool #848569, 2.529%, 11/01/36(a) | 13,235,155 | 13,955,328 | ||||||
Pool #1Q1404, 2.572%, 01/01/37(a) | 13,926,513 | 14,657,655 | ||||||
Pool #1Q1195, 2.320%, 05/01/37(a) | 13,856,060 | 14,508,875 | ||||||
Pool #848796, 2.541%, 05/01/37(a) | 28,496,121 | 29,990,758 | ||||||
Pool #1Q1282, 2.321%, 07/01/37(a) | 4,275,401 | 4,489,757 | ||||||
Pool #848852, 2.532%, 08/01/37(a) | 19,335,375 | 20,370,760 | ||||||
Pool #1Q0652, 2.561%, 02/01/38(a) | 2,063,623 | 2,179,444 | ||||||
See Notes to Financial Statements.
98
Table of Contents
SCHEDULES OF PORTFOLIO INVESTMENTS
RIDGEWORTH FUNDS March 31, 2016
Seix U.S. Government Securities Ultra-Short Bond Fund — continued
| Shares or Principal Amount($) | Value($) | |||||||
U.S. Government Agency Mortgages—continued |
| |||||||
Pool #1Q1405, 2.537%, 04/01/39(a) | 4,440,503 | 4,676,489 | ||||||
Pool #1Q1420, 2.588%, 09/01/39(a) | 19,453,406 | 20,556,393 | ||||||
Pool #849139, 3.128%, 09/01/43(a) | 3,259,568 | 3,394,547 | ||||||
Pool #2B4993, 2.857%, 12/01/45(a) | 4,739,208 | 4,903,358 | ||||||
Pool #2B5072, 2.852%, 01/01/46(a) | 5,601,803 | 5,795,267 | ||||||
|
| |||||||
| 249,588,064 | ||||||||
|
| |||||||
Federal National Mortgage Association | ||||||||
Pool #745530, 5.408%, 04/01/16 | 1,013 | 1,010 | ||||||
Pool #995887, 4.723%, 05/01/16 | 4,665 | 4,654 | ||||||
Pool #745764, 5.750%, 07/01/16 | 7,470,382 | 7,469,430 | ||||||
Pool #888015, 5.867%, 11/01/16 | 131,473 | 131,383 | ||||||
Pool #874196, 5.360%, 12/01/16 | 730,000 | 737,078 | ||||||
Pool #735745, 5.600%, 01/01/17 | 2,720 | 2,719 | ||||||
Pool #889232, 5.475%, 06/01/17 | 2,023,780 | 2,077,568 | ||||||
Pool #888969, 5.911%, 11/01/17 | 2,699,353 | 2,839,450 | ||||||
Pool #467010, 3.520%, 01/01/18 | 5,438,443 | 5,611,599 | ||||||
Pool #385912, 5.350%, 02/01/18 | 5,508,115 | 5,737,991 | ||||||
Pool #467288, 2.800%, 03/01/18 | 1,548,865 | 1,587,616 | ||||||
Pool #468279, 3.470%, 06/01/18 | 3,773,849 | 3,892,161 | ||||||
Pool #AL0561, 3.743%, 06/01/18 | 19,315,514 | 20,063,345 | ||||||
Pool #254906, 4.500%, 10/01/18 | 12,814,557 | 13,256,224 | ||||||
Pool #AM7163, 0.875%, 05/01/19(a) | 10,805,995 | 10,796,786 | ||||||
Pool #310089, 5.000%, 05/01/19 | 28,912,991 | 29,850,935 | ||||||
Pool #958815, 4.506%, 06/01/19 | 2,455,000 | 2,557,803 | ||||||
Pool #AM6261, 0.645%, 07/01/19(a) | 15,370,000 | 15,369,335 | ||||||
Pool #AM7028, 0.665%, 10/01/19(a) | 18,405,000 | 18,397,357 | ||||||
| Shares or Principal Amount($) | Value($) | |||||||
U.S. Government Agency Mortgages—continued |
| |||||||
Pool #AB0351, 4.500%, 04/01/20 | 17,626,115 | 18,263,204 | ||||||
Pool #AM9893, 0.805%, 10/01/21(a) | 27,500,000 | 27,484,210 | ||||||
Pool #469856, 1.215%, 12/01/21(a) | 17,690,000 | 17,650,564 | ||||||
Pool #AM9040, 0.695%, 06/01/22(a) | 17,995,000 | 17,986,565 | ||||||
Pool #AM9651, 0.725%, 08/01/22(a) | 14,330,000 | 14,322,541 | ||||||
Pool #AM7213, 1.075%, 08/01/22(a) | 4,540,000 | 4,536,172 | ||||||
Pool #MA1415, 2.000%, 04/01/23 | 508,496 | 518,519 | ||||||
Pool #793025, 2.141%, 07/01/34(a) | 638,581 | 663,609 | ||||||
Pool #AL0222, 2.498%, 07/01/34(a) | 9,356,044 | 9,835,230 | ||||||
Pool #AD0064, 2.147%, 01/01/35(a) | 8,750,017 | 9,093,001 | ||||||
Pool #805338, 2.407%, 01/01/35(a) | 107,293 | 110,284 | ||||||
Pool #813718, 2.462%, 01/01/35(a) | 7,623,224 | 8,042,480 | ||||||
Pool #809384, 2.590%, 01/01/35(a) | 363,010 | 380,592 | ||||||
Pool #809324, 2.223%, 02/01/35(a) | 7,178 | 7,455 | ||||||
Pool #814686, 2.634%, 03/01/35(a) | 183,130 | 189,813 | ||||||
Pool #AD7165, 2.126%, 04/01/35(a) | 1,823,581 | 1,915,892 | ||||||
Pool #995609, 2.612%, 04/01/35(a) | 1,863,919 | 1,970,575 | ||||||
Pool #822302, 2.726%, 05/01/35(a) | 3,258,592 | 3,434,557 | ||||||
Pool #AD0886, 2.590%, 07/01/35(a) | 2,696,739 | 2,839,663 | ||||||
Pool #AL0505, 2.423%, 11/01/35(a) | 8,487,741 | 8,971,538 | ||||||
Pool #AL0345, 2.542%, 11/01/35(a) | 4,100,889 | 4,324,970 | ||||||
Pool #AD0377, 2.115%, 01/01/36(a) | 2,117,185 | 2,190,507 | ||||||
Pool #888722, 2.294%, 01/01/36(a) | 1,841,300 | 1,937,061 | ||||||
Pool #995540, 2.477%, 01/01/36(a) | 6,613,530 | 6,959,534 | ||||||
Pool #888782, 2.454%, 03/01/36(a) | 1,521,046 | 1,599,073 | ||||||
See Notes to Financial Statements.
99
Table of Contents
SCHEDULES OF PORTFOLIO INVESTMENTS
RIDGEWORTH FUNDS March 31, 2016
Seix U.S. Government Securities Ultra-Short Bond Fund — continued
| Shares or Principal Amount($) | Value($) | |||||||
U.S. Government Agency Mortgages—continued |
| |||||||
Pool #AL1015, 2.467%, 04/01/36(a) | 2,160,611 | 2,277,347 | ||||||
Pool #AL2202, 2.547%, 06/01/36(a) | 9,113,290 | 9,579,087 | ||||||
Pool #AL0854, 2.552%, 06/01/36(a) | 5,811,669 | 6,122,514 | ||||||
Pool #888859, 2.517%, 10/01/36(a) | 742,470 | 782,384 | ||||||
Pool #AA3517, 2.363%, 11/01/36(a) | 5,483,916 | 5,741,511 | ||||||
Pool #903166, 2.628%, 11/01/36(a) | 2,534,748 | 2,681,270 | ||||||
Pool #AL0968, 2.530%, 12/01/36(a) | 14,769,443 | 15,562,791 | ||||||
Pool #906216, 2.552%, 01/01/37(a) | 2,109,862 | 2,213,527 | ||||||
Pool #AL0872, 2.069%, 07/01/37(a) | 3,890,382 | 4,050,746 | ||||||
Pool #AL0960, 2.485%, 07/01/37(a) | 15,282,993 | 16,097,686 | ||||||
Pool #AD0380, 2.468%, 10/01/37(a) | 7,690,140 | 8,083,743 | ||||||
Pool #AL0966, 2.583%, 11/01/37(a) | 5,836,673 | 6,140,368 | ||||||
Pool #AE0332, 2.634%, 11/01/37(a) | 6,032,058 | 6,369,114 | ||||||
Pool #AL0270, 2.384%, 08/01/38(a) | 13,449,320 | 14,141,560 | ||||||
Pool #AE0066, 2.432%, 09/01/39(a) | 13,670,322 | 14,454,045 | ||||||
Pool #725874, 2.550%, 09/01/39(a) | 67,384 | 70,902 | ||||||
Pool #AL2013, 2.467%, 10/01/39 | 320,658 | 338,499 | ||||||
Pool #AL6516, 2.601%, 04/01/40(a) | 14,780,776 | 15,509,979 | ||||||
Pool #AE0544, 2.575%, 11/01/40(a) | 8,565,507 | 8,982,315 | ||||||
Pool #AL0323, 3.203%, 06/01/41(a) | 10,646,147 | 11,240,328 | ||||||
Pool #AL1801, 2.935%, 05/01/42(a) | 6,487,616 | 6,730,385 | ||||||
Pool #AT1150, 2.802%, 09/01/43(a) | 11,847,680 | 12,230,439 | ||||||
Pool #AT1155, 2.980%, 09/01/43(a) | 3,564,512 | 3,704,688 | ||||||
Pool #AL7562, 2.692%, 10/01/43 | 20,431,373 | 20,998,626 | ||||||
Pool #AY4058, 2.756%, 05/01/44(a) | 4,265,081 | 4,397,873 | ||||||
| Shares or Principal Amount($) | Value($) | |||||||
U.S. Government Agency Mortgages—continued |
| |||||||
Pool #AW2489, 2.407%, 06/01/44 | 11,411,778 | 11,709,983 | ||||||
Pool #AL5406, 3.213%, 06/01/44(a) | 9,086,295 | 9,514,583 | ||||||
Pool #AW6998, 3.216%, 06/01/44(a) | 2,702,045 | 2,829,688 | ||||||
Pool #AW9723, 2.299%, 07/01/44(a) | 6,528,935 | 6,727,440 | ||||||
Pool #AL5640, 2.271%, 08/01/44(a) | 4,006,245 | 4,134,014 | ||||||
Pool #AW2253, 3.030%, 08/01/44(a) | 3,495,666 | 3,636,593 | ||||||
Pool #AL5643, 2.978%, 09/01/44(a) | 2,293,576 | 2,379,022 | ||||||
Pool #AL5793, 3.129%, 09/01/44(a) | 4,480,288 | 4,678,691 | ||||||
Pool #AX5937, 2.581%, 11/01/44(a) | 1,261,117 | 1,299,108 | ||||||
Pool #AX9332, 3.040%, 12/01/44(a) | 9,456,604 | 9,827,445 | ||||||
Pool #AY0836, 2.274%, 01/01/45(a) | 1,995,858 | 2,048,967 | ||||||
Pool #AY3142, 2.604%, 01/01/45(a) | 1,088,799 | 1,123,510 | ||||||
Pool #AY2431, 2.249%, 02/01/45(a) | 4,931,392 | 5,069,242 | ||||||
Pool #AY7185, 2.442%, 04/01/45(a) | 5,057,956 | 5,186,516 | ||||||
Pool #AZ7163, 2.610%, 07/01/45 | 1,768,757 | 1,818,991 | ||||||
Pool #AZ8772, 2.707%, 09/01/45 | 5,618,032 | 5,786,130 | ||||||
|
| |||||||
| 581,883,703 | ||||||||
|
| |||||||
Government National Mortgage Association | ||||||||
Pool #082480, 3.000%, 02/20/40 | 986,479 | 1,022,798 | ||||||
Pool #082542, 1.750%, 05/20/40 | 2,778,577 | 2,858,358 | ||||||
Pool #082540, 3.000%, 05/20/40(a) | 6,222,553 | 6,409,102 | ||||||
Pool #082580, 2.750%, 07/20/40(a) | 2,285,625 | 2,362,998 | ||||||
Pool #082627, 3.000%, 09/20/40(a) | 3,589,949 | 3,715,519 | ||||||
Pool #082852, 1.750%, 06/20/41(a) | 20,075,371 | 20,652,416 | ||||||
Pool #082904, 1.880%, 08/20/41(a) | 1,763,295 | 1,810,998 | ||||||
See Notes to Financial Statements.
100
Table of Contents
SCHEDULES OF PORTFOLIO INVESTMENTS
RIDGEWORTH FUNDS March 31, 2016
Seix U.S. Government Securities Ultra-Short Bond Fund — concluded
| Shares or Principal Amount($) | Value($) | |||||||
U.S. Government Agency Mortgages—continued |
| |||||||
Pool #MA0414, 1.875%, 09/20/42(a) | 5,641,148 | 5,799,770 | ||||||
|
| |||||||
| 44,631,959 | ||||||||
|
| |||||||
Total U.S. Government Agency Mortgages | 876,103,726 | |||||||
|
| |||||||
U.S. Treasury Obligation 0.1% |
| |||||||
U.S. Treasury Bill 0.1% | ||||||||
0.000%, 07/21/16(c) | 1,000,000 | 999,175 | ||||||
|
| |||||||
Total U.S. Treasury Obligation | 999,175 | |||||||
|
| |||||||
Money Market Fund 5.3% | ||||||||
State Street Institutional U.S. Government Money Market Fund, Institutional Class, 0.24%(d) | 81,726,491 | 81,726,491 | ||||||
|
| |||||||
Total Money Market Fund | 81,726,491 | |||||||
|
| |||||||
| Shares or Principal Amount($) | Value($) | |||||
Total Investments | 1,554,424,641 | |||||
Other Assets in Excess of | 3,474,619 | |||||
|
| |||||
Net Assets — 100.0% | $ | 1,557,899,260 | ||||
|
| |||||
| (a) | Variable or floating rate security. Rate disclosed is as of March 31, 2016. |
| (b) | Less than 0.05% of Net Assets. |
| (c) | Zero coupon bond. |
| (d) | Rate disclosed, the 7 day yield, is as of March 31, 2016. |
Investment Abbreviations
| REMIC | — | Real Estate Mortgage Investment Conduit | ||
| STRIPS | — | Separate Trading of Registered Interest and Principal Securities |
Open Futures Contracts
At March 31, 2016, the Fund’s open futures contracts were as follows:
Description | Position | Notional Amount | Expiration Month | Contracts | Unrealized Depreciation | |||||||||||||
U.S. Treasury 2 Year Note | Short | $(102,999,877) | June 2016 | 471 | $(31,373) | |||||||||||||
U.S. Treasury 5 Year Note | Short | (19,735,056) | June 2016 | 163 | (14,686) | |||||||||||||
|
| |||||||||||||||||
| $(46,059) | ||||||||||||||||||
|
| |||||||||||||||||
See Notes to Financial Statements.
101
Table of Contents
SCHEDULES OF PORTFOLIO INVESTMENTS
RIDGEWORTH FUNDS March 31, 2016
Seix U.S. Mortgage Fund
| Shares or Principal Amount($) | Value($) | |||||||
| Collateralized Mortgage Obligations 4.8% | ||||||||
Commercial Mortgage Backed Securities 4.8% |
| |||||||
Federal Home Loan Mortgage Corporation | ||||||||
Series KP02, Cl A2, 2.355%, 04/25/21(a) | 140,000 | 143,428 | ||||||
|
| |||||||
Federal National Mortgage Association | ||||||||
Series 2006-M2, Cl A2A, 5.271%, 10/25/32 | 269,363 | 293,273 | ||||||
|
| |||||||
GS Mortgage Securities Corp. II | ||||||||
Series 2012-ALOH, Cl A, | 365,000 | 388,535 | ||||||
Series 2012-BWTR, Cl B, | 109,000 | 108,346 | ||||||
|
| |||||||
| 496,881 | ||||||||
|
| |||||||
Morgan Stanley Capital I Trust | ||||||||
Series 2014-CPT, Cl A, | 300,000 | 315,088 | ||||||
|
| |||||||
OBP Depositor LLC Trust | ||||||||
Series 2010-OBP, Cl A, | 500,000 | 553,358 | ||||||
|
| |||||||
Total Collateralized Mortgage Obligations | 1,802,028 | |||||||
|
| |||||||
U.S. Government Agency Mortgages 92.1% |
| |||||||
Federal Home Loan Mortgage Corporation | ||||||||
Pool #J23359, 2.500%, 04/01/23 | 515,884 | 530,913 | ||||||
Pool #C01785, 5.000%, 02/01/34 | 188,687 | 209,493 | ||||||
Pool #C91768, 3.500%, 07/01/34 | 950,863 | 1,002,005 | ||||||
Pool #G01838, 5.000%, 07/01/35 | 160,979 | 178,604 | ||||||
Pool #A47828, 3.500%, 08/01/35 | 812,529 | 857,976 | ||||||
Pool #Z40004, 6.000%, 08/01/36 | 56,086 | 64,122 | ||||||
Pool #A85718, 4.000%, 04/01/39 | 66,371 | 72,038 | ||||||
Pool #G08347, 4.500%, 06/01/39 | 43,513 | 47,343 | ||||||
Pool #A89148, 4.000%, 10/01/39 | 133,353 | 142,712 | ||||||
Pool #G08372, 4.500%, 11/01/39 | 210,215 | 228,829 | ||||||
Pool #A93101, 5.000%, 07/01/40 | 263,538 | 290,539 | ||||||
Pool #G06061, 4.000%, 10/01/40 | 148,353 | 159,310 | ||||||
Pool #A95085, 4.000%, 11/01/40 | 752,459 | 805,192 | ||||||
Pool #A95796, 4.000%, 12/01/40 | 92,011 | 98,535 | ||||||
Pool #G07068, 5.000%, 07/01/41 | 593,505 | 651,930 | ||||||
Pool #G60126, 4.500%, 11/01/41 | 263,604 | 286,767 | ||||||
Pool #G07031, 4.000%, 05/01/42 | 599,868 | 644,382 | ||||||
Pool #Q10929, 3.500%, 09/01/42 | 470,212 | 492,766 | ||||||
Pool #Q18522, 3.500%, 05/01/43(c) | 509,301 | 535,502 | ||||||
Pool #849167, 2.947%, 10/01/43(a) | 788,216 | 816,638 | ||||||
| Shares or Principal Amount($) | Value($) | |||||||
U.S. Government Agency Mortgages—continued |
| |||||||
Pool #G60019, 4.500%, 03/01/44 | 678,203 | 739,046 | ||||||
Pool #Q26366, 4.000%, 05/01/44 | 257,284 | 277,515 | ||||||
Pool #V81283, 4.000%, 07/01/44 | 481,859 | 514,681 | ||||||
Pool #Q31645, 4.000%, 02/01/45 | 133,385 | 143,120 | ||||||
|
| |||||||
| 9,789,958 | ||||||||
|
| |||||||
Federal National Mortgage Association | ||||||||
Pool #AM9210, 2.400%, 12/01/20 | 494,384 | 510,574 | ||||||
Pool #AN0371, 2.910%, 11/01/22 | 1,190,911 | 1,255,913 | ||||||
Pool #AL2855, 2.500%, 01/01/23 | 417,836 | 430,073 | ||||||
Pool #MA1688, 3.500%, 12/01/33 | 70,841 | 74,900 | ||||||
Pool #MA1763, 3.500%, 01/01/34 | 126,991 | 134,260 | ||||||
Pool #AL0049, 6.000%, 12/01/35 | 44,963 | 51,650 | ||||||
Pool #AB6401, 3.000%, 10/01/37 | 366,211 | 377,620 | ||||||
Pool #889529, 6.000%, 03/01/38 | 292,729 | 337,034 | ||||||
Pool #889579, 6.000%, 05/01/38 | 190,212 | 216,916 | ||||||
Pool #AE0814, 6.000%, 09/01/39 | 525,940 | 600,492 | ||||||
Pool #AC2817, 4.000%, 10/01/39 | 11,010 | 11,762 | ||||||
Pool #AX3605, 3.500%, 01/01/40 | 234,178 | 246,065 | ||||||
Pool #AL7497, 3.500%, 09/01/40 | 1,896,325 | 1,992,205 | ||||||
Pool #AD9725, 3.500%, 10/01/40 | 85,543 | 89,872 | ||||||
Pool #AE3860, 5.000%, 10/01/40 | 730,364 | 810,815 | ||||||
Pool #AE4414, 4.000%, 11/01/40 | 41,052 | 43,993 | ||||||
Pool #AE5143, 4.000%, 11/01/40 | 37,030 | 39,682 | ||||||
Pool #AB2071, 3.500%, 01/01/41 | 92,827 | 97,532 | ||||||
Pool #AH4161, 3.500%, 01/01/41(d) | 1,073,528 | 1,127,939 | ||||||
Pool #MA0639, 4.000%, 02/01/41 | 620,041 | 664,337 | ||||||
Pool #AL0215, 4.500%, 04/01/41 | 176,494 | 192,670 | ||||||
Pool #890381, 3.500%, 10/01/41 | 366,711 | 385,285 | ||||||
Pool #AB3865, 3.500%, 11/01/41 | 59,594 | 62,902 | ||||||
Pool #AW8154, 3.500%, 01/01/42 | 1,085,112 | 1,142,186 | ||||||
Pool #AI9101, 3.500%, 04/01/42 | 445,294 | 469,466 | ||||||
Pool #AB5188, 3.500%, 05/01/42 | 78,174 | 82,152 | ||||||
Pool #AO8632, 3.500%, 07/01/42 | 296,281 | 311,827 | ||||||
Pool #AP7874, 3.500%, 10/01/42 | 140,363 | 147,507 | ||||||
Pool #AB8726, 3.500%, 03/01/43 | 100,120 | 105,207 | ||||||
Pool #AL3657, 3.500%, 06/01/43 | 202,058 | 213,558 | ||||||
Pool #AL5939, 3.500%, 09/01/43(c) | 844,492 | 888,913 | ||||||
Pool #AL5528, 4.000%, 05/01/44 | 330,681 | 356,146 | ||||||
Pool #AL6223, 4.500%, 08/01/44(d) | 763,315 | 831,107 | ||||||
Pool #AY2685, 4.500%, 01/01/45 | 90,976 | 99,891 | ||||||
Pool #AX8835, 2.801%, 02/01/45(a) | 170,272 | 175,441 | ||||||
See Notes to Financial Statements.
102
Table of Contents
SCHEDULES OF PORTFOLIO INVESTMENTS
RIDGEWORTH FUNDS March 31, 2016
Seix U.S. Mortgage Fund — concluded
| Shares or Principal Amount($) | Value($) | |||||||
U.S. Government Agency Mortgages—continued |
| |||||||
Pool #AZ5755, 3.500%, 09/01/45 | 721,024 | 759,776 | ||||||
Pool #AZ7723, 4.500%, 10/01/45 | 1,369,663 | 1,494,300 | ||||||
Pool #BC2470, 3.500%, 02/01/46 | 204,638 | 215,865 | ||||||
|
| |||||||
| 17,047,833 | ||||||||
|
| |||||||
Government National Mortgage Association | ||||||||
Pool #004396, 4.000%, 03/20/39 | 231,015 | 247,685 | ||||||
Pool #004637, 5.000%, 02/20/40 | 216,941 | 240,039 | ||||||
Pool #AA5471, 4.000%, 12/15/41 | 926,413 | 993,950 | ||||||
Pool #MA0321, 5.000%, 08/20/42 | 25,679 | 28,626 | ||||||
Pool #666413, 4.000%, 09/15/43 | 71,915 | 77,666 | ||||||
Pool #MA2681, 5.000%, 03/20/45 | 799,943 | 871,014 | ||||||
Pool #AM0226, 4.000%, 05/15/45 | 199,327 | 213,512 | ||||||
Pool #AM9875, 4.000%, 06/15/45 | 215,124 | 231,060 | ||||||
Pool #AN7421, 4.000%, 06/15/45 | 614,481 | 658,894 | ||||||
Pool #AN8476, 3.500%, 07/15/45 | 229,448 | 242,618 | ||||||
Pool #626960, 3.500%, 07/15/45 | 298,932 | 317,678 | ||||||
Pool #AN5781, 4.000%, 07/15/45 | 134,775 | 144,561 | ||||||
Pool #AN6811, 4.000%, 07/15/45 | 692,047 | 741,373 | ||||||
Pool #AO0509, 3.500%, 08/15/45 | 255,231 | 270,179 | ||||||
Pool #626970, 3.500%, 08/15/45 | 316,368 | 336,218 | ||||||
Pool #AO3608, 4.000%, 08/15/45 | 1,027,186 | 1,102,011 | ||||||
Pool #AM9046, 4.500%, 08/15/45 | 324,408 | 353,818 | ||||||
Pool #AB5970, 4.000%, 10/15/45 | 176,721 | 190,238 | ||||||
Pool #AB5975, 4.000%, 11/15/45 | 76,561 | 82,417 | ||||||
|
| |||||||
| 7,343,557 | ||||||||
|
| |||||||
Total U.S. Government Agency Mortgages | 34,181,348 | |||||||
|
| |||||||
| Shares or Principal Amount($) | Value($) | |||||||
| U.S. Treasury Obligations 1.8% | ||||||||
U.S. Treasury Notes 1.8% | ||||||||
1.375%, 02/29/20 | 360,000 | 363,952 | ||||||
1.625%, 02/15/26 | 300,000 | 295,641 | ||||||
|
| |||||||
Total U.S. Treasury Obligations | 659,593 | |||||||
|
| |||||||
Money Market Fund 6.6% | ||||||||
State Street Institutional Treasury Money Market Fund, Institutional Class, | 2,438,560 | 2,438,560 | ||||||
|
| |||||||
Total Money Market Fund | 2,438,560 | |||||||
|
| |||||||
Total Investments | 39,081,529 | |||||||
Liabilities in Excess of | (1,976,006 | ) | ||||||
|
| |||||||
Net Assets — 100.0% | $ | 37,105,523 | ||||||
|
| |||||||
| (a) | Variable or floating rate security. Rate disclosed is as of March 31, 2016. |
| (b) | Rule 144A, Section 4(2) or other security which is restricted as to resale to institutional investors. The Fund’s investment adviser/subadviser has deemed this security to be liquid based upon procedures approved by the Board of Trustees. These securities represent 3.7% of net assets as of March 31, 2016. |
| (c) | All or a portion of this security has been purchased on a when-issued or delayed-delivery basis. |
| (d) | All or a portion of this security has been segregated, or otherwise earmarked, in connection with obligations for when-issued or delayed-delivery purchase commitments. |
| (e) | Rate disclosed, the 7 day yield, is as of March 31, 2016. |
See Notes to Financial Statements.
103
Table of Contents
SCHEDULES OF PORTFOLIO INVESTMENTS
RIDGEWORTH FUNDS March 31, 2016
Seix Ultra-Short Bond Fund
| Shares or Principal Amount($) | Value($) | |||||||
| Asset-Backed Securities 20.6% | ||||||||
Auto Floor Plan 1.1% |
| |||||||
BMW Floorplan Master Owner Trust, Series 2015-1A, Cl A, | 1,100,000 | 1,100,443 | ||||||
|
| |||||||
Automobiles 7.2% | ||||||||
AmeriCredit Automobile Receivables Trust, Series 2013-5, Cl B, 1.520%, 01/08/19 | 1,055,000 | 1,055,002 | ||||||
California Republic Auto Receivables Trust, Series 2014-1, Cl A3, 0.850%, 05/15/18 | 238,434 | 238,240 | ||||||
Capital Auto Receivables Asset Trust, Series 2013-3, Cl A4, 1.680%, 04/20/18 | 880,000 | 881,423 | ||||||
Chrysler Capital Auto Receivables Trust, Series 2013-BA, Cl B, | 500,000 | 499,536 | ||||||
Fifth Third Auto Trust, Series 2015-1, Cl A2B, | 1,000,000 | 1,000,507 | ||||||
First Investors Auto Owner Trust, Series 2013-1A, Cl B, | 500,000 | 499,854 | ||||||
Harley-Davidson Motorcycle Trust, Series 2014-1, Cl A2B, 0.606%, 04/15/18(a) | 115,635 | 115,619 | ||||||
Honda Auto Receivables Owner Trust, Series 2013-2, Cl A3, 0.530%, 02/16/17 | 167,575 | 167,532 | ||||||
Hyundai Auto Receivables Trust, Series 2014-A, Cl B, 1.730%, 08/15/19 | 585,000 | 586,544 | ||||||
Mercedes Benz Auto Lease Trust, Series 2015-B, Cl A2B, 0.956%, 01/16/18(a) | 935,000 | 935,579 | ||||||
Toyota Auto Receivables 2015-A Owner Trust, Series 2015-A, Cl A3, 1.120%, 02/15/19 | 1,600,000 | 1,600,997 | ||||||
|
| |||||||
| 7,580,833 | ||||||||
|
| |||||||
Credit Card 8.6% | ||||||||
American Express Credit Account Master Trust, Series 2013-1, Cl A, 0.856%, 02/16/21(a) | 1,463,000 | 1,466,033 | ||||||
American Express Credit Account Master Trust, Series 2013-2, Cl A, 0.856%, 05/17/21(a) | 125,000 | 125,200 | ||||||
| Shares or Principal Amount($) | Value($) | |||||||
Credit Card—continued | ||||||||
American Express Issuance Trust II, Series 2013-1, Cl A, | 750,000 | 750,065 | ||||||
Barclays Dryrock Issuance Trust, Series 2014-1, Cl A, | 1,280,000 | 1,279,616 | ||||||
Cabela’s Credit Card Master Note Trust, Series 2014-2, Cl A, | 1,512,000 | 1,487,367 | ||||||
Capital One Multi-Asset Execution Trust, Series 2015-A1, Cl A, 1.390%, 01/15/21 | 873,000 | 875,816 | ||||||
Chase Issuance Trust, Series 2007-A2, Cl A2, 0.486%, 04/15/19(a) | 924,000 | 922,454 | ||||||
Discover Card Execution Note Trust, Series 2014-A1, Cl A1, 0.866%, 07/15/21(a) | 1,050,000 | 1,050,840 | ||||||
Nordstrom Credit Card Master Note Trust II, Series 2011-1A, Cl A, 2.280%, 11/15/19(b) | 1,045,000 | 1,051,396 | ||||||
|
| |||||||
| 9,008,787 | ||||||||
|
| |||||||
Other 2.4% | ||||||||
Centerpoint Energy Transition Bond Co. III LLC, Series 2008-A, Cl A1, 4.192%, 02/01/20 | 293,421 | 296,459 | ||||||
Domino’s Pizza Master Issuer LLC, Series 2012-1A, Cl A2, 5.216%, 01/25/42(b) | 1,019,023 | 1,042,820 | ||||||
Ohio Phase-In-Recovery Funding LLC, Series 2013-1, Cl A1, 0.958%, 07/01/18 | 916,180 | 914,082 | ||||||
Oncor Electric Delivery Transition Bond Co. LLC, Series 2004-1, Cl A3, 5.290%, 05/15/18 | 259,483 | 260,802 | ||||||
|
| |||||||
| 2,514,163 | ||||||||
|
| |||||||
Student Loan Asset Backed Security 1.3% |
| |||||||
SLM Student Loan Trust, Series 2013-1, Cl A2, 0.683%, 09/25/19(a) | 1,377,901 | 1,360,934 | ||||||
|
| |||||||
Total Asset-Backed Securities | 21,565,160 | |||||||
|
| |||||||
Collateralized Mortgage Obligations 17.4% |
| |||||||
Agency Collateralized Mortgage Obligations 2.0% |
| |||||||
Federal Home Loan Mortgage Corporation | ||||||||
Series 2839, Cl TS, REMIC, 5.000%, 08/15/19 | 1,745,867 | 1,806,482 | ||||||
See Notes to Financial Statements.
104
Table of Contents
SCHEDULES OF PORTFOLIO INVESTMENTS
RIDGEWORTH FUNDS March 31, 2016
Seix Ultra-Short Bond Fund — continued
| Shares or Principal Amount($) | Value($) | |||||||
Agency Collateralized Mortgage Obligations—continued |
| |||||||
Series 3728, Cl EH, REMIC, 3.000%, 09/15/20 | 106,022 | 106,265 | ||||||
Series 4513, Cl MB, REMIC, 4.000%, 03/15/22 | 34,240 | 34,202 | ||||||
|
| |||||||
| 1,946,949 | ||||||||
|
| |||||||
NCUA Guaranteed Notes | ||||||||
Series 2011-R5, Cl 1A, | 126,450 | 126,466 | ||||||
|
| |||||||
| 2,073,415 | ||||||||
|
| |||||||
Commercial Mortgage Backed Securities 15.2% |
| |||||||
Commercial Mortgage Trust | ||||||||
Series 2012-9W57, Cl A, 2.365%, 02/10/29(b) | 1,250,000 | 1,257,800 | ||||||
Series 2012-CR2, Cl A2, 2.025%, 08/15/45 | 179,353 | 180,177 | ||||||
Series 2012-LC4, Cl A2, 2.256%, 12/10/44 | 548,684 | 550,802 | ||||||
|
| |||||||
| 1,988,779 | ||||||||
|
| |||||||
Credit Suisse Commercial Mortgage Trust | ||||||||
Series 2006-C5, Cl A3, 5.311%, 12/15/39 | 1,376,172 | 1,384,817 | ||||||
|
| |||||||
Federal National Mortgage Association | ||||||||
Series 2011-M1, Cl FA, | 1,361,214 | 1,351,487 | ||||||
Series 2014-M12, Cl FA, | 1,684,305 | 1,663,932 | ||||||
Series 2014-M6, Cl FA, | 798,888 | 796,683 | ||||||
Series 2014-M8, Cl FA, | 380,567 | 378,146 | ||||||
Series 2015-M12, Cl FA, 0.764%, 04/25/20(a) | 1,824,108 | 1,816,158 | ||||||
|
| |||||||
| 6,006,406 | ||||||||
|
| |||||||
JPMorgan Chase Commercial Mortgage Securities Trust | ||||||||
Series 2013-C13, Cl A1, 1.303%, 01/15/46 | 776,253 | 774,795 | ||||||
|
| |||||||
ML-CFC Commercial Mortgage Trust | ||||||||
Series 2006-3, Cl A1A, | 360,921 | 363,757 | ||||||
|
| |||||||
Morgan Stanley Bank of America Merrill Lynch Trust | ||||||||
Series 2013-C12, Cl A1, 1.313%, 10/15/46 | 762,599 | 758,769 | ||||||
Series 2014-C14, Cl A1, 1.250%, 02/15/47 | 299,416 | 297,621 | ||||||
|
| |||||||
| 1,056,390 | ||||||||
|
| |||||||
| Shares or Principal Amount($) | Value($) | |||||||
Commercial Mortgage Backed Securities—continued |
| |||||||
Morgan Stanley Capital I Trust | ||||||||
Series 2006-IQ12, Cl A1A, 5.319%, 12/15/43 | 911,957 | 924,142 | ||||||
Series 2012-C4, Cl A2, 2.111%, 03/15/45 | 1,830,000 | 1,835,321 | ||||||
|
| |||||||
| 2,759,463 | ||||||||
|
| |||||||
WF-RBS Commercial Mortgage Trust | ||||||||
Series 2011-C5, Cl A1, 1.456%, 11/15/44 | 191,326 | 191,235 | ||||||
Series 2012-C10, Cl A2, 1.765%, 12/15/45 | 1,500,000 | 1,502,814 | ||||||
|
| |||||||
| 1,694,049 | ||||||||
|
| |||||||
| 16,028,456 | ||||||||
|
| |||||||
Whole Loan Collateral Mortgage Obligation 0.2% |
| |||||||
Banc of America Mortgage Securities, Inc. | ||||||||
Series 2003-F, Cl 1A1, | 204,177 | 193,785 | ||||||
|
| |||||||
Total Collateralized Mortgage Obligations | 18,295,656 | |||||||
|
| |||||||
Corporate Bonds 43.8% | ||||||||
Advertising 0.5% | ||||||||
Omnicom Group, Inc., 5.900%, 04/15/16 | 505,000 | 505,680 | ||||||
|
| |||||||
Aerospace/Defense 0.5% | ||||||||
Lockheed Martin Corp., 1.850%, 11/23/18 | 499,000 | 504,698 | ||||||
|
| |||||||
Auto Manufacturers 3.9% | ||||||||
Daimler Finance North America LLC, 1.476%, 08/01/18(a)(b) | 1,665,000 | 1,659,174 | ||||||
Ford Motor Credit Co. LLC, 1.400%, 01/17/17, | 550,000 | 550,506 | ||||||
Ford Motor Credit Co. LLC, 2.145%, 01/09/18 | 206,000 | 205,756 | ||||||
Ford Motor Credit Co. LLC, 5.000%, 05/15/18 | 465,000 | 491,005 | ||||||
PACCAR Financial Corp., 1.236%, 12/06/18, MTN(a) | 445,000 | 445,953 | ||||||
Volkswagen International Finance, 1.058%, 11/18/16(a)(b) | 785,000 | 781,181 | ||||||
|
| |||||||
| 4,133,575 | ||||||||
|
| |||||||
Banks 11.1% | ||||||||
Bank of America Corp., 2.000%, 01/11/18 | 1,432,000 | 1,437,897 | ||||||
See Notes to Financial Statements.
105
Table of Contents
SCHEDULES OF PORTFOLIO INVESTMENTS
RIDGEWORTH FUNDS March 31, 2016
Seix Ultra-Short Bond Fund — continued
| Shares or Principal Amount($) | Value($) | |||||||
Banks—continued | ||||||||
Branch Banking & Trust Co., 1.050%, 12/01/16 | 1,650,000 | 1,651,393 | ||||||
Goldman Sachs Group, Inc. (The), 5.950%, 01/18/18 | 1,750,000 | 1,876,684 | ||||||
ING Bank NV, 1.800%, 03/16/18(b) | 1,537,000 | 1,541,477 | ||||||
JPMorgan Chase & Co., 6.125%, 06/27/17 | 1,150,000 | 1,210,385 | ||||||
KeyBank NA, 1.119%, 11/25/16(a) | 1,620,000 | 1,620,624 | ||||||
Lloyds Bank PLC, 1.750%, 05/14/18 | 1,401,000 | 1,397,772 | ||||||
Wells Fargo & Co., 1.250%, 07/20/16, MTN | 860,000 | 861,525 | ||||||
|
| |||||||
| 11,597,757 | ||||||||
|
| |||||||
Beverages 1.2% | ||||||||
Anheuser-Busch InBev Finance, Inc., 1.900%, 02/01/19 | 1,288,000 | 1,306,393 | ||||||
|
| |||||||
Biotechnology 0.7% | ||||||||
Celgene Corp., 2.125%, 08/15/18 | 685,000 | 692,758 | ||||||
|
| |||||||
Chemicals 1.5% | ||||||||
Chevron Phillips Chemical Co. LLC, 1.700%, 05/01/18(b) | 1,553,000 | 1,541,933 | ||||||
|
| |||||||
Computers 0.4% | ||||||||
Hewlett Packard Enterprise Co., 2.850%, 10/05/18(b) | 431,000 | 438,237 | ||||||
|
| |||||||
Electric 2.1% | ||||||||
Duke Energy Corp., 1.009%, 04/03/17(a) | 1,010,000 | 1,003,229 | ||||||
MidAmerican Energy Co., 5.300%, 03/15/18 | 1,100,000 | 1,179,539 | ||||||
|
| |||||||
| 2,182,768 | ||||||||
|
| |||||||
Healthcare-Products 2.7% | ||||||||
Becton Dickinson and Co., 1.800%, 12/15/17 | 1,502,000 | 1,508,315 | ||||||
Medtronic, Inc., 1.500%, 03/15/18 | 1,342,000 | 1,353,553 | ||||||
|
| |||||||
| 2,861,868 | ||||||||
|
| |||||||
Healthcare-Services 4.7% | ||||||||
Aetna, Inc., 1.750%, 05/15/17 | 590,000 | 592,720 | ||||||
Providence Health & Services Obligated Group, 1.425%, 10/01/16(a) | 1,520,000 | 1,520,763 | ||||||
UnitedHealth Group, Inc., 1.875%, 11/15/16 | 1,450,000 | 1,460,130 | ||||||
UnitedHealth Group, Inc., 6.000%, 02/15/18 | 1,254,000 | 1,361,529 | ||||||
|
| |||||||
| 4,935,142 | ||||||||
|
| |||||||
| Shares or Principal Amount($) | Value($) | |||||||
Housewares 0.9% | ||||||||
Newell Rubbermaid, Inc., 2.600%, 03/29/19 | 882,000 | 894,826 | ||||||
|
| |||||||
Insurance 0.5% | ||||||||
Berkshire Hathaway Finance Corp., 1.700%, 03/15/19 | 550,000 | 557,632 | ||||||
|
| |||||||
Internet 0.4% | ||||||||
eBay, Inc., | 451,000 | 458,315 | ||||||
|
| |||||||
Media 1.7% | ||||||||
Comcast Corp., | 1,650,000 | 1,792,426 | ||||||
|
| |||||||
Oil & Gas 2.9% | ||||||||
BP Capital Markets PLC, 1.260%, 09/26/18(a) | 1,450,000 | 1,426,185 | ||||||
Shell International Finance BV, 0.900%, 11/15/16 | 1,650,000 | 1,652,363 | ||||||
|
| |||||||
| 3,078,548 | ||||||||
|
| |||||||
Oil & Gas Services 0.8% | ||||||||
Schlumberger Holdings Corp., 1.900%, 12/21/17(b) | 876,000 | 873,920 | ||||||
|
| |||||||
Pharmaceuticals 1.1% | ||||||||
AbbVie, Inc., 1.800%, 05/14/18 | 821,000 | 826,514 | ||||||
McKesson Corp., 2.284%, 03/15/19 | 375,000 | 379,513 | ||||||
|
| |||||||
| 1,206,027 | ||||||||
|
| |||||||
Pipelines 1.7% | ||||||||
Enbridge, Inc., 1.275%, 10/01/16(a) | 636,000 | 629,790 | ||||||
Kinder Morgan, Inc., 2.000%, 12/01/17 | 719,000 | 711,296 | ||||||
Spectra Energy Partners LP, 2.950%, 06/15/16 | 488,000 | 488,595 | ||||||
|
| |||||||
| 1,829,681 | ||||||||
|
| |||||||
Real Estate Investment Trust 0.7% |
| |||||||
American Tower Corp., 4.500%, 01/15/18 | 670,000 | 698,139 | ||||||
|
| |||||||
Retail 0.7% | ||||||||
CVS Health Corp., 1.900%, 07/20/18 | 687,000 | 697,025 | ||||||
|
| |||||||
Software 0.5% | ||||||||
Fidelity National Information Services, Inc., 2.850%, 10/15/18 | 488,000 | 495,954 | ||||||
|
| |||||||
Telecommunication Services 1.2% |
| |||||||
Verizon Communications, Inc., 1.036%, 06/09/17(a) | 390,000 | 389,223 | ||||||
See Notes to Financial Statements.
106
Table of Contents
SCHEDULES OF PORTFOLIO INVESTMENTS
RIDGEWORTH FUNDS March 31, 2016
Seix Ultra-Short Bond Fund — continued
| Shares or Principal Amount($) | Value($) | |||||||
Telecommunication Services—continued |
| |||||||
Verizon Communications, Inc., 2.550%, 06/17/19 | 815,000 | 838,386 | ||||||
|
| |||||||
| 1,227,609 | ||||||||
|
| |||||||
Transportation 1.4% | ||||||||
Canadian National Railway Co., 0.787%, 11/14/17(a) | 1,454,000 | 1,450,365 | ||||||
|
| |||||||
Total Corporate Bonds (Cost $45,877,906) | 45,961,276 | |||||||
|
| |||||||
| Municipal Bonds 2.5% | ||||||||
Louisiana 0.8% | ||||||||
Louisiana Local Government Environmental Facilities & Community Development Authority, RB, 2.470%, 02/01/19 | 823,063 | 826,232 | ||||||
|
| |||||||
New Jersey 1.7% | ||||||||
New Jersey Economic Development Authority, Series Q, RB, 1.096%, 06/15/16 | 1,755,000 | 1,755,123 | ||||||
|
| |||||||
Total Municipal Bonds | 2,581,355 | |||||||
|
| |||||||
U.S. Government Agency Mortgages 12.2% |
| |||||||
Federal Home Loan Mortgage Corporation | ||||||||
Pool #1Q1404, 2.576%, 01/01/37(a) | 727,674 | 765,877 | ||||||
Pool #848852, 2.576%, 08/01/37(a) | 904,992 | 953,453 | ||||||
|
| |||||||
| 1,719,330 | ||||||||
|
| |||||||
Federal National Mortgage Association | ||||||||
Pool #467863, 3.860%, 04/01/18 | 103,677 | 108,048 | ||||||
Pool #468123, 3.840%, 05/01/18 | 200,000 | 208,974 | ||||||
Pool #958815, 4.506%, 06/01/19 | 1,500,000 | 1,562,812 | ||||||
Pool #AB0351, 4.500%, 04/01/20 | 1,363,983 | 1,413,284 | ||||||
Pool #AL0968, 2.530%, 12/01/36(a) | 282,277 | 297,439 | ||||||
Pool #AD0380, 2.467%, 10/01/37(a) | 404,258 | 424,949 | ||||||
Pool #AL0966, 2.583%, 11/01/37(a) | 367,710 | 386,843 | ||||||
Pool #AT1150, 2.802%, 09/01/43(a) | 960,627 | 991,662 | ||||||
| Shares or Principal Amount($) | Value($) | |||||||
U.S. Government Agency Mortgages—continued |
| |||||||
Pool #AL7562, 2.692%, 10/01/43 | 2,431,193 | 2,498,693 | ||||||
|
| |||||||
| 7,892,704 | ||||||||
|
| |||||||
Government National Mortgage Association | ||||||||
Pool #082649, 2.000%, 10/20/40(a) | 1,722,941 | 1,770,585 | ||||||
Pool #082852, 1.750%, 06/20/41(a) | 1,380,364 | 1,420,042 | ||||||
|
| |||||||
| 3,190,627 | ||||||||
|
| |||||||
Total U.S. Government Agency Mortgages (Cost $12,679,093) | 12,802,661 | |||||||
|
| |||||||
| U.S. Treasury Obligation 0.1% | ||||||||
U.S. Treasury Bill 0.1% | ||||||||
0.000%, 07/21/16(c) | 110,000 | 109,910 | ||||||
|
| |||||||
Total U.S. Treasury Obligation |
| 109,910 | ||||||
|
| |||||||
Money Market Fund 3.1% | ||||||||
State Street Institutional U.S. Government Money Market Fund, Institutional Class, | 3,270,974 | 3,270,974 | ||||||
|
| |||||||
Total Money Market Fund | 3,270,974 | |||||||
|
| |||||||
Money Market Fund—continued |
| |||||||
Total Investments | 104,586,992 | |||||||
Other Assets in Excess of Liabilities — 0.3% | 363,302 | |||||||
|
| |||||||
Net Assets — 100.0% | $ | 104,950,294 | ||||||
|
| |||||||
| (a) | Variable or floating rate security. Rate disclosed is as of March 31, 2016. |
| (b) | Rule 144A, Section 4(2) or other security which is restricted as to resale to institutional investors. The Fund’s investment adviser/subadviser has deemed this security to be liquid based upon procedures approved by the Board of Trustees. These securities represent 11.7% of net assets as of March 31, 2016. |
| (c) | Zero coupon bond. |
| (d) | Rate disclosed, the 7 day yield, is as of March 31, 2016. |
Investment Abbreviations
| MTN | — | Medium Term Note | ||
| RB | — | Revenue Bond | ||
| REMIC | — | Real Estate Mortgage Investment Conduit |
See Notes to Financial Statements.
107
Table of Contents
SCHEDULES OF PORTFOLIO INVESTMENTS
RIDGEWORTH FUNDS March 31, 2016
Seix Ultra-Short Bond Fund — concluded
Open Futures Contracts
At March 31, 2016, the Fund’s open futures contracts were as follows:
Description | Position | Notional Amount | Expiration Month | Contracts | Unrealized Depreciation | |||||||||||||
U.S. Treasury 2 Year Note | Short | $(17,713,354) | June 2016 | 81 | $(5,396) | |||||||||||||
U.S. Treasury 5 Year Note | Short | (3,995,441) | June 2016 | 33 | (2,973) | |||||||||||||
|
| |||||||||||||||||
| $(8,369) | ||||||||||||||||||
|
| |||||||||||||||||
See Notes to Financial Statements.
108
Table of Contents
SCHEDULES OF PORTFOLIO INVESTMENTS
RIDGEWORTH FUNDS March 31, 2016
Seix Virginia Intermediate Municipal Bond Fund
| Shares or Principal Amount($) | Value($) | |||||||
| Municipal Bonds 95.4% | ||||||||
Alabama 1.0% | ||||||||
Birmingham, Series A, GO, 0.000%, 03/01/32(a) | 645,000 | 700,373 | ||||||
|
| |||||||
District of Columbia 5.1% |
| |||||||
Metropolitan Washington D.C. Airports Authority, Airport System, Series A, AMT, RB, 5.125%, 10/01/23 | 1,000,000 | 1,096,640 | ||||||
Metropolitan Washington D.C. Airports Authority, Airport System, Series B, RB, 5.000%, 10/01/26, BHAC | 2,175,000 | 2,452,661 | ||||||
|
| |||||||
| 3,549,301 | ||||||||
|
| |||||||
Guam 1.6% |
| |||||||
Guam Waterworks Authority Water & Watstewater System, RB, 5.000%, 01/01/46 | 665,000 | 754,556 | ||||||
Territory of Guam, Series D, RB, 5.000%, 11/15/39 | 300,000 | 339,099 | ||||||
|
| |||||||
| 1,093,655 | ||||||||
|
| |||||||
North Carolina 2.8% |
| |||||||
North Carolina Capital Facilities Finance Agency, Educational Facilities, RB, 5.000%, 05/01/32 | 1,740,000 | 1,911,512 | ||||||
|
| |||||||
Virginia 84.9% |
| |||||||
Fairfax County Economic Development Authority, RB, 5.000%, 08/01/22 | 1,700,000 | 1,982,336 | ||||||
Fairfax County Industrial Development Authority, RB, 5.500%, 05/15/35 | 1,000,000 | 1,129,070 | ||||||
Fairfax County Industrial Development Authority, Series D, RB, 5.000%, 05/15/27 | 1,300,000 | 1,530,555 | ||||||
Fairfax County Water Authority, RB, 5.000%, 04/01/25 | 3,050,000 | 3,693,489 | ||||||
Fairfax County Water Authority, RB, 5.000%, 04/01/27 | 600,000 | 721,698 | ||||||
Greater Richmond Convention Center Authority, RB, 5.000%, 06/15/28 | 1,375,000 | 1,682,422 | ||||||
Greater Richmond Convention Center Authority, RB, 5.000%, 06/15/30 | 1,000,000 | 1,207,650 | ||||||
Greater Richmond Convention Center Authority, RB, 5.000%, 06/15/32 | 1,000,000 | 1,194,420 | ||||||
| Shares or Principal Amount($) | Value($) | |||||||
Virginia—continued |
| |||||||
Hampton Roads Sanitation District Wastewater, RB, 5.000%, 04/01/23 | 1,060,000 | 1,148,489 | ||||||
Hampton Roads Sanitation District Wastewater, RB, 5.000%, 04/01/24 | 2,425,000 | 2,627,439 | ||||||
Hampton Roads Sanitation District Wastewater, Series A, RB, 5.000%, 08/01/30 | 1,860,000 | 2,338,969 | ||||||
Hanover County Economic Development Authority, Regional Medical Care Project, RB, 6.375%, 08/15/18, NATL-RE | 2,645,000 | 2,776,007 | ||||||
Isle County Wight, Series A, GO, 5.000%, 07/01/35, State Aid Withholding | 750,000 | 885,292 | ||||||
James City County Economic Development Authority, Public Facility Project, RB, 5.000%, 06/15/21, AGM | 2,215,000 | 2,330,490 | ||||||
Loudoun County Industrial Development Authority, Series A, RB, 5.000%, 06/01/31 | 1,000,000 | 1,144,170 | ||||||
New Kent County Economic Development Authority, School & Governmental Projects, RB, 5.000%, 02/01/18, AGM | 1,225,000 | 1,269,651 | ||||||
Norfolk Water Revenue, Series A, RB, 5.250%, 11/01/44 | 1,750,000 | 2,098,705 | ||||||
Northern Virginia Transportation Authority, RB, 5.000%, 06/01/26 | 1,250,000 | 1,543,600 | ||||||
Richmond Industrial Development Authority, Government Facilities, RB, 5.000%, 07/15/18, AMBAC | 1,795,000 | 1,912,465 | ||||||
Roanoke Economic Development Authority, Hospital Revenue, RB, 5.000%, 07/01/27 | 1,000,000 | 1,149,730 | ||||||
Virginia College Building Authority, Series A, RB, 5.000%, 02/01/27 | 1,500,000 | 1,826,745 | ||||||
Virginia College Building Authority, Educational Facilities Project, Washington & Lee University, RB, 5.375%, 01/01/21 | 3,390,000 | 3,785,409 | ||||||
See Notes to Financial Statements.
109
Table of Contents
SCHEDULES OF PORTFOLIO INVESTMENTS
RIDGEWORTH FUNDS March 31, 2016
Seix Virginia Intermediate Municipal Bond Fund — concluded
| Shares or Principal Amount($) | Value($) | |||||||
Virginia—continued |
| |||||||
Virginia College Building Authority, Educational Facilities Project, Washington & Lee University, Series B, RB, 5.000%, 09/01/26, ST INTERCEPT | 1,190,000 | 1,502,780 | ||||||
Virginia Commonwealth Transportation Board, Series A, RB, 5.000%, 05/15/19 | 1,440,000 | 1,621,498 | ||||||
Virginia Commonwealth University, Health System Authority, RB, 5.000%, 07/01/30 | 1,460,000 | 1,665,101 | ||||||
Virginia Housing Development Authority, Commonwealth Mortgage, Series A-1, RB, 3.650%, 01/01/18, GO of Authority | 1,205,000 | 1,262,394 | ||||||
Virginia Port Authority, Series A, AMT, RB, 5.000%, 07/01/32 | 4,000,000 | 4,687,680 | ||||||
Virginia Public Building Authority, Series A, RB, 5.000%, 08/01/31, Pre-refunded | 10,000 | 11,976 | ||||||
Virginia Public School Authority, Series A, RB, 5.000%, 08/01/27, State Aid Withholding | 2,060,000 | 2,494,660 | ||||||
Virginia Public School Authority, School Financing, RB, 5.000%, 07/15/26, State Aid Withholding | 2,000,000 | 2,188,980 | ||||||
Virginia Resources Authority, Series A, RB, 5.000%, 11/01/32 | 300,000 | 360,996 | ||||||
Virginia Resources Authority Infrastructure, Pooled Financing Program, Series A, RB, 5.000%, 11/01/28 | 2,300,000 | 2,805,218 | ||||||
|
| |||||||
| 58,580,084 | ||||||||
|
| |||||||
Total Municipal Bonds |
| 65,834,925 | ||||||
|
| |||||||
| Shares or Principal Amount($) | Value($) | |||||||
Money Market Funds 2.0% |
| |||||||
Federated Tax-Free Obligations Fund, Institutional Shares, 0.14%(b) | 23 | 23 | ||||||
Federated Virginia Municipal Cash Trust, Institutional Share, 0.01%(b) | 1,373,933 | 1,373,933 | ||||||
|
| |||||||
Total Money Market Funds |
| 1,373,956 | ||||||
|
| |||||||
Total Investments | 67,208,881 | |||||||
Other Assets in Excess of Liabilities — 2.6% | 1,808,752 | |||||||
|
| |||||||
Net Assets — 100.0% | $ | 69,017,633 | ||||||
|
| |||||||
| (a) | Step bond. The rate shown is the rate in effect as of March 31, 2016. |
| (b) | Rate disclosed, the 7 day yield, is as of March 31, 2016. |
Investment Abbreviations
| AGM | — | Security guaranteed by Assured Guaranty Municipal Corporation | ||
| AMBAC | — | Security guaranteed by American Municipal Bond Assurance Corporation | ||
| AMT | — | Income subject to Alternative Minimum Tax | ||
| BHAC | — | Security guaranteed by Berkshire Hathaway Assurance Corporation | ||
| GO | — | General Obligation | ||
| NATL-RE | — | Reinsurance provided by National Public Finance Guarantee Corporation | ||
| RB | — | Revenue Bond | ||
| ST INTERCEPT | — | State Interception |
See Notes to Financial Statements.
110
Table of Contents
STATEMENTS OF ASSETS AND LIABILITIES
RIDGEWORTH FUNDS March 31, 2016
| Seix Core Bond Fund | Seix Corporate Bond Fund | Seix Floating Rate High Income Fund | Seix Georgia Tax-Exempt Bond Fund | Seix High Grade Municipal Bond Fund | ||||||||||||||||
Assets: | ||||||||||||||||||||
Total Investments, at Cost | $281,267,222 | $17,903,087 | $4,709,385,305 | $103,135,940 | $111,739,766 | |||||||||||||||
|
|
|
|
|
|
|
|
|
| |||||||||||
Total Investments, at Value* | $284,188,930 | $17,999,304 | $4,371,040,660 | $110,323,036 | $116,892,373 | |||||||||||||||
Cash | — | — | 5,013 | — | — | |||||||||||||||
Interest Receivable | 1,295,340 | 164,492 | 27,332,385 | 1,402,563 | 1,091,112 | |||||||||||||||
Securities Lending Income Receivable | 28,156 | 771 | — | — | — | |||||||||||||||
Receivable for Capital Shares Issued | 106,487 | 3,493 | 3,557,375 | 109,109 | 319,680 | |||||||||||||||
Receivable for Investment Securities Sold | 493,900 | 250,352 | 108,337,812 | — | 1,210,541 | |||||||||||||||
Receivable for Investment Securities Sold on a When-issued Basis | — | — | 3,012,300 | — | — | |||||||||||||||
Receivable from Investment Adviser | — | 3,425 | — | 4,076 | 6,065 | |||||||||||||||
Prepaid Expenses and Other Assets | 32,076 | 22,047 | 108,515 | 8,586 | 14,818 | |||||||||||||||
|
|
|
|
|
|
|
|
|
| |||||||||||
Total Assets | 286,144,889 | 18,443,884 | 4,513,394,060 | 111,847,370 | 119,534,589 | |||||||||||||||
|
|
|
|
|
|
|
|
|
| |||||||||||
Liabilities: | ||||||||||||||||||||
Payable for Investment Securities Purchased | 853,880 | — | — | — | — | |||||||||||||||
Payable for Investment Securities Purchased on a When-issued Basis | 2,758,364 | 374,363 | 116,840,585 | — | 5,469,415 | |||||||||||||||
Payable for Capital Shares Redeemed | 359,714 | 28,554 | 22,210,914 | 450,075 | 137,080 | |||||||||||||||
Payable Upon Return of Securities Loaned | 12,791,803 | 471,458 | — | — | — | |||||||||||||||
Income Distributions Payable | 42,568 | 1,021 | 4,285,641 | 5,293 | 47,821 | |||||||||||||||
Investment Advisory Fees Payable | 56,596 | 5,812 | 1,532,274 | 47,229 | 47,871 | |||||||||||||||
Compliance and Fund Services Fees Payable | 5,851 | 377 | 96,139 | 2,438 | 2,481 | |||||||||||||||
Distribution and Service Fees Payable | 3,590 | 6,895 | 83,072 | 456 | 1,763 | |||||||||||||||
Trustee Fees Payable | 11 | 1 | 194 | 5 | 5 | |||||||||||||||
Other Accrued Expenses | 109,657 | 7,093 | 1,604,356 | 29,992 | 29,015 | |||||||||||||||
|
|
|
|
|
|
|
|
|
| |||||||||||
Total Liabilities | 16,982,034 | 895,574 | 146,653,175 | 535,488 | 5,735,451 | |||||||||||||||
|
|
|
|
|
|
|
|
|
| |||||||||||
Total Net Assets | $269,162,855 | $17,548,310 | $4,366,740,885 | $111,311,882 | $113,799,138 | |||||||||||||||
|
|
|
|
|
|
|
|
|
| |||||||||||
Net Assets Consist of: | ||||||||||||||||||||
Capital | $265,622,759 | $17,812,408 | $4,917,797,459 | $103,427,653 | $107,072,008 | |||||||||||||||
Accumulated Net Investment Income (Loss) | (328,472 | ) | (39,531 | ) | 4,095,610 | 190,525 | (7,042 | ) | ||||||||||||
Accumulated Net Realized Gain (Loss) from Investments, Unfunded Commitments, Swaps and Foreign Currency Transactions | 946,860 | (320,784 | ) | (216,807,539 | ) | 506,608 | 1,581,565 | |||||||||||||
Net Unrealized Appreciation (Depreciation) on Investments and Foreign Currencies | 2,921,708 | 96,217 | (338,344,645 | ) | 7,187,096 | 5,152,607 | ||||||||||||||
|
|
|
|
|
|
|
|
|
| |||||||||||
Net Assets | $269,162,855 | $17,548,310 | $4,366,740,885 | $111,311,882 | $113,799,138 | |||||||||||||||
|
|
|
|
|
|
|
|
|
| |||||||||||
Net Assets: | ||||||||||||||||||||
I Shares | $255,522,418 | $8,943,244 | $3,040,875,463 | $107,690,606 | $99,803,316 | |||||||||||||||
A Shares | 10,169,782 | 500,131 | 143,324,813 | 3,621,276 | 13,995,822 | |||||||||||||||
C Shares | — | 8,104,935 | 55,203,462 | — | — | |||||||||||||||
R Shares | 3,448,263 | — | — | — | — | |||||||||||||||
IS Shares | 22,392 | — | 1,127,337,147 | — | — | |||||||||||||||
Shares Outstanding (unlimited number of shares authorized, no par value) | ||||||||||||||||||||
I Shares | 23,522,489 | 1,056,688 | 365,069,560 | 9,826,583 | 8,075,586 | |||||||||||||||
A Shares | 936,429 | 58,847 | 17,204,927 | 329,936 | 1,132,023 | |||||||||||||||
C Shares | — | 957,920 | 6,625,165 | — | — | |||||||||||||||
R Shares | 317,196 | — | — | — | — | |||||||||||||||
IS Shares | 2,062 | — | 135,275,384 | — | — | |||||||||||||||
Net Asset Value and Redemption Price Per Share: | ||||||||||||||||||||
I Shares | $10.86 | $8.46 | $8.33 | $10.96 | $12.36 | |||||||||||||||
A Shares | 10.86 | 8.50 | 8.33 | 10.98 | 12.36 | |||||||||||||||
C Shares(a) | — | 8.46 | 8.33 | — | — | |||||||||||||||
R Shares | 10.87 | — | — | — | — | |||||||||||||||
IS Shares | 10.86 | — | 8.33 | — | — | |||||||||||||||
Offering Price per Share (100%/(100%-maximum sales charge x net asset value) adjusted to the nearest cent): | ||||||||||||||||||||
A Shares | $11.40 | $8.92 | $8.54 | $11.53 | $12.98 | |||||||||||||||
Maximum Sales Charge — A Shares | 4.75 | % | 4.75 | % | 2.50 | % | 4.75 | % | 4.75 | % | ||||||||||
| * | Investments include securities on loan of $12,492,396, $452,997, $—, $— and $—, respectively. |
| (a) | Redemption price per share varies based on length of time shares are held. |
See Notes to Financial Statements.
111
Table of Contents
STATEMENTS OF ASSETS AND LIABILITIES
RIDGEWORTH FUNDS March 31, 2016
| Seix High Income Fund | Seix High Yield Fund | Seix Investment Grade Tax- Exempt Bond Fund | Seix Limited Duration Fund | Seix North Carolina Tax- Exempt Bond Fund | ||||||||||||||||
Assets: | ||||||||||||||||||||
Total Investments, at Cost | $709,217,170 | $604,642,924 | $625,501,846 | $6,636,488 | $27,117,160 | |||||||||||||||
|
|
|
|
|
| �� |
|
|
|
| ||||||||||
Total Investments, at Value* | $657,923,415 | $575,599,309 | $659,205,292 | $6,647,489 | $28,899,306 | |||||||||||||||
Cash | 35,953 | — | — | — | — | |||||||||||||||
Interest Receivable | 12,637,495 | 9,936,956 | 6,527,913 | 2,035 | 387,819 | |||||||||||||||
Securities Lending Income Receivable | 52,258 | 35,353 | — | — | — | |||||||||||||||
Receivable for Capital Shares Issued | 334,425 | 694,537 | 419,202 | — | 789 | |||||||||||||||
Receivable for Investment Securities Sold | 2,288,951 | 380,105 | 17,488,039 | — | 1,167,216 | |||||||||||||||
Receivable for Investment Securities Sold on a When-issued Basis | 891,973 | 780,851 | 1,546,740 | — | — | |||||||||||||||
Receivable from Investment Adviser | — | — | 26,834 | 1,081 | 2,564 | |||||||||||||||
Prepaid Expenses and Other Assets | 32,269 | 38,337 | 25,278 | 4,135 | 7,931 | |||||||||||||||
|
|
|
|
|
|
|
|
|
| |||||||||||
Total Assets | 674,196,739 | 587,465,448 | 685,239,298 | 6,654,740 | 30,465,625 | |||||||||||||||
|
|
|
|
|
|
|
|
|
| |||||||||||
Liabilities: | ||||||||||||||||||||
Payable for Investment Securities Purchased | 609,325 | 2,861,420 | 8,180,933 | — | — | |||||||||||||||
Payable for Investment Securities Purchased on a When-issued Basis | 3,153,000 | 3,339,875 | 21,301,637 | — | 1,323,688 | |||||||||||||||
Payable for Capital Shares Redeemed | 2,022,657 | 1,155,609 | 835,096 | — | 48,186 | |||||||||||||||
Payable Upon Return of Securities Loaned | 61,871,816 | 46,697,565 | — | — | — | |||||||||||||||
Income Distributions Payable | 98,442 | 774,985 | 133,517 | 2,682 | 1,990 | |||||||||||||||
Line of Credit Payable | — | 1,044,906 | — | — | — | |||||||||||||||
Investment Advisory Fees Payable | 278,956 | 200,280 | 271,080 | 563 | 12,167 | |||||||||||||||
Compliance and Fund Services Fees Payable | 13,488 | 11,593 | 14,149 | 146 | 628 | |||||||||||||||
Distribution and Service Fees Payable | 17,431 | 1,765 | 6,316 | — | 62 | |||||||||||||||
Trustee Fees Payable | 25 | 22 | 28 | — | 1 | |||||||||||||||
Other Accrued Expenses | 213,402 | 135,352 | 200,869 | 2,783 | 10,772 | |||||||||||||||
|
|
|
|
|
|
|
|
|
| |||||||||||
Total Liabilities | 68,278,542 | 56,223,372 | 30,943,625 | 6,174 | 1,397,494 | |||||||||||||||
|
|
|
|
|
|
|
|
|
| |||||||||||
Total Net Assets | $605,918,197 | $531,242,076 | $654,295,673 | $6,648,566 | $29,068,131 | |||||||||||||||
|
|
|
|
|
|
|
|
|
| |||||||||||
Net Assets Consist of: | ||||||||||||||||||||
Capital | $738,064,960 | $625,665,314 | $614,851,410 | $7,466,031 | $27,179,342 | |||||||||||||||
Accumulated Net Investment Income (Loss) | (411,451 | ) | (1,279,544 | ) | (228,333 | ) | (772 | ) | (57,474 | ) | ||||||||||
Accumulated Net Realized Gain (Loss) from Investments and Swaps Transactions | (80,441,557 | ) | (64,100,079 | ) | 5,969,150 | (827,694 | ) | 164,117 | ||||||||||||
Net Unrealized Appreciation (Depreciation) on Investments and Swaps | (51,293,755 | ) | (29,043,615 | ) | 33,703,446 | 11,001 | 1,782,146 | |||||||||||||
|
|
|
|
|
|
|
|
|
| |||||||||||
Net Assets | $605,918,197 | $531,242,076 | $654,295,673 | $6,648,566 | $29,068,131 | |||||||||||||||
|
|
|
|
|
|
|
|
|
| |||||||||||
Net Assets: | ||||||||||||||||||||
I Shares | $546,793,012 | $523,206,423 | $629,434,612 | $6,648,566 | $28,576,475 | |||||||||||||||
A Shares | 43,433,305 | 7,463,012 | 24,861,061 | — | 491,656 | |||||||||||||||
R Shares | 14,574,391 | 572,641 | — | — | — | |||||||||||||||
IS Shares | 1,117,489 | — | — | — | — | |||||||||||||||
Shares Outstanding (unlimited number of shares authorized, no par value) | ||||||||||||||||||||
I Shares | 92,393,166 | 67,036,289 | 51,500,876 | 676,440 | 2,714,697 | |||||||||||||||
A Shares | 7,333,069 | 980,587 | 2,031,704 | — | 46,816 | |||||||||||||||
R Shares | 2,461,084 | 73,418 | — | — | — | |||||||||||||||
IS Shares | 188,769 | — | — | — | — | |||||||||||||||
Net Asset Value and Redemption Price Per Share: | ||||||||||||||||||||
I Shares | $5.92 | $7.80 | $12.22 | $9.83 | $10.53 | |||||||||||||||
A Shares | 5.92 | 7.61 | 12.24 | — | 10.50 | |||||||||||||||
R Shares | 5.92 | 7.80 | — | — | — | |||||||||||||||
IS Shares | 5.92 | — | — | — | — | |||||||||||||||
Offering Price per Share (100%/(100%-maximum sales charge x net asset value) adjusted to the nearest cent): | ||||||||||||||||||||
A Shares | $6.22 | $7.99 | $12.85 | $— | $11.02 | |||||||||||||||
Maximum Sales Charge — A Shares | 4.75 | % | 4.75 | % | 4.75 | % | — | 4.75 | % | |||||||||||
| * | Investments include securities on loan of $61,452,599, $46,040,107, $-, $- and $-, respectively. |
See Notes to Financial Statements.
112
Table of Contents
STATEMENTS OF ASSETS AND LIABILITIES
RIDGEWORTH FUNDS March 31, 2016
| Seix Short-Term Bond Fund | Seix Short-Term Municipal Bond Fund | Seix Total Return Bond Fund | Seix U.S. Government Securities Ultra- Short Bond Fund | Seix U.S. Mortgage Fund | ||||||||||||||||
Assets: | ||||||||||||||||||||
Total Investments, at Cost | $53,827,823 | $40,184,141 | $1,208,560,830 | $1,541,778,499 | $38,585,280 | |||||||||||||||
|
|
|
|
|
|
|
|
|
| |||||||||||
Total Investments, at Value* | $54,064,713 | $40,363,071 | $1,220,533,560 | $1,554,424,641 | $39,081,529 | |||||||||||||||
Cash | — | — | 5,113,600 | — | — | |||||||||||||||
Interest Receivable | 205,460 | 405,999 | 5,962,259 | 2,692,133 | 108,393 | |||||||||||||||
Securities Lending Income Receivable | — | — | 106,820 | — | — | |||||||||||||||
Receivable for Capital Shares Issued | 1,720 | 45,324 | 1,310,725 | 2,029,320 | 8,919 | |||||||||||||||
Receivable for Investment Securities Sold | — | — | 2,261,289 | 4,615,624 | 177,277 | |||||||||||||||
Unrealized Appreciation on Forward Foreign Currency Contracts | — | — | 3,646,060 | — | — | |||||||||||||||
Receivable from Investment Adviser | 4,205 | 5,772 | 2,074 | — | 5,832 | |||||||||||||||
Prepaid Expenses and Other Assets | 20,396 | 9,863 | 41,837 | 34,872 | 24,039 | |||||||||||||||
|
|
|
|
|
|
|
|
|
| |||||||||||
Total Assets | 54,296,494 | 40,830,029 | 1,238,978,224 | 1,563,796,590 | 39,405,989 | |||||||||||||||
|
|
|
|
|
|
|
|
|
| |||||||||||
Liabilities: | ||||||||||||||||||||
Payable for Investment Securities Purchased | — | — | 7,574,577 | 3,332,149 | 644,375 | |||||||||||||||
Payable for Investment Securities Purchased on a When-issued Basis | 638,551 | 1,175,250 | 11,359,674 | — | 1,420,838 | |||||||||||||||
Payable for Capital Shares Redeemed | 19,274 | 77,950 | 1,418,178 | 1,544,242 | 198,110 | |||||||||||||||
Payable Upon Return of Securities Loaned | — | — | 103,422,458 | — | — | |||||||||||||||
Income Distributions Payable | 4,496 | 7,278 | 27,840 | 135,797 | 537 | |||||||||||||||
Unrealized Depreciation on Forward Foreign Currency Contracts | — | — | 4,445,535 | — | — | |||||||||||||||
Investment Advisory Fees Payable | 18,274 | 11,662 | 225,773 | 236,871 | 12,623 | |||||||||||||||
Compliance and Fund Services Fees Payable | 1,183 | 865 | 24,070 | 32,064 | 812 | |||||||||||||||
Payable for Variation Margin on Futures Contracts | — | — | — | 72,453 | — | |||||||||||||||
Distribution and Service Fees Payable | 1,860 | 932 | 27,985 | — | 5,755 | |||||||||||||||
Trustee Fees Payable | 2 | 2 | 48 | 65 | 2 | |||||||||||||||
Other Accrued Expenses | 18,736 | 17,357 | 392,498 | 543,689 | 17,414 | |||||||||||||||
|
|
|
|
|
|
|
|
|
| |||||||||||
Total Liabilities | 702,376 | 1,291,296 | 128,918,636 | 5,897,330 | 2,300,466 | |||||||||||||||
|
|
|
|
|
|
|
|
|
| |||||||||||
Total Net Assets | $53,594,118 | $39,538,733 | $1,110,059,588 | $1,557,899,260 | $37,105,523 | |||||||||||||||
|
|
|
|
|
|
|
|
|
| |||||||||||
Net Assets Consist of: | ||||||||||||||||||||
Capital | $54,585,488 | $39,361,182 | $1,098,566,966 | $1,566,935,482 | $36,650,006 | |||||||||||||||
Accumulated Net Investment Loss | (2,124 | ) | (1,437 | ) | (2,006,504 | ) | (2,617 | ) | (15,736 | ) | ||||||||||
Accumulated Net Realized Gain (Loss) from Investments, Futures, Swaps and Foreign Currency Transactions | (1,226,136 | ) | 58 | 2,325,869 | (21,633,688 | ) | (24,996 | ) | ||||||||||||
Net Unrealized Appreciation on Investments, Futures, Swaps and Foreign Currencies | 236,890 | 178,930 | 11,173,257 | 12,600,083 | 496,249 | |||||||||||||||
|
|
|
|
|
|
|
|
|
| |||||||||||
Net Assets | $53,594,118 | $39,538,733 | $1,110,059,588 | $1,557,899,260 | $37,105,523 | |||||||||||||||
|
|
|
|
|
|
|
|
|
| |||||||||||
Net Assets: | ||||||||||||||||||||
I Shares | $49,748,525 | $32,184,245 | $971,158,593 | $1,557,899,260 | $25,067,724 | |||||||||||||||
A Shares | 2,104,032 | 7,354,488 | 32,365,962 | — | 6,559,921 | |||||||||||||||
C Shares | 1,741,561 | — | — | — | 5,477,878 | |||||||||||||||
R Shares | — | — | 50,402,070 | — | — | |||||||||||||||
IS Shares | — | — | 56,132,963 | — | — | |||||||||||||||
Shares Outstanding (unlimited number of shares authorized, no par value) | ||||||||||||||||||||
I Shares | 4,983,092 | 3,224,097 | 91,056,152 | 155,312,919 | 2,211,936 | |||||||||||||||
A Shares | 210,240 | 737,033 | 2,936,824 | — | 579,907 | |||||||||||||||
C Shares | 174,086 | — | — | — | 483,397 | |||||||||||||||
R Shares | — | — | 4,724,578 | — | — | |||||||||||||||
IS Shares | — | — | 5,261,574 | — | — | |||||||||||||||
Net Asset Value and Redemption Price Per Share: | ||||||||||||||||||||
I Shares | $9.98 | $9.98 | $10.67 | $10.03 | $11.33 | |||||||||||||||
A Shares | 10.01 | 9.98 | 11.02 | — | 11.31 | |||||||||||||||
C Shares(a) | 10.00 | — | — | — | 11.33 | |||||||||||||||
R Shares | — | — | 10.67 | — | — | |||||||||||||||
IS Shares | — | — | 10.67 | — | — | |||||||||||||||
Offering Price per Share (100%/(100%-maximum sales charge x net asset value) adjusted to the nearest cent): | ||||||||||||||||||||
A Shares | $10.27 | $10.24 | $11.57 | $— | $11.60 | |||||||||||||||
Maximum Sales Charge — A Shares | 2.50 | % | 2.50 | % | 4.75 | % | — | 2.50 | % | |||||||||||
| * | Investments include securities on loan of $-, $-, $101,018,998, $- and $-, respectively. |
| (a) | Redemption price per share varies based on length of time shares are held. |
See Notes to Financial Statements.
113
Table of Contents
STATEMENTS OF ASSETS AND LIABILITIES
RIDGEWORTH FUNDS March 31, 2016
| Seix Ultra-Short Bond Fund | Seix Virginia Intermediate Municipal Bond Fund | |||||||
Assets: | ||||||||
Total Investments, at Cost | $104,425,775 | $63,539,013 | ||||||
|
|
|
| |||||
Total Investments, at Value | $104,586,992 | $67,208,881 | ||||||
Interest Receivable | 336,650 | 842,104 | ||||||
Receivable for Capital Shares Issued | 129,110 | 293 | ||||||
Receivable for Investment Securities Sold | 476,068 | 1,219,638 | ||||||
Prepaid Expenses and Other Assets | 14,175 | 9,112 | ||||||
|
|
|
| |||||
Total Assets | 105,542,995 | 69,280,028 | ||||||
|
|
|
| |||||
Liabilities: | ||||||||
Payable for Investment Securities Purchased | 499,692 | — | ||||||
Payable for Capital Shares Redeemed | 18,379 | 104,992 | ||||||
Income Distributions Payable | 12,356 | 103,649 | ||||||
Investment Advisory Fees Payable | 20,348 | 30,121 | ||||||
Compliance and Fund Services Fees Payable | 2,444 | 1,506 | ||||||
Payable for Variation Margin on Futures Contracts | 13,547 | — | ||||||
Distribution and Service Fees Payable | — | 552 | ||||||
Trustee Fees Payable | 5 | 3 | ||||||
Other Accrued Expenses | 25,930 | 21,572 | ||||||
|
|
|
| |||||
Total Liabilities | 592,701 | 262,395 | ||||||
|
|
|
| |||||
Total Net Assets | $104,950,294 | $69,017,633 | ||||||
|
|
|
| |||||
Net Assets Consist of: | ||||||||
Capital | $107,276,833 | $63,981,553 | ||||||
Accumulated Net Investment Income (Loss) | (2,389 | ) | 19,172 | |||||
Accumulated Net Realized Gain (Loss) from Investments and Futures Transactions | (2,476,998 | ) | 1,347,040 | |||||
Net Unrealized Appreciation on Investments and Futures | 152,848 | 3,669,868 | ||||||
|
|
|
| |||||
Net Assets | $104,950,294 | $69,017,633 | ||||||
|
|
|
| |||||
Net Assets: | ||||||||
I Shares | $104,950,294 | $64,652,957 | ||||||
A Shares | — | 4,364,676 | ||||||
Shares Outstanding (unlimited number of shares authorized, no par value) | ||||||||
I Shares | 10,573,414 | 6,424,488 | ||||||
A Shares | — | 433,827 | ||||||
Net Asset Value and Redemption Price Per Share: | ||||||||
I Shares | $9.93 | $10.06 | ||||||
A Shares | — | 10.06 | ||||||
Offering Price per Share (100%/(100%-maximum sales charge x net asset value) adjusted to the nearest cent): | ||||||||
A Shares | $— | $10.56 | ||||||
Maximum Sales Charge — A Shares | — | 4.75 | % | |||||
See Notes to Financial Statements.
114
Table of Contents
RIDGEWORTH FUNDS For the Fiscal Year Ended March 31, 2016
| Seix Core Bond Fund | Seix Corporate Bond Fund | Seix Floating Rate High Income Fund | Seix Georgia Tax-Exempt Bond Fund | Seix High Grade Municipal Bond Fund | ||||||||||||||||
Investment Income: | ||||||||||||||||||||
Interest Income | $5,728,569 | $793,370 | $306,075,514 | $4,029,526 | $3,286,727 | |||||||||||||||
Dividend Income | — | — | 255,594 | — | — | |||||||||||||||
Net Income from Securities Lending | 57,730 | 1,828 | — | — | — | |||||||||||||||
|
|
|
|
|
|
|
|
|
| |||||||||||
Total Investment Income | 5,786,299 | 795,198 | 306,331,108 | 4,029,526 | 3,286,727 | |||||||||||||||
|
|
|
|
|
|
|
|
|
| |||||||||||
Expenses: | ||||||||||||||||||||
Investment Advisory Fees | 629,875 | 88,233 | 23,465,997 | 635,725 | 573,994 | |||||||||||||||
Administration Fees | 25,326 | 2,224 | 580,141 | 12,800 | 11,548 | |||||||||||||||
Fund Accounting Fees | 24,884 | 2,300 | 590,267 | 13,339 | 12,617 | |||||||||||||||
Transfer Agency Fees | 36,107 | 16,225 | 2,054,161 | 19,022 | 33,689 | |||||||||||||||
Compliance & Fund Services Fees | 18,261 | 1,702 | 448,446 | 10,105 | 9,155 | |||||||||||||||
Distribution and Service Fees — A Shares | 23,825 | 1,806 | 453,519 | 5,303 | 21,761 | |||||||||||||||
Distribution and Service Fees — C Shares | — | 85,089 | 604,184 | — | — | |||||||||||||||
Distribution and Service Fees — R Shares | 17,125 | — | — | — | — | |||||||||||||||
Shareholder Servicing Fees — I Shares | 307,434 | 7,246 | 5,043,808 | 116,445 | 73,877 | |||||||||||||||
Shareholder Servicing Fees — A Shares | 3,122 | 108 | 158,251 | 439 | 3,372 | |||||||||||||||
Shareholder Servicing Fees — R Shares | 993 | — | — | — | — | |||||||||||||||
Custodian Fees | 17,852 | 9,345 | 955,423 | 8,254 | 8,415 | |||||||||||||||
Printing Fees | 8,279 | 1,857 | 348,395 | 3,302 | 6,506 | |||||||||||||||
Registration Fees | 56,973 | 40,786 | 90,120 | 14,919 | 34,324 | |||||||||||||||
Trustee Fees | 9,173 | 973 | 248,590 | 5,591 | 4,921 | |||||||||||||||
Other Fees | 47,708 | 9,287 | 648,163 | 19,263 | 17,731 | |||||||||||||||
|
|
|
|
|
|
|
|
|
| |||||||||||
Total Expenses | 1,226,937 | 267,181 | 35,689,465 | 864,507 | 811,910 | |||||||||||||||
Less: Investment Advisory Fees Waived/Expenses Reimbursed | — | (30,054 | ) | — | (32,454 | ) | (43,026 | ) | ||||||||||||
|
|
|
|
|
|
|
|
|
| |||||||||||
Net Expenses | 1,226,937 | 237,127 | 35,689,465 | 832,053 | 768,884 | |||||||||||||||
|
|
|
|
|
|
|
|
|
| |||||||||||
Net Investment Income | 4,559,362 | 558,071 | 270,641,643 | 3,197,473 | 2,517,843 | |||||||||||||||
|
|
|
|
|
|
|
|
|
| |||||||||||
Net Realized and Unrealized Gain (Loss) on Investments, Unfunded Commitments, Swaps and Foreign Currencies: | ||||||||||||||||||||
Net Realized Gain (Loss) from: | ||||||||||||||||||||
Investments, Unfunded Commitments and Foreign Currency Transactions | 2,205,179 | (298,035 | ) | (165,631,300 | ) | 1,669,446 | 1,682,084 | |||||||||||||
Swap Contracts | — | (24,948 | ) | — | — | — | ||||||||||||||
Net Change in Unrealized Appreciation (Depreciation) on: | ||||||||||||||||||||
Investments, Unfunded Commitments and Foreign Currencies | (2,686,468 | ) | (721,324 | ) | (230,916,711 | ) | (736,695 | ) | 196,585 | |||||||||||
Swap Contracts | — | 1,656 | — | — | — | |||||||||||||||
|
|
|
|
|
|
|
|
|
| |||||||||||
Net Realized and Unrealized Gain (Loss) on Investments, Unfunded Commitments, Swaps and Foreign Currencies | (481,289 | ) | (1,042,651 | ) | (396,548,011 | ) | 932,751 | 1,878,669 | ||||||||||||
|
|
|
|
|
|
|
|
|
| |||||||||||
Change in Net Assets from Operations | $4,078,073 | $(484,580) | $(125,906,368) | $4,130,224 | $4,396,512 | |||||||||||||||
|
|
|
|
|
|
|
|
|
| |||||||||||
See Notes to Financial Statements.
115
Table of Contents
STATEMENTS OF OPERATIONS
RIDGEWORTH FUNDS For the Fiscal Year Ended March 31, 2016
| Seix High Income Fund | Seix High Yield Fund | Seix Investment Grade Tax-Exempt Bond Fund | Seix Limited Duration Fund | Seix North Carolina Tax-Exempt Bond Fund | ||||||||||||||||
Investment Income: | ||||||||||||||||||||
Interest Income | $51,746,684 | $40,233,693 | $19,457,318 | $42,739 | $988,780 | |||||||||||||||
Dividend Income | 706,588 | 57,599 | — | — | — | |||||||||||||||
Net Income from Securities Lending | 635,442 | 375,768 | — | — | — | |||||||||||||||
|
|
|
|
|
|
|
|
|
| |||||||||||
Total Investment Income | 53,088,714 | 40,667,060 | 19,457,318 | 42,739 | 988,780 | |||||||||||||||
|
|
|
|
|
|
|
|
|
| |||||||||||
Expenses: | ||||||||||||||||||||
Investment Advisory Fees | 4,029,645 | 2,862,692 | 3,238,901 | 6,647 | 167,104 | |||||||||||||||
Administration Fees | 75,040 | 64,797 | 65,959 | 670 | 3,365 | |||||||||||||||
Fund Accounting Fees | 77,454 | 64,720 | 69,253 | 701 | 3,447 | |||||||||||||||
Transfer Agency Fees | 149,611 | 197,169 | 165,412 | 1,414 | 7,119 | |||||||||||||||
Compliance & Fund Services Fees | 59,077 | 50,079 | 52,047 | 530 | 2,677 | |||||||||||||||
Distribution and Service Fees — A Shares | 164,836 | 19,352 | 81,639 | — | 900 | |||||||||||||||
Distribution and Service Fees — R Shares | 87,348 | 3,202 | — | — | — | |||||||||||||||
Shareholder Servicing Fees — I Shares | 1,022,325 | 493,838 | 677,451 | — | 29,309 | |||||||||||||||
Shareholder Servicing Fees — A Shares | 52,467 | 3,541 | 14,035 | — | 107 | |||||||||||||||
Shareholder Servicing Fees — R Shares | 16,453 | — | — | — | — | |||||||||||||||
Custodian Fees | 28,782 | 19,931 | 13,853 | 5,350 | 6,634 | |||||||||||||||
Printing Fees | 109,306 | 38,134 | 28,224 | 642 | 1,095 | |||||||||||||||
Registration Fees | 66,360 | 54,762 | 36,046 | 7,676 | 12,885 | |||||||||||||||
Trustee Fees | 31,816 | 27,345 | 27,977 | 283 | 1,488 | |||||||||||||||
Other Fees | 85,768 | 76,422 | 73,182 | 7,203 | 9,921 | |||||||||||||||
|
|
|
|
|
|
|
|
|
| |||||||||||
Total Expenses | 6,056,288 | 3,975,984 | 4,543,979 | 31,116 | 246,051 | |||||||||||||||
Less: Investment Advisory Fees Waived/Expenses Reimbursed | — | — | (230,521 | ) | (7,767 | ) | (27,322 | ) | ||||||||||||
|
|
|
|
|
|
|
|
|
| |||||||||||
Net Expenses | 6,056,288 | 3,975,984 | 4,313,458 | 23,349 | 218,729 | |||||||||||||||
|
|
|
|
|
|
|
|
|
| |||||||||||
Net Investment Income | 47,032,426 | 36,691,076 | 15,143,860 | 19,390 | 770,051 | |||||||||||||||
|
|
|
|
|
|
|
|
|
| |||||||||||
Net Realized and Unrealized Gain (Loss) on Investments and Swaps: | ||||||||||||||||||||
Net Realized Gain (Loss) from: | ||||||||||||||||||||
Investment Transactions | (58,364,351 | ) | (43,751,931 | ) | 5,969,610 | (658 | ) | 555,848 | ||||||||||||
Swap Contracts | 290,557 | 421,799 | — | — | — | |||||||||||||||
Net Change in Unrealized Depreciation on: | ||||||||||||||||||||
Investments | (37,995,417 | ) | (31,692,945 | ) | (2,477,315 | ) | (2,502 | ) | (368,882 | ) | ||||||||||
Swap Contracts | (224,551 | ) | (367,750 | ) | — | — | — | |||||||||||||
|
|
|
|
|
|
|
|
|
| |||||||||||
Net Realized and Unrealized Gain (Loss) on Investments and Swaps | (96,293,762 | ) | (75,390,827 | ) | 3,492,295 | (3,160 | ) | 186,966 | ||||||||||||
|
|
|
|
|
|
|
|
|
| |||||||||||
Change in Net Assets from Operations | $(49,261,336) | $(38,699,751) | $18,636,155 | $16,230 | $957,017 | |||||||||||||||
|
|
|
|
|
|
|
|
|
| |||||||||||
See Notes to Financial Statements.
116
Table of Contents
STATEMENTS OF OPERATIONS
RIDGEWORTH FUNDS For the Fiscal Year Ended March 31, 2016
| Seix Short-Term Bond Fund | Seix Short-Term Municipal Bond Fund | Seix Total Return Bond Fund | Seix U.S. Government Securities Ultra-Short Bond Fund | Seix U.S. Mortgage Fund | ||||||||||||||||
Investment Income: | ||||||||||||||||||||
Interest Income | $ | 637,060 | $ | 390,315 | $ | 25,572,663 | $ | 15,668,573 | $ | 467,776 | ||||||||||
Net Income from Securities Lending | — | — | 276,577 | — | — | |||||||||||||||
|
|
|
|
|
|
|
|
|
| |||||||||||
Total Investment Income | 637,060 | 390,315 | 25,849,240 | 15,668,573 | 467,776 | |||||||||||||||
|
|
|
|
|
|
|
|
|
| |||||||||||
Expenses: | ||||||||||||||||||||
Investment Advisory Fees | 215,055 | 149,091 | 2,747,820 | 3,029,253 | 114,410 | |||||||||||||||
Administration Fees | 5,409 | 4,286 | 114,491 | 160,974 | 2,757 | |||||||||||||||
Fund Accounting Fees | 6,411 | 4,546 | 121,657 | 167,669 | 3,003 | |||||||||||||||
Transfer Agency Fees | 11,784 | 14,555 | 105,417 | 182,432 | 15,135 | |||||||||||||||
Compliance & Fund Services Fees | 4,310 | 3,339 | 90,465 | 126,604 | 2,129 | |||||||||||||||
Distribution and Service Fees — A Shares | 4,408 | 7,944 | 92,399 | — | 11,629 | |||||||||||||||
Distribution and Service Fees — C Shares | 16,208 | — | — | — | 50,842 | |||||||||||||||
Distribution and Service Fees — R Shares | — | — | 280,219 | — | — | |||||||||||||||
Shareholder Servicing Fees — I Shares | 50,067 | 33,019 | 1,367,901 | 2,471,321 | 21,919 | |||||||||||||||
Shareholder Servicing Fees — A Shares | 748 | 1,727 | 52,955 | — | 5,991 | |||||||||||||||
Shareholder Servicing Fees — R Shares | — | — | 137,909 | — | — | |||||||||||||||
Custodian Fees | 8,186 | 7,063 | 36,983 | 29,607 | 10,697 | |||||||||||||||
Printing Fees | 2,718 | 2,536 | 103,419 | 113,036 | 2,292 | |||||||||||||||
Registration Fees | 42,198 | 30,096 | 63,178 | 39,854 | 43,272 | |||||||||||||||
Trustee Fees | 2,333 | 1,848 | 48,916 | 69,741 | 1,015 | |||||||||||||||
Other Fees | 12,297 | 10,900 | 130,493 | 168,027 | 12,613 | |||||||||||||||
|
|
|
|
|
|
|
|
|
| |||||||||||
Total Expenses | 382,132 | 270,950 | 5,494,222 | 6,558,518 | 297,704 | |||||||||||||||
Less: Investment Advisory Fees Waived/Expenses Reimbursed | (43,104 | ) | (46,670 | ) | (2,074 | ) | — | (44,867 | ) | |||||||||||
|
|
|
|
|
|
|
|
|
| |||||||||||
Net Expenses | 339,028 | 224,280 | 5,492,148 | 6,558,518 | 252,837 | |||||||||||||||
|
|
|
|
|
|
|
|
|
| |||||||||||
Net Investment Income | 298,032 | 166,035 | 20,357,092 | 9,110,055 | 214,939 | |||||||||||||||
|
|
|
|
|
|
|
|
|
| |||||||||||
Net Realized and Unrealized Gain (Loss) on Investments, Futures, Swaps and Foreign Currencies: | ||||||||||||||||||||
Net Realized Gain (Loss) from: | ||||||||||||||||||||
Investment and Foreign Currency Transactions | 38,645 | 130 | 5,811,666 | 897,215 | 255,310 | |||||||||||||||
Futures Contracts | — | — | — | (1,463,126 | ) | — | ||||||||||||||
Swap Contracts | — | — | (87,731 | ) | — | — | ||||||||||||||
Forward Foreign Currency Contracts | — | — | 1,867,571 | — | — | |||||||||||||||
Net Change in Unrealized Appreciation (Depreciation) on: | ||||||||||||||||||||
Investments and Foreign Currencies | 40,850 | 20,433 | (13,041,312 | ) | (10,546,528 | ) | 181,370 | |||||||||||||
Futures Contracts | — | — | — | 479,018 | — | |||||||||||||||
Swap Contracts | — | — | 50,260 | — | — | |||||||||||||||
Forward Foreign Currency Contracts | — | — | (1,351,317 | ) | — | — | ||||||||||||||
|
|
|
|
|
|
|
|
|
| |||||||||||
Net Realized and Unrealized Gain (Loss) on Investments, Futures, Swaps and Foreign Currencies | 79,495 | 20,563 | (6,750,863 | ) | (10,633,421 | ) | 436,680 | |||||||||||||
|
|
|
|
|
|
|
|
|
| |||||||||||
Change in Net Assets from Operations | $ | 377,527 | $ | 186,598 | $ | 13,606,229 | $ | (1,523,366 | ) | $ | 651,619 | |||||||||
|
|
|
|
|
|
|
|
|
| |||||||||||
See Notes to Financial Statements.
117
Table of Contents
STATEMENTS OF OPERATIONS
RIDGEWORTH FUNDS For the Fiscal Year Ended March 31, 2016
| Seix Ultra-Short Bond Fund | Seix Virginia Intermediate Municipal Bond Fund | |||||||
Investment Income: | ||||||||
Interest Income | $1,305,834 | $3,075,079 | ||||||
|
|
|
| |||||
Total Investment Income | 1,305,834 | 3,075,079 | ||||||
|
|
|
| |||||
Expenses: | ||||||||
Investment Advisory Fees | 248,510 | 507,743 | ||||||
Administration Fees | 11,371 | 10,236 | ||||||
Fund Accounting Fees | 11,829 | 10,641 | ||||||
Transfer Agency Fees | 35,778 | 19,318 | ||||||
Compliance & Fund Services Fees | 9,072 | 7,993 | ||||||
Distribution and Service Fees — A Shares | — | 7,101 | ||||||
Shareholder Servicing Fees — I Shares | 59,465 | 82,342 | ||||||
Shareholder Servicing Fees — A Shares | — | 521 | ||||||
Custodian Fees | 11,284 | 8,049 | ||||||
Printing Fees | 4,309 | 2,202 | ||||||
Registration Fees | 21,017 | 18,519 | ||||||
Trustee Fees | 4,851 | 4,559 | ||||||
Other Fees | 17,284 | 16,400 | ||||||
|
|
|
| |||||
Total Expenses | 434,770 | 695,624 | ||||||
Less: Investment Advisory Fees Waived/Expenses Reimbursed | — | (28,628 | ) | |||||
|
|
|
| |||||
Net Expenses | 434,770 | 666,996 | ||||||
|
|
|
| |||||
Net Investment Income | 871,064 | 2,408,083 | ||||||
|
|
|
| |||||
Net Realized and Unrealized Gain (Loss) on Investments and Futures: | ||||||||
Net Realized Gain (Loss) from: | ||||||||
Investment Transactions | (19,782 | ) | 2,374,971 | |||||
Futures Contracts | (220,838 | ) | — | |||||
Net Change in Unrealized Appreciation (Depreciation) on: | ||||||||
Investments | (262,722 | ) | (1,983,765 | ) | ||||
Futures Contracts | 37,451 | — | ||||||
|
|
|
| |||||
Net Realized and Unrealized Gain (Loss) on Investments and Futures | (465,891 | ) | 391,206 | |||||
|
|
|
| |||||
Change in Net Assets from Operations | $405,173 | $2,799,289 | ||||||
|
|
|
| |||||
See Notes to Financial Statements.
118
Table of Contents
STATEMENTS OF CHANGES IN NET ASSETS
RIDGEWORTH FUNDS For the Fiscal Years Indicated
| Seix Core Bond Fund | Seix Corporate Bond Fund | Seix Floating Rate High Income Fund | ||||||||||||||||||||||
| 04/01/15- 03/31/16 | 04/01/14- 03/31/15 | 04/01/15- 03/31/16 | 04/01/14- 03/31/15 | 04/01/15- 03/31/16 | 04/01/14- 03/31/15 | |||||||||||||||||||
Operations: | ||||||||||||||||||||||||
Net Investment Income | $ | 4,559,362 | $ | 3,940,354 | $ | 558,071 | $ | 963,462 | $ | 270,641,643 | $ | 328,336,131 | ||||||||||||
Net Realized Gain (Loss) | 2,205,179 | 5,407,610 | (322,983 | ) | 1,209,494 | (165,631,300 | ) | (10,116,412 | ) | |||||||||||||||
Net Change in Unrealized Appreciation (Depreciation) | (2,686,468 | ) | 2,544,019 | (719,668 | ) | 21,209 | (230,916,711 | ) | (173,529,364 | ) | ||||||||||||||
|
|
|
|
|
|
|
|
|
|
|
| |||||||||||||
Change in Net Assets from Operations | 4,078,073 | 11,891,983 | (484,580 | ) | 2,194,165 | (125,906,368 | ) | 144,690,355 | ||||||||||||||||
|
|
|
|
|
|
|
|
|
|
|
| |||||||||||||
Dividends and Distributions to Shareholders: | ||||||||||||||||||||||||
Net Investment Income: | ||||||||||||||||||||||||
I Shares | (4,785,178 | ) | (4,024,505 | ) | (354,519 | ) | (745,708 | ) | (206,044,061 | ) | (319,113,755 | ) | ||||||||||||
A Shares | (165,495 | ) | (153,575 | ) | (15,352 | ) | (22,880 | ) | (6,594,772 | ) | (7,712,075 | ) | ||||||||||||
C Shares | — | — | (159,856 | ) | (194,180 | ) | (2,272,834 | ) | (2,637,461 | ) | ||||||||||||||
R Shares | (54,464 | ) | (63,070 | ) | — | — | — | — | ||||||||||||||||
IS Shares* | (272 | ) | — | — | — | (52,282,087 | ) | (58,635 | ) | |||||||||||||||
Tax Return of Capital: | ||||||||||||||||||||||||
I Shares | — | — | (15,032 | ) | — | — | — | |||||||||||||||||
A Shares | — | — | (698 | ) | — | — | — | |||||||||||||||||
C Shares | — | — | (9,948 | ) | — | — | — | |||||||||||||||||
Net Realized Gains: | ||||||||||||||||||||||||
I Shares | (1,672,598 | ) | — | (208,083 | ) | (450,254 | ) | — | — | |||||||||||||||
A Shares | (65,096 | ) | — | (10,866 | ) | (15,424 | ) | — | — | |||||||||||||||
C Shares | — | — | (193,921 | ) | (179,318 | ) | — | — | ||||||||||||||||
R Shares | (28,138 | ) | — | — | — | — | — | |||||||||||||||||
IS Shares* | (54 | ) | — | — | — | — | — | |||||||||||||||||
|
|
|
|
|
|
|
|
|
|
|
| |||||||||||||
Total Dividends and Distributions | (6,771,295 | ) | (4,241,150 | ) | (968,275 | ) | (1,607,764 | ) | (267,193,754 | ) | (329,521,926 | ) | ||||||||||||
|
|
|
|
|
|
|
|
|
|
|
| |||||||||||||
Change in Net Assets from Capital Transactions | 69,050,058 | (19,178,943 | ) | (15,267,803 | ) | (5,503,208 | ) | (1,513,564,786 | ) | (2,802,560,007 | ) | |||||||||||||
|
|
|
|
|
|
|
|
|
|
|
| |||||||||||||
Change in Net Assets | 66,356,836 | (11,528,110 | ) | (16,720,658 | ) | (4,916,807 | ) | (1,906,664,908 | ) | (2,987,391,578 | ) | |||||||||||||
|
|
|
|
|
|
|
|
|
|
|
| |||||||||||||
Net Assets: | ||||||||||||||||||||||||
Beginning of Period | 202,806,019 | 214,334,129 | 34,268,968 | 39,185,775 | 6,273,405,793 | 9,260,797,371 | ||||||||||||||||||
|
|
|
|
|
|
|
|
|
|
|
| |||||||||||||
End of Period | $ | 269,162,855 | $ | 202,806,019 | $ | 17,548,310 | $ | 34,268,968 | $ | 4,366,740,885 | $ | 6,273,405,793 | ||||||||||||
|
|
|
|
|
|
|
|
|
|
|
| |||||||||||||
Accumulated Net Investment Income (Loss), End of Period | $ | (328,472 | ) | $ | (340,461 | ) | $ | (39,531 | ) | $ | (64,835 | ) | $ | 4,095,610 | $ | 511,077 | ||||||||
|
|
|
|
|
|
|
|
|
|
|
| |||||||||||||
| * | IS Shares commenced operations on August 3, 2015 for Seix Core Bond Fund and February 2, 2015 for Seix Floating Rate High Income Fund. |
See Notes to Financial Statements.
119
Table of Contents
STATEMENTS OF CHANGES IN NET ASSETS (continued)
RIDGEWORTH FUNDS For the Fiscal Years Indicated
| Seix Georgia Tax-Exempt Bond Fund | Seix High Grade Municipal Bond Fund | Seix High Income Fund | ||||||||||||||||||||||
| 04/01/15- 03/31/16 | 04/01/14- 03/31/15 | 04/01/15- 03/31/16 | 04/01/14- 03/31/15 | 04/01/15- 03/31/16 | 04/01/14- 03/31/15 | |||||||||||||||||||
Operations: | ||||||||||||||||||||||||
Net Investment Income | $ | 3,197,473 | $ | 3,369,667 | $ | 2,517,843 | $ | 2,142,287 | $ | 47,032,426 | $ | 51,106,250 | ||||||||||||
Net Realized Gain (Loss) | 1,669,446 | 2,134,836 | 1,682,084 | 2,385,295 | (58,073,794 | ) | (9,175,361 | ) | ||||||||||||||||
Net Change in Unrealized Appreciation (Depreciation) | (736,695 | ) | 3,204,295 | 196,585 | 1,292,519 | (38,219,968 | ) | (40,095,151 | ) | |||||||||||||||
|
|
|
|
|
|
|
|
|
|
|
| |||||||||||||
Change in Net Assets from Operations | 4,130,224 | 8,708,798 | 4,396,512 | 5,820,101 | (49,261,336 | ) | 1,835,738 | |||||||||||||||||
|
|
|
|
|
|
|
|
|
|
|
| |||||||||||||
Dividends and Distributions to Shareholders: | ||||||||||||||||||||||||
Net Investment Income: | ||||||||||||||||||||||||
I Shares | (3,111,493 | ) | (3,271,526 | ) | (2,217,002 | ) | (1,802,016 | ) | (42,544,235 | ) | (44,865,842 | ) | ||||||||||||
A Shares | (85,979 | ) | (98,214 | ) | (300,812 | ) | (340,203 | ) | (3,358,446 | ) | (5,308,612 | ) | ||||||||||||
R Shares | — | — | — | — | (1,038,413 | ) | (1,140,516 | ) | ||||||||||||||||
IS Shares* | — | — | — | — | (286,022 | ) | (203,040 | ) | ||||||||||||||||
Net Realized Gains: | ||||||||||||||||||||||||
I Shares | — | — | (990,891 | ) | (1,021,985 | ) | — | (22,443,420 | ) | |||||||||||||||
A Shares | — | — | (140,501 | ) | (188,454 | ) | — | (2,009,392 | ) | |||||||||||||||
R Shares | — | — | — | — | — | (657,683 | ) | |||||||||||||||||
IS Shares* | — | — | — | — | — | (166,118 | ) | |||||||||||||||||
|
|
|
|
|
|
|
|
|
|
|
| |||||||||||||
Total Dividends and Distributions | (3,197,472 | ) | (3,369,740 | ) | (3,649,206 | ) | (3,352,658 | ) | (47,227,116 | ) | (76,794,623 | ) | ||||||||||||
|
|
|
|
|
|
|
|
|
|
|
| |||||||||||||
Change in Net Assets from Capital Transactions | (25,139,236 | ) | 5,205,351 | 792,328 | �� | 53,088,287 | (140,908,042 | ) | (44,475,816 | ) | ||||||||||||||
|
|
|
|
|
|
|
|
|
|
|
| |||||||||||||
Change in Net Assets | (24,206,484 | ) | 10,544,409 | 1,539,634 | 55,555,730 | (237,396,494 | ) | (119,434,701 | ) | |||||||||||||||
|
|
|
|
|
|
|
|
|
|
|
| |||||||||||||
Net Assets: | ||||||||||||||||||||||||
Beginning of Period | 135,518,366 | 124,973,957 | 112,259,504 | 56,703,774 | 843,314,691 | �� | 962,749,392 | |||||||||||||||||
|
|
|
|
|
|
|
|
|
|
|
| |||||||||||||
End of Period | $ | 111,311,882 | $ | 135,518,366 | $ | 113,799,138 | $ | 112,259,504 | $ | 605,918,197 | $ | 843,314,691 | ||||||||||||
|
|
|
|
|
|
|
|
|
|
|
| |||||||||||||
Accumulated Net Investment Income (Loss), End of Period | $ | 190,525 | $ | 190,524 | $ | (7,042 | ) | $ | (7,071 | ) | $ | (411,451 | ) | $ | (367,341 | ) | ||||||||
|
|
|
|
|
|
|
|
|
|
|
| |||||||||||||
| * | IS Shares commenced operations on August 1, 2014. |
See Notes to Financial Statements.
120
Table of Contents
STATEMENTS OF CHANGES IN NET ASSETS (continued)
RIDGEWORTH FUNDS For the Fiscal Years Indicated
| Seix High Yield Fund | Seix Investment Grade Tax-Exempt Bond Fund | Seix Limited Duration Fund | ||||||||||||||||||||||
| 04/01/15- 03/31/16 | 04/01/14- 03/31/15 | 04/01/15- 03/31/16 | 04/01/14- 03/31/15 | 04/01/15- 03/31/16 | 04/01/14- 03/31/15 | |||||||||||||||||||
Operations: | ||||||||||||||||||||||||
Net Investment Income | $ | 36,691,076 | $ | 50,221,962 | $ | 15,143,860 | $ | 16,915,643 | $ | 19,390 | $ | 13,703 | ||||||||||||
Net Realized Gain (Loss) | (43,330,132 | ) | 8,735,325 | 5,969,610 | 15,090,036 | (658 | ) | (350 | ) | |||||||||||||||
Net Change in Unrealized Appreciation (Depreciation) | (32,060,695 | ) | (49,591,809 | ) | (2,477,315 | ) | 2,178,271 | (2,502 | ) | (1,950 | ) | |||||||||||||
|
|
|
|
|
|
|
|
|
|
|
| |||||||||||||
Change in Net Assets from Operations | (38,699,751 | ) | 9,365,478 | 18,636,155 | 34,183,950 | 16,230 | 11,403 | |||||||||||||||||
|
|
|
|
|
|
|
|
|
|
|
| |||||||||||||
Dividends and Distributions to Shareholders: | ||||||||||||||||||||||||
Net Investment Income: | ||||||||||||||||||||||||
I Shares | (36,915,937 | ) | (49,018,736 | ) | (14,552,251 | ) | (16,227,546 | ) | (17,332 | ) | (11,822 | ) | ||||||||||||
A Shares | (432,905 | ) | (1,686,559 | ) | (591,504 | ) | (688,148 | ) | — | — | ||||||||||||||
R Shares | (34,562 | ) | (55,575 | ) | — | — | — | — | ||||||||||||||||
Net Realized Gains: | ||||||||||||||||||||||||
I Shares | — | (63,887,145 | ) | (7,129,553 | ) | (8,172,201 | ) | — | — | |||||||||||||||
A Shares | — | (626,273 | ) | (294,359 | ) | (354,453 | ) | — | — | |||||||||||||||
R Shares | — | (79,485 | ) | — | — | — | — | |||||||||||||||||
|
|
|
|
|
|
|
|
|
|
|
| |||||||||||||
Total Dividends and Distributions | (37,383,404 | ) | (115,353,773 | ) | (22,567,667 | ) | (25,442,348 | ) | (17,332 | ) | (11,822 | ) | ||||||||||||
|
|
|
|
|
|
|
|
|
|
|
| |||||||||||||
Change in Net Assets from Capital Transactions | (96,627,566 | ) | (472,362,184 | ) | (29,063,575 | ) | 4,621,212 | — | — | |||||||||||||||
|
|
|
|
|
|
|
|
|
|
|
| |||||||||||||
Change in Net Assets | (172,710,721 | ) | (578,350,479 | ) | (32,995,087 | ) | 13,362,814 | (1,102 | ) | (419 | ) | |||||||||||||
|
|
|
|
|
|
|
|
|
|
|
| |||||||||||||
Net Assets: | ||||||||||||||||||||||||
Beginning of Period | 703,952,797 | 1,282,303,276 | 687,290,760 | 673,927,946 | 6,649,668 | 6,650,087 | ||||||||||||||||||
|
|
|
|
|
|
|
|
|
|
|
| |||||||||||||
End of Period | $ | 531,242,076 | $ | 703,952,797 | $ | 654,295,673 | $ | 687,290,760 | $ | 6,648,566 | $ | 6,649,668 | ||||||||||||
|
|
|
|
|
|
|
|
|
|
|
| |||||||||||||
Accumulated Net Investment Income (Loss), End of Period | $ | (1,279,544 | ) | $ | (1,258,535 | ) | $ | (228,333 | ) | $ | (228,438 | ) | $ | (772 | ) | $ | (715 | ) | ||||||
|
|
|
|
|
|
|
|
|
|
|
| |||||||||||||
See Notes to Financial Statements.
121
Table of Contents
STATEMENTS OF CHANGES IN NET ASSETS (continued)
RIDGEWORTH FUNDS For the Fiscal Years Indicated
| Seix North Carolina Tax-Exempt Bond Fund | Seix Short-Term Bond Fund | Seix Short-Term Municipal Bond Fund | ||||||||||||||||||||||
| 04/01/15- 03/31/16 | 04/01/14- 03/31/15 | 04/01/15- 03/31/16 | 04/01/14- 03/31/15 | 04/01/15- 03/31/16 | 04/01/14- 03/31/15 | |||||||||||||||||||
Operations: | ||||||||||||||||||||||||
Net Investment Income | $ | 770,051 | $ | 881,151 | $ | 298,032 | $ | 238,274 | $ | 166,035 | $ | 162,464 | ||||||||||||
Net Realized Gain | 555,848 | 736,445 | 38,645 | 240,074 | 130 | 210,677 | ||||||||||||||||||
Net Change in Unrealized Appreciation (Depreciation) | (368,882 | ) | 831,457 | 40,850 | (101,238 | ) | 20,433 | 93,039 | ||||||||||||||||
|
|
|
|
|
|
|
|
|
|
|
| |||||||||||||
Change in Net Assets from Operations | 957,017 | 2,449,053 | 377,527 | 377,110 | 186,598 | 466,180 | ||||||||||||||||||
|
|
|
|
|
|
|
|
|
|
|
| |||||||||||||
Dividends and Distributions to Shareholders: | ||||||||||||||||||||||||
Net Investment Income: | ||||||||||||||||||||||||
I Shares | (757,161 | ) | (863,258 | ) | (339,902 | ) | (259,957 | ) | (153,305 | ) | (149,835 | ) | ||||||||||||
A Shares | (12,890 | ) | (17,921 | ) | (10,552 | ) | (10,802 | ) | (12,722 | ) | (12,625 | ) | ||||||||||||
C Shares | — | — | — | (76 | ) | — | — | |||||||||||||||||
Net Realized Gains: | ||||||||||||||||||||||||
I Shares | (159,925 | ) | — | — | — | (72,254 | ) | (260,009 | ) | |||||||||||||||
A Shares | (2,916 | ) | — | — | — | (13,070 | ) | (31,379 | ) | |||||||||||||||
|
|
|
|
|
|
|
|
|
|
|
| |||||||||||||
Total Dividends and Distributions | (932,892 | ) | (881,179 | ) | (350,454 | ) | (270,835 | ) | (251,351 | ) | (453,848 | ) | ||||||||||||
|
|
|
|
|
|
|
|
|
|
|
| |||||||||||||
Change in Net Assets from Capital Transactions | (8,940,946 | ) | (1,754,966 | ) | (1,168,383 | ) | 11,582,335 | (2,929,472 | ) | 5,768,419 | ||||||||||||||
|
|
|
|
|
|
|
|
|
|
|
| |||||||||||||
Change in Net Assets | (8,916,821 | ) | (187,092 | ) | (1,141,310 | ) | 11,688,610 | (2,994,225 | ) | 5,780,751 | ||||||||||||||
|
|
|
|
|
|
|
|
|
|
|
| |||||||||||||
Net Assets: | ||||||||||||||||||||||||
Beginning of Period | 37,984,952 | 38,172,044 | 54,735,428 | 43,046,818 | 42,532,958 | 36,752,207 | ||||||||||||||||||
|
|
|
|
|
|
|
|
|
|
|
| |||||||||||||
End of Period | $ | 29,068,131 | $ | 37,984,952 | $ | 53,594,118 | $ | 54,735,428 | $ | 39,538,733 | $ | 42,532,958 | ||||||||||||
|
|
|
|
|
|
|
|
|
|
|
| |||||||||||||
Accumulated Net Investment Loss, End of Period | $ | (57,474 | ) | $ | (63,143 | ) | $ | (2,124 | ) | $ | (1,569 | ) | $ | (1,437 | ) | $ | (1,445 | ) | ||||||
|
|
|
|
|
|
|
|
|
|
|
| |||||||||||||
See Notes to Financial Statements.
122
Table of Contents
STATEMENTS OF CHANGES IN NET ASSETS (continued)
RIDGEWORTH FUNDS For the Fiscal Years Indicated
| Seix Total Return Bond Fund | Seix U.S. Government Securities Ultra-Short Bond Fund | Seix U.S. Mortgage Fund | ||||||||||||||||||||||
| 04/01/15- 03/31/16 | 04/01/14- 03/31/15 | 04/01/15- 03/31/16 | 04/01/14- 03/31/15 | 04/01/15- 03/31/16 | 04/01/14- 03/31/15 | |||||||||||||||||||
Operations: | ||||||||||||||||||||||||
Net Investment Income | $ | 20,357,092 | $ | 22,666,079 | $ | 9,110,055 | $ | 9,706,534 | $ | 214,939 | $ | 140,771 | ||||||||||||
Net Realized Gain (Loss) | 7,591,506 | 21,763,347 | (565,911 | ) | 7,988,412 | 255,310 | 217,709 | |||||||||||||||||
Net Change in Unrealized Appreciation (Depreciation) | (14,342,369 | ) | 12,963,935 | (10,067,510 | ) | (3,881,129 | ) | 181,370 | 244,661 | |||||||||||||||
|
|
|
|
|
|
|
|
|
|
|
| |||||||||||||
Change in Net Assets from Operations | 13,606,229 | 57,393,361 | (1,523,366 | ) | 13,813,817 | 651,619 | 603,141 | |||||||||||||||||
|
|
|
|
|
|
|
|
|
|
|
| |||||||||||||
Dividends and Distributions to Shareholders: | ||||||||||||||||||||||||
Net Investment Income: | ||||||||||||||||||||||||
I Shares | (19,336,958 | ) | (21,115,553 | ) | (12,422,092 | ) | (13,488,002 | ) | (291,602 | ) | (77,129 | ) | ||||||||||||
A Shares | (635,699 | ) | (830,587 | ) | — | — | (89,133 | ) | (59,757 | ) | ||||||||||||||
C Shares | — | — | — | — | (39,997 | ) | (54,737 | ) | ||||||||||||||||
R Shares | (769,627 | ) | (1,171,743 | ) | — | — | — | — | ||||||||||||||||
IS Shares* | (1,476,134 | ) | (1,094,613 | ) | — | — | — | — | ||||||||||||||||
Net Realized Gains: | ||||||||||||||||||||||||
I Shares | (1,023,082 | ) | — | — | — | — | — | |||||||||||||||||
A Shares | (34,543 | ) | — | — | — | — | — | |||||||||||||||||
R Shares | (55,720 | ) | — | — | — | — | — | |||||||||||||||||
IS Shares* | (72,019 | ) | — | — | — | — | — | |||||||||||||||||
|
|
|
|
|
|
|
|
|
|
|
| |||||||||||||
Total Dividends and Distributions | (23,403,782 | ) | (24,212,496 | ) | (12,422,092 | ) | (13,488,002 | ) | (420,732 | ) | (191,623 | ) | ||||||||||||
|
|
|
|
|
|
|
|
|
|
|
| |||||||||||||
Change in Net Assets from Capital Transactions | (31,719,301 | ) | (17,395,124 | ) | (94,042,939 | ) | (327,653,113 | ) | 24,033,593 | 2,236,092 | ||||||||||||||
|
|
|
|
|
|
|
|
|
|
|
| |||||||||||||
Change in Net Assets | (41,516,854 | ) | 15,785,741 | (107,988,397 | ) | (327,327,298 | ) | 24,264,480 | 2,647,610 | |||||||||||||||
|
|
|
|
|
|
|
|
|
|
|
| |||||||||||||
Net Assets: | ||||||||||||||||||||||||
Beginning of Period | 1,151,576,442 | 1,135,790,701 | 1,665,887,657 | 1,993,214,955 | 12,841,043 | 10,193,433 | ||||||||||||||||||
|
|
|
|
|
|
|
|
|
|
|
| |||||||||||||
End of Period | $ | 1,110,059,588 | $ | 1,151,576,442 | $ | 1,557,899,260 | $ | 1,665,887,657 | $ | 37,105,523 | $ | 12,841,043 | ||||||||||||
|
|
|
|
|
|
|
|
|
|
|
| |||||||||||||
Accumulated Net Investment Loss, End of Period | $ | (2,006,504 | ) | $ | (3,037,962 | ) | $ | (2,617 | ) | $ | (517 | ) | $ | (15,736 | ) | $ | (15,691 | ) | ||||||
|
|
|
|
|
|
|
|
|
|
|
| |||||||||||||
| * | IS Shares commenced operations on August 1, 2014. |
See Notes to Financial Statements.
123
Table of Contents
STATEMENTS OF CHANGES IN NET ASSETS (concluded)
RIDGEWORTH FUNDS For the Fiscal Years Indicated
| Seix Ultra-Short Bond Fund | Seix Virginia Intermediate Municipal Bond Fund | |||||||||||||||
| 04/01/15- 03/31/16 | 04/01/14- 03/31/15 | 04/01/15- 03/31/16 | 04/01/14- 03/31/15 | |||||||||||||
Operations: | ||||||||||||||||
Net Investment Income | $ | 871,064 | $ | 819,017 | $ | 2,408,083 | $ | 3,007,076 | ||||||||
Net Realized Gain (Loss) | (240,620 | ) | (29,150 | ) | 2,374,971 | 2,395,690 | ||||||||||
Net Change in Unrealized Appreciation (Depreciation) | (225,271 | ) | (2,958 | ) | (1,983,765 | ) | 198,008 | |||||||||
|
|
|
|
|
|
|
| |||||||||
Change in Net Assets from Operations | 405,173 | 786,909 | 2,799,289 | 5,600,774 | ||||||||||||
|
|
|
|
|
|
|
| |||||||||
Dividends and Distributions to Shareholders: | ||||||||||||||||
Net Investment Income: | ||||||||||||||||
I Shares | (924,985 | ) | (932,817 | ) | (2,299,604 | ) | (2,866,071 | ) | ||||||||
A Shares | — | — | (108,482 | ) | (141,063 | ) | ||||||||||
Net Realized Gains: | ||||||||||||||||
I Shares | — | — | (1,946,468 | ) | (973,740 | ) | ||||||||||
A Shares | — | — | (115,930 | ) | (44,134 | ) | ||||||||||
|
|
|
|
|
|
|
| |||||||||
Total Dividends and Distributions | (924,985 | ) | (932,817 | ) | (4,470,484 | ) | (4,025,008 | ) | ||||||||
|
|
|
|
|
|
|
| |||||||||
Change in Net Assets from Capital Transactions | (37,209,500 | ) | 20,772,412 | (53,566,152 | ) | (5,588,926 | ) | |||||||||
|
|
|
|
|
|
|
| |||||||||
Change in Net Assets | (37,729,312 | ) | 20,626,504 | (55,237,347 | ) | (4,013,160 | ) | |||||||||
|
|
|
|
|
|
|
| |||||||||
Net Assets: | ||||||||||||||||
Beginning of Period | 142,679,606 | 122,053,102 | 124,254,980 | 128,268,140 | ||||||||||||
|
|
|
|
|
|
|
| |||||||||
End of Period | $ | 104,950,294 | $ | 142,679,606 | $ | 69,017,633 | $ | 124,254,980 | ||||||||
|
|
|
|
|
|
|
| |||||||||
Accumulated Net Investment Income (Loss), End of Period | $ | (2,389 | ) | $ | (2,391 | ) | $ | 19,172 | $ | 19,175 | ||||||
|
|
|
|
|
|
|
| |||||||||
See Notes to Financial Statements.
124
Table of Contents
RIDGEWORTH FUNDS Selected Data For a Share of Beneficial Interest Outstanding Throughout the Periods Indicated.
| Net Asset Value, Beginning of Period | Net Investment Income (Loss)(a) | Net Realized and Unrealized Gains (Losses) on Investments | Total from Operations | Dividends from Net Investment Income | Distributions from Tax Return of Capital | Distributions from Realized Capital Gains | Total Dividends and Distributions | Net Asset Value, End of Period | Net Assets End of Period (000) | Total Return(b) | Ratio of Net Expenses to Average Net Assets(c) | Ratio of Expenses to Average Net Assets (Excluding Waivers and Reimbursements)(c) | Ratio of Net Investment Income to Average Net Assets(c) | Portfolio Turnover Rate(d) | ||||||||||||||||||||||||||||||||||||||||||||||
Seix Core Bond Fund |
| |||||||||||||||||||||||||||||||||||||||||||||||||||||||||||
I Shares | ||||||||||||||||||||||||||||||||||||||||||||||||||||||||||||
Year Ended March 31, 2016 | $11.04 | $0.20 | $(0.08 | ) | $0.12 | $(0.21 | ) | $— | $(0.09 | ) | $(0.30 | ) | $10.86 | $255,522 | 1.18 | % | 0.48 | % | 0.48 | % | 1.82 | % | 232 | % | ||||||||||||||||||||||||||||||||||||
Year Ended March 31, 2015 | 10.65 | 0.21 | 0.40 | 0.61 | (0.22 | ) | — | — | (0.22 | ) | 11.04 | 191,905 | 5.80 | 0.45 | 0.45 | 1.90 | 168 | |||||||||||||||||||||||||||||||||||||||||||
Year Ended March 31, 2014 | 11.16 | 0.18 | (0.23 | ) | (0.05 | ) | (0.22 | ) | — | (0.24 | ) | (0.46 | ) | 10.65 | 200,371 | (0.38 | ) | 0.42 | 0.42 | 1.67 | 208 | |||||||||||||||||||||||||||||||||||||||
Year Ended March 31, 2013 | 11.10 | 0.15 | 0.24 | 0.39 | (0.20 | ) | — | (0.13 | ) | (0.33 | ) | 11.16 | 370,455 | 3.53 | 0.38 | 0.38 | 1.33 | 151 | ||||||||||||||||||||||||||||||||||||||||||
Year Ended March 31, 2012 | 11.00 | 0.24 | 0.81 | 1.05 | (0.27 | ) | — | (0.68 | ) | (0.95 | ) | 11.10 | 439,017 | 9.65 | 0.48 | 0.48 | 2.15 | 211 | ||||||||||||||||||||||||||||||||||||||||||
A Shares | ||||||||||||||||||||||||||||||||||||||||||||||||||||||||||||
Year Ended March 31, 2016 | 11.04 | 0.18 | (0.07 | ) | 0.11 | (0.20 | ) | — | (0.09 | ) | (0.29 | ) | 10.86 | 10,170 | 1.01 | 0.65 | 0.65 | 1.65 | 232 | |||||||||||||||||||||||||||||||||||||||||
Year Ended March 31, 2015 | 10.65 | 0.18 | 0.41 | 0.59 | (0.20 | ) | — | — | (0.20 | ) | 11.04 | 7,411 | 5.58 | 0.67 | 0.67 | 1.70 | 168 | |||||||||||||||||||||||||||||||||||||||||||
Year Ended March 31, 2014 | 11.16 | 0.15 | (0.23 | ) | (0.08 | ) | (0.19 | ) | — | (0.24 | ) | (0.43 | ) | 10.65 | 9,848 | (0.66 | ) | 0.71 | 0.71 | 1.38 | 208 | |||||||||||||||||||||||||||||||||||||||
Year Ended March 31, 2013 | 11.10 | 0.11 | 0.24 | 0.35 | (0.16 | ) | — | (0.13 | ) | (0.29 | ) | 11.16 | 20,687 | 3.20 | 0.70 | 0.69 | 1.02 | 151 | ||||||||||||||||||||||||||||||||||||||||||
Year Ended March 31, 2012 | 11.00 | 0.21 | 0.80 | 1.01 | (0.23 | ) | — | (0.68 | ) | (0.91 | ) | 11.10 | 21,644 | 9.29 | 0.82 | 0.82 | 1.84 | 211 | ||||||||||||||||||||||||||||||||||||||||||
R Shares | ||||||||||||||||||||||||||||||||||||||||||||||||||||||||||||
Year Ended March 31, 2016 | 11.05 | 0.15 | (0.07 | ) | 0.08 | (0.17 | ) | — | (0.09 | ) | (0.26 | ) | 10.87 | 3,448 | 0.78 | 0.88 | 0.88 | 1.41 | 232 | |||||||||||||||||||||||||||||||||||||||||
Year Ended March 31, 2015 | 10.66 | 0.16 | 0.41 | 0.57 | (0.18 | ) | — | — | (0.18 | ) | 11.05 | 3,490 | 5.37 | 0.85 | 0.85 | 1.51 | 168 | |||||||||||||||||||||||||||||||||||||||||||
Year Ended March 31, 2014 | 11.17 | 0.14 | (0.24 | ) | (0.10 | ) | (0.17 | ) | — | (0.24 | ) | (0.41 | ) | 10.66 | 4,115 | (0.80 | ) | 0.85 | 0.85 | 1.29 | 208 | |||||||||||||||||||||||||||||||||||||||
Year Ended March 31, 2013 | 11.10 | 0.10 | 0.24 | 0.34 | (0.14 | ) | — | (0.13 | ) | (0.27 | ) | 11.17 | 5,135 | 3.15 | 0.84 | 0.84 | 0.87 | 151 | ||||||||||||||||||||||||||||||||||||||||||
Year Ended March 31, 2012 | 11.01 | 0.18 | 0.78 | 0.96 | (0.19 | ) | — | (0.68 | ) | (0.87 | ) | 11.10 | 5,952 | 8.83 | 1.16 | 1.16 | 1.55 | 211 | ||||||||||||||||||||||||||||||||||||||||||
IS Shares(e) | ||||||||||||||||||||||||||||||||||||||||||||||||||||||||||||
Year Ended March 31, 2016 | 10.77 | 0.14 | 0.13 | 0.27 | (0.15 | ) | — | (0.03 | ) | (0.18 | ) | 10.86 | 22 | 2.51 | 0.34 | 0.34 | 2.00 | 232 | ||||||||||||||||||||||||||||||||||||||||||
Seix Corporate Bond Fund | ||||||||||||||||||||||||||||||||||||||||||||||||||||||||||||
I Shares | ||||||||||||||||||||||||||||||||||||||||||||||||||||||||||||
Year Ended March 31, 2016 | 8.95 | 0.25 | (0.29 | ) | (0.04 | ) | (0.24 | ) | (0.01 | ) | (0.20 | ) | (0.45 | ) | 8.46 | 8,943 | (0.29 | ) | 0.70 | 0.83 | 2.86 | 84 | ||||||||||||||||||||||||||||||||||||||
Year Ended March 31, 2015 | 8.80 | 0.26 | 0.32 | 0.58 | (0.26 | ) | — | (0.17 | ) | (0.43 | ) | 8.95 | 24,172 | 6.73 | 0.66 | 0.69 | 2.95 | 90 | ||||||||||||||||||||||||||||||||||||||||||
Year Ended March 31, 2014 | 9.30 | 0.28 | (0.21 | ) | 0.07 | (0.28 | ) | — | (0.29 | ) | (0.57 | ) | 8.80 | 28,017 | 0.91 | 0.63 | 0.64 | 3.18 | 143 | |||||||||||||||||||||||||||||||||||||||||
Year Ended March 31, 2013 | 9.35 | 0.32 | 0.30 | 0.62 | (0.32 | ) | — | (0.35 | ) | (0.67 | ) | 9.30 | 51,828 | 6.71 | 0.60 | 0.61 | 3.36 | 58 | ||||||||||||||||||||||||||||||||||||||||||
Year Ended March 31, 2012 | 9.59 | 0.39 | 0.46 | 0.85 | (0.39 | ) | — | (0.70 | ) | (1.09 | ) | 9.35 | 57,203 | 9.10 | 0.61 | 0.61 | 3.98 | 88 | ||||||||||||||||||||||||||||||||||||||||||
A Shares | ||||||||||||||||||||||||||||||||||||||||||||||||||||||||||||
Year Ended March 31, 2016 | 8.99 | 0.23 | (0.29 | ) | (0.06 | ) | (0.22 | ) | (0.01 | ) | (0.20 | ) | (0.43 | ) | 8.50 | 500 | (0.52 | ) | 0.95 | 1.11 | 2.68 | 84 | ||||||||||||||||||||||||||||||||||||||
Year Ended March 31, 2015 | 8.84 | 0.24 | 0.32 | 0.56 | (0.24 | ) | — | (0.17 | ) | (0.41 | ) | 8.99 | 807 | 6.40 | 0.95 | 0.99 | 2.67 | 90 | ||||||||||||||||||||||||||||||||||||||||||
Year Ended March 31, 2014 | 9.35 | 0.25 | (0.21 | ) | 0.04 | (0.26 | ) | — | (0.29 | ) | (0.55 | ) | 8.84 | 783 | 0.52 | 0.92 | 0.93 | 2.76 | 143 | |||||||||||||||||||||||||||||||||||||||||
Year Ended March 31, 2013 | 9.40 | 0.29 | 0.30 | 0.59 | (0.29 | ) | — | (0.35 | ) | (0.64 | ) | 9.35 | 4,020 | 6.39 | 0.88 | 0.88 | 3.06 | 58 | ||||||||||||||||||||||||||||||||||||||||||
Year Ended March 31, 2012 | 9.64 | 0.36 | 0.46 | 0.82 | (0.36 | ) | — | (0.70 | ) | (1.06 | ) | 9.40 | 4,325 | 8.78 | 0.88 | 0.88 | 3.68 | 88 | ||||||||||||||||||||||||||||||||||||||||||
C Shares | ||||||||||||||||||||||||||||||||||||||||||||||||||||||||||||
Year Ended March 31, 2016 | 8.95 | 0.17 | (0.29 | ) | (0.12 | ) | (0.16 | ) | (0.01 | ) | (0.20 | ) | (0.37 | ) | 8.46 | 8,105 | (1.22 | ) | 1.65 | 1.80 | 2.01 | 84 | ||||||||||||||||||||||||||||||||||||||
Year Ended March 31, 2015 | 8.80 | 0.18 | 0.32 | 0.50 | (0.18 | ) | — | (0.17 | ) | (0.35 | ) | 8.95 | 9,289 | 5.69 | 1.64 | 1.67 | 1.97 | 90 | ||||||||||||||||||||||||||||||||||||||||||
Year Ended March 31, 2014 | 9.30 | 0.19 | (0.21 | ) | (0.02 | ) | (0.19 | ) | — | (0.29 | ) | (0.48 | ) | 8.80 | 10,385 | (0.07 | ) | 1.62 | 1.63 | 2.18 | 143 | |||||||||||||||||||||||||||||||||||||||
Year Ended March 31, 2013 | 9.35 | 0.23 | 0.30 | 0.53 | (0.23 | ) | — | (0.35 | ) | (0.58 | ) | 9.30 | 15,558 | 5.67 | 1.57 | 1.58 | 2.39 | 58 | ||||||||||||||||||||||||||||||||||||||||||
Year Ended March 31, 2012 | 9.59 | 0.29 | 0.46 | 0.75 | (0.29 | ) | — | (0.70 | ) | (0.99 | ) | 9.35 | 18,317 | 8.05 | 1.58 | 1.58 | 3.00 | 88 | ||||||||||||||||||||||||||||||||||||||||||
Seix Floating Rate High Income Fund |
| |||||||||||||||||||||||||||||||||||||||||||||||||||||||||||
I Shares | ||||||||||||||||||||||||||||||||||||||||||||||||||||||||||||
Year Ended March 31, 2016 | 8.86 | 0.40 | (0.53 | ) | (0.13 | ) | (0.40 | ) | — | — | (0.40 | ) | 8.33 | 3,040,875 | (1.50 | ) | 0.62 | 0.62 | 4.69 | 33 | ||||||||||||||||||||||||||||||||||||||||
Year Ended March 31, 2015 | 9.06 | 0.39 | (0.20 | ) | 0.19 | (0.39 | ) | — | — | (0.39 | ) | 8.86 | 6,048,771 | 2.17 | 0.61 | 0.61 | 4.34 | 29 | ||||||||||||||||||||||||||||||||||||||||||
Year Ended March 31, 2014 | 9.06 | 0.38 | (0.01 | ) | 0.37 | (0.37 | ) | — | — | (0.37 | ) | 9.06 | 8,965,312 | 4.16 | 0.60 | 0.60 | 4.13 | 47 | ||||||||||||||||||||||||||||||||||||||||||
Year Ended March 31, 2013 | 8.83 | 0.46 | 0.20 | 0.66 | (0.43 | ) | — | — | (0.43 | ) | 9.06 | 5,780,847 | 7.67 | 0.60 | 0.60 | 5.13 | 70 | |||||||||||||||||||||||||||||||||||||||||||
Year Ended March 31, 2012 | 9.01 | 0.50 | (0.22 | ) | 0.28 | (0.46 | ) | — | — | (0.46 | ) | 8.83 | 3,419,351 | 3.31 | 0.60 | 0.60 | 5.69 | 72 | ||||||||||||||||||||||||||||||||||||||||||
See Notes to Financial Highlights and Notes to Financial Statements.
125
Table of Contents
Financial Highlights
RIDGEWORTH FUNDS Selected Data For a Share of Beneficial Interest Outstanding Throughout the Periods Indicated.
| Net Asset Value, Beginning of Period | Net Investment Income (Loss)(a) | Net Realized and Unrealized Gains (Losses) on Investments | Total from Operations | Dividends from Net Investment Income | Distributions from Tax Return of Capital | Distributions from Realized Capital Gains | Total Dividends and Distributions | Net Asset Value, End of Period | Net Assets End of Period (000) | Total Return(b) | Ratio of Net Expenses to Average Net Assets(c) | Ratio of Expenses to Average Net Assets (Excluding Waivers and Reimbursements)(c) | Ratio of Net Investment Income to Average Net Assets(c) | Portfolio Turnover Rate(d) | ||||||||||||||||||||||||||||||||||||||||||||||
A Shares | ||||||||||||||||||||||||||||||||||||||||||||||||||||||||||||
Year Ended March 31, 2016 | $8.86 | $0.38 | $(0.54 | ) | $(0.16 | ) | $(0.37 | ) | $— | $— | $(0.37 | ) | $8.33 | $143,325 | (1.79 | )% | 0.92 | % | 0.92 | % | 4.42 | % | 33 | % | ||||||||||||||||||||||||||||||||||||
Year Ended March 31, 2015 | 9.06 | 0.36 | (0.19 | ) | 0.17 | (0.37 | ) | — | — | (0.37 | ) | 8.86 | 147,560 | 1.88 | 0.91 | 0.91 | 4.06 | 29 | ||||||||||||||||||||||||||||||||||||||||||
Year Ended March 31, 2014 | 9.06 | 0.35 | (0.01 | ) | 0.34 | (0.34 | ) | — | — | (0.34 | ) | 9.06 | 212,336 | 3.86 | 0.89 | 0.89 | 3.82 | 47 | ||||||||||||||||||||||||||||||||||||||||||
Year Ended March 31, 2013 | 8.83 | 0.43 | 0.21 | 0.64 | (0.41 | ) | — | — | (0.41 | ) | 9.06 | 99,040 | 7.39 | 0.85 | 0.85 | 4.85 | 70 | |||||||||||||||||||||||||||||||||||||||||||
Year Ended March 31, 2012 | 9.01 | 0.48 | (0.22 | ) | 0.26 | (0.44 | ) | — | — | (0.44 | ) | 8.83 | 51,185 | 3.05 | 0.85 | 0.85 | 5.47 | 72 | ||||||||||||||||||||||||||||||||||||||||||
C Shares | ||||||||||||||||||||||||||||||||||||||||||||||||||||||||||||
Year Ended March 31, 2016 | 8.86 | 0.33 | (0.54 | ) | (0.21 | ) | (0.32 | ) | — | — | (0.32 | ) | 8.33 | 55,203 | (2.37 | ) | 1.51 | 1.51 | 3.82 | 33 | ||||||||||||||||||||||||||||||||||||||||
Year Ended March 31, 2015 | 9.07 | 0.31 | (0.21 | ) | 0.10 | (0.31 | ) | — | — | (0.31 | ) | 8.86 | 64,445 | 1.16 | 1.50 | 1.50 | 3.46 | 29 | ||||||||||||||||||||||||||||||||||||||||||
Year Ended March 31, 2014 | 9.06 | 0.29 | 0.01 | 0.30 | (0.29 | ) | — | — | (0.29 | ) | 9.07 | 83,149 | 3.33 | 1.51 | 1.51 | 3.21 | 47 | |||||||||||||||||||||||||||||||||||||||||||
Year Ended March 31, 2013 | 8.83 | 0.38 | 0.20 | 0.58 | (0.35 | ) | — | — | (0.35 | ) | 9.06 | 40,493 | 6.69 | 1.51 | 1.51 | 4.22 | 70 | |||||||||||||||||||||||||||||||||||||||||||
Year Ended March 31, 2012 | 9.02 | 0.42 | (0.23 | ) | 0.19 | (0.38 | ) | — | — | (0.38 | ) | 8.83 | 30,132 | 2.26 | 1.52 | 1.52 | 4.77 | 72 | ||||||||||||||||||||||||||||||||||||||||||
IS Shares | ||||||||||||||||||||||||||||||||||||||||||||||||||||||||||||
Year Ended March 31, 2016 | 8.86 | 0.41 | (0.53 | ) | (0.12 | ) | (0.41 | ) | — | — | (0.41 | ) | 8.33 | 1,127,337 | (1.39 | ) | 0.51 | 0.51 | 4.83 | 33 | ||||||||||||||||||||||||||||||||||||||||
Period Ended March 31, 2015(f) | 8.74 | 0.07 | 0.12 | 0.19 | (0.07 | ) | — | — | (0.07 | ) | 8.86 | 12,629 | 2.15 | 0.47 | 0.47 | 5.08 | 29 | |||||||||||||||||||||||||||||||||||||||||||
Seix Georgia Tax-Exempt Bond Fund |
| |||||||||||||||||||||||||||||||||||||||||||||||||||||||||||
I Shares | ||||||||||||||||||||||||||||||||||||||||||||||||||||||||||||
Year Ended March 31, 2016 | 10.86 | 0.27 | 0.10 | 0.37 | (0.27 | ) | — | — | (0.27 | ) | 10.96 | 107,691 | 3.50 | 0.65 | 0.68 | 2.52 | 41 | |||||||||||||||||||||||||||||||||||||||||||
Year Ended March 31, 2015 | 10.42 | 0.28 | 0.44 | 0.72 | (0.28 | ) | — | — | (0.28 | ) | 10.86 | 131,881 | 7.00 | 0.64 | 0.64 | 2.63 | 55 | |||||||||||||||||||||||||||||||||||||||||||
Year Ended March 31, 2014 | 10.78 | 0.31 | (0.36 | ) | (0.05 | ) | (0.31 | ) | — | — | (0.31 | ) | 10.42 | 120,835 | (0.37 | ) | 0.57 | 0.57 | 3.01 | 67 | ||||||||||||||||||||||||||||||||||||||||
Year Ended March 31, 2013 | 10.55 | 0.34 | 0.23 | 0.57 | (0.34 | ) | — | — | (0.34 | ) | 10.78 | 148,153 | 5.44 | 0.59 | 0.59 | 3.15 | 50 | |||||||||||||||||||||||||||||||||||||||||||
Year Ended March 31, 2012 | 9.73 | 0.36 | 0.82 | 1.18 | (0.36 | ) | — | — | (0.36 | ) | 10.55 | 145,803 | 12.33 | 0.62 | 0.62 | 3.55 | 57 | |||||||||||||||||||||||||||||||||||||||||||
A Shares | ||||||||||||||||||||||||||||||||||||||||||||||||||||||||||||
Year Ended March 31, 2016 | 10.88 | 0.26 | 0.10 | 0.36 | (0.26 | ) | — | — | (0.26 | ) | 10.98 | 3,621 | 3.40 | 0.75 | 0.75 | 2.43 | 41 | |||||||||||||||||||||||||||||||||||||||||||
Year Ended March 31, 2015 | 10.44 | 0.27 | 0.44 | 0.71 | (0.27 | ) | — | — | (0.27 | ) | 10.88 | 3,637 | 6.89 | 0.73 | 0.73 | 2.55 | 55 | |||||||||||||||||||||||||||||||||||||||||||
Year Ended March 31, 2014 | 10.80 | 0.30 | (0.36 | ) | (0.06 | ) | (0.30 | ) | — | — | (0.30 | ) | 10.44 | 4,139 | (0.52 | ) | 0.72 | 0.72 | 2.87 | 67 | ||||||||||||||||||||||||||||||||||||||||
Year Ended March 31, 2013 | 10.57 | 0.32 | 0.23 | 0.55 | (0.32 | ) | — | — | (0.32 | ) | 10.80 | 4,566 | 5.27 | 0.74 | 0.74 | 2.99 | 50 | |||||||||||||||||||||||||||||||||||||||||||
Year Ended March 31, 2012 | 9.75 | 0.35 | 0.82 | 1.17 | (0.35 | ) | — | — | (0.35 | ) | 10.57 | 4,280 | 12.14 | 0.77 | 0.77 | 3.39 | 57 | |||||||||||||||||||||||||||||||||||||||||||
Seix High Grade Municipal Bond Fund |
| |||||||||||||||||||||||||||||||||||||||||||||||||||||||||||
I Shares | ||||||||||||||||||||||||||||||||||||||||||||||||||||||||||||
Year Ended March 31, 2016 | 12.29 | 0.27 | 0.19 | 0.46 | (0.27 | ) | — | (0.12 | ) | (0.39 | ) | 12.36 | 99,803 | 3.85 | 0.65 | 0.69 | 2.21 | 171 | ||||||||||||||||||||||||||||||||||||||||||
Year Ended March 31, 2015 | 11.86 | 0.31 | 0.59 | 0.90 | (0.31 | ) | — | (0.16 | ) | (0.47 | ) | 12.29 | 95,761 | 7.64 | 0.65 | 0.69 | 2.53 | 228 | ||||||||||||||||||||||||||||||||||||||||||
Year Ended March 31, 2014 | 12.10 | 0.34 | (0.19 | ) | 0.15 | (0.34 | ) | — | (0.05 | ) | (0.39 | ) | 11.86 | 47,737 | 1.40 | 0.65 | 0.68 | 2.90 | 227 | |||||||||||||||||||||||||||||||||||||||||
Year Ended March 31, 2013 | 11.96 | 0.34 | 0.50 | 0.84 | (0.34 | ) | — | (0.36 | ) | (0.70 | ) | 12.10 | 54,892 | 7.12 | 0.65 | 0.68 | 2.78 | 168 | ||||||||||||||||||||||||||||||||||||||||||
Year Ended March 31, 2012 | 10.92 | 0.38 | 1.07 | 1.45 | (0.38 | ) | — | (0.03 | ) | (0.41 | ) | 11.96 | 42,963 | 13.43 | 0.64 | 0.66 | 3.29 | 218 | ||||||||||||||||||||||||||||||||||||||||||
A Shares | ||||||||||||||||||||||||||||||||||||||||||||||||||||||||||||
Year Ended March 31, 2016 | 12.29 | 0.25 | 0.19 | 0.44 | (0.25 | ) | — | (0.12 | ) | (0.37 | ) | 12.36 | 13,996 | 3.70 | 0.79 | 0.79 | 2.07 | 171 | ||||||||||||||||||||||||||||||||||||||||||
Year Ended March 31, 2015 | 11.86 | 0.29 | 0.59 | 0.88 | (0.29 | ) | — | (0.16 | ) | (0.45 | ) | 12.29 | 16,499 | 7.48 | 0.80 | 0.80 | 2.38 | 228 | ||||||||||||||||||||||||||||||||||||||||||
Year Ended March 31, 2014 | 12.11 | 0.32 | (0.20 | ) | 0.12 | (0.32 | ) | — | (0.05 | ) | (0.37 | ) | 11.86 | 8,967 | 1.16 | 0.80 | 0.82 | 2.75 | 227 | |||||||||||||||||||||||||||||||||||||||||
Year Ended March 31, 2013 | 11.97 | 0.32 | 0.50 | 0.82 | (0.32 | ) | — | (0.36 | ) | (0.68 | ) | 12.11 | 11,363 | 6.97 | 0.80 | 0.83 | 2.63 | 168 | ||||||||||||||||||||||||||||||||||||||||||
Year Ended March 31, 2012 | 10.92 | 0.36 | 1.08 | 1.44 | (0.36 | ) | — | (0.03 | ) | (0.39 | ) | 11.97 | 8,155 | 13.36 | 0.79 | 0.81 | 3.15 | 218 | ||||||||||||||||||||||||||||||||||||||||||
See Notes to Financial Highlights and Notes to Financial Statements.
126
Table of Contents
Financial Highlights
RIDGEWORTH FUNDS Selected Data For a Share of Beneficial Interest Outstanding Throughout the Periods Indicated.
| Net Asset Value, Beginning of Period | Net Investment Income (Loss)(a) | Net Realized and Unrealized Gains (Losses) on Investments | Total from Operations | Dividends from Net Investment Income | Distributions from Tax Return of Capital | Distributions from Realized Capital Gains | Total Dividends and Distributions | Net Asset Value, End of Period | Net Assets End of Period (000) | Total Return(b) | Ratio of Net Expenses to Average Net Assets(c) | Ratio of Expenses to Average Net Assets (Excluding Waivers and Reimbursements)(c) | Ratio of Net Investment Income to Average Net Assets(c) | Portfolio Turnover Rate(d) | ||||||||||||||||||||||||||||||||||||||||||||||
Seix High Income Fund |
| |||||||||||||||||||||||||||||||||||||||||||||||||||||||||||
I Shares | ||||||||||||||||||||||||||||||||||||||||||||||||||||||||||||
Year Ended March 31, 2016 | $6.67 | $0.40 | $(0.75 | ) | $(0.35 | ) | $(0.40 | ) | $— | $— | $(0.40 | ) | $5.92 | $546,793 | (5.31 | )% | 0.79 | % | 0.79 | % | 6.34 | % | 77 | % | ||||||||||||||||||||||||||||||||||||
Year Ended March 31, 2015 | 7.26 | 0.40 | (0.38 | ) | 0.02 | (0.40 | ) | — | (0.21 | ) | (0.61 | ) | 6.67 | 753,851 | 0.47 | 0.77 | 0.77 | 5.63 | 86 | |||||||||||||||||||||||||||||||||||||||||
Year Ended March 31, 2014 | 7.32 | 0.43 | 0.11 | 0.54 | (0.44 | ) | — | (0.16 | ) | (0.60 | ) | 7.26 | 783,072 | 7.68 | 0.77 | 0.77 | 6.00 | 110 | ||||||||||||||||||||||||||||||||||||||||||
Year Ended March 31, 2013 | 6.89 | 0.45 | 0.43 | 0.88 | (0.45 | ) | — | — | (0.45 | ) | 7.32 | 784,870 | 13.17 | 0.74 | 0.75 | 6.33 | 118 | |||||||||||||||||||||||||||||||||||||||||||
Year Ended March 31, 2012 | 7.29 | 0.51 | (0.32 | ) | 0.19 | (0.52 | ) | — | (0.07 | ) | (0.59 | ) | 6.89 | 576,626 | 3.04 | 0.71 | 0.71 | 7.37 | 148 | |||||||||||||||||||||||||||||||||||||||||
A Shares | ||||||||||||||||||||||||||||||||||||||||||||||||||||||||||||
Year Ended March 31, 2016 | 6.68 | 0.38 | (0.75 | ) | (0.37 | ) | (0.39 | ) | — | — | (0.39 | ) | 5.92 | 43,433 | (5.68 | ) | 1.03 | 1.03 | 6.08 | 77 | ||||||||||||||||||||||||||||||||||||||||
Year Ended March 31, 2015 | 7.27 | 0.38 | (0.38 | ) | — | (0.38 | ) | — | (0.21 | ) | (0.59 | ) | 6.68 | 65,121 | 0.26 | 0.99 | 0.99 | 5.34 | 86 | |||||||||||||||||||||||||||||||||||||||||
Year Ended March 31, 2014 | 7.32 | 0.42 | 0.11 | 0.53 | (0.42 | ) | — | (0.16 | ) | (0.58 | ) | 7.27 | 157,360 | 7.60 | (g) | 0.97 | 0.97 | 5.82 | 110 | |||||||||||||||||||||||||||||||||||||||||
Year Ended March 31, 2013 | 6.90 | 0.43 | 0.42 | 0.85 | (0.43 | ) | — | — | (0.43 | ) | 7.32 | 119,006 | 12.72 | 0.99 | 0.99 | 6.09 | 118 | |||||||||||||||||||||||||||||||||||||||||||
Year Ended March 31, 2012 | 7.29 | 0.49 | (0.31 | ) | 0.18 | (0.50 | ) | — | (0.07 | ) | (0.57 | ) | 6.90 | 99,210 | 2.74 | 1.00 | 1.00 | 7.09 | 148 | |||||||||||||||||||||||||||||||||||||||||
R Shares | ||||||||||||||||||||||||||||||||||||||||||||||||||||||||||||
Year Ended March 31, 2016 | 6.68 | 0.37 | (0.76 | ) | (0.39 | ) | (0.37 | ) | — | — | (0.37 | ) | 5.92 | 14,574 | (5.87 | ) | 1.23 | 1.23 | 5.92 | 77 | ||||||||||||||||||||||||||||||||||||||||
Year Ended March 31, 2015 | 7.27 | 0.37 | (0.38 | ) | (0.01 | ) | (0.37 | ) | — | (0.21 | ) | (0.58 | ) | 6.68 | 20,887 | 0.05 | 1.21 | 1.21 | 5.20 | 86 | ||||||||||||||||||||||||||||||||||||||||
Year Ended March 31, 2014 | 7.32 | 0.40 | 0.12 | 0.52 | (0.41 | ) | — | (0.16 | ) | (0.57 | ) | 7.27 | 22,317 | 7.37 | 1.20 | 1.20 | 5.57 | 110 | ||||||||||||||||||||||||||||||||||||||||||
Year Ended March 31, 2013 | 6.89 | 0.41 | 0.43 | 0.84 | (0.41 | ) | — | — | (0.41 | ) | 7.32 | 23,956 | 12.61 | 1.23 | 1.23 | 5.85 | 118 | |||||||||||||||||||||||||||||||||||||||||||
Year Ended March 31, 2012 | 7.29 | 0.47 | (0.33 | ) | 0.14 | (0.47 | ) | — | (0.07 | ) | (0.54 | ) | 6.89 | 20,317 | 2.25 | 1.35 | 1.35 | 6.76 | 148 | |||||||||||||||||||||||||||||||||||||||||
IS Shares | ||||||||||||||||||||||||||||||||||||||||||||||||||||||||||||
Year Ended March 31, 2016 | 6.68 | 0.40 | (0.75 | ) | (0.35 | ) | (0.41 | ) | — | — | (0.41 | ) | 5.92 | 1,117 | (5.30 | ) | 0.63 | 0.63 | 6.27 | 77 | ||||||||||||||||||||||||||||||||||||||||
Period Ended March 31, 2015(h) | 7.22 | 0.28 | (0.33 | ) | (0.05 | ) | (0.28 | ) | — | (0.21 | ) | (0.49 | ) | 6.68 | 3,455 | (0.51 | ) | 0.63 | 0.63 | 5.99 | 86 | |||||||||||||||||||||||||||||||||||||||
Seix High Yield Fund |
| |||||||||||||||||||||||||||||||||||||||||||||||||||||||||||
I Shares | ||||||||||||||||||||||||||||||||||||||||||||||||||||||||||||
Year Ended March 31, 2016 | 8.73 | 0.47 | (0.92 | ) | (0.45 | ) | (0.48 | ) | — | — | (0.48 | ) | 7.80 | 523,206 | (5.23 | ) | 0.61 | 0.61 | 5.71 | 76 | ||||||||||||||||||||||||||||||||||||||||
Year Ended March 31, 2015 | 9.95 | 0.54 | (0.43 | ) | 0.11 | (0.54 | ) | — | (0.79 | ) | (1.33 | ) | 8.73 | 695,060 | 1.53 | 0.58 | 0.58 | 5.63 | 72 | |||||||||||||||||||||||||||||||||||||||||
Year Ended March 31, 2014 | 10.26 | 0.58 | 0.06 | 0.64 | (0.59 | ) | — | (0.36 | ) | (0.95 | ) | 9.95 | 1,211,146 | 6.65 | 0.55 | 0.55 | 5.79 | 89 | ||||||||||||||||||||||||||||||||||||||||||
Year Ended March 31, 2013 | 9.69 | 0.64 | 0.56 | 1.20 | (0.63 | ) | — | — | (0.63 | ) | 10.26 | 1,792,768 | 12.80 | 0.54 | 0.54 | 6.41 | 79 | |||||||||||||||||||||||||||||||||||||||||||
Year Ended March 31, 2012 | 10.07 | 0.70 | (0.38 | ) | 0.32 | (0.70 | ) | — | — | (0.70 | ) | 9.69 | 2,123,625 | 3.44 | 0.54 | 0.54 | 7.27 | 83 | ||||||||||||||||||||||||||||||||||||||||||
A Shares | ||||||||||||||||||||||||||||||||||||||||||||||||||||||||||||
Year Ended March 31, 2016 | 8.51 | 0.44 | (0.89) | (0.45) | (0.45 | ) | — | — | (0.45 | ) | 7.61 | 7,463 | (5.36 | ) | 0.84 | 0.84 | 5.48 | 76 | ||||||||||||||||||||||||||||||||||||||||||
Year Ended March 31, 2015 | 9.72 | 0.51 | (0.43) | 0.08 | (0.50 | ) | — | (0.79 | ) | (1.29 | ) | 8.51 | 8,110 | 1.24 | 0.87 | 0.87 | 5.31 | 72 | ||||||||||||||||||||||||||||||||||||||||||
Year Ended March 31, 2014 | 10.03 | 0.55 | 0.05 | 0.60 | (0.55 | ) | — | (0.36 | ) | (0.91 | ) | 9.72 | 69,921 | 6.39 | 0.81 | 0.81 | 5.57 | 89 | ||||||||||||||||||||||||||||||||||||||||||
Year Ended March 31, 2013 | 9.47 | 0.59 | 0.56 | 1.15 | (0.59 | ) | — | — | (0.59 | ) | 10.03 | 72,703 | 12.56 | 0.79 | 0.79 | 6.09 | 79 | |||||||||||||||||||||||||||||||||||||||||||
Year Ended March 31, 2012 | 9.84 | 0.65 | (0.36) | 0.29 | (0.66 | ) | — | — | (0.66 | ) | 9.47 | 38,016 | 3.21 | 0.78 | 0.78 | 6.91 | 83 | |||||||||||||||||||||||||||||||||||||||||||
R Shares | ||||||||||||||||||||||||||||||||||||||||||||||||||||||||||||
Year Ended March 31, 2016 | 8.72 | 0.44 | (0.91) | (0.47) | (0.45 | ) | — | — | (0.45 | ) | 7.80 | 573 | (5.52 | ) | 1.04 | 1.04 | 5.29 | 76 | ||||||||||||||||||||||||||||||||||||||||||
Year Ended March 31, 2015 | 9.94 | 0.49 | (0.42) | 0.07 | (0.50 | ) | — | (0.79 | ) | (1.29 | ) | 8.72 | 782 | 1.05 | 1.04 | 1.04 | 5.18 | 72 | ||||||||||||||||||||||||||||||||||||||||||
Year Ended March 31, 2014 | 10.26 | 0.53 | 0.05 | 0.58 | (0.54 | ) | — | (0.36 | ) | (0.90 | ) | 9.94 | 1,237 | 6.04 | 1.04 | 1.04 | 5.31 | 89 | ||||||||||||||||||||||||||||||||||||||||||
Year Ended March 31, 2013 | 9.68 | 0.59 | 0.57 | 1.16 | (0.58 | ) | — | — | (0.58 | ) | 10.26 | 2,385 | 12.36 | 1.03 | 1.03 | 5.92 | 79 | |||||||||||||||||||||||||||||||||||||||||||
Year Ended March 31, 2012 | 10.07 | 0.65 | (0.40) | 0.25 | (0.64 | ) | — | — | (0.64 | ) | 9.68 | 2,427 | 2.69 | 1.18 | 1.18 | 6.68 | 83 | |||||||||||||||||||||||||||||||||||||||||||
See Notes to Financial Highlights and Notes to Financial Statements.
127
Table of Contents
Financial Highlights
RIDGEWORTH FUNDS Selected Data For a Share of Beneficial Interest Outstanding Throughout the Periods Indicated.
| Net Asset Value, Beginning of Period | Net Investment Income (Loss)(a) | Net Realized and Unrealized Gains (Losses) on Investments | Total from Operations | Dividends from Net Investment Income | Distributions from Tax Return of Capital | Distributions from Realized Capital Gains | Total Dividends and Distributions | Net Asset Value, End of Period | Net Assets End of Period (000) | Total Return(b) | Ratio of Net Expenses to Average Net Assets(c) | Ratio of Expenses to Average Net Assets (Excluding Waivers and Reimbursements)(c) | Ratio of Net Investment Income to Average Net Assets(c) | Portfolio Turnover Rate(d) | ||||||||||||||||||||||||||||||||||||||||||||||
Seix Investment Grade Tax-Exempt Bond Fund |
| |||||||||||||||||||||||||||||||||||||||||||||||||||||||||||
I Shares | ||||||||||||||||||||||||||||||||||||||||||||||||||||||||||||
Year Ended March 31, 2016 | $12.29 | $0.28 | $0.07 | $0.35 | $(0.28 | ) | $— | $(0.14 | ) | $(0.42 | ) | $12.22 | $629,435 | 2.96 | % | 0.65 | % | 0.68 | % | 2.32 | % | 139 | % | |||||||||||||||||||||||||||||||||||||
Year Ended March 31, 2015 | 12.13 | 0.31 | 0.32 | 0.63 | (0.31 | ) | — | (0.16 | ) | (0.47 | ) | 12.29 | 657,851 | 5.25 | 0.65 | 0.68 | 2.53 | 144 | ||||||||||||||||||||||||||||||||||||||||||
Year Ended March 31, 2014 | 12.45 | 0.28 | (0.23 | ) | 0.05 | (0.28 | ) | — | (0.09 | ) | (0.37 | ) | 12.13 | 643,828 | 0.48 | 0.64 | 0.64 | 2.29 | 104 | |||||||||||||||||||||||||||||||||||||||||
Year Ended March 31, 2013 | 12.49 | 0.25 | 0.35 | 0.60 | (0.25 | ) | — | (0.39 | ) | (0.64 | ) | 12.45 | 982,171 | 4.87 | 0.62 | 0.63 | 1.98 | 151 | ||||||||||||||||||||||||||||||||||||||||||
Year Ended March 31, 2012 | 11.65 | 0.29 | 0.93 | 1.22 | (0.29 | ) | — | (0.09 | ) | (0.38 | ) | 12.49 | 950,629 | 10.62 | 0.61 | 0.61 | 2.38 | 199 | ||||||||||||||||||||||||||||||||||||||||||
A Shares | ||||||||||||||||||||||||||||||||||||||||||||||||||||||||||||
Year Ended March 31, 2016 | 12.30 | 0.26 | 0.08 | 0.34 | (0.26 | ) | — | (0.14 | ) | (0.40 | ) | 12.24 | 24,861 | 2.89 | 0.80 | 0.93 | 2.17 | 139 | ||||||||||||||||||||||||||||||||||||||||||
Year Ended March 31, 2015 | 12.14 | 0.29 | 0.32 | 0.61 | (0.29 | ) | — | (0.16 | ) | (0.45 | ) | 12.30 | 29,439 | 5.09 | 0.80 | 0.91 | 2.37 | 144 | ||||||||||||||||||||||||||||||||||||||||||
Year Ended March 31, 2014 | 12.47 | 0.26 | (0.24 | ) | 0.02 | (0.26 | ) | — | (0.09 | ) | (0.35 | ) | 12.14 | 30,100 | 0.23 | 0.80 | 0.90 | 2.13 | 104 | |||||||||||||||||||||||||||||||||||||||||
Year Ended March 31, 2013 | 12.50 | 0.23 | 0.36 | 0.59 | (0.23 | ) | — | (0.39 | ) | (0.62 | ) | 12.47 | 36,958 | 4.75 | 0.82 | 0.87 | 1.78 | 151 | ||||||||||||||||||||||||||||||||||||||||||
Year Ended March 31, 2012 | 11.66 | 0.26 | 0.93 | 1.19 | (0.26 | ) | — | (0.09 | ) | (0.35 | ) | 12.50 | 37,840 | 10.33 | 0.87 | 0.87 | 2.12 | 199 | ||||||||||||||||||||||||||||||||||||||||||
Seix Limited Duration Fund |
| |||||||||||||||||||||||||||||||||||||||||||||||||||||||||||
I Shares | ||||||||||||||||||||||||||||||||||||||||||||||||||||||||||||
Year Ended March 31, 2016 | 9.83 | 0.03 | — | (i) | 0.03 | (0.03 | ) | — | — | (0.03 | ) | 9.83 | 6,649 | 0.26 | 0.35 | 0.47 | 0.29 | 50 | ||||||||||||||||||||||||||||||||||||||||||
Year Ended March 31, 2015 | 9.83 | 0.02 | — | (i) | 0.02 | (0.02 | ) | — | — | (0.02 | ) | 9.83 | 6,650 | 0.18 | 0.34 | 0.46 | 0.21 | 45 | ||||||||||||||||||||||||||||||||||||||||||
Year Ended March 31, 2014 | 9.83 | 0.03 | (0.01 | ) | 0.02 | (0.02 | ) | — | — | (0.02 | ) | 9.83 | 6,650 | 0.21 | 0.32 | 0.43 | 0.27 | 104 | ||||||||||||||||||||||||||||||||||||||||||
Year Ended March 31, 2013 | 9.76 | 0.05 | 0.06 | 0.11 | (0.04 | ) | — | — | (0.04 | ) | 9.83 | 9,357 | 1.08 | 0.30 | 0.33 | 0.50 | 56 | |||||||||||||||||||||||||||||||||||||||||||
Year Ended March 31, 2012 | 9.76 | 0.07 | (0.01 | ) | 0.06 | (0.06 | ) | — | — | (0.06 | ) | 9.76 | 16,002 | 0.58 | 0.28 | 0.28 | 0.68 | 58 | ||||||||||||||||||||||||||||||||||||||||||
Seix North Carolina Tax-Exempt Bond Fund |
| |||||||||||||||||||||||||||||||||||||||||||||||||||||||||||
I Shares | ||||||||||||||||||||||||||||||||||||||||||||||||||||||||||||
Year Ended March 31, 2016 | 10.49 | 0.24 | 0.11 | 0.35 | (0.24 | ) | — | (0.07 | ) | (0.31 | ) | 10.53 | 28,576 | 3.39 | 0.65 | 0.73 | 2.31 | 42 | ||||||||||||||||||||||||||||||||||||||||||
Year Ended March 31, 2015 | 10.06 | 0.25 | 0.43 | 0.68 | (0.25 | ) | — | — | (0.25 | ) | 10.49 | 37,190 | 6.80 | 0.65 | 0.69 | 2.40 | 51 | |||||||||||||||||||||||||||||||||||||||||||
Year Ended March 31, 2014 | 10.68 | 0.26 | (0.31 | ) | (0.05 | ) | (0.27 | ) | — | (0.30 | ) | (0.57 | ) | 10.06 | 37,311 | (0.38 | ) | 0.61 | 0.61 | 2.59 | 77 | |||||||||||||||||||||||||||||||||||||||
Year Ended March 31, 2013 | 10.47 | 0.30 | 0.21 | 0.51 | (0.30 | ) | — | — | (0.30 | ) | 10.68 | 50,991 | 4.88 | 0.62 | 0.62 | 2.79 | 79 | |||||||||||||||||||||||||||||||||||||||||||
Year Ended March 31, 2012 | 9.70 | 0.33 | 0.77 | 1.10 | (0.33 | ) | — | — | (0.33 | ) | 10.47 | 50,412 | 11.51 | 0.67 | 0.67 | 3.27 | 39 | |||||||||||||||||||||||||||||||||||||||||||
A Shares | ||||||||||||||||||||||||||||||||||||||||||||||||||||||||||||
Year Ended March 31, 2016 | 10.46 | 0.22 | 0.12 | 0.34 | (0.23 | ) | — | (0.07 | ) | (0.30 | ) | 10.50 | 492 | 3.23 | 0.80 | 0.81 | 2.15 | 42 | ||||||||||||||||||||||||||||||||||||||||||
Year Ended March 31, 2015 | 10.04 | 0.23 | 0.42 | 0.65 | (0.23 | ) | — | — | (0.23 | ) | 10.46 | 795 | 6.56 | 0.79 | 0.79 | 2.27 | 51 | |||||||||||||||||||||||||||||||||||||||||||
Year Ended March 31, 2014 | 10.65 | 0.25 | (0.31 | ) | (0.06 | ) | (0.25 | ) | — | (0.30 | ) | (0.55 | ) | 10.04 | 861 | (0.45 | ) | 0.77 | 0.77 | 2.44 | 77 | |||||||||||||||||||||||||||||||||||||||
Year Ended March 31, 2013 | 10.45 | 0.28 | 0.20 | 0.48 | (0.28 | ) | — | — | (0.28 | ) | 10.65 | 910 | 4.63 | 0.77 | 0.77 | 2.60 | 79 | |||||||||||||||||||||||||||||||||||||||||||
Year Ended March 31, 2012 | 9.67 | 0.32 | 0.78 | 1.10 | (0.32 | ) | — | — | (0.32 | ) | 10.45 | 633 | 11.47 | 0.82 | 0.82 | 3.11 | 39 | |||||||||||||||||||||||||||||||||||||||||||
Seix Short-Term Bond Fund |
| |||||||||||||||||||||||||||||||||||||||||||||||||||||||||||
I Shares | ||||||||||||||||||||||||||||||||||||||||||||||||||||||||||||
Year Ended March 31, 2016 | 9.98 | 0.06 | 0.01 | 0.07 | (0.07 | ) | — | — | (0.07 | ) | 9.98 | 49,749 | 0.68 | 0.60 | 0.68 | 0.58 | 87 | |||||||||||||||||||||||||||||||||||||||||||
Year Ended March 31, 2015 | 9.95 | 0.05 | 0.04 | 0.09 | (0.06 | ) | — | — | (0.06 | ) | 9.98 | 50,689 | 0.93 | 0.60 | 0.67 | 0.52 | 199 | |||||||||||||||||||||||||||||||||||||||||||
Year Ended March 31, 2014 | 10.00 | 0.12 | (0.05 | ) | 0.07 | (0.12 | ) | — | — | (0.12 | ) | 9.95 | 38,400 | 0.75 | 0.58 | 0.58 | 1.22 | 79 | ||||||||||||||||||||||||||||||||||||||||||
Year Ended March 31, 2013 | 9.99 | 0.15 | 0.01 | 0.16 | (0.15 | ) | — | — | (0.15 | ) | 10.00 | 78,383 | 1.65 | 0.48 | 0.48 | 1.51 | 128 | |||||||||||||||||||||||||||||||||||||||||||
Year Ended March 31, 2012 | 9.95 | 0.20 | 0.06 | 0.26 | (0.22 | ) | — | — | (0.22 | ) | 9.99 | 310,854 | 2.60 | 0.48 | 0.48 | 2.00 | 86 | |||||||||||||||||||||||||||||||||||||||||||
A Shares | ||||||||||||||||||||||||||||||||||||||||||||||||||||||||||||
Year Ended March 31, 2016 | 10.00 | 0.04 | 0.02 | 0.06 | (0.05 | ) | — | — | (0.05 | ) | 10.01 | 2,104 | 0.58 | 0.80 | 0.81 | 0.38 | 87 | |||||||||||||||||||||||||||||||||||||||||||
Year Ended March 31, 2015 | 9.98 | 0.04 | 0.02 | 0.06 | (0.04 | ) | — | — | (0.04 | ) | 10.00 | 2,316 | 0.63 | 0.80 | 0.81 | 0.37 | 199 | |||||||||||||||||||||||||||||||||||||||||||
Year Ended March 31, 2014 | 10.03 | 0.10 | (0.05 | ) | 0.05 | (0.10 | ) | — | — | (0.10 | ) | 9.98 | 2,748 | 0.54 | 0.78 | 0.80 | 1.00 | 79 | ||||||||||||||||||||||||||||||||||||||||||
Year Ended March 31, 2013 | 10.02 | 0.13 | 0.01 | 0.14 | (0.13 | ) | — | — | (0.13 | ) | 10.03 | 2,069 | 1.40 | 0.73 | 0.74 | 1.27 | 128 | |||||||||||||||||||||||||||||||||||||||||||
Year Ended March 31, 2012 | 9.98 | 0.17 | 0.06 | 0.23 | (0.19 | ) | — | — | (0.19 | ) | 10.02 | 2,478 | 2.32 | 0.76 | 0.76 | 1.75 | 86 | |||||||||||||||||||||||||||||||||||||||||||
See Notes to Financial Highlights and Notes to Financial Statements.
128
Table of Contents
Financial Highlights
RIDGEWORTH FUNDS Selected Data For a Share of Beneficial Interest Outstanding Throughout the Periods Indicated.
| Net Asset Value, Beginning of Period | Net Investment Income (Loss)(a) | Net Realized and Unrealized Gains (Losses) on Investments | Total from Operations | Dividends from Net Investment Income | Distributions from Tax Return of Capital | Distributions from Realized Capital Gains | Total Dividends and Distributions | Net Asset Value, End of Period | Net Assets End of Period (000) | Total Return(b) | Ratio of Net Expenses to Average Net Assets(c) | Ratio of Expenses to Average Net Assets (Excluding Waivers and Reimbursements)(c) | Ratio of Net Investment Income to Average Net Assets(c) | Portfolio Turnover Rate(d) | ||||||||||||||||||||||||||||||||||||||||||||||
C Shares | ||||||||||||||||||||||||||||||||||||||||||||||||||||||||||||
Year Ended March 31, 2016 | $10.00 | $(0.01 | ) | $0.01 | $— | $— | (i) | $— | $— | $— | (i) | $10.00 | $1,742 | — | % | 1.29 | % | 1.58 | % | (0.10 | )% | 87 | % | |||||||||||||||||||||||||||||||||||||
Year Ended March 31, 2015 | 9.97 | (0.01 | ) | 0.04 | 0.03 | — | (i) | — | — | — | (i) | 10.00 | 1,730 | 0.31 | 1.22 | 1.58 | (0.06 | ) | 199 | |||||||||||||||||||||||||||||||||||||||||
Year Ended March 31, 2014 | 10.02 | 0.02 | (0.04 | ) | (0.02 | ) | (0.03 | ) | — | — | (0.03 | ) | 9.97 | 1,899 | (0.24 | ) | 1.56 | 1.56 | 0.23 | 79 | ||||||||||||||||||||||||||||||||||||||||
Year Ended March 31, 2013 | 10.01 | 0.05 | 0.01 | 0.06 | (0.05 | ) | — | — | (0.05 | ) | 10.02 | 2,425 | 0.65 | 1.48 | 1.48 | 0.52 | 128 | |||||||||||||||||||||||||||||||||||||||||||
Year Ended March 31, 2012 | 9.98 | 0.10 | 0.05 | 0.15 | (0.12 | ) | — | — | (0.12 | ) | 10.01 | 3,009 | 1.48 | 1.48 | 1.48 | 1.01 | 86 | |||||||||||||||||||||||||||||||||||||||||||
Seix Short-Term Municipal Bond Fund |
| |||||||||||||||||||||||||||||||||||||||||||||||||||||||||||
I Shares | ||||||||||||||||||||||||||||||||||||||||||||||||||||||||||||
Year Ended March 31, 2016 | 10.00 | 0.04 | — | (i) | 0.04 | (0.04 | ) | — | (0.02 | ) | (0.06 | ) | 9.98 | 32,184 | 0.41 | 0.51 | 0.62 | 0.41 | 82 | |||||||||||||||||||||||||||||||||||||||||
Year Ended March 31, 2015 | 9.99 | 0.04 | 0.08 | 0.12 | (0.04 | ) | — | (0.07 | ) | (0.11 | ) | 10.00 | 38,669 | 1.21 | 0.55 | 0.62 | 0.42 | 148 | ||||||||||||||||||||||||||||||||||||||||||
Year Ended March 31, 2014 | 10.01 | 0.02 | 0.01 | 0.03 | (0.02 | ) | — | (0.03 | ) | (0.05 | ) | 9.99 | 30,852 | 0.37 | 0.54 | 0.71 | 0.21 | 260 | ||||||||||||||||||||||||||||||||||||||||||
Year Ended March 31, 2013 | 10.73 | 0.05 | 0.27 | 0.32 | (0.06 | ) | — | (0.98 | ) | (1.04 | ) | 10.01 | 11,121 | 3.01 | 0.58 | 0.91 | 0.52 | 199 | ||||||||||||||||||||||||||||||||||||||||||
Year Ended March 31, 2012 | 10.16 | 0.32 | 0.70 | 1.02 | (0.31 | ) | — | (0.14 | ) | (0.45 | ) | 10.73 | 5,956 | 10.16 | 0.67 | 0.77 | 3.00 | 27 | ||||||||||||||||||||||||||||||||||||||||||
A Shares | ||||||||||||||||||||||||||||||||||||||||||||||||||||||||||||
Year Ended March 31, 2016 | 10.00 | 0.02 | — | (i) | 0.02 | (0.02 | ) | — | (0.02 | ) | (0.04 | ) | 9.98 | 7,354 | 0.23 | 0.67 | 0.72 | 0.24 | 82 | |||||||||||||||||||||||||||||||||||||||||
Year Ended March 31, 2015 | 9.99 | 0.03 | 0.08 | 0.11 | (0.03 | ) | — | (0.07 | ) | (0.10 | ) | 10.00 | 3,863 | 1.06 | 0.70 | 0.75 | 0.26 | 148 | ||||||||||||||||||||||||||||||||||||||||||
Year Ended March 31, 2014 | 10.01 | 0.01 | 0.01 | 0.02 | (0.01 | ) | — | (0.03 | ) | (0.04 | ) | 9.99 | 5,900 | 0.25 | 0.65 | 0.82 | 0.10 | 260 | ||||||||||||||||||||||||||||||||||||||||||
Year Ended March 31, 2013 | 10.73 | 0.04 | 0.26 | 0.30 | (0.04 | ) | — | (0.98 | ) | (1.02 | ) | 10.01 | 3,694 | 2.86 | 0.73 | 1.04 | 0.39 | 199 | ||||||||||||||||||||||||||||||||||||||||||
Year Ended March 31, 2012 | 10.16 | 0.29 | 0.71 | 1.00 | (0.29 | ) | — | (0.14 | ) | (0.43 | ) | 10.73 | 3,445 | 10.00 | 0.82 | 0.97 | 2.77 | 27 | ||||||||||||||||||||||||||||||||||||||||||
Seix Total Return Bond Fund |
| |||||||||||||||||||||||||||||||||||||||||||||||||||||||||||
I Shares | ||||||||||||||||||||||||||||||||||||||||||||||||||||||||||||
Year Ended March 31, 2016 | 10.75 | 0.19 | (0.05 | ) | 0.14 | (0.21 | ) | — | (0.01 | ) | (0.22 | ) | 10.67 | 971,159 | 1.35 | (g) | 0.45 | 0.45 | 1.82 | 181 | ||||||||||||||||||||||||||||||||||||||||
Year Ended March 31, 2015 | 10.43 | 0.23 | 0.34 | 0.57 | (0.25 | ) | — | — | (0.25 | ) | 10.75 | 972,117 | 5.47 | 0.44 | 0.44 | 2.17 | 173 | |||||||||||||||||||||||||||||||||||||||||||
Year Ended March 31, 2014 | 10.79 | 0.22 | (0.26 | ) | (0.04 | ) | (0.22 | ) | — | (0.10 | ) | (0.32 | ) | 10.43 | 1,022,101 | (0.31 | ) | 0.41 | 0.41 | 2.12 | 217 | |||||||||||||||||||||||||||||||||||||||
Year Ended March 31, 2013 | 10.77 | 0.18 | 0.25 | 0.43 | (0.21 | ) | — | (0.20 | ) | (0.41 | ) | 10.79 | 1,204,228 | 4.01 | 0.39 | 0.40 | 1.69 | 139 | ||||||||||||||||||||||||||||||||||||||||||
Year Ended March 31, 2012 | 10.40 | 0.25 | 0.73 | 0.98 | (0.36 | ) | — | (0.25 | ) | (0.61 | ) | 10.77 | 996,213 | 9.62 | 0.37 | 0.37 | 2.30 | 170 | ||||||||||||||||||||||||||||||||||||||||||
A Shares | ||||||||||||||||||||||||||||||||||||||||||||||||||||||||||||
Year Ended March 31, 2016 | 11.11 | 0.17 | (0.06 | ) | 0.11 | (0.19 | ) | — | (0.01 | ) | (0.20 | ) | 11.02 | 32,366 | 1.02 | 0.71 | 0.71 | 1.55 | 181 | |||||||||||||||||||||||||||||||||||||||||
Year Ended March 31, 2015 | 10.77 | 0.21 | 0.35 | 0.56 | (0.22 | ) | — | — | (0.22 | ) | 11.11 | 43,401 | 5.28 | 0.71 | 0.71 | 1.90 | 173 | |||||||||||||||||||||||||||||||||||||||||||
Year Ended March 31, 2014 | 11.15 | 0.20 | (0.28 | ) | (0.08 | ) | (0.20 | ) | — | (0.10 | ) | (0.30 | ) | 10.77 | 41,134 | (0.70 | ) | 0.70 | 0.70 | 1.82 | 217 | |||||||||||||||||||||||||||||||||||||||
Year Ended March 31, 2013 | 11.12 | 0.16 | 0.25 | 0.41 | (0.18 | ) | — | (0.20 | ) | (0.38 | ) | 11.15 | 50,279 | 3.76 | 0.66 | 0.68 | 1.42 | 139 | ||||||||||||||||||||||||||||||||||||||||||
Year Ended March 31, 2012 | 10.73 | 0.22 | 0.76 | 0.98 | (0.34 | ) | — | (0.25 | ) | (0.59 | ) | 11.12 | 44,359 | 9.31 | 0.65 | 0.65 | 1.95 | 170 | ||||||||||||||||||||||||||||||||||||||||||
R Shares | ||||||||||||||||||||||||||||||||||||||||||||||||||||||||||||
Year Ended March 31, 2016 | 10.75 | 0.13 | (0.05 | ) | 0.08 | (0.15 | ) | — | (0.01 | ) | (0.16 | ) | 10.67 | 50,402 | 0.74 | 1.06 | 1.06 | 1.21 | 181 | |||||||||||||||||||||||||||||||||||||||||
Year Ended March 31, 2015 | 10.43 | 0.17 | 0.33 | 0.50 | (0.18 | ) | — | — | (0.18 | ) | 10.75 | 64,539 | 4.83 | 1.05 | 1.06 | 1.56 | 173 | |||||||||||||||||||||||||||||||||||||||||||
Year Ended March 31, 2014 | 10.80 | 0.16 | (0.27 | ) | (0.11 | ) | (0.16 | ) | — | (0.10 | ) | (0.26 | ) | 10.43 | 72,556 | (1.02 | ) | 1.03 | 1.07 | 1.52 | 217 | |||||||||||||||||||||||||||||||||||||||
Year Ended March 31, 2013 | 10.78 | 0.12 | 0.25 | 0.37 | (0.15 | ) | — | (0.20 | ) | (0.35 | ) | 10.80 | 72,697 | 3.34 | 0.96 | 1.05 | 1.11 | 139 | ||||||||||||||||||||||||||||||||||||||||||
Year Ended March 31, 2012 | 10.40 | 0.18 | 0.76 | 0.94 | (0.31 | ) | — | (0.25 | ) | (0.56 | ) | 10.78 | 20,315 | 9.15 | 0.90 | 0.90 | 1.63 | 170 | ||||||||||||||||||||||||||||||||||||||||||
IS Shares | ||||||||||||||||||||||||||||||||||||||||||||||||||||||||||||
Year Ended March 31, 2016 | 10.75 | 0.21 | (0.06 | ) | 0.15 | (0.22 | ) | — | (0.01 | ) | (0.23 | ) | 10.67 | 56,133 | 1.49 | 0.31 | 0.31 | 1.95 | 181 | |||||||||||||||||||||||||||||||||||||||||
Period Ended March 31, 2015(h) | 10.56 | 0.16 | 0.20 | 0.36 | (0.17 | ) | — | — | (0.17 | ) | 10.75 | 71,520 | 3.39 | 0.31 | 0.31 | 2.20 | 173 | |||||||||||||||||||||||||||||||||||||||||||
See Notes to Financial Highlights and Notes to Financial Statements.
129
Table of Contents
Financial Highlights
RIDGEWORTH FUNDS Selected Data For a Share of Beneficial Interest Outstanding Throughout the Periods Indicated.
| Net Asset Value, Beginning of Period | Net Investment Income (Loss)(a) | Net Realized and Unrealized Gains (Losses) on Investments | Total from Operations | Dividends from Net Investment Income | Distributions from Tax Return of Capital | Distributions from Realized Capital Gains | Total Dividends and Distributions | Net Asset Value, End of Period | Net Assets End of Period (000) | Total Return(b) | Ratio of Net Expenses to Average Net Assets(c) | Ratio of Expenses to Average Net Assets (Excluding Waivers and Reimbursements)(c) | Ratio of Net Investment Income to Average Net Assets(c) | Portfolio Turnover Rate(d) | ||||||||||||||||||||||||||||||||||||||||||||||
Seix U.S. Government Securities Ultra-Short Bond Fund |
| |||||||||||||||||||||||||||||||||||||||||||||||||||||||||||
I Shares | ||||||||||||||||||||||||||||||||||||||||||||||||||||||||||||
Year Ended March 31, 2016 | $10.12 | $0.06 | $(0.07 | ) | $(0.01 | ) | $(0.08 | ) | $— | $— | $(0.08 | ) | $10.03 | $1,557,899 | (0.11 | )% | 0.41 | % | 0.41 | % | 0.57 | % | 52 | % | ||||||||||||||||||||||||||||||||||||
Year Ended March 31, 2015 | 10.12 | 0.06 | 0.02 | 0.08 | (0.08 | ) | — | — | (0.08 | ) | 10.12 | 1,665,888 | 0.77 | 0.39 | 0.39 | 0.55 | 34 | |||||||||||||||||||||||||||||||||||||||||||
Year Ended March 31, 2014 | 10.17 | 0.03 | (0.02 | ) | 0.01 | (0.06 | ) | — | — | (0.06 | ) | 10.12 | 1,993,215 | 0.13 | 0.38 | 0.38 | 0.31 | 36 | ||||||||||||||||||||||||||||||||||||||||||
Year Ended March 31, 2013 | 10.14 | 0.03 | 0.08 | 0.11 | (0.08 | ) | — | — | (0.08 | ) | 10.17 | 2,331,913 | 1.10 | 0.36 | 0.36 | 0.29 | 137 | |||||||||||||||||||||||||||||||||||||||||||
Year Ended March 31, 2012 | 10.07 | 0.06 | 0.12 | 0.18 | (0.11 | ) | — | — | (0.11 | ) | 10.14 | 2,033,765 | 1.76 | 0.36 | 0.36 | 0.55 | 70 | |||||||||||||||||||||||||||||||||||||||||||
Seix U.S. Mortgage Fund |
| |||||||||||||||||||||||||||||||||||||||||||||||||||||||||||
I Shares | ||||||||||||||||||||||||||||||||||||||||||||||||||||||||||||
Year Ended March 31, 2016 | 11.32 | 0.12 | 0.09 | 0.21 | (0.20 | ) | — | — | (0.20 | ) | 11.33 | 25,068 | 1.84 | 0.70 | 0.86 | 1.03 | 223 | |||||||||||||||||||||||||||||||||||||||||||
Year Ended March 31, 2015 | 10.90 | 0.19 | 0.48 | 0.67 | (0.25 | ) | — | — | (0.25 | ) | 11.32 | 3,650 | 6.16 | 0.69 | 1.26 | 1.75 | 165 | |||||||||||||||||||||||||||||||||||||||||||
Year Ended March 31, 2014 | 11.16 | 0.12 | (0.16 | ) | (0.04 | ) | (0.22 | ) | — | — | (0.22 | ) | 10.90 | 3,692 | (0.38 | ) | 0.66 | 1.10 | 1.08 | 236 | ||||||||||||||||||||||||||||||||||||||||
Year Ended March 31, 2013 | 11.09 | 0.04 | 0.21 | 0.25 | (0.18 | ) | — | — | (0.18 | ) | 11.16 | 8,851 | 2.26 | 0.66 | 0.85 | 0.37 | 163 | |||||||||||||||||||||||||||||||||||||||||||
Year Ended March 31, 2012 | 10.59 | 0.12 | 0.62 | 0.74 | (0.24 | ) | — | — | (0.24 | ) | 11.09 | 24,688 | 7.01 | 0.66 | 0.72 | 1.06 | 299 | |||||||||||||||||||||||||||||||||||||||||||
A Shares | ||||||||||||||||||||||||||||||||||||||||||||||||||||||||||||
Year Ended March 31, 2016 | 11.29 | 0.08 | 0.11 | 0.19 | (0.17 | ) | — | — | (0.17 | ) | 11.31 | 6,560 | 1.72 | 0.90 | 1.10 | 0.76 | 223 | |||||||||||||||||||||||||||||||||||||||||||
Year Ended March 31, 2015 | 10.88 | 0.16 | 0.47 | 0.63 | (0.22 | ) | — | — | (0.22 | ) | 11.29 | 5,201 | 5.86 | 0.89 | 1.43 | 1.45 | 165 | |||||||||||||||||||||||||||||||||||||||||||
Year Ended March 31, 2014 | 11.14 | 0.11 | (0.18 | ) | (0.07 | ) | (0.19 | ) | — | — | (0.19 | ) | 10.88 | 1,721 | (0.58 | ) | 0.86 | 1.27 | 1.02 | 236 | ||||||||||||||||||||||||||||||||||||||||
Year Ended March 31, 2013 | 11.07 | 0.02 | 0.21 | 0.23 | (0.16 | ) | — | — | (0.16 | ) | 11.14 | 2,271 | 2.06 | 0.86 | 1.05 | 0.15 | 163 | |||||||||||||||||||||||||||||||||||||||||||
Year Ended March 31, 2012 | 10.57 | 0.09 | 0.62 | 0.71 | (0.21 | ) | — | — | (0.21 | ) | 11.07 | 6,279 | 6.81 | 0.86 | 0.93 | 0.78 | 299 | |||||||||||||||||||||||||||||||||||||||||||
C Shares | ||||||||||||||||||||||||||||||||||||||||||||||||||||||||||||
Year Ended March 31, 2016 | 11.32 | — | (i) | 0.10 | 0.10 | (0.09 | ) | — | — | (0.09 | ) | 11.33 | 5,478 | 0.88 | 1.65 | 1.79 | 0.01 | 223 | ||||||||||||||||||||||||||||||||||||||||||
Year Ended March 31, 2015 | 10.90 | 0.09 | 0.47 | 0.56 | (0.14 | ) | — | — | (0.14 | ) | 11.32 | 3,989 | 5.15 | 1.65 | 2.15 | 0.79 | 165 | |||||||||||||||||||||||||||||||||||||||||||
Year Ended March 31, 2014 | 11.16 | 0.03 | (0.18 | ) | (0.15 | ) | (0.11 | ) | — | — | (0.11 | ) | 10.90 | 4,780 | (1.36 | ) | 1.66 | 2.04 | 0.23 | 236 | ||||||||||||||||||||||||||||||||||||||||
Year Ended March 31, 2013 | 11.09 | (0.07 | ) | 0.21 | 0.14 | (0.07 | ) | — | — | (0.07 | ) | 11.16 | 6,039 | 1.25 | 1.66 | 1.84 | (0.65 | ) | 163 | |||||||||||||||||||||||||||||||||||||||||
Year Ended March 31, 2012 | 10.59 | 0.01 | 0.62 | 0.63 | (0.13 | ) | — | — | (0.13 | ) | 11.09 | 7,376 | 5.94 | 1.66 | 1.71 | 0.06 | 299 | |||||||||||||||||||||||||||||||||||||||||||
Seix Ultra-Short Bond Fund |
| |||||||||||||||||||||||||||||||||||||||||||||||||||||||||||
I Shares | ||||||||||||||||||||||||||||||||||||||||||||||||||||||||||||
Year Ended March 31, 2016 | 9.97 | 0.08 | (0.04 | ) | 0.04 | (0.08 | ) | — | — | (0.08 | ) | 9.93 | 104,950 | 0.42 | 0.38 | 0.38 | 0.77 | 59 | ||||||||||||||||||||||||||||||||||||||||||
Year Ended March 31, 2015 | 9.98 | 0.06 | — | (i) | 0.06 | (0.07 | ) | — | — | (0.07 | ) | 9.97 | 142,680 | 0.55 | 0.37 | 0.37 | 0.57 | 54 | ||||||||||||||||||||||||||||||||||||||||||
Year Ended March 31, 2014 | 9.98 | 0.07 | 0.01 | 0.08 | (0.08 | ) | — | — | (0.08 | ) | 9.98 | 122,053 | 0.76 | 0.35 | 0.35 | 0.65 | 134 | |||||||||||||||||||||||||||||||||||||||||||
Year Ended March 31, 2013 | 9.95 | 0.10 | 0.04 | 0.14 | (0.11 | ) | — | — | (0.11 | ) | 9.98 | 109,224 | 1.39 | 0.33 | 0.33 | 0.98 | 127 | |||||||||||||||||||||||||||||||||||||||||||
Year Ended March 31, 2012 | 9.93 | 0.10 | 0.03 | 0.13 | (0.11 | ) | — | — | (0.11 | ) | 9.95 | 112,617 | 1.34 | 0.34 | 0.34 | 0.99 | 97 | |||||||||||||||||||||||||||||||||||||||||||
Seix Virginia Intermediate Municipal Bond Fund |
| |||||||||||||||||||||||||||||||||||||||||||||||||||||||||||
I Shares | ||||||||||||||||||||||||||||||||||||||||||||||||||||||||||||
Year Ended March 31, 2016 | 10.24 | 0.24 | 0.08 | 0.32 | (0.24 | ) | — | (0.26 | ) | (0.50 | ) | 10.06 | 64,653 | 3.30 | 0.65 | 0.68 | 2.38 | 48 | ||||||||||||||||||||||||||||||||||||||||||
Year Ended March 31, 2015 | 10.12 | 0.25 | 0.21 | 0.46 | (0.25 | ) | — | (0.09 | ) | (0.34 | ) | 10.24 | 119,103 | 4.54 | 0.65 | 0.65 | 2.42 | 59 | ||||||||||||||||||||||||||||||||||||||||||
Year Ended March 31, 2014 | 10.54 | 0.29 | (0.32 | ) | (0.03 | ) | (0.29 | ) | — | (0.10 | ) | (0.39 | ) | 10.12 | 120,600 | (0.20 | ) | 0.58 | 0.58 | 2.83 | 65 | |||||||||||||||||||||||||||||||||||||||
Year Ended March 31, 2013 | 10.63 | 0.31 | 0.08 | 0.39 | (0.31 | ) | — | (0.17 | ) | (0.48 | ) | 10.54 | 144,889 | 3.70 | 0.59 | 0.59 | 2.93 | 33 | ||||||||||||||||||||||||||||||||||||||||||
Year Ended March 31, 2012 | 10.21 | 0.33 | 0.53 | 0.86 | (0.33 | ) | — | (0.11 | ) | (0.44 | ) | 10.63 | 147,599 | 8.55 | 0.63 | 0.63 | 3.12 | 23 | ||||||||||||||||||||||||||||||||||||||||||
A Shares | ||||||||||||||||||||||||||||||||||||||||||||||||||||||||||||
Year Ended March 31, 2016 | 10.23 | 0.23 | 0.09 | 0.32 | (0.23 | ) | — | (0.26 | ) | (0.49 | ) | 10.06 | 4,365 | 3.29 | 0.76 | 0.76 | 2.29 | 48 | ||||||||||||||||||||||||||||||||||||||||||
Year Ended March 31, 2015 | 10.11 | 0.24 | 0.21 | 0.45 | (0.24 | ) | — | (0.09 | ) | (0.33 | ) | 10.23 | 5,152 | 4.45 | 0.74 | 0.74 | 2.34 | 59 | ||||||||||||||||||||||||||||||||||||||||||
Year Ended March 31, 2014 | 10.53 | 0.27 | (0.32 | ) | (0.05 | ) | (0.27 | ) | — | (0.10 | ) | (0.37 | ) | 10.11 | 7,668 | (0.35 | ) | 0.73 | 0.73 | 2.67 | 65 | |||||||||||||||||||||||||||||||||||||||
Year Ended March 31, 2013 | 10.63 | 0.30 | 0.07 | 0.37 | (0.30 | ) | — | (0.17 | ) | (0.47 | ) | 10.53 | 10,996 | 3.45 | 0.74 | 0.74 | 2.78 | 33 | ||||||||||||||||||||||||||||||||||||||||||
Year Ended March 31, 2012 | 10.21 | 0.31 | 0.53 | 0.84 | (0.31 | ) | — | (0.11 | ) | (0.42 | ) | 10.63 | 12,509 | 8.38 | 0.78 | 0.78 | 2.97 | 23 | ||||||||||||||||||||||||||||||||||||||||||
See Notes to Financial Highlights and Notes to Financial Statements.
130
Table of Contents
NOTES TO FINANCIAL HIGHLIGHTS
| (a) | Per share data calculated using average shares outstanding method. |
| (b) | Total return excludes sales charge. Not annualized for periods less than one year. |
| (c) | Annualized for periods less than one year. |
| (d) | Not annualized for periods less than one year. |
| (e) | IS Shares commenced operations on August 3, 2015. |
| (f) | IS Shares commenced operations on February 2, 2015. |
| (g) | Generally accepted accounting principles require adjustments to be made to the net assets of the Fund at period end for financial reporting purposes, and as such, the net asset values for shareholder transactions and the returns based on those net asset values may differ from the net asset values and returns reported in the management’s discussion of Fund performance. |
| (h) | IS Shares commenced operations on August 1, 2014. |
| (i) | Rounds to less than $0.005 per share |
131
Table of Contents
RIDGEWORTH FUNDS March 31, 2016
| 1. | Organization |
RidgeWorth Funds (the “Trust”) is organized as a Massachusetts business trust and is registered under the Investment Company Act of 1940, as amended (the “1940 Act”), as an open-end management investment company. The Trust is authorized to issue an unlimited number of shares without par value. The financial statements presented herein are those of the Seix Core Bond Fund (formerly, “Core Bond Fund”), Seix Corporate Bond Fund (formerly, “Corporate Bond Fund”), Seix Floating Rate High Income Fund, Seix Georgia Tax-Exempt Bond Fund (formerly, “Georgia Tax-Exempt Bond Fund”), Seix High Grade Municipal Bond Fund (formerly, “High Grade Municipal Bond Fund”), Seix High Income Fund (formerly, “High Income Fund”), Seix High Yield Fund, Seix Investment Grade Tax-Exempt Bond Fund (formerly, “Investment Grade Tax-Exempt Bond Fund”), Seix Limited Duration Fund (formerly, “Limited Duration Fund”), Seix North Carolina Tax-Exempt Bond Fund (formerly, “North Carolina Tax-Exempt Bond Fund”), Seix Short-Term Bond Fund (formerly, “Short-Term Bond Fund”), Seix Short-Term Municipal Bond Fund (formerly, “Short-Term Municipal Bond Fund”), Seix Total Return Bond Fund (formerly, “Total Return Bond Fund”), Seix U.S. Government Securities Ultra-Short Bond Fund (formerly, “U.S. Government Securities Ultra-Short Bond Fund”), Seix U.S. Mortgage Fund (formerly, “Limited-Term Federal Mortgage Securities Fund”), Seix Ultra-Short Bond Fund (formerly, “Ultra-Short Bond Fund”) and Seix Virginia Intermediate Municipal Bond Fund (formerly, “Virginia Intermediate Municipal Bond Fund”) (each, a “Fund” and collectively, the “Funds” or “Fixed Income Funds”), which are each (except Seix North Carolina Tax-Exempt Bond Fund) a diversified series of the Trust.
The Seix Limited Duration Fund, Seix U.S. Government Securities Ultra-Short Bond Fund and Seix Ultra-Short Bond Fund offer I Shares only. The Seix Georgia Tax-Exempt Bond Fund, Seix High Grade Municipal Bond Fund, Seix Investment Grade Tax-Exempt Bond Fund, Seix North Carolina Tax-Exempt Bond Fund, Seix Short-Term Municipal Bond Fund and Seix Virginia Intermediate Bond Fund offer I Shares and A Shares. The Seix High Yield Fund offers I Shares, A Shares and R Shares. The Seix Core Bond Fund, Seix High Income Fund and Seix Total Return Bond Fund offer I Shares, A Shares, R Shares and IS Shares. The Seix Floating Rate High Income Fund offers I Shares, A Shares, C Shares and IS Shares. The remaining Funds offer I Shares, A Shares and C Shares.
The assets of each Fund are segregated and a shareholder’s interest is limited to the Fund in which shares are held. Each class of shares has identical rights and privileges except with respect to the fees paid under the Distribution and Service Plan and the Shareholder Servicing Plan (“Plan”), voting rights on matters affecting a single class of shares and sales charges. The A Shares of the Funds (except Seix Floating Rate High Income Fund, Seix Short-Term Bond Fund, Seix Short-Term Municipal Bond Fund and Seix U.S. Mortgage Fund) have a maximum sales charge on purchases of 4.75% as a percentage of original purchase price. The A Shares of the Seix Floating Rate High Income Fund, Seix Short-Term Bond Fund, Seix Short-Term Municipal Bond and Seix U.S. Mortgage Fund have a maximum sales charge on purchases of 2.50% as a percentage of original purchase price. Certain purchases of A Shares will not be subject to a front-end sales charge but will be subject to a contingent deferred sales charge (“CDSC”) of 0.50%, if redeemed within two years of purchase. The deferred sale charges may be waived from time to time for certain broker-dealers that waive payment of compensation to them. The C Shares have a maximum CDSC of 1.00% as a percentage of either the original purchase price or the next calculated price after the Funds receive a redemption request, whichever is less, if shares are redeemed within one year of purchase. There is no sales charge on purchases of I, R or IS Shares.
The Trust’s officers and trustees are indemnified against certain liabilities arising out of the performance of their duties to the Trust. In addition, in the normal course of business, the Trust enters into contracts with its vendors and others that provide for general indemnifications. The Trust’s maximum exposure under these arrangements is unknown as this would involve future claims that may be made against the Trust. However, based on experience, the Trust expects that risk of loss to be remote.
The Funds are each an investment company and accordingly follow the investment company accounting and reporting guidance of the Financial Accounting Standards Board Codification (“FASB”) Topic 946 Financial Services — Investment Companies.
| 2. | Significant Accounting Policies |
The following are significant accounting policies consistently followed by the Funds which are in conformity with accounting principles generally accepted in the U.S. (“GAAP”). Estimates and assumptions are required to be made
132
Table of Contents
NOTES TO FINANCIAL STATEMENTS (continued)
RIDGEWORTH FUNDS March 31, 2016
regarding assets, liabilities and changes in net assets resulting from operations when financial statements are prepared. Changes in the economic environment, financial markets and any other parameters used in determining these estimates could cause actual results to differ.
(a) Investment Valuation — Debt securities are valued at the last quoted bid price provided by independent pricing vendors approved by the Board of Trustees of the Trust (the “Board”) that are based on transactions in debt obligations, quotations from bond dealers, market transactions in comparable securities and various other relationships between securities.
The Funds, in accordance with GAAP, have adopted FASB Codification Topic 820 (“ASC Topic 820”). ASC Topic 820 establishes a single definition of fair value, creates a three-tier hierarchy as a framework for measuring fair value based on inputs used to value the Funds’ investments, and requires additional disclosure about fair value. The hierarchy of inputs is summarized below:
| • | Level 1 — Investments whose values are based on quoted market prices in active markets, and whose values are therefore classified as Level 1 prices, include active listed equities. Investments in underlying funds and money market funds are valued at their Net Asset Value (“NAV”) daily and are classified as Level 1 prices. |
| • | Level 2 — Investments that trade in markets that are not considered to be active, but whose values are based on quoted market prices, dealer quotations or valuations provided by alternative pricing sources supported by observable inputs are classified as Level 2 prices. These generally include U.S. government and sovereign obligations, most government agency securities, investment-grade corporate bonds, certain asset and mortgage backed products, less liquid listed equities, and state, municipal and provincial obligations. |
| • | Level 3 — Investments whose values are classified as Level 3 prices have significant unobservable inputs, as they may trade infrequently or not at all. When observable prices are not available for these securities, the Funds use one or more valuation techniques for which sufficient and reliable data is available. The inputs used by the Funds in estimating the value of Level 3 prices may include the original transaction price, quoted prices for similar securities or assets in active markets, completed or pending third-party transactions in the underlying investment or comparable issuers, and changes in financial ratios or cash flows. Level 3 prices may also be adjusted to reflect illiquidity and/or non-transferability, with the amount of such discount estimated by the Funds in the absence of market information. Assumptions used by the Funds due to the lack of observable inputs may significantly impact the resulting fair value and therefore the Funds’ results of operations. |
The inputs or methodology used for valuing securities are not necessarily an indication of the risk associated with investing in those securities.
The Funds use valuation techniques to measure fair value that are consistent with the market approach and/or income approach, depending on the type of security and the particular circumstance. The market approach uses prices and other relevant information generated by market transactions involving identical or comparable securities. The income approach uses valuation techniques to discount estimated future cash flows to present value.
The independent pricing vendor may value bank loans and debt securities at an evaluated bid price by employing methodologies that utilize actual market transactions, broker-supplied valuations, and/or other methodologies designed to identify the market value for such securities and such securities are considered Level 2 in the fair value hierarchy. Publicly-traded foreign government debt securities are typically traded internationally in the over-the-counter market and are valued at the bid prices as of the close of business of that market and such securities are considered Level 2 in the fair value hierarchy. Futures contracts are valued daily at the settlement price established by the board of trade or exchange on which they are traded and such securities may be considered Level 1 in the fair value hierarchy. Equity securities for which market quotations are available are valued at the last reported sales price or official closing price on the primary market or exchange on which they trade and such securities may be considered Level 1 in the fair value hierarchy. Centrally cleared credit default and interest rate swaps are valued at the price determined by the relevant exchange and such securities may be considered Level 2 in the fair value hierarchy. Forward foreign exchange contracts are valued using daily forward exchange rates and such securities may be considered Level 2 in the fair value hierarchy. Short-term obligations with maturities of 60 days or less are valued at amortized cost, which approximates fair value and such securities are considered Level 2
133
Table of Contents
NOTES TO FINANCIAL STATEMENTS (continued)
RIDGEWORTH FUNDS March 31, 2016
in the fair value hierarchy. Under the Pricing and Valuation Procedures, such securities may be considered Level 2 or Level 3 in the fair value hierarchy.
When reliable prices are not readily available, such as when the value of a security has been significantly affected by events after the close of the exchange or market on which the security is principally traded, but before each Fund calculates its NAV, each of the Funds will value the security as determined in accordance with the Pricing and Valuation Procedures approved by the Board. The Pricing and Valuation Procedures are performed and monitored by a Valuation Committee (the “Committee”) designated by the Board. Some of the more common reasons which may necessitate that a security be fair valued in accordance with the Pricing and Valuation Procedures include, but are not limited to: the security’s trading has been halted or suspended; the security has been de-listed from a national exchange; the security’s primary trading market is temporarily closed at a time when, under normal conditions, it would be open; or the security’s primary pricing source is not able or willing to provide a price. When a security is fair valued in accordance with the Pricing and Valuation Procedures, the Committee determines the value after taking into consideration relevant information reasonably available to the Committee.
The following is a summary of the inputs used in valuing the Funds’ assets and liabilities carried at fair value as of March 31, 2016:
| Level 1 - Quoted Prices | Level 2 - Other Significant Observable Inputs | Level 3 - Significant Unobservable Inputs | Total | |||||||||||||
Seix Core Bond Fund | ||||||||||||||||
Assets | ||||||||||||||||
Asset-Backed Securities1 | $— | $8,383,283 | $— | $8,383,283 | ||||||||||||
Collateralized Mortgage Obligations1 | — | 13,443,765 | — | 13,443,765 | ||||||||||||
Corporate Bonds1 | — | 74,515,220 | — | 74,515,220 | ||||||||||||
U.S. Government Agency Mortgages1 | — | 67,135,123 | — | 67,135,123 | ||||||||||||
U.S. Treasury Obligations1 | — | 98,529,772 | — | 98,529,772 | ||||||||||||
Foreign Government Bond | — | 438,570 | — | 438,570 | ||||||||||||
Money Market Funds | 21,743,197 | — | — | 21,743,197 | ||||||||||||
|
|
|
|
|
|
|
| |||||||||
Total Investments | 21,743,197 | 262,445,733 | — | 284,188,930 | ||||||||||||
|
|
|
|
|
|
|
| |||||||||
Seix Corporate Bond Fund | ||||||||||||||||
Assets | ||||||||||||||||
Corporate Bonds1 | — | 16,713,848 | — | 16,713,848 | ||||||||||||
Money Market Funds | 1,285,456 | — | — | 1,285,456 | ||||||||||||
|
|
|
|
|
|
|
| |||||||||
Total Investments | 1,285,456 | 16,713,848 | — | 17,999,304 | ||||||||||||
|
|
|
|
|
|
|
| |||||||||
Seix Floating Rate High Income Fund | ||||||||||||||||
Assets | ||||||||||||||||
Asset-Backed Security1 | — | 1,058,470 | — | 1,058,470 | ||||||||||||
Bank Loans1 | — | 4,094,295,501 | — | 4,094,295,501 | ||||||||||||
Corporate Bonds1 | — | 64,977,560 | 24,497,837 | 4 | 89,475,397 | |||||||||||
Preferred Stock1 | 2,304,553 | — | — | 2,304,553 | ||||||||||||
Common Stocks1 | 5,537,434 | — | — | 5,537,434 | ||||||||||||
Money Market Fund | 178,369,305 | — | — | 178,369,305 | ||||||||||||
|
|
|
|
|
|
|
| |||||||||
Total Investments | 186,211,292 | 4,160,331,531 | 24,497,837 | 4 | 4,371,040,660 | |||||||||||
|
|
|
|
|
|
|
| |||||||||
Seix Georgia Tax-Exempt Bond Fund | ||||||||||||||||
Assets | ||||||||||||||||
Municipal Bonds2 | — | 109,025,763 | — | 109,025,763 | ||||||||||||
Money Market Fund | 1,297,273 | — | — | 1,297,273 | ||||||||||||
|
|
|
|
|
|
|
| |||||||||
Total Investments | 1,297,273 | 109,025,763 | — | 110,323,036 | ||||||||||||
|
|
|
|
|
|
|
| |||||||||
Seix High Grade Municipal Bond Fund | ||||||||||||||||
Assets | ||||||||||||||||
Municipal Bonds2 | — | 99,552,548 | — | 99,552,548 | ||||||||||||
Money Market Fund | 17,339,825 | — | — | 17,339,825 | ||||||||||||
|
|
|
|
|
|
|
| |||||||||
Total Investments | 17,339,825 | 99,552,548 | — | 116,892,373 | ||||||||||||
|
|
|
|
|
|
|
| |||||||||
134
Table of Contents
NOTES TO FINANCIAL STATEMENTS (continued)
RIDGEWORTH FUNDS March 31, 2016
| Level 1 - Quoted Prices | Level 2 - Other Significant Observable Inputs | Level 3 - Significant Unobservable Inputs | Total | |||||||||||||
Seix High Income Fund | ||||||||||||||||
Assets | ||||||||||||||||
Bank Loans1 | $— | $21,513,417 | $— | $21,513,417 | ||||||||||||
Corporate Bonds1 | — | 543,447,548 | 0 | 4 | 543,447,548 | |||||||||||
Convertible Preferred Stock1 | 1,091,638 | — | — | 1,091,638 | ||||||||||||
Preferred Stock1 | 2,968,406 | — | — | 2,968,406 | ||||||||||||
Common Stocks1 | 7,467,786 | — | — | 7,467,786 | ||||||||||||
Money Market Funds | 81,434,620 | — | — | 81,434,620 | ||||||||||||
|
|
|
|
|
|
|
| |||||||||
Total Investments | 92,962,450 | 564,960,965 | 0 | 4 | 657,923,415 | |||||||||||
|
|
|
|
|
|
|
| |||||||||
Seix High Yield Fund | ||||||||||||||||
Assets | ||||||||||||||||
Bank Loans1 | — | 20,533,275 | — | 20,533,275 | ||||||||||||
Corporate Bonds1 | — | 466,622,597 | — | 466,622,597 | ||||||||||||
Convertible Preferred Stock1 | 948,315 | — | — | 948,315 | ||||||||||||
Common Stock1 | 965,521 | — | — | 965,521 | ||||||||||||
Money Market Funds | 86,529,601 | — | — | 86,529,601 | ||||||||||||
|
|
|
|
|
|
|
| |||||||||
Total Investments | 88,443,437 | 487,155,872 | — | 575,599,309 | ||||||||||||
|
|
|
|
|
|
|
| |||||||||
Seix Investment Grade Tax-Exempt Bond Fund | ||||||||||||||||
Assets | ||||||||||||||||
Municipal Bonds2 | — | 578,563,827 | — | 578,563,827 | ||||||||||||
Money Market Fund | 80,641,465 | — | — | 80,641,465 | ||||||||||||
|
|
|
|
|
|
|
| |||||||||
Total Investments | 80,641,465 | 578,563,827 | — | 659,205,292 | ||||||||||||
|
|
|
|
|
|
|
| |||||||||
Seix Limited Duration Fund | ||||||||||||||||
Assets | ||||||||||||||||
Asset-Backed Securities1 | — | 1,628,500 | — | 1,628,500 | ||||||||||||
Collateralized Mortgage Obligations1 | — | 3,679,667 | — | 3,679,667 | ||||||||||||
U.S. Government Agency Mortgages1 | — | 1,039,798 | — | 1,039,798 | ||||||||||||
Money Market Fund | 299,524 | — | — | 299,524 | ||||||||||||
|
|
|
|
|
|
|
| |||||||||
Total Investments | 299,524 | 6,347,965 | — | 6,647,489 | ||||||||||||
|
|
|
|
|
|
|
| |||||||||
Seix North Carolina Tax-Exempt Bond Fund | ||||||||||||||||
Assets | ||||||||||||||||
Municipal Bonds2 | — | 27,857,014 | — | 27,857,014 | ||||||||||||
Money Market Fund | 1,042,292 | — | — | 1,042,292 | ||||||||||||
|
|
|
|
|
|
|
| |||||||||
Total Investments | 1,042,292 | 27,857,014 | — | 28,899,306 | ||||||||||||
|
|
|
|
|
|
|
| |||||||||
Seix Short-Term Bond Fund | ||||||||||||||||
Assets | ||||||||||||||||
Asset-Backed Securities1 | — | 4,832,501 | — | 4,832,501 | ||||||||||||
Collateralized Mortgage Obligations1 | — | 4,957,923 | — | 4,957,923 | ||||||||||||
Corporate Bonds1 | — | 18,663,329 | — | 18,663,329 | ||||||||||||
Municipal Bonds2 | — | 1,063,356 | — | 1,063,356 | ||||||||||||
U.S. Government Agency Mortgages1 | — | 6,417,461 | — | 6,417,461 | ||||||||||||
U.S. Treasury Obligations1 | — | 17,254,087 | — | 17,254,087 | ||||||||||||
Money Market Fund | 876,056 | — | — | 876,056 | ||||||||||||
|
|
|
|
|
|
|
| |||||||||
Total Investments | 876,056 | 53,188,657 | — | 54,064,713 | ||||||||||||
|
|
|
|
|
|
|
| |||||||||
Seix Short-Term Municipal Bond Fund | ||||||||||||||||
Assets | ||||||||||||||||
Municipal Bonds2 | — | 36,871,105 | — | 36,871,105 | ||||||||||||
Money Market Fund | 3,491,966 | — | — | 3,491,966 | ||||||||||||
|
|
|
|
|
|
|
| |||||||||
Total Investments | 3,491,966 | 36,871,105 | — | 40,363,071 | ||||||||||||
|
|
|
|
|
|
|
| |||||||||
135
Table of Contents
NOTES TO FINANCIAL STATEMENTS (continued)
RIDGEWORTH FUNDS March 31, 2016
| Level 1 - Quoted Prices | Level 2 - Other Significant Observable Inputs | Level 3 - Significant Unobservable Inputs | Total | |||||||||||||
Seix Total Return Bond Fund | ||||||||||||||||
Assets | ||||||||||||||||
Asset-Backed Securities1 | $— | $30,586,650 | $— | $30,586,650 | ||||||||||||
Collateralized Mortgage Obligations1 | — | 44,698,867 | — | 44,698,867 | ||||||||||||
Bank Loan1 | — | 234,610 | — | 234,610 | ||||||||||||
Corporate Bonds1 | — | 296,338,174 | — | 296,338,174 | ||||||||||||
U.S. Government Agency Mortgages1 | — | 288,179,569 | — | 288,179,569 | ||||||||||||
U.S. Treasury Obligations1 | — | 397,166,500 | — | 397,166,500 | ||||||||||||
Foreign Government Bonds | — | 22,824,570 | — | 22,824,570 | ||||||||||||
Money Market Funds | 140,504,620 | — | — | 140,504,620 | ||||||||||||
|
|
|
|
|
|
|
| |||||||||
Total Investments | 140,504,620 | 1,080,028,940 | — | 1,220,533,560 | ||||||||||||
|
|
|
|
|
|
|
| |||||||||
Other Financial Instruments3 | ||||||||||||||||
Forward Foreign Currency Contracts | — | 3,646,060 | — | 3,646,060 | ||||||||||||
|
|
|
|
|
|
|
| |||||||||
Total Assets | 140,504,620 | 1,083,675,000 | — | 1,224,179,620 | ||||||||||||
|
|
|
|
|
|
|
| |||||||||
Liabilities | ||||||||||||||||
Forward Foreign Currency Contracts | — | (4,445,535 | ) | — | (4,445,535 | ) | ||||||||||
|
|
|
|
|
|
|
| |||||||||
Total Liabilities | — | (4,445,535 | ) | — | (4,445,535 | ) | ||||||||||
|
|
|
|
|
|
|
| |||||||||
Seix U.S. Government Securities Ultra-Short Bond Fund | ||||||||||||||||
Assets | ||||||||||||||||
Asset-Backed Security1 | — | 11,415,574 | — | 11,415,574 | ||||||||||||
Collateralized Mortgage Obligations1 | — | 584,179,675 | — | 584,179,675 | ||||||||||||
U.S. Government Agency Mortgages1 | — | 876,103,726 | — | 876,103,726 | ||||||||||||
U.S. Treasury Obligation1 | — | 999,175 | — | 999,175 | ||||||||||||
Money Market Fund | 81,726,491 | — | — | 81,726,491 | ||||||||||||
|
|
|
|
|
|
|
| |||||||||
Total Investments | 81,726,491 | 1,472,698,150 | — | 1,554,424,641 | ||||||||||||
|
|
|
|
|
|
|
| |||||||||
Other Financial Instruments3 | ||||||||||||||||
Liabilities | ||||||||||||||||
Futures Contracts | (46,059 | ) | — | — | (46,059 | ) | ||||||||||
|
|
|
|
|
|
|
| |||||||||
Total Liabilities | (46,059 | ) | — | — | (46,059 | ) | ||||||||||
|
|
|
|
|
|
|
| |||||||||
Seix U.S. Mortgage Fund | ||||||||||||||||
Assets | ||||||||||||||||
Collateralized Mortgage Obligations1 | — | 1,802,028 | — | 1,802,028 | ||||||||||||
U.S. Government Agency Mortgages1 | — | 34,181,348 | — | 34,181,348 | ||||||||||||
U.S. Treasury Obligations1 | — | 659,593 | — | 659,593 | ||||||||||||
Money Market Fund | 2,438,560 | — | — | 2,438,560 | ||||||||||||
|
|
|
|
|
|
|
| |||||||||
Total Investments | 2,438,560 | 36,642,969 | — | 39,081,529 | ||||||||||||
|
|
|
|
|
|
|
| |||||||||
Seix Ultra-Short Bond Fund | ||||||||||||||||
Assets | ||||||||||||||||
Asset-Backed Securities1 | — | 21,565,160 | — | 21,565,160 | ||||||||||||
Collateralized Mortgage Obligations1 | — | 18,295,656 | — | 18,295,656 | ||||||||||||
Corporate Bonds1 | — | 45,961,276 | — | 45,961,276 | ||||||||||||
Municipal Bonds2 | — | 2,581,355 | — | 2,581,355 | ||||||||||||
U.S. Government Agency Mortgages1 | — | 12,802,661 | — | 12,802,661 | ||||||||||||
U.S. Treasury Obligation1 | — | 109,910 | — | 109,910 | ||||||||||||
Money Market Fund | 3,270,974 | — | — | 3,270,974 | ||||||||||||
|
|
|
|
|
|
|
| |||||||||
Total Investments | 3,270,974 | 101,316,018 | — | 104,586,992 | ||||||||||||
|
|
|
|
|
|
|
| |||||||||
Other Financial Instruments3 | ||||||||||||||||
Liabilities | ||||||||||||||||
Futures Contracts | (8,369 | ) | — | — | (8,369 | ) | ||||||||||
|
|
|
|
|
|
|
| |||||||||
Total Liabilities | (8,369 | ) | — | — | (8,369 | ) | ||||||||||
|
|
|
|
|
|
|
| |||||||||
136
Table of Contents
NOTES TO FINANCIAL STATEMENTS (continued)
RIDGEWORTH FUNDS March 31, 2016
| Level 1 - Quoted Prices | Level 2 - Other Significant Observable Inputs | Level 3 - Significant Unobservable Inputs | Total | |||||||||||||
Seix Virginia Intermediate Municipal Bond Fund | ||||||||||||||||
Assets | ||||||||||||||||
Municipal Bonds2 | $— | $65,834,925 | $— | $65,834,925 | ||||||||||||
Money Market Funds | 1,373,956 | — | — | 1,373,956 | ||||||||||||
|
|
|
|
|
|
|
| |||||||||
Total Investments | 1,373,956 | 65,834,925 | — | 67,208,881 | ||||||||||||
|
|
|
|
|
|
|
| |||||||||
| 1 | Please see the Schedules of Portfolio Investments for Sector Classifications. |
| 2 | Please see the Schedules of Portfolio Investments for State Classifications. |
| 3 | Other Financial Instruments are derivative instruments and depreciation on unfunded loan commitments not reflected in the value of Total Investments in the Schedules of Portfolio Investments, such as credit default swaps, forward foreign currency contracts, futures and interest rate swaps, which are shown at the unrealized appreciation (depreciation) on the instrument. |
| 4 | As of March 31, 2016, the securities designated as Level 3 were fair valued using significant unobservable inputs under procedures adopted by the Board. Such valuations were based on a review of inputs such as, but not limited to, similar securities, company specific financial information, and company specific news. Each of these securities are Board fair valued securities for the fiscal year ended March 31, 2016. The Level 3 securities comprised 0.0% of net assets of Seix High Income Fund and 0.6% of net assets of Seix Floating Rate High Income Fund. |
The following is a reconciliation of investments as of March 31, 2016 in which significant unobservable inputs (Level 3) were used in determining fair value:
| Balance as of 3/31/2015 | Accrued Discounts | Realized Gain | Change in Unrealized Depreciation | Purchases | Sales | Transfers into Level 3 | Transfers out of Level 3 | Balance as of 3/31/2016 | Net Change in Unrealized Depreciation from Investments Still Held as of 3/31/2016 | |||||||||||||||||||||||||||||||
Seix Floating Rate High Income Fund | ||||||||||||||||||||||||||||||||||||||||
Corporate Bonds | ||||||||||||||||||||||||||||||||||||||||
Oil and Gas | $— | $— | $— | $— | $— | $— | $24,497,837 | $— | $24,497,837 | $— | ||||||||||||||||||||||||||||||
| �� |
|
|
|
|
|
|
|
|
|
|
|
|
|
|
|
|
|
|
|
| ||||||||||||||||||||
| $— | $— | $— | $— | $— | $— | $24,497,837 | $— | $24,497,837 | $— | |||||||||||||||||||||||||||||||
|
|
|
|
|
|
|
|
|
|
|
|
|
|
|
|
|
|
|
| |||||||||||||||||||||
The Funds’ policy is to disclose transfers between levels based on valuations at the end of the reporting period. Each portfolio may hold securities which are periodically fair valued in accordance with the Pricing and Valuation Procedures. This may result in movements between Level 1 and Level 2 throughout the period. As of March 31, 2016, there were no transfers from Level 1 to Level 2 pursuant to the Pricing and Valuation Procedures. As of March 31, 2016, a security was transferred from Level 2 to Level 3 pursuant to the Pricing and Valuation Procedures for Seix Floating Rate High Income Fund. The transfer was a result of a review of the use of the Barclays broker quote and other pricing inputs. Based on the fact pattern, it was deemed the security illiquid, and classified it as Level 3.
(b) Security Transactions and Investment Income — Security transactions are accounted for on a trade date basis. Interest income, adjusted for amortization of premium and accretion of discount over the life of the securities, is recorded on the accrual basis. Domestic and foreign dividend income is recorded on the ex-dividend date or as soon as practicable after the Funds determine the existence of a dividend declaration after exercising reasonable due diligence. The cost of investments sold is determined by use of the specific identification method. To the extent any issuer defaults or a credit event occurs that impacts the issuer, the Funds may halt any additional interest income accruals and consider the Funds’ ability to realize interest accrued up to the date of default or credit event. Distributions from gains from underlying funds, if any, are recorded as realized gains on the ex-dividend date. Paydown gains and losses on mortgage- and asset-backed securities are recorded as adjustments to interest income.
(c) Distributions to Shareholders — Distributions from net investment income of each of the Funds are declared each business day to shareholders of record and are paid monthly. Distributions of net realized capital gains, if any, are declared at least annually. Distributions to shareholders from each of the Funds are recorded on the ex-dividend date and are determined in accordance with income tax regulations, which may differ from GAAP.
137
Table of Contents
NOTES TO FINANCIAL STATEMENTS (continued)
RIDGEWORTH FUNDS March 31, 2016
(d) Expenses and Share Class Accounting — Expenses that are directly related to a specific Fund are charged to that Fund. Other operating expenses of the Trust are allocated pro-rata to the Funds on the basis of relative net assets or another appropriate basis. Investment income, common expenses, and realized/unrealized capital gains (losses) on investments are allocated to the various share classes of the Funds on the basis of relative daily net assets of each share class. Fees relating to a specific share class are charged directly to the share class.
(e) Securities Traded on a To-Be-Announced Basis — Certain Funds may trade securities on a to-be-announced (“TBA”) basis. In a TBA transaction, a Fund commits to purchasing or selling securities which have not yet been issued by the issuer and for which specific information, such as the face amount, maturity date and underlying pool of investments in U.S. government agency mortgage pass-through securities, is not announced. Securities purchased on a TBA basis are not settled until they are delivered to the Fund. Beginning on the date a Fund enters into a TBA transaction, cash, U.S. government securities or other liquid high-grade debt obligations are segregated in an amount equal in value to the purchase price of the TBA security. These securities are subject to market fluctuations and their current value is determined in the same manner as for other securities.
(f) Derivative Instruments — Certain Funds may enter into derivative contracts for purposes of pursuing their investment objectives, to use as a substitute for a purchase or sale of a position in the underlying assets and/or as part of a strategy designed to reduce exposure to other risks. Open derivative positions as of March 31, 2016 are included on each Fund’s Schedule of Portfolio Investments.
(g) Forward Foreign Currency Contracts — Certain Funds may enter into forward foreign currency contracts to hedge against foreign currency exchange rate risk on non-U.S. dollar denominated securities or to facilitate settlement of a foreign currency denominated portfolio transaction. A forward foreign currency contract is an agreement between two parties to buy and sell a currency at a set price with delivery and settlement at a future date. The contract is marked-to-market daily and the change in value is recorded by the Fund as an unrealized gain or loss. When a forward foreign currency contract is closed, through either delivery or offset by entering into another forward foreign currency contract, the Fund recognizes a realized gain or loss equal to the difference between the value of the contract at the time it was opened and the value of the contract at the time it is closed.
Forward foreign currency contracts involve elements of market risk in excess of the amounts reflected on the Statements of Assets and Liabilities. The Funds bear the risk of an unfavorable change in the foreign exchange rate underlying the forward foreign currency contract. Risks may also arise upon entering into these contracts from the potential inability of the counterparties to meet the terms of their contracts.
(h) Futures Contracts — Certain Funds may enter into futures contracts to gain exposure to, or hedge against, changes in interest rates or gain exposure to, or hedge against, changes in certain asset classes. A futures contract represents a commitment for the future purchase or sale of an asset at a specified price on a specified date.
Upon entering into a futures contract, the Fund is required to deposit cash or cash equivalents with a broker in an amount equal to a certain percentage of the contract amount. This is known as the “initial margin” and subsequent payments (“variation margin”) are made or received by the Fund each day, depending on the daily fluctuation in the value of the contract. For certain futures, including foreign denominated futures, variation margin is not settled daily, but is recorded as a net variation margin payable or receivable. Futures contracts are valued daily at the settlement price established by the board of trade or exchange on which they are traded. The daily changes in contract value are recorded as unrealized gains or losses in the Statements of Operations and the Fund recognizes a realized gain or loss when the contract is closed.
Futures contracts involve, to varying degrees, risk of loss in excess of the amounts reflected in the Statements of Assets and Liabilities. In addition, there is the risk that the Funds may not be able to enter into a closing transaction because of an illiquid secondary market.
(i) Foreign Currency Translation — Investment securities and other assets and liabilities denominated in foreign currencies are translated into U.S. dollar amounts based upon prevailing exchange rates, as of the close of regular trading on the New York Stock Exchange (usually 4:00 p.m. Eastern Time), on the date of valuation. Purchases and sales of investment securities and income and expense items denominated in foreign currencies are translated into U.S. dollar amounts based upon prevailing exchange rates on the respective dates of such transactions.
138
Table of Contents
NOTES TO FINANCIAL STATEMENTS (continued)
RIDGEWORTH FUNDS March 31, 2016
The Funds do not isolate that portion of the results of operations resulting from fluctuations in foreign exchange rates on investments from the fluctuations arising from changes in market prices of securities held. Such fluctuations are included with the net realized and unrealized gain or loss on investments and foreign currencies.
Net realized foreign exchange gains or losses arise from sales of foreign currencies, including gains and losses on forward foreign currency contracts, currency gains or losses realized between the trade and settlement dates on securities transactions, and the difference between the amounts of dividends, interest and foreign withholding taxes recorded and the amount actually received.
(j) Swap Contracts — Certain Funds may invest in swap contracts for the purpose of managing exposure to interest rate, credit or market risk, or for other purposes. The use of swap contracts involves risks that are different from those associated with ordinary portfolio transactions. Swap contracts may be privately negotiated in the over-the-counter market (“OTC swaps”) or may be executed in a multilateral or other trade facility platform, such as a registered commodities exchange (“centrally cleared swaps”).
OTC swap contracts are marked-to-market daily using an independent pricing vendor and changes in value are recorded as unrealized appreciation or depreciation in the Statements of Assets and Liabilities. Daily changes in valuation of centrally cleared swaps, if any, are recorded as a receivable or payable, as applicable, for variation margin on centrally cleared swaps on the Statement of Assets and Liabilities. Gains or losses are realized upon termination of the swap contract. Collateral, in the form of restricted cash or securities, may be required to be held in segregated accounts with the Funds’ custodian in compliance with the terms of the swap contracts. Securities posted as collateral for swap contracts are identified in the Schedules of Portfolio Investments and restricted cash, if any, is identified on the Statements of Assets and Liabilities. Risks may exceed amounts recorded in the Statements of Assets and Liabilities. These risks include changes in the returns of the underlying instruments, failure of the counterparties to perform under the contracts’ terms, and the possible lack of liquidity with respect to the swap contracts. Payments received or made at the beginning of the measurement period are reflected as a premium or deposit, respectively, on the Statements of Assets and Liabilities. These upfront payments are amortized over the life of the swap and are recognized as realized gain or loss in the Statements of Operations. Net periodic payments received or paid by the Funds are recognized as a realized gain or loss in the Statements of Operations.
Credit Default Swaps
Certain Funds enter into credit default swap (“CDS”) contracts for investment purposes, to manage credit risk or to add leverage. CDS contracts involve one party making a stream of payments to another party in exchange for the right to receive a specified return in the event of a default by a third party, typically corporate or sovereign issuers, on a specified obligation, or in the event of a write-down, principal shortfall, interest shortfall or default of all or part of the referenced entities comprising a credit index. The Funds may use a CDS contract to provide protection against defaults of the issuers (i.e., to reduce risk where the Funds have exposure to an issuer) or to take an active long or short position with respect to the likelihood of a particular issuer’s default.
As a seller of protection, a Fund generally receives an upfront payment or a stream of payments throughout the term of the swap contracts provided that there is no credit event. These amounts of potential payments will be partially offset by any recovery of values from the respective referenced obligations. As a seller of protection, a Fund effectively adds leverage to its portfolio because, in addition to its total net assets, a Fund is subject to investment exposure on the notional amount of the swap contract. As a buyer of protection, a Fund generally receives an amount up to the notional value of the swap contract if a defined credit event occurs.
The Funds’ maximum risk of loss from counterparty risk, as the protection buyer, is the fair value of the swap contract (this risk is mitigated by the posting of collateral by the counterparty to the Fund to cover the Funds’ exposure to the counterparty). As the protection seller, the Funds’ maximum risk is the notional amount of the contract. CDS contracts are considered to have credit risk-related contingent features since they require payment by the protection seller to the protection buyer upon the occurrence of a defined credit event.
Implied spreads are the theoretical prices a lender receives for credit default protection. When spreads rise, market perceived credit risk rises and when spreads fall, market perceived credit risk falls. The implied credit spread of a particular referenced entity reflects the cost of buying/selling protection and may include upfront payments required to enter into the contract. Wider credit spreads and decreasing market values, when compared
139
Table of Contents
NOTES TO FINANCIAL STATEMENTS (continued)
RIDGEWORTH FUNDS March 31, 2016
to the notional amount of the swap, represent a deterioration of the referenced entity’s credit soundness and a greater likelihood or risk of default or other credit event occurring as defined under the terms of the contract. Credit spreads utilized in determining the period end market value of CDS contracts on corporate or sovereign issues are disclosed in the Schedules of Portfolio Investments and serve as an indicator of the current status of the payment/performance risk and represent the likelihood or risk of default for credit derivatives. The quoted market prices and resulting values, particularly in relation to the notional amount of the contract as well as the annual payment rate, serve as an indication of the current status of the payment/performance risk for CDS contracts on asset-backed securities and credit indices.
Entering into a CDS contract involves, to varying degrees, elements of credit, market and documentation risk. Such risks involve the possibility that there will be no liquid market for these contracts, and that the counterparty to the contract may default on its obligation to perform or disagree as to the meaning of the contractual terms in the contract, and that there are unfavorable changes in net interest rates. As of March 31, 2016, the Funds had no outstanding CDS contracts.
Interest Rate Swaps
Certain Funds may enter into interest rate swap (“IRS”) contracts to manage exposure to interest rate risk. IRS contracts are agreements between two parties to exchange cash flows based on a notional principal amount. The Fund may elect to pay a fixed rate and receive a floating rate, or, receive a fixed rate and pay a floating rate on a notional principal amount. IRS contracts are marked-to-market daily based upon quotations from market makers. When a swap contract is terminated early, the Fund records a realized gain or loss equal to the difference between the original cost and the settlement amount of the closing transaction.
The risks of IRS contracts include changes in market conditions that will affect the value of the contract or changes in the present value of the future cash flow streams and the possible inability of the counterparty to fulfill its obligations under the contract. The Fund’s maximum risk of loss from counterparty credit risk is the discounted net value of the cash flows to be received from the counterparty over the contract’s remaining life, to the extent that that amount is positive. This risk is mitigated by the posting of collateral by the counterparty to the Fund to cover the Fund’s exposure to the counterparty. As of March 31, 2016, the Funds had no outstanding IRS contracts.
The fair value of derivative instruments not accounted for as hedging instruments on the Statements of Assets and Liabilities and the effect of derivative instruments not accounted for as hedging instruments, on the Statements of Operations as of March 31, 2016, are presented in the table below:
| Credit Risk | Foreign Exchange Risk | Interest Rate Risk | Total | |||||||||||||
| Seix Corporate Bond Fund | ||||||||||||||||
Realized Gain (Loss)# | ||||||||||||||||
Swaps Contracts | $ | (24,948 | ) | $ | — | $ | — | $ | (24,948 | ) | ||||||
|
|
|
|
|
|
|
| |||||||||
Total Realized Gain (Loss) | $ | (24,948 | ) | $ | — | $ | — | $ | (24,948 | ) | ||||||
|
|
|
|
|
|
|
| |||||||||
Change in Unrealized Appreciation (Depreciation)## | ||||||||||||||||
Swaps Contracts | $ | 1,656 | $ | — | $ | — | $ | 1,656 | ||||||||
|
|
|
|
|
|
|
| |||||||||
Total Change in Appreciation (Depreciation) | $ | 1,656 | $ | — | $ | — | $ | 1,656 | ||||||||
|
|
|
|
|
|
|
| |||||||||
Average Number of Contracts, Notional Amounts or Shares+ | ||||||||||||||||
Swaps Contracts | 783,333 | — | — | 783,333 | ||||||||||||
|
|
|
|
|
|
|
| |||||||||
| Seix High Income Fund | ||||||||||||||||
Realized Gain (Loss)# | ||||||||||||||||
Swaps Contracts | $ | 290,557 | $ | — | $ | — | $ | 290,557 | ||||||||
|
|
|
|
|
|
|
| |||||||||
Total Realized Gain (Loss) | $ | 290,557 | $ | — | $ | — | $ | 290,557 | ||||||||
|
|
|
|
|
|
|
| |||||||||
Change in Unrealized Appreciation (Depreciation)## | ||||||||||||||||
Swaps Contracts | $ | (224,551 | ) | $ | — | $ | — | $ | (224,551 | ) | ||||||
|
|
|
|
|
|
|
| |||||||||
Total Change in Appreciation (Depreciation) | $ | (224,551 | ) | $ | — | $ | — | $ | (224,551 | ) | ||||||
|
|
|
|
|
|
|
| |||||||||
Average Number of Contracts, Notional Amounts or Shares+ | ||||||||||||||||
Swaps Contracts | 24,500,000 | — | — | 24,500,000 | ||||||||||||
|
|
|
|
|
|
|
| |||||||||
140
Table of Contents
NOTES TO FINANCIAL STATEMENTS (continued)
RIDGEWORTH FUNDS March 31, 2016
| Credit Risk | Foreign Exchange Risk | Interest Rate Risk | Total | |||||||||||||
| Seix High Yield Fund | ||||||||||||||||
Realized Gain (Loss)# | ||||||||||||||||
Swaps Contracts | $ | 421,799 | $ | — | $ | — | $ | 421,799 | ||||||||
|
|
|
|
|
|
|
| |||||||||
Total Realized Gain (Loss) | $ | 421,799 | $ | — | $ | — | $ | 421,799 | ||||||||
|
|
|
|
|
|
|
| |||||||||
Change in Unrealized Appreciation (Depreciation)## | ||||||||||||||||
Swaps Contracts | $ | (367,750 | ) | $ | — | $ | — | $ | (367,750 | ) | ||||||
|
|
|
|
|
|
|
| |||||||||
Total Change in Appreciation (Depreciation) | $ | (367,750 | ) | $ | — | $ | — | $ | (367,750 | ) | ||||||
|
|
|
|
|
|
|
| |||||||||
Average Number of Contracts, Notional Amounts or Shares+ | ||||||||||||||||
Swaps Contracts | 26,800,000 | — | — | 26,800,000 | ||||||||||||
|
|
|
|
|
|
|
| |||||||||
| Seix Total Return Bond Fund | ||||||||||||||||
Asset Derivatives | ||||||||||||||||
Forward Contracts* | $ | — | $ | 3,646,060 | $ | — | $ | 3,646,060 | ||||||||
|
|
|
|
|
|
|
| |||||||||
Total Value | $ | — | $ | 3,646,060 | $ | — | $ | 3,646,060 | ||||||||
|
|
|
|
|
|
|
| |||||||||
Liability Derivatives | ||||||||||||||||
Forward Contracts^ | $ | — | $ | (4,445,535 | ) | $ | — | $ | (4,445,535 | ) | ||||||
|
|
|
|
|
|
|
| |||||||||
Total Value | $ | — | $ | (4,445,535 | ) | $ | — | $ | (4,445,535 | ) | ||||||
|
|
|
|
|
|
|
| |||||||||
Realized Gain (Loss)# | ||||||||||||||||
Forward Contracts | $ | — | $ | 1,867,571 | $ | — | $ | 1,867,571 | ||||||||
Swaps Contracts | (87,731 | ) | — | — | (87,731 | ) | ||||||||||
|
|
|
|
|
|
|
| |||||||||
Total Realized Gain (Loss) | $ | (87,731 | ) | $ | 1,867,571 | $ | — | $ | 1,779,840 | |||||||
|
|
|
|
|
|
|
| |||||||||
Change in Unrealized Appreciation (Depreciation)## | ||||||||||||||||
Forward Contracts | $ | — | $ | (1,351,317 | ) | $ | — | $ | (1,351,317 | ) | ||||||
Swaps Contracts | 50,260 | — | — | 50,260 | ||||||||||||
|
|
|
|
|
|
|
| |||||||||
Total Change in Appreciation (Depreciation) | $ | 50,260 | $ | (1,351,317 | ) | $ | — | $ | (1,301,057 | ) | ||||||
|
|
|
|
|
|
|
| |||||||||
Average Number of Contracts, Notional Amounts or Shares+ | ||||||||||||||||
Forward Currency Contracts | — | 229,076,896 | — | 229,076,896 | ||||||||||||
|
|
|
|
|
|
|
| |||||||||
Swaps Contracts | 26,598,850 | — | — | 26,598,850 | ||||||||||||
|
|
|
|
|
|
|
| |||||||||
| Seix U.S. Government Securities Ultra-Short Bond Fund | ||||||||||||||||
Asset Derivatives | ||||||||||||||||
Liability Derivatives | ||||||||||||||||
Futures Contracts^ | $ | — | $ | — | $ | (46,059 | ) | $ | (46,059 | ) | ||||||
|
|
|
|
|
|
|
| |||||||||
Total Value | $ | — | $ | — | $ | (46,059 | ) | $ | (46,059 | ) | ||||||
|
|
|
|
|
|
|
| |||||||||
Realized Gain (Loss)# | ||||||||||||||||
Futures Contracts | $ | — | $ | — | $ | (1,463,126 | ) | $ | (1,463,126 | ) | ||||||
|
|
|
|
|
|
|
| |||||||||
Total Realized Gain (Loss) | $ | — | $ | — | $ | (1,463,126 | ) | $ | (1,463,126 | ) | ||||||
|
|
|
|
|
|
|
| |||||||||
Change in Unrealized Appreciation (Depreciation)## | ||||||||||||||||
Futures Contracts | $ | — | $ | — | $ | 479,018 | $ | 479,018 | ||||||||
|
|
|
|
|
|
|
| |||||||||
Total Change in Appreciation (Depreciation) | $ | — | $ | — | $ | 479,018 | $ | 479,018 | ||||||||
|
|
|
|
|
|
|
| |||||||||
Average Number of Contracts, Notional Amounts or Shares+ | ||||||||||||||||
Futures Short Contracts | — | — | (776 | ) | (776 | ) | ||||||||||
|
|
|
|
|
|
|
| |||||||||
141
Table of Contents
NOTES TO FINANCIAL STATEMENTS (continued)
RIDGEWORTH FUNDS March 31, 2016
| Credit Risk | Foreign Exchange Risk | Interest Rate Risk | Total | |||||||||||||
| Seix Ultra-Short Bond Fund | ||||||||||||||||
Liability Derivatives | ||||||||||||||||
Futures Contracts^ | $ | — | $ | — | $ | (8,369 | ) | $ | (8,369 | ) | ||||||
|
|
|
|
|
|
|
| |||||||||
Total Value | $ | — | $ | — | $ | (8,369 | ) | $ | (8,369 | ) | ||||||
|
|
|
|
|
|
|
| |||||||||
Realized Gain (Loss)# | ||||||||||||||||
Futures Contracts | $ | — | $ | — | $ | (220,838 | ) | $ | (220,838 | ) | ||||||
|
|
|
|
|
|
|
| |||||||||
Total Realized Gain (Loss) | $ | — | $ | — | $ | (220,838 | ) | $ | (220,838 | ) | ||||||
|
|
|
|
|
|
|
| |||||||||
Change in Unrealized Appreciation (Depreciation)## | ||||||||||||||||
Futures Contracts | $ | — | $ | — | $ | 37,451 | $ | 37,451 | ||||||||
|
|
|
|
|
|
|
| |||||||||
Total Change in Appreciation (Depreciation) | $ | — | $ | — | $ | 37,451 | $ | 37,451 | ||||||||
|
|
|
|
|
|
|
| |||||||||
Average Number of Contracts, Notional Amounts or Shares+ | ||||||||||||||||
Futures Short Contracts | — | — | (125 | ) | (125 | ) | ||||||||||
|
|
|
|
|
|
|
| |||||||||
| * | Statements of Assets and Liabilities location: Appreciated Swap Contracts, at Value, Unrealized Appreciation on Forward Foreign Currency Contracts, as applicable. Futures Contracts value represents cumulative unrealized appreciation. Only the current day’s variation margin on futures contracts is reported within the Statement of Assets and Liabilities as receivable or payable for variation margin, as applicable. |
| ^ | Statements of Assets and Liabilities location: Depreciated Swap Contracts, at Value, Unrealized Depreciation on Forward Foreign Currency Contracts, as applicable. Futures Contracts value represents cumulative unrealized depreciation. Only the current day’s variation margin on futures contracts is reported within the Statement of Assets and Liabilities as receivable or payable for variation margin, as applicable. |
| # | Statements of Operations location: Net Realized Gain (Loss) from: Futures Contracts, Swap Contracts, or Forward Foreign Currency Contracts, as applicable. |
| ## | Statements of Operations location: Net Change in Unrealized Appreciation (Depreciation) on: Futures Contracts, Swap Contracts, or Forward Foreign Currency Contracts, as applicable. |
| + | Amount(s) disclosed represent the average number of contracts for futures contracts, notional amounts for forward foreign currency contracts and swap contracts, which are indicative of volume of this derivative type, for the months that the Fund held such derivatives during the fiscal year ended March 31, 2016. |
The following table summarizes any OTC derivatives at March 31, 2016 that are subject to an enforceable master netting agreement or similar agreement and net of the related collateral received by the Funds.
| Gross Amounts of Assets/Liabilities Presented in the Statement of Assets and Liabilities(a) | Financial Instruments and Derivatives Available for Offset | Collateral (Received)/Pledged(b) | Net Amount of Derivative Assets/Liabilities | |||||||||||||
| Seix Total Return Bond Fund | ||||||||||||||||
Assets Counterparty | ||||||||||||||||
JPMorgan | $ | 3,646,060 | $ | — | $ | — | $ | 3,646,060 | ||||||||
|
|
|
|
|
|
|
| |||||||||
| $ | 3,646,060 | $ | — | $ | — | $ | 3,646,060 | |||||||||
|
|
|
|
|
|
|
| |||||||||
Liabilities Counterparty | ||||||||||||||||
JPMorgan | $ | 4,445,535 | $ | — | $ | (542,212 | ) | $ | 3,903,323 | |||||||
|
|
|
|
|
|
|
| |||||||||
| $ | 4,445,535 | $ | — | $ | (542,212 | ) | $ | 3,903,323 | ||||||||
|
|
|
|
|
|
|
| |||||||||
| (a) | Absent an event of default or early termination, OTC derivative assets and liabilities are presented gross and not offset in the Statement of Asset and Liabilities. |
| (b) | The amount presented here may be less than the total amount of collateral received/pledged, as the net amount of the derivative assets and liabilities for a counterparty cannot be less than $0. |
(k) Securities Lending — Each Fund may lend portfolio securities to brokers, dealers and other financial organizations that meet capital and other credit requirements or other criteria established by the Board. These loans may not exceed either (i) 50% of the sum of the market value of all securities of the Fund and the market value of securities purchased with cash collateral or (ii) 33.33% of the total market value of all securities of the Fund. No Fund will lend portfolio securities to its investment adviser, subadviser, or its affiliates unless it has applied for and received specific authority to do so from the Securities and Exchange Commission. Loans of
142
Table of Contents
NOTES TO FINANCIAL STATEMENTS (continued)
RIDGEWORTH FUNDS March 31, 2016
portfolio securities are required to be fully collateralized by cash, letters of credit or U.S. government securities. The initial value of the collateral must be at least 102% of the market value of the securities loaned, if the securities loaned are U.S. securities (105% for non-U.S. securities); and maintained in an amount equal to at least 100% (103% for non-U.S. securities) thereafter. However, due to market fluctuations during the day, the value of securities loaned on a particular day may exceed the value of collateral. On each business day, the amount of collateral is adjusted based on the prior day’s market fluctuations and the current day’s lending activity. Income from lending activity is determined by the amount of interest earned on collateral, less any amounts payable to the borrowers of the securities and the lending agent. Lending securities involves certain risks; including the risk that a Fund may be delayed or prevented from recovering the collateral if the borrower fails to return the securities. A fee will be obtained from the borrower if letters of credit or U.S. government securities are used as collateral.
The Funds, in accordance with guidance presented, have adopted FASB Accounting Standards Update (‘‘ASU 2014-11”), Balance Sheet (Topic) 860: Repurchase-to-Maturity Transactions, Repurchase Financings, and Disclosures. ASU 2014-11 is intended to provide increased transparency about the types of collateral pledged in repurchase agreements and other similar transactions that are accounted for as secured borrowing.
For Seix Core Bond Fund, Seix Corporate Bond Fund, Seix High Income Fund, Seix High Yield Fund and Seix Total Return Bond Fund the value of the security loan obligation is classified as follows as of March 31, 2016:
Seix Core Bond Fund
| Remaining Contractual Maturity of the Agreements As of March 31, 2016 | ||||||||||||||||||||
| Overnight and Continuous | <30 days | Between 30 & 90 days | >90 days | Total | ||||||||||||||||
Securities Lending Transactions | ||||||||||||||||||||
Corporate Bonds | $ | 1,234,668 | $ | — | $ | — | $ | — | $ | 1,234,668 | ||||||||||
U.S. Treasury Obligations | 11,557,135 | — | — | — | 11,557,135 | |||||||||||||||
|
|
|
|
|
|
|
|
|
| |||||||||||
Total | $ | 12,791,803 | $ | — | $ | — | $ | — | $ | 12,791,803 | ||||||||||
|
|
|
|
|
|
|
|
|
| |||||||||||
Total Borrowings | $ | 12,791,803 | $ | — | $ | — | $ | — | $ | 12,791,803 | ||||||||||
|
|
|
|
|
|
|
|
|
| |||||||||||
Gross amount of recognized liabilities for securities lending transactions |
| $ | 12,791,803 | |||||||||||||||||
|
| |||||||||||||||||||
| Seix Corporate Bond Fund | ||||||||||||||||||||
| Remaining Contractual Maturity of the Agreements As of March 31, 2016 | ||||||||||||||||||||
| Overnight and Continuous | <30 days | Between 30 & 90 days | >90 days | Total | ||||||||||||||||
Securities Lending Transactions | ||||||||||||||||||||
Corporate Bonds | $ | 471,458 | $ | — | $ | — | $ | — | $ | 471,458 | ||||||||||
|
|
|
|
|
|
|
|
|
| |||||||||||
Total Borrowings | $ | 471,458 | $ | — | $ | — | $ | — | $ | 471,458 | ||||||||||
|
|
|
|
|
|
|
|
|
| |||||||||||
Gross amount of recognized liabilities for securities lending transactions |
| $ | 471,458 | |||||||||||||||||
|
| |||||||||||||||||||
| Seix High Income Fund | ||||||||||||||||||||
| Remaining Contractual Maturity of the Agreements As of March 31, 2016 | ||||||||||||||||||||
| Overnight and Continuous | <30 days | Between 30 & 90 days | >90 days | Total | ||||||||||||||||
Securities Lending Transactions | ||||||||||||||||||||
Common Stocks | $ | 1,643,728 | $ | — | $ | — | $ | — | $ | 1,643,728 | ||||||||||
Corporate Bonds | 60,228,088 | — | — | — | 60,228,088 | |||||||||||||||
|
|
|
|
|
|
|
|
|
| |||||||||||
Total | $ | 61,871,816 | $ | — | $ | — | $ | — | $ | 61,871,816 | ||||||||||
|
|
|
|
|
|
|
|
|
| |||||||||||
Total Borrowings | $ | 61,871,816 | $ | — | $ | — | $ | — | $ | 61,871,816 | ||||||||||
|
|
|
|
|
|
|
|
|
| |||||||||||
Gross amount of recognized liabilities for securities lending transactions |
| $ | 61,871,816 | |||||||||||||||||
|
| |||||||||||||||||||
143
Table of Contents
NOTES TO FINANCIAL STATEMENTS (continued)
RIDGEWORTH FUNDS March 31, 2016
| Seix High Yield Fund | ||||||||||||||||||||
| Remaining Contractual Maturity of the Agreements As of March 31, 2016 | ||||||||||||||||||||
| Overnight and Continuous | <30 days | Between 30 & 90 days | >90 days | Total | ||||||||||||||||
Securities Lending Transactions | ||||||||||||||||||||
Common Stocks | $ | 964,231 | $ | — | $ | — | $ | — | $ | 964,231 | ||||||||||
Corporate Bonds | 45,733,334 | — | — | — | 45,733,334 | |||||||||||||||
|
|
|
|
|
|
|
|
|
| |||||||||||
Total | $ | 46,697,565 | $ | — | $ | — | $ | — | $ | 46,697,565 | ||||||||||
|
|
|
|
|
|
|
|
|
| |||||||||||
Total Borrowings | $ | 46,697,565 | $ | — | $ | — | $ | — | $ | 46,697,565 | ||||||||||
|
|
|
|
|
|
|
|
|
| |||||||||||
Gross amount of recognized liabilities for securities lending transactions |
| $ | 46,697,565 | |||||||||||||||||
|
| |||||||||||||||||||
| Seix Total Return Fund | ||||||||||||||||||||
| Remaining Contractual Maturity of the Agreements As of March 31, 2016 | ||||||||||||||||||||
| Overnight and Continuous | <30 days | Between 30 & 90 days | >90 days | Total | ||||||||||||||||
Securities Lending Transactions | ||||||||||||||||||||
Corporate Bonds | $ | 4,856,675 | $ | — | $ | — | $ | — | $ | 4,856,675 | ||||||||||
Foreign Government Bonds | 2,145,247 | — | — | — | 2,145,247 | |||||||||||||||
U.S. Treasury Obligations | 96,420,536 | — | — | — | 96,420,536 | |||||||||||||||
|
|
|
|
|
|
|
|
|
| |||||||||||
Total | $ | 103,422,458 | $ | — | $ | — | $ | — | $ | 103,422,458 | ||||||||||
|
|
|
|
|
|
|
|
|
| |||||||||||
Total Borrowings | $ | 103,422,458 | $ | — | $ | — | $ | — | $ | 103,422,458 | ||||||||||
|
|
|
|
|
|
|
|
|
| |||||||||||
Gross amount of recognized liabilities for securities lending transactions |
| $ | 103,422,458 | |||||||||||||||||
|
| |||||||||||||||||||
(l) When-Issued Securities and Forward Commitments — Delivery and payment for securities that have been purchased by a Fund on a forward commitment or when-issued basis can take place up to a month or more after the transaction date at a fixed price. During this period, such securities are subject to market fluctuations. The purchase of securities on a when-issued or forward commitment basis may increase the volatility of a Fund’s NAV if the Fund makes such investments while remaining substantially fully invested. A Fund records when-issued securities on trade date and will segregate or earmark liquid assets in an amount at least equal in value to its commitments to purchase when-issued and forward commitment securities or engage in other appropriate measures to “cover” its obligation. When-issued securities and the segregated liquid assets associated with such investments are presented within the Funds’ Schedules of Portfolio Investments.
(m) Bank Loans — Certain Funds may invest in first and second lien senior floating-rate loans (“bank loans”). These loans are made by banks and other large financial institutions to various companies and are senior in the borrowing companies’ capital structure. Coupon rates are floating, not fixed, and are tied to a benchmark lending rate. A Fund records an investment when the borrower withdraws money and records the interest as earned. Some types of senior loans in which these Funds may invest require that an open loan for a specific amount be continually offered to a borrower. These types of senior loans, commonly referred to as revolvers, contractually obligate the lender (and therefore those with an interest in the loan) to fund the loan at the borrower’s discretion. A Fund will maintain, on a daily basis, high quality, liquid assets in an amount at least equal in value to its contractual obligation to fulfill the revolving senior loan. Therefore, a Fund must have funds sufficient to cover its contractual obligation. In addition, bank loans generally are subject to extended settlement periods, which may impair the Fund’s ability to sell or realize the full value of its loans in the event of a need to liquidate such loans. As of March 31, 2016, the Funds had no unfunded loan commitments.
(n) Restricted Securities — Certain Funds’ investments are restricted as to resale. As of March 31, 2016, all of these restricted securities have been deemed liquid by the Funds’ investment adviser based upon procedures approved by the Board, unless stated otherwise on the Funds’ Schedules of Portfolio Investments.
(o) Credit and Market Risk — Certain Funds’ investments in securities that are collateralized by residential real estate mortgages are subject to certain credit and liquidity risks. When market conditions result in an increase in default rates of the underlying mortgages and the foreclosure values of underlying real estate properties are
144
Table of Contents
NOTES TO FINANCIAL STATEMENTS (continued)
RIDGEWORTH FUNDS March 31, 2016
materially below the outstanding amount of these underlying mortgages, collection of the full amount of accrued interest and principal on these investments may be doubtful. Such market conditions may significantly impair the value and liquidity of these investments and may result in a lack of correlation between their credit ratings and values.
(p) Foreign Investment Risks — Certain Funds’ investments in foreign securities may involve risks not present in domestic investments. Since securities may be denominated in foreign currencies, may require settlement in foreign currencies or pay interest or dividends in foreign currencies, changes in the relationship of these foreign currencies to the U.S. dollar can significantly affect the value of the investments and earnings of the Fund. Foreign investments may also subject the Fund to foreign government exchange restrictions, expropriation, taxation or other political, social or economic developments, all of which affect the market and/or credit risk of the investments.
For securities subject to foreign withholding tax upon disposition, liabilities are recorded on the Statement of Assets and Liabilities for the estimated tax withholding based on the securities’ current market value. Upon disposition, realized gains or losses on such securities are recorded net of foreign withholding tax.
(q) Counterparty Risk and Credit-Risk-Related Contingent Features of Derivative Instruments — Certain Funds may invest in certain securities or engage in other transactions where the Funds are exposed to counterparty credit risk in addition to broader market risks. The Funds may invest in securities of issuers, which may also be considered counterparties as trading partners in other transactions. This may increase the risk of loss in the event of default or bankruptcy by the counterparty or if the counterparty otherwise fails to meet its contractual obligations. The Funds’ Investment Adviser attempts to mitigate counterparty risk by (i) periodically assessing the creditworthiness of its trading partners, (ii) monitoring and/or limiting the amount of its net exposure to each individual counterparty based on its assessment and (iii) requiring collateral from the counterparty for certain transactions. Market events and changes in overall economic conditions may impact the assessment of such counterparty risk by the investment manager. In addition, declines in the values of underlying collateral received may expose the Funds to increased risk of loss.
(r) Other Risks — Certain Funds invest in high yield corporate, government, and other debt instruments of U.S. and non-U.S. issuers. High yield securities involve greater risk of default or downgrade and are more volatile than investment grade securities. A Fund’s concentration of investments in securities of issuers located in a specific region or state, subjects that Fund to the economic and government policies of the region or state, and may increase risk versus that of a fund whose investments are more diversified. Please refer to each Fund’s prospectus for additional risks that may be associated with the Funds.
At March 31, 2016, one shareholder owned 100% of Seix Limited Duration Fund. Transaction activities of these shareholders may have a material effect on the respective Fund. Redemptions of these shareholders’ holdings in the Fund may impact the Fund’s liquidity and net asset value. Such redemptions may force the Fund to sell securities.
(s) Federal and Other Taxes — It is the Funds’ policy to comply with the federal income and excise tax requirements of the Internal Revenue Code of 1986 (the “Code”), as amended, applicable to regulated investment companies. Accordingly, the Funds intend to distribute taxable income and net realized gains, if any, to shareholders in accordance with timing requirements imposed by the Code. Therefore, no federal or state income tax provision is required in the Funds’ financial statements.
Management has analyzed the Funds’ tax positions taken on income tax returns for all open tax years and has concluded that as of March 31, 2016, no provision for income tax is required in the Funds’ financial statements. The Funds’ federal and state income and federal excise tax returns for tax years for which the applicable statutes of limitations have not expired are subject to examination by the Internal Revenue Service and state departments of revenue. As of March 31, 2016, open tax years include the tax years of March 31, 2013 through 2016.
Under the applicable foreign tax laws, a withholding tax may be imposed on interest, dividends and capital gains at various rates. The Funds will accrue such taxes and recoveries as applicable, based upon their current interpretation of tax rules and regulations that exist in the markets in which they invest.
(t) Reclassification — GAAP requires that certain components of net assets be reclassified to reflect permanent differences between financial and tax reporting. These reclassifications have no effect on net assets or NAV per share.
145
Table of Contents
NOTES TO FINANCIAL STATEMENTS (continued)
RIDGEWORTH FUNDS March 31, 2016
(u) Line of Credit —The Funds entered into a committed unsecured revolving line of credit agreement (“LOC”) with a syndicate of banks which includes State Street Bank and Trust (“State Street Bank”) and Royal Bank of Canada (“RBC”), for an aggregate amount of $200,000,000. The proceeds may be used only to (1) temporarily finance the purchase and sale of securities; or (2) finance the redemption of shares of the Funds. The Funds will pay a commitment fee on a pro rata basis to State Street Bank and RBC, in the amount of 0.15% per annum on the daily unused portion of the LOC. Borrowings under the LOC will accrue interest at the higher of (a) the Federal Funds Rate, or (b) the One-month LIBOR Rate, plus 1.25% per annum. Generally, repayments must be made within 60 days of the borrowings. Commitment fees and interest expense paid to State Street Bank and RBC pursuant to this agreement are reflected on the Statements of Operations as a component of Other Fees. Prior to the September 23, 2015 syndicated agreement, a credit agreement with State Street Bank permitted an aggregate amount of $250,000,000 under similar terms and interest rates as described above. As of March 31, 2016, the Seix High Yield Fund had outstanding borrowings under the LOC.
The following Funds had an outstanding loan during the year. The borrowings were valued at cost, which approximates fair value.
Fund | Interest Incurred on Borrowing | Average Dollar Amount of Borrowing | Weighted Average Interest Rate on Borrowing | Days Loan was Open | ||||||||||||
Seix Floating Rate High Income Fund | $6,094 | $14,607,655 | 1.69 | % | 9 | |||||||||||
Seix High Yield Fund | 49 | 1,044,906 | 1.72 | 1 | ||||||||||||
Seix Short-Term Municipal Bond Fund | 49 | 1,047,982 | 1.70 | 1 | ||||||||||||
Seix Virginia Intermediate Municipal Bond Fund | 32 | 794,813 | 1.47 | 1 | ||||||||||||
| 3. | Investment Adviser and Other Service Providers |
Investment Adviser — RidgeWorth Investments (“Investment Adviser”) serves as the investment adviser to the Funds. The Trust and the Investment Adviser have entered into an investment advisory agreement (“Advisory Agreement”). The Investment Adviser is a money-management holding company with multiple style-focused investment boutiques. The subadviser for the Funds is Seix Investment Advisors LLC (“Subadviser”). Seix is a wholly-owned subsidiary of the Investment Adviser. The Investment Adviser pays the Subadviser out of the investment advisory fees it receives from the Funds.
Under the terms of the Advisory Agreement, the Funds are charged annual advisory fees, which are computed daily and paid monthly based upon average daily net assets. Breakpoints are used in computing the overall annual advisory fee. The maximum annual advisory fee is charged on average daily net assets of each Fund up to $500 million. A discount of 5% applies on the next $500 million, a discount of 10% applies on the next $4 billion and a discount of 15% applies on amounts over $5 billion. Fee rates for the fiscal year ended March 31, 2016 were as follows:
Fund | Maximum Advisory Fee | Discounted Annual Advisory Fee | Advisory Fees Waived | Net Annual fees Paid* | ||||||||||||
Seix Core Bond Fund | 0.25 | % | 0.25 | % | — | % | 0.25 | % | ||||||||
Seix Corporate Bond Fund | 0.40 | 0.40 | (0.07 | ) | 0.33 | |||||||||||
Seix Floating Rate High Income Fund | 0.45 | 0.41 | — | 0.41 | ||||||||||||
Seix Georgia Tax-Exempt Bond Fund | 0.50 | 0.50 | — | 0.50 | ||||||||||||
Seix High Grade Municipal Bond Fund | 0.50 | 0.50 | — | 0.50 | ||||||||||||
Seix High Income Fund | 0.55 | 0.54 | — | 0.54 | ||||||||||||
Seix High Yield Fund | 0.45 | 0.44 | — | 0.44 | ||||||||||||
Seix Investment Grade Tax-Exempt Bond Fund | 0.50 | 0.49 | — | 0.49 | ||||||||||||
Seix Limited Duration Fund | 0.10 | 0.10 | — | 0.10 | ||||||||||||
Seix North Carolina Tax-Exempt Bond Fund | 0.50 | 0.50 | — | 0.50 | ||||||||||||
Seix Short-Term Bond Fund | 0.40 | 0.40 | — | 0.40 | ||||||||||||
Seix Short-Term Municipal Bond Fund | 0.35 | 0.35 | (0.04 | ) | 0.31 | |||||||||||
Seix Total Return Bond Fund | 0.25 | 0.24 | — | 0.24 | ||||||||||||
Seix U.S. Government Securities Ultra-Short Bond Fund | 0.20 | 0.19 | — | 0.19 | ||||||||||||
Seix U.S. Mortgage Fund** | 0.40 | 0.40 | (0.03 | ) | 0.37 | |||||||||||
146
Table of Contents
NOTES TO FINANCIAL STATEMENTS (continued)
RIDGEWORTH FUNDS March 31, 2016
Fund | Maximum Advisory Fee | Discounted Annual Advisory Fee | Advisory Fees Waived | Net Annual fees Paid* | ||||||||||||
Seix Ultra-Short Bond Fund | 0.22 | % | 0.22 | % | — | % | 0.22 | % | ||||||||
Seix Virginia Intermediate Municipal Bond Fund | 0.50 | 0.50 | — | 0.50 | ||||||||||||
| * | Aggregate annual fees paid to the Investment Adviser, who pays the Subadviser a portion of the fees for its services to the Funds. |
| ** | Effective September 1, 2015, the Seix U.S. Mortgage Fund’s investment advisory fee was reduced from 0.50% to 0.40%. The Maximum and Discounted Annual Advisory Fee reflects the reduced annual advisory fee for the period September 1, 2015 through March 31, 2016. For the period ended August 31, 2015, the Maximum and Discounted Annual Advisory Fee would have been 0.42%, respectively. |
Amounts designated as “—” are 0%.
The Investment Adviser and the Subadviser have contractually agreed, until at least August 1, 2016, to waive fees and/or reimburse expenses for each of the following Funds to the extent necessary to maintain each Fund’s total annual fund operating expenses (excluding, as applicable, taxes, brokerage commissions, substitute dividend expenses on securities sold short, interest expense, extraordinary expenses and indirect expenses attributable to the Fund’s investment in other funds), expressed as a percentage of average daily net assets, as noted below:
| Contractual Expense Limitations August 1, 2015 to March 31, 2016* | ||||||||||||||||||||
Fund | I Shares | A Shares | C Shares | R Shares | IS Shares | |||||||||||||||
Seix Core Bond Fund** | 0.50 | % | 0.75 | % | N/A | % | 1.05 | % | 0.40 | % | ||||||||||
Seix Corporate Bond Fund | 0.70 | 0.95 | 1.65 | N/A | N/A | |||||||||||||||
Seix Floating Rate High Income Fund | 0.70 | 1.00 | 1.60 | N/A | 0.60 | |||||||||||||||
Seix Georgia Tax-Exempt Bond Fund | 0.65 | 0.80 | N/A | N/A | N/A | |||||||||||||||
Seix High Grade Municipal Bond Fund | 0.65 | 0.80 | N/A | N/A | N/A | |||||||||||||||
Seix High Income Fund | 0.80 | 1.05 | N/A | 1.50 | 0.70 | |||||||||||||||
Seix High Yield Fund | 0.65 | 0.90 | N/A | 1.30 | N/A | |||||||||||||||
Seix Investment Grade Tax-Exempt Bond Fund | 0.65 | 0.80 | N/A | N/A | N/A | |||||||||||||||
Seix Limited Duration Fund | 0.35 | N/A | N/A | N/A | N/A | |||||||||||||||
Seix North Carolina Tax-Exempt Bond Fund | 0.65 | 0.80 | N/A | N/A | N/A | |||||||||||||||
Seix Short-Term Bond Fund | 0.60 | 0.80 | 1.60 | N/A | N/A | |||||||||||||||
Seix Short-Term Municipal Bond Fund** | 0.48 | 0.68 | N/A | N/A | N/A | |||||||||||||||
Seix Total Return Bond Fund** | 0.50 | 0.75 | N/A | 1.10 | 0.40 | |||||||||||||||
Seix U.S. Government Securities Ultra-Short Bond Fund | 0.46 | N/A | N/A | N/A | N/A | |||||||||||||||
Seix U.S. Mortgage Fund | 0.70 | 0.90 | 1.65 | N/A | N/A | |||||||||||||||
Seix Ultra-Short Bond Fund | 0.46 | N/A | N/A | N/A | N/A | |||||||||||||||
Seix Virginia Intermediate Municipal Bond Fund | 0.65 | 0.80 | N/A | N/A | N/A | |||||||||||||||
| * | These contractual Expense Limitations were in effect for the entire fiscal year except for the Funds listed below. |
| ** | For the period April 1, 2015 to July 31, 2015, the Contractual Expense Limitations were as follows: |
Fund | I Shares | A Shares | C Shares | R Shares | IS Shares | |||||||||||||||
Seix Core Bond Fund | 0.50 | % | 0.75 | % | N/A | % | 1.05 | % | N/A | % | ||||||||||
Seix Short-Term Municipal Bond Fund | 0.55 | 0.70 | N/A | N/A | N/A | |||||||||||||||
Seix Total Return Bond Fund | 0.50 | 0.75 | N/A | 1.05 | 0.40 | |||||||||||||||
Under the Expense Limitation Agreement, the Investment Adviser may retain the difference between the Contractual Expense Limitation identified above and the actual total expenses to recapture any of its prior contractual waivers or reimbursements at a date not to exceed three years from the date of such waivers or reimbursements. Such repayments shall be made monthly, but only to the extent that such repayments would not cause the annualized total expense ratio to exceed, if lower, the contractual expense limitation in place at the time of the waiver or reimbursement.
Under certain circumstances, the Investment Advisor may choose to voluntarily waive fees. In the event that the Investment Advisor voluntarily waives any fees, these waived fees are not subject to recoupment by the Investment Advisor. The Investment Adviser has voluntarily undertaken to reduce and/or subsidize certain expenses of the Seix Limited Duration Fund, Seix Short-Term Bond Fund and Seix U.S. Mortgage Fund to the extent necessary to maintain a minimum annualized yield of 0.0% for each of the Fund’s share classes. This voluntary expense reduction and/or expense subsidy may be modified or discontinued at any time without prior notice and is not subject to recoupment. There can be no assurance that this fee reduction will be sufficient to avoid any loss. During the fiscal year ended March 31, 2016, Seix Limited Duration Fund, Seix Short-Term Bond Fund, Seix Short-Term Municipal Bond Fund and Seix U.S. Mortgage Fund had voluntary reimbursements in the amount of $34, $4,722, $24 and $7, respectively.
147
Table of Contents
NOTES TO FINANCIAL STATEMENTS (continued)
RIDGEWORTH FUNDS March 31, 2016
During the fiscal year ended March 31, 2016, the Investment Adviser did not recapture any of its prior contractual waivers or reimbursements. As of March 31, 2016, the cumulative potential recoupments recoverable pursuant to this agreement are as follows:
| Expires | ||||||||||||
| 2017 | 2018 | 2019 | ||||||||||
Seix Core Bond Fund | $42 | $3,506 | $— | |||||||||
Seix Corporate Bond Fund | 5,345 | 11,677 | 30,054 | |||||||||
Seix Floating Rate High Income Fund | 122 | — | — | |||||||||
Seix Georgia Tax-Exempt Bond Fund | — | — | 32,454 | |||||||||
Seix High Grade Municipal Bond Fund | 18,165 | 26,689 | 43,026 | |||||||||
Seix High Income Fund | 26,432 | — | — | |||||||||
Seix Investment Grade Tax-Exempt Bond Fund | 32,500 | 189,341 | 230,521 | |||||||||
Seix Limited Duration Fund | 8,029 | 8,039 | 7,767 | |||||||||
Seix North Carolina Tax-Exempt Bond Fund | — | 14,868 | 27,322 | |||||||||
Seix Short-Term Bond Fund | 1,467 | 31,360 | 43,104 | |||||||||
Seix Short-Term Municipal Bond Fund | 35,071 | 28,407 | 46,670 | |||||||||
Seix Total Return Bond Fund | 30,144 | 5,518 | 2,074 | |||||||||
Seix U.S. Mortgage Fund | 56,990 | 58,174 | 44,867 | |||||||||
Seix Virginia Intermediate Municipal Bond Fund | — | — | 28,628 | |||||||||
Amounts designated as “—” are $0.
Fund Accounting, Custody, Administration, and Transfer Agency — State Street Bank and Trust Company (“State Street Bank”) serves as the fund accounting agent and custodian for the Trust pursuant to a Master Custodian Agreement. The custodian is responsible for the safekeeping of the assets of the Funds and the fund accounting agent is responsible for calculating the Funds’ NAVs. State Street Bank, as the Funds’ custodian and fund accounting agent, is paid on the basis of net assets and transaction costs of the Funds. State Street Bank also serves as the administrator for the Trust pursuant to an administration agreement. State Street Bank, as the Funds’ administrator, is paid on the basis of net assets of the Funds which are allocated among the series of the Trust, on the basis of relative net assets.
Boston Financial Data Services, Inc. (“BFDS”) serves as the transfer agent to the Trust pursuant to a Transfer Agency and Service Agreement. BFDS is paid on the basis of net assets, per account fees and certain transaction costs.
Custodian Credits — The Funds have an agreement with their custodian under which custody fees may be reduced by balance credits. These credits, if any, are shown as a reduction of custody expenses on the Statements of Operations.
Distribution — The Trust and RidgeWorth Distributors LLC (the “Distributor”) are parties to a Distribution Agreement.
In addition, with respect to the A Shares, C Shares and R Shares, the Distributor receives amounts, pursuant to a Distribution and Service Plan, based upon average daily net assets of each respective class, which are computed daily and paid monthly. For the fiscal year ended March 31, 2016, the Distributor did not retain any of the front end sales charges assessed on the sale of Class A shares. For the fiscal year ended March 31, 2016, the Distributor did not retain any commissions from contingent deferred sales charges assessed on redemptions of Class C Shares. These current board approved fees, expressed as a percentage of average daily net assets, for the fiscal year ended March 31, 2016, were as follows:
Fund | A Share Distribution and Service Fee | C Share Distribution and Service Fee | R Share Distribution and Service Fee | IS Share Distribution and Service Fee | ||||||||||||
Seix Core Bond Fund | 0.25 | % | N/A | % | 0.50 | % | N/A | % | ||||||||
Seix Corporate Bond Fund | 0.30 | 1.00 | N/A | N/A | ||||||||||||
Seix Floating Rate High Income Fund | 0.30 | 1.00 | N/A | N/A | ||||||||||||
148
Table of Contents
NOTES TO FINANCIAL STATEMENTS (continued)
RIDGEWORTH FUNDS March 31, 2016
Fund | A Share Distribution and Service Fee | C Share Distribution and Service Fee | R Share Distribution and Service Fee | IS Share Distribution and Service Fee | ||||||||||||
Seix Georgia Tax-Exempt Bond Fund | 0.15 | % | N/A | % | N/A | % | N/A | % | ||||||||
Seix High Grade Municipal Bond Fund | 0.15 | N/A | N/A | N/A | ||||||||||||
Seix High Income Fund | 0.30 | N/A | 0.50 | N/A | ||||||||||||
Seix High Yield Fund | 0.25 | N/A | 0.50 | N/A | ||||||||||||
Seix Investment Grade Tax-Exempt Bond Fund | 0.30 | N/A | N/A | N/A | ||||||||||||
Seix North Carolina Tax-Exempt Bond Fund | 0.15 | N/A | N/A | N/A | ||||||||||||
Seix Short-Term Bond Fund | 0.20 | 1.00 | N/A | N/A | ||||||||||||
Seix Short-Term Municipal Bond Fund | 0.15 | N/A | N/A | N/A | ||||||||||||
Seix Total Return Bond Fund | 0.25 | N/A | 0.50 | N/A | ||||||||||||
Seix U.S. Mortgage Fund | 0.20 | 1.00 | N/A | N/A | ||||||||||||
Seix Virginia Intermediate Municipal Bond Fund | 0.15 | N/A | N/A | N/A | ||||||||||||
Shareholder Servicing Fees — The Funds have adopted shareholder services fees for the I Shares and A Shares of such Funds. Each of these Funds (or class thereof, as the case may be) may pay a services fee to financial institutions that provide certain services to the Funds. The services under each of these Plans may include, among others, providing general shareholder liaison services (including responding to shareholder inquiries) providing information on shareholder investments, and establishing and maintaining shareholder accounts and records. The Funds may pay a fee under the Plan up to an annual rate of 0.20% of average daily net assets of a Fund’s I Shares or A Shares. The Seix Core Bond Fund, Seix High Income Fund, Seix High Yield Fund and Seix Total Return Bond Fund have adopted a shareholder services fee for the R Shares. Each Fund pays specified benefit plans or other financial service firms for shareholder support services they provide, at an annual rate of up to 0.25% of the average daily net assets of R Shares.
Compliance & Fund Services Fees — The Investment Adviser provides compliance and certain administrative services to the Trust to ensure compliance with applicable laws and regulations. For the fiscal year ended March 31, 2016, the Investment Adviser was paid $1,483,680 for these services. Foreside Fund Officer Services, LLC (‘‘FFOS’’) (formerly Foreside Compliance Services, LLC), an affiliate of the Distributor, provides an Anti-Money Laundering Officer/Identity Theft Prevention Officer (“AML Officer”) to the Trust. Effective October 2015, Foreside Management Services, LLC (“FMS”), an affiliate of the Distributor, provides Principal Financial Officer (“PFO”) support services to the Trust. Fees paid to FFOS and FMS pursuant to these agreements are reflected on the Statements of Operations as a component of the caption “Other Fees”.
Neither FFOS nor any of their officers or employees who serve as an officer of the Trust, have any role in determining the Funds’ investment policies or which securities are to be purchased or sold by the Trust or its Funds.
Certain officers of the Trust are also officers or employees of the Investment Adviser, FFOS and the administrator. Such officers receive no fees from the Trust for serving as officers of the Trust.
Each of the Trustees receives an annual retainer and an additional fee for each meeting attended, plus reimbursement for certain expenses incurred. Trustees receive an additional fee for committee service, paid on a per committee meeting basis. Information on the aggregate remuneration paid to the Trustees can be found on the Statements of Operations.
| 4. | Capital Stock Transactions |
Transactions in capital shares and dollars for the fiscal years ended March 31 were as follows:
| Shares Issued | Shares Issued- Merger | Shares Reinvested | Shares Redeemed | Shares Converted | Net Increase (Decrease) in Shares Outstanding | Proceeds from Shares Issued | Issued- Merger | Dividends Reinvested | Cost of Shares Redeemed | Shares Converted | Change in Net Assets from Capital Transactions | |||||||||||||||||||||||||||||||||||||
Seix Core Bond Fund |
| |||||||||||||||||||||||||||||||||||||||||||||||
I Shares | ||||||||||||||||||||||||||||||||||||||||||||||||
3/31/2016 | 3,773,694 | 18,121,184 | 514,563 | (16,264,183 | ) | — | 6,145,258 | $40,652,397 | $195,102,886 | $5,532,336 | $(175,119,070 | ) | $— | $66,168,549 | ||||||||||||||||||||||||||||||||||
3/31/2015 | 4,510,931 | — | 302,569 | (6,253,876 | ) | — | (1,440,376 | ) | 49,062,356 | — | 3,294,024 | (68,021,150 | ) | — | (15,664,770 | ) | ||||||||||||||||||||||||||||||||
149
Table of Contents
NOTES TO FINANCIAL STATEMENTS (continued)
RIDGEWORTH FUNDS March 31, 2016
| Shares Issued | Shares Issued- Merger | Shares Reinvested | Shares Redeemed | Shares Converted | Net Increase (Decrease) in Shares Outstanding | Proceeds from Shares Issued | Issued- Merger | Dividends Reinvested | Cost of Shares Redeemed | Shares Converted | Change in Net Assets from Capital Transactions | |||||||||||||||||||||||||||||||||||||
A Shares | ||||||||||||||||||||||||||||||||||||||||||||||||
3/31/2016 | 114,909 | 312,495 | 19,263 | (181,459 | ) | — | 265,208 | $1,234,908 | $3,363,629 | $207,022 | $(1,960,111 | ) | $— | $2,845,448 | ||||||||||||||||||||||||||||||||||
3/31/2015 | 54,092 | — | 13,538 | (321,519 | ) | — | (253,889 | ) | 589,429 | — | 147,238 | (3,486,043 | ) | — | (2,749,376 | ) | ||||||||||||||||||||||||||||||||
R Shares | ||||||||||||||||||||||||||||||||||||||||||||||||
3/31/2016 | 63,349 | 1,392 | 7,188 | (70,497 | ) | — | 1,432 | 681,606 | 14,994 | 77,357 | (760,012 | ) | — | 13,945 | ||||||||||||||||||||||||||||||||||
3/31/2015 | 17,918 | — | 5,424 | (93,708 | ) | — | (70,366 | ) | 194,681 | — | 59,073 | (1,018,551 | ) | — | (764,797 | ) | ||||||||||||||||||||||||||||||||
IS Shares* |
| |||||||||||||||||||||||||||||||||||||||||||||||
3/31/2016 | 2,309 | — | 30 | (277 | ) | — | 2,062 | 24,783 | — | 327 | (2,994 | ) | — | 22,116 | ||||||||||||||||||||||||||||||||||
Seix Corporate Bond Fund |
| |||||||||||||||||||||||||||||||||||||||||||||||
I Shares | ||||||||||||||||||||||||||||||||||||||||||||||||
3/31/2016 | 332,069 | — | 66,369 | (2,042,573 | ) | — | (1,644,135 | ) | 2,874,849 | — | 559,900 | (17,746,984 | ) | — | (14,312,235 | ) | ||||||||||||||||||||||||||||||||
3/31/2015 | 955,616 | — | 134,258 | (1,573,782 | ) | — | (483,908 | ) | 8,532,909 | — | 1,191,441 | (13,966,065 | ) | — | (4,241,715 | ) | ||||||||||||||||||||||||||||||||
A Shares | ||||||||||||||||||||||||||||||||||||||||||||||||
3/31/2016 | 40,688 | — | 2,578 | (74,224 | ) | — | (30,958 | ) | 345,153 | — | 21,778 | (637,354 | ) | — | (270,423 | ) | ||||||||||||||||||||||||||||||||
3/31/2015 | 90,712 | — | 3,551 | (93,103 | ) | — | 1,160 | 814,568 | — | 31,615 | (834,348 | ) | — | 11,835 | ||||||||||||||||||||||||||||||||||
C Shares | ||||||||||||||||||||||||||||||||||||||||||||||||
3/31/2016 | 39,199 | — | 42,617 | (161,946 | ) | — | (80,130 | ) | 328,481 | — | 355,742 | (1,369,368 | ) | — | (685,145 | ) | ||||||||||||||||||||||||||||||||
3/31/2015 | 4,778 | — | 41,097 | (188,550 | ) | — | (142,675 | ) | 42,519 | — | 363,642 | (1,679,489 | ) | — | (1,273,328 | ) | ||||||||||||||||||||||||||||||||
Seix Floating Rate High Income Fund |
| |||||||||||||||||||||||||||||||||||||||||||||||
I Shares | ||||||||||||||||||||||||||||||||||||||||||||||||
3/31/2016 | 170,340,033 | — | 20,764,128 | (508,778,380 | ) | — | (317,674,219 | ) | 1,471,672,628 | — | 178,035,065 | (4,367,322,310 | ) | — | (2,717,614,617 | ) | ||||||||||||||||||||||||||||||||
3/31/2015 | 250,862,178 | — | 25,936,211 | (583,258,962 | ) | — | (306,460,573 | ) | 2,241,961,673 | — | 231,690,008 | (5,212,104,240 | ) | — | (2,738,452,559 | ) | ||||||||||||||||||||||||||||||||
A Shares | ||||||||||||||||||||||||||||||||||||||||||||||||
3/31/2016 | 8,169,669 | — | 715,765 | (8,337,227 | ) | — | 548,207 | 70,528,471 | — | 6,117,753 | (71,544,260 | ) | — | 5,101,964 | ||||||||||||||||||||||||||||||||||
3/31/2015 | 5,311,892 | — | 789,523 | (12,877,326 | ) | — | (6,775,911 | ) | 47,521,598 | — | 7,051,575 | (114,351,918 | ) | — | (59,778,745 | ) | ||||||||||||||||||||||||||||||||
C Shares | ||||||||||||||||||||||||||||||||||||||||||||||||
3/31/2016 | 1,195,922 | — | 201,422 | (2,044,517 | ) | — | (647,173 | ) | 10,336,524 | — | 1,718,817 | (17,473,145 | ) | — | (5,417,804 | ) | ||||||||||||||||||||||||||||||||
3/31/2015 | 1,255,960 | — | 186,092 | (3,342,098 | ) | — | (1,900,046 | ) | 11,262,053 | — | 1,660,627 | (29,808,639 | ) | — | (16,885,959 | ) | ||||||||||||||||||||||||||||||||
IS Shares* |
| |||||||||||||||||||||||||||||||||||||||||||||||
3/31/2016 | 224,292,881 | — | 1,963,926 | (92,406,634 | ) | — | 133,850,173 | 1,966,663,031 | — | 16,665,384 | (778,962,744 | ) | — | 1,204,365,671 | ||||||||||||||||||||||||||||||||||
3/31/2015 | 1,578,189 | — | 4,668 | (157,646 | ) | — | 1,425,211 | 13,911,350 | — | 41,378 | (1,395,472 | ) | — | 12,557,256 | ||||||||||||||||||||||||||||||||||
Seix Georgia Tax-Exempt Bond Fund |
| |||||||||||||||||||||||||||||||||||||||||||||||
I Shares | ||||||||||||||||||||||||||||||||||||||||||||||||
3/31/2016 | 2,112,609 | — | 281,773 | (4,711,514 | ) | — | (2,317,132 | ) | 22,739,783 | — | 3,045,225 | (50,879,549 | ) | — | (25,094,541 | ) | ||||||||||||||||||||||||||||||||
3/31/2015 | 2,592,909 | — | 224,078 | (2,270,543 | ) | — | 546,444 | 27,818,184 | — | 2,418,136 | (24,363,603 | ) | — | 5,872,717 | ||||||||||||||||||||||||||||||||||
A Shares | ||||||||||||||||||||||||||||||||||||||||||||||||
3/31/2016 | 17,533 | — | 7,749 | (29,719 | ) | — | (4,437 | ) | 191,368 | — | 83,945 | (320,008 | ) | — | (44,695 | ) | ||||||||||||||||||||||||||||||||
3/31/2015 | 8,488 | — | 8,921 | (79,653 | ) | — | (62,244 | ) | 90,157 | — | 96,012 | (853,535 | ) | — | (667,366 | ) | ||||||||||||||||||||||||||||||||
Seix High Grade Municipal Bond Fund |
| |||||||||||||||||||||||||||||||||||||||||||||||
I Shares | ||||||||||||||||||||||||||||||||||||||||||||||||
3/31/2016 | 3,082,083 | — | 189,300 | (2,989,888 | ) | — | 281,495 | 37,610,574 | — | 2,310,363 | (36,571,732 | ) | — | 3,349,205 | ||||||||||||||||||||||||||||||||||
3/31/2015 | 4,745,372 | — | 159,946 | (1,137,834 | ) | — | 3,767,484 | 57,975,527 | — | 1,960,186 | (13,933,474 | ) | — | 46,002,239 | ||||||||||||||||||||||||||||||||||
A Shares | ||||||||||||||||||||||||||||||||||||||||||||||||
3/31/2016 | 191,190 | — | 30,996 | (432,490 | ) | — | (210,304 | ) | 2,332,202 | — | 378,352 | (5,267,431 | ) | — | (2,556,877 | ) | ||||||||||||||||||||||||||||||||
3/31/2015 | 1,054,618 | — | 37,938 | (506,285 | ) | — | 586,271 | 12,792,276 | — | 464,617 | (6,170,845 | ) | — | 7,086,048 | ||||||||||||||||||||||||||||||||||
Seix High Income Fund |
| |||||||||||||||||||||||||||||||||||||||||||||||
I Shares | ||||||||||||||||||||||||||||||||||||||||||||||||
3/31/2016 | 53,888,034 | — | 6,491,068 | (80,951,480 | ) | — | (20,572,378 | ) | 337,896,385 | — | 40,140,348 | (498,500,450 | ) | — | (120,463,717 | ) | ||||||||||||||||||||||||||||||||
3/31/2015 | 82,575,974 | — | 8,843,693 | (86,288,928 | ) | — | 5,130,739 | 579,568,804 | — | 60,279,865 | (601,990,156 | ) | — | 37,858,513 | ||||||||||||||||||||||||||||||||||
A Shares | ||||||||||||||||||||||||||||||||||||||||||||||||
3/31/2016 | 4,030,897 | — | 497,172 | (6,945,176 | ) | — | (2,417,107 | ) | 25,894,346 | — | 3,085,138 | (43,754,670 | ) | — | (14,775,186 | ) | ||||||||||||||||||||||||||||||||
3/31/2015 | 7,667,812 | — | 976,856 | (20,543,905 | ) | — | (11,899,237 | ) | 54,340,109 | — | 6,753,578 | (147,628,392 | ) | — | (86,534,705 | ) | ||||||||||||||||||||||||||||||||
R Shares | ||||||||||||||||||||||||||||||||||||||||||||||||
3/31/2016 | 359,333 | — | 161,075 | (1,187,358 | ) | — | (666,950 | ) | 2,219,409 | — | 997,383 | (7,386,173 | ) | — | (4,169,381 | ) | ||||||||||||||||||||||||||||||||
3/31/2015 | 810,510 | — | 254,230 | (1,008,275 | ) | — | 56,465 | 5,667,370 | — | 1,729,645 | (7,052,708 | ) | — | 344,307 | ||||||||||||||||||||||||||||||||||
IS Shares* | ||||||||||||||||||||||||||||||||||||||||||||||||
3/31/2016 | 679,195 | — | 42,294 | (1,050,372 | ) | — | (328,883 | ) | 4,520,923 | — | 267,858 | (6,288,539 | ) | — | (1,499,758 | ) | ||||||||||||||||||||||||||||||||
3/31/2015 | 835,524 | — | 55,114 | (372,986 | ) | — | 517,652 | 5,992,270 | — | 369,144 | (2,505,345 | ) | — | 3,856,069 | ||||||||||||||||||||||||||||||||||
150
Table of Contents
NOTES TO FINANCIAL STATEMENTS (continued)
RIDGEWORTH FUNDS March 31, 2016
| Shares Issued | Shares Issued- Merger | Shares Reinvested | Shares Redeemed | Shares Converted | Net Increase (Decrease) in Shares Outstanding | Proceeds from Shares Issued | Issued- Merger | Dividends Reinvested | Cost of Shares Redeemed | Shares Converted | Change in Net Assets from Capital Transactions | |||||||||||||||||||||||||||||||||||||
Seix High Yield Fund |
| |||||||||||||||||||||||||||||||||||||||||||||||
I Shares | ||||||||||||||||||||||||||||||||||||||||||||||||
3/31/2016 | 41,765,800 | — | 2,677,794 | (57,054,822 | ) | — | (12,611,228 | ) | $344,971,553 | $— | $21,784,528 | $(463,492,389 | ) | $— | $(96,736,308 | ) | ||||||||||||||||||||||||||||||||
3/31/2015 | 59,991,586 | — | 5,890,762 | (107,955,053 | ) | — | (42,072,705 | ) | 566,345,748 | — | 51,929,938 | (1,029,523,302 | ) | — | (411,247,616 | ) | ||||||||||||||||||||||||||||||||
A Shares | ||||||||||||||||||||||||||||||||||||||||||||||||
3/31/2016 | 1,826,899 | — | 49,068 | (1,848,225 | ) | — | 27,742 | 14,701,000 | — | 392,138 | (14,843,739 | ) | — | 249,399 | ||||||||||||||||||||||||||||||||||
3/31/2015 | 4,637,962 | — | 224,812 | (11,103,725 | ) | — | (6,240,951 | ) | 43,055,711 | — | 2,074,573 | (105,914,466 | ) | — | (60,784,182 | ) | ||||||||||||||||||||||||||||||||
R Shares | ||||||||||||||||||||||||||||||||||||||||||||||||
3/31/2016 | 2,247 | — | 4,222 | (22,713 | ) | — | (16,244 | ) | 18,090 | — | 34,524 | (193,271 | ) | — | (140,657 | ) | ||||||||||||||||||||||||||||||||
3/31/2015 | 2,288 | — | 15,091 | (52,067 | ) | — | (34,688 | ) | 21,707 | — | 133,652 | (485,745 | ) | — | (330,386 | ) | ||||||||||||||||||||||||||||||||
Seix Investment Grade Tax-Exempt Bond Fund |
| |||||||||||||||||||||||||||||||||||||||||||||||
I Shares | ||||||||||||||||||||||||||||||||||||||||||||||||
3/31/2016 | 13,026,768 | — | 1,590,200 | (16,652,152 | ) | — | (2,035,184 | ) | 158,312,240 | — | 19,300,261 | (202,281,494 | ) | — | (24,668,993 | ) | ||||||||||||||||||||||||||||||||
3/31/2015 | 14,602,298 | — | 1,646,853 | (15,797,083 | ) | — | 452,068 | 179,985,612 | — | 20,298,292 | (194,601,088 | ) | — | 5,682,816 | ||||||||||||||||||||||||||||||||||
A Shares | ||||||||||||||||||||||||||||||||||||||||||||||||
3/31/2016 | 270,002 | — | 61,646 | (692,731 | ) | — | (361,083 | ) | 3,278,639 | — | 748,831 | (8,422,052 | ) | — | (4,394,582 | ) | ||||||||||||||||||||||||||||||||
3/31/2015 | 602,590 | — | 67,708 | (756,290 | ) | — | (85,992 | ) | 7,434,825 | — | 835,425 | (9,331,854 | ) | — | (1,061,604 | ) | ||||||||||||||||||||||||||||||||
Seix Limited Duration Fund |
| |||||||||||||||||||||||||||||||||||||||||||||||
I Shares | ||||||||||||||||||||||||||||||||||||||||||||||||
3/31/2016 | 1 | — | — | (1 | ) | — | — | 10 | — | — | (10 | ) | — | — | ||||||||||||||||||||||||||||||||||
3/31/2015 | — | — | — | — | — | — | — | — | — | — | — | — | ||||||||||||||||||||||||||||||||||||
Seix North Carolina Tax-Exempt Bond Fund |
| |||||||||||||||||||||||||||||||||||||||||||||||
I Shares | ||||||||||||||||||||||||||||||||||||||||||||||||
3/31/2016 | 844,230 | — | 22,593 | (1,697,037 | ) | — | (830,214 | ) | 8,794,686 | — | 235,955 | (17,670,389 | ) | — | (8,639,748 | ) | ||||||||||||||||||||||||||||||||
3/31/2015 | 456,959 | — | 7,666 | (627,800 | ) | — | (163,175 | ) | 4,742,649 | — | 79,506 | (6,477,472 | ) | — | (1,655,317 | ) | ||||||||||||||||||||||||||||||||
A Shares | ||||||||||||||||||||||||||||||||||||||||||||||||
3/31/2016 | 3,850 | — | 1,440 | (34,435 | ) | — | (29,145 | ) | 40,276 | — | 14,957 | (356,431 | ) | — | (301,198 | ) | ||||||||||||||||||||||||||||||||
3/31/2015 | 970 | — | 1,647 | (12,431 | ) | — | (9,814 | ) | 10,050 | — | 17,015 | (126,714 | ) | — | (99,649 | ) | ||||||||||||||||||||||||||||||||
Seix Short-Term Bond Fund |
| |||||||||||||||||||||||||||||||||||||||||||||||
I Shares | ||||||||||||||||||||||||||||||||||||||||||||||||
3/31/2016 | 2,020,005 | — | 28,202 | (2,144,798 | ) | — | (96,591 | ) | 20,069,817 | — | 280,754 | (21,316,782 | ) | — | (966,211 | ) | ||||||||||||||||||||||||||||||||
3/31/2015 | 4,689,209 | — | 15,007 | (3,483,051 | ) | — | 1,221,165 | 46,705,550 | — | 149,489 | (34,661,784 | ) | — | 12,193,255 | ||||||||||||||||||||||||||||||||||
A Shares | ||||||||||||||||||||||||||||||||||||||||||||||||
3/31/2016 | 39,217 | — | 1,049 | (61,581 | ) | — | (21,315 | ) | 390,439 | — | 10,466 | (613,864 | ) | — | (212,959 | ) | ||||||||||||||||||||||||||||||||
3/31/2015 | 31,643 | — | 1,080 | (76,545 | ) | — | (43,822 | ) | 315,855 | — | 10,786 | (764,100 | ) | — | (437,459 | ) | ||||||||||||||||||||||||||||||||
C Shares | ||||||||||||||||||||||||||||||||||||||||||||||||
3/31/2016 | 34,023 | — | — | (32,941 | ) | — | 1,082 | 339,111 | — | — | (328,324 | ) | — | 10,787 | ||||||||||||||||||||||||||||||||||
3/31/2015 | 30,224 | — | 7 | (47,609 | ) | — | (17,378 | ) | 301,471 | — | 69 | (475,001 | ) | — | (173,461 | ) | ||||||||||||||||||||||||||||||||
Seix Short-Term Municipal Bond Fund |
| |||||||||||||||||||||||||||||||||||||||||||||||
I Shares | ||||||||||||||||||||||||||||||||||||||||||||||||
3/31/2016 | 953,169 | — | 7,278 | (1,603,161 | ) | — | (642,714 | ) | 9,508,130 | — | 72,544 | (16,004,683 | ) | — | (6,424,009 | ) | ||||||||||||||||||||||||||||||||
3/31/2015 | 2,495,504 | — | 13,203 | (1,730,406 | ) | — | 778,301 | 25,027,144 | — | 131,989 | (17,344,646 | ) | — | 7,814,487 | ||||||||||||||||||||||||||||||||||
A Shares | ||||||||||||||||||||||||||||||||||||||||||||||||
3/31/2016 | 451,219 | — | 1,966 | (102,645 | ) | — | 350,540 | 4,498,824 | — | 19,585 | (1,023,872 | ) | — | 3,494,537 | ||||||||||||||||||||||||||||||||||
3/31/2015 | 112,743 | — | 4,253 | (321,367 | ) | — | (204,371 | ) | 1,130,952 | — | 42,495 | (3,219,515 | ) | — | (2,046,068 | ) | ||||||||||||||||||||||||||||||||
Seix Total Return Bond Fund |
| |||||||||||||||||||||||||||||||||||||||||||||||
I Shares | ||||||||||||||||||||||||||||||||||||||||||||||||
3/31/2016 | 24,445,338 | — | 1,895,924 | (25,707,163 | ) | — | 634,099 | 258,433,518 | — | 20,024,042 | (271,413,458 | ) | — | 7,044,102 | ||||||||||||||||||||||||||||||||||
3/31/2015 | 34,898,907 | — | 1,913,702 | (44,413,678 | ) | — | (7,601,069 | ) | 370,723,813 | — | 20,363,610 | (469,786,413 | ) | — | (78,698,990 | ) | ||||||||||||||||||||||||||||||||
A Shares | ||||||||||||||||||||||||||||||||||||||||||||||||
3/31/2016 | 462,175 | — | 55,139 | (1,487,568 | ) | — | (970,254 | ) | 5,047,588 | — | 601,829 | (16,200,651 | ) | — | (10,551,234 | ) | ||||||||||||||||||||||||||||||||
3/31/2015 | 1,172,422 | — | 67,076 | (1,150,420 | ) | — | 89,078 | 12,923,984 | — | 737,622 | (12,606,489 | ) | — | 1,055,117 | ||||||||||||||||||||||||||||||||||
R Shares | ||||||||||||||||||||||||||||||||||||||||||||||||
3/31/2016 | 795,487 | — | 77,532 | (2,150,252 | ) | — | (1,277,233 | ) | 8,396,594 | — | 819,135 | (22,713,931 | ) | — | (13,498,202 | ) | ||||||||||||||||||||||||||||||||
3/31/2015 | 1,423,952 | — | 108,564 | (2,487,736 | ) | — | (955,220 | ) | 15,230,786 | — | 1,154,903 | (26,504,553 | ) | — | (10,118,864 | ) | ||||||||||||||||||||||||||||||||
IS Shares* | ||||||||||||||||||||||||||||||||||||||||||||||||
3/31/2016 | 2,408,963 | — | 141,104 | (3,939,256 | ) | — | (1,389,189 | ) | 25,424,750 | — | 1,490,984 | (41,629,701 | ) | — | (14,713,967 | ) | ||||||||||||||||||||||||||||||||
3/31/2015 | 7,452,851 | — | 102,410 | (904,498 | ) | — | 6,650,763 | 78,912,819 | — | 1,094,608 | (9,639,814 | ) | — | 70,367,613 | ||||||||||||||||||||||||||||||||||
151
Table of Contents
NOTES TO FINANCIAL STATEMENTS (continued)
RIDGEWORTH FUNDS March 31, 2016
| Shares Issued | Shares Issued- Merger | Shares Reinvested | Shares Redeemed | Shares Converted | Net Increase (Decrease) in Shares Outstanding | Proceeds from Shares Issued | Issued- Merger | Dividends Reinvested | Cost of Shares Redeemed | Shares Converted | Change in Net Assets from Capital Transactions | |||||||||||||||||||||||||||||||||||||
Seix U.S. Government Securities Ultra-Short Bond Fund |
| |||||||||||||||||||||||||||||||||||||||||||||||
I Shares | ||||||||||||||||||||||||||||||||||||||||||||||||
3/31/2016 | 69,731,135 | — | 1,082,880 | (80,130,245 | ) | — | (9,316,230 | ) | $702,624,532 | $— | $10,908,593 | $(807,576,064 | ) | $— | $(94,042,939 | ) | ||||||||||||||||||||||||||||||||
3/31/2015 | 83,380,029 | 784,751 | 1,171,622 | (117,688,966 | ) | — | (32,352,564 | ) | 844,619,459 | 7,953,747 | 11,867,837 | (1,192,094,156 | ) | — | (327,653,113 | ) | ||||||||||||||||||||||||||||||||
Seix U.S. Mortgage Fund |
| |||||||||||||||||||||||||||||||||||||||||||||||
I Shares | ||||||||||||||||||||||||||||||||||||||||||||||||
3/31/2016 | 911,814 | 1,506,410 | 25,558 | (554,435 | ) | — | 1,889,347 | 10,270,176 | 16,905,776 | 287,767 | (6,240,251 | ) | — | 21,223,468 | ||||||||||||||||||||||||||||||||||
3/31/2015 | 111,347 | — | 6,642 | (134,103 | ) | — | (16,114 | ) | 1,244,455 | — | 74,071 | (1,490,918 | ) | — | (172,392 | ) | ||||||||||||||||||||||||||||||||
A Shares | ||||||||||||||||||||||||||||||||||||||||||||||||
3/31/2016 | 184,007 | 49,212 | 7,846 | (121,669 | ) | — | 119,396 | 2,066,876 | 551,248 | 88,138 | (1,363,719 | ) | — | 1,342,543 | ||||||||||||||||||||||||||||||||||
3/31/2015 | 435,295 | — | 5,234 | (138,224 | ) | — | 302,305 | 4,856,654 | — | 58,527 | (1,550,996 | ) | — | 3,364,185 | ||||||||||||||||||||||||||||||||||
C Shares | ||||||||||||||||||||||||||||||||||||||||||||||||
3/31/2016 | 72,081 | 104,870 | 3,533 | (49,636 | ) | — | 130,848 | 809,121 | 1,176,793 | 39,767 | (558,099 | ) | — | 1,467,582 | ||||||||||||||||||||||||||||||||||
3/31/2015 | 6,873 | — | 4,872 | (97,786 | ) | — | (86,041 | ) | 76,671 | — | 54,280 | (1,086,652 | ) | — | (955,701 | ) | ||||||||||||||||||||||||||||||||
Seix Ultra-Short Bond Fund |
| |||||||||||||||||||||||||||||||||||||||||||||||
I Shares | ||||||||||||||||||||||||||||||||||||||||||||||||
3/31/2016 | 3,877,331 | — | 78,994 | (7,694,691 | ) | — | (3,738,366 | ) | 38,499,137 | — | 784,778 | (76,493,415 | ) | — | (37,209,500 | ) | ||||||||||||||||||||||||||||||||
3/31/2015 | 8,677,771 | — | 74,912 | (6,674,417 | ) | — | 2,078,266 | 86,577,985 | — | 747,060 | (66,552,633 | ) | — | 20,772,412 | ||||||||||||||||||||||||||||||||||
Seix Virginia Intermediate Municipal Bond Fund |
| |||||||||||||||||||||||||||||||||||||||||||||||
I Shares | ||||||||||||||||||||||||||||||||||||||||||||||||
3/31/2016 | 1,119,433 | — | 116,554 | (6,446,425 | ) | — | (5,210,438 | ) | 11,308,335 | — | 1,164,775 | (65,333,009 | ) | — | (52,859,899 | ) | ||||||||||||||||||||||||||||||||
3/31/2015 | 1,641,414 | — | 61,789 | (1,991,032 | ) | — | (287,829 | ) | 16,795,290 | — | 633,563 | (20,408,382 | ) | — | (2,979,529 | ) | ||||||||||||||||||||||||||||||||
A Shares | ||||||||||||||||||||||||||||||||||||||||||||||||
3/31/2016 | 15,992 | — | 20,643 | (106,197 | ) | — | (69,562 | ) | 161,455 | — | 206,765 | (1,074,473 | ) | — | (706,253 | ) | ||||||||||||||||||||||||||||||||
3/31/2015 | 57,972 | — | 16,745 | (329,656 | ) | — | (254,939 | ) | 593,372 | — | 171,735 | (3,374,504 | ) | — | (2,609,397 | ) | ||||||||||||||||||||||||||||||||
| * | IS Shares commenced operations on August 1, 2014 (August 3, 2015 for Seix Core Bond Fund and February 2, 2015 for Seix Floating Rate High Income Fund). |
| 5. | Investment Transactions |
The cost of security purchases and the proceeds from sales and maturities of securities, excluding securities maturing less than one year from acquisition and U.S. government securities, for the fiscal year ended March 31, 2016, were as follows:
| Purchases | Sales and Maturities | |||||||
Seix Core Bond Fund | $83,317,978 | $143,926,797 | ||||||
Seix Corporate Bond Fund | 17,616,024 | 28,790,961 | ||||||
Seix Floating Rate High Income Fund | 1,822,420,772 | 3,353,171,117 | ||||||
Seix Georgia Tax-Exempt Bond Fund | 50,702,173 | 68,843,102 | ||||||
Seix High Grade Municipal Bond Fund | 166,034,983 | 169,042,340 | ||||||
Seix High Income Fund | 520,833,374 | 611,214,021 | ||||||
Seix High Yield Fund | 425,050,821 | 470,565,502 | ||||||
Seix Investment Grade Tax-Exempt Bond Fund | 828,255,095 | 903,227,128 | ||||||
Seix Limited Duration Fund | 3,190,831 | 3,166,389 | ||||||
Seix North Carolina Tax-Exempt Bond Fund | 13,339,565 | 20,297,570 | ||||||
Seix Short-Term Bond Fund | 9,478,202 | 13,713,426 | ||||||
Seix Short-Term Municipal Bond Fund | 35,900,403 | 28,896,514 | ||||||
Seix Total Return Bond Fund | 361,898,708 | 341,017,144 | ||||||
Seix U.S. Government Securities Ultra-Short Bond Fund | 440,887,758 | 451,142,260 | ||||||
Seix U.S. Mortgage Fund | 5,350,888 | 6,362,303 | ||||||
Seix Ultra-Short Bond Fund | 53,546,413 | 98,606,747 | ||||||
Seix Virginia Intermediate Municipal Bond Fund | 46,432,319 | 102,097,616 | ||||||
152
Table of Contents
NOTES TO FINANCIAL STATEMENTS (continued)
RIDGEWORTH FUNDS March 31, 2016
The cost of security purchases and proceeds from sales and maturities of U.S. government securities, excluding short-term investments, for the fiscal year ended March 31, 2016, were as follows:
| Purchases—U.S. Government Securities | Sales—U.S. Government Securities | |||||||
Seix Core Bond Fund | $456,632,051 | $555,422,667 | ||||||
Seix Corporate Bond Fund | 149,503 | 147,330 | ||||||
Seix Limited Duration Fund | — | 226,245 | ||||||
Seix Short-Term Bond Fund | 36,925,764 | 32,161,608 | ||||||
Seix Total Return Bond Fund | 1,499,755,753 | 1,594,181,285 | ||||||
Seix U.S. Government Securities Ultra-Short Bond Fund | 358,881,431 | 469,932,719 | ||||||
Seix U.S. Mortgage Fund | 62,170,018 | 54,256,064 | ||||||
Seix Ultra-Short Bond Fund | 10,163,307 | 7,722,183 | ||||||
| 6. | Federal Income Tax Information |
The following information is presented on an income tax basis and takes into consideration differences between amounts for financial statement and income tax purposes. These “book/tax” differences are either considered temporary or permanent in nature. To the extent these differences are permanent in nature (e.g., foreign currency transactions and return of capital on securities), such amounts are reclassified within the composition of net assets based on their U.S. federal tax-basis treatment; temporary differences do not require reclassification.
The effects of certain differences reclassified as of March 31, 2016 were as follows:
| Paid in Capital | Accumulated Net Realized Gain (Loss) | Undistributed Net Investment Income (Loss) | ||||||||||
Seix Core Bond Fund | $105,418 | $(563,454 | ) | $458,036 | ||||||||
Seix Corporate Bond Fund | — | 3,040 | (3,040 | ) | ||||||||
Seix Floating Rate High Income Fund | — | (136,644 | ) | 136,644 | ||||||||
Seix High Income Fund | — | (150,580 | ) | 150,580 | ||||||||
Seix High Yield Fund | — | (671,319 | ) | 671,319 | ||||||||
Seix Limited Duration Fund | — | 2,115 | (2,115 | ) | ||||||||
Seix North Carolina Tax-Exempt Bond Fund | — | (5,669 | ) | 5,669 | ||||||||
Seix Short-Term Bond Fund | — | (51,867 | ) | 51,867 | ||||||||
Seix Total Return Bond Fund | — | (2,892,784 | ) | 2,892,784 | ||||||||
Seix U.S. Government Securities Ultra-Short Bond Fund | — | (3,309,937 | ) | 3,309,937 | ||||||||
Seix U.S. Mortgage Fund | (621,703 | ) | 415,955 | 205,748 | ||||||||
Seix Ultra-Short Bond Fund | — | (53,923 | ) | 53,923 | ||||||||
The cost of investments and aggregate gross unrealized appreciation and depreciation for securities held by the Funds as of March 31, 2016 were as follows:
Fund | Tax Cost | Aggregate Gross Unrealized Appreciation | Aggregate Gross Unrealized (Depreciation) | Net Unrealized Appreciation (Depreciation) | ||||||||||||
Seix Core Bond Fund | $281,404,939 | $3,992,232 | $(1,208,241 | ) | $2,783,991 | |||||||||||
Seix Corporate Bond Fund | 17,903,774 | 467,430 | (371,900 | ) | 95,530 | |||||||||||
Seix Floating Rate High Income Fund | 4,714,220,887 | 10,392,605 | (353,572,832 | ) | (343,180,227 | ) | ||||||||||
Seix Georgia Tax-Exempt Bond Fund | 103,135,940 | 7,210,428 | (23,332 | ) | 7,187,096 | |||||||||||
Seix High Grade Municipal Bond Fund | 111,739,766 | 5,179,237 | (26,630 | ) | 5,152,607 | |||||||||||
Seix High Income Fund | 710,665,250 | 10,680,961 | (63,422,796 | ) | (52,741,835 | ) | ||||||||||
Seix High Yield Fund | 605,294,977 | 9,683,505 | (39,379,173 | ) | (29,695,668 | ) | ||||||||||
Seix Investment Grade Tax-Exempt Bond Fund | 625,501,846 | 33,825,351 | (121,905 | ) | 33,703,446 | |||||||||||
Seix Limited Duration Fund | 6,636,488 | 11,001 | — | 11,001 | ||||||||||||
Seix North Carolina Tax-Exempt Bond Fund | 27,117,160 | 1,793,611 | (11,465 | ) | 1,782,146 | |||||||||||
153
Table of Contents
NOTES TO FINANCIAL STATEMENTS (continued)
RIDGEWORTH FUNDS March 31, 2016
Fund | Tax Cost | Aggregate Gross Unrealized Appreciation | Aggregate Gross Unrealized (Depreciation) | Net Unrealized Appreciation (Depreciation) | ||||||||||||
Seix Short-Term Bond Fund | $53,835,048 | $269,009 | $(39,344 | ) | $229,665 | |||||||||||
Seix Short-Term Municipal Bond Fund | 40,184,141 | 182,949 | (4,019 | ) | 178,930 | |||||||||||
Seix Total Return Bond Fund | 1,208,924,251 | 17,631,743 | (6,022,434 | ) | 11,609,309 | |||||||||||
Seix U.S. Government Securities Ultra-Short Bond Fund | 1,541,778,499 | 14,946,786 | (2,300,644 | ) | 12,646,142 | |||||||||||
Seix U.S. Mortgage Fund | 38,585,705 | 495,824 | — | 495,824 | ||||||||||||
Seix Ultra-Short Bond Fund | 104,425,775 | 326,591 | (165,374 | ) | 161,217 | |||||||||||
Seix Virginia Intermediate Municipal Bond Fund | 63,539,013 | 3,684,570 | (14,702 | ) | 3,669,868 | |||||||||||
Amounts designated as “—” are $0.
The tax character of distributions paid to shareholders during the fiscal year ended March 31, 2016 was as follows:
| Distributions paid from | ||||||||||||||||||||
Fund | Net Investment Income* | Net Long Term Capital Gains | Tax-Exempt Distributions** | Return of Capital | Total Distributions Paid | |||||||||||||||
Seix Core Bond Fund | $5,472,740 | $1,298,555 | $— | $— | $6,771,295 | |||||||||||||||
Seix Corporate Bond Fund | 670,776 | 271,821 | — | 25,678 | 968,275 | |||||||||||||||
Seix Floating Rate High Income Fund | 267,193,754 | — | — | — | 267,193,754 | |||||||||||||||
Seix Georgia Tax-Exempt Bond Fund | 35 | — | 3,197,437 | — | 3,197,472 | |||||||||||||||
Seix High Grade Municipal Bond Fund | 1,029,211 | 102,216 | 2,517,779 | — | 3,649,206 | |||||||||||||||
Seix High Income Fund | 47,227,116 | — | — | — | 47,227,116 | |||||||||||||||
Seix High Yield Fund | 37,383,404 | — | — | — | 37,383,404 | |||||||||||||||
Seix Investment Grade Tax-Exempt Bond Fund | 2,968,203 | 4,455,803 | 15,143,661 | — | 22,567,667 | |||||||||||||||
Seix Limited Duration Fund | 17,332 | — | — | — | 17,332 | |||||||||||||||
Seix North Carolina Tax-Exempt Bond Fund | — | 168,510 | 764,382 | — | 932,892 | |||||||||||||||
Seix Short-Term Bond Fund | 350,454 | — | — | — | 350,454 | |||||||||||||||
Seix Short-Term Municipal Bond Fund | 31,579 | 54,861 | 164,911 | — | 251,351 | |||||||||||||||
Seix Total Return Bond Fund | 22,218,418 | 1,185,364 | — | — | 23,403,782 | |||||||||||||||
Seix U.S. Government Securities Ultra-Short Bond Fund | 12,422,092 | — | — | — | 12,422,092 | |||||||||||||||
Seix U.S. Mortgage Fund | 420,732 | — | — | — | 420,732 | |||||||||||||||
Seix Ultra-Short Bond Fund | 924,985 | — | — | — | 924,985 | |||||||||||||||
Seix Virginia Intermediate Municipal Bond Fund | 118,135 | 1,944,263 | 2,408,086 | — | 4,470,484 | |||||||||||||||
| * | Net Investment income includes taxable market discount income and short-term capital gains, if any. |
| ** | The Funds hereby designate these amounts as Exempt Interest Dividends. |
Amounts designated as “—” are $0.
The tax character of distributions paid to shareholders during the fiscal year ended March 31, 2015 was as follows:
| Distributions paid from | ||||||||||||||||||||
Fund | Net Investment Income* | Net Long Term Capital Gains | Tax-Exempt Distributions** | Return of Capital | Total Distributions Paid | |||||||||||||||
Seix Core Bond Fund | $4,241,150 | $— | $— | $— | $4,241,150 | |||||||||||||||
Seix Corporate Bond Fund | 1,518,635 | 89,129 | — | — | 1,607,764 | |||||||||||||||
Seix Floating Rate High Income Fund | 329,521,926 | — | — | — | 329,521,926 | |||||||||||||||
Seix Georgia Tax-Exempt Bond Fund | 42 | — | 3,369,698 | — | 3,369,740 | |||||||||||||||
Seix High Grade Municipal Bond Fund | 1,210,439 | — | 2,142,219 | — | 3,352,658 | |||||||||||||||
Seix High Income Fund | 63,083,214 | 13,711,409 | — | — | 76,794,623 | |||||||||||||||
Seix High Yield Fund | 71,059,727 | 44,294,046 | — | — | 115,353,773 | |||||||||||||||
Seix Investment Grade Tax-Exempt Bond Fund | 6,178,999 | 2,347,656 | 16,915,693 | — | 25,442,348 | |||||||||||||||
Seix Limited Duration Fund | 11,822 | — | — | — | 11,822 | |||||||||||||||
154
Table of Contents
NOTES TO FINANCIAL STATEMENTS (continued)
RIDGEWORTH FUNDS March 31, 2016
| Distributions paid from | ||||||||||||||||||||
Fund | Net Investment Income* | Net Long Term Capital Gains | Tax-Exempt Distributions** | Return of Capital | Total Distributions Paid | |||||||||||||||
Seix North Carolina Tax-Exempt Bond Fund | $— | $— | $881,179 | $— | $881,179 | |||||||||||||||
Seix Short-Term Bond Fund | 270,835 | — | — | — | 270,835 | |||||||||||||||
Seix Short-Term Municipal Bond Fund | 274,833 | 22,750 | 156,265 | — | 453,848 | |||||||||||||||
Seix Total Return Bond Fund | 24,212,496 | — | — | — | 24,212,496 | |||||||||||||||
Seix U.S. Government Securities Ultra-Short Bond Fund | 13,488,002 | — | — | — | 13,488,002 | |||||||||||||||
Seix U.S. Mortgage Fund | 191,623 | — | — | — | 191,623 | |||||||||||||||
Seix Ultra-Short Bond Fund | 932,817 | — | — | — | 932,817 | |||||||||||||||
Seix Virginia Intermediate Municipal Bond Fund | 21,988 | 995,886 | 3,007,134 | — | 4,025,008 | |||||||||||||||
| * | Net Investment income includes taxable market discount income and short-term capital gains, if any. |
| ** | The Funds hereby designate these amounts as Exempt Interest Dividends. |
Amounts designated as “—” are $0.
As of March 31, 2016 the components of distributable earnings (accumulated losses) on a federal income tax basis were as follows:
Fund | Undistributed Tax Exempt Income | Undistributed Ordinary Income | Undistributed Long Term Capital Gains | Net Unrealized Appreciation (Depreciation)* | Loss Carryforwards and Deferrals | Total | ||||||||||||||||||
Seix Core Bond Fund | $— | $793,355 | $422,874 | $2,783,991 | $— | $4,000,220 | ||||||||||||||||||
Seix Corporate Bond Fund | — | — | — | 95,529 | (320,096 | ) | (224,567 | ) | ||||||||||||||||
Seix Floating Rate High Income Fund | — | 22,272,734 | — | (343,180,227 | ) | (211,971,957 | ) | (532,879,450 | ) | |||||||||||||||
Seix Georgia Tax-Exempt Bond Fund | 433,903 | — | 506,608 | 7,187,096 | — | 8,127,607 | ||||||||||||||||||
Seix High Grade Municipal Bond Fund | 189,390 | 1,114,762 | 466,803 | 5,152,607 | — | 6,923,562 | ||||||||||||||||||
Seix High Income Fund | — | 3,368,878 | — | (52,741,832 | ) | (78,993,481 | ) | (128,366,435 | ) | |||||||||||||||
Seix High Yield Fund | — | 1,460,015 | — | (29,695,663 | ) | (63,448,031 | ) | (91,683,679 | ) | |||||||||||||||
Seix Investment Grade Tax- Exempt Bond Fund | 956,636 | 4,500,936 | 1,468,214 | 33,703,446 | — | 40,629,232 | ||||||||||||||||||
Seix Limited Duration Fund | — | 1,910 | — | 11,001 | (827,694 | ) | (814,783 | ) | ||||||||||||||||
Seix North Carolina Tax- Exempt Bond Fund | — | — | 164,117 | 1,782,146 | — | 1,946,263 | ||||||||||||||||||
Seix Short-Term Bond Fund | — | 31,408 | — | 229,664 | (1,218,910 | ) | (957,838 | ) | ||||||||||||||||
Seix Short-Term Municipal Bond Fund | 11,337 | 58 | — | 178,931 | — | 190,326 | ||||||||||||||||||
Seix Total Return Bond Fund | — | 411,613 | 1,281,193 | 11,806,320 | — | 13,499,126 | ||||||||||||||||||
Seix U.S. Government Securities Ultra-Short Bond Fund | — | 1,202,089 | — | 12,646,145 | (21,679,750 | ) | (7,831,516 | ) | ||||||||||||||||
Seix U.S. Mortgage Fund | — | 37,100 | — | 495,824 | (24,571 | ) | 508,353 | |||||||||||||||||
Seix Ultra-Short Bond Fund | — | 89,560 | — | 161,215 | (2,485,365 | ) | (2,234,590 | ) | ||||||||||||||||
Seix Virginia Intermediate Municipal Bond Fund | 161,306 | 407,871 | 939,168 | 3,669,868 | — | 5,178,213 | ||||||||||||||||||
| * | The differences between book-basis and tax-basis unrealized appreciation (depreciation) is attributable primarily to tax deferral of losses on wash sales, futures contract mark to market, dividends payable, bank loan adjustments, forward contracts mark to market 988(a)(1)(b), mark to market on credit default swaps, trust adjustments and straddle loss deferrals. |
Amounts designated as “—” are $0.
The Funds utilize the provisions of the federal income tax laws that provide for the carryforward of capital losses from prior years, offsetting such losses against any future realized capital gains. Under the Regulated Investment Company Modernization Act of 2010 (the “Act”), net capital losses recognized in taxable years beginning after December 22, 2010 (“post-enactment”), may be carried forward indefinitely, and their character is retained as
155
Table of Contents
NOTES TO FINANCIAL STATEMENTS (continued)
RIDGEWORTH FUNDS March 31, 2016
short-term and/or long-term losses. Previously, net capital losses were carried forward for eight years and treated as short-term losses (“pre-enactment”). The Act requires that post-enactment net capital losses be used before pre-enactment net capital losses.
As of March 31, 2016, the post-enactment accumulated short-term and long-term capital loss carryforwards were as follows:
Fund | Short Term | Long Term | Total | |||||||||
Seix Corporate Bond Fund | $156,102 | $— | $156,102 | |||||||||
Seix Floating Rate High Income Fund | 40,806,533 | 146,126,939 | 186,933,472 | |||||||||
Seix High Income Fund | 29,363,462 | 49,630,019 | 78,993,481 | |||||||||
Seix High Yield Fund | 24,340,402 | 39,107,629 | 63,448,031 | |||||||||
Seix U.S. Government Securities Ultra-Short Bond Fund | 10,992,974 | 2,278,292 | 13,271,266 | |||||||||
Seix Ultra-Short Bond Fund | 237,470 | 231,205 | 468,675 | |||||||||
As of March 31, 2016, the pre-enactment accumulated capital loss carryforwards and expiration dates were as follows:
Fund | Expiring 2017 | Expiring 2018 | Expiring 2019 | Expiring 2020 | Total | |||||||||||||||
Seix Floating Rate High Income Fund | $ | 25,038,485 | $— | $— | $ | — | $ | 25,038,485 | ||||||||||||
Seix Limited Duration Fund* | — | 827,086 | — | — | 827,086 | |||||||||||||||
Seix Short-Term Bond Fund | — | 1,200,277 | — | — | 1,200,277 | |||||||||||||||
Seix U.S. Government Securities Ultra-Short Bond Fund | — | — | 8,408,484 | — | 8,408,484 | |||||||||||||||
Seix U.S. Mortgage Fund** | — | — | — | — | | — | | |||||||||||||
Seix Ultra-Short Bond Fund | 202,726 | 1,362,740 | 451,224 | — | 2,016,690 | |||||||||||||||
| * | Of the $829,060 of capital loss carryforwards subject to limitations due to an ownership change on June 30, 2013, $1,974 was utilized, and the remaining $827,086, will expire in 2018. |
| ** | Of the $695,758 of capital loss carryforwards subject to limitations due to an ownership change on January 31, 2014, $74,055 was utilized, and the remaining $621,703 expired unused. |
Amounts designated as “—” are $0.
Capital loss carryforwards may be applied to offset future realized capital gains and therefore may reduce future capital gain distributions.
During the fiscal year ended March 31, 2016, the following Funds utilized capital loss carryforwards as follows:
Fund | Amount | |||
Seix Georgia Tax-Exempt Bond Fund | $1,162,838 | |||
Seix Limited Duration Fund | 1,974 | |||
Seix North Carolina Tax-Exempt Bond Fund | 223,221 | |||
Seix Short-Term Bond Fund | 1,472 | |||
Seix U.S. Mortgage Fund | 74,055 | |||
During the fiscal year ended March 31, 2016, the following Fund had capital loss carryforwards that expired in fiscal 2016 as follows:
Fund | Amount | |||
Seix U.S. Mortgage Fund | $621,703 | |||
Net capital losses incurred after October 31, and within the taxable year are deemed to arise on the first business day of the Funds’ next fiscal year. During the fiscal year ended March 31, 2016, the following Funds had net capital losses:
Fund | Short Term | Long Term | Total | |||||||||
Seix Corporate Bond Fund | $137,223 | $26,771 | $163,994 | |||||||||
Seix Limited Duration Fund | — | 608 | 608 | |||||||||
Seix Short-Term Bond Fund | 7,996 | 10,637 | 18,633 | |||||||||
Seix U.S. Mortgage Fund | 49,293 | (24,722 | ) | 24,571 | ||||||||
156
Table of Contents
NOTES TO FINANCIAL STATEMENTS (continued)
RIDGEWORTH FUNDS March 31, 2016
Pursuant to federal income tax rules applicable to regulated investment companies, the Funds may elect to treat certain capital losses between November 1 and March 31 and late year ordinary losses (i) ordinary losses between January 1 and March 31, and (ii) specified ordinary and currency losses between November 1 and March 31 as occurring on the first day of the following tax year. For the fiscal year ended March 31, 2016, any amount of losses elected as late year ordinary losses within the tax return will not be recognized for federal income tax purposes until April 1, 2016.
| 7. | Reorganizations |
On May 20, 2014, the Board approved the reorganization of the RidgeWorth Short-Term U.S. Treasury Securities Fund (the “Target Fund”) into the RidgeWorth U.S. Government Securities Ultra-Short Bond Fund (the “Acquiring Fund”), a separate series of the Trust. On August 1, 2014, the Acquiring Fund acquired all of the net assets of the Target Fund in a tax-free exchange of shares. The purpose of the transaction was to combine two portfolios with comparable investment objectives and strategies.
Target Fund | Shares Prior to Reorganization | Shares Issued by the Acquiring Fund | Net Assets Prior to Reorganization | |||||||||
I Shares | 292,773 | 282,619 | $2,864,452 | |||||||||
A Shares | 106,635 | 102,792 | $1,041,835 | |||||||||
C Shares | 414,503 | 399,340 | $4,047,460 | |||||||||
The appreciation (depreciation) of the acquired fund was $9,669 as of the date of the merger. The combined net assets of the Acquiring Fund immediately after the reorganization were $1,786,800,909.
Assuming the acquisition had been completed on April 1, 2014, the beginning of the reporting period of the Acquiring Fund, the Acquiring Fund’s pro forma results of operations for the fiscal year ended March 31, 2015, were as follows:
Net Investment Income (Loss) | $9,708,863 | |||
Net Realized and Unrealized Gains/Losses on Investments | $4,096,899 | |||
Net Increase/Decrease in Net Assets resulting from Operations | $13,805,762 |
Because the combined investment portfolios have been managed as a single integrated portfolio since the acquisition was completed, it is not practicable to separate the amounts of revenue and earnings of the Target Fund that has been included in the Acquiring Fund’s Statement of Operations as of March 31, 2015.
On May 21, 2015, the Board approved the reorganization of the RidgeWorth Intermediate Bond Fund (the “Target Fund”) into the RidgeWorth Core Bond Fund (the “Acquiring Fund”), a separate series of the Trust. On August 3, 2015, the Acquiring Fund acquired all of the net assets of the Target Fund in a tax-free exchange of shares. The purpose of the transaction was to combine two portfolios with comparable investment objectives and strategies.
Target Fund | Shares Prior to Reorganization | Shares Issued by the Acquiring Fund | Net Assets Prior to Reorganization | |||||||||
I Shares | 20,078,785 | 18,121,184 | $195,102,886 | |||||||||
A Shares | 345,825 | 312,495 | $3,363,629 | |||||||||
R Shares | 1,543 | 1,392 | $14,994 | |||||||||
The appreciation (depreciation) of the acquired fund was $841,440 as of the date of the merger. The combined net assets of the Acquiring Fund immediately after the reorganization were $387,705,719.
Assuming the acquisition had been completed on April 1, 2015, the beginning of the reporting period of the Acquiring Fund, the Acquiring Fund’s pro forma results of operations for the year ended March 31, 2016, were as follows:
Net Investment Income (Loss) | $5,701,046 | |||
Net Realized and Unrealized Gains/Losses on Investments | $(3,299,477 | ) | ||
Net Increase/Decrease in Net Assets resulting from Operations | $(2,401,569 | ) |
157
Table of Contents
NOTES TO FINANCIAL STATEMENTS (concluded)
RIDGEWORTH FUNDS March 31, 2016
On May 21, 2015, the Board approved the reorganization of the RidgeWorth U.S. Government Securities Fund (the “Target Fund”) into the RidgeWorth Limited-Term Federal Mortgage Securities Fund (the “Acquiring Fund”), a separate series of the Trust. On August 1, 2015, the Acquiring Fund was renamed RidgeWorth Seix U.S. Mortgage Fund and acquired all of the net assets of the Target Fund in a taxable exchange of shares. The purpose of the transaction was to combine two portfolios with comparable investment objectives and strategies.
Target Fund | Shares Prior to Reorganization | Shares Issued by the Acquiring Fund | Net Assets Prior to Reorganization | |||||||||
I Shares | 2,019,210 | 1,506,410 | $16,905,776 | |||||||||
A Shares | 65,853 | 49,212 | $551,248 | |||||||||
C Shares | 140,575 | 104,870 | $1,176,793 | |||||||||
The appreciation (depreciation) of the acquired fund was $113,976 as of the date of the merger. The combined net assets of the Acquiring Fund immediately after the reorganization were $32,289,899.
Assuming the acquisition had been completed on April 1, 2015, the beginning of the reporting period of the Acquiring Fund, the Acquiring Fund’s pro forma results of operations for the year ended March 31, 2016, were as follows:
Net Investment Income (Loss) | $(159,812 | ) | ||
Net Realized and Unrealized Gains/Losses on Investments | $71,615 | |||
Net Increase/Decrease in Net Assets resulting from Operations | $(88,197 | ) |
Because the combined investment portfolios have been managed as a single integrated portfolio since the acquisition was completed, it is not practicable to separate the amounts of revenue and earnings of the Target Fund that has been included in the Acquiring Fund’s Statement of Operations as of March 31, 2016.
| 8. | Recently Issued Accounting Pronouncements |
In May 2015, the Financial Accounting Standards Board (“FASB”) issued Accounting Standards Update (“ASU”) No. 2015-07 Disclosure for Investments in Certain Entities that Calculate Net Asset Value per Share (or Its Equivalent). The amendments in ASU No. 2015-07 remove the requirement to categorize within the fair value hierarchy investments measured using the net asset value per share (“NAV”) practical expedient. The ASU also removes certain disclosure requirements for investments that qualify, but do not utilize, the NAV practical expedient. The amendments in the ASU are effective for fiscal years beginning after December 15, 2015, and interim periods within those fiscal years. Management is currently evaluating the impact these changes will have on the Fund’s financial statements and related disclosures.
| 9. | Subsequent Events |
Management has evaluated subsequent events through the date these financial statements were available to be issued. Management has determined that there are no material events that would require disclosure in the Funds’ financial statements through this date.
158
Table of Contents
REPORT OF INDEPENDENT REGISTERED PUBLIC ACCOUNTING FIRM
RIDGEWORTH FUNDS March 31, 2016
To the Board of Trustees and Shareholders of RidgeWorth Funds:
In our opinion, the accompanying statements of assets and liabilities, including the schedules of portfolio investments, and the related statements of operations and of changes in net assets and the financial highlights present fairly, in all material respects, the financial position of Seix Core Bond Fund (formerly, “Core Bond Fund”), Seix Corporate Bond Fund (formerly, “Corporate Bond Fund”), Seix Floating Rate High Income Fund, Seix Georgia Tax-Exempt Bond Fund (formerly, “Georgia Tax-Exempt Bond Fund”), Seix High Grade Municipal Bond Fund (formerly, “High Grade Municipal Bond Fund”), Seix High Income Fund (formerly, “High Income Fund”), Seix High Yield Fund, Seix Investment Grade Tax-Exempt Bond Fund (formerly, “Investment Grade Tax-Exempt Bond Fund”), Seix Limited Duration Fund (formerly, “Limited Duration Fund”), Seix North Carolina Tax-Exempt Bond Fund (formerly, “North Carolina Tax-Exempt Bond Fund”), Seix Short-Term Bond Fund (formerly, “Short-Term Bond Fund”), Seix Short-Term Municipal Bond Fund (formerly, “Short-Term Municipal Bond Fund”), Seix Total Return Bond Fund (formerly, “Total Return Bond Fund”), Seix U.S. Government Securities Ultra-Short Bond Fund (formerly, “U.S. Government Securities Ultra-Short Bond Fund”), Seix U.S. Mortgage Fund (formerly, “Limited-Term Federal Mortgage Securities Fund”), Seix Ultra-Short Bond Fund (formerly, “Ultra-Short Bond Fund”), and Seix Virginia Intermediate Municipal Bond Fund (formerly, “Virginia Intermediate Municipal Bond Fund”) (seventeen of the funds constituting RidgeWorth Funds, collectively the “Funds”) at March 31, 2016, the results of each of their operations for the year then ended, the changes in each of their net assets for each of the two years in the period then ended and the financial highlights for each of the periods indicated, in conformity with accounting principles generally accepted in the United States of America. These financial statements and financial highlights (hereafter referred to as “financial statements”) are the responsibility of the Funds’ management. Our responsibility is to express an opinion on these financial statements based on our audits. We conducted our audits of these financial statements in accordance with the standards of the Public Company Accounting Oversight Board (United States). Those standards require that we plan and perform the audits to obtain reasonable assurance about whether the financial statements are free of material misstatement. An audit includes examining, on a test basis, evidence supporting the amounts and disclosures in the financial statements, assessing the accounting principles used and significant estimates made by management, and evaluating the overall financial statement presentation. We believe that our audits, which included confirmation of securities at March 31, 2016 by correspondence with the custodian, transfer agent and brokers, and application of alternative auditing procedures where securities purchased had not been received, provide a reasonable basis for our opinion.
PricewaterhouseCoopers LLP
Boston, Massachusetts
May 26, 2016
159
Table of Contents
RIDGEWORTH FUNDS March 31, 2016
(Unaudited)
The following Funds hereby designate the following amounts as long term capital gain distributions:
Fund | Long Term Capital Dividend | |||
Seix Core Bond Fund | $1,298,555 | |||
Seix Corporate Bond Fund | 271,821 | |||
Seix High Grade Municipal Bond Fund | 102,216 | |||
Seix Investment Grade Tax-Exempt Bond Fund | 4,455,803 | |||
Seix North Carolina Tax-Exempt Bond Fund | 168,510 | |||
Seix Short-Term Municipal Bond Fund | 54,861 | |||
Seix Total Return Bond Fund | 1,185,364 | |||
Seix Virginia Intermediate Municipal Bond Fund | 1,944,263 | |||
For corporate shareholders, the following percentages of the total ordinary income distributions paid by the following Funds during the fiscal year ended March 31, 2016 qualify for the corporate dividends received deduction:
Fund | Dividends Received Deductions | |||
Seix Floating Rate High Income Fund | 0.07 | % | ||
Siex High Income Fund | 1.29 | |||
Seix High Yield Fund | 0.15 | |||
For the fiscal year ended March 31, 2016, the following Funds paid qualified dividend income:
Fund | Qualified Dividend Income | |||
Seix Floating Rate High Income Fund | 0.07 | % | ||
Siex High Income Fund | 1.40 | |||
Seix High Yield Fund | 0.15 | |||
160
Table of Contents
TRUSTEES AND OFFICERS OF THE RIDGEWORTH FUNDS
RIDGEWORTH FUNDS March 31, 2016
(Unaudited)
Set forth below are the names, age, position with the Trust, length of term of office, and the principal occupations and applicable, other directorships held during at least the last five years of each of the persons currently serving as a Trustee or Officer of the Trust. Unless otherwise noted, the address of each Trustee and officer is c/o RidgeWorth Investments®, 3333 Piedmont Road, Suite 1500, Atlanta, Georgia 30305. The Funds’ Statement of Additional Information includes more information about the Trustees and is available without charge, upon request, by calling 1-888-784-3863 and on the Funds’ website at www.ridgeworth.com.
| Name and Age | Position Held With the Trust | Term of Office and Length of Time Served | Principal Occupation(s) During the Past 5 Years | Number of Portfolios in the RidgeWorth Complex Overseen by Trustees | Other Directorships Held By Trustee During the Past 5 Years | |||||||
INDEPENDENT TRUSTEE | ||||||||||||
Tim E. Bentsen (August 1953) | Trustee | Indefinite; since 2012 | Lecturer- J.M. Tull School of Accounting, Terry College of Business at University of Georgia (2013-Present); Retired. Audit Partner and Account Executive (1993-2012); Lead Area Managing Partner (2005-2009); Atlanta Office Managing Partner (2003-2009), KPMG LLP. | 29 | Synovus Financial Corp.: Krispy Kreme Doughnuts, Inc. | |||||||
Jeffrey M. Biggar (February 1950) | Trustee | Indefinite; since 2007 | Director of Special Gifts for Hawken School (since May 2013); Managing Director, Little Mountain Group, LLC (an independent Registered Investment Advisor consulting firm) (2011-2013); Chief Operating Officer, Cedar Brook Financial Partners LLC (2008-2010); Chief Executive Officer and Senior Managing Director, Sterling (National City Corp.) (2000-2006). | 29 | Multi-Manager Master Portfolios LLC (3 portfolios; thru 2013) | |||||||
George C. Guynn (December 1942) | Trustee | Indefinite; since 2008 | Retired. President and CEO, Federal Reserve Bank of Atlanta (1996-2006). | 29 | SUSA Registered Fund, LLC; Oxford Industries; Acuity Brands, Inc. (thru 2014); Multi-Manager Master Portfolios LLC (3 portfolios; thru 2013); Genuine Parts Company (thru 2015) | |||||||
Sidney E. Harris (July 1949) | Trustee | Indefinite; since 2004 | Professor and Dean Emeritus (since April 2015), Professor (1997-2014), Dean (1997-2004), J. Mack Robinson College of Business, Georgia State University. | 29 | Total System Services, Inc.; Multi-Manager Master Portfolios LLC (3 portfolios; thru 2013). | |||||||
Connie D. McDaniel (April 1958) | Trustee | Indefinite; since 2005 | Retired. Vice President, Chief of Internal Audit, Corporate Audit Department (2009-2013); Vice President Global Finance Transformation (2007-2009); Vice President and Controller (1999-2007), The Coca-Cola Company. | 29 | Total System Services, Inc. | |||||||
INTERESTED TRUSTEE | ||||||||||||
Ashi S. Parikh* (February 1966) | Trustee | Indefinite; since 2013 | Chief Executive Officer and Chief Investment Officer, RidgeWorth Investments (2010-present); President and Chief Investment Officer (2008-2010). | 29 | None | |||||||
| * | Mr. Parikh is an “interested person” of the Trust, as defined in the 1940 Act, because he is an employee of the Investment Adviser. |
161
Table of Contents
TRUSTEES AND OFFICERS OF THE RIDGEWORTH FUNDS (concluded)
RIDGEWORTH FUNDS March 31, 2016
(Unaudited)
Name, Address and Age | Position(s) Held With the Trust | Term of Office and Length of Time Served | Principal Occupation(s) During the Past 5 Years | |||
Julia R. Short (November 1972) | President and Chief Executive Officer | One year; since 2007 | Managing Director, Product Manager, RidgeWorth Investments (since 2004). | |||
James L. Love (December 1968) | Chief Compliance Officer | One year; since 2016 | Managing Director and Chief Compliance Officer, RidgeWorth Investments (since 2016); Chief Compliance Officer and Deputy General Counsel, U.S. Global Investors (2007-2015). | |||
Benjamin H. Lowe (March 1978) | Treasurer and Chief Financial Officer | One year; since 2015 | Director of Fund Administration, RidgeWorth Investments (since 2011); Fund Controller, ALPS Fund Services, Inc. (2005–2011). | |||
James Bacik State Street Bank and Trust Co. 1 Iron Street Boston, MA 02210 (May 1975) | Assistant Treasurer | One year; since 2010 | Vice President, State Street Bank and Trust Company (since 2001).* | |||
Patrick J. Keniston Foreside Fund Officer Services, LLC Three Canal Plaza, Suite 100 Portland, ME 04101 (January 1964) | Anti-Money Laundering Officer and Identity Theft Prevention Officer | One year; since 2013 | Managing Director, Foreside Fund Officer Services, LLC (October 2008 – present). | |||
Karen Jacoppo-Wood State Street Bank and Trust Company 100 Huntington Avenue Tower 2, Third Floor, CPH0326 Boston, MA 02116 (December 1966) | Secretary and Chief Legal Officer | One year; since 2014 | Vice President and Managing Counsel, State Street Bank and Trust Company (since 2014); Vice President, RMR Advisors, Inc./RMR Funds (2007-2014).* |
| * | During the period indicated the officer has held various positions at State Street Bank and Trust Company and has provided his or her current title. |
162
Table of Contents
INVESTMENT ADVISORY AGREEMENT
RIDGEWORTH FUNDS March 31, 2016
(Unaudited)
APPROVAL OF INVESTMENT ADVISORY AND SUBADVISORY AGREEMENTS
The continuance of the Trust’s investment advisory agreement with RidgeWorth Capital Management LLC (the “Adviser”) and subadvisory agreement between the Adviser and Seix Investment Advisors LLC (the “Subadviser”) must be specifically approved at least annually by (i) the vote of the Trustees or a vote of the shareholders of the Funds and (ii) the vote of a majority of the Trustees who are not parties to the agreements or “interested persons” of any party thereto (the “Independent Trustees”), as defined in the Investment Company Act of 1940 (the “1940 Act”), cast in person at a meeting called for the purpose of voting on such approval. New advisory agreements for the Trust are also subject to such approval initially and annually after their initial term is complete.
Each year, the Board of Trustees calls and holds a meeting to decide whether to approve the continuance of the Trust’s agreements for another year. In preparation for the meeting, the Board requests and reviews a wide variety of information from the Adviser and Subadviser. The Trustees use this information, as well as other information that the Adviser, Subadviser, and other service providers may submit to the Board, to help them decide whether to approve the agreements.
In considering the renewal of the agreements with the Adviser and Subadviser, the Board requested and received material from the Adviser and Subadviser in preparation for a special meeting of the Board held on October 8, 2015, and requested and reviewed additional material from the Adviser and Subadviser in preparation for its quarterly meeting held on November 16-17, 2015, at which it specifically considered the renewal of the agreements. Such material included, among other things, information about: (a) the quality of the Adviser’s and Subadviser’s investment management and other services; (b) the Adviser’s and Subadviser’s investment management personnel; (c) the Adviser’s and Subadviser’s operations and financial condition; (d) the Adviser’s and Subadviser’s brokerage practices (including any soft dollar arrangements) and investment strategies; (e) the level of the advisory fees that the Adviser and Subadviser charge the Funds compared with the fees they charge to comparable mutual funds or accounts; (f) the Funds’ overall fees and operating expenses compared with similar mutual funds; (g) the level of the Adviser’s and Subadviser’s profitability from their Fund-related operations; (h) the Adviser’s and Subadviser’s compliance systems; (i) the Adviser’s and Subadviser’s policies and procedures for personal securities transactions; (j) the Adviser’s and Subadviser’s reputation, expertise, and resources in domestic financial markets; and (k) the Funds’ performance compared with similar mutual funds. The Board also received a memorandum from fund counsel regarding the responsibilities of the Trustees in connection with their consideration of the agreements.
At the meetings, representatives from the Adviser and Subadviser presented additional oral and written information to the Board to help the Board evaluate the Adviser’s and Subadviser’s fees and other aspects of the agreements. The Board also considered information presented by the Adviser, Subadviser, and other service providers at meetings held throughout the year. The Trustees discussed the written materials, oral presentations, and any other information that the Board received, and considered the approval of the agreements in light of this information.
Based on the Board’s deliberations and evaluation of the information it received, the Board, all of whose members are Independent Trustees, approved the renewal of the agreements with the Adviser and Subadviser and determined that the compensation under the agreements is fair and reasonable in light of the services to be performed. The Board considered the following specific factors, none of which was controlling, and made the following conclusions:
Nature, Extent, and Quality of Services. The Board received and considered information regarding the nature, extent, and quality of services provided to the Funds by the Adviser and Subadviser. In this regard, the Trustees evaluated, among other things, the Adviser’s and Subadviser’s personnel, experience, track record, and compliance program. The Board considered the background and experience of the Adviser’s and Subadviser’s senior management and the expertise of, and amount of attention given to the Funds by, their portfolio management teams. The Board reviewed the qualifications and backgrounds of the portfolio managers responsible for the day-to-day management of the Funds. The Board also reviewed information pertaining to the Adviser’s and Subadviser’s organizational structure, senior management, investment operations, and other relevant information. The Board concluded that, within the context of its full deliberations, the nature, extent, and quality of the services provided to the Funds by the Adviser and Subadviser supported the approval of the agreements.
163
Table of Contents
INVESTMENT ADVISORY AGREEMENT (concluded)
RIDGEWORTH FUNDS March 31, 2016
(Unaudited)
Performance. The Board considered the investment performance of each Fund, including any periods of outperformance and underperformance, both on an absolute basis and a comparative basis to indices and other funds within the same investment categories. Specifically, the Board considered Fund performance relative to peer groups and appropriate benchmarks in light of total return, yield, and market trends. As part of this review, the Board considered the composition of the peer group and selection criteria, as well as market risk and shareholder risk expectations. The Board considered the Adviser’s and Subadviser’s explanations regarding specific performance issues. The Board concluded that, within the context of its full deliberations, the performance of the Funds, the Adviser, and the Subadviser supported the approval of the agreements.
Fund Expenses. With respect to advisory fees, the Board considered the rate of compensation under the agreements and each Fund’s net operating expense ratio in comparison to those of comparable mutual funds. The Trustees also considered information about average expense ratios of comparable mutual funds in each Fund’s peer group. Finally, the Trustees considered the effect of the Adviser’s and Subadviser’s waiver and reimbursement of fees and expenses, where applicable, to prevent total expenses from exceeding a specified amount and that, due to these waivers and reimbursements, net operating expenses have been maintained at competitive levels. The Board concluded that, within the context of its full deliberations, the expenses of the Funds are reasonable and supported the approval of the agreements.
Profitability. The Board reviewed information about the profitability of the Funds to the Adviser and Subadviser and considered whether the level of profitability, if any, was reasonable and justified in light of the quality of the services rendered to the Funds. The Board concluded that, within the context of its full deliberations, the profitability of the Adviser and Subadviser is within the range the Board considered reasonable.
Economies of Scale. The Board considered the existence of economies of scale and whether they were passed along to Fund shareholders through a graduated advisory fee schedule or other means, including any fee waivers and expense reimbursements by the Adviser and Subadviser. The Board concluded that, within the context of its full deliberations, the Funds obtain reasonable benefit from economies of scale.
164
Table of Contents
RIDGEWORTH FUNDS March 31, 2016
(Unaudited)
Expense Examples
As a shareholder of the RidgeWorth Funds, you incur two types of costs: (1) transaction costs, including sales charges (loads) on purchases; and (2) ongoing costs, including management fees, 12b-1 distribution and/or service fees, and other Fund expenses. These examples are intended to help you understand your ongoing costs (in dollars) of investing in the RidgeWorth Funds and to compare these costs with the ongoing costs of investing in other mutual funds.
These examples are based on an investment of $1,000 invested at the beginning of the period and held for the entire period from October 1, 2015 through March 31, 2016.
Actual Expenses
The table below provides information about actual account values and actual expenses. You may use the information below, together with the amount you invested, to estimate the expenses that you paid over the period. Simply divide your account value by $1,000 (for example, an $8,600 account value divided by $1,000 = 8.6), then multiply the result by the number in the table under the heading entitled “Expenses Paid During Period” to estimate the expenses you paid on your account during this period.
Fund | Class | Beginning Account Value 10/01/15 | Ending Account Value 03/31/16 | Expenses Paid During Period* 10/01/15-03/31/16 | Expense Ratio During Period** 10/01/15-03/31/16 | |||||||||||||||
Seix Core Bond Fund | I Shares | $1,000.00 | $1,020.90 | $2.48 | 0.49 | % | ||||||||||||||
| A Shares | 1,000.00 | 1,020.20 | 3.23 | 0.64 | ||||||||||||||||
| R Shares | 1,000.00 | 1,018.90 | 4.49 | 0.89 | ||||||||||||||||
| IS Shares | 1,000.00 | 1,021.60 | 1.97 | 0.39 | ||||||||||||||||
Seix Corporate Bond Fund | I Shares | 1,000.00 | 1,026.90 | 3.55 | 0.70 | |||||||||||||||
| A Shares | 1,000.00 | 1,025.60 | 4.81 | 0.95 | ||||||||||||||||
| C Shares | 1,000.00 | 1,022.10 | 8.34 | 1.65 | ||||||||||||||||
Seix Floating Rate High Income Fund | I Shares | 1,000.00 | 994.80 | 3.09 | 0.62 | |||||||||||||||
| A Shares | 1,000.00 | 993.40 | 4.58 | 0.92 | ||||||||||||||||
| C Shares | 1,000.00 | 990.50 | 7.51 | 1.51 | ||||||||||||||||
| IS Shares | 1,000.00 | 995.40 | 2.54 | 0.51 | ||||||||||||||||
Seix Georgia Tax-Exempt Bond Fund | I Shares | 1,000.00 | 1,030.00 | 3.30 | 0.65 | |||||||||||||||
| A Shares | 1,000.00 | 1,029.50 | 3.86 | 0.76 | ||||||||||||||||
Seix High Grade Municipal Bond Fund | I Shares | 1,000.00 | 1,034.30 | 3.31 | 0.65 | |||||||||||||||
| A Shares | 1,000.00 | 1,032.70 | 4.07 | 0.80 | ||||||||||||||||
Seix High Income Fund | I Shares | 1,000.00 | 1,004.60 | 4.01 | 0.80 | |||||||||||||||
| A Shares | 1,000.00 | 1,001.70 | 5.20 | 1.04 | ||||||||||||||||
| R Shares | 1,000.00 | 1,000.80 | 6.15 | 1.23 | ||||||||||||||||
| IS Shares | 1,000.00 | 1,005.40 | 12.63 | 2.52 | ||||||||||||||||
Seix High Yield Fund | I Shares | 1,000.00 | 992.60 | 3.09 | 0.62 | |||||||||||||||
| A Shares | 1,000.00 | 991.80 | 4.13 | 0.83 | ||||||||||||||||
| R Shares | 1,000.00 | 990.60 | 5.08 | 1.02 | ||||||||||||||||
Seix Investment Grade Tax-Exempt Bond Fund | I Shares | 1,000.00 | 1,027.40 | 3.29 | 0.65 | |||||||||||||||
| A Shares | 1,000.00 | 1,027.50 | 4.06 | 0.80 | ||||||||||||||||
Seix Limited Duration Fund | I Shares | 1,000.00 | 1,001.70 | 1.75 | 0.35 | |||||||||||||||
Seix North Carolina Tax-Exempt Bond Fund | I Shares | 1,000.00 | 1,029.20 | 3.30 | 0.65 | |||||||||||||||
| A Shares | 1,000.00 | 1,027.40 | 4.21 | 0.83 | ||||||||||||||||
Seix Short-Term Bond Fund | I Shares | 1,000.00 | 1,004.60 | 3.01 | 0.60 | |||||||||||||||
| A Shares | 1,000.00 | 1,004.60 | 4.01 | 0.80 | ||||||||||||||||
| C Shares | 1,000.00 | 1,001.00 | 6.65 | 1.33 | ||||||||||||||||
Seix Short-Term Municipal Bond Fund | I Shares | 1,000.00 | 1,003.00 | 2.40 | 0.48 | |||||||||||||||
| A Shares | 1,000.00 | 1,002.10 | 3.30 | 0.66 | ||||||||||||||||
Seix Total Return Bond Fund | I Shares | 1,000.00 | 1,019.90 | 2.32 | 0.46 | |||||||||||||||
| A Shares | 1,000.00 | 1,019.20 | 3.58 | 0.71 | ||||||||||||||||
| R Shares | 1,000.00 | 1,017.80 | 5.30 | 1.05 | ||||||||||||||||
| IS Shares | 1,000.00 | 1,020.60 | 1.57 | 0.31 | ||||||||||||||||
Seix U.S. Government Securities Ultra-Short Bond Fund | I Shares | 1,000.00 | 998.20 | 2.10 | 0.42 | |||||||||||||||
Seix U.S. Mortgage Fund | I Shares | 1,000.00 | 1,015.20 | 3.53 | 0.70 | |||||||||||||||
| A Shares | 1,000.00 | 1,014.10 | 4.53 | 0.90 | ||||||||||||||||
| C Shares | 1,000.00 | 1,010.30 | 8.29 | 1.65 | ||||||||||||||||
165
Table of Contents
ADDITIONAL INFORMATION (continued)
RIDGEWORTH FUNDS March 31, 2016
(Unaudited)
Fund | Class | Beginning Account Value 10/01/15 | Ending Account Value 03/31/16 | Expenses Paid During Period* 10/01/15-03/31/16 | Expense Ratio During Period** 10/01/15-03/31/16 | |||||||||||||||
Seix Ultra-Short Bond Fund | I Shares | $1,000.00 | $1,004.40 | $1.60 | 0.32 | % | ||||||||||||||
Seix Virginia Intermediate Municipal Bond Fund | I Shares | 1,000.00 | 1,028.10 | 3.30 | 0.65 | |||||||||||||||
| A Shares | 1,000.00 | 1,027.50 | 3.90 | 0.77 | ||||||||||||||||
| * | Expenses are equal to the average account value times the Fund’s annualized expense ratio multiplied by the number of days in the most recent fiscal half-year divided by the number of days in the fiscal year. |
| ** | Annualized. |
Hypothetical Example
The table below provides information about hypothetical account values and hypothetical expenses based on each RidgeWorth Fund’s actual expense ratio and an assumed rate of return of 5% per year before expenses, which is not the Fund’s actual return. The hypothetical account values and expenses may not be used to estimate the actual ending account balance or expenses you paid for the period. You may use this information to compare this 5% hypothetical example with the 5% hypothetical examples that appear in the shareholder reports of other funds.
Please note that the expenses shown in the table are meant to highlight your ongoing costs only and do not reflect any transactional costs, such as sales charges (loads) or redemption fees. Therefore, the table is useful in comparing ongoing costs only, and will not help you determine the relative total costs of owning different funds. In addition, if these transactional costs were included, your costs would have been higher.
Fund | Class | Beginning Account Value 10/01/15 | Ending Account Value 03/31/16 | Expenses Paid During Period* 010/01/15-03/31/16 | Expense Ratio During Period** 010/01/15-03/31/16 | |||||||||||||||
Seix Core Bond Fund | I Shares | $1,000.00 | $1,022.60 | $2.48 | 0.49 | % | ||||||||||||||
| A Shares | 1,000.00 | 1,021.80 | 3.23 | 0.64 | ||||||||||||||||
| R Shares | 1,000.00 | 1,020.60 | 4.50 | 0.89 | ||||||||||||||||
| IS Shares | *** | 1,000.00 | 1,023.05 | 1.97 | 0.39 | |||||||||||||||
Seix Corporate Bond Fund | I Shares | 1,000.00 | 1,021.50 | 3.54 | 0.70 | |||||||||||||||
| A Shares | 1,000.00 | 1,020.30 | 4.80 | 0.95 | ||||||||||||||||
| C Shares | 1,000.00 | 1,016.80 | 8.32 | 1.65 | ||||||||||||||||
Seix Floating Rate High Income Fund | I Shares | 1,000.00 | 1,021.90 | 3.13 | 0.62 | |||||||||||||||
| A Shares | 1,000.00 | 1,020.40 | 4.65 | 0.92 | ||||||||||||||||
| C Shares | 1,000.00 | 1,017.50 | 7.62 | 1.51 | ||||||||||||||||
| IS Shares | 1,000.00 | 1,022.45 | 2.58 | 0.51 | ||||||||||||||||
Seix Georgia Tax-Exempt Bond Fund | I Shares | 1,000.00 | 1,021.80 | 3.29 | 0.65 | |||||||||||||||
| A Shares | 1,000.00 | 1,021.20 | 3.84 | 0.76 | ||||||||||||||||
Seix High Grade Municipal Bond Fund | I Shares | 1,000.00 | 1,021.80 | 3.29 | 0.65 | |||||||||||||||
| A Shares | 1,000.00 | 1,021.00 | 4.04 | 0.80 | ||||||||||||||||
Seix High Income Fund | I Shares | 1,000.00 | 1,021.00 | 4.04 | 0.80 | |||||||||||||||
| A Shares | 1,000.00 | 1,019.80 | 5.25 | 1.04 | ||||||||||||||||
| R Shares | 1,000.00 | 1,018.90 | 6.21 | 1.23 | ||||||||||||||||
| IS Shares | 1,000.00 | 1,012.40 | 12.68 | 2.52 | ||||||||||||||||
Seix High Yield Fund | I Shares | 1,000.00 | 1,021.90 | 3.13 | 0.62 | |||||||||||||||
| A Shares | 1,000.00 | 1,020.90 | 4.19 | 0.83 | ||||||||||||||||
| R Shares | 1,000.00 | 1,019.90 | 5.15 | 1.02 | ||||||||||||||||
Seix Investment Grade Tax-Exempt Bond Fund | I Shares | 1,000.00 | 1,021.80 | 3.29 | 0.65 | |||||||||||||||
| A Shares | 1,000.00 | 1,021.00 | 4.04 | 0.80 | ||||||||||||||||
Seix Limited Duration Fund | I Shares | 1,000.00 | 1,023.30 | 1.77 | 0.35 | |||||||||||||||
Seix North Carolina Tax-Exempt Bond Fund | I Shares | 1,000.00 | 1,021.80 | 3.29 | 0.65 | |||||||||||||||
| A Shares | 1,000.00 | 1,020.90 | 4.19 | 0.83 | ||||||||||||||||
Seix Short-Term Bond Fund | I Shares | 1,000.00 | 1,022.00 | 3.03 | 0.60 | |||||||||||||||
| A Shares | 1,000.00 | 1,021.00 | 4.04 | 0.80 | ||||||||||||||||
| C Shares | 1,000.00 | 1,018.40 | 6.71 | 1.33 | ||||||||||||||||
Seix Short-Term Municipal Bond Fund | I Shares | 1,000.00 | 1,022.60 | 2.43 | 0.48 | |||||||||||||||
| A Shares | 1,000.00 | 1,021.70 | 3.34 | 0.66 | ||||||||||||||||
Seix Total Return Bond Fund | I Shares | 1,000.00 | 1,022.70 | 2.33 | 0.46 | |||||||||||||||
| A Shares | 1,000.00 | 1,021.50 | 3.59 | 0.71 | ||||||||||||||||
| R Shares | 1,000.00 | 1,019.80 | 5.30 | 1.05 | ||||||||||||||||
| IS Shares | 1,000.00 | 1,023.45 | 1.57 | 0.31 | ||||||||||||||||
166
Table of Contents
ADDITIONAL INFORMATION (concluded)
RIDGEWORTH FUNDS March 31, 2016
(Unaudited)
Fund | Class | Beginning Account Value 10/01/15 | Ending Account Value 03/31/16 | Expenses Paid During Period* 010/01/15-03/31/16 | Expense Ratio During Period** 010/01/15-03/31/16 | |||||||||||||||
Seix U.S. Government Securities Ultra-Short Bond Fund | I Shares | $1,000.00 | $1,022.90 | $2.12 | 0.42 | % | ||||||||||||||
Seix U.S. Mortgage Fund | I Shares | 1,000.00 | 1,021.50 | 3.54 | 0.70 | |||||||||||||||
| A Shares | 1,000.00 | 1,020.50 | 4.55 | 0.90 | ||||||||||||||||
| C Shares | 1,000.00 | 1,016.80 | 8.32 | 1.65 | ||||||||||||||||
Seix Ultra-Short Bond Fund | I Shares | 1,000.00 | 1,023.40 | 1.62 | 0.32 | |||||||||||||||
Seix Virginia Intermediate Municipal Bond Fund | I Shares | 1,000.00 | 1,021.80 | 3.29 | 0.65 | |||||||||||||||
| A Shares | 1,000.00 | 1,021.20 | 3.89 | 0.77 | ||||||||||||||||
| * | Expenses are equal to the average account value times the Fund’s annualized expense ratio multiplied by the number of days in the most recent fiscal half-year divided by the number of days in the fiscal year. |
| ** | Annualized. |
| *** | IS Shares for Seix Core Bond Fund commenced operations on August 3, 2015. Expenses (hypothetical expenses if IS Shares had been in existence from April 1, 2015) are equal to the Fund’s annualized expense ratio, multiplied by the average account value over the period, multiplied by 183 (the number of days in the most recent six-month period), then divided by 366. |
Proxy Voting Information
Information regarding the policies and procedures that the Funds use to determine how to vote proxies relating to portfolio securities is available without charge, upon request, by calling 1-888-784-3863. The information also is included in the Funds’ Statement of Additional Information, which is available on the Funds’ website at www.ridgeworth.com and on the Securities and Exchange Commission’s (“SEC”) website at www.sec.gov.
Information relating to how each Fund voted proxies relating to portfolio securities held during the most recent twelve months ended June 30 is available on the Funds’ website at www.ridgeworth.com and on the SEC’s website at www.sec.gov.
Quarterly Portfolio Holdings Information
The Funds file their complete schedule of portfolio holdings with the SEC for the first and third quarters of each fiscal year on Form N-Q. The Funds’ Forms N-Q are available free of charge on the SEC’s website at www.sec.gov. You may also review or, for a fee, copy those documents by visiting the SEC’s Public Reference Room in Washington, D.C. Information on the operation of the Public Reference Room may be obtained by calling the SEC at 1-800-SEC-0330.
167
Table of Contents
INVESTMENT ADVISER:
RidgeWorth Investments
3333 Piedmont Road, NE, Suite 1500
Atlanta, Georgia 30305
www.ridgeworth.com
INVESTMENT SUBADVISER:
Seix Investment Advisors LLC
One Maynard Drive
Suite 3200
Park Ridge, NJ USA 07656
www.seixadvisors.com
This information must be preceded or accompanied by a current prospectus for each Fund described. Before investing, investors should carefully read the prospectus or summary prospectus and consider the fund’s investment objectives, risks, charges and expenses. Please call 888.784.3863 or visit ridgeworth.com to obtain a prospectus or summary prospectus, which contains this and other information about the funds.
DISTRIBUTOR:
RIDGEWORTH DISTRIBUTORS LLC
RFAR-FI-0316

Table of Contents
Item 2. Code of Ethics.
| (a) | RidgeWorth Funds (the “Registrant”) has adopted a Code of Ethics that applies to the Registrant’s principal executive officer and principal financial officer. |
| (b) | No disclosures are required by this Item 2(b). |
| (c) | The Registrant has not made any amendments to its Code of Ethics during the reporting period for this Form N-CSR. |
| (d) | There have been no waivers granted by the Registrant to individuals covered by the Registrant’s Code of Ethics during the reporting period for this Form N-CSR. |
| (e) | Not applicable. |
| (f) | A copy of the Registrant’s Code of Ethics is attached as an exhibit to this Form N-CSR. |
Item 3. Audit Committee Financial Expert.
| (a) (1) | The Board of Trustees of the Registrant has determined that the Registrant has at least one member serving on the Registrant’s Audit Committee that possesses the attributes identified in Instruction 2(b) of Item 3 to Form N-CSR to qualify as “audit committee financial expert.” |
| (2) | The names of the audit committee financial expert are Connie D. McDaniel and Tim E. Bentsen. Each audit committee financial expert has been deemed to be “independent” as that term is defined in Item 3(a)(2) of Form N-CSR. |
Item 4. Principal Accountant Fees and Services.
(a) Audit Fees – The aggregate fees billed for the last two fiscal years ended March 31 for professional services rendered by the principal accountant to the Registrant for the annual audit of the Registrant’s financial statements or services normally provided by the accountant in connection with statutory and regulatory filings or engagements for those fiscal years are set forth below.
| March 31, 2016 | March 31, 2015 | |||
Audit Fees | $474,230 | $483,490 |
(b) Audit-Related Fees – The aggregate fees billed for the last two fiscal years ended March 31 for professional services rendered by the principal accountant to the Registrant for assurance and related services rendered by the principal accountant to the Registrant that are reasonably related to the performance of the audit of the Registrant’s financial statements and are not reported under paragraph (a) of this Item 4 are set forth below.
| March 31, 2016 | March 31, 2015 | |||
Audit-Related Fees | $0 | $0 |
There were no fees billed for the last two fiscal years ended March 31 for assurance and related services rendered by the principal accountant to the investment adviser that are reasonably related to the performance of the audit of the Registrant’s financial statements that were required to be pre-approved by the Audit Committee as described in paragraph (e)(1) of this Item 4.
Table of Contents
(c) Tax Fees – The aggregate fees billed for the last two fiscal years ended March 31 for professional services rendered by the principal accountant to the Registrant for tax compliance, tax advice and tax planning are set forth below. The principal accountant is engaged to review and sign the Federal Income and Excise returns, along with reviewing excise distributions.
| March 31, 2016 | March 31, 2015 | |||
Tax Fees | $177,364 | $186,500 |
There were no fees billed for the last two fiscal years ended March 31 for professional services rendered by the principal accountant to the investment adviser for tax compliance, tax advice and tax planning that were required to be pre-approved by the Audit Committee as described in paragraph (e)(1) of this Item 4.
(d) All Other Fees – The aggregate fees billed for the last two fiscal years ended March 31 for products and services provided by the principal accountant to the Registrant, other than the services reported in paragraphs (a) – (c) of this Item 4 are set forth below.
| March 31, 2016 | March 31, 2015 | |||
All Other Fees | $0 | $0 |
There were no fees billed for the last two fiscal years ended March 31 for products and services provided by the principal accountant to the investment adviser that were required to be pre-approved by the Audit Committee as described in paragraph (e)(1) of this Item 4.
(e)(1) Audit Committee’s Pre-Approval Policies and Procedures
RIDGEWORTH FUNDS
Audit and Non-Audit Services Pre-Approval Policy
| I. | Statement of Principles |
As set forth in the chart below, the Sarbanes-Oxley Act of 2002 (the “Act”), and rules adopted by the Securities and Exchange Commission (“SEC”) require that the Audit Committee of the Board of Trustees pre-approve all audit services and non-audit services provided to RidgeWorth Funds (the “Trust”) and its portfolios (the “Funds”) by its independent accountant (“Auditor”), as well as non-audit services provided by the Auditor to the Funds’ investment adviser and to affiliates of the adviser that provide ongoing services to the Funds (“Service Affiliates”), listed on Appendix A, if the services directly impact the Funds’ operations and financial reporting.1
Where Pre-Approval is Required
| Audit Service | Non-Audit Service | |||
Fund | Yes | Yes | ||
Adviser | No | Yes, if directly related to Fund operation and financial reporting | ||
Service Affiliate | No | Yes, if directly related to Fund operation and financial reporting |
| 1 | The Audit Committee also is permitted to ratify the provision of inadvertent non-audit services, but only if: |
| ¡ | the value of all such services do not exceed 5% of total revenues paid by the Trust and Service Affiliates to the Auditor in the fiscal year when services are provided; |
| ¡ | the services were not recognized as non-audit services at the time they were provided; and |
| ¡ | the services are promptly brought to the attention of the Audit Committee and approved prior to the completion of the audit. |
Table of Contents
The following policies and procedures (except Section IX) govern the ways in which the Audit Committee will pre-approve audit and various types of non-audit services that the Auditor provides to the Trust and to Service Affiliates. These policies and procedures do not apply in the case of audit services that the Auditor provides to Service Affiliates, nor do they apply to services that an audit firm other than the Auditor provides to such entities.
These policies and procedures comply with the requirements for pre-approval, but also provide a mechanism by which management of the Trust may request and secure pre-approval of audit and non-audit services in an orderly manner with minimal disruption to normal business operations. Pre-approval of non-audit services by the Auditor may be achieved through a combination of the procedures described in Section VI below.
With respect to non-audit services that may be provided to the Trust by an accounting firm other than the Auditor, the Chairperson of the Audit Committee is authorized to pre-approve such services in accordance with the procedures described in Section IX below.
| II. | Audit Services |
The annual audit services engagement scope and terms will be subject to the specific pre-approval of the Audit Committee. Audit services include the annual financial statement audit (including required rating agency reviews) and other procedures required to be performed by the independent auditor to be able to form an opinion on the Trust’s financial statements. The Audit Committee will monitor the audit services engagement throughout the year and will also approve, if necessary, any changes in terms and conditions resulting from changes in audit scope, Fund structure or other items. The Audit Committee will pre-approve all audit services for the Trust.
| III. | Audit-related Services |
Audit-related services are assurance and related services that are reasonably related to the performance of the audit or review of the Trust’s financial statements or that are traditionally performed by the Auditor. The Audit Committee will pre-approve all audit-related services for the Trust.
| IV. | Tax Services |
Tax services to the Trust include tax compliance, tax planning and tax advice. The Audit Committee will review all proposed tax related services to assure that their provision would not impair the independence of the Auditor. The Audit Committee will pre-approve all tax services for the Trust.
| V. | All Other Services |
While the SEC’s rules prohibit the Auditor from providing specific non-audit services, as listed on Appendix A, certain other types of non-audit services are permitted. Accordingly, the Audit Committee believes it may pre-approve those permissible non-audit services classified as All Other Services that it believes would not impair the independence of the Auditor, and are consistent with the SEC’s rules on auditor independence. The Audit Committee will pre-approve all other services for the Trust.
| VI. | Procedures |
| A. | Regular Pre-Approval Procedures |
The Audit Committee shall pre-approve at its regularly scheduled meetings the audit, audit-related, tax and other non-audit services to be rendered by the Auditor to the Trust and those non-audit services to be rendered by the Auditor to the Service Affiliates that require pre-approval by the Audit Committee. In connection with such pre-approvals, the Auditor, or the President and/or Treasurer with the assistance of the Auditor, shall provide the Audit Committee with a report containing information about each type of service to be pre-approved at the meeting, an explanation of why the service is being performed, and projected fees.
Table of Contents
The Auditor shall notify the President, Treasurer, and Chairperson of the Audit Committee as soon as practicable regarding its engagement to provide Fund-related non-audit services to Service Affiliates.
| B. | Interim Pre-Approval Procedures |
If, in the opinion of the President and/or Treasurer, a proposed engagement needs to commence before the next regularly scheduled Audit Committee meeting, the Chairperson of the Audit Committee (the “Chairperson”) is authorized to pre-approve the engagement so long as the amount to be paid to the Auditor would not exceed $50,000. The President and/or Treasurer will coordinate with the Chairperson and provide to the Chairperson, with the assistance of the Auditor, information about the service to be considered for pre-approval. The Auditor may not commence the engagement under consideration until the President and/or Treasurer has indicated that pre-approval has been obtained from the Chairperson. The Chairperson will report any interim pre-approval decisions to the Audit Committee at its next regularly scheduled meeting.
| VII. | Recordkeeping |
The Trust shall maintain a written record of all decisions made by the Audit Committee or by the Chairperson of the Audit Committee pursuant to these procedures, together with appropriate supporting material. In connection with the ratification of any inadvertent non-audit services, a record shall be made indicating that each of the conditions for this exception to the pre-approval requirement has been satisfied.
| VIII. | Amendment |
The Audit Committee may review and amend these policies and procedures from time to time as it deems appropriate.
| IX. | Interim Pre-Approval of Non-Audit Services By Other Accounting Firms |
If, in the opinion of the President and/or Treasurer, a proposed engagement for non-audit services to the Trust by an accounting firm other than the Auditor needs to commence before the next regularly scheduled Audit Committee meeting, the Chairperson is authorized to pre-approve the engagement so long as the amount to be paid to the accounting firm would not exceed $50,000. The Chairperson will report any interim pre-approval decisions to the Audit Committee at its next regularly scheduled meeting.
Adopted: March 1, 2012
Appendix A
Service Affiliates Subject to Pre-Approval of Non-Audit Services
Including, but not limited to:
RidgeWorth Capital Management LLC and its subsidiaries.
Zevenbergen Capital Investments LLC
Table of Contents
Prohibited Non-Audit Services
| • | Bookkeeping or other services related to the accounting records or financial statements of the audit client; |
| • | Financial information systems design and implementation; |
| • | Appraisal or valuation services, fairness opinions, or contribution-in-kind reports; |
| • | Actuarial services; |
| • | Internal audit outsourcing services; |
| • | Management functions or human resources; |
| • | Broker or dealer, investment adviser, or investment banking services; |
| • | Legal services and expert services unrelated to the audit. |
(e)(2) Percentage of Services – None of the services summarized in paragraphs (b)-(d), above, were approved by the Audit Committee pursuant to Rule 2-01(c)(7)(i)(C) of Regulation S-X.
(f) No disclosures are required by this Item 4(f).
(g) The aggregate non-audit fees billed for the last two fiscal years ended March 31 for services rendered by the principal accountant to the Registrant are set forth below.
March 31, 2016 | March 31, 2015 | |
$161,264 | $179,000 |
The approximate aggregate non-audit fees billed for the last two fiscal years ended March 31 for services rendered by the Registrant’s principal accountant to the Registrant’s investment adviser, and any other entity controlling, controlled by, or under common control with the Registrant’s investment adviser that provides ongoing services to the Registrant are set forth below.
March 31, 2016 | March 31, 2015 | |
$0 | $0 |
Services for which the non-audit fees were billed relate principally to mortgage compliance reviews, general corporate and state and local tax assistance and accounting matters, and various strategic reporting consulting projects.
(h) In regards to Item 4(g), the Audit Committee has considered that the provision of non-audit services that were rendered to the Registrant’s investment adviser (not including any sub-adviser whose role is primarily portfolio management and is subcontracted with or overseen by another investment adviser), and any entity controlling, controlled by, or under common control with the investment adviser that provides ongoing services to the Registrant that were not pre-approved pursuant to paragraph (c)(7)(ii) of Rule 2-01 of Regulation S-X is compatible with maintaining the principal accountant’s independence.
Item 5. Audit Committee of Listed Registrants.
Not applicable.
Table of Contents
Item 6. Schedule of Investments.
| (a) | Schedule of Investments is included as a part of the reports to shareholders filed under Item 1 of this Form N-CSR. |
| (b) | Not applicable. |
Item 7. Disclosure of Proxy Voting Policies and Procedures for Closed-End Management Investment Companies.
Not applicable.
Item 8. Portfolio Managers of Closed-End Investment Companies.
Not applicable.
Item 9. Purchases of Equity Securities by Closed-End Management Investment Company and Affiliated Purchasers.
Not applicable.
Item 10. Submission of Matters to a Vote of Security Holders.
The Board of Trustees has not adopted formal procedures by which shareholders may recommend nominees to the Board of Trustees.
Item 11. Controls and Procedures.
(a) The Registrant’s principal executive officer and principal financial officer have concluded, based on their evaluation of the Registrant’s disclosure controls and procedures as conducted within 90 days of the filing date of this report, that these disclosure controls and procedures are adequately designed and are operating effectively to ensure that information required to be disclosed by the Registrant on Form N-CSR is recorded, processed, summarized and reported within the time periods specified in the Securities and Exchange Commission’s rules and forms.
(b) There were no changes in the Registrant’s internal control over financial reporting that occurred during the second fiscal quarter of the period covered by this report that have materially affected or are reasonably likely to materially affect, the Registrant’s internal control over financial reporting.
Item 12. Exhibits.
| (a) (1) | Code of Ethics described in Item 2 is attached hereto. |
| (2) | The certifications required by Rule 30a-2(a) of the 1940 Act are attached hereto. |
| (3) | Not applicable. |
(b) The certifications required by Rule 30a-2(b) of the 1940 Act and Section 906 of the Sarbanes-Oxley Act of 2002 are attached hereto.
Table of Contents
SIGNATURES
Pursuant to the requirements of the Securities Exchange Act of 1934 and the Investment Company Act of 1940, the Registrant has duly caused this report to be signed on its behalf by the undersigned, thereunto duly authorized.
| RIDGEWORTH FUNDS | ||
| By: | /s/ Julia R. Short | |
| Julia R. Short | ||
| President | ||
| Date: | June 3, 2016 | |
Pursuant to the requirements of the Securities Exchange Act of 1934 and the Investment Company Act of 1940, this report has been signed below by the following persons on behalf of the Registrant and in the capacities and on the dates indicated.
| By: | /s/ Julia R. Short | |
| Julia R. Short | ||
| President | ||
| Date: | June 3, 2016 | |
| By: | /s/ Benjamin H. Lowe | |
| Benjamin H. Lowe | ||
| Treasurer | ||
| Date: | June 3, 2016 | |