FORM 6-K
SECURITIES AND EXCHANGE COMMISSION
Washington, D.C. 20549
Report of Foreign Private Issuer
Pursuant to Rule 13a-16 or 15d-16
of the Securities Exchange Act of 1934
For the month of October, 2010
Commission File Number 1-11080
Commission File Number 1-11080
THE ICA CORPORATION
(Translation of registrant's name into English)
(Translation of registrant's name into English)
Blvd. Manuel Avila Camacho 36
Col. Lomas de Chapultepec
Del. Miguel Hidalgo
11000 Mexico City
Mexico
(Address of principal executive offices)
Col. Lomas de Chapultepec
Del. Miguel Hidalgo
11000 Mexico City
Mexico
(Address of principal executive offices)
Indicate by check mark whether the registrant files or will file annual reports under cover Form 20-F or Form 40-F.
Form 20-F.....x.... Form 40-F.........
Indicate by check mark if the registrant is submitting the Form 6-K in paper as permitted by Regulation S-T Rule 101(b)(1): ____
Indicate by check mark if the registrant is submitting the Form 6-K in paper as permitted by Regulation S-T Rule 101(b)(7): ____
Indicate by check mark whether by furnishing the information contained in this Form, the registrant is also thereby furnishing the information to the Commission pursuant to Rule 12g3-2(b) under the Securities Exchange Act of 1934.
Yes ..... No...x...
If "Yes" is marked, indicate below the file number assigned to the registrant in connection with Rule 12g3-2(b): 82- ________
| | EARNINGS REPORT |
Third Quarter 2010 Earnings Report
October 22, 2010
Empresas ICA, S.A.B. de C.V. (BMV and NYSE: ICA), the largest engineering, construction, procurement and infrastructure company in Mexico, announced today its unaudited results for the third quarter of 2010.
Summary
| Summary | 9 months | |||||||||||||||||||||||
| (Ps. million) | 3Q09 | 3Q10 | % Chg | 2009 | 2010 | % Chg | ||||||||||||||||||
| Revenues | 7,672 | 9,454 | 23 | 22,419 | 25,815 | 15 | ||||||||||||||||||
| Operating Income | 670 | 663 | (1 | ) | 1,909 | 1,946 | 2 | |||||||||||||||||
| Income before Taxes | 349 | 238 | (32 | ) | 1,084 | 1,104 | 2 | |||||||||||||||||
| Consolidated Net Income | 212 | 150 | (29 | ) | 727 | 745 | 3 | |||||||||||||||||
| Net Income of Majority Interest | 134 | 121 | (10 | ) | 533 | 589 | 10 | |||||||||||||||||
| Adjusted EBITDA | 1,164 | 1,411 | 21 | 3,380 | 3,960 | 17 | ||||||||||||||||||
| Adjusted EBITDA excluding Airports provision | 1,164 | 1,556 | 34 | 3,380 | 4,118 | 22 | ||||||||||||||||||
| Operating Margin | 8.7 | % | 7.0 | % | 8.5 | % | 7.5 | % | ||||||||||||||||
| Adjusted EBITDA Margin | 15.2 | % | 14.9 | % | 15.1 | % | 15.3 | % | ||||||||||||||||
| Adjusted EBITDA Margin excluding Airports provision | 15.2 | % | 16.5 | % | 15.1 | % | 16.0 | % | ||||||||||||||||
| EPS (Ps.) | 0.21 | 0.19 | 0.99 | 0.91 | ||||||||||||||||||||
| EPADS (US$) | 0.07 | 0.06 | 0.32 | 0.29 | ||||||||||||||||||||
| Construction Backlog | 39,664 | 33,733 | (15 | ) | ||||||||||||||||||||
ICA’s major business units continued to develop during the third quarter of 2010, achieving double-digit growth in consolidated revenues and Adjusted EBITDA, with increases of 23% and 21%, respectively. The Airports division created a Ps. 145 million provision during the quarter as a result of the bankruptcy filing of the Grupo Mexicana airlines, which negatively affected our results. Excluding this effect, Adjusted EBITDA would have increased 34%, with an Adjusted EBITDA margin of 16.5%.
For the first nine months of 2010, ICA’s revenues and Adjusted EBITDA recorded double-digit growth rates of 15% and 17%, respectively, despite the provision in the Airports division. Net income of majority interest for the first nine months of 2010 was Ps. 589 million, an increase of 10% as compared to the prior year period.
High levels of work continued to be executed on the major civil construction projects including Mexico City’s Metro Line 12, the La Yesca Hydroelectric project, and the Eastern Outlet Tunnel. In Industrial Construction, the four clean fuels projects that were awarded last year and in the first months of the current year began generating significant revenues. As a result, Industrial construction Adjusted EBITDA increased 21% during the quarter. Our construction backlog was Ps. 33,733 million as of September 30, 2010.
| For more information contact: | ||
Alonso Quintana (5255) 5272 9991 x 3653 alonso.quintana@ica.com.mx | Luz Montemayor (5255) 5272 9991 x 3692 luz.montemayor@ica.com.mx | In the United States: Zemi Communications |
Luciana Garcia (5255) 5272 9991 x 3664 luciana.garcia@ica.com.mx | José Eduardo Ontiveros (5255) 5272 9991 x 3678 jose.ontiveros@ica.com.mx | Daniel Wilson (212) 689 9560 dbmwilson@zemi.com |
| | EARNINGS REPORT |
In the concessions division, the Queretaro-Irapuato public-private partnership (PPP) highway went into service in July 2010, increasing to six the total number of operating highway concessions. Housing results also improved, principally because of the consolidation of Los Portales in the results of this segment. Airports recorded growth in passenger traffic, cargo, and double-digit increases in both aeronautical and non-aeronautical revenues.
One of ICA’s medium-term objectives is to develop and sustain a balanced mix of businesses in the construction, infrastructure operations, and housing sectors. We believe that this will maximize growth opportunities, and increase the return on equity. The key to executing this strategy has been and will continue to be to increase significantly our participation in the infrastructure sector. At the same time, our infrastructure investments should be seen as an actively managed portfolio of investments; some will be held to maturity, others will be monetized prior to maturity, based on market developments or opportunities to redeploy capital in new projects.
It is in keeping with this objective that ICA entered into a preliminary, non-binding agreement during the quarter with its tollroad affiliate Red de Carreteras de Occidente (RCO) to transfer two of its PPP highways to RCO in exchange for an increased shareholding in RCO and some cash. (See Current Developments for additional details.)
INVESTOR RELATIONS | www.ica.com.mx | 2/24 |
| | EARNINGS REPORT |
Construction Business Unit
Civil Construction
| 9 months | ||||||||||||||||||||||||
| Civil Construction | 3Q09 | 3Q10 | % Chg | 2009 | 2010 | % Chg | ||||||||||||||||||
| Revenues | 4,629 | 6,144 | 33 | 13,598 | 16,672 | 23 | ||||||||||||||||||
| Operating Income | 252 | 265 | 5 | 689 | 681 | (1 | ) | |||||||||||||||||
| Adjusted EBITDA | 471 | 613 | 30 | 1,238 | 1,502 | 21 | ||||||||||||||||||
| Operating Margin | 5.4 | % | 4.3 | % | 5.1 | % | 4.1 | % | ||||||||||||||||
| Adjusted EBITDA Margin | 10.2 | % | 10.0 | % | 9.1 | % | 9.0 | % | ||||||||||||||||
| Debt | 6,809 | 12,434 | ||||||||||||||||||||||
| Cash and Cash Equivalents | 1,111 | 873 | ||||||||||||||||||||||
| Backlog | 32,309 | 24,530 | (24 | ) | ||||||||||||||||||||
| · | Civil Construction revenues increased principally as a result of execution of the Mexico City Metro Line 12 and the La Yesca hydroelectric project, and projects such as the Eastern Outlet Tunnel. |
| · | Adjusted EBITDA increased as a result of the execution of the projects mentioned above, an increase in depreciation and amortization, as well as the interest expense included in cost of sales for La Yesca. |
| · | Debt increased principally due to additional draws on the La Yesca debt facility as a result of approved certifications for completed work on the project. The La Yesca hydroelectric project, which has been undertaken under the financed public works mechanism, accounted for 60% of debt in Civil Construction. The debt is expected to be repaid in full upon project completion. |
| Largest revenue contribution projects | Executed Work 3Q10 (Ps. Million) | Scheduled Completion |
| Line 12 Mexico City Subway | 1,691 | 2Q12 |
| La Yesca Hydroelectric Project | 934 | 4Q12 |
| Eastern Outlet Tunnel | 292 | 2Q13 |
| Rio de los Remedios Ecatepec Highway | 495 | 1Q11 |
| Nuevo Necaxa - Tihuatlán Highway | 244 | 2Q12 |
INVESTOR RELATIONS | www.ica.com.mx | 3/24 |
| | EARNINGS REPORT |
Industrial Construction
| 9 months | ||||||||||||||||||||||||
| Industrial Construction | 3Q09 | 3Q10 | % Chg | 2009 | 2010 | % Chg | ||||||||||||||||||
| Revenues | 947 | 1,152 | 22 | 3,192 | 2,731 | (14 | ) | |||||||||||||||||
| Operating Income | 22 | 28 | 26 | 164 | 69 | (58 | ) | |||||||||||||||||
| Adjusted EBITDA | 33 | 40 | 21 | 220 | 117 | (47 | ) | |||||||||||||||||
| Operating Margin | 2.3 | % | 2.4 | % | 5.1 | % | 2.5 | % | ||||||||||||||||
| Adjusted EBITDA Margin | 3.5 | % | 3.4 | % | 6.9 | % | 4.3 | % | ||||||||||||||||
| Debt | 520 | 254 | ||||||||||||||||||||||
| Cash and Cash Equivalents | 608 | 464 | ||||||||||||||||||||||
| Backlog | 6,889 | 8,963 | 30 | |||||||||||||||||||||
| · | Revenues increased compared to 3Q09 because of the execution of projects including the Poza Rica cryogenic plant and the four clean fuels projects at the Salina Cruz, Madero, Cadereyta, and Minatitlán refineries, which were not generating revenues in the prior year period. |
| · | Debt decreased principally as a result of a lower requirement for working capital financing on the Chicontepec II project, and the completion of the financing for the Dos Bocas terminal project. |
| · | Industrial Construction backlog increased 30% as compared to September 30, 2009 as a result of the award of new projects including the clean fuels projects for the Minatitlán and Salina Cruz refineries and increases in other previously awarded contracts during 3Q10. Industrial Construction backlog accounts for 27% of total Backlog, as compared to 9% as of September 30, 2009. |
| Largest revenue contribution projects | Executed Work 3Q10 (Ps. Million) | Scheduled Completion |
| Poza Rica 1 Criogenic Plant | 211 | 4Q11 |
| Madero Clean Gasoline Plant | 176 | 1Q13 |
| Cadereyta Clean Gasoline Plant | 153 | 3Q12 |
INVESTOR RELATIONS | www.ica.com.mx | 4/24 |
| | EARNINGS REPORT |
Rodio
| 9 months | ||||||||||||||||||||||||
| Rodio | 3Q09 | 3Q10 | % Chg | 2009 | 2010 | % Chg | ||||||||||||||||||
| Revenues | 461 | 314 | (32 | ) | 1,296 | 1,134 | (12 | ) | ||||||||||||||||
| Operating Income | 24 | (23 | ) | 39 | 14 | (64 | ) | |||||||||||||||||
| Adjusted EBITDA | 40 | (2 | ) | 91 | 64 | (30 | ) | |||||||||||||||||
| Operating Margin | 5.2 | % | -7.3 | % | 3.0 | % | 1.3 | % | ||||||||||||||||
| Adjusted EBITDA Margin | 8.6 | % | -0.5 | % | 7.1 | % | 5.6 | % | ||||||||||||||||
| Debt | 227 | 189 | ||||||||||||||||||||||
| Cash and Cash Equivalents | 52 | 77 | ||||||||||||||||||||||
| Backlog | 466 | 240 | (49 | ) | ||||||||||||||||||||
| · | Despite positive results in Morocco, Central America, and Mexico, revenues and operating margins decreased because of the economic recession in Spain and Portugal. The infrastructure market in Spain has been affected by cuts in government budgets, which resulted in the cancellation of some projects and delays in the startup of others. |
| · | Rodio has implemented a restructuring to adapt the organization to current market conditions and has created a provision for this restructuring. |
INVESTOR RELATIONS | www.ica.com.mx | 5/24 |
| | EARNINGS REPORT |
Construction Backlog
| As of September 30, 2010 | Current Backlog | Termination Date | Total Contract (Ps. million) | Project Progress (%) | |
| Civil Construction | 72% | 24,530 | |||
| Mitla Tehuantepec Highway | 5,567 | 4Q13 | 5,591 | 0 | |
| Eastern Outlet Tunnel | 3,152 | 2Q13 | 4,729 | 33 | |
| Rio de los Remedios Ecatepec Highway | 2,350 | 1Q11 | 5,134 | 54 | |
| Atotonilco Water Treatment Plant | 1,743 | 3Q13 | 1,743 | 0 | |
| Line 12 Mexico City Subway | 1,441 | 2Q12 | 7,923 | 82 | |
| La Yesca Hydroelectric Project | 1,434 | 4Q12 | 10,223 | 86 | |
| PAC-4 | 1,381 | 4Q13 | 1,443 | 4 | |
| Nuevo Necaxa - Tihuatlán Highway | 1,315 | 2Q12 | 1,798 | 27 | |
| El Realito Aqueduct | 1,053 | 1Q12 | 1,053 | 0 | |
| Rio Verde - Ciudad Valles Highway | 1,035 | 3Q11 | 2,617 | 60 | |
| Other Civil Construction Projects | 4,061 | ||||
| Industrial Construction | 27% | 8,963 | |||
| Salina Cruz Clean Gasoline Plant | 2,219 | 2Q13 | 2,357 | 6 | |
| Madero Clean Gasoline Plant | 2,047 | 1Q13 | 2,434 | 16 | |
| Minatitlán Clean Gasoline Plant | 1,537 | 2Q13 | 1,603 | 4 | |
| Cadereyta Clean Gasoline Plant | 1,451 | 3Q12 | 1,762 | 18 | |
| Poza Rica Criogenic Plant | 996 | 4Q11 | 1,788 | 44 | |
| Other Industrial Construction Projects | 714 | ||||
| Rodio | 1% | 240 | |||
| Projects in Spain, Morocco, Mexico and Central America | 240 | ||||
| Total | 33,733 | ||||
· | Construction backlog was Ps. 33,733 million as of September 30, 2010. Civil Construction accounted for 72% of backlog, Industrial Construction 27%, and Rodio 1%. Backlog was the equivalent of 13 months work at 3Q10 levels. |
| · | Net contract additions and new contracts totaled Ps. 1,635 million in 3Q10. The largest portion of the increase resulted from additions to existing contracts. |
| · | 44% of Backlog corresponded to the Mitla-Tehuantepec highway, the Atotonilco water treatment plant, and the four clean fuels projects. In aggregate, these projects were 7% completed as of September 30, 2010. |
| · | 59% of projects were fixed price contracts, 15% were unit price contracts, and 26% had both unit price and fixed price components. |
| · | Foreign currency denominated projects were 26% of Backlog. These included the La Yesca hydroelectric project, the Poza Rica cryogenic plant, a portion of the clean fuels projects, and the PAC-4 contract in Panama. |
| · | The ratio of new contracts to construction revenues (the book and burn ratio) was 0.21 during 3Q10. |
INVESTOR RELATIONS | www.ica.com.mx | 6/24 |
| | EARNINGS REPORT |
| Backlog | million pesos | Projected Months of Work * | ||||||
| Balance, June 30, 2010 | 39,709 | 17 | ||||||
| New contracts and net contract additions | 1,635 | 1 | ||||||
| Work executed | 7,611 | 3 | ||||||
| Balance, September 30, 2010 | 33,733 | 13 | ||||||
| Share of Backlog | ||||||||
| Projects in Mexico | 95 | % | ||||||
| Projects outside Mexico | 5 | % | ||||||
| Public sector clients | 97 | % | ||||||
| Private sector clients | 3 | % | ||||||
| * Estimated using construction revenues of 3Q10 | ||||||||
Infrastructure
Concessions
| 9 months | ||||||||||||||||||||||||
| Concessions | 3Q09 | 3Q10 | % Chg | 2009 | 2010 | % Chg | ||||||||||||||||||
| Total Revenues | 602 | 696 | 16 | 1,668 | 1,979 | 19 | ||||||||||||||||||
| Traffic | 311 | 320 | 3 | 900 | 944 | 5 | ||||||||||||||||||
| Financial | 132 | 170 | 29 | 327 | 512 | 57 | ||||||||||||||||||
| Services | 83 | 113 | 35 | 242 | 300 | 24 | ||||||||||||||||||
| Construction | 76 | 93 | 23 | 200 | 223 | 12 | ||||||||||||||||||
| Operating Income | 122 | 119 | (3 | ) | 413 | 473 | 14 | |||||||||||||||||
| Adjusted EBITDA | 290 | 367 | 27 | 876 | 1,186 | 35 | ||||||||||||||||||
| Operating Margin | 20.3 | % | 17.1 | % | 24.8 | % | 23.9 | % | ||||||||||||||||
| Adjusted EBITDA Margin | 48.1 | % | 52.6 | % | 52.5 | % | 59.9 | % | ||||||||||||||||
| Debt | 10,004 | 12,124 | 21 | |||||||||||||||||||||
| Cash and Cash Equivalents | 1,854 | 1,502 | (19 | ) | ||||||||||||||||||||
| · | The Queretaro-Irapuato PPP highway started operations in July 2010, becoming ICA’s sixth operating highway concession. |
| · | Revenues increased compared to 3Q09 principally because of an increase in revenues generated by projects under construction, principally the Nuevo Necaxa-Tihuatlán, Rio Verde-Ciudad Valles, and Querétaro- Irapuato highways. |
| · | Adjusted EBITDA increased principally as a result of an increase in net interest expense included in cost of sales from the growing number of financed projects under construction, as well as a reduction in the costs of some operating concessions. |
| · | Debt increased as a result of the advance in the execution of projects that are under construction, principally the Río Verde-Ciudad Valles highway, the Nuevo Necaxa-Tihuatlán highway, Aqueduct II, and the La Piedad bypass. |
| · | ICA has five concessioned water projects and 11 highways. Of the 16 concessions, seven are in operation. |
INVESTOR RELATIONS | www.ica.com.mx | 7/24 |
| | EARNINGS REPORT |
| Highways | % Ownership | Equity + Debt | Length (km) | Type | Beg. of Operations | Avg. Daily Traffic Volume (ADTV) | |||
| Startup | 3Q09 | 3Q10 | 9M09 | 9M10 | |||||
| Acapulco Tunnel | 100% | 1,814 | 6 | Toll | 1994 | 9,321 | 8,975 | 8,626 | 8,269 |
| Corredor Sur | 100% | 2,367 | 20 | Toll | 2000 | 43,418 | 46,928 | 42,600 | 47,527 |
| RCO (FARAC 1) | 13.6% | 6,101 | 618 | Toll | 2007 | 9,036 | 9,332 | 7,966 | 8,591 |
| Mayab Consortium | 100% | 1,292 | 242 | Toll | 2008 | 2,711 | 2,614 | 2,001 | 2,018 |
| Irapuato- La Piedad | 100% | 813 | 74 | PPP | 2008 | 9,230 | 9,205 | 8,975 | 9,004 |
| Queretaro-Irapuato | 100% | 1,775 | 93 | PPP | 2010 | - | 14,983 | - | 14,673 |
| Under Construction | |||||||||
| Río Verde - Cd. Valles | 100% | 1,967 | 113 | PPP+Toll | 2011 | ||||
| La Piedad Bypass | 100% | 829 | 21 | PPP+Toll | 2011 | ||||
| Rio de los Remedios | 50% | 2,616 | 26 | Toll | 2011 | ||||
| N.Necaxa Tihuatlan | 50% | 1,725 | 85 | PPP+Toll | 2012 | ||||
| Mitla Tehuantepec | 100% | - | 169 | PPP+Toll | 2014 | ||||
| Water projects | % Ownership | Equity + Debt Investment | Capacity (m3 mm) | Type | Beg. of Operations | Total Volume (million m3) | |||
| 3Q09 | 3Q10 | 9M09 | 9M10 | ||||||
| Cd. Acuña | 100% | 318 | 0.5 | Tariff | 1998 | 2.61 | 1.04 | 7.56 | 6.67 |
| Under Construction | |||||||||
| Aqueduct II | 42% | 971 | 1.5 | Tariff | 2010 | ||||
| El Realito | 51% | 6 | 1.0 | Tariff | 2012 | ||||
| Agua Prieta | 50% | 4 | 8.5 | Tariff | 2012 | ||||
| Atotonilco | 10.2% | - | 42 | Tariff | 2013 | ||||
INVESTOR RELATIONS | www.ica.com.mx | 8/24 |
| | EARNINGS REPORT |
Airports
| 9 months | ||||||||||||||||||||||||
| Airports | 3Q09 | 3Q10 | % Chg | 2009 | 2010 | % Chg | ||||||||||||||||||
| Total Revenues | 488 | 569 | 17 | 1,414 | 1,608 | 14 | ||||||||||||||||||
| Aeronautical | 396 | 442 | 12 | 1,147 | 1,255 | 9 | ||||||||||||||||||
| Non- Aeronautical | 91 | 126 | 38 | 267 | 353 | 32 | ||||||||||||||||||
| Operating Income | 171 | 54 | (69 | ) | 490 | 411 | (16 | ) | ||||||||||||||||
| Adjusted EBITDA | 278 | 167 | (40 | ) | 792 | 746 | (6 | ) | ||||||||||||||||
| Adjusted EBITDA excluding Airports provision | 278 | 312 | 12 | 792 | 891 | 13 | ||||||||||||||||||
| Operating Margin | 35.1 | % | 9.4 | % | 34.6 | % | 25.5 | % | ||||||||||||||||
| Adjusted EBITDA Margin | 57.1 | % | 29.4 | % | 56.1 | % | 46.4 | % | ||||||||||||||||
| Adjusted EBITDA Margin excluding Airports provision | 57.1 | % | 54.9 | % | 56.1 | % | 55.4 | % | ||||||||||||||||
| Debt | 2,964 | 3,339 | 13 | |||||||||||||||||||||
| Cash and Cash Equivalents | 257 | 453 | 76 | |||||||||||||||||||||
| Total Assets | 10,746 | 10,487 | (2 | ) | ||||||||||||||||||||
9 months | ||||||||||||||||||||||||
| (millions) | 3Q09 | 3Q10 | % Chg | 2009 | 2010 | % Chg | ||||||||||||||||||
| Total passenger traffic | 2.97 | 3.10 | 4.3 | 8.72 | 8.78 | 0.6 | ||||||||||||||||||
| Domestic | 2.59 | 2.67 | 2.7 | 7.35 | 7.32 | (0.5 | ) | |||||||||||||||||
| International | 0.38 | 0.44 | 14.9 | 1.37 | 1.46 | 6.2 | ||||||||||||||||||
| Cargo Units (=100kg) | 0.19 | 0.24 | 28.9 | 0.50 | 0.68 | 35.8 | ||||||||||||||||||
| · | The Airports division includes Grupo Aeroportuario del Centro Norte (OMA), Aeroinvest, and Servicios de Tecnología Aeroportuaria (SETA). |
| · | During the third quarter of 2010, total revenues increased 17%; aeronautical revenues grew 12% and non-aeronautical revenues grew 38%. Noteworthy were the increased revenues generated by the NH Terminal 2 Hotel at the Mexico City International Airport, other leases (+25%), advertising (+22%), restaurants (+25%), and OMA Carga (+50%), as well as increases in passenger charges. As a result of the bankruptcy filing by the airlines of Grupo Mexicana (Mexicana de Aviación, Click Mexicana, and Mexicana Link) and their suspension of operations, the Company created a provision for Ps. 145 million, equivalent to 100% of Grupo Mexicana receivables. This provision is recorded under cost of services and affected operating income and Adjusted EBITDA. |
| · | Passenger traffic grew 4.3%. The NH Terminal 2 Hotel in the Mexico City International Airport continued to increase its average occupancy rate, reaching 71% in the quarter and 83% in September. |
| · | Operating income and Adjusted EBITDA decreased 69% and 40%, respectively, as a result of the Grupo Mexicana provision. Excluding this effect, Adjusted EBITDA would have increased 12% in 3Q10. |
| · | OMA has started the legal proceedings to recover the accounts receivable with Grupo Mexicana. |
| · | The earnings report of OMA, which is the operating company in the Airports segment, can be found at http://www.bmv.com.mx or http://ir.oma.aero. Those results differ from the ones presented here as a result of consolidation effects. |
INVESTOR RELATIONS | www.ica.com.mx | 9/24 |
| | EARNINGS REPORT |
Housing Development
| 9 months | ||||||
| Housing | 3Q09 | 3Q10 | % Chg | 2009 | 2010 | % Chg |
| Total Revenues | 572 | 794 | 39 | 1,617 | 2,203 | 36 |
| Operating Income | 35 | 93 | 167 | 116 | 206 | 78 |
| Adjusted EBITDA | 20 | 119 | 505 | 161 | 287 | 78 |
| Operating Margin | 6.1% | 11.8% | 7.2% | 9.4% | ||
| Adjusted EBITDA Margin | 3.4% | 15.0% | 10.0% | 13.0% | ||
| Net Income | 36 | 58 | 64 | 115 | 173 | 51 |
| Debt | 1,589 | 1,566 | (1) | |||
| Cash and Cash Equivalents | 74 | 146 | 96 | |||
| 9 months | ||||||
| Units Sold | 3Q09 | 3Q10 | % Chg | 2009 | 2010 | % Chg |
| Total | 1,727 | 1,832 | 6 | 4,931 | 5,080 | 3 |
| Entry level | 62% | 61% | 68% | 57% | ||
| Middle income | 11% | 8% | 10% | 8% | ||
| Economical | 14% | 22% | 8% | 24% | ||
| Traditional | 13% | 9% | 13% | 11% |
| · | Housing revenues increased principally because of the reclassification of our participation in Los Portales in this segment effective this quarter (See Notes) and the sale of a parcel of land in Cancún, which also positively affected the Adjusted EBITDA margin during the quarter. |
| · | The proportional share of Los Portales’ revenues in 3Q10 was Ps. 174 million. |
| · | ViveICA sold 1,832 units in 3Q10, at an average price of Ps. 304,813. |
| · | At the end of 3Q10, ViveICA had 25 projects underway in 11 states in Mexico. |
| · | The land reserve as of September 30, 2010 was 1,746 hectares, equivalent to 85,223 units. |
INVESTOR RELATIONS | www.ica.com.mx | 10/24 |
| | EARNINGS REPORT |
Consolidated Results
| Third Quarter | 9 months | |||||||||||||||||||||||
| 3Q09 | 3Q10 | % Chg | 2009 | 2010 | % Chg | |||||||||||||||||||
| (Ps. Million) | ||||||||||||||||||||||||
| Revenues | 7,672 | 9,454 | 23 | 22,419 | 25,815 | 15 | ||||||||||||||||||
| Costs | 6,471 | 8,101 | 25 | 19,001 | 22,099 | 16 | ||||||||||||||||||
| Gross profit | 1,201 | 1,352 | 13 | 3,419 | 3,716 | 9 | ||||||||||||||||||
| Selling, general and operating expenses | 531 | 689 | 30 | 1,510 | 1,769 | 17 | ||||||||||||||||||
| Operating Income | 670 | 663 | (1 | ) | 1,909 | 1,946 | 2 | |||||||||||||||||
| Other income (loss), net | (41 | ) | (77 | ) | 87 | 26 | (45 | ) | ||||||||||||||||
| Comprehensive financing (cost) | (219 | ) | (311 | ) | 42 | (600 | ) | (696 | ) | 16 | ||||||||||||||
| Interest Expense | (243 | ) | (328 | ) | 35 | (774 | ) | (866 | ) | 12 | ||||||||||||||
| Interest Income | 82 | 82 | 1 | 239 | 253 | 6 | ||||||||||||||||||
| Exchange (Loss) Gain | (56 | ) | (34 | ) | (38 | ) | (82 | ) | 10 | |||||||||||||||
| Financial derivative effects | (2 | ) | (31 | ) | 1,793 | 17 | (93 | ) | ||||||||||||||||
| Share in net income (loss) of affiliated companies | (61 | ) | (37 | ) | (39 | ) | (251 | ) | (101 | ) | (60 | ) | ||||||||||||
| Income before taxes | 349 | 238 | (32 | ) | 1,084 | 1,104 | 2 | |||||||||||||||||
| Taxes | 136 | 88 | (36 | ) | 358 | 359 | 0 | |||||||||||||||||
| Consolidated net income | 212 | 150 | (29 | ) | 727 | 745 | 3 | |||||||||||||||||
| Net income of minority interest | 79 | 29 | (63 | ) | 194 | 157 | (19 | ) | ||||||||||||||||
| Net income of majority interest | 134 | 121 | (10 | ) | 533 | 589 | 10 | |||||||||||||||||
| Adjusted EBITDA | 1,164 | 1,411 | 21 | 3,380 | 3,960 | 17 | ||||||||||||||||||
| Earnings per share (Ps.) | Ps. | 0.21 | Ps. | 0.19 | Ps. | 0.99 | Ps. | 0.91 | ||||||||||||||||
| Earnings per ADS (US$) | US$ | 0.07 | US$ | 0.06 | US$ | 0.32 | US$ | 0.29 | ||||||||||||||||
| Weighted average shares outstanding (millions) | 628.51 | 649.43 | 538.67 | 647.76 | ||||||||||||||||||||
| · | Revenues increased 23% to Ps. 9,454 million in 3Q10, as compared to Ps. 7,672 million in 3Q09. Five of the six divisions recorded growth in revenues. Civil Construction accounted for 85% of the increase in revenues, followed by Housing and Industrial Construction. |
| · | Cost of sales increased 25% during the quarter. Cost of sales includes a provision for doubtful accounts of Ps. 145 million in the Airports division. Cost of sales also includes interest expense on financed projects in Civil Construction, Industrial Construction, Concessions, and Housing. |
| · | Selling, general, and administrative expenses increased to 7.3% of revenues from 6.9% because of the addition of new business units, such as COTRISA and the proportional consolidation of Los Portales starting 2Q10, and an increase in bid preparation and promotion expenses. |
| · | Operating income was Ps. 663 million in 3Q10, a decrease of 1%. The Construction segment contributed 45% of operating income, Infrastructure 26%, and Housing 10%. The consolidated operating margin was 7.0%, as compared to 8.7% in 3Q09. Excluding OMA’s provision for Mexicana in the Airports division, operating income would have increased 21% and the operating margin would have been 8.5%. |
| · | Adjusted EBITDA was Ps. 1,411 million, an increase of 21% over 3Q09. Construction contributed 48% and Concessions 26% of the total. Adjusted EBITDA, excluding the effect of the Airports provision, would have increased 34%, with a margin of 16.5%. |
| · | Other Income (loss) was a loss of Ps. 77 million, as a result of a decrease in fixed assets and the provision of Rodio restructuring. |
| · | Comprehensive financing cost increased principally as a result of higher interest expense which was partially offset by a smaller exchange loss. |
INVESTOR RELATIONS | www.ica.com.mx | 11/24 |
| | EARNINGS REPORT |
| · | Share of net loss of unconsolidated affiliates was Ps. 37 million, as compared to a loss of Ps. 61 million in the prior year period. The improved result reflects improved results of Red de Carreteras del Occidente (RCO), the operator of the FARAC I tollroad. |
| · | Income before taxes totaled Ps. 238 million, a decrease of 32%. |
| · | Taxes were Ps. 88 million, with an effective tax rate was 37%. |
| · | Consolidated net income was Ps. 150 million in 3Q10, a decrease of 29%. |
| · | Net income of majority interest was Ps. 121 million, a decrease of 10%. |
| o | Earning per share were Ps. 0.19. |
| o | Earnings per ADS were US$ 0.06. |
Adjusted EBITDA
| (Ps. Million) | 3Q09 | 3Q10 | % Chg | 9M09 | 9M10 | % Chg | ||||||||||||||||||
| Net income of majority interest | 134 | 121 | (10 | ) | 533 | 589 | 10 | |||||||||||||||||
| Net income of minority interest | 79 | 29 | (63 | ) | 194 | 157 | (19 | ) | ||||||||||||||||
| Taxes | 136 | 88 | (36 | ) | 358 | 359 | 0 | |||||||||||||||||
| Share in (loss) income of affiliated companies | (61 | ) | (37 | ) | (39 | ) | (251 | ) | (101 | ) | (60 | ) | ||||||||||||
| Comprehensive financing (cost) | (219 | ) | (311 | ) | 42 | (600 | ) | (696 | ) | 16 | ||||||||||||||
| Other income (expense), net | (41 | ) | (77 | ) | 87 | 26 | (45 | ) | ||||||||||||||||
| Depreciation and amortization | 317 | 432 | 36 | 920 | 1,125 | 22 | ||||||||||||||||||
| Net interest expense included in cost of sales | 177 | 316 | 79 | 551 | 889 | 61 | ||||||||||||||||||
| Adjusted EBITDA | 1,164 | 1,411 | 21 | 3,380 | 3,960 | 17 | ||||||||||||||||||
| Adjusted EBITDA Margin | 15.2 | % | 14.9 | % | 15.1 | % | 15.3 | % | ||||||||||||||||
| · | Adjusted EBITDA is not a financial measure computed under U.S. GAAP or MFRS and should not be considered an indicator of financial performance or free cash flow. We define Adjusted EBITDA as net income of majority interest plus (i) net income of minority interest, (ii) income taxes, (iii) share in net income of affiliates, (iv) comprehensive financing cost, (v) other (income) expense, net, (vi) depreciation and amortization, and (vii) net interest expense included in cost of sales. Our management believes that Adjusted EBITDA provides a useful measure of its performance, supplemental to net income and operating income, because it excludes the effects of financing decisions, minority shareholdings, and other non-operating items. The calculation of Adjusted EBITDA is also provided as a result of requests from the financial community and is widely used by investor s in order to calculate ratios and to make estimates of the total value of our company in comparison to other companies. Financial ratios calculated on the base of Adjusted EBITDA are also widely used by credit providers in order to gauge the debt servicing capacity of companies and are relevant measures under one or more of our subsidiaries’ financing agreements. |
INVESTOR RELATIONS | www.ica.com.mx | 12/24 |
| | EARNINGS REPORT |
Debt
| September 30 | ||||||||||||||||
| Total debt (Ps.million) | 2009 | 2010 | % Var | |||||||||||||
| Short Term | 4,406 | 5,413 | 23 | |||||||||||||
| Long Term | 17,977 | 24,492 | 36 | |||||||||||||
| Total Debt | 22,383 | 29,905 | 34 | |||||||||||||
| Total Cash | 4,962 | 3,618 | (27 | ) | ||||||||||||
| Net Debt | 17,421 | 26,287 | 51 | |||||||||||||
| Weighted average interest rate | 8.7 | % | 9.1 | % | ||||||||||||
| Debt by type of currency | Short Term | Long Term | ||||||||||||||
| (Ps. million) | MXN | FX | MXN | FX | ||||||||||||
| Civil | 1,871 | 866 | 1,902 | 7,795 | ||||||||||||
| Industrial | 254 | - | - | - | ||||||||||||
| Rodio | - | 126 | - | 63 | ||||||||||||
| Concessions | 317 | 996 | 9,070 | 1,741 | ||||||||||||
| Airports | 187 | - | 3,152 | - | ||||||||||||
| Housing | 736 | 60 | 648 | 122 | ||||||||||||
| Subtotal | 3,365 | 2,048 | 14,771 | 9,721 | ||||||||||||
| Total | 5,413 | 24,492 | ||||||||||||||
| Total Debt | 29,905 | |||||||||||||||
| · | Debt increased as a result of the execution of projects that require financing, and in accordance with the terms of the financings for those projects. ICA expects that debt will continue to increase in step with the advance in the construction of financed projects, which include the concessions under construction and the La Yesca hydroelectric project. |
| · | 75% percent of debt is bank debt and 25% is securities debt, principally for concessions. |
| · | 18% of debt is short-term. Of this, 58% represents working capital lines for Civil Construction, Industrial Construction, and Rodio; 27% is in the Infrastructure segment, and includes the current portion of long-term debt and OMA working capital lines; and 15% is in Housing Development, for construction loans and working capital lines. |
| · | Long-term debt is 82% of total debt: 57% is in Concessions and Airports; 30% is for the La Yesca hydroelectric project; and the balance is for structured financings in Housing and Civil Construction. |
| · | ICA’s policy is to contract financing in the same currency as the source of repayment; 39% of total debt is denominated in foreign currencies, principally U.S. dollars. |
| · | 100% of debt is related to projects; ICA has no debt at the holding company level. |
| Debt maturity profile | 2010 | 2011 | 2012 | 2013 | + 2014 | |||||||||||||||
| Total | 4,943 | 469 | 9,336 | 2,502 | 12,654 | |||||||||||||||
| Bank Debt | 4,841 | 331 | 8,872 | 2,124 | 6,122 | |||||||||||||||
| Securities Debt | 102 | 138 | 464 | 378 | 6,533 | |||||||||||||||
INVESTOR RELATIONS | www.ica.com.mx | 13/24 |
| | EARNINGS REPORT |
Financial Derivative Instruments
| Mark to Market (Ps. million) | ||||
| Project | Type of Instrument | 06/30/2010 | 09/30/2010 | 10/19/2010 |
| Consolidated Subsidiaries | ||||
| La Yesca Hydroelectric Project | CAP | 3 | 1 | 1 |
| Floor | (338) | (334) | (350) | |
| FX Fwd | (189) | (140) | (112) | |
| Querétaro- Irapuato | SWAPTION | (58) | (60) | (65) |
| Irapuato- La Piedad | CAP | - | 0 | |
| Acapulco Tunnel | CAP | 2 | 5 | |
| Aqueduct II* | CAP | - | - | |
| Nuevo Necaxa- Tihuatlán* | SWAP | (380) | (537) | (539) |
| ICA, Río de la Compañía Tunnel | FX SWAP | (1) | 2 | |
| ICA, Leasing credit line | CAP | - | - | |
| ICA Viabilis | SWAP | - | - | |
| Rio Verde- Cd. Valles Highway | SWAP | (331) | (389) | (402) |
| La Piedad Bypass | SWAP | (62) | (102) | (105) |
| Aeroinvest | SWAP | (3) | (3) | |
| Cotrisa | FX Fwd / Fx CAP | 3 | - | |
| ICA, Tunnel Boring Machine | Fx Option/Swap | - | (19) | |
| Non consolidated affiliates | ||||
| FARAC1, RCO | SWAP UDIS | (311) | (506) | (549) |
| * Proportional consolidation | ||||
INVESTOR RELATIONS | www.ica.com.mx | 14/24 |
| | EARNINGS REPORT |
Current Developments
Agreement to Sell the Corredor Sur Concession in Panama: On March 25, 2010, ICA announced that it had reached a non-binding agreement with the Government of Panama to sell it the Corredor Sur tollroad for US$420 million. As of today, the negotiation of the definitive agreement and documentation between ICA and the Government of Panama continues.
Potential Transfer of the Irapuato – La Piedad and Querétaro – Irapuato Projects to RCO: On September 9, 2010, ICA announced that it entered into a non-binding letter of intent with Red de Carreteras de Occidente, S.A.P.I.B. de C.V. (“RCO”) to transfer 100% of ICA’s shares in Concesionaria Irapuato La Piedad, S.A. de C.V. (“CONIPSA”) and Concesionaria de Vías Irapuato Queretaro, S.A. de C.V. (“COVIQSA”) to RCO. In exchange for the shares in CONIPSA and COVIQSA, ICA would receive consideration in cash and, principally, additional shares in RCO. As of today, ICA and RCO continue to negotiate the definitive documentation, and are taking the steps to obtain the required governmental and corporate approvals, as well as to meet such other conditions precedent that are standard for these kinds of transactions.
Campeche Playa/Faros de Panamá: In September 2010, ICA announced that it took control of the Board of Directors of the companies developing the Campeche Playa, Golf, Marina & Spa Resort project, exercising its rights as a creditor for the project. ICA took this action in order to protect its investment in this tourism project in the State of Campeche, after continued failure by the developers to meet their commitments.
ICA has acted as the general contractor for the project, and had accounts receivable related to the project totaling approximately Ps. 1,600 million as of September 30, 2010. These financings are secured by 94% of the shares of the development companies and substantially all their assets, which include the buildings under construction, a golf course, and more than 289 hectares of prime beach front land.
The foreclosure on the property and other collateral is in process. However, there is ongoing litigation and dispute resolution proceedings related to the foreclosure on the project, the control of the Board of Directors and the related construction contracts. While ICA believes that an adverse decision on these proceedings is unlikely, the Company can provide no assurance that the accounts receivable related to the project will be collected or litigation will not delay or otherwise affect the completion of the project.
In addition, ICA has accounts receivable totaling approximately US$43 million with the same developer for the construction work on the foundation of the Faros de Panamá project, in Panama City, Panama. This receivable is secured by a mortgage on the land where the project is located. The process for foreclosing on this mortgage is advancing satisfactorily. The appraised value of the underlying property fully covers the amount of the receivable.
INVESTOR RELATIONS | www.ica.com.mx | 15/24 |
| | EARNINGS REPORT |
Conference Call Invitation
| · | ICA invites you to participate in a conference call on Monday, October 25, at 9:00 am Eastern Time (8:00 am Mexico City time). In order to participate, please call toll-free 1-877-941-2069 from the U.S. or 1-480-629-9713 internationally. The conference ID is 4375435. A replay will be available until November 1, 2010 by calling toll-free 1-877-870-5176 from the U.S. or 1-858-384-5517 internationally, with the same reference code. |
| · | The conference call will also be available via Webcast. |
http://phx.corporate-ir.net/phoenix.zhtml?p=irol-eventDetails&c=83646&eventID=3437141
INVESTOR RELATIONS | www.ica.com.mx | 16/24 |
| | EARNINGS REPORT |
Empresas ICA, S.A.B. de C.V.
Consolidated Statement of Income
| Third Quarter | 9 months | |||||||||||||||||||||||
| 3Q09 | 3Q10 | % Chg | 2009 | 2010 | % Chg | |||||||||||||||||||
| (Ps. Million) | ||||||||||||||||||||||||
| Revenues | 7,672 | 9,454 | 23 | 22,419 | 25,815 | 15 | ||||||||||||||||||
| Costs | 6,471 | 8,101 | 25 | 19,001 | 22,099 | 16 | ||||||||||||||||||
| Gross profit | 1,201 | 1,352 | 13 | 3,419 | 3,716 | 9 | ||||||||||||||||||
| Selling, general and operating expenses | 531 | 689 | 30 | 1,510 | 1,769 | 17 | ||||||||||||||||||
| Operating Income | 670 | 663 | (1 | ) | 1,909 | 1,946 | 2 | |||||||||||||||||
| Other income (loss), net | (41 | ) | (77 | ) | 87 | 26 | (45 | ) | ||||||||||||||||
| Comprehensive financing (cost) | (219 | ) | (311 | ) | 42 | (600 | ) | (696 | ) | 16 | ||||||||||||||
| Interest Expense | (243 | ) | (328 | ) | 35 | (774 | ) | (866 | ) | 12 | ||||||||||||||
| Interest Income | 82 | 82 | 1 | 239 | 253 | 6 | ||||||||||||||||||
| Exchange (Loss) Gain | (56 | ) | (34 | ) | (38 | ) | (82 | ) | 10 | |||||||||||||||
| Financial derivative effects | (2 | ) | (31 | ) | 1,793 | 17 | (93 | ) | ||||||||||||||||
| Share in net income (loss) of affiliated companies | (61 | ) | (37 | ) | (39 | ) | (251 | ) | (101 | ) | (60 | ) | ||||||||||||
| Income before taxes | 349 | 238 | (32 | ) | 1,084 | 1,104 | 2 | |||||||||||||||||
| Taxes | 136 | 88 | (36 | ) | 358 | 359 | 0 | |||||||||||||||||
| Consolidated net income | 212 | 150 | (29 | ) | 727 | 745 | 3 | |||||||||||||||||
| Net income of minority interest | 79 | 29 | (63 | ) | 194 | 157 | (19 | ) | ||||||||||||||||
| Net income of majority interest | 134 | 121 | (10 | ) | 533 | 589 | 10 | |||||||||||||||||
| Adjusted EBITDA | 1,164 | 1,411 | 21 | 3,380 | 3,960 | 17 | ||||||||||||||||||
| Earnings per share (Ps.) | Ps. | 0.21 | Ps. | 0.19 | Ps. | 0.99 | Ps. | 0.91 | ||||||||||||||||
| Earnings per ADS (US$) | US$ | 0.07 | US$ | 0.06 | US$ | 0.32 | US$ | 0.29 | ||||||||||||||||
| Weighted average shares outstanding (millions) | 628.51 | 649.43 | 538.67 | 647.76 | ||||||||||||||||||||
INVESTOR RELATIONS | www.ica.com.mx | 17/24 |
| | EARNINGS REPORT |
Empresas ICA, S.A.B. de C.V.
Consolidated Balance Sheet
| September 30, | ||||||||
| 2009 | 2010 | |||||||
| (Ps. Million) | ||||||||
| Assets | ||||||||
| Short Term Cash and Cash Equivalents | 4,962 | 3,618 | ||||||
| Trade and Contract Receivables | 8,562 | 10,504 | ||||||
| Other Receivables | 2,589 | 2,110 | ||||||
| Inventories | 3,662 | 4,273 | ||||||
| Other Current Assets | 1,403 | 1,656 | ||||||
| Total Current Assets | 21,177 | 22,161 | ||||||
| Trade and Contract Receivables | 8,588 | 14,169 | ||||||
| Restricted Cash | 468 | 418 | ||||||
| Investment in Subsidiaries & Affiliates | 250 | 78 | ||||||
| Other Investments | 23,275 | 27,391 | ||||||
| Investment in Concessions | 21,138 | 24,859 | ||||||
| Long Term Inventories | 2,136 | 2,532 | ||||||
| Long Term Assets | 32,581 | 42,056 | ||||||
| Property, Plant and Equipment Net | 3,726 | 4,482 | ||||||
| Other Assets | 2,628 | 4,155 | ||||||
| Total Assets | 60,112 | 72,854 | ||||||
| Liabilities | ||||||||
| Accounts Payable | 3,668 | 5,470 | ||||||
| Current Debt | 4,406 | 5,413 | ||||||
| Other Current Liabilities | 8,091 | 8,180 | ||||||
| Total Current Liabilities | 16,165 | 19,062 | ||||||
| Long-Term Debt | 17,977 | 24,492 | ||||||
| Other Noncurrent Liabilities | 4,617 | 8,525 | ||||||
| Total Liabilities | 38,760 | 52,079 | ||||||
| Majority Stockholders' Equity | 17,717 | 16,790 | ||||||
| Minority Interest in Consolidated Subsidiaries | 3,635 | 3,985 | ||||||
| Stockholders' Equity | 21,353 | 20,775 | ||||||
| Total Liabilities and Stockholders' Equity | 60,112 | 72,854 | ||||||
INVESTOR RELATIONS | www.ica.com.mx | 18/24 |
| | EARNINGS REPORT |
Empresas ICA, S.A.B. de C.V.
Statement of Cash Flows
| 9 months | ||||||||
| 2009 | 2010 | |||||||
| (Ps. Million) | ||||||||
| Operating Activities | ||||||||
| Income before taxes | 1,084 | 1,104 | ||||||
| Items in income that do not affect cash | 2,172 | 2,481 | ||||||
| Resources used in operations | (6,220 | ) | (7,011 | ) | ||||
| Net flow from operating activities | (2,964 | ) | (3,426 | ) | ||||
| Investing activities | ||||||||
| Acquisition of businesses | (114 | ) | (116 | ) | ||||
| Acquisition of real estate, machinery and equipment | (598 | ) | (475 | ) | ||||
| Acquisition of other long term assets | (2,053 | ) | (1,965 | ) | ||||
| Sale of real estate, machinery and equipment | 167 | 37 | ||||||
| Others | 8 | 192 | ||||||
| Net flow from investing activities | (2,590 | ) | (2,328 | ) | ||||
| Financing activities | ||||||||
| Borrowings | 6,460 | 10,252 | ||||||
| Debt payments | (2,032 | ) | (3,148 | ) | ||||
| Interest expense | (1,172 | ) | (1,117 | ) | ||||
| Financial lease payments | (16 | ) | (27 | ) | ||||
| Decreases in minority interest | (150 | ) | (172 | ) | ||||
| Increases in majority shareholders' equity | 2,992 | 4 | ||||||
| Share repurchases | (8 | ) | - | |||||
| Financing for financial derivatives | (333 | ) | (447 | ) | ||||
| Net cash flow from financing activities | 5,741 | 5,344 | ||||||
| Net change in cash and cash equivalents | 187 | (410 | ) | |||||
| Adjustments in cash flow for exchange variations | 11 | (80 | ) | |||||
| Cash and cash equivalents at beginning of period | 5,232 | 4,511 | ||||||
| Cash and cash equivalents at end of period | 5,430 | 4,021 | ||||||
INVESTOR RELATIONS | www.ica.com.mx | 19/24 |
| | EARNINGS REPORT |
Empresas ICA, S.A.B. de C.V.
Consolidated Segment Information, Third Quarter
| 3Q09 | 3Q10 | %Var | 3Q09 | 3Q10 | %Var | 3Q09 | 3Q10 | ||||
| Revenues | X | Operating Income | X | Operating Margin | |||||||
| Civil | 4,629 | 6,144 | 33 | 252 | 265 | 5 | 5.4% | 4.3% | |||
| Industrial | 947 | 1,152 | 22 | 22 | 28 | 26 | 2.3% | 2.4% | |||
| Rodio | 461 | 314 | (32) | 24 | (23) | 5.2% | -7.3% | ||||
| Construction | 6,036 | 7,611 | 26 | 298 | 270 | (9) | 4.9% | 3.6% | |||
| Housing | 572 | 794 | 39 | 35 | 93 | 167 | 6.1% | 11.8% | |||
| Other Concessions | 602 | 696 | 16 | 122 | 119 | (3) | 20.3% | 17.1% | |||
| Airports | 488 | 569 | 17 | 171 | 54 | (69) | 35.1% | 9.4% | |||
| Infrastructure | 1,090 | 1,265 | 16 | 293 | 172 | (41) | 26.9% | 13.6% | |||
| Other* | (26) | (215) | 727 | 44 | 127 | 191 | |||||
| TOTAL | 7,672 | 9,454 | 23 | 670 | 663 | (1) | 8.7% | 7.0% | |||
| Depr. & Amort. | Adjusted EBITDA | Adjusted EBITDA Margin | |||||||||
| Civil | 119 | 181 | 51 | 471 | 613 | 30 | 10.2% | 10.0% | |||
| Industrial | 8 | 12 | 40 | 33 | 40 | 21 | 3.5% | 3.4% | |||
| Rodio | 16 | 21 | 35 | 40 | (2) | 8.6% | -0.5% | ||||
| Construction | 144 | 214 | 49 | 543 | 651 | 20 | 9.0% | 8.6% | |||
| Housing | 2 | 7 | 330 | 20 | 119 | 505 | 3.4% | 15.0% | |||
| Other Concessions | 68 | 87 | 29 | 290 | 367 | 27 | 48.1% | 52.6% | |||
| Airports | 107 | 114 | 6 | 278 | 167 | (40) | 57.1% | 29.4% | |||
| Infrastructure | 175 | 201 | 15 | 568 | 534 | (6) | 52.1% | 42.2% | |||
| Other* | (3) | 10 | 33 | 108 | 226 | ||||||
| TOTAL | 317 | 432 | 36 | 1,164 | 1,411 | 21 | 15.2% | 14.9% | |||
| Total Assets | Debt | IV-06 | % Var. | Capital Expenditures | |||||||
| Civil | 21,528 | 32,087 | 49 | 6,809 | 12,434 | 83 | 235 | (56) | |||
| Industrial | 3,100 | 2,424 | (22) | 520 | 254 | (51) | 3 | 2 | (22) | ||
| Rodio | 1,379 | 1,183 | (14) | 227 | 189 | (17) | (50) | 2 | |||
| Construction | 26,007 | 35,693 | 37 | 7,556 | 12,876 | 70 | 188 | (51) | |||
| Housing | 5,433 | 7,468 | 37 | 1,589 | 1,566 | (1) | 4 | 38 | |||
| Other Concessions | 19,813 | 23,801 | 20 | 10,004 | 12,124 | 21 | 530 | 873 | 65 | ||
| Airports | 10,746 | 10,487 | (2) | 2,964 | 3,339 | 13 | 439 | (20) | |||
| Infrastructure | 30,559 | 34,287 | 12 | 12,968 | 15,463 | 19 | 970 | 853 | (12) | ||
| Other* | (1,887) | (4,594) | 143 | 270 | - | 2 | 2 | (5) | |||
| TOTAL | 60,112 | 72,854 | 21 | 22,383 | 29,905 | 34 | 1,163 | 842 | (28) | ||
| *Other includes holding company and consolidation effects. | |||||||||||
INVESTOR RELATIONS | www.ica.com.mx | 20/24 |
| | EARNINGS REPORT |
Empresas ICA, S.A.B. de C.V.
Consolidated Segment Information, First Nine Months
| 2009 | 2010 | %Var | 2009 | 2010 | %Var | 2008 | 2009 | ||||
| Revenues | Operating Income | Operating Margin | |||||||||
| Civil | 13,598 | 16,672 | 23 | 689 | 681 | (1) | 5.1% | 4.1% | |||
| Industrial | 3,192 | 2,731 | (14) | 164 | 69 | (58) | 5.1% | 2.5% | |||
| Rodio | 1,296 | 1,134 | (12) | 39 | 14 | (64) | 3.0% | 1.3% | |||
| Construction | 18,086 | 20,537 | 14 | 892 | 765 | (14) | 4.9% | 3.7% | |||
| Housing | 1,617 | 2,203 | 36 | 116 | 206 | 78 | 7.2% | 9.4% | |||
| Other Concessions | 1,668 | 1,979 | 19 | 413 | 473 | 14 | 24.8% | 23.9% | |||
| Airports | 1,414 | 1,608 | 14 | 490 | 411 | (16) | 34.6% | 25.5% | |||
| Infrastructure | 3,081 | 3,588 | 16 | 903 | 884 | (2) | 29.3% | 24.6% | |||
| Other* | (365) | (514) | 41 | (2) | 91 | ||||||
| TOTAL | 22,419 | 25,815 | 15 | 1,909 | 1,946 | 2 | 8.5% | 7.5% | |||
| Depr. & Amort. | Adjusted EBITDA | Adjusted EBITDA Margin | |||||||||
| Civil | 334 | 445 | 34 | 1,238 | 1,502 | 21 | 9.1% | 9.0% | |||
| Industrial | 26 | 29 | 11 | 220 | 117 | (47) | 6.9% | 4.3% | |||
| Rodio | 52 | 50 | (5) | 91 | 64 | (30) | 7.1% | 5.6% | |||
| Construction | 412 | 524 | 27 | 1,549 | 1,683 | 9 | 8.6% | 8.2% | |||
| Housing | 4 | 14 | 259 | 161 | 287 | 78 | 10.0% | 13.0% | |||
| Other Concessions | 199 | 240 | 20 | 876 | 1,186 | 35 | 52.5% | 59.9% | |||
| Airports | 303 | 336 | 11 | 792 | 746 | (6) | 56.1% | 46.4% | |||
| Infrastructure | 502 | 575 | 15 | 1,669 | 1,933 | 16 | 54.2% | 53.9% | |||
| Other* | 3 | 12 | 249 | 1 | 58 | 3,985 | |||||
| TOTAL | 920 | 1,125 | 22 | 3,380 | 3,960 | 17 | 15.1% | 15.3% | |||
| Total Assets | Debt | IV-06 | % Var. | Capital Expenditures | |||||||
| Civil | 21,528 | 32,087 | 49 | 6,809 | 12,434 | 83 | 678 | 686 | 1 | ||
| Industrial | 3,100 | 2,424 | (22) | 520 | 254 | (51) | 22 | 18 | (20) | ||
| Rodio | 1,379 | 1,183 | (14) | 227 | 189 | (17) | - | 14 | |||
| Construction | 26,007 | 35,693 | 37 | 7,556 | 12,876 | 70 | 700 | 717 | 3 | ||
| Housing | 5,433 | 7,468 | 37 | 1,589 | 1,566 | (1) | 4 | 42 | 877 | ||
| Other Concessions | 19,813 | 23,801 | 20 | 10,004 | 12,124 | 21 | 1,330 | 1,908 | 43 | ||
| Airports | 10,746 | 10,487 | (2) | 2,964 | 3,339 | 13 | 905 | - | |||
| Infrastructure | 30,559 | 34,287 | 12 | 12,968 | 15,463 | 19 | 2,234 | 1,908 | (15) | ||
| Other* | (1,887) | (4,594) | 143 | 270 | - | 4 | 8 | 100 | |||
| TOTAL | 60,112 | 72,854 | 21 | 22,383 | 29,905 | 34 | 2,942 | 2,675 | (9) | ||
| *Other includes holding company and consolidation effects. | |||||||||||
INVESTOR RELATIONS | www.ica.com.mx | 21/24 |
| | EARNINGS REPORT |
Notes and disclaimers
Mexican Financial Reporting Standards (MFRS): Financial statements and other information are presented in accordance with Mexican Financial Reporting Standards and their Interpretations (INIFs). These norms differ in certain significant respects from U.S. GAAP.
Unaudited financials: Financial statements are unaudited, preliminary statements.
Prior period comparisons: Unless stated otherwise, all comparisons of operating or financial results are made with respect to the comparable prior-year period. Percentage changes are calculated with respect to the actual numbers.
Early adoption of International Financial Reporting Standards: In January 2009, the National Banking and Securities Commission (CNBV) published amendments to its Circular for Issuers to make mandatory the presentation of financial statements prepared in accordance with International Financial Reporting Standards (IFRS) starting with the year ending December 31, 2012, but allowing for early adoption. The U.S. Securities and Exchange Commission (SEC) allows foreign issuers, to eliminate the reconciliation of financial statements prepared in accordance with Mexican Financial Reporting Standards (MFRS) with U.S. GAAP, if the statements are prepared under IFRS.
The Board of Directors agreed to elect early adoption of IFRS for the year ending December 31, 2011, and to consider January 1, 2010 as “the start date for the transition period.”
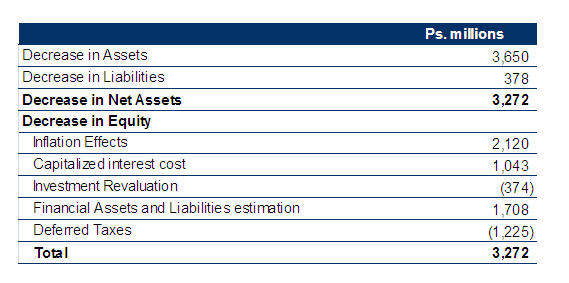
Since Mexican Financial Reporting Standards are in the process of convergence with IFRS and since the process of adopting the norms applicable to the principal business activities of the Company (construction, concessions, and housing) has been completed, the effects of the differences between the two norms is not expected to be significant. Following are the unaudited estimated effects of the change on the opening balance sheet (January 1, 2010) as a result of the differences between the two accounting standards. The Company will continue its process of quantification, and the estimated figures may change until this process has been concluded and has been reviewed by the Company’s external auditors.
INVESTOR RELATIONS | www.ica.com.mx | 22/24 |
| | EARNINGS REPORT |
Recalculation of financial statements:
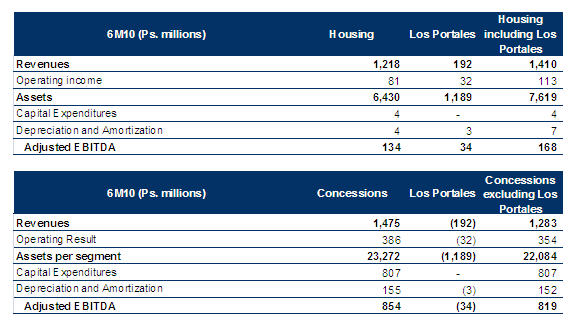
| a) | During 2Q10, we increased our shareholding Los Portales, S.A., in Peru from 18% to 50%, and began proportional consolidation of its results. For 2Q10, Los Portales was included in the Infrastructure segment. However, since its principal business is in the real estate development area, it was decided to include it in the Housing segment. In order to make comparable the segment information, the results previously reported for 2Q10 have been recalculated. The effect of the recalculation on the Housing and Infrastructure segments is shown below: |
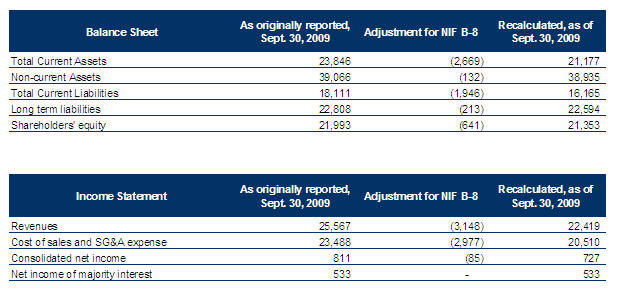
| b) | The financial statements previously issued for the period ended September 30, 2009 were recalculated as the result of the adoption of NIF B-8, “Consolidated or combined financial statements.” As a result, ICA adopted the proportional consolidation method for the results of its subsidiary ICA Fluor, which is a joint investment with Fluor Corporation. This NIF establishes that full consolidation of a subsidiary requires control, defined as the power to decide financial and operating policies, and not simply holding a majority of voting shares. As a result of the application of this norm, net income of majority interest is unchanged. However, revenues and expenses, as well as assets and liabilities are consolidated 51%. Previously, ICA Fluor was consolidated 100%. Financial statements for prior periods have been recalculated. |
INVESTOR RELATIONS | www.ica.com.mx | 23/24 |
| | EARNINGS REPORT |
Adjusted EBITDA: Adjusted EBITDA is not a financial measure computed under U.S. GAAP or MFRS and should not be considered an indicator of financial performance or free cash flow. We define Adjusted EBITDA as net income of majority interest plus (i) net income of minority interest, (ii) income taxes, (iii) share in net income of affiliates, (iv) comprehensive financing cost, (v) other (income) expense, net, (vi) depreciation and amortization, and (vii) net interest expense included in cost of sales. Our management believes that Adjusted EBITDA provides a useful measure of its performance, supplemental to net income and operating income, because it excludes the effects of financing decisions, minority shareholdings, and other non-operating items. The calculation of Adjusted EBITDA is also pro vided as a result of requests from the financial community and is widely used by investors in order to calculate ratios and to make estimates of the total value of our company in comparison to other companies. Financial ratios calculated on the base of Adjusted EBITDA are also widely used by credit providers in order to gauge the debt servicing capacity of companies and are relevant measures under one or more of our or our subsidiaries’ financing agreements.
Exchange rate: Amounts in U.S. dollars (US$) are converted at an exchange rate of Ps. 12.535 per U.S. dollar.
Financial Derivative Instruments: ICA enters into financial derivative contracts in the subsidiaries where projects are located solely in order to reduce the uncertainty on the returns on projects. The instruments contracted are established on a notional amount. Interest rate derivatives are used in order to fix maximum financial costs. Exchange rate derivatives are contracted in order to reduce the exchange risk on projects that incur labor and materials costs in a currency different from the currency of the financing of the project. ICA contracts its financings in the same currency as the source of repayment.
From an accounting perspective, there are two classifications for derivative instruments. “Hedging financial instruments” must meet the specific requirements established in Mexican Financial Reporting Standards (MFRS). Other derivative financial instruments that do not meet MFRS requirements for hedge accounting treatment are designated as trading derivatives. ICA values all derivatives at fair value. Fair value is based on market prices for derivatives traded in recognized markets; if no active market exists, fair value is based on other valuation methodologies, validated by third party experts, and supported by sufficient, reliable, and verifiable information. Fair value is recognized in the balance sheet as an asset or liability, in accordance with the rights or obligations derived from the contracts executed and in accordance wit h accounting norms. Changes in fair value are recorded temporarily in comprehensive income within stockholders’ equity, and are subsequently reclassified to results at the same time that they are affected by the item being hedged. For trading derivatives, the fluctuation in fair value is recognized in results of the period.
Forward looking statements: This report may contain projections or other forward-looking statements related to ICA that involve risks and uncertainties. Readers are cautioned that these statements are only projections of future events based on assumptions and estimates ICA believes to be reasonable, but these projections may differ materially from actual future results or events. Factors that could cause actual results to differ materially and adversely include, but are not limited to: changes in general economic, business or political or other conditions in Mexico or changes in general economic or business conditions in Latin America, changes in capital markets in general that may affect policies or attitudes towards lending to Mexico or Mexican companies, chang es in tax and other laws affecting ICA’s businesses, increased costs, unanticipated increases in financing and other costs or the inability to obtain additional debt or equity financing on attractive terms. Readers are referred to the documents filed by ICA with the United States Securities and Exchange Commission, specifically the most recent filing on Form 20-F which identifies important risk factors that could cause actual results to differ from those contained in the forward-looking statements. All forward-looking statements are based on information available to ICA on the date hereof, and ICA assumes no obligation to update such statements.
Empresas ICA was founded in 1947. ICA’s principal lines of business are construction and engineering; housing; and infrastructure operations, including airports, toll roads, and municipal services. For more information please visit www.ica.com.mx.
INVESTOR RELATIONS | www.ica.com.mx | 24/24 |
SIGNATURE
Pursuant to the requirements of the Securities Exchange Act of 1934, the registrant has duly caused this Report to be signed on its behalf by the undersigned, thereunto duly authorized.
Date: October 22, 2010
| Empresas ICA, S.A.B. de C.V. | ||
| /s/ JOSE LUIS GUERRERO ALVAREZ | ||
| Name: José Luis Guerrero Alvarez | ||
| Title: Chief Executive Officer | ||