SECURITIES AND EXCHANGE COMMISSION
MANAGEMENT INVESTMENT COMPANIES
(Address of principal executive offices) (Zip code)
SECURITY EQUITY FUND
ONE SECURITY BENEFIT PLACE
TOPEKA, KANSAS 66636-0001
(Name and address of agent for service)
| SEPTEMBER 30, 2011 GI EQUITY FUND ANNUAL REPORT FUNDAMENTAL ALPHA LARGE CAP CORE FUND ALL CAP VALUE FUND MID CAP VALUE FUND MID CAP VALUE INSTITUTIONAL FUND SMALL CAP GROWTH FUND SMALL CAP VALUE FUND LARGE CAP CONCENTRATED GROWTH FUND MSCI EAFE EQUAL WEIGHT FUND (Formerly Global Fund) OPPORTUNISTIC ALPHA OPPORTUNITY FUND |
| • | View online confirmations and statements at your convenience. | |
| • | Receive email notifications when your most recent confirmations, statements and other account documents are available for review. | |
| • | Access prospectuses, annual reports and semiannual reports online. |


ABOUT SHAREHOLDERS’ FUND EXPENSES | 2 | |||
LARGE CAP CORE FUND | 6 | |||
ALL CAP VALUE FUND | 15 | |||
MID CAP VALUE FUND | 24 | |||
MID CAP VALUE INSTITUTIONAL FUND | 33 | |||
SMALL CAP GROWTH FUND | 41 | |||
SMALL CAP VALUE FUND | 50 | |||
LARGE CAP CONCENTRATED GROWTH FUND | 59 | |||
MSCI EAFE EQUAL WEIGHT FUND | 67 | |||
ALPHA OPPORTUNITY FUND | 85 | |||
NOTES TO FINANCIAL STATEMENTS | 96 | |||
REPORT OF INDEPENDENT REGISTERED PUBLIC ACCOUNTING FIRM | 108 | |||
OTHER INFORMATION | 109 | |||
INFORMATION ON BOARD OF DIRECTORS AND OFFICERS | 113 | |||
RYDEX|SGI PRIVACY POLICIES | 116 | |||
the RYDEX|SGI equity funds annual report | 1
2 | the RYDEX|SGI equity funds annual report
| Beginning | Ending | Expenses | |||||||||||||||||||||
| Expense | Fund | Account Value | Account Value | Paid During | |||||||||||||||||||
| Ratio1 | Return | March 31, 2011 | September 30, 2011 | Period2 | |||||||||||||||||||
Table 1. Based on actual Fund return3 | |||||||||||||||||||||||
Large Cap Core Fund | |||||||||||||||||||||||
| A-Class | 1.25 | % | (19.90 | )% | $ | 1,000.00 | $ | 801.05 | $ | 5.64 | |||||||||||||
| B-Class | 2.00 | % | (20.04 | )% | 1,000.00 | 799.65 | 9.02 | ||||||||||||||||
| C-Class | 2.00 | % | (20.20 | )% | 1,000.00 | 797.95 | 9.01 | ||||||||||||||||
All Cap Value Fund | |||||||||||||||||||||||
| A-Class | 1.27 | % | (21.60 | )% | 1,000.00 | 784.02 | 5.68 | ||||||||||||||||
| C-Class | 2.02 | % | (21.86 | )% | 1,000.00 | 781.35 | 9.02 | ||||||||||||||||
| Institutional Class | 1.02 | % | (21.56 | )% | 1,000.00 | 784.36 | 4.56 | ||||||||||||||||
Mid Cap Value Fund | |||||||||||||||||||||||
| A-Class | 1.32 | % | (23.21 | )% | 1,000.00 | 767.90 | 5.85 | ||||||||||||||||
| B-Class | 2.07 | % | (23.47 | )% | 1,000.00 | 765.31 | 9.16 | ||||||||||||||||
| C-Class | 2.07 | % | (23.49 | )% | 1,000.00 | 765.11 | 9.16 | ||||||||||||||||
Mid Cap Value Institutional Fund | 0.90 | % | (23.37 | )% | 1,000.00 | 766.33 | 3.99 | ||||||||||||||||
Small Cap Growth Fund | |||||||||||||||||||||||
| A-Class | 1.99 | % | (22.16 | )% | 1,000.00 | 778.43 | 8.87 | ||||||||||||||||
| B-Class | 2.75 | % | (22.43 | )% | 1,000.00 | 775.72 | 12.24 | ||||||||||||||||
| C-Class | 2.74 | % | (22.44 | )% | 1,000.00 | 775.60 | 12.20 | ||||||||||||||||
Small Cap Value Fund | |||||||||||||||||||||||
| A-Class | 1.30 | % | (25.35 | )% | 1,000.00 | 746.48 | 5.69 | ||||||||||||||||
| C-Class | 2.05 | % | (25.65 | )% | 1,000.00 | 743.46 | 8.96 | ||||||||||||||||
| Institutional Class | 1.05 | % | (25.24 | )% | 1,000.00 | 747.62 | 4.60 | ||||||||||||||||
Large Cap Concentrated Growth Fund | |||||||||||||||||||||||
| A-Class | 1.35 | % | (18.86 | )% | 1,000.00 | 811.40 | 6.13 | ||||||||||||||||
| B-Class | 2.10 | % | (19.23 | )% | 1,000.00 | 807.69 | 9.52 | ||||||||||||||||
| C-Class | 2.10 | % | (19.16 | )% | 1,000.00 | 808.38 | 9.52 | ||||||||||||||||
MSCI EAFE Equal Weight Fund | |||||||||||||||||||||||
| A-Class | 1.65 | % | (18.76 | )% | 1,000.00 | 812.40 | 7.50 | ||||||||||||||||
B-Class5 | 1.40 | % | (18.65 | )% | 1,000.00 | 813.50 | 6.36 | ||||||||||||||||
| C-Class | 2.40 | % | (19.05 | )% | 1,000.00 | 809.52 | 10.89 | ||||||||||||||||
Institutional Class4 | 1.36 | % | (21.58 | )% | 1,000.00 | 784.20 | 4.99 | ||||||||||||||||
Alpha Opportunity Fund6 | |||||||||||||||||||||||
| A-Class | 2.14 | % | (21.19 | )% | 1,000.00 | 788.10 | 9.59 | ||||||||||||||||
| B-Class | 2.89 | % | (21.47 | )% | 1,000.00 | 785.30 | 12.93 | ||||||||||||||||
| C-Class | 2.89 | % | (21.40 | )% | 1,000.00 | 786.00 | 12.94 | ||||||||||||||||
| Institutional Class | 1.89 | % | (21.02 | )% | 1,000.00 | 789.80 | 8.48 | ||||||||||||||||
the RYDEX|SGI equity funds annual report | 3
| Beginning | Ending | Expenses | |||||||||||||||||||||
| Expense | Fund | Account Value | Account Value | Paid During | |||||||||||||||||||
| Ratio1 | Return | March 31, 2011 | September 30, 2011 | Period2 | |||||||||||||||||||
Table 2. Based on hypothetical 5% return (before expenses) | |||||||||||||||||||||||
Large Cap Core Fund | |||||||||||||||||||||||
| A-Class | 1.25 | % | 5.00 | % | $ | 1,000.00 | $ | 1,018.80 | $ | 6.33 | |||||||||||||
| B-Class | 2.00 | % | 5.00 | % | 1,000.00 | 1,015.04 | 10.10 | ||||||||||||||||
| C-Class | 2.00 | % | 5.00 | % | 1,000.00 | 1,015.04 | 10.10 | ||||||||||||||||
All Cap Value Fund | |||||||||||||||||||||||
| A-Class | 1.27 | % | 5.00 | % | 1,000.00 | 1,018.70 | 6.43 | ||||||||||||||||
| C-Class | 2.02 | % | 5.00 | % | 1,000.00 | 1,014.94 | 10.20 | ||||||||||||||||
| Institutional Class | 1.02 | % | 5.00 | % | 1,000.00 | 1,019.95 | 5.16 | ||||||||||||||||
Mid Cap Value Fund | |||||||||||||||||||||||
| A-Class | 1.32 | % | 5.00 | % | 1,000.00 | 1,018.45 | 6.68 | ||||||||||||||||
| B-Class | 2.07 | % | 5.00 | % | 1,000.00 | 1,014.69 | 10.45 | ||||||||||||||||
| C-Class | 2.07 | % | 5.00 | % | 1,000.00 | 1,014.69 | 10.45 | ||||||||||||||||
Mid Cap Value Institutional Fund | 0.90 | % | 5.00 | % | 1,000.00 | 1,020.56 | 4.56 | ||||||||||||||||
Small Cap Growth Fund | |||||||||||||||||||||||
| A-Class | 1.99 | % | 5.00 | % | 1,000.00 | 1,015.09 | 10.05 | ||||||||||||||||
| B-Class | 2.75 | % | 5.00 | % | 1,000.00 | 1,011.28 | 13.87 | ||||||||||||||||
| C-Class | 2.74 | % | 5.00 | % | 1,000.00 | 1,011.33 | 13.82 | ||||||||||||||||
Small Cap Value Fund | |||||||||||||||||||||||
| A-Class | 1.30 | % | 5.00 | % | 1,000.00 | 1,018.55 | 6.58 | ||||||||||||||||
| C-Class | 2.05 | % | 5.00 | % | 1,000.00 | 1,014.79 | 10.35 | ||||||||||||||||
| Institutional Class | 1.05 | % | 5.00 | % | 1,000.00 | 1,019.80 | 5.32 | ||||||||||||||||
Large Cap Concentrated Growth Fund | |||||||||||||||||||||||
| A-Class | 1.35 | % | 5.00 | % | 1,000.00 | 1,018.30 | 6.83 | ||||||||||||||||
| B-Class | 2.10 | % | 5.00 | % | 1,000.00 | 1,014.54 | 10.61 | ||||||||||||||||
| C-Class | 2.10 | % | 5.00 | % | 1,000.00 | 1,014.54 | 10.61 | ||||||||||||||||
MSCI EAFE Equal Weight Fund | |||||||||||||||||||||||
| A-Class | 1.65 | % | 5.00 | % | 1,000.00 | 1,016.80 | 8.34 | ||||||||||||||||
B-Class5 | 1.40 | % | 5.00 | % | 1,000.00 | 1,018.05 | 7.08 | ||||||||||||||||
| C-Class | 2.40 | % | 5.00 | % | 1,000.00 | 1,013.04 | 12.11 | ||||||||||||||||
Institutional Class4 | 1.36 | % | 5.00 | % | 1,000.00 | 1,018.25 | 6.88 | ||||||||||||||||
Alpha Opportunity Fund6 | |||||||||||||||||||||||
| A-Class | 2.14 | % | 5.00 | % | 1,000.00 | 1,014.34 | 10.81 | ||||||||||||||||
| B-Class | 2.89 | % | 5.00 | % | 1,000.00 | 1,010.58 | 14.57 | ||||||||||||||||
| C-Class | 2.89 | % | 5.00 | % | 1,000.00 | 1,010.58 | 14.57 | ||||||||||||||||
| Institutional Class | 1.89 | % | 5.00 | % | 1,000.00 | 1,015.59 | 9.55 | ||||||||||||||||
| 1 | Annualized | |
| 2 | Expenses are equal to the Fund’s annualized expense ratio, net of any applicable fee waivers, multiplied by the average account value over the period, multiplied by 183/365 (to reflect the one-half year period). | |
| 3 | Actual cumulative return at net asset value for the period March 31, 2011 to September 30, 2011. | |
| 4 | Expenses paid based on actual fund return are calculated using 150 days from the commencement of operations, May 2, 2011. Expenses paid based on the hypothetical 5% return are calculated using 183 days. | |
| 5 | B-Class shares did not charge 12b-1 fees during the period. | |
| 6 | This ratio represents annualized net expenses, which includes interest and dividend expense related to securities sold short. Excluding short dividend expense and prime broker interest expense, the operating expense ratio would be 0.03%, 0.03%, 0.03%, and 0.03% lower for the A-Class, B-Class, C-Class, and Institutional Class, respectively. |
4 | the RYDEX|SGI equity funds annual report
| MANAGERS’ COMMENTARY (Unaudited) | September 30, 2011 | |
| Advised by: |  |
6 | the RYDEX|SGI equity funds annual report
| 1 | Performance figures are based on A-Class shares and do not reflect deduction of the sales charges or taxes that a shareholder would pay on distributions or the redemption of shares. Fee waivers and/or reimbursements reduce Fund expenses and, in the absence of such waivers, the performance quoted would be reduced. |
the RYDEX|SGI equity funds annual report | 7
| PERFORMANCE REPORT AND FUND PROFILE (Unaudited) | September 30, 2011 | |
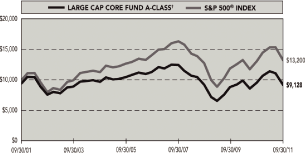
Periods Ended 9/30/11
| 1 Year | 5 Year | 10 Year | ||||||||||
| A-Class | -4.11 | % | -4.11 | % | -0.32 | % | ||||||
A-Class with sales charge† | -9.66 | % | -5.24 | % | -0.91 | % | ||||||
| B-Class | -4.93 | % | -4.83 | % | -0.95 | % | ||||||
B-Class with CDSC†† | -9.68 | % | -5.11 | % | -0.95 | % | ||||||
| C-Class | -4.82 | % | -4.80 | % | -1.06 | % | ||||||
C-Class with CDSC††† | -5.77 | % | -4.80 | % | -1.06 | % | ||||||
| S&P 500 Index | 1.14 | % | -1.18 | % | 2.82 | % | ||||||
| Inception Dates: | ||||
| A-Class | September 10, 1962 | |||
| B-Class | October 19, 1993 | |||
| C-Class | January 29, 1999 | |||
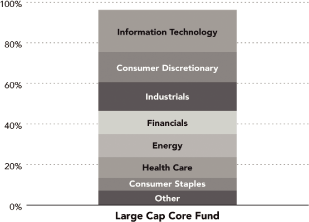
Ten Largest Holdings (% of Total Net Assets) | ||||
| Apple, Inc. | 3.1 | % | ||
| Wells Fargo & Co. | 3.0 | % | ||
| Google, Inc. — Class A | 2.8 | % | ||
| Covidien plc | 2.5 | % | ||
| QUALCOMM, Inc. | 2.3 | % | ||
| Equifax, Inc. | 2.1 | % | ||
| Halliburton Co. | 2.0 | % | ||
| International Business Machines Corp. | 2.0 | % | ||
| Coca-Cola Co. | 2.0 | % | ||
| McDonald’s Corp. | 1.9 | % | ||
| Top Ten Total | 23.7 | % | ||
| * | The performance data above represents past performance that is not predictive of future results. The investment return and principal value of an investment in the Fund will fluctuate so that an investor’s shares, when redeemed, may be worth more or less than their original cost. Returns are historical and include changes in principal and reinvested dividends and capital gains and do not reflect the effect of taxes. The S&P 500 Index is an unmanaged index and, unlike the Fund, has no management fees or operating expenses to reduce its reported return. | |
| † | Effective February 22, 2011, the maximum sales charge decreased from 5.75% to 4.75%. A 5.75% maximum sales charge is used in the calculation of the 1 Year, 5 Year and 10 Year Average Annual Returns (based on subscriptions made prior to February 22, 2011), and a 4.75% maximum sales charge will be used to calculate performance for periods based on subscriptions made on or after February 22, 2011. | |
| †† | Fund returns include a CDSC of up to 5% if redeemed within 5 years of purchase. | |
| ††† | Fund returns include a CDSC of 1% if redeemed within 12 months of purchase. |
8 | the RYDEX|SGI equity funds annual report
| SCHEDULE OF INVESTMENTS | September 30, 2011 | |
| LARGE CAP CORE FUND | ||
| Shares | Value | |||||||
COMMON STOCKS† - 95.4% | ||||||||
Information Technology - 20.7% | ||||||||
| Apple, Inc.* | 13,215 | $ | 5,037,294 | |||||
| Google, Inc. — Class A* | 8,985 | 4,621,704 | ||||||
| QUALCOMM, Inc. | 78,090 | 3,797,517 | ||||||
| International Business Machines Corp. | 18,800 | 3,290,564 | ||||||
| Dell, Inc.* | 199,710 | 2,825,896 | ||||||
| Western Union Co. | 155,900 | 2,383,711 | ||||||
| Avago Technologies Ltd. | 69,380 | 2,273,583 | ||||||
| TE Connectivity Ltd. | 75,400 | 2,121,756 | ||||||
| Cognizant Technology Solutions Corp. — Class A* | 30,830 | 1,933,041 | ||||||
| Computer Sciences Corp. | 70,200 | 1,884,870 | ||||||
| Cisco Systems, Inc. | 86,900 | 1,346,081 | ||||||
| Hewlett-Packard Co. | 50,716 | 1,138,574 | ||||||
| Visa, Inc. | 12,100 | 1,037,212 | ||||||
Total Information Technology | 33,691,803 | |||||||
Consumer Discretionary - 14.9% | ||||||||
| McDonald’s Corp. | 36,360 | 3,193,135 | ||||||
| TJX Companies, Inc. | 55,260 | 3,065,272 | ||||||
| Starbucks Corp. | 80,200 | 2,990,658 | ||||||
| Nordstrom, Inc. | 65,130 | 2,975,139 | ||||||
| Priceline.com, Inc.* | 5,690 | 2,557,427 | ||||||
| BorgWarner, Inc.* | 40,350 | 2,442,386 | ||||||
| Lowe’s Companies, Inc. | 123,300 | 2,384,622 | ||||||
| Time Warner, Inc. | 70,066 | 2,099,878 | ||||||
| Wynn Resorts Ltd. | 17,200 | 1,979,376 | ||||||
| Best Buy Company, Inc. | 25,400 | 591,820 | ||||||
Total Consumer Discretionary | 24,279,713 | |||||||
Industrials - 14.1% | ||||||||
| Equifax, Inc. | 108,500 | 3,335,290 | ||||||
| United Parcel Service, Inc. — Class B | 46,340 | 2,926,371 | ||||||
| Precision Castparts Corp. | 18,080 | 2,810,717 | ||||||
| Eaton Corp. | 72,430 | 2,571,265 | ||||||
| Honeywell International, Inc. | 57,390 | 2,519,995 | ||||||
| CSX Corp. | 131,750 | 2,459,772 | ||||||
| Republic Services, Inc. | 61,700 | 1,731,302 | ||||||
| United Technologies Corp. | 21,000 | 1,477,560 | ||||||
| URS Corp.* | 37,900 | 1,124,114 | ||||||
| Parker Hannifin Corp. | 11,100 | 700,743 | ||||||
| FedEx Corp. | 10,200 | 690,336 | ||||||
| USG Corp.* | 66,400 | 446,872 | ||||||
| Babcock & Wilcox Co.* | 4,821 | 94,251 | ||||||
Total Industrials | 22,888,588 | |||||||
Financials - 11.5% | ||||||||
| Wells Fargo & Co. | 201,328 | 4,856,031 | ||||||
| Aon Corp. | 58,700 | 2,464,226 | ||||||
| U.S. Bancorp | 96,126 | 2,262,806 | ||||||
| MetLife, Inc. | 74,160 | 2,077,222 | ||||||
| Berkshire Hathaway, Inc. — Class A* | 16 | 1,708,800 | ||||||
| JPMorgan Chase & Co. | 41,770 | 1,258,112 | ||||||
| Allstate Corp. | 49,800 | 1,179,762 | ||||||
| BB&T Corp. | 51,212 | 1,092,352 | ||||||
| Bank of New York Mellon Corp. | 49,800 | 925,782 | ||||||
| State Street Corp. | 24,000 | 771,840 | ||||||
| First Marblehead Corp.* | 97,760 | 99,715 | ||||||
Total Financials | 18,696,648 | |||||||
Energy - 11.4% | ||||||||
| Halliburton Co. | 108,770 | 3,319,660 | ||||||
Chevron Corp.1 | 32,240 | 2,982,845 | ||||||
| Baker Hughes, Inc. | 50,660 | 2,338,466 | ||||||
| National Oilwell Varco, Inc. | 43,000 | 2,202,460 | ||||||
| Williams Companies, Inc. | 85,500 | 2,081,070 | ||||||
| McDermott International, Inc.* | 183,500 | 1,974,460 | ||||||
| Apache Corp. | 15,600 | 1,251,744 | ||||||
| ConocoPhillips | 14,400 | 911,808 | ||||||
| Chesapeake Energy Corp. | 35,400 | 904,470 | ||||||
| Exxon Mobil Corp. | 8,600 | 624,618 | ||||||
Total Energy | 18,591,601 | |||||||
Health Care - 10.2% | ||||||||
| Covidien plc | 93,520 | 4,124,232 | ||||||
| Johnson & Johnson | 46,400 | 2,956,144 | ||||||
| Gilead Sciences, Inc.* | 75,350 | 2,923,580 | ||||||
| Aetna, Inc. | 68,300 | 2,482,705 | ||||||
| Hospira, Inc.* | 44,100 | 1,631,700 | ||||||
| Forest Laboratories, Inc.* | 33,800 | 1,040,702 | ||||||
| UnitedHealth Group, Inc. | 16,200 | 747,144 | ||||||
| Medco Health Solutions, Inc.* | 14,800 | 693,972 | ||||||
Total Health Care | 16,600,179 | |||||||
Consumer Staples - 6.3% | ||||||||
| Coca-Cola Co. | 47,400 | 3,202,344 | ||||||
| CVS Caremark Corp. | 67,400 | 2,263,292 | ||||||
| Wal-Mart Stores, Inc. | 31,800 | 1,650,420 | ||||||
| Kraft Foods, Inc. — Class A | 43,100 | 1,447,298 | ||||||
| Bunge Ltd. | 17,000 | 990,930 | ||||||
| Costco Wholesale Corp. | 9,200 | 755,504 | ||||||
Total Consumer Staples | 10,309,788 | |||||||
Materials - 4.3% | ||||||||
| CF Industries Holdings, Inc. | 18,060 | 2,228,423 | ||||||
| EI du Pont de Nemours & Co. | 53,400 | 2,134,398 | ||||||
| Bemis Company, Inc. | 45,600 | 1,336,536 | ||||||
| Dow Chemical Co. | 59,300 | 1,331,878 | ||||||
Total Materials | 7,031,235 | |||||||
Utilities - 1.5% | ||||||||
| Edison International | 64,700 | 2,474,775 | ||||||
Telecommunication Services - 0.5% | ||||||||
| Windstream Corp. | 75,500 | 880,330 | ||||||
Total Common Stocks (Cost $167,576,027) | 155,444,660 | |||||||
the RYDEX|SGI equity funds annual report | 9
| SCHEDULE OF INVESTMENTS (concluded) | September 30, 2011 | |
| LARGE CAP CORE FUND | ||
| Shares | Value | |||||||
EXCHANGE TRADED FUND† - 0.7% | ||||||||
| iShares Russell 1000 Value Index Fund | 20,200 | $ | 1,143,118 | |||||
Total Exchange Traded Fund (Cost $1,160,304) | 1,143,118 | |||||||
Total Investments - 96.1% (Cost $168,736,331) | $ | 156,587,778 | ||||||
| Contracts | ||||||||
OPTIONS WRITTEN† - 0.0% | ||||||||
| Put Options on: | ||||||||
| State Street Corp. | ||||||||
| Expiring October 2011 with strike price of $31.00 | 119 | (16,898 | ) | |||||
Total Options Written (Premiums received $21,832) | (16,898 | ) | ||||||
Cash & Other Assets, Less Liabilities - 3.9% | 6,382,265 | |||||||
Total Net Assets - 100.0% | $ | 162,953,145 | ||||||
| * | Non-income producing security. | |
| † | Value determined based on Level 1 inputs — See Note 4. | |
| 1 | All or a portion of this security is pledged as collateral for open options written at September 30, 2011. | |
| ADR — American Depositary Receipt | ||
| plc — Public Limited Company |
10 | the RYDEX|SGI equity funds annual report
| STATEMENT OF ASSETS AND LIABILITIES | ||||
| September 30, 2011 | ||||
Assets: | ||||
| Investments, at value (cost $168,736,331) | $ | 156,587,778 | ||
| Cash | 6,178,228 | |||
| Prepaid expenses | 17,963 | |||
| Receivables: | ||||
| Securities sold | 3,115,263 | |||
| Dividends | 149,443 | |||
| Fund shares sold | 10,899 | |||
Total assets | 166,059,574 | |||
Liabilities: | ||||
| Options written, at value (premiums received $21,832) | 16,898 | |||
| Payable for: | ||||
| Securities purchased | 2,767,188 | |||
| Management fees | 106,769 | |||
| Distribution and service fees | 40,049 | |||
| Fund shares redeemed | 39,282 | |||
| Transfer agent/maintenance fees | 37,330 | |||
| Fund accounting/administration fees | 13,524 | |||
| Directors’ fees* | 1,021 | |||
| Miscellaneous | 84,368 | |||
Total liabilities | 3,106,429 | |||
Net assets | $ | 162,953,145 | ||
Net assets consist of: | ||||
| Paid in capital | $ | 193,848,138 | ||
| Undistributed net investment income | 13,084 | |||
| Accumulated net realized loss on investments | (18,764,458 | ) | ||
| Net unrealized depreciation on investments | (12,143,619 | ) | ||
| Net assets | $ | 162,953,145 | ||
A-Class: | ||||
| Net assets | $ | 156,232,059 | ||
| Capital shares outstanding | 9,303,333 | |||
| Net asset value per share | $ | 16.79 | ||
| Maximum offering price per share (Net asset value divided by 95.25%) | $ | 17.63 | ||
B-Class: | ||||
| Net assets | $ | 5,120,954 | ||
| Capital shares outstanding | 374,153 | |||
| Net asset value per share | $ | 13.69 | ||
C-Class: | ||||
| Net assets | $ | 1,600,132 | ||
| Capital shares outstanding | 108,064 | |||
| Net asset value per share | $ | 14.81 | ||
| STATEMENT OF OPERATIONS | ||||
| Year Ended September 30, 2011 | ||||
Investment Income: | ||||
| Dividends | $ | 2,784,522 | ||
| Interest | 1,383 | |||
| Total investment income | 2,785,905 | |||
Expenses: | ||||
| Management fees | 1,482,362 | |||
| Transfer agent/maintenance fees | 394,716 | |||
| Distribution and service fees: | ||||
| A-Class | 472,000 | |||
| B-Class | 68,139 | |||
| C-Class | 20,342 | |||
| Fund accounting/administration fees | 187,763 | |||
| Directors’ fees* | 16,673 | |||
| Miscellaneous | 89,690 | |||
| Total expenses | 2,731,685 | |||
| Net investment income | 54,220 | |||
Net Realized and Unrealized Gain (Loss): | ||||
| Net realized gain (loss) on: | ||||
| Investments | 15,933,509 | |||
| Net realized gain | 15,933,509 | |||
| Net change in unrealized appreciation (depreciation) on: | ||||
| Investments | (21,389,379 | ) | ||
| Options written | (7,733 | ) | ||
| Net change in unrealized appreciation (depreciation) | (21,397,112 | ) | ||
| Net realized and unrealized loss | (5,463,603 | ) | ||
Net decrease in net assets resulting from operations | $ | (5,409,383 | ) | |
| * | Relates to Directors not deemed “interested persons” within the meaning of Section 2(a)(19) of the 1940 Act. |
the RYDEX|SGI equity funds annual report | 11
| Year Ended | Year Ended | |||||||
| September 30, | September 30, | |||||||
| 2011 | 2010 | |||||||
Increase (Decrease) In Net Assets From Operations: | ||||||||
| Net investment income | $ | 54,220 | $ | 505,424 | ||||
| Net realized gain on investments | 15,933,509 | 6,646,343 | ||||||
| Net change in unrealized appreciation (depreciation) on investments | (21,397,112 | ) | 8,023,383 | |||||
| Net increase (decrease) in net assets resulting from operations | (5,409,383 | ) | 15,175,150 | |||||
Distributions to shareholders from: | ||||||||
| Net investment income | ||||||||
| A-Class | (546,823 | ) | — | |||||
| Total distributions to shareholders | (546,823 | ) | — | |||||
Capital share transactions: | ||||||||
| Proceeds from sale of shares | ||||||||
| A-Class | 9,715,889 | 12,543,804 | ||||||
| B-Class | 1,180,154 | 2,379,823 | ||||||
| C-Class | 177,237 | 266,313 | ||||||
| Distributions reinvested | ||||||||
| A-Class | 502,041 | — | ||||||
| Cost of shares redeemed | ||||||||
| A-Class | (22,520,161 | ) | (27,969,578 | ) | ||||
| B-Class | (2,775,354 | ) | (3,966,116 | ) | ||||
| C-Class | (716,944 | ) | (514,992 | ) | ||||
| Net decrease from capital share transactions | (14,437,138 | ) | (17,260,746 | ) | ||||
| Net decrease in net assets | (20,393,344 | ) | (2,085,596 | ) | ||||
Net assets: | ||||||||
| Beginning of year | 183,346,489 | 185,432,085 | ||||||
| End of year | $ | 162,953,145 | $ | 183,346,489 | ||||
| Undistributed net investment income at end of year | $ | 13,084 | $ | 505,424 | ||||
Capital share activity:1 | ||||||||
| Shares sold | ||||||||
| A-Class | 493,303 | 736,887 | ||||||
| B-Class | 73,162 | 171,540 | ||||||
| C-Class | 10,210 | 17,562 | ||||||
| Shares issued from reinvestment of distributions | ||||||||
| A-Class | 26,342 | — | ||||||
| Shares redeemed | ||||||||
| A-Class | (1,144,274 | ) | (1,630,932 | ) | ||||
| B-Class | (172,978 | ) | (279,623 | ) | ||||
| C-Class | (40,853 | ) | (33,966 | ) | ||||
| Net decrease in shares | (755,088 | ) | (1,018,532 | ) | ||||
| 1 | The share activity for the year ended September 30, 2010 and the period October 1, 2010 through April 8, 2011 has been restated to reflect a 1:4 reverse share split effective April 8, 2011 — See Note 11. |
12 | the RYDEX|SGI equity funds annual report
| Year Ended | Year Ended | Year Ended | Year Ended | Year Ended | ||||||||||||||||
| September 30, | September 30, | September 30, | September 30, | September 30, | ||||||||||||||||
| A-Class | 2011d | 2010d | 2009d | 2008d | 2007d | |||||||||||||||
Per Share Data | ||||||||||||||||||||
| Net asset value, beginning of period | $ | 17.56 | $ | 16.20 | $ | 17.04 | $ | 27.36 | $ | 27.40 | ||||||||||
| Income (loss) from investment operations: | ||||||||||||||||||||
Net investment incomea | .01 | .04 | .04 | .04 | — | b | ||||||||||||||
| Net gain (loss) on investments (realized and unrealized) | (.74 | ) | 1.32 | (.80 | ) | (6.44 | ) | 2.76 | ||||||||||||
| Total from investment operations | (.73 | ) | 1.36 | (.76 | ) | (6.40 | ) | 2.76 | ||||||||||||
| Less distributions from: | ||||||||||||||||||||
| Net investment income | (.04 | ) | — | (.04 | ) | — | — | |||||||||||||
| Net realized gains | — | — | — | (3.88 | ) | (2.80 | ) | |||||||||||||
| Return of capital | — | — | (.04 | ) | (.04 | ) | — | |||||||||||||
| Total distributions | (.04 | ) | — | (.08 | ) | (3.92 | ) | (2.80 | ) | |||||||||||
| Net asset value, end of period | $ | 16.79 | $ | 17.56 | $ | 16.20 | $ | 17.04 | $ | 27.36 | ||||||||||
Total Returnc | (4.11 | )% | 8.40 | % | (4.32 | )% | (26.12 | )% | 10.33 | % | ||||||||||
Ratios/Supplemental Data | ||||||||||||||||||||
| Net assets, end of period (in thousands) | $ | 156,232 | $ | 174,371 | $ | 175,404 | $ | 205,908 | $ | 322,850 | ||||||||||
| Ratios to average net assets: | ||||||||||||||||||||
| Net investment income | 0.06 | % | 0.31 | % | 0.28 | % | 0.15 | % | 0.02 | % | ||||||||||
| Total expenses | 1.35 | % | 1.43 | % | 1.49 | % | 1.36 | % | 1.34 | % | ||||||||||
| Portfolio turnover rate | 92 | % | 100 | % | 69 | % | 111 | % | 20 | % | ||||||||||
| Year Ended | Year Ended | Year Ended | Year Ended | Year Ended | ||||||||||||||||
| September 30, | September 30, | September 30, | September 30, | September 30, | ||||||||||||||||
| B-Class | 2011d | 2010d | 2009d | 2008d | 2007d | |||||||||||||||
Per Share Data | ||||||||||||||||||||
| Net asset value, beginning of period | $ | 14.40 | $ | 13.36 | $ | 14.12 | $ | 23.56 | $ | 24.16 | ||||||||||
| Income (loss) from investment operations: | ||||||||||||||||||||
Net investment lossa | (.11 | ) | (.08 | ) | (.04 | ) | (.12 | ) | (.16 | ) | ||||||||||
| Net gain (loss) on investments (realized and unrealized) | (.60 | ) | 1.12 | (.68 | ) | (5.40 | ) | 2.36 | ||||||||||||
| Total from investment operations | (.71 | ) | 1.04 | (.72 | ) | (5.52 | ) | 2.20 | ||||||||||||
| Less distributions from: | ||||||||||||||||||||
| Net realized gains | — | — | — | (3.88 | ) | (2.80 | ) | |||||||||||||
| Return of capital | — | — | (.04 | ) | (.04 | ) | — | |||||||||||||
| Total distributions | — | — | (.04 | ) | (3.92 | ) | (2.80 | ) | ||||||||||||
| Net asset value, end of period | $ | 13.69 | $ | 14.40 | $ | 13.36 | $ | 14.12 | $ | 23.56 | ||||||||||
Total Returnc | (4.93 | )% | 7.78 | % | (4.96 | )% | (26.69 | )% | 9.33 | % | ||||||||||
Ratios/Supplemental Data | ||||||||||||||||||||
| Net assets, end of period (in thousands) | $ | 5,121 | $ | 6,817 | $ | 7,784 | $ | 10,621 | $ | 19,928 | ||||||||||
| Ratios to average net assets: | ||||||||||||||||||||
| Net investment loss | (0.70 | )% | (0.48 | )% | (0.46 | )% | (0.61 | )% | (0.74 | )% | ||||||||||
| Total expenses | 2.10 | % | 2.17 | % | 2.24 | % | 2.11 | % | 2.09 | % | ||||||||||
| Portfolio turnover rate | 92 | % | 100 | % | 69 | % | 111 | % | 20 | % | ||||||||||
the RYDEX|SGI equity funds annual report | 13
| Year Ended | Year Ended | Year Ended | Year Ended | Year Ended | ||||||||||||||||
| September 30, | September 30, | September 30, | September 30, | September 30, | ||||||||||||||||
| C-Class | 2011d | 2010d | 2009d | 2008d | 2007d | |||||||||||||||
Per Share Data | ||||||||||||||||||||
| Net asset value, beginning of period | $ | 15.56 | $ | 14.48 | $ | 15.24 | $ | 25.12 | $ | 25.56 | ||||||||||
| Income (loss) from investment operations: | ||||||||||||||||||||
Net investment lossa | (.12 | ) | (.08 | ) | (.04 | ) | (.12 | ) | (.20 | ) | ||||||||||
| Net gain (loss) on investments (realized and unrealized) | (.63 | ) | 1.16 | (.68 | ) | (5.84 | ) | 2.56 | ||||||||||||
| Total from investment operations | (.75 | ) | 1.08 | (.72 | ) | (5.96 | ) | 2.36 | ||||||||||||
| Less distributions from: | ||||||||||||||||||||
| Net realized gains | — | — | — | (3.88 | ) | (2.80 | ) | |||||||||||||
| Return of capital | — | — | (.04 | ) | (.04 | ) | — | |||||||||||||
| Total distributions | — | — | (.04 | ) | (3.92 | ) | (2.80 | ) | ||||||||||||
| Net asset value, end of period | $ | 14.81 | $ | 15.56 | $ | 14.48 | $ | 15.24 | $ | 25.12 | ||||||||||
Total Returnc | (4.82 | )% | 7.46 | % | (4.60 | )% | (26.79 | )% | 9.45 | % | ||||||||||
Ratios/Supplemental Data | ||||||||||||||||||||
| Net assets, end of period (in thousands) | $ | 1,600 | $ | 2,158 | $ | 2,244 | $ | 2,915 | $ | 5,048 | ||||||||||
| Ratios to average net assets: | ||||||||||||||||||||
| Net investment loss | (0.70 | )% | (0.44 | )% | (0.47 | )% | (0.60 | )% | (0.73 | )% | ||||||||||
| Total expenses | 2.10 | % | 2.18 | % | 2.24 | % | 2.11 | % | 2.09 | % | ||||||||||
| Portfolio turnover rate | 92 | % | 100 | % | 69 | % | 111 | % | 20 | % | ||||||||||
| a | Net investment income (loss) per share was computed using average shares outstanding throughout the period. | |
| b | Net investment income is less than $0.01 per share. | |
| c | Total return does not reflect the impact of any applicable sales charges and has not been annualized. | |
| d | Per share amounts for periods ended September 30, 2007 — September 30, 2010 and the period October 1, 2010 through April 8, 2011 have been restated to reflect 1:4 share split effective April 8, 2011. |
14 | the RYDEX|SGI equity funds annual report
| MANAGERS’ COMMENTARY (Unaudited) | September 30, 2011 |
| Advised by: | |
the RYDEX|SGI equity funds annual report | 15
| MANAGERS’ COMMENTARY (Unaudited) (concluded) | September 30, 2011 | |
| 1 | Performance figures are based on A-Class shares and do not reflect deduction of the sales charges or taxes that a shareholder would pay on distributions or the redemption of shares. Fee waivers and/or reimbursements reduce Fund expenses and, in the absence of such waivers, the performance quoted would be reduced. |
16 | the RYDEX|SGI equity funds annual report
| PERFORMANCE REPORT AND FUND PROFILE (Unaudited) | September 30, 2011 | |

| Since | ||||||||
| Inception | ||||||||
| 1 Year | (10/03/08) | |||||||
| A-Class | -5.93 | % | 1.53 | % | ||||
A-Class with sales charge† | -11.36 | % | -0.46 | % | ||||
| C-Class | -6.65 | % | 0.80 | % | ||||
C-Class with CDSC†† | -7.53 | % | 0.80 | % | ||||
| Institutional Class | -5.72 | % | 1.79 | % | ||||
| Russell 3000 Value Index | -2.22 | % | 0.29 | % | ||||
as % of Net Assets)
| Inception Dates: | ||||
| A-Class | October 3, 2008 | |||
| C-Class | October 3, 2008 | |||
| Institutional Class | October 3, 2008 | |||
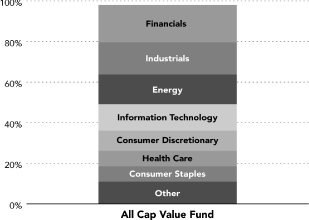
| Ten Largest Holdings (% of Total Net Assets) | ||||
| Equifax, Inc. | 3.7 | % | ||
| Lowe’s Companies, Inc. | 2.6 | % | ||
| Western Union Co. | 2.6 | % | ||
| Chevron Corp. | 2.5 | % | ||
| TE Connectivity Ltd. | 2.4 | % | ||
| Edison International | 2.3 | % | ||
| Time Warner, Inc. | 2.2 | % | ||
| ConocoPhillips | 2.1 | % | ||
| CVS Caremark Corp. | 2.1 | % | ||
| Computer Sciences Corp. | 2.1 | % | ||
| Top Ten Total | 24.6 | % | ||
| * | The performance data above represents past performance that is not predictive of future results. The investment return and principal value of an investment in the Fund will fluctuate so that an investor’s shares, when redeemed, may be worth more or less than their original cost. Returns are historical and include changes in principal and reinvested dividends and capital gains and do not reflect the effect of taxes. The Russell 3000 Value Index is an unmanaged index and, unlike the Fund, has no management fees or operating expenses to reduce its reported return. | |
| † | Effective February 22, 2011, the maximum sales charge decreased from 5.75% to 4.75%. A 5.75% maximum sales charge is used in the calculation of the 1 Year, 5 Year and 10 Year Average Annual Returns (based on subscriptions made prior to February 22, 2011), and a 4.75% maximum sales charge will be used to calculate performance for periods based on subscriptions made on or after February 22, 2011. | |
| †† | Fund returns include a CDSC of 1% if redeemed within 12 months of purchase. |
the RYDEX|SGI equity funds annual report | 17
| SCHEDULE OF INVESTMENTS | September 30, 2011 | |
| ALL CAP VALUE FUND | ||
| Shares | Value | |||||||
COMMON STOCKS† - 96.0% | ||||||||
Financials - 18.4% | ||||||||
| Aon Corp. | 1,334 | $ | 56,001 | |||||
| Berkshire Hathaway, Inc. — Class B* | 770 | 54,701 | ||||||
| Wells Fargo & Co. | 1,872 | 45,153 | ||||||
| U.S. Bancorp | 1,440 | 33,898 | ||||||
| American Financial Group, Inc. | 1,050 | 32,623 | ||||||
| Hanover Insurance Group, Inc. | 914 | 32,447 | ||||||
| WR Berkley Corp. | 1,066 | 31,650 | ||||||
| JPMorgan Chase & Co. | 1,010 | 30,421 | ||||||
| Allstate Corp. | 1,270 | 30,086 | ||||||
| BB&T Corp. | 1,335 | 28,476 | ||||||
| Bank of New York Mellon Corp. | 1,330 | 24,725 | ||||||
| State Street Corp. | 700 | 22,512 | ||||||
| Alleghany Corp. | 53 | 15,291 | ||||||
| Reinsurance Group of America, Inc. | 294 | 13,509 | ||||||
| Transatlantic Holdings, Inc. | 200 | 9,704 | ||||||
| Fifth Street Finance Corp. | 990 | 9,227 | ||||||
| Employers Holdings, Inc. | 719 | 9,174 | ||||||
| RenaissanceRe Holdings Ltd. | 140 | 8,932 | ||||||
| Old National Bancorp | 713 | 6,645 | ||||||
| Investors Real Estate Trust | 900 | 6,480 | ||||||
| Ocwen Financial Corp.* | 440 | 5,812 | ||||||
| Associated Banc-Corp. | 544 | 5,059 | ||||||
| Endurance Specialty Holdings Ltd. | 130 | 4,440 | ||||||
| First Marblehead Corp.* | 2,819 | 2,875 | ||||||
Total Financials | 519,841 | |||||||
Industrials - 15.8% | ||||||||
| Equifax, Inc. | 3,365 | 103,440 | ||||||
| Republic Services, Inc. | 1,900 | 53,314 | ||||||
| United Technologies Corp. | 530 | 37,291 | ||||||
| URS Corp.* | 1,000 | 29,660 | ||||||
| Quanta Services, Inc.* | 1,340 | 25,179 | ||||||
| Covanta Holding Corp. | 1,510 | 22,937 | ||||||
| GeoEye, Inc.* | 720 | 20,412 | ||||||
| Parker Hannifin Corp. | 252 | 15,909 | ||||||
| FedEx Corp. | 217 | 14,687 | ||||||
| Orbital Sciences Corp.* | 1,095 | 14,016 | ||||||
| FTI Consulting, Inc.* | 380 | 13,988 | ||||||
| Trex Company, Inc.* | 829 | 13,289 | ||||||
| General Cable Corp.* | 510 | 11,908 | ||||||
| Navigant Consulting, Inc.* | 1,245 | 11,541 | ||||||
| Insituform Technologies, Inc. — Class A* | 880 | 10,190 | ||||||
| USG Corp.* | 1,454 | 9,785 | ||||||
| Saia, Inc.* | 882 | 9,279 | ||||||
| Force Protection, Inc.* | 2,321 | 8,936 | ||||||
| Atlas Air Worldwide Holdings, Inc.* | 175 | 5,826 | ||||||
| DryShips, Inc.* | 2,120 | 4,961 | ||||||
| ICF International, Inc.* | 199 | 3,743 | ||||||
| Babcock & Wilcox Co.* | 150 | 2,932 | ||||||
| United Stationers, Inc. | 94 | 2,561 | ||||||
Total Industrials | 445,784 | |||||||
Energy - 14.7% | ||||||||
Chevron Corp.1 | 760 | 70,315 | ||||||
| ConocoPhillips | 960 | 60,787 | ||||||
| Williams Companies, Inc. | 2,160 | 52,574 | ||||||
| McDermott International, Inc.* | 4,638 | 49,905 | ||||||
| Apache Corp. | 500 | 40,120 | ||||||
| Halliburton Co. | 1,069 | 32,626 | ||||||
| Chesapeake Energy Corp. | 859 | 21,948 | ||||||
| Gulfport Energy Corp.* | 800 | 19,344 | ||||||
| Exxon Mobil Corp. | 190 | 13,800 | ||||||
| Plains Exploration & Production Co.* | 600 | 13,626 | ||||||
| SandRidge Energy, Inc.* | 1,744 | 9,697 | ||||||
| Arch Coal, Inc. | 600 | 8,748 | ||||||
| Goodrich Petroleum Corp.* | 713 | 8,428 | ||||||
| Resolute Energy Corp.* | 700 | 7,952 | ||||||
| USEC, Inc.* | 2,005 | 3,228 | ||||||
| Ocean Rig UDW, Inc.* | 15 | 233 | ||||||
Total Energy | 413,331 | |||||||
Information Technology - 13.1% | ||||||||
| Western Union Co. | 4,690 | 71,710 | ||||||
| TE Connectivity Ltd. | 2,352 | 66,185 | ||||||
| Computer Sciences Corp. | 2,243 | 60,225 | ||||||
| IXYS Corp.* | 3,814 | 41,496 | ||||||
| Cisco Systems, Inc. | 2,600 | 40,274 | ||||||
| Hewlett-Packard Co. | 1,290 | 28,961 | ||||||
| Maxwell Technologies, Inc.* | 1,259 | 23,178 | ||||||
| Cree, Inc.* | 470 | 12,211 | ||||||
| Power-One, Inc.* | 2,092 | 9,414 | ||||||
| Satyam Computer Services Ltd. ADR* | 3,215 | 8,777 | ||||||
| Symmetricom, Inc.* | 1,825 | 7,920 | ||||||
Total Information Technology | 370,351 | |||||||
Consumer Discretionary - 9.9% | ||||||||
| Lowe’s Companies, Inc. | 3,759 | 72,699 | ||||||
| Time Warner, Inc. | 2,087 | 62,547 | ||||||
| Cabela’s, Inc.* | 1,679 | 34,403 | ||||||
| Best Buy Company, Inc. | 800 | 18,640 | ||||||
| Chico’s FAS, Inc. | 1,600 | 18,288 | ||||||
| Penn National Gaming, Inc. | 400 | 13,316 | ||||||
| Maidenform Brands, Inc.* | 537 | 12,571 | ||||||
| Apollo Group, Inc. — Class A | 270 | 10,695 | ||||||
| Scholastic Corp. | 300 | 8,409 | ||||||
| Brown Shoe Company, Inc. | 1,063 | 7,569 | ||||||
| Hanesbrands, Inc.* | 300 | 7,503 | ||||||
| DeVry, Inc. | 140 | 5,174 | ||||||
| Jack in the Box, Inc.* | 210 | 4,183 | ||||||
| Fred’s, Inc. — Class A | 200 | 2,132 | ||||||
Total Consumer Discretionary | 278,129 | |||||||
18 | the RYDEX|SGI equity funds annual report
| SCHEDULE OF INVESTMENTS (concluded) | September 30, 2011 |
| Shares | Value | |||||||
Health Care - 7.6% | ||||||||
| Aetna, Inc. | 1,449 | $ | 52,671 | |||||
| Covidien plc | 1,038 | 45,776 | ||||||
| Hospira, Inc.* | 619 | 22,903 | ||||||
| Mednax, Inc.* | 324 | 20,295 | ||||||
| Forest Laboratories, Inc.* | 630 | 19,398 | ||||||
| UnitedHealth Group, Inc. | 350 | 16,142 | ||||||
| Medco Health Solutions, Inc.* | 244 | 11,441 | ||||||
| Universal Health Services, Inc. — Class B | 210 | 7,140 | ||||||
| Community Health Systems, Inc.* | 400 | 6,656 | ||||||
| Hologic, Inc.* | 399 | 6,069 | ||||||
| Kindred Healthcare, Inc.* | 605 | 5,215 | ||||||
Total Health Care | 213,706 | |||||||
Consumer Staples - 7.5% | ||||||||
| CVS Caremark Corp. | 1,808 | 60,713 | ||||||
| Wal-Mart Stores, Inc. | 800 | 41,520 | ||||||
| Kraft Foods, Inc. — Class A | 1,100 | 36,938 | ||||||
| Bunge Ltd. | 425 | 24,773 | ||||||
| JM Smucker Co. | 201 | 14,651 | ||||||
| Hormel Foods Corp. | 528 | 14,266 | ||||||
| Ralcorp Holdings, Inc.* | 173 | 13,271 | ||||||
| Beam, Inc.* | 100 | 5,408 | ||||||
Total Consumer Staples | 211,540 | |||||||
Materials - 4.6% | ||||||||
| Dow Chemical Co. | 1,656 | 37,194 | ||||||
| Bemis Company, Inc. | 1,194 | 34,996 | ||||||
| Owens-Illinois, Inc.* | 1,070 | 16,178 | ||||||
| Sonoco Products Co. | 521 | 14,708 | ||||||
| Louisiana-Pacific Corp.* | 2,800 | 14,280 | ||||||
| HB Fuller Co. | 352 | 6,414 | ||||||
| Zoltek Companies, Inc.* | 794 | 5,105 | ||||||
Total Materials | 128,875 | |||||||
Utilities - 3.6% | ||||||||
| Edison International | 1,680 | 64,260 | ||||||
| Black Hills Corp. | 500 | 15,320 | ||||||
| Great Plains Energy, Inc. | 497 | 9,592 | ||||||
| Allete, Inc. | 180 | 6,593 | ||||||
| MDU Resources Group, Inc. | 273 | 5,239 | ||||||
Total Utilities | 101,004 | |||||||
Telecommunication Services - 0.8% | ||||||||
| Windstream Corp. | 1,982 | 23,110 | ||||||
Total Common Stocks (Cost $2,885,517) | 2,705,671 | |||||||
EXCHANGE TRADED FUNDS† - 2.0% | ||||||||
| iShares S&P 500 Value Index Fund | 550 | 28,369 | ||||||
| iShares Russell 1000 Value Index Fund | 500 | 28,295 | ||||||
Total Exchange Traded Funds (Cost $66,134) | 56,664 | |||||||
Total Investments - 98.0% (Cost $2,951,651) | $ | 2,762,335 | ||||||
| Contracts | ||||||||
OPTIONS WRITTEN† - 0.0% | ||||||||
| Put Options on: | ||||||||
| Northern Trust Corp. | ||||||||
| Expiring January 2012 with strike price of $35.00 | 4 | (1,356 | ) | |||||
Total Options Written (Premiums received $1,472) | (1,356 | ) | ||||||
Cash & Other Assets, Less Liabilities - 2.0% | 57,350 | |||||||
Total Net Assets - 100.0% | $ | 2,818,329 | ||||||
| * | Non-income producing security. | |
| † | Value determined based on Level 1 inputs — See Note 4. | |
| 1 | All or a portion of this security is pledged as collateral for open options written at September 30, 2011. | |
| ADR — American Depositary Receipt | ||
| plc — Public Limited Company |
| See Notes to Financial Statements. | the RYDEX | SGI equity funds annual report | 19 |
Assets: | ||||
| Investments, at value (cost $2,951,651) | $ | 2,762,335 | ||
| Cash | 18,892 | |||
| Prepaid expenses | 10,572 | |||
| Receivables: | ||||
| Securities sold | 75,673 | |||
| Fund shares sold | 14,630 | |||
| Investment advisor | 9,499 | |||
| Dividends | 4,413 | |||
Total assets | 2,896,014 | |||
Liabilities: | ||||
| Options written, at value (premiums received $1,472) | 1,356 | |||
| Payable for: | ||||
| Fund shares redeemed | 55,954 | |||
| Professional fees | 9,517 | |||
| Securities purchased | 3,545 | |||
| Management fees | 1,672 | |||
| Distribution and service fees | 1,196 | |||
| Transfer agent/maintenance fees | 371 | |||
| Fund accounting/administration fees | 227 | |||
| Directors’ fees* | 150 | |||
| Miscellaneous | 3,697 | |||
Total liabilities | 77,685 | |||
Net assets | $ | 2,818,329 | ||
Net assets consist of: | ||||
| Paid in capital | $ | 2,861,780 | ||
| Undistributed net investment income | 2,724 | |||
| Accumulated net realized gain on investments | 143,025 | |||
| Net unrealized depreciation on investments | (189,200 | ) | ||
| Net assets | $ | 2,818,329 | ||
A-Class: | ||||
| Net assets | $ | 1,487,348 | ||
| Capital shares outstanding | 150,076 | |||
| Net asset value per share | $ | 9.91 | ||
| Maximum offering price per share (Net asset value divided by 95.25%) | $ | 10.40 | ||
C-Class: | ||||
| Net assets | $ | 1,030,713 | ||
| Capital shares outstanding | 106,080 | |||
| Net asset value per share | $ | 9.72 | ||
Institutional Class: | ||||
| Net assets | $ | 300,268 | ||
| Capital shares outstanding | 30,225 | |||
| Net asset value per share | $ | 9.93 | ||
Investment Income: | ||||
| Dividends | $ | 51,628 | ||
| Total investment income | 51,628 | |||
Expenses: | ||||
| Management fees | 22,771 | |||
| Transfer agent/maintenance fees | 5,049 | |||
| Distribution and service fees: | ||||
| A-Class | 4,447 | |||
| C-Class | 11,108 | |||
| Fund accounting/administration fees | 3,090 | |||
| Registration fees | 32,283 | |||
| Professional fees | 7,660 | |||
| Directors’ fees* | 490 | |||
| Miscellaneous | 10,901 | |||
| Total expenses | 97,799 | |||
| Less: | ||||
| Expenses waived by advisor | (49,063 | ) | ||
| Net expenses | 48,736 | |||
| Net investment income | 2,892 | |||
Net Realized and Unrealized Gain(Loss): | ||||
| Net realized gain (loss) on: | ||||
| Investments | 183,909 | |||
| Options written | 2,548 | |||
| Net realized gain | 186,457 | |||
| Net change in unrealized appreciation (depreciation) on: | ||||
| Investments | (392,366 | ) | ||
| Options written | (331 | ) | ||
| Net change in unrealized appreciation (depreciation) | (392,697 | ) | ||
| Net realized and unrealized loss | (206,240 | ) | ||
Net decrease in net assets resulting from operations | $ | (203,348 | ) | |
| * | Relates to Directors not deemed “interested persons” within the meaning of Section 2(a)(19) of the 1940 Act. |
| 20 | The RYDEX | SGI equity funds annual report | See Notes to Financial Statements. |
| Year Ended | Year Ended | |||||||
| September 30, | September 30, | |||||||
| 2011 | 2010 | |||||||
Increase (Decrease) In Net Assets From Operations: | ||||||||
| Net investment income | $ | 2,892 | $ | 3,935 | ||||
| Net realized gain on investments | 186,457 | 140,388 | ||||||
| Net change in unrealized appreciation (depreciation) on investments | (392,697 | ) | 54,786 | |||||
| Net increase (decrease) in net assets resulting from operations | (203,348 | ) | 199,109 | |||||
Distributions to shareholders from: | ||||||||
| Net investment income | ||||||||
| A-Class | (2,929 | ) | (1,974 | ) | ||||
| Institutional Class | (1,040 | ) | (1,736 | ) | ||||
| Net realized gains | ||||||||
| A-Class | (89,465 | ) | — | |||||
| C-Class | (51,878 | ) | — | |||||
| Institutional Class | (18,694 | ) | — | |||||
| Total distributions to shareholders | (164,006 | ) | (3,710 | ) | ||||
Capital share transactions: | ||||||||
| Proceeds from sale of shares | ||||||||
| A-Class | 509,310 | 1,353,803 | ||||||
| C-Class | 500,554 | 464,106 | ||||||
| Institutional Class | 23,672 | 43,200 | ||||||
| Distributions reinvested | ||||||||
| A-Class | 92,394 | 1,960 | ||||||
| C-Class | 51,833 | — | ||||||
| Institutional Class | 19,734 | 1,736 | ||||||
| Cost of shares redeemed | ||||||||
| A-Class | (547,992 | ) | (1,209,690 | ) | ||||
| C-Class | (166,421 | ) | (128,033 | ) | ||||
| Institutional Class | (25,872 | ) | (40,226 | ) | ||||
| Net increase from capital share transactions | 457,212 | 486,856 | ||||||
| Net increase in net assets | 89,858 | 682,255 | ||||||
Net assets: | ||||||||
| Beginning of year | 2,728,471 | 2,046,216 | ||||||
| End of year | $ | 2,818,329 | $ | 2,728,471 | ||||
| Undistributed net investment income at end of year | $ | 2,724 | $ | 3,801 | ||||
Capital share activity: | ||||||||
| Shares sold | ||||||||
| A-Class | 44,039 | 126,610 | ||||||
| C-Class | 42,478 | 42,853 | ||||||
| Institutional Class | 1,966 | 3,913 | ||||||
| Shares issued from reinvestment of distributions | ||||||||
| A-Class | 7,993 | 186 | ||||||
| C-Class | 4,547 | — | ||||||
| Institutional Class | 1,706 | 165 | ||||||
| Shares redeemed | ||||||||
| A-Class | (46,034 | ) | (111,974 | ) | ||||
| C-Class | (14,749 | ) | (12,031 | ) | ||||
| Institutional Class | (2,076 | ) | (3,913 | ) | ||||
| Net increase in shares | 39,870 | 45,809 | ||||||
| See Notes to Financial Statements. | the RYDEX | SGI equity funds annual report | 21 |
| Year Ended | Year Ended | Period Ended | ||||||||||
| September 30, | September 30, | September 30, | ||||||||||
| A-Class | 2011 | 2010 | 2009a | |||||||||
Per Share Data | ||||||||||||
| Net asset value, beginning of period | $ | 11.11 | $ | 10.21 | $ | 10.00 | ||||||
| Income (loss) from investment operations: | ||||||||||||
Net investment incomeb | .04 | .03 | .04 | |||||||||
| Net gain (loss) on investments (realized and unrealized) | (.61 | ) | .89 | .17 | ||||||||
| Total from investment operations | (.57 | ) | .92 | .21 | ||||||||
| Less distributions from: | ||||||||||||
| Net investment income | (.02 | ) | (.02 | ) | — | |||||||
| Net realized gains | (.61 | ) | — | — | ||||||||
| Total distributions | (.63 | ) | (.02 | ) | — | |||||||
| Net asset value, end of period | $ | 9.91 | $ | 11.11 | $ | 10.21 | ||||||
Total Returnc | (5.93 | )% | 8.97 | % | 2.10 | % | ||||||
Ratios/Supplemental Data | ||||||||||||
| Net assets, end of period (in thousands) | $ | 1,487 | $ | 1,601 | $ | 1,319 | ||||||
| Ratios to average net assets: | ||||||||||||
| Net investment income | 0.31 | % | 0.31 | % | 0.51 | % | ||||||
| Total expenses | 2.78 | % | 3.71 | % | 6.75 | % | ||||||
Net expensesd | 1.27 | % | 1.29 | % | 1.35 | % | ||||||
| Portfolio turnover rate | 30 | % | 55 | % | 17 | % | ||||||
| Year Ended | Year Ended | Period Ended | ||||||||||
| September 30, | September 30, | September 30, | ||||||||||
| C-Class | 2011 | 2010 | 2009a | |||||||||
Per Share Data | ||||||||||||
| Net asset value, beginning of period | $ | 10.97 | $ | 10.13 | $ | 10.00 | ||||||
| Income (loss) from investment operations: | ||||||||||||
Net investment lossb | (.05 | ) | (.04 | ) | (.02 | ) | ||||||
| Net gain (loss) on investments (realized and unrealized) | (.59 | ) | .88 | .15 | ||||||||
| Total from investment operations | (.64 | ) | .84 | .13 | ||||||||
| Less distributions from: | ||||||||||||
| Net realized gains | (.61 | ) | — | — | ||||||||
| Total distributions | (.61 | ) | — | — | ||||||||
| Net asset value, end of period | $ | 9.72 | $ | 10.97 | $ | 10.13 | ||||||
Total Returnc | (6.65 | )% | 8.29 | % | 1.30 | % | ||||||
Ratios/Supplemental Data | ||||||||||||
| Net assets, end of period (in thousands) | $ | 1,031 | $ | 809 | $ | 436 | ||||||
| Ratios to average net assets: | ||||||||||||
| Net investment loss | (0.42 | )% | (0.41 | )% | (0.18 | )% | ||||||
| Total expenses | 3.52 | % | 4.47 | % | 8.89 | % | ||||||
Net expensesd | 2.02 | % | 2.04 | % | 2.10 | % | ||||||
| Portfolio turnover rate | 30 | % | 55 | % | 17 | % | ||||||
| 22 | the RYDEX | SGI equity funds annual report | See Notes to Financial Statements. |
| Year Ended | Year Ended | Period Ended | ||||||||||
| September 30, | September 30, | September 30, | ||||||||||
| Institutional Class | 2011 | 2010 | 2009a | |||||||||
Per Share Data | ||||||||||||
| Net asset value, beginning of period | $ | 11.12 | $ | 10.24 | $ | 10.00 | ||||||
| Income (loss) from investment operations: | ||||||||||||
Net investment incomeb | .07 | .06 | .07 | |||||||||
| Net gain (loss) on investments (realized and unrealized) | (.62 | ) | .88 | .17 | ||||||||
| Total from investment operations | (.55 | ) | .94 | .24 | ||||||||
| Less distributions from: | ||||||||||||
| Net investment income | (.03 | ) | (.06 | ) | — | |||||||
| Net realized gains | (.61 | ) | — | — | ||||||||
| Total distributions | (.64 | ) | (.06 | ) | — | |||||||
| Net asset value, end of period | $ | 9.93 | $ | 11.12 | $ | 10.24 | ||||||
Total Returnc | (5.72 | %) | 9.22 | % | 2.40 | % | ||||||
Ratios/Supplemental Data | ||||||||||||
| Net assets, end of period (in thousands) | $ | 300 | $ | 318 | $ | 291 | ||||||
| Ratios to average net assets: | ||||||||||||
| Net investment income | 0.56 | % | 0.55 | % | 0.81 | % | ||||||
| Total expenses | 2.53 | % | 3.48 | % | 8.19 | % | ||||||
Net expensesd | 1.02 | % | 1.05 | % | 1.10 | % | ||||||
| Portfolio turnover rate | 30 | % | 55 | % | 17 | % | ||||||
| a | Since commencement of operations: October 3, 2008. Percentage amounts for the period, except total return and portfolio turnover rate, have been annualized. | |
| b | Net investment income (loss) per share was computed using average shares outstanding throughout the period. | |
| c | Total return does not reflect the impact of any applicable sales charges and has not been annualized. | |
| d | Net expense information reflects the expense ratios after expense waivers and reimbursements, as applicable. |
| See Notes to Financial Statements. | the RYDEX | SGI equity funds annual report | 23 |
| MANAGER’S COMMENTARY (Unaudited) | September 30, 2011 |
| 1 | Performance figures are based on A-Class shares and do not reflect deduction of the sales charges or taxes that a shareholder would pay on distributions or the redemption of shares. Fee waivers and/or reimbursements reduce Fund expenses and, in the absence of such waivers, the performance quoted would be reduced. |
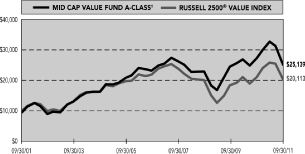
| PERFORMANCE REPORT AND FUND PROFILE (Unaudited) | September 30, 2011 |
| 1 Year | 5 Year | 10 Year | ||||||||||
| A-Class | -7.98 | % | 1.60 | % | 10.31 | % | ||||||
A-Class with sales charge† | -13.26 | % | 0.41 | % | 9.66 | % | ||||||
| B-Class | -8.66 | % | 0.85 | % | 9.62 | % | ||||||
B-Class with CDSC†† | -13.23 | % | 0.59 | % | 9.62 | % | ||||||
| C-Class | -8.68 | % | 0.84 | % | 9.46 | % | ||||||
C-Class with CDSC††† | -9.59 | % | 0.84 | % | 9.46 | % | ||||||
| Russell 2500 Value Index | -4.70 | % | -1.69 | % | 7.24 | % | ||||||
% of Net Assets)
| Inception Dates: | ||||
| A-Class | May 1, 1997 | |||
| B-Class | May 1, 1997 | |||
| C-Class | January 29, 1999 | |||
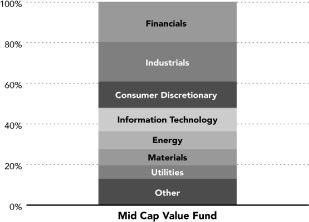
| Ten Largest Holdings (% of Total Net Assets) | ||||
| Hanover Insurance Group, Inc. | 3.7 | % | ||
| Computer Sciences Corp. | 3.0 | % | ||
| Cabela’s, Inc. | 2.8 | % | ||
| Bemis Company, Inc. | 2.6 | % | ||
| Maxwell Technologies, Inc. | 2.5 | % | ||
| WR Berkley Corp. | 2.4 | % | ||
| American Financial Group, Inc. | 2.4 | % | ||
| Covanta Holding Corp. | 2.3 | % | ||
| Gulfport Energy Corp. | 2.2 | % | ||
| IXYS Corp. | 2.1 | % | ||
| Top Ten Total | 26.0 | % | ||
| * | The performance data above represents past performance that is not predictive of future results. The investment return and principal value of an investment in the Fund will fluctuate so that an investor’s shares, when redeemed, may be worth more or less than their original cost. Returns are historical and include changes in principal and reinvested dividends and capital gains and do not reflect the effect of taxes. The Russell 2500 Value Index is an unmanaged index and, unlike the Fund, has no management fees or operating expenses to reduce its reported return. | |
| † | Effective February 22, 2011, the maximum sales charge decreased from 5.75% to 4.75%. A 5.75% maximum sales charge is used in the calculation of the 1 Year, 5 Year and 10 Year Average Annual Returns (based on subscriptions made prior to February 22, 2011), and a 4.75% maximum sales charge will be used to calculate performance for periods based on subscriptions made on or after February 22, 2011. | |
| †† | Fund returns include a CDSC of up to 5% if redeemed within 5 years of purchase. | |
| ††† | Fund returns include a CDSC of 1% if redeemed within 12 months of purchase. |
| SCHEDULE OF INVESTMENTS | September 30, 2011 |
| Shares | Value | |||||||
COMMON STOCKS† - 97.9% | ||||||||
Financials - 19.8% | ||||||||
| Hanover Insurance Group, Inc. | 1,256,910 | $ | 44,620,305 | |||||
| WR Berkley Corp. | 956,310 | 28,392,844 | ||||||
American Financial Group, Inc.1 | 903,700 | 28,077,959 | ||||||
| Alleghany Corp. | 70,600 | 20,368,100 | ||||||
| Reinsurance Group of America, Inc. | 387,754 | 17,817,296 | ||||||
| Transatlantic Holdings, Inc. | 246,700 | 11,969,884 | ||||||
| Fifth Street Finance Corp. | 1,263,932 | 11,779,846 | ||||||
| RenaissanceRe Holdings Ltd. | 177,000 | 11,292,600 | ||||||
| Old National Bancorp | 1,015,822 | 9,467,461 | ||||||
| Ocwen Financial Corp.* | 670,930 | 8,862,985 | ||||||
| Lexington Realty Trust | 1,207,800 | 7,899,012 | ||||||
| Associated Banc-Corp. | 731,277 | 6,800,876 | ||||||
| Northern Trust Corp. | 189,600 | 6,632,208 | ||||||
| Employers Holdings, Inc. | 486,300 | 6,205,188 | ||||||
| Endurance Specialty Holdings Ltd. | 177,930 | 6,076,310 | ||||||
| Investors Real Estate Trust | 674,800 | 4,858,560 | ||||||
| Redwood Trust, Inc. | 287,727 | 3,213,911 | ||||||
| First Marblehead Corp.* | 1,117,473 | 1,139,822 | ||||||
Total Financials | 235,475,167 | |||||||
Industrials - 19.0% | ||||||||
| Covanta Holding Corp. | 1,789,150 | 27,177,189 | ||||||
| GeoEye, Inc.* | 864,390 | 24,505,456 | ||||||
| Quanta Services, Inc.* | 1,067,600 | 20,060,204 | ||||||
| FTI Consulting, Inc.* | 525,210 | 19,332,980 | ||||||
| Navigant Consulting, Inc.* | 1,757,030 | 16,287,668 | ||||||
| General Cable Corp.* | 595,200 | 13,897,920 | ||||||
| Equifax, Inc. | 440,000 | 13,525,600 | ||||||
| Orbital Sciences Corp.* | 1,022,080 | 13,082,624 | ||||||
| Insituform Technologies, Inc. — Class A* | 913,100 | 10,573,698 | ||||||
| URS Corp.* | 338,300 | 10,033,978 | ||||||
| Babcock & Wilcox Co.* | 470,650 | 9,201,208 | ||||||
| ICF International, Inc.* | 437,700 | 8,233,137 | ||||||
| Force Protection, Inc.* | 2,066,525 | 7,956,121 | ||||||
| Atlas Air Worldwide Holdings, Inc.* | 221,411 | 7,370,772 | ||||||
| DryShips, Inc.* | 2,864,340 | 6,702,556 | ||||||
| Trex Company, Inc.* | 379,900 | 6,089,797 | ||||||
| Saia, Inc.* | 578,560 | 6,086,451 | ||||||
| United Stationers, Inc. | 178,902 | 4,875,080 | ||||||
| Thermoenergy Corp.* | 2,701,839 | 513,349 | ||||||
| UQM Technologies, Inc.* | 167,541 | 279,793 | ||||||
Total Industrials | 225,785,581 | |||||||
Consumer Discretionary - 12.9% | ||||||||
| Cabela’s, Inc.* | 1,617,193 | 33,136,285 | ||||||
Chico’s FAS, Inc.1 | 2,006,100 | 22,929,723 | ||||||
| Penn National Gaming, Inc. | 483,700 | 16,102,373 | ||||||
| Maidenform Brands, Inc.* | 655,900 | 15,354,619 | ||||||
| Apollo Group, Inc. — Class A | 356,000 | 14,101,160 | ||||||
| Scholastic Corp. | 386,600 | 10,836,398 | ||||||
| Brown Shoe Company, Inc. | 1,369,435 | 9,750,377 | ||||||
| Jack in the Box, Inc.* | 443,700 | 8,838,504 | ||||||
| Hanesbrands, Inc.* | 333,580 | 8,342,836 | ||||||
| DeVry, Inc. | 162,480 | 6,005,261 | ||||||
| Smith & Wesson Holding Corp.* | 2,024,310 | 5,101,261 | ||||||
| Fred’s, Inc. — Class A | 242,534 | 2,585,412 | ||||||
Total Consumer Discretionary | 153,084,209 | |||||||
Information Technology - 11.6% | ||||||||
| Computer Sciences Corp. | 1,317,120 | 35,364,672 | ||||||
Maxwell Technologies, Inc.*,2 | 1,617,554 | 29,779,169 | ||||||
IXYS Corp.*,2 | 2,336,630 | 25,422,534 | ||||||
| Cree, Inc.* | 629,640 | 16,358,047 | ||||||
| Satyam Computer Services Ltd. ADR* | 4,289,620 | 11,710,663 | ||||||
| Power-One, Inc.* | 2,509,259 | 11,291,666 | ||||||
| Symmetricom, Inc.* | 1,861,970 | 8,080,950 | ||||||
Total Information Technology | 138,007,701 | |||||||
Energy - 8.2% | ||||||||
| Gulfport Energy Corp.* | 1,101,077 | 26,624,042 | ||||||
| Plains Exploration & Production Co.* | 701,740 | 15,936,516 | ||||||
| SandRidge Energy, Inc.* | 2,862,970 | 15,918,113 | ||||||
| Goodrich Petroleum Corp.* | 1,075,129 | 12,708,025 | ||||||
| Resolute Energy Corp.* | 917,600 | 10,423,936 | ||||||
| McDermott International, Inc.* | 714,400 | 7,686,944 | ||||||
| USEC, Inc.* | 2,743,730 | 4,417,405 | ||||||
| Arch Coal, Inc. | 253,500 | 3,696,030 | ||||||
| Ocean Rig UDW, Inc.* | 20,812 | 315,306 | ||||||
Total Energy | 97,726,317 | |||||||
Materials - 7.8% | ||||||||
| Bemis Company, Inc. | 1,060,180 | 31,073,876 | ||||||
| Owens-Illinois, Inc.* | 1,313,740 | 19,863,749 | ||||||
| Sonoco Products Co. | 527,200 | 14,882,856 | ||||||
| Louisiana-Pacific Corp.* | 2,079,300 | 10,604,430 | ||||||
| HB Fuller Co. | 486,504 | 8,864,103 | ||||||
| Landec Corp.* | 911,716 | 4,850,329 | ||||||
| Zoltek Companies, Inc.* | 519,596 | 3,341,002 | ||||||
Total Materials | 93,480,345 | |||||||
Utilities - 6.7% | ||||||||
| Great Plains Energy, Inc. | 953,117 | 18,395,158 | ||||||
| Black Hills Corp. | 501,860 | 15,376,990 | ||||||
| NorthWestern Corp. | 373,456 | 11,928,185 | ||||||
| UGI Corp. | 386,242 | 10,146,577 | ||||||
| American Water Works Company, Inc. | 322,720 | 9,739,690 | ||||||
| Allete, Inc. | 234,600 | 8,593,398 | ||||||
| MDU Resources Group, Inc. | 305,768 | 5,867,688 | ||||||
Total Utilities | 80,047,686 | |||||||
| See Notes to Financial Statements. | the RYDEX | SGI equity funds annual report | 27 |
| SCHEDULE OF INVESTMENTS (concluded) | September 30, 2011 |
| Shares | Value | ||||||||
Consumer Staples - 6.0% | |||||||||
| JM Smucker Co. | 267,030 | $ | 19,463,817 | ||||||
| Hormel Foods Corp. | 701,840 | 18,963,717 | |||||||
| Ralcorp Holdings, Inc.* | 226,316 | 17,360,700 | |||||||
Bunge Ltd.1 | 160,890 | 9,378,278 | |||||||
| Beam, Inc.* | 121,500 | 6,570,720 | |||||||
Total Consumer Staples | 71,737,232 | ||||||||
Health Care - 5.9% | |||||||||
| Mednax, Inc.* | 347,641 | 21,776,232 | |||||||
| Forest Laboratories, Inc.* | 390,780 | 12,032,116 | |||||||
| Hologic, Inc.* | 737,801 | 11,221,953 | |||||||
| Universal Health Services, Inc. — Class B | 261,940 | 8,905,960 | |||||||
| Community Health Systems, Inc.* | 530,250 | 8,823,360 | |||||||
| Kindred Healthcare, Inc.* | 811,136 | 6,991,993 | |||||||
Total Health Care | 69,751,614 | ||||||||
Total Common Stocks (Cost $1,211,519,124) | 1,165,095,852 | ||||||||
CONVERTIBLE PREFERRED STOCK†† - 0.0% | |||||||||
Thermoenergy Corp.*,3 | 858,334 | 476,204 | |||||||
Total Convertible Preferred Stock (Cost $819,654) | 476,204 | ||||||||
WARRANTS†† - 0.0% | |||||||||
Thermoenergy Corp. $0.30, 07/31/153 | 13,733,344 | 558,947 | |||||||
Total Warrants (Cost $1,240,348) | 558,947 | ||||||||
EXCHANGE TRADED FUNDS† - 1.0% | |||||||||
| iShares Russell Midcap Value Index Fund | 180,000 | 6,940,800 | |||||||
| iShares Russell 2000 Value Index Fund | 79,860 | 4,554,416 | |||||||
Total Exchange Traded Funds (Cost $10,935,558) | 11,495,216 | ||||||||
| Face | |||||||||
| Amount | |||||||||
CONVERTIBLE BONDS†† - 1.1% | |||||||||
Energy - 0.6% | |||||||||
| USEC, Inc. 3.00% due 10/01/14 $13,600,000 | 7,174,000 | ||||||||
| Face | ||||||||
| Amount | Value | |||||||
Industrials - 0.5% | ||||||||
| DryShips, Inc. 5.00% due 12/01/14 | $ | 9,425,000 | $ | 5,808,156 | ||||
Total Convertible Bonds (Cost $19,511,906) | 12,982,156 | |||||||
Total Investments - 100.0% (Cost $1,244,026,590) | $ | 1,190,608,375 | ||||||
| Contracts | ||||||||
OPTIONS WRITTEN† - (0.3)% | ||||||||
| Call Options on: | ||||||||
| Chico’s FAS, Inc. Expiring January 2012 with strike price of $15.00 | 1,239 | (30,975 | ) | |||||
| Bunge Ltd. Expiring January 2012 with strike price of $62.50 | 972 | (320,760 | ) | |||||
Total Call Options | (351,735 | ) | ||||||
| Put Options on: | ||||||||
| Chico’s FAS, Inc. Expiring January 2012 with strike price of $12.50 | 1,487 | (312,270 | ) | |||||
| SandRidge Energy, Inc. Expiring December 2011 with strike price of $7.00 | 2,012 | (380,268 | ) | |||||
| Gulfport Energy Corp. Expiring October 2011 with strike price of $25.00 | 2,001 | (400,200 | ) | |||||
| Northern Trust Corp. Expiring January 2012 with strike price of $35.00 | 1,740 | (589,860 | ) | |||||
| Bunge Ltd. Expiring January 2012 with strike price of $60.00 | 1,012 | (647,680 | ) | |||||
| McDermott International, Inc Expiring November 2011 with strike price of $13.00 | 4,925 | (1,329,750 | ) | |||||
Total Put Options | (3,660,028 | ) | ||||||
Total Options Written (Premiums received $3,146,202) | (4,011,763 | ) | ||||||
Cash & Other Assets, Less Liabilities - 0.3% | 3,575,474 | |||||||
Total Net Assets - 100.0% | $ | 1,190,172,086 | ||||||
| * | Non-income producing security. | |
| † | Value determined based on Level 1 inputs — See Note 4. | |
| †† | Value determined based on Level 2 inputs — See Note 4. | |
| 1 | All or a portion of this security is pledged as collateral for open options written at September 30, 2011. | |
| 2 | Affiliated issuers — See Note 8. | |
| 3 | PIPE (Private Investment in Public Equity) — Stock issued by a company in the secondary market as a means of raising capital more quickly and less expensively than through registration of a secondary public offering. | |
| ADR — American Depositary Receipt |
| 28 | the RYDEX | SGI equity funds annual report | See Notes to Financial Statements. |
Assets: | ||||
| Investments in unaffiliated issuers, at value (cost $1,205,095,386) | $ | 1,135,406,672 | ||
| Investments in affiliated issuers, at value (cost $38,931,204) | 55,201,703 | |||
| Cash | 7,988,668 | |||
| Prepaid expenses | 90,356 | |||
| Receivables: | ||||
| Securities sold | 1,677,718 | |||
| Dividends | 1,063,929 | |||
| Fund shares sold | 925,739 | |||
| Interest | 360,984 | |||
Total assets | 1,202,715,769 | |||
Liabilities: | ||||
| Options written, at value (premiums received $3,146,202) | 4,011,763 | |||
| Payable for: | ||||
| Securities purchased | 3,554,414 | |||
| Fund shares redeemed | 2,965,494 | |||
| Management fees | 822,746 | |||
| Distribution and service fees | 402,897 | |||
| Fund accounting/administration fees | 99,007 | |||
| Transfer agent/maintenance fees | 96,041 | |||
| Directors’ fees* | 9,130 | |||
| Miscellaneous | 582,191 | |||
Total liabilities | 12,543,683 | |||
Net assets | $ | 1,190,172,086 | ||
Net assets consist of: | ||||
| Paid in capital | $ | 1,236,560,361 | ||
| Undistributed net investment income | — | |||
| Accumulated net realized gain on investments | 7,895,501 | |||
| Net unrealized depreciation on investments | (54,283,776 | ) | ||
| Net assets | $ | 1,190,172,086 | ||
A-Class: | ||||
| Net assets | $ | 973,467,195 | ||
| Capital shares outstanding | 35,881,053 | |||
| Net asset value per share | $ | 27.13 | ||
| Maximum offering price per share (Net asset value divided by 95.25%) | $ | 28.48 | ||
B-Class: | ||||
| Net assets | $ | 27,960,158 | ||
| Capital shares outstanding | 1,216,371 | |||
| Net asset value per share | $ | 22.99 | ||
C-Class: | ||||
| Net assets | $ | 188,744,733 | ||
| Capital shares outstanding | 7,969,549 | |||
| Net asset value per share | $ | 23.68 | ||
Investment Income: | ||||
| Dividends | $ | 16,970,819 | ||
| Interest | 722,109 | |||
| Total investment income | 17,692,928 | |||
Expenses: | ||||
| Management fees | 11,395,603 | |||
| Transfer agent/maintenance fees | 2,136,068 | |||
| Distribution and service fees: | ||||
| A-Class | 2,968,461 | |||
| B-Class | 400,840 | |||
| C-Class | 2,252,788 | |||
| Fund accounting/administration fees | 1,380,091 | |||
| Directors’ fees* | 117,539 | |||
| Miscellaneous | 482,046 | |||
| Total expenses | 21,133,436 | |||
| Net investment loss | (3,440,508 | ) | ||
Net Realized and Unrealized Gain (Loss): | ||||
| Net realized gain (loss) on: | ||||
| Investments in unaffiliated issuers | 93,505,286 | |||
| Investments in affiliated issuers | 756,394 | |||
| Options written | 2,010,007 | |||
| Net realized gain | 96,271,687 | |||
| Net change in unrealized appreciation (depreciation) on: | ||||
| Investments in unaffiliated issuers | (209,339,144 | ) | ||
| Investments in affiliated issuers | 8,748,239 | |||
| Options written | (1,503,487 | ) | ||
| Net change in unrealized appreciation (depreciation) | (202,094,392 | ) | ||
| Net realized and unrealized loss | (105,822,705 | ) | ||
Net decrease in net assets resulting from operations | $ | (109,263,213 | ) | |
| * | Relates to Directors not deemed “interested persons” within the meaning of Section 2(a)(19) of the 1940 Act. |
| See Notes to Financial Statements. | the RYDEX | SGI equity funds annual report | 29 |
| Year Ended | Year Ended | |||||||
| September 30, | September 30, | |||||||
| 2011 | 2010 | |||||||
Increase (Decrease) In Net Assets From Operations: | ||||||||
| Net investment income (loss) | $ | (3,440,508 | ) | $ | 2,637,672 | |||
| Net realized gain (loss) on investments | 96,271,687 | (2,816,034 | ) | |||||
| Net change in unrealized appreciation (depreciation) on investments | (202,094,392 | ) | 120,886,412 | |||||
| Net increase (decrease) in net assets resulting from operations | (109,263,213 | ) | 120,708,050 | |||||
Distributions to shareholders from: | ||||||||
| Net investment income | ||||||||
| A-Class | (2,703,664 | ) | (1,178,918 | ) | ||||
| Total distributions to shareholders | (2,703,664 | ) | (1,178,918 | ) | ||||
Capital share transactions: | ||||||||
| Proceeds from sale of shares | ||||||||
| A-Class | 324,475,268 | 525,044,189 | ||||||
| B-Class | 1,151,877 | 2,160,769 | ||||||
| C-Class | 50,436,018 | 60,822,739 | ||||||
| Distributions reinvested | ||||||||
| A-Class | 2,286,331 | 1,064,396 | ||||||
| Cost of shares redeemed | ||||||||
| A-Class | (319,562,384 | ) | (349,397,686 | ) | ||||
| B-Class | (13,883,753 | ) | (23,155,998 | ) | ||||
| C-Class | (35,726,724 | ) | (22,330,336 | ) | ||||
| Net increase from capital share transactions | 9,176,633 | 194,208,073 | ||||||
| Net increase (decrease) in net assets | (102,790,244 | ) | 313,737,205 | |||||
Net assets: | ||||||||
| Beginning of year | 1,292,962,330 | 979,225,125 | ||||||
| End of year | $ | 1,190,172,086 | $ | 1,292,962,330 | ||||
| Undistributed net investment income at end of year | $ | — | $ | 2,564,377 | ||||
Capital share activity: | ||||||||
| Shares sold | ||||||||
| A-Class | 9,983,874 | 18,798,275 | ||||||
| B-Class | 41,607 | 92,317 | ||||||
| C-Class | 1,764,740 | 2,460,598 | ||||||
| Shares issued from reinvestment of distributions | ||||||||
| A-Class | 71,136 | 38,861 | ||||||
| Shares redeemed | ||||||||
| A-Class | (9,926,468 | ) | (12,495,803 | ) | ||||
| B-Class | (506,587 | ) | (966,968 | ) | ||||
| C-Class | (1,274,995 | ) | (908,686 | ) | ||||
| Net increase in shares | 153,307 | 7,018,594 | ||||||
| 30 | the RYDEX | SGI equity funds annual report | See Notes to Financial Statements. |
| Year Ended | Year Ended | Year Ended | Year Ended | Year Ended | ||||||||||||||||
| September 30, | September 30, | September 30, | September 30, | September 30, | ||||||||||||||||
| A-Class | 2011 | 2010 | 2009 | 2008 | 2007 | |||||||||||||||
Per Share Data | ||||||||||||||||||||
| Net asset value, beginning of period | $ | 29.55 | $ | 26.58 | $ | 28.41 | $ | 40.79 | $ | 38.27 | ||||||||||
| Income (loss) from investment operations: | ||||||||||||||||||||
Net investment income (loss)a | (.03 | ) | .11 | .08 | .25 | .25 | ||||||||||||||
| Net gain (loss) on investments (realized and unrealized) | (2.31 | ) | 2.90 | .82 | (4.77 | ) | 4.59 | |||||||||||||
| Total from investment operations | (2.34 | ) | 3.01 | .90 | (4.52 | ) | 4.84 | |||||||||||||
| Less distributions from: | ||||||||||||||||||||
| Net investment income | (.08 | ) | (.04 | ) | (.14 | ) | (.14 | ) | (.23 | ) | ||||||||||
| Net realized gains | — | — | (2.59 | ) | (7.72 | ) | (2.09 | ) | ||||||||||||
| Total distributions | (.08 | ) | (.04 | ) | (2.73 | ) | (7.86 | ) | (2.32 | ) | ||||||||||
| Net asset value, end of period | $ | 27.13 | $ | 29.55 | $ | 26.58 | $ | 28.41 | $ | 40.79 | ||||||||||
Total Returnb | (7.98 | )% | 11.32 | % | 6.90 | % | (12.48 | )% | 12.96 | % | ||||||||||
Ratios/Supplemental Data | ||||||||||||||||||||
| Net assets, end of period (in thousands) | $ | 973,467 | $ | 1,056,655 | $ | 781,883 | $ | 656,044 | $ | 687,484 | ||||||||||
| Ratios to average net assets: | ||||||||||||||||||||
| Net investment income (loss) | (0.10 | )% | 0.38 | % | 0.40 | % | 0.79 | % | 0.61 | % | ||||||||||
| Total expenses | 1.32 | % | 1.37 | % | 1.48 | % | 1.37 | % | 1.32 | % | ||||||||||
| Portfolio turnover rate | 28 | % | 23 | % | 31 | % | 68 | % | 44 | % | ||||||||||
| Year Ended | Year Ended | Year Ended | Year Ended | Year Ended | ||||||||||||||||
| September 30, | September 30, | September 30, | September 30, | September 30, | ||||||||||||||||
| B-Class | 2011 | 2010 | 2009 | 2008 | 2007 | |||||||||||||||
Per Share Data | ||||||||||||||||||||
| Net asset value, beginning of period | $ | 25.17 | $ | 22.78 | $ | 24.83 | $ | 36.78 | $ | 34.76 | ||||||||||
| Income (loss) from investment operations: | ||||||||||||||||||||
Net investment lossa | (.24 | ) | (.09 | ) | (.06 | ) | (— | )c | (.04 | ) | ||||||||||
| Net gain (loss) on investments (realized and unrealized) | (1.94 | ) | 2.48 | .60 | (4.23 | ) | 4.15 | |||||||||||||
| Total from investment operations | (2.18 | ) | 2.39 | .54 | (4.23 | ) | 4.11 | |||||||||||||
| Less distributions from: | ||||||||||||||||||||
| Net realized gains | — | — | (2.59 | ) | (7.72 | ) | (2.09 | ) | ||||||||||||
| Total distributions | — | — | (2.59 | ) | (7.72 | ) | (2.09 | ) | ||||||||||||
| Net asset value, end of period | $ | 22.99 | $ | 25.17 | $ | 22.78 | $ | 24.83 | $ | 36.78 | ||||||||||
Total Returnb | (8.66 | )% | 10.49 | % | 6.17 | % | (13.14 | )% | 12.10 | % | ||||||||||
Ratios/Supplemental Data | ||||||||||||||||||||
| Net assets, end of period (in thousands) | $ | 27,960 | $ | 42,321 | $ | 58,221 | $ | 66,641 | $ | 106,179 | ||||||||||
| Ratios to average net assets: | ||||||||||||||||||||
| Net investment loss | (0.86 | )% | (0.40 | )% | (0.34 | )% | (0.01 | )% | (0.10 | )% | ||||||||||
| Total expenses | 2.07 | % | 2.12 | % | 2.23 | % | 2.12 | % | 2.07 | % | ||||||||||
| Portfolio turnover rate | 28 | % | 23 | % | 31 | % | 68 | % | 44 | % | ||||||||||
| See Notes to Financial Statements. | the RYDEX | SGI equity funds annual report | 31 |
| Year Ended | Year Ended | Year Ended | Year Ended | Year Ended | ||||||||||||||||
| September 30, | September 30, | September 30, | September 30, | September 30, | ||||||||||||||||
| C-Class | 2011 | 2010 | 2009 | 2008 | 2007 | |||||||||||||||
Per Share Data | ||||||||||||||||||||
| Net asset value, beginning of period | $ | 25.93 | $ | 23.47 | $ | 25.49 | $ | 37.54 | $ | 35.43 | ||||||||||
| Income (loss) from investment operations: | ||||||||||||||||||||
Net investment lossa | (.24 | ) | (.09 | ) | (.07 | ) | (— | )c | (.05 | ) | ||||||||||
| Net gain (loss) on investments (realized and unrealized) | (2.01 | ) | 2.55 | .64 | (4.33 | ) | 4.25 | |||||||||||||
| Total from investment operations | (2.25 | ) | 2.46 | .57 | (4.33 | ) | 4.20 | |||||||||||||
| Less distributions from: | ||||||||||||||||||||
| Net realized gains | — | — | (2.59 | ) | (7.72 | ) | (2.09 | ) | ||||||||||||
| Total distributions | — | — | (2.59 | ) | (7.72 | ) | (2.09 | ) | ||||||||||||
| Net asset value, end of period | $ | 23.68 | $ | 25.93 | $ | 23.47 | $ | 25.49 | $ | 37.54 | ||||||||||
Total Returnb | (8.68 | %) | 10.48 | % | 6.13 | % | (13.15 | %) | 12.13 | % | ||||||||||
Ratios/Supplemental Data | ||||||||||||||||||||
| Net assets, end of period (in thousands) | $ | 188,745 | $ | 193,986 | $ | 139,121 | $ | 113,192 | $ | 176,746 | ||||||||||
| Ratios to average net assets: | ||||||||||||||||||||
| Net investment loss | (0.85 | %) | (0.37 | %) | (0.35 | %) | (0.01 | %) | (0.12 | %) | ||||||||||
| Total expenses | 2.07 | % | 2.12 | % | 2.22 | % | 2.12 | % | 2.07 | % | ||||||||||
| Portfolio turnover rate | 28 | % | 23 | % | 31 | % | 68 | % | 44 | % | ||||||||||
| a | Net investment income (loss) per share was computed using average shares outstanding throughout the year. | |
| b | Total return does not reflect the impact of any applicable sales charges and has not been annualized. | |
| c | Net investment loss is less than $0.01 per share. |
| 32 | the RYDEX | SGI equity funds annual report | See Notes to Financial Statements. |
| MANAGER’S COMMENTARY (Unaudited) | September 30, 2011 |
| 1 | Performance figures do not reflect deduction of the sales charges or taxes that a shareholder would pay on distributions or the redemption of shares. Fee waivers and/or reimbursements reduce Fund expenses and, in the absence of such waivers, the performance quoted would be reduced. |
| PERFORMANCE REPORT AND FUND PROFILE (Unaudited) | September 30, 2011 |
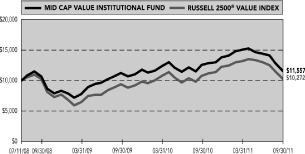
| Since | ||||||||
| Inception | ||||||||
| 1 Year | (07/11/08) | |||||||
| Mid Cap Value Institutional Fund | -8.05 | % | 4.59 | % | ||||
| Russell 2500 Value Index | -4.70 | % | 0.84 | % | ||||
% of Net Assets)
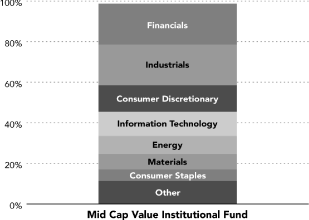
| Ten Largest Holdings (% of Total Net Assets) | ||||
| Hanover Insurance Group, Inc. | 3.8 | % | ||
| Computer Sciences Corp. | 3.1 | % | ||
| Cabela’s, Inc. | 2.8 | % | ||
| Maxwell Technologies, Inc. | 2.6 | % | ||
| Bemis Company, Inc. | 2.5 | % | ||
| WR Berkley Corp. | 2.4 | % | ||
| American Financial Group, Inc. | 2.3 | % | ||
| Covanta Holding Corp. | 2.3 | % | ||
| Gulfport Energy Corp. | 2.2 | % | ||
| IXYS Corp. | 2.2 | % | ||
| Top Ten Total | 26.2 | % | ||
| “ Ten Largest Holdings” exclude any temporary cash or derivative investments. |
| * | The performance data above represents past performance that is not predictive of future results. The investment return and principal value of an investment in the Fund will fluctuate so that an investor’s shares, when redeemed, may be worth more or less than their original cost. Returns are historical and include changes in principal and reinvested dividends and capital gains and do not reflect the effect of taxes. The Russell 2500 Value Index is an unmanaged index and, unlike the Fund, has no management fees or operating expenses to reduce its reported return. |
| SCHEDULE OF INVESTMENTS | September 30, 2011 |
| Shares | Value | |||||||
COMMON STOCKS† - 97.5% | ||||||||
Financials - 20.1% | ||||||||
| Hanover Insurance Group, Inc. | 502,891 | $ | 17,852,630 | |||||
| WR Berkley Corp. | 383,810 | 11,395,319 | ||||||
American Financial Group, Inc.1 | 353,570 | 10,985,420 | ||||||
| Alleghany Corp. | 28,808 | 8,311,108 | ||||||
| Reinsurance Group of America, Inc. | 151,923 | 6,980,862 | ||||||
| Transatlantic Holdings, Inc. | 104,200 | 5,055,784 | ||||||
| Fifth Street Finance Corp. | 502,507 | 4,683,365 | ||||||
| RenaissanceRe Holdings Ltd. | 73,300 | 4,676,540 | ||||||
| Old National Bancorp | 393,845 | 3,670,635 | ||||||
| Ocwen Financial Corp.* | 260,360 | 3,439,356 | ||||||
| Lexington Realty Trust | 481,300 | 3,147,702 | ||||||
| Associated Banc-Corp. | 292,352 | 2,718,874 | ||||||
| Employers Holdings, Inc. | 205,900 | 2,627,284 | ||||||
| Northern Trust Corp. | 74,460 | 2,604,611 | ||||||
| Endurance Specialty Holdings Ltd. | 74,550 | 2,545,882 | ||||||
| Investors Real Estate Trust | 245,000 | 1,764,000 | ||||||
| Redwood Trust, Inc. | 125,600 | 1,402,952 | ||||||
| First Marblehead Corp.* | 557,384 | 568,532 | ||||||
| Bimini Capital Management, Inc. — Class A | 445,113 | 269,293 | ||||||
Total Financials | 94,700,149 | |||||||
Industrials - 19.5% | ||||||||
| Covanta Holding Corp. | 710,040 | 10,785,508 | ||||||
| GeoEye, Inc.* | 353,900 | 10,033,065 | ||||||
| Quanta Services, Inc.* | 443,200 | 8,327,728 | ||||||
| FTI Consulting, Inc.* | 213,600 | 7,862,616 | ||||||
| Navigant Consulting, Inc.* | 692,070 | 6,415,489 | ||||||
| General Cable Corp.* | 243,600 | 5,688,060 | ||||||
| Equifax, Inc. | 181,500 | 5,579,310 | ||||||
| Orbital Sciences Corp.* | 397,788 | 5,091,686 | ||||||
| Insituform Technologies, Inc. — Class A* | 386,640 | 4,477,291 | ||||||
| URS Corp.* | 148,040 | 4,390,866 | ||||||
| Babcock & Wilcox Co.* | 196,600 | 3,843,530 | ||||||
| Force Protection, Inc.* | 913,803 | 3,518,142 | ||||||
| ICF International, Inc.* | 178,910 | 3,365,297 | ||||||
| Atlas Air Worldwide Holdings, Inc.* | 86,961 | 2,894,932 | ||||||
| DryShips, Inc.* | 1,199,870 | 2,807,696 | ||||||
| Trex Company, Inc.* | 151,200 | 2,423,736 | ||||||
| Saia, Inc.* | 219,570 | 2,309,876 | ||||||
| United Stationers, Inc. | 78,556 | 2,140,651 | ||||||
| UQM Technologies, Inc.* | 67,422 | 112,595 | ||||||
Total Industrials | 92,068,074 | |||||||
Consumer Discretionary - 13.1% | ||||||||
| Cabela’s, Inc.* | 647,661 | 13,270,574 | ||||||
Chico’s FAS, Inc.1 | 789,170 | 9,020,213 | ||||||
| Maidenform Brands, Inc.* | 272,717 | 6,384,305 | ||||||
| Penn National Gaming, Inc. | 189,760 | 6,317,110 | ||||||
| Apollo Group, Inc. — Class A | 149,690 | 5,929,221 | ||||||
| Scholastic Corp. | 157,600 | 4,417,528 | ||||||
| Brown Shoe Company, Inc. | 574,257 | 4,088,710 | ||||||
| Jack in the Box, Inc.* | 183,130 | 3,647,950 | ||||||
| Hanesbrands, Inc.* | 140,160 | 3,505,402 | ||||||
| DeVry, Inc. | 66,060 | 2,441,578 | ||||||
| Smith & Wesson Holding Corp.* | 824,826 | 2,078,561 | ||||||
| Fred’s, Inc. — Class A | 89,226 | 951,149 | ||||||
HydroGen Corp.*,2 | 1,265,700 | 18,985 | ||||||
Total Consumer Discretionary | 62,071,286 | |||||||
Information Technology - 11.9% | ||||||||
| Computer Sciences Corp. | 537,370 | 14,428,385 | ||||||
| Maxwell Technologies, Inc.* | 669,475 | 12,325,035 | ||||||
| IXYS Corp.* | 938,179 | 10,207,388 | ||||||
| Cree, Inc.* | 254,300 | 6,606,714 | ||||||
| Satyam Computer Services Ltd. ADR* | 1,770,399 | 4,833,189 | ||||||
| Power-One, Inc.* | 1,027,775 | 4,624,987 | ||||||
| Symmetricom, Inc.* | 696,000 | 3,020,640 | ||||||
Total Information Technology | 56,046,338 | |||||||
Energy - 8.3% | ||||||||
| Gulfport Energy Corp.* | 427,612 | 10,339,658 | ||||||
| SandRidge Energy, Inc.* | 1,191,351 | 6,623,912 | ||||||
| Plains Exploration & Production Co.* | 273,230 | 6,205,053 | ||||||
| Goodrich Petroleum Corp.* | 422,250 | 4,990,995 | ||||||
| Resolute Energy Corp.* | 383,600 | 4,357,696 | ||||||
| McDermott International, Inc.* | 277,300 | 2,983,748 | ||||||
| USEC, Inc.* | 1,248,200 | 2,009,602 | ||||||
| Arch Coal, Inc. | 102,500 | 1,494,450 | ||||||
| Ocean Rig UDW, Inc.* | 8,718 | 132,082 | ||||||
Total Energy | 39,137,196 | |||||||
Materials - 7.6% | ||||||||
| Bemis Company, Inc. | 399,150 | 11,699,086 | ||||||
| Owens-Illinois, Inc.* | 513,300 | 7,761,096 | ||||||
| Sonoco Products Co. | 186,500 | 5,264,895 | ||||||
| Louisiana-Pacific Corp.* | 830,700 | 4,236,570 | ||||||
| HB Fuller Co. | 200,316 | 3,649,758 | ||||||
| Landec Corp.* | 358,600 | 1,907,752 | ||||||
| Zoltek Companies, Inc.* | 241,514 | 1,552,935 | ||||||
Total Materials | 36,072,092 | |||||||
Consumer Staples - 5.7% | ||||||||
| Hormel Foods Corp. | 261,520 | 7,066,270 | ||||||
| JM Smucker Co. | 95,950 | 6,993,795 | ||||||
| Ralcorp Holdings, Inc.* | 88,922 | 6,821,207 | ||||||
Bunge Ltd.1 | 65,420 | 3,813,332 | ||||||
| Beam, Inc.* | 44,000 | 2,379,520 | ||||||
Total Consumer Staples | 27,074,124 | |||||||
| 36 | the RYDEX | SGI equity funds annual report | See Notes to Financial Statements. |
| SCHEDULE OF INVESTMENTS (concluded) | September 30, 2011 |
| Shares | Value | |||||||
Utilities - 5.7% | ||||||||
| Great Plains Energy, Inc. | 402,735 | $ | 7,772,786 | |||||
| Black Hills Corp. | 211,540 | 6,481,586 | ||||||
| NorthWestern Corp. | 145,676 | 4,652,891 | ||||||
| Allete, Inc. | 91,500 | 3,351,645 | ||||||
| MDU Resources Group, Inc. | 123,467 | 2,369,332 | ||||||
| UGI Corp. | 87,960 | 2,310,709 | ||||||
Total Utilities | 26,938,949 | |||||||
Health Care - 5.6% | ||||||||
| Mednax, Inc.* | 114,813 | 7,191,886 | ||||||
| Hologic, Inc.* | 307,882 | 4,682,885 | ||||||
| Forest Laboratories, Inc.* | 151,230 | 4,656,372 | ||||||
| Community Health Systems, Inc.* | 211,450 | 3,518,528 | ||||||
| Universal Health Services, Inc. — Class B | 102,930 | 3,499,620 | ||||||
| Kindred Healthcare, Inc.* | 340,497 | 2,935,084 | ||||||
| ICU Medical, Inc.* | 2,400 | 88,320 | ||||||
Total Health Care | 26,572,695 | |||||||
Total Common Stocks (Cost $493,846,610) | 460,680,903 | |||||||
CONVERTIBLE PREFERRED STOCK†† - 0.1% | ||||||||
Thermoenergy Corp.*,3 | 793,750 | 440,372 | ||||||
Total Convertible Preferred Stock (Cost $757,981) | 440,372 | |||||||
WARRANTS†† - 0.1% | ||||||||
Thermoenergy Corp. $0.30, 07/31/153 | 12,700,000 | 516,890 | ||||||
Total Warrants (Cost $1,147,020) | 516,890 | |||||||
| Face | ||||||||
| Amount | ||||||||
CONVERTIBLE BONDS†† - 1.0% | ||||||||
Energy — 0.6% | ||||||||
| USEC, Inc. 3.00% due 10/01/14 | $ | 5,500,000 | 2,901,250 | |||||
Industrials — 0.4% | ||||||||
| DryShips, Inc. 5.00% due 12/01/14 | 2,725,000 | 1,679,281 | ||||||
Total Convertible Bonds (Cost $6,563,744) | 4,580,531 | |||||||
| Value | ||||
Total Investments - 98.7% (Cost $502,315,355) | $ | 466,218,696 | ||
| Contracts | ||||||||
OPTIONS WRITTEN† - (0.3)% | ||||||||
| Call Options on: | ||||||||
| Chico’s FAS, Inc. Expiring January 2012 with strike price of $15.00 | 522 | (13,050 | ) | |||||
| Bunge Ltd. Expiring January 2012 with strike price of $62.50 | 409 | (134,970 | ) | |||||
Total Call Options | (148,020 | ) | ||||||
| Put Options on: | ||||||||
| Chico’s FAS, Inc. Expiring January 2012 with strike price of $12.50 | 626 | (131,460 | ) | |||||
| SandRidge Energy, Inc. Expiring December 2011 with strike price of $7.00 | 845 | (159,705 | ) | |||||
| Gulfport Energy Corp. Expiring October 2011 with strike price of $25.00 | 840 | (168,000 | ) | |||||
| Northern Trust Corp. Expiring January 2012 with strike price of $35.00 | 735 | (249,165 | ) | |||||
| Bunge Ltd. Expiring January 2012 with strike price of $60.00 | 425 | (272,000 | ) | |||||
| McDermott International, Inc Expiring November 2011 with strike price of $13.00 | 1,940 | (523,800 | ) | |||||
Total Put Options | (1,504,130 | ) | ||||||
Total Options Written (Premiums received $1,308,247) | (1,652,150 | ) | ||||||
Cash & Other Assets, Less Liabilities - 1.6% | 7,699,459 | |||||||
Total Net Assets - 100.0% | $ | 472,266,005 | ||||||
| * | Non-income producing security. | |
| † | Value determined based on Level 1 inputs — See Note 4. | |
| †† | Value determined based on Level 2 inputs — See Note 4. | |
| 1 | All or a portion of this security is pledged as collateral for open options written at September 30, 2011. | |
| 2 | Affiliated issuers — See Note 8. | |
| 3 | PIPE (Private Investment in Public Equity) — Stock issued by a company in the secondary market as a means of raising capital more quickly and less expensively than through registration of a secondary public offering. | |
| ADR — American Depositary Receipt |
| See Notes to Financial Statements. | the RYDEX | SGI equity funds annual report | 37 |
Assets: | ||||
| Investments in unaffiliated issuers, at value (cost $502,312,824) | $ | 466,199,711 | ||
| Investments in affiliated issuers, at value (cost $2,531) | 18,985 | |||
| Cash | 2,981,570 | |||
| Prepaid expenses | 44,617 | |||
| Receivables: | ||||
| Fund shares sold | 6,090,693 | |||
| Dividends | 416,191 | |||
| Securities sold | 377,832 | |||
| Interest | 127,881 | |||
| Investment advisor | 99,951 | |||
Total assets | 476,357,431 | |||
Liabilities: | ||||
| Options written, at value (premiums received $1,308,247) | 1,652,150 | |||
| Payable for: | ||||
| Securities purchased | 1,205,174 | |||
| Fund shares redeemed | 811,563 | |||
| Management fees | 310,116 | |||
| Fund accounting/administration fees | 39,281 | |||
| Transfer agent/maintenance fees | 16,194 | |||
| Directors’ fees* | 7,142 | |||
| Miscellaneous | 49,806 | |||
Total liabilities | 4,091,426 | |||
Net assets | $ | 472,266,005 | ||
Net assets consist of: | ||||
| Paid in capital | $ | 464,162,426 | ||
| Undistributed net investment income | 1,977,505 | |||
| Accumulated net realized gain on investments | 42,566,636 | |||
| Net unrealized depreciation on investments | (36,440,562 | ) | ||
| Net assets | $ | 472,266,005 | ||
| Net assets | $ | 472,266,005 | ||
| Capital shares outstanding | 47,348,439 | |||
| Net asset value per share | $ | 9.97 | ||
Investment Income: | ||||
| Dividends | $ | 6,886,066 | ||
| Interest | 445,520 | |||
| Total investment income | 7,331,586 | |||
Expenses: | ||||
| Management fees | 4,428,783 | |||
| Transfer agent/maintenance fees | 455,193 | |||
| Fund accounting/administration fees | 560,972 | |||
| Directors’ fees* | 62,653 | |||
| Miscellaneous | 253,118 | |||
| Total expenses | 5,760,719 | |||
| Less: | ||||
| Expenses waived by advisor | (443,419 | ) | ||
| Net expenses | 5,317,300 | |||
| Net investment income | 2,014,286 | |||
Net Realized and Unrealized Gain (Loss): | ||||
| Net realized gain (loss) on: | ||||
| Investments | 45,286,587 | |||
| Options written | 782,329 | |||
| Net realized gain | 46,068,916 | |||
| Net change in unrealized appreciation (depreciation) on: | ||||
| Investments in unaffiliated issuers | (92,848,671 | ) | ||
| Investments in affiliated issuers | 15,062 | |||
| Options written | (580,465 | ) | ||
| Net change in unrealized appreciation (depreciation) | (93,414,074 | ) | ||
| Net realized and unrealized loss | (47,345,158 | ) | ||
Net decrease in net assets resulting from operations | $ | (45,330,872 | ) | |
| * | Relates to Directors not deemed “interested persons” within the meaning of Section 2(a)(19) of the 1940 Act. |
| 38 | the RYDEX|SGI equity funds annual report | See Notes to Financial Statements. |
| Year Ended | Year Ended | |||||||
| September 30, | September 30, | |||||||
| 2011 | 2010 | |||||||
Increase (Decrease) In Net Assets From Operations: | ||||||||
| Net investment income | $ | 2,014,286 | $ | 3,027,929 | ||||
| Net realized gain on investments | 46,068,916 | 21,766,168 | ||||||
| Net change in unrealized appreciation (depreciation) on investments | (93,414,074 | ) | 19,799,839 | |||||
| Net increase (decrease) in net assets resulting from operations | (45,330,872 | ) | 44,593,936 | |||||
Distributions to shareholders from: | ||||||||
| Net investment income | (3,064,710 | ) | (326,334 | ) | ||||
| Net realized gains | (22,149,496 | ) | (11,082,828 | ) | ||||
| Total distributions to shareholders | (25,214,206 | ) | (11,409,162 | ) | ||||
Capital share transactions: | ||||||||
| Proceeds from sale of shares | 230,594,999 | 259,968,422 | ||||||
| Distributions reinvested | 10,706,814 | 5,348,897 | ||||||
| Cost of shares redeemed | (212,937,728 | ) | (101,510,411 | ) | ||||
| Net increase from capital share transactions | 28,364,085 | 163,806,908 | ||||||
| Net increase (decrease) in net assets | (42,180,993 | ) | 196,991,682 | |||||
Net assets: | ||||||||
| Beginning of year | 514,446,998 | 317,455,316 | ||||||
| End of year | $ | 472,266,005 | $ | 514,446,998 | ||||
| Undistributed net investment income at end of year | $ | 1,977,505 | $ | 3,027,929 | ||||
Capital share activity: | ||||||||
| Shares sold | 19,002,513 | 23,979,841 | ||||||
| Shares issued from reinvestment of distributions | 905,056 | 509,904 | ||||||
| Shares redeemed | (17,934,768 | ) | (9,372,413 | ) | ||||
| Net increase in shares | 1,972,801 | 15,117,332 | ||||||
| See Notes to Financial Statements. | the RYDEX | SGI equity funds annual report | 39 |
| Year Ended | Year Ended | Year Ended | Period Ended | |||||||||||||
| September 30, | September 30, | September 30, | September 30, | |||||||||||||
| 2011 | 2010 | 2009 | 2008a | |||||||||||||
Per Share Data | ||||||||||||||||
| Net asset value, beginning of period | $ | 11.34 | $ | 10.49 | $ | 10.68 | $ | 10.00 | ||||||||
| Income (loss) from investment operations: | ||||||||||||||||
Net investment incomeb | .04 | .08 | .08 | .04 | ||||||||||||
| Net gain (loss) on investments (realized and unrealized) | (.87 | ) | 1.13 | .27 | .64 | |||||||||||
| Total from investment operations | (.83 | ) | 1.21 | .35 | .68 | |||||||||||
| Less distributions from: | ||||||||||||||||
| Net investment income | (.06 | ) | (.01 | ) | (.06 | ) | — | |||||||||
| Net realized gains | (.48 | ) | (.35 | ) | (.48 | ) | — | |||||||||
| Total distributions | (.54 | ) | (.36 | ) | (.54 | ) | — | |||||||||
| Net asset value, end of period | $ | 9.97 | $ | 11.34 | $ | 10.49 | $ | 10.68 | ||||||||
Total Return | (8.05 | %) | 11.76 | % | 5.30 | % | 6.80 | % | ||||||||
Ratios/Supplemental Data | ||||||||||||||||
| Net assets, end of period (in thousands) | $ | 472,266 | $ | 514,447 | $ | 317,455 | $ | 17,436 | ||||||||
| Ratios to average net assets: | ||||||||||||||||
| Net investment income | 0.34 | % | 0.78 | % | 0.82 | % | 1.81 | % | ||||||||
| Total expenses | 0.98 | % | 0.95 | % | 0.98 | % | 1.19 | % | ||||||||
Net expensesc | 0.90 | % | 0.90 | % | 0.91 | % | 1.10 | % | ||||||||
| Portfolio turnover rate | 38 | % | 20 | % | 76 | % | 63 | % | ||||||||
| a | Since commencement of operations: July 11, 2008. Percentage amounts for the period, except total return and portfolio turnover rate, have been annualized. | |
| b | Net investment income per share was computed using average shares outstanding throughout the period. | |
| c | Net expense information reflects the expense ratios after expense waivers and reimbursements, as applicable. |
| 40 | the RYDEX | SGI equity funds annual report | See Notes to Financial Statements. |
| MANAGER’S COMMENTARY (Unaudited) | September 30, 2011 |
| 1 | Performance figures are based on A-Class shares and do not reflect deduction of the sales charges or taxes that a shareholder would pay on distributions or the redemption of shares. Fee waivers and/or reimbursements reduce Fund expenses and, in the absence of such waivers, the performance quoted would be reduced. |
| PERFORMANCE REPORT AND FUND PROFILE (Unaudited) | September 30, 2011 |
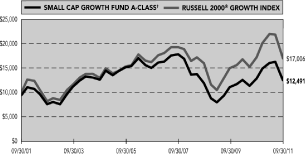
| 1 Year | 5 Year | 10 Year | ||||||||||
| A-Class | -2.78 | % | -3.63 | % | 2.86 | % | ||||||
A-Class with sales charge† | -8.38 | % | -4.76 | % | 2.25 | % | ||||||
| B-Class | -3.41 | % | -4.32 | % | 2.25 | % | ||||||
B-Class with CDSC†† | -8.24 | % | -4.67 | % | 2.25 | % | ||||||
| C-Class | -3.44 | % | -4.33 | % | 2.10 | % | ||||||
C-Class with CDSC††† | -4.40 | % | -4.33 | % | 2.10 | % | ||||||
| Russell 2000 Growth Index | -1.12 | % | 0.96 | % | 5.45 | % | ||||||
% of Net Assets)
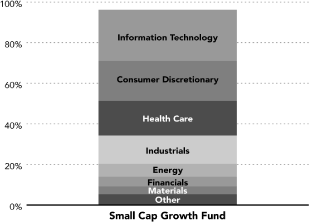
| Inception Dates: | ||||
| A-Class | October 15, 1997 | |||
| B-Class | October 15, 1997 | |||
| C-Class | January 29, 1999 | |||
| Ten Largest Holdings (% of Total Net Assets) | ||||
| Cadence Design Systems, Inc. | 2.2 | % | ||
| Alliance Data Systems Corp. | 2.1 | % | ||
| Endo Pharmaceuticals Holdings, Inc. | 1.9 | % | ||
| Life Time Fitness, Inc. | 1.9 | % | ||
| Oil States International, Inc. | 1.8 | % | ||
| Jarden Corp. | 1.7 | % | ||
| Nuance Communications, Inc. | 1.6 | % | ||
| Solera Holdings, Inc. | 1.6 | % | ||
| SonoSite, Inc. — Class A | 1.5 | % | ||
| Penn National Gaming, Inc. | 1.5 | % | ||
| Top Ten Total | 17.8 | % | ||
| * | The performance data above represents past performance that is not predictive of future results. The investment return and principal value of an investment in the Fund will fluctuate so that an investor’s shares, when redeemed, may be worth more or less than their original cost. Returns are historical and include changes in principal and reinvested dividends and capital gains and do not reflect the effect of taxes. The Russell 2000 Growth Index is an unmanaged index and, unlike the Fund, has no management fees or operating expenses to reduce its reported return. | |
| † | Effective February 22, 2011, the maximum sales charge decreased from 5.75% to 4.75%. A 5.75% maximum sales charge is used in the calculation of the 1 Year, 5 Year and 10 Year Average Annual Returns (based on subscriptions made prior to February 22, 2011), and a 4.75% maximum sales charge will be used to calculate performance for periods based on subscriptions made on or after February 22, 2011. | |
| †† | Fund returns include a CDSC of up to 5% if redeemed within 5 years of purchase. | |
| ††† | Fund returns include a CDSC of 1% if redeemed within 12 months of purchase. |
| SCHEDULE OF INVESTMENTS | September 30, 2011 |
| Shares | Value | |||||||
COMMON STOCKS† - 94.7% | ||||||||
Information Technology - 25.2% | ||||||||
| Cadence Design Systems, Inc.* | 30,520 | $ | 282,005 | |||||
| Alliance Data Systems Corp.* | 2,925 | 271,148 | ||||||
| Nuance Communications, Inc.* | 10,405 | 211,846 | ||||||
| Solera Holdings, Inc. | 4,000 | 202,000 | ||||||
| Sourcefire, Inc.* | 7,350 | 196,686 | ||||||
| TIBCO Software, Inc.* | 8,700 | 194,793 | ||||||
| Opnet Technologies, Inc. | 4,950 | 172,804 | ||||||
| Aspen Technology, Inc.* | 10,700 | 163,389 | ||||||
| CommVault Systems, Inc.* | 4,050 | 150,093 | ||||||
| SYNNEX Corp.* | 5,630 | 147,506 | ||||||
| Informatica Corp.* | 3,040 | 124,488 | ||||||
| Lattice Semiconductor Corp.* | 22,600 | 118,650 | ||||||
| Netgear, Inc.* | 4,350 | 112,622 | ||||||
| LogMeIn, Inc.* | 3,350 | 111,253 | ||||||
| Ciena Corp.* | 9,000 | 100,800 | ||||||
| SolarWinds, Inc.* | 4,520 | 99,530 | ||||||
| Nanometrics, Inc.* | 6,290 | 91,205 | ||||||
| Harmonic, Inc.* | 21,350 | 90,951 | ||||||
| Rofin-Sinar Technologies, Inc.* | 4,710 | 90,432 | ||||||
| Newport Corp.* | 8,300 | 89,723 | ||||||
| Cavium, Inc.* | 2,900 | 78,329 | ||||||
| Riverbed Technology, Inc.* | 3,710 | 74,052 | ||||||
| Meru Networks, Inc.* | 5,930 | 48,329 | ||||||
| VanceInfo Technologies, Inc. ADR* | 5,600 | 37,688 | ||||||
Total Information Technology | 3,260,322 | |||||||
Consumer Discretionary - 19.7% | ||||||||
| Life Time Fitness, Inc.* | 6,520 | 240,262 | ||||||
| Jarden Corp. | 7,765 | 219,439 | ||||||
| Penn National Gaming, Inc. | 5,925 | 197,243 | ||||||
| BJ’s Restaurants, Inc.* | 4,200 | 185,262 | ||||||
| Gentex Corp. | 6,700 | 161,135 | ||||||
| Vail Resorts, Inc. | 3,725 | 140,768 | ||||||
| Hanesbrands, Inc.* | 5,490 | 137,305 | ||||||
| MDC Partners, Inc. — Class A | 9,400 | 135,548 | ||||||
| Monro Muffler Brake, Inc. | 4,075 | 134,353 | ||||||
| PVH Corp. | 2,270 | 132,205 | ||||||
| Ulta Salon Cosmetics & Fragrance, Inc.* | 1,925 | 119,793 | ||||||
| Select Comfort Corp.* | 8,360 | 116,789 | ||||||
| Jos A. Bank Clothiers, Inc.* | 2,360 | 110,047 | ||||||
| Stage Stores, Inc. | 7,400 | 102,638 | ||||||
| Lennar Corp. — Class A | 7,450 | 100,873 | ||||||
| SodaStream International Ltd.* | 2,975 | 98,324 | ||||||
| Pinnacle Entertainment, Inc.* | 9,100 | 82,628 | ||||||
| Cost Plus, Inc.* | 11,240 | 70,812 | ||||||
| Harman International Industries, Inc. | 2,270 | 64,876 | ||||||
Total Consumer Discretionary | 2,550,300 | |||||||
Health Care - 17.1% | ||||||||
| Endo Pharmaceuticals Holdings, Inc.* | 8,590 | 240,434 | ||||||
| SonoSite, Inc.* | 6,610 | 200,547 | ||||||
| Endologix, Inc.* | 19,400 | 194,776 | ||||||
| Cepheid, Inc.* | 4,900 | 190,267 | ||||||
| Mednax, Inc.* | 2,620 | 164,117 | ||||||
| BioMarin Pharmaceutical, Inc.* | 5,000 | 159,350 | ||||||
| Halozyme Therapeutics, Inc.* | 23,440 | 143,922 | ||||||
| Hologic, Inc.* | 8,660 | 131,719 | ||||||
| Haemonetics Corp.* | 2,155 | 126,025 | ||||||
| Integra LifeSciences Holdings Corp.* | 3,230 | 115,537 | ||||||
| Hill-Rom Holdings, Inc. | 3,745 | 112,425 | ||||||
| Teleflex, Inc. | 1,830 | 98,399 | ||||||
| NxStage Medical, Inc.* | 4,050 | 84,483 | ||||||
| Health Management Associates, Inc. — Class A* | 10,770 | 74,528 | ||||||
| Angiodynamics, Inc.* | 4,260 | 55,976 | ||||||
| NuVasive, Inc.* | 2,500 | 42,675 | ||||||
| Momenta Pharmaceuticals, Inc.* | 3,300 | 37,950 | ||||||
| CardioNet, Inc.* | 12,550 | 37,650 | ||||||
Total Health Care | 2,210,780 | |||||||
Industrials - 13.9% | ||||||||
| Wabtec Corp. | 3,150 | 166,541 | ||||||
| IDEX Corp. | 5,200 | 162,032 | ||||||
| WABCO Holdings, Inc.* | 4,190 | 158,633 | ||||||
| Kansas City Southern* | 2,945 | 147,132 | ||||||
| BE Aerospace, Inc.* | 4,440 | 147,008 | ||||||
| Pall Corp. | 3,240 | 137,376 | ||||||
| Crane Co. | 3,500 | 124,915 | ||||||
| Interface, Inc. — Class A | 10,430 | 123,700 | ||||||
| AECOM Technology Corp.* | 6,410 | 113,265 | ||||||
| Navistar International Corp.* | 3,500 | 112,420 | ||||||
| Regal-Beloit Corp. | 2,390 | 108,458 | ||||||
| Towers Watson & Co. — Class A | 1,800 | 107,604 | ||||||
| Pentair, Inc. | 3,290 | 105,313 | ||||||
| A123 Systems, Inc.* | 25,800 | 88,752 | ||||||
Total Industrials | 1,803,149 | |||||||
Energy - 6.4% | ||||||||
| Oil States International, Inc.* | 4,660 | 237,287 | ||||||
| Superior Energy Services, Inc.* | 6,830 | 179,219 | ||||||
| Plains Exploration & Production Co.* | 6,250 | 141,937 | ||||||
| CARBO Ceramics, Inc. | 1,200 | 123,036 | ||||||
| Stone Energy Corp.* | 5,750 | 93,208 | ||||||
| Carrizo Oil & Gas, Inc.* | 2,300 | 49,565 | ||||||
Total Energy | 824,252 | |||||||
Financials - 4.7% | ||||||||
| Texas Capital Bancshares, Inc.* | 8,250 | 188,513 | ||||||
| Commerce Bancshares, Inc. | 5,311 | 184,557 | ||||||
| Amtrust Financial Services, Inc. | 5,900 | 131,334 | ||||||
| Stifel Financial Corp.* | 4,005 | 106,373 | ||||||
Total Financials | 610,777 | |||||||
Materials - 3.9% | ||||||||
| Kaiser Aluminum Corp. | 4,390 | 194,389 | ||||||
| Solutia, Inc.* | 9,600 | 123,360 | ||||||
| 44 | the RYDEX | SGI equity funds annual report | See Notes to Financial Statements. |
| SCHEDULE OF INVESTMENTS (concluded) | September 30, 2011 |
| Shares | Value | |||||||
| Silgan Holdings, Inc. | 2,670 | $ | 98,096 | |||||
| Cliffs Natural Resources, Inc. | 1,760 | 90,059 | ||||||
Total Materials | 505,904 | |||||||
Utilities - 2.6% | ||||||||
| ITC Holdings Corp. | 2,270 | 175,766 | ||||||
| NorthWestern Corp. | 5,050 | 161,297 | ||||||
Total Utilities | 337,063 | |||||||
Telecommunication Services - 1.2% | ||||||||
| SBA Communications Corp. — Class A* | 4,450 | 153,436 | ||||||
Total Common Stocks (Cost $12,063,145) | 12,255,983 | |||||||
EXCHANGE TRADED FUND† - 1.5% | ||||||||
| iShares Russell 2000 Growth Index Fund | 2,570 | 188,818 | ||||||
Total Exchange Traded Fund (Cost $230,743) | 188,818 | |||||||
Total Investments - 96.2% (Cost $12,293,888) | $ | 12,444,801 | ||||||
Cash & Other Assets, Less Liabilities - 3.8% | 496,828 | |||||||
Total Net Assets - 100.0% | $ | 12,941,629 | ||||||
| * | Non-income producing security. | |
| † | Value determined based on Level 1 inputs — See Note 4. | |
| ADR — American Depositary Receipt |
| See Notes to Financial Statements. | the RYDEX | SGI equity funds annual report | 45 |
Assets: | ||||
| Investments, at value (cost $12,293,888) | $ | 12,444,801 | ||
| Cash | 626,520 | |||
| Prepaid expenses | 8,564 | |||
| Receivables: | ||||
| Securities sold | 82,729 | |||
| Fund shares sold | 4,224 | |||
| Dividends | 1,811 | |||
Total assets | 13,168,649 | |||
Liabilities: | ||||
| Payable for: | ||||
| Securities purchased | 121,872 | |||
| Fund shares redeemed | 66,012 | |||
| Management fees | 9,585 | |||
| Transfer agent/maintenance fees | 4,725 | |||
| Distribution and service fees | 4,519 | |||
| Fund accounting/administration fees | 1,057 | |||
| Directors’ fees* | 266 | |||
| Miscellaneous | 18,984 | |||
Total liabilities | 227,020 | |||
Net assets | $ | 12,941,629 | ||
Net assets consist of: | ||||
| Paid in capital | $ | 16,907,487 | ||
| Undistributed net investment income | — | |||
| Accumulated net realized loss on investments | (4,116,771 | ) | ||
| Net unrealized appreciation on investments | 150,913 | |||
| Net assets | $ | 12,941,629 | ||
A-Class: | ||||
| Net assets | $ | 10,395,675 | ||
| Capital shares outstanding | 872,979 | |||
| Net asset value per share | $ | 11.91 | ||
| Maximum offering price per share (Net asset value divided by 95.25%) | $ | 12.50 | ||
B-Class: | ||||
| Net assets | $ | 1,262,424 | ||
| Capital shares outstanding | 120,522 | |||
| Net asset value per share | $ | 10.47 | ||
C-Class: | ||||
| Net assets | $ | 1,283,530 | ||
| Capital shares outstanding | 120,226 | |||
| Net asset value per share | $ | 10.68 | ||
Investment Income: | ||||
| Dividends (net of foreign withholding tax of $376) | $ | 72,538 | ||
| Total investment income | 72,538 | |||
Expenses: | ||||
| Management fees | 143,919 | |||
| Transfer agent/maintenance fees | 74,218 | |||
| Distribution and service fees: | ||||
| A-Class | 34,413 | |||
| B-Class | 14,511 | |||
| C-Class | 17,153 | |||
| Fund accounting/administration fees | 25,000 | |||
| Registration fees | 38,539 | |||
| Directors’ fees* | 1,663 | |||
| Miscellaneous | 31,813 | |||
| Total expenses | 381,229 | |||
| Net investment loss | (308,691 | ) | ||
Net Realized and Unrealized Gain (Loss): | ||||
| Net realized gain (loss) on: | ||||
| Investments | 2,614,617 | |||
| Net realized gain | 2,614,617 | |||
| Net change in unrealized appreciation (depreciation) on: | ||||
| Investments | (2,745,033 | ) | ||
| Net change in unrealized appreciation (depreciation) | (2,745,033 | ) | ||
| Net realized and unrealized loss | (130,416 | ) | ||
Net decrease in net assets resulting from operations | $ | (439,107 | ) | |
| * | Relates to Directors not deemed “interested persons” within the meaning of Section 2(a)(19) of the 1940 Act. |
| 46 | the RYDEX | SGI equity funds annual report | See Notes to Financial Statements. |
| Year Ended | Year Ended | |||||||
| September 30, | September 30, | |||||||
| 2011 | 2010 | |||||||
Increase (Decrease) In Net Assets From Operations: | ||||||||
| Net investment loss | $ | (308,691 | ) | $ | (246,891 | ) | ||
| Net realized gain on investments | 2,614,617 | 2,427,963 | ||||||
| Net change in unrealized appreciation (depreciation) on investments | (2,745,033 | ) | (19,339 | ) | ||||
| Net increase (decrease) in net assets resulting from operations | (439,107 | ) | 2,161,733 | |||||
Distributions to shareholders | — | — | ||||||
Capital share transactions: | ||||||||
| Proceeds from sale of shares | ||||||||
| A-Class | 7,162,239 | 7,166,260 | ||||||
| B-Class | 476,803 | 126,073 | ||||||
| C-Class | 438,345 | 164,394 | ||||||
| Cost of shares redeemed | ||||||||
| A-Class | (8,281,727 | ) | (7,013,788 | ) | ||||
| B-Class | (573,179 | ) | (691,365 | ) | ||||
| C-Class | (606,748 | ) | (397,619 | ) | ||||
| Net decrease from capital share transactions | (1,384,267 | ) | (646,045 | ) | ||||
| Net increase (decrease) in net assets | (1,823,374 | ) | 1,515,688 | |||||
Net assets: | ||||||||
| Beginning of year | 14,765,003 | 13,249,315 | ||||||
| End of year | $ | 12,941,629 | $ | 14,765,003 | ||||
| Undistributed net investment income | $ | — | $ | — | ||||
Capital share activity: | ||||||||
| Shares sold | ||||||||
| A-Class | 488,818 | 641,027 | ||||||
| B-Class | 35,998 | 12,444 | ||||||
| C-Class | 32,398 | 16,059 | ||||||
| Shares redeemed | ||||||||
| A-Class | (583,053 | ) | (617,198 | ) | ||||
| B-Class | (46,201 | ) | (69,069 | ) | ||||
| C-Class | (47,660 | ) | (38,473 | ) | ||||
| Net decrease in shares | (119,700 | ) | (55,210 | ) | ||||
| See Notes to Financial Statements. | the RYDEX | SGI equity funds annual report | 47 |
| Year Ended | Year Ended | Year Ended | Year Ended | Year Ended | ||||||||||||||||
| September 30, | September 30, | September 30, | September 30, | September 30, | ||||||||||||||||
| A-Class | 2011 | 2010 | 2009 | 2008 | 2007 | |||||||||||||||
Per Share Data | ||||||||||||||||||||
| Net asset value, beginning of period | $ | 12.25 | $ | 10.56 | $ | 11.43 | $ | 18.53 | $ | 15.63 | ||||||||||
| Income (loss) from investment operations: | ||||||||||||||||||||
Net investment lossa | (.24 | ) | (.18 | ) | (.18 | ) | (.24 | ) | (.23 | ) | ||||||||||
| Net gain (loss) on investments (realized and unrealized) | (.10 | ) | 1.87 | (.63 | ) | (5.55 | ) | 3.13 | ||||||||||||
| Total from investment operations | (.34 | ) | 1.69 | (.81 | ) | (5.79 | ) | 2.90 | ||||||||||||
| Less distributions from: | ||||||||||||||||||||
| Net realized gains | — | — | (.06 | ) | (1.31 | ) | — | |||||||||||||
| Total distributions | — | — | (.06 | ) | (1.31 | ) | — | |||||||||||||
| Net asset value, end of period | $ | 11.91 | $ | 12.25 | $ | 10.56 | $ | 11.43 | $ | 18.53 | ||||||||||
Total Returnb | (2.78 | %) | 16.00 | % | (6.89 | %) | (33.25 | %) | 18.55 | % | ||||||||||
Ratios/Supplemental Data | ||||||||||||||||||||
| Net assets, end of period (in thousands) | $ | 10,396 | $ | 11,847 | $ | 9,966 | $ | 12,414 | $ | 45,430 | ||||||||||
| Ratios to average net assets: | ||||||||||||||||||||
| Net investment loss | (1.68 | %) | (1.55 | %) | (2.04 | %) | (1.59 | %) | (1.32 | %) | ||||||||||
| Total expenses | 2.11 | % | 2.26 | % | 2.67 | % | 1.98 | % | 1.80 | % | ||||||||||
Net expensesc | 2.11 | % | 2.26 | % | 2.60 | % | 1.98 | % | 1.80 | % | ||||||||||
| Portfolio turnover rate | 101 | % | 112 | % | 200 | % | 169 | % | 145 | % | ||||||||||
| Year Ended | Year Ended | Year Ended | Year Ended | Year Ended | ||||||||||||||||
| September 30, | September 30, | September 30, | September 30, | September 30, | ||||||||||||||||
| B-Class | 2011 | 2010 | 2009 | 2008 | 2007 | |||||||||||||||
Per Share Data | ||||||||||||||||||||
| Net asset value, beginning of period | $ | 10.85 | $ | 9.43 | $ | 10.28 | $ | 16.92 | $ | 14.38 | ||||||||||
| Income (loss) from investment operations: | ||||||||||||||||||||
Net investment lossa | (.30 | ) | (.23 | ) | (.21 | ) | (.32 | ) | (.33 | ) | ||||||||||
| Net gain (loss) on investments (realized and unrealized) | (.08 | ) | 1.65 | (.58 | ) | (5.01 | ) | 2.87 | ||||||||||||
| Total from investment operations | (.38 | ) | 1.42 | (.79 | ) | (5.33 | ) | 2.54 | ||||||||||||
| Less distributions from: | ||||||||||||||||||||
| Net realized gains | — | — | (.06 | ) | (1.31 | ) | — | |||||||||||||
| Total distributions | — | — | (.06 | ) | (1.31 | ) | — | |||||||||||||
| Net asset value, end of period | $ | 10.47 | $ | 10.85 | $ | 9.43 | $ | 10.28 | $ | 16.92 | ||||||||||
Total Returnb | (3.41 | %) | 15.06 | % | (7.47 | %) | (33.72 | %) | 17.66 | % | ||||||||||
Ratios/Supplemental Data | ||||||||||||||||||||
| Net assets, end of period (in thousands) | $ | 1,262 | $ | 1,419 | $ | 1,766 | $ | 2,675 | $ | 5,792 | ||||||||||
| Ratios to average net assets: | ||||||||||||||||||||
| Net investment loss | (2.44 | %) | (2.30 | %) | (2.77 | %) | (2.42 | %) | (2.07 | %) | ||||||||||
| Total expenses | 2.87 | % | 3.02 | % | 3.41 | % | 2.82 | % | 2.56 | % | ||||||||||
Net expensesc | 2.87 | % | 3.02 | % | 3.33 | % | 2.82 | % | 2.56 | % | ||||||||||
| Portfolio turnover rate | 101 | % | 112 | % | 200 | % | 169 | % | 145 | % | ||||||||||
| 48 | the RYDEX | SGI equity funds annual report | See Notes to Financial Statements. |
| Year Ended | Year Ended | Year Ended | Year Ended | Year Ended | ||||||||||||||||
| September 30, | September 30, | September 30, | September 30, | September 30, | ||||||||||||||||
| C-Class | 2011 | 2010 | 2009 | 2008 | 2007 | |||||||||||||||
Per Share Data | ||||||||||||||||||||
| Net asset value, beginning of period | $ | 11.06 | $ | 9.61 | $ | 10.48 | $ | 17.23 | $ | 14.64 | ||||||||||
| Income (loss) from investment operations: | ||||||||||||||||||||
Net investment lossa | (.31 | ) | (.24 | ) | (.22 | ) | (.33 | ) | (.33 | ) | ||||||||||
| Net gain (loss) on investments (realized and unrealized) | (.07 | ) | 1.69 | (.59 | ) | (5.11 | ) | 2.92 | ||||||||||||
| Total from investment operations | (.38 | ) | 1.45 | (.81 | ) | (5.44 | ) | 2.59 | ||||||||||||
| Less distributions from: | ||||||||||||||||||||
| Net realized gains | — | — | (.06 | ) | (1.31 | ) | — | |||||||||||||
| Total distributions | — | — | (.06 | ) | (1.31 | ) | — | |||||||||||||
| Net asset value, end of period | $ | 10.68 | $ | 11.06 | $ | 9.61 | $ | 10.48 | $ | 17.23 | ||||||||||
Total Returnb | (3.44 | %) | 15.09 | % | (7.51 | %) | (33.76 | %) | 17.69 | % | ||||||||||
Ratios/Supplemental Data | ||||||||||||||||||||
| Net assets, end of period (in thousands) | $ | 1,284 | $ | 1,499 | $ | 1,518 | $ | 2,318 | $ | 3,964 | ||||||||||
| Ratios to average net assets: | ||||||||||||||||||||
| Net investment loss | (2.43 | %) | (2.31 | %) | (2.77 | %) | (2.43 | %) | (2.07 | %) | ||||||||||
| Total expenses | 2.86 | % | 3.02 | % | 3.40 | % | 2.83 | % | 2.56 | % | ||||||||||
Net expensesc | 2.86 | % | 3.02 | % | 3.33 | % | 2.83 | % | 2.56 | % | ||||||||||
| Portfolio turnover rate | 101 | % | 112 | % | 200 | % | 169 | % | 145 | % | ||||||||||
| a | Net investment loss per share was computed using average shares outstanding throughout the year. | |
| b | Total return does not reflect the impact of any applicable sales charges and has not been annualized. | |
| c | Net expense information reflects the expense ratios after expense waivers and reimbursements, as applicable. |
| See Notes to Financial Statements. | the RYDEX | SGI equity funds annual report | 49 |
| MANAGER’S COMMENTARY (Unaudited) | September 30, 2011 |
| PERFORMANCE REPORT AND FUND PROFILE (Unaudited) | September 30, 2011 |
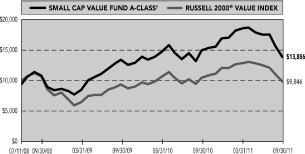
| Since | ||||||||
| Inception | ||||||||
| 1 Year | (07/11/08) | |||||||
| A-Class | -7.31 | % | 12.78 | % | ||||
A-Class with sales charge† | -12.66 | % | 10.73 | % | ||||
| C-Class | -8.07 | % | 11.97 | % | ||||
C-Class with CDSC†† | -8.87 | % | 11.97 | % | ||||
| Institutional Class | -7.11 | % | 13.04 | % | ||||
| Russell 2000 Value Index | -5.99 | % | -0.48 | % | ||||
% of Net Assets)
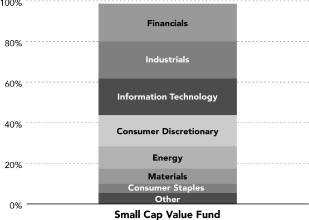
| Inception Dates: | ||
| A-Class | July 11, 2008 | |
| C-Class | July 11, 2008 | |
| Institutional Class | July 11, 2008 |
| Ten Largest Holdings (% of Total Net Assets) | ||||
| Hanover Insurance Group, Inc. | 3.7 | % | ||
| Cabela’s, Inc. | 2.7 | % | ||
| Maxwell Technologies, Inc. | 2.4 | % | ||
| GeoEye, Inc. | 2.2 | % | ||
| Gulfport Energy Corp. | 2.1 | % | ||
| Standard Microsystems Corp. | 2.1 | % | ||
| Chico’s FAS, Inc. | 2.1 | % | ||
| IXYS Corp. | 2.0 | % | ||
| Myers Industries, Inc. | 2.0 | % | ||
| Black Hills Corp. | 1.9 | % | ||
| Top Ten Total | 23.2 | % | ||
| * | The performance data above represents past performance that is not predictive of future results. The investment return and principal value of an investment in the Fund will fluctuate so that an investor’s shares, when redeemed, may be worth more or less than their original cost. Returns are historical and include changes in principal and reinvested dividends and capital gains and do not reflect the effect of taxes. The Russell 2000 Value Index is an unmanaged index and, unlike the Fund, has no management fees or operating expenses to reduce its reported return. | |
| † | Effective February 22, 2011, the maximum sales charge decreased from 5.75% to 4.75%. A 5.75% maximum sales charge is used in the calculation of the 1 Year, 5 Year and 10 Year Average Annual Returns (based on subscriptions made prior to February 22, 2011), and a 4.75% maximum sales charge will be used to calculate performance for periods based on subscriptions made on or after February 22, 2011. | |
| †† | Fund returns include a CDSC of 1% if redeemed within 12 months of purchase. |
| SCHEDULE OF INVESTMENTS | September 30, 2011 |
| Shares | Value | |||||||
COMMON STOCKS† - 97.6% | ||||||||
Financials - 18.6% | ||||||||
Hanover Insurance Group, Inc.1 | 11,020 | $ | 391,210 | |||||
| Transatlantic Holdings, Inc. | 4,015 | 194,808 | ||||||
| 1st Source Corp. | 8,260 | 172,056 | ||||||
| Horace Mann Educators Corp. | 14,920 | 170,237 | ||||||
| SeaBright Holdings, Inc. | 22,830 | 164,376 | ||||||
| Reinsurance Group of America, Inc. | 3,248 | 149,246 | ||||||
| Cedar Shopping Centers, Inc. | 41,920 | 130,371 | ||||||
| Employers Holdings, Inc. | 6,120 | 78,091 | ||||||
| Heritage Financial Corp. | 6,860 | 75,734 | ||||||
| Solar Senior Capital Ltd. | 5,296 | 75,680 | ||||||
| Ocwen Financial Corp.* | 5,560 | 73,448 | ||||||
| Lexington Realty Trust | 10,670 | 69,782 | ||||||
| Fifth Street Finance Corp. | 6,340 | 59,089 | ||||||
| Endurance Specialty Holdings Ltd. | 1,500 | 51,225 | ||||||
| Bancfirst Corp. | 1,514 | 50,204 | ||||||
| Redwood Trust, Inc. | 2,650 | 29,600 | ||||||
| First Marblehead Corp.* | 19,362 | 19,749 | ||||||
| First Horizon National Corp. | — | — | ||||||
Total Financials | 1,954,906 | |||||||
Information Technology - 18.0% | ||||||||
| Maxwell Technologies, Inc.* | 13,900 | 255,899 | ||||||
| Standard Microsystems Corp.* | 11,373 | 220,636 | ||||||
| IXYS Corp.* | 19,630 | 213,574 | ||||||
| Insight Enterprises, Inc.* | 11,599 | 175,609 | ||||||
| Cree, Inc.* | 5,500 | 142,890 | ||||||
| Global Cash Access Holdings, Inc.* | 54,270 | 138,931 | ||||||
| Digi International, Inc.* | 11,227 | 123,497 | ||||||
| Multi-Fineline Electronix, Inc.* | 5,980 | 119,241 | ||||||
| Satyam Computer Services Ltd. ADR* | 41,467 | 113,205 | ||||||
| KIT Digital, Inc.* | 11,720 | 98,448 | ||||||
| Power-One, Inc.* | 18,173 | 81,779 | ||||||
| Intermec, Inc.* | 11,220 | 73,155 | ||||||
| Perficient, Inc.* | 8,920 | 65,294 | ||||||
| Symmetricom, Inc.* | 11,100 | 48,174 | ||||||
| Methode Electronics, Inc. | 3,045 | 22,624 | ||||||
Total Information Technology | 1,892,956 | |||||||
Industrials - 17.4% | ||||||||
| GeoEye, Inc.* | 8,330 | 236,155 | ||||||
| FTI Consulting, Inc.* | 4,560 | 167,854 | ||||||
| Force Protection, Inc.* | 43,440 | 167,244 | ||||||
| Great Lakes Dredge & Dock Corp. | 38,350 | 156,084 | ||||||
| ICF International, Inc.* | 7,850 | 147,658 | ||||||
| Navigant Consulting, Inc.* | 14,960 | 138,679 | ||||||
| Orbital Sciences Corp.* | 9,876 | 126,413 | ||||||
| EnergySolutions, Inc.* | 33,188 | 117,154 | ||||||
| General Cable Corp.* | 4,910 | 114,648 | ||||||
| Saia, Inc.* | 10,180 | 107,094 | ||||||
| Insituform Technologies, Inc. — Class A* | 9,060 | 104,915 | ||||||
| Celadon Group, Inc. | 10,212 | 90,683 | ||||||
| Atlas Air Worldwide Holdings, Inc.* | 1,973 | 65,681 | ||||||
| DryShips, Inc.* | 24,770 | 57,962 | ||||||
| Energy Recovery, Inc.* | 10,898 | 32,803 | ||||||
Total Industrials | 1,831,027 | |||||||
Consumer Discretionary - 15.3% | ||||||||
| Cabela’s, Inc.* | 13,819 | 283,151 | ||||||
Chico’s FAS, Inc.1 | 19,100 | 218,313 | ||||||
| International Speedway Corp. — Class A | 8,040 | 183,634 | ||||||
| Penn National Gaming, Inc.* | 4,600 | 153,134 | ||||||
| DeVry, Inc. | 3,760 | 138,970 | ||||||
| Smith & Wesson Holding Corp.* | 54,610 | 137,617 | ||||||
Maidenform Brands, Inc.*,1 | 5,510 | 128,989 | ||||||
| MDC Partners, Inc. — Class A | 8,239 | 118,806 | ||||||
| Scholastic Corp. | 3,620 | 101,469 | ||||||
| Brown Shoe Company, Inc. | 11,564 | 82,336 | ||||||
| Hanesbrands, Inc.* | 2,840 | 71,028 | ||||||
Total Consumer Discretionary | 1,617,447 | |||||||
Energy - 11.1% | ||||||||
| Gulfport Energy Corp.* | 9,235 | 223,302 | ||||||
| Parker Drilling Co.* | 41,470 | 182,053 | ||||||
| Kodiak Oil & Gas Corp.* | 28,916 | 150,652 | ||||||
| Tesco Corp.* | 12,810 | 148,596 | ||||||
| Abraxas Petroleum Corp.* | 52,820 | 139,445 | ||||||
| Goodrich Petroleum Corp.* | 9,564 | 113,047 | ||||||
| Resolute Energy Corp.* | 8,360 | 94,970 | ||||||
| Petroleum Development Corp.* | 3,290 | 63,793 | ||||||
| USEC, Inc.* | 29,420 | 47,366 | ||||||
| Ocean Rig UDW, Inc.* | 180 | 2,727 | ||||||
Total Energy | 1,165,951 | |||||||
Materials - 7.3% | ||||||||
| Myers Industries, Inc. | 20,660 | 209,699 | ||||||
| TPC Group, Inc.* | 7,560 | 151,805 | ||||||
| A. Schulman, Inc. | 8,040 | 136,600 | ||||||
| Landec Corp.* | 20,173 | 107,320 | ||||||
| Zoltek Companies, Inc.* | 14,540 | 93,492 | ||||||
| HB Fuller Co. | 4,167 | 75,923 | ||||||
Total Materials | 774,839 | |||||||
Consumer Staples - 4.5% | ||||||||
| Spartan Stores, Inc. | 8,860 | 137,153 | ||||||
| Smart Balance, Inc.* | 20,500 | 120,950 | ||||||
| Orchids Paper Products Co. | 9,569 | 119,517 | ||||||
| Winn-Dixie Stores, Inc.* | 15,600 | 92,352 | ||||||
Total Consumer Staples | 469,972 | |||||||
Health Care - 3.1% | ||||||||
| ICU Medical, Inc.* | 5,180 | 190,624 | ||||||
| Mednax, Inc.* | 1,240 | 77,673 | ||||||
| Kindred Healthcare, Inc.* | 6,980 | 60,168 | ||||||
Total Health Care | 328,465 | |||||||
| See Notes to Financial Statements. | the RYDEX | SGI equity funds annual report | 53 |
| SCHEDULE OF INVESTMENTS (concluded) | September 30, 2011 |
| Shares | Value | |||||||
Utilities - 2.3% | ||||||||
| Black Hills Corp. | 6,410 | $ | 196,402 | |||||
| MDU Resources Group, Inc. | 2,346 | 45,020 | ||||||
Total Utilities | 241,422 | |||||||
Total Common Stocks (Cost $12,306,222) | 10,276,985 | |||||||
CONVERTIBLE PREFERRED STOCK†† -0.0% | ||||||||
Thermoenergy Corp.*,2 | 6,250 | 3,468 | ||||||
Total Convertible Preferred Stock (Cost $5,968) | 3,468 | |||||||
WARRANTS†† - 0.0% | ||||||||
Thermoenergy Corp.2 $0.30, 07/31/15 | 100,000 | 4,070 | ||||||
Total Warrants (Cost $9,032) | 4,070 | |||||||
| Face | ||||||||
| Amount | ||||||||
CONVERTIBLE BONDS†† - 0.8% | ||||||||
Industrials - 0.8% | ||||||||
| DryShips, Inc. 5.00% due 12/01/14 | $ | 125,000 | 77,031 | |||||
Total Convertible Bonds (Cost $93,467) | 77,031 | |||||||
Total Investments - 98.4% (Cost $12,414,689) | $ | 10,361,554 | ||||||
| Contracts | Value | |||||||
OPTIONS WRITTEN† - (0.2)% | ||||||||
| Call Options on: | ||||||||
| Chico’s FAS, Inc. Expiring January 2012 with strike price of $15.00 | 10 | $ | (250 | ) | ||||
Maidenform Brands, Inc.†† Expiring January 2012 with strike price of $25.00 | 21 | (3,045 | ) | |||||
Total Call Options | (3,295 | ) | ||||||
| Put Options on: | ||||||||
| Chico’s FAS, Inc. Expiring January 2012 with strike price of $12.50 | 13 | (2,730 | ) | |||||
| SandRidge Energy, Inc. Expiring December 2011 with strike price of $7.00 | 19 | (3,591 | ) | |||||
| Gulfport Energy Corp. Expiring October 2011 with strike price of $25.00 | 19 | (3,800 | ) | |||||
| Maidenform Brands, Inc. Expiring January 2012 with strike price of $22.50 | 23 | (5,520 | ) | |||||
Total Put Options | (15,641 | ) | ||||||
Total Options Written (Premiums received $17,903) | (18,936 | ) | ||||||
Cash & Other Assets, Less Liabilities - 1.8% | 191,823 | |||||||
Total Net Assets - 100.0% | $ | 10,534,441 | ||||||
| * | Non-income producing security. | |
| † | Value determined based on Level 1 inputs — See Note 4. | |
| †† | Value determined based on Level 2 inputs — See Note 4. | |
| 1 | All or a portion of this security is pledged as collateral for open options written at September 30, 2011. | |
| 2 | PIPE (Private Investment in Public Equity) — Stock issued by a company in the secondary market as a means of raising capital more quickly and less expensively than through registration of a secondary public offering. | |
| ADR — American Depositary Receipt |
| 54 | the RYDEX|SGI equity funds annual report | See Notes to Financial Statements. |
Assets: | ||||
| Investments, at value (cost $12,414,689) | $ | 10,361,554 | ||
| Cash | 123,524 | |||
| Prepaid expenses | 22,717 | |||
| Receivables: | ||||
| Securities sold | 55,968 | |||
| Fund shares sold | 53,084 | |||
| Investment advisor | 10,832 | |||
| Dividends | 6,705 | |||
| Interest | 2,082 | |||
Total assets | 10,636,466 | |||
Liabilities: | ||||
| Options written, at value (premiums received $17,903) | 18,936 | |||
| Payable for: | ||||
| Securities purchased | 45,162 | |||
| Management fees | 9,178 | |||
| Fund shares redeemed | 8,509 | |||
| Distribution and service fees | 3,665 | |||
| Transfer agent/maintenance fees | 2,188 | |||
| Fund accounting/administration fees | 533 | |||
| Directors’ fees* | 58 | |||
| Miscellaneous | 13,796 | |||
Total liabilities | 102,025 | |||
Net assets | $ | 10,534,441 | ||
Net assets consist of: | ||||
| Paid in capital | $ | 12,345,276 | ||
| Undistributed net investment income | — | |||
| Accumulated net realized gain on investments | 243,333 | |||
| Net unrealized depreciation on investments | (2,054,168 | ) | ||
| Net assets | $ | 10,534,441 | ||
A-Class: | ||||
| Net assets | $ | 7,591,756 | ||
| Capital shares outstanding | 651,156 | |||
| Net asset value per share | $ | 11.66 | ||
| Maximum offering price per share (Net asset value divided by 95.25%) | $ | 12.24 | ||
C-Class: | ||||
| Net assets | $ | 2,304,893 | ||
| Capital shares outstanding | 202,821 | |||
| Net asset value per share | $ | 11.36 | ||
Institutional Class: | ||||
| Net assets | $ | 637,792 | ||
| Capital shares outstanding | 54,234 | |||
| Net asset value per share | $ | 11.76 | ||
Investment Income: | ||||
| Dividends (net of foreign withholding tax of $607) | $ | 89,368 | ||
| Interest | 255 | |||
| Total investment income | 89,623 | |||
Expenses: | ||||
| Management fees | 114,840 | |||
| Transfer agent/maintenance fees | 36,625 | |||
| Distribution and service fees: | ||||
| A-Class | 21,032 | |||
| C-Class | 22,707 | |||
| Fund accounting/administration fees | 25,000 | |||
| Registration fees | 33,832 | |||
| Directors’ fees* | 1,011 | |||
| Miscellaneous | 27,464 | |||
| Total expenses | 282,511 | |||
| Less: | ||||
| Expenses waived by advisor | (118,145 | ) | ||
| Net expenses | 164,366 | |||
| Net investment loss | (74,743 | ) | ||
Net Realized and Unrealized Gain (Loss): | ||||
| Net realized gain (loss) on: | ||||
| Investments | 876,975 | |||
| Options written | 15,644 | |||
| Net realized gain | 892,619 | |||
| Net change in unrealized appreciation (depreciation) on: | ||||
| Investments | (2,396,483 | ) | ||
| Options written | (1,659 | ) | ||
| Net change in unrealized appreciation (depreciation) | (2,398,142 | ) | ||
| Net realized and unrealized loss | (1,505,523 | ) | ||
Net decrease in net assets resulting from operations | $ | (1,580,266 | ) | |
| * | Relates to Directors not deemed “interested persons” within the meaning of Section 2(a)(19) of the 1940 Act. |
| See Notes to Financial Statements. | the RYDEX | SGI equity funds annual report | 55 |
| Year Ended | Year Ended | |||||||
| September 30, | September 30, | |||||||
| 2011 | 2010 | |||||||
Increase (Decrease) In Net Assets From Operations: | ||||||||
| Net investment loss | $ | (74,743 | ) | $ | (32,326 | ) | ||
| Net realized gain on investments | 892,619 | 720,272 | ||||||
| Net change in unrealized appreciation (depreciation) on investments | (2,398,142 | ) | (376,988 | ) | ||||
| Net increase (decrease) in net assets resulting from operations | (1,580,266 | ) | 310,958 | |||||
Distributions to Shareholders From: | ||||||||
| Net realized gains | ||||||||
| A-Class | (891,555 | ) | (152,192 | ) | ||||
| C-Class | (220,130 | ) | (21,874 | ) | ||||
| Institutional Class | (91,413 | ) | (21,435 | ) | ||||
| Total distributions to shareholders | (1,203,098 | ) | (195,501 | ) | ||||
Capital Share Transactions: | ||||||||
| Proceeds from sale of shares | ||||||||
| A-Class | 6,162,474 | 12,456,244 | ||||||
| C-Class | 1,798,076 | 692,236 | ||||||
| Institutional Class | 187,814 | 157,271 | ||||||
| Distributions reinvested | ||||||||
| A-Class | 869,495 | 150,268 | ||||||
| C-Class | 203,368 | 21,874 | ||||||
| Institutional Class | 73,422 | 13,598 | ||||||
| Cost of shares redeemed | ||||||||
| A-Class | (3,590,095 | ) | (9,619,034 | ) | ||||
| C-Class | (469,516 | ) | (143,145 | ) | ||||
| Institutional Class | (213,782 | ) | (131,908 | ) | ||||
| Net increase from capital share transactions | 5,021,256 | 3,597,404 | ||||||
| Net increase in net assets | 2,237,892 | 3,712,861 | ||||||
Net assets: | ||||||||
| Beginning of year | 8,296,549 | 4,583,688 | ||||||
| End of year | $ | 10,534,441 | $ | 8,296,549 | ||||
| Undistributed net investment income | $ | — | $ | — | ||||
Capital share activity: | ||||||||
| Shares sold | ||||||||
| A-Class | 427,431 | 911,652 | ||||||
| C-Class | 126,060 | 51,089 | ||||||
| Institutional Class | 12,835 | 11,908 | ||||||
| Shares issued from reinvestment of distributions | ||||||||
| A-Class | 61,535 | 11,497 | ||||||
| C-Class | 14,673 | 1,693 | ||||||
| Institutional Class | 5,160 | 1,036 | ||||||
| Shares redeemed | ||||||||
| A-Class | (270,342 | ) | (735,798 | ) | ||||
| C-Class | (33,653 | ) | (11,124 | ) | ||||
| Institutional Class | (14,642 | ) | (9,494 | ) | ||||
| Net increase in shares | 329,057 | 232,459 | ||||||
| 56 | the RYDEX|SGI equity funds annual report | See Notes to Financial Statements. |
| Year Ended | Year Ended | Year Ended | Period Ended | |||||||||||||
| September 30, | September 30, | September 30, | September 30, | |||||||||||||
| A-Class | 2011 | 2010 | 2009 | 2008a | ||||||||||||
Per Share Data | ||||||||||||||||
| Net asset value, beginning of period | $ | 14.35 | $ | 13.24 | $ | 11.48 | $ | 10.00 | ||||||||
| Income (loss) from investment operations: | ||||||||||||||||
Net investment lossb | (.07 | ) | (.05 | ) | (.05 | ) | (— | )c | ||||||||
| Net gain (loss) on investments (realized and unrealized) | (.63 | ) | 1.54 | 2.44 | 1.48 | |||||||||||
| Total from investment operations | (.70 | ) | 1.49 | 2.39 | 1.48 | |||||||||||
| Less distributions from: | ||||||||||||||||
| Net realized gains | (1.99 | ) | (.38 | ) | (.63 | ) | — | |||||||||
| Total distributions | (1.99 | ) | (.38 | ) | (.63 | ) | — | |||||||||
| Net asset value, end of period | $ | 11.66 | $ | 14.35 | $ | 13.24 | $ | 11.48 | ||||||||
Total Returnd | (7.31 | %) | 11.53 | % | 24.15 | % | 14.80 | % | ||||||||
Ratios/Supplemental Data | ||||||||||||||||
| Net assets, end of period (in thousands) | $ | 7,592 | $ | 6,209 | $ | 3,245 | $ | 400 | ||||||||
| Ratios to average net assets: | ||||||||||||||||
| Net investment loss | (0.52 | %) | (0.34 | %) | (0.46 | %) | (0.19 | %) | ||||||||
| Total expenses | 2.33 | % | 2.45 | % | 4.92 | % | 6.10 | % | ||||||||
Net expensese | 1.30 | % | 1.30 | % | 1.55 | % | 1.55 | % | ||||||||
| Portfolio turnover rate | 70 | % | 140 | % | 58 | % | 86 | % | ||||||||
| Year Ended | Year Ended | Year Ended | Period Ended | |||||||||||||
| September 30, | September 30, | September 30, | September 30, | |||||||||||||
| C-Class | 2011 | 2010 | 2009 | 2008a | ||||||||||||
Per Share Data | ||||||||||||||||
| Net asset value, beginning of period | $ | 14.13 | $ | 13.11 | $ | 11.46 | $ | 10.00 | ||||||||
| Income (loss) from investment operations: | ||||||||||||||||
Net investment lossb | (.18 | ) | (.15 | ) | (.11 | ) | (.02 | ) | ||||||||
| Net gain (loss) on investments (realized and unrealized) | (.60 | ) | 1.55 | 2.39 | 1.48 | |||||||||||
| Total from investment operations | (.78 | ) | 1.40 | 2.28 | 1.46 | |||||||||||
| Less distributions from: | ||||||||||||||||
| Net realized gains | (1.99 | ) | (.38 | ) | (.63 | ) | — | |||||||||
| Total distributions | (1.99 | ) | (.38 | ) | (.63 | ) | — | |||||||||
| Net asset value, end of period | $ | 11.36 | $ | 14.13 | $ | 13.11 | $ | 11.46 | ||||||||
Total Returnd | (8.07 | %) | 10.94 | % | 23.16 | % | 14.60 | % | ||||||||
Ratios/Supplemental Data | ||||||||||||||||
| Net assets, end of period (in thousands) | $ | 2,305 | $ | 1,353 | $ | 709 | $ | 391 | ||||||||
| Ratios to average net assets: | ||||||||||||||||
| Net investment loss | (1.26 | %) | (1.09 | %) | (1.15 | %) | (0.94 | %) | ||||||||
| Total expenses | 3.07 | % | 3.22 | % | 6.40 | % | 6.88 | % | ||||||||
Net expensese | 2.05 | % | 2.05 | % | 2.30 | % | 2.30 | % | ||||||||
| Portfolio turnover rate | 70 | % | 140 | % | 58 | % | 86 | % | ||||||||
| See Notes to Financial Statements. | the RYDEX | SGI equity funds annual report | 57 |
| Year Ended | Year Ended | Year Ended | Period Ended | |||||||||||||
| September 30, | September 30, | September 30, | September 30, | |||||||||||||
| Institutional Class | 2011 | 2010 | 2009 | 2008a | ||||||||||||
Per Share Data | ||||||||||||||||
| Net asset value, beginning of period | $ | 14.43 | $ | 13.28 | $ | 11.49 | $ | 10.00 | ||||||||
| Income (loss) from investment operations: | ||||||||||||||||
Net investment income (loss)b | (.04 | ) | (.01 | ) | (.01 | ) | —c | |||||||||
| Net gain (loss) on investments (realized and unrealized) | (.64 | ) | 1.54 | 2.43 | 1.49 | |||||||||||
| Total from investment operations | (.68 | ) | 1.53 | 2.42 | 1.49 | |||||||||||
| Less distributions from: | ||||||||||||||||
| Net realized gains | (1.99 | ) | (.38 | ) | (.63 | ) | — | |||||||||
| Total distributions | (1.99 | ) | (.38 | ) | (.63 | ) | — | |||||||||
| Net asset value, end of period | $ | 11.76 | $ | 14.43 | $ | 13.28 | $ | 11.49 | ||||||||
Total Returnd | (7.11 | %) | 11.80 | % | 24.40 | % | 14.90 | % | ||||||||
Ratios/Supplemental Data | ||||||||||||||||
| Net assets, end of period (in thousands) | $ | 638 | $ | 734 | $ | 630 | $ | 383 | ||||||||
| Ratios to average net assets: | ||||||||||||||||
| Net investment income (loss) | (0.30 | %) | (0.08 | %) | (0.14 | %) | 0.06 | % | ||||||||
| Total expenses | 2.09 | % | 2.21 | % | 5.44 | % | 5.90 | % | ||||||||
Net expensese | 1.05 | % | 1.05 | % | 1.30 | % | 1.30 | % | ||||||||
| Portfolio turnover rate | 70 | % | 140 | % | 58 | % | 86 | % | ||||||||
| a | Since commencement of operations: July 11, 2008. Percentage amounts for the period, except total return and portfolio turnover rate, have been annualized. | |
| b | Net investment income (loss) per share was computed using average shares outstanding throughout the period. | |
| c | Net investment income is less than $0.01 per share. | |
| d | Total return does not reflect the impact of any applicable sales charges and has not been annualized. | |
| e | Net expense information reflects the expense ratios after expense waivers and reimbursements, as applicable. |
| 58 | the RYDEX | SGI equity funds annual report | See Notes to Financial Statements. |
MANAGER’S COMMENTARY (Unaudited) | September 30, 2011 | |
| Advised by: | | |
the RYDEX|SGI equity funds annual report | 59
| 1 | Performance figures are based on A-Class shares and do not reflect deduction of the sales charges or taxes that a shareholder would pay on distributions or the redemption of shares. Fee waivers and/or reimbursements reduce Fund expenses and, in the absence of such waivers, the performance quoted would be reduced. |
60 | the RYDEX|SGI equity funds annual report
| PERFORMANCE REPORT AND FUND PROFILE (Unaudited) | September 30, 2011 |
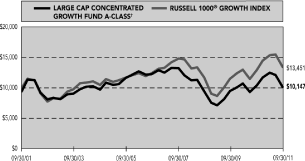
Periods Ended 9/30/11
| 1 Year | 5 Year | 10 Year | ||||||||||
| A-Class | -2.59 | % | -3.72 | % | 0.74 | % | ||||||
A-Class with sales charge† | -8.24 | % | -4.85 | % | 0.15 | % | ||||||
| B-Class | -3.45 | % | -4.47 | % | 0.15 | % | ||||||
B-Class with CDSC†† | -8.28 | % | -4.81 | % | 0.15 | % | ||||||
| C-Class | -3.43 | % | -4.45 | % | -0.02 | % | ||||||
C-Class with CDSC††† | -4.40 | % | -4.45 | % | -0.02 | % | ||||||
| Russell 1000 Growth Index | 3.78 | % | 1.62 | % | 3.01 | % | ||||||
% of Net Assets)
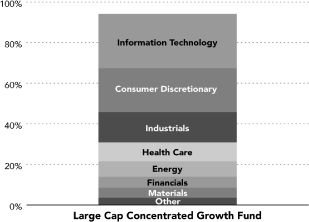
| Inception Dates: | ||||||||
| A-Class | January 29, 1999 | |||||||
| B-Class | January 29, 1999 | |||||||
| C-Class | January 29, 1999 | |||||||
| Ten Largest Holdings (% of Total Net Assets) | ||||||||
| Apple, Inc. | 5.7 | % | ||||||
| Google, Inc. — Class A | 5.2 | % | ||||||
| QUALCOMM, Inc. | 4.2 | % | ||||||
| International Business Machines Corp. | 3.7 | % | ||||||
| Coca-Cola Co. | 3.6 | % | ||||||
| McDonald’s Corp. | 3.6 | % | ||||||
| TJX Companies, Inc. | 3.4 | % | ||||||
| Starbucks Corp. | 3.4 | % | ||||||
| Johnson & Johnson | 3.4 | % | ||||||
| Nordstrom, Inc. | 3.3 | % | ||||||
| Top Ten Total | 39.5 | % | ||||||
| * | The performance data above represents past performance that is not predictive of future results. The investment return and principal value of an investment in the Fund will fluctuate so that an investor’s shares, when redeemed, may be worth more or less than their original cost. Returns are historical and include changes in principal and reinvested dividends and capital gains and do not reflect the effect of taxes. The Russell 1000 Growth Index is an unmanaged index and, unlike the Fund, has no management fees or operating expenses to reduce its reported return. | |
| † | Effective February 22, 2011, the maximum sales charge decreased from 5.75% to 4.75%. A 5.75% maximum sales charge is used in the calculation of the 1 Year, 5 Year and 10 Year Average Annual Returns (based on subscriptions made prior to February 22, 2011), and a 4.75% maximum sales charge will be used to calculate performance for periods based on subscriptions made on or after February 22, 2011. | |
| †† | Fund returns include a CDSC of up to 5% if redeemed within 5 years of purchase. | |
| ††† | Fund returns include a CDSC of 1% if redeemed within 12 months of purchase. |
the RYDEX|SGI equity funds annual report | 61
| SCHEDULE OF INVESTMENTS | September 30, 2011 |
| Shares | Value | |||||||
COMMON STOCKS† - 94.3% | ||||||||
Information Technology - 26.8% | ||||||||
| Apple, Inc.* | 4,305 | $ | 1,640,980 | |||||
| Google, Inc. — Class A* | 2,945 | 1,514,849 | ||||||
| QUALCOMM, Inc. | 25,320 | 1,231,312 | ||||||
| International Business Machines Corp. | 6,150 | 1,076,434 | ||||||
| Dell, Inc.* | 65,820 | 931,353 | ||||||
| Avago Technologies Ltd. | 22,720 | 744,534 | ||||||
| Cognizant Technology Solutions Corp. — Class A* | 10,070 | 631,389 | ||||||
Total Information Technology | 7,770,851 | |||||||
Consumer Discretionary - 21.6% | ||||||||
| McDonald’s Corp. | 11,890 | 1,044,180 | ||||||
| TJX Companies, Inc. | 18,040 | 1,000,679 | ||||||
| Starbucks Corp. | 26,400 | 984,456 | ||||||
| Nordstrom, Inc. | 21,250 | 970,700 | ||||||
| Priceline.com, Inc.* | 1,865 | 838,243 | ||||||
| BorgWarner, Inc.* | 13,250 | 802,022 | ||||||
| Wynn Resorts Ltd. | 5,475 | 630,063 | ||||||
Total Consumer Discretionary | 6,270,343 | |||||||
Industrials - 14.9% | ||||||||
| United Parcel Service, Inc. — Class B | 15,040 | 949,776 | ||||||
| Precision Castparts Corp. | 5,910 | 918,769 | ||||||
| Eaton Corp. | 23,720 | 842,060 | ||||||
| CSX Corp. | 43,080 | 804,304 | ||||||
| Honeywell International, Inc. | 18,260 | 801,796 | ||||||
Total Industrials | 4,316,705 | |||||||
Health Care - 9.5% | ||||||||
| Johnson & Johnson | 15,300 | 974,763 | ||||||
| Gilead Sciences, Inc.* | 24,750 | 960,300 | ||||||
| Covidien plc | 18,200 | 802,620 | ||||||
Total Health Care | 2,737,683 | |||||||
Energy - 7.6% | ||||||||
| Baker Hughes, Inc. | 16,770 | 774,103 | ||||||
| National Oilwell Varco, Inc. | 14,100 | 722,202 | ||||||
| Halliburton Co. | 22,870 | 697,993 | ||||||
Total Energy | 2,194,298 | |||||||
Financials - 5.4% | ||||||||
| Wells Fargo & Co. | 36,400 | 877,968 | ||||||
| MetLife, Inc. | 24,230 | 678,682 | ||||||
Total Financials | 1,556,650 | |||||||
Materials - 4.9% | ||||||||
| CF Industries Holdings, Inc. | 5,920 | 730,469 | ||||||
| EI du Pont de Nemours & Co. | 17,500 | 699,475 | ||||||
Total Materials | 1,429,944 | |||||||
Consumer Staples - 3.6% | ||||||||
| Coca-Cola Co. | 15,500 | 1,047,180 | ||||||
Total Common Stocks (Cost $29,719,841) | 27,323,654 | |||||||
Total Investments - 94.3% (Cost $29,719,841) | $ | 27,323,654 | ||||||
Cash & Other Assets, Less Liabilities - 5.7% | 1,666,289 | |||||||
Total Net Assets - 100.0% | $ | 28,989,943 | ||||||
| * | Non-income producing security. | |
| † | Value determined based on Level 1 inputs — See Note 4. | |
| plc — Public Limited Company |
62 | the RYDEX|SGI equity funds annual report
Assets: | ||||
| Investments, at value (cost $29,719,841) | $ | 27,323,654 | ||
| Cash | 1,813,634 | |||
| Prepaid expenses | 11,313 | |||
| Receivables: | ||||
| Securities sold | 842,297 | |||
| Investment advisor | 7,091 | |||
| Fund shares sold | 3,935 | |||
| Dividends | 177 | |||
Total assets | 30,002,101 | |||
Liabilities: | ||||
| Payable for: | ||||
| Securities purchased | 902,964 | |||
| Fund shares redeemed | 52,409 | |||
| Management fees | 19,190 | |||
| Distribution and service fees | 10,185 | |||
| Transfer agent/maintenance fees | 7,307 | |||
| Fund accounting/administration fees | 2,430 | |||
| Directors’ fees* | 339 | |||
| Miscellaneous | 17,334 | |||
Total liabilities | 1,012,158 | |||
Net assets | $ | 28,989,943 | ||
Net assets consist of: | ||||
| Paid in capital | $ | 39,267,240 | ||
| Undistributed net investment income | — | |||
| Accumulated net realized loss on investments | (7,881,110 | ) | ||
| Net unrealized depreciation on investments | (2,396,187 | ) | ||
| Net assets | $ | 28,989,943 | ||
A-Class: | ||||
| Net assets | $ | 23,358,008 | ||
| Capital shares outstanding | 3,158,438 | |||
| Net asset value per share | $ | 7.40 | ||
| Maximum offering price per share (Net asset value divided by 95.25%) | $ | 7.77 | ||
B-Class: | ||||
| Net assets | $ | 2,873,445 | ||
| Capital shares outstanding | 427,296 | |||
| Net asset value per share | $ | 6.72 | ||
C-Class: | ||||
| Net assets | $ | 2,758,490 | ||
| Capital shares outstanding | 408,504 | |||
| Net asset value per share | $ | 6.75 | ||
Investment income: | ||||
| Dividends | $ | 448,920 | ||
| Interest | 174 | |||
| Total investment income | 449,094 | |||
Expenses: | ||||
| Management fees | 297,791 | |||
| Transfer agent/maintenance fees | 167,738 | |||
| Distribution and service fees: | ||||
| A-Class | 78,414 | |||
| B-Class | 45,007 | |||
| C-Class | 38,392 | |||
| Fund accounting/administration fees | 37,720 | |||
| Registration fees | 39,459 | |||
| Directors’ fees* | 2,636 | |||
| Miscellaneous | 32,200 | |||
| Total expenses | 739,357 | |||
| Less: | ||||
| Expenses waived by advisor | (140,783 | ) | ||
| Net expenses | 598,574 | |||
| Net investment loss | (149,480 | ) | ||
Net Realized and Unrealized Gain (Loss): | ||||
| Net realized gain (loss) on: | ||||
| Investments | 5,536,174 | |||
| Net realized gain | 5,536,174 | |||
| Net change in unrealized appreciation (depreciation) on: | ||||
| Investments | (5,217,813 | ) | ||
| Net change in unrealized appreciation (depreciation) | (5,217,813 | ) | ||
| Net realized and unrealized gain | 318,361 | |||
Net increase in net assets resulting from operations | $ | 168,881 | ||
| * | Relates to Directors not deemed “interested persons” within the meaning of Section 2(a)(19) of the 1940 Act. |
the RYDEX|SGI equity funds annual report | 63
| Year Ended | Year Ended | |||||||
| September 30, | September 30, | |||||||
| 2011 | 2010 | |||||||
Increase (Decrease) In Net Assets From Operations: | ||||||||
| Net investment income (loss) | $ | (149,480 | ) | $ | 129,025 | |||
| Net realized gain on investments | 5,536,174 | 4,700,281 | ||||||
| Net change in unrealized appreciation (depreciation) on investments | (5,217,813 | ) | (1,175,337 | ) | ||||
| Net increase in net assets resulting from operations | 168,881 | 3,653,969 | ||||||
Distributions to shareholders from: | ||||||||
| Net investment income | ||||||||
| A-Class | (136,272 | ) | — | |||||
| Total distributions to shareholders | (136,272 | ) | — | |||||
Capital share transactions: | ||||||||
| Proceeds from sale of shares | ||||||||
| A-Class | 6,625,536 | 12,118,241 | ||||||
| B-Class | 432,234 | 1,138,329 | ||||||
| C-Class | 912,085 | 253,325 | ||||||
| Distributions reinvested | ||||||||
| A-Class | 135,329 | — | ||||||
| Cost of shares redeemed | ||||||||
| A-Class | (12,415,678 | ) | (8,293,084 | ) | ||||
| B-Class | (2,268,242 | ) | (2,811,232 | ) | ||||
| C-Class | (1,408,613 | ) | (1,022,294 | ) | ||||
| Net increase (decrease) from capital share transactions | (7,987,349 | ) | 1,383,285 | |||||
| Net increase (decrease) in net assets | (7,954,740 | ) | 5,037,254 | |||||
Net assets: | ||||||||
| Beginning of year | 36,944,683 | 31,907,429 | ||||||
| End of year | $ | 28,989,943 | $ | 36,944,683 | ||||
| Undistributed net investment income at end of year | $ | — | $ | 129,025 | ||||
Capital share activity: | ||||||||
| Shares sold | ||||||||
| A-Class | 770,941 | 1,699,951 | ||||||
| B-Class | 55,464 | 170,222 | ||||||
| C-Class | 115,065 | 37,449 | ||||||
| Shares issued from reinvestment of distributions | ||||||||
| A-Class | 16,034 | — | ||||||
| Shares redeemed | ||||||||
| A-Class | (1,435,726 | ) | (1,120,658 | ) | ||||
| B-Class | (287,335 | ) | (409,958 | ) | ||||
| C-Class | (177,984 | ) | (149,671 | ) | ||||
| Net increase (decrease) in shares | (943,541 | ) | 227,335 | |||||
64 | the RYDEX|SGI equity funds annual report
| Year Ended | Year Ended | Year Ended | Year Ended | Year Ended | ||||||||||||||||
| September 30, | September 30, | September 30, | September 30, | September 30, | ||||||||||||||||
| A-Class | 2011 | 2010 | 2009 | 2008 | 2007 | |||||||||||||||
Per Share Data | ||||||||||||||||||||
| Net asset value, beginning of period | $ | 7.63 | $ | 6.95 | $ | 6.91 | $ | 10.66 | $ | 9.86 | ||||||||||
| Income (loss) from investment operations: | ||||||||||||||||||||
Net investment income (loss)a | (.02 | ) | .04 | .01 | (.02 | ) | (.01 | ) | ||||||||||||
| Net gain (loss) on investments (realized and unrealized) | (.17 | ) | .64 | .03 | (2.87 | ) | .81 | |||||||||||||
| Total from investment operations | (.19 | ) | .68 | .04 | (2.89 | ) | .80 | |||||||||||||
| Less distributions from: | ||||||||||||||||||||
| Net investment income | (.04 | ) | — | — | — | — | ||||||||||||||
| Net realized gains | — | — | — | (.86 | ) | — | ||||||||||||||
| Total distributions | (.04 | ) | — | — | (.86 | ) | — | |||||||||||||
| Net asset value, end of period | $ | 7.40 | $ | 7.63 | $ | 6.95 | $ | 6.91 | $ | 10.66 | ||||||||||
Total Returnb | (2.59 | %) | 9.78 | % | 0.58 | % | (28.85 | %) | 8.11 | % | ||||||||||
Ratios/Supplemental Data | ||||||||||||||||||||
| Net assets, end of period (in thousands) | $ | 23,358 | $ | 29,059 | $ | 22,425 | $ | 23,723 | $ | 30,375 | ||||||||||
| Ratios to average net assets: | ||||||||||||||||||||
| Net investment income (loss) | (0.22 | %) | 0.52 | % | 0.09 | % | (0.20 | %) | (0.10 | %) | ||||||||||
| Total expenses | 1.70 | % | 1.73 | % | 2.04 | % | 1.72 | % | 1.57 | % | ||||||||||
Net expensesc | 1.35 | % | 1.35 | % | 1.35 | % | 1.35 | % | 1.40 | % | ||||||||||
| Portfolio turnover rate | 158 | % | 190 | % | 134 | % | 198 | %d | 21 | % | ||||||||||
| Year Ended | Year Ended | Year Ended | Year Ended | Year Ended | ||||||||||||||||
| September 30, | September 30, | September 30, | September 30, | September 30, | ||||||||||||||||
| B-Class | 2011 | 2010 | 2009 | 2008 | 2007 | |||||||||||||||
Per Share Data | ||||||||||||||||||||
| Net asset value, beginning of period | $ | 6.96 | $ | 6.39 | $ | 6.40 | $ | 10.01 | $ | 9.33 | ||||||||||
| Income (loss) from investment operations: | ||||||||||||||||||||
Net investment lossa | (.08 | ) | (.02 | ) | (.03 | ) | (.08 | ) | (.09 | ) | ||||||||||
| Net gain (loss) on investments (realized and unrealized) | (.16 | ) | .59 | .02 | (2.67 | ) | .77 | |||||||||||||
| Total from investment operations | (.24 | ) | .57 | (.01 | ) | (2.75 | ) | .68 | ||||||||||||
| Less distributions from: | ||||||||||||||||||||
| Net realized gains | — | — | — | (.86 | ) | — | ||||||||||||||
| Total distributions | — | — | — | (.86 | ) | — | ||||||||||||||
| Net asset value, end of period | $ | 6.72 | $ | 6.96 | $ | 6.39 | $ | 6.40 | $ | 10.01 | ||||||||||
Total Returnb | (3.45 | %) | 8.92 | % | (0.16 | %) | (29.36 | %) | 7.29 | % | ||||||||||
Ratios/Supplemental Data | ||||||||||||||||||||
| Net assets, end of period (in thousands) | $ | 2,873 | $ | 4,590 | $ | 5,740 | $ | 7,394 | $ | 10,868 | ||||||||||
| Ratios to average net assets: | ||||||||||||||||||||
| Net investment loss | (0.97 | %) | (0.31 | %) | (0.66 | %) | (0.95 | %) | (0.88 | %) | ||||||||||
| Total expenses | 2.46 | % | 2.48 | % | 2.79 | % | 2.47 | % | 2.32 | % | ||||||||||
Net expensesc | 2.10 | % | 2.10 | % | 2.10 | % | 2.10 | % | 2.15 | % | ||||||||||
| Portfolio turnover rate | 158 | % | 190 | % | 134 | % | 198 | %d | 21 | % | ||||||||||
the RYDEX|SGI equity funds annual report | 65
| Year Ended | Year Ended | Year Ended | Year Ended | Year Ended | ||||||||||||||||
| September 30, | September 30, | September 30, | September 30, | September 30, | ||||||||||||||||
| C-Class | 2011 | 2010 | 2009 | 2008 | 2007 | |||||||||||||||
Per Share Data | ||||||||||||||||||||
| Net asset value, beginning of period | $ | 6.99 | $ | 6.41 | $ | 6.42 | $ | 10.04 | $ | 9.36 | ||||||||||
| Income (loss) from investment operations: | ||||||||||||||||||||
Net investment lossa | (.08 | ) | (.02 | ) | (.03 | ) | (.08 | ) | (.08 | ) | ||||||||||
| Net gain (loss) on investments (realized and unrealized) | (.16 | ) | .60 | .02 | (2.68 | ) | .76 | |||||||||||||
| Total from investment operations | (.24 | ) | .58 | (.01 | ) | (2.76 | ) | .68 | ||||||||||||
| Less distributions from: | ||||||||||||||||||||
| Net realized gains | — | — | — | (.86 | ) | — | ||||||||||||||
| Total distributions | — | — | — | (.86 | ) | — | ||||||||||||||
| Net asset value, end of period | $ | 6.75 | $ | 6.99 | $ | 6.41 | $ | 6.42 | $ | 10.04 | ||||||||||
Total Returnb | (3.43 | %) | 9.05 | % | (0.16 | %) | (29.37 | %) | 7.26 | % | ||||||||||
Ratios/Supplemental Data | ||||||||||||||||||||
| Net assets, end of period (in thousands) | $ | 2,758 | $ | 3,296 | $ | 3,742 | $ | 5,501 | $ | 11,245 | ||||||||||
| Ratios to average net assets: | ||||||||||||||||||||
| Net investment loss | (0.97 | %) | (0.27 | %) | (0.66 | %) | (0.92 | %) | (0.86 | %) | ||||||||||
| Total expenses | 2.46 | % | 2.48 | % | 2.78 | % | 2.46 | % | 2.32 | % | ||||||||||
Net expensesc | 2.10 | % | 2.10 | % | 2.10 | % | 2.10 | % | 2.15 | % | ||||||||||
| Portfolio turnover rate | 158 | % | 190 | % | 134 | % | 198 | %d | 21 | % | ||||||||||
| a | Net investment income (loss) per share was computed using average shares outstanding throughout the year. | |
| b | Total return does not reflect the impact of any applicable sales charges and has not been annualized. | |
| c | Net expense information reflects the expense ratios after expense waivers and reimbursements, as applicable. | |
| d | Significant variation in the portfolio turnover rate is due to the Investment Manager’s appointment of new portfolio managers for the Fund. |
66 | the RYDEX|SGI equity funds annual report
MANAGER’S COMMENTARY (Unaudited) | September 30, 2011 | |
| Advised by: | | |
the RYDEX|SGI equity funds annual report | 67
| 1 | Performance figures are based on A-Class shares and do not reflect deduction of the sales charges or taxes that a shareholder would pay on distributions or the redemption of shares. Fee waivers and/or reimbursements reduce Fund expenses and, in the absence of such waivers, the performance quoted would be reduced. |
68 | the RYDEX|SGI equity funds annual report
| PERFORMANCE REPORT AND FUND PROFILE (Unaudited) | September 30, 2011 |
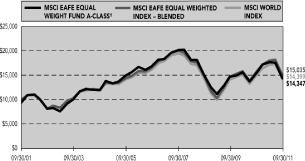
Periods Ended 9/30/2011
| 1 Year | 5 Year | 10 Year | ||||||||||
| A-Class | -7.32 | % | -3.09 | % | 4.29 | % | ||||||
A-Class with sales charge† | -12.63 | % | -4.23 | % | 3.68 | % | ||||||
| B-Class | -7.13 | % | -2.84 | % | 4.20 | % | ||||||
B-Class with CDSC†† | -11.74 | % | -3.05 | % | 4.20 | % | ||||||
| C-Class | -8.06 | % | -3.83 | % | 3.50 | % | ||||||
C-Class with CDSC††† | -8.98 | % | -3.83 | % | 3.50 | % | ||||||
| MSCI EAFE Equal Weighted Index | -7.49 | % | N/A | N/A | ||||||||
| MSCI EAFE Equal Weighted Index — Blended | -4.53 | % | -1.84 | % | 4.16 | % | ||||||
| MSCI World Index | -4.36 | % | -2.23 | % | 3.71 | % | ||||||
| Since Inception | ||||
| (05/02/11) | ||||
| Institutional Class Shares | -21.58 | % | ||
| MSCI World Index | -19.83 | % | ||
| MSCI EAFE Equal Weighted Index | -20.73 | % | ||
% of Net Assets)
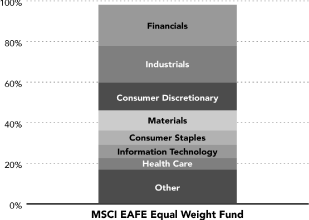
| Inception Dates: | ||||
| A-Class | October 1, 1993 | |||
| B-Class | October 19, 1993 | |||
| C-Class | January 29, 1999 | |||
| Institutional Class | May 2, 2011 | |||
| Ten Largest Holdings (% of Total Net Assets) | ||||
| iShares MSCI EAFE Index Fund | 4.0 | % | ||
| iShares MSCI Japan Index Fund | 0.8 | % | ||
| Toyo Suisan Kaisha Ltd. | 0.2 | % | ||
| Keyence Corp. | 0.2 | % | ||
| Nippon Building Fund, Inc. | 0.1 | % | ||
| Chugoku Bank Ltd. | 0.1 | % | ||
| Taisho Pharmaceutical Holdings Co. Ltd. | 0.1 | % | ||
| JGC Corp. | 0.1 | % | ||
| Japan Real Estate Investment Corp. | 0.1 | % | ||
| TOTO Ltd. | 0.1 | % | ||
| Top Ten Total | 5.8 | % | ||
| * | The performance data above represents past performance that is not predictive of future results. The investment return and principal value of an investment in the Fund will fluctuate so that an investor’s shares, when redeemed, may be worth more or less than their original cost. Returns are historical and include changes in principal and reinvested dividends and capital gains and do not reflect the effect of taxes. The MSCI World Index is an unmanaged index and, unlike the Fund, has no management fees or operating expenses to reduce its reported return. | |
| † | Effective February 22, 2011, the maximum sales charge decreased from 5.75% to 4.75%. A 5.75% maximum sales charge is used in the calculation of the 1 Year, 5 Year and 10 Year Average Annual Returns (based on subscriptions made prior to February 22, 2011), and a 4.75% maximum sales charge will be used to calculate performance for periods based on subscriptions made on or after February 22, 2011. | |
| †† | Fund returns include a CDSC of up to 5% if redeemed within 5 years of purchase. | |
| ††† | Fund returns include a CDSC of 1% if redeemed within 12 months of purchase. |
the RYDEX|SGI equity funds annual report | 69
| SCHEDULE OF INVESTMENTS | September 30, 2011 |
| Shares | Value | |||||||
COMMON STOCKS†† - 92.6% | ||||||||
Financials - 20.2% | ||||||||
| Nippon Building Fund, Inc. | 10 | $ | 103,516 | |||||
| Chugoku Bank Ltd. | 7,000 | 103,079 | ||||||
| Japan Real Estate Investment Corp. | 10 | 97,760 | ||||||
| Japan Retail Fund Investment Corp. — Class A | 60 | 96,462 | ||||||
| Joyo Bank Ltd. | 20,000 | 93,039 | ||||||
| Iyo Bank Ltd. | 9,000 | 91,816 | ||||||
| Chiba Bank Ltd. | 13,000 | 90,161 | ||||||
| Daiwa House Industry Company Ltd. | 7,000 | 89,625 | ||||||
| Gunma Bank Ltd. | 16,000 | 89,176 | ||||||
| Hiroshima Bank Ltd. | 18,000 | 89,083 | ||||||
| Bank of Kyoto Ltd. | 10,000 | 89,028 | ||||||
| Fukuoka Financial Group, Inc. | 21,000 | 87,862 | ||||||
| Suruga Bank Ltd. | 9,000 | 87,674 | ||||||
| Hokuhoku Financial Group, Inc. | 39,960 | 87,305 | ||||||
| Lloyds Banking Group plc* | 160,350 | 86,062 | ||||||
| Nishi-Nippon City Bank Ltd. | 28,000 | 86,043 | ||||||
| Hachijuni Bank Ltd. | 14,000 | 85,755 | ||||||
| Bank of Yokohama Ltd. | 17,000 | 85,244 | ||||||
| Resona Holdings, Inc. | 17,780 | 84,825 | ||||||
| Shizuoka Bank Ltd. | 8,000 | 83,813 | ||||||
Mitsubishi UFJ Financial Group, Inc.† | 18,080 | 82,976 | ||||||
| Aeon Credit Service Company Ltd. | 5,390 | 82,916 | ||||||
| Sumitomo Mitsui Trust Holdings, Inc. | 24,980 | 82,676 | ||||||
| Daito Trust Construction Company Ltd. | 900 | 82,506 | ||||||
| Aeon Mall Company Ltd. | 3,600 | 82,226 | ||||||
| Mitsubishi UFJ Lease & Finance Company Ltd. | 2,040 | 81,430 | ||||||
| Mitsubishi Estate Company Ltd. | 5,000 | 81,098 | ||||||
| Yamaguchi Financial Group, Inc. | 8,000 | 80,848 | ||||||
| Credit Saison Company Ltd. | 4,190 | 80,781 | ||||||
| Nomura Real Estate Holdings, Inc. | 5,290 | 80,028 | ||||||
| Mizuho Financial Group, Inc. | 54,057 | 79,155 | ||||||
| Mitsui Fudosan Company Ltd. | 5,000 | 78,981 | ||||||
| Sumitomo Mitsui Financial Group, Inc. | 2,800 | 78,887 | ||||||
| Shinsei Bank Ltd. | 69,920 | 78,585 | ||||||
| Daiwa Securities Group, Inc. | 21,000 | 78,414 | ||||||
| Seven Bank Ltd. | 40 | 78,066 | ||||||
| Royal Bank of Scotland Group plc ADR* | 217,770 | 77,864 | ||||||
| SBI Holdings, Inc. | 901 | 77,848 | ||||||
| NKSJ Holdings, Inc. | 3,500 | 77,693 | ||||||
| Unione di Banche Italiane SCPA | 20,960 | 77,589 | ||||||
| Banco Popolare SC | 46,800 | 77,375 | ||||||
| Zurich Financial Services AG* | 370 | 77,073 | ||||||
| Japan Prime Realty Investment Corp. | 30 | 77,030 | ||||||
| United Overseas Bank Ltd. | 5,990 | 77,018 | ||||||
| Sumitomo Realty & Development Company Ltd. | 4,000 | 76,887 | ||||||
| Standard Life plc | 24,818 | 76,756 | ||||||
| Randstad Holding N.V. | 2,400 | 76,509 | ||||||
| Sony Financial Holdings, Inc. | 5,000 | 76,334 | ||||||
| MS&AD Insurance Group Holdings | 3,500 | 76,147 | ||||||
| Hopewell Holdings Ltd. | 26,500 | 76,035 | ||||||
| Tokio Marine Holdings, Inc. | 3,000 | 76,024 | ||||||
| Capital Shopping Centres Group plc | 14,990 | 75,977 | ||||||
| Hannover Rueckversicherung AG | 1,671 | 75,544 | ||||||
| Danske Bank A/S* | 5,390 | 75,379 | ||||||
| Barclays plc | 30,740 | 75,353 | ||||||
| Credit Suisse Group AG* | 2,860 | 74,821 | ||||||
| Muenchener Rueckversicherungs AG | 600 | 74,514 | ||||||
| Tryg A/S | 1,411 | 74,184 | ||||||
| ASX Ltd. | 2,551 | 74,091 | ||||||
| Allianz AG | 790 | 74,042 | ||||||
| Aozora Bank Ltd. | 32,000 | 73,673 | ||||||
| RSA Insurance Group plc | 42,810 | 73,599 | ||||||
| T&D Holdings, Inc. | 7,800 | 73,483 | ||||||
| Pohjola Bank plc — Class A | 6,980 | 73,425 | ||||||
Banco Bilbao Vizcaya Argentaria S.A.† | 8,850 | 73,271 | ||||||
| Aegon N.V.* | 18,010 | 72,997 | ||||||
| Intesa Sanpaolo SpA | 46,480 | 72,888 | ||||||
| Bankinter S.A. | 13,414 | 72,848 | ||||||
| Standard Chartered plc | 3,650 | 72,784 | ||||||
| Svenska Handelsbanken AB — Class A | 2,860 | 72,755 | ||||||
Swiss Re AG*,† | 1,550 | 72,712 | ||||||
| Global Logistic Properties Ltd.* | 57,950 | 72,665 | ||||||
| NTT Urban Development Corp. | 100 | 72,664 | ||||||
| Link REIT | 22,980 | 72,603 | ||||||
| SCOR SE | 3,360 | 72,475 | ||||||
| HSBC Holdings plc | 9,460 | 72,441 | ||||||
| Legal & General Group plc | 48,529 | 72,433 | ||||||
| City Developments Ltd. | 9,990 | 72,426 | ||||||
| Dai-ichi Life Insurance Company Ltd. | 70 | 72,351 | ||||||
| Resolution Ltd. | 18,860 | 72,260 | ||||||
| CapitaMall Trust | 51,950 | 72,038 | ||||||
| Tokyu Land Corp. | 20,000 | 71,880 | ||||||
| Insurance Australia Group Ltd. | 24,832 | 71,879 | ||||||
| Aviva plc | 15,290 | 71,875 | ||||||
| Hammerson plc | 12,270 | 71,807 | ||||||
| Suncorp Group Ltd. | 9,418 | 71,700 | ||||||
| Government Properties Trust, Inc. | 23,821 | 71,643 | ||||||
| Skandinaviska Enskilda Banken AB | 13,330 | 71,637 | ||||||
| Mapfre S.A. | 23,191 | 71,606 | ||||||
| Banco Santander S.A. | 8,740 | 71,453 | ||||||
Bankia S.A.*,† | 14,550 | 71,420 | ||||||
| Banco de Sabadell S.A. | 19,994 | 71,385 | ||||||
70 | the RYDEX|SGI equity funds annual report
| SCHEDULE OF INVESTMENTS (continued) | September 30, 2011 |
| Shares | Value | |||||||
| Prudential plc | 8,320 | $ | 71,380 | |||||
| GAM Holding AG* | 5,700 | 71,345 | ||||||
| Sino Land Company Ltd. | 54,000 | 71,313 | ||||||
| Hang Lung Group Ltd. | 13,990 | 71,283 | ||||||
| Mirvac Group REIT | 64,795 | 71,231 | ||||||
| Banco Popular Espanol S.A. | 15,421 | 71,141 | ||||||
| Israel Discount Bank Ltd. — Class A* | 47,025 | 68,932 | ||||||
| Mizrahi Tefahot Bank Ltd.* | 8,394 | 68,908 | ||||||
| Admiral Group plc | 3,620 | 70,948 | ||||||
| CapitaLand Ltd. | 38,000 | 70,895 | ||||||
| Ascendas Real Estate Investment Trust | 45,950 | 70,851 | ||||||
| Dexus Property Group | 89,703 | 70,701 | ||||||
| London Stock Exchange Group plc | 5,622 | 70,676 | ||||||
| ORIX Corp. | 900 | 70,634 | ||||||
| Singapore Exchange Ltd. | 14,000 | 70,366 | ||||||
| Assicurazioni Generali SpA | 4,440 | 70,309 | ||||||
| Delta Lloyd N.V. | 4,450 | 70,221 | ||||||
| Investor AB — Class B | 3,990 | 70,194 | ||||||
| Banca Carige SpA | 36,290 | 70,180 | ||||||
| Intesa Sanpaolo SpA | 54,480 | 70,027 | ||||||
| Westpac Banking Corp. | 3,603 | 69,768 | ||||||
| CFS Retail Property Trust | 41,560 | 69,736 | ||||||
| Nomura Holdings, Inc. | 19,100 | 69,651 | ||||||
| Stockland | 24,923 | 69,368 | ||||||
| Sampo Oyj — Class A | 2,761 | 69,346 | ||||||
| Westfield Group | 9,333 | 69,206 | ||||||
| Banca Monte dei Paschi di Siena SpA | 124,390 | 69,076 | ||||||
| Nordea Bank AB | 8,530 | 69,015 | ||||||
| Sun Hung Kai Properties Ltd. | 6,000 | 68,832 | ||||||
| Ageas | 39,950 | 68,795 | ||||||
| Bank Hapoalim BM* | 19,240 | 66,388 | ||||||
| Wing Hang Bank Ltd. | 8,490 | 68,524 | ||||||
| Pargesa Holding S.A. | 1,000 | 68,403 | ||||||
| Old Mutual plc | 42,183 | 68,375 | ||||||
| Groupe Bruxelles Lambert S.A. | 971 | 68,193 | ||||||
| Kinnevik Investment AB — Class B | 3,681 | 68,092 | ||||||
| Wheelock & Company Ltd. | 22,980 | 67,991 | ||||||
| Deutsche Bank AG | 1,960 | 67,913 | ||||||
| Bendigo and Adelaide Bank Ltd. | 8,370 | 67,792 | ||||||
| Oversea-Chinese Banking Corporation Ltd. | 10,990 | 67,728 | ||||||
| Gjensidige Forsikring ASA | 6,556 | 67,682 | ||||||
| Australia & New Zealand Banking Group Ltd. | 3,643 | 67,614 | ||||||
| Julius Baer Group Ltd.* | 2,021 | 67,538 | ||||||
| ICAP plc | 10,589 | 67,471 | ||||||
| ING Groep N.V.* | 9,560 | 67,431 | ||||||
| Mediobanca SpA | 8,580 | 67,355 | ||||||
| AIA Group Ltd. | 23,780 | 67,344 | ||||||
Deutsche Boerse AG*† | 1,330 | 67,262 | ||||||
| Land Securities Group plc | 6,761 | 67,134 | ||||||
| 3i Group plc | 23,070 | 67,025 | ||||||
| Industrivarden AB — Class C | 6,400 | 66,993 | ||||||
| British Land Company plc | 9,094 | 66,963 | ||||||
| Bank Leumi Le-Israel BM* | 21,050 | 64,449 | ||||||
| Swiss Life Holding AG* | 610 | 66,898 | ||||||
| AXA S.A. | 5,140 | 66,867 | ||||||
| CaixaBank | 15,250 | 66,809 | ||||||
| National Australia Bank Ltd. ADR | 3,142 | 66,736 | ||||||
| Commonwealth Bank of Australia ADR | 1,532 | 66,621 | ||||||
| Exor SpA | 3,400 | 66,545 | ||||||
| Westfield Retail Trust | 28,523 | 66,376 | ||||||
| Fonciere Des Regions | 950 | 66,265 | ||||||
| UOL Group Ltd. | 20,980 | 66,117 | ||||||
| Commerzbank AG* | 26,350 | 66,034 | ||||||
| Unibail-Rodamco SE | 370 | 66,018 | ||||||
| DnB NOR ASA* | 6,620 | 65,973 | ||||||
| Schroders plc | 3,331 | 65,969 | ||||||
| Baloise Holding AG | 900 | 65,910 | ||||||
| KBC Groep N.V. | 2,850 | 65,748 | ||||||
| Segro plc | 19,240 | 65,595 | ||||||
| Hang Seng Bank Ltd. | 5,590 | 65,485 | ||||||
| Hang Lung Properties Ltd. | 22,000 | 65,457 | ||||||
| Klepierre | 2,330 | 65,309 | ||||||
| UBS AG* | 5,700 | 65,200 | ||||||
| Cheung Kong Holdings Ltd. | 6,000 | 65,044 | ||||||
| Swedbank AB | 5,880 | 64,904 | ||||||
| Dexia S.A.* | 34,030 | 64,724 | ||||||
| Vienna Insurance Group AG Wiener Versicherung Gruppe | 1,700 | 64,625 | ||||||
| CapitaMalls Asia Ltd. | 69,940 | 64,448 | ||||||
| Bank of East Asia Ltd. | 20,980 | 64,435 | ||||||
| CNP Assurances | 4,362 | 64,222 | ||||||
| QBE Insurance Group Ltd. | 5,230 | 64,221 | ||||||
| Wharf Holdings Ltd. | 12,990 | 64,088 | ||||||
| Macquarie Group Ltd. | 2,950 | 63,792 | ||||||
| Societe Generale S.A. | 2,430 | 63,608 | ||||||
| Investec plc | 11,730 | 63,438 | ||||||
| AMP Ltd. | 16,862 | 63,330 | ||||||
| Gecina S.A. | 720 | 62,931 | ||||||
| Banco Espirito Santo S.A. | 23,754 | 62,911 | ||||||
| IMMOFINANZ AG* | 22,230 | 62,843 | ||||||
| Henderson Land Development Company Ltd. | 13,990 | 62,809 | ||||||
| DBS Group Holdings Ltd. | 7,000 | 62,765 | ||||||
| Corio N.V. | 1,360 | 62,661 | ||||||
| Keppel Land Ltd. | 32,000 | 62,499 | ||||||
| Hong Kong Exchanges and Clearing Ltd. | 4,300 | 62,375 | ||||||
| BOC Hong Kong Holdings Ltd. | 29,470 | 62,309 | ||||||
| Goodman Group | 113,135 | 61,981 | ||||||
| ICADE | 790 | 61,720 | ||||||
| Swire Pacific Ltd. — Class A | 5,990 | 61,547 | ||||||
| BNP Paribas S.A. | 1,560 | 61,496 | ||||||
| UniCredit SpA | 57,880 | 61,371 | ||||||
| New World Development Ltd. | 64,000 | 61,196 | ||||||
the RYDEX|SGI equity funds annual report | 71
| Shares | Value | |||||||
| Nomura Real Estate Office Fund, Inc. — Class A | 10 | $ | 60,978 | |||||
| Natixis | 19,300 | 60,710 | ||||||
| Hysan Development Company Ltd. — Class A | 19,980 | 60,532 | ||||||
| Ratos AB — Class B | 5,260 | 60,368 | ||||||
| Lend Lease Group | 8,986 | 60,346 | ||||||
| Eurazeo | 1,420 | 59,637 | ||||||
| Man Group plc | 22,950 | 59,324 | ||||||
| Kerry Properties Ltd. | 18,480 | 58,985 | ||||||
| Raiffeisen Bank International AG | 1,980 | 57,311 | ||||||
| Banco Comercial Portugues S.A.* | 215,886 | 55,861 | ||||||
| Credit Agricole S.A. | 8,100 | 55,703 | ||||||
| Bank of Cyprus plc | 35,850 | 55,350 | ||||||
| Erste Group Bank AG | 2,170 | 55,340 | ||||||
| National Bank of Greece S.A.* | 14,980 | 54,193 | ||||||
| Alpha Bank AE — Class B* | 21,770 | 37,973 | ||||||
| EFG Eurobank Ergasias S.A.* | 24,010 | 29,386 | ||||||
| ANF Immobilier | 43 | 1,759 | ||||||
| Swiss Reinsurance Company Ltd.* | 10 | 463 | ||||||
| Banco de Valencia S.A.* | 412 | 424 | ||||||
| Deutsche Boerse AG | 8 | 403 | ||||||
Total Financials | 14,873,323 | |||||||
Industrials - 18.1% | ||||||||
| JGC Corp. | 4,000 | 97,811 | ||||||
| TOTO Ltd. | 11,000 | 97,021 | ||||||
| Odakyu Electric Railway Company Ltd. | 10,000 | 95,046 | ||||||
| Keio Corp. | 13,000 | 92,998 | ||||||
| Keikyu Corp. | 10,000 | 92,317 | ||||||
| NGK Insulators Ltd. | 6,000 | 90,279 | ||||||
Kubota Corp.† | 11,000 | 89,700 | ||||||
| JS Group Corp. | 3,200 | 89,578 | ||||||
| Keisei Electric Railway Company Ltd. | 13,000 | 88,145 | ||||||
| Asahi Glass Company Ltd. | 9,000 | 87,863 | ||||||
| Central Japan Railway Co. | 10 | 87,262 | ||||||
| Kurita Water Industries Ltd. | 3,100 | 86,897 | ||||||
| Secom Company Ltd. | 1,800 | 86,813 | ||||||
| Kinden Corp. | 10,000 | 86,456 | ||||||
| West Japan Railway Co. | 2,000 | 85,726 | ||||||
| Yamato Holdings Company Ltd. | 4,690 | 85,499 | ||||||
| Tokyu Corp. | 17,000 | 85,422 | ||||||
| Toyota Tsusho Corp. | 4,990 | 85,366 | ||||||
| Nippon Express Company Ltd. | 20,000 | 85,304 | ||||||
| East Japan Railway Co. | 1,400 | 84,872 | ||||||
| Tobu Railway Company Ltd. | 18,000 | 84,781 | ||||||
| Obayashi Corp. | 17,000 | 83,966 | ||||||
| Mabuchi Motor Company Ltd. | 1,800 | 83,594 | ||||||
| Hino Motors Ltd. | 14,000 | 83,291 | ||||||
| Kintetsu Corp. | 22,000 | 82,942 | ||||||
| Dai Nippon Printing Company Ltd. | 8,000 | 82,724 | ||||||
| Taisei Corp. | 30,000 | 82,585 | ||||||
| Balfour Beatty plc | 20,840 | 82,393 | ||||||
| Kajima Corp. | 24,970 | 81,947 | ||||||
| Wolseley plc | 3,270 | 81,125 | ||||||
| Babcock International Group plc | 7,943 | 80,912 | ||||||
| Nidec Corp. | 1,000 | 80,532 | ||||||
| Kamigumi Company Ltd. | 9,000 | 80,329 | ||||||
| Hutchison Port Holdings Trust | 119,000 | 80,325 | ||||||
| Toppan Printing Company Ltd. | 11,000 | 80,111 | ||||||
| JTEKT Corp. | 6,690 | 80,047 | ||||||
| Mitsubishi Heavy Industries Ltd. | 18,980 | 80,045 | ||||||
| Experian plc | 7,131 | 80,040 | ||||||
| NTN Corp. | 17,000 | 79,721 | ||||||
| Smiths Group plc | 5,150 | 79,428 | ||||||
| Abertis Infraestructuras S.A. | 5,150 | 79,197 | ||||||
| Shimizu Corp. | 18,000 | 79,001 | ||||||
| Amada Company Ltd. | 12,000 | 78,931 | ||||||
| Bunzl plc | 6,606 | 78,659 | ||||||
| All Nippon Airways Company Ltd. | 25,000 | 78,237 | ||||||
| Sojitz Corp. | 42,800 | 78,186 | ||||||
| Marubeni Corp. | 14,000 | 78,170 | ||||||
| Bouygues S.A. | 2,360 | 78,068 | ||||||
| Koninklijke Vopak N.V. | 1,632 | 77,996 | ||||||
| Singapore Airlines Ltd. | 9,000 | 77,915 | ||||||
| Chiyoda Corp. | 7,990 | 77,891 | ||||||
| Sumitomo Corp. | 6,290 | 77,825 | ||||||
| Japan Steel Works Ltd. | 13,000 | 77,539 | ||||||
Ryanair Holdings plc ADR†,* | 2,990 | 76,993 | ||||||
| Serco Group plc | 9,692 | 76,588 | ||||||
| Capita Group plc | 6,936 | 75,905 | ||||||
| Elbit Systems Ltd.* | 1,900 | 73,936 | ||||||
| G4S plc | 18,323 | 75,774 | ||||||
| BAE Systems plc | 18,310 | 75,586 | ||||||
| Mitsubishi Logistics Corp. | 7,000 | 75,420 | ||||||
| Schindler Holding AG | 690 | 75,209 | ||||||
| Finmeccanica SpA | 10,870 | 75,208 | ||||||
| Fomento de Construcciones y Contratas S.A. | 3,050 | 75,191 | ||||||
| Makita Corp. | 2,100 | 74,740 | ||||||
| Ushio, Inc. | 4,900 | 74,594 | ||||||
| Fraser and Neave Ltd. | 16,980 | 74,530 | ||||||
| Daikin Industries Ltd. | 2,600 | 74,465 | ||||||
| MAp Group | 23,972 | 74,223 | ||||||
| Schindler Holding AG | 700 | 74,203 | ||||||
| Koninklijke Boskalis Westminster N.V. — Class B | 2,410 | 74,123 | ||||||
| NWS Holdings Ltd. | 56,000 | 74,097 | ||||||
| Transurban Group | 14,234 | 74,000 | ||||||
| Groupe Eurotunnel S.A. | 8,710 | 73,814 | ||||||
| Hitachi Construction Machinery Company Ltd. | 4,400 | 73,665 | ||||||
| ITOCHU Corp. | 7,700 | 73,575 | ||||||
| NSK Ltd. | 10,000 | 73,485 | ||||||
| MTR Corp. | 24,480 | 73,275 | ||||||
| Mitsui OSK Lines Ltd. | 19,000 | 73,200 | ||||||
| SMC Corp. | 500 | 73,076 | ||||||
| Skanska AB | 5,280 | 73,073 | ||||||
| Ferrovial S.A. | 6,407 | 73,034 | ||||||
72 | the RYDEX|SGI equity funds annual report
| SCHEDULE OF INVESTMENTS (continued) | September 30, 2011 |
| Shares | Value | |||||||
| Delek Group Ltd.* | 460 | $ | 69,696 | |||||
| IHI Corp. | 33,000 | 72,748 | ||||||
| Rolls-Royce Holdings plc* | 7,898 | 72,535 | ||||||
| Fuji Electric Company Ltd. | 28,000 | 72,478 | ||||||
| Aeroports de Paris | 960 | 72,206 | ||||||
| Atlantia SpA | 5,020 | 72,176 | ||||||
| Geberit AG* | 390 | 72,010 | ||||||
| Bureau Veritas S.A. | 1,001 | 71,953 | ||||||
| Sumitomo Heavy Industries Ltd. | 14,000 | 71,589 | ||||||
| Cobham plc | 26,460 | 71,575 | ||||||
| Nippon Sheet Glass Company Ltd. | 31,980 | 71,545 | ||||||
| Sandvik AB | 6,210 | 71,539 | ||||||
| Auckland International Airport Ltd. | 41,110 | 71,451 | ||||||
| Intertek Group plc | 2,482 | 71,337 | ||||||
| Mitsubishi Corp. | 3,500 | 71,254 | ||||||
| Hochtief AG | 1,140 | 71,201 | ||||||
| Edenred | 2,982 | 71,036 | ||||||
| Mitsui & Company Ltd. | 4,900 | 70,973 | ||||||
| Assa Abloy AB | 3,450 | 70,962 | ||||||
| Orkla ASA | 9,336 | 70,961 | ||||||
| Adecco S.A.* | 1,800 | 70,946 | ||||||
| European Aeronautic Defence and Space Company N.V.* | 2,522 | 70,887 | ||||||
| Mitsubishi Electric Corp. | 8,000 | 70,858 | ||||||
| Societe BIC S.A. ADR | 831 | 70,750 | ||||||
| DSV A/S | 3,920 | 70,524 | ||||||
| Nippon Yusen Kabushiki Kaisha | 26,000 | 70,518 | ||||||
| Sumitomo Electric Industries Ltd. | 5,990 | 70,344 | ||||||
| Singapore Technologies Engineering Ltd. | 33,000 | 70,242 | ||||||
| Nabtesco Corp. | 3,700 | 69,928 | ||||||
| Wartsila Oyj | 2,940 | 69,757 | ||||||
| QR National Ltd. | 22,989 | 69,513 | ||||||
| ComfortDelGro Corporation Ltd. | 69,930 | 69,433 | ||||||
| Brenntag AG | 800 | 69,396 | ||||||
| Neptune Orient Lines Ltd. | 84,000 | 69,250 | ||||||
| Koninklijke Philips Electronics N.V. | 3,850 | 69,073 | ||||||
| ACS Actividades de Construccion y Servicios S.A. | 1,960 | 69,068 | ||||||
| MAN SE | 890 | 68,986 | ||||||
| Zardoya Otis S.A. | 5,422 | 68,921 | ||||||
| FANUC Corp. | 500 | 68,868 | ||||||
| Kawasaki Heavy Industries Ltd. | 27,000 | 68,848 | ||||||
| Mitsui Engineering & Shipbuilding Company Ltd. | 40,960 | 68,781 | ||||||
| Siemens AG | 760 | 68,374 | ||||||
| Fraport AG Frankfurt Airport Services Worldwide | 1,150 | 67,712 | ||||||
| Asciano Ltd. | 48,890 | 67,355 | ||||||
| Thales S.A. | 2,151 | 67,231 | ||||||
| International Consolidated Airlines Group S.A.* | 28,440 | 66,949 | ||||||
| Komatsu Ltd. | 3,100 | 66,832 | ||||||
| Aggreko plc | 2,652 | 66,686 | ||||||
| Hutchison Whampoa Ltd. | 9,000 | 66,604 | ||||||
| Toll Holdings Ltd. | 15,878 | 66,580 | ||||||
| Brambles Ltd. | 10,799 | 66,569 | ||||||
| Kuehne + Nagel International AG | 590 | 66,217 | ||||||
| Prysmian SpA | 5,040 | 66,209 | ||||||
| Deutsche Post AG | 5,160 | 66,059 | ||||||
| Invensys plc | 18,960 | 66,010 | ||||||
| Weir Group plc | 2,761 | 65,916 | ||||||
| Orient Overseas International Ltd. | 16,490 | 65,880 | ||||||
| Sulzer AG | 640 | 65,770 | ||||||
| GS Yuasa Corp. | 14,000 | 65,643 | ||||||
| GEA Group AG | 2,810 | 65,589 | ||||||
| SKF AB | 3,480 | 65,552 | ||||||
| ABB Ltd.* | 3,830 | 65,516 | ||||||
| Fiat Industrial SpA* | 8,740 | 65,303 | ||||||
| Cathay Pacific Airways Ltd. | 39,970 | 65,232 | ||||||
| Volvo AB | 6,640 | 65,211 | ||||||
| Vinci S.A. | 1,520 | 65,192 | ||||||
| Metso Oyj | 2,220 | 64,977 | ||||||
| THK Company Ltd. | 3,900 | 64,895 | ||||||
| Safran S.A. | 2,121 | 64,880 | ||||||
| Kone Oyj — Class B | 1,361 | 64,730 | ||||||
| Keppel Corporation Ltd. | 10,990 | 64,443 | ||||||
| Schneider Electric S.A. | 1,200 | 64,215 | ||||||
| Legrand S.A. | 2,051 | 63,935 | ||||||
| Minebea Company Ltd. | 19,000 | 63,781 | ||||||
| Deutsche Lufthansa AG | 4,910 | 63,651 | ||||||
| Cosco Corporation Singapore Ltd. | 91,000 | 63,481 | ||||||
| Leighton Holdings Ltd. | 3,572 | 63,435 | ||||||
| Atlas Copco AB — Class A | 3,570 | 63,173 | ||||||
| Scania AB — Class B | 4,420 | 63,132 | ||||||
| Alfa Laval AB | 3,992 | 62,826 | ||||||
| Atlas Copco AB — Class B | 4,010 | 62,763 | ||||||
| Qantas Airways Ltd.* | 46,810 | 62,745 | ||||||
| Furukawa Electric Company Ltd. | 23,000 | 62,636 | ||||||
| Securitas AB — Class B | 8,611 | 62,617 | ||||||
| Kawasaki Kisen Kaisha Ltd. | 29,980 | 62,344 | ||||||
| Air France-KLM* | 8,450 | 61,757 | ||||||
| Vestas Wind Systems A/S* | 3,780 | 61,255 | ||||||
| Cie de St.-Gobain | 1,600 | 61,039 | ||||||
| PostNL N.V. ADR | 13,945 | 60,995 | ||||||
| Noble Group Ltd. | 60,950 | 60,803 | ||||||
| Wendel S.A. | 970 | 60,785 | ||||||
| SGS S.A. | 40 | 60,768 | ||||||
| Yangzijiang Shipbuilding Holdings Ltd. | 90,940 | 60,730 | ||||||
| SembCorp Industries Ltd. | 22,980 | 59,308 | ||||||
TNT Express N.V.† | 8,480 | 59,290 | ||||||
| Bekaert S.A. | 1,450 | 59,030 | ||||||
| A P Moller — Maersk A/S — Class B | 10 | 58,737 | ||||||
| SembCorp Marine Ltd. | 23,980 | 58,712 | ||||||
| Alstom S.A. | 1,740 | 57,310 | ||||||
| A P Moller — Maersk A/S — Class A | 10 | 55,969 | ||||||
the RYDEX|SGI equity funds annual report | 73
| SCHEDULE OF INVESTMENTS (continued) | September 30, 2011 |
| Shares | Value | |||||||
| Eiffage S.A. | 1,710 | $ | 52,743 | |||||
| Vallourec S.A. | 900 | 51,537 | ||||||
Total Industrials | 13,275,544 | |||||||
Consumer Discretionary - 13.2% | ||||||||
| Jardine Cycle & Carriage Ltd. | 3,000 | 95,320 | ||||||
| NGK Spark Plug Company Ltd. | 7,000 | 95,127 | ||||||
| Koito Manufacturing Company Ltd. | 6,000 | 94,915 | ||||||
| Sekisui House Ltd. | 10,000 | 93,697 | ||||||
| Rinnai Corp. | 1,100 | 91,828 | ||||||
| Daihatsu Motor Company Ltd. | 5,000 | 90,720 | ||||||
| Takashimaya Company Ltd. | 12,000 | 87,507 | ||||||
| Sankyo Company Ltd. | 1,600 | 86,571 | ||||||
| Sega Sammy Holdings, Inc. | 3,700 | 86,318 | ||||||
| Suzuki Motor Corp. | 3,900 | 85,962 | ||||||
| J Front Retailing Company Ltd. | 18,000 | 85,429 | ||||||
| Oriental Land Company Ltd. | 800 | 85,348 | ||||||
| NOK Corp. | 4,700 | 85,024 | ||||||
| Nikon Corp. | 3,600 | 84,915 | ||||||
| Mitsubishi Motors Corp.* | 63,930 | 84,728 | ||||||
| Shimano, Inc. | 1,600 | 84,684 | ||||||
| Stanley Electric Company Ltd. | 5,600 | 84,616 | ||||||
| Benesse Holdings, Inc. | 1,900 | 84,165 | ||||||
| Sekisui Chemical Company Ltd. | 10,000 | 84,068 | ||||||
| Sharp Corp. | 10,000 | 84,007 | ||||||
| Next plc | 2,143 | 83,973 | ||||||
| Shimamura Company Ltd. | 800 | 83,858 | ||||||
| Toyoda Gosei Company Ltd. | 4,400 | 83,771 | ||||||
| Hakuhodo DY Holdings, Inc. | 1,440 | 83,533 | ||||||
| Aisin Seiki Company Ltd. | 2,500 | 83,233 | ||||||
| Namco Bandai Holdings, Inc. | 6,090 | 82,477 | ||||||
| Dentsu, Inc. | 2,600 | 82,369 | ||||||
| Toho Company Ltd. | 4,700 | 82,089 | ||||||
| Inditex S.A. | 961 | 82,031 | ||||||
| Kingfisher plc | 21,300 | 81,747 | ||||||
| Sumitomo Rubber Industries Ltd. | 6,390 | 81,700 | ||||||
| Bridgestone Corp. | 3,600 | 81,678 | ||||||
| Toyota Industries Corp. | 2,800 | 81,655 | ||||||
| Isuzu Motors Ltd. | 19,000 | 81,622 | ||||||
| Rakuten, Inc. | 70 | 81,548 | ||||||
| Whitbread plc | 3,302 | 80,906 | ||||||
| ABC-Mart, Inc. | 2,100 | 80,719 | ||||||
| Carnival plc | 2,590 | 80,682 | ||||||
| Nitori Holdings Company Ltd. | 800 | 80,522 | ||||||
| Denso Corp. | 2,500 | 80,363 | ||||||
| McDonald’s Holdings Company Japan Ltd. | 3,000 | 80,009 | ||||||
| Toyota Boshoku Corp. | 5,590 | 79,880 | ||||||
| Nissan Motor Company Ltd. | 8,990 | 79,539 | ||||||
| NHK Spring Company Ltd. | 9,000 | 79,517 | ||||||
| Intercontinental Hotels Group plc | 4,900 | 79,372 | ||||||
| USS Company Ltd. | 930 | 79,070 | ||||||
| Pearson plc | 4,484 | 79,015 | ||||||
| Isetan Mitsukoshi Holdings Ltd. | 7,790 | 78,838 | ||||||
| Toyota Motor Corp. | 2,300 | 78,837 | ||||||
| British Sky Broadcasting Group plc ADR | 7,650 | 78,720 | ||||||
| Yamada Denki Company Ltd. | 1,130 | 78,586 | ||||||
| Casio Computer Co. Ltd. | 12,390 | 78,442 | ||||||
| JCDecaux S.A.* | 3,160 | 78,423 | ||||||
| Marui Group Company Ltd. | 10,300 | 77,436 | ||||||
| Yamaha Corp. | 7,090 | 76,715 | ||||||
| Li & Fung Ltd. | 45,960 | 76,688 | ||||||
| Fuji Heavy Industries Ltd. | 13,000 | 76,325 | ||||||
| Kabel Deutschland Holding AG* | 1,420 | 76,129 | ||||||
| Hennes & Mauritz AB — Class B | 2,540 | 76,031 | ||||||
| Jupiter Telecommunications Company Ltd. | 70 | 75,736 | ||||||
| ITV plc* | 82,360 | 75,257 | ||||||
| Reed Elsevier plc | 9,814 | 75,112 | ||||||
| Marks & Spencer Group plc | 15,380 | 74,861 | ||||||
| Mazda Motor Corp.* | 37,000 | 74,837 | ||||||
| Reed Elsevier N.V. | 6,802 | 74,794 | ||||||
| Harvey Norman Holdings Ltd. | 36,210 | 74,396 | ||||||
| Singapore Press Holdings Ltd. | 26,000 | 74,334 | ||||||
| Yue Yuen Industrial Holdings Ltd. | 28,480 | 73,657 | ||||||
| TUI Travel plc | 31,830 | 73,358 | ||||||
| Panasonic Corp. | 7,590 | 73,354 | ||||||
| Honda Motor Company Ltd. | 2,500 | 73,232 | ||||||
| SES S.A. | 2,984 | 72,613 | ||||||
| Asics Corp. | 5,290 | 72,227 | ||||||
| Eutelsat Communications S.A. | 1,792 | 71,984 | ||||||
| Compass Group plc | 8,916 | 71,853 | ||||||
| WPP plc | 7,750 | 71,716 | ||||||
| Fast Retailing Company Ltd. | 400 | 71,634 | ||||||
| Yamaha Motor Company Ltd.* | 5,400 | 71,287 | ||||||
| Pirelli & C. SpA | 10,000 | 71,125 | ||||||
| Sony Corp. | 3,700 | 70,821 | ||||||
| Sodexo | 1,071 | 70,518 | ||||||
| Electrolux AB | 4,750 | 69,833 | ||||||
| Genting Singapore plc* | 59,950 | 69,605 | ||||||
| Luxottica Group SpA | 2,732 | 69,431 | ||||||
| Fairfax Media Ltd. | 88,020 | 69,170 | ||||||
| GKN plc | 25,445 | 69,042 | ||||||
| Publicis Groupe S.A. | 1,650 | 68,861 | ||||||
| Crown Ltd. | 9,038 | 68,847 | ||||||
| Burberry Group plc | 3,794 | 68,829 | ||||||
| Adidas AG | 1,131 | 68,824 | ||||||
| Sky City Entertainment Group Ltd. | 27,188 | 68,799 | ||||||
| Shangri-La Asia Ltd. | 35,970 | 68,772 | ||||||
| Tatts Group Ltd. | 32,142 | 68,763 | ||||||
| Fiat SpA | 12,710 | 68,618 | ||||||
| Wolters Kluwer N.V. | 4,170 | 67,669 | ||||||
| Lifestyle International Holdings Ltd. | 26,470 | 67,154 | ||||||
| SJM Holdings Ltd. | 37,970 | 67,077 | ||||||
| Nokian Renkaat Oyj | 2,230 | 66,758 | ||||||
| Renault S.A. | 1,990 | 65,912 | ||||||
| Daimler AG | 1,480 | 65,818 | ||||||
| Cie Generale des Etablissements Michelin — Class B | 1,100 | 65,785 | ||||||
74 | the RYDEX|SGI equity funds annual report
| SCHEDULE OF INVESTMENTS (continued) | September 30, 2011 |
| Shares | Value | |||||||
| Mediaset SpA | 20,840 | $ | 65,634 | |||||
| Bayerische Motoren Werke AG | 990 | 65,397 | ||||||
| Volkswagen AG | 530 | 65,297 | ||||||
| TABCORP Holdings Ltd. | 26,160 | 64,459 | ||||||
Echo Entertainment Group Ltd.*,† | 18,190 | 64,245 | ||||||
| Autogrill SpA | 6,387 | 64,216 | ||||||
| Societe Television Francaise 1 | 5,131 | 63,785 | ||||||
| Cie Financiere Richemont S.A. | 1,430 | 63,700 | ||||||
| Modern Times Group AB — Class B | 1,590 | 63,696 | ||||||
| Continental AG* | 1,100 | 63,488 | ||||||
| LVMH Moet Hennessy Louis Vuitton S.A. | 480 | 63,357 | ||||||
| PPR | 490 | 63,334 | ||||||
| Swatch Group AG/REG | 1,060 | 63,177 | ||||||
| Christian Dior S.A. | 560 | 62,695 | ||||||
| Sands China Ltd.* | 26,770 | 62,633 | ||||||
| Husqvarna AB — Class B | 15,490 | 62,568 | ||||||
| Mediaset Espana Comunicacion S.A. | 10,990 | 62,471 | ||||||
| Axel Springer AG | 1,811 | 62,328 | ||||||
| Sanoma Oyj | 5,210 | 61,246 | ||||||
| TUI AG* | 11,900 | 61,177 | ||||||
| Accor S.A. | 2,280 | 60,709 | ||||||
| Metropole Television S.A. | 3,732 | 60,505 | ||||||
| Wynn Macau Ltd. | 25,580 | 60,492 | ||||||
| OPAP S.A. | 5,910 | 59,606 | ||||||
| Swatch Group AG/BR | 180 | 59,224 | ||||||
| Pandora A/S | 8,740 | 58,268 | ||||||
| Porsche Automobil Holding SE | 1,221 | 58,155 | ||||||
| Lagardere SCA | 2,330 | 57,229 | ||||||
| Peugeot S.A. | 2,690 | 57,223 | ||||||
| Galaxy Entertainment Group Ltd.* | 34,960 | 50,792 | ||||||
| Esprit Holdings Ltd. | 29,680 | 35,945 | ||||||
Total Consumer Discretionary | 9,742,321 | |||||||
Materials - 10.0% | ||||||||
| Yamato Kogyo Company Ltd. | 3,300 | 86,549 | ||||||
| Air Water, Inc. | 7,000 | 86,517 | ||||||
| Ube Industries Ltd. | 26,000 | 86,399 | ||||||
| Kansai Paint Company Ltd. | 9,000 | 86,239 | ||||||
| Daido Steel Company Ltd. | 14,000 | 83,726 | ||||||
| Maruichi Steel Tube Ltd. | 3,500 | 82,642 | ||||||
| Nippon Paper Group, Inc. | 3,100 | 82,530 | ||||||
| OJI Paper Company Ltd. | 15,000 | 82,267 | ||||||
| Showa Denko K.K. | 41,000 | 80,928 | ||||||
| Sumitomo Metal Industries Ltd. | 38,960 | 80,746 | ||||||
| Hitachi Metals Ltd. | 7,000 | 80,601 | ||||||
| Nippon Steel Corp. | 28,000 | 80,301 | ||||||
| Mitsui Chemicals, Inc. | 24,000 | 80,270 | ||||||
Makhteshim-Agan Industries Ltd.*,† | 14,622 | 80,041 | ||||||
| Daicel Corp. | 14,000 | 79,697 | ||||||
Glencore International plc† | 12,630 | 79,342 | ||||||
| Kaneka Corp. | 14,000 | 79,191 | ||||||
| Nitto Denko Corp. | 2,000 | 78,708 | ||||||
| Shin-Etsu Chemical Company Ltd. | 1,600 | 78,481 | ||||||
| Mitsubishi Chemical Holdings Corp. | 11,490 | 77,918 | ||||||
| Asahi Kasei Corp. | 13,000 | 77,906 | ||||||
| Kuraray Company Ltd. | 5,690 | 77,596 | ||||||
| Toray Industries, Inc. | 11,000 | 77,030 | ||||||
| Novozymes A/S — Class B | 540 | 76,770 | ||||||
| Taiyo Nippon Sanso Corp. | 11,000 | 76,583 | ||||||
| Hitachi Chemical Company Ltd. | 4,600 | 75,939 | ||||||
| JSR Corp. | 4,400 | 75,700 | ||||||
| Toyo Seikan Kaisha Ltd. | 4,990 | 75,512 | ||||||
| Teijin Ltd. | 21,000 | 75,489 | ||||||
| Nisshin Steel Company Ltd. | 42,000 | 74,958 | ||||||
| Amcor Ltd. | 11,208 | 74,196 | ||||||
| Mitsubishi Gas Chemical Company, Inc. | 12,000 | 73,663 | ||||||
| Kobe Steel Ltd. | 43,960 | 73,375 | ||||||
| Sumitomo Chemical Company Ltd. | 19,000 | 73,307 | ||||||
| Randgold Resources Ltd. | 753 | 73,135 | ||||||
| Johnson Matthey plc | 2,970 | 72,795 | ||||||
| Denki Kagaku Kogyo Kabushiki Kaisha | 19,000 | 72,434 | ||||||
| Holmen AB — Class B | 2,880 | 71,522 | ||||||
| UPM-Kymmene Oyj | 6,320 | 71,393 | ||||||
| MacArthur Coal Ltd. | 4,668 | 71,376 | ||||||
| Air Liquide S.A. | 611 | 71,346 | ||||||
| Akzo Nobel N.V. | 1,610 | 71,041 | ||||||
| Sika AG — Class A | 40 | 70,822 | ||||||
| CRH plc ADR | 4,580 | 70,779 | ||||||
| JFE Holdings, Inc. | 3,500 | 70,647 | ||||||
| Holcim Ltd.* | 1,330 | 70,580 | ||||||
| Koninklijke DSM N.V. | 1,620 | 70,431 | ||||||
| Orica Ltd. | 3,132 | 70,284 | ||||||
| Anglo American plc | 2,040 | 70,174 | ||||||
| Fletcher Building Ltd. | 11,996 | 70,154 | ||||||
| Svenska Cellulosa AB — Class B | 5,752 | 70,016 | ||||||
| Linde AG | 520 | 69,579 | ||||||
| Cimpor Cimentos de Portugal SGPS S.A. | 10,344 | 69,072 | ||||||
| HeidelbergCement AG | 1,900 | 69,022 | ||||||
| Mitsubishi Materials Corp. | 28,000 | 68,177 | ||||||
| James Hardie Industries SE* | 12,458 | 68,115 | ||||||
| Eurasian Natural Resources Corp. plc | 7,650 | 67,733 | ||||||
| BASF SE | 1,110 | 67,668 | ||||||
| Syngenta AG* | 260 | 67,566 | ||||||
| Rexam plc | 13,973 | 67,163 | ||||||
| Sumitomo Metal Mining Company Ltd. | 5,000 | 66,197 | ||||||
| Lonmin plc | 4,060 | 65,851 | ||||||
| Stora Enso Oyj | 11,240 | 65,785 | ||||||
| Boral Ltd. | 19,760 | 65,754 | ||||||
| Tosoh Corp. | 20,980 | 65,737 | ||||||
| Lafarge S.A. | 1,910 | 65,641 | ||||||
| BHP Billiton plc | 2,430 | 64,888 | ||||||
| Vedanta Resources plc | 3,820 | 64,867 | ||||||
| Israel Chemicals Ltd.* | 5,393 | 61,379 | ||||||
| Salzgitter AG | 1,320 | 63,347 | ||||||
| Incitec Pivot Ltd. | 20,438 | 63,318 | ||||||
| Acerinox S.A. | 5,610 | 63,040 | ||||||
the RYDEX|SGI equity funds annual report | 75
| SCHEDULE OF INVESTMENTS (continued) | September 30, 2011 |
| Shares | Value | |||||||
| Boliden AB | 6,080 | $ | 62,505 | |||||
| Givaudan S.A.* | 80 | 62,391 | ||||||
| Fresnillo plc | 2,549 | 62,308 | ||||||
| BHP Billiton Ltd. | 1,881 | 62,276 | ||||||
| Solvay S.A. | 660 | 62,143 | ||||||
| Imerys S.A. | 1,240 | 62,026 | ||||||
| Arkema S.A. | 1,060 | 61,380 | ||||||
| Xstrata plc | 4,860 | 61,363 | ||||||
| Voestalpine AG | 2,120 | 61,280 | ||||||
| Lanxess AG | 1,270 | 60,918 | ||||||
| Rio Tinto Ltd. | 1,040 | 60,912 | ||||||
| Umicore S.A. | 1,680 | 60,901 | ||||||
| K+S AG | 1,160 | 60,722 | ||||||
| Israel Corporation Ltd.* | 90 | 57,594 | ||||||
| SSAB AB — Class A | 8,150 | 60,433 | ||||||
| Newcrest Mining Ltd. | 1,833 | 60,414 | ||||||
| Norsk Hydro ASA | 13,270 | 60,185 | ||||||
| BlueScope Steel Ltd. | 86,980 | 59,972 | ||||||
| ArcelorMittal | 3,750 | 59,910 | ||||||
| Rio Tinto plc | 1,350 | 59,852 | ||||||
| ThyssenKrupp AG | 2,410 | 59,214 | ||||||
| Kazakhmys plc | 4,810 | 58,715 | ||||||
| OneSteel Ltd. | 50,000 | 58,593 | ||||||
| Alumina Ltd. | 42,000 | 58,563 | ||||||
Sims Metal Management Ltd.† | 4,704 | 56,442 | ||||||
| Antofagasta plc | 3,943 | 56,263 | ||||||
| OZ Minerals Ltd. | 6,231 | 55,507 | ||||||
| Rautaruukki Oyj | 5,500 | 55,150 | ||||||
| Outokumpu Oyj | 8,400 | 55,115 | ||||||
| Yara International ASA | 1,431 | 54,591 | ||||||
| Eramet | 390 | 53,843 | ||||||
| Iluka Resources Ltd. | 4,458 | 52,176 | ||||||
| Fortescue Metals Group Ltd. | 12,468 | 52,076 | ||||||
| Wacker Chemie AG | 550 | 48,826 | ||||||
| Lynas Corporation Ltd.* | 40,270 | 41,213 | ||||||
Total Materials | 7,325,717 | |||||||
Consumer Staples - 6.9% | ||||||||
| Toyo Suisan Kaisha Ltd. | 4,000 | 109,693 | ||||||
| Japan Tobacco, Inc. | 20 | 93,545 | ||||||
| Kirin Holdings Company Ltd. | 7,000 | 91,555 | ||||||
| Kikkoman Corp. | 8,000 | 91,392 | ||||||
| Yamazaki Baking Company Ltd. | 6,000 | 90,981 | ||||||
| Nippon Meat Packers, Inc. | 7,000 | 90,961 | ||||||
| Yakult Honsha Company Ltd. | 2,800 | 87,357 | ||||||
| Lindt & Spruengli AG | 30 | 87,269 | ||||||
| Seven & I Holdings Company Ltd. | 3,100 | 86,888 | ||||||
| Aeon Company Ltd. | 6,390 | 86,430 | ||||||
| Kao Corp. | 3,100 | 86,343 | ||||||
| Unicharm Corp. | 1,800 | 86,329 | ||||||
| Coca-Cola West Company Ltd. | 4,500 | 86,313 | ||||||
| MEIJI Holdings Company Ltd. | 1,800 | 85,410 | ||||||
| Lawson, Inc. | 1,500 | 84,902 | ||||||
| Nisshin Seifun Group, Inc. | 6,490 | 84,712 | ||||||
| Nissin Foods Holdings Company Ltd. | 2,100 | 84,491 | ||||||
| FamilyMart Company Ltd. | 2,200 | 84,018 | ||||||
| Asahi Group Holdings Ltd. | 3,900 | 82,633 | ||||||
| Ajinomoto Company, Inc. | 6,990 | 82,567 | ||||||
| Shiseido Company Ltd. | 4,200 | 81,448 | ||||||
Distribuidora Internacional de Alimentacion S.A.*,† | 20,330 | 80,944 | ||||||
| Imperial Tobacco Group plc | 2,382 | 80,340 | ||||||
| Koninklijke Ahold N.V. | 6,760 | 79,494 | ||||||
| Associated British Foods plc | 4,545 | 78,164 | ||||||
| WM Morrison Supermarkets plc | 17,014 | 76,676 | ||||||
| Anheuser-Busch InBev N.V. | 1,441 | 76,483 | ||||||
| Tesco plc | 13,035 | 76,334 | ||||||
| Diageo plc | 4,003 | 76,283 | ||||||
| Metro AG | 1,780 | 75,554 | ||||||
| Reckitt Benckiser Group plc | 1,491 | 75,514 | ||||||
Foster’s Group Ltd.† | 14,767 | 75,446 | ||||||
| British American Tobacco plc | 1,772 | 74,800 | ||||||
| Unilever plc | 2,374 | 74,318 | ||||||
| Casino Guichard Perrachon S.A. | 950 | 74,149 | ||||||
| Unilever N.V. — Class B | 2,334 | 73,875 | ||||||
| Heineken Holding N.V. | 1,900 | 73,321 | ||||||
| SABMiller plc | 2,242 | 73,128 | ||||||
Heineken N.V. ADR† | 1,620 | 72,791 | ||||||
| Wesfarmers Ltd. — PPS | 2,360 | 72,605 | ||||||
| Danone | 1,181 | 72,596 | ||||||
| Wesfarmers Ltd. | 2,400 | 72,510 | ||||||
| Metcash Ltd. | 18,180 | 71,661 | ||||||
| Aryzta AG | 1,650 | 71,647 | ||||||
| Wilmar International Ltd. | 18,000 | 71,621 | ||||||
| Parmalat SpA | 33,730 | 71,214 | ||||||
| Coca-Cola Amatil Ltd. | 6,209 | 71,124 | ||||||
| Henkel AG & Company KGaA — Class B | 1,620 | 70,996 | ||||||
| Swedish Match AB | 2,144 | 70,735 | ||||||
Kerry Group plc — Class A† | 2,011 | 70,585 | ||||||
| Pernod-Ricard S.A. | 900 | 70,459 | ||||||
| Beiersdorf AG | 1,311 | 70,147 | ||||||
| Nestle S.A. | 1,271 | 69,972 | ||||||
| J Sainsbury plc | 16,323 | 69,471 | ||||||
| Woolworths Ltd. | 2,892 | 69,104 | ||||||
| Golden Agri-Resources Ltd. | 148,850 | 68,878 | ||||||
| Olam International Ltd. | 39,970 | 68,106 | ||||||
| Delhaize Group S.A. | 1,160 | 67,809 | ||||||
| L’Oreal S.A. | 690 | 67,308 | ||||||
| Jeronimo Martins SGPS S.A. | 4,166 | 65,054 | ||||||
| Carrefour S.A. | 2,850 | 64,897 | ||||||
| Coca Cola Hellenic Bottling Company S.A.* | 3,600 | 63,445 | ||||||
| Carlsberg A — Class B | 1,070 | 63,402 | ||||||
| Suedzucker AG | 2,225 | 63,211 | ||||||
| Colruyt S.A. | 1,521 | 63,184 | ||||||
| Kesko Oyj — Class B | 2,030 | 62,454 | ||||||
Total Consumer Staples | 5,067,046 | |||||||
76 | the RYDEX|SGI equity funds annual report
| SCHEDULE OF INVESTMENTS (continued) | September 30, 2011 |
| Shares | Value | |||||||
Information Technology - 6.6% | ||||||||
| Keyence Corp. | 400 | $ | 109,455 | |||||
| Shimadzu Corp. | 11,000 | 92,784 | ||||||
| NTT Data Corp. | 30 | 92,588 | ||||||
| Foxconn International Holdings Ltd.* | 174,850 | 90,326 | ||||||
| Yokogawa Electric Corp.* | 9,300 | 87,965 | ||||||
| Nomura Research Institute Ltd. | 3,800 | 86,798 | ||||||
| Hitachi High-Technologies Corp. | 4,300 | 86,282 | ||||||
| Itochu Techno-Solutions Corp. | 1,900 | 85,475 | ||||||
| Oracle Corporation Japan | 2,400 | 84,489 | ||||||
| Hirose Electric Company Ltd. | 900 | 83,661 | ||||||
| Hoya Corp. | 3,600 | 83,459 | ||||||
| Rohm Company Ltd. | 1,600 | 83,458 | ||||||
| Otsuka Corp. | 1,200 | 82,712 | ||||||
| Canon, Inc. | 1,800 | 81,726 | ||||||
| Trend Micro, Inc. | 2,600 | 81,310 | ||||||
| Hamamatsu Photonics K.K. | 2,000 | 80,607 | ||||||
| NICE Systems Ltd.* | 2,541 | 76,423 | ||||||
| Gree, Inc. | 2,600 | 79,288 | ||||||
| Neopost S.A. | 1,080 | 79,187 | ||||||
| Citizen Holdings Company Ltd. | 15,890 | 79,114 | ||||||
| Konica Minolta Holdings, Inc. | 11,490 | 78,778 | ||||||
| STMicroelectronics N.V. | 11,990 | 78,352 | ||||||
| Sage Group plc | 19,603 | 77,706 | ||||||
| Yahoo Japan Corp. | 250 | 77,641 | ||||||
| Konami Corp. | 2,300 | 77,210 | ||||||
| ASM Pacific Technology Ltd. | 7,900 | 77,114 | ||||||
| Tokyo Electron Ltd. | 1,700 | 77,107 | ||||||
| ARM Holdings plc | 8,948 | 76,443 | ||||||
| ASML Holding N.V. | 2,202 | 76,137 | ||||||
| Murata Manufacturing Company Ltd. | 1,400 | 76,007 | ||||||
| Autonomy Corp. plc* | 1,908 | 75,451 | ||||||
| Fujitsu Ltd. | 16,000 | 75,449 | ||||||
| United Internet AG | 4,463 | 75,440 | ||||||
| Ricoh Company Ltd. | 9,000 | 75,427 | ||||||
| Kyocera Corp. | 900 | 75,249 | ||||||
| Hitachi Ltd. | 15,000 | 74,456 | ||||||
| FUJIFILM Holdings Corp. | 3,200 | 74,365 | ||||||
| SAP AG | 1,451 | 73,826 | ||||||
| Nintendo Company Ltd. | 500 | 73,464 | ||||||
| Toshiba Corp. | 18,000 | 73,425 | ||||||
| Brother Industries Ltd. | 6,190 | 72,720 | ||||||
| Nippon Electric Glass Company Ltd. | 8,000 | 72,691 | ||||||
| Nokia Oyj | 12,827 | 72,530 | ||||||
| Seiko Epson Corp. | 5,600 | 71,254 | ||||||
| Computershare Ltd. | 9,840 | 70,061 | ||||||
| Dassault Systemes S.A. | 991 | 69,976 | ||||||
| Ibiden Company Ltd. | 3,300 | 69,731 | ||||||
| AtoS | 1,600 | 69,053 | ||||||
| Elpida Memory, Inc.* | 10,900 | 68,171 | ||||||
| Infineon Technologies AG ADR | 9,200 | 67,879 | ||||||
| Yaskawa Electric Corp. | 9,000 | 67,847 | ||||||
| Telefonaktiebolaget LM Ericsson — Class B | 7,000 | 67,195 | ||||||
| Dena Company Ltd. | 1,600 | 67,022 | ||||||
| NEC Corp.* | 32,000 | 65,005 | ||||||
| Omron Corp. | 3,300 | 64,803 | ||||||
| Advantest Corp. | 6,000 | 64,671 | ||||||
| Square Enix Holdings Company Ltd. | 3,590 | 64,641 | ||||||
| Amadeus IT Holding S.A. — Class A | 4,014 | 64,127 | ||||||
| Capital Gemini S.A. — Class B | 1,920 | 63,834 | ||||||
| Indra Sistemas S.A. | 4,431 | 63,699 | ||||||
| Alcatel-Lucent* | 21,730 | 63,003 | ||||||
| TDK Corp. | 1,800 | 62,786 | ||||||
| Hexagon AB — Class B | 4,780 | 62,138 | ||||||
| Sumco Corp.* | 6,400 | 59,763 | ||||||
| Renewable Energy Corp. ASA* | 41,610 | 36,394 | ||||||
Total Information Technology | 4,867,148 | |||||||
Health Care - 5.7% | ||||||||
| Taisho Pharmaceutical Holdings Co. Ltd.* | 1,200 | 98,842 | ||||||
| Hisamitsu Pharmaceutical Company, Inc. | 2,000 | 96,092 | ||||||
| Mitsubishi Tanabe Pharma Corp. | 4,900 | 91,092 | ||||||
| Sonova Holding AG* | 990 | 89,828 | ||||||
| Ono Pharmaceutical Company Ltd. | 1,500 | 89,491 | ||||||
| Kyowa Hakko Kirin Company Ltd. | 8,000 | 89,191 | ||||||
| Medipal Holdings Corp. | 8,790 | 89,029 | ||||||
| Dainippon Sumitomo Pharma Company Ltd. | 8,090 | 88,905 | ||||||
| Suzuken Company Ltd. | 3,300 | 88,753 | ||||||
| Santen Pharmaceutical Company Ltd. | 2,100 | 88,254 | ||||||
| Alfresa Holdings Corp. | 2,100 | 87,795 | ||||||
| Olympus Corp. | 2,800 | 86,413 | ||||||
| Daiichi Sankyo Company Ltd. | 4,100 | 85,465 | ||||||
| Otsuka Holdings Company Ltd. | 3,100 | 84,923 | ||||||
| Elan Corporation plc* | 7,892 | 83,649 | ||||||
| Miraca Holdings, Inc. | 1,900 | 83,507 | ||||||
| Tsumura & Co. | 2,600 | 82,893 | ||||||
| Takeda Pharmaceutical Company Ltd. | 1,700 | 80,623 | ||||||
| Chugai Pharmaceutical Company Ltd. | 4,700 | 79,615 | ||||||
| Astellas Pharma, Inc. | 2,100 | 79,263 | ||||||
| Sysmex Corp. | 2,200 | 79,149 | ||||||
| Fresenius Medical Care AG & Co. KGaA | 1,161 | 78,757 | ||||||
| Terumo Corp. | 1,500 | 78,061 | ||||||
| Lonza Group AG* | 1,290 | 77,728 | ||||||
| Shire plc | 2,484 | 77,415 | ||||||
| Novartis AG | 1,381 | 77,145 | ||||||
| Eisai Company Ltd. | 1,900 | 76,657 | ||||||
| GlaxoSmithKline plc ADR | 3,704 | 76,394 | ||||||
| Ramsay Health Care Ltd. | 4,164 | 76,012 | ||||||
| UCB S.A. | 1,781 | 75,896 | ||||||
| Coloplast A/S — Class B | 521 | 75,071 | ||||||
| AstraZeneca plc | 1,691 | 75,024 | ||||||
| Novo Nordisk A/S — Class B | 750 | 74,795 | ||||||
the RYDEX|SGI equity funds annual report | 77
| SCHEDULE OF INVESTMENTS (continued) | September 30, 2011 |
| Shares | Value | |||||||
| Smith & Nephew plc | 8,302 | $ | 74,671 | |||||
| Roche Holding AG | 461 | 74,457 | ||||||
| Cie Generale d’Optique Essilor International S.A. | 1,021 | 73,419 | ||||||
Synthes, Inc.1 | 451 | 72,987 | ||||||
| Shionogi & Company Ltd. | 4,900 | 72,493 | ||||||
| Grifols S.A.* | 3,885 | 72,445 | ||||||
| CSL Ltd. | 2,541 | 72,132 | ||||||
| Merck KGaA | 880 | 72,076 | ||||||
| William Demant Holding A/S* | 950 | 71,451 | ||||||
| QIAGEN N.V.* | 5,120 | 71,107 | ||||||
| Sanofi | 1,081 | 71,101 | ||||||
| Orion Oyj — Class B | 3,481 | 70,090 | ||||||
| Teva Pharmaceutical Industries Ltd.* | 1,960 | 72,573 | ||||||
| Sonic Healthcare Ltd. | 6,276 | 68,593 | ||||||
| Getinge AB — Class B | 3,132 | 68,325 | ||||||
| Fresenius SE & Company KGaA | 761 | 67,639 | ||||||
| Bayer AG | 1,210 | 66,769 | ||||||
| Straumann Holding AG | 410 | 64,154 | ||||||
| Actelion Ltd.* | 1,890 | 62,789 | ||||||
| Celesio AG | 4,670 | 61,451 | ||||||
| Cochlear Ltd. | 961 | 42,598 | ||||||
Total Health Care | 4,185,047 | |||||||
Utilities - 4.8% | ||||||||
| Toho Gas Company Ltd. | 14,000 | 91,880 | ||||||
| Shikoku Electric Power Company, Inc. | 3,200 | 87,967 | ||||||
| Tokyo Gas Company Ltd. | 18,000 | 83,601 | ||||||
| Osaka Gas Company Ltd. | 20,000 | 83,087 | ||||||
| Electric Power Development Company Ltd. | 2,800 | 82,734 | ||||||
| Chugoku Electric Power Company, Inc. | 4,690 | 82,485 | ||||||
| Tohoku Electric Power Company, Inc. | 5,890 | 81,597 | ||||||
| CLP Holdings Ltd. | 8,990 | 80,993 | ||||||
| Severn Trent plc | 3,333 | 79,573 | ||||||
| United Utilities Group plc | 8,207 | 79,368 | ||||||
| Hokuriku Electric Power Co. | 4,300 | 79,337 | ||||||
| Enel Green Power SpA | 34,600 | 78,825 | ||||||
| Hong Kong & China Gas Company Ltd. | 34,960 | 78,692 | ||||||
| Terna Rete Elettrica Nazionale SpA | 21,200 | 78,611 | ||||||
| National Grid plc | 7,929 | 78,521 | ||||||
| Chubu Electric Power Company, Inc. | 4,190 | 78,470 | ||||||
| E.ON AG | 3,560 | 77,234 | ||||||
| SSE plc | 3,852 | 77,230 | ||||||
| Power Assets Holdings Ltd. | 9,990 | 76,433 | ||||||
| RWE AG | 2,070 | 76,354 | ||||||
| Kansai Electric Power Company, Inc. | 4,400 | 76,033 | ||||||
| Cheung Kong Infrastructure Holdings Ltd. | 13,000 | 75,737 | ||||||
| Kyushu Electric Power Company, Inc. | 4,690 | 75,400 | ||||||
| Contact Energy Ltd.* | 18,168 | 75,045 | ||||||
| Gas Natural SDG S.A. | 4,394 | 74,716 | ||||||
| GDF Suez | 2,501 | 74,305 | ||||||
| Centrica plc | 16,124 | 74,291 | ||||||
| EDP — Energias de Portugal S.A. ADR | 23,991 | 73,888 | ||||||
| Snam Rete Gas SpA | 15,961 | 73,682 | ||||||
| Red Electrica Corp. S.A. | 1,610 | 73,362 | ||||||
| EDF S.A. | 2,530 | 73,267 | ||||||
| Hokkaido Electric Power Company, Inc. | 4,900 | 72,225 | ||||||
| Iberdrola S.A. | 10,682 | 72,216 | ||||||
| Acciona S.A. | 850 | 71,652 | ||||||
| EDP Renovaveis S.A.* | 13,056 | 71,090 | ||||||
| International Power plc ADR | 14,961 | 70,989 | ||||||
| Enel SpA | 15,980 | 70,535 | ||||||
| A2A SpA | 56,600 | 70,408 | ||||||
| SP AusNet | 78,305 | 70,320 | ||||||
| Veolia Environnement S.A. | 4,770 | 69,658 | ||||||
| Enagas S.A. | 3,782 | 69,503 | ||||||
| Fortum Oyj | 2,890 | 68,023 | ||||||
| AGL Energy Ltd. | 4,680 | 64,165 | ||||||
| Suez Environnement Co. | 4,580 | 63,736 | ||||||
| Public Power Corp. S.A. | 7,900 | 62,746 | ||||||
| Verbund AG | 2,051 | 59,025 | ||||||
| Tokyo Electric Power Company, Inc.* | 15,280 | 46,191 | ||||||
Total Utilities | 3,505,200 | |||||||
Energy - 3.7% | ||||||||
| Tullow Oil plc* | 4,770 | 96,384 | ||||||
| TonenGeneral Sekiyu K.K. | 7,000 | 80,428 | ||||||
| Cosmo Oil Company Ltd. | 31,000 | 76,723 | ||||||
| Royal Dutch Shell plc | 2,430 | 75,600 | ||||||
| Royal Dutch Shell plc — Class A | 2,440 | 75,380 | ||||||
| Repsol YPF S.A. | 2,850 | 75,232 | ||||||
| Essar Energy plc* | 19,420 | 75,228 | ||||||
| BG Group plc | 3,872 | 74,066 | ||||||
| BP plc | 12,330 | 73,908 | ||||||
| Galp Energia SGPS S.A. — Class B | 4,003 | 73,099 | ||||||
| JX Holdings, Inc. | 12,990 | 72,904 | ||||||
| Japan Petroleum Exploration Co. | 2,000 | 72,695 | ||||||
| Petrofac Ltd. | 3,880 | 71,701 | ||||||
| Idemitsu Kosan Company Ltd. | 800 | 71,661 | ||||||
| Total S.A. | 1,620 | 71,469 | ||||||
| AMEC plc | 5,610 | 70,734 | ||||||
| ENI SpA — Class Preference | 4,010 | 70,543 | ||||||
| Showa Shell Sekiyu K.K. | 9,890 | 70,445 | ||||||
| Statoil ASA | 3,282 | 70,421 | ||||||
| Transocean Ltd. | 1,450 | 69,911 | ||||||
| Fugro N.V. | 1,370 | 69,087 | ||||||
| Seadrill Ltd. | 2,501 | 69,065 | ||||||
| Cairn Energy plc* | 15,910 | 68,969 | ||||||
| WorleyParsons Ltd. | 2,761 | 68,887 | ||||||
| SBM Offshore N.V. | 3,930 | 68,111 | ||||||
| Santos Ltd. | 6,230 | 67,419 | ||||||
| 78 | the RYDEX|SGI equity funds annual report | See Notes to Financial Statements. |
| SCHEDULE OF INVESTMENTS (continued) | September 30, 2011 |
| Shares | Value | |||||||
| Caltex Australia Ltd. | 6,530 | $ | 67,297 | |||||
| Origin Energy Ltd. | 5,222 | 66,816 | ||||||
| Technip S.A. | 830 | 66,493 | ||||||
| Subsea 7 S.A.* | 3,501 | 66,150 | ||||||
| Saipem SpA | 1,830 | 64,225 | ||||||
| Neste Oil Oyj | 7,350 | 63,784 | ||||||
| Woodside Petroleum Ltd. | 2,050 | 63,512 | ||||||
| Tenaris S.A. | 4,890 | 61,594 | ||||||
| Inpex Corp. | 10 | 61,407 | ||||||
| OMV AG | 2,042 | 60,780 | ||||||
| Cie Generale de Geophysique — Veritas* | 3,310 | 58,297 | ||||||
| Aker Solutions ASA | 6,070 | 58,144 | ||||||
| Paladin Energy Ltd.* | 34,190 | 39,232 | ||||||
| John Wood Group plc | 47 | 384 | ||||||
Kvaerner ASA*,† | 28 | 37 | ||||||
Total Energy | 2,698,222 | |||||||
Telecommunication Services - 3.4% | ||||||||
| Nippon Telegraph & Telephone Corp. | 1,800 | 86,229 | ||||||
| Inmarsat plc | 10,570 | 80,471 | ||||||
| BT Group plc | 29,590 | 79,256 | ||||||
| Vodafone Group plc | 29,461 | 75,897 | ||||||
| Elisa Oyj | 3,664 | 74,897 | ||||||
| Singapore Telecommunications Ltd. | 30,970 | 74,648 | ||||||
| StarHub Ltd. | 33,960 | 73,810 | ||||||
| Cellcom Israel Ltd.* | 3,540 | 72,225 | ||||||
| Koninklijke KPN N.V. | 5,586 | 73,569 | ||||||
| TDC A/S | 8,990 | 73,439 | ||||||
| Swisscom AG | 180 | 73,230 | ||||||
| Telefonica S.A. | 3,811 | 73,033 | ||||||
| Telenor ASA | 4,726 | 72,886 | ||||||
| NTT DoCoMo, Inc. | 40 | 72,877 | ||||||
| Iliad S.A. | 651 | 72,722 | ||||||
| Belgacom S.A. | 2,392 | 71,985 | ||||||
| Telecom Italia SpA — Savings Shares | 73,860 | 71,827 | ||||||
| TeliaSonera AB ADR | 10,849 | 71,507 | ||||||
| Telstra Corporation Ltd. | 23,976 | 71,401 | ||||||
| Telekom Austria AG ADR | 7,062 | 71,269 | ||||||
| Telecom Italia SpA | 65,100 | 70,728 | ||||||
| Softbank Corp. | 2,400 | 70,220 | ||||||
| Millicom International Cellular S.A. | 701 | 69,836 | ||||||
| PCCW Ltd. | 186,790 | 69,471 | ||||||
| Mobistar S.A. | 1,211 | 69,128 | ||||||
| KDDI Corp. | 10 | 68,839 | ||||||
| Tele2 AB — Class B | 3,787 | 68,573 | ||||||
| Vivendi S.A. | 3,350 | 68,202 | ||||||
| Portugal Telecom SGPS S.A. | 9,280 | 68,176 | ||||||
| Partner Communications Company Ltd.* | 7,010 | 66,385 | ||||||
| France Telecom S.A. | 4,130 | 67,591 | ||||||
| Bezeq The Israeli Telecommunication Corporation Ltd.* | 35,016 | 65,478 | ||||||
| Telecom Corporation of New Zealand Ltd. | 33,492 | 66,567 | ||||||
| Deutsche Telekom AG | 5,595 | 65,670 | ||||||
| Hellenic Telecommunications Organization S.A. | 11,980 | 50,921 | ||||||
Total Telecommunication Services | 2,492,963 | |||||||
Total Common Stocks (Cost $84,204,916) | 68,032,531 | |||||||
PREFERRED STOCKS†† - 0.5% | ||||||||
| RWE AG | 2,280 | 78,820 | ||||||
| ProSiebenSat.1 Media AG | 4,260 | 74,901 | ||||||
| Bayerische Motoren Werke AG | 1,540 | 72,234 | ||||||
| Henkel AG & Company KGaA | 1,320 | 70,183 | ||||||
| Volkswagen AG | 480 | 63,341 | ||||||
Total Preferred Stocks (Cost $453,661) | 359,479 | |||||||
RIGHTS†† - 0.0% | ||||||||
| Banco Bilbao Vizcaya Argentaria S.A.* | ||||||||
| Expires 10/01/11 | 8,850 | 1,304 | ||||||
| CaixaBank* | ||||||||
| Expires 10/13/11 | 15,250 | 1,246 | ||||||
| Eurazeo* | ||||||||
| Expires 12/30/11 | 20 | 27 | ||||||
Total Rights (Cost $32) | 2,577 | |||||||
EXCHANGE TRADED FUNDS† - 4.9% | ||||||||
| iShares MSCI EAFE Index Fund | 61,140 | 2,919,435 | ||||||
| iShares MSCI Japan Index Fund | 59,800 | 565,708 | ||||||
| iShares MSCI Singapore Index Fund | 4,970 | 54,670 | ||||||
| iShares MSCI Hong Kong Index Fund | 3,580 | 51,337 | ||||||
Total Exchange Traded Funds (Cost $4,281,166) | 3,591,150 | |||||||
SHORT TERM INVESTMENTS†† - 1.7% | ||||||||
| State Street General Account U.S. Government Fund | 1,204,333 | 1,204,333 | ||||||
Total Short Term Investments (Cost $1,204,333) | 1,204,333 | |||||||
Total Investments - 99.7% (Cost $90,144,108) | $ | 73,190,070 | ||||||
Cash & Other Assets, Less Liabilities - 0.3% | 242,760 | |||||||
Total Net Assets - 100.0% | $ | 73,432,830 | ||||||
| See Notes to Financial Statements. | the RYDEX|SGI equity funds annual report | 79 |
| SCHEDULE OF INVESTMENTS (concluded) | September 30, 2011 |
the market value of Common Stocks.
| * | Non-income producing security. | |
| † | Value determined based on Level 1 inputs — See Note 4. | |
| †† | Value determined based on Level 2 inputs — See Note 4. | |
| 1 | Security is a 144A or Section 4(2) security. The total market value of 144A or Section 4(2) securities is $72,987 (cost $75,313), or 0.1% of total net assets. | |
| ADR — American Depositary Receipt | ||
| plc — Public Limited Company | ||
| REIT — Real Estate Investment Trust |
| 80 | the RYDEX|SGI equity funds annual report | See Notes to Financial Statements. |
Assets: | ||||
| Investments, at value (cost $90,144,108) | $ | 73,190,070 | ||
| Foreign currency, at value (cost $21,150) | 14,358 | |||
| Cash | 242 | |||
| Prepaid expenses | 42,235 | |||
| Receivables: | ||||
| Dividends | 295,922 | |||
| Foreign taxes reclaim | 41,006 | |||
| Investment advisor | 25,388 | |||
| Fund shares sold | 16,564 | |||
Total assets | 73,625,785 | |||
Liabilities: | ||||
| Payable for: | ||||
| Management fees | 43,715 | |||
| Fund shares redeemed | 41,823 | |||
| Custodian fees | 24,707 | |||
| Professional fees | 19,741 | |||
| Distribution and service fees | 16,881 | |||
| Transfer agent/maintenance fees | 10,598 | |||
| Fund accounting/administration fees | 9,367 | |||
| Directors’ fees* | 446 | |||
| Miscellaneous | 25,677 | |||
Total liabilities | 192,955 | |||
Net Assets | $ | 73,432,830 | ||
Net Assets Consist Of: | ||||
| Paid in capital | $ | 114,269,030 | ||
| Accumulated net investment loss | (281,821 | ) | ||
| Accumulated net realized loss on investments and foreign currency | (23,593,549 | ) | ||
| Net unrealized depreciation on investments and foreign currency | (16,960,830 | ) | ||
| Net assets | $ | 73,432,830 | ||
A-Class: | ||||
| Net assets | $ | 65,573,376 | ||
| Capital shares outstanding | 6,762,710 | |||
| Net asset value per share | $ | 9.70 | ||
| Maximum offering price per share (Net asset value divided by 95.25%) | $ | 10.18 | ||
B-Class: | ||||
| Net assets | $ | 4,147,954 | ||
| Capital shares outstanding | 490,473 | |||
| Net asset value per share | $ | 8.46 | ||
C-Class: | ||||
| Net assets | $ | 3,426,020 | ||
| Capital shares outstanding | 411,183 | |||
| Net asset value per share | $ | 8.33 | ||
Institutional Class: | ||||
| Net assets | $ | 285,480 | ||
| Capital shares outstanding | 29,426 | |||
| Net asset value per share | $ | 9.70 | ||
Investment Income: | ||||
| Dividends (net of foreign withholding tax of $207,613) | $ | 2,025,164 | ||
| Total investment income | 2,025,164 | |||
Expenses: | ||||
| Management fees | 807,696 | |||
| Transfer agent/maintenance fees | 208,668 | |||
| Distribution and service fees: | ||||
| A-Class | 202,576 | |||
| C-Class | 43,945 | |||
| Fund accounting/administration fees | 137,401 | |||
| Custodian fees | 149,096 | |||
| Directors’ fees* | 5,206 | |||
| Miscellaneous | 159,980 | |||
| Total expenses | 1,714,568 | |||
| Less: | ||||
| Expenses waived by advisor | (26,732 | ) | ||
| Net expenses | 1,687,836 | |||
| Net investment income | 337,328 | |||
Net Realized And Unrealized Gain (Loss): | ||||
| Net realized gain (loss) on: | ||||
| Investments | 19,293,911 | |||
| Futures contracts | 530,374 | |||
| Foreign currency | (258,603 | ) | ||
| Net realized gain | 19,565,682 | |||
| Net change in unrealized appreciation (depreciation) on: | ||||
| Investments | (24,782,002 | ) | ||
| Foreign currency | (12,406 | ) | ||
| Net change in unrealized appreciation (depreciation) | (24,794,408 | ) | ||
| Net realized and unrealized loss | (5,228,726 | ) | ||
Net decrease in net assets resulting from operations | $ | (4,891,398 | ) | |
| * | Relates to Directors not deemed “interested persons” within the meaning of Section 2(a)(19) of the 1940 Act. |
| See Notes to Financial Statements. | the RYDEX|SGI equity funds annual report | 81 |
| Year Ended | Year Ended | |||||||
| September 30, | September 30, | |||||||
| 2011 | 2010 | |||||||
Increase (Decrease) In Net Assets From Operations: | ||||||||
| Net investment income | $ | 337,328 | $ | 223,151 | ||||
| Net realized gain on investments and foreign currency | 19,565,682 | 11,793,752 | ||||||
| Net change in unrealized appreciation (depreciation) on investments and foreign currency | (24,794,408 | ) | (6,398,467 | ) | ||||
| Net increase (decrease) in net assets resulting from operations | (4,891,398 | ) | 5,618,436 | |||||
Distributions to shareholders from: | ||||||||
| Net investment income | ||||||||
| A-Class | (428,482 | ) | — | |||||
| B-Class | (59,809 | ) | — | |||||
| Total distributions to shareholders | (488,291 | ) | — | |||||
Capital share transactions: | ||||||||
| Proceeds from sale of shares | ||||||||
| A-Class | 11,944,041 | 20,592,616 | ||||||
| B-Class | 358,374 | 826,631 | ||||||
| C-Class | 541,059 | 439,496 | ||||||
| Institutional Class* | 1,599,376 | — | ||||||
| Distributions reinvested | ||||||||
| A-Class | 424,001 | — | ||||||
| B-Class | 59,500 | — | ||||||
| Cost of shares redeemed | ||||||||
| A-Class | (20,083,005 | ) | (44,556,043 | ) | ||||
| B-Class | (2,876,923 | ) | (5,667,547 | ) | ||||
| C-Class | (1,159,828 | ) | (1,186,786 | ) | ||||
| Institutional Class* | (1,258,878 | ) | — | |||||
| Net decrease from capital share transactions | (10,452,283 | ) | (29,551,633 | ) | ||||
| Net decrease in net assets | (15,831,972 | ) | (23,933,197 | ) | ||||
Net assets: | ||||||||
| Beginning of year | 89,264,802 | 113,197,999 | ||||||
| End of year | $ | 73,432,830 | $ | 89,264,802 | ||||
| Accumulated net investment loss at end of year | $ | (281,821 | ) | $ | (426,190 | ) | ||
Capital share activity: | ||||||||
| Shares sold | ||||||||
| A-Class | 1,048,009 | 2,066,878 | ||||||
| B-Class | 35,602 | 93,747 | ||||||
| C-Class | 53,801 | 50,022 | ||||||
| Institutional Class* | 150,654 | — | ||||||
| Shares issued from reinvestment of distributions | ||||||||
| A-Class | 36,520 | — | ||||||
| B-Class | 5,885 | — | ||||||
| Shares redeemed | ||||||||
| A-Class | (1,754,360 | ) | (4,379,932 | ) | ||||
| B-Class | (287,631 | ) | (640,990 | ) | ||||
| C-Class | (116,514 | ) | (135,076 | ) | ||||
| Institutional Class* | (121,228 | ) | — | |||||
| Net decrease in shares | (949,262 | ) | (2,945,351 | ) | ||||
| * | Since commencement of operations: May 2, 2011. |
| 82 | the RYDEX|SGI equity funds annual report | See Notes to Financial Statements. |
| Year Ended | Year Ended | Year Ended | Year Ended | Year Ended | ||||||||||||||||
| September 30, | September 30, | September 30, | September 30, | September 30, | ||||||||||||||||
| A-Class | 2011 | 2010 | 2009 | 2008 | 2007f | |||||||||||||||
Per Share Data | ||||||||||||||||||||
| Net asset value, beginning of period | $ | 10.52 | $ | 9.97 | $ | 10.35 | $ | 20.69 | $ | 19.65 | ||||||||||
| Income (loss) from investment operations: | ||||||||||||||||||||
Net investment incomea | .05 | .02 | .05 | .05 | .06 | |||||||||||||||
| Net gain (loss) on investments (realized and unrealized) | (.81 | ) | .53 | (.35 | ) | (3.63 | ) | 3.60 | ||||||||||||
| Total from investment operations | (.76 | ) | .55 | (.30 | ) | (3.58 | ) | 3.66 | ||||||||||||
| Less distributions from: | ||||||||||||||||||||
| Net investment income | (.06 | ) | — | (.02 | ) | (.04 | ) | — | ||||||||||||
| Net realized gains | — | — | — | (6.72 | ) | (2.62 | ) | |||||||||||||
| Return of capital | — | — | (.06 | ) | — | — | ||||||||||||||
| Total distributions | (.06 | ) | — | (.08 | ) | (6.76 | ) | (2.62 | ) | |||||||||||
| Net asset value, end of period | $ | 9.70 | $ | 10.52 | $ | 9.97 | $ | 10.35 | $ | 20.69 | ||||||||||
Total Returnb | (7.32 | %) | 5.52 | % | (2.71 | %) | (25.16 | %) | 20.07 | % | ||||||||||
Ratios/Supplemental Data | ||||||||||||||||||||
| Net assets, end of period (in thousands) | $ | 65,573 | $ | 78,201 | $ | 97,205 | $ | 88,782 | $ | 145,158 | ||||||||||
| Ratios to average net assets: | ||||||||||||||||||||
| Net investment income | 0.40 | % | 0.24 | % | 0.63 | % | 0.33 | % | 0.29 | % | ||||||||||
| Total expenses | 1.85 | % | 1.86 | % | 1.89 | % | 1.73 | % | 1.69 | % | ||||||||||
Net expensesc | 1.82 | % | 1.86 | % | 1.89 | % | 1.73 | % | 1.69 | % | ||||||||||
| Portfolio turnover rate | 206 | % | 288 | % | 368 | % | 280 | %g | 162 | %g | ||||||||||
| Year Ended | Year Ended | Year Ended | Year Ended | Year Ended | ||||||||||||||||
| September 30, | September 30, | September 30, | September 30, | September 30, | ||||||||||||||||
| B-Class | 2011d | 2010d | 2009d | 2008d | 2007d,f | |||||||||||||||
Per Share Data | ||||||||||||||||||||
| Net asset value, beginning of period | $ | 9.19 | $ | 8.69 | $ | 9.05 | $ | 18.96 | $ | 18.17 | ||||||||||
| Income (loss) from investment operations: | ||||||||||||||||||||
Net investment incomea | .05 | .04 | .07 | .07 | .09 | |||||||||||||||
| Net gain (loss) on investments (realized and unrealized) | (.69 | ) | .46 | (.32 | ) | (3.17 | ) | 3.32 | ||||||||||||
| Total from investment operations | (.64 | ) | .50 | (.25 | ) | (3.10 | ) | 3.41 | ||||||||||||
| Less distributions from: | ||||||||||||||||||||
| Net investment income | (.09 | ) | — | (.04 | ) | (.09 | ) | — | ||||||||||||
| Net realized gains | — | — | — | (6.72 | ) | (2.62 | ) | |||||||||||||
| Return of capital | — | — | (.07 | ) | — | — | ||||||||||||||
| Total distributions | (.09 | ) | — | (.11 | ) | (6.81 | ) | (2,62 | ) | |||||||||||
| Net asset value, end of period | $ | 8.46 | $ | 9.19 | $ | 8.69 | $ | 9.05 | $ | 18.96 | ||||||||||
Total Returnb | (7.13 | %) | 5.75 | % | (2.45 | %) | (24.91 | %) | 20.36 | % | ||||||||||
Ratios/Supplemental Data | ||||||||||||||||||||
| Net assets, end of period (in thousands) | $ | 4,148 | $ | 6,769 | $ | 11,155 | $ | 15,303 | $ | 29,659 | ||||||||||
| Ratios to average net assets: | ||||||||||||||||||||
| Net investment income | 0.53 | % | 0.45 | % | 0.90 | % | 0.55 | % | 0.50 | % | ||||||||||
| Total expenses | 1.61 | % | 1.61 | % | 1.65 | % | 1.48 | % | 1.44 | % | ||||||||||
Net expensesc | 1.59 | % | 1.61 | % | 1.65 | % | 1.48 | % | 1.44 | % | ||||||||||
| Portfolio turnover rate | 206 | % | 288 | % | 368 | % | 280 | %g | 162 | %g | ||||||||||
| See Notes to Financial Statements. | the RYDEX|SGI equity funds annual report | 83 |
| Year Ended | Year Ended | Year Ended | Year Ended | Year Ended | ||||||||||||||||
| September 30, | September 30, | September 30, | September 30, | September 30, | ||||||||||||||||
| C-Class | 2011 | 2010 | 2009 | 2008 | 2007f | |||||||||||||||
Per Share Data | ||||||||||||||||||||
| Net asset value, beginning of period | $ | 9.06 | $ | 8.66 | $ | 9.04 | $ | 19.00 | $ | 18.37 | ||||||||||
| Income (loss) from investment operations: | ||||||||||||||||||||
Net investment lossa | (.04 | ) | (.04 | ) | (.01 | ) | (.05 | ) | (.09 | ) | ||||||||||
| Net gain (loss) on investments (realized and unrealized) | (.69 | ) | .44 | (.31 | ) | (3.18 | ) | 3.34 | ||||||||||||
| Total from investment operations | (.73 | ) | .40 | (.32 | ) | (3.23 | ) | 3.25 | ||||||||||||
| Less distributions from: | ||||||||||||||||||||
| Net realized gains | — | — | — | (6.73 | ) | (2.62 | ) | |||||||||||||
| Return of capital | — | — | (.06 | ) | — | — | ||||||||||||||
| Total distributions | — | — | (.06 | ) | (6.73 | ) | (2.62 | ) | ||||||||||||
| Net asset value, end of period | $ | 8.33 | $ | 9.06 | $ | 8.66 | $ | 9.04 | $ | 19.00 | ||||||||||
Total Returnb | (8.06 | %) | 4.62 | % | (3.39 | %) | (25.69 | %) | 19.14 | % | ||||||||||
Ratios/Supplemental Data | ||||||||||||||||||||
| Net assets, end of period (in thousands) | $ | 3,426 | $ | 4,295 | $ | 4,838 | $ | 7,866 | $ | 12,449 | ||||||||||
| Ratios to average net assets: | ||||||||||||||||||||
| Net investment loss | (0.37 | %) | (0.50 | %) | (0.11 | %) | (0.44 | %) | (0.48 | %) | ||||||||||
| Total expenses | 2.60 | % | 2.62 | % | 2.65 | % | 2.49 | % | 2.44 | % | ||||||||||
Net expensesc | 2.58 | % | 2.62 | % | 2.65 | % | 2.49 | % | 2.44 | % | ||||||||||
| Portfolio turnover rate | 206 | % | 288 | % | 368 | % | 280 | %g | 162 | %g | ||||||||||
| Year Ended | ||||
| September 30, | ||||
| Institutional Class | 2011e | |||
Per Share Data | ||||
| Net asset value, beginning of period | $ | 12.37 | ||
| Income (loss) from investment operations: | ||||
Net investment incomea | .13 | |||
| Net loss on investments (realized and unrealized) | (2.80 | ) | ||
| Total from investment operations | (2.67 | ) | ||
| Net asset value, end of period | $ | 9.70 | ||
Total Returnb | (21.58 | %) | ||
Ratios/Supplemental Data | ||||
| Net assets, end of period (in thousands) | $ | 285 | ||
| Ratios to average net assets: | ||||
| Net investment income | 2.99 | % | ||
| Total expenses | 2.27 | % | ||
Net expensesc | 1.36 | % | ||
| Portfolio turnover rate | 206 | % | ||
| a | Net investment income (loss) per share was computed using average shares outstanding throughout the period. | |
| b | Total return does not reflect the impact of any applicable sales charges and has not been annualized. | |
| c | Net expense information reflects the expense ratios after expense waivers and reimbursements, as applicable. | |
| d | Effective August 25, 2005, B-Class shares ceased charging 12b-1 fees in accordance with FINRA sales cap regulations. Per share information reflects this change. This fee will be reinstated when sales exceed the sales cap limit. | |
| e | Since commencement of operations: May 2, 2011 — percentage amounts for the period, except total return and portfolio turnover rate, have been annualized. | |
| f | Security Global Investors, LLC (“SGI”) became the sub-advisor of the fund effective August 1, 2007. | |
| g | Significant variation in the portfolio turnover is due to the re-alignment of the Fund’s portfolio following the appointment of SGI as sub-advisor. |
| 84 | the RYDEX|SGI equity funds annual report | See Notes to Financial Statements. |
| MANAGERS’ COMMENTARY (Unaudited) | September 30, 2011 |
| Advised by: | | and Subadvised by: |  |
Consumer Discretionary positions that contributed to performance were long positions in Limited Brands, Inc. and Ross Stores, Inc.
(Mainstream Investment Advisers)
(Mainstream Investment Advisers)
Rydex|SGI
Rydex|SGI
Rydex|SGI
Rydex|SGI
| 1 | Performance figures are based on A-Class shares and do not reflect deduction of the sales charges or taxes that a shareholder would pay on distributions or the redemption of shares. Fee waivers and/or reimbursements reduce Fund expenses and, in the absence of such waivers, the performance quoted would be reduced. |
| PERFORMANCE REPORT AND FUND PROFILE (Unaudited) | September 30, 2011 |
% of Net Assets)
| ** | Substantially all of the short holdings were fair valued by the Valuation Committee at September 30, 2011 due to exposure to LBIE — See Note 9. The total market value of fair valued securities amounts to (73%) of total net assets. |
Periods Ended 9/30/11
| Since | ||||||||||||
| Inception | ||||||||||||
| 1 Year | 5 Year | (07/07/03) | ||||||||||
| A-Class | 1.13 | % | 2.13 | % | 6.38 | % | ||||||
A-Class with sales charge† | -4.66 | % | 0.93 | % | 5.62 | % | ||||||
| B-Class | 0.44 | % | 1.34 | % | 5.58 | % | ||||||
B-Class with CDSC†† | -4.56 | % | 1.05 | % | 5.58 | % | ||||||
| C-Class | 0.44 | % | 1.34 | % | 5.56 | % | ||||||
C-Class with CDSC††† | -0.56 | % | 1.34 | % | 5.56 | % | ||||||
| S&P 500 Index | 1.14 | % | -1.18 | % | 3.51 | % | ||||||
| Since | ||||||||
| Inception | ||||||||
| 1 Year | (11/07/08) | |||||||
| Institutional Class | 1.50 | % | 11.00 | % | ||||
| S&P 500 Index | 1.14 | % | 9.35 | % | ||||
| Inception Dates: | ||
| A-Class | July 7, 2003 | |
| B-Class | July 7, 2003 | |
| C-Class | July 7, 2003 | |
| Institutional Class | November 7, 2008 | |
| Ten Largest Holdings (% of Total Net Assets) | ||||
| Philip Morris International, Inc. | 6.9 | % | ||
| Johnson & Johnson | 5.3 | % | ||
| Altria Group, Inc. | 4.5 | % | ||
| Shanda Interactive Entertainment Ltd. ADR | 4.4 | % | ||
| Herbalife Ltd. | 3.2 | % | ||
| AT&T, Inc. | 3.0 | % | ||
| Joy Global, Inc. | 2.8 | % | ||
| Lockheed Martin Corp. | 2.7 | % | ||
| CA, Inc. | 2.7 | % | ||
| Trinity Industries, Inc. | 2.2 | % | ||
| Top Ten Total | 37.7 | % | ||
| * | The performance data above represents past performance that is not predictive of future results. The investment return and principal value of an investment in the Fund will fluctuate so that an investor’s shares, when redeemed, may be worth more or less than their original cost. Returns are historical and include changes in principal and reinvested dividends and capital gains and do not reflect the effect of taxes. The S&P 500 Index is an unmanaged index and, unlike the Fund, has no management fees or operating expenses to reduce its reported return. | |
| † | Effective February 22, 2011, the maximum sales charge decreased from 5.75% to 4.75%. A 5.75% maximum sales charge is used in the calculation of the 1 Year, 5 Year and 10 Year Average Annual Returns (based on subscriptions made prior to February 22, 2011), and a 4.75% maximum sales charge will be used to calculate performance for periods based on subscriptions made on or after February 22, 2011. | |
| †† | Fund returns include a CDSC of up to 5% if redeemed within 5 years of purchase. | |
| ††† | Fund returns include a CDSC of 1% if redeemed within 12 months of purchase. |
| SCHEDULE OF INVESTMENTS | September 30, 2011 |
| Shares | Value | |||||||
COMMON STOCKS† - 101.5% | ||||||||
Consumer Staples - 23.6% | ||||||||
Philip Morris International, Inc.1,2 | 11,007 | $ | 686,617 | |||||
Altria Group, Inc.1,2 | 16,700 | 447,727 | ||||||
Herbalife Ltd.1,2 | 5,965 | 319,724 | ||||||
| Procter & Gamble Co. | 3,273 | 206,788 | ||||||
Wal-Mart Stores, Inc.1,2 | 2,200 | 114,180 | ||||||
| Clorox Co. | 1,655 | 109,776 | ||||||
| Unilever plc ADR | 3,186 | 99,371 | ||||||
Safeway, Inc.1,2 | 3,900 | 64,857 | ||||||
| CVS Caremark Corp. | 1,931 | 64,843 | ||||||
| Corn Products International, Inc. | 1,593 | 62,509 | ||||||
| Darling International, Inc. | 3,448 | 43,410 | ||||||
| Cia de Bebidas das Americas ADR | 1,015 | 31,110 | ||||||
| Brown-Forman Corp. — Class B | 433 | 30,371 | ||||||
| Colgate-Palmolive Co. | 276 | 24,476 | ||||||
| Smithfield Foods, Inc. | 965 | 18,817 | ||||||
| British American Tobacco plc ADR | 171 | 14,489 | ||||||
| Kraft Foods, Inc. — Class A | 276 | 9,268 | ||||||
| Omega Protein Corp.* | 1,000 | 9,080 | ||||||
| HJ Heinz Co. | 158 | 7,976 | ||||||
Total Consumer Staples | 2,365,389 | |||||||
Industrials - 16.7% | ||||||||
Joy Global, Inc.1,2 | 4,500 | 280,710 | ||||||
Lockheed Martin Corp.1,2 | 3,753 | 272,618 | ||||||
Trinity Industries, Inc.1,2 | 10,200 | 218,382 | ||||||
AO Smith Corp.1,2 | 4,200 | 134,526 | ||||||
Towers Watson & Co. — Class A1,2 | 2,200 | 131,516 | ||||||
General Electric Co.1,2 | 7,194 | 109,636 | ||||||
| Kirby Corp.* | 1,434 | 75,486 | ||||||
Watts Water Technologies, Inc. — Class A1,2 | 2,800 | 74,620 | ||||||
Northrop Grumman Corp.1,2 | 1,100 | 57,376 | ||||||
| Boeing Co. | 827 | 50,042 | ||||||
| MasTec, Inc.* | 2,482 | 43,708 | ||||||
| Danaher Corp. | 965 | 40,472 | ||||||
| 3M Co. | 552 | 39,628 | ||||||
| Polypore International, Inc. | 689 | 38,942 | ||||||
Con-way, Inc.1,2 | 1,700 | 37,621 | ||||||
| Wesco Aircraft Holdings, Inc. | 2,502 | 27,347 | ||||||
| Waste Connections, Inc. | 552 | 18,669 | ||||||
| Chart Industries, Inc. | 178 | 7,506 | ||||||
| Thermon Group Holdings, Inc.* | 513 | 7,090 | ||||||
Huntington Ingalls Industries, Inc.1,2 | 183 | 4,452 | ||||||
Total Industrials | 1,670,347 | |||||||
Consumer Discretionary - 15.3% | ||||||||
TJX Companies, Inc.1,2 | 3,600 | 199,692 | ||||||
Limited Brands, Inc.1,2 | 5,100 | 196,401 | ||||||
Family Dollar Stores, Inc.1,2 | 3,700 | 188,182 | ||||||
Ross Stores, Inc.1,2 | 2,100 | 165,249 | ||||||
Walt Disney Co.1,2 | 4,024 | 121,364 | ||||||
The Gap, Inc.1,2 | 6,000 | 97,440 | ||||||
| Wynn Resorts Ltd. | 830 | 95,516 | ||||||
Jack in the Box, Inc.*,1,2 | 4,000 | 79,680 | ||||||
| Mattel, Inc. | 2,901 | 75,107 | ||||||
RadioShack Corp.1,2 | 5,100 | 59,262 | ||||||
| Lululemon Athletica, Inc. | 1,026 | 49,915 | ||||||
PVH Corp.1,2 | 800 | 46,592 | ||||||
| Tupperware Brands Corp. | 827 | 44,443 | ||||||
| Expedia, Inc. | 1,517 | 39,063 | ||||||
| Priceline.com, Inc.* | 79 | 35,507 | ||||||
| Target Corp. | 414 | 20,303 | ||||||
| Lithia Motors, Inc. — Class A | 827 | 11,892 | ||||||
| Perfumania Holdings, Inc. | 527 | 7,494 | ||||||
Total Consumer Discretionary | 1,533,102 | |||||||
Health Care - 15.1% | ||||||||
Johnson & Johnson1,2 | 8,281 | 527,582 | ||||||
Viropharma, Inc.*,1,2 | 9,900 | 178,893 | ||||||
Life Technologies Corp.*,1,2 | 2,800 | 107,604 | ||||||
Forest Laboratories, Inc.*,1,2 | 3,400 | 104,686 | ||||||
Baxter International, Inc.1,2 | 1,800 | 101,052 | ||||||
Amgen, Inc.1,2 | 1,800 | 98,910 | ||||||
WellCare Health Plans, Inc.*,1,2 | 2,300 | 87,354 | ||||||
Lincare Holdings, Inc.1,2 | 3,800 | 85,500 | ||||||
Owens & Minor, Inc.1,2 | 2,700 | 76,896 | ||||||
Charles River Laboratories International, Inc. ADR1,2 | 2,000 | 57,240 | ||||||
| athenahealth, Inc.* | 827 | 49,248 | ||||||
Kindred Healthcare, Inc.*,1,2 | 3,900 | 33,618 | ||||||
Total Health Care | 1,508,583 | |||||||
Information Technology - 12.6% | ||||||||
Shanda Interactive Entertainment Ltd. ADR*,1,2 | 15,100 | 446,054 | ||||||
CA, Inc.1,2 | 14,000 | 271,740 | ||||||
Symantec Corp.*,1,2 | 5,900 | 96,170 | ||||||
Avnet, Inc.*,1,2 | 3,100 | 80,848 | ||||||
Arrow Electronics, Inc.1,2 | 2,600 | 72,228 | ||||||
| ARM Holdings plc ADR | 2,620 | 66,810 | ||||||
Harmonic, Inc.*,1,2 | 11,000 | 46,860 | ||||||
| Apple, Inc.* | 120 | 45,742 | ||||||
Amkor Technology, Inc.*,1,2 | 9,200 | 40,112 | ||||||
| Baidu, Inc. ADR* | 286 | 30,576 | ||||||
| Yandex N.V. — Class A | 1,182 | 24,125 | ||||||
| Microsoft Corp. | 690 | 17,174 | ||||||
| Electronic Arts, Inc.* | 689 | 14,090 | ||||||
| SPS Commerce, Inc. | 414 | 6,744 | ||||||
| TriQuint Semiconductor, Inc. | 828 | 4,156 | ||||||
Total Information Technology | 1,263,429 | |||||||
| 88 | the RYDEX|SGI equity funds annual report | See Notes to Financial Statements. |
| SCHEDULE OF INVESTMENTS (continued) | September 30, 2011 |
| Shares | Value | |||||||
Financials - 7.3% | ||||||||
| Simon Property Group, Inc. | 1,655 | $ | 182,017 | |||||
Amtrust Financial Services, Inc.1,2 | 6,000 | 133,560 | ||||||
Endurance Specialty Holdings Ltd.1,2 | 3,000 | 102,450 | ||||||
| RenaissanceRe Holdings Ltd. | 1,397 | 89,129 | ||||||
| ACE Ltd. | 1,103 | 66,842 | ||||||
| Chubb Corp. | 1,103 | 66,169 | ||||||
| Arch Capital Group Ltd. | 1,103 | 36,040 | ||||||
| Berkshire Hathaway, Inc. — Class B* | 425 | 30,192 | ||||||
Genworth Financial, Inc. — Class A1,2 | 4,000 | 22,960 | ||||||
Total Financials | 729,359 | |||||||
Energy - 4.6% | ||||||||
Anadarko Petroleum Corp.1,2 | 2,755 | 173,703 | ||||||
ConocoPhillips1,2 | 1,500 | 94,980 | ||||||
| Chesapeake Energy Corp. | 3,034 | 77,519 | ||||||
| Cabot Oil & Gas Corp. | 965 | 59,743 | ||||||
| El Paso Corp. | 1,655 | 28,929 | ||||||
| Hornbeck Offshore Services, Inc.* | 552 | 13,750 | ||||||
| Oceaneering International, Inc. | 276 | 9,754 | ||||||
| Tsakos Energy Navigation Ltd. | 752 | 4,196 | ||||||
Total Energy | 462,574 | |||||||
Telecommunication Services - 3.2% | ||||||||
AT&T, Inc.1,2 | 10,600 | 302,312 | ||||||
| Crown Castle International Corp.* | 414 | 16,838 | ||||||
Total Telecommunication Services | 319,150 | |||||||
Utilities - 1.9% | ||||||||
Constellation Energy Group, Inc.1,2 | 5,100 | 194,106 | ||||||
Materials - 1.2% | ||||||||
| Potash Corporation of Saskatchewan, Inc. | 1,265 | 54,673 | ||||||
| CF Industries Holdings, Inc. | 278 | 34,303 | ||||||
| Molycorp, Inc.* | 552 | 18,144 | ||||||
| Newmont Mining Corp. | 276 | 17,361 | ||||||
Total Materials | 124,481 | |||||||
Total Common Stocks (Cost $10,885,895) | 10,170,520 | |||||||
EXCHANGE TRADED FUNDS† - 6.2% | ||||||||
| Consumer Staples Select Sector SPDR Fund | 6,206 | 184,318 | ||||||
| PowerShares DB Agriculture Fund | 3,748 | 111,128 | ||||||
| Teucrium Corn Fund | 2,736 | 109,112 | ||||||
| Utilities Select Sector SPDR Fund | 2,846 | 95,740 | ||||||
| WisdomTree Asia Local Debt Fund | 1,734 | 85,696 | ||||||
| WisdomTree Dreyfus Emerging Currency Fund | 1,565 | 32,364 | ||||||
Total Exchange Traded Funds (Cost $668,958) | 618,358 | |||||||
CLOSED-END FUND† - 0.3% | ||||||||
| Morgan Stanley China A Share Fund, Inc. | 1,512 | 32,039 | ||||||
Total Closed-End Fund (Cost $34,976) | 32,039 | |||||||
SHORT TERM INVESTMENTS†† - 0.2% | ||||||||
| State Street General Account U.S. Government Fund | 20,591 | 20,591 | ||||||
Total Short Term Investments (Cost $20,591) | 20,591 | |||||||
| Face | ||||||||
| Amount | ||||||||
FEDERAL AGENCY DISCOUNT NOTE†† - 10.0% | ||||||||
Fannie Mae3 0.11% due 01/17/12 | $ | 1,000,000 | 999,941 | |||||
Total Federal Agency Discount Note (Cost $999,670) | 999,941 | |||||||
Total Long Investments - 118.2% (Cost $12,610,090) | $ | 11,841,449 | ||||||
| Shares | ||||||||
COMMON STOCKS SOLD SHORT — (73.7)% | ||||||||
Consumer Staples — (1.0)% | ||||||||
Bridgford Foods Corp. — Class A† | 238 | (2,209 | ) | |||||
Hansen Natural Corp.†††,4,5 | 3,250 | (96,232 | ) | |||||
Total Consumer Staples | (98,441 | ) | ||||||
Telecommunication Services — (1.9)% | ||||||||
Clearwire Corp. — Class A*,†††,4,5 | 2,530 | (28,665 | ) | |||||
Global Crossing Ltd.*,†††,4,5 | 1,800 | (28,746 | ) | |||||
Leap Wireless International, Inc.*,†††,4,5 | 1,500 | (65,100 | ) | |||||
SBA Communications Corp. — Class A*,†††,4,5 | 2,400 | (69,096 | ) | |||||
Total Telecommunication Services | (191,607 | ) | ||||||
Utilities — (2.5)% | ||||||||
Korea Electric Power Corp. ADR*,†††,4,5 | 18,310 | (247,734 | ) | |||||
Energy — (3.4)% | ||||||||
Aquila Resources Ltd. — Class A*,†††,4,5 | 2,750 | (21,907 | ) | |||||
Arrow Energy Holdings Pty Ltd.†††,4,5 | 8,900 | (22,965 | ) | |||||
Modec, Inc.†††,4,5 | 900 | (23,195 | ) | |||||
Sevan Marine ASA*,†††,4,5 | 5,900 | (30,951 | ) | |||||
Trican Well Service Ltd.†††,4,5 | 2,000 | (34,043 | ) | |||||
Queensland Gas Company Ltd.*,†††,4,5 | 12,800 | (49,787 | ) | |||||
Riversdale Mining Ltd.*,†††,4,5 | 6,700 | (50,985 | ) | |||||
BPZ Resources, Inc.*,†††,4,5 | 5,700 | (107,160 | ) | |||||
Total Energy | (340,993 | ) | ||||||
| See Notes to Financial Statements. | the RYDEX|SGI equity funds annual report | 89 |
| SCHEDULE OF INVESTMENTS (continued) | September 30, 2011 |
| Shares | Value | |||||||
Materials — (4.1)% | ||||||||
China National Building Material Company Ltd. — Class H†††,4,5 | 14,700 | $ | (19,911 | ) | ||||
Anhui Conch Cement Company Ltd. — Class H†††,4,5 | 4,500 | (20,259 | ) | |||||
Shougang Fushan Resources Group Ltd.†††,4,5 | 66,000 | (23,727 | ) | |||||
Sino Gold Mining Ltd. — Class A†††,4,5 | 8,600 | (35,368 | ) | |||||
Ivanhoe Mines Ltd.*,†††,4,5 | 4,440 | (37,030 | ) | |||||
Western Areas NL†††,4,5 | 6,200 | (44,456 | ) | |||||
Zoltek Companies, Inc.*,†††,4,5 | 2,700 | (49,221 | ) | |||||
Silver Wheaton Corp.†††,4,5 | 6,100 | (64,046 | ) | |||||
Agnico-Eagle Mines Ltd.†††,4,5 | 1,800 | (119,001 | ) | |||||
Total Materials | (413,019 | ) | ||||||
Information Technology — (8.2)% | ||||||||
Jabil Circuit, Inc.† | 543 | (9,660 | ) | |||||
VeriSign, Inc.†††,4,5 | 1,200 | (30,756 | ) | |||||
Access Company Ltd.†††,4,5 | 17 | (32,755 | ) | |||||
Varian Semiconductor Equipment Associates, Inc.*,†††,4,5 | 1,260 | (33,037 | ) | |||||
Electronic Arts, Inc.*,†††,4,5 | 900 | (36,720 | ) | |||||
Riverbed Technology, Inc.*,†††,4,5 | 3,280 | (43,624 | ) | |||||
Red Hat, Inc.*,†††,4,5 | 2,610 | (46,589 | ) | |||||
Baidu, Inc. ADR*,†††,4,5 | 200 | (53,726 | ) | |||||
Intermec, Inc.*,†††,4,5 | 2,740 | (54,307 | ) | |||||
Rambus, Inc.*,†††,4,5 | 3,600 | (55,224 | ) | |||||
VMware, Inc. — Class A*,†††,4,5 | 2,400 | (68,592 | ) | |||||
Imperial Energy Corporation plc*,†††,4,5 | 3,900 | (77,681 | ) | |||||
Equinix, Inc.*,†††,4,5 | 1,000 | (79,940 | ) | |||||
SAVVIS, Inc.*,†††,4,5 | 5,700 | (84,018 | ) | |||||
Cree, Inc.*,†††,4,5 | 4,000 | (109,840 | ) | |||||
Total Information Technology | (816,469 | ) | ||||||
Industrials — (9.9)% | ||||||||
China Merchants Holdings International Company Ltd. ADR†††,4,5 | 3,100 | (11,047 | ) | |||||
China Communications Construction Company Ltd. — Class H†††,4,5 | 15,000 | (15,535 | ) | |||||
China National Materials Company Ltd.†††,4,5 | 34,400 | (17,537 | ) | |||||
Japan Steel Works Ltd.†††,4,5 | 1,500 | (20,809 | ) | |||||
Ausenco Ltd.†††,4,5 | 2,100 | (22,659 | ) | |||||
Toyo Tanso Company Ltd.†††,4,5 | 500 | (27,007 | ) | |||||
Ryanair Holdings plc*,†††,4,5 | 9,600 | (35,971 | ) | |||||
Meyer Burger Technology AG*,†††,4,5 | 200 | (49,878 | ) | |||||
USG Corp.*,†††,4,5 | 4,940 | (141,877 | ) | |||||
Beijing Capital International Airport Company Ltd. — Class H†††,4,5 | 218,000 | (188,550 | ) | |||||
Brisa Auto-Estradas de Portugal S.A.†††,4,5 | 44,400 | (461,804 | ) | |||||
Total Industrials | (992,674 | ) | ||||||
Financials — (11.7)% | ||||||||
C C Land Holdings Ltd.†††,4,5 | 50,000 | (13,945 | ) | |||||
Franshion Properties China Ltd.†††,4,5 | 79,400 | (22,104 | ) | |||||
Mizuho Trust & Banking Company Ltd.†††,4,5 | 17,700 | (24,682 | ) | |||||
Aozora Bank Ltd.†††,4,5 | 16,300 | (26,251 | ) | |||||
Monex Group, Inc.†††,4,5 | 78 | (27,384 | ) | |||||
Mizuho Financial Group, Inc.†††,4,5 | 11,000 | (45,461 | ) | |||||
Aeon Mall Company Ltd.†††,4,5 | 1,700 | (52,093 | ) | |||||
PrivateBancorp, Inc.†††,4,5 | 2,390 | (102,770 | ) | |||||
Erste Group Bank AG†††,4,5 | 5,200 | (319,536 | ) | |||||
Wells Fargo & Co.†††,4,5 | 12,384 | (539,689 | ) | |||||
Total Financials | (1,173,915 | ) | ||||||
Health Care — (13.4)% | ||||||||
Sepracor, Inc.*,†††,4,5 | 1,400 | (24,500 | ) | |||||
Exelixis, Inc. — Class H†††,4,5 | 4,500 | (28,845 | ) | |||||
Savient Pharmaceuticals, Inc.*,†††,4,5 | 2,420 | (48,013 | ) | |||||
Zeltia S.A.†††,4,5 | 8,000 | (54,559 | ) | |||||
Intuitive Surgical, Inc.†††,4,5 | 200 | (56,100 | ) | |||||
Auxilium Pharmaceuticals, Inc.*,†††,4,5 | 1,540 | (56,703 | ) | |||||
XenoPort, Inc.*,†††,4,5 | 1,376 | (63,062 | ) | |||||
Luminex Corp.*,†††,4,5 | 2,500 | (63,725 | ) | |||||
Regeneron Pharmaceuticals, Inc.*,†††,4,5 | 3,180 | (69,038 | ) | |||||
Vertex Pharmaceuticals, Inc.*,†††,4,5 | 2,600 | (71,942 | ) | |||||
Align Technology, Inc.*,†††,4,5 | 6,100 | (74,420 | ) | |||||
Intercell AG*,†††,4,5 | 1,900 | (74,840 | ) | |||||
Acorda Therapeutics, Inc.†††,4,5 | 2,800 | (74,900 | ) | |||||
Rigel Pharmaceuticals, Inc.*,†††,4,5 | 3,050 | (78,324 | ) | |||||
Sequenom, Inc.*,†††,4,5 | 3,810 | (78,524 | ) | |||||
Cepheid, Inc.*,†††,4,5 | 5,300 | (81,620 | ) | |||||
AMAG Pharmaceuticals, Inc.*,†††,4,5 | 1,900 | (82,954 | ) | |||||
Basilea Pharmaceutica*,†††,4,5 | 500 | (83,364 | ) | |||||
Alnylam Pharmaceuticals, Inc.*,†††,4,5 | 2,900 | (85,289 | ) | |||||
athenahealth, Inc.*,†††,4,5 | 2,500 | (89,625 | ) | |||||
Total Health Care | (1,340,347 | ) | ||||||
Consumer Discretionary — (17.6)% | ||||||||
Papa John’s International, Inc. ADR† | 108 | (3,283 | ) | |||||
DineEquity, Inc.*† | 542 | (20,862 | ) | |||||
Tokyo Broadcasting System Holdings, Inc.†††,4,5 | 1,300 | (21,837 | ) | |||||
Genting Singapore plc*,†††,4,5 | 124,900 | (41,123 | ) | |||||
bwin Interactive Entertainment AG*,†††,4,5 | 1,600 | (45,582 | ) | |||||
Bwin.Party Digital Entertainment plc*,†††,4,5 | 15,200 | (57,210 | ) | |||||
Focus Media Holding Ltd. ADR†††,4,5 | 2,130 | (63,900 | ) | |||||
| 90 | the RYDEX|SGI equity funds annual report | See Notes to Financial Statements. |
| SCHEDULE OF INVESTMENTS (concluded) | September 30, 2011 |
| Shares | Value | |||||||
Sky Deutschland AG*,†††,4,5 | 4,000 | $ | (65,668 | ) | ||||
Marui Group Company Ltd.†††,4,5 | 29,100 | (219,527 | ) | |||||
Pool Corp.†††,4,5 | 11,639 | (288,065 | ) | |||||
Electrolux AB†††,4,5 | 30,100 | (395,761 | ) | |||||
Volkswagen AG†††,4,5 | 1,300 | (539,374 | ) | |||||
Total Consumer Discretionary | (1,762,192 | ) | ||||||
Total Common Stocks Sold Short (Proceeds $7,201,487) | (7,377,391 | ) | ||||||
| EXCHANGE TRADED FUND SOLD SHORT† - (0.8)% | ||||||||
| PowerShares DB US Dollar Index Bullish Fund ADR | 3,798 | (84,733 | ) | |||||
Total Exchange Traded Fund Sold Short (Proceeds $81,133) | (84,733 | ) | ||||||
Total Securities Sold Short — (74.5)% (Proceeds $7,282,620) | $ | (7,462,124 | ) | |||||
Cash & Other Assets, Less Liabilities - 56.3% | 5,640,274 | |||||||
Total Net Assets - 100.0% | $ | 10,019,599 | ||||||
| Unrealized | ||||||||
| Contracts | Loss | |||||||
FUTURES CONTRACTS PURCHASED† | ||||||||
| December 2011 S&P 500 Index | ||||||||
| Mini Futures Contracts (Aggregate Value of Contracts $2,589,800) | 46 | $ | (90,054 | ) | ||||
| * | Non-income producing security. | |
| † | Value determined based on Level 1 inputs — See Note 4. | |
| †† | Value determined based on Level 2 inputs — See Note 4. | |
| ††† | Value determined based on Level 3 inputs — See Note 4. | |
| 1 | All or a portion of this security is pledged as short security collateral at September 30, 2011. | |
| 2 | All or a portion of the security is deemed illiquid due to the Fund’s exposure to Lehman Brothers International Europe (“LBIE”) prime brokerage services. The total market value of illiquid securities is $7,264,165 (cost $7,627,564), or 72% of total net assets. The security was deemed liquid at the time of purchase — See Note 9. | |
| 3 | On September 7, 2008, the issuer was placed in conservatorship by the Federal Housing Finance Agency (FHFA). As conservator, the FHFA has full powers to control the assets and operations of the firm. | |
| 4 | All or a portion of this security was fair valued by the Valuation Committee at September 30, 2011. The total market value of fair valued securities amounts to $(7,341,377) (proceeds $7,164,435), or (73%) of total net assets. | |
| 5 | Illiquid security. | |
| 6 | Security was acquired through a private placement. | |
| ADR — American Depositary Receipt | ||
| plc — Public Limited Company |
| See Notes to Financial Statements. | the RYDEX|SGI equity funds annual report | 91 |
Assets: | ||||
| Investments, at value (cost $12,610,090) | $ | 11,841,449 | ||
Restricted cash denominated in a foreign currency, at value (cost $3,380,755)† | 3,609,568 | |||
| Cash | 66,034 | |||
Restricted cash† | 1,759,316 | |||
| Prepaid expenses | 16,665 | |||
| Receivables: | ||||
| Securities sold | 501,703 | |||
| Dividends | 22,405 | |||
| Investment advisor | 1,279 | |||
| Foreign taxes reclaim | 216 | |||
Total assets | 17,818,635 | |||
Liabilities: | ||||
| Securities sold short, at value (proceeds $7,282,620) | 7,462,124 | |||
| Payable for: | ||||
| Securities purchased | 184,210 | |||
| Management fees | 11,146 | |||
| Distribution and service fees | 3,271 | |||
| Fund shares redeemed | 2,876 | |||
| Transfer agent/maintenance fees | 2,112 | |||
| Fund accounting/administration fees | 1,446 | |||
| Directors’ fees* | 839 | |||
| Variation margin | 69,690 | |||
| Miscellaneous | 61,322 | |||
Total liabilities | 7,799,036 | |||
Net assets | $ | 10,019,599 | ||
Net assets consist of: | ||||
| Paid in capital | $ | 22,505,329 | ||
| Undistributed net investment income | — | |||
| Accumulated net realized loss on investments and foreign currency | (11,676,344 | ) | ||
| Net unrealized depreciation on investments and foreign currency | (809,386 | ) | ||
| Net assets | $ | 10,019,599 | ||
A-Class: | ||||
| Net assets | $ | 6,708,144 | ||
| Capital shares outstanding | 682,866 | |||
| Net asset value per share | $ | 9.82 | ||
| Maximum offering price per share (Net asset value divided by 95.25%) | $ | 10.31 | ||
B-Class: | ||||
| Net assets | $ | 693,059 | ||
| Capital shares outstanding | 76,418 | |||
| Net asset value per share | $ | 9.07 | ||
C-Class: | ||||
| Net assets | $ | 1,292,446 | ||
| Capital shares outstanding | 142,500 | |||
| Net asset value per share | $ | 9.07 | ||
Institutional Class: | ||||
| Net assets | $ | 1,325,950 | ||
| Capital shares outstanding | 98,009 | |||
| Net asset value per share | $ | 13.53 | ||
| † | All or portion of this amount represents values related to Lehman Brothers International Europe prime brokerage services — See Note 9. |
Investment Income: | ||||
| Dividends (net of foreign withholding tax of $209) | $ | 230,139 | ||
| Interest | 1,617 | |||
| Total investment income | 231,756 | |||
Expenses: | ||||
| Management fees | 158,975 | |||
| Transfer agent/maintenance fees | 36,812 | |||
| Distribution and service fees: | ||||
| A-Class | 20,996 | |||
| B-Class | 10,503 | |||
| C-Class | 16,336 | |||
| Fund accounting/administration fees | 25,000 | |||
| Legal fees expense | 60,809 | |||
| Registration fees | 45,630 | |||
| Prime broker interest expense | 4,384 | |||
| Directors’ fees* | 1,432 | |||
| Short sales dividend expense | 979 | |||
| Miscellaneous | 65,821 | |||
| Total expenses | 447,677 | |||
| Less: | ||||
| Expenses waived by advisor | (157,924 | ) | ||
| Net expenses | 289,753 | |||
| Net investment loss | (57,997 | ) | ||
Net Realized and Unrealized Gain (Loss): | ||||
| Net realized gain (loss) on: | ||||
| Investments | 699,216 | |||
| Futures contracts | 263,253 | |||
| Foreign currency | 99 | |||
| Securities sold short | 7,124 | |||
| Net realized gain | 969,692 | |||
| Net change in unrealized appreciation (depreciation) on: | ||||
| Investments | (337,630 | ) | ||
| Securities sold short | 598 | |||
| Futures contracts | (139,087 | ) | ||
| Foreign currency | 36,295 | |||
| Net change in unrealized appreciation (depreciation) | (439,824 | ) | ||
| Net realized and unrealized gain | 529,868 | |||
Net increase in net assets resulting from operations | $ | 471,871 | ||
| * | Relates to Directors not deemed “interested persons” within the meaning of Section 2(a)(19) of the 1940 Act. |
| 92 | the RYDEX|SGI equity funds annual report | See Notes to Financial Statements. |
| Year Ended | Year Ended | |||||||
| September 30, | September 30, | |||||||
| 2011 | 2010 | |||||||
Increase (Decrease) In Net Assets From Operations: | ||||||||
| Net investment loss | $ | (57,997 | ) | $ | (114,876 | ) | ||
| Net realized gain on investments and foreign currency | 969,692 | 1,037,820 | ||||||
| Net change in unrealized appreciation (depreciation) on investments and foreign currency | (439,824 | ) | 683,849 | |||||
| Net increase in net assets resulting from operations | 471,871 | 1,606,793 | ||||||
Distributions to shareholders | — | — | ||||||
Capital share transactions: | ||||||||
| Proceeds from sale of shares | ||||||||
| A-Class* | 180,654 | 293,839 | ||||||
| Cost of shares redeemed | ||||||||
| A-Class | (1,908,640 | ) | (2,954,805 | ) | ||||
| B-Class | (547,550 | ) | (635,054 | ) | ||||
| C-Class | (242,522 | ) | (698,685 | ) | ||||
| Institutional Class | (166,305 | ) | (917,495 | ) | ||||
| Net decrease from capital share transactions | (2,684,363 | ) | (4,912,200 | ) | ||||
| Net decrease in net assets | (2,212,492 | ) | (3,305,407 | ) | ||||
Net assets: | ||||||||
| Beginning of year | 12,232,091 | 15,537,498 | ||||||
| End of year | $ | 10,019,599 | $ | 12,232,091 | ||||
| Accumulated (Undistributed) net investment income (loss) at end of year | $ | — | $ | (2,843 | ) | |||
Capital share activity: | ||||||||
| Shares sold | ||||||||
| A-Class* | 15,900 | 32,339 | ||||||
| Shares redeemed | ||||||||
| A-Class | (171,786 | ) | (333,306 | ) | ||||
| B-Class | (52,155 | ) | (74,867 | ) | ||||
| C-Class | (22,496 | ) | (83,926 | ) | ||||
| Institutional Class | (10,264 | ) | (75,471 | ) | ||||
| Net decrease in shares | (240,801 | ) | (535,231 | ) | ||||
| * | Represents conversion of B-Class to A-Class shares. |
| See Notes to Financial Statements. | the RYDEX|SGI equity funds annual report | 93 |
FINANCIAL HIGHLIGHTS
| Year Ended | Year Ended | Year Ended | Year Ended | Year Ended | ||||||||||||||||
| September 30, | September 30, | September 30, | September 30, | September 30, | ||||||||||||||||
| A-Class | 2011 | 2010 | 2009 | 2008f | 2007 | |||||||||||||||
Per Share Data | ||||||||||||||||||||
| Net asset value, beginning of period | $ | 9.70 | $ | 8.56 | $ | 9.37 | $ | 13.94 | $ | 12.23 | ||||||||||
| Income (loss) from investment operations: | ||||||||||||||||||||
Net investment lossa | (.04 | ) | (.06 | ) | (.04 | ) | (.16 | ) | (.01 | ) | ||||||||||
| Net gain (loss) on investments (realized and unrealized) | .16 | 1.20 | (.77 | ) | (1.68 | ) | 2.99 | |||||||||||||
| Total from investment operations | .12 | 1.14 | (.81 | ) | (1.84 | ) | 2.98 | |||||||||||||
| Less distributions from: | ||||||||||||||||||||
| Net realized gains | — | — | — | (2.57 | ) | (1.27 | ) | |||||||||||||
| Return of capital | — | — | — | (.16 | ) | — | ||||||||||||||
| Total distributions | — | — | — | (2.73 | ) | (1.27 | ) | |||||||||||||
| Net asset value, end of period | $ | 9.82 | $ | 9.70 | $ | 8.56 | $ | 9.37 | $ | 13.94 | ||||||||||
Total Returnb | 1.13 | % | 13.43 | % | (8.64 | %) | (15.99 | %) | 26.10 | % | ||||||||||
Ratios/Supplemental Data | ||||||||||||||||||||
| Net assets, end of period (in thousands) | $ | 6,708 | $ | 8,138 | �� | $ | 9,752 | $ | 30,615 | $ | 25,072 | |||||||||
| Ratios to average net assets: | ||||||||||||||||||||
| Net investment loss | (0.33 | %) | (0.71 | %) | (0.50 | %) | (1.44 | %) | (0.08 | %) | ||||||||||
| Total expenses | 3.39 | % | 3.51 | % | 3.82 | % | 3.41 | % | 2.88 | % | ||||||||||
Net expensesc | 2.15 | % | 2.21 | % | 2.00 | % | 3.32 | % | 2.82 | % | ||||||||||
Operating expensesd | 2.11 | % | 2.05 | % | 1.95 | % | 3.06 | % | 2.62 | % | ||||||||||
| Portfolio turnover rate | 868 | % | 954 | % | 422 | % | 1,248 | % | 1,697 | % | ||||||||||
| Year Ended | Year Ended | Year Ended | Year Ended | Year Ended | ||||||||||||||||
| September 30, | September 30, | September 30, | September 30, | September 30, | ||||||||||||||||
| B-Class | 2011 | 2010 | 2009 | 2008f | 2007 | |||||||||||||||
Per Share Data | ||||||||||||||||||||
| Net asset value, beginning of period | $ | 9.03 | $ | 8.04 | $ | 8.87 | $ | 13.42 | $ | 11.90 | ||||||||||
| Income (loss) from investment operations: | ||||||||||||||||||||
Net investment lossa | (.12 | ) | (.12 | ) | (.09 | ) | (.23 | ) | (.09 | ) | ||||||||||
| Net gain (loss) on investments (realized and unrealized) | .16 | 1.11 | (.74 | ) | (1.59 | ) | 2.88 | |||||||||||||
| Total from investment operations | .04 | .99 | (.83 | ) | (1.82 | ) | 2.79 | |||||||||||||
| Less distributions from: | ||||||||||||||||||||
| Net realized gains | — | — | — | (2.57 | ) | (1.27 | ) | |||||||||||||
| Return of capital | — | — | — | (.16 | ) | — | ||||||||||||||
| Total distributions | — | — | — | (2.73 | ) | (1.27 | ) | |||||||||||||
| Net asset value, end of period | $ | 9.07 | $ | 9.03 | $ | 8.04 | $ | 8.87 | $ | 13.42 | ||||||||||
Total Returnb | 0.44 | % | 12.31 | % | (9.36 | %) | (16.66 | %) | 25.14 | % | ||||||||||
Ratios/Supplemental Data | ||||||||||||||||||||
| Net assets, end of period (in thousands) | $ | 693 | $ | 1,161 | $ | 1,635 | $ | 5,391 | $ | 3,154 | ||||||||||
| Ratios to average net assets: | ||||||||||||||||||||
| Net investment loss | (1.09 | %) | (1.47 | %) | (1.24 | %) | (2.18 | %) | (0.77 | %) | ||||||||||
| Total expenses | 4.19 | % | 4.27 | % | 4.57 | % | 4.16 | % | 3.59 | % | ||||||||||
Net expensesc | 2.90 | % | 2.96 | % | 2.75 | % | 4.04 | % | 3.53 | % | ||||||||||
Operating expensesd | 2.86 | % | 2.80 | % | 2.69 | % | 3.78 | % | 3.33 | % | ||||||||||
| Portfolio turnover rate | 868 | % | 954 | % | 422 | % | 1,248 | % | 1,697 | % | ||||||||||
| 94 | the RYDEX|SGI equity funds annual report | See Notes to Financial Statements. |
FINANCIAL HIGHLIGHTS (concluded)
| Year Ended | Year Ended | Year Ended | Year Ended | Year Ended | ||||||||||||||||
| September 30, | September 30, | September 30, | September 30, | September 30, | ||||||||||||||||
| C-Class | 2011 | 2010 | 2009 | 2008f | 2007 | |||||||||||||||
Per Share Data | ||||||||||||||||||||
| Net asset value, beginning of period | $ | 9.03 | $ | 8.02 | $ | 8.87 | $ | 13.43 | $ | 11.90 | ||||||||||
| Income (loss) from investment operations: | ||||||||||||||||||||
Net investment lossa | (.11 | ) | (.12 | ) | (.09 | ) | (.23 | ) | (.10 | ) | ||||||||||
| Net gain (loss) on investments (realized and unrealized) | .15 | 1.13 | (.76 | ) | (1.60 | ) | 2.90 | |||||||||||||
| Total from investment operations | .04 | 1.01 | (.85 | ) | (1.83 | ) | 2.80 | |||||||||||||
| Less distributions from: | ||||||||||||||||||||
| Net realized gains | — | — | — | (2.57 | ) | (1.27 | ) | |||||||||||||
| Return of capital | — | — | — | (.16 | ) | — | ||||||||||||||
| Total distributions | — | — | — | (2.73 | ) | (1.27 | ) | |||||||||||||
| Net asset value, end of period | $ | 9.07 | $ | 9.03 | $ | 8.02 | $ | 8.87 | $ | 13.43 | ||||||||||
Total Returnb | 0.44 | % | 12.59 | % | (9.58 | %) | (16.63 | %) | 25.24 | % | ||||||||||
Ratios/Supplemental Data | ||||||||||||||||||||
| Net assets, end of period (in thousands) | $ | 1,292 | $ | 1,490 | $ | 1,996 | $ | 4,935 | $ | 4,216 | ||||||||||
| Ratios to average net assets: | ||||||||||||||||||||
| Net investment loss | (1.08 | %) | (1.46 | %) | (1.24 | %) | (2.21 | %) | (0.77 | %) | ||||||||||
| Total expenses | 4.14 | % | 4.28 | % | 4.67 | % | 4.16 | % | 3.60 | % | ||||||||||
Net expensesc | 2.90 | % | 2.95 | % | 2.75 | % | 4.09 | % | 3.54 | % | ||||||||||
Operating expensesd | 2.86 | % | 2.80 | % | 2.69 | % | 3.83 | % | 3.34 | % | ||||||||||
| Portfolio turnover rate | 868 | % | 954 | % | 422 | % | 1,248 | % | 1,697 | % | ||||||||||
| Year Ended | Year Ended | Period Ended | ||||||||||
| September 30, | September 30, | September 30, | ||||||||||
| Institutional Class | 2011 | 2010 | 2009e | |||||||||
Per Share Data | ||||||||||||
| Net asset value, beginning of period | $ | 13.33 | $ | 11.73 | $ | 10.00 | ||||||
| Income (loss) from investment operations: | ||||||||||||
Net investment lossa | (.01 | ) | (.06 | ) | (.01 | ) | ||||||
| Net gain on investments (realized and unrealized) | .21 | 1.66 | 1.74 | |||||||||
| Total from investment operations | .20 | 1.60 | 1.73 | |||||||||
| Net asset value, end of period | $ | 13.53 | $ | 13.33 | $ | 11.73 | ||||||
Total Returnb | 1.50 | % | 13.64 | % | 17.30 | % | ||||||
Ratios/Supplemental Data | ||||||||||||
| Net assets, end of period (in thousands) | $ | 1,326 | $ | 1,444 | $ | 2,155 | ||||||
| Ratios to average net assets: | ||||||||||||
| Net investment loss | (0.08 | %) | (0.48 | %) | (0.07 | %) | ||||||
| Total expenses | 3.12 | % | 3.28 | % | 3.94 | % | ||||||
Net expensesc | 1.90 | % | 1.96 | % | 1.76 | % | ||||||
Operating expensesd | 1.86 | % | 1.80 | % | 1.70 | % | ||||||
| Portfolio turnover rate | 868 | % | 954 | % | 422 | % | ||||||
| a | Net investment loss per share was computed using average shares outstanding throughout the period. | |
| b | Total return does not reflect the impact of any applicable sales charges and has not been annualized. | |
| c | Net expense information reflects the expense ratios after expense waivers and reimbursements, as applicable. | |
| d | Operating expenses exclude interest and dividend expense from securities sold short and prime broker interest expense. | |
| e | Since commencement of operations: November 7, 2008 — Alpha Opportunity Fund Institutional Class. Percentage amounts for the period, except total return and portfolio turnover rate, have been annualized. | |
| f | Security Global Investors, LLC (SGI) became the sub-advisor of 37.5% of the assets of the Alpha Opportunity Fund effective August 18, 2008. Also effective August 18, 2008, Mainstream Investment Advisers, LLC (Mainstream) sub-advises 37.5% of the assets and Security Investors, LLC (SI) manages 25% of the assets. Prior to August 18, 2008, Mainstream sub-advised 60% of the assets and SI managed the remaining 40% of the assets. |
| See Notes to Financial Statements. | the RYDEX|SGI equity funds annual report | 95 |
| Management | ||||
| Fees (as a % | ||||
| of net assets) | ||||
| Large Cap Core Fund | 0.75 | % | ||
| All Cap Value Fund | 0.70 | % | ||
| Mid Cap Value Fund | 0.78 | %2 | ||
| Mid Cap Value Institutional Fund | 0.75 | % | ||
| Small Cap Growth Fund | 0.85 | % | ||
| Small Cap Value Fund | 1.00 | % | ||
| Large Cap Concentrated Growth Fund | 0.75 | % | ||
| MSCI EAFE Equal Weight Fund | 0.70 | %1 | ||
| Alpha Opportunity Fund | 1.25 | % | ||
| 1 | Effective April 29, 2011, the Fund’s management fee was reduced from an annual rate of 1.00% of the average daily net assets to 0.70% of the average daily net assets. | |
| 2 | Management fees are payable at an annual rate of 1.00% of the average daily net assets of $200 million or less, and 0.75% of the average daily net assets of the Fund in excess of $200 million. |
| Administrative Fees | ||||
| (as a % of net assets) | ||||
| Large Cap Core Fund | 0.095 | % | ||
| All Cap Value Fund | 0.095 | % | ||
| Mid Cap Value Fund | 0.095 | % | ||
| Mid Cap Value Institutional Fund | 0.095 | % | ||
| Small Cap Growth Fund | 0.095 | % | ||
| Small Cap Value Fund | 0.095 | % | ||
| Large Cap Concentrated Growth Fund | 0.095 | % | ||
| MSCI EAFE Equal Weight Fund | greater of 0.15% or $60,000 | |||
| Alpha Opportunity Fund | 0.15 | % | ||
| Minimum charge per Fund | $ | 25,000 | 1 | |
| Certain out-of-pocket charges | Varies | |||
| 1 | SI has agreed not to charge the $25,000 minimum fee on the All Cap Value Fund. |
| Annual charge per account | $ | 5.00 – $8.00 | ||
| Transaction fee | $ | 0.60 – $1.10 | ||
| Minimum annual charge (per Fund) | $ | 25,000 | 1 | |
| Certain out-of-pocket charges | Varies | |||
| 1 | SI has agreed not to charge the $25,000 minimum fee on the All Cap Value Fund. |
| Effective | Contract | |||||||||||
| Limit | Date | End Date | ||||||||||
| All Cap Value Fund — A-Class | 1.27 | % | 02/01/10 | 01/31/12 | ||||||||
| All Cap Value Fund — C-Class | 2.02 | % | 02/01/10 | 01/31/12 | ||||||||
| All Cap Value Fund — Institutional Class | 1.02 | % | 02/01/10 | 01/31/12 | ||||||||
| Mid Cap Value Institutional Fund | 0.90 | % | 04/13/09 | 03/31/12 | ||||||||
| Small Cap Value Fund — A-Class | 1.30 | % | 08/24/09 | 01/31/12 | ||||||||
| Small Cap Value Fund — C-Class | 2.05 | % | 08/24/09 | 01/31/12 | ||||||||
| Small Cap Value Fund — Institutional Class | 1.05 | % | 08/24/09 | 01/31/12 | ||||||||
| Large Cap Concentrated Growth Fund — A-Class | 1.35 | % | 01/11/07 | 01/31/12 | ||||||||
| Large Cap Concentrated Growth Fund — B-Class | 2.10 | % | 01/11/07 | 01/31/12 | ||||||||
| Large Cap Concentrated Growth Fund — C-Class | 2.10 | % | 01/11/07 | 01/31/12 | ||||||||
| MSCI EAFE Equal Weight Fund — A-Class | 1.61 | % | 04/29/11 | 01/31/13 | ||||||||
| MSCI EAFE Equal Weight Fund — B-Class | 2.36 | % | 04/29/11 | 01/31/13 | ||||||||
| MSCI EAFE Equal Weight Fund — C-Class | 2.36 | % | 04/29/11 | 01/31/13 | ||||||||
| MSCI EAFE Equal Weight Fund — Institutional Class | 1.36 | % | 04/29/11 | 01/31/13 | ||||||||
| Alpha Opportunity Fund — A-Class | 2.11 | % | 02/01/10 | 01/31/12 | ||||||||
| Alpha Opportunity Fund — B-Class | 2.86 | % | 02/01/10 | 01/31/12 | ||||||||
| Alpha Opportunity Fund — C-Class | 2.86 | % | 02/01/10 | 01/31/12 | ||||||||
| Alpha Opportunity Fund — Institutional Class | 1.86 | % | 02/01/10 | 01/31/12 | ||||||||
| Fees Waived | Expires In | |||||||
| All Cap Value Fund | $ | 49,063 | 2014 | |||||
| 59,326 | 2013 | |||||||
| 56,488 | 2012 | |||||||
| $ | 164,877 | |||||||
| Mid Cap Value Institutional Fund | $ | 443,419 | 2014 | |||||
| 209,976 | 2013 | |||||||
| 56,387 | 2012 | |||||||
| $ | 709,782 | |||||||
| Small Cap Value Fund | $ | 118,145 | 2014 | |||||
| 90,347 | 2013 | |||||||
| 68,867 | 2012 | |||||||
| $ | 277,359 | |||||||
| Large Cap Concentrated Growth Fund | $ | 140,783 | 2014 | |||||
| 150,104 | 2013 | |||||||
| 208,564 | 2012 | |||||||
| $ | 499,451 | |||||||
| Alpha Opportunity Fund | $ | 157,924 | 2014 | |||||
| 176,815 | 2013 | |||||||
| 360,351 | 2012 | |||||||
| $ | 695,090 | |||||||
| Percent of | ||||
| outstanding | ||||
| shares owned | ||||
| Large Cap Core Fund | 15 | % | ||
| All Cap Value Fund | 32 | % | ||
| Small Cap Growth Fund | 25 | % | ||
| Small Cap Value Fund | 16 | % | ||
| Large Cap Concentrated Growth Fund | 20 | % | ||
| MSCI EAFE Equal Weight Fund | 14 | % | ||
| Alpha Opportunity Fund | 16 | % | ||
| Ordinary | Long-Term | Total | ||||||||||
| Fund | Income | Capital Gain | Distributions | |||||||||
| Large Cap Core Fund | $ | 546,823 | $ | — | $ | 546,823 | ||||||
| All Cap Value Fund | 48,497 | 115,509 | 164,006 | |||||||||
| Mid Cap Value Fund | 2,564,377 | 139,287 | 2,703,664 | |||||||||
| Mid Cap Value Institutional Fund | 14,998,506 | 10,215,700 | 25,214,206 | |||||||||
| Small Cap Growth Fund | — | — | — | |||||||||
| Small Cap Value Fund | 526,847 | 676,251 | 1,203,098 | |||||||||
| Large Cap Concentrated Growth Fund | 136,272 | — | 136,272 | |||||||||
| MSCI EAFE Equal Weight Fund | 488,291 | — | 488,291 | |||||||||
| Alpha Opportunity Fund | — | — | — | |||||||||
| Ordinary | Long-Term | Total | ||||||||||
| Fund | Income | Capital Gain | Distributions | |||||||||
| Large Cap Core Fund | $ | — | $ | — | $ | — | ||||||
| All Cap Value Fund | 3,710 | — | 3,710 | |||||||||
| Mid Cap Value Fund | 1,178,918 | — | 1,178,918 | |||||||||
| Mid Cap Value Institutional Fund | 10,187,733 | 1,221,429 | 11,409,162 | |||||||||
| Small Cap Growth Fund | — | — | — | |||||||||
| Small Cap Value Fund | 161,456 | 34,045 | 195,501 | |||||||||
| Large Cap Concentrated Growth Fund | — | — | — | |||||||||
| MSCI EAFE Equal Weight Fund | — | — | — | |||||||||
| Alpha Opportunity Fund | — | — | — | |||||||||
| Undistributed | Undistributed | Accumulated | Net Unrealized | Total | ||||||||||||||||
| Ordinary | Long-Term | Capital and | Appreciation/ | Accumulated | ||||||||||||||||
| Fund | Income | Capital Gain | Other Losses* | (Depreciation)** | Earnings/(Deficit) | |||||||||||||||
| Large Cap Core Fund | $ | 13,084 | $ | — | $ | (18,461,711 | ) | $ | (12,446,366 | ) | $ | (30,894,993 | ) | |||||||
| All Cap Value Fund | 45,954 | 138,514 | — | (227,919 | ) | (43,451 | ) | |||||||||||||
| Mid Cap Value Fund | — | 18,116,293 | — | (64,504,568 | ) | (46,388,275 | ) | |||||||||||||
| Mid Cap Value Institutional Fund | 10,347,092 | 34,203,113 | — | (36,446,626 | ) | 8,103,579 | ||||||||||||||
| Small Cap Growth Fund | — | — | (4,100,570 | ) | 134,712 | (3,965,858 | ) | |||||||||||||
| Small Cap Value Fund | 490,519 | 201,354 | — | (2,502,708 | ) | (1,810,835 | ) | |||||||||||||
| Large Cap Concentrated Growth Fund | — | — | (7,817,471 | ) | (2,459,826 | ) | (10,277,297 | ) | ||||||||||||
| MSCI EAFE Equal Weight Fund | — | — | (23,814,806 | ) | (17,021,394 | ) | (40,836,200 | ) | ||||||||||||
| Alpha Opportunity Fund | — | — | (11,707,214 | ) | (778,516 | ) | (12,485,730 | ) | ||||||||||||
| * | The Fund had net capital loss carryovers and deferred post October losses as identified elsewhere in the Notes to the Financial Statements. | |
| ** | Any differences between book-basis and tax-basis unrealized appreciation (depreciation) are attributable primarily to the tax deferral of wash sale losses, the differences between book and tax basis passive foreign investment companies and bond discount accretion. |
| Deferred | ||||||||||||||||||||
| Capital Loss | Capital Loss | Remaining | Post- | |||||||||||||||||
| Carryovers | Carryovers | Capital Loss | October | |||||||||||||||||
| Utilized | Expired | Carryovers | Expires In | Losses | ||||||||||||||||
| Large Cap Core Fund | $ | 13,503,040 | $ | — | $ | 18,461,711 | 2018 | $ | — | |||||||||||
| Mid Cap Value Fund | $ | 74,225,225 | $ | — | $ | — | $ | — | ||||||||||||
| Small Cap Growth Fund | $ | 1,974,062 | 2017 | |||||||||||||||||
| 2,126,508 | 2018 | |||||||||||||||||||
| Small Cap Growth Fund Total | $ | 2,615,693 | $ | — | $ | 4,100,570 | $ | — | ||||||||||||
| Large Cap Concentrated Growth Fund | $ | 5,361,779 | 2017 | |||||||||||||||||
| 2,455,692 | 2018 | |||||||||||||||||||
| Large Cap Concentrated Growth Fund Total | $ | 5,509,431 | $ | — | $ | 7,817,471 | $ | — | ||||||||||||
| MSCI EAFE Equal Weight Fund | $ | 18,217,126 | 2017 | |||||||||||||||||
| 5,357,504 | 2018 | |||||||||||||||||||
| MSCI EAFE Equal Weight Fund Total | $ | 19,083,242 | $ | — | $ | 23,574,630 | $ | 240,175 | ||||||||||||
| Alpha Opportunity Fund | $ | 7,365,287 | 2017 | |||||||||||||||||
| 4,341,927 | 2018 | |||||||||||||||||||
| Alpha Opportunity Fund Total | $ | 850,171 | $ | — | $ | 11,707,214 | $ | — | ||||||||||||
| Accumulated | Undistributed | |||||||||||
| Net Realized | Net Investment | |||||||||||
| Gain/(Loss) | Income | Paid-In Capital | ||||||||||
| Large Cap Core Fund | $ | — | $ | 263 | $ | (263 | ) | |||||
| All Cap Value Fund | — | — | — | |||||||||
| Mid Cap Value Fund | (139,287 | ) | 3,579,795 | (3,440,508 | ) | |||||||
| Mid Cap Value Institutional Fund | — | — | — | |||||||||
| Small Cap Growth Fund | — | 308,691 | (308,691 | ) | ||||||||
| Small Cap Value Fund | (74,743 | ) | 74,743 | — | ||||||||
| Large Cap Concentrated Growth Fund | — | 156,727 | (156,727 | ) | ||||||||
| MSCI EAFE Equal Weight Fund | (291,194 | ) | 295,332 | (4,138 | ) | |||||||
| Alpha Opportunity Fund | (99 | ) | 60,840 | (60,741 | ) | |||||||
| Tax | Tax | Net Unrealized | ||||||||||||||
| Fund | Tax Cost | Unrealized Gain | Unrealized Loss | Gain/(Loss) | ||||||||||||
| Large Cap Core Fund | $ | 169,039,079 | $ | 12,000,057 | $ | (24,446,423 | ) | $ | (12,446,366 | ) | ||||||
| All Cap Value Fund | 2,990,370 | 161,114 | (389,033 | ) | (227,919 | ) | ||||||||||
| Mid Cap Value Fund | 1,254,247,382 | 142,945,600 | (207,450,168 | ) | (64,504,568 | ) | ||||||||||
| Mid Cap Value Institutional Fund | 502,321,419 | 44,463,668 | (80,910,294 | ) | (36,446,626 | ) | ||||||||||
| Small Cap Growth Fund | 12,310,089 | 2,062,263 | (1,927,551 | ) | 134,712 | |||||||||||
| Small Cap Value Fund | 12,863,229 | 336,415 | (2,839,123 | ) | (2,502,708 | ) | ||||||||||
| Large Cap Concentrated Growth Fund | 29,783,480 | 1,073,300 | (3,533,126 | ) | (2,459,826 | ) | ||||||||||
| MSCI EAFE Equal Weight Fund | 90,204,673 | 1,800,000 | (18,821,394 | ) | (17,021,394 | ) | ||||||||||
| Alpha Opportunity Fund | 12,669,273 | 1,148,504 | (1,927,020 | ) | (778,516 | ) | ||||||||||
| Level 1 — | quoted prices in active markets for identical securities. |
| Level 2 — | other significant observable inputs (including quoted prices for similar securities, interest rates, prepayment speeds, credit risk, etc.). |
| Level 3 — | significant unobservable inputs (including the fund’s own assumptions used to determine the fair value of investments). |
| Level 1 | Level 1 | Level 2 | Level 2 | Level 3 | ||||||||||||||||||||
| Investments | Other Financial | Investments | Other Financial | Investments | ||||||||||||||||||||
| In Securities | Instruments* | In Securities | Instruments* | In Securities | Total | |||||||||||||||||||
Assets | ||||||||||||||||||||||||
| Large Cap Core Fund | $ | 156,587,778 | $ | — | $ | — | $ | — | $ | — | $ | 156,587,778 | ||||||||||||
| All Cap Value Fund | 2,762,335 | — | — | — | — | 2,762,335 | ||||||||||||||||||
| Mid Cap Value Fund | 1,176,591,068 | — | 14,017,307 | — | — | 1,190,608,375 | ||||||||||||||||||
| Mid Cap Value Institutional Fund | 460,680,903 | — | 5,537,793 | — | — | 466,218,696 | ||||||||||||||||||
| Small Cap Growth Fund | 12,444,801 | — | — | — | — | 12,444,801 | ||||||||||||||||||
| Small Cap Value Fund | 10,276,985 | — | 84,569 | — | — | 10,361,554 | ||||||||||||||||||
| Large Cap Concentrated Growth Fund | 27,323,654 | — | — | — | — | 27,323,654 | ||||||||||||||||||
| MSCI EAFE Equal Weight Fund | 4,764,646 | — | 68,425,424 | — | — | 73,190,070 | ||||||||||||||||||
| Alpha Opportunity Fund | 10,820,917 | — | 1,020,532 | — | — | 11,841,449 | ||||||||||||||||||
Liabilities | ||||||||||||||||||||||||
| Large Cap Core Fund | $ | — | $ | 16,898 | $ | — | $ | — | $ | — | $ | 16,898 | ||||||||||||
| All Cap Value Fund | — | 1,356 | — | — | — | 1,356 | ||||||||||||||||||
| Mid Cap Value Fund | — | 4,011,763 | — | — | — | 4,011,763 | ||||||||||||||||||
| Mid Cap Value Institutional Fund | — | 1,652,150 | — | — | — | 1,652,150 | ||||||||||||||||||
| Small Cap Value Fund | — | 10,371 | — | 8,565 | — | 18,936 | ||||||||||||||||||
| Alpha Opportunity Fund | 120,747 | 90,054 | — | — | 7,341,377 | 7,552,178 | ||||||||||||||||||
| * | Other financial instruments include futures contracts which are reported as unrealized gain/loss at period end, and options written. |
| Securities Sold Short | Total | |||||||
Alpha Opportunity Fund | ||||||||
| Liabilities: | ||||||||
| Beginning Balance | $ | 7,341,377 | $ | 7,341,377 | ||||
| Total realized gains or losses included in earnings | — | — | ||||||
| Total unrealized gains or losses included in earnings | — | — | ||||||
| Purchases, sales, issuances, and settlements (net) | — | — | ||||||
| Transfers in and/or out of Level 3 | — | — | ||||||
| Ending Balance | $ | 7,341,377 | $ | 7,341,377 | ||||
| Approximate percentage | ||||
| of Fund’s net assets | ||||
| Fund | on a daily basis | |||
| Alpha Opportunity Fund | 25 | % | ||
| MSCI EAFE Equal Weight Fund | 0 | % | ||
| Derivative Investments Type | Asset Derivatives | Liability Derivatives | ||
| Futures — equity contracts | Variation margin | Variation margin | ||
| Options Written — equity contracts | — | Options Written, at value | ||
| Futures | Options Written | Total | ||||||||||
| Equity | Equity | Value at | ||||||||||
| Contracts* | Contracts | September 30, 2011 | ||||||||||
| Large Cap Core Fund | $ | — | $ | 16,898 | $ | 16,898 | ||||||
| All Cap Value Fund | — | 1,356 | 1,356 | |||||||||
| Mid Cap Value Fund | — | 4,011,763 | 4,011,763 | |||||||||
| Mid Cap Value Institutional Fund | — | 1,652,150 | 1,652,150 | |||||||||
| Small Cap Value Fund | — | 18,936 | 18,936 | |||||||||
| Alpha Opportunity Fund | 90,054 | — | 90,054 | |||||||||
| * | Includes cumulative appreciation (depreciation) of futures contracts as reported on the Schedule of Investments. Only current day’s variation margin is reported within the Statement of Assets and Liabilities. |
| Derivative Investment Type | Location of Gain (Loss) on Derivatives | |
| Futures — equity contracts | Net realized gain (loss) on futures contracts | |
| Net change in unrealized appreciation (depreciation) on futures contracts | ||
| Options Written — equity contracts | Net realized gain (loss) on options written | |
| Net change in unrealized appreciation(depreciation) on options written | ||
| Futures | Options Written | |||||||||||
| Equity | Equity | |||||||||||
| Contracts | Contracts | Total | ||||||||||
| All Cap Value Fund | $ | — | $ | 2,548 | $ | 2,548 | ||||||
| Mid Cap Value Fund | — | 2,010,007 | 2,010,007 | |||||||||
| Mid Cap Value Institutional Fund | — | 782,329 | 782,329 | |||||||||
| Small Cap Value Fund | — | 15,644 | 15,644 | |||||||||
| MSCI EAFE Equal Weight Fund | 530,374 | — | 530,374 | |||||||||
| Alpha Opportunity Fund | 263,253 | — | 263,253 | |||||||||
| Futures | Options Written | |||||||||||
| Equity | Equity | |||||||||||
| Contracts | Contracts | Total | ||||||||||
| Large Cap Core Fund | $ | — | $ | (7,733 | ) | $ | (7,733 | ) | ||||
| All Cap Value Fund | — | (331 | ) | (331 | ) | |||||||
| Mid Cap Value Fund | — | (1,503,487 | ) | (1,503,487 | ) | |||||||
| Mid Cap Value Institutional Fund | — | (580,465 | ) | (580,465 | ) | |||||||
| Small Cap Value Fund | — | (1,659 | ) | (1,659 | ) | |||||||
| Alpha Opportunity Fund | (139,087 | ) | — | (139,087 | ) | |||||||
| All Cap Value | Mid Cap Value | Mid Cap Value Institutional | Small Cap Value | |||||||||||||||||||||||||||||
| Fund | Fund | Fund | Fund | |||||||||||||||||||||||||||||
| Number of | Premium | Number of | Premium | Number of | Premium | Number of | Premium | |||||||||||||||||||||||||
| Contracts | Amount | Contracts | Amount | Contracts | Amount | Contracts | Amount | |||||||||||||||||||||||||
| Balance at September 30, 2010 | — | $ | — | 4,000 | $ | 520,297 | 1,400 | $ | 182,101 | — | $ | — | ||||||||||||||||||||
| Options written | 62 | 5,787 | 16,876 | 1,923,673 | 6,880 | 788,044 | 179 | 18,985 | ||||||||||||||||||||||||
| Options terminated in closing purchase transactions | (41 | ) | (3,813 | ) | — | — | — | — | — | — | ||||||||||||||||||||||
| Options expired | (10 | ) | (906 | ) | (9,252 | ) | (803,561 | ) | (3,760 | ) | (325,903 | ) | (148 | ) | (13,698 | ) | ||||||||||||||||
| Options exercised | (11 | ) | (1,068 | ) | (9,413 | ) | (1,071,322 | ) | (3,589 | ) | (404,725 | ) | — | — | ||||||||||||||||||
| Balance at September 30, 2011 | — | $ | — | 2,211 | $ | 569,087 | 931 | $ | 239,517 | 31 | $ | 5,287 | ||||||||||||||||||||
| Large Cap Core | All Cap Value | Mid Cap Value | Mid Cap Value Institutional | Small Cap Value | ||||||||||||||||||||||||||||||||||||
| Fund | Fund | Fund | Fund | Fund | ||||||||||||||||||||||||||||||||||||
| Number of | Premium | Number of | Premium | Number of | Premium | Number of | Premium | Number of | Premium | |||||||||||||||||||||||||||||||
| Contracts | Amount | Contracts | Amount | Contracts | Amount | Contracts | Amount | Contracts | Amount | |||||||||||||||||||||||||||||||
| Balance at September 30, 2010 | 120 | $ | 36,067 | 8 | $ | 1,057 | 8,745 | $ | 1,059,209 | 3,274 | $ | 397,441 | 17 | $ | 1,946 | |||||||||||||||||||||||||
| Options written | 0 | — | 17 | 4,520 | 18,514 | 3,574,610 | 7,518 | 1,456,974 | 74 | 12,616 | ||||||||||||||||||||||||||||||
| Options terminated in closing purchase transactions | — | — | — | — | — | — | — | — | — | — | ||||||||||||||||||||||||||||||
| Options expired | 119 | 21,832 | (11 | ) | (1,396 | ) | (8,047 | ) | (770,235 | ) | (2,956 | ) | (273,309 | ) | (17 | ) | (1,946 | ) | ||||||||||||||||||||||
| Options exercised | (120 | ) | (36,067 | ) | (10 | ) | (2,709 | ) | (6,035 | ) | (1,286,469 | ) | (2,425 | ) | (512,376 | ) | — | — | ||||||||||||||||||||||
| Balance at September 30, 2011 | 119 | $ | 21,832 | 4 | $ | 1,472 | 13,177 | $ | 2,577,115 | 5,411 | $ | 1,068,730 | 74 | $ | 12,616 | |||||||||||||||||||||||||
| Purchases | Sales | |||||||
| Large Cap Core Fund | $ | 174,716,047 | $ | 191,871,883 | ||||
| All Cap Value Fund | 1,286,759 | 934,375 | ||||||
| Mid Cap Value Fund | 446,121,828 | 388,353,911 | ||||||
| Mid Cap Value Institutional Fund | 243,506,000 | 219,105,694 | ||||||
| Small Cap Growth Fund | 16,484,693 | 18,352,785 | ||||||
| Small Cap Value Fund | 11,775,821 | 7,772,657 | ||||||
| Large Cap Concentrated Growth Fund | 59,770,723 | 68,607,807 | ||||||
| MSCI EAFE Equal Weight Fund | 184,892,745 | 194,031,099 | ||||||
| Alpha Opportunity Fund | 43,188,800 | 44,258,167 | ||||||
| Value | Value | Shares | Investment | |||||||||||||||||||||||
| Fund | Security | 09/30/10 | Additions | Reductions | 09/30/11 | 09/30/11 | Income | |||||||||||||||||||
| Mid Cap Value Fund | Common Stock: | |||||||||||||||||||||||||
| IXYS Corp. | $ | 22,347,000 | $ | 1,295,290 | $ | (1,717,014 | ) | $ | 25,422,534 | 2,336,630 | $ | — | ||||||||||||||
| Maxwell Technologies, Inc. | 21,691,467 | 2,080,327 | — | 29,779,169 | 1,617,554 | — | ||||||||||||||||||||
| Total | 44,038,467 | 3,375,617 | (1,717,014 | ) | 55,201,703 | 3,954,184 | — | |||||||||||||||||||
| Mid Cap Value Institutional Fund | ||||||||||||||||||||||||||
| Common Stock: | ||||||||||||||||||||||||||
| HydroGen Corp. | 3,924 | — | — | 18,985 | 1,265,700 | — | ||||||||||||||||||||
| Total | 3,924 | — | — | 18,985 | 1,265,700 | — | ||||||||||||||||||||
Rydex|SGI Equity Fund

November 29, 2011
| Fund | % Qualifying | |||
| Large Cap Core Fund | 100.00 | % | ||
| All Cap Value Fund | 100.00 | % | ||
| Mid Cap Value Institutional Fund | 65.13 | % | ||
| Small Cap Value Fund | 13.69 | % | ||
| MSCI EAFE Equal Weight Fund | 100.00 | % | ||
| Fund | % Qualifying | |||
| Large Cap Core Fund | 100.00 | % | ||
| All Cap Value Fund | 100.00 | % | ||
| Mid Cap Value Institutional Fund | 65.75 | % | ||
| Small Cap Value Fund | 14.16 | % | ||
| MSCI EAFE Equal Weight Fund | 100.00 | % | ||
16th Floor
New York, NY 10022
(Headquarters)
805 King Farm Boulevard
Suite 600
Rockville, MD 20850
40 Corporate Woods
Suite 850
Overland Park, KS 66210
| • | Nature, Extent and Quality of Services Provided by the Advisers. At the meeting of August 10, 2011, the Board reviewed the scope of services to be provided by the Advisers under the current investment advisory agreements, and, at the meeting of August 16, 2011, noted that there would be no significant differences between the scope of services required to be provided by the Advisers under the current investment advisory agreements (which had been recently approved by shareholders and renewed by the Board at the meeting of August 10, 2011) and the scope of services required to be provided by the Advisers under the new investment advisory agreements. The Board noted that the key investment and management personnel of the Advisers servicing the Funds were expected to remain with the Adviser following the Transaction. The Directors also considered Guggenheim Capital’s representations to the Board that the Adviser would continue to provide investment and related services that were materially the same quality and quantity as services provided to the Funds in the past, and that these services were appropriate in scope and extent in light of the Funds’ operations, the competitive landscape of the investment company business and investor needs. | ||
| • | The investment performance of the Funds. At the meeting of August 10, 2011, the Board had reviewed statistical information prepared by the Adviser regarding the expense ratio components and performance of each Fund. Based on the representations made by Guggenheim Capital that the Adviser would continue to operate following the closing of the Transaction in much the same manner as it currently operates, the Board concluded that the investment performance of the Adviser was not expected to be affected by the Transaction. | ||
| • | The cost of investment management and sub-advisory services provided and the level of profitability. At the meeting of August 10, 2011, the Board had reviewed information about the profitability of the Funds to the Adviser based on the advisory fees payable under the current investment advisory agreements. At that meeting, the Board had also analyzed the Funds’ expenses, including the investment advisory fees paid to the Adviser. At the meeting of August 16, 2011, the Board considered the fact that the fee rates payable to the Adviser would be the same under each Fund’s new investment advisory agreement as they are under such Fund’s current investment advisory agreement. With respect to anticipated profitability, the Board noted that it was too early to predict how the Transaction would affect the Adviser’s profitability with respect to the Funds, but noted that this matter would be given further consideration on an ongoing basis. | ||
| • | Whether the investment management fees reflect economies of scale. In connection with its review of the Funds’ profitability analysis at the meeting of August 10, 2011, the Board reviewed information regarding economies of scale or other efficiencies that may result from increases in the Funds’ asset levels. The Directors noted that the fees would not change under the new investment advisory agreements, and that no additional economies of scale would be directly realized as a result of the Transaction. They also noted that they will have the opportunity to again review the appropriateness of the fee payable to the Adviser under the Agreements when the next renewal of the Agreements comes before the Board. |
| • | Benefits (such as soft dollars) to the Advisers from their relationship with the Funds. In addition to evaluating the services provided by the Advisers, the Board had considered the nature, extent, quality and cost of the distribution services performed by the Distributor under a separate agreement at the meeting of August 10, 2011. The Board also considered the terms of the Transaction and the changes to the corporate ownership structure of the Adviser, noting that the Adviser would no longer be a subsidiary of Security Benefit Corporation. In this regard, the Board noted that, under the corporate structure after the Transaction, the Adviser would be more closely controlled by Guggenheim Capital, which could benefit Guggenheim Capital. The Board also noted that the costs associated with the Transaction would be borne by Guggenheim Capital (or its affiliates) and not the Funds. |
| • | The change of the Fund’s name to “MSCI EAFE Equal Weight Fund;” | ||
| • | The change of the Fund’s’ investment objective to “performance that corresponds, before fees and expenses, to the price and yield performance of the MSCI EAFE Equal Weighted Index;” | ||
| • | The change of the Fund’s investment strategies to reflect the new name and investment objective; | ||
| • | The change of the Fund’s benchmark index in light of the foregoing changes to the Fund’s investment objective and strategies; and | ||
| • | A new lower investment advisory fee of 0.70% of average daily net assets on an annual basis (instead of 1.00% currently). | ||
| • | The creation of the new Institutional Class in MSCI EAFE Equal Weight Fund. |
| Name | ||
| (Date of Birth) | Principal Occupations | |
| Year Elected*** | During Past Five Years | |
Donald A. Chubb, Jr.** (12-14-46) 1994 | Business Broker — Griffith & Blair Realtors | |
Harry W. Craig, Jr.** (05-11-39) 2004 | Chairman, CEO, Secretary & Director — The Martin Tractor Company, Inc. | |
Jerry B. Farley** (09-20-46) 2005 | President — Washburn University | |
Penny A. Lumpkin** (08-20-39) 1993 | Partner — Vivian’s Gift Shop (Corporate Retail) Vice President — Palmer Companies, Inc. (Small Business and Shopping Center Development) Vice President — PLB (Real Estate Equipment Leasing) | |
Maynard F. Oliverius** (12-18-43) 1998 | President & Chief Executive Officer — Stormont-Vail HealthCare | |
Richard M. Goldman* (03-04-61) 2008 (President, Director & Chairman of the Board) | Senior Vice President — Security Benefit Corporation (2007 to present) Chief Executive Officer — Security Benefit Asset Management Holdings, LLC (2010 to present) Chief Executive Officer & Manager — Rydex Holdings, LLC (2009 to present) President, CEO & Member Representative — Security Investors, LLC (2007 to present) President, Chief Executive Officer and Manager — Rydex Distributors, LLC (2009 to present) Manager — Rydex Fund Services, LLC (2009 to present) President — SBL Fund, Security Equity Fund, Security Income Fund, Security Large Cap Value Fund and Security Mid Cap Growth Fund (2008 to present) Director — First Security Benefit Life and Annuity Insurance Company of New York (2007 to 2010) Director and Chief Executive Officer — Rydex Advisors, LLC (2009 to 2010) Director and Chief Executive Officer — Rydex Advisors II, LLC (2009 to 2010) Manager and President — Security Global Investors, LLC (2007 to 2010) Director — Security Distributors, Inc. (2007 to 2009) Managing Member — R.M. Goldman Partner, LLC (2006 to 2007) |
| * | This Director is deemed to be an “interested person” of the Funds under the 1940 Act, as amended, by reason of his position with the Funds’ Investment Manager and/or the parent of the Investment Manager. This Director is also an officer of the funds. | |
| ** | These Directors serve on the Fund’s joint audit committee, the purpose of which is to meet with the independent registered public accounting firm, to review the work of the independent registered public accounting firm, and to oversee the handling by Security Investors of the accounting and financial reporting functions for the Funds. | |
| *** | Each Director oversees 28 Security Funds portfolios and serves until the next annual meeting, or until a successor has been duly elected and qualified. |
| Name | ||
| (Date of Birth) | Principal Occupations | |
| Title — Year Elected | During Past Five Years | |
Mark P. Bronzo (11-01-60) Vice President — 2008 | Current: Portfolio Manager, Security Investors, LLC Previous: Managing Director and Chief Compliance Officer, Nationwide Separate Accounts LLC (2003-2008) | |
Keith A. Fletcher (02-18-58) Vice President — 2010 | Current: Senior Vice President, Security Investors, LLC; Vice President, Rydex Holdings, LLC; Vice President, Rydex Specialized Products, LLC; Vice President, Rydex Distributors, LLC; Vice President, Rydex Fund Services, LLC; Vice President and Director, Advisor Research Center, Inc.; and Vice President, SBL Fund; Security Equity Fund; Security Income Fund; Security Large Cap Value Fund & Security Mid Cap Growth Fund Previous: Security Global Investors, LLC, Vice President (2010-2011); Rydex Advisors, LLC (f/k/a PADCO Advisors, Inc.) & Rydex Advisors II, LLC (f/k/a PADCO Advisors II, Inc.), Vice President (2009-2011); Lyster Watson and Company, Managing Director (2007-2008); and Fletcher Financial Group, Inc., Chief Executive Officer (2004-2007) | |
Joanna Haigney (10-10-66) Chief Compliance Officer — 2010 | Current: Chief Compliance Officer & Secretary, SBL Fund; Security Equity Fund; Security Income Fund; Security Large Cap Value Fund & Security Mid Cap Growth Fund; Vice President, Rydex Holdings, LLC; Vice President, Security Benefit Asset Management Holdings, LLC; and Senior Vice President & Chief Compliance Officer, Security Investors, LLC Previous: Security Global Investors, LLC, Senior Vice President (2010-2011); Rydex Advisors, LLC (f/k/a PADCO Advisors, Inc.) and Rydex Advisors II, LLC (f/k/a PADCO Advisors II, Inc.), Chief Compliance Officer and Senior Vice President (2010-2011); Rydex Capital Partners I, LLC & Rydex Capital Partners II, LLC, Chief Compliance Officer (2006-2007); and Rydex Fund Services, LLC (f/k/a Rydex Fund Services, Inc.), Vice President (2001-2006) | |
Nikolaos Bonos (05-30-63) Treasurer — 2010 | Current: Senior Vice President, Security Investors, LLC; Chief Executive Officer & Manager, Rydex Specialized Products, LLC; Chief Executive Officer & President, Rydex Fund Services, LLC; Vice President, Rydex Holdings, LLC; Treasurer, SBL Fund; Security Equity Fund; Security Income Fund; Security Large Cap Value Fund & Security Mid Cap Growth Fund; and Vice President, Security Benefit Asset Management Holdings, LLC Previous: Security Global Investors, LLC, Senior Vice President (2010-2011); Rydex Advisors, LLC (f/k/a PADCO Advisors, Inc.) Senior Vice President (2006-2011); Rydex Fund Services, LLC (f/k/a Rydex Fund Services, Inc.), Director (2009) & Senior Vice President (2003-2006); and Rydex Specialized Products, LLC, Chief Financial Officer (2005-2009) |
| * | Officers serve until the next annual meeting or until a successor has been duly elected and qualified. |
| Name | ||
| (Date of Birth) | Principal Occupations | |
| Title — Year Elected | During Past Five Years | |
Joseph M. Arruda (09-05-66) Assistant Treasurer — 2010 | Current: Assistant Treasurer, SBL Fund; Security Equity Fund; Security Income Fund; Security Large Cap Value Fund & Security Mid Cap Growth Fund; Vice President, Security Investors, LLC; and Chief Financial Officer & Manager, Rydex Specialized Products, LLC Previous: Security Global Investors, LLC, Vice President (2010- 2011); and Rydex Advisors, LLC (f/k/a PADCO Advisors, Inc.) & Rydex Advisors II, LLC (f/k/a PADCO Advisors II, Inc.), Vice President (2004-2011) | |
Amy J. Lee (06-05-61) Vice President — 2007 Secretary — 1987 | Current: Senior Vice President & Secretary, Security Investors, LLC; Secretary & Chief Compliance Officer, Security Distributors, Inc.; Vice President, Associate General Counsel & Assistant Secretary, Security Benefit Life Insurance Company and Security Benefit Corporation; Associate General Counsel, First Security Benefit Life Insurance and Annuity of New York; Vice President & Secretary, SBL Fund; Security Equity Fund; Security Income Fund; Security Large Cap Value Fund & Security Mid Cap Growth Fund; Vice President & Secretary, Rydex Holdings, LLC; Secretary, Advisor Research Center, Inc., Rydex Specialized Products, LLC, Rydex Distributors, LLC and Rydex Fund Services, LLC; and Assistant Secretary, Security Benefit Clinic and Hospital Previous: Security Global Investors, LLC, Senior Vice President & Secretary (2007-2011); Rydex Advisors, LLC (f/k/a PADCO Advisors, Inc.) & Rydex Advisors II, LLC (f/k/a PADCO Advisors II, Inc.), Senior Vice President & Secretary (2010-2011); and Brecek & Young Advisors, Inc., Director (2004-2008) | |
Mark A. Mitchell (08-24-64) Vice President — 2003 | Current: Portfolio Manager, Security Investors, LLC Previous: Vice President and Portfolio Manager, Security Benefit Life Insurance Company (2003-2010) | |
Joseph C. O’Connor (07-15-60) Vice President — 2008 | Current: Portfolio Manager, Security Investors, LLC Previous: Managing Director, Nationwide Separate Accounts LLC (2003-2008) | |
Daniel W. Portanova (10-02-60) Vice President — 2008 | Current: Portfolio Manager, Security Investors, LLC Previous: Managing Director, Nationwide Separate Accounts LLC (2003-2008) | |
James P. Schier (12-28-57) Vice President — 1998 | Current: Senior Portfolio Manager, Security Investors, LLC Previous: Vice President & Senior Portfolio Manager, Security Benefit Life Insurance Company (1998-2010) | |
David G. Toussaint (10-10-66) Vice President — 2005 | Current: Portfolio Manager, Security Investors, LLC Previous: Assistant Vice President and Portfolio Manager, Security Benefit Life Insurance Company (2005-2009) |
| * | Officers serve until the next annual meeting or until a successor has been duly elected and qualified. |

Topeka, Kansas 66636-0001
www.rydex-sgi.com
Rydex Distributors, Inc.
SBE-ANN
| Item 2. | Code of Ethics. |
| Item 3. | Audit Committee Financial Expert. |
| Item 4. | Principal Accountant Fees and Services. |
| (a) | Audit Fees. The aggregate fees billed for each of the last two fiscal years (the “Reporting Periods”) for professional services rendered by the Registrant’s principal accountant (the “Auditor”) for the audit of the Registrant’s annual financial statements, or services that are normally provided by the Auditor in connection with the statutory and regulatory filings or engagements for the Reporting Periods, were $171,900 in 2010 and $158,660 in 2011. |
| (b) | Audit-Related Fees. The aggregate fees billed in the Reporting Periods for assurance and related services by the Auditor that are reasonably related to the performance of the audit of the Registrant’s financial statements and are not reported under paragraph (a) of this Item 4 were $5,400 in 2010 and $5,046 in 2011. These services consisted of financial reporting advisory services. | |
| The aggregate fees billed in the Reporting Periods for assurance and related services by the Auditor to the Registrant’s investment adviser (not including any sub-investment adviser whose role is primarily portfolio management and is subcontracted with or overseen by another investment adviser), and any entity controlling, controlled by or under common control with the investment adviser that provides ongoing services to the Registrant (“Service Affiliates”) which required pre-approval by the Audit Committee were $9,250 in 2010 and $30,000 in 2011, which related to the review of the transfer agent function. |
| __________ |
| (c) | Tax Fees. The aggregate fees billed to the Registrant in the Reporting Periods for professional services rendered by the Auditor for tax compliance, tax advice and tax planning (“Tax Services”) were $38,700 in 2010 and $31,733 in 2011. |
| The aggregate fees billed in the Reporting Periods for Tax Services by the Auditor to Service Affiliates which required pre-approval by the Audit Committee were $0 in 2010 and $0 in 2011. |
| __________ |
| (d) | All Other Fees. The aggregate fees billed to the Registrant in the Reporting Periods for products and services provided by the Auditor, other than the services reported in paragraphs (a) through (c) of this Item, were $0 in 2010 and $0 in 2011. | |
| The aggregate fees billed in the Reporting Periods for Non-Audit Services by the Auditor to Service Affiliates, other than the services reported in paragraphs (b) through (d) of this Item, which required pre-approval by the Audit Committee were $0 in 2010 and $0 in 2011. |
| __________ |
| (e) | (1 | ) | Audit Committee Pre-Approval Policies and Procedures. The Registrant’s Audit Committee has established policies and procedures for pre-approval of the auditor’s engagements for audit and non-audit services to the Registrant. Pre-approval considerations include whether the proposed services are compatible with maintaining the auditor’s independence as specified in applicable rules. | |||
| (e) | (2 | ) | Percentage of Non-Audit Services Approved under (c)(7)(i)(C). The percentage of the services described in each of (b) through (d) of this Item 4 (only those that relate to the Registrant) that were approved by the Audit Committee pursuant to paragraph (c)(7)(i)(C) of Rule 2-01 of Regulation S-X was 0%, 0% and 0%, respectively. |
| (f) | Not applicable. |
| (g) | Non-Audit Fees. The aggregate non-audit fees were for audit-related and tax services rendered to the Registrant, and rendered to Service Affiliates, for the Reporting Periods were $53,350 in 2010 and $66,779 in 2011. |
| (h) | Auditor Independence. The Registrant’s Audit Committee was provided with information relating to the provision of non audit services by Ernst & Young, LLP to the Registrant’s investment adviser (not including any sub-adviser whose role is primarily portfolio management and is subcontracted with or overseen by another investment adviser), and any entity controlling, controlled by, or under common control with the investment adviser that provides ongoing services to the registrant that were not pre approved by the Audit Committee so that a determination could be made whether the provision of such services is compatible with maintaining Ernst & Young, LLP’s independence. |
| Item 5. | Audit Committee of Listed Registrants. |
| Not applicable. |
| Item 6. | Investments. |
| The Schedule of Investments is included under Item 1 of this form. |
| Item 7. | Disclosure of Proxy Voting Policies and Procedures for Closed-End Management Investment Companies. |
| Not applicable. |
| Item 8. | Portfolio Mangers of Closed-end Management Investment Companies |
| Not applicable |
| Item 9. | Purchases of Equity Securities by Closed-End Management Investment Company and Affiliated Purchasers. |
| Not applicable. |
| Item 10. | Submission of Matters to a Vote of Security Holders. |
| Item 11. | Controls and Procedures. |
| (a) | The registrant’s President (principal executive officer) and Treasurer (principal financial officer) have evaluated the registrant’s disclosure controls and procedures within 90 days of this filing and have concluded that the registrant’s disclosure controls and procedures were effective as of that date in ensuring that information required to be disclosed by the registrant in this Form N-CSR was recorded, processed, summarized, and reported timely. | ||
| (b) | The registrant’s principal executive officer and principal financial officer are aware of no change in the registrant’s internal control over financial reporting that occurred during the registrant’s second fiscal quarter covered by this report that has materially affected, or is reasonably likely to materially affect, the registrant’s internal control over financial reporting. |
| Item 12. | Exhibits. |
| (a)(2) | Separate certifications by the President (principal executive officer) and Treasurer (principal financial officer) of the registrant as required by Rule 30a-2(a) under the Act (17 CFR 270.30a-2(a)) are attached. | ||
| (b) | A certification by the registrant’s President (principal executive officer) and Treasurer (principal financial officer) as required by Rule 30a-2(b) under the Act (17 CFR 270.30a-2(b)) is attached. |
| (Registrant) | Security Equity Fund | |||
| By (Signature and Title)* | /s/ Richard M. Goldman | |||
| Date: December 8, 2011 |
| By (Signature and Title)* | /s/ Richard M. Goldman | |||
| Date: December 8, 2011 | ||||
| By (Signature and Title)* | /s/ Nikolaos Bonos | |||
| Date: December 8, 2011 |
| * | Print the name and title of each signing officer under his or her signature. |