UNITED STATES
SECURITIES AND EXCHANGE COMMISSION
Washington, D.C. 20549
FORM N-CSR/A
CERTIFIED SHAREHOLDER REPORT OF REGISTERED
MANAGEMENT INVESTMENT COMPANIES
Investment Company Act file number: 811-06637
The UBS Funds
(Exact name of registrant as specified in charter)
One North Wacker Drive, Chicago, IL 60606-2807
(Address of principal executive offices) (Zip code)
Keith A. Weller, Esq. UBS Asset Management One North Wacker Drive Chicago, IL 60606 |
| (Name and address of agent for service) |
| Copy to: |
Bruce G. Leto, Esq. Stradley Ronon Stevens & Young, LLP 2005 Market Street, Suite 260 Philadelphia, PA 19103-7098 |
Registrant’s telephone number, including area code: 312-525-7100
Date of fiscal year end: June 30
Date of reporting period: June 30, 2021
This NCSR/A for The UBS Funds (the ”Registrant”) is being filed solely to reflect changes in the annual report with respect to certain returns for benchmark indices for the UBS Municipal Bond Fund. The annual report as it relates to the other series of the Registrant is contained in the Form N-CSR filed on September 7, 2021 (Accession Number 0001104659-21-113435) and is not amended or modified in any way by this Form N-CSR/A. This Form N-CSR/A also updates item 11 “Control and Procedures” with respect to the UBS Municipal Bond Fund as required. Other than the aforementioned amendment, no other information or disclosures contained in the Registrant’s Form N-CSR filed on September 7, 2021 is being amended by this Form N-CSR/A.
Item 1. Reports to Stockholders.
| (a) | Copy of the report transmitted to shareholders: |

The UBS Funds
Annual Report | June 30, 2021
Table of contents | Page | ||||||
President's letter | 1 | ||||||
Market commentary | 3 | ||||||
UBS All China Equity Fund | 5 | ||||||
UBS Dynamic Alpha Fund | 12 | ||||||
UBS Global Allocation Fund | 26 | ||||||
UBS Emerging Markets Equity Opportunity Fund | 42 | ||||||
UBS Engage For Impact Fund | 48 | ||||||
UBS International Sustainable Equity Fund | 56 | ||||||
UBS US Dividend Ruler Fund | 66 | ||||||
UBS US Quality Growth At Reasonable Price Fund | 73 | ||||||
UBS U.S. Small Cap Growth Fund | 80 | ||||||
UBS Municipal Bond Fund | 88 | ||||||
UBS Sustainable Development Bank Bond Fund | 96 | ||||||
UBS Total Return Bond Fund | 103 | ||||||
Glossary of terms used in the Portfolio of investments | 117 | ||||||
Explanation of expense disclosure | 118 | ||||||
Statement of assets and liabilities | 122 | ||||||
Statement of operations | 130 | ||||||
Statement of changes in net assets | 134 | ||||||
Financial highlights | 139 | ||||||
Notes to financial statements | 152 | ||||||
Report of independent registered public accounting firm | 184 | ||||||
Federal tax information | 186 | ||||||
General information | 187 | ||||||
Board approval of investment advisory agreements | 188 | ||||||
Trustee and officer information | 193 | ||||||
President's letter
August 12, 2021
Dear Shareholder,
When I last wrote you, we had closed out an unprecedented year, the world, markets and the global economy were in various stages of recovery from the most harrowing global crisis in many of our lifetimes.
In 2021, the arc of the first half was one of continued economic recovery and reopening around the world as well as optimism in the markets, but within an overarching storyline of uncertainty, ups and downs.
Global equity markets continued to rally following last year's remarkable recovery from a short, sharp bear market. In the first half, the S&P 500 Index1 gained 40.79% and reached several new all-time highs, international developed equities also posted strong gains, with the MSCI EAFE Index (net),2 returning 32.35%, while emerging markets equities also rallied, as the MSCI Emerging Markets Index (net),3 gained 40.90%, fueled in part by easy monetary policy and generous fiscal policy.
The US Federal Reserve continued to maintain its extremely accommodative policy, with the federal funds target rate at its lower bound of 00.0%-0.25%, and continued asset purchases. Globally, developed market central banks also continued to maintain low, and even negative, policy rates.
The global backdrop of low rates has continued to support economic recovery and markets as well, while challenging fixed income investors: the amount of global debt with negative yields had grown to about USD 14 trillion at the end of the second half, from zero around 2014, accounting for nearly 20% of the Bloomberg Barclays Global Aggregate Index4.
The overall global fixed income market has had weak results over the 12 months ended June 30th. The yield on the US 10-year Treasury rose from 0.66% to 1.45% and 10-year developed market government bond yields outside the US also moved higher. The overall US bond market, as measured by the Bloomberg Barclays US Aggregate Index,5 returned -0.33%.
Meanwhile, fiscal stimulus has remained supportive in the first half of 2021. In March, just months after he was sworn in US President Joe Biden signed off on an additional $1.9 trillion relief package, which included more direct payments to many Americans, and further stimulus from the US Congress in the form of a massive infrastructure bill appears well on its way.
1 The S&P 500 Index is an unmanaged, weighted index composed of 500 widely held common stocks varying in composition and is not available for direct investment. Investors should note that indices do not reflect the deduction of fees and expenses.
2 The MSCI EAFE Index (net) is an index of stocks designed to measure the investment returns of developed economies outside of North America. Net total return indices reinvest dividends after the deduction of withholding taxes, using a tax rate applicable to non-resident institutional investors who do not benefit from double taxation treaties. The index is constructed and managed with a view to being fully investable from the perspective of international institutional investors. Investors should note that indices do not reflect the deduction of fees and expenses.
3 The MSCI Emerging Markets Index (net) is a market capitalization-weighted index composed of different emerging market countries in Europe, Latin America, and the Pacific Basin. Net total return indices reinvest dividends after the deduction of withholding taxes, using a tax rate applicable to non-resident institutional investors who do not benefit from double taxation treaties. The index is constructed and managed with a view to being fully investable from the perspective of international institutional investors. Investors should note that indices do not reflect the deduction of fees and expenses.
4 The Bloomberg Barclays Global Aggregate Index is a measure of global investment grade debt from 24 local currency markets. This multi-currency benchmark includes Treasury, government-related, corporate and securitized fixed-rate bonds from both developed and emerging markets issuers. Investors should note that indices do not reflect the deduction of fees and expenses.
5 The Bloomberg Barclays US Aggregate Index is an unmanaged broad based index designed to measure the US dollar-denominated, investment-grade, taxable bond market. The index includes bonds from the Treasury, government-related, corporate, mortgage-backed, asset-backed and commercial mortgage-backed sectors. Investors should note that indices do not reflect the deduction of fees and expenses.
1
President's letter
And even as the pace of growth slowed in the US, from 33.4% in the third quarter of 2020, the largest quarterly increase in US GDP ever, to a still above trend 6.3% rise in the first quarter of 2021, company earnings in the first quarter of the year were among the best ever recorded. First quarter S&P 500 profits rose by roughly 50% year-over-year, surpassing consensus expectations by more than 20%.
With more than half of the population having received at least one dose of the vaccine by the end of June, new COVID-19 cases were at their lowest levels since the early days of the pandemic, enabling more of the economy to reopen.
On the other hand, new strains of the COVID-19 virus continued to appear, and the particularly virulent Delta variant was proving persistent, feeding new outbreaks and hotspots around the world.
The June consumer price index report showed the headline annual rate at a 20-year high of 5.4% in May. This fueled initial panic which dissipated as markets debated whether the surge in inflation would prove transitory. While the Fed appeared to support this theory, as of the June Federal Open Market Committee meeting, officials forecast two rate hikes in 2023, up from zero in March.
Now the potential beginning of tapering of central bank support has come to the forefront of global economic and market dialogue.
As markets continue to weigh potential threats to growth, rising inflation and interest rates against a robust economic and market recovery, it appears the storyline of a world dealing with and healing from the COVID-19 crisis will continue to include twists and turns and questions yet to be answered ... and volatility.
With the potential for continued volatility ahead, the timeless challenge of building a genuinely diversified portfolio capable of delivering growth and downside protection takes on an added degree of difficulty given the low starting point for sovereign bond yields across advanced economies.
We believe that there are many diverse and compelling opportunities across global asset classes and that the right strategies in the hands of skilled investment professionals have the potential to deliver better investment outcomes for our clients.
As always, we thank you for being a part of the UBS family of funds.
Sincerely,

Igor Lasun
President
The UBS Funds
Managing Director
UBS Asset Management (Americas) Inc.
2
The markets in review
An economic rebound
The US economy rebounded sharply following the dramatic downturn due to the COVID-19 global pandemic. Looking back, with large parts of the economy locked down, second quarter 2020 U.S. annualized gross domestic product ("GDP") was down -31.4% versus the previous quarter. This was the largest quarterly contraction on record. With the economy reopening, third quarter GDP growth was 33.4%, the largest quarterly increase ever. GDP growth in the U.S. was then 4.3% and 6.3% during the fourth quarter of 2020 and the first quarter of 2021, respectively. Finally, the Commerce Department's initial estimate for second quarter annualized GDP growth—released after the reporting period ended—was 6.5%.
The US Federal Reserve Board (the "Fed") maintained its highly accommodative monetary policy during the reporting period. Throughout the 12 months ended June 30, 2021, the Fed maintained the federal funds rate in a record-low range between 0.00% and 0.25%. The Fed also continued to purchase Treasury and mortgage securities, as well as individual corporate bonds. While inflation picked up late in the period, at its June 2021 meeting they stated, "Progress on vaccinations has reduced the spread of COVID-19 in the United States... Inflation has risen, largely reflecting transitory factors." However, Fed officials pushed forward the time table for raising rates and now projects that it would institute two interest rate increases by the end of 2023, versus in 2024. Central banks outside the US, including the European Central Bank, the Bank of England and the Bank of Japan, also maintained their highly accommodative monetary policies.
From a global perspective, in its April 2021 World Economic Outlook Update, the International Monetary Fund ("IMF") said, "Global prospects remain highly uncertain one year into the pandemic. New virus mutations and the accumulating human toll raise concerns, even as growing vaccine coverage lifts sentiment. Economic recoveries are diverging across countries and sectors, reflecting variation in pandemic-induced disruptions and the extent of policy support. The outlook depends not just on the outcome of the battle between the virus and vaccines—it also hinges on how effectively economic policies deployed under high uncertainty can limit lasting damage from this unprecedented crisis." From a regional perspective, the IMF projects the U.S. economy will grow 6.4% in 2021, compared to a 3.5% contraction in 2020. Elsewhere, the IMF expects 2021 GDP growth in the eurozone, U.K. and Japan will be 4.4%, 5.3% and 3.3%, respectively.
Global equities rally sharply
The global equity market produced exceptional results during the reporting period. Supporting the market were the continued COVID-19 vaccine rollout, aggressive monetary and fiscal policy and improving corporate profits. While there were periods of weakness, they were short lived and investor demand for equities was robust overall. For the 12 months ended June 30, 2021, the S&P 500 Index1 gained 40.79% and reached several new all-time highs. Outside the US, international developed equities, as measured by the MSCI EAFE Index (net),2 returned 32.35% during the reporting period, while emerging markets equities, as measured by the MSCI Emerging Markets Index (net),3 gained 40.90%.
1 The S&P 500 Index is an unmanaged, weighted index composed of 500 widely held common stocks varying in composition and is not available for direct investment. Investors should note that indices do not reflect the deduction of fees and expenses.
2 The MSCI EAFE Index (net) is an index of stocks designed to measure the investment returns of developed economies outside of North America. Net total return indices reinvest dividends after the deduction of withholding taxes, using a tax rate applicable to non-resident institutional investors who do not benefit from double taxation treaties. The index is constructed and managed with a view to being fully investable from the perspective of international institutional investors. Investors should note that indices do not reflect the deduction of fees and expenses.
3 The MSCI Emerging Markets Index (net) is a market capitalization-weighted index composed of different emerging market countries in Europe, Latin America, and the Pacific Basin. Net total return indices reinvest dividends after the deduction of withholding taxes, using a tax rate applicable to non-resident institutional investors who do not benefit from double taxation treaties. The index is constructed and managed with a view to being fully investable from the perspective of international institutional investors. Investors should note that indices do not reflect the deduction of fees and expenses.
3
The markets in review
The overall fixed income market weakens
The overall global fixed income market generated weak results over the reporting period. Developed market central banks maintained their highly accommodative monetary policies to support their economies. While inflation moved higher, the US Fed characterized the increase as being transitory. Regardless, with global growth improving and inflation rising, both short- and long-term US Treasury yields moved sharply higher (bond yields and prices generally move in the opposite direction). For the 12-month reporting period as a whole, the yield on the US 10-year Treasury rose from 0.66% to 1.45%. 10-year developed market government bond yields outside the US also moved higher. The overall US bond market, as measured by the Bloomberg Barclays US Aggregate Index,4 returned -0.33% during the 12-months ended June 30, 2021. Returns of riskier fixed income securities were positive. High yield bonds, as measured by the ICE BofAML US High Yield Cash Pay Constrained Index,5 returned 15.45%. Elsewhere, emerging markets debt, as measured by the J.P. Morgan Emerging Markets Bond Index Global (EMBI Global),6 gained 6.81% during the reporting period.
4 The Bloomberg Barclays US Aggregate Index is an unmanaged broad based index designed to measure the US dollar-denominated, investment-grade, taxable bond market. The index includes bonds from the Treasury, government-related, corporate, mortgage-backed, asset-backed and commercial mortgage-backed sectors. Investors should note that indices do not reflect the deduction of fees and expenses.
5 The ICE BofAML US High Yield Cash Pay Constrained Index is an unmanaged index of publicly placed, non-convertible, coupon-bearing US dollar denominated, below investment grade corporate debt with a term to maturity of at least one year. The index is market capitalization weighted, so that larger bond issuers have a greater effect on the index's return. However, the representation of any single bond issuer is restricted to a maximum of 2% of the total index. Investors should note that indices do not reflect the deduction of fees and expenses.
6 The J.P. Morgan Emerging Markets Bond Index Global (EMBI Global) is an unmanaged index which is designed to track total returns for US dollar denominated debt instruments issued by emerging market sovereign and quasi-sovereign entities: Brady bonds, loans and Eurobonds. Investors should note that indices do not reflect the deduction of fees and expenses.
4
UBS All China Equity Fund
Portfolio performance
From its inception on February 23, 2021, through June 30, 2021, Class P shares of UBS All China Equity Fund (the "Fund") returned -11.60%. The Fund's benchmark, the MSCI China All Shares Index (the "Index"), returned -7.53% over the same time period. (Please note that the Fund's returns do not reflect the deduction of taxes that a shareholder would pay on Fund distributions or the redemption of Fund shares, while the Index returns do not reflect the deduction of fees and expenses.)
The Fund's performance was driven primarily by stock selection decisions.
Portfolio performance summary1
What worked:
• Within stock selection, Li Ning was the top contributor to Fund performance from the period since inception through June 30, 2021.
– Shares of Li Ning rose as the company issued positive profit guidance for the first half of 2021, significantly ahead of Wall Street expectations. Demand for domestic footwear and apparel brands is benefiting from the shift in Chinese consumers' preference for local brands following the issues about cotton from Xinjiang raised by several global brands.
• Several other stock selection decisions benefited performance during the reporting period.
– Chinasoft, an information technology (IT) company, outperformed as investors rewarded the growing diversification of its business toward internet-based IT services, the cloud and big data, as well as growing its customer base beyond Huawei.
– CSPC Pharmaceutical is an integrated pharmaceutical company in China. The company is evolving from its traditional pharma model into a more innovation-focused model with sustainable earnings growth and healthy cashflows. The company provided strong guidance for its 2021 outlook and in-licensing of two new novel assets to boost its pipeline.
– The Fund holds Alibaba, a technology company that specializes in e-commerce, despite the recent correction in the share price, which was due to concerns about anti-trust regulations. We believe that Alibaba is a high-quality name in the space. (For details, see "Portfolio highlights.")
– An underweight position in Baidu, a technology company that provides internet search and online marketing solutions, benefited relative performance as the market saw a selloff in technology names during the reporting period.
• The Fund did not invest in derivatives during the reporting period.
What didn't work:
• Certain stock selection decisions detracted from Fund returns during the reporting period.
– Shares of TAL Education and New Oriental Education declined based on concerns that new regulations might impact the profitability of the after-school tutoring sector. While some measures have the potential to affect the companies' stock prices, we believe the regulations will likely strengthen the industry leaders, who are better able to withstand the impact and the cost of implementing the rules. In addition, academic performance is expected to remain the decisive factor for students to enter high-quality schools and universities. We continue to hold stock in Tal Education. We sold New Oriental Education during the reporting period.
1 For a detailed commentary on the market environment in general during the reporting period, see page 3.
5
UBS All China Equity Fund
– Ping An Insurance declined as investors took profits before the US Federal Open Market Committee meeting in anticipation of potential tighterning. The share price recovered slightly after the Federal Reserve announced a continued accommodative stance, but still underperformed. We continue to hold this stock. (For details, see "Portfolio highlights.")
– Tencent underperformed due to investor concerns about the company's profit margins in 2021, after the company announced plans to reinvest heavily in key areas as part of social responsibility efforts. In addition, investors feared that the games business might slow down due to a high base and lack of new game launches. We continue to hold this stock. (For details, see "Portfolio highlights.")
– Yihai International underperformed in the second quarter of 2021 as the market rotated from favoring 2020's outperformers to the laggards. Additionally, the company's stock suffered from weak growth guidance from management for the first half of 2021, given the weaker-than-expected recovery in related party channel and increasing brand investments. While we believe that Yihai's brand power, research & development capability, and channel management are still among the best in the market, we are closely monitoring the stock for signs of a growth recovery. We continue to hold this stock.
Portfolio highlights
• Tencent is the leading company in China's PC/mobile internet market, and provides services such as instant messaging, online gaming, social community, news and online music. Tencent has established several powerful online service platforms and accumulated a huge number of loyal customers. With its current strong position, we expect the company to ride on the mature business models and consistently grow its business going forward. Fast-growing online games—along with newly emerging mobile games, which is one of the largest revenue-generating segments—will likely contribute most to the company going forward.
• Alibaba is a large e-commerce company. We believe that e-commerce penetration will continue to grow in China, even in the midst of a retail slowdown. Thus, we consider it a more defensive part of retail sales, and we believe Alibaba has the strongest position in China's e-commerce space.
• Kweichow Moutai engages in the manufacture and distribution of Moutai liquor series products. Moutai is a Chinese premium liquor brand with strong pricing power and growth visibility. We believe share price is attractively valued, and the company offers the potential to benefit from state-owned enterprise (SOE) reform.
• Netease is a leading online game company in China. It has a good track record for delivering blockbuster games, and has posted healthy growth for more than 10 years. We believe that Netease continues to have a strong game pipeline and will be able to deliver new revenue streams. The company is well-positioned as a leading player in China's online entertainment sectors, particularly online games and music.
• We believe Ping An Insurance is well-placed to benefit from the structural growth in investment and retirement needs of the aging Chinese population. Premium penetration remains low compared to more developed Asian economies.
This letter is intended to assist shareholders in understanding how the Fund performed during the period from February 23, 2021, through June 30, 2021. The views and opinions in the letter were current as of August 12, 2021. They are not guarantees of future performance or investment results and should not be taken as investment advice. Investment decisions reflect a variety of factors, and we reserve the right to change our views about individual securities, sectors and markets at any time. As a result, the views expressed should not be relied upon as a forecast of the Fund's future investment intent. We encourage you to consult your financial advisor regarding your personal investment program.
Mutual funds are sold by prospectus only. You should read it carefully and consider a fund's investment objectives, risks, charges, expenses and other important information contained in the prospectus before investing. Prospectuses for most of our funds can be obtained from your financial advisor, by calling UBS Funds at 800-647 1568 or by visiting our website at www.ubs.com/am-us.
6
UBS All China Equity Fund
Average annual total returns for periods ended 06/30/21 (unaudited)
1 year | Inception1 | ||||||||||
Class P2 | N/A | (11.60 | )% | ||||||||
MSCI China All Shares Index (net)3 | 27.69 | % | (7.53 | ) | |||||||
The annualized gross and net expense ratios, respectively, for each class of shares as in the October 28, 2020 prospectuses were as follows: Class P—1.45% and 1.10%. Net expenses reflect fee waivers and/or expense reimbursements, if any, pursuant to an agreement that is in effect to cap the expenses. The Trust, with respect to the Fund, and UBS Asset Management (Americas) Inc., the Fund's investment advisor and administrator ("UBS AM (Americas)" or the "Advisor"), have entered into a written agreement pursuant to which the Advisor has agreed to waive a portion of its management fees and/or to reimburse expenses (excluding expenses incurred through investment in other investment companies, interest, taxes, brokerage commissions and extraordinary expenses) to the extent necessary so that the Fund's ordinary operating expenses (excluding expenses incurred through investment in other investment companies, interest, taxes, brokerage commissions and extraordinary expenses), through the period ending October 28, 2021, do not exceed 1.10% for Class P shares. Pursuant to the written agreement, the Advisor is entitled to be reimbursed for any fees it waives and expenses it reimburses to the extent such reimbursement can be made during the three fiscal years following the date on which such fee waivers and expense reimbursements were made, provided that the reimbursement of the Advisor by the Fund will not cause the Fund to exceed the lesser of any applicable expense limit that is in place for the Fund (i) at the time of the waiver or reimbursement or (ii) at the time of the recoupment. The fee waiver/expense reimbursement agreement may be terminated by the Fund's Board of Trustees at any time and also will terminate automatically upon the expiration or termination of the Fund's advisory contract with the Advisor. Upon termination of the fee waiver/expense reimbursement agreement, however, UBS AM (Americas)'s three year recoupment rights will survive.
1 Inception date of Class P of UBS All China Equity Fund is February 23, 2021.
2 Class P shares do not bear initial or contingent deferred sales charges or ongoing 12b-1 service and distribution fees, but Class P shares held through advisory programs may be subject to a program fee, which, if included, would have reduced performance.
3 The MSCI China All Shares Index (net) is a free float-adjusted market capitalization weighted index that is designed to measure the equity market performance of developed and emerging markets. Net total return indices reinvest dividends after the deduction of withholding taxes, using a tax rate applicable to non-resident institutional investors who do not benefit from double taxation treaties. The index is constructed and managed with a view to being fully investable from the perspective of international institutional investors. Investors should note that indices do not reflect the deduction of fees and expenses.
Past performance does not predict future performance, and the performance information provided does not reflect the deduction of taxes that a shareholder would pay on Fund distributions or the redemption of Fund shares. The return and principal value of an investment will fluctuate, so that an investor's shares, when redeemed, may be worth more or less than their original cost. Performance results assume reinvestment of all dividends and capital gain distributions at net asset value on the ex-dividend dates. Current performance may be higher or lower than the performance data quoted. For month-end performance figures, please visit www.ubs.com/us-mutualfundperformance.
7
UBS All China Equity Fund
Illustration of an assumed investment of $2,000,000 in Class P shares (unaudited)
The following graph depict the performance of UBS All China Equity Fund Fund Class P shares versus the MSCI All China Index from February 23, 2021, the inception date of Class P through June 30, 2021. The performance provided does not reflect the deduction of taxes that a shareholder would pay on Fund distributions or the redemption of Fund shares. Past performance is no guarantee of future results. Share price and returns will vary with market conditions; investors may realize a gain or loss upon redemption.
UBS All China Equity Fund Class P vs. MSCI All China Index
Wealth value with dividends reinvested. Initial investment for Class P shares as of February 23, 2021 = $2,000,000

Past performance does not predict future performance, and the performance information provided does not reflect the deduction of taxes that a shareholder would pay on Fund distributions or the redemption of Fund shares. The return and principal value of an investment will fluctuate, so that an investor's shares, when redeemed, may be worth more or less than their original cost. Performance results assume reinvestment of all dividends and capital gain distributions at net asset value on the ex-dividend dates. Current performance may be higher or lower than the performance data quoted. For month-end performance figures, please visit www.ubs.com/us-mutualfundperformance.
8
UBS All China Equity Fund
Portfolio statistics and industry diversification—(unaudited)1
As a percentage of net assets as of June 30, 2021
Top ten holdings
Kweichow Moutai Co. Ltd., Class A | 10.8 | % | |||||
Tencent Holdings Ltd. | 9.8 | ||||||
Alibaba Group Holding Ltd. | 9.8 | ||||||
Ping An Insurance Group Co. of China Ltd., Class H | 5.3 | ||||||
NetEase, Inc. | 5.3 | ||||||
China Merchants Bank Co. Ltd., Class H | 3.9 | ||||||
Hong Kong Exchanges & Clearing Ltd. | 3.3 | ||||||
Wuliangye Yibin Co. Ltd., Class A | 3.1 | ||||||
Ping An Bank Co. Ltd., Class A | 3.0 | ||||||
CSPC Pharmaceutical Group Ltd. | 2.8 | ||||||
Total | 57.1 | % | |||||
Top issuer breakdown by country or territory of origin
China | 84.0 | % | |||||
United States | 10.8 | ||||||
Hong Kong | 5.0 | ||||||
Total | 99.8 | % | |||||
Common stocks | |||||||
Banks | 6.8 | % | |||||
Beverages | 15.1 | ||||||
Capital markets | 3.4 | ||||||
Commercial services & supplies | 1.2 | ||||||
Construction materials | 1.3 | ||||||
Diversified consumer services | 0.7 | ||||||
Diversified financial services | 2.2 | ||||||
Entertainment | 5.3 | ||||||
Food products | 1.5 | ||||||
Gas utilities | 0.7 | ||||||
Health care equipment & supplies | 1.6 | ||||||
Health care technology | 1.7 | ||||||
Household durables | 1.3 | ||||||
Insurance | 7.0 | ||||||
Interactive media & services | 9.8 | ||||||
Internet & direct marketing retail | 11.6 | ||||||
IT services | 1.9 | ||||||
Life sciences tools & services | 1.6 | ||||||
Pharmaceuticals | 5.7 | ||||||
Real estate management & development | 4.9 | ||||||
Software | 0.6 | ||||||
Textiles, apparel & luxury goods | 2.4 | ||||||
Transportation infrastructure | 0.7 | ||||||
Total common stocks | 89.0 | ||||||
Short-term investments | 10.8 | ||||||
Total investments | 99.8 | ||||||
Other assets in excess of liabilities | 0.2 | ||||||
Net assets | 100.0 | % | |||||
1 The portfolio is actively managed and its composition will vary over time.
9
UBS All China Equity Fund
Portfolio of investments
June 30, 2021
| Number of shares | Value | ||||||||||
Common stocks: 89.0% | |||||||||||
China: 84.0% | |||||||||||
Alibaba Group Holding Ltd.* | 6,100 | $ | 172,842 | ||||||||
Alibaba Health Information Technology Ltd.* | 6,000 | 13,307 | |||||||||
Angelalign Technology, Inc.*,1 | 200 | 10,319 | |||||||||
Anhui Conch Cement Co. Ltd., Class H | 4,500 | 23,879 | |||||||||
Anhui Gujing Distillery Co. Ltd., Class B | 1,500 | 20,768 | |||||||||
China Gas Holdings Ltd. | 4,200 | 12,820 | |||||||||
China Jinmao Holdings Group Ltd. | 46,000 | 15,404 | |||||||||
China Merchants Bank Co. Ltd., Class H | 8,000 | 68,261 | |||||||||
China Resources Land Ltd. | 6,000 | 24,304 | |||||||||
Chinasoft International Ltd.* | 18,000 | 32,827 | |||||||||
Country Garden Services Holdings Co. Ltd. | 2,000 | 21,612 | |||||||||
CSPC Pharmaceutical Group Ltd. | 34,000 | 49,220 | |||||||||
Far East Horizon Ltd. | 37,000 | 38,695 | |||||||||
Hainan Meilan International Airport Co. Ltd., Class H* | 3,000 | 12,538 | |||||||||
Jiangsu Hengrui Medicine Co. Ltd., Class A | 2,400 | 25,246 | |||||||||
Jinke Smart Services Group Co. Ltd., Class H | 2,000 | 18,765 | |||||||||
Kweichow Moutai Co. Ltd., Class A | 600 | 190,982 | |||||||||
Li Ning Co. Ltd. | 3,500 | 42,734 | |||||||||
Longfor Group Holdings Ltd.1 | 5,000 | 28,013 | |||||||||
Meituan, Class B*,1 | 800 | 33,013 | |||||||||
Midea Group Co. Ltd., Class A | 2,100 | 23,196 | |||||||||
NetEase, Inc. | 4,100 | 92,885 | |||||||||
Ping An Bank Co. Ltd., Class A | 15,000 | 52,512 | |||||||||
Ping An Healthcare and Technology Co. Ltd.*,1 | 1,400 | 17,436 | |||||||||
Ping An Insurance Group Co. of China Ltd., Class H | 9,500 | 93,051 | |||||||||
| Number of shares | Value | ||||||||||
Common stocks—(concluded) | |||||||||||
China—(concluded) | |||||||||||
Shandong Pharmaceutical Glass Co. Ltd., Class A | 3,400 | $ | 17,864 | ||||||||
TAL Education Group, ADR* | 468 | 11,808 | |||||||||
Tencent Holdings Ltd. | 2,300 | 172,997 | |||||||||
Tuya, Inc., ADR* | 400 | 9,800 | |||||||||
Wuliangye Yibin Co. Ltd., Class A | 1,200 | 55,323 | |||||||||
Wuxi Biologics Cayman, Inc.*,1 | 1,500 | 27,491 | |||||||||
Yihai International Holding Ltd.* | 4,000 | 26,867 | |||||||||
Yunnan Baiyao Group Co. Ltd., Class A | 1,500 | 26,864 | |||||||||
1,483,643 | |||||||||||
Hong Kong: 5.0% | |||||||||||
AIA Group Ltd. | 2,400 | 29,829 | |||||||||
Hong Kong Exchanges & Clearing Ltd. | 1,000 | 59,606 | |||||||||
89,435 | |||||||||||
| Total common stocks (cost $1,706,869) | 1,573,078 | ||||||||||
Short-term investments: 10.8% | |||||||||||
Investment companies: 10.8% | |||||||||||
| State Street Institutional U.S. Government Money Market Fund, 0.030%2 (cost $190,586) | 190,586 | 190,586 | |||||||||
| Total investments (cost $1,897,455)—99.8% | 1,763,664 | ||||||||||
Other assets in excess of liabilities: 0.2% | 3,340 | ||||||||||
Net assets: 100.0% | $ | 1,767,004 | |||||||||
For a listing of defined portfolio acronyms that are used throughout the Portfolio of investments as well as the tables that follow, please refer to the Glossary of terms used in the Portfolio of investments.
Fair valuation summary
The following is a summary of the fair valuations according to the inputs used as of June 30, 2021 in valuing the Fund's investments. In the event a Fund holds investments (other than a money market fund) for which fair value is measured using the NAV per share practical expedient (or its equivalent), a separate column will be added to the fair value hierarchy table; this is intended to permit reconciliation to the amounts presented in the Portfolio of investments:
Description | Unadjusted quoted prices in active markets for identical investments (Level 1) | Other significant observable inputs (Level 2) | Unobservable inputs (Level 3) | Total | |||||||||||||||
Assets | |||||||||||||||||||
Common stocks | $ | 1,573,078 | $ | — | $ | — | $ | 1,573,078 | |||||||||||
Short-term investments | — | 190,586 | — | 190,586 | |||||||||||||||
Total | $ | 1,573,078 | $ | 190,586 | $ | — | $ | 1,763,664 | |||||||||||
At June 30, 2021, there were no transfers in or out of Level 3.
10
UBS All China Equity Fund
Portfolio of investments
June 30, 2021
Portfolio footnotes
* Non-income producing security.
1 Security exempt from registration pursuant to Rule 144A under the Securities Act of 1933. These securities are considered liquid, unless noted otherwise, and may be resold in transactions exempt from registration, normally to qualified institutional buyers. Securities exempt from registration pursuant to Rule 144A, in the amount of $116,272, represented 6.6% of the Fund's net assets at period end.
2 Rates shown reflect yield at June 30, 2021.
See accompanying notes to financial statements.
11
UBS Dynamic Alpha Fund
Portfolio performance
For the 12 months ended June 30, 2021, Class A shares of UBS Dynamic Alpha Fund (the "Fund") returned 14.21% (Class A shares returned 7.90% after the deduction of the maximum sales charge), while Class P shares returned 14.52%. For purposes of comparison, the BofA Merrill Lynch US Treasury 1-5 Year Index retuned -0.27% during the same time period, the MSCI World Index (net) returned 39.04%, and the FTSE One-Month US Treasury Bill Index returned 0.06% (Class P shares have lower expenses than other share classes of the Fund). Returns for all share classes over various time periods are shown on page 14; please note that these returns do not reflect the deduction of taxes that a shareholder would pay on Fund distributions or the redemption of Fund shares, while the Index returns do not reflect the deduction of fees and expenses.
During the reporting period, we used derivatives for risk management purposes and as a tool to help enhance returns across various strategies. With respect to our active currency strategy, utilizing currency forwards had a direct positive impact on performance. Derivatives were just one tool, among others, that we used to implement our market allocation strategy.
Overall, the Fund delivered strong risk-adjusted and absolute returns over the past year and comfortably outperformed its benchmark and return objective.
The first nine months of the reporting period were exceptionally strong, with most of our trades and directional exposures contributing positively. It was a period of reflation, reopening and optimism. Global growth accelerated, yield curves steepened, and inflation expectations rebounded more than 1%. Equities strongly outperformed bonds, value outperformed growth and cyclicals outperformed defensive. Finally, attractively valued emerging market currencies benefited from a weaker US dollar and gradually improving global financial conditions. The Fund was exposed to all those factors.
The following three months were less constructive and represented more of a mixed bag for the Fund. While our equity exposure continued to perform well overall, we observed a countertrend, with a move back to pandemic winners and away from reflation exposures. This was driven by investors becoming more cautious due to a peak in global growth momentum and especially a third global COVID-19 wave. The Delta variant was more contagious than initially anticipated and put a clock on regional vaccination campaigns that were still ramping up. In turn, investors turned more cautious and bond yields began to decline and the US dollar strengthened in anticipation of weaker near-term (global) growth.
We remain positioned for a strong growth environment given financial and monetary conditions remain accommodative, vaccines continue to work (albeit at a slightly decreased efficacy) and will allow for a gradual ongoing reopening of additional parts of the global economy.
Portfolio performance summary1
What worked:
• The portfolio's strategic allocation to equities and credit contributed to performance.
– Our strategic allocation to global equities delivered strong positive returns over the reporting period as the global economy continued to recover.
– Fixed income was a slight detractor overall as yields rose by almost 0.80% over the reporting period. An exception was high-yield corporate bonds, which were additive for returns due to narrowing credit spreads (narrowing credit spreads are caused by increases in bond prices which indicate improved private credit worthiness).
1 For a detailed commentary on the market environment in general during the reporting period, see page 3.
12
UBS Dynamic Alpha Fund
• Overall, market allocation decisions were additive for results.
– We maintained an equity overweight for most of the reporting period, but decided to assume a more neutral stance as we transitioned into the second quarter of 2021, as several of our key risk indicators turned more negative. First, economic momentum was peaking and markets historically struggled during such an adjustment period. Second, our behavioral sentiment indicators were softening, as the media increasingly focused on the aforementioned peak in global growth. Lastly, we were concerned that a quick rise in yields could pressure lofty equity valuations.
– Within equities, we maintained a pro-cyclical positioning for most of the reporting period, with the perception of further earnings upside from a reopening of the global economy. Most of the trades within this category contributed to performance, such as long Stoxx600 Banks versus Eurostoxx50, long FTSE MIB Italy versus Stoxx50 and long emerging versus developed market equities.
• Overall, active currency positions contributed to results.
– The largest contributor to performance was a short US dollar versus Norwegian krone trade which benefited from hawkish rhetoric from the Norges Bank and a procyclical growth improvement which similarly helped long emerging market positions, such as the Brazilian real and Mexican peso against the US dollar, which were additive to performance.
What didn't work:
• Certain market allocation decisions detracted from results.
– Within equities, the trades that detracted were generally more defensively minded, such as the long UK versus EuroStoxx50 position and the long Topix versus MSCI World trade. Both underperformed more than we anticipated, driven by some idiosyncratic developments in their respective markets. For example, flows and sentiment remained weak for the Topix, largely due to slow progress on vaccine distribution and approval which delayed the reopening and increased the vulnerability to COVID-19 variants. However, we anticipated Japanese equities to underperform to a lesser degree given their fundamental strength, cheapness and the ongoing Bank of Japan buying during stress periods. UK equities also underperformed for several reasons but probably the most important were: 1) the pound's strength relative to other major trading currencies, 2) increasing instead of falling risk premium on UK stocks following the "skinny" Brexit deal and 3) the strength of broader Eurozone equities during the first half of 2021.
• Certain active currency positions detracted from performance.
– The short positions in developed commodity currencies such as the Canadian dollar and New Zealand dollar against the US dollar were the largest detractors over the period amidst the improved global growth outlook and a rebound in commodity prices.
This letter is intended to assist shareholders in understanding how the Fund performed during the 12 months ended June 30, 2021. The views and opinions in the letter were current as of August 12, 2021. They are not guarantees of future performance or investment results and should not be taken as investment advice. Investment decisions reflect a variety of factors, and we reserve the right to change our views about individual securities, sectors and markets at any time. As a result, the views expressed should not be relied upon as a forecast of the Fund's future investment intent. We encourage you to consult your financial advisor regarding your personal investment program.
Mutual funds are sold by prospectus only. You should read it carefully and consider a fund's investment objectives, risks, charges, expenses and other important information contained in the prospectus before investing. Prospectuses for most of our funds can be obtained from your financial advisor, by calling UBS Funds at 800-647 1568 or by visiting our website at www.ubs.com/am-us.
13
UBS Dynamic Alpha Fund
Average annual total returns for periods ended 06/30/21 (unaudited)
1 year | 5 years | 10 years | |||||||||||||
Before deducting maximum sales charge | |||||||||||||||
Class A1 | 14.21 | % | 3.24 | % | 2.80 | % | |||||||||
Class P2 | 14.52 | 3.49 | 3.06 | ||||||||||||
After deducting maximum sales charge | |||||||||||||||
Class A1 | 7.90 | % | 2.07 | % | 2.22 | % | |||||||||
ICE BofA US Treasury 1-5 Year Index3 | (0.27 | ) | 1.76 | 1.59 | |||||||||||
MSCI World Index (net)4 | 39.04 | 14.83 | 10.65 | ||||||||||||
FTSE One-Month US Treasury Bill Index5 | 0.06 | 1.08 | 0.56 | ||||||||||||
The annualized gross and net expense ratios, respectively, for each class of shares as in the October 28, 2020 prospectuses were as follows: Class A—2.03% and 1.38%; Class P—1.78% and 1.13%. Net expenses reflect fee waivers and/or expense reimbursements, if any, pursuant to an agreement that is in effect to cap the expenses. The Trust, with respect to the Fund, and UBS Asset Management (Americas) Inc., the Fund's investment advisor and administrator ("UBS AM (Americas)" or the "Advisor"), have entered into a written agreement pursuant to which the Advisor has agreed to waive a portion of its management fees and/or to reimburse expenses (excluding expenses incurred through investment in other investment companies, interest, taxes, brokerage commissions, extraordinary expenses, and dividend expense and security loan fees for securities sold short) to the extent necessary so that the Fund's ordinary operating expenses (excluding expenses incurred through investment in other investment companies, interest, taxes, brokerage commissions, extraordinary expenses, and dividend expense and security loan fees for securities sold short), through the period ending October 28, 2021, do not exceed 1.35% for Class A shares and 1.10% for Class P shares. Pursuant to the written agreement, the Advisor is entitled to be reimbursed for any fees it waives and expenses it reimburses to the extent such reimbursement can be made during the three fiscal years following the date on which such fee waivers and expense reimbursements were made, provided that the reimbursement of the Advisor by the Fund will not cause the Fund to exceed the lesser of any applicable expense limit that is in place for the Fund (i) at the time of the waiver or reimbursement or (ii) at the time of the recoupment. The fee waiver/expense reimbursement agreement may be terminated by the Fund's Board of Trustees at any time and also will terminate automatically upon the expiration or termination of the Fund's advisory contract with the Advisor. Upon termination of the fee waiver/expense reimbursement agreement, however, UBS AM (Americas)'s three year recoupment rights will survive.
1 Maximum sales charge for Class A shares is 5.5%. Class A shares bear ongoing 12b-1 service fees.
2 Class P shares do not bear initial or contingent deferred sales charges or ongoing 12b-1 service and distribution fees, but Class P shares held through advisory programs may be subject to a program fee, which, if included, would have reduced performance.
3 The ICE BofA US Treasury 1-5 Year Index is an unmanaged index designed to track US Treasury securities with maturities between 1 and 5 years. Investors should note that indices do not reflect the deduction of fees and expenses.
4 The MSCI World Index (net) is a free float-adjusted market capitalization weighted index that is designed to measure the equity market performance of developed markets. Net total return indices reinvest dividends after the deduction of withholding taxes, using a tax rate applicable to non-resident institutional investors who do not benefit from double taxation treaties. The index is constructed and managed with a view to being fully investable from the perspective of international institutional investors. Investors should note that indices do not reflect the deduction of fees and expenses.
5 The FTSE One-Month US Treasury Bill Index is an unmanaged index representing monthly return equivalents of yield averages of the last one month Treasury Bill issue. Investors should note that indices do not reflect the deduction of fees and expenses.
Past performance does not predict future performance, and the performance information provided does not reflect the deduction of taxes that a shareholder would pay on Fund distributions or the redemption of Fund shares. The return and principal value of an investment will fluctuate, so that an investor's shares, when redeemed, may be worth more or less than their original cost. Performance results assume reinvestment of all dividends and capital gain distributions at net asset value on the ex-dividend dates. Current performance may be higher or lower than the performance data quoted. For month-end performance figures, please visit www.ubs.com/us-mutualfundperformance.
14
UBS Dynamic Alpha Fund
Illustration of an assumed investment of $10,000 in Class A shares (adjusted for 5.5% maximum sales charge) and $2,000,000 in Class P shares (unaudited)
The following two graphs depict the performance of UBS Dynamic Alpha Fund Class A and Class P shares versus the ICE BofA US Treasury 1-5 Year Index, the MSCI World Index (net) and the FTSE One-Month US Treasury Bill Index over the 10 years ended June 30, 2021. The performance provided does not reflect the deduction of taxes that a shareholder would pay on Fund distributions or the redemption of Fund shares. Past performance is no guarantee of future results. Share price and returns will vary with market conditions; investors may realize a gain or loss upon redemption.
UBS Dynamic Alpha Fund Class A vs. ICE BofAML US Treasury 1-5 Year Index, MSCI World Index (net) and FTSE One-Month US Treasury Bill Index
Wealth value with dividends reinvested. Initial investment for Class A Shares as of June 30, 2011 = $9,450
The Fund's growth of an assumed $10,000 investment is adjusted for the maximum sales charge of 5.5%.

UBS Dynamic Alpha Fund Class P vs. ICE BofAML US Treasury 1-5 Year Index, MSCI World Index (net) and FTSE One-Month US Treasury Bill Index
Wealth value with dividends reinvested. Initial investment for Class P shares as of June 30, 2011 = $2,000,000

Past performance does not predict future performance, and the performance information provided does not reflect the deduction of taxes that a shareholder would pay on Fund distributions or the redemption of Fund shares. The return and principal value of an investment will fluctuate, so that an investor's shares, when redeemed, may be worth more or less than their original cost. Performance results assume reinvestment of all dividends and capital gain distributions at net asset value on the ex-dividend dates. Current performance may be higher or lower than the performance data quoted. For month-end performance figures, please visit www.ubs.com/us-mutualfundperformance.
15
UBS Dynamic Alpha Fund
Portfolio statistics and industry diversification—(unaudited)1
As a percentage of net assets as of June 30, 2021
Top ten holdings
| U.S. Treasury Bills, 0.077% due 07/15/21 | 10.3 | % | |||||
| U.S. Treasury Bills, 0.011% due 10/21/21 | 9.8 | ||||||
iShares MSCI International Value Factor ETF | 4.2 | ||||||
| Bundesobligation, 0.000% due 04/11/25 | 3.3 | ||||||
| U.S. Treasury Notes, 2.000% due 02/15/22 | 3.2 | ||||||
| U.S. Treasury Notes, 0.250% due 05/31/25 | 3.0 | ||||||
| New Zealand Government Bond, 3.000% due 09/20/30 | 2.1 | ||||||
| Japan Government Ten Year Bond, 0.400% due 03/20/25 | 1.9 | ||||||
| Ireland Government Bond, 1.000% due 05/15/26 | 1.8 | ||||||
| Canadian Government Bond, 1.500% due 09/01/24 | 1.7 | ||||||
Total | 41.3 | % | |||||
Top five issuer breakdown by country or territory of origin
United States | 54.0 | % | |||||
France | 4.8 | ||||||
Germany | 4.7 | ||||||
Japan | 4.4 | ||||||
United Kingdom | 4.4 | ||||||
Total | 72.3 | % | |||||
1 The portfolio is actively managed and its composition will vary over time.
16
UBS Dynamic Alpha Fund
Portfolio statistics and industry diversification—(unaudited)1
As a percentage of net assets as of June 30, 2021
Corporate bonds | |||||||
Advertising | 0.1 | % | |||||
Aerospace & defense | 0.1 | ||||||
Agriculture | 0.6 | ||||||
Airlines | 0.2 | ||||||
Apparel | 0.0 | † | |||||
Auto manufacturers | 1.4 | ||||||
Banks | 8.4 | ||||||
Biotechnology | 0.1 | ||||||
Chemicals | 0.7 | ||||||
Commercial services | 0.1 | ||||||
Computers | 0.2 | ||||||
Diversified financial services | 0.1 | ||||||
Electric | 2.4 | ||||||
Engineering & construction | 0.6 | ||||||
Gas | 1.2 | ||||||
Insurance | 2.9 | ||||||
Media | 0.9 | ||||||
Mining | 0.1 | ||||||
Miscellaneous manufacturers | 0.3 | ||||||
Oil & gas | 1.1 | ||||||
Pharmaceuticals | 0.9 | ||||||
Pipelines | 0.6 | ||||||
Real estate | 0.3 | ||||||
Real estate investment trusts | 0.7 | ||||||
Retail | 0.0 | † | |||||
Semiconductors | 0.2 | ||||||
Software | 0.1 | ||||||
Supranationals | 0.1 | ||||||
Telecommunications | 0.3 | ||||||
Transportation | 0.1 | ||||||
Water | 1.3 | ||||||
Total corporate bonds | 26.1 | ||||||
Mortgage-backed securities | 0.0 | † | |||||
Non-U.S. government agency obligations | 19.0 | ||||||
U.S. Treasury obligations | 29.8 | ||||||
Exchange traded funds | 7.1 | ||||||
Short-term investments | 8.1 | ||||||
Investment of cash collateral from securities loaned | 0.3 | ||||||
Total investments | 90.4 | ||||||
Other assets in excess of liabilities | 9.6 | ||||||
Net assets | 100.0 | % | |||||
† Amount represents less than 0.05% or (0.05)%.
1 Figures represent the breakdown of direct investments of UBS Dynamic Alpha Fund. Figures would be different if a breakdown of the underlying investment companies and exchange traded funds was included.
17
UBS Dynamic Alpha Fund
Portfolio of investments
June 30, 2021
| Face amount1 | Value | ||||||||||
Corporate bonds: 26.1% | |||||||||||
Australia: 1.2% | |||||||||||
| APT Pipelines Ltd. 4.200%, due 03/23/252 | 15,000 | $ | 16,450 | ||||||||
| Aurizon Network Pty Ltd. 4.000%, due 06/21/242 | AUD | 30,000 | 24,126 | ||||||||
| Ausgrid Finance Pty Ltd. 3.750%, due 10/30/242 | AUD | 30,000 | 24,321 | ||||||||
| Commonwealth Bank of Australia (fixed, converts to FRN on 10/03/24), 1.936%, due 10/03/292 | EUR | 100,000 | 124,129 | ||||||||
| Glencore Funding LLC 4.875%, due 03/12/293 | 40,000 | 46,517 | |||||||||
| Origin Energy Finance Ltd. 5.450%, due 10/14/212 | 45,000 | 45,642 | |||||||||
| Westpac Banking Corp. 2.000%, due 01/13/23 | 30,000 | 30,784 | |||||||||
| (fixed, converts to FRN on 09/21/27), 5.000%, due 09/21/274 | 80,000 | 85,827 | |||||||||
397,796 | |||||||||||
Belgium: 0.3% | |||||||||||
| RESA SA 1.000%, due 07/22/262 | EUR | 100,000 | 123,253 | ||||||||
Bermuda: 0.1% | |||||||||||
| XLIT Ltd. 5.250%, due 12/15/43 | 20,000 | 27,683 | |||||||||
Canada: 0.6% | |||||||||||
| Canadian Natural Resources Ltd. 2.950%, due 01/15/23 | 35,000 | 36,251 | |||||||||
3.850%, due 06/01/27 | 35,000 | 38,531 | |||||||||
| Cenovus Energy, Inc. 4.250%, due 04/15/27 | 35,000 | 39,109 | |||||||||
| Royal Bank of Canada 1.650%, due 07/15/21 | CAD | 85,000 | 68,602 | ||||||||
| Suncor Energy, Inc. 3.100%, due 05/15/25 | 15,000 | 16,027 | |||||||||
| TELUS Corp. 3.750%, due 01/17/25 | CAD | 15,000 | 12,986 | ||||||||
211,506 | |||||||||||
China: 0.1% | |||||||||||
| NXP BV/NXP Funding LLC/NXP USA, Inc. 2.700%, due 05/01/253 | 5,000 | 5,273 | |||||||||
3.150%, due 05/01/273 | 15,000 | 16,046 | |||||||||
21,319 | |||||||||||
Czech Republic: 0.3% | |||||||||||
| NET4GAS sro 2.500%, due 07/28/212 | EUR | 100,000 | 118,543 | ||||||||
| Face amount1 | Value | ||||||||||
Corporate bonds—(continued) | |||||||||||
France: 3.5% | |||||||||||
| AXA SA (fixed, converts to FRN on 05/28/29), 3.250%, due 05/28/492 | EUR | 100,000 | $ | 135,719 | |||||||
| BPCE SA 1.375%, due 03/23/262 | EUR | 100,000 | 124,856 | ||||||||
| Credit Agricole SA 1.375%, due 03/13/252 | EUR | 100,000 | 124,121 | ||||||||
| Credit Logement SA 3 mo. Euribor + 1.150%, 0.604%, due 09/16/212,4,14 | EUR | 100,000 | 115,467 | ||||||||
| Electricite de France SA (fixed, converts to FRN on 01/22/24), 5.625%, due 01/22/242,4 | 100,000 | 107,625 | |||||||||
| SCOR SE (fixed, converts to FRN on 03/13/29), 5.250%, due 03/13/292,4 | 200,000 | 211,125 | |||||||||
| TDF Infrastructure SASU 2.875%, due 10/19/222 | EUR | 100,000 | 122,146 | ||||||||
| Terega SA 2.200%, due 08/05/252 | EUR | 100,000 | 128,564 | ||||||||
| Unibail-Rodamco-Westfield SE (fixed, converts to FRN on 01/25/26), 2.875%, due 01/25/262,4 | EUR | 100,000 | 119,464 | ||||||||
1,189,087 | |||||||||||
Germany: 1.4% | |||||||||||
| ADLER Group SA 1.500%, due 07/26/242 | EUR | 100,000 | 116,193 | ||||||||
| KFW 2.625%, due 01/25/22 | 110,000 | 111,570 | |||||||||
| Volkswagen International Finance N.V. 1.125%, due 10/02/232 | EUR | 100,000 | 121,818 | ||||||||
| Series NC6, (fixed, converts to FRN on 06/27/24), 3.375%, due 06/27/242,4 | EUR | 100,000 | 126,579 | ||||||||
476,160 | |||||||||||
Guernsey: 0.4% | |||||||||||
| Globalworth Real Estate Investments Ltd. 3.000%, due 03/29/252 | EUR | 100,000 | 127,172 | ||||||||
Israel: 0.5% | |||||||||||
| Teva Pharmaceutical Finance IV BV 3.650%, due 11/10/21 | 20,000 | 20,001 | |||||||||
| Teva Pharmaceutical Finance Netherlands II BV 1.125%, due 10/15/242 | EUR | 100,000 | 111,038 | ||||||||
| Teva Pharmaceutical Finance Netherlands III BV 2.800%, due 07/21/23 | 40,000 | 39,710 | |||||||||
170,749 | |||||||||||
18
UBS Dynamic Alpha Fund
Portfolio of investments
June 30, 2021
| Face amount1 | Value | ||||||||||
Corporate bonds—(continued) | |||||||||||
Japan: 0.1% | |||||||||||
| Mitsubishi UFJ Financial Group, Inc. 2.665%, due 07/25/22 | 25,000 | $ | 25,621 | ||||||||
Mexico: 0.9% | |||||||||||
| Mexico City Airport Trust 5.500%, due 07/31/472 | 200,000 | 201,750 | |||||||||
| Petroleos Mexicanos 3.750%, due 02/21/242 | EUR | 100,000 | 122,192 | ||||||||
323,942 | |||||||||||
Poland: 0.4% | |||||||||||
| Tauron Polska Energia SA 2.375%, due 07/05/272 | EUR | 100,000 | 123,822 | ||||||||
Singapore: 0.6% | |||||||||||
| DBS Group Holdings Ltd. (fixed, converts to FRN on 09/07/21), 3.600%, due 09/07/212,4 | 200,000 | 200,500 | |||||||||
Spain: 1.9% | |||||||||||
| Banco Santander SA 3.250%, due 04/04/262 | EUR | 100,000 | 133,541 | ||||||||
4.000%, due 01/19/232 | AUD | 200,000 | 157,031 | ||||||||
| Canal de Isabel II Gestion SA 1.680%, due 02/26/252 | EUR | 100,000 | 125,304 | ||||||||
| Iberdrola International BV (fixed, converts to FRN on 03/26/24), 2.625%, due 03/26/242,4 | EUR | 100,000 | 125,394 | ||||||||
| Redexis Gas Finance BV 1.875%, due 04/27/272 | EUR | 100,000 | 127,106 | ||||||||
668,376 | |||||||||||
Supranationals: 0.1% | |||||||||||
| Corp Andina de Fomento 4.500%, due 06/05/252 | AUD | 35,000 | 28,502 | ||||||||
Switzerland: 0.4% | |||||||||||
| Argentum Netherlands BV for Swiss Life AG (fixed, converts to FRN on 06/16/25), 4.375%, due 06/16/252,4 | EUR | 100,000 | 133,883 | ||||||||
United Kingdom: 4.3% | |||||||||||
| Anglian Water Services Financing PLC 4.500%, due 02/22/262 | GBP | 100,000 | 158,467 | ||||||||
| AstraZeneca PLC 3.500%, due 08/17/23 | 30,000 | 31,864 | |||||||||
| Barclays Bank PLC 9.500%, due 08/07/212 | GBP | 40,000 | 55,802 | ||||||||
| Barclays PLC (fixed, converts to FRN on 10/06/22), 2.375%, due 10/06/232 | GBP | 100,000 | 141,342 | ||||||||
| BAT Capital Corp. 3.557%, due 08/15/27 | 35,000 | 37,480 | |||||||||
| BAT International Finance PLC 0.875%, due 10/13/232 | EUR | 100,000 | 120,563 | ||||||||
| Face amount1 | Value | ||||||||||
Corporate bonds—(continued) | |||||||||||
United Kingdom—(continued) | |||||||||||
| Lloyds Banking Group PLC 2.250%, due 10/16/242 | GBP | 100,000 | $ | 143,999 | |||||||
| Natwest Group PLC (fixed, converts to FRN on 06/25/23), 4.519%, due 06/25/24 | 200,000 | 214,716 | |||||||||
| Phoenix Group Holdings PLC 4.125%, due 07/20/222 | GBP | 150,000 | 214,541 | ||||||||
| Reynolds American, Inc. 4.450%, due 06/12/25 | 25,000 | 27,694 | |||||||||
| Virgin Money UK PLC (fixed, converts to FRN on 04/24/25), 3.375%, due 04/24/262 | GBP | 100,000 | 147,013 | ||||||||
| WPP Finance 2010 3.750%, due 09/19/24 | 25,000 | 27,190 | |||||||||
| Yorkshire Water Finance PLC (fixed, converts to FRN on 03/22/23), 3.750%, due 03/22/462 | GBP | 100,000 | 142,802 | ||||||||
1,463,473 | |||||||||||
United States: 9.0% | |||||||||||
| 3M Co. 2.650%, due 04/15/25 | 20,000 | 21,307 | |||||||||
| AbbVie, Inc. 3.450%, due 03/15/22 | 25,000 | 25,422 | |||||||||
| Air Products and Chemicals, Inc. 2.050%, due 05/15/30 | 20,000 | 20,387 | |||||||||
| Albemarle Corp. 5.450%, due 12/01/44 | 50,000 | 63,217 | |||||||||
| Altria Group, Inc. 4.400%, due 02/14/26 | 13,000 | 14,709 | |||||||||
| American Airlines Pass-Through Trust 4.375%, due 10/01/22 | 38,207 | 38,382 | |||||||||
| Amgen, Inc. 2.650%, due 05/11/22 | 20,000 | 20,342 | |||||||||
| Apache Corp. 4.250%, due 01/15/446 | 60,000 | 58,627 | |||||||||
| AT&T, Inc. 4.350%, due 03/01/29 | 60,000 | 69,471 | |||||||||
| Bank of America Corp. (fixed, converts to FRN on 12/20/22), 3.004%, due 12/20/23 | 90,000 | 93,271 | |||||||||
3.875%, due 08/01/25 | 80,000 | 88,884 | |||||||||
| Boeing Co. 2.196%, due 02/04/26 | 20,000 | 20,191 | |||||||||
| Bristol-Myers Squibb Co. 3.875%, due 08/15/25 | 24,000 | 26,719 | |||||||||
| Broadcom, Inc. 3.150%, due 11/15/25 | 35,000 | 37,512 | |||||||||
| Charter Communications Operating LLC/Charter Communications Operating Capital 4.500%, due 02/01/24 | 50,000 | 54,458 | |||||||||
19
UBS Dynamic Alpha Fund
Portfolio of investments
June 30, 2021
| Face amount1 | Value | ||||||||||
Corporate bonds—(continued) | |||||||||||
United States—(continued) | |||||||||||
| Chevron Phillips Chemical Co. LLC/Chevron Phillips Chemical Co. LP 3.300%, due 05/01/233 | 120,000 | $ | 126,000 | ||||||||
5.125%, due 04/01/253,6 | 25,000 | 28,619 | |||||||||
| Chevron USA, Inc. 3.850%, due 01/15/28 | 20,000 | 22,779 | |||||||||
| Citigroup, Inc. 3.875%, due 10/25/23 | 130,000 | 140,284 | |||||||||
4.600%, due 03/09/26 | 20,000 | 22,764 | |||||||||
| Comcast Corp. 3.950%, due 10/15/25 | 35,000 | 39,217 | |||||||||
| Costco Wholesale Corp. 1.600%, due 04/20/30 | 10,000 | 9,869 | |||||||||
| CVS Health Corp. 2.625%, due 08/15/24 | 35,000 | 36,934 | |||||||||
| Dell International LLC/EMC Corp. 5.300%, due 10/01/29 | 60,000 | 72,398 | |||||||||
| Diamondback Energy, Inc. 3.250%, due 12/01/26 | 50,000 | 53,595 | |||||||||
| Enable Midstream Partners LP 3.900%, due 05/15/247 | 25,000 | 26,571 | |||||||||
| Energy Transfer LP 4.500%, due 04/15/24 | 35,000 | 38,106 | |||||||||
| EnLink Midstream Partners LP 4.400%, due 04/01/24 | 40,000 | 42,000 | |||||||||
| ERAC USA Finance LLC 5.625%, due 03/15/423 | 35,000 | 47,716 | |||||||||
| Exelon Corp. 3.400%, due 04/15/26 | 15,000 | 16,333 | |||||||||
| Ford Motor Credit Co. LLC 3.021%, due 03/06/24 | EUR | 100,000 | 124,269 | ||||||||
| General Electric Co. 3.450%, due 05/01/27 | 10,000 | 10,993 | |||||||||
| Series A, 6.750%, due 03/15/32 | 10,000 | 13,861 | |||||||||
| General Motors Financial Co., Inc. 4.350%, due 04/09/25 | 90,000 | 99,449 | |||||||||
| Georgia Power Co., Series A, 2.100%, due 07/30/23 | 25,000 | 25,817 | |||||||||
| Goldman Sachs Group, Inc. 1.625%, due 07/27/262 | EUR | 40,000 | 50,598 | ||||||||
3.375%, due 03/27/252 | EUR | 35,000 | 46,519 | ||||||||
3.500%, due 04/01/25 | 90,000 | 97,641 | |||||||||
| Illinois Tool Works, Inc. 2.650%, due 11/15/26 | 45,000 | 48,268 | |||||||||
| JPMorgan Chase & Co. 3.200%, due 01/25/23 | 220,000 | 229,803 | |||||||||
3.625%, due 12/01/27 | 60,000 | 65,931 | |||||||||
| Kinder Morgan, Inc. 5.625%, due 11/15/233 | 35,000 | 38,556 | |||||||||
| Face amount1 | Value | ||||||||||
Corporate bonds—(continued) | |||||||||||
United States—(continued) | |||||||||||
| Liberty Mutual Group, Inc. 4.569%, due 02/01/293 | 25,000 | $ | 29,204 | ||||||||
| Lincoln National Corp. 3.800%, due 03/01/28 | 70,000 | 78,246 | |||||||||
| Mastercard, Inc. 2.000%, due 03/03/25 | 20,000 | 20,910 | |||||||||
| Morgan Stanley 4.000%, due 07/23/25 | 85,000 | 94,542 | |||||||||
4.350%, due 09/08/26 | 20,000 | 22,645 | |||||||||
| MPLX LP 4.250%, due 12/01/27 | 30,000 | 33,995 | |||||||||
| National Rural Utilities Cooperative Finance Corp. 3.700%, due 03/15/29 | 15,000 | 16,731 | |||||||||
| NIKE, Inc. 2.400%, due 03/27/256 | 10,000 | 10,579 | |||||||||
| Oncor Electric Delivery Co. LLC 3.700%, due 11/15/28 | 25,000 | 28,270 | |||||||||
| Oracle Corp. 2.500%, due 04/01/25 | 20,000 | 21,009 | |||||||||
| PacifiCorp. 2.700%, due 09/15/30 | 5,000 | 5,251 | |||||||||
| Raytheon Technologies Corp. 3.950%, due 08/16/25 | 25,000 | 27,805 | |||||||||
| Southern California Edison Co., Series E, 3.700%, due 08/01/25 | 20,000 | 21,784 | |||||||||
| Southern Co. 3.250%, due 07/01/26 | 35,000 | 37,984 | |||||||||
| Swiss Re Treasury U.S. Corp. 4.250%, due 12/06/423 | 30,000 | 36,748 | |||||||||
| TWDC Enterprises 18 Corp. 1.850%, due 07/30/26 | 10,000 | 10,295 | |||||||||
| United Airlines Pass-Through Trust 3.650%, due 01/07/26 | 37,153 | 36,890 | |||||||||
| Verizon Communications, Inc. 3.376%, due 02/15/25 | 25,000 | 27,159 | |||||||||
| ViacomCBS, Inc. 4.750%, due 05/15/25 | 75,000 | 84,869 | |||||||||
| Virginia Electric and Power Co., Series A, 3.800%, due 04/01/28 | 20,000 | 22,577 | |||||||||
| Visa, Inc. 1.900%, due 04/15/27 | 25,000 | 25,814 | |||||||||
| Williams Cos., Inc. 4.300%, due 03/04/24 | 35,000 | 38,017 | |||||||||
| Xcel Energy, Inc. 4.800%, due 09/15/41 | 80,000 | 98,025 | |||||||||
3,057,138 | |||||||||||
| Total corporate bonds (cost $8,238,581) | 8,888,525 | ||||||||||
20
UBS Dynamic Alpha Fund
Portfolio of investments
June 30, 2021
| Face amount1 | Value | ||||||||||
Mortgage-backed securities: 0.0%† | |||||||||||
Cayman Islands: 0.0%† | |||||||||||
| LNR CDO IV Ltd., Series 2006-1A, Class FFX, 7.592%, due 05/28/433,8,9 | 8,000,000 | $ | 0 | ||||||||
United States: 0.0%† | |||||||||||
| Structured Adjustable Rate Mortgage Loan Trust, Series 2005-7, Class B11, 2.772%, due 04/25/355 | 26,050 | 332 | |||||||||
| Total mortgage-backed securities (cost $8,096,992) | 332 | ||||||||||
Non-U.S. government agency obligations: 19.0% | |||||||||||
Australia: 1.5% | |||||||||||
| Australia Government Bond 2.250%, due 05/21/282 | AUD | 420,000 | 338,805 | ||||||||
2.750%, due 11/21/272 | AUD | 200,000 | 165,991 | ||||||||
504,796 | |||||||||||
Canada: 2.0% | |||||||||||
| Canada Housing Trust No. 1 2.350%, due 09/15/233 | CAD | 120,000 | 100,571 | ||||||||
| Canadian Government Bond 1.500%, due 09/01/24 | CAD | 690,000 | 570,617 | ||||||||
671,188 | |||||||||||
China: 0.4% | |||||||||||
| China Development Bank 1.250%, due 01/21/232 | GBP | 100,000 | 139,450 | ||||||||
Colombia: 0.1% | |||||||||||
| Colombia Government International Bond 8.125%, due 05/21/24 | 30,000 | 35,415 | |||||||||
France: 1.3% | |||||||||||
| Caisse d'Amortissement de la Dette Sociale 1.375%, due 11/25/242 | EUR | 100,000 | 125,951 | ||||||||
| French Republic Government Bond OAT 0.000%, due 03/25/252 | EUR | 260,000 | 314,384 | ||||||||
440,335 | |||||||||||
Germany: 3.3% | |||||||||||
| Bundesobligation 0.000%, due 04/11/252 | EUR | 910,000 | 1,105,786 | ||||||||
Ireland: 1.8% | |||||||||||
| Ireland Government Bond 1.000%, due 05/15/262 | EUR | 490,000 | 620,614 | ||||||||
Japan: 4.3% | |||||||||||
| Japan Bank for International Cooperation 0.625%, due 05/22/23 | 200,000 | 201,044 | |||||||||
| Japan Government Ten Year Bond 0.400%, due 03/20/25 | JPY | 70,000,000 | 642,410 | ||||||||
| Face amount1 | Value | ||||||||||
Non-U.S. government agency obligations—(continued) | |||||||||||
Japan—(continued) | |||||||||||
| Japan Government Two Year Bond 0.100%, due 05/01/22 | JPY | 47,000,000 | $ | 423,810 | |||||||
| Japanese Government CPI Linked Bond 0.100%, due 03/10/29 | JPY | 23,045,310 | 213,143 | ||||||||
1,480,407 | |||||||||||
New Zealand: 2.7% | |||||||||||
| New Zealand Government Bond 0.500%, due 05/15/26 | NZD | 300,000 | 203,409 | ||||||||
3.000%, due 09/20/302 | NZD | 729,630 | 713,241 | ||||||||
916,650 | |||||||||||
Poland: 0.3% | |||||||||||
| Republic of Poland Government International Bond 2.375%, due 02/10/252 | EUR | 90,000 | 107,538 | ||||||||
Romania: 0.4% | |||||||||||
| Romanian Government International Bond 2.750%, due 02/26/262 | EUR | 100,000 | 131,058 | ||||||||
Spain: 0.7% | |||||||||||
| Spain Government Bond 1.600%, due 04/30/252,3 | EUR | 180,000 | 229,633 | ||||||||
Supranationals: 0.1% | |||||||||||
| European Union 3.000%, due 09/04/262 | EUR | 30,000 | 41,797 | ||||||||
United Kingdom: 0.1% | |||||||||||
| Bank of England Euro Note 0.500%, due 04/28/232 | 40,000 | 40,176 | |||||||||
| Total non-U.S. government agency obligations (cost $6,260,676) | 6,464,843 | ||||||||||
U.S. Treasury obligations: 29.8% | |||||||||||
United States: 29.8% | |||||||||||
| U.S. Treasury Bills 0.011%, due 10/21/2110 | 3,350,000 | 3,349,505 | |||||||||
0.077%, due 07/15/2110 | 3,500,000 | 3,499,939 | |||||||||
| U.S. Treasury Notes 0.250%, due 05/31/25 | 1,030,000 | 1,012,699 | |||||||||
0.375%, due 04/30/25 | 560,000 | 553,984 | |||||||||
1.375%, due 09/30/23 | 320,000 | 327,713 | |||||||||
1.500%, due 02/28/23 | 210,000 | 214,520 | |||||||||
2.000%, due 02/15/22 | 1,090,000 | 1,103,199 | |||||||||
2.750%, due 11/15/23 | 100,000 | 105,738 | |||||||||
| Total U.S. Treasury obligations (cost $10,186,595) | 10,167,297 | ||||||||||
21
UBS Dynamic Alpha Fund
Portfolio of investments
June 30, 2021
| Number of shares | Value | ||||||||||
Exchange traded funds: 7.1% | |||||||||||
United States: 7.1% | |||||||||||
iShares MSCI International Value Factor ETF | 56,055 | $ | 1,447,340 | ||||||||
iShares MSCI USA Value Factor ETF | 9,270 | 973,906 | |||||||||
| Total exchange traded funds (cost $1,841,092) | 2,421,246 | ||||||||||
Short-term investments: 8.1% | |||||||||||
Investment companies: 8.1% | |||||||||||
| State Street Institutional U.S. Government Money Market Fund, 0.030%11 (cost $2,752,679) | 2,752,679 | 2,752,679 | |||||||||
| Number of shares | Value | ||||||||||
Investment of cash collateral from securities loaned: 0.3% | |||||||||||
Money market funds: 0.3% | |||||||||||
| State Street Navigator Securities Lending Government Money Market Portfolio, 0.020%11 (cost $101,525) | 101,525 | $ | 101,525 | ||||||||
| Total investments (cost $37,478,140)—90.4% | 30,796,447 | ||||||||||
Other assets in excess of liabilities: 9.6% | 3,276,499 | ||||||||||
Net assets: 100.0% | $ | 34,072,946 | |||||||||
For a listing of defined portfolio acronyms that are used throughout the Portfolio of investments as well as the tables that follow, please refer to the Glossary of terms used in the Portfolio of investments.
Futures contracts
| Number of contracts | Currency | Expiration date | Current notional amount | Value | Unrealized appreciation (depreciation) | ||||||||||||||||||||||
Index futures buy contracts: | |||||||||||||||||||||||||||
1 | AUD | ASX SPI 200 Index Futures | September 2021 | $ | 136,342 | $ | 135,422 | $ | (920 | ) | |||||||||||||||||
1 | CAD | S&P/TSX 60 Index Futures | September 2021 | 191,478 | 194,046 | 2,568 | |||||||||||||||||||||
134 | EUR | EURO STOXX 600 Bank Index Futures | September 2021 | 1,089,535 | 1,059,800 | (29,735 | ) | ||||||||||||||||||||
13 | EUR | EURO STOXX 600 Index Futures | September 2021 | 348,390 | 347,757 | (633 | ) | ||||||||||||||||||||
5 | EUR | FTSE MIB Index Futures | September 2021 | 755,930 | 741,212 | (14,718 | ) | ||||||||||||||||||||
15 | GBP | FTSE 100 Index Futures | September 2021 | 1,453,709 | 1,448,419 | (5,290 | ) | ||||||||||||||||||||
8 | JPY | TOPIX Index Futures | September 2021 | 1,410,712 | 1,399,163 | (11,549 | ) | ||||||||||||||||||||
17 | USD | Mini MSCI Emerging Markets (EM) Index Futures | September 2021 | 1,167,337 | 1,160,080 | (7,257 | ) | ||||||||||||||||||||
5 | USD | S&P 500 E-Mini Index Futures | September 2021 | 1,052,311 | 1,072,150 | 19,839 | |||||||||||||||||||||
Interest rate futures buy contracts: | |||||||||||||||||||||||||||
2 | CAD | Canada Government Bond 10 Year Futures | September 2021 | 232,046 | 234,786 | 2,740 | |||||||||||||||||||||
U.S. Treasury futures buy contracts: | |||||||||||||||||||||||||||
25 | USD | U.S. Treasury Note 2 Year Futures | September 2021 | 5,516,053 | 5,508,008 | (8,045 | ) | ||||||||||||||||||||
13 | USD | U.S. Treasury Note 5 Year Futures | September 2021 | 1,610,597 | 1,604,586 | (6,011 | ) | ||||||||||||||||||||
Total | $ | 14,964,440 | $ | 14,905,429 | $ | (59,011 | ) | ||||||||||||||||||||
22
UBS Dynamic Alpha Fund
Portfolio of investments
June 30, 2021
Futures contracts—(concluded)
| Number of contracts | Currency | Expiration date | Current notional amount | Value | Unrealized appreciation (depreciation) | ||||||||||||||||||||||
Index futures sell contracts: | |||||||||||||||||||||||||||
27 | EUR | EURO STOXX 50 Index Futures | September 2021 | $ | (1,301,833 | ) | $ | (1,298,379 | ) | $ | 3,454 | ||||||||||||||||
Interest rate futures sell contracts: | |||||||||||||||||||||||||||
2 | EUR | German Euro BOBL | September 2021 | (317,992 | ) | (318,137 | ) | (145 | ) | ||||||||||||||||||
6 | EUR | German Euro Bund Futures | September 2021 | (1,220,130 | ) | (1,228,034 | ) | (7,904 | ) | ||||||||||||||||||
5 | GBP | United Kingdom Long Gilt Bond Futures | September 2021 | (878,805 | ) | (886,003 | ) | (7,198 | ) | ||||||||||||||||||
U.S. Treasury futures sell contracts: | |||||||||||||||||||||||||||
13 | USD | U.S. Treasury Note 10 Year Futures | September 2021 | (1,710,497 | ) | (1,722,500 | ) | (12,003 | ) | ||||||||||||||||||
1 | USD | U.S. Ultra Bond Futures | September 2021 | (186,123 | ) | (192,687 | ) | (6,564 | ) | ||||||||||||||||||
4 | USD | U.S. Ultra Treasury Note 10 Year Futures | September 2021 | (581,182 | ) | (588,813 | ) | (7,631 | ) | ||||||||||||||||||
Total | $ | (6,196,562 | ) | $ | (6,234,553 | ) | $ | (37,991 | ) | ||||||||||||||||||
Net unrealized appreciation (depreciation) | $ | (97,002 | ) | ||||||||||||||||||||||||
Centrally cleared credit default swap agreements on corporate issues—sell protection12
| Referenced obligations | Notional amount (000) | Maturity date | Payment frequency | Payments received by the Portfolio13 | Upfront payments received (made) | Value | Unrealized appreciation (depreciation) | ||||||||||||||||||||||||
iTraxx Europe Crossover Series 35 Index | EUR | 400 | 06/20/26 | Quarterly | 5.000 | % | $ | (49,653 | ) | $ | 59,632 | $ | 9,979 | ||||||||||||||||||
Centrally cleared credit default swap agreements on credit indices—sell protection12
| Referenced obligations | Notional amount (000) | Maturity date | Payment frequency | Payments received by the Portfolio13 | Upfront payments received (made) | Value | Unrealized appreciation (depreciation) | ||||||||||||||||||||||||
CDX North American High Yield 36 Index | USD | 1,160 | 06/20/26 | Quarterly | 5.000 | % | $ | (93,960 | ) | $ | 119,931 | $ | 25,971 | ||||||||||||||||||
Forward foreign currency contracts
Counterparty | Sell | Purchase | Settlement date | Unrealized appreciation (depreciation) | |||||||||||||||
BB | USD | 2,051,857 | COP | 7,712,419,000 | 07/28/21 | $ | 621 | ||||||||||||
BOA | BRL | 1,020,000 | USD | 204,943 | 07/28/21 | 432 | |||||||||||||
BOA | USD | 1,087,359 | RUB | 80,054,100 | 07/28/21 | 3,240 | |||||||||||||
CIBC | EUR | 8,000,000 | USD | 9,555,534 | 07/28/21 | 64,420 | |||||||||||||
CITI | TWD | 14,700,000 | USD | 528,222 | 07/28/21 | 608 | |||||||||||||
HSBC | PHP | 50,050,000 | USD | 1,024,292 | 07/28/21 | (285 | ) | ||||||||||||
HSBC | USD | 196,138 | NOK | 1,670,000 | 07/28/21 | (2,155 | ) | ||||||||||||
23
UBS Dynamic Alpha Fund
Portfolio of investments
June 30, 2021
Forward foreign currency contracts—(concluded)
Counterparty | Sell | Purchase | Settlement date | Unrealized appreciation (depreciation) | |||||||||||||||
JPMCB | USD | 1,024,880 | SEK | 8,690,000 | 07/28/21 | $ | (9,222 | ) | |||||||||||
MSCI | KRW | 586,000,000 | USD | 516,983 | 07/28/21 | (3,295 | ) | ||||||||||||
MSCI | USD | 2,811,411 | BRL | 14,280,000 | 07/28/21 | 51,736 | |||||||||||||
SSC | AUD | 4,950,000 | USD | 3,750,101 | 07/28/21 | 37,361 | |||||||||||||
SSC | CAD | 4,480,000 | USD | 3,643,011 | 07/28/21 | 28,993 | |||||||||||||
SSC | CHF | 1,945,000 | USD | 2,116,886 | 07/28/21 | 13,298 | |||||||||||||
SSC | GBP | 1,310,000 | USD | 1,830,268 | 07/28/21 | 18,002 | |||||||||||||
SSC | HKD | 365,000 | USD | 47,010 | 07/28/21 | (2 | ) | ||||||||||||
SSC | NZD | 4,125,000 | USD | 2,909,733 | 07/28/21 | 26,521 | |||||||||||||
SSC | THB | 16,360,000 | USD | 512,874 | 07/29/21 | 2,459 | |||||||||||||
SSC | USD | 1,285,691 | JPY | 142,500,000 | 07/28/21 | (2,732 | ) | ||||||||||||
SSC | USD | 617,831 | MYR | 2,564,000 | 07/28/21 | (909 | ) | ||||||||||||
SSC | USD | 4,027,613 | NOK | 34,240,000 | 07/28/21 | (50,385 | ) | ||||||||||||
SSC | USD | 2,101,193 | PLN | 7,975,000 | 07/28/21 | (9,387 | ) | ||||||||||||
Net unrealized appreciation (depreciation) | $ | 169,319 | |||||||||||||||||
Fair valuation summary
The following is a summary of the fair valuations according to the inputs used as of June 30, 2021 in valuing the Fund's investments. In the event a Fund holds investments for which fair value is measured using the NAV per share practical expedient (or its equivalent), a separate column will be added to the fair value hierarchy table; this is intended to permit reconciliation to the amounts presented in the Portfolio of investments:
Description | Unadjusted quoted prices in active markets for identical investments (Level 1) | Other significant observable inputs (Level 2) | Unobservable inputs (Level 3) | Total | |||||||||||||||
Assets | |||||||||||||||||||
Corporate bonds | $ | — | $ | 8,888,525 | $ | — | $ | 8,888,525 | |||||||||||
Mortgage-backed securities | — | 332 | 0 | 332 | |||||||||||||||
Non-U.S. government agency obligations | — | 6,464,843 | — | 6,464,843 | |||||||||||||||
U.S. Treasury obligations | — | 10,167,297 | — | 10,167,297 | |||||||||||||||
Exchange traded funds | 2,421,246 | — | — | 2,421,246 | |||||||||||||||
Short-term investments | — | 2,752,679 | — | 2,752,679 | |||||||||||||||
Investment of cash collateral from securities loaned | — | 101,525 | — | 101,525 | |||||||||||||||
Futures contracts | 28,601 | — | — | 28,601 | |||||||||||||||
Swap agreements | — | 179,563 | — | 179,563 | |||||||||||||||
Forward foreign currency contracts | — | 247,691 | — | 247,691 | |||||||||||||||
Total | $ | 2,449,847 | $ | 28,802,455 | $ | 0 | $ | 31,252,302 | |||||||||||
Liabilities | |||||||||||||||||||
Futures contracts | $ | (125,603 | ) | $ | — | $ | — | $ | (125,603 | ) | |||||||||
Forward foreign currency contracts | — | (78,372 | ) | — | (78,372 | ) | |||||||||||||
Total | $ | (125,603 | ) | $ | (78,372 | ) | $ | — | $ | (203,975 | ) | ||||||||
24
UBS Dynamic Alpha Fund
Portfolio of investments
June 30, 2021
At June 30, 2021, there were no transfers in or out of Level 3.
Securities valued using unobservable inputs, i.e. Level 3, were not considered significant to the Fund.
Portfolio footnotes
† Amount represents less than 0.05% or (0.05)%.
1 In U.S. dollars unless otherwise indicated.
2 Security was purchased pursuant to Regulation S under the Securities Act of 1933, which exempts from registration securities offered and sold outside of the United States. Such a security cannot be sold in the United States without either an effective registration statement filed pursuant to the Securities Act of 1933, or pursuant to an exemption from registration.
3 Security exempt from registration pursuant to Rule 144A under the Securities Act of 1933. These securities are considered liquid, unless noted otherwise, and may be resold in transactions exempt from registration, normally to qualified institutional buyers. Securities exempt from registration pursuant to Rule 144A, in the amount of $704,883, represented 2.1% of the Fund's net assets at period end.
4 Perpetual investment. Date shown reflects the next call date.
5 Variable or floating rate security for which the interest rate adjusts periodically based on changes in current interest rates and prepayments on the underlying pool of assets. Rate shown is the rate in effect as of period end.
6 Security, or portion thereof, was on loan at the period end.
7 Step bond—coupon rate increases in increments to maturity. The rate disclosed is the rate at the period end; the maturity date disclosed is the ultimate maturity date.
8 Significant unobservable inputs were used in the valuation of this security; i.e. Level 3.
9 Security fair valued by the Valuation Committee under the direction of the Board of Trustees.
10 Rate shown is the discount rate at the date of purchase unless otherwise noted.
11 Rates shown reflect yield at June 30, 2021.
12 If the Fund is a seller of protection and a credit event occurs, as defined under the terms of that particular swap agreement, the Fund will either (i) pay to the buyer of protection an amount equal to the notional amount of the swap and take delivery of the referenced obligation or underlying securities comprising the referenced obligation or (ii) pay a net settlement amount in the form of cash or securities equal to the notional amount of the swap less the recovery value of the referenced obligation or underlying securities comprising the referenced obligation.
13 Payments made or received are based on the notional amount.
14 Variable or floating rate security. The interest rate shown is the rate in effect as of period end and changes periodically.
25
UBS Global Allocation Fund
Portfolio performance
For the 12 months ended June 30, 2021, Class A shares of UBS Global Allocation Fund (the "Fund") returned 25.58% (Class A shares returned 18.66% after the deduction of the maximum sales charge), while Class P shares returned 25.88%. In contrast, the Fund's benchmark, the 60% MSCI All Country World Index (net)/40% Citigroup World Government Bond Index (Hedged in USD), returned 21.71% during the same time period. For comparison purposes, the MSCI All Country World Index (net) returned 39.26% and the FTSE World Government Bond Index (Hedged in USD) returned -1.40% (Class P shares have lower expenses than other share classes of the Fund). Returns for all share classes over various time periods are shown on page 28; please note that these returns do not reflect the deduction of taxes that a shareholder would pay on Fund distributions or the redemption of Fund shares, while the Index returns do not reflect the deduction of fees and expenses.
The Fund produced a positive total return during the reporting period. All return levers contributed to performance, including security selection, tactical asset allocation decisions and our currency strategy.
During the review period, we used derivatives for risk management purposes and as a tool to help enhance returns in the portfolio. With respect to our active currency strategy, utilizing currency forwards had a positive impact on performance. We used a variety of equity and fixed income options, futures and swaps to implement our tactical asset allocation strategy
Portfolio performance summary
What worked:
• Overall, bottom-up security selection contributed to performance.
– All managers, except for the Emerging Markets Equity Opportunity strategy, contributed to performance. More specifically, performance in the US Large Cap Value and International Equity strategies were areas of strong security selection that were beneficial to performance.
• Overall, active asset allocation decisions were additive to returns.
– Overall, an overweight to equities relative to fixed income contributed to relative performance.
– Within equities, the Fund was rewarded for having an overweight to non-US equities. More specifically, the Fund benefited from its preference for emerging market stocks over developed market stocks, particularly in the fourth quarter of 2020. Furthermore, a preference for US small-cap over US large-cap stocks was very additive for returns. Over the period, investors shifted focus towards US small-cap stocks due to improving profit margins and the likelihood of US domestic stimulus.
– Within fixed income, the various credit tilts in the portfolio across high yield, investment grade and emerging market debt contributed to performance. This was a positive environment for credit given the supportive backdrop of accommodative policy, positive fundamentals and improving global growth.
• Overall, active currency positions contributed to performance.
– Most notably, long positions in the Chilean peso, Colombian peso, Mexican peso, Brazilian peso, and European currencies versus the US dollar were beneficial over the last half of 2020. Over this timeframe, favorable global growth, commodity price developments, and US dollar depreciation contributed to their performance.
26
UBS Global Allocation Fund
What didn't work:
• Bottom-up security selection detracted from performance in some areas.
– Most notably, security selection within the Emerging Markets Equity Opportunity strategy was a drag on performance, driven by negative stock selection within the consumer discretionary sector in the portfolio.
• Certain market allocations were a headwind for returns.
– Within equities, from a tactical asset allocation perspective, the Fund was underweight US equities relative to the benchmark (which detracted from relative performance). Global equities rallied, particularly with the US leading the way, supported by optimism over the rollout of vaccines, which offset concerns over rising COVID-19 cases in many parts of the world.
– Within fixed income, the Fund's overweight to Australian fixed income relative to European fixed income detracted from relative performance.
• Certain active currency positions detracted from performance.
– Most notably, short positions in New Zealand dollar, Canadian dollar, and Australian dollar versus the US dollar detracted from results, as cyclical global growth improvements alongside rising commodity prices contributed to the pullback of the broader US dollar.
This letter is intended to assist shareholders in understanding how the Fund performed during the 12 months ended June 30, 2021. The views and opinions in the letter were current as of August 12, 2021. They are not guarantees of future performance or investment results and should not be taken as investment advice. Investment decisions reflect a variety of factors, and we reserve the right to change our views about individual securities, sectors and markets at any time. As a result, the views expressed should not be relied upon as a forecast of the Fund's future investment intent. We encourage you to consult your financial advisor regarding your personal investment program.
Mutual funds are sold by prospectus only. You should read it carefully and consider a fund's investment objectives, risks, charges, expenses and other important information contained in the prospectus before investing. Prospectuses for most of our funds can be obtained from your financial advisor, by calling UBS Funds at 800-647 1568 or by visiting our website at www.ubs.com/am-us.
27
UBS Global Allocation Fund
Average annual total returns for periods ended 06/30/21 (unaudited)
1 year | 5 years | 10 years | |||||||||||||
Before deducting maximum sales charge | |||||||||||||||
Class A1 | 25.58 | % | 9.50 | % | 5.98 | % | |||||||||
Class P2 | 25.88 | 9.77 | 6.27 | ||||||||||||
After deducting maximum sales charge | |||||||||||||||
Class A1 | 18.66 | % | 8.27 | % | 5.38 | % | |||||||||
MSCI All Country World Index (net)3 | 39.26 | 14.61 | 9.90 | ||||||||||||
FTSE World Government Bond Index (Hedged in USD)4 | (1.40 | ) | 2.58 | 3.84 | |||||||||||
| 60% MSCI All Country World Index (net)/40% FTSE World Government Bond Index (Hedged in USD)5 | 21.71 | 9.97 | 7.73 | ||||||||||||
The annualized gross and net expense ratios, respectively, for each class of shares as in the October 28, 2020 prospectuses were as follows: Class A—1.50% and 1.28%; Class P—1.22% and 1.03%. Net expenses reflect fee waivers and/or expense reimbursements, if any, pursuant to an agreement that is in effect to cap the expenses. The Trust, with respect to the Fund, and UBS Asset Management (Americas) Inc., the Fund's investment advisor and administrator ("UBS AM (Americas)" or the "Advisor"), have entered into a written agreement pursuant to which the Advisor has agreed to waive a portion of its management fees and/or to reimburse expenses (excluding expenses incurred through investment in other investment companies, interest, taxes, brokerage commissions, and extraordinary expenses to the extent necessary so that the Fund's ordinary operating expenses (excluding expenses incurred through investment in other investment companies, interest, taxes, brokerage commissions, and extraordinary expenses), through the period ending October 28, 2021, do not exceed 1.20% for Class A shares and 0.95% for Class P shares. Pursuant to the written agreement, the Advisor is entitled to be reimbursed for any fees it waives and expenses it reimburses to the extent such reimbursement can be made during the three fiscal years following the date on which such fee waivers and expense reimbursements were made, provided that the reimbursement of the Advisor by the Fund will not cause the Fund to exceed the lesser of any applicable expense limit that is in place for the Fund (i) at the time of the waiver or reimbursement or (ii) at the time of the recoupment. The fee waiver/expense reimbursement agreement may be terminated by the Fund's Board of Trustees at any time and also will terminate automatically upon the expiration or termination of the Fund's advisory contract with the Advisor. Upon termination of the fee waiver/expense reimbursement agreement, however, UBS AM (Americas)'s three year recoupment rights will survive.
1 Maximum sales charge for Class A shares is 5.5%. Class A shares bear ongoing 12b-1 service fees.
2 Class P shares do not bear initial or contingent deferred sales charges or ongoing 12b-1 service and distribution fees, but Class P shares held through advisory programs may be subject to a program fee, which, if included, would have reduced performance.
3 The MSCI All Country World Index (net) is a free float-adjusted market capitalization weighted index that is designed to measure the equity market performance of developed and emerging markets. Net total return indices reinvest dividends after the deduction of withholding taxes, using a tax rate applicable to non-resident institutional investors who do not benefit from double taxation treaties. The index is constructed and managed with a view to being fully investable from the perspective of international institutional investors. Investors should note that indices do not reflect the deduction of fees and expenses.
4 The FTSE World Government Bond Index (Hedged in USD) is an unmanaged market capitalization-weighted index designed to measure the performance of fixed-rate, local currency, investment-grade sovereign bonds with a one-year minimum maturity and is hedged back to the US dollar. Investors should note that indices do not reflect the deduction of fees and expenses.
5 The 60% MSCI All Country World Index (net)/40% FTSE World Government Bond Index (Hedged in USD) is a unmanaged blended benchmark compiled by the Advisor. Investors should note that indices do not reflect the deduction of fees and expenses.
Prior to August 3, 2015, a 1% redemption fee was imposed on sales or exchanges of any class of shares of the Fund made during the specified holding period.
Past performance does not predict future performance, and the performance information provided does not reflect the deduction of taxes that a shareholder would pay on Fund distributions or the redemption of Fund shares. The return and principal value of an investment will fluctuate, so that an investor's shares, when redeemed, may be worth more or less than their original cost. Performance results assume reinvestment of all dividends and capital gain distributions at net asset value on the ex-dividend dates. Current performance may be higher or lower than the performance data quoted. For month-end performance figures, please visit www.ubs.com/us-mutualfundperformance.
28
UBS Global Allocation Fund
Illustration of an assumed investment of $10,000 in Class A shares (adjusted for 5.5% maximum sales charge) and $2,000,000 in Class P shares (unaudited)
The following two graphs depict the performance of UBS Global Allocation Fund Class A and Class P shares versus the MSCI All Country World Index (net), FTSE World Government Bond Index (Hedged in USD), and the 60% MSCI All Country World Index (net)/40% FTSE World Government Bond Index (Hedged in USD) over the 10 years ended June 30, 2021. The performance provided does not reflect the deduction of taxes that a shareholder would pay on Fund distributions or the redemption of Fund shares. Past performance is no guarantee of future results. Share price and returns will vary with market conditions; investors may realize a gain or loss upon redemption.
UBS Global Allocation Fund Class A vs. MSCI All Country World Index (net), FTSE World Government Bond Index (Hedged in USD) and 60% MSCI All Country World Index (net)/40% FTSE World Government Bond Index (Hedged in USD)
Wealth value with dividends reinvested. Initial investment for Class A Shares as of June 30, 2011 = $9,450
The Fund's growth of an assumed $10,000 investment is adjusted for the maximum sales charge of 5.5%.
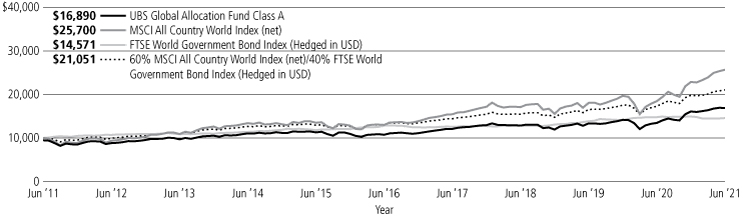
UBS Global Allocation Fund Class P vs. MSCI All Country World Index (net), FTSE World Government Bond Index (Hedged in USD) and 60% MSCI All Country World Index (net)/40% FTSE World Government Bond Index (Hedged in USD)
Wealth value with dividends reinvested. Initial investment for Class P shares as of June 30, 2011 = $2,000,000

Past performance does not predict future performance, and the performance information provided does not reflect the deduction of taxes that a shareholder would pay on Fund distributions or the redemption of Fund shares. The return and principal value of an investment will fluctuate, so that an investor's shares, when redeemed, may be worth more or less than their original cost. Performance results assume reinvestment of all dividends and capital gain distributions at net asset value on the ex-dividend dates. Current performance may be higher or lower than the performance data quoted. For month-end performance figures, please visit www.ubs.com/us-mutualfundperformance.
29
UBS Global Allocation Fund
Portfolio statistics and industry diversification—(unaudited)1
As a percentage of net assets as of June 30, 2021
Top ten fixed income holdings
| Republic of South Africa Government Bond, 8.000% due 01/31/30 | 3.0 | % | |||||
| New Zealand Government Inflation Linked Bond, 2.000% due 09/20/25 | 1.2 | ||||||
UMBS TBA, 2.000% | 1.0 | ||||||
UMBS TBA, 2.500% | 0.8 | ||||||
U.S. Treasury Notes, 0.625% due 08/15/30 | 0.5 | ||||||
GNMA TBA, 2.500% | 0.5 | ||||||
U.S. Treasury Notes, 1.375% due 09/30/23 | 0.4 | ||||||
Canadian Government Bond, 1.500% due 09/01/24 | 0.4 | ||||||
U.S. Treasury Bonds, 2.875% due 05/15/43 | 0.3 | ||||||
U.S. Treasury Notes, 1.625% due 11/30/26 | 0.3 | ||||||
Total | 8.4 | % | |||||
Top ten equity holdings
Microsoft Corp. | 1.3 | % | |||||
Apple, Inc. | 1.2 | ||||||
Amazon.com, Inc. | 1.1 | ||||||
Alphabet, Inc., Class A | 1.0 | ||||||
AbbVie, Inc. | 1.0 | ||||||
Salesforce.com, Inc. | 0.6 | ||||||
Visa, Inc., A Shares | 0.6 | ||||||
Comcast Corp., Class A | 0.6 | ||||||
Sony Group Corp. | 0.6 | ||||||
AIA Group Ltd. | 0.5 | ||||||
Total | 8.5 | % | |||||
Top five issuer breakdown by country or territory of origin2
United States | �� | 76.8 | % | ||||
Japan | 3.5 | ||||||
South Africa | 3.3 | ||||||
United Kingdom | 3.2 | ||||||
Canada | 1.4 | ||||||
Total | 88.2 | % | |||||
1 The portfolio is actively managed and its composition will vary over time.
2 Figures represent the direct investments of UBS Global Allocation Fund. If a breakdown of the underlying investment companies and exchange traded funds was included, the country or territory of origin breakdown would be as follows: United States: 89.7%, Japan: 3.6%, South Africa 4.0%, United Kingdom: 3.4% and Canada 1.9%.
30
UBS Global Allocation Fund
Portfolio statistics and industry diversification—(unaudited)1
As a percentage of net assets as of June 30, 2021
Common stocks | |||||||
Aerospace & defense | 0.1 | % | |||||
Air freight & logistics | 0.2 | ||||||
Airlines | 0.4 | ||||||
Auto components | 0.7 | ||||||
Automobiles | 0.5 | ||||||
Banks | 2.4 | ||||||
Beverages | 0.3 | ||||||
Biotechnology | 1.7 | ||||||
Capital markets | 0.9 | ||||||
Chemicals | 1.6 | ||||||
Commercial services & supplies | 0.3 | ||||||
Communications equipment | 0.2 | ||||||
Consumer finance | 0.3 | ||||||
Diversified financial services | 0.7 | ||||||
Diversified telecommunication services | 0.7 | ||||||
Electric utilities | 0.4 | ||||||
Electrical equipment | 0.6 | ||||||
Electronic equipment, instruments & components | 0.5 | ||||||
Entertainment | 1.0 | ||||||
Equity real estate investment trusts | 0.4 | ||||||
Food products | 1.1 | ||||||
Health care equipment & supplies | 1.5 | ||||||
Health care providers & services | 0.6 | ||||||
Hotels, restaurants & leisure | 0.8 | ||||||
Household durables | 0.6 | ||||||
Insurance | 1.0 | ||||||
Interactive media & services | 1.8 | ||||||
Internet & direct marketing retail | 1.4 | ||||||
IT services | 1.3 | ||||||
Life sciences tools & services | 0.9 | ||||||
Machinery | 1.0 | ||||||
Media | 0.6 | ||||||
Metals & mining | 0.3 | ||||||
Multiline retail | 0.6 | ||||||
Oil, gas & consumable fuels | 1.7 | ||||||
Personal products | 0.5 | ||||||
Pharmaceuticals | 0.9 | ||||||
Professional services | 0.5 | ||||||
Road & rail | 0.2 | ||||||
Semiconductors & semiconductor equipment | 2.0 | ||||||
Software | 4.2 | ||||||
Specialty retail | 0.3 | ||||||
Technology hardware, storage & peripherals | 1.4 | ||||||
Textiles, apparel & luxury goods | 0.4 | ||||||
Tobacco | 0.3 | ||||||
Trading companies & distributors | 1.1 | ||||||
Transportation infrastructure | 0.3 | ||||||
Wireless telecommunication services | 0.3 | ||||||
Total common stocks | 41.5 | ||||||
|
| ||||||
Exchange traded funds | 24.3 | % | |||||
Investment companies | 8.1 | ||||||
Asset-backed securities | 3.6 | ||||||
Mortgage-backed securities | 3.6 | ||||||
Non-U.S. government agency obligations | 6.7 | ||||||
U.S. government agency obligations | 3.1 | ||||||
U.S. Treasury obligations | 3.3 | ||||||
Short-term investments | 4.3 | ||||||
Investment of cash collateral from securities loaned | 0.7 | ||||||
Total investments | 99.2 | ||||||
Other assets in excess of liabilities | 0.8 | ||||||
Net assets | 100.0 | % | |||||
31
UBS Global Allocation Fund
Portfolio of investments
June 30, 2021
| Number of shares | Value | ||||||||||
Common stocks: 41.5% | |||||||||||
Austria: 0.5% | |||||||||||
Erste Group Bank AG | 34,271 | $ | 1,257,304 | ||||||||
Belgium: 0.1% | |||||||||||
Galapagos N.V.* | 2,560 | 177,517 | |||||||||
Canada: 0.9% | |||||||||||
Canadian Natural Resources Ltd. | 26,163 | 949,770 | |||||||||
Royal Bank of Canada | 11,476 | 1,162,690 | |||||||||
Zymeworks, Inc.* | 5,577 | 193,466 | |||||||||
2,305,926 | |||||||||||
China: 0.8% | |||||||||||
Alibaba Group Holding Ltd., ADR* | 956 | 216,802 | |||||||||
Hangzhou Tigermed Consulting Co. Ltd., Class A | 18,087 | 541,089 | |||||||||
NXP Semiconductors N.V. | 3,988 | 820,411 | |||||||||
Prosus N.V.* | 5,316 | 519,845 | |||||||||
2,098,147 | |||||||||||
Denmark: 0.4% | |||||||||||
Genmab A/S* | 2,210 | 904,263 | |||||||||
France: 0.5% | |||||||||||
Pernod Ricard SA | 3,759 | 834,394 | |||||||||
Ubisoft Entertainment SA* | 7,158 | 501,108 | |||||||||
1,335,502 | |||||||||||
Germany: 1.3% | |||||||||||
Continental AG | 4,489 | 659,925 | |||||||||
CTS Eventim AG & Co. KGaA* | 9,993 | 624,453 | |||||||||
Knorr-Bremse AG | 2,553 | 293,640 | |||||||||
LANXESS AG | 11,003 | 754,367 | |||||||||
SAP SE | 6,396 | 901,289 | |||||||||
3,233,674 | |||||||||||
Hong Kong: 0.5% | |||||||||||
AIA Group Ltd. | 107,317 | 1,333,809 | |||||||||
India: 0.4% | |||||||||||
HDFC Bank Ltd., ADR* | 12,718 | 929,940 | |||||||||
Ireland: 0.3% | |||||||||||
AIB Group PLC* | 248,902 | 641,330 | |||||||||
Italy: 0.7% | |||||||||||
PRADA SpA | 116,700 | 886,038 | |||||||||
Prysmian SpA | 21,551 | 772,501 | |||||||||
1,658,539 | |||||||||||
Japan: 3.1% | |||||||||||
ITOCHU Corp. | 37,700 | 1,085,917 | |||||||||
Keyence Corp. | 1,000 | 504,703 | |||||||||
Nippon Telegraph & Telephone Corp. | 29,300 | 763,390 | |||||||||
ORIX Corp. | 60,600 | 1,022,501 | |||||||||
Shin-Etsu Chemical Co. Ltd. | 5,000 | 836,221 | |||||||||
SoftBank Group Corp. | 10,100 | 706,850 | |||||||||
Sony Group Corp. | 14,100 | 1,372,623 | |||||||||
| Number of shares | Value | ||||||||||
Common stocks—(continued) | |||||||||||
Japan—(concluded) | |||||||||||
Takeda Pharmaceutical Co. Ltd. | 22,800 | $ | 763,250 | ||||||||
TechnoPro Holdings, Inc.1 | 28,200 | 667,083 | |||||||||
7,722,538 | |||||||||||
Netherlands: 0.7% | |||||||||||
OCI N.V.* | 25,842 | 628,777 | |||||||||
Royal Dutch Shell PLC, A Shares | 53,607 | 1,072,868 | |||||||||
1,701,645 | |||||||||||
South Africa: 0.3% | |||||||||||
Anglo American PLC | 20,294 | 806,388 | |||||||||
South Korea: 0.3% | |||||||||||
Coupang, Inc.* | 2,927 | 122,407 | |||||||||
SK Hynix, Inc. | 5,377 | 608,771 | |||||||||
731,178 | |||||||||||
Spain: 0.3% | |||||||||||
Aena SME SA*,2 | 4,621 | 757,794 | |||||||||
Sweden: 0.1% | |||||||||||
Oatly Group AB, ADR* | 13,800 | 337,548 | |||||||||
Switzerland: 0.9% | |||||||||||
Alcon, Inc. | 17,503 | 1,225,447 | |||||||||
Novartis AG | 11,560 | 1,053,487 | |||||||||
2,278,934 | |||||||||||
United Kingdom: 2.9% | |||||||||||
Ashtead Group PLC | 16,262 | 1,206,644 | |||||||||
British American Tobacco PLC | 22,569 | 874,152 | |||||||||
BT Group PLC* | 394,157 | 1,057,761 | |||||||||
London Stock Exchange Group PLC | 7,569 | 834,475 | |||||||||
RELX PLC | 21,963 | 583,019 | |||||||||
Sage Group PLC | 63,709 | 602,976 | |||||||||
Spectris PLC | 16,139 | 722,886 | |||||||||
Unilever PLC | 20,575 | 1,204,348 | |||||||||
7,086,261 | |||||||||||
United States: 26.5% | |||||||||||
10X Genomics, Inc., Class A* | 1,212 | 237,334 | |||||||||
AbbVie, Inc. | 21,308 | 2,400,133 | |||||||||
Advanced Micro Devices, Inc.* | 5,848 | 549,303 | |||||||||
AGCO Corp. | 7,715 | 1,005,882 | |||||||||
Airbnb, Inc., Class A* | 120 | 18,377 | |||||||||
Akamai Technologies, Inc.* | 10,686 | 1,245,988 | |||||||||
Allstate Corp. | 4,843 | 631,721 | |||||||||
Alphabet, Inc., Class A* | 1,067 | 2,605,390 | |||||||||
Amazon.com, Inc.* | 801 | 2,755,568 | |||||||||
Ameriprise Financial, Inc. | 4,035 | 1,004,231 | |||||||||
APA Corp. | 26,268 | 568,177 | |||||||||
Apple, Inc. | 21,228 | 2,907,387 | |||||||||
Applied Materials, Inc. | 4,061 | 578,286 | |||||||||
Aptiv PLC* | 6,886 | 1,083,374 | |||||||||
Autodesk, Inc.* | 2,898 | 845,926 | |||||||||
Bank OZK | 15,479 | 652,595 | |||||||||
32
UBS Global Allocation Fund
Portfolio of investments
June 30, 2021
| Number of shares | Value | ||||||||||
Common stocks—(continued) | |||||||||||
United States—(continued) | |||||||||||
Bio-Rad Laboratories, Inc., Class A* | 1,600 | $ | 1,030,864 | ||||||||
BioMarin Pharmaceutical, Inc.* | 6,430 | 536,519 | |||||||||
Booking Holdings, Inc.* | 350 | 765,831 | |||||||||
Bumble, Inc., Class A* | 537 | 30,931 | |||||||||
Bunge Ltd. | 15,233 | 1,190,459 | |||||||||
CF Industries Holdings, Inc. | 15,052 | 774,425 | |||||||||
Charles Schwab Corp. | 5,707 | 415,527 | |||||||||
Ciena Corp.* | 10,726 | 610,202 | |||||||||
Comcast Corp., Class A | 24,730 | 1,410,105 | |||||||||
ConocoPhillips | 4,997 | 304,317 | |||||||||
Cooper Cos., Inc. | 844 | 334,452 | |||||||||
DexCom, Inc.* | 1,262 | 538,874 | |||||||||
Dollar General Corp. | 2,503 | 541,624 | |||||||||
Dollar Tree, Inc.* | 10,513 | 1,046,043 | |||||||||
Edwards Lifesciences Corp.* | 6,149 | 636,852 | |||||||||
Eli Lilly & Co. | 1,621 | 372,052 | |||||||||
Facebook, Inc., Class A* | 2,005 | 697,159 | |||||||||
FedEx Corp. | 1,425 | 425,120 | |||||||||
Fidelity National Information Services, Inc. | 3,513 | 497,687 | |||||||||
Ford Motor Co.* | 51,246 | 761,516 | |||||||||
HEICO Corp., Class A | 2,238 | 277,915 | |||||||||
Hess Corp. | 1,536 | 134,124 | |||||||||
HubSpot, Inc.* | 1,127 | 656,725 | |||||||||
IAC/InterActiveCorp* | 1,864 | 287,373 | |||||||||
Ingersoll Rand, Inc.* | 24,762 | 1,208,633 | |||||||||
IQVIA Holdings, Inc.* | 2,193 | 531,408 | |||||||||
Laboratory Corp. of America Holdings* | 3,429 | 945,890 | |||||||||
LivaNova PLC* | 10,500 | 883,155 | |||||||||
Lowe's Cos., Inc. | 3,765 | 730,297 | |||||||||
Marsh & McLennan Cos., Inc. | 4,105 | 577,491 | |||||||||
Marvell Technology, Inc. | 7,524 | 438,875 | |||||||||
Match Group, Inc.* | 3,380 | 545,025 | |||||||||
McDonald's Corp. | 2,813 | 649,775 | |||||||||
Micron Technology, Inc.* | 10,705 | 909,711 | |||||||||
Microsoft Corp. | 11,672 | 3,161,945 | |||||||||
Mondelez International, Inc., Class A | 18,476 | 1,153,641 | |||||||||
Netflix, Inc.* | 1,157 | 611,139 | |||||||||
NextEra Energy, Inc. | 13,708 | 1,004,522 | |||||||||
NVIDIA Corp. | 543 | 434,454 | |||||||||
Prologis, Inc. | 8,300 | 992,099 | |||||||||
Qorvo, Inc.* | 2,168 | 424,169 | |||||||||
Rockwell Automation, Inc. | 1,194 | 341,508 | |||||||||
Salesforce.com, Inc.* | 6,599 | 1,611,938 | |||||||||
ServiceNow, Inc.* | 1,577 | 866,640 | |||||||||
Shoals Technologies Group, Inc., Class A* | 7,627 | 270,759 | |||||||||
Southwest Airlines Co.* | 19,404 | 1,030,158 | |||||||||
Starbucks Corp. | 5,469 | 611,489 | |||||||||
Stericycle, Inc.* | 9,681 | 692,676 | |||||||||
Synchrony Financial | 14,235 | 690,682 | |||||||||
Take-Two Interactive Software, Inc.* | 4,586 | 811,814 | |||||||||
Tesla, Inc.* | 811 | 551,237 | |||||||||
Trade Desk, Inc., Class A* | 5,580 | 431,669 | |||||||||
Union Pacific Corp. | 1,758 | 386,637 | |||||||||
United Rentals, Inc.* | 1,417 | 452,037 | |||||||||
UnitedHealth Group, Inc. | 1,217 | 487,335 | |||||||||
Universal Display Corp. | 1,319 | 293,253 | |||||||||
| Number of shares | Value | ||||||||||
Common stocks—(concluded) | |||||||||||
United States—(concluded) | |||||||||||
Vimeo, Inc.* | 4,027 | $ | 197,323 | ||||||||
Visa, Inc., Class A | 6,633 | 1,550,928 | |||||||||
VMware, Inc., Class A* | 5,059 | 809,288 | |||||||||
Voya Financial, Inc. | 10,942 | 672,933 | |||||||||
Wells Fargo & Co. | 28,401 | 1,286,281 | |||||||||
Western Digital Corp.* | 9,853 | 701,238 | |||||||||
Westlake Chemical Corp. | 9,902 | 892,071 | |||||||||
Williams Cos., Inc. | 48,483 | 1,287,224 | |||||||||
Zscaler, Inc.* | 2,833 | 612,098 | |||||||||
66,107,813 | |||||||||||
| Total common stocks (cost $76,296,586) | 103,406,050 | ||||||||||
Exchange traded funds: 24.3% | |||||||||||
Invesco S&P 500 Equal Weight ETF1 | 33,084 | 4,986,751 | |||||||||
| iShares Broad USD High Yield Corporate Bond ETF | 541,568 | 22,594,217 | |||||||||
iShares Global Financials ETF1 | 61,641 | 4,783,958 | |||||||||
| iShares JPMorgan USD Emerging Markets Bond ETF1 | 135,118 | 15,195,370 | |||||||||
iShares MSCI India ETF | 70,569 | 3,122,678 | |||||||||
iShares MSCI Mexico ETF1 | 38,971 | 1,870,218 | |||||||||
iShares MSCI South Africa ETF1 | 35,315 | 1,725,491 | |||||||||
JPMorgan BetaBuilders MSCI US REIT ETF | 64,474 | 6,178,544 | |||||||||
| Total exchange traded funds (cost $59,912,938) | 60,457,227 | ||||||||||
Investment companies: 8.1% | |||||||||||
| UBS Emerging Markets Equity Opportunity Fund3 (cost $16,515,265) | 1,617,672 | 20,253,259 | |||||||||
| Face amount | |||||||||||
Asset-backed securities: 3.6% | |||||||||||
United States: 3.6% | |||||||||||
| ACC Trust, Series 2021-1, Class A, 0.740%, due 11/20/232 | $ | 150,000 | 149,972 | ||||||||
| American Credit Acceptance Receivables Trust, Series 2021-1, Class C, 0.830%, due 03/15/272 | 100,000 | 100,053 | |||||||||
| Series 2021-2, Class D, 1.340%, due 07/13/272 | 275,000 | 273,991 | |||||||||
| AmeriCredit Automobile Receivables Trust, Series 2017-2, Class D, 3.420%, due 04/18/23 | 200,000 | 202,909 | |||||||||
| Series 2020-1, Class A2A, 1.100%, due 03/20/23 | 14,448 | 14,458 | |||||||||
| CARDS II Trust, Series 2021-1A, Class C, 1.200%, due 04/15/272 | 200,000 | 199,530 | |||||||||
| CCG Receivables Trust, Series 2020-1, Class C, 1.840%, due 12/14/272 | 100,000 | 101,245 | |||||||||
33
UBS Global Allocation Fund
Portfolio of investments
June 30, 2021
| Face amount | Value | ||||||||||
Asset-backed securities—(continued) | |||||||||||
United States—(continued) | |||||||||||
| CF Hippolyta LLC, Series 2020-1, Class A1, 1.690%, due 07/15/602 | $ | 95,438 | $ | 96,978 | |||||||
| Series 2021-1A, Class A1, 1.530%, due 03/15/612 | 150,000 | 151,002 | |||||||||
| CPS Auto Receivables Trust, Series 2018-A, Class D, 3.660%, due 12/15/232 | 86,838 | 87,788 | |||||||||
| Series 2021-A, Class C, 0.830%, due 09/15/262 | 150,000 | 149,884 | |||||||||
| Series 2021-A, Class D, 1.160%, due 12/15/262 | 100,000 | 99,447 | |||||||||
| Dell Equipment Finance Trust, Series 2018-2, Class B, 3.550%, due 10/22/232 | 57,196 | 57,348 | |||||||||
| Series 2019-2, Class A2, 1.950%, due 12/22/212 | 17,493 | 17,520 | |||||||||
| Drive Auto Receivables Trust, Series 2018-1, Class D, 3.810%, due 05/15/24 | 198,598 | 200,936 | |||||||||
| Series 2018-4, Class C, 3.660%, due 11/15/24 | 8,045 | 8,057 | |||||||||
| DT Auto Owner Trust, Series 2018-1A, Class D, 3.810%, due 12/15/232 | 102,086 | 102,737 | |||||||||
| Series 2019-3A, Class C, 2.740%, due 04/15/252 | 235,000 | 238,037 | |||||||||
| Series 2021-1A, Class C, 0.840%, due 10/15/262 | 100,000 | 99,917 | |||||||||
| Series 2021-1A, Class D, 1.160%, due 11/16/262 | 100,000 | 99,628 | |||||||||
| Exeter Automobile Receivables Trust, Series 2018-4A, Class C, 3.970%, due 09/15/232 | 25,548 | 25,661 | |||||||||
| Series 2019-2A, Class C, 3.300%, due 03/15/242 | 364,666 | 368,608 | |||||||||
| Series 2021-1A, Class C, 0.740%, due 01/15/26 | 125,000 | 124,924 | |||||||||
| Series 2021-1A, Class D, 1.080%, due 11/16/26 | 125,000 | 124,290 | |||||||||
| Series 2021-2A, Class D, 1.400%, due 04/15/27 | 300,000 | 299,664 | |||||||||
| Flagship Credit Auto Trust, Series 2017-2, Class C, 2.960%, due 07/15/232 | 42,123 | 42,171 | |||||||||
| Ford Credit Auto Owner Trust, Series 2018-1, Class A, 3.190%, due 07/15/312 | 600,000 | 647,287 | |||||||||
| Ford Credit Floorplan Master Owner Trust, Series 2019-2, Class A, 3.060%, due 04/15/26 | 500,000 | 533,362 | |||||||||
| GM Financial Automobile Leasing Trust, Series 2020-2, Class A4, 1.010%, due 07/22/24 | 75,000 | 75,769 | |||||||||
| Face amount | Value | ||||||||||
Asset-backed securities—(continued) | |||||||||||
United States—(continued) | |||||||||||
| HPEFS Equipment Trust, Series 2019-1A, Class B, 2.320%, due 09/20/292 | $ | 100,000 | $ | 100,862 | |||||||
| Series 2021-1A, Class D, 1.030%, due 03/20/312 | 150,000 | 149,573 | |||||||||
| Series 2021-2A, Class D, 1.290%, due 03/20/292 | 100,000 | 99,766 | |||||||||
| MVW LLC, Series 2021-1WA, Class A, 1.140%, due 01/22/412 | 146,988 | 146,886 | |||||||||
| Ocwen Master Advance Receivables Trust, Series 2020-T1, Class AT1, 1.278%, due 08/15/522 | 100,000 | 101,081 | |||||||||
| OneMain Direct Auto Receivables Trust, Series 2018-1A, Class A, 3.430%, due 12/16/242 | 47,701 | 47,903 | |||||||||
| Series 2018-1A, Class C, 3.850%, due 10/14/252 | 216,000 | 218,637 | |||||||||
| Series 2018-1A, Class D, 4.400%, due 01/14/282 | 216,000 | 218,902 | |||||||||
| Series 2019-1A, Class A, 3.630%, due 09/14/272 | 120,000 | 129,339 | |||||||||
| OneMain Financial Issuance Trust, Series 2020-2A, Class B, 2.210%, due 09/14/352 | 100,000 | 102,213 | |||||||||
| Series 2021-1A, Class A1, 1.550%, due 06/16/362 | 300,000 | 301,120 | |||||||||
| PFS Financing Corp., Series 2021-A, Class A, 0.710%, due 04/15/262 | 100,000 | 99,920 | |||||||||
| Series 2021-B, Class A, 0.775%, due 08/17/262 | 275,000 | 273,514 | |||||||||
| Santander Drive Auto Receivables Trust, Series 2017-2, Class D, 3.490%, due 07/17/23 | 163,898 | 164,453 | |||||||||
| Series 2018-2, Class C, 3.350%, due 07/17/23 | 47,300 | 47,360 | |||||||||
| Series 2020-2, Class B, 0.960%, due 11/15/24 | 100,000 | 100,487 | |||||||||
| Series 2021-1, Class B, 0.500%, due 04/15/25 | 300,000 | 300,207 | |||||||||
| Series 2021-1, Class D, 1.130%, due 11/16/26 | 200,000 | 200,304 | |||||||||
| Series 2021-2, Class D, 1.350%, due 07/15/27 | 225,000 | 225,222 | |||||||||
| Santander Retail Auto Lease Trust, Series 2021-B, Class C, 1.100%, due 06/20/252 | 300,000 | 298,984 | |||||||||
| Sofi Consumer Loan Program LLC, Series 2017-4, Class B, 3.590%, due 05/26/262,5 | 69,592 | 70,158 | |||||||||
| SoFi Consumer Loan Program Trust, Series 2019-3, Class A, 2.900%, due 05/25/282 | 15,560 | 15,641 | |||||||||
34
UBS Global Allocation Fund
Portfolio of investments
June 30, 2021
| Face amount | Value | ||||||||||
Asset-backed securities—(concluded) | |||||||||||
United States—(concluded) | |||||||||||
| SoFi Professional Loan Program LLC, Series 2016-D, Class A2B, 2.340%, due 04/25/332 | $ | 69,687 | $ | 70,886 | |||||||
| SPS Servicer Advance Receivables Trust, Series 2020-T1, Class AT1, 1.280%, due 11/15/522 | 100,000 | 100,373 | |||||||||
| Tesla Auto Lease Trust, Series 2020-A, Class D, 2.330%, due 02/20/242 | 300,000 | 307,751 | |||||||||
| Series 2021-A, Class D, 1.340%, due 03/20/252 | 425,000 | 425,870 | |||||||||
| Total asset-backed securities (cost $8,880,319) | 9,010,585 | ||||||||||
Mortgage-backed securities: 3.6% | |||||||||||
United States: 3.6% | |||||||||||
| Angel Oak Mortgage Trust, Series 2020-4, Class A1, 1.469%, due 06/25/652,5 | 93,071 | 93,610 | |||||||||
| Series 2020-6, Class A1, 1.261%, due 05/25/652,5 | 66,485 | 66,665 | |||||||||
| Series 2020-R1, Class A1, 0.990%, due 04/25/532,5 | 106,653 | 106,636 | |||||||||
| Series 2021-2, Class A1, 0.985%, due 04/25/662,5 | 92,327 | 92,233 | |||||||||
| Angel Oak Mortgage Trust LLC, Series 2020-5, Class A1, 1.373%, due 05/25/652,5 | 63,089 | 63,311 | |||||||||
| Arbor Multifamily Mortgage Securities Trust, Series 2020-MF1, Class B, 3.719%, due 05/15/532,5 | 500,000 | 538,588 | |||||||||
| Series 2021-MF2, Class B, 2.560%, due 06/15/542,5 | 100,000 | 100,383 | |||||||||
| BANK, Series 2018-BN14, Class A4, 4.231%, due 09/15/605 | 275,000 | 318,407 | |||||||||
| Series 2021-BN32, Class C, 3.372%, due 04/15/54 | 150,000 | 156,333 | |||||||||
| BBCMS Trust, Series 2015-SRCH, Class A2, 4.197%, due 08/10/352 | 210,000 | 238,071 | |||||||||
| BENCHMARK Mortgage Trust, Series 2020-B20, Class AS, 2.375%, due 10/15/53 | 100,000 | 101,480 | |||||||||
| BX Commercial Mortgage Trust, Series 2018-BIOA, Class A, 1 mo. USD LIBOR + 0.671%, 0.744%, due 03/15/37 2,6 | 470,000 | 470,610 | |||||||||
| Series 2018-IND, Class B, 1 mo. USD LIBOR + 0.900%, 0.973%, due 11/15/35 2,6 | 70,000 | 70,023 | |||||||||
| Series 2020-VKNG, Class C, 1 mo. USD LIBOR + 1.400%, 1.473%, due 10/15/37 2,6 | 100,000 | 100,000 | |||||||||
| Face amount | Value | ||||||||||
Mortgage-backed securities—(continued) | |||||||||||
United States—(continued) | |||||||||||
| Series 2021-VINO, Class A, 1 mo. USD LIBOR + 0.652%, 0.725%, due 05/15/38 2,6 | $ | 300,000 | $ | 299,910 | |||||||
| Citigroup Commercial Mortgage Trust, Series 2019-GC43, Class A4, 3.038%, due 11/10/52 | 200,000 | 216,247 | |||||||||
| Series 2019-SMRT, Class C, 4.682%, due 01/10/362 | 345,000 | 369,602 | |||||||||
| COLT Funding LLC, Series 2021-1, Class A1, 0.910%, due 06/25/662,5 | 98,551 | 98,327 | |||||||||
| Series 2021-3R, Class A1, 1.051%, due 12/25/642,5 | 167,797 | 167,744 | |||||||||
| COLT Mortgage Loan Trust, Series 2020-1R, Class A1, 1.255%, due 09/25/652,5 | 56,959 | 57,163 | |||||||||
| Series 2020-2, Class A1, 1.853%, due 03/25/652,5 | 143,766 | 144,532 | |||||||||
| Series 2020-3, Class A1, 1.506%, due 04/27/652,5 | 135,384 | 135,908 | |||||||||
| COMM Mortgage Trust, Series 2021-LBA, Class C, 1 mo. USD LIBOR + 1.200%, 1.273%, due 03/15/382,6 | 250,000 | 250,000 | |||||||||
| CSMC Trust, Series 2020-NQM1, Class A1, 1.208%, due 05/25/652,7 | 222,711 | 224,127 | |||||||||
| DBGS Mortgage Trust, Series 2018-BIOD, Class A, 1 mo. USD LIBOR + 0.803%, 0.876%, due 05/15/352,6 | 92,814 | 92,965 | |||||||||
| Deephaven Residential Mortgage Trust, Series 2020-1, Class A1, 2.339%, due 01/25/602,5 | 109,518 | 110,749 | |||||||||
| Series 2020-2, Class A1, 1.692%, due 05/25/652 | 42,144 | 42,334 | |||||||||
| Series 2021-2, Class A1, 0.899%, due 04/25/662,5 | 147,004 | 146,865 | |||||||||
| GS Mortgage Backed Securities Corp. Trust, Series 2021-NQM1, Class A1, 1.017%, due 07/25/612,5 | 136,916 | 136,810 | |||||||||
| GS Mortgage Securities Trust, Series 2017-FARM, Class A, 3.659%, due 01/10/432,5 | 100,000 | 109,859 | |||||||||
| Series 2017-GS5, Class B, 4.047%, due 03/10/505 | 100,000 | 109,676 | |||||||||
| GS Mortgage-Backed Securities Trust, Series 2020-NQM1, Class A1, 1.382%, due 09/27/602,5 | 55,877 | 56,066 | |||||||||
| J.P. Morgan Chase Commercial Mortgage Securities Trust, Series 2021-2NU, Class D, 2.146%, due 01/05/402,5 | 125,000 | 120,266 | |||||||||
35
UBS Global Allocation Fund
Portfolio of investments
June 30, 2021
| Face amount | Value | ||||||||||
Mortgage-backed securities—(continued) | |||||||||||
United States—(continued) | |||||||||||
| JPMDB Commercial Mortgage Securities Trust, Series 2017-C7, Class B, 3.985%, due 10/15/50 | $ | 175,000 | $ | 191,678 | |||||||
| MAD Mortgage Trust, Series 2017-330M, Class B, 3.478%, due 08/15/342,5 | 125,000 | 127,923 | |||||||||
| Series 2017-330M, Class C, 3.600%, due 08/15/342,5 | 150,000 | 152,959 | |||||||||
| MFA Trust, Series 2020-NQM3, Class A1, 1.014%, due 01/26/652,5 | 69,679 | 69,730 | |||||||||
| Series 2021-NQM1, Class A1, 1.153%, due 04/25/652,5 | 85,233 | 85,098 | |||||||||
| MHC Commercial Mortgage Trust, Series 2021-MHC, Class D, 1 mo. USD LIBOR + 1.601%, 1.674%, due 04/15/382,6 | 350,000 | 350,329 | |||||||||
| MHC Trust, Series 2021-MHC2, Class D, 1 mo. USD LIBOR + 1.500%, 1.573%, due 05/15/232,6 | 150,000 | 150,180 | |||||||||
| MSCG Trust, Series 2018-SELF, Class A, 1 mo. USD LIBOR + 0.900%, 0.973%, due 10/15/372,6 | 690,000 | 690,430 | |||||||||
| New Residential Mortgage Loan Trust, Series 2019-NQM4, Class A1, 2.492%, due 09/25/592,5 | 70,330 | 71,023 | |||||||||
| Series 2020-NQM2, Class A1, 1.650%, due 05/24/602,5 | 58,402 | 59,066 | |||||||||
| Series 2021-NQ2R, Class A1, 0.941%, due 09/25/582,4,5 | 161,291 | 161,282 | |||||||||
| ONE Mortgage Trust, Series 2021-PARK, Class C, 1 mo. USD LIBOR + 1.100%, 1.173%, due 03/15/362,6 | 200,000 | 199,759 | |||||||||
| Residential Mortgage Loan Trust, Series 2020-2, Class A1, 1.654%, due 05/25/602,5 | 59,611 | 59,986 | |||||||||
| RLGH Trust, Series 2021-TROT, Class C, 1 mo. USD LIBOR + 1.314%, 1.387%, due 04/15/362,6 | 190,000 | 189,833 | |||||||||
| TTAN, Series 2021-MHC, Class D, 1 mo. USD LIBOR + 1.750%, 1.823%, due 03/15/382,6 | 100,000 | 100,453 | |||||||||
| Verus Securitization Trust, Series 2019-4, Class A1, 2.642%, due 11/25/592,7 | 53,551 | 54,446 | |||||||||
| Series 2020-4, Class A1, 1.502%, due 05/25/652,7 | 71,600 | 72,012 | |||||||||
| Series 2020-5, Class A1, 1.218%, due 05/25/652,7 | 73,057 | 73,244 | |||||||||
| Face amount | Value | ||||||||||
Mortgage-backed securities—(concluded) | |||||||||||
United States—(concluded) | |||||||||||
| Series 2021-3, Class A1, 1.024%, due 06/25/662,4,5,8 | $ | 200,000 | $ | 199,998 | |||||||
| Series 2021-R2, Class A1, 0.918%, due 02/25/642,5 | 104,733 | 104,852 | |||||||||
| Series 2021-R3, Class A1, 1.020%, due 04/25/642,5 | 164,163 | 163,993 | |||||||||
| Vista Point Securitization Trust, Series 2020-1, Class A1, 1.763%, due 03/25/652,5 | 53,984 | 54,490 | |||||||||
| Series 2020-2, Class A1, 1.475%, due 04/25/652,5 | 75,140 | 75,543 | |||||||||
| Wells Fargo Commercial Mortgage Trust, Series 2018-C45, Class AS, 4.405%, due 06/15/515 | 130,000 | 149,203 | |||||||||
| Total mortgage-backed securities (cost $8,922,978) | 9,013,010 | ||||||||||
Non-U.S. government agency obligations: 6.7% | |||||||||||
Australia: 0.1% | |||||||||||
| Australia Government Bond, Series 138, 3.250%, due 04/21/299 | AUD | 310,000 | 267,391 | ||||||||
Austria: 0.0%† | |||||||||||
| Republic of Austria Government Bond 3.150%, due 06/20/442,9 | EUR | 55,000 | 103,464 | ||||||||
Belgium: 0.1% | |||||||||||
| Kingdom of Belgium Government Bond, Series 71, 3.750%, due 06/22/459 | EUR | 83,000 | 163,506 | ||||||||
Canada: 0.5% | |||||||||||
| Canadian Government Bond 1.500%, due 09/01/24 | CAD | 1,040,000 | 860,060 | ||||||||
2.250%, due 06/01/25 | CAD | 221,000 | 188,267 | ||||||||
2.750%, due 12/01/64 | CAD | 54,000 | 54,530 | ||||||||
1,102,857 | |||||||||||
Finland: 0.0%† | |||||||||||
| Finland Government Bond, Series 30Y, 1.375%, due 04/15/472,9 | EUR | 20,000 | 28,944 | ||||||||
France: 0.1% | |||||||||||
| French Republic Government Bond OAT 0.500%, due 05/25/402,9 | EUR | 100,000 | 116,110 | ||||||||
3.250%, due 05/25/459 | EUR | 93,000 | 171,704 | ||||||||
287,814 | |||||||||||
Ireland: 0.1% | |||||||||||
| Ireland Government Bond 1.500%, due 05/15/509 | EUR | 110,000 | 151,401 | ||||||||
2.000%, due 02/18/459 | EUR | 48,000 | 72,892 | ||||||||
224,293 | |||||||||||
36
UBS Global Allocation Fund
Portfolio of investments
June 30, 2021
| Face amount | Value | ||||||||||
Non-U.S. government agency obligations—(concluded) | |||||||||||
Italy: 0.4% | |||||||||||
| Italy Buoni Poliennali Del Tesoro 1.650%, due 03/01/322,9 | EUR | 60,000 | $ | 76,795 | |||||||
3.000%, due 08/01/299 | EUR | 240,000 | 339,256 | ||||||||
3.250%, due 09/01/462,9 | EUR | 150,000 | 233,409 | ||||||||
4.000%, due 02/01/372,9 | EUR | 129,000 | 210,987 | ||||||||
860,447 | |||||||||||
Japan: 0.4% | |||||||||||
| Japan Government Forty Year Bond, Series 12, 0.500%, due 03/20/59 | JPY | 20,000,000 | 165,351 | ||||||||
| Japan Government Thirty Year Bond, Series 51, 0.300%, due 06/20/46 | JPY | 11,100,000 | 93,554 | ||||||||
| Japan Government Twenty Year Bond, Series 156, 0.400%, due 03/20/36 | JPY | 83,550,000 | 767,882 | ||||||||
1,026,787 | |||||||||||
Netherlands: 0.0%† | |||||||||||
| Netherlands Government Bond 2.750%, due 01/15/472,9 | EUR | 40,000 | 76,542 | ||||||||
New Zealand: 1.2% | |||||||||||
| New Zealand Government Inflation Linked Bond, Series 0925, 2.000%, due 09/20/259,10 | NZD | 3,509,220 | 3,053,131 | ||||||||
South Africa: 3.0% | |||||||||||
| Republic of South Africa Government Bond, Series 2030, 8.000%, due 01/31/30 | ZAR | 113,500,000 | 7,538,649 | ||||||||
Spain: 0.5% | |||||||||||
| Spain Government Bond 1.450%, due 10/31/272,9 | EUR | 165,000 | 214,019 | ||||||||
1.500%, due 04/30/272,9 | EUR | 325,000 | 421,876 | ||||||||
3.450%, due 07/30/662,9 | EUR | 10,000 | 18,234 | ||||||||
4.200%, due 01/31/372,9 | EUR | 44,000 | 77,884 | ||||||||
4.800%, due 01/31/242,9 | EUR | 296,000 | 399,010 | ||||||||
5.150%, due 10/31/442,9 | EUR | 69,000 | 147,759 | ||||||||
1,278,782 | |||||||||||
United Kingdom: 0.3% | |||||||||||
| United Kingdom Gilt 1.000%, due 04/22/249 | GBP | 90,000 | 127,459 | ||||||||
1.500%, due 07/22/479 | GBP | 114,000 | 166,886 | ||||||||
1.625%, due 10/22/289 | GBP | 144,000 | 214,634 | ||||||||
3.500%, due 01/22/459 | GBP | 60,000 | 121,607 | ||||||||
630,586 | |||||||||||
| Total non-U.S. government agency obligations (cost $15,463,092) | 16,643,193 | ||||||||||
| Face amount | Value | ||||||||||
U.S. government agency obligations: 3.1% | |||||||||||
United States: 3.1% | |||||||||||
| GNMA TBA 2.000% | $ | 625,000 | $ | 636,425 | |||||||
| 2.500% | 1,125,000 | 1,163,632 | |||||||||
| UMBS TBA 1.500% | 200,000 | 202,338 | |||||||||
| 2.000% | 3,400,000 | 3,443,466 | |||||||||
| 2.500% | 1,900,000 | 1,964,790 | |||||||||
| 3.000% | 300,000 | 312,732 | |||||||||
| Total U.S. government agency obligations (cost $7,715,444) | 7,723,383 | ||||||||||
U.S. Treasury obligations: 3.3% | |||||||||||
United States: 3.3% | |||||||||||
| U.S. Treasury Bonds 2.500%, due 02/15/46 | 302,000 | 327,151 | |||||||||
2.750%, due 11/15/42 | 201,000 | 226,337 | |||||||||
2.750%, due 08/15/47 | 328,000 | 373,100 | |||||||||
2.875%, due 05/15/43 | 717,000 | 824,606 | |||||||||
3.000%, due 11/15/45 | 47,000 | 55,568 | |||||||||
| U.S. Treasury Notes 0.625%, due 08/15/30 | 1,270,000 | 1,183,183 | |||||||||
1.375%, due 09/30/23 | 971,000 | 994,403 | |||||||||
1.500%, due 02/28/23 | 226,000 | 230,864 | |||||||||
1.625%, due 08/15/22 | 116,000 | 117,976 | |||||||||
1.625%, due 11/30/26 | 760,000 | 787,045 | |||||||||
1.625%, due 08/15/29 | 196,000 | 200,464 | |||||||||
1.625%, due 05/15/31 | 350,000 | 355,359 | |||||||||
1.750%, due 05/15/23 | 345,000 | 354,703 | |||||||||
1.875%, due 10/31/22 | 680,000 | 695,619 | |||||||||
2.000%, due 11/30/22 | 528,000 | 541,654 | |||||||||
2.500%, due 05/15/24 | 321,000 | 340,022 | |||||||||
2.750%, due 07/31/23 | 459,000 | 482,703 | |||||||||
| Total U.S. Treasury obligations (cost $7,853,911) | 8,090,757 | ||||||||||
| Number of shares | |||||||||||
Short-term investments: 4.3% | |||||||||||
Investment companies: 4.3% | |||||||||||
| State Street Institutional U.S. Government Money Market Fund, 0.030%11 (cost $10,817,898) | 10,817,898 | 10,817,898 | |||||||||
Investment of cash collateral from securities loaned: 0.7% | |||||||||||
Money market funds: 0.7% | |||||||||||
| State Street Navigator Securities Lending Government Money Market Portfolio, 0.020%11 (cost $1,796,278) | 1,796,278 | 1,796,278 | |||||||||
| Total investments (cost $214,174,709)—99.2% | 247,211,640 | ||||||||||
Other assets in excess of liabilities: 0.8% | 1,943,724 | ||||||||||
Net assets: 100.0% | $ | 249,155,364 | |||||||||
37
UBS Global Allocation Fund
Portfolio of investments
June 30, 2021
For a listing of defined portfolio acronyms that are used throughout the Portfolio of investments as well as the tables that follow, please refer to the Glossary of terms used in the Portfolio of investments.
Futures contracts
| Number of contracts | Currency | Expiration date | Current notional amount | Value | Unrealized appreciation (depreciation) | ||||||||||||||||||||||
Index futures buy contracts: | |||||||||||||||||||||||||||
18 | EUR | DAX Index Futures | September 2021 | $ | 8,277,842 | $ | 8,285,548 | $ | 7,706 | ||||||||||||||||||
63 | EUR | EURO STOXX 50 Index Futures | September 2021 | 3,050,183 | 3,029,550 | (20,633 | ) | ||||||||||||||||||||
1,100 | EUR | EURO STOXX 600 Bank Index Futures | September 2021 | 9,050,301 | 8,699,849 | (350,452 | ) | ||||||||||||||||||||
52 | GBP | FTSE 100 Index Futures | September 2021 | 5,046,429 | 5,021,185 | (25,244 | ) | ||||||||||||||||||||
40 | JPY | TOPIX Index Futures | September 2021 | 7,053,604 | 6,995,814 | (57,790 | ) | ||||||||||||||||||||
24 | USD | Russell 1000 Value Index Futures | September 2021 | 1,895,445 | 1,870,440 | (25,005 | ) | ||||||||||||||||||||
48 | USD | Russell 2000 Mini Index Futures | September 2021 | 5,574,358 | 5,538,720 | (35,638 | ) | ||||||||||||||||||||
Interest rate futures buy contracts: | |||||||||||||||||||||||||||
26 | JPY | JGB MINI 10 Year Futures | September 2021 | 3,540,829 | 3,551,699 | 10,870 | |||||||||||||||||||||
U.S. Treasury futures buy contracts: | |||||||||||||||||||||||||||
175 | USD | U.S. Treasury Note 10 Year Futures | September 2021 | 23,027,818 | 23,187,500 | 159,682 | |||||||||||||||||||||
Total | $ | 66,516,809 | $ | 66,180,305 | $ | (336,504 | ) | ||||||||||||||||||||
Index futures sell contracts: | |||||||||||||||||||||||||||
13 | AUD | ASX SPI 200 Index Futures | September 2021 | (1,772,418 | ) | (1,760,489 | ) | 11,929 | |||||||||||||||||||
25 | CAD | S&P TSX 60 Index Futures | September 2021 | (4,786,851 | ) | (4,851,162 | ) | (64,311 | ) | ||||||||||||||||||
182 | USD | Mini MSCI Emerging Markets (EM) Index Futures | September 2021 | (12,486,022 | ) | (12,419,680 | ) | 66,342 | |||||||||||||||||||
74 | USD | S&P 500 E-Mini Index Futures | September 2021 | (15,573,881 | ) | (15,867,820 | ) | (293,939 | ) | ||||||||||||||||||
Interest rate futures sell contracts: | |||||||||||||||||||||||||||
54 | EUR | German Euro Bund Futures | September 2021 | (10,984,372 | ) | (11,052,306 | ) | (67,934 | ) | ||||||||||||||||||
93 | GBP | United Kingdom Long Gilt Bond Futures | September 2021 | (16,304,622 | ) | (16,479,667 | ) | (175,045 | ) | ||||||||||||||||||
U.S. Treasury futures sell contracts: | |||||||||||||||||||||||||||
69 | USD | U.S. Treasury Note 5 Year Futures | September 2021 | (8,530,564 | ) | (8,516,649 | ) | 13,915 | |||||||||||||||||||
Total | $ | (70,438,730 | ) | $ | (70,947,773 | ) | $ | (509,043 | ) | ||||||||||||||||||
Net unrealized appreciation (depreciation) | $ | (845,547 | ) | ||||||||||||||||||||||||
Centrally cleared credit default swap agreements on credit indices—buy protection13
| Referenced obligations | Notional amount (000) | Maturity date | Payment frequency | Payments made by the Portfolio12 | Upfront payments received (made) | Value | Unrealized appreciation (depreciation) | ||||||||||||||||||||||||
CDX North American Investment Grade 36 Index | USD | 14,600 | 06/20/26 | Quarterly | 1.000 | % | — | $ | (376,078 | ) | $ | (376,078 | ) | ||||||||||||||||||
38
UBS Global Allocation Fund
Portfolio of investments
June 30, 2021
Centrally cleared credit default swap agreements on credit indices—sell protection14
| Referenced obligations | Notional amount (000) | Maturity date | Payment frequency | Payments received by the Portfolio12 | Upfront payments received (made) | Value | Unrealized appreciation (depreciation) | ||||||||||||||||||||||||
CDX Emerging Markets 35 Index | USD | 12,900 | 06/20/26 | Quarterly | 1.000 | % | $ | 434,424 | $ | (331,703 | ) | $ | 102,721 | ||||||||||||||||||
CDX North American High Yield 36 Index | USD | 2,250 | 06/20/26 | Quarterly | 5.000 | % | 622 | 232,625 | 233,247 | ||||||||||||||||||||||
Total | $ | 435,046 | $ | (99,078 | ) | $ | 335,968 | ||||||||||||||||||||||||
Forward foreign currency contracts
Counterparty | Sell | Purchase | Settlement date | Unrealized appreciation (depreciation) | |||||||||||||||
BB | EUR | 5,855,000 | USD | 6,943,447 | 08/19/21 | $ | (5,881 | ) | |||||||||||
BB | GBP | 4,275,000 | USD | 6,061,089 | 08/19/21 | 146,785 | |||||||||||||
BB | ZAR | 116,950,000 | USD | 8,241,441 | 08/19/21 | 100,445 | |||||||||||||
BOA | USD | 6,930,992 | BRL | 36,780,000 | 08/19/21 | 422,745 | |||||||||||||
CIBC | USD | 6,018,449 | JPY | 655,800,000 | 08/19/21 | (113,073 | ) | ||||||||||||
CIBC | USD | 2,470,000 | NOK | 20,526,752 | 08/19/21 | (85,420 | ) | ||||||||||||
CITI | CAD | 2,996,400 | USD | 2,485,000 | 08/19/21 | 67,829 | |||||||||||||
CITI | MXN | 67,598,934 | USD | 3,282,053 | 08/19/21 | (89,183 | ) | ||||||||||||
CITI | USD | 2,472,341 | NZD | 3,435,000 | 08/19/21 | (71,580 | ) | ||||||||||||
GSI | KRW | 5,571,000,000 | USD | 4,920,074 | 08/19/21 | (25,750 | ) | ||||||||||||
GSI | NOK | 63,080,000 | USD | 7,370,461 | 08/19/21 | 42,497 | |||||||||||||
GSI | USD | 5,510,198 | COP | 20,678,395,000 | 08/19/21 | (12,841 | ) | ||||||||||||
GSI | USD | 3,739,763 | MYR | 15,434,000 | 08/19/21 | (29,485 | ) | ||||||||||||
HSBC | INR | 98,530,000 | USD | 1,325,219 | 08/20/21 | 6,554 | |||||||||||||
HSBC | TWD | 283,300,000 | USD | 10,259,289 | 08/19/21 | 90,653 | |||||||||||||
HSBC | USD | 1,615,268 | CNY | 10,465,000 | 08/19/21 | (817 | ) | ||||||||||||
JPMCB | COP | 29,805,800,000 | USD | 7,963,078 | 08/19/21 | 39,198 | |||||||||||||
JPMCB | PHP | 118,650,000 | USD | 2,453,271 | 08/19/21 | 26,229 | |||||||||||||
JPMCB | USD | 14,011,249 | EUR | 11,445,000 | 08/19/21 | (427,123 | ) | ||||||||||||
JPMCB | USD | 10,553,786 | NOK | 86,960,000 | 08/19/21 | (451,697 | ) | ||||||||||||
MSCI | AUD | 3,075,000 | USD | 2,317,232 | 08/19/21 | 10,635 | |||||||||||||
MSCI | CHF | 10,615,000 | USD | 11,826,828 | 08/19/21 | 339,847 | |||||||||||||
MSCI | USD | 2,485,000 | COP | 9,127,405,000 | 08/19/21 | (58,477 | ) | ||||||||||||
MSCI | USD | 1,235,000 | MXN | 24,818,934 | 08/19/21 | 2,749 | |||||||||||||
MSCI | USD | 5,010,489 | PLN | 18,565,000 | 08/19/21 | (140,740 | ) | ||||||||||||
MSCI | USD | 6,758,677 | SEK | 56,040,000 | 08/19/21 | (207,637 | ) | ||||||||||||
SSC | AUD | 1,455,000 | USD | 1,129,834 | 08/19/21 | 38,420 | |||||||||||||
SSC | GBP | 385,000 | USD | 546,118 | 08/19/21 | 13,485 | |||||||||||||
SSC | NZD | 17,575,000 | USD | 12,672,245 | 08/19/21 | 388,872 | |||||||||||||
SSC | SEK | 42,410,000 | USD | 4,957,271 | 08/19/21 | (431 | ) | ||||||||||||
SSC | USD | 4,959,755 | CHF | 4,585,000 | 08/19/21 | 1,885 | |||||||||||||
SSC | USD | 1,259,680 | EUR | 1,035,000 | 08/19/21 | (31,233 | ) | ||||||||||||
SSC | USD | 905,884 | GBP | 640,000 | 08/19/21 | (20,468 | ) | ||||||||||||
SSC | USD | 3,078,328 | JPY | 335,852,969 | 08/19/21 | (54,025 | ) | ||||||||||||
SSC | USD | 2,128,781 | MXN | 42,780,000 | 08/19/21 | 4,706 | |||||||||||||
SSC | USD | 488,336 | SGD | 650,000 | 08/19/21 | (4,959 | ) | ||||||||||||
Net unrealized appreciation (depreciation) | $ | (87,286 | ) | ||||||||||||||||
39
UBS Global Allocation Fund
Portfolio of investments
June 30, 2021
Fair valuation summary
The following is a summary of the fair valuations according to the inputs used as of June 30, 2021 in valuing the Fund's investments. In the event a Fund holds investments (other than a money market fund) for which fair value is measured using the NAV per share practical expedient (or its equivalent), a separate column will be added to the fair value hierarchy table; this is intended to permit reconciliation to the amounts presented in the Portfolio of investments:
Description | Unadjusted quoted prices in active markets for identical investments (Level 1) | Other significant observable inputs (Level 2) | Unobservable inputs (Level 3) | Total | |||||||||||||||
Assets | |||||||||||||||||||
Common stocks | $ | 103,304,740 | $ | 101,310 | $ | — | $ | 103,406,050 | |||||||||||
Exchange traded funds | 60,457,227 | — | — | 60,457,227 | |||||||||||||||
Investment companies | 20,253,259 | — | — | 20,253,259 | |||||||||||||||
Asset-backed securities | — | 9,010,585 | — | 9,010,585 | |||||||||||||||
Mortgage-backed securities | — | 8,813,012 | 199,998 | 9,013,010 | |||||||||||||||
Non-U.S. government agency obligations | — | 16,643,193 | — | 16,643,193 | |||||||||||||||
U.S. government agency obligations | — | 7,723,383 | — | 7,723,383 | |||||||||||||||
U.S. Treasury obligations | — | 8,090,757 | — | 8,090,757 | |||||||||||||||
Short-term investments | — | 10,817,898 | — | 10,817,898 | |||||||||||||||
Investment of cash collateral from securities loaned | — | 1,796,278 | — | 1,796,278 | |||||||||||||||
Futures contracts | 270,444 | — | — | 270,444 | |||||||||||||||
Swap agreements | — | 232,625 | — | 232,625 | |||||||||||||||
Forward foreign currency contracts | — | 1,743,534 | — | 1,743,534 | |||||||||||||||
Total | $ | 184,285,670 | $ | 64,972,575 | $ | 199,998 | $ | 249,458,243 | |||||||||||
Liabilities | |||||||||||||||||||
Futures contracts | $ | (1,115,991 | ) | $ | — | $ | — | $ | (1,115,991 | ) | |||||||||
Swap agreements | — | (707,781 | ) | — | (707,781 | ) | |||||||||||||
Forward foreign currency contracts | — | (1,830,820 | ) | — | (1,830,820 | ) | |||||||||||||
Total | $ | (1,115,991 | ) | $ | (2,538,601 | ) | $ | — | $ | (3,654,592 | ) | ||||||||
At June 30, 2021, there were $114,477 transferred out of Level 3. The transfers from Level 3 to Level 2 occurred because there was observable market data that became available as of June 30, 2021.
Securities valued using unobservable inputs, i.e. Level 3, were not considered significant to the Fund.
Portfolio footnotes
* Non-income producing security.
† Amount represents less than 0.05% or (0.05)%.
1 Security, or portion thereof, was on loan at the period end.
2 Security exempt from registration pursuant to Rule 144A under the Securities Act of 1933. These securities are considered liquid, unless noted otherwise, and may be resold in transactions exempt from registration, normally to qualified institutional buyers. Securities exempt from registration pursuant to Rule 144A, in the amount of $17,040,996, represented 6.8% of the Fund's net assets at period end.
3 The table below details the Fund's investment in a fund advised by the same Advisor as the Fund. The Advisor does not earn a management fee from the affiliated UBS Mutual Funds.
40
UBS Global Allocation Fund
Portfolio of investments
June 30, 2021
Security description | Value 06/30/20 | Purchases during the period ended 06/30/21 | Sales during the period ended 06/30/21 | Net realized gain (loss) during the period ended 06/30/21 | Change in net unrealized appreciation (depreciation) during the period ended 06/30/21 | Value 06/30/21 | Net income earned from affiliate for the period ended 06/30/21 | Shares 06/30/21 | |||||||||||||||||||||||||||
| UBS Emerging Markets Equity Opportunity Fund | $ | 12,599,338 | $ | 6,114,100 | $ | 3,500,000 | $ | 288,877 | $ | 4,750,944 | $ | 20,253,259 | $ | 314,100 | 1,617,672 | ||||||||||||||||||||
4 Security fair valued by the Valuation Committee under the direction of the Board of Trustees.
5 Variable or floating rate security for which the interest rate adjusts periodically based on changes in current interest rates and prepayments on the underlying pool of assets. Rate shown is the rate in effect as of period end.
6 Variable or floating rate security. The interest rate shown is the current rate as of June 30, 2021 and changes periodically.
7 Step bond—coupon rate increases in increments to maturity. The rate disclosed is the rate at the period end; the maturity date disclosed is the ultimate maturity date.
8 Significant unobservable inputs were used in the valuation of this security; i.e. Level 3.
9 Security was purchased pursuant to Regulation S under the Securities Act of 1933, which exempts from registration securities offered and sold outside of the United States. Such a security cannot be sold in the United States without either an effective registration statement filed pursuant to the Securities Act of 1933, or pursuant to an exemption from registration.
10 Debt security whose principal and/or interest payments are adjusted for inflation, unlike debt securities that make fixed principal and interest payments. The interest rate paid by the securities is fixed, while the principal value rises or falls based on changes in an index. Thus, if inflation occurs, the principal and interest payments on the securities are adjusted accordingly to protect investors from inflationary loss. During a deflationary period, the principal and interest payments decrease, although the securities' principal amounts will not drop below their face amounts at maturity. In exchange for the inflation protection, the securities generally pay lower interest rates than typical government securities from the issuer's country. Only if inflation occurs will securities offer a higher real yield than a conventional security of the same maturity.
11 Rates shown reflect yield at June 30, 2021.
12 Payments made or received are based on the notional amount.
13 If the Fund is a buyer of protection and a credit event occurs, as defined under the terms of that particular swap agreement, the Fund will either (i) receive from the seller of protection an amount equal to the notional amount of the swap and deliver the referenced obligation or underlying securities comprising the referenced obligation or (ii) receive a net settlement amount in the form of cash or securities equal to the notional amount of the swap less the recovery value of the referenced obligation or underlying securities comprising the referenced obligation.
14 If the Fund is a seller of protection and a credit event occurs, as defined under the terms of that particular swap agreement, the Fund will either (i) pay to the buyer of protection an amount equal to the notional amount of the swap and take delivery of the referenced obligation or underlying securities comprising the referenced obligation or (ii) pay a net settlement amount in the form of cash or securities equal to the notional amount of the swap less the recovery value of the referenced obligation or underlying securities comprising the referenced obligation.
See accompanying notes to financial statements.
41
UBS Emerging Markets Equity Opportunity Fund
Portfolio performance
For the 12 months ended June 30, 2021, Class P shares of UBS Emerging Markets Equity Opportunity Fund (the "Fund") returned 35.51%, while the Class P2 returned 36.66%. The Fund's benchmark, the MSCI Emerging Markets Index (net) (the "Index"), returned 40.90%. Please note that these returns do not reflect the deduction of taxes that a shareholder would pay on Fund distributions or the redemption of Fund shares, while the Index returns do not reflect the deduction of fees and expenses.
The Fund posted a strong absolute return, but underperformed its benchmark during the reporting period.
Portfolio performance summary1
What worked:
• On a sector level, stock selection within financials and information technology (IT) added the most value.
• On a stock level, Taiwan Semiconductor Manufacturing Company (TSMC) (Taiwan, IT) and SK Hynix (South Korea, IT) were among the top contributors to performance over the reporting period.
• Shares of TSMC continued to rise, as it has arguably extended its industry leadership during 2020 and is now an even more important partner in delivering leading edge semiconductor chips for its customers. Shares of SK Hynix outperformed on the back of market expectations of a recovery in memory prices in 2021.
What didn't work:
• On a sector level, stock selection within consumer discretionary and health care detracted from performance.
• On a stock level, Tal Education and Jiangsu Hengrui were among the main headwinds for results over the reporting period
• Shares of TAL Education declined as regulations around the after school tutoring sector in China continued to concern investors. We find the stock less attractive now and have exited our position. Shares of Jiangsu Hengrui underperformed due to weaker market sentiment about the healthcare sector and a rotation from outperformers to laggards. The company is also facing pricing pressure on some of its legacy generic drugs. However, in our view, its new product launches should more than offset any decline as a result of centralised procurement. We continue to hold Jiangsu Hengrui.
• The Fund did not invest in derivatives during the reporting period.
This letter is intended to assist shareholders in understanding how the Fund performed during the 12 months ended June 30, 2021. The views and opinions in the letter were current as of August 12, 2021. They are not guarantees of future performance or investment results and should not be taken as investment advice. Investment decisions reflect a variety of factors, and we reserve the right to change our views about individual securities, sectors and markets at any time. As a result, the views expressed should not be relied upon as a forecast of the Fund's future investment intent. We encourage you to consult your financial advisor regarding your personal investment program.
Mutual funds are sold by prospectus only. You should read it carefully and consider a fund's investment objectives, risks, charges, expenses and other important information contained in the prospectus before investing. Prospectuses for most of our funds can be obtained from your financial advisor, by calling UBS Funds at 800-647 1568 or by visiting our website at www.ubs.com/am-us.
1 For a detailed commentary on the market environment in general during the reporting period, see page 3.
42
UBS Emerging Markets Equity Opportunity Fund
Average annual total returns for periods ended 06/30/21 (unaudited)
1 year | Inception1 | ||||||||||
Class P22 | 36.66 | % | 16.18 | % | |||||||
Class P4 | 35.51 | 19.30 | |||||||||
MSCI Emerging Markets Index (net)3 | 40.90 | 8.65 | |||||||||
The annualized gross and net expense ratios, respectively, for each class of shares as in the October 28, 2020 prospectuses were as follows: Class P—1.17% and 0.22%. Net expenses reflect fee waivers and/or expense reimbursements, if any, pursuant to an agreement that is in effect to cap the expenses. The Trust, with respect to the Fund, and UBS Asset Management (Americas) Inc., the Fund's investment advisor and administrator ("UBS AM (Americas)" or the "Advisor"), have entered into a written agreement pursuant to which the Advisor has agreed to waive a portion of its management fees and/or to reimburse expenses (excluding expenses incurred through investment in other investment companies, interest, taxes, brokerage commissions and extraordinary expenses) to the extent necessary so that the Fund's ordinary operating expenses (excluding expenses incurred through investment in other investment companies, interest, taxes, brokerage commissions and extraordinary expenses), through the period ending October 28, 2021, do not exceed 1.00% for Class P shares and 0.40% for Class P2 shares. Pursuant to the written agreement, the Advisor is entitled to be reimbursed for any fees it waives and expenses it reimburses to the extent such reimbursement can be made during the three fiscal years following the date on which such fee waivers and expense reimbursements were made, provided that the reimbursement of the Advisor by the Fund will not cause the Fund to exceed the lesser of any applicable expense limit that is in place for the Fund (i) at the time of the waiver or reimbursement or (ii) at the time of the recoupment. The fee waiver/expense reimbursement agreement may be terminated by the Fund's Board of Trustees at any time and also will terminate automatically upon the expiration or termination of the Fund's advisory contract with the Advisor. Upon termination of the fee waiver/expense reimbursement agreement, however, UBS AM (Americas)'s three year recoupment rights will survive.
1 Inception date of Class P2 of UBS Emerging Markets Equity Opportunity Fund is June 4, 2018. Benchmark's inception return is based on Class P2 inception date.
2 Class P2 shares do not bear initial or contingent deferred sales charges or ongoing 12b-1 service and distribution fees, but Class P2 shares held through advisory programs may be subject to a program fee, which, if included, would have reduced performance.
3 The MSCI Emerging Markets Index (net) is a market capitalization-weighted index composed of different emerging market countries in Europe, Latin America, and the Pacific Basin. Net total return indices reinvest dividends after the deduction of withholding taxes, using a tax rate applicable to nonresident institutional investors who do not benefit from double taxation treaties. The index is constructed and managed with a view to being fully investable from the perspective of international institutional investors. Investors should note that indices do not reflect the deduction of fees and expenses.
4 Inception date of Class P of UBS Emerging Markets Equity Opportunity Fund is January 31, 2019.
Past performance does not predict future performance, and the performance information provided does not reflect the deduction of taxes that a shareholder would pay on Fund distributions or the redemption of Fund shares. The return and principal value of an investment will fluctuate, so that an investor's shares, when redeemed, may be worth more or less than their original cost. Performance results assume reinvestment of all dividends and capital gain distributions at net asset value on the ex-dividend dates. Current performance may be higher or lower than the performance data quoted. For month-end performance figures, please visit www.ubs.com/us-mutualfundperformance.
43
UBS Emerging Markets Equity Opportunity Fund
Illustration of an assumed investment of $2,000,000 in Class P shares and $10,000 in Class P2 shares (unaudited)
The following graphs depict the performance of UBS Emerging Markets Equity Opportunity Fund Class P and Class P2 shares versus the MSCI Emerging Markets Index (net) from January 31, 2019, the inception date of class P and June 4, 2018, the inception date of class P2, through June 30, 2019. The performance provided does not reflect the deduction of taxes that a shareholder would pay on Fund distributions or the redemption of Fund shares. Past performance is no guarantee of future results. Share price and returns will vary with market conditions; investors may realize a gain or loss upon redemption.
UBS Emerging Markets Equity Opportunity Fund P vs. MSCI Emerging Markets Index (net)
Wealth value with dividends reinvested. Initial investment for Class P shares as of January 31, 2019 = $2,000,000

UBS Emerging Markets Equity Opportunity Fund P2 vs. MSCI Emerging Markets Index (net)
Wealth value with dividends reinvested. Initial investment for Class P2 shares as of June 4, 2018 = $10,000

Past performance does not predict future performance, and the performance information provided does not reflect the deduction of taxes that a shareholder would pay on Fund distributions or the redemption of Fund shares. The return and principal value of an investment will fluctuate, so that an investor's shares, when redeemed, may be worth more or less than their original cost. Performance results assume reinvestment of all dividends and capital gain distributions at net asset value on the ex-dividend dates. Current performance may be higher or lower than the performance data quoted. For month-end performance figures, please visit www.ubs.com/us-mutualfundperformance.
44
UBS Emerging Markets Equity Opportunity Fund
Portfolio statistics and industry diversification—(unaudited)1
As a percentage of net assets as of June 30, 2021
Top ten holdings
Taiwan Semiconductor Manufacturing Co. Ltd. | 8.8 | % | |||||
Tencent Holdings Ltd. | 6.9 | ||||||
Samsung Electronics Co. Ltd. | 5.7 | ||||||
Infosys Ltd., ADR | 4.2 | ||||||
Meituan, Class B | 3.7 | ||||||
China Merchants Bank Co. Ltd., Class H | 3.7 | ||||||
MercadoLibre, Inc. | 3.5 | ||||||
Axis Bank Ltd. | 3.4 | ||||||
Hindustan Unilever Ltd. | 3.2 | ||||||
HDFC Bank Ltd. | 3.2 | ||||||
Total | 46.3 | % | |||||
Top five issuer breakdown by country or territory of origin
China | 29.2 | % | |||||
India | 16.3 | ||||||
Taiwan | 13.7 | ||||||
South Korea | 11.5 | ||||||
Brazil | 5.7 | ||||||
Total | 76.4 | % | |||||
Common stocks | |||||||
Automobiles | 2.4 | % | |||||
Banks | 20.9 | ||||||
Beverages | 3.1 | ||||||
Chemicals | 2.7 | ||||||
Entertainment | 2.3 | ||||||
Household durables | 2.0 | ||||||
Household products | 3.2 | ||||||
Insurance | 3.0 | ||||||
Interactive media & services | 9.5 | ||||||
Internet & direct marketing retail | 12.8 | ||||||
IT services | 4.2 | ||||||
Metals & mining | 4.7 | ||||||
Oil, gas & consumable fuels | 3.0 | ||||||
Pharmaceuticals | 2.0 | ||||||
Semiconductors & semiconductor equipment | 16.8 | ||||||
Technology hardware, storage & peripherals | 5.7 | ||||||
Total common stocks | 98.3 | ||||||
Short-term investments | 2.3 | ||||||
Investment of cash collateral from securities loaned | 0.1 | ||||||
Total investments | 100.7 | ||||||
Liabilities in excess of other assets | (0.7 | ) | |||||
Net assets | 100.0 | % | |||||
1 The portfolio is actively managed and its composition will vary over time.
45
UBS Emerging Markets Equity Opportunity Fund
Portfolio of investments
June 30, 2021
| Number of shares | Value | ||||||||||
Common stocks: 98.3% | |||||||||||
Argentina: 3.5% | |||||||||||
MercadoLibre, Inc.* | 23,335 | $ | 36,351,030 | ||||||||
Brazil: 5.7% | |||||||||||
Petroleo Brasileiro SA, ADR1 | 1,302,750 | 15,385,477 | |||||||||
Petroleo Brasileiro SA, ADR | 1,294,938 | 15,837,092 | |||||||||
Vale SA | 1,222,339 | 27,831,817 | |||||||||
59,054,386 | |||||||||||
China: 29.2% | |||||||||||
Alibaba Group Holding Ltd.* | 967,744 | 27,420,847 | |||||||||
Bilibili, Inc., Class Z* | 191,000 | 23,517,381 | |||||||||
China Merchants Bank Co. Ltd., Class H | 4,448,000 | 37,953,196 | |||||||||
Gree Electric Appliances, Inc. of Zhuhai, Class A | 2,577,289 | 20,781,211 | |||||||||
Jiangsu Hengrui Medicine Co. Ltd., Class A | 1,970,818 | 20,731,647 | |||||||||
Kweichow Moutai Co. Ltd., Class A | 100,567 | 32,010,795 | |||||||||
Meituan, Class B*,2 | 920,700 | 37,993,416 | |||||||||
| Ping An Insurance Group Co. of China Ltd., Class H | 3,127,500 | 30,633,331 | |||||||||
Tencent Holdings Ltd. | 952,900 | 71,673,377 | |||||||||
302,715,201 | |||||||||||
Hungary: 2.4% | |||||||||||
OTP Bank Nyrt* | 463,816 | 24,969,461 | |||||||||
India: 16.3% | |||||||||||
Axis Bank Ltd.* | 3,504,253 | 35,278,253 | |||||||||
Eicher Motors Ltd.* | 683,049 | 24,546,298 | |||||||||
HDFC Bank Ltd. | 1,621,448 | 32,675,460 | |||||||||
Hindustan Unilever Ltd. | 1,012,053 | 33,648,414 | |||||||||
Infosys Ltd., ADR | 2,035,500 | 43,132,245 | |||||||||
169,280,670 | |||||||||||
Indonesia: 2.9% | |||||||||||
Bank Mandiri Persero Tbk. PT | 73,215,200 | 29,791,012 | |||||||||
Mexico: 2.4% | |||||||||||
Grupo Financiero Banorte SAB de CV, Class O | 3,793,200 | 24,501,477 | |||||||||
Russia: 5.6% | |||||||||||
Sberbank of Russia PJSC | 7,470,105 | 31,258,303 | |||||||||
Yandex N.V., Class A*,1 | 382,400 | 27,054,800 | |||||||||
58,313,103 | |||||||||||
| Number of shares | Value | ||||||||||
Common stocks—(concluded) | |||||||||||
South Africa: 5.1% | |||||||||||
Anglo American Platinum Ltd. | 91,161 | $ | 10,529,542 | ||||||||
Impala Platinum Holdings Ltd. | 653,385 | 10,774,904 | |||||||||
Naspers Ltd., Class N | 148,455 | 31,169,209 | |||||||||
52,473,655 | |||||||||||
South Korea: 11.5% | |||||||||||
LG Chem Ltd. | 36,633 | 27,650,002 | |||||||||
Samsung Electronics Co. Ltd. | 831,796 | 59,606,569 | |||||||||
SK Hynix, Inc. | 284,538 | 32,214,709 | |||||||||
119,471,280 | |||||||||||
Taiwan: 13.7% | |||||||||||
MediaTek, Inc. | 936,000 | 32,316,985 | |||||||||
Nanya Technology Corp. | 6,428,000 | 18,387,137 | |||||||||
Taiwan Semiconductor Manufacturing Co. Ltd. | 4,261,000 | 90,993,091 | |||||||||
141,697,213 | |||||||||||
| Total common stocks (cost $862,103,378) | 1,018,618,488 | ||||||||||
Short-term investments: 2.3% | |||||||||||
Investment companies: 2.3% | |||||||||||
| State Street Institutional U.S. Government Money Market Fund, 0.030%3 (cost $23,293,004) | 23,293,004 | 23,293,004 | |||||||||
Investment of cash collateral from securities loaned: 0.1% | |||||||||||
Money market funds: 0.1% | |||||||||||
| State Street Navigator Securities Lending Government Money Market Portfolio, 0.020%3 (cost $1,296,912) | 1,296,912 | 1,296,912 | |||||||||
| Total investments (cost $886,693,294)—100.7% | 1,043,208,404 | ||||||||||
Liabilities in excess of other assets: (0.7)% | (7,188,339 | ) | |||||||||
Net assets: 100.0% | $ | 1,036,020,065 | |||||||||
For a listing of defined portfolio acronyms that are used throughout the Portfolio of investments as well as the tables that follow, please refer to the Glossary of terms used in the Portfolio of investments.
46
UBS Emerging Markets Equity Opportunity Fund
Portfolio of investments
June 30, 2021
Fair valuation summary
The following is a summary of the fair valuations according to the inputs used as of June 30, 2021 in valuing the Fund's investments. In the event a Fund holds investments (other than a money market fund) for which fair value is measured using the NAV per share practical expedient (or its equivalent), a separate column will be added to the fair value hierarchy table; this is intended to permit reconciliation to the amounts presented in the Portfolio of investments.
Description | Unadjusted quoted prices in active markets for identical investments (Level 1) | Other significant observable inputs (Level 2) | Unobservable inputs (Level 3) | Total | |||||||||||||||
Assets | |||||||||||||||||||
Common stocks | $ | 987,360,185 | $ | 31,258,303 | $ | — | $ | 1,018,618,488 | |||||||||||
Short-term investments | — | 23,293,004 | — | 23,293,004 | |||||||||||||||
Investment of cash collateral from securities loaned | — | 1,296,912 | — | 1,296,912 | |||||||||||||||
Total | $ | 987,360,185 | $ | 55,848,219 | $ | — | $ | 1,043,208,404 | |||||||||||
At June 30, 2021, there were no transfers in or out of Level 3.
Portfolio footnotes
* Non-income producing security.
1 Security, or portion thereof, was on loan at the period end.
2 Security exempt from registration pursuant to Rule 144A under the Securities Act of 1933. These securities are considered liquid, unless noted otherwise, and may be resold in transactions exempt from registration, normally to qualified institutional buyers. Securities exempt from registration pursuant to Rule 144A, in the amount of $37,993,416, represented 3.7% of the Fund's net assets at period end.
3 Rates shown reflect yield at June 30, 2021.
See accompanying notes to financial statements.
47
UBS Engage For Impact Fund
Portfolio performance
For the 12 months ended June 30, 2021, Class P shares of UBS Engage For Impact Fund (the "Fund") returned 41.70%, while the Class P2 shares returned 4.77% from their inception date of February 23, 2021. The Fund's benchmark, the MSCI All Country World Index (net) (the "Index"), returned 39.26% over the same time period. (Please note that the Fund's returns do not reflect the deduction of taxes that a shareholder would pay on Fund distributions or the redemption of Fund shares, while the Index returns do not reflect the deduction of fees and expenses.)
The Fund outperformed its benchmark as the global economy began to recover from the COVID-19 pandemic. The Fund's returns were driven primarily by strong stock selection, while allocation to sectors was slightly negative for relative performance.
Portfolio performance summary1
What worked:
• Stock selection within the industrials and information technology sectors contributed positively to Fund performance during the reporting period. Stock selection in consumer staples and consumer discretionary was also positive.
• Several individual stock positions were positive for relative performance during the 12-month period. The largest contributors were:
– Montrose Environmental Group was the top performer for the Fund during the fiscal year, relative to the benchmark. It is a small-cap environmental services company that has benefitted from stricter environmental regulation and its customers' commitment to reduce their impact on climate. In addition, the company made several recent acquisitions such as MSE Group last year, which boosted growth. The share price is up over 200% since it went public in July 2020.
– AGCO is a US manufacturer of agricultural equipment. The company posted strong performance for much of the reporting period due to the agricultural supercycle, a longer-term period of higher crop prices. Due to these robust end markets, investors anticipated increased demand for new farm machinery, and AGCO's shares traded higher as a result.
– Aptiv benefited from the trend toward electric vehicles (EV) and autonomous driving safety. Most of the EV sector saw positive returns for the year. (For details, see "Portfolio highlights.")
• The Fund did not invest in derivatives during the reporting period.
What didn't work:
• The Fund's overweight to the health care sector, as well as stock selection in materials and financials, detracted from relative performance during the 12-month period. The three largest detractors for the reporting period were:
– Incyte's share price declined as the biotech industry more broadly underperformed. We have since sold out of this position in the Fund.
– Takeda Pharmaceuticals underperformed during the period, along with much of the health care sector. The company announced a high level of research and development spending, which caused the stock to trade lower as investors anticipated a near-term impact on profitability. We continue to hold this stock.
1 For a detailed commentary on the market environment in general during the reporting period, see page 3.
48
UBS Engage For Impact Fund
– VMWare's share price was negatively impacted by the recent market rotation into more economically sensitive names. There is also some ongoing uncertainty around the company as investors wait to see whether there may be a Dell spin-off. We continue to hold this stock.
Portfolio highlights
The Fund is a high conviction, impactful portfolio of companies that we believe have an important role to play in achieving the United Nation's Sustainable Development Goals (SDGs)—not just through the products and services they sell but also through improvements in their operations and supply chains.
As we look toward the recovery, the response to the pandemic cannot be de-linked from actions on the SDGs. Indeed, achieving the SDGs should form a solid foundation and a firm path to dealing with global health risks and emerging infectious diseases in the future. For example, achieving SDG 3 (Good Health and Wellbeing) will mean strengthening the capacity of countries for early warning, risk reduction, and management of national and global health risks. Impactful investing is more important than ever, and we can increasingly align our investment decisions with our values. Ultimately, we want our money to drive improvement in the world around us.
The Fund's overweights as of June 30, 2021 included:
Alcon
Impact Theme: Health (SDG #3)
Alcon is a leader in the ophthalmic surgical and vision care markets. According to the company and based on a WHO study, 80% of all visual impairments are currently preventable, treatable or curable, and Alcon aims to serve these unmet needs. Based on market research, it is estimated that there are currently 20 million people globally who are blind from treatable cataracts, 1.7 billion who suffer from presbyopia, 153 million with uncorrected refractive errors, 93 million with diabetic retinopathy, among other unaddressed ocular health conditions. Alcon is among the few direct plays on the structurally attractive eye care market, where demand for vision correction is expected to remain strong given secular drivers such as increased screen usage, longer life expectancy and a growing middle class. Despite near-term coronavirus headwinds (surgical procedure delays, lower level of contact lens fittings), we believe Alcon's strong pipeline of intraocular lenses (IOLs), contact lenses and surgical consumables leaves the company well-positioned for the recovery. Looking forward, Alcon's recovery from underinvestment in recent years under Novartis's ownership should allow the company to return to industry average growth rates and close the significant margin gap against peers. Also, improving free cash flow will allow management to again pursue tuck-in acquisitions. Earnings growth is re-accelerating already, and we expect that key launches in Surgical (PanOptix, Vivity, Clareon) and Vision Care (Precision 1, Pataday, Systane) will drive market share gains and a better product mix.
Aptiv
Impact Theme: Climate (SDG #11)
Aptiv manufactures electrical and electronic vehicle components that enable safer, greener and smarter mobility. The company's segments include Power & Signal Solutions (SPS), and Advanced Safety & User Experience (ASUE). We believe Aptiv will benefit from a high level of original equipment manufacturer (OEM) spend on active safety, infotainment and electrification. Around the world, policy makers and automakers are boosting their actions related to the production of electric vehicles (EVs). The International Energy Agency (IEA) estimates that EVs are two to four times more efficient than conventional combustion engine cars. They reduce our reliance on oil-based fuels and, if running on low-carbon power, deliver significant reductions in carbon emissions. We believe that Aptiv is well-positioned to capitalize on the key trends of EVs and autonomous vehicles (AVs) given its strong market position in
49
UBS Engage For Impact Fund
connectors, high voltage harnesses and autonomy. Over the long term, given the company's product offerings in hyper-growth areas such as Connected Services, Smart Vehicle Architecture and AMoD (autonomous mobility on demand), we believe there is clear opportunity for continued growth throughout the next decade. Aptiv has a strong sustainability strategy with driver safety, reduction in CO2 emissions and greater fuel economy at the heart of its technologies' purpose.
Ingersoll Rand
Impact Theme: Climate (SDG #2; #3; #12)
Ingersoll Rand is a market leader in specialized compression, vacuum and dosing technologies. Its products are used to save energy, reduce chemical use and to dose at very precise levels in industrial, water, pharmaceutical and medical applications. Over the past two years, senior management was focused on developing a new product competence, improving working capital and implementing a lean business model. The merger with Gardner Denver created an industrial company that is a leader in climate control solutions. Despite depressed end markets due to the COVID-19 pandemic, the company has improved its working capital to sales ratio by 30% and has increased margins in all units outside upstream energy. The company has transformed its portfolio from 35% exposure to oil and gas to less than 2% today. Ingersoll Rand has also pioneered an innovative incentive compensation structure that we believe materially reduces inequality while improving business fundamentals. We continue to engage with the company to improve the sustainability profile of its businesses and to set more ambitious sustainability goals.
This letter is intended to assist shareholders in understanding how the Fund performed during the 12 months ended June 30, 2021. The views and opinions in the letter were current as of August 12, 2021. They are not guarantees of future performance or investment results and should not be taken as investment advice. Investment decisions reflect a variety of factors, and we reserve the right to change our views about individual securities, sectors and markets at any time. As a result, the views expressed should not be relied upon as a forecast of the Fund's future investment intent. We encourage you to consult your financial advisor regarding your personal investment program.
Mutual funds are sold by prospectus only. You should read it carefully and consider a fund's investment objectives, risks, charges, expenses and other important information contained in the prospectus before investing. Prospectuses for most of our funds can be obtained from your financial advisor, by calling UBS Funds at 800-647 1568 or by visiting our website at www.ubs.com/am-us.
50
UBS Engage For Impact Fund
Average annual total returns for periods ended 06/30/21 (unaudited)
1 year | Inception1 | ||||||||||
Class P2 | 41.70 | % | 15,64 | % | |||||||
Class P24 | N/A | 4.77 | |||||||||
MSCI All Country World Index (net)3 | 39.26 | 18.67 | |||||||||
The annualized gross and net expense ratios, respectively, for each class of shares as in the October 28, 2020 prospectuses were as follows: Class P—2.27% and 0.85%. Net expenses reflect fee waivers and/or expense reimbursements, if any, pursuant to an agreement that is in effect to cap the expenses. The Trust, with respect to the Fund, and UBS Asset Management (Americas) Inc., the Fund's investment advisor and administrator ("UBS AM (Americas)" or the "Advisor"), have entered into a written agreement pursuant to which the Advisor has agreed to waive a portion of its management fees and/or to reimburse expenses (excluding expenses incurred through investment in other investment companies, interest, taxes, brokerage commissions and extraordinary expenses) to the extent necessary so that the Fund's ordinary operating expenses (excluding expenses incurred through investment in other investment companies, interest, taxes, brokerage commissions and extraordinary expenses), through the period ending October 28, 2021, do not exceed 0.85% for Class P shares. Pursuant to the written agreement, the Advisor is entitled to be reimbursed for any fees it waives and expenses it reimburses to the extent such reimbursement can be made during the three fiscal years following the date on which such fee waivers and expense reimbursements were made, provided that the reimbursement of the Advisor by the Fund will not cause the Fund to exceed the lesser of any applicable expense limit that is in place for the Fund (i) at the time of the waiver or reimbursement or (ii) at the time of the recoupment. The fee waiver/expense reimbursement agreement may be terminated by the Fund's Board of Trustees at any time and also will terminate automatically upon the expiration or termination of the Fund's advisory contract with the Advisor. Upon termination of the fee waiver/expense reimbursement agreement, however, UBS AM (Americas)'s three year recoupment rights will survive.
1 Inception date of Class P of UBS Engage For Impact Fund is October 24, 2018. Benchmark's inception return is based on Class P inception date.
2 Class P shares do not bear initial or contingent deferred sales charges or ongoing 12b-1 service and distribution fees, but Class P shares held through advisory programs may be subject to a program fee, which, if included, would have reduced performance.
3 The MSCI All Country World Index (net) is a free float-adjusted market capitalization weighted index that is designed to measure the equity market performance of developed and emerging markets. Net total return indices reinvest dividends after the deduction of withholding taxes, using a tax rate applicable to non-resident institutional investors who do not benefit from double taxation treaties. The index is constructed and managed with a view to being fully investable from the perspective of international institutional investors. Investors should note that indices do not reflect the deduction of fees and expenses.
4 Inception date of Class P2 of UBS Engage For Impact Fund is February 23, 2021.
Past performance does not predict future performance, and the performance information provided does not reflect the deduction of taxes that a shareholder would pay on Fund distributions or the redemption of Fund shares. The return and principal value of an investment will fluctuate, so that an investor's shares, when redeemed, may be worth more or less than their original cost. Performance results assume reinvestment of all dividends and capital gain distributions at net asset value on the ex-dividend dates. Current performance may be higher or lower than the performance data quoted. For month-end performance figures, please visit www.ubs.com/us-mutualfundperformance.
51
UBS Engage For Impact Fund
Illustration of an assumed investment of $2,000,000 in Class P shares and $10,000 in Class P2 shares (unaudited)
The following graphs depict the performance of UBS Emerging Markets Equity Opportunity Fund Class P and Class P2 shares versus the MSCI Emerging Markets Index (net) from January 31, 2019, the inception date of class P and June 4, 2018, the inception date of class P2, through June 30, 2019. The performance provided does not reflect the deduction of taxes that a shareholder would pay on Fund distributions or the redemption of Fund shares. Past performance is no guarantee of future results. Share price and returns will vary with market conditions; investors may realize a gain or loss upon redemption.
UBS Engage For Impact Fund P vs. MSCI All Country World Index (net)
Wealth value with dividends reinvested. Initial investment for Class P shares as of October 24, 2018 = $2,000,000

UBS Engage For Impact Fund P vs. MSCI All Country World Index (net)
Wealth value with dividends reinvested. Initial investment for Class P2 shares as of February 23, 2021 = $25,000,000

Past performance does not predict future performance, and the performance information provided does not reflect the deduction of taxes that a shareholder would pay on Fund distributions or the redemption of Fund shares. The return and principal value of an investment will fluctuate, so that an investor's shares, when redeemed, may be worth more or less than their original cost. Performance results assume reinvestment of all dividends and capital gain distributions at net asset value on the ex-dividend dates. Current performance may be higher or lower than the performance data quoted. For month-end performance figures, please visit www.ubs.com/us-mutualfundperformance.
52
UBS Engage For Impact Fund
Portfolio statistics and industry diversification—(unaudited)1
As a percentage of net assets as of June 30, 2021
Top ten holdings
Aptiv PLC | 3.1 | % | |||||
Roper Technologies, Inc. | 3.1 | ||||||
Alcon, Inc. | 3.1 | ||||||
Danone SA | 3.1 | ||||||
Takeda Pharmaceutical Co. Ltd. | 3.1 | ||||||
Ingersoll Rand, Inc. | 3.1 | ||||||
Spectris PLC | 3.0 | ||||||
VMware, Inc., Class A | 3.0 | ||||||
Ecolab, Inc. | 2.9 | ||||||
Knorr-Bremse AG | 2.9 | ||||||
Total | 30.4 | % | |||||
Top five issuer breakdown by country or territory of origin
United States | 58.8 | % | |||||
Germany | 7.3 | ||||||
United Kingdom | 5.8 | ||||||
Switzerland | 3.1 | ||||||
France | 3.1 | ||||||
Total | 78.1 | % | |||||
Common stocks | |||||||
Auto components | 5.2 | % | |||||
Banks | 5.0 | ||||||
Beverages | 2.5 | ||||||
Biotechnology | 5.4 | ||||||
Building products | 2.4 | ||||||
Chemicals | 7.7 | ||||||
Commercial services & supplies | 2.2 | ||||||
Distributors | 2.1 | ||||||
Diversified consumer services | 1.8 | ||||||
Electric utilities | 1.4 | ||||||
Electrical equipment | 6.4 | ||||||
Electronic equipment, instruments & components | 4.5 | ||||||
Equity real estate investment trusts | 1.7 | ||||||
Food products | 9.1 | ||||||
Health care equipment & supplies | 7.2 | ||||||
Health care technology | 1.3 | ||||||
Industrial conglomerates | 3.1 | ||||||
Life sciences tools & services | 3.2 | ||||||
Machinery | 10.5 | ||||||
Oil, gas & consumable fuels | 1.2 | ||||||
Pharmaceuticals | 3.1 | ||||||
Semiconductors & semiconductor equipment | 5.1 | ||||||
Software | 4.0 | ||||||
Total common stocks | 96.1 | ||||||
Short-term investments | 3.9 | ||||||
Investment of cash collateral from securities loaned | 0.2 | ||||||
Total investments | 100.2 | ||||||
Liabilities in excess of other assets | (0.2 | ) | |||||
Net assets | 100.0 | % | |||||
1 The portfolio is actively managed and its composition will vary over time.
53
UBS Engage For Impact Fund
Portfolio of investments
June 30, 2021
| Number of shares | Value | ||||||||||
Common stocks: 96.1% | |||||||||||
Austria: 2.6% | |||||||||||
Erste Group Bank AG | 36,576 | $ | 1,341,868 | ||||||||
Canada: 0.4% | |||||||||||
Zymeworks, Inc.* | 5,408 | 187,604 | |||||||||
China: 2.5% | |||||||||||
China Mengniu Dairy Co. Ltd.* | 206,000 | 1,245,663 | |||||||||
Denmark: 2.2% | |||||||||||
Genmab A/S* | 2,703 | 1,105,983 | |||||||||
France: 3.1% | |||||||||||
Danone SA | 22,151 | 1,559,386 | |||||||||
Germany: 7.3% | |||||||||||
Continental AG | 7,212 | 1,060,231 | |||||||||
Infineon Technologies AG | 29,040 | 1,164,564 | |||||||||
Knorr-Bremse AG | 12,686 | 1,459,115 | |||||||||
3,683,910 | |||||||||||
Indonesia: 2.3% | |||||||||||
Bank Mandiri Persero Tbk. PT | 2,913,300 | 1,185,412 | |||||||||
Ireland: 2.4% | |||||||||||
Kingspan Group PLC | 12,878 | 1,216,110 | |||||||||
Japan: 3.1% | |||||||||||
Takeda Pharmaceutical Co. Ltd. | 46,553 | 1,558,401 | |||||||||
New Zealand: 2.2% | |||||||||||
Fisher & Paykel Healthcare Corp. Ltd. | 50,997 | 1,109,332 | |||||||||
Norway: 1.6% | |||||||||||
Mowi ASA | 31,920 | 811,888 | |||||||||
Portugal: 1.2% | |||||||||||
Galp Energia SGPS SA | 54,254 | 588,764 | |||||||||
Spain: 1.4% | |||||||||||
Iberdrola SA | 59,528 | 725,617 | |||||||||
Switzerland: 3.1% | |||||||||||
Alcon, Inc. | 22,474 | 1,573,484 | |||||||||
United Kingdom: 5.8% | |||||||||||
Linde PLC | 4,894 | 1,414,855 | |||||||||
Spectris PLC | 33,936 | 1,520,036 | |||||||||
2,934,891 | |||||||||||
United States: 54.9% | |||||||||||
AGCO Corp. | 8,242 | 1,074,592 | |||||||||
American Well Corp., Class A*,1 | 52,668 | 662,563 | |||||||||
Aptiv PLC* | 10,046 | 1,580,537 | |||||||||
| Number of shares | Value | ||||||||||
Common stocks—(concluded) | |||||||||||
United States—(concluded) | |||||||||||
Avantor, Inc.* | 28,445 | $ | 1,010,082 | ||||||||
Bloom Energy Corp., Class A*,1 | 35,027 | 941,175 | |||||||||
Bunge Ltd. | 12,749 | 996,334 | |||||||||
CF Industries Holdings, Inc. | 19,381 | 997,152 | |||||||||
Coursera, Inc.* | 22,922 | 906,794 | |||||||||
Digital Realty Trust, Inc. | 5,856 | 881,094 | |||||||||
Ecolab, Inc. | 7,148 | 1,472,274 | |||||||||
Evoqua Water Technologies Corp.* | 35,543 | 1,200,643 | |||||||||
Ingersoll Rand, Inc.* | 31,875 | 1,555,819 | |||||||||
IPG Photonics Corp.* | 3,540 | 746,126 | |||||||||
LivaNova PLC* | 11,335 | 953,387 | |||||||||
LKQ Corp.* | 21,055 | 1,036,327 | |||||||||
Maravai LifeSciences Holdings, Inc., Class A* | 14,736 | 614,933 | |||||||||
Micron Technology, Inc.* | 16,485 | 1,400,895 | |||||||||
Mirati Therapeutics, Inc.* | 1,330 | 214,835 | |||||||||
Montrose Environmental Group, Inc.* | 20,991 | 1,126,377 | |||||||||
Prelude Therapeutics, Inc.* | 7,787 | 222,942 | |||||||||
Primo Water Corp. | 76,045 | 1,272,233 | |||||||||
Regal Beloit Corp. | 9,272 | 1,237,905 | |||||||||
Roper Technologies, Inc. | 3,348 | 1,574,230 | |||||||||
Seagen, Inc.* | 6,374 | 1,006,327 | |||||||||
Shoals Technologies Group, Inc., Class A* | 28,910 | 1,026,305 | |||||||||
VMware, Inc., Class A* | 9,466 | 1,514,276 | |||||||||
Zendesk, Inc.* | 3,475 | 501,582 | |||||||||
27,727,739 | |||||||||||
| Total common stocks (cost $41,019,535) | 48,556,052 | ||||||||||
Short-term investments: 3.9% | |||||||||||
Investment companies: 3.9% | |||||||||||
| State Street Institutional U.S. Government Money Market Fund, 0.030%2 (cost $1,990,220) | 1,990,220 | 1,990,220 | |||||||||
Investment of cash collateral from securities loaned: 0.2% | |||||||||||
Money market funds: 0.2% | |||||||||||
| State Street Navigator Securities Lending Government Money Market Portfolio, 0.020%2 (cost $74,176) | 74,176 | 74,176 | |||||||||
| Total investments (cost $43,083,931)—100.2% | 50,620,448 | ||||||||||
Liabilities in excess of other assets: (0.2)% | (112,332 | ) | |||||||||
Net assets: 100.0% | $ | 50,508,116 | |||||||||
For a listing of defined portfolio acronyms that are used throughout the Portfolio of investments as well as the tables that follow, please refer to the Glossary of terms used in the Portfolio of investments.
54
UBS Engage For Impact Fund
Portfolio of investments
June 30, 2021
Fair valuation summary
The following is a summary of the fair valuations according to the inputs used as of June 30, 2021 in valuing the Fund's investments. In the event a Fund holds investments (other than a money market fund) for which fair value is measured using the NAV per share practical expedient (or its equivalent), a separate column will be added to the fair value hierarchy table; this is intended to permit reconciliation to the amounts presented in the Portfolio of investments:
Description | Unadjusted quoted prices in active markets for identical investments (Level 1) | Other significant observable inputs (Level 2) | Unobservable inputs (Level 3) | Total | |||||||||||||||
Assets | |||||||||||||||||||
Common stocks | $ | 48,556,052 | $ | — | $ | — | $ | 48,556,052 | |||||||||||
Short-term investments | — | 1,990,220 | — | 1,990,220 | |||||||||||||||
Investment of cash collateral from securities loaned | — | 74,176 | — | 74,176 | |||||||||||||||
Total | $ | 48,556,052 | $ | 2,064,396 | $ | — | $ | 50,620,448 | |||||||||||
At June 30, 2021, there were no transfers in or out of Level 3.
Portfolio footnotes
* Non-income producing security.
1 Security, or portion thereof, was on loan at the period end.
2 Rates shown reflect yield at June 30, 2021.
See accompanying notes to financial statements.
55
UBS International Sustainable Equity Fund
Portfolio performance
For the 12 months ended June 30, 2021, Class A shares of UBS International Sustainable Equity Fund (the "Fund") returned 31.09% (Class A shares returned 23.88% after the deduction of the maximum sales charge), while Class P shares returned 31.40% while Class P2 shares returned 26.90% from their inception date of October, 30 2020. The Fund's benchmark, (MSCI All Country World Index ex-US Index) (the "Index"), returned 35.72%. (Class P2 shares have lower expenses than the other share classes in the series. Returns for all share classes over various time periods are shown on page 59; please note that these returns do not reflect the deduction of taxes that a shareholder would pay on Fund distributions or the redemption of Fund shares, while the Index returns do not reflect the deduction of fees and expenses.)
The Fund underperformed its benchmark during the reporting period.
Portfolio performance summary1
What worked:
Stock selection in the materials and industrials sectors added the most value relative to the benchmark.
• Cemex's share price performed well, as their 2020 year-end results, including earnings of $625 million, reflected an improvement of 16% year-over-year. Its volumes increased the most in the US and Mexican markets. During the reporting year, the company delivered several announcements around their carbon-neutral concrete goal. Carbon Trust, a partner for organizations supporting them in realizing ambitious plans for a sustainable, low carbon future, validated its roadmap to decarbonize global operations in line with a 2 degree scenario and reduce carbon emissions by 35% by 2030.
• Ashtead Group's share price performed well after it announced plans to recommence its share buyback program. The company had paused its new rental location openings, bolt-on and share buyback programs in March 2020, as it looked to optimize cash flow and strengthen its liquidity position due to the COVID-19 pandemic. Now, given strong cash flow generation and expansion plans following the successful Project 2021 campaign, the company anticipates buying back up to £1 billion in shares.
• Samsung Engineering benefited from new order pipelines and sharply rising oil prices.
What didn't work:
Stock selection in the financials and health care sectors detracted the most relative to the benchmark.
• Galapagos' share price declined after the receipt of a complete response letter (CRL) from the Food and Drug Administration (FDA) in late summer 2020 for their lead program, filgotinib, an oral JAK-1 inhibitor. Following the FDA feedback that suggested the lack of a clear regulatory path forward in the US, Galapagos and Gilead announced in December 2020 a significant restructuring of their collaboration agreement. The companies will instead concentrate their efforts on IBD indications such as Ulcerative Colitis and Crohn's. We continue to hold this stock.
• This Fund did not own Taiwan Semiconductor Manufacturing, which detracted from relative performance during the reporting period.
• Despite strong fourth quarter 2020 results, Ubisoft Entertainment's share price declined amid concerns due to COVID-19 delays to their game releases and the previous lack of fiscal year 2022 guidance. In July 2021, after the reporting period ended, the company reaffirmed guidance for fiscal year 2022 and, despite changes in release dates, we continue to hold this stock, as they are a leading video game developer with strong franchises with strong potential for margin expansion as its sales continue to trend more towards digital downloads.
1 For a detailed commentary on the market environment in general during the reporting period, see page 3.
56
UBS International Sustainable Equity Fund
Portfolio highlights
Our investment philosophy combines our bottom-up fundamental research with rigorous sustainability analysis. We look for companies that we believe are attractively valued and integrate sustainability factors into their business model to build a competitive advantage.
The investment process for the International Sustainable Equity strategy is driven by a combination of fundamental, ESG (Environmental, Social and Governance) and thematic factors. Through this process, we aim to identify our best investment ideas across sectors and geographies from a stock-specific standpoint.
Please see below for summaries on active weights in the portfolio, as of period end June 30, 2021:
Samsung Engineering
Samsung Engineering is a South Korean engineering, procurement and constructions (EPC) company, with expertise in construction of petrochemical plants, gas plants, refineries, hydrocarbon upstream, water treatment and electricity generation infrastructure. The business is structured between two divisions: hydrocarbon and non-hydrocarbon, with 63% of its revenues generated outside of South Korea. We expect the company will continue leveraging project wins from its captive business in Samsung Electronics, for example, which we believe provide a high degree of certainty and visibility in its backlog. There has been a decline in new projects because of the pandemic and weakness in the oil market implying weaker revenue and margins in 2021. Cash-strapped EPCs have been reigning in capital expenditures (capex) amidst the oil market correction which has obvious implications for Samsung Engineering's backlog. However, we believe the company remains resilient through a tough order backdrop considering its strong balance sheet and net cash position. Coming out of the pandemic, we believe the company's orders will recover and should outpace growth over the past few years, with greater management focus on front end engineering design project (30% target by 2025), which should strengthen relationships with customers and translate into higher project conversion. In our view, the market reaction to Samsung Engineering's negative backlog impact from COVID-19 is, in our opinion, overdone at this point, with the stock trading far below its five-year average (9.4x 2020 earnings and 4.4x 2020 enterprise value/earnings before interest, taxes, depreciation, and amortization [EV/EBITDA], despite strong improvement in its return profile over the past few years. We believe that the market underappreciates the company's balance sheet resiliency and the new Chief Executive Officer's focus on project profitability with a greater willingness to turn away margin dilutive projects.
Ashtead Group
Ashtead Group provides a range of construction and industrial equipment. The company's Sunbelt brand is the second largest player in the highly fragmented US tool hire market, where the majority of competitors are very small and local. Ashtead Group has more than doubled its market share to 9% over the past decade, growing at approximately three times the pace of the overall market. When compared with its smaller competitors, Ashtead Group benefits from better buying power, fleet availability, technology, and the ability to share equipment between branches. The company is very successful at both geographic expansion and increasing local market strength. We believe it should continue to grow its market share in this fragmented, but consolidating US tool hire market. In addition, we feel Ashtead Group and will continue to grow ahead of the market, mainly organically, but also with bolt-on mergers and acquisitions (M&A).
BT Group
BT is the former UK fixed line telecom monopoly. It remains the dominant telecom services provider with around 40% market share. The business is currently organized in four divisions: Openreach (the regulated fixed line access network reaching 30 million households and business premises, i.e. close to 100% of the country), Consumer (voice, broadband and mobile services to consumers), Enterprise (telecom services to businesses) and Global Services (telecom services to multinational corporations). After numerous failed attempts to grow internationally, BT has now
57
UBS International Sustainable Equity Fund
largely retreated to its home market, with only 15% of revenues coming from abroad and more than 90% of the value of its assets in the UK. We believe that under the right regulatory agreement that Openreach could be a highly valuable infrastructure asset, with a fair value well in excess of the last reported regulatory book value of £13.8 billion. The UK telecom regulatory framework is under consultation and recent statements indicate that the potential new agreement would be favorable to BT Group's fiber roll-out plans this year.
Barry Callebaut
Barry Callebaut is one of the world's leading manufacturers of high-quality chocolate and cocoa products, and has been dedicated to this business for more than 150 years. The company operates out of more than 40 countries, runs about 60 production facilities, employs a global workforce of more than 12,000 people, and generates annual sales of about $7.1 billion. We see long-term structural growth coming from outsourcing and volume growth, complemented by margin growth through leverage. Barry Callebaut is globally diversified, which gives it a competitive edge over smaller local players and allows for more capacity in innovation. We believe they have a strong management team that is focused on long term margin expansion and top line growth with sustainability embedded in the corporate culture DNA. While the shutdown of restaurants/hotels has created short term headwinds for its Gourmet segment, we believe post crisis will be an opportunity to gain market share with a solid pipeline in food manufacturing. Overall, we view Barry Callebaut as being a recovery winner post lockdown. In 2016, the company launched Forever Chocolate, with a plan to make sustainable chocolate the norm by 2025 and drive a sustainable cocoa and chocolate supply chain. It aims to have more than 500,000 cocoa farmers lifted out of poverty and have 100% sustainable ingredients in all their products. In their fourth annual progress report, it reported 143,233 cocoa farmers in their supply chain are out of poverty and also reported an 8.1% reduction in its carbon footprint.
Infineon Technologies
Infineon Technologies engages in the provision of semiconductor and system solutions. It operates through the following segments: Automotive, Industrial Power Control, Power & Sensor Systems, and Connected Secure Systems. Infineon Technologies is now a much higher quality business than in the 2000s. The company exited from the very low quality and volatile DRAM business, together with the volatile and research and development intensive wireless and wireline businesses. 90% of Infineon Technologies' sales now come from the far higher quality Automotive, Industrial Power Control and Power & Sensor System divisions, which benefit from lower capital intensity and volatility of earnings. The company has a leading position in automotive and power semiconductors, which should benefit from increasing focus on energy efficiency and increased automation in cars. The company has a strong sustainability strategy, including well-integrated environmental targets and processes across the whole value chain.
• The Fund did not invest in derivatives during the reporting period.
This letter is intended to assist shareholders in understanding how the Fund performed during the 12 months ended June 30, 2021. The views and opinions in the letter were current as of August 12, 2021. They are not guarantees of future performance or investment results and should not be taken as investment advice. Investment decisions reflect a variety of factors, and we reserve the right to change our views about individual securities, sectors and markets at any time. As a result, the views expressed should not be relied upon as a forecast of the Fund's future investment intent. We encourage you to consult your financial advisor regarding your personal investment program.
Mutual funds are sold by prospectus only. You should read it carefully and consider a fund's investment objectives, risks, charges, expenses and other important information contained in the prospectus before investing. Prospectuses for most of our funds can be obtained from your financial advisor, by calling UBS Funds at 800-647 1568 or by visiting our website at www.ubs.com/am-us.
58
UBS International Sustainable Equity Fund
Average annual total returns for periods ended 06/30/21 (unaudited)
1 year | 5 years | 10 years or Inception1 | |||||||||||||
Before deducting maximum sales charge | |||||||||||||||
Class A1 | 31.09 | % | 10.73 | % | 6.08 | % | |||||||||
Class P2 | 31.40 | 11.01 | 6.35 | ||||||||||||
Class P25 | N/A | N/A | 26.90 | ||||||||||||
After deducting maximum sales charge | |||||||||||||||
Class A1 | 23.88 | % | 9.48 | % | 5.48 | % | |||||||||
MSCI World ex USA Index (net)3 | 33.60 | 10.36 | 5.70 | ||||||||||||
MSCI ACWI ex-US Index4 | 35.72 | 11.08 | 5.45 | ||||||||||||
The annualized gross and net expense ratios, respectively, for each class of shares as in the October 28, 2020 prospectuses were as follows: Class A—1.41% and 1.25%; Class P—1.12% and 1.00%; Class P2—1.12% and 0.25%. Net expenses reflect fee waivers and/or expense reimbursements, if any, pursuant to an agreement that is in effect to cap the expenses. UBS Asset Management (Americas) Inc., the Fund's investment advisor and administrator ("UBS AM (Americas)" or the "Advisor"), has agreed irrevocably to waive its fees and reimburse certain expenses (excluding expenses incurred through investment in other investment companies, interest, taxes, brokerage commissions and extraordinary expenses) so that the Fund's ordinary operating expenses (excluding expenses incurred through investment in other investment companies, interest, taxes, brokerage commissions and extraordinary expenses) do not exceed 1.25% for Class A shares, 1.00% for Class P shares and 0.25% for Class P2 shares. This fee waiver and expense arrangement may only be amended or terminated by shareholders.
1 Maximum sales charge for Class A shares is 5.5%. Class A shares bear ongoing 12b-1 service fees.
2 Class P shares do not bear initial or contingent deferred sales charges or ongoing 12b-1 service and distribution fees, but Class P shares held through advisory programs may be subject to a program fee, which, if included, would have reduced performance.
3 The MSCI World ex USA Index (net) is a free float-adjusted market capitalization weighted index that is designed to measure the equity market performance of developed markets excluding the United States. Net total return indices reinvest dividends after the deduction of withholding taxes, using a tax rate applicable to non-resident institutional investors who do not benefit from double taxation treaties. The index is constructed and managed with a view to being fully investable from the perspective of international institutional investors. Investors should note that indices do not reflect the deduction of fees and expenses.
4 Effective October 28, 2019, the MSCI ACWI ex-US Index replaced MSCI World ex USA Index (net) as the Fund's primary benchmark because it more closely aligns with the Fund's investment strategy
5 Inception date of Class P2 of UBS International Sustainable Equity Fund is October 30, 2020.
Past performance does not predict future performance, and the performance information provided does not reflect the deduction of taxes that a shareholder would pay on Fund distributions or the redemption of Fund shares. The return and principal value of an investment will fluctuate, so that an investor's shares, when redeemed, may be worth more or less than their original cost. Performance results assume reinvestment of all dividends and capital gain distributions at net asset value on the ex-dividend dates. Current performance may be higher or lower than the performance data quoted. For month-end performance figures, please visit www.ubs.com/us-mutualfundperformance.
59
UBS International Sustainable Equity Fund
Illustration of an assumed investment of $10,000 in Class A shares (adjusted for 5.5% maximum sales charge) and $5,000,000 in Class P shares and $25,000,000 in Class P2 shares (unaudited)
The following graphs depict the performance of UBS International Sustainable Equity Fund Class A and Class P and Class P2 shares versus the MSCI World Free ex USA Index (net) over the 10 years ended June 30, 2021. Class P2 shares versus the MSCI World Free ex USA Index (net) is from October 30, 2020, the inception date. The performance provided does not reflect the deduction of taxes that a shareholder would pay on Fund distributions or the redemption of Fund shares. Past performance is no guarantee of future results. Share price and returns will vary with market conditions; investors may realize a gain or loss upon redemption.
UBS International Sustainable Equity Fund Class A vs. MSCI World ex USA Index (net)
Wealth value with dividends reinvested. Initial investment for Class A Shares as of June 30, 2011 = $9,450
The Fund's growth of an assumed $10,000 investment is adjusted for the maximum sales charge of 5.5%.

UBS International Sustainable Equity Fund Class P vs. MSCI World ex USA Index (net)
Wealth value with dividends reinvested. Initial investment for Class P shares as of June 30, 2011 = $2,000,000
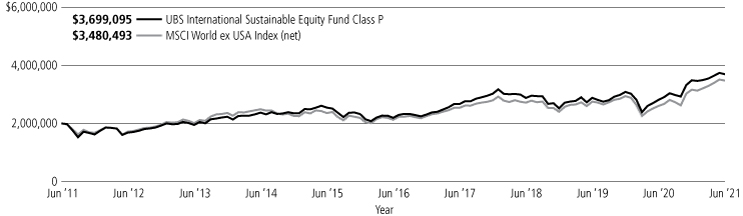
60
UBS International Sustainable Equity Fund
UBS International Sustainable Equity Fund Class P2 vs. MSCI World ex USA Index (net)
Wealth value with dividends reinvested. Initial investment for Class P2 shares as of October 30, 2020 = $25,000,000

Past performance does not predict future performance, and the performance information provided does not reflect the deduction of taxes that a shareholder would pay on Fund distributions or the redemption of Fund shares. The return and principal value of an investment will fluctuate, so that an investor's shares, when redeemed, may be worth more or less than their original cost. Performance results assume reinvestment of all dividends and capital gain distributions at net asset value on the ex-dividend dates. Current performance may be higher or lower than the performance data quoted. For month-end performance figures, please visit www.ubs.com/us-mutualfundperformance.
61
UBS International Sustainable Equity Fund
Portfolio statistics and industry diversification—(unaudited)1
As a percentage of net assets as of June 30, 2021
Top ten holdings
Samsung Engineering Co. Ltd. | 2.6 | % | |||||
Ashtead Group PLC | 2.5 | ||||||
BT Group PLC | 2.4 | ||||||
Sony Group Corp. | 2.3 | ||||||
Alibaba Group Holding Ltd., ADR | 2.3 | ||||||
Infineon Technologies AG | 2.0 | ||||||
Danone SA | 2.0 | ||||||
Barry Callebaut AG | 1.9 | ||||||
LG Chem Ltd. | 1.9 | ||||||
SoftBank Group Corp. | 1.9 | ||||||
Total | 21.8 | % | |||||
Top five issuer breakdown by country or territory of origin
United Kingdom | 15.8 | % | |||||
Japan | 14.6 | ||||||
China | 9.1 | ||||||
United States | 8.4 | ||||||
South Korea | 7.6 | ||||||
Total | 55.5 | % | |||||
Common stocks | |||||||
Auto components | 2.3 | % | |||||
Automobiles | 3.1 | ||||||
Banks | 9.2 | ||||||
Biotechnology | 2.1 | ||||||
Capital markets | 1.3 | ||||||
Chemicals | 3.5 | ||||||
Commercial services & supplies | 1.2 | ||||||
Construction & engineering | 2.6 | ||||||
Construction materials | 1.1 | ||||||
Diversified financial services | 0.9 | ||||||
Diversified telecommunication services | 4.7 | ||||||
Electrical equipment | 0.9 | ||||||
Electronic equipment, instruments & components | 1.5 | ||||||
Energy equipment & services | 1.2 | ||||||
Entertainment | 4.4 | ||||||
Food products | 6.0 | ||||||
Health care equipment & supplies | 2.5 | ||||||
Household durables | 2.3 | ||||||
Insurance | 7.4 | ||||||
Interactive media & services | 1.7 | ||||||
Internet & direct marketing retail | 3.3 | ||||||
IT services | 0.8 | ||||||
Machinery | 2.2 | ||||||
Oil, gas & consumable fuels | 2.2 | ||||||
Paper & forest products | 1.2 | ||||||
Personal products | 3.4 | ||||||
Pharmaceuticals | 4.2 | ||||||
Professional services | 1.2 | ||||||
Real estate management & development | 1.2 | ||||||
Semiconductors & semiconductor equipment | 6.2 | ||||||
Software | 3.2 | ||||||
Specialty retail | 1.5 | ||||||
Trading companies & distributors | 3.6 | ||||||
Wireless telecommunication services | 1.9 | ||||||
Total common stocks | 96.0 | ||||||
Short-term investments | 3.9 | ||||||
Investment of cash collateral from securities loaned | 0.0 | † | |||||
Total investments | 99.9 | ||||||
Other assets in excess of liabilities | 0.1 | ||||||
Net assets | 100.0 | % | |||||
† Amount represents less than 0.05% or (0.05)%.
1 The portfolio is actively managed and its composition will vary over time.
62
UBS International Sustainable Equity Fund
Portfolio of investments
June 30, 2021
| Number of shares | Value | ||||||||||
Common stocks: 96.0% | |||||||||||
Argentina: 1.0% | |||||||||||
MercadoLibre, Inc.* | 2,756 | $ | 4,293,269 | ||||||||
Australia: 1.2% | |||||||||||
Brambles Ltd. | 605,885 | 5,198,148 | |||||||||
Austria: 1.4% | |||||||||||
Erste Group Bank AG | 163,787 | 6,008,872 | |||||||||
Belgium: 2.6% | |||||||||||
Galapagos N.V.*,1 | 11,509 | 798,065 | |||||||||
Galapagos N.V.* | 40,553 | 2,812,053 | |||||||||
KBC Group N.V. | 101,367 | 7,728,598 | |||||||||
11,338,716 | |||||||||||
China: 9.1% | |||||||||||
Alibaba Group Holding Ltd., ADR* | 43,180 | 9,792,360 | |||||||||
China Mengniu Dairy Co. Ltd.* | 754,000 | 4,559,368 | |||||||||
Li Auto, Inc., ADR*,1 | 121,100 | 4,231,234 | |||||||||
Ping An Insurance Group Co. of China Ltd., Class H | 710,500 | 6,959,227 | |||||||||
Tencent Holdings Ltd. | 97,100 | 7,303,479 | |||||||||
Zhongsheng Group Holdings Ltd. | 760,000 | 6,323,300 | |||||||||
39,168,968 | |||||||||||
Denmark: 1.3% | |||||||||||
Genmab A/S* | 13,459 | 5,507,003 | |||||||||
France: 6.9% | |||||||||||
AXA SA | 230,277 | 5,839,195 | �� | ||||||||
Cie Generale des Etablissements Michelin SCA | 30,695 | 4,895,343 | |||||||||
Danone SA | 120,149 | 8,458,247 | |||||||||
Societe Generale SA | 156,201 | 4,604,454 | |||||||||
Ubisoft Entertainment SA* | 84,928 | 5,945,528 | |||||||||
29,742,767 | |||||||||||
Germany: 5.9% | |||||||||||
CTS Eventim AG & Co. KGaA* | 83,410 | 5,212,210 | |||||||||
Infineon Technologies AG | 219,891 | 8,818,084 | |||||||||
Knorr-Bremse AG | 35,995 | 4,140,065 | |||||||||
SAP SE | 51,114 | 7,202,706 | |||||||||
25,373,065 | |||||||||||
Hong Kong: 1.2% | |||||||||||
Sun Hung Kai Properties Ltd. | 353,000 | 5,260,242 | |||||||||
India: 3.0% | |||||||||||
Axis Bank Ltd., GDR* | 105,122 | 5,287,637 | |||||||||
Infosys Ltd., ADR | 171,299 | 3,629,826 | |||||||||
Mahindra & Mahindra Ltd., GDR | 400,690 | 4,187,210 | |||||||||
13,104,673 | |||||||||||
Indonesia: 2.8% | |||||||||||
Bank Central Asia Tbk. PT | 3,617,500 | 7,515,668 | |||||||||
Bank Mandiri Persero Tbk. PT | 11,329,000 | 4,609,731 | |||||||||
12,125,399 | |||||||||||
| Number of shares | Value | ||||||||||
Common stocks—(continued) | |||||||||||
Ireland: 0.9% | |||||||||||
AIB Group PLC* | 1,503,910 | $ | 3,875,027 | ||||||||
Italy: 2.1% | |||||||||||
Infrastrutture Wireless Italiane SpA1,2 | 440,315 | 4,966,249 | |||||||||
Prysmian SpA | 111,599 | 4,000,292 | |||||||||
8,966,541 | |||||||||||
Japan: 14.6% | |||||||||||
ITOCHU Corp. | 165,900 | 4,778,613 | |||||||||
Nabtesco Corp.1 | 144,800 | 5,474,234 | |||||||||
Nintendo Co. Ltd. | 13,700 | 7,968,801 | |||||||||
Nippon Telegraph & Telephone Corp. | 195,600 | 5,096,217 | |||||||||
ORIX Corp. | 236,700 | 3,993,826 | |||||||||
Shin-Etsu Chemical Co. Ltd. | 41,800 | 6,990,810 | |||||||||
SoftBank Group Corp. | 114,400 | 8,006,301 | |||||||||
Sony Group Corp. | 100,800 | 9,812,791 | |||||||||
Takeda Pharmaceutical Co. Ltd. | 175,561 | 5,877,054 | |||||||||
Toyota Motor Corp. | 54,800 | 4,789,667 | |||||||||
62,788,314 | |||||||||||
Mexico: 1.1% | |||||||||||
Cemex SAB de CV, ADR* | 553,533 | 4,649,677 | |||||||||
Netherlands: 2.9% | |||||||||||
ASML Holding N.V. | 11,084 | 7,614,970 | |||||||||
NXP Semiconductors N.V. | 24,138 | 4,965,669 | |||||||||
12,580,639 | |||||||||||
New Zealand: 0.7% | |||||||||||
Fisher & Paykel Healthcare Corp. Ltd. | 138,952 | 3,022,607 | |||||||||
Norway: 1.7% | |||||||||||
Equinor ASA | 145,376 | 3,075,974 | |||||||||
Mowi ASA | 174,715 | 4,443,893 | |||||||||
7,519,867 | |||||||||||
Portugal: 1.5% | |||||||||||
Galp Energia SGPS SA | 598,278 | 6,492,504 | |||||||||
South Korea: 7.6% | |||||||||||
LG Chem Ltd. | 10,896 | 8,224,126 | |||||||||
LG Household & Health Care Ltd. | 5,068 | 7,929,509 | |||||||||
Samsung Engineering Co. Ltd.* | 528,002 | 11,205,654 | |||||||||
SK Hynix, Inc. | 48,266 | 5,464,561 | |||||||||
32,823,850 | |||||||||||
Switzerland: 6.2% | |||||||||||
Alcon, Inc. | 75,539 | 5,288,751 | |||||||||
Barry Callebaut AG | 3,568 | 8,290,948 | |||||||||
Novartis AG | 84,703 | 7,719,164 | |||||||||
Zurich Insurance Group AG | 13,602 | 5,456,971 | |||||||||
26,755,834 | |||||||||||
63
UBS International Sustainable Equity Fund
Portfolio of investments
June 30, 2021
| Number of shares | Value | ||||||||||
Common stocks—(concluded) | |||||||||||
United Kingdom: 15.8% | |||||||||||
Ashtead Group PLC | 145,102 | $ | 10,766,599 | ||||||||
AstraZeneca PLC | 39,119 | 4,698,659 | |||||||||
BT Group PLC* | 3,827,893 | 10,272,541 | |||||||||
London Stock Exchange Group PLC | 48,856 | 5,386,325 | |||||||||
Mondi PLC | 203,680 | 5,356,078 | |||||||||
Prudential PLC | 378,902 | 7,198,996 | |||||||||
RELX PLC | 195,897 | 5,200,189 | |||||||||
Sage Group PLC | 679,393 | 6,430,141 | |||||||||
Spectris PLC | 139,556 | 6,250,888 | |||||||||
Unilever PLC | 115,080 | 6,736,157 | |||||||||
68,296,573 | |||||||||||
United States: 4.5% | |||||||||||
Aon PLC, Class A | 27,708 | 6,615,562 | |||||||||
Aptiv PLC* | 32,184 | 5,063,509 | |||||||||
LivaNova PLC* | 29,699 | 2,497,983 | |||||||||
Schlumberger N.V. | 162,692 | 5,207,771 | |||||||||
19,384,825 | |||||||||||
| Total common stocks (cost $358,008,109) | 414,277,380 | ||||||||||
| Number of shares | Value | ||||||||||
Short-term investments: 3.9% | |||||||||||
Investment companies: 3.9% | |||||||||||
| State Street Institutional U.S. Government Money Market Fund, 0.030%3 (cost $16,815,057) | 16,815,057 | $ | 16,815,057 | ||||||||
Investment of cash collateral from securities loaned: 0.0%† | |||||||||||
Money market funds: 0.0%† | |||||||||||
| State Street Navigator Securities Lending Government Money Market Portfolio, 0.020%3 (cost $192,040) | 192,040 | 192,040 | |||||||||
| Total investments (cost $375,015,206)—99.9% | 431,284,477 | ||||||||||
Other assets in excess of liabilities: 0.1% | 350,817 | ||||||||||
Net assets: 100.0% | $ | 431,635,294 | |||||||||
For a listing of defined portfolio acronyms that are used throughout the Portfolio of investments as well as the tables that follow, please refer to the Glossary of terms used in the Portfolio of investments.
Fair valuation summary
The following is a summary of the fair valuations according to the inputs used as of June 30, 2021 in valuing the Fund's investments. In the event a Fund holds investments for which fair value is measured using the NAV per share practical expedient (or its equivalent), a separate column will be added to the fair value hierarchy table; this is intended to permit reconciliation to the amounts presented in the Portfolio of investments:
Description | Unadjusted quoted prices in active markets for identical investments (Level 1) | Other significant observable inputs (Level 2) | Unobservable inputs (Level 3) | Total | |||||||||||||||
Assets | |||||||||||||||||||
Common stocks | $ | 411,465,327 | $ | 2,812,053 | $ | — | $ | 414,277,380 | |||||||||||
Short-term investments | — | 16,815,057 | — | 16,815,057 | |||||||||||||||
Investment of cash collateral from securities loaned | — | 192,040 | — | 192,040 | |||||||||||||||
U.S. treasury obligations | — | — | — | — | |||||||||||||||
Total | $ | 411,465,327 | $ | 19,819,150 | $ | — | $ | 431,284,477 | |||||||||||
At June 30, 2021, there were no transfers in or out of Level 3.
64
UBS International Sustainable Equity Fund
Portfolio of investments
June 30, 2021
Portfolio footnotes
* Non-income producing security.
† Amount represents less than 0.05% or (0.05)%.
1 Security, or portion thereof, was on loan at the period end.
2 Security exempt from registration pursuant to Rule 144A under the Securities Act of 1933. These securities are considered liquid, unless noted otherwise, and may be resold in transactions exempt from registration, normally to qualified institutional buyers. Securities exempt from registration pursuant to Rule 144A, in the amount of $4,966,249, represented 1.2% of the Fund's net assets at period end.
3 Rates shown reflect yield at June 30, 2021.
See accompanying notes to financial statements.
65
UBS US Dividend Ruler Fund
Portfolio Performance
For the period from its inception on July 9, 2020 through June 30, 2021 (the "reporting period"), Class P shares of UBS US Dividend Ruler Fund (the "Fund") returned 29.37%. For comparison purposes, the S&P 500 Index (the "Index") returned 36.34%. Please note that the Fund's returns do not reflect the deduction of taxes that a shareholder would pay on the redemption of Fund shares, while index returns do not reflect the deduction of fees and expenses.
Fund Overview
The Fund seeks to maximize total return, consisting of capital appreciation and current income.
Portfolio performance summary1
What worked:
• In terms of sector allocation, the portfolio's overweights in financials and industrials, as well as underweights to consumer discretionary and real estate, were the most additive to relative performance.
• In terms of stock selection, holdings in the communication services, consumer discretionary and consumer staples sectors were contributors to returns.
• A number of individual holdings were beneficial for performance, including:
– Shares of JPMorgan Chase outperformed given strong earnings results, market expectations for higher interest rates, and anticipation of higher capital returns to shareholders (both dividends and share buybacks).
– Microsoft's shares outperformed, driven by continued strength in its cloud computing platform Azure, as well as robust work-from-home demand for PCs.
– Comcast's stock has been a solid performer benefiting from strong broadband internet demand, expectations of a recovery in its Parks and TV advertising segments amid economic reopening, and the announcement of a resumption of share buybacks.
What didn't work:
• In terms of sector allocation, our overweights to consumer staples and energy were notable detractors from relative returns.
• Stock selection, overall, detracted from performance, with holdings in the financials, health care, industrials and information technology sectors being the largest negatives for results.
• A number of individual holdings weighed on performance, including:
– Shares of Intel lagged during the period given unexpected manufacturing delays. While disappointing, the introduction of well-respected industry veteran Pat Gelsinger as CEO, and continued strong demand in datacenter products should support an earnings and valuation rebound. We continue to hold the stock.
– Amgen's shares lagged following disappointing late stage clinical results for its heart failure assets, as well as inconsistent operating execution, mainly attributable to the pandemic which reduced in-office doctor visits. As the economy reopens, we believe Amgen should see a return in new patient treatments. We continue to hold the stock.
1 For a detailed commentary on the market environment in general during the reporting period, see page 3.
66
UBS US Dividend Ruler Fund
– Chevron's shares were only a modest contributor to performance over the reporting period, owing to the fact that it was removed from portfolio in November 2020.
• The Fund did not invest in derivatives during the reporting period.
This letter is intended to assist shareholders in understanding how the Fund performed during the period from its inception on July 9, 2020 through June 30, 2021. The views and opinions in the letter were current as of August 12, 2021. They are not guarantees of future performance or investment results and should not be taken as investment advice. Investment decisions reflect a variety of factors, and we reserve the right to change our views about individual securities, sectors and markets at any time. As a result, the views expressed should not be relied upon as a forecast of the Fund's future investment intent. We encourage you to consult your financial advisor regarding your personal investment program.
Mutual funds are sold by prospectus only. You should read it carefully and consider a fund's investment objectives, risks, charges, expenses and other important information contained in the prospectus before investing. Prospectuses for most of our funds can be obtained from your financial advisor, by calling UBS Funds at (800) 647 1568 or by visiting our website at www.ubs.com/am-us.
67
UBS US Dividend Ruler Fund
Average annual total returns for periods ended 06/30/21 (unaudited)
1 year | Inception1 | ||||||||||
Class P2 | N/A | 29.37 | % | ||||||||
S&P 500 Index3 | 40.79 | % | 36.34 | ||||||||
The annualized gross and net expense ratios, respectively, for each class of shares as in the October 28, 2020 prospectuses were as follows: Class P—0.78% and 0.50%. Net expenses reflect fee waivers and/or expense reimbursements, if any, pursuant to an agreement that is in effect to cap the expenses. The Trust, with respect to the Fund, and UBS Asset Management (Americas) Inc., the Fund's investment advisor and administrator ("UBS AM (Americas)" or the "Advisor"), have entered into a written agreement pursuant to which the Advisor has agreed to waive a portion of its management fees and/or to reimburse expenses (excluding expenses incurred through investment in other investment companies, interest, taxes, brokerage commissions and extraordinary expenses) to the extent necessary so that the Fund's ordinary operating expenses (excluding expenses incurred through investment in other investment companies, interest, taxes, brokerage commissions and extraordinary expenses), through the period ending October 28, 2021, do not exceed 0.50% for Class P shares. Pursuant to the written agreement, the Advisor is entitled to be reimbursed for any fees it waives and expenses it reimburses to the extent such reimbursement can be made during the three fiscal years following the date on which such fee waivers and expense reimbursements were made, provided that the reimbursement of the Advisor by the Fund will not cause the Fund to exceed the lesser of any applicable expense limit that is in place for the Fund (i) at the time of the waiver or reimbursement or (ii) at the time of the recoupment. The fee waiver/expense reimbursement agreement may be terminated by the Fund's Board of Trustees at any time and also will terminate automatically upon the expiration or termination of the Fund's advisory contract with the Advisor. Upon termination of the fee waiver/expense reimbursement agreement, however, UBS AM (Americas)'s three year recoupment rights will survive.
1 Inception date of Class P2 of UBS Dividend Ruler Price Fund is July 09, 2020.
2 Class P shares do not bear initial or contingent deferred sales charges or ongoing 12b-1 service and distribution fees, but Class P shares held through advisory programs may be subject to a program fee, which, if included, would have reduced performance.
3 The S&P 500 Index is an unmanaged, weighted index comprising 500 widely held common stocks varying in composition and is not available for direct investment. Investors should note that indices do not reflect the deduction of fees and expenses.
Past performance does not predict future performance, and the performance information provided does not reflect the deduction of taxes that a shareholder would pay on Fund distributions or the redemption of Fund shares. The return and principal value of an investment will fluctuate, so that an investor's shares, when redeemed, may be worth more or less than their original cost. Performance results assume reinvestment of all dividends and capital gain distributions at net asset value on the ex-dividend dates. Current performance may be higher or lower than the performance data quoted. For month-end performance figures, please visit www.ubs.com/us-mutualfundperformance.
68
UBS US Dividend Ruler Fund
Illustration of an assumed investment of $1,000 in Class P shares (unaudited)
The following graph depict the performance of UBS US Dividend Ruler Fund Class P shares versus the S&P 500 Index from July 09, 2020, the inception date of Class P through June 30, 2021. The performance provided does not reflect the deduction of taxes that a shareholder would pay on Fund distributions or the redemption of Fund shares. Past performance is no guarantee of future results. Share price and returns will vary with market conditions; investors may realize a gain or loss upon redemption.
UBS US Dividend Ruler Fund Class P vs. S&P 500 Index
Wealth value with dividends reinvested. Initial investment for Class P shares as of July 9, 2020 = $1,000

Past performance does not predict future performance, and the performance information provided does not reflect the deduction of taxes that a shareholder would pay on Fund distributions or the redemption of Fund shares. The return and principal value of an investment will fluctuate, so that an investor's shares, when redeemed, may be worth more or less than their original cost. Performance results assume reinvestment of all dividends and capital gain distributions at net asset value on the ex-dividend dates. Current performance may be higher or lower than the performance data quoted. For month-end performance figures, please visit www.ubs.com/us-mutualfundperformance.
69
UBS US Dividend Ruler Fund
Portfolio statistics and industry diversification—(unaudited)1
As a percentage of net assets as of June 30, 2021
Top ten holdings
Microsoft Corp. | 7.9 | % | |||||
Johnson & Johnson | 4.3 | ||||||
Cisco Systems, Inc. | 4.1 | ||||||
Comcast Corp., Class A | 3.8 | ||||||
JPMorgan Chase & Co. | 3.7 | ||||||
Medtronic PLC | 3.7 | ||||||
Home Depot, Inc. | 3.4 | ||||||
Coca-Cola Co. | 3.3 | ||||||
VF Corp. | 3.1 | ||||||
McDonald's Corp. | 3.0 | ||||||
Total | 40.3 | % | |||||
Issuer breakdown by country or territory of origin
United States | 92.8 | % | |||||
United Kingdom | 5.6 | ||||||
Switzerland | 2.2 | ||||||
Total | 100.6 | % | |||||
Common stocks | |||||||
Aerospace & defense | 4.7 | % | |||||
Air freight & logistics | 2.7 | ||||||
Banks | 6.7 | ||||||
Beverages | 5.9 | ||||||
Biotechnology | 2.8 | ||||||
Capital markets | 2.7 | ||||||
Chemicals | 3.0 | ||||||
Commercial services & supplies | 1.6 | ||||||
Communications equipment | 4.1 | ||||||
Consumer finance | 1.2 | ||||||
Electric utilities | 2.1 | ||||||
Electrical equipment | 2.5 | ||||||
Health care equipment & supplies | 3.7 | ||||||
Hotels, restaurants & leisure | 3.0 | ||||||
Household products | 2.5 | ||||||
Insurance | 5.3 | ||||||
IT services | 3.8 | ||||||
Media | 3.8 | ||||||
Oil, gas & consumable fuels | 4.0 | ||||||
Pharmaceuticals | 6.5 | ||||||
Road & rail | 2.8 | ||||||
Semiconductors & semiconductor equipment | 8.2 | ||||||
Software | 7.9 | ||||||
Specialty retail | 3.4 | ||||||
Textiles, apparel & luxury goods | 3.1 | ||||||
Total common stocks | 98.0 | ||||||
Short-term investments | 2.6 | ||||||
Total investments | 100.6 | ||||||
Liabilities in excess of other assets | (0.6 | ) | |||||
Net assets | 100.0 | % | |||||
1 The portfolio is actively managed and its composition will vary over time.
70
UBS US Dividend Ruler Fund
Portfolio of investments
June 30, 2021
| Number of shares | Value | ||||||||||
Common stocks: 98.0% | |||||||||||
Aerospace & defense: 4.7% | |||||||||||
Lockheed Martin Corp. | 4,947 | $ | 1,871,698 | ||||||||
Raytheon Technologies Corp. | 23,607 | 2,013,913 | |||||||||
3,885,611 | |||||||||||
Air freight & logistics: 2.7% | |||||||||||
United Parcel Service, Inc., Class B | 10,450 | 2,173,286 | |||||||||
Banks: 6.7% | |||||||||||
JPMorgan Chase & Co. | 19,671 | 3,059,627 | |||||||||
Truist Financial Corp. | 43,854 | 2,433,897 | |||||||||
5,493,524 | |||||||||||
Beverages: 5.9% | |||||||||||
Coca-Cola Co. | 49,940 | 2,702,254 | |||||||||
Diageo PLC, ADR | 11,228 | 2,152,295 | |||||||||
4,854,549 | |||||||||||
Biotechnology: 2.8% | |||||||||||
Amgen, Inc. | 9,356 | 2,280,525 | |||||||||
Capital markets: 2.7% | |||||||||||
BlackRock, Inc. | 2,489 | 2,177,800 | |||||||||
Chemicals: 3.0% | |||||||||||
Linde PLC | 8,508 | 2,459,663 | |||||||||
Commercial services & supplies: 1.6% | |||||||||||
Republic Services, Inc. | 12,272 | 1,350,043 | |||||||||
Communications equipment: 4.1% | |||||||||||
Cisco Systems, Inc. | 62,889 | 3,333,117 | |||||||||
Consumer finance: 1.2% | |||||||||||
Discover Financial Services | 8,075 | 955,192 | |||||||||
Electric utilities: 2.1% | |||||||||||
American Electric Power Co., Inc. | 10,001 | 845,984 | |||||||||
NextEra Energy, Inc. | 11,899 | 871,959 | |||||||||
1,717,943 | |||||||||||
Electrical equipment: 2.5% | |||||||||||
Rockwell Automation, Inc. | 7,206 | 2,061,060 | |||||||||
Health care equipment & supplies: 3.7% | |||||||||||
Medtronic PLC | 24,220 | 3,006,429 | |||||||||
Hotels, restaurants & leisure: 3.0% | |||||||||||
McDonald's Corp. | 10,762 | 2,485,914 | |||||||||
Household products: 2.5% | |||||||||||
Procter & Gamble Co. | 15,416 | 2,080,081 | |||||||||
| Number of shares | Value | ||||||||||
Common stocks—(concluded) | |||||||||||
Insurance: 5.3% | |||||||||||
Chubb Ltd. | 14,884 | $ | 2,365,663 | ||||||||
Marsh & McLennan Cos., Inc. | 13,879 | 1,952,498 | |||||||||
4,318,161 | |||||||||||
IT services: 3.8% | |||||||||||
Accenture PLC, Class A | 5,619 | 1,656,425 | |||||||||
Automatic Data Processing, Inc. | 7,546 | 1,498,787 | |||||||||
3,155,212 | |||||||||||
Media: 3.8% | |||||||||||
Comcast Corp., Class A | 54,696 | 3,118,766 | |||||||||
Oil, gas & consumable fuels: 4.0% | |||||||||||
EOG Resources, Inc. | 20,148 | 1,681,149 | |||||||||
Phillips 66 | 18,223 | 1,563,898 | |||||||||
3,245,047 | |||||||||||
Pharmaceuticals: 6.5% | |||||||||||
Johnson & Johnson | 21,526 | 3,546,193 | |||||||||
Novartis AG, ADR | 19,807 | 1,807,191 | |||||||||
5,353,384 | |||||||||||
Road & rail: 2.8% | |||||||||||
Union Pacific Corp. | 10,484 | 2,305,746 | |||||||||
Semiconductors & semiconductor equipment: 8.2% | |||||||||||
Analog Devices, Inc. | 12,243 | 2,107,755 | |||||||||
Intel Corp. | 38,743 | 2,175,032 | |||||||||
Texas Instruments, Inc. | 12,529 | 2,409,327 | |||||||||
6,692,114 | |||||||||||
Software: 7.9% | |||||||||||
Microsoft Corp. | 23,967 | 6,492,660 | |||||||||
Specialty retail: 3.4% | |||||||||||
Home Depot, Inc. | 8,835 | 2,817,393 | |||||||||
Textiles, apparel & luxury goods: 3.1% | |||||||||||
VF Corp. | 30,727 | 2,520,843 | |||||||||
| Total common stocks (cost $72,355,202) | 80,334,063 | ||||||||||
Short-term investments: 2.6% | |||||||||||
Investment companies: 2.6% | |||||||||||
| State Street Institutional U.S. Government Money Market Fund, 0.030%1 (cost $2,140,250) | 2,140,250 | 2,140,250 | |||||||||
| Total investments (cost $74,495,452)—100.6% | 82,474,313 | ||||||||||
Liabilities in excess of other assets: (0.6)% | (493,243 | ) | |||||||||
Net assets: 100.0% | $ | 81,981,070 | |||||||||
For a listing of defined portfolio acronyms that are used throughout the Portfolio of investments as well as the tables that follow, please refer to the Glossary of terms used in the Portfolio of investments.
71
UBS US Dividend Ruler Fund
Portfolio of investments
June 30, 2021
Fair valuation summary
The following is a summary of the fair valuations according to the inputs used as of June 30, 2021 in valuing the Fund's investments. In the event a Fund holds investments (other than a money market fund) for which fair value is measured using the NAV per share practical expedient (or its equivalent), a separate column will be added to the fair value hierarchy table; this is intended to permit reconciliation to the amounts presented in the Portfolio of investments:
Description | Unadjusted quoted prices in active markets for identical investments (Level 1) | Other significant observable inputs (Level 2) | Unobservable inputs (Level 3) | Total | |||||||||||||||
Assets | |||||||||||||||||||
Common stocks | $ | 80,334,063 | $ | — | $ | — | $ | 80,334,063 | |||||||||||
Short-term investments | — | 2,140,250 | — | 2,140,250 | |||||||||||||||
Total | $ | 80,334,063 | $ | 2,140,250 | $ | — | $ | 82,474,313 | |||||||||||
At June 30, 2021, there were no transfers in or out of Level 3.
Portfolio footnotes
1 Rates shown reflect yield at June 30, 2021.
See accompanying notes to financial statements.
72
UBS US Quality Growth At Reasonable Price Fund
Portfolio Performance
For the period from its inception on July 9, 2020 through June 30, 2021 (the "reporting period"), Class P shares of UBS US Quality Growth At Reasonable Price Fund (the "Fund") returned 31.49%. For comparison purposes, the Russell 1000 Growth Index (the "Index") returned 34.64%. Please note that the Fund's returns do not reflect the deduction of taxes that a shareholder would pay on the redemption of Fund shares, while index returns do not reflect the deduction of fees and expenses.
Fund Overview
The Fund seeks to provide capital appreciation.
Portfolio performance summary1
What worked:
• Stock selection in the financials, health care, and industrial sectors were meaningful contributors to returns.
• Looking at sector allocation, an overweight to communication services and an underweight to consumer staples were the more meaningful contributors to relative performance.
• A number of individual holdings were beneficial for performance, including:
– Alphabet's shares outperformed, benefiting from the strong recovery in digital advertising markets, opportunities for further YouTube monetization, and enhanced profitability in its cloud computing platform.
– Despite fears of regulatory action and more restrictive privacy platform changes, Facebook's shares rallied, driven by broad-based online advertising strength, especially in small and medium enterprises that were adversely impacted during the pandemic.
– Microsoft's shares outperformed, driven by continued strength in its cloud computing platform Azure, as well as robust work-from-home demand for PCs.
What didn't work:
• Stock selection in the information technology, consumer discretionary, and real estate sectors were detractors from performance.
• In terms of sector allocation, our overweight in financials and underweight in information technology were the largest detractors.
• A number of individual holdings have been less additive to performance, including:
– American Tower's shares lagged due to instability in the Indian telecom market and lack of clarity regarding the terms of its long-term lease with T-Mobile. Both issues have since been resolved and our positive fundamental view for American Tower remains unchanged, supported by continued global mobile data consumption and 5G rollouts. We continue to hold the stock.
– Union Pacific's shares have been only a modest contributor to performance over the reporting performance period owing to the fact that it was recently added in April 2021. We continue to hold the stock.
1 For a detailed commentary on the market environment in general during the reporting period, see page 3.
73
UBS US Quality Growth At Reasonable Price Fund
– Shares of S&P Global was only a modest contributor to performance over the reporting period, owing to the fact that it was recently added in May 2021. We continue to hold the stock.
• The Fund did not invest in derivatives during the reporting period.
This letter is intended to assist shareholders in understanding how the Fund performed during the period from its inception on July 9, 2020 through June 30, 2021. The views and opinions in the letter were current as of August 12, 2021. They are not guarantees of future performance or investment results and should not be taken as investment advice. Investment decisions reflect a variety of factors, and we reserve the right to change our views about individual securities, sectors and markets at any time. As a result, the views expressed should not be relied upon as a forecast of the Fund's future investment intent. We encourage you to consult your financial advisor regarding your personal investment program.
Mutual funds are sold by prospectus only. You should read it carefully and consider a fund's investment objectives, risks, charges, expenses and other important information contained in the prospectus before investing. Prospectuses for most of our funds can be obtained from your financial advisor, by calling UBS Funds at (800) 647 1568 or by visiting our website at www.ubs.com/am-us.
74
UBS US Quality Growth At Reasonable Price Fund
Average annual total returns for periods ended 06/30/21 (unaudited)
1 year | Inception1 | ||||||||||
Class P2 | N/A | 31.49 | % | ||||||||
Russell 1000 Growth3 | 42.50 | % | 34.64 | ||||||||
The annualized gross and net expense ratios, respectively, for each class of shares as in the October 28, 2020 prospectuses were as follows: Class P—0.78% and 0.50%. Net expenses reflect fee waivers and/or expense reimbursements, if any, pursuant to an agreement that is in effect to cap the expenses. The Trust, with respect to the Fund, and UBS Asset Management (Americas) Inc., the Fund's investment advisor and administrator ("UBS AM (Americas)" or the "Advisor"), have entered into a written agreement pursuant to which the Advisor has agreed to waive a portion of its management fees and/or to reimburse expenses (excluding expenses incurred through investment in other investment companies, interest, taxes, brokerage commissions and extraordinary expenses) to the extent necessary so that the Fund's ordinary operating expenses (excluding expenses incurred through investment in other investment companies, interest, taxes, brokerage commissions and extraordinary expenses), through the period ending October 28, 2021, do not exceed 0.50% for Class P shares. Pursuant to the written agreement, the Advisor is entitled to be reimbursed for any fees it waives and expenses it reimburses to the extent such reimbursement can be made during the three fiscal years following the date on which such fee waivers and expense reimbursements were made, provided that the reimbursement of the Advisor by the Fund will not cause the Fund to exceed the lesser of any applicable expense limit that is in place for the Fund (i) at the time of the waiver or reimbursement or (ii) at the time of the recoupment. The fee waiver/expense reimbursement agreement may be terminated by the Fund's Board of Trustees at any time and also will terminate automatically upon the expiration or termination of the Fund's advisory contract with the Advisor. Upon termination of the fee waiver/expense reimbursement agreement, however, UBS AM (Americas)'s three year recoupment rights will survive.
1 Inception date of Class P of UBS US Quality Growth at Reasonable Price Fund is July 09, 2020.
2 Class P shares do not bear initial or contingent deferred sales charges or ongoing 12b-1 service and distribution fees, but Class P shares held through advisory programs may be subject to a program fee, which, if included, would have reduced performance.
3 Russell 1000 Growth Index measures the performance of those Russell 1000 companies with higher price-to-book ratios and higher forecasted growth values. The index was developed with a base value of 200 as of August 31, 1992.
Past performance does not predict future performance, and the performance information provided does not reflect the deduction of taxes that a shareholder would pay on Fund distributions or the redemption of Fund shares. The return and principal value of an investment will fluctuate, so that an investor's shares, when redeemed, may be worth more or less than their original cost. Performance results assume reinvestment of all dividends and capital gain distributions at net asset value on the ex-dividend dates. Current performance may be higher or lower than the performance data quoted. For month-end performance figures, please visit www.ubs.com/us-mutualfundperformance.
75
UBS US Quality Growth At Reasonable Price Fund
Illustration of an assumed investment of $1,000 in Class P shares (unaudited)
The following graph depict the performance of UBS US Quality Growth At Reasonable Price Fund Class P shares versus the Russell 1000 Growth Index from July 09, 2020, the inception date of Class P through June 30, 2021. The performance provided does not reflect the deduction of taxes that a shareholder would pay on Fund distributions or the redemption of Fund shares. Past performance is no guarantee of future results. Share price and returns will vary with market conditions; investors may realize a gain or loss upon redemption.
UBS US Quality Growth At Reasonable Price Fund Class P vs. Russell 1000 Growth Index
Wealth value with dividends reinvested. Initial investment for Class P shares as of July 9, 2020 = $1,000
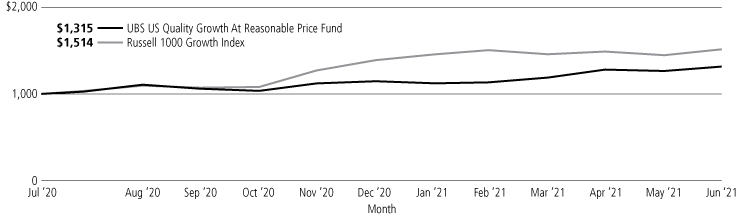
Past performance does not predict future performance, and the performance information provided does not reflect the deduction of taxes that a shareholder would pay on Fund distributions or the redemption of Fund shares. The return and principal value of an investment will fluctuate, so that an investor's shares, when redeemed, may be worth more or less than their original cost. Performance results assume reinvestment of all dividends and capital gain distributions at net asset value on the ex-dividend dates. Current performance may be higher or lower than the performance data quoted. For month-end performance figures, please visit www.ubs.com/us-mutualfundperformance.
76
UBS US Quality Growth At Reasonable Price Fund
Portfolio statistics and industry diversification—(unaudited)1
As a percentage of net assets as of June 30, 2021
Top ten holdings
Microsoft Corp. | 10.8 | % | |||||
Amazon.com, Inc. | 8.3 | ||||||
Alphabet, Inc., Class A | 7.4 | ||||||
Facebook, Inc., Class A | 7.3 | ||||||
Apple, Inc. | 5.7 | ||||||
Visa, Inc., A Shares | 4.3 | ||||||
Adobe, Inc. | 3.3 | ||||||
O'Reilly Automotive, Inc. | 2.9 | ||||||
Home Depot, Inc. | 2.8 | ||||||
Salesforce.com, Inc. | 2.7 | ||||||
Total | 55.5 | % | |||||
Issuer breakdown by country or territory of origin
United States | 99.9 | % | |||||
Common stocks | |||||||
Capital markets | 4.9 | % | |||||
Chemicals | 1.7 | ||||||
Electrical equipment | 1.0 | ||||||
Equity real estate investment trusts | 2.1 | ||||||
Food & staples retailing | 1.5 | ||||||
Health care equipment & supplies | 7.1 | ||||||
Health care providers & services | 1.9 | ||||||
Industrial conglomerates | 1.4 | ||||||
Interactive media & services | 14.7 | ||||||
Internet & direct marketing retail | 8.3 | ||||||
IT services | 9.0 | ||||||
Life sciences tools & services | 1.5 | ||||||
Machinery | 1.9 | ||||||
Multiline retail | 1.6 | ||||||
Personal products | 1.1 | ||||||
Road & rail | 2.4 | ||||||
Semiconductors & semiconductor equipment | 3.1 | ||||||
Software | 16.8 | ||||||
Specialty retail | 10.2 | ||||||
Technology hardware, storage & peripherals | 5.7 | ||||||
Total common stocks | 97.9 | ||||||
Short-term investments | 2.0 | ||||||
Total investments | 99.9 | ||||||
Other assets in excess of liabilities | 0.1 | ||||||
Net assets | 100.0 | % | |||||
1 The portfolio is actively managed and its composition will vary over time.
77
UBS US Quality Growth At Reasonable Price Fund
Portfolio of investments
June 30, 2021
| Number of shares | Value | ||||||||||
Common stocks: 97.9% | |||||||||||
Capital markets: 4.9% | |||||||||||
Ameriprise Financial, Inc. | 11,060 | $ | 2,752,613 | ||||||||
Intercontinental Exchange, Inc. | 14,475 | 1,718,182 | |||||||||
S&P Global, Inc. | 2,953 | 1,212,059 | |||||||||
5,682,854 | |||||||||||
Chemicals: 1.7% | |||||||||||
Sherwin-Williams Co. | 7,322 | 1,994,879 | |||||||||
Electrical equipment: 1.0% | |||||||||||
Rockwell Automation, Inc. | 4,000 | 1,144,080 | |||||||||
Equity real estate investment trusts: 2.1% | |||||||||||
American Tower Corp. | 9,072 | 2,450,710 | |||||||||
Food & staples retailing: 1.5% | |||||||||||
Costco Wholesale Corp. | 4,545 | 1,798,320 | |||||||||
Health care equipment & supplies: 7.1% | |||||||||||
Abbott Laboratories | 22,994 | 2,665,694 | |||||||||
Boston Scientific Corp.* | 38,800 | 1,659,088 | |||||||||
Danaher Corp. | 7,402 | 1,986,401 | |||||||||
Medtronic PLC | 15,429 | 1,915,202 | |||||||||
8,226,385 | |||||||||||
Health care providers & services: 1.9% | |||||||||||
UnitedHealth Group, Inc. | 5,444 | 2,179,995 | |||||||||
Industrial conglomerates: 1.4% | |||||||||||
Honeywell International, Inc. | 7,564 | 1,659,163 | |||||||||
Interactive media & services: 14.7% | |||||||||||
Alphabet, Inc., Class A* | 3,531 | 8,621,960 | |||||||||
Facebook, Inc., Class A* | 24,563 | 8,540,801 | |||||||||
17,162,761 | |||||||||||
Internet & direct marketing retail: 8.3% | |||||||||||
Amazon.com, Inc.* | 2,826 | 9,721,892 | |||||||||
IT services: 9.0% | |||||||||||
Accenture PLC, Class A | 9,325 | 2,748,917 | |||||||||
Fidelity National Information Services, Inc. | 18,888 | 2,675,863 | |||||||||
Visa, Inc., A Shares | 21,509 | 5,029,234 | |||||||||
10,454,014 | |||||||||||
Life sciences tools & services: 1.5% | |||||||||||
Thermo Fisher Scientific, Inc. | 3,582 | 1,807,012 | |||||||||
| Number of shares | Value | ||||||||||
Common stocks—(concluded) | |||||||||||
Machinery: 1.9% | |||||||||||
Parker-Hannifin Corp. | 7,196 | $ | 2,209,964 | ||||||||
Multiline retail: 1.6% | |||||||||||
Dollar General Corp. | 8,487 | 1,836,502 | |||||||||
Personal products: 1.1% | |||||||||||
Estee Lauder Cos., Inc., Class A | 4,023 | 1,279,636 | |||||||||
Road & rail: 2.4% | |||||||||||
Union Pacific Corp. | 12,727 | 2,799,049 | |||||||||
Semiconductors & semiconductor equipment: 3.1% | |||||||||||
Applied Materials, Inc. | 12,976 | 1,847,783 | |||||||||
Texas Instruments, Inc. | 8,997 | 1,730,123 | |||||||||
3,577,906 | |||||||||||
Software: 16.8% | |||||||||||
Adobe, Inc.* | 6,515 | 3,815,444 | |||||||||
Microsoft Corp. | 46,503 | 12,597,663 | |||||||||
Salesforce.com, Inc.* | 12,880 | 3,146,198 | |||||||||
19,559,305 | |||||||||||
Specialty retail: 10.2% | |||||||||||
Home Depot, Inc. | 10,227 | 3,261,288 | |||||||||
Lowe's Cos., Inc. | 11,903 | 2,308,825 | |||||||||
O'Reilly Automotive, Inc.* | 5,929 | 3,357,059 | |||||||||
TJX Cos., Inc. | 44,520 | 3,001,538 | |||||||||
11,928,710 | |||||||||||
Technology hardware, storage & peripherals: 5.7% | |||||||||||
Apple, Inc. | 48,692 | 6,668,856 | |||||||||
| Total common stocks (cost $99,214,254) | 114,141,993 | ||||||||||
Short-term investments: 2.0% | |||||||||||
Investment companies: 2.0% | |||||||||||
| State Street Institutional U.S. Government Money Market Fund, 0.030%1 (cost $2,298,754) | 2,298,754 | 2,298,754 | |||||||||
| Total investments (cost $101,513,008)—99.9% | 116,440,747 | ||||||||||
Other assets in excess of liabilities: 0.1% | 97,138 | ||||||||||
Net assets: 100.0% | $ | 116,537,885 | |||||||||
For a listing of defined portfolio acronyms that are used throughout the Portfolio of investments as well as the tables that follow, please refer to the Glossary of terms used in the Portfolio of investments.
78
UBS US Quality Growth At Reasonable Price Fund
Portfolio of investments
June 30, 2021
Fair valuation summary
The following is a summary of the fair valuations according to the inputs used as of June 30, 2021 in valuing the Fund's investments. In the event a Fund holds investments (other than a money market fund) for which fair value is measured using the NAV per share practical expedient (or its equivalent), a separate column will be added to the fair value hierarchy table; this is intended to permit reconciliation to the amounts presented in the Portfolio of investments.
Description | Unadjusted quoted prices in active markets for identical investments (Level 1) | Other significant observable inputs (Level 2) | Unobservable inputs (Level 3) | Total | |||||||||||||||
Assets | |||||||||||||||||||
Common stocks | $ | 114,141,993 | $ | — | $ | — | $ | 114,141,993 | |||||||||||
Short-term investments | — | 2,298,754 | — | 2,298,754 | |||||||||||||||
Total | $ | 114,141,993 | $ | 2,298,754 | $ | — | $ | 116,440,747 | |||||||||||
At June 30, 2021, there were no transfers in or out of Level 3.
Portfolio footnotes
* Non-income producing security.
1 Rates shown reflect yield at June 30, 2021.
See accompanying notes to financial statements.
79
UBS U.S. Small Cap Growth Fund
Portfolio performance
For the 12 months ended June 30, 2021, Class A shares of UBS U.S. Small Cap Growth Fund (the "Fund") returned 59.94% (Class A shares returned 51.14% after the deduction of the maximum sales charge), while Class P shares returned 60.29%. The Fund's benchmark, the Russell 2000 Growth Index (the "Index"), returned 51.36% over the same time period. (Class P shares have lower expenses than Class A shares of the Fund. Returns for all share classes over various time periods are shown on page 82; please note that the Fund's returns do not reflect the deduction of taxes that a shareholder would pay on Fund distributions or the redemption of Fund shares, while the Index returns do not reflect the deduction of fees and expenses.)
The Fund's performance was driven primarily by stock selection decisions, but also benefitted from sector selection.
Portfolio performance summary1
What worked:
• Within stock selection, Generac was the top contributor to Fund performance during the 12 months ended June 30, 2021.
– Generac is a manufacturer of automatic, stationary standby and portable generators. The company outperformed due to continued strong demand for home generators. Generac also has a growing business in backup solar energy storage and recently announced the acquisition of Deep Sea. (For details, see "Portfolio highlights.")
• Several other stock selection decisions benefited performance during the 12-month period.
– Magnite, a provider of technology solutions to automate the purchase and sale of digital advertising inventory, traded higher as the company's connected TV advertising segment began to gain traction.
– Enphase Energy, a manufacturer of solar power solutions, outperformed on optimism surrounding both the continued recovery of solar installations and the attachment rate of the company's proprietary storage system. We sold the stock during the reporting period.
– Livongo Health, a developer of applied health signals for the treatment of chronic health conditions, outperformed as the global pandemic increased demand for its services and the company agreed to be acquired by Teladoc Health. We sold the stock during the reporting period.
– Herc Holdings, a provider of equipment rental services for a wide array of industries, outperformed as the company benefitted from the ongoing economic recovery. We believe Herc is likely to experience additional momentum from increased infrastructure spending. (For details, see "Portfolio highlights.")
• Within sector allocation, an overweight to industrials as well as underweights to utilities and healthcare contributed, while the Fund's cash position detracted from relative performance.
• The Fund did not invest in derivatives during the reporting period.
What didn't work:
• Certain stock selection decisions made detracted from Fund returns during the reporting period.
– Alteryx, a designer and developer of software for analytic solutions, underperformed after the company provided initial revenue guidance for fiscal year 2021 that was below expectations. Alteryx also had unexpected senior leadership changes that we believe could have contributed to challenges with sales execution.
– Grocery Outlet, an owner and operator of grocery stores, underperformed as the company approached the one-year anniversary of pandemic-inflated results and investors appeared to focus their attention on companies
1 For a detailed commentary on the market environment in general during the reporting period, see page 3.
80
UBS U.S. Small Cap Growth Fund
that would see greater benefit from continued improvements in economic activity. We sold the stock during the reporting period.
– Adverum Biotechnologies is a novel gene therapy company that targets serious ocular and rare diseases. The share price underperformed after the company reported a serious adverse reaction in a patient treated with ADVM-022 in the Phase 2 diabetic macular edema study (INFINITY). The adverse event caused the study to be immediately terminated and unblinded. We sold the stock during the reporting period.
– Mercury Systems, a provider of sensor processing subsystems, underperformed on concerns about slowing organic growth, increasing federal deficits and a potential decline in US defense spending. We sold the stock during the reporting period.
– Plug Power, which designs, develops, manufactures and commercializes fuel cell systems for electric lift trucks and material handling systems, outperformed during the 12-month period. The Fund did not own the stock during the reporting period, which harmed returns relative to the benchmark.
Portfolio highlights
• Generac is a manufacturer of backup power generation products for the residential, light commercial and industrial markets. The company is executing well with a favorable backdrop for sales. Opportunities for upside include a recovery in the energy sector, interest from the telecom market with national account customers who wish to protect the uptime of their network, as well as power outages ahead of current baseline.
• Universal Display is a leader in the research, development and commercialization of organic light-emitting diode (OLED) technologies and materials. We remain positive regarding expected OLED industry shipments in the coming years as manufacturing capacity continues to grow and adoption across mobile, TV, auto and other form factors continues to broaden.
• Staar Surgical designs, develops, manufactures and sells a variety of implantable lenses used to treat visual disorders. The company has developed EVO/EVO+, an implantable collamer lens (ICL) that is awaiting regulatory approval in the US. We believe this lens has the potential to disrupt the LASIK market, given that it is expected to have more benign side effects and is removeable. The company's product may also expand the population of treatable patients who otherwise would not consider laser correction surgery. The product is currently launched in China, where it has seen rapid uptake, which is providing a playbook for the company's US distribution plans.
• Herc Holdings is one of the leading North American equipment rental companies. The company operates in a highly fragmented market, which is seeing a secular growth tailwind of customers renting rather than owning equipment. Renting is beneficial because it frees up capital, provides flexibility, and outsources repair and maintenance of the fleet). We expect the company's growth to come from expanding and diversifying revenues, improving operating efficiencies and enhancing the customer experience, along with disciplined capital management.
This letter is intended to assist shareholders in understanding how the Fund performed during the 12 months ended June 30, 2021. The views and opinions in the letter were current as of August 12, 2021. They are not guarantees of future performance or investment results and should not be taken as investment advice. Investment decisions reflect a variety of factors, and we reserve the right to change our views about individual securities, sectors and markets at any time. As a result, the views expressed should not be relied upon as a forecast of the Fund's future investment intent. We encourage you to consult your financial advisor regarding your personal investment program.
Mutual funds are sold by prospectus only. You should read it carefully and consider a fund's investment objectives, risks, charges, expenses and other important information contained in the prospectus before investing. Prospectuses for most of our funds can be obtained from your financial advisor, by calling UBS Funds at 800-647 1568 or by visiting our website at www.ubs.com/am-us.
81
UBS U.S. Small Cap Growth Fund
Average annual total returns for periods ended 06/30/21 (unaudited)
1 year | 5 years | 10 years | |||||||||||||
Before deducting maximum sales charge | |||||||||||||||
Class A1 | 59.94 | % | 23.67 | % | 15.88 | % | |||||||||
Class P2 | 60.29 | 23.99 | 16.18 | ||||||||||||
After deducting maximum sales charge | |||||||||||||||
Class A1 | 51.14 | % | 22.28 | % | 15.22 | % | |||||||||
Russell 2000 Growth Index3 | 51.36 | 18.76 | 13.52 | ||||||||||||
The annualized gross and net expense ratios, respectively, for each class of shares as in the October 28, 2020 prospectuses were as follows: Class A—1.61% and 1.25%; Class P—1.30% and 1.00%. Net expenses reflect fee waivers and/or expense reimbursements, if any, pursuant to an agreement that is in effect to cap the expenses. The Trust, with respect to the Fund, and UBS Asset Management (Americas) Inc. the Fund's investment advisor and administrator ("UBS AM (Americas)" or the "Advisor"), have entered into a written agreement pursuant to which the Advisor has agreed to waive a portion of its management fees and/or to reimburse expenses (excluding expenses incurred through investment in other investment companies, interest, taxes, brokerage commissions, extraordinary expenses, and dividend expense and security loan fees for securities sold short) to the extent necessary so that the Fund's ordinary operating expenses (excluding expenses incurred through investment in other investment companies, interest, taxes, brokerage commissions, extraordinary expenses, and dividend expense and security loan fees for securities sold short), through the period ending October 28, 2021, do not exceed 1.24% for Class A shares and 0.99% for Class P shares. Pursuant to the written agreement, the Advisor is entitled to be reimbursed for any fees it waives and expenses it reimburses to the extent such reimbursement can be made during the three fiscal years following the date on which such fee waivers and expense reimbursements were made, provided that the reimbursement of the Advisor by the Fund will not cause the Fund to exceed the lesser of any applicable expense limit that is in place for the Fund (i) at the time of the waiver or reimbursement or (ii) at the time of the recoupment. The fee waiver/expense reimbursement agreement may be terminated by the Fund's Board of Trustees at any time and also will terminate automatically upon the expiration or termination of the Fund's advisory contract with the Advisor. Upon termination of the fee waiver/expense reimbursement agreement, however, UBS AM (Americas)'s three year recoupment rights will survive.
1 Maximum sales charge for Class A shares is 5.5%. Class A shares bear ongoing 12b-1 service fees.
2 Class P shares do not bear initial or contingent deferred sales charges or ongoing 12b-1 service and distribution fees, but Class P shares held through advisory programs may be subject to a program fee, which, if included, would have reduced performance.
3 The Russell 2000 Growth Index measures the performance of the small-cap growth segment of the US equity universe. It includes those Russell 2000 Index companies with higher price-to-book ratios and higher forecasted growth values. The Russell 2000 Growth Index is constructed to provide a comprehensive and unbiased barometer for the small-cap growth segment. The Index is completely reconstituted annually to ensure larger stocks do not distort the performance and characteristics of the true small-cap opportunity set and that the represented companies continue to reflect growth characteristics. Investors should note that indices do not reflect the deduction of fees and expenses.
The Fund invests in IPOs which may have a magnified impact on performance.
Past performance does not predict future performance, and the performance information provided does not reflect the deduction of taxes that a shareholder would pay on Fund distributions or the redemption of Fund shares. The return and principal value of an investment will fluctuate, so that an investor's shares, when redeemed, may be worth more or less than their original cost. Performance results assume reinvestment of all dividends and capital gain distributions at net asset value on the ex-dividend dates. Current performance may be higher or lower than the performance data quoted. For month-end performance figures, please visit www.ubs.com/us-mutualfundperformance.
82
UBS U.S. Small Cap Growth Fund
Illustration of an assumed investment of $10,000 in Class A shares (adjusted for 5.5% maximum sales charge) and $2,000,000 in Class P shares (unaudited)
The following two graphs depict the performance of UBS U.S. Small Cap Growth Fund Class A and Class P versus the Russell 2000 Growth Index over the 10 years ended June 30, 2021. The performance provided does not reflect the deduction of taxes that a shareholder would pay on Fund distributions or the redemption of Fund shares. Past performance is no guarantee of future results. Share price and returns will vary with market conditions; investors may realize a gain or loss upon redemption.
UBS U.S. Small Cap Growth Fund Class A vs. Russell 2000 Growth Index
Wealth value with dividends reinvested. Initial investment for Class A Shares as of June 30, 2011 = $9,450
The Fund's growth of an assumed $10,000 investment is adjusted for the maximum sales charge of 5.5%.

UBS U.S. Small Cap Growth Fund Class P vs. Russell 2000 Growth Index
Wealth value with dividends reinvested. Initial investment for Class P shares as of June 30, 2011 = $2,000,000

Past performance does not predict future performance, and the performance information provided does not reflect the deduction of taxes that a shareholder would pay on Fund distributions or the redemption of Fund shares. The return and principal value of an investment will fluctuate, so that an investor's shares, when redeemed, may be worth more or less than their original cost. Performance results assume reinvestment of all dividends and capital gain distributions at net asset value on the ex-dividend dates. Current performance may be higher or lower than the performance data quoted. For month-end performance figures, please visit www.ubs.com/us-mutualfundperformance.
83
UBS U.S. Small Cap Growth Fund
Portfolio statistics and industry diversification—(unaudited)1
As a percentage of net assets as of June 30, 2021
Top ten holdings
Generac Holdings, Inc. | 3.0 | % | |||||
Staar Surgical Co. | 2.5 | ||||||
Herc Holdings, Inc. | 2.2 | ||||||
Universal Display Corp. | 2.1 | ||||||
Chart Industries, Inc. | 2.0 | ||||||
MasTec, Inc. | 2.0 | ||||||
Terex Corp. | 1.9 | ||||||
Performance Food Group Co. | 1.9 | ||||||
Shift4 Payments, Inc., Class A | 1.7 | ||||||
PVH Corp. | 1.7 | ||||||
Total | 21.0 | % | |||||
Top five issuer breakdown by country or territory of origin
United States | 98.2 | % | |||||
Israel | 0.9 | ||||||
Canada | 0.8 | ||||||
Switzerland | 0.6 | ||||||
Netherlands | 0.5 | ||||||
Total | 101.0 | % | |||||
Common stocks | |||||||
Banks | 4.0 | % | |||||
Biotechnology | 11.7 | ||||||
Building products | 2.0 | ||||||
Commercial services & supplies | 1.4 | ||||||
Construction & engineering | 3.4 | ||||||
Diversified consumer services | 1.5 | ||||||
Diversified telecommunication services | 0.9 | ||||||
Electrical equipment | 5.2 | ||||||
Equity real estate investment trusts | 2.9 | ||||||
Food & staples retailing | 1.9 | ||||||
Health care equipment & supplies | 5.3 | ||||||
Health care providers & services | 2.2 | ||||||
Health care technology | 1.2 | ||||||
Hotels, restaurants & leisure | 7.0 | ||||||
Household durables | 1.4 | ||||||
Internet & direct marketing retail | 0.4 | ||||||
IT services | 3.8 | ||||||
Life sciences tools & services | 6.8 | ||||||
Machinery | 6.4 | ||||||
Media | 1.5 | ||||||
Pharmaceuticals | 0.7 | ||||||
Semiconductors & semiconductor equipment | 6.6 | ||||||
Software | 9.4 | ||||||
Specialty retail | 3.0 | ||||||
Textiles, apparel & luxury goods | 3.3 | ||||||
Thrifts & mortgage finance | 0.6 | ||||||
Trading companies & distributors | 3.5 | ||||||
Total common stocks | 98.0 | ||||||
Short-term investments | 3.4 | ||||||
Investment of cash collateral from securities loaned | 0.9 | ||||||
Total investments | 102.3 | ||||||
Liabilities in excess of other assets | (2.3 | ) | |||||
Net assets | 100.0 | % | |||||
1 The portfolio is actively managed and its composition will vary over time.
84
UBS U.S. Small Cap Growth Fund
Portfolio of investments
June 30, 2021
| Number of shares | Value | ||||||||||
Common stocks: 98.0% | |||||||||||
Banks: 4.0% | |||||||||||
First Bancorp/Southern Pines NC | 67,633 | $ | 2,766,866 | ||||||||
Veritex Holdings, Inc. | 75,350 | 2,668,143 | |||||||||
Webster Financial Corp. | 57,834 | 3,084,866 | |||||||||
8,519,875 | |||||||||||
Biotechnology: 11.7% | |||||||||||
Allogene Therapeutics, Inc.* | 47,750 | 1,245,320 | |||||||||
ALX Oncology Holdings, Inc.* | 22,143 | 1,210,779 | |||||||||
Arena Pharmaceuticals, Inc.* | 13,146 | 896,557 | |||||||||
Argenx SE, ADR* | 3,462 | 1,042,304 | |||||||||
CareDx, Inc.* | 37,863 | 3,465,222 | |||||||||
CRISPR Therapeutics AG* | 7,600 | 1,230,364 | |||||||||
Dicerna Pharmaceuticals, Inc.* | 39,923 | 1,489,926 | |||||||||
Fate Therapeutics, Inc.* | 15,868 | 1,377,184 | |||||||||
Graphite Bio, Inc.* | 29,615 | 910,069 | |||||||||
Hookipa Pharma, Inc.*,1 | 50,848 | 465,768 | |||||||||
IGM Biosciences, Inc.* | 21,455 | 1,785,056 | |||||||||
Instil Bio, Inc.* | 36,493 | 705,045 | |||||||||
Kronos Bio, Inc.*,1 | 22,045 | 527,978 | |||||||||
Kura Oncology, Inc.* | 53,501 | 1,115,496 | |||||||||
Magenta Therapeutics, Inc.* | 81,171 | 793,852 | |||||||||
MeiraGTx Holdings PLC* | 49,360 | 765,080 | |||||||||
Nurix Therapeutics, Inc.* | 43,889 | 1,164,375 | |||||||||
PMV Pharmaceuticals, Inc.* | 28,272 | 965,772 | |||||||||
Relay Therapeutics, Inc.* | 26,055 | 953,352 | |||||||||
Repare Therapeutics, Inc.*,1 | 25,672 | 800,453 | |||||||||
Xencor, Inc.*,1 | 33,780 | 1,165,072 | |||||||||
Xenon Pharmaceuticals, Inc.* | 49,143 | 915,043 | |||||||||
24,990,067 | |||||||||||
Building products: 2.0% | |||||||||||
AZEK Co., Inc.* | 42,915 | 1,822,171 | |||||||||
Simpson Manufacturing Co., Inc. | 22,521 | 2,487,219 | |||||||||
4,309,390 | |||||||||||
Commercial services & supplies: 1.4% | |||||||||||
ACV Auctions, Inc., Class A* | 29,296 | 750,856 | |||||||||
IAA, Inc.* | 42,425 | 2,313,860 | |||||||||
3,064,716 | |||||||||||
Construction & engineering: 3.4% | |||||||||||
Ameresco, Inc., Class A* | 48,231 | 3,025,048 | |||||||||
MasTec, Inc.* | 39,549 | 4,196,149 | |||||||||
7,221,197 | |||||||||||
Diversified consumer services: 1.5% | |||||||||||
Chegg, Inc.* | 39,359 | 3,271,127 | |||||||||
Diversified telecommunication services: 0.9% | |||||||||||
Bandwidth, Inc., Class A* | 14,163 | 1,953,361 | |||||||||
Electrical equipment: 5.2% | |||||||||||
Generac Holdings, Inc.* | 15,864 | 6,585,940 | |||||||||
Regal Beloit Corp. | 23,975 | 3,200,902 | |||||||||
Shoals Technologies Group, Inc., Class A* | 40,972 | 1,454,506 | |||||||||
11,241,348 | |||||||||||
| Number of shares | Value | ||||||||||
Common stocks—(continued) | |||||||||||
Equity real estate investment trusts: 2.9% | |||||||||||
QTS Realty Trust, Inc., Class A | 34,083 | $ | 2,634,616 | ||||||||
Ryman Hospitality Properties, Inc.* | 46,139 | 3,643,135 | |||||||||
6,277,751 | |||||||||||
Food & staples retailing: 1.9% | |||||||||||
Performance Food Group Co.* | 83,089 | 4,028,986 | |||||||||
Health care equipment & supplies: 5.3% | |||||||||||
AtriCure, Inc.* | 37,009 | 2,935,924 | |||||||||
Bioventus, Inc., Class A* | 62,061 | 1,092,274 | |||||||||
Silk Road Medical, Inc.* | 40,178 | 1,922,919 | |||||||||
Staar Surgical Co.* | 35,991 | 5,488,627 | |||||||||
11,439,744 | |||||||||||
Health care providers & services: 2.2% | |||||||||||
Castle Biosciences, Inc.* | 25,930 | 1,901,447 | |||||||||
LHC Group, Inc.* | 12,565 | 2,516,267 | |||||||||
LifeStance Health Group, Inc.* | 13,583 | 378,422 | |||||||||
4,796,136 | |||||||||||
Health care technology: 1.2% | |||||||||||
Doximity, Inc., Class A* | 4,643 | 270,223 | |||||||||
Inspire Medical Systems, Inc.* | 11,633 | 2,248,193 | |||||||||
2,518,416 | |||||||||||
Hotels, restaurants & leisure: 7.0% | |||||||||||
Bloomin' Brands, Inc.* | 123,748 | 3,358,521 | |||||||||
Churchill Downs, Inc. | 13,332 | 2,643,202 | |||||||||
Dave & Buster's Entertainment, Inc.* | 77,768 | 3,157,381 | |||||||||
Planet Fitness, Inc., Class A* | 34,475 | 2,594,244 | |||||||||
Six Flags Entertainment Corp.* | 73,793 | 3,193,761 | |||||||||
14,947,109 | |||||||||||
Household durables: 1.4% | |||||||||||
TopBuild Corp.* | 15,232 | 3,012,585 | |||||||||
Internet & direct marketing retail: 0.4% | |||||||||||
Xometry, Inc. Class A* | 9,810 | 857,296 | |||||||||
IT services: 3.8% | |||||||||||
Digitalocean Holdings, Inc.* | 45,372 | 2,522,230 | |||||||||
Shift4 Payments, Inc., Class A* | 39,919 | 3,741,209 | |||||||||
Wix.com Ltd.* | 6,712 | 1,948,359 | |||||||||
8,211,798 | |||||||||||
Life sciences tools & services: 6.8% | |||||||||||
Maravai LifeSciences Holdings, Inc., Class A* | 82,501 | 3,442,767 | |||||||||
Medpace Holdings, Inc.* | 18,248 | 3,223,144 | |||||||||
NanoString Technologies, Inc.* | 32,807 | 2,125,566 | |||||||||
NeoGenomics, Inc.* | 49,000 | 2,213,330 | |||||||||
Olink Holding AB, ADR* | 25,300 | 870,826 | |||||||||
Repligen Corp.* | 13,328 | 2,660,535 | |||||||||
14,536,168 | |||||||||||
85
UBS U.S. Small Cap Growth Fund
Portfolio of investments
June 30, 2021
| Number of shares | Value | ||||||||||
Common stocks—(continued) | |||||||||||
Machinery: 6.4% | |||||||||||
Altra Industrial Motion Corp. | 45,971 | $ | 2,989,034 | ||||||||
Astec Industries, Inc. | 37,240 | 2,343,886 | |||||||||
Chart Industries, Inc.* | 29,632 | 4,335,754 | |||||||||
Terex Corp. | 86,176 | 4,103,701 | |||||||||
13,772,375 | |||||||||||
Media: 1.5% | |||||||||||
Magnite, Inc.*,1 | 96,254 | 3,257,235 | |||||||||
Pharmaceuticals: 0.7% | |||||||||||
Revance Therapeutics, Inc.* | 47,550 | 1,409,382 | |||||||||
Semiconductors & semiconductor equipment: 6.6% | |||||||||||
Brooks Automation, Inc. | 37,451 | 3,568,331 | |||||||||
Lattice Semiconductor Corp.* | 48,243 | 2,710,292 | |||||||||
MaxLinear, Inc.* | 75,317 | 3,200,219 | |||||||||
Universal Display Corp. | 20,609 | 4,581,999 | |||||||||
14,060,841 | |||||||||||
Software: 9.4% | |||||||||||
Alteryx, Inc., Class A* | 19,962 | 1,717,131 | |||||||||
Everbridge, Inc.* | 14,204 | 1,932,880 | |||||||||
Jamf Holding Corp.* | 82,356 | 2,764,691 | |||||||||
LivePerson, Inc.*,1 | 32,720 | 2,069,213 | |||||||||
Olo, Inc., Class A* | 29,073 | 1,087,039 | |||||||||
Rapid7, Inc.* | 32,477 | 3,073,299 | |||||||||
SentinelOne, Inc., Class A* | 44,147 | 1,876,248 | |||||||||
Sumo Logic, Inc.*,1 | 50,365 | 1,040,037 | |||||||||
Tenable Holdings, Inc.* | 55,956 | 2,313,781 | |||||||||
Viant Technology, Inc., Class A* | 12,387 | 368,885 | |||||||||
Vonage Holdings Corp.* | 130,932 | 1,886,730 | |||||||||
20,129,934 | |||||||||||
Specialty retail: 3.0% | |||||||||||
Children's Place, Inc.* | 37,550 | 3,494,403 | |||||||||
National Vision Holdings, Inc.* | 58,740 | 3,003,376 | |||||||||
6,497,779 | |||||||||||
| Number of shares | Value | ||||||||||
Common stocks—(concluded) | |||||||||||
Textiles, apparel & luxury goods: 3.3% | |||||||||||
PVH Corp.* | 34,545 | $ | 3,716,696 | ||||||||
Tapestry, Inc.* | 75,820 | 3,296,654 | |||||||||
7,013,350 | |||||||||||
Thrifts & mortgage finance: 0.6% | |||||||||||
Essent Group Ltd. | 27,217 | 1,223,404 | |||||||||
Trading companies & distributors: 3.5% | |||||||||||
Boise Cascade Co. | 47,377 | 2,764,448 | |||||||||
Herc Holdings, Inc.* | 41,772 | 4,681,388 | |||||||||
7,445,836 | |||||||||||
| Total common stocks (cost $141,480,197) | 210,007,206 | ||||||||||
Short-term investments: 3.4% | |||||||||||
Investment companies: 3.4% | |||||||||||
| State Street Institutional U.S. Government Money Market Fund, 0.030%2 (cost $7,162,467) | 7,162,467 | 7,162,467 | |||||||||
Investment of cash collateral from securities loaned: 0.9% | |||||||||||
Money market funds: 0.9% | |||||||||||
| State Street Navigator Securities Lending Government Money Market Portfolio, 0.020%2 (cost $1,915,599) | 1,915,599 | 1,915,599 | |||||||||
| Total investments (cost $150,558,263)—102.3% | 219,085,272 | ||||||||||
Liabilities in excess of other assets: (2.3)% | (4,846,867 | ) | |||||||||
Net assets: 100.0% | $ | 214,238,405 | |||||||||
For a listing of defined portfolio acronyms that are used throughout the Portfolio of investments as well as the tables that follow, please refer to the Glossary of terms used in the Portfolio of investments.
86
UBS U.S. Small Cap Growth Fund
Portfolio of investments
June 30, 2021
Fair valuation summary
The following is a summary of the fair valuations according to the inputs used as of June 30, 2021 in valuing the Fund's investments. In the event a Fund holds investments (other than a money market fund) for which fair value is measured using the NAV per share practical expedient (or its equivalent), a separate column will be added to the fair value hierarchy table; this is intended to permit reconciliation to the amounts presented in the Portfolio of investments:
Description | Unadjusted quoted prices in active markets for identical investments (Level 1) | Other significant observable inputs (Level 2) | Unobservable inputs (Level 3) | Total | |||||||||||||||
Assets | |||||||||||||||||||
Common stocks | $ | 210,007,206 | $ | — | $ | — | $ | 210,007,206 | |||||||||||
Short-term investments | — | 7,162,467 | — | 7,162,467 | |||||||||||||||
Investment of cash collateral from securities loaned | — | 1,915,599 | — | 1,915,599 | |||||||||||||||
Total | $ | 210,007,206 | $ | 9,078,066 | $ | — | $ | 219,085,272 | |||||||||||
At June 30, 2021, there were no transfers in or out of Level 3.
Portfolio footnotes
* Non-income producing security.
1 Security, or portion thereof, was on loan at the period end.
2 Rates shown reflect yield at June 30, 2021.
See accompanying notes to financial statements.
87
UBS Municipal Bond Fund
Portfolio performance
For the 12 months ended June 30, 2021, Class A shares of UBS Municipal Bond Fund (the "Fund") returned 2.82% (Class A shares returned 0.50% after the deduction of the maximum sales charge), while Class P shares returned 2.99%. For comparison purposes, the Fund's benchmark, the Bloomberg Barclays Municipal Bond Index (the "Index"), returned 4.17%, and the Bloomberg Barclays Municipal Managed Money Intermediate (1-17) Index returned 2.37% over the same time period. (Class P shares have lower expenses than the other share class of the Fund. Returns for all share classes over various time periods are shown on page 89; please note that the Fund's returns do not reflect the deduction of taxes that a shareholder could pay on Fund distributions or the redemption of Fund shares, while the Index returns do not reflect the deduction of fees and expenses.)
The Fund posted a positive return during the reporting period, but underperformed its benchmark. This was partially due to the Fund's quality biases and yield curve positioning.
Portfolio performance summary1
What worked:
• Yield curve positioning along some portions of the curve contributed to performance. In particular, an overweight to the 20 year portion of the curve, along with underweights to the three- and five-year portions of the curve, were beneficial for relative performance. (The yield curve plots the interest rates, at a set point in time, of bonds having equal credit quality, but differing maturity dates.)
• Our quality biases were positive in certain ratings categories. An overweight to relatively higher quality A-rated securities was positive for relative results
• Overweights to the leasing and transportation sectors were beneficial for results.
What didn't work:
• Yield curve positioning, overall, detracted from performance. Having an underweight to the 22+ year portion of the curve was negative for relative results, as was an overweight to the 10-year portion of the curve.
• An underweight to lower quality BBB-rated securities was a headwind for returns. Overweights to AA-rated and AAA-rated securities were also drags on relative returns.
• Underweights in the hospital and industrial development revenue/polution control revenue sectors detracted from relative performance, as did an overweight to general obligation bonds.
• The Fund did not invest in derivatives during the reporting period.
This letter is intended to assist shareholders in understanding how the Fund performed during the 12 months ended June 30, 2021. The views and opinions in the letter were current as of August 12, 2021. They are not guarantees of future performance or investment results and should not be taken as investment advice. Investment decisions reflect a variety of factors, and we reserve the right to change our views about individual securities, sectors and markets at any time. As a result, the views expressed should not be relied upon as a forecast of the Fund's future investment intent. We encourage you to consult your financial advisor regarding your personal investment program.
Mutual funds are sold by prospectus only. You should read it carefully and consider a fund's investment objectives, risks, charges, expenses and other important information contained in the prospectus before investing. Prospectuses for most of our funds can be obtained from your financial advisor, by calling UBS Funds at 800-647 1568 or by visiting our Web site at www.ubs.com.
1 For a detailed commentary on the market environment in general during the reporting period, see page 3.
88
UBS Municipal Bond Fund
Average annual total returns for periods ended 06/30/21 (unaudited)
1 year | 5 years | Inception1 | |||||||||||||
Before deducting maximum sales charge | |||||||||||||||
Class A2 | 2.82 | % | 2.54 | % | 3.10 | % | |||||||||
Class P3 | 2.99 | 2.78 | 3.35 | ||||||||||||
After deducting maximum sales charge | |||||||||||||||
Class A2 | 0.50 | % | 2.07 | % | 2.75 | % | |||||||||
Bloomberg Barclays Municipal Bond Index4 | 4.17 | 3.25 | 3.75 | ||||||||||||
Bloomberg Barclays Municipal Managed Money Intermediate (1-17) Index5 | 2.37 | 2.88 | 3.41 | ||||||||||||
The annualized gross and net expense ratios, respectively, for each class of shares as in the October 28, 2020 prospectuses were as follows: Class A—1.00% and 0.65%; Class P—0.74% and 0.40%. Net expenses reflect fee waivers and/or expense reimbursements, if any, pursuant to an agreement that is in effect to cap the expenses. The Trust, with respect to the Fund, and UBS Asset Management (Americas) Inc., the Fund's investment advisor ("UBS AM (Americas)" or the "Advisor"), have entered into a written agreement pursuant to which the Advisor has agreed to waive a portion of its management fees and/or to reimburse expenses (excluding expenses incurred through investment in other investment companies, interest, taxes, brokerage commissions and extraordinary expenses) to the extent necessary so that the Fund's ordinary operating expenses (excluding expenses incurred through investment in other investment companies, interest, taxes, brokerage commissions and extraordinary expenses), through the period ending October 28, 2021, do not exceed 0.65% for Class A shares and 0.40% for Class P shares. Pursuant to the written agreement, the Advisor is entitled to be reimbursed for any fees it waives and expenses it reimburses to the extent such reimbursement can be made during the three fiscal years following the date on which such fee waivers and expense reimbursements were made, provided that the reimbursement of the Advisor by the Fund will not cause the Fund to exceed the lesser of any applicable expense limit that is in place for the Fund (i) at the time of the waiver or reimbursement, or (ii) at the time of the recoupment. The fee waiver/expense reimbursement agreement may be terminated by the Fund's Board of Trustees at any time and also will terminate automatically upon the expiration or termination of the Fund's advisory contract with the Advisor. Upon termination of the fee waiver/expense reimbursement agreement, however, UBS AM (Americas)'s three year recoupment rights will survive.
1 Inception date of all shares of UBS Municipal Bond Fund and the indices is November 10, 2014.
2 Maximum sales charge for Class A shares is 2.25%. Class A shares bear ongoing 12b-1 service fees.
3 Class P shares do not bear initial or contingent deferred sales charges or ongoing 12b-1 service and distribution fees, but Class P shares held through advisory programs may be subject to a program fee, which, if included, would have reduced performance.
4 The Bloomberg Barclays Municipal Bond Index is an unmanaged index designed to measure the total return of the US dollar denominated tax exempt bond market. Investors should note that indices do not reflect the deduction of fees and expenses.
5 The Bloomberg Barclays Municipal Managed Money Intermediate (1-17) Index is an unmanaged sub-index of the Barclays Municipal Managed Money Index, which is a rules-based, market-value-weighted index designed to track the performance of municipal securities issued by state and local municipalities whose interest is exempt from federal income tax and the federal alternative minimum tax. Investors should note that indices do not reflect the deduction of fees and expenses.
Past performance does not predict future performance, and the performance information provided does not reflect the deduction of taxes that a shareholder could pay on Fund distributions or the redemption of Fund shares. The return and principal value of an investment will fluctuate, so that an investor's shares, when redeemed, may be worth more or less than their original cost. Performance results assume reinvestment of all dividends and capital gain distributions at net asset value on the ex-dividend dates. Current performance may be higher or lower than the performance data quoted. For month-end performance figures, please visit www.ubs.com/us-mutualfundperformance.
89
UBS Municipal Bond Fund
Illustration of an assumed investment of $10,000 in Class A shares (adjusted for 2.25% maximum sales charge) and $5,000,000 in Class P shares (unaudited)
The following two graphs depict the performance of UBS Municipal Bond Fund Class A and Class P shares versus the Bloomberg Barclays Municipal Bond Index and Bloomberg Barclays Municipal Managed Money Intermediate (1-17) Index from November 10, 2014, which is the inception date of the two classes, through June 30, 2021. The performance provided does not reflect the deduction of taxes that a shareholder could pay on Fund distributions or the redemption of Fund shares. Past performance is no guarantee of future results. Share price and returns will vary with market conditions; investors may realize a gain or loss upon redemption.
UBS Municipal Bond Fund Class A vs. Barclays Municipal Bond Index and Barclays Municipal Managed Money Intermediate (1-17) Index
Wealth value with dividends reinvested. Initial investment for Class A Shares as of November 10, 2014 = $9,775
The Fund's growth of an assumed $10,000 investment is adjusted for the maximum sales charge of 2.25%.

UBS Municipal Bond Fund Class P vs. Barclays Municipal Bond Index and Barclays Municipal Managed Money Intermediate (1-17) Index
Wealth value with dividends reinvested. Initial investment for Class P shares as of November 10, 2014 = $2,000,000

Past performance does not predict future performance, and the performance information provided does not reflect the deduction of taxes that a shareholder could pay on Fund distributions or the redemption of Fund shares. The return and principal value of an investment will fluctuate, so that an investor's shares, when redeemed, may be worth more or less than their original cost. Performance results assume reinvestment of all dividends and capital gain distributions at net asset value on the ex-dividend dates. Current performance may be higher or lower than the performance data quoted. For month-end performance figures, please visit www.ubs.com/us-mutualfundperformance.
90
UBS Municipal Bond Fund
Portfolio statistics and industry diversification—(unaudited)1
Summary of municipal securities by state
as a percentage of net assets as of June 30, 2021
Municipal bonds | |||||||
Arizona | 3.0 | % | |||||
California | 1.4 | ||||||
Colorado | 2.7 | ||||||
Connecticut | 6.3 | ||||||
District of Columbia | 1.7 | ||||||
Florida | 8.3 | ||||||
Georgia | 4.8 | ||||||
Illinois | 8.5 | ||||||
Maryland | 3.4 | ||||||
Massachusetts | 6.4 | ||||||
Michigan | 3.0 | ||||||
Mississippi | 0.3 | ||||||
Nevada | 2.0 | ||||||
New Jersey | 3.6 | ||||||
New York | 16.0 | ||||||
Ohio | 1.3 | ||||||
Oregon | 1.6 | ||||||
Pennsylvania | 6.0 | ||||||
South Carolina | 1.0 | ||||||
Texas | 14.9 | ||||||
Virginia | 1.1 | ||||||
Washington | 3.2 | ||||||
Wisconsin | 0.3 | ||||||
Total municipal bonds | 100.8 | ||||||
Short-term investments | 0.2 | ||||||
Total investments | 101.0 | ||||||
Other assets in excess of liabilities | (1.0 | ) | |||||
Net assets | 100.0 | % | |||||
1 The portfolio is actively managed and its composition will vary over time.
91
UBS Municipal Bond Fund
Portfolio of investments
June 30, 2021
| Face amount | Value | ||||||||||
Municipal bonds: 100.8% | |||||||||||
Arizona: 3.0% | |||||||||||
| Arizona Industrial Development Authority, (Phoenix Children's), Refunding, Revenue Bonds, Series A,1 0.030%, due 02/01/48 | $ | 2,100,000 | $ | 2,100,000 | |||||||
| Salt River Project Agricultural Improvement & Power District, Refunding, Revenue Bonds, Series A, 5.000%, due 01/01/45 | 1,000,000 | 1,310,137 | |||||||||
3,410,137 | |||||||||||
California: 1.4% | |||||||||||
| State of California, GO Bonds 5.000%, due 03/01/35 | 1,000,000 | 1,306,916 | |||||||||
| Series A3, 0.010%, due 05/01/341 | 255,000 | 255,000 | |||||||||
1,561,916 | |||||||||||
Colorado: 2.7% | |||||||||||
| Denver City & County School District No. 1, GO Bonds 5.000%, due 12/01/21 | 1,000,000 | 1,020,275 | |||||||||
| University of Colorado, Refunding, Revenue Bonds, Series B-1,1 0.030%, due 06/01/50 | 2,000,000 | 2,000,000 | |||||||||
3,020,275 | |||||||||||
Connecticut: 6.3% | |||||||||||
| State of Connecticut Special Tax Revenue, (Transportation Infrastructure), Revenue Bonds, Series A, 5.000%, due 01/01/30 | 1,665,000 | 2,080,327 | |||||||||
| State of Connecticut, GO Bonds, Series A, 5.000%, due 04/15/25 | 1,250,000 | 1,465,271 | |||||||||
| Series C, 5.000%, due 06/15/23 | 1,000,000 | 1,094,387 | |||||||||
| State of Connecticut, Refunding, GO Bonds, Series F, 5.000%, due 09/15/25 | 2,140,000 | 2,544,001 | |||||||||
7,183,986 | |||||||||||
District of Columbia: 1.7% | |||||||||||
| District of Columbia, Revenue Bonds, Series A, 5.000%, due 03/01/31 | 1,465,000 | 1,918,714 | |||||||||
Florida: 8.3% | |||||||||||
| Miami-Dade County Transit System, Revenue Bonds, Series A, 5.000%, due 07/01/43 | 1,000,000 | 1,286,751 | |||||||||
| Miami-Dade County, Refunding, Revenue Bonds 5.000%, due 10/01/26 | 1,000,000 | 1,222,403 | |||||||||
| Face amount | Value | ||||||||||
Municipal bonds—(continued) | |||||||||||
Florida—(concluded) | |||||||||||
| Palm Beach County School District, Refunding, COP, Series B, 5.000%, due 08/01/31 | $ | 1,000,000 | $ | 1,173,338 | |||||||
| School Board of Miami-Dade County, Refunding, COP, Series A, 5.000%, due 05/01/31 | 1,000,000 | 1,157,467 | |||||||||
| School District of Broward County, Refunding, COP, Series B, 5.000%, due 07/01/30 | 2,000,000 | 2,337,071 | |||||||||
| St. Lucie County School Board, Refunding, Revenue Bonds, AGM 5.000%, due 10/01/26 | 1,020,000 | 1,212,456 | |||||||||
| State of Florida, Refunding, GO Bonds, Series A, 5.000%, due 07/01/24 | 935,000 | 1,066,997 | |||||||||
9,456,483 | |||||||||||
Georgia: 4.8% | |||||||||||
| Brookhaven Development Authority, (Children's Healthcare of Atlanta), Revenue Bonds, Series A, 5.000%, due 07/01/29 | 1,500,000 | 1,971,016 | |||||||||
| Catoosa County School District, GO Bonds 2 5.000%, due 08/01/26 | 2,000,000 | 2,433,855 | |||||||||
| County of Fulton GA, Revenue Notes 1.250%, due 12/31/21 | 1,000,000 | 1,005,902 | |||||||||
5,410,773 | |||||||||||
Illinois: 8.5% | |||||||||||
| Chicago O'Hare International Airport, Refunding, Revenue Bonds, Series B, 5.000%, due 01/01/30 | 1,000,000 | 1,151,423 | |||||||||
| Series B, 5.000%, due 01/01/31 | 1,050,000 | 1,208,994 | |||||||||
| Illinois Finance Authority, (Clean Water Initiative Revolving Fund), Revenue Bonds 5.000%, due 07/01/37 | 1,000,000 | 1,283,043 | |||||||||
| Illinois Finance Authority, (OSF Healthcare System), Revenue Bonds, Series A, 5.000%, due 05/15/23 | 1,405,000 | 1,463,930 | |||||||||
| Illinois State Toll Highway Authority, Revenue Bonds, Series B, 5.000%, due 01/01/27 | 1,000,000 | 1,219,086 | |||||||||
| Railsplitter Tobacco Settlement Authority, Revenue Bonds 5.000%, due 06/01/25 | 1,235,000 | 1,447,727 | |||||||||
92
UBS Municipal Bond Fund
Portfolio of investments
June 30, 2021
| Face amount | Value | ||||||||||
Municipal bonds—(continued) | |||||||||||
Illinois—(concluded) | |||||||||||
| State of Illinois, GO Bonds, Series C, 4.000%, due 03/01/31 | $ | 1,500,000 | $ | 1,823,918 | |||||||
9,598,121 | |||||||||||
Maryland: 3.4% | |||||||||||
| County of Anne Arundel MD, (Consolidated Water and Sewer), GO Bonds, Series B, 5.000%, due 10/01/38 | 1,000,000 | 1,301,484 | |||||||||
| State of Maryland, GO Bonds, Series A, 5.000%, due 08/01/30 | 1,000,000 | 1,312,451 | |||||||||
| Washington Suburban Sanitary Commission, (Consolidated Public Improvement), Revenue Bonds 5.000%, due 06/01/29 | 1,000,000 | 1,278,163 | |||||||||
3,892,098 | |||||||||||
Massachusetts: 6.4% | |||||||||||
| Commonwealth of Massachusetts, (Consolidated Loan), GO Bonds 5.000%, due 07/01/45 | 4,000,000 | 5,140,657 | |||||||||
| Commonwealth of Massachusetts, GO Bonds, Series A, 5.000%, due 01/01/40 | 1,500,000 | 1,858,514 | |||||||||
| Massachusetts Health & Educational Facilities Authority, (Harvard University), Revenue Bonds, Series R,1 0.030%, due 11/01/49 | 200,000 | 200,000 | |||||||||
7,199,171 | |||||||||||
Michigan: 3.0% | |||||||||||
| Michigan Finance Authority, (Trinity Health Credit Group Hospital), Refunding, Revenue Bonds, Series A, 5.000%, due 12/01/35 | 1,000,000 | 1,247,784 | |||||||||
| Michigan State Building Authority, Refunding, Revenue Bonds, Series I, 5.000%, due 10/15/29 | 1,800,000 | 2,188,125 | |||||||||
3,435,909 | |||||||||||
Mississippi: 0.3% | |||||||||||
| Mississippi Business Finance Corp., (Chevron USA, Inc.), Revenue Bonds, Series G, 0.010%, due 11/01/351 | 200,000 | 200,000 | |||||||||
| Series L, 0.010%, due 11/01/351 | 100,000 | 100,000 | |||||||||
300,000 | |||||||||||
| Face amount | Value | ||||||||||
Municipal bonds—(continued) | |||||||||||
Nevada: 2.0% | |||||||||||
| County of Clark NV Passenger Facility Charge Revenue, (Las Vegas-McCarran International Airport), Refunding, Revenue Bonds, Series C, 5.000%, due 07/01/27 | $ | 1,815,000 | $ | 2,271,983 | |||||||
New Jersey: 3.6% | |||||||||||
| New Jersey Transportation Trust Fund Authority, Refunding, Revenue Bonds, Series A, 5.000%, due 06/15/30 | 1,000,000 | 1,296,510 | |||||||||
| New Jersey Transportation Trust Fund Authority, Revenue Bonds, Series AA, 5.000%, due 06/15/27 | 1,500,000 | 1,633,001 | |||||||||
| New Jersey Turnpike Authority, Revenue Bonds, Series A, 5.000%, due 01/01/27 | 1,000,000 | 1,136,663 | |||||||||
4,066,174 | |||||||||||
New York: 16.0% | |||||||||||
| City of New York, GO Bonds, Series B-1, 5.000%, due 10/01/42 | 1,200,000 | 1,520,864 | |||||||||
| Subseries F-1, 5.000%, due 04/01/40 | 1,000,000 | 1,231,776 | |||||||||
| New York City Transitional Finance Authority Future Tax Secured Revenue, Revenue Bonds, Series A-4,1 0.020%, due 08/01/43 | 130,000 | 130,000 | |||||||||
| New York City Transitional Finance Authority Future Tax Secured, Revenue Bonds, Series A-2, 5.000%, due 08/01/38 | 1,000,000 | 1,242,300 | |||||||||
| Series A-3, 0.020%, due 08/01/431 | 400,000 | 400,000 | |||||||||
| New York City Water & Sewer System, (Second General Resolution), Refunding, Revenue Bonds, Series EE, 5.000%, due 06/15/40 | 1,000,000 | 1,245,168 | |||||||||
| Series EE2, 5.000%, due 06/15/40 | 1,200,000 | 1,536,601 | |||||||||
| Series FF, 5.000%, due 06/15/39 | 2,000,000 | 2,521,101 | |||||||||
| New York State Dormitory Authority, Refunding, Revenue Bonds, Series A, 5.000%, due 03/15/44 | 1,000,000 | 1,298,481 | |||||||||
93
UBS Municipal Bond Fund
Portfolio of investments
June 30, 2021
| Face amount | Value | ||||||||||
Municipal bonds—(continued) | |||||||||||
New York—(concluded) | |||||||||||
| New York State Dormitory Authority, Revenue Bonds, Series A, 5.000%, due 03/15/43 | $ | 1,500,000 | $ | 1,871,488 | |||||||
| New York State Urban Development Corp., Refunding, Revenue Bonds, Series A, 5.000%, due 03/15/41 | 4,060,000 | 5,173,841 | |||||||||
18,171,620 | |||||||||||
Ohio: 1.3% | |||||||||||
| State of Ohio, GO Bonds, Series A, 5.000%, due 06/15/30 | 1,110,000 | 1,485,832 | |||||||||
Oregon: 1.6% | |||||||||||
| Tri-County Metropolitan Transportation District of Oregon, Revenue Bonds, Series A, 5.000%, due 09/01/43 | 1,500,000 | 1,849,700 | |||||||||
Pennsylvania: 6.0% | |||||||||||
| Allegheny County Higher Education Building Authority, (Carnegie Mellon University), Refunding, Revenue Bonds, Series C,1 0.010%, due 12/01/37 | 200,000 | 200,000 | |||||||||
| Commonwealth Financing Authority, (Tobacco Master Settlement Payment), Revenue Bonds 5.000%, due 06/01/24 | 1,625,000 | 1,838,314 | |||||||||
| Pennsylvania Turnpike Commission, Refunding, Revenue Bonds, 2nd Series, 5.000%, due 12/01/30 | 1,750,000 | 2,180,169 | |||||||||
| Series 2017-3, 5.000%, due 12/01/28 | 1,000,000 | 1,255,599 | |||||||||
| Series A-2, 5.000%, due 12/01/28 | 1,000,000 | 1,266,291 | |||||||||
6,740,373 | |||||||||||
South Carolina: 1.0% | |||||||||||
| South Carolina Public Service Authority, Refunding, Revenue Bonds, Series A, 5.000%, due 12/01/26 | 1,010,000 | 1,175,781 | |||||||||
Texas: 14.9% | |||||||||||
| Board of Regents of the University of Texas System, Refunding, Revenue Bonds, Series A, 5.000%, due 08/15/38 | 1,000,000 | 1,285,416 | |||||||||
| County of Williamson TX, GO Bonds 5.000%, due 02/15/29 | 1,000,000 | 1,300,796 | |||||||||
| Face amount | Value | ||||||||||
Municipal bonds—(concluded) | |||||||||||
Texas—(concluded) | |||||||||||
| Dallas and Fort Worth International Airport, Refunding, Revenue Bonds, Series A, 5.000%, due 11/01/29 | $ | 1,100,000 | $ | 1,450,403 | |||||||
| Lower Colorado River Authority, (LCRA Transmission Services), Refunding, Revenue Bonds 5.000%, due 05/15/31 | 1,000,000 | 1,282,272 | |||||||||
| North Texas Tollway Authority, (Second Tier), Refunding, Revenue Bonds, Series B, 5.000%, due 01/01/29 | 1,140,000 | 1,468,522 | |||||||||
| North Texas Tollway Authority, Refunding, Revenue Bonds, Series A, 5.000%, due 01/01/27 | 3,030,000 | 3,376,121 | |||||||||
| State of Texas, GO Bonds, Series B, 5.000%, due 08/01/21 | 350,000 | 351,372 | |||||||||
| State of Texas, Revenue Notes 4.000%, due 08/26/21 | 6,360,000 | 6,398,186 | |||||||||
16,913,088 | |||||||||||
Virginia: 1.1% | |||||||||||
| County of Fairfax VA, GO Bonds, Series A, 5.000%, due 10/01/29 | 1,000,000 | 1,243,376 | |||||||||
Washington: 3.2% | |||||||||||
| State of Washington, GO Bonds, Series B, 5.000%, due 06/01/27 | 2,905,000 | 3,635,944 | |||||||||
Wisconsin: 0.3% | |||||||||||
| Wisconsin Health & Educational Facilities Authority, (Marshfield Clinic Health), Revenue Bonds, Series A,1 0.010%, due 02/15/50 | 300,000 | 300,000 | |||||||||
| Total municipal bonds (cost $108,878,102) | 114,241,454 | ||||||||||
| Number of shares | |||||||||||
Short-term investments: 0.2% | |||||||||||
Investment companies: 0.2% | |||||||||||
| State Street Institutional U.S. Government Money Market Fund, 0.030%3 (cost $190,568) | 190,568 | 190,568 | |||||||||
| Total investments (cost $109,068,670)—101.0% | 114,432,022 | ||||||||||
Liabilities in excess of other assets: (1.0)% | (1,173,980 | ) | |||||||||
Net assets: 100.0% | $ | 113,258,042 | |||||||||
94
UBS Municipal Bond Fund
Portfolio of investments
June 30, 2021
For a listing of defined portfolio acronyms that are used throughout the Portfolio of investments as well as the tables that follow, please refer to the Glossary of terms used in the Portfolio of investments.
Fair valuation summary
The following is a summary of the fair valuations according to the inputs used as of June 30, 2021 in valuing the Fund's investments. In the event a Fund holds investments (other than a money market fund) for which fair value is measured using the NAV per share practical expedient (or its equivalent), a separate column will be added to the fair value hierarchy table; this is intended to permit reconciliation to the amounts presented in the Portfolio of investments.
Description | Unadjusted quoted prices in active markets for identical investments (Level 1) | Other significant observable inputs (Level 2) | Unobservable inputs (Level 3) | Total | |||||||||||||||
Assets | |||||||||||||||||||
Municipal bonds | $ | — | $ | 114,241,454 | $ | — | $ | 114,241,454 | |||||||||||
Short-term investments | — | 190,568 | — | 190,568 | |||||||||||||||
Total | $ | — | $ | 114,432,022 | $ | — | $ | 114,432,022 | |||||||||||
At June 30, 2021, there were no transfers in or out of Level 3.
Portfolio footnotes
1 Variable or floating rate security. The interest rate shown is the rate in effect as of period end and changes periodically.
2 Security purchased on a when-issued basis. When-issued refers to a transaction made conditionally because a security, although authorized, has not yet been issued.
3 Rates shown reflect yield at June 30, 2021.
See accompanying notes to financial statements
95
UBS Sustainable Development Bank Bond Fund
Portfolio Performance
For the 12 months ended June 30, 2021 (the "reporting period"), Class P shares of UBS Sustainable Development Bank Bond Fund (the "Fund") returned -1.70%,while Class P2 shares returned -1.34% from their inception date of October 30, 2020. For comparison purposes, the Bloomberg Barclays U.S. Treasury Index (the "Index") returned -3.22%. The Fund's secondary benchmark, the Solactive Global Multilateral Development Bank Bond USD 40% 1-5 Year 60% 5-10 Year Total Return Index, retuned -1.46% during the reporting period. Please note that the Fund's returns do not reflect the deduction of taxes that a shareholder would pay on the redemption of Fund shares, while index returns do not reflect the deduction of fees and expenses.
Fund Overview
The Fund seeks current income. Under normal circumstances, the Fund invests at least 80% of its net assets in bonds and/or instruments that provide exposure to bonds issued by development banks. Development banks are financial organizations formed by government entities to promote economic and social development.
The development bank bond market typically follows high-quality US government bonds. As each of the global Multilateral Development Banks ("MDB") are supranational entities backed by multiple member governments, MDBs historically have a similar credit profile to major sovereign issuers, such as the US government. Consequently, MDB bonds have generally delivered comparable returns to US Treasurys.
Market review
After a very volatile first half of 2020, financial markets calmed down as the reporting period progressed. With countries coming out of their lockdowns and many more restrictions lifted, global economies experienced strong recoveries. Financial markets continued their recovery as well. Against this backdrop, both the equity and corporate bond markets generated positive performance.
The positive risk sentiment led US yields higher from their very low levels reached in early 2020. With global central banks still very accommodative, the upward move in yields was very gradual. At the beginning of 2021, the move up in yields picked up some pace. The ongoing recovery, as well as rising inflation rates, caused some uncertainty as to how long central banks and especially the Federal Reserve can or will hold on to their very loose policy. The direction of yields changed towards the end or the reporting period. With some forward-looking economic indicators stabilizing and central banks reluctant to change their policy too fast, investors readjusted their expectations downward.
In this risk friendly environment, US Treasurys underperformed riskier parts of the US fixed income markets. Ten-year US Treasury yields rose from 0.66% at the start of the reporting period to 1.45%. Sustainable development banks (SDB) were able to outperform US Treasurys during the reporting period. The risk-on sentiment led to a tightening of credit spreads of SDB bonds versus Treasurys.
96
UBS Sustainable Development Bank Bond Fund
Portfolio performance summary
The Fund is passively managed and seeks to minimize tracking error relative to its secondary benchmark (before fees and expenses), which is constructed from a blend of two market indexes designed to measure the performance of the US dollar-denominated multilateral development bank bond market. During the reporting period, the Fund generated relatively flat performance relative to its secondary benchmark. Transaction costs associated with the management of the Fund's portfolio, as well as fees and expenses were covered by outperformance of some out-of-benchmark holdings. Additionally, the performance deviation between the Fund and the primary index is explained by the longer duration of the Index, as well as a slightly higher credit-quality.
• The Fund did not invest in derivatives during the reporting period.
This letter is intended to assist shareholders in understanding how the Fund performed during the 12 months ended June 30, 2021. The views and opinions in the letter were current as of August 12, 2021. They are not guarantees of future performance or investment results and should not be taken as investment advice. Investment decisions reflect a variety of factors, and we reserve the right to change our views about individual securities, sectors and markets at any time. As a result, the views expressed should not be relied upon as a forecast of the Fund's future investment intent. We encourage you to consult your financial advisor regarding your personal investment program.
Mutual funds are sold by prospectus only. You should read it carefully and consider a fund's investment objectives, risks, charges, expenses and other important information contained in the prospectus before investing. Prospectuses for most of our funds can be obtained from your financial advisor, by calling UBS Funds at (800) 647 1568 or by visiting our website at www.ubs.com/am-us.
97
UBS Sustainable Development Bank Bond Fund
Average annual total returns for periods ended 06/30/21 (unaudited)
1 year | Inception1 | ||||||||||
Class P2 | (1.70 | )% | 14.42 | % | |||||||
Class P25 | N/A | (1.34 | ) | ||||||||
Bloomberg Barclays U.S. Treasury Index3 | (3.22 | ) | 4.74 | ||||||||
Solactive UBS Global Multilateral Development Bank Bond USD 40% 1-5 Year 60% 5-10 Year Total Return Index.4 | (1.46 | ) | 5.45 | ||||||||
The annualized gross and net expense ratios, respectively, for each class of shares as in the October 28, 2020 prospectuses were as follows: Class P—1.07% and 0.25%. Net expenses reflect fee waivers and/or expense reimbursements, if any, pursuant to an agreement that is in effect to cap the expenses. The Trust, with respect to the Fund, and UBS Asset Management (Americas) Inc., the Fund's investment advisor and administrator ("UBS AM (Americas)" or the "Advisor"), have entered into a written agreement pursuant to which the Advisor has agreed to waive a portion of its management fees and/or to reimburse expenses (excluding expenses incurred through investment in other investment companies, interest, taxes, brokerage commissions and extraordinary expenses) to the extent necessary so that the Fund's ordinary operating expenses (excluding expenses incurred through investment in other investment companies, interest, taxes, brokerage commissions and extraordinary expenses), through the period ending October 28, 2021, do not exceed 0.25% for Class P shares and 0.15% for Class P2 shares. Pursuant to the written agreement, the Advisor is entitled to be reimbursed for any fees it waives and expenses it reimburses to the extent such reimbursement can be made during the three fiscal years following the date on which such fee waivers and expense reimbursements were made, provided that the reimbursement of the Advisor by the Fund will not cause the Fund to exceed the lesser of any applicable expense limit that is in place for the Fund (i) at the time of the waiver or reimbursement or (ii) at the time of the recoupment. The fee waiver/expense reimbursement agreement may be terminated by the Fund's Board of Trustees at any time and also will terminate automatically upon the expiration or termination of the Fund's advisory contract with the Advisor. Upon termination of the fee waiver/expense reimbursement agreement, however, UBS AM (Americas)'s three year recoupment rights will survive.
1 Inception date of Class P of UBS Sustainable Development Bank Bond Fund is October 24, 2018. Benchmark's inception return is based on Class P inception date.
2 Class P shares do not bear initial or contingent deferred sales charges or ongoing 12b-1 service and distribution fees, but Class P shares held through advisory programs may be subject to a program fee, which, if included, would have reduced performance.
3 The Bloomberg Barclays US Treasury Index measures US dollar-denominated, fixed-rate, nominal debt issued by the US Treasury. Investors should note that indices do not reflect the deduction of fees and expenses.
4 The Solactive UBS Global Multilateral Development Bank Bond USD 40% 1-5 Year 60% 5-10 Year Total Return Index is a composite index, constructed from a blend of two market indexes designed to measure the performance of the US dollar denominated multilateral development bank bond market. Investors should note that indices do not reflect the deduction of fees and expenses.
5 Inception date of Class P2 of UBS Sustainable Development Bank Bond Fund is October 30, 2020.
Past performance does not predict future performance, and the performance information provided does not reflect the deduction of taxes that a shareholder would pay on Fund distributions or the redemption of Fund shares. The return and principal value of an investment will fluctuate, so that an investor's shares, when redeemed, may be worth more or less than their original cost. Performance results assume reinvestment of all dividends and capital gain distributions at net asset value on the ex-dividend dates. Current performance may be higher or lower than the performance data quoted. For month-end performance figures, please visit www.ubs.com/us-mutualfundperformance.
98
UBS Sustainable Development Bank Bond Fund
Illustration of an assumed investment of $2,000,000 in Class P shares (unaudited) and $25,000,000 in Class P2 shares (unaudited)
The following graphs depict the performance of UBS Sustainable Development Bank Bond Fund Class P shares and Class P2 shares versus the Bloomberg Barclays U.S. Treasury Index and Solactive UBS Global Multilateral Development Bank Bond USD 40% 1-5 Year 60% 5-10 Year Total Return Index from October 24, 2018, the inception date of class P and from October 30, 2020, the he inception date of class P2 through June 30, 2021. The performance provided does not reflect the deduction of taxes that a shareholder would pay on Fund distributions or the redemption of Fund shares. Past performance is no guarantee of future results. Share price and returns will vary with market conditions; investors may realize a gain or loss upon redemption.
UBS Sustainable Development Bank Bond Fund P vs. Bloomberg Barclays U.S. Treasury Index and Solactive UBS Global Multilateral Development Bank Bond USD 40% 1-5 Year 60% 5-10 Year Total Return Index
Wealth value with dividends reinvested. Initial investment for Class P shares as of October 24, 2018 = $2,000,000

UBS Sustainable Development Bank Bond Fund P2 vs. Bloomberg Barclays U.S. Treasury Index and Solactive UBS Global Multilateral Development Bank Bond USD 40% 1-5 Year 60% 5-10 Year Total Return Index
Wealth value with dividends reinvested. Initial investment for Class P2 shares as of October 24, 2018 = $25,000,000
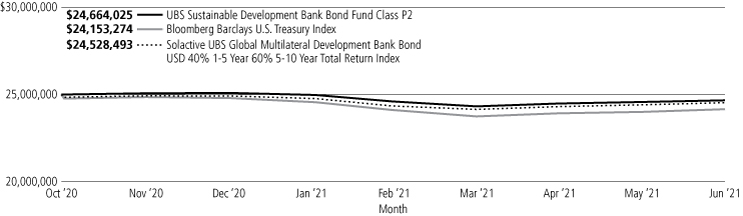
Past performance does not predict future performance, and the performance information provided does not reflect the deduction of taxes that a shareholder would pay on Fund distributions or the redemption of Fund shares. The return and principal value of an investment will fluctuate, so that an investor's shares, when redeemed, may be worth more or less than their original cost. Performance results assume reinvestment of all dividends and capital gain distributions at net asset value on the ex-dividend dates. Current performance may be higher or lower than the performance data quoted. For month-end performance figures, please visit www.ubs.com/us-mutualfundperformance.
99
UBS Sustainable Development Bank Bond Fund
Portfolio statistics and industry diversification—(unaudited)1
As a percentage of net assets as of June 30, 2021
Top ten holdings
| Inter-American Development Bank, 2.250% due 06/18/29 | 4.5 | % | |||||
| Inter-American Development Bank, 1.125% due 01/13/31 | 4.1 | ||||||
| International Bank for Reconstruction & Development, 0.750% due 08/26/30 | 3.7 | ||||||
| International Bank for Reconstruction & Development, 1.250% due 02/10/31 | 3.7 | ||||||
| Agence Francaise de Developpement, 0.625% due 01/22/26 | 3.6 | ||||||
| International Bank for Reconstruction & Development, 0.750% due 11/24/27 | 3.5 | ||||||
| Inter-American Development Bank, 2.000% due 06/02/26 | 3.5 | ||||||
| Inter-American Development Bank, 3.125% due 09/18/28 | 3.4 | ||||||
| Inter-American Investment Corp., 1.750% due 10/02/24 | 3.1 | ||||||
| Council of Europe Development Bank, 1.375% due 02/27/25 | 3.1 | ||||||
Total | 36.2 | % | |||||
Sector allocation | |||||||
Non-U.S. Government agency obligations | 98.2 | % | |||||
Investments of cash collateral from securities loaned | 2.9 | ||||||
Short-term investments | 1.4 | ||||||
Total investments | 102.5 | ||||||
Liabilities in excess of other assets | (2.5 | ) | |||||
Total | 100.0 | % | |||||
1 The portfolio is actively managed and its composition will vary over time.
100
UBS Sustainable Development Bank Bond Fund
Portfolio of investments
June 30, 2021
| Face amount | Value | ||||||||||
Non-U.S. government agency obligations: 98.2% | |||||||||||
Supranationals: 98.2% | |||||||||||
| African Development Bank, (Series GDIF), 1.250%, due 07/26/21 | $ | 500,000 | $ | 500,390 | |||||||
| (Series GDIF), 0.500%, due 04/22/22 | 100,000 | 100,224 | |||||||||
1.625%, due 09/16/22 | 220,000 | 223,713 | |||||||||
| (Series GDIF), 2.125%, due 11/16/22 | 300,000 | 307,759 | |||||||||
0.750%, due 04/03/23 | 750,000 | 755,950 | |||||||||
7.375%, due 04/06/23 | 300,000 | 336,510 | |||||||||
3.000%, due 09/20/23 | 700,000 | 740,526 | |||||||||
0.875%, due 03/23/26 | 500,000 | 499,370 | |||||||||
| Agence Francaise de Developpement 2.750%, due 01/22/221 | 200,000 | 202,826 | |||||||||
0.625%, due 01/22/261 | 3,000,000 | 2,958,390 | |||||||||
| Asian Development Bank 2.500%, due 11/02/27 | 100,000 | 108,129 | |||||||||
2.750%, due 01/19/28 | 240,000 | 262,391 | |||||||||
3.125%, due 09/26/28 | 500,000 | 560,704 | |||||||||
1.750%, due 09/19/29 | 500,000 | 511,987 | |||||||||
1.875%, due 01/24/30 | 700,000 | 725,252 | |||||||||
0.750%, due 10/08/30 | 800,000 | 748,499 | |||||||||
1.500%, due 03/04/31 | 1,100,000 | 1,098,724 | |||||||||
| Asian Infrastructure Investment Bank 2.250%, due 05/16/24 | 1,400,000 | 1,469,558 | |||||||||
0.500%, due 05/28/25 | 1,200,000 | 1,188,012 | |||||||||
0.500%, due 01/27/26 | 750,000 | 737,871 | |||||||||
| Corp. Andina de Fomento 2.125%, due 09/27/21 | 125,000 | 125,501 | |||||||||
4.375%, due 06/15/22 | 300,000 | 310,776 | |||||||||
| Council of Europe Development Bank 2.500%, due 02/27/24 | 650,000 | 684,903 | |||||||||
1.375%, due 02/27/25 | 2,500,000 | 2,558,098 | |||||||||
| European Bank for Reconstruction & Development 1.875%, due 02/23/22 | 100,000 | 101,090 | |||||||||
2.750%, due 03/07/23 | 300,000 | 312,436 | |||||||||
1.625%, due 09/27/24 | 100,000 | 103,272 | |||||||||
1.500%, due 02/13/25 | 1,450,000 | 1,491,330 | |||||||||
0.500%, due 05/19/25 | 400,000 | 396,189 | |||||||||
0.500%, due 11/25/25 | 500,000 | 492,655 | |||||||||
0.500%, due 01/28/262 | 450,000 | 442,922 | |||||||||
| European Investment Bank 2.625%, due 03/15/24 | 225,000 | 238,127 | |||||||||
1.875%, due 02/10/25 | 1,200,000 | 1,252,663 | |||||||||
0.625%, due 07/25/25 | 250,000 | 247,639 | |||||||||
0.625%, due 10/21/27 | 700,000 | 672,078 | |||||||||
0.750%, due 09/23/30 | 650,000 | 608,025 | |||||||||
| IDB Trust Services Ltd. 2.393%, due 04/12/221 | 200,000 | 203,088 | |||||||||
3.389%, due 09/26/231 | 800,000 | 849,632 | |||||||||
2.843%, due 04/25/241 | 1,000,000 | 1,058,350 | |||||||||
0.908%, due 06/25/251 | 400,000 | 397,780 | |||||||||
| Face amount | Value | ||||||||||
Non-U.S. government agency obligations—(continued) | |||||||||||
Supranationals—(continued) | |||||||||||
| Inter-American Development Bank 2.125%, due 01/15/25 | $ | 1,000,000 | $ | 1,050,580 | |||||||
1.750%, due 03/14/25 | 850,000 | 882,438 | |||||||||
0.875%, due 04/03/25 | 850,000 | 854,933 | |||||||||
0.625%, due 07/15/25 | 850,000 | 846,143 | |||||||||
0.875%, due 04/20/26 | 200,000 | 199,982 | |||||||||
2.000%, due 06/02/26 | 2,750,000 | 2,892,157 | |||||||||
2.000%, due 07/23/26 | 630,000 | 661,689 | |||||||||
2.375%, due 07/07/27 | 1,285,000 | 1,377,952 | |||||||||
0.625%, due 09/16/27 | 1,400,000 | 1,351,840 | |||||||||
3.125%, due 09/18/28 | 2,550,000 | 2,864,629 | |||||||||
2.250%, due 06/18/29 | 3,500,000 | 3,729,862 | |||||||||
1.125%, due 01/13/31 | 3,500,000 | 3,378,176 | |||||||||
| Inter-American Investment Corp. 1.750%, due 10/02/241 | 2,500,000 | 2,585,791 | |||||||||
0.625%, due 02/10/261 | 100,000 | 98,478 | |||||||||
| International Bank for Reconstruction & Development 0.625%, due 04/22/25 | 300,000 | 298,923 | |||||||||
| (Series GDIF), 2.500%, due 07/29/25 | 600,000 | 642,177 | |||||||||
0.500%, due 10/28/25 | 700,000 | 691,383 | |||||||||
| (Series GDIF), 3.125%, due 11/20/25 | 900,000 | 989,964 | |||||||||
| (Series GDIF), 1.875%, due 10/27/26 | 1,750,000 | 1,828,017 | |||||||||
| (Series GDIF), 2.500%, due 11/22/27 | 2,110,000 | 2,283,478 | |||||||||
0.750%, due 11/24/27 | 3,000,000 | 2,921,222 | |||||||||
| (Series GDIF), 1.375%, due 04/20/28 | 200,000 | 201,667 | |||||||||
| (Series GDIF), 1.750%, due 10/23/29 | 2,060,000 | 2,117,172 | |||||||||
0.875%, due 05/14/30 | 2,250,000 | 2,142,827 | |||||||||
0.750%, due 08/26/30 | 3,300,000 | 3,094,629 | |||||||||
1.250%, due 02/10/31 | 3,150,000 | 3,076,672 | |||||||||
| International Development Association 0.875%, due 04/28/261 | 500,000 | 498,187 | |||||||||
| (Series GDIF), 0.750%, due 06/10/271,2 | 1,500,000 | 1,463,700 | |||||||||
1.000%, due 12/03/301 | 1,650,000 | 1,576,410 | |||||||||
| International Finance Corp. 1.375%, due 10/16/24 | 400,000 | 410,001 | |||||||||
0.375%, due 07/16/25 | 1,000,000 | 981,456 | |||||||||
2.125%, due 04/07/26 | 775,000 | 819,651 | |||||||||
0.750%, due 08/27/30 | 1,250,000 | 1,164,941 | |||||||||
| Kreditanstalt fuer Wiederaufbau 2.000%, due 05/02/25 | 600,000 | 629,128 | |||||||||
2.875%, due 04/03/28 | 1,500,000 | 1,662,045 | |||||||||
0.750%, due 09/30/302 | 550,000 | 515,531 | |||||||||
101
UBS Sustainable Development Bank Bond Fund
Portfolio of investments
June 30, 2021
| Face amount | Value | ||||||||||
Non-U.S. government agency obligations—(concluded) | |||||||||||
Supranationals—(concluded) | |||||||||||
| Nordic Investment Bank 2.875%, due 07/19/23 | $ | 1,000,000 | $ | 1,051,584 | |||||||
2.250%, due 05/21/24 | 1,200,000 | 1,259,916 | |||||||||
| Total non-U.S. government agency obligations (cost $81,175,356) | 81,678,670 | ||||||||||
| Number of shares | |||||||||||
Short-term investments: 1.4% | |||||||||||
Investment companies: 1.4% | |||||||||||
| State Street Institutional U.S. Government Money Market fund, 0.030%3 (cost $1,158,268) | 1,158,268 | 1,158,268 | |||||||||
| Number of shares | Value | ||||||||||
Investment of cash collateral from securities loaned: 2.9% | |||||||||||
Money market funds: 2.9% | |||||||||||
| State Street Navigator Securities Lending Government Money Market Portfolio, 0.020%3 (cost $2,382,450) | 2,382,450 | $ | 2,382,450 | ||||||||
| Total investments (cost $84,716,074)—102.5% | 85,219,388 | ||||||||||
Liabilities in excess of other assets: (2.5)% | (2,050,646 | ) | |||||||||
Net assets: 100.0% | $ | 83,168,742 | |||||||||
For a listing of defined portfolio acronyms that are used throughout the Portfolio of investments as well as the tables that follow, please refer to the Glossary of terms used in the Portfolio of investments.
Fair valuation summary
The following is a summary of the fair valuations according to the inputs used as of June 30, 2021 in valuing the Fund's investments. In the event a Fund holds investments for which fair value is measured using the NAV per share practical expedient (or its equivalent), a separate column will be added to the fair value hierarchy table; this is intended to permit reconciliation to the amounts presented in the Portfolio of investments.
Description | Unadjusted quoted prices in active markets for identical investments (Level 1) | Other significant observable inputs (Level 2) | Unobservable inputs (Level 3) | Total | |||||||||||||||
Assets | |||||||||||||||||||
Non-U.S. Government agency obligations | $ | — | $ | 81,678,670 | $ | — | $ | 81,678,670 | |||||||||||
Short-term investments | — | 1,158,268 | — | 1,158,268 | |||||||||||||||
Investment of cash collateral from securities loaned | — | 2,382,450 | — | 2,382,450 | |||||||||||||||
Total | $ | — | $ | 85,219,388 | $ | — | $ | 85,219,388 | |||||||||||
At June 30, 2021, there were no transfers in or out of Level 3.
Portfolio footnotes
1 Security was purchased pursuant to Regulation S under the Securities Act of 1933, which exempts from registration securities offered and sold outside of the United States. Such a security cannot be sold in the United States without either an effective registration statement filed pursuant to the Securities Act of 1933, or pursuant to an exemption from registration.
2 Security, or portion thereof, was on loan at the period end.
3 Rates shown reflect yield at June 30, 2021.
See accompanying notes to financial statements.
102
UBS Total Return Bond Fund
Portfolio Performance
For the 12 months ended June 30, 2021, Class A shares of UBS Total Return Bond Fund (the "Fund") returned 1.83% (Class A shares returned -2.18 after the deduction of the maximum sales charge), while Class P shares returned 2.07%. For comparison purposes, the Bloomberg Barclays U.S. Aggregate Bond Index (the "Index") returned -0.33%. (Class P shares have lower expenses than the other share class of the Fund. Returns for all share classes over various time periods are shown on page 105; please note that the Fund's returns do not reflect the deduction of taxes that a shareholder would pay on the redemption of Fund shares, while index returns do not reflect the deduction of fees and expenses.)
During the reporting period, we used derivatives for risk management purposes and as a tool to help enhance returns across various strategies. A number of credit derivatives, including credit-default swaps and index (CDX) options, were used to manage the Fund's credit exposure. For active currency management, we utilized foreign exchange (FX) forwards. For managing interest rate exposure, we utilized interest rate futures during the reporting period. Derivatives were just one tool, among others, that we used to implement our overall strategy. Looking at the impact of derivatives in isolation is not very meaningful and could potentially be misleading, as often times they are used as a complement or risk mitigant to other existing positions in the portfolio.
Portfolio Performance Summary
What Worked:
• Sector allocation: Overweights to securitized assets, including asset-backed securities (ABS) and commercial mortgage-backed securities (CMBS) were additive to results. Allocations to high yield corporate and emerging markets also contributed to returns.
• Security selection: Security selection, particularly industrial investment grade corporate bonds, contributed to relative performance.
• Incremental yield and pre-payment management: The Fund's overall overweight risk position contributed to performance as we generated incremental spread carry (yields) relative to the index. Additionally, pre-payment risk management for securitized assets contributed to returns.
• Currency management: FX management and, in particular, active management in both the euro and Indonesian rupiah, contributed to performance
What Didn't Work:
• Active Duration: The Fund's longer duration relative to the benchmark in early 2021 detracted from relative performance as rates moved sharply higher.
• Yield Curve positioning: The Fund's yield curve positioning in the first quarter of 2021, notably an overweight in the 10-20 year part of the curve, detracted from relative performance.
• Duration—New Zealand: Long exposure to New Zealand interest rates detracted during the period.
103
UBS Total Return Bond Fund
Market Outlook
Supported by the continued pace of vaccinations and the easing of restrictions, the US labor market recovery continued in June at a slower pace, but was more robust when smoothed over three months. The Federal Reserve (Fed) reiterated that it's monetary policy is on hold. Fed Chair Jerome Powell said that the central bank views the likely increase in inflation in near term as transitory.
In financial markets, risk assets and reflationary measures appear well supported. This is buoyed by the improving economic data in general. We believe this will reinforce the ongoing support by the Fed and other central banks, along with the addition of fiscal policy measures around the globe. We thus remain upbeat prospectively as policy makers continue to mitigate the downside risks in this globally uneven economic recovery that is well under way.
We remain generally positive on risk assets and expect continued outperformances versus Treasury securities, but at a much slower pace than in 2020. We maintain our view that monetary policy will remain accommodative, thus supporting securitized credit, corporate credit, and equities. Our duration posture has been short relative to the benchmark. Financial conditions are easy and will likely further benefit from the very strong demand verses supply dynamics that are also supporting risk assets.
This letter is intended to assist shareholders in understanding how the Fund performed during the 12 months ended June 30, 2021. The views and opinions in the letter were current as of August 12, 2021. They are not guarantees of future performance or investment results and should not be taken as investment advice. Investment decisions reflect a variety of factors, and we reserve the right to change our views about individual securities, sectors and markets at any time. As a result, the views expressed should not be relied upon as a forecast of the Fund's future investment intent. We encourage you to consult your financial advisor regarding your personal investment program.
Mutual funds are sold by prospectus only. You should read it carefully and consider a fund's investment objectives, risks, charges, expenses and other important information contained in the prospectus before investing. Prospectuses for most of our funds can be obtained from your financial advisor, by calling UBS Funds at (800) 647 1568 or by visiting our website at www.ubs.com/am-us.
104
UBS Total Return Bond Fund
Average annual total returns for periods ended 06/30/21 (unaudited)
1 year | 5 years | 10 years or Inception1 | |||||||||||||
Before deducting maximum sales charge | |||||||||||||||
Class A1 | 1.83 | % | N/A | 2.92 | % | ||||||||||
Class P3 | 2.07 | 3.32 | % | 4.03 | |||||||||||
After deducting maximum sales charge | |||||||||||||||
Class A2 | (2.18 | )% | N/A | 2.10 | % | ||||||||||
Bloomberg Barclays US Aggregate Index4 | (0.33 | ) | 3.03 | % | 3.04 | ||||||||||
The annualized gross and net expense ratios as in the October 28, 2020 prospectuses were as follows: Class A—1.60% and 0.76%; Class P—1.39% and 0.51%. Net expenses reflect fee waivers and/or expense reimbursements, if any, pursuant to an agreement that is in effect to cap the expenses. The Trust, with respect to the Fund, and UBS Asset Management (Americas) Inc., the Fund's investment advisor and administrator ("UBS AM (Americas)" or the "Advisor"), have entered into a written agreement pursuant to which the Advisor has agreed to waive a portion of its management fees and/or to reimburse expenses (excluding expenses incurred through investment in other investment companies, interest, taxes, brokerage commissions and extraordinary expenses) to the extent necessary so that the Fund's ordinary operating expenses (excluding expenses incurred through investment in other investment companies, interest, taxes, brokerage commissions and extraordinary expenses), through the period ending October 28, 2021, do not exceed 0.75% for Class A shares and 0.50% for Class P shares. Pursuant to the written agreement, the Advisor is entitled to be reimbursed for any fees it waives and expenses it reimburses to the extent such reimbursement can be made during the three fiscal years following the date on which such fee waivers and expense reimbursements were made, provided that the reimbursement of the Advisor by the Fund will not cause the Fund to exceed the lesser of any applicable expense limit that is in place for the Fund (i) at the time of the waiver or reimbursement or (ii) at the time of the recoupment. The fee waiver/expense reimbursement agreement may be terminated by the Fund's Board of Trustees at any time and also will terminate automatically upon the expiration or termination of the Fund's advisory contract with the Advisor. Upon termination of the fee waiver/expense reimbursement agreement, however, UBS AM (Americas)'s three year recoupment rights will survive.
1 Inception date of A shares of UBS Total Return Bond Fund and the index is September 29, 2016. 10 years fund performance is shown for Class P Shares, and the 10 years index performance of the Bloomberg Barclays US Aggregate Index is 3.39%. The Fund's Class P shares acquired the assets and liabilities of Fort Dearborn Income Securities, Inc., a closed-end fund (the "Predecessor Fund"), prior to the opening of business on May 23, 2016 (the "Reorganization"). The Predecessor Fund was also managed by the Advisor, and the day-to-day management of, and investment decisions for, the Fund and the Predecessor Fund are made by the same portfolio management team. The Funds have generally similar investment objectives and strategies. Therefore, the information shown above reflects the historical performance of the Predecessor Fund for periods prior to the Reorganization. The performance information shown for periods prior to the Reorganization is for the Predecessor Fund and may not be representative of performance of the Fund.
2 Maximum sales charge for Class A shares is 3.75%. Class A shares bear ongoing 12b-1 service fees.
3 Class P shares do not bear initial or contingent deferred sales charges or ongoing 12b-1 service and distribution fees, but Class P shares held through advisory programs may be subject to a program fee, which, if included, would have reduced performance.
4 The Bloomberg Barclays US Aggregate Bond Index is an unmanaged broad based index designed to measure the US dollar-denominated, investment-grade, taxable bond market. The index includes bonds from the Treasury, government-related, corporate, mortgage-backed, assetbacked and commercial mortgage-backed sectors. Investors should note that indices do not reflect the deduction of fees and expenses.
A temporary redemption fee of 2% was imposed on sales of Class P shares of the Fund between May 23, and August 22, 2016.
Past performance does not predict future performance, and the performance information provided does not reflect the deduction of taxes that a shareholder would pay on Fund distributions or the redemption of Fund shares. The return and principal value of an investment will fluctuate, so that an investor's shares, when redeemed, may be worth more or less than their original cost. Performance results assume reinvestment of all dividends and capital gain distributions at net asset value on the ex-dividend dates. Current performance may be higher or lower than the performance data quoted. For month-end performance figures, please visit www.ubs.com/us-mutualfundperformance.
105
UBS Total Return Bond Fund
Illustration of an assumed investment of $10,000 in Class A shares (adjusted for 3.75% maximum sales charge) and $2,000,000 in Class P shares (unaudited)
The following two graphs depict the performance of UBS Total Return Bond Fund Class A and Class P shares versus the Bloomberg Barclays US Aggregate Index from September 29, 2016 for Class A and over 10 years for Class P, both ending June 30, 2021. The performance provided does not reflect the deduction of taxes that a shareholder would pay on Fund distributions or the redemption of Fund shares. Past performance is no guarantee of future results. Share price and returns will vary with market conditions; investors may realize a gain or loss upon redemption.
UBS Total Return Bond Fund Class A vs. Bloomberg Barclays US Aggregate Index
Wealth value with dividends reinvested. Initial investment for Class A Shares as of September 29, 2016 = $9,625.
The Fund's growth of an assumed $10,000 investment is adjusted for the maximum sales charge of 3.75%.

UBS Total Return Bond Fund Class P vs. Bloomberg Barclays US Aggregate Index
Wealth value with dividends reinvested. Initial investment for Class P shares as of June 30, 2011 = $2,000,000
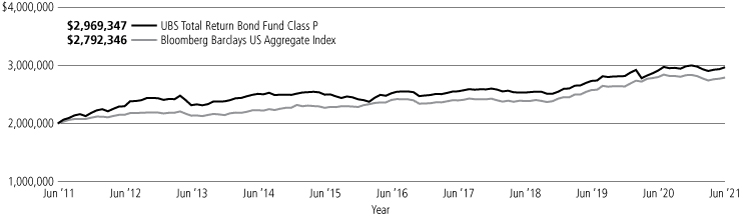
Past performance does not predict future performance, and the performance information provided does not reflect the deduction of taxes that a shareholder would pay on Fund distributions or the redemption of Fund shares. The return and principal value of an investment will fluctuate, so that an investor's shares, when redeemed, may be worth more or less than their original cost. Performance results assume reinvestment of all dividends and capital gain distributions at net asset value on the ex-dividend dates. Current performance may be higher or lower than the performance data quoted. For month-end performance figures, please visit www.ubs.com/us-mutualfundperformance.
106
UBS Total Return Bond Fund
Portfolio statistics and industry diversification—(unaudited)1
As a percentage of net assets as of June 30, 2021
Top ten holdings
| UMBS TBA, 3.000% | 3.0 | % | |||||
| UMBS TBA, 2.000% | 2.8 | ||||||
| UMBS TBA, 2.500% | 2.2 | ||||||
| Santander Retail Auto Lease Trust, 1.100% due 06/20/25 | 1.4 | ||||||
| COMM Mortgage Trust, 1.273% due 03/15/38 | 1.2 | ||||||
| State of California, GO Bonds, 7.300% due 10/01/39 | 1.1 | ||||||
| Verus Securitization Trust, 1.024% due 06/25/66 | 1.1 | ||||||
| JPMorgan Chase & Co., 3.875% due 09/10/24 | 1.1 | ||||||
| ONE Mortgage Trust, 1.173% due 03/15/36 | 1.1 | ||||||
| Morgan Stanley, 4.875% due 11/01/22 | 1.0 | ||||||
Total | 16.0 | % | |||||
Top five issuer breakdown by country or territory of origin
United States | 101.5 | % | |||||
United Kingdom | 2.5 | ||||||
New Zealand | 1.0 | ||||||
Colombia | 0.7 | ||||||
Belgium | 0.6 | ||||||
Total | 106.3 | % | |||||
1 The portfolio is actively managed and its composition will vary over time.
107
UBS Total Return Bond Fund
Portfolio statistics and industry diversification—(unaudited)1
As a percentage of net assets as of June 30, 2021
Corporate bonds | |||||||
Agriculture | 0.1 | % | |||||
Airlines | 0.3 | ||||||
Auto manufacturers | 1.6 | ||||||
Banks | 10.8 | ||||||
Beverages | 0.6 | ||||||
Biotechnology | 1.1 | ||||||
Chemicals | 1.1 | ||||||
Commercial services | 0.7 | ||||||
Computers | 0.6 | ||||||
Diversified financial services | 2.8 | ||||||
Electric | 2.3 | ||||||
Food | 0.3 | ||||||
Healthcare-products | 0.1 | ||||||
Housewares | 0.6 | ||||||
Insurance | 1.9 | ||||||
Media | 1.5 | ||||||
Mining | 0.2 | ||||||
Miscellaneous manufacturers | 1.7 | ||||||
Oil & gas | 2.2 | ||||||
Packaging & containers | 0.6 | ||||||
Pharmaceuticals | 1.4 | ||||||
Pipelines | 1.7 | ||||||
Real estate investment trust | 0.6 | ||||||
Retail | 0.6 | ||||||
Semiconductors | 1.1 | ||||||
Software | 1.8 | ||||||
Telecommunications | 2.6 | ||||||
Transportation | 0.5 | ||||||
Total corporate bonds | 41.4 | % | |||||
Asset-backed securities | 15.4 | % | |||||
Mortgage-backed securities | 18.7 | ||||||
Municipal bonds | 1.8 | ||||||
Non-U.S. government agency obligations | 3.2 | ||||||
U.S. government agency obligations | 19.9 | ||||||
U.S. Treasury obligations | 1.3 | ||||||
Short-term investments | 8.1 | ||||||
Investment of cash collateral from securities loaned | 0.4 | ||||||
Total investments | 110.2 | ||||||
Liabilities in excess of other assets | (10.2 | ) | |||||
Net assets | 100.0 | % | |||||
108
UBS Total Return Bond Fund
Portfolio of investments
June 30, 2021
| Face amount | Value | ||||||||||
Asset-backed securities: 15.4% | |||||||||||
United States: 15.4% | |||||||||||
| CCG Receivables Trust, Series 2020-1, Class C, 1.840%, due 12/14/271 | $ | 150,000 | $ | 151,868 | |||||||
| CPS Auto Trust, Series 2018-C, Class D, 4.400%, due 06/17/241 | 150,000 | 153,458 | |||||||||
| Drive Auto Receivables Trust, Series 2017-1, Class D, 3.840%, due 03/15/23 | 8,898 | 8,940 | |||||||||
| Series 2018-1, Class D, 3.810%, due 05/15/24 | 168,808 | 170,795 | |||||||||
| Series 2018-2, Class D, 4.140%, due 08/15/24 | 130,355 | 133,018 | |||||||||
| Series 2018-3, Class D, 4.300%, due 09/16/24 | 246,130 | 251,841 | |||||||||
| Series 2018-4, Class D, 4.090%, due 01/15/26 | 150,000 | 153,765 | |||||||||
| DT Auto Owner Trust, Series 2018-1A, Class D, 3.810%, due 12/15/231 | 40,834 | 41,095 | |||||||||
| Series 2021-1A, Class C, 0.840%, due 10/15/261 | 150,000 | 149,876 | |||||||||
| Series 2021-1A, Class D, 1.160%, due 11/16/261 | 150,000 | 149,442 | |||||||||
| Exeter Automobile Receivables Trust, Series 2019-2A, Class C, 3.300%, due 03/15/241 | 85,804 | 86,731 | |||||||||
| HPEFS Equipment Trust, Series 2021-1A, Class D, 1.030%, due 03/20/311 | 300,000 | 299,146 | |||||||||
| Series 2021-2A, Class D, 1.290%, due 03/20/291 | 150,000 | 149,649 | |||||||||
| Invitation Homes Trust, Series 2018-SFR1, Class C, 1 mo. USD LIBOR + 1.250%, 1.332%, due 03/17/37 1,2 | 100,000 | 100,157 | |||||||||
| Series 2018-SFR2, Class D, 1 mo. USD LIBOR + 1.450%, 1.523%, due 06/17/37 1,2 | 149,970 | 150,257 | |||||||||
| OneMain Direct Auto Receivables Trust, Series 2018-1A, Class C, 3.850%, due 10/14/251 | 300,000 | 303,663 | |||||||||
| OneMain Financial Issuance Trust, Series 2019-1A, Class A, 3.480%, due 02/14/311 | 141,773 | 141,941 | |||||||||
| Series 2020-2A, Class A, 1.750%, due 09/14/351 | 100,000 | 101,677 | |||||||||
| Series 2020-2A, Class B, 2.210%, due 09/14/351 | 150,000 | 153,319 | |||||||||
| Series 2021-1A, Class A1, 1.550%, due 06/16/361 | 250,000 | 250,934 | |||||||||
| PSNH Funding LLC, Series 2018-1, Class A3, 3.814%, due 02/01/35 | 175,000 | 203,550 | |||||||||
| Face amount | Value | ||||||||||
Asset-backed securities—(concluded) | |||||||||||
United States—(concluded) | |||||||||||
| Santander Consumer Auto Receivables Trust, Series 2020-BA, Class B, 0.770%, due 12/15/251 | $ | 275,000 | $ | 275,718 | |||||||
| Santander Drive Auto Receivables Trust, Series 2017-2, Class D, 3.490%, due 07/17/23 | 106,534 | 106,894 | |||||||||
| Series 2017-3, Class D, 3.200%, due 11/15/23 | 146,745 | 148,227 | |||||||||
| Series 2018-4, Class D, 3.980%, due 12/15/25 | 225,000 | 231,241 | |||||||||
| Santander Retail Auto Lease Trust, Series 2021-B, Class C, 1.100%, due 06/20/251 | 500,000 | 498,307 | |||||||||
| Sofi Consumer Loan Program Trust, Series 2017-6, Class B, 3.520%, due 11/25/261 | 165,726 | 167,479 | |||||||||
| Series 2018-1, Class B, 3.650%, due 02/25/271 | 67,820 | 68,757 | |||||||||
| Series 2018-2, Class B, 3.790%, due 04/26/271 | 67,371 | 68,118 | |||||||||
| Series 2018-3, Class B, 4.020%, due 08/25/271 | 97,893 | 99,156 | |||||||||
| Tesla Auto Lease Trust, Series 2020-A, Class B, 1.180%, due 01/22/241 | 100,000 | 100,941 | |||||||||
| Series 2020-A, Class D, 2.330%, due 02/20/241 | 100,000 | 102,584 | |||||||||
| Series 2021-A, Class D, 1.340%, due 03/20/251 | 250,000 | 250,512 | |||||||||
| Total asset-backed securities (cost $5,353,178) | 5,423,056 | ||||||||||
Corporate bonds: 41.4% | |||||||||||
Belgium: 0.6% | |||||||||||
| Anheuser-Busch Cos. LLC/Anheuser-Busch InBev Worldwide, Inc. 4.900%, due 02/01/46 | 165,000 | 208,849 | |||||||||
Canada: 0.5% | |||||||||||
| Cenovus Energy, Inc. 5.400%, due 06/15/47 | 80,000 | 98,994 | |||||||||
| Rogers Communications, Inc. 5.000%, due 03/15/44 | 60,000 | 74,953 | |||||||||
173,947 | |||||||||||
China: 0.2% | |||||||||||
| NXP BV/NXP Funding LLC/NXP USA, Inc. 3.875%, due 06/18/261 | 65,000 | 71,991 | |||||||||
Colombia: 0.2% | |||||||||||
| Ecopetrol SA 5.375%, due 06/26/26 | 70,000 | 77,182 | |||||||||
109
UBS Total Return Bond Fund
Portfolio of investments
June 30, 2021
| Face amount | Value | ||||||||||
Corporate bonds—(continued) | |||||||||||
Ireland: 0.1% | |||||||||||
| Avolon Holdings Funding Ltd. 2.875%, due 02/15/251 | $ | 50,000 | $ | 51,480 | |||||||
Israel: 0.2% | |||||||||||
| Teva Pharmaceutical Finance IV BV 3.650%, due 11/10/21 | 57,000 | 57,003 | |||||||||
Luxembourg: 0.6% | |||||||||||
| INEOS Group Holdings SA 5.625%, due 08/01/241 | 200,000 | 200,700 | |||||||||
Peru: 0.2% | |||||||||||
| Southern Copper Corp. 6.750%, due 04/16/40 | 40,000 | 56,932 | |||||||||
United Kingdom: 2.5% | |||||||||||
| Barclays PLC 4.836%, due 05/09/28 | 200,000 | 224,837 | |||||||||
| HSBC Holdings PLC 6.500%, due 09/15/37 | 100,000 | 139,103 | |||||||||
| Lloyds Banking Group PLC 4.582%, due 12/10/25 | 200,000 | 224,727 | |||||||||
| Natwest Group PLC 3.875%, due 09/12/23 | 250,000 | 267,061 | |||||||||
| Reynolds American, Inc. 7.250%, due 06/15/37 | 35,000 | 47,000 | |||||||||
902,728 | |||||||||||
United States: 36.3% | |||||||||||
| Abbott Laboratories 3.750%, due 11/30/26 | 45,000 | 50,820 | |||||||||
| AbbVie, Inc. 4.500%, due 05/14/35 | 100,000 | 120,450 | |||||||||
| ADT Security Corp. 3.500%, due 07/15/22 | 140,000 | 142,625 | |||||||||
| AEP Texas, Inc., Series E, 6.650%, due 02/15/33 | 50,000 | 67,310 | |||||||||
| Series G, 4.150%, due 05/01/49 | 50,000 | 58,654 | |||||||||
| Air Lease Corp. 2.875%, due 01/15/26 | 50,000 | 52,532 | |||||||||
| Alabama Power Co. 6.000%, due 03/01/39 | 100,000 | 141,806 | |||||||||
| Allstate Corp., Series B, (fixed, converts to FRN on 08/15/23), 5.750%, due 08/15/53 | 25,000 | 27,219 | |||||||||
| Ally Financial, Inc. 4.125%, due 02/13/22 | 100,000 | 102,279 | |||||||||
4.625%, due 05/19/224 | 100,000 | 103,568 | |||||||||
| American International Group, Inc. 2.500%, due 06/30/25 | 50,000 | 52,762 | |||||||||
| Amgen, Inc. 4.663%, due 06/15/51 | 50,000 | 64,486 | |||||||||
| Face amount | Value | ||||||||||
Corporate bonds—(continued) | |||||||||||
United States—(continued) | |||||||||||
| Aon PLC 4.750%, due 05/15/45 | $ | 50,000 | $ | 63,995 | |||||||
| Apple, Inc. 4.650%, due 02/23/46 | 100,000 | 132,693 | |||||||||
| Ardagh Packaging Finance PLC/ Ardagh Holdings USA, Inc. 5.250%, due 04/30/251 | 200,000 | 210,250 | |||||||||
| AT&T, Inc. 3.800%, due 12/01/571 | 58,000 | 60,429 | |||||||||
4.300%, due 02/15/30 | 316,000 | 365,241 | |||||||||
| Bank of America Corp. 4.200%, due 08/26/24 | 150,000 | 164,435 | |||||||||
5.700%, due 01/24/22 | 350,000 | 360,755 | |||||||||
6.110%, due 01/29/37 | 125,000 | 170,802 | |||||||||
| Bank of New York Mellon Corp. 1.600%, due 04/24/25 | 100,000 | 102,686 | |||||||||
| Berkshire Hathaway Energy Co. 4.450%, due 01/15/49 | 100,000 | 124,688 | |||||||||
| Biogen, Inc. 3.250%, due 02/15/511 | 56,000 | 56,037 | |||||||||
4.050%, due 09/15/25 | 100,000 | 111,338 | |||||||||
| Boston Properties LP, REIT 2.750%, due 10/01/26 | 210,000 | 224,264 | |||||||||
| BP Capital Markets America, Inc. 3.017%, due 01/16/27 | 50,000 | 53,955 | |||||||||
| Bristol-Myers Squibb Co. 3.200%, due 06/15/26 | 150,000 | 164,656 | |||||||||
4.125%, due 06/15/39 | 50,000 | 60,340 | |||||||||
| Broadcom Corp./ Broadcom Cayman Finance Ltd. 3.125%, due 01/15/25 | 30,000 | 32,023 | |||||||||
| Burlington Northern Santa Fe LLC 5.150%, due 09/01/43 | 50,000 | 68,549 | |||||||||
| Burlington Resources LLC 7.200%, due 08/15/31 | 100,000 | 144,582 | |||||||||
| CCO Holdings LLC/ CCO Holdings Capital Corp. 5.500%, due 05/01/261 | 150,000 | 155,085 | |||||||||
| Citigroup, Inc. 4.125%, due 07/25/28 | 50,000 | 56,327 | |||||||||
5.500%, due 09/13/25 | 300,000 | 349,437 | |||||||||
6.675%, due 09/13/43 | 25,000 | 38,383 | |||||||||
| Comcast Corp. 3.969%, due 11/01/47 | 88,000 | 102,453 | |||||||||
4.600%, due 10/15/38 | 50,000 | 61,970 | |||||||||
4.700%, due 10/15/48 | 50,000 | 64,459 | |||||||||
| CVS Health Corp. 4.300%, due 03/25/28 | 68,000 | 78,126 | |||||||||
| Delta Air Lines, Inc. 7.000%, due 05/01/251 | 100,000 | 116,699 | |||||||||
| Duke Energy Ohio, Inc. 4.300%, due 02/01/49 | 50,000 | 61,755 | |||||||||
| DuPont de Nemours, Inc. 4.725%, due 11/15/28 | 100,000 | 119,224 | |||||||||
110
UBS Total Return Bond Fund
Portfolio of investments
June 30, 2021
| Face amount | Value | ||||||||||
Corporate bonds—(continued) | |||||||||||
United States—(continued) | |||||||||||
| Eaton Corp. 2.750%, due 11/02/22 | $ | 190,000 | $ | 196,151 | |||||||
| Energy Transfer LP 5.400%, due 10/01/47 | 50,000 | 59,237 | |||||||||
5.500%, due 06/01/27 | 50,000 | 58,639 | |||||||||
| EOG Resources, Inc. 3.900%, due 04/01/35 | 50,000 | 57,724 | |||||||||
| EQT Corp. 3.900%, due 10/01/27 | 100,000 | 107,125 | |||||||||
| Exelon Corp. 3.400%, due 04/15/26 | 150,000 | 163,325 | |||||||||
4.450%, due 04/15/46 | 50,000 | 60,616 | |||||||||
| FedEx Corp. 4.550%, due 04/01/46 | 50,000 | 60,721 | |||||||||
| Fiserv, Inc. 3.200%, due 07/01/26 | 60,000 | 64,931 | |||||||||
4.400%, due 07/01/49 | 50,000 | 60,308 | |||||||||
| Ford Motor Credit Co. LLC 4.542%, due 08/01/26 | 300,000 | 326,250 | |||||||||
| Fox Corp. 3.050%, due 04/07/25 | 25,000 | 26,769 | |||||||||
5.576%, due 01/25/49 | 50,000 | 67,494 | |||||||||
| GE Capital International Funding Co. Unlimited Co. 3.373%, due 11/15/25 | 200,000 | 218,226 | |||||||||
| General Electric Co., Series D, 3 mo. USD LIBOR + 3.330%, 3.449%, due 09/15/212,5 | 99,000 | 97,020 | |||||||||
| General Motors Co. 6.600%, due 04/01/36 | 170,000 | 233,333 | |||||||||
| Gilead Sciences, Inc. 3.650%, due 03/01/26 | 75,000 | 82,682 | |||||||||
4.750%, due 03/01/46 | 50,000 | 63,408 | |||||||||
| Goldman Sachs Group, Inc. 5.150%, due 05/22/45 | 80,000 | 106,971 | |||||||||
5.750%, due 01/24/22 | 305,000 | 314,433 | |||||||||
| Hillenbrand, Inc. 5.750%, due 06/15/25 | 200,000 | 214,680 | |||||||||
| Home Depot, Inc. 2.125%, due 09/15/26 | 100,000 | 105,258 | |||||||||
| Illinois Tool Works, Inc. 2.650%, due 11/15/26 | 80,000 | 85,810 | |||||||||
| International Lease Finance Corp. 5.875%, due 08/15/22 | 120,000 | 126,987 | |||||||||
| JPMorgan Chase & Co. (fixed, converts to FRN on 01/23/28), 3.509%, due 01/23/29 | 150,000 | 165,326 | |||||||||
3.875%, due 09/10/24 | 350,000 | 381,525 | |||||||||
| Series I, 3 mo. USD LIBOR + 3.470%, 3.656%, due 07/30/21 2,5 | 97,000 | 97,242 | |||||||||
| Face amount | Value | ||||||||||
Corporate bonds—(continued) | |||||||||||
United States—(continued) | |||||||||||
| Kinder Morgan, Inc. 4.300%, due 03/01/28 | $ | 100,000 | $ | 114,145 | |||||||
5.550%, due 06/01/45 | 40,000 | 51,785 | |||||||||
| Kroger Co. 6.900%, due 04/15/38 | 25,000 | 36,623 | |||||||||
| Liberty Mutual Group, Inc. 4.250%, due 06/15/231 | 45,000 | 48,063 | |||||||||
4.569%, due 02/01/291 | 155,000 | 181,063 | |||||||||
| Lumen Technologies, Inc. 5.625%, due 04/01/25 | 200,000 | 217,000 | |||||||||
| LYB International Finance BV 4.875%, due 03/15/44 | 50,000 | 62,246 | |||||||||
| Marathon Petroleum Corp. 4.750%, due 09/15/44 | 70,000 | 82,708 | |||||||||
| McDonald's Corp. 4.875%, due 12/09/45 | 75,000 | 96,613 | |||||||||
| MetLife, Inc. 6.400%, due 12/15/36 | 110,000 | 141,275 | |||||||||
| Microsoft Corp. 2.375%, due 02/12/22 | 250,000 | 252,865 | |||||||||
2.525%, due 06/01/50 | 100,000 | 98,248 | |||||||||
| Morgan Stanley 4.300%, due 01/27/45 | 50,000 | 61,793 | |||||||||
4.350%, due 09/08/26 | 140,000 | 158,517 | |||||||||
4.875%, due 11/01/22 | 350,000 | 369,759 | |||||||||
| MPLX LP 4.875%, due 06/01/25 | 70,000 | 79,018 | |||||||||
| Nabors Industries, Inc. 4.625%, due 09/15/21 | 150,000 | 150,000 | |||||||||
| Newell Brands, Inc. 4.875%, due 06/01/25 | 200,000 | 221,250 | |||||||||
| Oncor Electric Delivery Co. LLC 3.750%, due 04/01/45 | 50,000 | 57,754 | |||||||||
| OneMain Finance Corp. 6.875%, due 03/15/25 | 200,000 | 225,720 | |||||||||
| Oracle Corp. 2.800%, due 04/01/27 | 100,000 | 106,043 | |||||||||
4.000%, due 11/15/47 | 50,000 | 54,543 | |||||||||
| Prudential Financial, Inc. 6.625%, due 06/21/40 | 50,000 | 75,359 | |||||||||
| QUALCOMM, Inc. 3.250%, due 05/20/27 | 60,000 | 66,271 | |||||||||
| Sabine Pass Liquefaction LLC 5.000%, due 03/15/27 | 200,000 | 230,948 | |||||||||
| Seagate HDD Cayman 5.750%, due 12/01/34 | 80,000 | 92,000 | |||||||||
| Smithfield Foods, Inc. 3.350%, due 02/01/221 | 80,000 | 81,125 | |||||||||
| Synchrony Financial 4.500%, due 07/23/25 | 90,000 | 100,648 | |||||||||
| Teachers Insurance & Annuity Association of America 4.270%, due 05/15/471 | 60,000 | 71,731 | |||||||||
| Texas Instruments, Inc. 1.850%, due 05/15/22 | 220,000 | 222,924 | |||||||||
111
UBS Total Return Bond Fund
Portfolio of investments
June 30, 2021
| Face amount | Value | ||||||||||
Corporate bonds—(concluded) | |||||||||||
United States—(concluded) | |||||||||||
| Union Pacific Corp. 4.050%, due 11/15/45 | $ | 40,000 | $ | 45,650 | |||||||
| Verizon Communications, Inc. 2.987%, due 10/30/56 | 226,000 | 212,448 | |||||||||
| Virginia Electric and Power Co. 4.600%, due 12/01/48 | 50,000 | 64,558 | |||||||||
| Walt Disney Co. 4.950%, due 10/15/45 | 50,000 | 67,372 | |||||||||
| Wells Fargo & Co. (fixed, converts to FRN on 06/17/26), 3.196%, due 06/17/27 | 70,000 | 75,546 | |||||||||
| Yale University, Series 2020, 1.482%, due 04/15/30 | 100,000 | 98,521 | |||||||||
12,834,470 | |||||||||||
| Total corporate bonds (cost $13,698,502) | 14,635,282 | ||||||||||
Mortgage-backed securities: 18.7% | |||||||||||
United States: 18.7% | |||||||||||
| Angel Oak Mortgage Trust, Series 2019-5, Class A1, 2.593%, due 10/25/491,6 | $ | 83,145 | $ | 83,483 | |||||||
| Series 2020-4, Class A1, 1.469%, due 06/25/651,6 | 124,095 | 124,813 | |||||||||
| Series 2020-R1, Class A1, 0.990%, due 04/25/531,6 | 142,204 | 142,182 | |||||||||
| Angel Oak Mortgage Trust I LLC, Series 2018-3, Class A1, 3.649%, due 09/25/481,6 | 41,745 | 42,006 | |||||||||
| Series 2019-4, Class A1, 2.993%, due 07/26/491,6 | 93,278 | 94,056 | |||||||||
| Angel Oak Mortgage Trust LLC, Series 2020-5, Class A1, 1.373%, due 05/25/651,6 | 78,861 | 79,139 | |||||||||
| BANK, Series 2018-BN15, Class A4, 4.407%, due 11/15/616 | 150,000 | 175,279 | |||||||||
| BBCMS Trust, Series 2015-SRCH, Class B, 4.498%, due 08/10/351 | 135,000 | 153,070 | |||||||||
| BENCHMARK Mortgage Trust, Series 2018-B5, Class A3, 3.944%, due 07/15/51 | 100,000 | 113,843 | |||||||||
| Series 2019-B10, Class C, 3.750%, due 03/15/62 | 200,000 | 212,933 | |||||||||
| Series 2020-B20, Class AS, 2.375%, due 10/15/53 | 175,000 | 177,590 | |||||||||
| BX Trust, Series 2021-SOAR, Class D, 1 mo. USD LIBOR + 1.400%, 1.500%, due 06/15/381,2 | 150,000 | 150,180 | |||||||||
| Face amount | Value | ||||||||||
Mortgage-backed securities—(continued) | |||||||||||
United States—(continued) | |||||||||||
| COLT Mortgage Loan Trust, Series 2020-2, Class A1, 1.853%, due 03/25/651,6 | $ | 48,082 | $ | 48,338 | |||||||
| Series 2020-3, Class A1, 1.506%, due 04/27/651,6 | 54,154 | 54,363 | |||||||||
| COLT Mortgage Pass-Through Certificates, Series 2021-1R, Class A1, 0.857%, due 05/25/651,6 | 67,625 | 67,552 | |||||||||
| COMM Mortgage Trust, Series 2021-LBA, Class C, 1 mo. USD LIBOR + 1.200%, 1.273%, due 03/15/381,2 | 425,000 | 425,000 | |||||||||
| CSMC Trust, Series 2020-NQM1, Class A1, 1.208%, due 05/25/651,7 | 143,172 | 144,081 | |||||||||
| Deephaven Residential Mortgage Trust, Series 2021-1, Class A1, 0.715%, due 05/25/651,6 | 108,231 | 108,167 | |||||||||
| Extended Stay America Trust, Series 2021-ESH, Class D, 1 mo. USD LIBOR + 2.250%, 2.325%, due 07/15/381,2,8 | 125,000 | 125,601 | |||||||||
| FREMF Mortgage Trust, Series 2017-K64, Class B, 4.117%, due 05/25/501,6 | 50,000 | 55,411 | |||||||||
| GB Trust, Series 2020-FLIX, Class C, 1 mo. USD LIBOR + 1.600%, 1.673%, due 08/15/371,2 | 125,000 | 125,350 | |||||||||
| GS Mortgage Securities Trust, Series 2017-GS5, Class B, 4.047%, due 03/10/506 | 200,000 | 219,353 | |||||||||
| GS Mortgage-Backed Securities Trust, Series 2020-NQM1, Class A1, 1.382%, due 09/27/601,6 | 69,847 | 70,083 | |||||||||
| JPMBB Commercial Mortgage Securities Trust, Series 2014-C26, Class AS, 3.800%, due 01/15/48 | 200,000 | 215,154 | |||||||||
| Series 2015-C30, Class A5, 3.822%, due 07/15/48 | 170,000 | 186,716 | |||||||||
| MHC Commercial Mortgage Trust, Series 2021-MHC, Class D, 1 mo. USD LIBOR + 1.601%, 1.674%, due 04/15/381,2 | 300,000 | 300,282 | |||||||||
| Morgan Stanley Bank of America Merrill Lynch Trust, Series 2015-C24, Class A4, 3.732%, due 05/15/48 | 100,000 | 109,421 | |||||||||
| Series 2015-C24, Class AS, 4.036%, due 05/15/486 | 75,000 | 81,932 | |||||||||
| Series 2016-C32, Class AS, 3.994%, due 12/15/496 | 273,000 | 299,760 | |||||||||
| Series 2017-C34, Class C, 4.318%, due 11/15/526 | 100,000 | 107,446 | |||||||||
112
UBS Total Return Bond Fund
Portfolio of investments
June 30, 2021
| Face amount | Value | ||||||||||
Mortgage-backed securities—(concluded) | |||||||||||
United States—(concluded) | |||||||||||
| New Residential Mortgage Loan Trust, Series 2020-NQM2, Class A1, 1.650%, due 05/24/601,6 | $ | 58,402 | $ | 59,066 | |||||||
| ONE Mortgage Trust, Series 2021-PARK, Class C, 1 mo. USD LIBOR + 1.100%, 1.173%, due 03/15/361,2 | 375,000 | 374,549 | |||||||||
| Residential Mortgage Loan Trust, Series 2019-3, Class A1, 2.633%, due 09/25/591,6 | 88,236 | 89,262 | |||||||||
| Series 2020-2, Class A1, 1.654%, due 05/25/601,6 | 74,514 | 74,983 | |||||||||
| RETL, Series 2019-RVP, Class C, 1 mo. USD LIBOR + 2.100%, 2.173%, due 03/15/361,2 | 109,757 | 109,479 | |||||||||
| SLG Office Trust, Series 2021-OVA, Class C, 2.851%, due 07/15/411 | 100,000 | 103,717 | |||||||||
| Starwood Retail Property Trust, Series 2014-STAR, Class C, 1 mo. USD LIBOR + 2.750%, 2.823%, due 11/15/271,2 | 125,000 | 5,000 | |||||||||
| Verus Securitization Trust, Series 2019-3, Class A1, 2.784%, due 07/25/591,7 | 64,674 | 65,486 | |||||||||
| Series 2019-4, Class A1, 2.642%, due 11/25/591,7 | 61,790 | 62,823 | |||||||||
| Series 2020-4, Class A1, 1.502%, due 05/25/651,7 | 71,600 | 72,012 | |||||||||
| Series 2020-5, Class A1, 1.218%, due 05/25/651,7 | 73,057 | 73,245 | |||||||||
| Series 2021-1, Class A1, 0.815%, due 01/25/661,6 | 86,085 | 86,001 | |||||||||
| Series 2021-3, Class A1, 1.024%, due 06/25/661,3,6,9 | 400,000 | 399,997 | |||||||||
| Series 2021-R1, Class A1, 0.820%, due 10/25/631,6 | 156,936 | 156,801 | |||||||||
| Series 2021-R3, Class A1, 1.020%, due 04/25/641,6 | 281,422 | 281,130 | |||||||||
| Vista Point Securitization Trust, Series 2020-1, Class A1, 1.763%, due 03/25/651,6 | 53,984 | 54,490 | |||||||||
| Series 2020-2, Class A1, 1.475%, due 04/25/651,6 | 75,140 | 75,543 | |||||||||
| Wells Fargo Commercial Mortgage Trust, Series 2018-C44, Class C, 4.995%, due 05/15/516 | 150,000 | 157,530 | |||||||||
| Total mortgage-backed securities (cost $6,599,429) | 6,593,698 | ||||||||||
| Face amount | Value | ||||||||||
Municipal bonds: 1.8% | |||||||||||
California: 1.1% | |||||||||||
| State of California, GO Bonds 7.300%, due 10/01/39 | $ | 250,000 | $ | 400,102 | |||||||
Hawaii: 0.2% | |||||||||||
| State of Hawaii, GO Bonds, Series FZ, 2.245%, due 08/01/38 | 75,000 | 72,429 | |||||||||
Illinois: 0.2% | |||||||||||
| State of Illinois, GO Bonds 6.630%, due 02/01/35 | 50,000 | 62,447 | |||||||||
Texas: 0.3% | |||||||||||
| Texas Transportation Commission, Taxable Refunding, GO Bonds 2.472%, due 10/01/44 | 100,000 | 98,798 | |||||||||
| Total municipal bonds (cost $593,938) | 633,776 | ||||||||||
Non-U.S. government agency obligations: 3.2% | |||||||||||
Colombia: 0.5% | |||||||||||
| Colombia Government International Bond 8.125%, due 05/21/24 | 155,000 | 182,977 | |||||||||
Indonesia: 0.4% | |||||||||||
| Indonesia Government International Bond 6.625%, due 02/17/371 | 100,000 | 137,738 | |||||||||
Mexico: 0.5% | |||||||||||
| Mexico Government International Bond 4.750%, due 03/08/44 | 150,000 | 166,106 | |||||||||
New Zealand: 1.0% | |||||||||||
| New Zealand Government Bond 1.500%, due 05/15/31 | NZD | 500,000 | 340,773 | ||||||||
Panama: 0.1% | |||||||||||
| Panama Government International Bond 3.870%, due 07/23/60 | 50,000 | 50,978 | |||||||||
Turkey: 0.3% | |||||||||||
| Turkey Government International Bond 6.875%, due 03/17/364 | 100,000 | 100,894 | |||||||||
Uruguay: 0.4% | |||||||||||
| Uruguay Government International Bond 7.625%, due 03/21/36 | 100,000 | 152,144 | |||||||||
| Total non-U.S. government agency obligations (cost $1,106,713) | 1,131,610 | ||||||||||
113
UBS Total Return Bond Fund
Portfolio of investments
June 30, 2021
| Face amount | Value | ||||||||||
U.S. government agency obligations: 19.9% | |||||||||||
United States: 19.9% | |||||||||||
| FHLMC 2.500%, due 10/01/50 | $ | 92,882 | $ | 96,849 | |||||||
3.000%, due 09/01/43 | 83,655 | 89,631 | |||||||||
3.500%, due 08/01/47 | 133,667 | 141,305 | |||||||||
3.500%, due 11/01/47 | 144,939 | 153,220 | |||||||||
4.000%, due 01/01/46 | 62,770 | 68,322 | |||||||||
4.000%, due 05/01/47 | 52,655 | 56,344 | |||||||||
4.000%, due 10/01/47 | 32,868 | 35,171 | |||||||||
| FNMA 1.500%, due 03/01/51 | 49,226 | 48,300 | |||||||||
2.000%, due 09/01/50 | 134,115 | 135,563 | |||||||||
2.000%, due 01/01/51 | 242,654 | 245,274 | |||||||||
2.000%, due 03/01/51 | 344,108 | 347,823 | |||||||||
2.500%, due 11/01/50 | 92,811 | 96,421 | |||||||||
2.500%, due 03/01/51 | 146,069 | 151,157 | |||||||||
3.000%, due 02/01/33 | 114,343 | 120,525 | |||||||||
3.000%, due 09/01/42 | 76,870 | 81,520 | |||||||||
3.000%, due 07/01/43 | 60,579 | 64,311 | |||||||||
3.000%, due 05/01/46 | 65,234 | 68,612 | |||||||||
3.000%, due 08/01/50 | 83,046 | 87,726 | |||||||||
3.500%, due 04/01/32 | 59,201 | 64,055 | |||||||||
3.500%, due 06/01/45 | 69,535 | 75,248 | |||||||||
3.500%, due 06/01/46 | 123,523 | 134,243 | |||||||||
4.000%, due 09/01/40 | 61,298 | 67,034 | |||||||||
4.000%, due 03/01/41 | 19,683 | 21,527 | |||||||||
4.000%, due 12/01/43 | 112,592 | 124,332 | |||||||||
4.000%, due 02/01/45 | 74,163 | 81,993 | |||||||||
4.500%, due 02/01/44 | 15,865 | 17,762 | |||||||||
4.500%, due 12/01/44 | 13,767 | 15,295 | |||||||||
4.500%, due 02/01/45 | 22,118 | 24,572 | |||||||||
4.500%, due 08/01/46 | 13,357 | 14,814 | |||||||||
4.500%, due 05/01/47 | 37,780 | 41,778 | |||||||||
5.500%, due 03/01/33 | 23,499 | 27,070 | |||||||||
5.500%, due 09/01/34 | 55,681 | 62,920 | |||||||||
5.500%, due 11/01/34 | 22,370 | 25,983 | |||||||||
6.000%, due 11/01/28 | 22,749 | 25,582 | |||||||||
| GNMA 6.500%, due 05/15/29 | 5,959 | 6,708 | |||||||||
| GNMA II 2.500%, due 02/20/51 | 146,824 | 152,038 | |||||||||
2.500%, due 03/20/51 | 49,279 | 51,029 | |||||||||
3.000%, due 09/20/44 | 40,464 | 42,867 | |||||||||
3.000%, due 12/20/50 | 139,665 | 146,021 | |||||||||
3.500%, due 02/20/43 | 10,693 | 11,580 | |||||||||
4.000%, due 06/20/44 | 7,144 | 7,771 | |||||||||
4.000%, due 09/20/44 | 28,016 | 30,471 | |||||||||
4.000%, due 05/20/45 | 6,925 | 7,523 | |||||||||
5.000%, due 08/20/48 | 10,854 | 11,783 | |||||||||
| GNMA TBA 2.000% | 175,000 | 178,199 | |||||||||
| 2.500% | 125,000 | 129,292 | |||||||||
| 3.000% | 50,000 | 52,156 | |||||||||
| Face amount | Value | ||||||||||
U.S. government agency obligations—(concluded) | |||||||||||
United States—(concluded) | |||||||||||
| UMBS TBA 1.500% | $ | 150,000 | $ | 151,753 | |||||||
| 2.000% | 975,000 | 988,139 | |||||||||
| 2.500% | 750,000 | 775,061 | |||||||||
| 3.000% | 1,025,000 | 1,068,501 | |||||||||
| 3.500% | 275,000 | 289,437 | |||||||||
| Total U.S. government agency obligations (cost $6,967,916) | 7,012,611 | ||||||||||
U.S. Treasury obligations: 1.3% | |||||||||||
United States: 1.3% | |||||||||||
| U.S. Treasury Bonds 1.250%, due 05/15/50 | 105,000 | 85,735 | |||||||||
2.000%, due 02/15/50 | 35,000 | 34,385 | |||||||||
| U.S. Treasury Notes 0.625%, due 08/15/30 | 50,000 | 46,582 | |||||||||
1.125%, due 02/15/31 | 300,000 | 291,234 | |||||||||
| Total U.S. Treasury obligations (cost $482,283) | 457,936 | ||||||||||
| Number of shares | |||||||||||
Short-term investments: 8.1% | |||||||||||
Investment companies: 8.1% | |||||||||||
| State Street Institutional U.S. Government Money Market Fund, 0.030%10 (cost $2,876,875) | 2,876,875 | 2,876,875 | |||||||||
Investment of cash collateral from securities loaned: 0.4% | |||||||||||
Money market funds: 0.4% | |||||||||||
| State Street Navigator Securities Lending Government Money Market Portfolio, 0.020%10 (cost $156,650) | 156,650 | 156,650 | |||||||||
| Total investments (cost $37,835,484)—110.2% | 38,921,494 | ||||||||||
Liabilities in excess of other assets: (10.2)% | (3,611,906 | ) | |||||||||
Net assets: 100.0% | $ | 35,309,588 | |||||||||
114
UBS Total Return Bond Fund
Portfolio of investments
June 30, 2021
For a listing of defined portfolio acronyms that are used throughout the Portfolio of investments as well as the tables that follow, please refer to the Glossary of terms used in the Portfolio of investments.
Futures contracts
Number of | Currency | Expiration | Current | Value | Unrealized | ||||||||||||||||||||||
U.S. Treasury futures buy contracts: | |||||||||||||||||||||||||||
3 | USD | U.S. Treasury Note 10 Year Futures | September 2021 | $ | 397,551 | $ | 397,500 | $ | (51 | ) | |||||||||||||||||
16 | USD | U.S. Treasury Note 2 Year Futures | September 2021 | 3,530,492 | 3,525,125 | (5,367 | ) | ||||||||||||||||||||
10 | USD | U.S. Ultra Long Treasury Bond Futures | September 2021 | 1,851,812 | 1,926,875 | 75,063 | |||||||||||||||||||||
7 | USD | U.S. Ultra Treasury Note 10 Year Futures | September 2021 | 1,015,174 | 1,030,422 | 15,248 | |||||||||||||||||||||
Total | $ | 6,795,029 | $ | 6,879,922 | $ | 84,893 | |||||||||||||||||||||
Interest rate futures sell contracts: | |||||||||||||||||||||||||||
2 | EUR | German Euro Bund Futures | September 2021 | $ | (407,350 | ) | $ | (409,345 | ) | $ | (1,995 | ) | |||||||||||||||
6 | GBP | United Kingdom Long Gilt Bond Futures | September 2021 | (1,053,654 | ) | (1,063,204 | ) | (9,550 | ) | ||||||||||||||||||
U.S. Treasury futures sell contracts: | |||||||||||||||||||||||||||
8 | USD | U.S. Treasury Note 5 Year Futures | September 2021 | $ | (989,895 | ) | $ | (987,438 | ) | $ | 2,457 | ||||||||||||||||
Total | $ | (2,450,899 | ) | $ | (2,459,987 | ) | $ | (9,088 | ) | ||||||||||||||||||
Net unrealized appreciation (depreciation) | $ | 75,805 | |||||||||||||||||||||||||
OTC Total return swap agreements
Counterparty | Notional amount (000) | Maturity date | Payment frequency | Payments made by the Portfolio11 | Payments received by the Portfolio11 | Upfront payments received (made) | Value | Unrealized appreciation (depreciation) | |||||||||||||||||||||||||||
JPMCB | USD | 300 | 09/20/21 | Quarterly | iBoxx USD Liquid High Yield Index | 3 Month USD LIBOR | $ | — | $ | 2,618 | $ | 2,618 | |||||||||||||||||||||||
Forward foreign currency contracts
Counterparty | Sell | Purchase | Settlement date | Unrealized appreciation (depreciation) | |||||||||||||||
BB | USD | 370,490 | MXN | 7,600,000 | 07/21/21 | $ | 9,878 | ||||||||||||
CITI | EUR | 2,085,000 | USD | 2,491,832 | 07/21/21 | 18,563 | |||||||||||||
JPMCB | NZD | 485,000 | USD | 342,104 | 07/21/21 | 3,101 | |||||||||||||
JPMCB | USD | 2,492,450 | EUR | 2,085,000 | 07/21/21 | (19,181 | ) | ||||||||||||
Net unrealized appreciation (depreciation) | $ | 12,361 | |||||||||||||||||
115
UBS Total Return Bond Fund
Portfolio of investments
June 30, 2021
Fair valuation summary
The following is a summary of the fair valuations according to the inputs used as of June 30, 2021 in valuing the Fund's investments. In the event a Fund holds investments for which fair value is measured using the NAV per share practical expedient (or its equivalent), a separate column will be added to the fair value hierarchy table; this is intended to permit reconciliation to the amounts presented in the Portfolio of investments:
Description | Unadjusted quoted prices in active markets for identical investments (Level 1) | Other significant observable inputs (Level 2) | Unobservable inputs (Level 3) | Total | |||||||||||||||
Assets | |||||||||||||||||||
Asset-backed securities | $ | — | $ | 5,423,056 | $ | — | $ | 5,423,056 | |||||||||||
Corporate bonds | — | 14,635,282 | — | 14,635,282 | |||||||||||||||
Mortgage-backed securities | — | 6,193,701 | 399,997 | 6,593,698 | |||||||||||||||
Municipal bonds | — | 633,776 | — | 633,776 | |||||||||||||||
Non-U.S. government agency obligations | — | 1,131,610 | — | 1,131,610 | |||||||||||||||
U.S. government agency obligations | — | 7,012,611 | — | 7,012,611 | |||||||||||||||
U.S. Treasury obligations | — | 457,936 | — | 457,936 | |||||||||||||||
Short-term investments | — | 2,876,875 | — | 2,876,875 | |||||||||||||||
Investment of cash collateral from securities loaned | — | 156,650 | — | 156,650 | |||||||||||||||
Futures contracts | 92,768 | — | — | 92,768 | |||||||||||||||
Swap agreements | — | 2,618 | — | 2,618 | |||||||||||||||
Forward foreign currency contracts | — | 31,542 | — | 31,542 | |||||||||||||||
Total | $ | 92,768 | $ | 38,555,657 | $ | 399,997 | $ | 39,048,422 | |||||||||||
Liabilities | |||||||||||||||||||
Futures contracts | $ | (16,963 | ) | $ | — | $ | — | $ | (16,963 | ) | |||||||||
Forward foreign currency contracts | — | (19,181 | ) | — | (19,181 | ) | |||||||||||||
Total | $ | (16,963 | ) | $ | (19,181 | ) | $ | — | $ | (36,144 | ) | ||||||||
At June 30, 2021, there were $129,473 transferred out of Level 3.
Securities valued using unobservable inputs, i.e. Level 3, were not considered significant to the Fund.
Portfolio footnotes
1 Security exempt from registration pursuant to Rule 144A under the Securities Act of 1933. These securities are considered liquid, unless noted otherwise, and may be resold in transactions exempt from registration, normally to qualified institutional buyers. Securities exempt from registration pursuant to Rule 144A, in the amount of $9,993,917, represented 28.3% of the Fund's net assets at period end.
2 Variable or floating rate security. The interest rate shown is the rate in effect as of period end and changes periodically.
3 Security fair valued by the Valuation Committee under the direction of the Board of Trustees.
4 Security, or portion thereof, was on loan at the period end.
5 Perpetual investment. Date shown reflects the next call date.
6 Variable or floating rate security for which the interest rate adjusts periodically based on changes in current interest rates and prepayments on the underlying pool of assets. Rate shown is the rate in effect as of period end.
7 Step bond—coupon rate increases in increments to maturity. The rate disclosed is the rate at the period end; the maturity date disclosed is the ultimate maturity date.
8 Security purchased on a when-issued basis. When-issued refers to a transaction made conditionally because a security, although authorized, has not yet been issued.
9 Significant unobservable inputs were used in the valuation of this security; i.e. Level 3.
10 Rates shown reflect yield at June 30, 2021.
11 Payments made or received are based on the notional amount.
See accompanying notes to financial statements
116
The UBS Funds
Glossary of terms used in the Portfolio of investments
June 30, 2021
Portfolio acronyms
ADR American Depositary Receipt
AGM Assured Guaranty Municipal Corporation
CDO Collateralized Debt Obligation
COP Certificate of Participation
ETF Exchange Traded Fund
EURIBOR Euro Interbank Offered Rate
FHLMC Federal Home Loan Mortgage Corporation
FNMA Federal National Mortgage Association
FRN Floating Rate Note
GDR Global Depositary Receipt
GNMA Government National Mortgage Association
GO General Obligation
LIBOR London Interbank Offered Rate
OAT Obligation Assimilables du Trésor (French Government Bonds)
OTC Over The Counter
PJSC Private Joint Stock Company
REIT Real Estate Investment Trust
TBA To-Be-Announced Security
UMBS Uniform Mortgage-Backed Securities
Counterparty abbreviations
BB Barclays Bank PLC
BOA Bank of America NA
CIBC Canadian Imperial Bank of Commerce
CITI Citibank NA
GSI Goldman Sachs International
HSBC HSBC Bank PLC
JPMCB JPMorgan Chase Bank
MSCI Morgan Stanley & Co. International PLC
SSC State Street Bank and Trust Co.
Currency abbreviations
AUD Australian Dollar
BRL Brazilian Real
CAD Canadian Dollar
CHF Swiss Franc
CNY Chinese Yuan
COP Colombian Peso
EUR Euro
GBP Great Britain Pound
HKD Hong Kong Dollar
INR Indian Rupee
JPY Japanese Yen
KRW South Korean Won
MXN Mexican Peso
MYR Malaysian Ringgit
NOK Norwegian Krone
NZD New Zealand Dollar
PHP Philippine Peso
PLN Polish Zloty
RUB Russian Ruble
SEK Swedish Krona
SGD Singapore Dollar
THB Thailand Baht
TWD Taiwan Dollar
USD United States Dollar
117
The UBS Funds
June 30, 2021 (unaudited)
Explanation of expense disclosure
As a shareholder of the Funds, you incur two types of costs: (1) transactional costs (as applicable); including sales charges (loads); and (2) ongoing costs, including management fees; service and/or distribution (12b-1) fees (if applicable); and other Fund expenses. This example is intended to help you understand your ongoing costs (in dollars) of investing in each Fund and to compare these costs with the ongoing costs of investing in other mutual funds.
The example below is based on an investment of $1,000 invested at the beginning of the period and held for the entire period, December 31, 2020 to June 30, 2021 (unless otherwise noted).
Actual expenses
The first line for each class of shares in the table below provides information about actual account values and actual expenses. You may use the information in this line, together with the amount you invested, to estimate the expenses that you paid over a period. Simply divide your account value by $1,000 (for example, an $8,600 account value divided by $1,000 = 8.6), then multiply the result by the number in the first line under the heading entitled "Expenses paid during period" to estimate the expenses you paid on your account during this period.
Hypothetical example for comparison purposes
The second line for each class of shares in the table below provides information about hypothetical account values and hypothetical expenses based on that Fund's actual expense ratios for each class of shares and an assumed rate of return of 5% per year before expenses, which is not that Fund's actual return for each class of shares. The hypo- thetical account values and expenses may not be used to estimate the actual ending account balance or expenses you paid for the period. You may use this information to compare the ongoing costs of investing in a Fund and other funds. To do so, compare this 5% hypothetical example with the 5% hypothetical examples that appear in the shareholder reports of other funds.
Please note that the expenses shown in the table are meant to highlight your ongoing costs only and do not reflect any transactional costs (as applicable), such as sales charges (loads). Therefore, the second line in the table for each class of shares is useful in comparing ongoing costs only, and will not help you determine the relative total costs of owning different funds. In addition, if these transactional costs were included, your costs would have been higher.
118
The UBS Funds
June 30, 2021
| Beginning account value January 1, 2021 | Ending account value June 30, 2021 | Expenses paid during period 01/01/21 to 06/30/21* | Expense ratio during the period | ||||||||||||||||||||
UBS All China Equity Fund1 | |||||||||||||||||||||||
Class P | Actual | $ | 1,000.00 | $ | 884.00 | $ | 3.61 | 1.10 | % | ||||||||||||||
Hypothetical (5% annual return before expenses) | 1,000.00 | 1,019.34 | 5.51 | 1.10 | |||||||||||||||||||
UBS Dynamic Alpha Fund | |||||||||||||||||||||||
Class A | Actual | 1,000.00 | 1,039.60 | 6.83 | 1.35 | ||||||||||||||||||
Hypothetical (5% annual return before expenses) | 1,000.00 | 1,018.10 | 6.76 | 1.35 | |||||||||||||||||||
Class P | Actual | 1,000.00 | 1,041.50 | 5.57 | 1.10 | ||||||||||||||||||
Hypothetical (5% annual return before expenses) | 1,000.00 | 1,019.34 | 5.51 | 1.10 | |||||||||||||||||||
UBS Global Allocation Fund | |||||||||||||||||||||||
Class A | Actual | 1,000.00 | 1,049.60 | 6.10 | 1.20 | ||||||||||||||||||
Hypothetical (5% annual return before expenses) | 1,000.00 | 1,018.84 | 6.01 | 1.20 | |||||||||||||||||||
Class P | Actual | 1,000.00 | 1,051.20 | 4.83 | 0.95 | ||||||||||||||||||
Hypothetical (5% annual return before expenses) | 1,000.00 | 1,020.08 | 4.76 | 0.95 | |||||||||||||||||||
UBS Emerging Markets Equity Opportunity Fund | |||||||||||||||||||||||
Class P | Actual | 1,000.00 | 1,016.40 | 5.00 | 1.00 | ||||||||||||||||||
Hypothetical (5% annual return before expenses) | 1,000.00 | 1,019.84 | 5.01 | 1.00 | |||||||||||||||||||
Class P2 | Actual | 1,000.00 | 1,020.40 | 0.60 | 0.12 | ||||||||||||||||||
Hypothetical (5% annual return before expenses) | 1,000.00 | 1,024.20 | 0.60 | 0.12 | |||||||||||||||||||
UBS Engage for Impact Fund | |||||||||||||||||||||||
Class P | Actual | 1,000.00 | 1,096.10 | 4.42 | 0.85 | ||||||||||||||||||
Hypothetical (5% annual return before expenses) | 1,000.00 | 1,020.58 | 4.26 | 0.85 | |||||||||||||||||||
Class P22 | Actual | 1,000.00 | 1,037.80 | 0.89 | 0.25 | ||||||||||||||||||
Hypothetical (5% annual return before expenses) | 1,000.00 | 1,023.55 | 1.25 | 0.25 | |||||||||||||||||||
UBS International Sustainable Equity Fund | |||||||||||||||||||||||
Class A | Actual | 1,000.00 | 1,058.50 | 6.38 | 1.25 | ||||||||||||||||||
Hypothetical (5% annual return before expenses) | 1,000.00 | 1,018.60 | 6.26 | 1.25 | |||||||||||||||||||
Class P | Actual | 1,000.00 | 1,060.10 | 5.36 | 1.05 | ||||||||||||||||||
Hypothetical (5% annual return before expenses) | 1,000.00 | 1,019.59 | 5.26 | 1.05 | |||||||||||||||||||
Class P2 | Actual | 1,000.00 | 1,064.20 | 1.18 | 0.23 | ||||||||||||||||||
Hypothetical (5% annual return before expenses) | 1,000.00 | 1,023.65 | 1.15 | 0.23 | |||||||||||||||||||
* Expenses are equal to the Fund's annualized net expense ratio, multiplied by the average account value over the period, multiplied by 181 divided by 365 (to reflect the one-half year period).
1 The Fund commenced operations on February 23, 2021. Expenses are equal to the Fund's annualized net expense ratio, multiplied by the average account value over the period, multiplied by 127 divided by 365 (to reflect the actual days in the period) for the actual example and 181 divided by 365 (to reflect the one-half year period) for the hypothetical example.
2 The Fund commenced operations on February 24, 2021. Expenses are equal to the Fund's annualized net expense ratio, multiplied by the average account value over the period, multiplied by 127 divided by 365 (to reflect the actual days in the period) for the actual example and 181 divided by 365 (to reflect the one-half year period) for the hypothetical example.
119
The UBS Funds
June 30, 2021
| Beginning account value January 1, 2021 | Ending account value June 30, 2021 | Expenses paid during period 01/01/21 to 06/30/21* | Expense ratio during the period | ||||||||||||||||||||
UBS US Dividend Ruler Fund | |||||||||||||||||||||||
Class P | Actual | $ | 1,000.00 | $ | 1,121.60 | $ | 2.63 | 0.50 | % | ||||||||||||||
Hypothetical (5% annual return before expenses) | 1,000.00 | 1,022.32 | 2.51 | 0.50 | |||||||||||||||||||
UBS US Quality Growth At Reasonable Price Fund | |||||||||||||||||||||||
Class P | Actual | 1,000.00 | 1,147.10 | 2.66 | 0.50 | ||||||||||||||||||
Hypothetical (5% annual return before expenses) | 1,000.00 | 1,022.32 | 2.51 | 0.50 | |||||||||||||||||||
UBS U.S. Small Cap Growth Fund | |||||||||||||||||||||||
Class A | Actual | 1,000.00 | 1,079.70 | 6.39 | 1.24 | ||||||||||||||||||
Hypothetical (5% annual return before expenses) | 1,000.00 | 1,018.65 | 6.21 | 1.24 | |||||||||||||||||||
Class P | Actual | 1,000.00 | 1,081.30 | 5.11 | 0.99 | ||||||||||||||||||
Hypothetical (5% annual return before expenses) | 1,000.00 | 1,019.89 | 4.96 | 0.99 | |||||||||||||||||||
UBS Municipal Bond Fund | |||||||||||||||||||||||
Class A | Actual | 1,000.00 | 1,001.90 | 3.23 | 0.65 | ||||||||||||||||||
Hypothetical (5% annual return before expenses) | 1,000.00 | 1,021.57 | 3.26 | 0.65 | |||||||||||||||||||
Class P | Actual | 1,000.00 | 1,003.10 | 1.99 | 0.40 | ||||||||||||||||||
Hypothetical (5% annual return before expenses) | 1,000.00 | 1,022.81 | 2.01 | 0.40 | |||||||||||||||||||
UBS Sustainable Development Bank Bond Fund | |||||||||||||||||||||||
Class P | Actual | 1,000.00 | 982.20 | 1.23 | 0.25 | ||||||||||||||||||
Hypothetical (5% annual return before expenses) | 1,000.00 | 1,023.55 | 1.25 | 0.25 | |||||||||||||||||||
Class P2 | Actual | 1,000.00 | 983.00 | 0.74 | 0.15 | ||||||||||||||||||
Hypothetical (5% annual return before expenses) | 1,000.00 | 1,024.05 | 0.75 | 0.15 | |||||||||||||||||||
UBS Total Return Bond Fund | |||||||||||||||||||||||
Class A | Actual | 1,000.00 | 987.90 | 3.70 | 0.75 | ||||||||||||||||||
Hypothetical (5% annual return before expenses) | 1,000.00 | 1,021.08 | 3.76 | 0.75 | |||||||||||||||||||
Class P | Actual | 1,000.00 | 989.20 | 2.47 | 0.50 | ||||||||||||||||||
Hypothetical (5% annual return before expenses) | 1,000.00 | 1,022.32 | 2.51 | 0.50 | |||||||||||||||||||
* Expenses are equal to the Fund's annualized net expense ratio, multiplied by the average account value over the period, multiplied by 181 divided by 365 (to reflect the one-half year period).
120
This page intentionally left blank.
121
The UBS Funds
Financial statements
Statement of assets and liabilities—June 30, 2021
| UBS All China Equity Fund | UBS Dynamic Alpha Fund | UBS Global Allocation Fund | |||||||||||||
Assets: | |||||||||||||||
Investments, at cost | |||||||||||||||
Unaffiliated issuers | $ | 1,897,455 | $ | 37,478,140 | $ | 197,659,444 | |||||||||
Affiliated issuers | — | — | 16,515,265 | ||||||||||||
Foreign currency | 20,949 | 331,784 | 984,074 | ||||||||||||
Investments, at value | |||||||||||||||
Unaffiliated issuers1 | $ | 1,763,664 | $ | 30,796,447 | $ | 226,958,381 | |||||||||
Affiliated issuers | — | — | 20,253,259 | ||||||||||||
Foreign currency | 20,940 | 329,036 | 966,399 | ||||||||||||
Cash | — | 50,890 | 3,070 | ||||||||||||
Cash collateral on futures | — | 577,122 | 5,223,825 | ||||||||||||
Cash collateral on swap agreements | — | 124,577 | 1,904,091 | ||||||||||||
Due from broker | — | 2,334,072 | 785,133 | ||||||||||||
Receivable for investments sold | — | — | 8,028,813 | ||||||||||||
Receivable for fund shares sold | — | 2,320 | 1,141 | ||||||||||||
Receivable for interest and dividends | 2,714 | 122,106 | 422,758 | ||||||||||||
Receivable for foreign tax reclaims | — | — | 132,803 | ||||||||||||
Receivable from affiliate | 21,831 | — | — | ||||||||||||
Receivable for variation margin on centrally cleared swap agreements | — | 71,247 | 407,385 | ||||||||||||
Unrealized appreciation on forward foreign currency contracts | — | 247,691 | 1,743,534 | ||||||||||||
Deferred offering cost | 42,774 | — | — | ||||||||||||
Other assets | 3,841 | 21,527 | 32,517 | ||||||||||||
Total assets | 1,855,764 | 34,677,035 | 266,863,109 | ||||||||||||
Liabilities: | |||||||||||||||
Due to broker | — | — | — | ||||||||||||
Payable for cash collateral from securities loaned | — | 101,525 | 1,796,278 | ||||||||||||
Payable for investments purchased | — | — | 12,331,047 | ||||||||||||
Payable for fund shares redeemed | — | 81,963 | 364,966 | ||||||||||||
Payable to affiliate | — | 21,159 | 175,024 | ||||||||||||
Payable to Trustees | 6,000 | 8,930 | 17,258 | ||||||||||||
Payable to custodian | 4,334 | 18,215 | 48,833 | ||||||||||||
Payable for foreign withholding taxes and foreign capital gains taxes | — | — | 4,464 | ||||||||||||
Payable for variation margin on futures contracts | — | 96,589 | 842,050 | ||||||||||||
Unrealized depreciation on forward foreign currency contracts | — | 78,372 | 1,830,820 | ||||||||||||
Accrued expenses and other liabilities | 78,426 | 197,336 | 297,005 | ||||||||||||
Total liabilities | 88,760 | 604,089 | 17,707,745 | ||||||||||||
Net assets | $ | 1,767,004 | $ | 34,072,946 | $ | 249,155,364 | |||||||||
1 Includes $0; $99,385; $20,195,920; $28,331,178; $1,185,429 and $10,359,349, respectively of investments in securities on loan, at value, plus accrued interest and dividends, if any.
122
The UBS Funds
| UBS Emerging Markets Equity Opportunity Fund | UBS Engage for Impact Fund | UBS International Sustainable Equity Fund | |||||||||||||
Assets: | |||||||||||||||
Investments, at cost | |||||||||||||||
Unaffiliated issuers | $ | 886,693,294 | $ | 43,083,931 | $ | 375,015,206 | |||||||||
Affiliated issuers | — | — | — | ||||||||||||
Foreign currency | 4,900,211 | 94,366 | 1,666,978 | ||||||||||||
Investments, at value | |||||||||||||||
Unaffiliated issuers1 | $ | 1,043,208,404 | $ | 50,620,448 | $ | 431,284,477 | |||||||||
Affiliated issuers | — | — | — | ||||||||||||
Foreign currency | 4,874,202 | 93,901 | 1,659,389 | ||||||||||||
Cash | — | — | — | ||||||||||||
Cash collateral on futures | — | — | — | ||||||||||||
Cash collateral on swap agreements | — | — | — | ||||||||||||
Due from broker | — | — | — | ||||||||||||
Receivable for investments sold | — | — | — | ||||||||||||
Receivable for fund shares sold | 3,884,485 | 55,473 | 1,688,391 | ||||||||||||
Receivable for interest and dividends | 538,599 | 12,728 | 178,428 | ||||||||||||
Receivable for foreign tax reclaims | 10,661 | 18,125 | 484,593 | ||||||||||||
Receivable from affiliate | — | 48,102 | — | ||||||||||||
Receivable for variation margin on centrally cleared swap agreements | — | — | — | ||||||||||||
Unrealized appreciation on forward foreign currency contracts | — | — | — | ||||||||||||
Deferred offering cost | — | — | — | ||||||||||||
Other assets | 53,697 | 26,736 | 59,018 | ||||||||||||
Total assets | 1,052,570,048 | 50,875,513 | 435,354,296 | ||||||||||||
Liabilities: | |||||||||||||||
Due to broker | — | — | — | ||||||||||||
Payable for cash collateral from securities loaned | 1,296,912 | 74,176 | 192,040 | ||||||||||||
Payable for investments purchased | — | — | 1,922,277 | ||||||||||||
Payable for fund shares redeemed | 12,129,148 | 164,425 | 1,066,478 | ||||||||||||
Payable to affiliate | 173,864 | — | 276,376 | ||||||||||||
Payable to Trustees | 45,944 | 9,453 | 22,509 | ||||||||||||
Payable to custodian | 139,462 | 8,809 | 44,349 | ||||||||||||
Payable for foreign withholding taxes and foreign capital gains taxes | 2,581,939 | 1,377 | 13,669 | ||||||||||||
Payable for variation margin on futures contracts | — | — | — | ||||||||||||
Unrealized depreciation on forward foreign currency contracts | — | — | — | ||||||||||||
Accrued expenses and other liabilities | 182,714 | 109,157 | 181,304 | ||||||||||||
Total liabilities | 16,549,983 | 367,397 | 3,719,002 | ||||||||||||
Net assets | $ | 1,036,020,065 | $ | 50,508,116 | $ | 431,635,294 | |||||||||
See accompanying notes to financial statements.
123
The UBS Funds
Financial statements
Statement of assets and liabilities—June 30, 2021 (continued)
| UBS All China Equity Fund | UBS Dynamic Alpha Fund | UBS Global Allocation Fund | |||||||||||||
Net assets consist of: | |||||||||||||||
Beneficial interest | $ | 2,000,000 | $ | 74,306,144 | $ | 185,573,489 | |||||||||
Distributable earnings (accumulated losses) | (232,996 | ) | (40,233,198 | ) | 63,581,875 | ||||||||||
Net assets | $ | 1,767,004 | $ | 34,072,946 | $ | 249,155,364 | |||||||||
Class A | |||||||||||||||
Net assets | $ | — | $ | 20,670,703 | $ | 192,771,874 | |||||||||
Shares outstanding | — | 3,025,773 | 13,194,933 | ||||||||||||
Net asset value and redemption proceeds per share | — | $ | 6.83 | $ | 14.61 | ||||||||||
Maximum offering price per share (NAV per share plus maximum sales charge) | $ | — | $ | 7.23 | $ | 15.46 | |||||||||
Class P | |||||||||||||||
Net assets | $ | 1,767,004 | $ | 13,402,243 | $ | 56,383,490 | |||||||||
Shares outstanding | 200,000 | 1,909,511 | 3,759,607 | ||||||||||||
Net asset value, offering price and redemption value per share | $ | 8.84 | $ | 7.02 | $ | 15.00 | |||||||||
Class P2 | |||||||||||||||
Net assets | $ | — | $ | — | $ | — | |||||||||
Shares outstanding | — | — | — | ||||||||||||
Net asset value and offering price per share2 | $ | — | $ | — | $ | — | |||||||||
2 Assumes shares were held a sufficient period or are otherwise not subject to a redemption fee.
124
The UBS Funds
| UBS Emerging Markets Equity Opportunity Fund | UBS Engage for Impact Fund | UBS International Sustainable Equity Fund | |||||||||||||
Net assets consist of: | |||||||||||||||
Beneficial interest | $ | 838,589,495 | $ | 37,931,512 | $ | 360,876,899 | |||||||||
Distributable earnings (accumulated losses) | 197,430,570 | 12,576,604 | 70,758,395 | ||||||||||||
Net assets | $ | 1,036,020,065 | $ | 50,508,116 | $ | 431,635,294 | |||||||||
Class A | |||||||||||||||
Net assets | $ | — | $ | — | $ | 9,080,869 | |||||||||
Shares outstanding | — | — | 727,549 | ||||||||||||
Net asset value and redemption proceeds per share | $ | — | $ | — | $ | 12.48 | |||||||||
Maximum offering price per share (NAV per share plus maximum sales charge) | $ | — | $ | — | $ | 13.21 | |||||||||
Class P | |||||||||||||||
Net assets | $ | 274,358,794 | $ | 7,816,239 | $ | 380,983,454 | |||||||||
Shares outstanding | 22,147,118 | 548,197 | 30,413,867 | ||||||||||||
Net asset value, offering price and redemption value per share | $ | 12.39 | $ | 14.26 | $ | 12.53 | |||||||||
Class P2 | |||||||||||||||
Net assets | $ | 761,661,271 | $ | 42,691,877 | $ | 41,570,971 | |||||||||
Shares outstanding | 60,825,210 | 2,987,240 | 3,302,091 | ||||||||||||
Net asset value and offering price per share2 | $ | 12.52 | $ | 14.29 | $ | 12.59 | |||||||||
See accompanying notes to financial statements.
125
The UBS Funds
Financial statements
Statement of assets and liabilities—June 30, 2021 (continued)
| UBS US Dividend Ruler Fund | UBS US Quality Growth At Reasonable Price Fund | UBS U.S. Small Cap Growth Fund | |||||||||||||
Assets: | |||||||||||||||
Investments, at cost | |||||||||||||||
Unaffiliated issuers | $ | 74,495,452 | $ | 101,513,008 | $ | 150,558,263 | |||||||||
Foreign currency | — | — | — | ||||||||||||
Investments, at value | |||||||||||||||
Unaffiliated issuers1 | $ | 82,474,313 | $ | 116,440,747 | $ | 219,085,272 | |||||||||
Foreign currency | — | — | — | ||||||||||||
Cash collateral on futures | — | — | — | ||||||||||||
Due from broker | — | — | — | ||||||||||||
Receivable for investments sold | — | — | 172,260 | ||||||||||||
Receivable for fund shares sold | 277,736 | 579,262 | 57,329 | ||||||||||||
Receivable for interest and dividends | 58,678 | 26,185 | 41,044 | ||||||||||||
Receivable from affiliate | — | — | — | ||||||||||||
Receivable for variation margin on futures contracts | — | — | — | ||||||||||||
OTC swap agreements, at value | — | — | — | ||||||||||||
Unrealized appreciation on forward foreign currency contracts | — | — | — | ||||||||||||
Deferred offering cost | 7,427 | — | — | ||||||||||||
Other assets | 24,535 | 31,674 | 20,837 | ||||||||||||
Total assets | 82,842,689 | 117,077,868 | 219,376,742 | ||||||||||||
Liabilities: | |||||||||||||||
Payable for cash collateral from securities loaned | — | — | 1,915,599 | ||||||||||||
Payable for investments purchased | 529,624 | — | 1,976,785 | ||||||||||||
Payable for fund shares redeemed | 154,028 | 364,297 | 942,128 | ||||||||||||
Payable to affiliate | 39,649 | 37,684 | 138,999 | ||||||||||||
Payable to Trustees | 9,991 | 11,166 | 15,843 | ||||||||||||
Payable to custodian | 15,872 | 15,975 | 21,355 | ||||||||||||
Unrealized depreciation on forward foreign currency contracts | — | — | — | ||||||||||||
Accrued expenses and other liabilities | 112,455 | 110,861 | 127,628 | ||||||||||||
Total liabilities | 861,619 | 539,983 | 5,138,337 | ||||||||||||
Net assets | $ | 81,981,070 | $ | 116,537,885 | $ | 214,238,405 | |||||||||
1 Includes $0; $0; $4,665,805; $0; $2,329,687 and $153,496, respectively of investments in securities on loan, at value, plus accrued interest and dividends, if any.
126
The UBS Funds
| UBS Municipal Bond Fund | UBS Sustainable Development Bank Bond Fund | UBS Total Return Bond Fund | |||||||||||||
Assets: | |||||||||||||||
Investments, at cost | |||||||||||||||
Unaffiliated issuers | $ | 109,068,670 | $ | 84,716,074 | $ | 37,835,484 | |||||||||
Foreign currency | — | — | 23,677 | ||||||||||||
Investments, at value | |||||||||||||||
Unaffiliated issuers1 | $ | 114,432,022 | $ | 85,219,388 | $ | 38,921,494 | |||||||||
Foreign currency | — | — | 24,497 | ||||||||||||
Cash collateral on futures | — | — | 117,911 | ||||||||||||
Due from broker | — | — | 122,518 | ||||||||||||
Receivable for investments sold | — | — | 1,395,779 | ||||||||||||
Receivable for fund shares sold | 40,095 | 606,488 | — | ||||||||||||
Receivable for interest and dividends | 1,362,881 | 340,285 | 201,443 | ||||||||||||
Receivable from affiliate | — | 2,851 | 7,833 | ||||||||||||
Receivable for variation margin on futures contracts | — | — | 75,889 | ||||||||||||
OTC swap agreements, at value | — | — | 2,618 | ||||||||||||
Unrealized appreciation on forward foreign currency contracts | — | — | 31,542 | ||||||||||||
Deferred offering cost | — | — | — | ||||||||||||
Other assets | 18,264 | 20,181 | 26,198 | ||||||||||||
Total assets | 115,853,262 | 86,189,193 | 40,927,722 | ||||||||||||
Liabilities: | |||||||||||||||
Payable for cash collateral from securities loaned | — | 2,382,450 | 156,650 | ||||||||||||
Payable for investments purchased | 2,434,840 | 296,713 | 5,156,198 | ||||||||||||
Payable for fund shares redeemed | 1,283 | 233,202 | 122,420 | ||||||||||||
Payable to affiliate | 27,228 | — | — | ||||||||||||
Payable to Trustees | 12,246 | 10,820 | 11,337 | ||||||||||||
Payable to custodian | 12,733 | 3,068 | 12,447 | ||||||||||||
Unrealized depreciation on forward foreign currency contracts | — | — | 19,181 | ||||||||||||
Accrued expenses and other liabilities | 106,890 | 94,198 | 139,901 | ||||||||||||
Total liabilities | 2,595,220 | 3,020,451 | 5,618,134 | ||||||||||||
Net assets | $ | 113,258,042 | $ | 83,168,742 | $ | 35,309,588 | |||||||||
See accompanying notes to financial statements.
127
The UBS Funds
Financial statements
Statement of assets and liabilities—June 30, 2021 (concluded)
| UBS US Dividend Ruler Fund | UBS US Quality Growth At Reasonable Price Fund | UBS U.S. Small Cap Growth Fund | |||||||||||||
Net assets consist of: | |||||||||||||||
Beneficial interest | $ | 72,390,188 | $ | 99,011,292 | $ | 125,390,582 | |||||||||
Distributable earnings (accumulated losses) | 9,590,882 | 17,526,593 | 88,847,823 | ||||||||||||
Net assets | $ | 81,981,070 | $ | 116,537,885 | $ | 214,238,405 | |||||||||
Class A | |||||||||||||||
Net assets | $ | — | $ | — | $ | 35,267,546 | |||||||||
Shares outstanding | — | — | 1,252,960 | ||||||||||||
Net asset value and redemption proceeds per share | $ | — | $ | — | $ | 28.15 | |||||||||
Maximum offering price per share (NAV per share plus maximum sales charge) | $ | — | $ | — | $ | 29.79 | |||||||||
Class P | |||||||||||||||
Net assets | $ | 81,981,070 | $ | 116,537,885 | $ | 178,970,859 | |||||||||
Shares outstanding | 6,392,713 | 8,898,697 | 5,517,077 | ||||||||||||
Net asset value, offering price and redemption value per share | $ | 12.82 | $ | 13.10 | $ | 32.44 | |||||||||
Class P2 | |||||||||||||||
Net assets | $ | — | $ | — | $ | — | |||||||||
Shares outstanding | — | — | — | ||||||||||||
Net asset value and offering price per share2 | $ | — | $ | — | $ | — | |||||||||
2 Assumes shares were held a sufficient period or are otherwise not subject to a redemption fee.
128
The UBS Funds
| UBS Municipal Bond Fund | UBS Sustainable Development Bank Bond Fund | UBS Total Return Bond Fund | |||||||||||||
Net assets consist of: | |||||||||||||||
Beneficial interest | $ | 107,158,047 | $ | 82,598,818 | $ | 36,569,490 | |||||||||
Distributable earnings (accumulated losses) | 6,099,995 | 569,924 | (1,259,902 | ) | |||||||||||
Net assets | $ | 113,258,042 | $ | 83,168,742 | $ | 35,309,588 | |||||||||
Class A | |||||||||||||||
Net assets | $ | 9,857,753 | $ | — | $ | 680,526 | |||||||||
Shares outstanding | 903,007 | — | 43,467 | ||||||||||||
Net asset value and redemption proceeds per share | $ | 10.92 | $ | — | $ | 15.66 | |||||||||
Maximum offering price per share (NAV per share plus maximum sales charge) | $ | 11.17 | $ | — | $ | 16.27 | |||||||||
Class P | |||||||||||||||
Net assets | $ | 103,400,289 | $ | 17,509,531 | $ | 34,629,062 | |||||||||
Shares outstanding | 9,479,844 | 1,652,620 | 2,210,564 | ||||||||||||
Net asset value, offering price and redemption value per share | $ | 10.91 | $ | 10.60 | $ | 15.67 | |||||||||
Class P2 | |||||||||||||||
Net assets | $ | — | $ | 65,659,211 | $ | — | |||||||||
Shares outstanding | — | 6,198,612 | — | ||||||||||||
Net asset value and offering price per share2 | $ | — | $ | 10.59 | $ | — | |||||||||
See accompanying notes to financial statements.
129
The UBS Funds
Statement of operations
For the year ended June 30, 2021
| UBS All China Equity Fund* | UBS Dynamic Alpha Fund | UBS Global Allocation Fund | |||||||||||||
Investment income: | |||||||||||||||
Unaffiliated dividends | $ | 14,562 | $ | 42,470 | $ | 3,920,841 | |||||||||
Affiliated dividends | — | — | 314,100 | ||||||||||||
Interest | 32 | 298,743 | 724,203 | ||||||||||||
Securities lending | — | 4,828 | 109,634 | ||||||||||||
Foreign tax withheld | (775 | ) | (490 | ) | (78,533 | ) | |||||||||
Total income | 13,819 | 345,551 | 4,990,245 | ||||||||||||
Expenses: | |||||||||||||||
Investment management and administration fees | 5,916 | 322,415 | 2,130,568 | ||||||||||||
Service and distribution fees—Class A | — | 52,936 | 470,147 | ||||||||||||
Transfer agency and related services fees—A | — | 20,774 | 114,299 | ||||||||||||
Transfer agency and related services fees—Class P | 2,250 | 15,704 | 20,152 | ||||||||||||
Transfer agency and related services fees—P2 | — | — | — | ||||||||||||
Custody and fund accounting fees | 7,160 | 38,461 | 80,522 | ||||||||||||
Trustees fees | 8,933 | 31,135 | 62,919 | ||||||||||||
Professional services fees | 78,881 | 159,231 | 185,933 | ||||||||||||
Printing and shareholder report fees | 1,967 | 19,651 | 83,419 | ||||||||||||
Federal and state registration fees | 404 | 33,543 | 36,468 | ||||||||||||
Amortization of offering costs | 22,826 | — | — | ||||||||||||
Other expenses | 5,491 | 73,840 | 100,464 | ||||||||||||
Total expenses | 133,828 | 767,690 | 3,284,891 | ||||||||||||
Fee waivers and/or expense reimbursements by Advisor | (126,792 | ) | (331,342 | ) | (501,556 | ) | |||||||||
Net expenses | 7,036 | 436,348 | 2,783,335 | ||||||||||||
Net investment income (loss) | 6,783 | (90,797 | ) | 2,206,910 | |||||||||||
Net realized gain (loss) on: | |||||||||||||||
Investments in unaffiliated issuers (including foreign capital gain tax expense of $0; $0; $0; $(931,752); $0 and $0, respectively) | (106,114 | ) | 310,758 | 29,202,725 | |||||||||||
Investments in affiliated issuers | — | — | 288,877 | ||||||||||||
Futures contracts | — | 2,648,563 | 1,102,033 | ||||||||||||
Swap agreements | — | 255,626 | 797,673 | ||||||||||||
Forward foreign currency contracts | — | 104,225 | (1,240,391 | ) | |||||||||||
Foreign currency transactions | 135 | 299,429 | (237,072 | ) | |||||||||||
Net realized gain (loss) | (105,979 | ) | 3,618,601 | 29,913,845 | |||||||||||
Change in net unrealized appreciation (depreciation) on: | |||||||||||||||
Investments in unaffiliated issuers (net of change in deferred foreign capital gain taxes of $0; $0; $0; $(2,470,631); $0 and $0, respectively) | (133,791 | ) | 1,226,481 | 16,549,607 | |||||||||||
Investments in affiliated issuers | — | — | 4,750,944 | ||||||||||||
Futures contracts | — | (113,559 | ) | (458,972 | ) | ||||||||||
Swap agreements | — | (54,064 | ) | 97,957 | |||||||||||
Forward foreign currency contracts | — | 157,484 | 1,828,695 | ||||||||||||
Translation of other assets and liabilities denominated in foreign currency | (9 | ) | (40,525 | ) | 77,336 | ||||||||||
Net change in unrealized appreciation (depreciation) | (133,800 | ) | 1,175,817 | 22,845,567 | |||||||||||
Net realized and unrealized gain (loss) | (239,779 | ) | 4,794,418 | 52,759,412 | |||||||||||
Net increase (decrease) in net assets resulting from operations | $ | (232,996 | ) | $ | 4,703,621 | $ | 54,966,322 | ||||||||
* For the period from February 23, 2021 (commencement of operations) through June 30, 2021.
130
The UBS Funds
| UBS Emerging Markets Equity Opportunity Fund | UBS Engage for Impact Fund | UBS International Sustainable Equity Fund | |||||||||||||
Investment income: | |||||||||||||||
Unaffiliated dividends | $ | 15,788,168 | $ | 573,467 | $ | 6,403,651 | |||||||||
Affiliated dividends | — | — | — | ||||||||||||
Interest | 7,026 | 313 | 852 | ||||||||||||
Securities lending | 28,594 | 5,802 | 18,799 | ||||||||||||
Foreign tax withheld | (2,367,974 | ) | (51,039 | ) | (701,157 | ) | |||||||||
Total income | 13,455,814 | 528,543 | 5,722,145 | ||||||||||||
Expenses: | |||||||||||||||
Investment management and administration fees | 7,520,239 | 321,787 | 2,770,613 | ||||||||||||
Service and distribution fees—Class A | — | — | 21,435 | ||||||||||||
Transfer agency and related services fees—A | — | — | 4,187 | ||||||||||||
Transfer agency and related services fees—Class P | 47,937 | 17,157 | 64,445 | ||||||||||||
Transfer agency and related services fees—P2 | 21,064 | 5,252 | 9,405 | ||||||||||||
Custody and fund accounting fees | 414,470 | 20,362 | 105,750 | ||||||||||||
Trustees fees | 156,038 | 32,379 | 76,616 | ||||||||||||
Professional services fees | 120,761 | 220,784 | 170,630 | ||||||||||||
Printing and shareholder report fees | 47,303 | 28,401 | 34,671 | ||||||||||||
Federal and state registration fees | 50,490 | 32,130 | 54,700 | ||||||||||||
Amortization of offering costs | — | — | — | ||||||||||||
Other expenses | 78,153 | 34,656 | 76,910 | ||||||||||||
Total expenses | 8,456,455 | 712,908 | 3,389,362 | ||||||||||||
Fee waivers and/or expense reimbursements by Advisor | (5,805,571 | ) | (439,920 | ) | (364,595 | ) | |||||||||
Net expenses | 2,650,884 | 272,988 | 3,024,767 | ||||||||||||
Net investment income (loss) | 10,804,930 | 255,555 | 2,697,378 | ||||||||||||
Net realized gain (loss) on: | |||||||||||||||
Investments in unaffiliated issuers (including foreign capital gain tax expense of $0; $0; $0; $(931,752); $0 and $0, respectively) | 57,611,173 | 4,961,188 | 23,113,034 | ||||||||||||
Investments in affiliated issuers | — | — | — | ||||||||||||
Futures contracts | — | — | — | ||||||||||||
Swap agreements | — | — | — | ||||||||||||
Forward foreign currency contracts | 3,955 | (51 | ) | 7,417 | |||||||||||
Foreign currency transactions | (169,476 | ) | 10,676 | 30,560 | |||||||||||
Net realized gain (loss) | 57,445,652 | 4,971,813 | 23,151,011 | ||||||||||||
Change in net unrealized appreciation (depreciation) on: | |||||||||||||||
Investments in unaffiliated issuers (net of change in deferred foreign capital gain taxes of $0; $0; $0; $(2,470,631); $0 and $0, respectively) | 122,760,566 | 7,333,349 | 51,615,389 | ||||||||||||
Investments in affiliated issuers | — | — | — | ||||||||||||
Futures contracts | — | — | — | ||||||||||||
Swap agreements | — | — | — | ||||||||||||
Forward foreign currency contracts | — | — | — | ||||||||||||
Translation of other assets and liabilities denominated in foreign currency | 9,457 | (4,639 | ) | 1,404 | |||||||||||
Net change in unrealized appreciation (depreciation) | 122,770,023 | 7,328,710 | 51,616,793 | ||||||||||||
Net realized and unrealized gain (loss) | 180,215,675 | 12,300,523 | 74,767,804 | ||||||||||||
Net increase (decrease) in net assets resulting from operations | $ | 191,020,605 | $ | 12,556,078 | $ | 77,465,182 | |||||||||
See accompanying notes to financial statements.
131
The UBS Funds
Statement of operations
For the year ended June 30, 2021 (concluded)
| UBS US Dividend Ruler Fund* | UBS US Quality Growth At Reasonable Price Fund* | UBS U.S. Small Cap Growth Fund | |||||||||||||
Investment income: | |||||||||||||||
Unaffiliated dividends | $ | 877,818 | $ | 507,731 | $ | 404,005 | |||||||||
Interest | 373 | 481 | 2,167 | ||||||||||||
Securities lending | — | — | 34,302 | ||||||||||||
Foreign tax withheld | (6,571 | ) | — | — | |||||||||||
Total income | 871,620 | 508,212 | 440,474 | ||||||||||||
Expenses: | |||||||||||||||
Investment management and administration fees | 225,962 | 358,089 | 1,633,021 | ||||||||||||
Service and distribution fees—Class A | — | — | 78,015 | ||||||||||||
Transfer agency and related services fees—Class A | — | — | 26,011 | ||||||||||||
Transfer agency and related services fees—Class P | 22,235 | 36,284 | 98,176 | ||||||||||||
Transfer agency and related services fees—Class P2 | — | — | — | ||||||||||||
Custody and fund accounting fees | 24,309 | 24,892 | 28,460 | ||||||||||||
Trustees fees | 31,577 | 35,554 | 55,149 | ||||||||||||
Professional services fees | 141,639 | 142,910 | 117,696 | ||||||||||||
Printing and shareholder report fees | 42,593 | 42,588 | 24,841 | ||||||||||||
Federal and state registration fees | 9,436 | 10,730 | 37,482 | ||||||||||||
Interest expense | — | — | — | ||||||||||||
Amortization of offering costs | 89,149 | 87,153 | — | ||||||||||||
Other expenses | 29,831 | 30,817 | 37,070 | ||||||||||||
Total expenses | 616,731 | 769,017 | 2,135,921 | ||||||||||||
Fee waivers and/or expense reimbursements by Advisor | (420,243 | ) | (457,635 | ) | (310,133 | ) | |||||||||
Net expenses | 196,488 | 311,382 | 1,825,788 | ||||||||||||
Net investment income (loss) | 675,132 | 196,830 | (1,385,314 | ) | |||||||||||
Net realized gain (loss) on: | |||||||||||||||
Investments in unaffiliated issuers | 1,273,902 | 2,667,603 | 31,012,552 | ||||||||||||
Options and swaptions written | — | — | — | ||||||||||||
Futures contracts | — | — | — | ||||||||||||
Swap agreements | — | — | — | ||||||||||||
Forward foreign currency contracts | — | — | — | ||||||||||||
Foreign currency transactions | — | — | — | ||||||||||||
Net realized gain (loss) | 1,273,902 | 2,667,603 | 31,012,552 | ||||||||||||
Change in net unrealized appreciation (depreciation) on: | |||||||||||||||
Investments in unaffiliated issuers | 7,978,861 | 14,927,739 | 45,051,897 | ||||||||||||
Futures contracts | — | — | — | ||||||||||||
Swap agreements | — | — | — | ||||||||||||
Forward foreign currency contracts | — | — | — | ||||||||||||
Translation of other assets and liabilities denominated in foreign currency | — | — | — | ||||||||||||
Net change in unrealized appreciation (depreciation) | 7,978,861 | 14,927,739 | 45,051,897 | ||||||||||||
Net realized and unrealized gain (loss) | 9,252,763 | 17,595,342 | 76,064,449 | ||||||||||||
Net increase (decrease) in net assets resulting from operations | $ | 9,927,895 | $ | 17,792,172 | $ | 74,679,135 | |||||||||
* For the period from July 9, 2020 (commencement of operations) through June 30, 2021.
132
The UBS Funds
| UBS Municipal Bond Fund | UBS Sustainable Development Bank Bond Fund | UBS Total Return Bond Fund | |||||||||||||
Investment income: | |||||||||||||||
Unaffiliated dividends | $ | — | $ | — | $ | — | |||||||||
Interest | 2,210,382 | 758,601 | 976,825 | ||||||||||||
Securities lending | — | 1,658 | 565 | ||||||||||||
Foreign tax withheld | — | — | — | ||||||||||||
Total income | 2,210,382 | 760,259 | 977,390 | ||||||||||||
Expenses: | |||||||||||||||
Investment management and administration fees | 565,632 | 128,584 | 211,900 | ||||||||||||
Service and distribution fees—Class A | 28,493 | — | 1,649 | ||||||||||||
Transfer agency and related services fees—Class A | 2,345 | — | 257 | ||||||||||||
Transfer agency and related services fees—Class P | 19,475 | 8,083 | 27,399 | ||||||||||||
Transfer agency and related services fees—Class P2 | — | 6,832 | — | ||||||||||||
Custody and fund accounting fees | 20,956 | 11,723 | 29,576 | ||||||||||||
Trustees fees | 44,523 | 35,390 | 33,813 | ||||||||||||
Professional services fees | 115,377 | 134,372 | 168,701 | ||||||||||||
Printing and shareholder report fees | 22,041 | 9,992 | 18,409 | ||||||||||||
Federal and state registration fees | 42,488 | 39,157 | 33,364 | ||||||||||||
Interest expense | 1,163 | — | — | ||||||||||||
Amortization of offering costs | — | — | — | ||||||||||||
Other expenses | 49,386 | 46,132 | 35,874 | ||||||||||||
Total expenses | 911,879 | 420,265 | 560,942 | ||||||||||||
Fee waivers and/or expense reimbursements by Advisor | (405,902 | ) | (307,068 | ) | (375,033 | ) | |||||||||
Net expenses | 505,977 | 113,197 | 185,909 | ||||||||||||
Net investment income (loss) | 1,704,405 | 647,062 | 791,481 | ||||||||||||
Net realized gain (loss) on: | |||||||||||||||
Investments in unaffiliated issuers | 1,757,715 | 224,614 | (147,252 | ) | |||||||||||
Options and swaptions written | — | — | 34,723 | ||||||||||||
Futures contracts | — | — | (375,478 | ) | |||||||||||
Swap agreements | — | — | (92,150 | ) | |||||||||||
Forward foreign currency contracts | — | — | 16,363 | ||||||||||||
Foreign currency transactions | — | — | 16,370 | ||||||||||||
Net realized gain (loss) | 1,757,715 | 224,614 | (547,424 | ) | |||||||||||
Change in net unrealized appreciation (depreciation) on: | |||||||||||||||
Investments in unaffiliated issuers | 7,467 | (1,610,586 | ) | 410,495 | |||||||||||
Futures contracts | — | — | 88,234 | ||||||||||||
Swap agreements | — | — | 2,618 | ||||||||||||
Forward foreign currency contracts | — | — | 10,947 | ||||||||||||
Translation of other assets and liabilities denominated in foreign currency | — | — | 1,794 | ||||||||||||
Net change in unrealized appreciation (depreciation) | 7,467 | (1,610,586 | ) | 514,088 | |||||||||||
Net realized and unrealized gain (loss) | 1,765,182 | (1,385,972 | ) | (33,336 | ) | ||||||||||
Net increase (decrease) in net assets resulting from operations | $ | 3,469,587 | $ | (738,910 | ) | $ | 758,145 | ||||||||
See accompanying notes to financial statements.
133
The UBS Funds
Statement of changes in net assets
UBS All China Equity Fund | UBS Dynamic Alpha Fund | UBS Global Allocation Fund | |||||||||||||||||||||
For the period ended | For the years ended June 30, | For the years ended June 30, | |||||||||||||||||||||
June 30, 2021* | 2021 | 2020 | 2021 | 2020 | |||||||||||||||||||
From operations: | |||||||||||||||||||||||
Net investment income (loss) | $ | 6,783 | $ | (90,797 | ) | $ | 486,352 | $ | 2,206,910 | $ | 2,657,178 | ||||||||||||
Net realized gain (loss) | (105,979 | ) | 3,618,601 | (581,207 | ) | 29,913,845 | 1,484,118 | ||||||||||||||||
Net change in unrealized appreciation (depreciation) | (133,800 | ) | 1,175,817 | (494,164 | ) | 22,845,567 | (2,752,556 | ) | |||||||||||||||
Net increase (decrease) in net assets resulting from operations | (232,996 | ) | 4,703,621 | (589,019 | ) | 54,966,322 | 1,388,740 | ||||||||||||||||
Total distributions—Class A | — | — | (1,215,326 | ) | (3,057,684 | ) | (13,406,465 | ) | |||||||||||||||
Total distributions—Class P | — | — | (848,376 | ) | (1,019,866 | ) | (4,161,168 | ) | |||||||||||||||
Total distributions—Class P2 | — | — | — | — | — | ||||||||||||||||||
Total distributions | — | — | (2,063,702 | ) | (4,077,550 | ) | (17,567,633 | ) | |||||||||||||||
From beneficial interest transactions: | |||||||||||||||||||||||
Proceeds from shares sold | 2,000,000 | 1,460,148 | 1,087,974 | 3,575,085 | 7,492,574 | ||||||||||||||||||
Cost of shares redeemed | — | (7,646,862 | ) | (14,090,815 | ) | (34,517,066 | ) | (49,228,691 | ) | ||||||||||||||
Shares issued on reinvestment of dividends and distributions | — | — | 1,829,496 | 3,739,203 | 16,174,628 | ||||||||||||||||||
| Net increase (decrease) in net assets from beneficial interest transactions | 2,000,000 | (6,186,714 | ) | (11,173,345 | ) | (27,202,778 | ) | (25,561,489 | ) | ||||||||||||||
Net increase (decrease) in net assets | 1,767,004 | (1,483,093 | ) | (13,826,066 | ) | 23,685,994 | (41,740,382 | ) | |||||||||||||||
Net assets: | |||||||||||||||||||||||
Beginning of year | — | 35,556,039 | 49,382,105 | 225,469,370 | 267,209,752 | ||||||||||||||||||
End of year | $ | 1,767,004 | $ | 34,072,946 | $ | 35,556,039 | $ | 249,155,364 | $ | 225,469,370 | |||||||||||||
1 For the period from February 23, 2021 (commencement of operations) through June 30, 2021.
134
The UBS Funds
| UBS Emerging Markets Equity Opportunity Fund | UBS Engage for Impact Fund | ||||||||||||||||||
For the years ended June 30, | For the years ended June 30, | ||||||||||||||||||
2021 | 2020 | 2021 | 2020 | ||||||||||||||||
From operations: | |||||||||||||||||||
Net investment income (loss) | $ | 10,804,930 | $ | 8,798,181 | $ | 255,555 | $ | 156,991 | |||||||||||
Net realized gain (loss) | 57,445,652 | (11,068,433 | ) | 4,971,813 | 122,375 | ||||||||||||||
Net change in unrealized appreciation (depreciation) | 122,770,023 | 25,567,250 | 7,328,710 | (374,588 | ) | ||||||||||||||
Net increase (decrease) in net assets resulting from operations | 191,020,605 | 23,296,998 | 12,556,078 | (95,222 | ) | ||||||||||||||
Total distributions—Class A | — | — | — | — | |||||||||||||||
Total distributions—Class P | (1,771,622 | ) | (2,126,928 | ) | (300,924 | ) | (567,242 | ) | |||||||||||
Total distributions—Class P2 | (9,016,015 | ) | (6,516,989 | ) | — | — | |||||||||||||
Total distributions | (10,787,637 | ) | (8,643,917 | ) | (300,924 | ) | (567,242 | ) | |||||||||||
From beneficial interest transactions: | |||||||||||||||||||
Proceeds from shares sold | 488,581,499 | 344,491,270 | 60,440,196 | 15,119,169 | |||||||||||||||
Cost of shares redeemed | (117,310,941 | ) | (114,075,956 | ) | (48,693,360 | ) | (4,654,704 | ) | |||||||||||
Shares issued on reinvestment of dividends and distributions | 8,182,239 | 5,860,007 | 265,026 | 521,370 | |||||||||||||||
| Net increase (decrease) in net assets from beneficial interest transactions | 379,452,797 | 236,275,321 | 12,011,862 | 10,985,835 | |||||||||||||||
Net increase (decrease) in net assets | 559,685,765 | 250,928,402 | 24,267,016 | 10,323,371 | |||||||||||||||
Net assets: | |||||||||||||||||||
Beginning of year | 476,334,300 | 225,405,898 | 26,241,100 | 15,917,729 | |||||||||||||||
End of year | $ | 1,036,020,065 | $ | 476,334,300 | $ | 50,508,116 | $ | 26,241,100 | |||||||||||
See accompanying notes to financial statements.
135
The UBS Funds
Statement of changes in net assets (continued)
| UBS International Sustainable Equity Fund | UBS US Dividend Ruler Fund | UBS US Quality Growth At Reasonable Price Fund | |||||||||||||||||
For the years ended June 30, | For the period ended June 30, | For the period ended June 30, | |||||||||||||||||
2021 | 2020 | 2021* | 2021* | ||||||||||||||||
From operations: | |||||||||||||||||||
Net investment income (loss) | $ | 2,697,378 | $ | 3,382,818 | $ | 675,132 | $ | 196,830 | |||||||||||
Net realized gain (loss) | 23,151,011 | (5,550,441 | ) | 1,273,902 | 2,667,603 | ||||||||||||||
Net change in unrealized appreciation (depreciation) | 51,616,793 | (256,870 | ) | 7,978,861 | 14,927,739 | ||||||||||||||
Net increase (decrease) in net assets resulting from operations | 77,465,182 | (2,424,493 | ) | 9,927,895 | 17,792,172 | ||||||||||||||
Total distributions—Class A | (93,754 | ) | (123,994 | ) | — | — | |||||||||||||
Total distributions—Class P | (3,529,498 | ) | (2,822,544 | ) | (337,013 | ) | (250,762 | ) | |||||||||||
Total distributions—Class P2 | (397,737 | ) | — | — | — | ||||||||||||||
Total distributions | (4,020,989 | ) | (2,946,538 | ) | (337,013 | ) | (250,762 | ) | |||||||||||
From beneficial interest transactions: | |||||||||||||||||||
Proceeds from shares sold | 225,093,386 | 125,560,872 | 84,691,033 | 123,322,191 | |||||||||||||||
Cost of shares redeemed | (81,050,264 | ) | (68,746,707 | ) | (12,605,771 | ) | (24,559,546 | ) | |||||||||||
Shares issued on reinvestment of dividends and distributions | 3,628,047 | 2,692,439 | 304,926 | 233,830 | |||||||||||||||
| Net increase (decrease) in net assets from beneficial interest transactions | 147,671,169 | 59,506,604 | 72,390,188 | 98,996,475 | |||||||||||||||
Net increase (decrease) in net assets | 221,115,362 | 54,135,573 | 81,981,070 | 116,537,885 | |||||||||||||||
Net assets: | |||||||||||||||||||
Beginning of year | 210,519,932 | 156,384,359 | — | — | |||||||||||||||
End of year | $ | 431,635,294 | $ | 210,519,932 | $ | 81,981,070 | $ | 116,537,885 | |||||||||||
* For the period from July 9, 2020 (commencement of operations) through June 30, 2021.
136
The UBS Funds
UBS U.S. Small Cap Growth Fund | UBS Municipal Bond Fund | ||||||||||||||||||
For the years ended June 30, | For the years ended June 30, | ||||||||||||||||||
2021 | 2020 | 2021 | 2020 | ||||||||||||||||
From operations: | |||||||||||||||||||
Net investment income (loss) | $ | (1,385,314 | ) | $ | (478,771 | ) | $ | 1,704,405 | $ | 2,011,631 | |||||||||
Net realized gain (loss) | 31,012,552 | 13,974,311 | 1,757,715 | 988,296 | |||||||||||||||
Net change in unrealized appreciation (depreciation) | 45,051,897 | (4,482,062 | ) | 7,467 | 1,442,243 | ||||||||||||||
Net increase (decrease) in net assets resulting from operations | 74,679,135 | 9,013,478 | 3,469,587 | 4,442,170 | |||||||||||||||
Total distributions—Class A | (3,778,671 | ) | (1,775,575 | ) | (236,182 | ) | (213,387 | ) | |||||||||||
Total distributions—Class P | (15,336,070 | ) | (6,480,541 | ) | (2,476,911 | ) | (1,797,595 | ) | |||||||||||
Total distributions—Class P2 | — | — | — | — | |||||||||||||||
Total distributions | (19,114,741 | ) | (8,256,116 | ) | (2,713,093 | ) | (2,010,982 | ) | |||||||||||
From beneficial interest transactions: | |||||||||||||||||||
Proceeds from shares sold | 63,802,582 | 21,748,959 | 35,344,732 | 38,324,671 | |||||||||||||||
Cost of shares redeemed | (39,173,242 | ) | (37,336,837 | ) | (44,075,100 | ) | (25,262,928 | ) | |||||||||||
Shares issued on reinvestment of dividends and distributions | 18,382,290 | 7,893,853 | 2,202,817 | 1,518,656 | |||||||||||||||
| Net increase (decrease) in net assets from beneficial interest transactions | 43,011,630 | (7,694,025 | ) | (6,527,551 | ) | 14,580,399 | |||||||||||||
Net increase (decrease) in net assets | 98,576,024 | (6,936,663 | ) | (5,771,057 | ) | 17,011,587 | |||||||||||||
Net assets: | |||||||||||||||||||
Beginning of year | 115,662,381 | 122,599,044 | 119,029,099 | 102,017,512 | |||||||||||||||
End of year | $ | 214,238,405 | $ | 115,662,381 | $ | 113,258,042 | $ | 119,029,099 | |||||||||||
See accompanying notes to financial statements.
137
The UBS Funds
Statement of changes in net assets (concluded)
| UBS Sustainable Development Bank Bond Fund | UBS Total Return Bond Fund | ||||||||||||||||||
For the years ended June 30, | For the years ended June 30, | ||||||||||||||||||
2021 | 2020 | 2021 | 2020 | ||||||||||||||||
From operations: | |||||||||||||||||||
Net investment income (loss) | $ | 647,062 | $ | 703,885 | $ | 791,481 | $ | 1,120,667 | |||||||||||
Net realized gain (loss) | 224,614 | 1,093,551 | (547,424 | ) | 1,670,842 | ||||||||||||||
Net change in unrealized appreciation (depreciation) | (1,610,586 | ) | 1,094,854 | 514,088 | (422,068 | ) | |||||||||||||
Net increase (decrease) in net assets resulting from operations | (738,910 | ) | 2,892,290 | 758,145 | 2,369,441 | ||||||||||||||
Total distributions—Class A | — | — | (11,047 | ) | (15,011 | ) | |||||||||||||
Total distributions—Class P | (741,550 | ) | (824,383 | ) | (695,034 | ) | (987,231 | ) | |||||||||||
Total distributions—Class P2 | (1,108,472 | ) | — | — | — | ||||||||||||||
Total distributions | (1,850,022 | ) | (824,383 | ) | (706,081 | ) | (1,002,242 | ) | |||||||||||
From beneficial interest transactions: | |||||||||||||||||||
Proceeds from shares sold | 88,763,287 | 36,308,770 | 333,021 | 443,074 | |||||||||||||||
Cost of shares redeemed | (41,736,626 | ) | (26,819,184 | ) | (3,311,690 | ) | (4,328,919 | ) | |||||||||||
Shares issued on reinvestment of dividends and distributions | 1,317,020 | 621,222 | 539,109 | 778,398 | |||||||||||||||
| Net increase (decrease) in net assets from beneficial interest transactions | 48,343,681 | 10,110,808 | (2,439,560 | ) | (3,107,447 | ) | |||||||||||||
Net increase (decrease) in net assets | 45,754,749 | 12,178,715 | (2,387,496 | ) | (1,740,248 | ) | |||||||||||||
Net assets: | |||||||||||||||||||
Beginning of year | 37,413,993 | 25,235,278 | 37,697,084 | 39,437,332 | |||||||||||||||
End of year | $ | 83,168,742 | $ | 37,413,993 | $ | 35,309,588 | $ | 37,697,084 | |||||||||||
See accompanying notes to financial statements.
138
UBS All China Equity Fund
Financial highlights
The table below sets forth financial data for one share of beneficial interest outstanding throughout each period presented.
Class P
| Period ended June 30, 20211 | |||||||
Net asset value, beginning of period | $ | 10.00 | |||||
Net investment income (loss)2 | 0.03 | ||||||
Net realized and unrealized gain (loss) | (1.19 | ) | |||||
Net increase (decrease) from operations | (1.16 | ) | |||||
Net asset value, end of period | $ | 8.84 | |||||
Total investment return3 | (11.60 | )% | |||||
Ratios to average net assets: | |||||||
Expenses before fee waivers and/or expense reimbursements | 20.92 | %4 | |||||
Expenses after fee waivers and/or expense reimbursements | 1.10 | %4 | |||||
Net investment income (loss) | 1.06 | %4 | |||||
Supplemental data: | |||||||
Net assets, end of period (000's) | $ | 1,767 | |||||
Portfolio turnover | 6 | % | |||||
1 For the period from February 23, 2021 (commencement of operations) through June 30, 2021.
2 Calculated using the average share method.
3 Total investment return is calculated assuming a $10,000 investment on the first day of each period reported, reinvestment of all dividends and distributions, if any, at net asset value on the ex-dividend dates, and a sale at net asset value on the last day of each period reported. The figures do not include any applicable sales charges; results would be lower if they were included. Total investment return for periods less than one year has not been annualized. Returns do not reflect the deduction of taxes that a shareholder would pay on Fund dividends/distributions or the redemption of Fund shares.
4 Annualized.
See accompanying notes to financial statements.
139
UBS Dynamic Alpha Fund
Financial highlights
The table below sets forth financial data for one share of beneficial interest outstanding throughout each year presented.
Class A
Years ended June 30, | |||||||||||||||||||||||
2021 | 2020 | 2019 | 2018 | 2017 | |||||||||||||||||||
Net asset value, beginning of year | $ | 5.98 | $ | 6.36 | $ | 6.38 | $ | 6.52 | $ | 6.17 | |||||||||||||
Net investment income (loss)1 | (0.02 | ) | 0.07 | 0.08 | 0.04 | 0.03 | |||||||||||||||||
Net realized and unrealized gain (loss) | 0.87 | (0.15 | ) | (0.04 | ) | (0.18 | ) | 0.32 | |||||||||||||||
Net increase (decrease) from operations | 0.85 | (0.08 | ) | 0.04 | (0.14 | ) | 0.35 | ||||||||||||||||
Dividends from net investment income | — | (0.30 | ) | (0.06 | ) | — | — | ||||||||||||||||
Net asset value, end of year | $ | 6.83 | $ | 5.98 | $ | 6.36 | $ | 6.38 | $ | 6.52 | |||||||||||||
Total investment return2 | 14.21 | % | (1.45 | )% | 0.60 | % | (2.15 | )% | 5.84 | % | |||||||||||||
Ratios to average net assets: | |||||||||||||||||||||||
Expenses before fee waivers and/or expense reimbursements | 2.29 | %3 | 2.00 | %3 | 2.02 | %3 | 1.69 | % | 1.49 | % | |||||||||||||
Expenses after fee waivers and/or expense reimbursements | 1.35 | %3 | 1.35 | %3 | 1.35 | %3 | 1.35 | % | 1.35 | % | |||||||||||||
Net investment income (loss) | (0.36 | )% | 1.06 | % | 1.29 | % | 0.57 | % | 0.42 | % | |||||||||||||
Supplemental data: | |||||||||||||||||||||||
Net assets, end of year (000's) | $ | 20,671 | $ | 21,273 | $ | 30,025 | $ | 31,066 | $ | 43,930 | |||||||||||||
Portfolio turnover | 27 | % | 62 | % | 32 | % | 31 | % | 48 | % | |||||||||||||
Class P
Years ended June 30, | |||||||||||||||||||||||
2021 | 2020 | 2019 | 2018 | 2017 | |||||||||||||||||||
Net asset value, beginning of year | $ | 6.13 | $ | 6.52 | $ | 6.53 | $ | 6.66 | $ | 6.28 | |||||||||||||
Net investment income (loss)1 | (0.01 | ) | 0.08 | 0.10 | 0.06 | 0.04 | |||||||||||||||||
Net realized and unrealized gain (loss) | 0.90 | (0.15 | ) | (0.04 | ) | (0.19 | ) | 0.34 | |||||||||||||||
Net increase (decrease) from operations | 0.89 | (0.07 | ) | 0.06 | (0.13 | ) | 0.38 | ||||||||||||||||
Dividends from net investment income | — | (0.32 | ) | (0.07 | ) | — | — | ||||||||||||||||
Net asset value, end of year | $ | 7.02 | $ | 6.13 | $ | 6.52 | $ | 6.53 | $ | 6.66 | |||||||||||||
Total investment return2 | 14.52 | % | (1.28 | )% | 0.83 | % | (1.80 | )% | 6.05 | % | |||||||||||||
Ratios to average net assets: | |||||||||||||||||||||||
Expenses before fee waivers and/or expense reimbursements | 2.06 | %3 | 1.75 | %3 | 1.70 | %3 | 1.43 | % | 1.27 | % | |||||||||||||
Expenses after fee waivers and/or expense reimbursements | 1.10 | %3 | 1.10 | %3 | 1.10 | %3 | 1.10 | % | 1.10 | % | |||||||||||||
Net investment income (loss) | (0.11 | )% | 1.31 | % | 1.52 | % | 0.94 | % | 0.68 | % | |||||||||||||
Supplemental data: | |||||||||||||||||||||||
Net assets, end of year (000's) | $ | 13,402 | $ | 14,283 | $ | 19,357 | $ | 30,647 | $ | 98,018 | |||||||||||||
Portfolio turnover | 27 | % | 62 | % | 32 | % | 31 | % | 48 | % | |||||||||||||
1 Calculated using the average share method.
2 Total investment return is calculated assuming a $10,000 investment on the first day of each year reported, reinvestment of all dividends and distributions, if any, at net asset value on the ex-dividend dates, and a sale at net asset value on the last day of each year reported. The figures do not include any applicable sales charges; results would be lower if they were included. Returns do not reflect the deduction of taxes that a shareholder would pay on Fund dividends/distributions or the redemption of Fund shares.
3 Includes interest expense representing less than 0.005%.
See accompanying notes to financial statements.
140
UBS Global Allocation Fund
Financial highlights
The table below sets forth financial data for one share of beneficial interest outstanding throughout each year presented.
Class A
Years ended June 30, | |||||||||||||||||||||||
2021 | 2020 | 2019 | 2018 | 2017 | |||||||||||||||||||
Net asset value, beginning of year | $ | 11.82 | $ | 12.56 | $ | 12.08 | $ | 11.52 | $ | 10.46 | |||||||||||||
Net investment income (loss)1 | 0.12 | 0.12 | 0.12 | 0.05 | 0.02 | ||||||||||||||||||
Net realized and unrealized gain (loss) | 2.89 | 0.02 | 0.36 | 0.68 | 1.27 | ||||||||||||||||||
Net increase (decrease) from operations | 3.01 | 0.14 | 0.48 | 0.73 | 1.29 | ||||||||||||||||||
Dividends from net investment income | (0.07 | ) | (0.35 | ) | — | (0.17 | ) | (0.23 | ) | ||||||||||||||
Distributions from net realized gains | (0.15 | ) | (0.53 | ) | — | — | — | ||||||||||||||||
Total dividends and distributions | (0.22 | ) | (0.88 | ) | — | (0.17 | ) | (0.23 | ) | ||||||||||||||
Net asset value, end of year | $ | 14.61 | $ | 11.82 | $ | 12.56 | $ | 12.08 | $ | 11.52 | |||||||||||||
Total investment return2 | 25.58 | % | 0.79 | % | 3.97 | %3 | 6.34 | % | 12.51 | % | |||||||||||||
Ratios to average net assets: | |||||||||||||||||||||||
Expenses before fee waivers and/or expense reimbursements | 1.41 | % | 1.42 | %4 | 1.40 | %4 | 1.40 | % | 1.39 | % | |||||||||||||
Expenses after fee waivers and/or expense reimbursements | 1.20 | % | 1.20 | %4 | 1.20 | %4 | 1.20 | % | 1.25 | % | |||||||||||||
Net investment income (loss) | 0.85 | % | 1.01 | % | 1.04 | % | 0.39 | % | 0.16 | % | |||||||||||||
Supplemental data: | |||||||||||||||||||||||
Net assets, end of year (000's) | $ | 192,772 | $ | 174,159 | $ | 209,407 | $ | 159,678 | $ | 174,148 | |||||||||||||
Portfolio turnover | 128 | % | 120 | % | 35 | % | 54 | % | 56 | % | |||||||||||||
Class P
Years ended June 30, | |||||||||||||||||||||||
2021 | 2020 | 2019 | 2018 | 2017 | |||||||||||||||||||
Net asset value, beginning of year | $ | 12.13 | $ | 12.87 | $ | 12.34 | $ | 11.78 | $ | 10.69 | |||||||||||||
Net investment income (loss)1 | 0.15 | 0.16 | 0.16 | 0.08 | 0.05 | ||||||||||||||||||
Net realized and unrealized gain (loss) | 2.97 | 0.02 | 0.37 | 0.68 | 1.30 | ||||||||||||||||||
Net increase (decrease) from operations | 3.12 | 0.18 | 0.53 | 0.76 | 1.35 | ||||||||||||||||||
Dividends from net investment income | (0.10 | ) | (0.39 | ) | — | (0.20 | ) | (0.26 | ) | ||||||||||||||
Distributions from net realized gains | (0.15 | ) | (0.53 | ) | — | — | — | ||||||||||||||||
Total dividends and distributions | (0.25 | ) | (0.92 | ) | — | (0.20 | ) | (0.26 | ) | ||||||||||||||
Net asset value, end of year | $ | 15.00 | $ | 12.13 | $ | 12.87 | $ | 12.34 | $ | 11.78 | |||||||||||||
Total investment return2 | 25.88 | % | 1.02 | % | 4.21 | %3 | 6.56 | % | 12.85 | % | |||||||||||||
Ratios to average net assets: | |||||||||||||||||||||||
Expenses before fee waivers and/or expense reimbursements | 1.14 | % | 1.14 | %4 | 1.13 | %4 | 1.14 | % | 1.12 | % | |||||||||||||
Expenses after fee waivers and/or expense reimbursements | 0.95 | % | 0.95 | %4 | 0.95 | %4 | 0.95 | % | 1.00 | % | |||||||||||||
Net investment income (loss) | 1.10 | % | 1.27 | % | 1.27 | % | 0.64 | % | 0.41 | % | |||||||||||||
Supplemental data: | |||||||||||||||||||||||
Net assets, end of year (000's) | $ | 56,383 | $ | 51,311 | $ | 57,803 | $ | 64,009 | $ | 67,156 | |||||||||||||
Portfolio turnover | 128 | % | 120 | % | 35 | % | 54 | % | 56 | % | |||||||||||||
1 Calculated using the average share method.
2 Total investment return is calculated assuming a $10,000 investment on the first day of each year reported, reinvestment of all dividends and distributions, if any, at net asset value on the ex-dividend dates, and a sale at net asset value on the last day of each year reported. The figures do not include any applicable sales charges; results would be lower if they were included. Returns do not reflect the deduction of taxes that a shareholder would pay on Fund dividends/distributions or the redemption of Fund shares.
3 During the year, the Fund recorded a gain of $263,116 from affiliated funds that were previously liquidated. If this gain had been excluded, the total return of Class A and Class P would have been 3.89% and 4.13%, respectively.
4 Includes interest expense representing less than 0.005%.
See accompanying notes to financial statements.
141
UBS Emerging Markets Equity Opportunity Fund
Financial highlights
The table below sets forth financial data for one share of beneficial interest outstanding throughout each period presented.
Class P
Years ended June 30, | Period ended | ||||||||||||||
2021 | 2020 | June 30, 20191 | |||||||||||||
Net asset value, beginning of period | $ | 9.23 | $ | 9.28 | $ | 8.92 | |||||||||
Net investment income (loss)3 | 0.09 | 0.19 | 0.21 | ||||||||||||
Net realized and unrealized gain (loss) | 3.18 | 0.004 | 0.15 | ||||||||||||
Net increase (decrease) from operations | 3.27 | 0.19 | 0.36 | ||||||||||||
Dividends from net investment income | (0.11 | ) | (0.24 | ) | — | ||||||||||
Net asset value, end of period | $ | 12.39 | $ | 9.23 | $ | 9.28 | |||||||||
Total investment return6 | 35.51 | % | 1.84 | % | 4.04 | % | |||||||||
Ratios to average net assets: | |||||||||||||||
Expenses before fee waivers and/or expense reimbursements | 1.08 | % | 1.19 | % | 1.22 | %7 | |||||||||
Expenses after fee waivers and/or expense reimbursements | 1.00 | % | 1.04 | % | 1.15 | %7 | |||||||||
Net investment income (loss) | 0.73 | % | 2.14 | % | 5.73 | %7 | |||||||||
Supplemental data: | |||||||||||||||
Net assets, end of period (000's) | $ | 274,359 | $ | 100,543 | $ | 38,465 | |||||||||
Portfolio turnover | 41 | % | 50 | % | 52 | % | |||||||||
Class P2
Years ended June 30, | Period ended | ||||||||||||||||||
2021 | 2020 | 2019 | June 30, 20182 | ||||||||||||||||
Net asset value, beginning of period | $ | 9.30 | $ | 9.31 | $ | 9.40 | $ | 10.00 | |||||||||||
Net investment income (loss)3 | 0.18 | 0.26 | 0.19 | 0.03 | |||||||||||||||
Net realized and unrealized gains (losses) | 3.22 | 0.004 | (0.23 | )5 | (0.63 | ) | |||||||||||||
Net increase (decrease) from operations | 3.40 | 0.26 | (0.04 | ) | (0.60 | ) | |||||||||||||
Dividends from net investment income | (0.18 | ) | (0.27 | ) | (0.05 | ) | — | ||||||||||||
Net asset value, end of period | $ | 12.52 | $ | 9.30 | $ | 9.31 | $ | 9.40 | |||||||||||
Total investment return6 | 36.66 | % | 2.66 | % | (0.46 | )% | (5.90 | )% | |||||||||||
Ratios to average net assets: | |||||||||||||||||||
Expenses before fee waivers and/or expense reimbursements | 1.06 | % | 1.17 | % | 1.42 | % | 4.39 | %7 | |||||||||||
Expenses after fee waivers and/or expense reimbursements | 0.12 | % | 0.22 | % | 0.40 | % | 0.44 | %7 | |||||||||||
Net investment income (loss) | 1.56 | % | 2.88 | % | 2.16 | % | 4.05 | %7 | |||||||||||
Supplemental data: | |||||||||||||||||||
Net assets, end of period (000's) | $ | 761,661 | $ | 375,791 | $ | 186,941 | $ | 94,349 | |||||||||||
Portfolio turnover | 41 | % | 50 | % | 52 | % | 0 | % | |||||||||||
1 For the period February 1, 2019 (commencement of operations) through June 30, 2019.
2 For the period June 4, 2018 (commencement of operations) through June 30, 2018.
3 Calculated using the average share method.
4 Amount represents less than $0.005 per share.
5 The amount of net realized and unrealized gain per share does not correspond with the net realized and unrealized gain reported within the Statement of Changes due to the timing of purchases and redemptions of Fund shares and fluctuating market values.
6 Total investment return is calculated assuming a $10,000 investment on the first day of each period reported, reinvestment of all dividends and distributions, if any, at net asset value on the ex-dividend dates, and a sale at net asset value on the last day of each period reported. The figures do not include any applicable sales charges; results would be lower if they were included. Total investment return for periods less than one year has not been annualized. Returns do not reflect the deduction of taxes that a shareholder would pay on Fund dividends/distributions or the redemption of Fund shares.
7 Annualized.
See accompanying notes to financial statements.
142
UBS Engage For Impact Fund
Financial highlights
The table below sets forth financial data for one share of beneficial interest outstanding throughout each period presented.
Class P
Years ended June 30, | Period ended | ||||||||||||||
2021 | 2020 | June 30, 20191 | |||||||||||||
Net asset value, beginning of period | $ | 10.14 | $ | 10.81 | $ | 10.00 | |||||||||
Net investment income (loss)3 | 0.03 | 0.08 | 0.15 | ||||||||||||
Net realized and unrealized gain (loss) | 4.19 | (0.45 | ) | 0.67 | |||||||||||
Net increase (decrease) from operations | 4.22 | (0.37 | ) | 0.82 | |||||||||||
Dividends from net investment income | (0.02 | ) | (0.11 | ) | (0.01 | ) | |||||||||
Distributions from net realized gains | (0.08 | ) | (0.19 | ) | — | ||||||||||
Total dividends and distributions | (0.10 | ) | (0.30 | ) | (0.01 | ) | |||||||||
Net asset value, end of period | $ | 14.26 | $ | 10.14 | $ | 10.81 | |||||||||
Total investment return4 | 41.70 | % | (3.77 | )% | 8.27 | % | |||||||||
Ratios to average net assets: | |||||||||||||||
Expenses before fee waivers and/or expense reimbursements | 1.69 | % | 2.27 | % | 3.87 | %5 | |||||||||
Expenses after fee waivers and/or expense reimbursements | 0.85 | % | 0.85 | % | 0.85 | %5 | |||||||||
Net investment income (loss) | 0.27 | % | 0.75 | % | 2.13 | %5 | |||||||||
Supplemental data: | |||||||||||||||
Net assets, end of period (000's) | $ | 7,816 | $ | 26,241 | $ | 15,918 | |||||||||
Portfolio turnover | 78 | % | 43 | % | 67 | % | |||||||||
Class P2
| Period ended June 30, 20212 | |||||||
Net asset value, beginning of period | $ | 13.64 | |||||
Net investment income (loss)3 | 0.09 | ||||||
Net realized and unrealized gain (loss) | 0.56 | ||||||
Net increase (decrease) from operations | 0.65 | ||||||
Net asset value, end of period | $ | 14.29 | |||||
Total investment return4 | 4.77 | % | |||||
Ratios to average net assets: | |||||||
Expenses before fee waivers and/or expense reimbursements | 2.24 | %5 | |||||
Expenses after fee waivers and/or expense reimbursements | 0.25 | %5 | |||||
Net investment income (loss) | 1.80 | %5 | |||||
Supplemental data: | |||||||
Net assets, end of period (000's) | $ | 42,692 | |||||
Portfolio turnover | 78 | % | |||||
1 For the period October 24, 2018 (commencement of operations) through June 30, 2019
2 For the period February 24, 2021 (commencement of operations) through June 30, 2021.
3 Calculated using the average share method.
4 Total investment return is calculated assuming a $10,000 investment on the first day of each period reported, reinvestment of all dividends and distributions, if any, at net asset value on the ex-dividend dates, and a sale at net asset value on the last day of each period reported. The figures do not include any applicable sales charges; results would be lower if they were included. Total investment return for periods less than one year has not been annualized. Returns do not reflect the deduction of taxes that a shareholder would pay on Fund dividends/distributions or the redemption of Fund shares.
5 Annualized.
See accompanying notes to financial statements.
143
UBS International Sustainable Equity Fund
Financial highlights
The table below sets forth financial data for one share of beneficial interest outstanding throughout each period presented.
Class A
Years ended June 30, | |||||||||||||||||||||||
2021 | 2020 | 2019 | 2018 | 2017 | |||||||||||||||||||
Net asset value, beginning of year | $ | 9.62 | $ | 10.01 | $ | 10.20 | $ | 9.58 | $ | 8.05 | |||||||||||||
Net investment income (loss)2 | 0.05 | 0.16 | 0.13 | 0.08 | 0.19 | ||||||||||||||||||
Net realized and unrealized gain (loss) | 2.93 | (0.42 | ) | (0.16 | )3 | 0.66 | 1.51 | ||||||||||||||||
Net increase (decrease) from operations | 2.98 | (0.26 | ) | (0.03 | ) | 0.74 | 1.70 | ||||||||||||||||
Dividends from net investment income | (0.12 | ) | (0.13 | ) | (0.06 | ) | (0.12 | ) | (0.17 | ) | |||||||||||||
Distributions from net realized gains | — | — | (0.10 | ) | — | — | |||||||||||||||||
Total dividends and distributions | (0.12 | ) | (0.13 | ) | (0.16 | ) | (0.12 | ) | (0.17 | ) | |||||||||||||
Net asset value, end of year | $ | 12.48 | $ | 9.62 | $ | 10.01 | $ | 10.20 | $ | 9.58 | |||||||||||||
Total investment return4 | 31.09 | % | (2.73 | )% | (0.14 | )% | 7.67 | % | 21.43 | % | |||||||||||||
Ratios to average net assets: | |||||||||||||||||||||||
Expenses before fee waivers and/or expense reimbursements | 1.33 | % | 1.41 | %5 | 1.53 | % | 2.02 | % | 2.25 | % | |||||||||||||
Expenses after fee waivers and/or expense reimbursements | 1.25 | % | 1.25 | %5 | 1.25 | % | 1.25 | % | 1.25 | % | |||||||||||||
Net investment income (loss) | 0.45 | % | 1.60 | % | 1.38 | % | 0.79 | % | 2.16 | % | |||||||||||||
Supplemental data: | |||||||||||||||||||||||
Net assets, end of year (000's) | $ | 9,081 | $ | 7,442 | $ | 9,769 | $ | 8,049 | $ | 15,811 | |||||||||||||
Portfolio turnover | 52 | % | 41 | % | 57 | % | 43 | % | 33 | % | |||||||||||||
Class P
Years ended June 30, | |||||||||||||||||||||||
2021 | 2020 | 2019 | 2018 | 2017 | |||||||||||||||||||
Net asset value, beginning of year | $ | 9.66 | $ | 10.04 | $ | 10.23 | $ | 9.61 | $ | 8.08 | |||||||||||||
Net investment income (loss)2 | 0.09 | 0.18 | 0.17 | 0.14 | 0.14 | ||||||||||||||||||
Net realized and unrealized gain (loss) | 2.93 | (0.41 | ) | (0.18 | )3 | 0.63 | 1.58 | ||||||||||||||||
Net increase (decrease) from operations | 3.02 | (0.23 | ) | (0.01 | ) | 0.77 | 1.72 | ||||||||||||||||
Dividends from net investment income | (0.15 | ) | (0.15 | ) | (0.08 | ) | (0.15 | ) | (0.19 | ) | |||||||||||||
Distributions from net realized gains | — | — | (0.10 | ) | — | — | |||||||||||||||||
Total dividends and distributions | (0.15 | ) | (0.15 | ) | (0.18 | ) | (0.15 | ) | (0.19 | ) | |||||||||||||
Net asset value, end of year | $ | 12.53 | $ | 9.66 | $ | 10.04 | $ | 10.23 | $ | 9.61 | |||||||||||||
Total investment return4 | 31.40 | % | (2.40 | )% | 0.10 | % | 7.94 | % | 21.68 | % | |||||||||||||
Ratios to average net assets: | |||||||||||||||||||||||
Expenses before fee waivers and/or expense reimbursements | 1.05 | % | 1.12 | %5 | 1.26 | % | 1.70 | % | 2.06 | % | |||||||||||||
Expenses after fee waivers and/or expense reimbursements | 0.99 | % | 1.00 | %5 | 1.00 | % | 1.00 | % | 1.00 | % | |||||||||||||
Net investment income (loss) | 0.79 | % | 1.82 | % | 1.80 | % | 1.37 | % | 1.65 | % | |||||||||||||
Supplemental data: | |||||||||||||||||||||||
Net assets, end of year (000's) | $ | 380,983 | $ | 203,078 | $ | 146,616 | $ | 65,750 | $ | 19,952 | |||||||||||||
Portfolio turnover | 52 | % | 41 | % | 57 | % | 43 | % | 33 | % | |||||||||||||
1 For the period October 30, 2020 (commencement of operations) through June 20, 2021.
2 Calculated using the average share method.
3 The amount of net realized and unrealized gain per share does not correspond with the net realized and unrealized gain reported within the Statement of Changes due to the timing of purchases and redemptions of Fund shares and fluctuating market values.
4 Total investment return is calculated assuming a $10,000 investment on the first day of each year reported, reinvestment of all dividends and distributions, if any, at net asset value on the ex-dividend dates, and a sale at net asset value on the last day of each year reported. The figures do not include any applicable sales charges; results would be lower if they were included. Returns do not reflect the deduction of taxes that a shareholder would pay on Fund dividends/distributions or the redemption of Fund shares.
5 Includes interest expense representing less than 0.005%.
144
UBS International Sustainable Equity Fund
Financial highlights
Class P2
| Period ended June 30, 20211 | |||||||
Net asset value, beginning of period | $ | 10.05 | |||||
Net investment income (loss)2 | 0.14 | ||||||
Net realized and unrealized gains | 2.55 | ||||||
Net increase from operations | 2.69 | ||||||
Dividends from net investment income | (0.15 | ) | |||||
Total dividends, distributions and return of capital | (0.15 | ) | |||||
Net asset value, end of period | $ | 12.59 | |||||
Total investment return6 | 26.90 | % | |||||
Ratios to average net assets: | |||||||
Expenses before fee waivers and/or expense reimbursements | 1.08 | %7 | |||||
Expenses after fee waivers and/or expense reimbursements | 0.22 | %7 | |||||
Net investment income (loss) | 1.78 | %7 | |||||
Supplemental data: | |||||||
Net assets, end of period (000's) | $ | 41,571 | |||||
Portfolio turnover | 52 | % | |||||
6 Total investment return is calculated assuming a $10,000 investment on the first day of each period reported, reinvestment of all dividends and distributions, if any, at net asset value on the ex-dividend dates, and a sale at net asset value on the last day of each period reported. The figures do not include any applicable sales charges; results would be lower if they were included. Total investment return for periods less than one year has not been annualized. Returns do not reflect the deduction of taxes that a shareholder would pay on Fund dividends/distributions or the redemption of Fund shares.
7 Annualized.
See accompanying notes to financial statements.
145
UBS US Dividend Ruler Fund
Financial highlights
The table below sets forth financial data for one share of beneficial interest outstanding throughout each period presented.
Class P
| Period ended June 30, 20211 | |||||||
Net asset value, beginning of period | $ | 10.00 | |||||
Net investment income (loss)2 | 0.20 | ||||||
Net realized and unrealized gain (loss) | 2.72 | ||||||
Net increase (decrease) from operations | 2.92 | ||||||
Dividends from net investment income | (0.05 | ) | |||||
Distributions from net realized gains | (0.05 | ) | |||||
Total dividends and distributions | (0.10 | ) | |||||
Net asset value, end of period | $ | 12.82 | |||||
Total investment return3 | 29.37 | % | |||||
Ratios to average net assets: | |||||||
Expenses before fee waivers and/or expense reimbursements | 1.57 | %4 | |||||
Expenses after fee waivers and/or expense reimbursements | 0.50 | %4 | |||||
Net investment income (loss) | 1.72 | %4 | |||||
Supplemental data: | |||||||
Net assets, end of period (000's) | $ | 81,981 | |||||
Portfolio turnover | 24 | % | |||||
1 For the period from July 9, 2020 (commencement of operations) through June 30, 2021.
2 Calculated using the average share method.
3 Total investment return is calculated assuming a $10,000 investment on the first day of each period reported, reinvestment of all dividends and distributions, if any, at net asset value on the ex-dividend dates, and a sale at net asset value on the last day of each period reported. The figures do not include any applicable sales charges; results would be lower if they were included. Total investment return for periods less than one year has not been annualized. Returns do not reflect the deduction of taxes that a shareholder would pay on Fund dividends/distributions or the redemption of Fund shares.
4 Annualized.
See accompanying notes to financial statements.
146
UBS US Quality Growth At Reasonable Price Fund
Financial highlights
The table below sets forth financial data for one share of beneficial interest outstanding throughout each year presented.
Class P
| Period ended June 30, 20211 | |||||||
Net asset value, beginning of year | $ | 10.00 | |||||
Net investment income (loss)2 | 0.04 | ||||||
Net realized and unrealized gain (loss) | 3.10 | ||||||
Net increase (decrease) from operations | 3.14 | ||||||
Dividends from net investment income | (0.01 | ) | |||||
Distributions from net realized gains | (0.03 | ) | |||||
Total dividends and distributions | (0.04 | ) | |||||
Net asset value, end of year | $ | 13.10 | |||||
Total investment return3 | 31.49 | % | |||||
Ratios to average net assets: | |||||||
Expenses before fee waivers and/or expense reimbursements | 1.23 | %4 | |||||
Expenses after fee waivers and/or expense reimbursements | 0.50 | %4 | |||||
Net investment income (loss) | 0.32 | %4 | |||||
Supplemental data: | |||||||
Net assets, end of year (000's) | $ | 116,538 | |||||
Portfolio turnover | 29 | % | |||||
1 For the period from July 9, 2020 (commencement of operations) through June 30, 2021.
2 Calculated using the average share method.
3 Total investment return is calculated assuming a $10,000 investment on the first day of each period reported, reinvestment of all dividends and distributions, if any, at net asset value on the ex-dividend dates, and a sale at net asset value on the last day of each period reported. The figures do not include any applicable sales charges; results would be lower if they were included. Total investment return for periods less than one year has not been annualized. Returns do not reflect the deduction of taxes that a shareholder would pay on Fund dividends/distributions or the redemption of Fund shares.
4 Annualized.
See accompanying notes to financial statements.
147
UBS U.S. Small Cap Growth Fund
Financial highlights
The table below sets forth financial data for one share of beneficial interest outstanding throughout each year presented.
Class A
Years ended June 30, | |||||||||||||||||||||||
2021 | 2020 | 2019 | 2018 | 2017 | |||||||||||||||||||
Net asset value, beginning of year | $ | 19.74 | $ | 19.49 | $ | 20.74 | $ | 21.26 | $ | 17.75 | |||||||||||||
Net investment income (loss)1 | (0.25 | ) | (0.11 | ) | (0.10 | ) | (0.17 | ) | (0.15 | ) | |||||||||||||
Net realized and unrealized gain (loss) | 11.88 | 1.79 | 0.80 | 4.92 | 4.34 | ||||||||||||||||||
Net increase (decrease) from operations | 11.63 | 1.68 | 0.70 | 4.75 | 4.19 | ||||||||||||||||||
Distributions from net realized gains | (3.22 | ) | (1.43 | ) | (1.95 | ) | (5.27 | ) | (0.68 | ) | |||||||||||||
Net asset value, end of year | $ | 28.15 | $ | 19.74 | $ | 19.49 | $ | 20.74 | $ | 21.26 | |||||||||||||
Total investment return2 | 59.94 | % | 9.33 | % | 5.95 | % | 26.17 | % | 23.75 | % | |||||||||||||
Ratios to average net assets: | |||||||||||||||||||||||
Expenses before fee waivers and/or expense reimbursements | 1.43 | % | 1.60 | %3 | 1.57 | % | 1.66 | % | 1.56 | % | |||||||||||||
Expenses after fee waivers and/or expense reimbursements | 1.24 | % | 1.24 | %3 | 1.24 | % | 1.24 | % | 1.24 | % | |||||||||||||
Net investment income (loss) | (0.98 | )% | (0.63 | )% | (0.53 | )% | (0.83 | )% | (0.77 | )% | |||||||||||||
Supplemental data: | |||||||||||||||||||||||
Net assets, end of year (000's) | $ | 35,268 | $ | 22,909 | $ | 26,114 | $ | 26,498 | $ | 27,464 | |||||||||||||
Portfolio turnover | 63 | % | 79 | % | 54 | % | 67 | % | 50 | % | |||||||||||||
Class P
Years ended June 30, | |||||||||||||||||||||||
2021 | 2020 | 2019 | 2018 | 2017 | |||||||||||||||||||
Net asset value, beginning of year | $ | 22.37 | $ | 21.84 | $ | 22.89 | $ | 22.92 | $ | 19.05 | |||||||||||||
Net investment income (loss)1 | (0.22 | ) | (0.08 | ) | (0.06 | ) | (0.13 | ) | (0.11 | ) | |||||||||||||
Net realized and unrealized gain (loss) | 13.51 | 2.04 | 0.96 | 5.37 | 4.66 | ||||||||||||||||||
Net increase (decrease) from operations | 13.29 | 1.96 | 0.90 | 5.24 | 4.55 | ||||||||||||||||||
Distributions from net realized gains | (3.22 | ) | (1.43 | ) | (1.95 | ) | (5.27 | ) | (0.68 | ) | |||||||||||||
Net asset value, end of year | $ | 32.44 | $ | 22.37 | $ | 21.84 | $ | 22.89 | $ | 22.92 | |||||||||||||
Total investment return2 | 60.29 | % | 9.62 | % | 6.24 | % | 26.50 | % | 24.09 | % | |||||||||||||
Ratios to average net assets: | |||||||||||||||||||||||
Expenses before fee waivers and/or expense reimbursements | 1.16 | % | 1.29 | %3 | 1.30 | % | 1.34 | % | 1.22 | % | |||||||||||||
Expenses after fee waivers and/or expense reimbursements | 0.99 | % | 0.99 | %3 | 0.99 | % | 0.99 | % | 0.99 | % | |||||||||||||
Net investment income (loss) | (0.74 | )% | (0.37 | )% | (0.27 | )% | (0.58 | )% | (0.50 | )% | |||||||||||||
Supplemental data: | |||||||||||||||||||||||
Net assets, end of year (000's) | $ | 178,971 | $ | 92,754 | $ | 96,485 | $ | 88,845 | $ | 75,770 | |||||||||||||
Portfolio turnover | 63 | % | 79 | % | 54 | % | 67 | % | 50 | % | |||||||||||||
1 Calculated using the average share method.
2 Total investment return is calculated assuming a $10,000 investment on the first day of each year reported, reinvestment of all dividends and distributions, if any, at net asset value on the ex-dividend dates, and a sale at net asset value on the last day of each year reported. The figures do not include any applicable sales charges; results would be lower if they were included. Returns do not reflect the deduction of taxes that a shareholder would pay on Fund dividends/distributions or the redemption of Fund shares.
3 Includes interest expense representing less than 0.005%.
See accompanying notes to financial statements.
148
UBS Municipal Bond Fund
Financial highlights
The table below sets forth financial data for one share of beneficial interest outstanding throughout each year presented.
Class A
Years ended June 30, | |||||||||||||||||||||||
2021 | 2020 | 2019 | 2018 | 2017 | |||||||||||||||||||
Net asset value, beginning of year | $ | 10.84 | $ | 10.60 | $ | 10.07 | $ | 10.23 | $ | 10.52 | |||||||||||||
Net investment income (loss)1 | 0.13 | 0.18 | 0.18 | 0.16 | 0.15 | ||||||||||||||||||
Net realized and unrealized gain (loss) | 0.17 | 0.24 | 0.53 | (0.16 | ) | (0.27 | ) | ||||||||||||||||
Net increase (decrease) from operations | 0.30 | 0.42 | 0.71 | — | (0.12 | ) | |||||||||||||||||
Dividends from net investment income | (0.13 | ) | (0.18 | ) | (0.18 | ) | (0.16 | ) | (0.15 | ) | |||||||||||||
Distributions from net realized gains | (0.09 | ) | — | — | — | (0.02 | ) | ||||||||||||||||
Total dividends and distributions | (0.22 | ) | (0.18 | ) | (0.18 | ) | (0.16 | ) | (0.17 | ) | |||||||||||||
Net asset value, end of year | $ | 10.92 | $ | 10.84 | $ | 10.60 | $ | 10.07 | $ | 10.23 | |||||||||||||
Total investment return2 | 2.82 | % | 3.98 | % | 7.17 | % | 0.04 | % | (1.11 | )% | |||||||||||||
Ratios to average net assets: | |||||||||||||||||||||||
Expenses before fee waivers and/or expense reimbursements | 0.99 | %3 | 1.00 | %3 | 1.07 | %3 | 1.03 | % | 1.00 | % | |||||||||||||
Expenses after fee waivers and/or expense reimbursements | 0.65 | %3 | 0.65 | %3 | 0.65 | %3 | 0.65 | % | 0.65 | % | |||||||||||||
Net investment income (loss) | 1.21 | % | 1.66 | % | 1.80 | % | 1.61 | % | 1.42 | % | |||||||||||||
Supplemental data: | |||||||||||||||||||||||
Net assets, end of year (000's) | $ | 9,858 | $ | 12,496 | $ | 12,796 | $ | 9,378 | $ | 21,007 | |||||||||||||
Portfolio turnover4 | 35 | % | 23 | % | 31 | % | 39 | % | 60 | % | |||||||||||||
Class P
Years ended June 30, | |||||||||||||||||||||||
2021 | 2020 | 2019 | 2018 | 2017 | |||||||||||||||||||
Net asset value, beginning of year | $ | 10.84 | $ | 10.60 | $ | 10.06 | $ | 10.22 | $ | 10.52 | |||||||||||||
Net investment income (loss)1 | 0.16 | 0.20 | 0.21 | 0.19 | 0.17 | ||||||||||||||||||
Net realized and unrealized gain (loss) | 0.16 | 0.24 | 0.54 | (0.16 | ) | (0.28 | ) | ||||||||||||||||
Net increase (decrease) from operations | 0.32 | 0.44 | 0.75 | 0.03 | (0.11 | ) | |||||||||||||||||
Dividends from net investment income | (0.16 | ) | (0.20 | ) | (0.21 | ) | (0.19 | ) | (0.17 | ) | |||||||||||||
Distributions from net realized gains | (0.09 | ) | — | — | — | (0.02 | ) | ||||||||||||||||
Total dividends and distributions | (0.25 | ) | (0.20 | ) | (0.21 | ) | (0.19 | ) | (0.19 | ) | |||||||||||||
Net asset value, end of year | $ | 10.91 | $ | 10.84 | $ | 10.60 | $ | 10.06 | $ | 10.22 | |||||||||||||
Total investment return2 | 2.99 | % | 4.24 | % | 7.55 | % | 0.30 | % | (0.97 | )% | |||||||||||||
Ratios to average net assets: | |||||||||||||||||||||||
Expenses before fee waivers and/or expense reimbursements | 0.74 | %3 | 0.74 | %3 | 0.82 | %3 | 0.79 | % | 0.77 | % | |||||||||||||
Expenses after fee waivers and/or expense reimbursements | 0.40 | %3 | 0.40 | %3 | 0.40 | %3 | 0.40 | % | 0.40 | % | |||||||||||||
Net investment income (loss) | 1.45 | % | 1.91 | % | 2.03 | % | 1.88 | % | 1.68 | % | |||||||||||||
Supplemental data: | |||||||||||||||||||||||
Net assets, end of year (000's) | $ | 103,400 | $ | 106,533 | $ | 89,222 | $ | 107,153 | $ | 101,601 | |||||||||||||
Portfolio turnover4 | 35 | % | 23 | % | 31 | % | 39 | % | 60 | % | |||||||||||||
1 Calculated using the average share method.
2 Total investment return is calculated assuming a $10,000 investment on the first day of each year reported, reinvestment of all dividends and distributions, if any, at net asset value on the ex-dividend dates, and a sale at net asset value on the last day of each year reported. The figures do not include any applicable sales charges; results would be lower if they were included. Returns do not reflect the deduction of taxes that a shareholder would pay on Fund dividends/distributions or the redemption of Fund shares.
3 Includes interest expense representing less than 0.005%.
4 Effective with the fiscal year ended June 30, 2017, calculation of the portfolio turnover rate excludes transactions involving variable-rate demand notes,which are considered short-term instruments due to the ability to demand immediate repayment.
See accompanying notes to financial statements.
149
UBS Sustainable Development Bank Bond Fund
Financial highlights
The table below sets forth financial data for one share of beneficial interest outstanding throughout each period presented.
Class P
Years ended June 30, | Period ended | ||||||||||||||
2021 | 2020 | June 30, 20191 | |||||||||||||
Net asset value, beginning of period | $ | 11.17 | $ | 10.58 | $ | 10.00 | |||||||||
Net investment income (loss)3 | 0.13 | 0.21 | 0.19 | ||||||||||||
Net realized and unrealized gain (loss) | (0.31 | ) | 0.63 | 0.58 | |||||||||||
Net increase (decrease) from operations | (0.18 | ) | 0.84 | 0.77 | |||||||||||
Dividends from net investment income | (0.12 | ) | (0.21 | ) | (0.19 | ) | |||||||||
Distributions from net realized gains | (0.27 | ) | (0.04 | ) | — | ||||||||||
Total dividends and distributions | (0.39 | ) | (0.25 | ) | (0.19 | ) | |||||||||
Net asset value, end of period | $ | 10.60 | $ | 11.17 | $ | 10.58 | |||||||||
Total investment return4 | (1.70 | )% | 8.03 | % | 7.75 | % | |||||||||
Ratios to average net assets: | |||||||||||||||
Expenses before fee waivers and/or expense reimbursements | 0.80 | % | 1.07 | %5 | 2.19 | %6 | |||||||||
Expenses after fee waivers and/or expense reimbursements | 0.25 | % | 0.25 | %5 | 0.25 | %6 | |||||||||
Net investment income (loss) | 1.18 | % | 1.94 | % | 2.67 | %6 | |||||||||
Supplemental data: | |||||||||||||||
Net assets, end of period (000's) | $ | 17,510 | $ | 37,414 | $ | 25,235 | |||||||||
Portfolio turnover | 16 | % | 80 | % | 20 | % | |||||||||
Class P2
| Period ended June 30, 20212 | |||||||
Net asset value, beginning of period | $ | 11.09 | |||||
Net investment income (loss)3 | 0.08 | ||||||
Net realized and unrealized gains (losses) | (0.23 | ) | |||||
Net increase (decrease) from operations | (0.15 | ) | |||||
Dividends from net investment income | (0.08 | ) | |||||
Distributions from net realized gains | (0.27 | ) | |||||
Total dividends and distributions | (0.35 | ) | |||||
Net asset value, end of period | $ | 10.59 | |||||
Total investment return4 | (1.34 | )% | |||||
Ratios to average net assets: | |||||||
Expenses before fee waivers and/or expense reimbursements | 0.68 | %6 | |||||
Expenses after fee waivers and/or expense reimbursements | 0.15 | %6 | |||||
Net investment income (loss) | 1.09 | %6 | |||||
Supplemental data: | |||||||
Net assets, end of period (000's) | $ | 65,659 | |||||
Portfolio turnover | 16 | % | |||||
1 For the period October 24, 2018 (commencement of operations) through June 30, 2019.
2 For the period October 30, 2020 (commencement of operations) through June 30, 2021.
3 Calculated using the average share method.
4 Total investment return is calculated assuming a $10,000 investment on the first day of each year reported, reinvestment of all dividends and distributions, if any, at net asset value on the ex-dividend dates, and a sale at net asset value on the last day of each period reported. The figures do not include any applicable sales charges; results would be lower if they were included. Total investment return for periods less than one year has not been annualized. Returns do not reflect the deduction of taxes that a shareholder would pay on Fund dividends/distributions or the redemption of Fund shares.
5 Includes interest expense representing less than 0.005%.
6 Annualized.
See accompanying notes to financial statements.
150
UBS Total Return Bond Fund
Financial highlights
The table below sets forth financial data for one share of beneficial interest outstanding throughout each period presented.
Class A
Years ended June 30, | Period ended | ||||||||||||||||||||||
2021 | 2020 | 2019 | 2018 | June 30, 20171 | |||||||||||||||||||
Net asset value, beginning of period | $ | 15.64 | $ | 15.09 | $ | 14.40 | $ | 14.94 | $ | 15.24 | |||||||||||||
Net investment income (loss)2 | 0.30 | 0.41 | 0.45 | 0.47 | 0.25 | ||||||||||||||||||
Net realized and unrealized gain (loss) | (0.02 | ) | 0.50 | 0.65 | (0.65 | ) | (0.30 | ) | |||||||||||||||
Net increase (decrease) from operations | 0.28 | 0.91 | 1.10 | (0.18 | ) | (0.05 | ) | ||||||||||||||||
Dividends from net investment income | (0.26 | ) | (0.36 | ) | (0.41 | ) | (0.36 | ) | (0.25 | ) | |||||||||||||
Return of capital | — | — | — | — | (0.00 | )3 | |||||||||||||||||
Total dividends and distributions | (0.26 | ) | (0.36 | ) | (0.41 | ) | (0.36 | ) | (0.25 | ) | |||||||||||||
Net asset value, end of period | $ | 15.66 | $ | 15.64 | $ | 15.09 | $ | 14.40 | $ | 14.94 | |||||||||||||
Total investment return4 | 1.83 | % | 6.14 | % | 7.63 | % | (1.12 | )% | (0.31 | )% | |||||||||||||
Ratios to average net assets: | |||||||||||||||||||||||
Expenses before fee waivers and/or expense reimbursements | 1.73 | % | 1.59 | %6 | 1.68 | %6 | 1.45 | % | 1.74 | %5 | |||||||||||||
Expenses after fee waivers and/or expense reimbursements | 0.75 | % | 0.75 | %6 | 0.75 | %6 | 0.75 | % | 0.75 | %5 | |||||||||||||
Net investment income (loss) | 1.90 | % | 2.66 | % | 3.10 | % | 3.22 | % | 2.28 | %5 | |||||||||||||
Supplemental data: | |||||||||||||||||||||||
Net assets, end of period (000's) | $ | 681 | $ | 650 | $ | 488 | $ | 108 | $ | 44 | |||||||||||||
Portfolio turnover | 169 | % | 209 | % | 234 | % | 236 | % | 700 | % | |||||||||||||
Class P
Years ended June 30, | |||||||||||||||||||||||
2021 | 2020 | 2019 | 2018 | 2017 | |||||||||||||||||||
Net asset value, beginning of year | $ | 15.65 | $ | 15.10 | $ | 14.41 | $ | 14.94 | $ | 15.14 | |||||||||||||
Net investment income (loss)2 | 0.34 | 0.45 | 0.49 | 0.49 | 0.37 | ||||||||||||||||||
Net realized and unrealized gain (loss) | (0.02 | ) | 0.50 | 0.64 | (0.63 | ) | (0.18 | ) | |||||||||||||||
Net increase (decrease) from operations | 0.32 | 0.95 | 1.13 | (0.14 | ) | 0.19 | |||||||||||||||||
Dividends from net investment income | (0.30 | ) | (0.40 | ) | (0.44 | ) | (0.39 | ) | (0.39 | ) | |||||||||||||
Return of capital | — | — | — | — | (0.00 | )3 | |||||||||||||||||
Total dividends and distributions | (0.30 | ) | (0.40 | ) | (0.44 | ) | (0.39 | ) | (0.39 | ) | |||||||||||||
Net asset value, end of year | $ | 15.67 | $ | 15.65 | $ | 15.10 | $ | 14.41 | $ | 14.94 | |||||||||||||
Total investment return4 | 2.07 | % | 6.40 | % | 7.95 | % | (0.88 | )% | 1.32 | % | |||||||||||||
Ratios to average net assets: | |||||||||||||||||||||||
Expenses before fee waivers and/or expense reimbursements | 1.52 | % | 1.38 | %6 | 1.45 | %6 | 1.30 | % | 1.29 | % | |||||||||||||
Expenses after fee waivers and/or expense reimbursements | 0.50 | % | 0.50 | %6 | 0.50 | %6 | 0.50 | % | 0.50 | % | |||||||||||||
Net investment income (loss) | 2.15 | % | 2.92 | % | 3.35 | % | 3.29 | % | 2.45 | % | |||||||||||||
Supplemental data: | |||||||||||||||||||||||
Net assets, end of year (000's) | $ | 34,629 | $ | 37,048 | $ | 38,949 | $ | 41,245 | $ | 49,919 | |||||||||||||
Portfolio turnover | 169 | % | 209 | % | 234 | % | 236 | % | 700 | % | |||||||||||||
1 For the period September 29, 2016 (commencement of operations) through June 30, 2017.
2 Calculated using the average share method.
3 Amount represents less than $0.005 per share.
4 Total investment return is calculated assuming a $10,000 investment on the first day of each year reported, reinvestment of all dividends and distributions, if any, at net asset value on the ex-dividend dates, and a sale at net asset value on the last day of each period reported. The figures do not include any applicable sales charges; results would be lower if they were included. Total investment return for period less than one year has not been annualized. Returns do not reflect the deduction of taxes that a shareholder would pay on Fund dividends/distributions or the redemption of Fund shares.
5 Annualized.
6 Includes interest expense representing less than 0.005%.
See accompanying notes to financial statements.
151
The UBS Funds
Notes to financial statements
Organization and significant accounting policies
The UBS Funds (the "Trust") is an open-end management investment company registered with the US Securities and Exchange Commission ("SEC") under the Investment Company Act of 1940 (the "1940 Act"), as amended, currently offering multiple series representing separate investment portfolios. The Trust is a Delaware statutory trust organized on August 13, 1993. The trustees of the Trust have authority to issue an unlimited number of shares of beneficial interest at par value of $0.001 per share.
The Trust has twelve Funds available for investment, each having its own investment objectives and policies: UBS All China Equity Fund, UBS Dynamic Alpha Fund, UBS Global Allocation Fund, UBS Emerging Markets Equity Opportunity Fund, UBS Engage For Impact Fund, UBS International Sustainable Equity Fund, UBS US Dividend Ruler Fund, UBS US Quality Growth at Reasonable Price Fund, UBS U.S. Small Cap Growth Fund, UBS Municipal Bond Fund, UBS Sustainable Development Bank Bond Fund, and UBS Total Return Bond Fund, (each a "Fund", and collectively, the "Funds"). Each of the Funds is classified as a diversified investment company with the exception of UBS Dynamic Alpha Fund, UBS Municipal Bond Fund, and the UBS Sustainable Development Bank Bond Fund which are classified as non-diversified for purposes of the 1940 Act.
UBS Asset Management (Americas) Inc. ("UBS AM" or the "Advisor") serves as the investment advisor and administrator for the Funds. UBS Asset Management (US) Inc. ("UBS AM (US)") serves as principal underwriter for the Funds. UBS AM and UBS AM (US) are indirect wholly owned subsidiaries of UBS Group AG. UBS Group AG is an internationally diversified organization with headquarters in Zurich, Switzerland. UBS Group AG operates in many areas of the financial services industry.
The Funds currently offer Class A and Class P shares, with the exception of UBS Emerging Markets Equity Opportunity Fund, UBS Engage For Impact Fund, UBS International Sustainable Equity Fund and UBS Sustainable Development Bank Bond Fund, which currently offers Class P2 shares. Each class represents interests in the same assets of the applicable Fund and the classes are identical except for differences in their sales charge structures, ongoing service and distribution charges and certain transfer agency and related services expenses. All classes of shares have equal voting privileges except that each class has exclusive voting rights with respect to its service and/or distribution plan, if any. Class P and Class P2 shares have no service or distribution plan.
The Trust accounts separately for the assets, liabilities and operations of each Fund. Expenses directly attributable to each Fund are charged to that Fund's operations; expenses which are applicable to all Funds are allocated among them on a pro rata basis.
In the normal course of business, the Funds may enter into contracts that contain a variety of representations that provide indemnification for certain liabilities. The Funds' maximum exposure under these arrangements is unknown, as this would involve future claims that may be made against the Funds that have not yet occurred. However, the Funds have not had any prior claims or losses pursuant to these contracts and expect the risk of loss to be remote.
Under certain circumstances, shareholders of the Funds may receive payment for redemptions in securities rather than in cash.
The Financial Accounting Standards Board ("FASB") Accounting Standards Codification ("ASC") is the exclusive reference of authoritative US generally accepted accounting principles ("US GAAP") recognized by the FASB to be applied by nongovernmental entities. Rules and interpretive releases of the SEC under authority of federal laws are also sources of authoritative US GAAP for SEC registrants. The Funds' financial statements are prepared in accordance with US GAAP, which may require the use of management estimates and assumptions. Actual results could differ from those estimates.
152
The UBS Funds
Notes to financial statements
In March 2020, the Financial Accounting Standards Board ("FASB") issued Accounting Standards Update No. 2020-04 ("ASU 2020-04"), "Reference Rate Reform (Topic 848)". In response to concerns about structural risks of interbank offered rates, and particularly the risk of cessation of LIBOR, regulators have undertaken reference rate reform initiatives to identify alternative reference rates that are more observable or transaction based and less susceptible to manipulation. ASU 2020-04 provides optional guidance for a limited period of time to ease the potential burden in accounting for (or recognizing the effects of) reference rate reform on financial reporting. ASU 2020-04 is elective and applies to all entities, subject to meeting certain criteria, that have contracts, hedging relationships, and other transactions that reference LIBOR or another reference rate expected to be discontinued because of reference rate reform. The amendments are effective as of March 12, 2020 through December 31, 2022. Management is currently evaluating the implications, if any, of the additional requirements and the impact on the Funds' financial statements.
The following is a summary of significant accounting policies:
Investment transactions, investment income and expenses: Investment transactions are recorded on the trade date. Realized gains and losses from investment transactions and foreign exchange transactions are calculated using the identified cost method. Dividend income and expense are recorded net of withholding taxes on the ex-dividend date ("ex-date") except in the case of certain dividends from foreign securities which are recorded as soon after the ex-date as the respective Fund , using reasonable diligence, becomes aware of such dividends. Interest income is recorded on an accrual basis. Discounts are accreted and premiums are amortized as adjustments to interest income and the identified cost of investments.
Income, expenses (excluding class-specific expenses) and realized/unrealized gains/losses are allocated proportionately to each class of shares based upon the relative net asset value of outstanding shares (or the value of dividend eligible shares, as appropriate) of each class at the beginning of the day after adjusting for current capital share activity of the respective classes. Class specific expenses are charged directly to the applicable class of shares.
Offering costs
Offering costs are accounted for as deferred costs until operations begin and are then amortized to expense over twelve months on a straight-line basis.
Dividends and distributions: Dividends and distributions to shareholders are recorded on the ex-dividend date. The amount of dividends from net investment income and distributions from net realized capital gains and/or return of capital are determined in accordance with US federal income tax regulations, which may differ from US GAAP. These "book/tax" differences are either considered temporary or permanent in nature. To the extent these differences are permanent in nature, such amounts are reclassified within the capital accounts based on their federal tax-basis treatment; temporary differences do not require reclassification.
Foreign currency translation: The books and records of the Funds are maintained in US dollars. Foreign currency amounts are translated into US dollars as follows: (1) the foreign currency market value of investment securities and other assets and liabilities stated in foreign currencies are translated into US dollars based on the current exchange rates each business day; and (2) purchases and sales of investment securities and income and expenses are translated at the rate of exchange prevailing on the respective dates of such transactions. The resulting exchange gains and losses are included in the Statement of operations.
The Funds do not generally isolate the effect of fluctuations in foreign exchange rates from the effect of the changes in the market prices of securities. However, the Funds do isolate the effect of fluctuations in foreign exchange rates when determining the realized gain or loss upon the sale or maturity of foreign currency-denominated securities pursuant to US federal income tax regulations. Net realized foreign currency transaction gain (loss) is treated as ordinary income (loss) for income tax reporting purposes.
153
The UBS Funds
Notes to financial statements
Concentration of risk: Investing in securities of foreign issuers and currency transactions may involve certain considerations and risks not typically associated with investments in the United States. These risks include revaluation of currencies, adverse fluctuations in foreign currency values and possible adverse political, social and economic developments, including those particular to a specific industry, country or region, which could cause the securities and their markets to be less liquid and prices more volatile than those of comparable US companies and US government securities. These risks are greater with respect to securities of issuers located in emerging market countries in which some Funds in the Trust invest.
Small capitalization ("small cap") companies may be more vulnerable than larger capitalization ("large cap") companies to adverse business or economic developments. Small cap companies may also have limited product lines, markets or financial resources, and may be dependent on a relatively small management group. Securities of such companies may be less liquid and more volatile than securities of large cap companies or the market averages in general and therefore may involve greater risk than investing in large cap companies. In addition, small cap companies may not be well-known to the investing public, may not have institutional ownership and may have only cyclical, static or moderate growth prospects.
The ability of the issuers of debt securities held by the Funds to meet their obligations may be affected by economic and political developments particular to a specific industry, country, state or region.
Investments in bonds with ratings of BB (Standard & Poor's Financial Services LLC or Fitch Ratings, Inc.) or Ba (Moody's Investors Service, Inc.) or below (commonly referred to as "high yield" bonds), or deemed of equivalent quality, have an increased risk of defaulting or otherwise being unable to honor a financial obligation. These securities are considered to be predominantly speculative with respect to an issuer's capacity to pay interest and repay principal in accordance with the terms of the obligations. Lower-quality bonds are more likely to be subject to an issuer's default or downgrade than investment grade (higher-quality) bonds.
Many financial instruments, financings or other transactions to which a Fund may be a party use or may use a floating rate based on the London Interbank Offered Rate ("LIBOR"). LIBOR is widely used in financial markets. In July 2017, the United Kingdom's financial regulatory body announced that after 2021 it will cease its active encouragement of banks to provide the quotations needed to sustain LIBOR. That announcement suggests that LIBOR may cease to be published or utilized after that time. Various financial industry groups have begun planning for that transition, but the effect of the transition process and its ultimate success cannot yet be determined. The transition process may lead to increased volatility and illiquidity in markets for instruments the terms of which are based on LIBOR. It could also lead to a reduction in the value of some LIBOR-based investments and reduce the effectiveness of new hedges placed against existing LIBOR-based investments. Since the usefulness of LIBOR as a benchmark could deteriorate during the transition period, these effects could occur prior to the end of 2021. The willingness and ability of issuers to include enhanced provisions in new and existing contracts or instruments also remains uncertain. Any of these factors may adversely affect the Fund's performance or NAV. On November 30, 2020, the administrator of LIBOR announced a delay in the phase out of a majority of the U.S. dollar LIBOR publications until June 30, 2023, with the remainder of LIBOR publications to still end at the end of 2021.
Certain impacts to public health conditions particular to the coronavirus (COVID-19) outbreak that occurred may have a significant negative impact on the operations and profitability of the issuers of the Funds' investments. The extent of the impact to the financial performance of the Funds will depend on future developments, including (i) the duration and spread of the outbreak, (ii) the restrictions and advisories, (iii) the effects on the financial markets, and (iv) the effects on the economy overall, all of which are highly uncertain and cannot be predicted.
Valuation of investments
Each Fund generally calculates its net asset value on days that the New York Stock Exchange ("NYSE") is open. The Fund calculates net asset value as of the close of regular trading on the NYSE (generally, 4:00 p.m., Eastern time).
154
The UBS Funds
Notes to financial statements
The NYSE normally is not open, and the Fund does not price its shares, on most national holidays and Good Friday. To the extent that the Fund's assets are traded in other markets on days when the NYSE is not open, the value of the Fund's assets may be affected on those days. If trading on the NYSE is halted for the day before 4:00 p.m., Eastern time, the Fund's net asset value per share generally will still be calculated as of the close of regular trading on the NYSE. The time at which the Fund calculates its net asset value and until which purchase, sale or exchange orders are accepted may be changed as permitted by the SEC.
Each Fund calculates its net asset value based on the current market value, where available, for its portfolio investments. The Fund normally obtains market values for its investments from independent pricing sources and broker-dealers. Independent pricing sources may use reported last sale prices, official market closing prices, current market quotations or valuations from computerized "evaluation" systems that derive values based on comparable investments. An evaluation system incorporates parameters such as security quality, maturity and coupon, and/or research and evaluations by its staff, including review of broker-dealer market price quotations, if available, in determining the valuation of the portfolio investments. Investments also may be valued based on appraisals derived from information concerning the investment or similar investments received from recognized dealers in those holdings.
Investments traded in the over-the-counter ("OTC") market and listed on The NASDAQ Stock Market, Inc. ("NASDAQ") normally are valued at the NASDAQ Official Closing Price. Other OTC securities are valued at the last bid price on the valuation date available prior to valuation. Investments which are listed on U.S. and foreign stock exchanges normally are valued at the market closing price, the last sale price on the day the securities are valued or, lacking any sales on such day, at the last available bid price. Investments listed on foreign stock exchanges may be fair valued based on significant events that have occurred subsequent to the close of the foreign markets. In cases where investments are traded on more than one exchange, the investments are valued on the exchange designated as the primary market by UBS AM. If a market value is not readily available from an independent pricing source for a particular investment, that investment is valued at fair value as determined in good faith by or under the direction of the Trust's Board of Trustees (the "Board"). Foreign currency exchange rates are generally determined as of the close of the NYSE.
Certain investments in which the Fund invests are traded in markets that close before 4:00 p.m., Eastern time. Normally, developments that occur between the close of the foreign markets and 4:00 p.m., Eastern time, will not be reflected in the Fund's net asset value. However, if the Fund determines that such developments are so significant that they will materially affect the value of the Fund's investments, the Fund may adjust the previous closing prices to reflect what is believed to be the fair value of these investments as of 4:00 p.m., Eastern time.
Certain Funds may use a systematic fair valuation model provided by an independent third party to value investments principally traded in foreign markets in order to adjust for possible stale pricing that may occur between the close of the foreign exchanges and the time for valuation. The systematic fair valuation model may use calculations based on indices of domestic securities and other appropriate indicators, such as prices of relevant ADRs and futures contracts. If an investment is valued at a "fair value," that value is likely to be different from the last quoted market price for the investment. The use of the fair valuation model may result in securities being transferred between Level 1 and Level 2 of the fair valuation hierarchy at the end of the reporting period.
The amortized cost method of valuation, which approximates market value, generally is used to value short-term debt instruments with 60 days or less remaining to maturity, unless the Board determines that this does not represent fair value.
Investments in open-end investment companies are valued at the daily closing net asset value of the respective investment company. Pursuant to the Fund's use of the practical expedient within ASC Topic 820, Fair Value Measurement, investments in investment companies without publicly published prices are also valued at the daily net asset value.
155
The UBS Funds
Notes to financial statements
All investments quoted in foreign currencies are valued daily in U.S. dollars on the basis of the foreign currency exchange rates prevailing at the time such valuation is determined by the Fund's custodian.
Futures contracts are generally valued at the settlement price established each day on the exchange on which they are traded. Forward foreign currency contracts are valued daily using forward exchange rates quoted by independent pricing services.
Swaps are marked-to-market daily based upon values from third-party vendors or quotations from market makers to the extent available. In the event that market quotations are not readily available or deemed unreliable, the swap is valued at fair value as determined in good faith by or under the direction of the Board.
The Board has delegated to the Equities, Fixed Income and Multi-Asset Valuation Committee ("VC") the responsibility for making fair value determinations with respect to the Fund's portfolio holdings. The VC is comprised of representatives of management. The VC provides reports to the Board at each quarterly meeting regarding any investments that have been fair valued, valued pursuant to standing instructions approved by the VC, or where non-vendor pricing sources had been used to make fair value determinations when sufficient information exists during the prior quarter. Fair valuation determinations are subject to review at least monthly by the VC during scheduled meetings. Pricing decisions, processes, and controls over fair value determinations are subject to internal and external reviews, including annual internal compliance reviews and periodic internal audit reviews.
The types of investments for which such fair value pricing may be necessary include, but are not limited to: foreign investments under some circumstances; securities of an issuer that has entered into a restructuring; investments whose trading has been halted or suspended; fixed income securities that are in default and for which there is no current market value quotation; and investments that are restricted as to transfer or resale. The need to fair value a Fund's portfolio investments may also result from low trading volume in foreign markets or thinly traded domestic investments, and when a security that is subject to a trading limit or collar on the exchange or market on which it is primarily traded reaches the "limit up" or "limit down" price and no trading has taken place at that price. Various factors may be reviewed in order to make a good faith determination of an investment's fair value. These factors include, but are not limited to, fundamental analytical data relating to the investment; the nature and duration of restrictions on disposition of the investment; and the evaluation of forces which influence the market in which the investment is purchased and sold. Valuing investments at fair value involves greater reliance on judgment than valuing investments that have readily available market quotations. Fair value determinations can also involve reliance on quantitative models employed by a fair value pricing service.
US GAAP requires disclosure regarding the various inputs that are used in determining the value of each Fund's investments. These inputs are summarized into the three broad levels listed below:
Level 1—Unadjusted quoted prices in active markets for identical investments.
Level 2—Other significant observable inputs, including but not limited to, quoted prices for similar investments, interest rates, prepayment speeds and credit risks.
Level 3—Unobservable inputs inclusive of the Funds' own assumptions in determining the fair value of investments.
In accordance with the requirements of US GAAP, a fair value hierarchy has been included near the end of each Fund's Portfolio of investments.
Investments
Asset-backed securities: Certain Funds may invest in asset-backed securities ("ABS"), representing interests in pools of certain types of underlying installment loans, home equity loans, leases of various types of real and personal property and receivables from revolving lines of credit (credit cards). Such assets are securitized through the
156
The UBS Funds
Notes to financial statements
use of trusts or special purpose corporations. The yield characteristics of ABS differ from those of traditional debt securities. One such major difference is that principal may be prepaid at any time because the underlying obligations generally may be prepaid at any time. ABS may decrease in value as a result of increases in interest rates and may benefit less than other fixed-income securities from declining interest rates because of the risk of prepayment.
Mortgage-backed securities: Certain Funds may invest in mortgage-backed securities ("MBS"), representing direct or indirect interests in pools of underlying mortgage loans that are secured by real property. These securities provide investors with payments consisting of both principal and interest as the mortgages in the underlying mortgage pools are paid.
The timely payment of principal and interest (but not the market value) on MBS issued or guaranteed by Ginnie Mae (formally known as the Government National Mortgage Association or GNMA) is backed by Ginnie Mae and the full faith and credit of the US government. Obligations issued by Fannie Mae (formally known as the Federal National Mortgage Association or FNMA) and Freddie Mac (formally known as the Federal Home Loan Mortgage Company or FHLMC) are historically supported only by the credit of the issuer, but currently are guaranteed by the US government in connection with such agencies being placed temporarily into conservatorship by the US government.
Some MBS are sponsored or issued by private entities. Payments of principal and interest (but not the market value) of such private MBS may be supported by pools of mortgage loans or other MBS that are guaranteed, directly or indirectly, by the US government or one of its agencies or instrumentalities, or they may be issued without any government guarantee of the underlying mortgage assets but with some form of non-government credit enhancement.
Collateralized mortgage obligations ("CMO") are a type of MBS. A CMO is a debt security that may be collateralized by whole mortgage loans or mortgage pass-through securities. The mortgage loans or mortgage pass-through securities are divided into classes or tranches with each class having its own characteristics. Investors typically receive payments out of the interest and principal on the underlying mortgages. The portions of these payments that investors receive, as well as the priority of their rights to receive payments, are determined by the specific terms of the CMO class.
The yield characteristics of MBS differ from those of traditional debt securities. Among the major differences are that interest and principal payments are made more frequently, usually monthly, and that principal may be prepaid at any time because the underlying mortgage loans or other obligations generally may be prepaid at any time. Prepayments on a pool of mortgage loans are influenced by a variety of economic, geographic, social and other factors. Generally, prepayments on fixed-rate mortgage loans will increase during a period of falling interest rates and decrease during a period of rising interest rates. Certain classes of CMOs and other MBS are structured in a manner that makes them extremely sensitive to changes in prepayment rates. Such classes include interest-only ("IO") and principal-only ("PO") classes. IOs are entitled to receive all or a portion of the interest, but none (or only a nominal amount) of the principal payments, from the underlying mortgage assets. If the mortgage assets underlying an IO experience greater than anticipated principal prepayments, then the total amount of interest payments allocable to the IO class, and therefore the yield to investors, generally will be reduced. Conversely, PO classes are entitled to receive all or a portion of the principal payments, but none of the interest, from the underlying mortgage assets. PO classes are purchased at substantial discounts from par, and the yield to investors will be reduced if principal payments are slower than expected.
Real estate investment trusts: Certain Funds may invest in real estate investment trusts ("REITs"). Distributions from a REIT are initially recorded as dividend income and may subsequently be recharacterized by the REIT at the end of its tax year as a return of capital and/or capital gains. The Fund estimates the character of dividends received from REITs for financial reporting purposes based on the distribution history of each REIT. Once actual distribution characterizations are made available by the REITs, typically after calendar year end, the Fund updates its accounting and/or tax books and records.
157
The UBS Funds
Notes to financial statements
Restricted securities: The Funds may invest in securities that are subject to legal or contractual restrictions on resale. These securities generally may be resold in transactions exempt from registration or to the public if the securities are registered. Disposal of these securities may involve time-consuming negotiations and expense, and prompt sale at an acceptable price may be difficult. Information regarding restricted securities, if any, is included in each Fund's portfolio footnotes.
Securities traded on to-be-announced basis: Certain Funds may from time to time purchase, or short sell, securities on a to-be-announced ("TBA") basis. In a TBA transaction, the Fund commits to purchasing securities for which all specific information is not yet known at the time of the trade, particularly the face amount and maturity date of the underlying securities. Securities purchased on a TBA basis are not settled until they are delivered to the Fund, normally 15 to 45 days later. Beginning on the date the Fund enters into a TBA transaction, cash, U.S. government securities or other liquid securities are segregated in an amount equal in value to the purchase price of the TBA security. These transactions are subject to market fluctuations and their current value is determined in the same manner as for other securities.
Short sales: UBS Dynamic Alpha Fund, UBS U.S. Small Cap Growth Fund and UBS Total Return Bond Fund may engage in short sale transactions in which the Fund sells a security it does not own (or does not have the right to acquire at no added cost), in anticipation of a decline in the security's price.
The Fund must borrow the security to make delivery to the buyer. The initial amount of a short sale is recorded as a liability which is marked to market daily. Fluctuations in the value of this liability are recorded as unrealized appreciation or depreciation on the Statement of operations. The Fund will realize a loss as a result of the short sale if the price of the security increases between the date of the short sale and the date on which the Fund replaces the borrowed security, and the Fund will realize a gain if the security declines in price between those same dates. The Fund segregates collateral, consisting of cash or liquid assets, sufficient to collateralize the market value of the investments sold short. The Fund incurs transaction costs, including dividend expense, borrowing costs and interest expenses in connection with opening, maintaining and closing short sales. These dividends and interest are booked as an expense or liability to the Fund.
Because a Fund's loss on a short sale arises from increases in the value of the investment sold short, such loss, like the potential increase in price of the security sold short, is theoretically unlimited. The Fund's investments held long could also decline in value at the same time the value of the investment sold short increases, thereby increasing the Fund's potential for loss. There is also the risk that the counterparty to a short sale transaction may fail to honor its contract terms, causing a loss to the Fund.
For the period ended June 30, 2021, UBS Dynamic Alpha Fund, UBS U.S. Small Cap Growth Fund and UBS Total Return Bond Fund did not engage in short sale transactions.
Treasury Inflation Protected Securities: The Funds may purchase Treasury inflation protected securities ("TIPS") which are debt securities issued by the US Treasury. TIPS adjust for inflation based on changes in the published Consumer Price Index ("CPI"). During periods of inflation when the CPI index increases, the principal amount of the debt to which the rate of interest is applied increases, which in turn increases the yield. During periods of deflation when the CPI index decreases, the principal amount of the debt to which the rate of interest is applied decreases, which in turn lowers the yield. At maturity, TIPS return the higher of the principal amount at maturity or the initial face amount of the debt.
Derivative instruments
Purchased options: Certain Funds may purchase put and call options, including, but not limited to, options on foreign or US securities, indices, foreign currencies, options on futures contracts and options on swap agreements (commonly referred to as swaptions), in order to gain exposure to or protect against changes in the markets or in an
158
The UBS Funds
Notes to financial statements
attempt to enhance income or gains. Purchasing call options tends to increase exposure to the underlying instrument. Purchasing put options tends to decrease exposure to the underlying instrument.
The Funds pay a premium which is included on the Statement of assets and liabilities as an investment and subsequently marked to market to reflect the current value of the option. Premiums paid for purchasing options which expire are treated as realized losses. Purchased options are shown as portfolio holdings within the Fund of investments and are included in the Statement of assets and liabilities in investments, at value. At June 30, 2021, the Funds did not hold any purchased options.
The risk associated with purchasing put and call options is limited to the premium paid. Premiums paid for purchasing options which are exercised or closed are added to the amounts paid or offset against the proceeds on the underlying future, security or currency transaction to determine the realized gain or loss.
Option writing: Certain Funds may write (sell) put and call options, including, but not limited to, options on foreign or US securities, indices, foreign currencies, options on futures contracts and options on swap agreements (commonly referred to as swaptions), in order to gain exposure to or protect against changes in the markets or in an attempt to enhance income or gains.
When a Fund writes a call or a put option, an amount equal to the premium received by the Fund is included on the Fund's Statement of assets and liabilities as a liability. The amount of the liability is subsequently marked-to-market to reflect the current market value of the option written. If an option which the Fund has written either expires on its stipulated expiration date or the Fund enters into a closing purchase transaction, the Fund realizes a gain (or loss if the cost of a closing purchase transaction exceeds the premium received when the option was written) without regard to any unrealized gain or loss on the underlying security or derivative instrument, and the liability related to such option is extinguished. If a call option, which a Fund has written, is exercised, the Fund recognizes a realized gain or loss (long-term or short-term, depending on the holding period of the underlying security) from the sale of the underlying security or derivative instrument and the proceeds from the sale are increased by the premium originally received. If a put option, which a Fund has written, is exercised, the amount of the premium originally received reduces the cost of the security or derivative instrument which the Fund purchases upon exercise of the option.
In writing an option, a Fund bears the market risk of an unfavorable change in the price of the derivative instrument, security, or currency underlying the written option. Exercise of an option written by a Fund could result in the Fund selling or buying a derivative instrument, security or currency at a price different from current market value.
In the normal course of trading activities, the Fund trades and holds certain fair valued derivative contracts that constitute guarantees. Such contracts include written put options, where the Fund will be obligated to purchase securities at specified prices (i.e. the options are exercised by the counterparties). It also includes written swaptions, where the Fund will be obligated to enter into a swap agreement. The maximum payout for these contracts is limited to the number of put option contracts written and the related strike prices, respectively. Maximum payout amounts could be offset by the subsequent sale, if any, of assets obtained via the execution of a payout event.
Written options, if any, are shown as portfolio holdings within the Portfolio of investments and are included in the Statement of assets and liabilities in options and swaptions written, at value. At June 30, 2021, the Funds did not hold any written options.
Futures contracts: Certain Funds may purchase or sell futures contracts to increase or reduce their exposure to an asset class without purchasing or selling the underlying securities, either as a hedge or to enhance income or realized gains. Generally, a futures contract is a standard binding agreement to buy or sell a specified quantity of an underlying reference asset, such as a specific security or currency, at a specified price at a specified later date.
159
The UBS Funds
Notes to financial statements
Upon entering into a futures contract, a Fund is required to deliver to a broker an amount of cash and/or US government securities equal to a certain percentage of the contract amount. This amount is known as the "initial margin". Subsequent payments, known as "variation margin", generally are made or received by a Fund, depending on the daily fluctuations in the value of the underlying futures contracts, except that in the case of certain futures contracts that are held through swap contracts. Such variation margin is recorded for financial statement purposes on a daily basis as an unrealized appreciation or depreciation on futures until the futures contract is closed or expires, at which time the net gain or loss is reclassified to realized gain or loss on futures.
Using futures contracts involves various risks, including market, interest rate and equity risks. Risks of entering into futures contracts include the possibility that there may be an illiquid market or that a change in the value of the contract may not correlate with changes in the value of the underlying securities. To the extent that market prices move in an unexpected direction, there is a risk that a Fund will not achieve the anticipated benefits of the futures contract or may realize a loss.
Futures contracts, if any, are shown as fund holdings within the Portfolio of investments. Variation margin, if applicable, is shown in Variation margin receivable or payable on futures contracts within the Statement of Assets and Liabilities.
Swap agreements: Certain Funds may engage in swap agreements, including, but not limited to, interest rate, credit default and total return swap agreements. A Fund expects to enter into these transactions to preserve a return or spread on a particular investment or to hedge a portion of the portfolio's duration, to protect against any increase in the price of securities the Fund anticipates purchasing at a later date, to gain exposure to certain markets in the most economical way possible or in an attempt to enhance income or gains.
The Funds accrue for interim payments on swap agreements on a daily basis, with the net amount recorded within unrealized appreciation or depreciation of swap agreements. Once interim payments are settled in cash, the net amount is recorded as realized gain or loss on swap agreements, in addition to realized gain or loss recorded upon the termination of swap agreements on the Statement of operations. Fluctuations in the value of swap agreements are recorded for financial statement purposes as unrealized appreciation or depreciation on swap agreements.
Certain Funds may enter into interest rate swap agreements with another party to receive or pay interest (e.g., an exchange of fixed rate payments for floating rate payments) to protect themselves from interest rate fluctuations. This type of swap is an agreement that obligates two parties to exchange a series of cash flows at specified intervals based upon or calculated by reference to a specified interest rate(s) for a specified amount. The payment flows are usually netted against each other, with the difference being paid by one party to the other. Interest rate swap agreements are subject to general market risk, liquidity risk, counterparty risk and interest rate risk.
Credit default swap agreements involve commitments to make or receive payments in the event of a default of a security or other credit event of the referenced obligation. As a buyer, the Fund would make periodic payments to the counterparty, and the Fund would receive payments only upon the occurrence of a default or credit event. If no default or credit event occurs, the Fund will lose its periodic stream of payments over the term of the contract. However, if a default or a credit event does occur, the Fund typically would receive full notional value for the referenced obligation that may have little or no value. As a seller, the Fund would receive periodic payments from the counterparty, and the Fund would make payments only upon the occurrence of a default or a credit event. If no default or credit event occurs, the Fund will gain the periodic stream of payments it received over the term of the contract and the counterparty will lose its periodic stream of payments over the term of the contract. However, if a default or credit event occurs, the Fund typically would pay full notional value for the referenced obligation that may have little or no value. Credit default swap agreements may involve greater risks than if the Fund had invested in the referenced obligation directly and are subject to general market risk, liquidity risk and credit risk.
160
The UBS Funds
Notes to financial statements
Credit default swap agreements on credit indices involve one party making a stream of payments to another party in exchange for the right to receive a specified return in the event of a write-down, principal shortfall, interest shortfall or default of all or part of the referenced entities comprising the credit index. A credit index is a list of a basket of credit instruments or exposures designed to be representative of some part of the credit market as a whole. These indices are made up of referenced credits that are judged by a poll of dealers to be the most liquid entities in the credit default swap market based on the sector of the index. Components of the indices may include, but are not limited to, investment grade securities, high yield securities, asset backed securities, emerging markets, and/or various credit ratings within each sector. Credit indices are traded using credit default swaps with standardized terms including a fixed spread and standard maturity dates. An index credit default swap references all the names in the index, and if there is a default, the credit event is settled based on that name's weight in the index. The composition of the indices changes periodically, usually every six months, and for most indices, each name has an equal weight in the index. A Fund may use credit default swap agreements on credit indices to hedge a portfolio of credit default swaps or bonds with a credit default swap on indices which is less expensive than it would be to buy many credit default swaps to achieve a similar effect. Credit default swap agreements on credit indices are benchmarks for protecting investors owning bonds against default, and traders use them to speculate on changes in credit quality.
Credit default swap agreements on corporate issues or sovereign issues of an emerging market country involve one party making a stream of payments to another party in exchange for the right to receive a specified return in the event of a default or other credit event. If a credit event occurs and cash settlement is not elected, a variety of other obligations may be delivered in lieu of the specific referenced obligation. The ability to deliver other obligations may result in a cheapest-to-deliver option (the buyer of protection's right to choose the deliverable obligation with the lowest value following a credit event). A Fund may use credit default swap agreements on corporate issues or sovereign issues of an emerging market country to provide a measure of protection against defaults of the issuers (i.e., to reduce risk where the Fund owns or has exposure to the referenced obligation) or to take an active long or short position with respect to the likelihood of a particular issuer's default.
The maximum potential amount of future payments (undiscounted) that a Fund as a seller of protection could be required to make under a credit default swap agreement would be an amount equal to the notional amount of the agreement, which may exceed the amount of the value reflected on the Statement of assets and liabilities. Notional amounts of all credit default swap agreements outstanding as of the period end for which a Fund is the seller of protection are disclosed under the section "Credit default swap agreements on credit indices—sell protection" in the Portfolio of investments. These potential amounts would be partially offset by any recovery values of the respective referenced obligations, upfront payments received upon entering into the agreement, or net amounts received from the settlement of buy protection credit default swap agreements entered into, if any, by a Fund for the same referenced entity or entities.
Total return swap agreements involve commitments to pay or receive interest in exchange for a market-linked return based on a notional amount. To the extent the total return of the security or index underlying the transaction exceeds or falls short of the offsetting interest rate obligation, the Fund will receive a payment from or make a payment to the counterparty, respectively. Total return swap agreements are marked-to-market daily, and the change, if any, is recorded as unrealized appreciation or depreciation. Total return swap agreements are subject to general market risk, liquidity risk, counterparty risk, interest rate risk, credit risk and the risk that there may be unfavorable changes in the underlying investments or instruments.
The use of swap agreements involves investment techniques, risks, and transaction costs different from those associated with ordinary portfolio security transactions, including assumptions about market conditions, interest rates, and other applicable factors. As a result, the performance of the Fund will be different than if it had used ordinary portfolio security transactions. OTC swap agreements do not involve the delivery of securities and are subject to counterparty risk. If the other party to a swap agreement defaults and fails to consummate the transaction, the
161
The UBS Funds
Notes to financial statements
Fund's risk of loss will consist of the net amount of interest or other payments that the Fund is contractually entitled to receive. Therefore, the Fund would consider the creditworthiness of the counterparty to a swap agreement in evaluating potential credit risk.
Certain clearinghouses offer clearing for limited types of derivatives transactions, such as interest rate and credit default swap agreements. Centrally cleared swap agreements must be transacted through a futures commission merchant ("FCM") and cleared through a clearinghouse that serves as a central counterparty. The performance of a centrally cleared swap transaction is effectively guaranteed by a central clearinghouse, thereby reducing the Fund's exposure to the credit risk of its original counterparty. The Fund will be required to post specified levels of margin with the clearinghouse or at the instruction of the clearinghouse; the margin required by a clearinghouse may be greater than the margin the Fund would be required to post in an uncleared transaction. Centrally cleared swap agreements, if any, are reported on the Statement of assets and liabilities based on variation margin receivable or payable, if any.
Swap agreements, if any, are shown as portfolio holdings within the Portfolio of investments.
Forward foreign currency contracts: Certain Funds may enter into forward foreign currency contracts as part of their investment objective, for purposes of risk management or to hedge the US dollar value of portfolio securities denominated in a particular currency. Generally, a forward foreign currency contract is a commitment to purchase or sell a foreign currency at a future date at a negotiated forward rate. Non-deliverable forward foreign currency contracts are settled with the counterparty in US dollars, or another fully convertible currency, without the physical delivery of foreign currency.
Fluctuations in the value of open forward foreign currency contracts are recorded daily for book purposes as unrealized appreciation or depreciation on forward foreign currency contracts by the Funds. Realized gains and losses on forward foreign currency contracts include net gains or losses recognized by the Funds on contracts which have been sold or matured.
Risks may arise upon entering into forward foreign currency contracts from the potential inability of counterparties to meet the terms of their contracts and from unanticipated movements in the value of foreign currencies relative to the US dollar or each other.
Derivatives by underlying risk: Investment companies value their derivatives at fair value and recognize changes in fair value through the Statement of operations. Under US GAAP, investment companies do not qualify for hedge accounting. Accordingly, even though Fund's investments in derivatives may represent economic hedges, they are considered to be non-hedge transactions for purposes of disclosure under US GAAP.
The volume of derivatives as disclosed in each Fund's portfolio of investments is representative of the volume of derivatives outstanding during the period ended June 30, 2021.
Swap agreements, forward foreign currency contracts, swaptions and options written entered into by the Funds may contain credit-risk related contingent features that could be triggered subject to certain circumstances. Such circumstances include agreed upon net asset value thresholds. If triggered, the derivative counterparty could request additional cash margin and/or terminate the derivative contract. The aggregate fair value of the derivative contracts that are in a net liability position that contain these triggers can be found in the Fund's Portfolio of investments. The aggregate fair value of assets that are already posted as collateral as of June 30, 2021 is reflected in the Statement of assets and liabilities.
162
The UBS Funds
Notes to financial statements
At June 30, 2021, the Fund had the following derivatives categorized by underlying risk:
Asset derivatives1
| Interest rate risk | Foreign exchange risk | Credit risk | Equity risk | Total value | |||||||||||||||||||
UBS Dynamic Alpha Fund | |||||||||||||||||||||||
Futures contracts | $ | 2,740 | $ | — | $ | — | $ | 25,861 | $ | 28,601 | |||||||||||||
Swap agreements | — | — | 179,563 | — | 179,563 | ||||||||||||||||||
Forward foreign currency contracts | — | 247,691 | — | — | 247,691 | ||||||||||||||||||
Total value | $ | 2,740 | $ | 247,691 | $ | 179,563 | $ | 25,861 | $ | 455,855 | |||||||||||||
UBS Global Allocation Fund | |||||||||||||||||||||||
Futures contracts | $ | 184,467 | $ | — | $ | — | $ | 85,977 | $ | 270,444 | |||||||||||||
Swap agreements | — | — | 232,625 | — | 232,625 | ||||||||||||||||||
Forward foreign currency contracts | — | 1,743,534 | — | — | 1,743,534 | ||||||||||||||||||
Total value | $ | 184,467 | $ | 1,743,534 | $ | 232,625 | $ | 85,977 | $ | 2,246,603 | |||||||||||||
UBS Total Return Bond Fund | |||||||||||||||||||||||
Futures contracts | $ | 92,768 | $ | — | $ | — | $ | — | $ | 92,768 | |||||||||||||
Swap agreements | — | — | — | 2,618 | 2,618 | ||||||||||||||||||
Forward foreign currency contracts | — | 31,542 | — | — | 31,542 | ||||||||||||||||||
Total value | $ | 92,768 | $ | 31,542 | $ | — | $ | 2,618 | $ | 126,928 | |||||||||||||
1 In the Statement of assets and liabilities, options and swaptions purchased are shown within investments, at value, swap agreements (except centrally cleared swap agreements) are shown within swap agreements, at value, while forward foreign currency contracts are shown using unrealized appreciation on forward foreign currency contracts. Futures contracts are reported in the table above using cumulative appreciation of futures contracts and centrally cleared swap agreements are reported at value, as reported in the futures contracts and centrally cleared swap agreements tables at the end of the Portfolio of investments, respectively, but only the variation margin to be received, if any, is reported within the Statement of assets and liabilities.
Liability derivatives1
| Interest rate risk | Foreign exchange risk | Credit risk | Equity risk | Total value | |||||||||||||||||||
UBS Dynamic Alpha Fund | |||||||||||||||||||||||
Futures contracts | $ | (55,501 | ) | $ | — | $ | — | $ | (70,102 | ) | $ | (125,603 | ) | ||||||||||
Forward foreign currency contracts | — | (78,372 | ) | — | — | (78,372 | ) | ||||||||||||||||
Total | $ | (55,501 | ) | $ | (78,372 | ) | $ | — | $ | (70,102 | ) | $ | (203,975 | ) | |||||||||
UBS Global Allocation Fund | |||||||||||||||||||||||
Futures contracts | $ | (242,979 | ) | $ | — | $ | — | $ | (873,012 | ) | $ | (1,115,991 | ) | ||||||||||
Swap agreements | — | — | (707,781 | ) | — | (707,781 | ) | ||||||||||||||||
Forward foreign currency contracts | — | (1,830,820 | ) | — | — | (1,830,820 | ) | ||||||||||||||||
Total | $ | (242,979 | ) | $ | (1,830,820 | ) | $ | (707,781 | ) | $ | (873,012 | ) | $ | (3,654,592 | ) | ||||||||
UBS Total Return Bond Fund | |||||||||||||||||||||||
Futures contracts | $ | (16,963 | ) | $ | — | $ | — | $ | — | $ | (16,963 | ) | |||||||||||
Forward foreign currency contracts | — | (19,181 | ) | — | — | (19,181 | ) | ||||||||||||||||
Total | $ | (16,963 | ) | $ | (19,181 | ) | $ | — | $ | — | $ | (36,144 | ) | ||||||||||
1 In the Statement of assets and liabilities, options and swaptions written are shown within options and swaptions written, at value, swap agreements (except centrally cleared swap agreements) are shown within swap agreements, at value, while forward foreign currency contracts are shown within unrealized depreciation on forward foreign currency contracts. Futures contracts are reported in the table above using
163
The UBS Funds
Notes to financial statements
cumulative depreciation of futures contracts and centrally cleared swap agreements are reported at value, as reported in the futures contracts and centrally cleared swap agreements are reported at value, as reported in the futures contracts and centrally cleared swap agreements tables at the end of the Portfolio of investments, respectively, but only the variation margin to be paid, if any, is reported within the Statement of assets and liabilities.
During the period ended June 30, 2021, net realized gain (loss) from derivatives were as follows:
Realized gain (loss)1
| Interest rate risk | Foreign exchange risk | Credit risk | Equity risk | Total value | |||||||||||||||||||
UBS Dynamic Alpha Fund | |||||||||||||||||||||||
Futures contracts | $ | 130,960 | $ | — | $ | — | $ | 2,517,603 | $ | 2,648,563 | |||||||||||||
Swap agreements | — | — | 255,626 | — | 255,626 | ||||||||||||||||||
Forward foreign currency contracts | — | 104,225 | — | — | 104,225 | ||||||||||||||||||
Total net realized gains (loss) | $ | 130,960 | $ | 104,225 | $ | 255,626 | $ | 2,517,603 | $ | 3,008,414 | |||||||||||||
UBS Global Allocation Fund | |||||||||||||||||||||||
Futures contracts | $ | (1,414,323 | ) | $ | — | $ | — | $ | 2,516,356 | $ | 1,102,033 | ||||||||||||
Swap agreements | — | — | 797,673 | — | 797,673 | ||||||||||||||||||
Forward foreign currency contracts | — | (1,240,391 | ) | — | — | (1,240,391 | ) | ||||||||||||||||
Total net realized gains (loss) | $ | (1,414,323 | ) | $ | (1,240,391 | ) | $ | 797,673 | $ | 2,516,356 | $ | 659,315 | |||||||||||
UBS Emerging Markets Equity Opportunity Fund | |||||||||||||||||||||||
Forward foreign currency contracts | $ | — | $ | 3,955 | $ | — | $ | — | $ | 3,955 | |||||||||||||
UBS Engage for Impact Fund | |||||||||||||||||||||||
Forward foreign currency contracts | $ | — | $ | (51 | ) | $ | — | $ | — | $ | (51 | ) | |||||||||||
UBS International Sustainable Equity Fund | |||||||||||||||||||||||
Forward foreign currency contracts | $ | — | $ | 7,417 | $ | — | $ | — | $ | 7,417 | |||||||||||||
UBS Total Return Bond Fund | |||||||||||||||||||||||
Options and swaptions purchased | $ | (29,344 | ) | $ | (8,213 | ) | $ | — | $ | — | $ | (37,557 | ) | ||||||||||
Options and swaptions written | 34,723 | — | — | — | 34,723 | ||||||||||||||||||
Futures contracts | (375,478 | ) | — | — | — | (375,478 | ) | ||||||||||||||||
Swap agreements | — | — | (98,511 | ) | 6,361 | (92,150 | ) | ||||||||||||||||
Forward foreign currency contracts | — | 16,363 | — | — | 16,363 | ||||||||||||||||||
Total net realized gains (loss) | $ | (370,099 | ) | $ | 8,150 | $ | (98,511 | ) | $ | 6,361 | $ | (454,099 | ) | ||||||||||
1 The net realized gain (loss) is shown in the Statement of operations in net realized gain (loss) on futures contracts, options and swaptions written, swap agreements and forward foreign currency contracts, unless otherwise noted. The net realized gain (loss) on options and swaptions purchased is shown in the Statement of operations in net realized gain (loss) on investments.
164
The UBS Funds
Notes to financial statements
During the period ended June 30, 2021, net unrealized appreciation (depreciation) from derivatives were as follows:
Net change in unrealized appreciation (depreciation)1
| Interest rate risk | Foreign exchange risk | Credit risk | Equity risk | Total value | |||||||||||||||||||
UBS Dynamic Alpha Fund | |||||||||||||||||||||||
Futures contracts | $ | (18,421 | ) | $ | — | $ | — | $ | (95,138 | ) | $ | (113,559 | ) | ||||||||||
Swap agreements | — | — | (54,064 | ) | — | (54,064 | ) | ||||||||||||||||
Forward foreign currency contracts | — | 157,484 | — | — | 157,484 | ||||||||||||||||||
Net change in appreciation (depreciation) | $ | (18,421 | ) | $ | 157,484 | $ | (54,064 | ) | $ | (95,138 | ) | $ | (10,139 | ) | |||||||||
UBS Global Allocation Fund | |||||||||||||||||||||||
Futures contracts | $ | (93,547 | ) | $ | — | $ | — | $ | (365,425 | ) | $ | (458,972 | ) | ||||||||||
Swap agreements | — | — | 97,957 | — | 97,957 | ||||||||||||||||||
Forward foreign currency contracts | — | 1,828,695 | — | — | 1,828,695 | ||||||||||||||||||
Net change in appreciation (depreciation) | $ | (93,547 | ) | $ | 1,828,695 | $ | 97,957 | $ | (365,425 | ) | $ | 1,467,680 | |||||||||||
UBS Total Return Bond Fund | |||||||||||||||||||||||
Futures contracts | $ | 88,234 | $ | — | $ | — | $ | — | $ | 88,234 | |||||||||||||
Swap agreements | — | — | — | 2,618 | 2,618 | ||||||||||||||||||
Forward foreign currency contracts | — | 10,947 | — | — | 10,947 | ||||||||||||||||||
Net change in appreciation (depreciation) | $ | 88,234 | $ | 10,947 | $ | — | $ | 2,618 | $ | 101,799 | |||||||||||||
1 The change in net unrealized appreciation (depreciation) is shown in the Statement of operations in change in net unrealized appreciation (depreciation) on futures contracts, options and swaptions written, swap agreements and forward foreign currency contracts, unless otherwise noted. The change in net unrealized appreciation (depreciation) of options and swaptions purchased is shown in the Statement of operations in change in net unrealized appreciation (depreciation) on investments.
Offsetting of certain derivatives: The Funds typically enter into International Swaps and Derivatives Association, Inc. Master Agreements ("ISDA Master Agreements") or similar master agreements with its OTC derivative contract counterparties in order to, among other things, reduce its credit risk to counterparties. ISDA Master Agreements include provisions for general obligations, representations, collateral and events of default or termination. Under an ISDA Master Agreement, the Funds typically may offset with the counterparty certain derivative financial instrument's payables and/or receivables with collateral held and/or posted and create one single net payment (close-out netting) in the event of default or termination. The Statement of assets and liabilities is presented gross of any netting.
At June 30, 2021, derivative assets and liabilities (by type) on a gross basis and derivatives subject to an enforceable master netting arrangement ("MNA") or similar were as follows:
UBS Dynamic Alpha Fund
Derivative Financial Instruments: | Assets | Liabilities | |||||||||
Total gross amount of derivative assets and liabilities in the Statement of assets and liabilities1 | $ | 455,855 | $ | (203,975 | ) | ||||||
Derivatives not subject to a MNA or similar agreements | (208,164 | ) | 125,603 | ||||||||
Total gross amount of assets and liabilities subject to MNA or similar agreements | $ | 247,691 | $ | (78,372 | ) | ||||||
165
The UBS Funds
Notes to financial statements
The following tables present the Fund's derivative assets and liabilities subject to MNA by counterparty net of amounts available for offset under a MNA and net of the related collateral received/pledged by the Fund as of the period end.
Counterparty | Gross amount of assets | Financial instruments and derivatives available for offset | Collateral received2 | Net amount of assets | |||||||||||||||
BB | $ | 621 | $ | — | $ | — | $ | 621 | |||||||||||
BOA | 3,672 | — | — | 3,672 | |||||||||||||||
CIBC | 64,420 | — | — | 64,420 | |||||||||||||||
CITI | 608 | — | — | 608 | |||||||||||||||
MSCI | 51,736 | (3,295 | ) | — | 48,441 | ||||||||||||||
SSC | 126,634 | (63,415 | ) | — | 63,219 | ||||||||||||||
Total | $ | 247,691 | $ | (66,710 | ) | $ | — | $ | 180,981 | ||||||||||
Counterparty | Gross amount of liabilities | Financial instruments and derivatives available for offset | Collateral pledged2 | Net amount of liabilities | |||||||||||||||
HSBC | $ | (2,440 | ) | $ | — | $ | — | $ | (2,440 | ) | |||||||||
JPMCB | (9,222 | ) | — | — | (9,222 | ) | |||||||||||||
MSCI | (3,295 | ) | 3,295 | — | — | ||||||||||||||
SSC | (63,415 | ) | 63,415 | — | — | ||||||||||||||
Total | $ | (78,372 | ) | $ | 66,710 | $ | — | $ | (11,662 | ) | |||||||||
1 In the Statement of assets and liabilities, options purchased are shown within investments of unaffiliated issuers, as value, swap agreements (except centrally cleared swap agreements) are shown within outstanding swap agreements, at value, while forward foreign currency contracts are shown within unrealized appreciation of forward foreign currency contracts. Futures contracts are reported in the table above using cumulative appreciation on futures contracts and centrally cleared swap agreements, if any, are reported at value, as reported in the futures contracts and centrally cleared swap agreements tables at the end of the Portfolio of investments, respectively, but only the variation margin to be received, if any, is reported within the Statement of assets and liabilities.
2 In some instances, the actual collateral received and/or pledged may be more than the amount shown and may be comprised of cash collateral, non-cash collateral or combination of both.
At June 30, 2021, derivative assets and liabilities (by type) on a gross basis and derivatives subject to an enforceable master netting arrangement ("MNA") or similar were as follows:
UBS Global Allocation Fund
Derivative Financial Instruments: | Assets | Liabilities | |||||||||
Total gross amount of derivative assets and liabilities in the Statement of assets and liabilities1 | $ | 2,246,603 | $ | (3,654,592 | ) | ||||||
Derivatives not subject to a MNA or similar agreements | (503,069 | ) | 1,823,772 | ||||||||
Total gross amount of assets and liabilities subject to MNA or similar agreements | $ | 1,743,534 | $ | (1,830,820 | ) | ||||||
166
The UBS Funds
Notes to financial statements
The following tables present the Fund's derivative assets and liabilities by counterparty net of amounts available for offset under a MNA and net of the related collateral received/pledged by the Fund as of the period end.
Counterparty | Gross amount of assets | Financial instruments and derivatives available for offset | Collateral received2 | Net amount of assets | |||||||||||||||
BB | $ | 247,230 | $ | (5,881 | ) | $ | — | $ | 241,349 | ||||||||||
BOA | 422,745 | — | — | 422,745 | |||||||||||||||
CITI | 67,829 | (67,829 | ) | — | — | ||||||||||||||
GSI | 42,497 | (42,497 | ) | — | — | ||||||||||||||
HSBC | 97,207 | (817 | ) | — | 96,390 | ||||||||||||||
JPMCB | 65,427 | (65,427 | ) | — | — | ||||||||||||||
MSCI | 353,231 | (353,231 | ) | — | — | ||||||||||||||
SSC | 447,368 | (111,116 | ) | — | 336,252 | ||||||||||||||
Total | $ | 1,743,534 | $ | (646,798 | ) | $ | — | $ | 1,096,736 | ||||||||||
Counterparty | Gross amount of liabilities | Financial instruments and derivatives available for offset | Collateral pledged2 | Net amount of liabilities | |||||||||||||||
BB | $ | (5,881 | ) | $ | 5,881 | $ | — | $ | — | ||||||||||
CIBC | (198,493 | ) | — | — | (198,493 | ) | |||||||||||||
CITI | (160,763 | ) | 67,829 | — | (92,934 | ) | |||||||||||||
GSI | (68,076 | ) | 42,497 | — | (25,579 | ) | |||||||||||||
HSBC | (817 | ) | 817 | — | — | ||||||||||||||
JPMCB | (878,820 | ) | 65,427 | — | (813,393 | ) | |||||||||||||
MSCI | (406,854 | ) | 353,231 | — | (53,623 | ) | |||||||||||||
SSC | (111,116 | ) | 111,116 | — | — | ||||||||||||||
Total | $ | (1,830,820 | ) | $ | 646,798 | $ | — | $ | (1,184,022 | ) | |||||||||
1 In the Statement of assets and liabilities, options purchased are shown within investments of unaffiliated issuers, as value, swap agreements (except centrally cleared swap agreements) are shown within outstanding swap agreements, at value, while forward foreign currency contracts are shown within unrealized appreciation of forward foreign currency contracts. Futures contracts are reported in the table above using cumulative appreciation on futures contracts and centrally cleared swap agreements, if any, are reported at value, as reported in the futures contracts and centrally cleared swap agreements tables at the end of the Portfolio of investments, respectively, but only the variation margin to be received, if any, is reported within the Statement of assets and liabilities.
2 In some instances, the actual collateral received and/or pledged may be more than the amount shown and may be comprised of cash collateral, non-cash collateral or combination of both.
167
The UBS Funds
Notes to financial statements
At June 30, 2021, derivative assets and liabilities (by type) on a gross basis and derivatives subject to an enforceable master netting arrangement ("MNA") or similar were as follows:
UBS Total Return Bond Fund
Derivative Financial Instruments: | Assets | Liabilities | |||||||||
Total gross amount of derivative assets and liabilities in the Statement of assets and liabilities1 | $ | 126,928 | $ | (36,144 | ) | ||||||
Derivatives not subject to a MNA or similar agreements | (92,768 | ) | 16,963 | ||||||||
Total gross amount of assets and liabilities subject to MNA or similar agreements | $ | 34,160 | $ | (19,181 | ) | ||||||
The following tables present the Fund's derivative assets and liabilities by counterparty net of amounts available for offset under a MNA and net of the related collateral received/pledged by the Fund as of the period end.
Counterparty | Gross amount of assets | Financial instruments and derivatives available for offset | Collateral received2 | Net amount of assets | |||||||||||||||
BB | $ | 9,878 | $ | — | $ | — | $ | 9,878 | |||||||||||
CITI | 18,563 | — | — | 18,563 | |||||||||||||||
JPMCB | 5,719 | (5,719 | ) | — | — | ||||||||||||||
Total | $ | 34,160 | $ | (5,719 | ) | $ | — | $ | 28,441 | ||||||||||
Counterparty | Gross amount of liabilities | Financial instruments and derivatives available for offset | Collateral pledged2 | Net amount of liabilities | |||||||||||||||
JPMCB | $ | (19,181 | ) | $ | 5,719 | $ | — | $ | (13,462 | ) | |||||||||
1 In the Statement of assets and liabilities, options purchased are shown within investments of unaffiliated issuers, as value, swap agreements (except centrally cleared swap agreements) are shown within outstanding swap agreements, at value, while forward foreign currency contracts are shown within unrealized appreciation of forward foreign currency contracts. Futures contracts are reported in the table above using cumulative appreciation on futures contracts and centrally cleared swap agreements, if any, are reported at value, as reported in the futures contracts and centrally cleared swap agreements tables at the end of the Portfolio of investments, respectively, but only the variation margin to be received, if any, is reported within the Statement of assets and liabilities.
2 In some instances, the actual collateral received and/or pledged may be more than the amount shown and may be comprised of cash collateral, non-cash collateral or combination of both.
168
The UBS Funds
Notes to financial statements
Investment advisory fees and other transactions with affiliates
The Advisor, a registered investment advisor, provides the Funds with investment management services. As compensation for these services, each Fund pays the Advisor a monthly fee, accrued daily and paid monthly, based on each Fund's respective average daily net assets in accordance with the following per annum schedule:
Fund | $0 to $500 mm | $500 mm to $1.0 billion | $1.0 billion to $1.5 billion | $1.5 billion to $2.0 billion | $2.0 billion to $4.0 billion | $4.0 billion and over | |||||||||||||||||||||
UBS Dynamic Alpha Fund | 0.850 | % | 0.800 | % | 0.750 | % | 0.725 | % | 0.700 | % | 0.680 | % | |||||||||||||||
Fund | $0 to $500 mm | $500 mm to $1.0 billion | $1.0 billion to $1.5 billion | $1.5 billion to $2.0 billion | $2.0 billion to $3.0 billion | $3.0 billion to $6.0 billion | $6.0 billion and over | ||||||||||||||||||||||||
UBS Global Allocation Fund | 0.800 | % | 0.750 | % | 0.700 | % | 0.675 | % | 0.650 | % | 0.630 | % | 0.610 | % | |||||||||||||||||
Fund | $0 to $250 mm | $250 mm to $500 mm | $500 mm to $750 mm | $750 mm to $1.0 billion | $1.0 billion and over | ||||||||||||||||||
UBS All China Equity Fund | 0.850 | % | 0.825 | % | 0.800 | % | 0.775 | % | 0.750 | % | |||||||||||||
UBS Emerging Markets Equity Opportunity Fund | 0.900 | 0.875 | 0.850 | 0.825 | 0.750 | ||||||||||||||||||
UBS Sustainable Development Bank Bond Fund | 0.150 | 0.145 | 0.140 | 0.135 | 0.130 | ||||||||||||||||||
Fund | $0 to $250 mm | $250 mm to $500 mm billion | $500 mm to $750 mm billion | $750 mm to $1.0 billion | $1.0 billion to $1.5 billion | $2.0 billion and over | |||||||||||||||||||||
UBS International Sustainable Equity Fund* | 0.800 | % | 0.775 | % | 0.750 | % | 0.725 | % | 0.675 | % | 0.650 | % | |||||||||||||||
Fund | $0 to $500 mm | $500 mm to $1.0 billion | $1.0 billion to $1.5 billion | $1.5 billion to $2.0 billion | $2.0 billion and over | ||||||||||||||||||
UBS U.S. Small Cap Growth Fund | 0.850 | % | 0.850 | % | 0.825 | % | 0.825 | % | 0.825 | % | |||||||||||||
Fund | Net assets | ||||||
UBS Engage For Impact Fund | 0.750 | % | |||||
UBS Municipal Bond Fund | 0.400 | ||||||
UBS US Dividend Ruler Fund | 0.500 | ||||||
UBS US Quality Growth at Reasonable Price Fund | 0.500 | ||||||
UBS Total Return Bond Fund | 0.500 | ||||||
* The rates in the table above went into effect on 10/28/2020. Prior to 10/28/2020 the rates were as follows: 0.800% for the first $500 million in assets, 0.750% for the next $500 million in assets, 0.700% for assets between $1 billion and $1.5 billion, 0.675% for assets between $1.5 billion and $2 billion, and 0.650% for assets over $2 billion.
For UBS All China Equity Fund, UBS Global Allocation Fund, UBS Emerging Markets Equity Opportunity Fund, UBS Engage For Impact Fund, UBS International Sustainable Equity Fund, UBS US Dividend Ruler Fund, UBS US Quality Growth at Reasonable Price Fund, UBS Municipal Bond Fund, UBS Sustainable Development Bank Bond Fund, and UBS Total Return Bond Fund, the Advisor has agreed to waive its fees and/or reimburse expenses (excluding expenses incurred through investment in other investment companies, interest, taxes, brokerage commissions and extraordinary expenses) to the extent necessary so that the Funds' operating expenses (excluding expenses incurred through investment in other investment companies, interest, taxes, brokerage commissions and extraordinary expenses) do not exceed the expense limit of each class of shares as indicated in the following table. For UBS Dynamic Alpha Fund and UBS U.S. Small Cap Growth Fund the Advisor has agreed to waive its fees and/or reimburse expenses (excluding expenses incurred through investment in other investment companies, interest, taxes,
169
The UBS Funds
Notes to financial statements
brokerage commissions, extraordinary expenses and dividend expense and security loan fees for securities sold short) to the extent necessary so that the Fund's operating expenses (excluding expenses incurred through investment in other investment companies, interest, taxes, brokerage commissions, extraordinary expenses and dividend expense and security loan fees for securities sold short) do not exceed the expense limit of each class of shares as indicated in the following table. The contractual fee waiver and/or expense reimbursement agreement for each Fund, except UBS International Sustainable Equity Fund, will remain in place through the period ending October 28, 2021. The fee waiver and/or expense reimbursement for UBS International Sustainable Equity Fund is irrevocable. Investment advisory fees, including the dollar amount waived or reimbursed, for the period ended June 30, 2021 were as follows:
Fund | Class A expense cap | Class P expense cap | Class P2 expense cap | Amount due to (due from) Advisor | Advisory fees incurred | Fees waived/ expenses reimbursed | Recoupments | ||||||||||||||||||||||||
UBS All China Equity Fund | — | 1.10 | % | — | $ | (21,941 | ) | $ | 5,436 | $ | (126,792 | ) | $ | — | |||||||||||||||||
UBS Dynamic Alpha Fund | 1.35 | % | 1.10 | — | 14,803 | 296,273 | (331,342 | ) | — | ||||||||||||||||||||||
UBS Global Allocation Fund | 1.20 | 0.95 | — | 120,026 | 1,947,948 | (501,556 | ) | — | |||||||||||||||||||||||
UBS Emerging Markets Equity Opportunity Fund | — | 1.00 | 0.40 | % | 152,971 | 6,922,773 | (5,395,067 | ) | — | ||||||||||||||||||||||
UBS Engage For Impact Fund | — | 0.85 | 0.25 | (51,222 | ) | 292,534 | (439,920 | ) | — | ||||||||||||||||||||||
UBS International Sustainable Equity Fund | 1.25 | 1.00 | 0.25 | 251,972 | 2,531,584 | (340,322 | ) | — | |||||||||||||||||||||||
UBS US Dividend Ruler Fund | — | 0.50 | — | 34,769 | 196,489 | (420,243 | ) | — | |||||||||||||||||||||||
UBS US Quality Growth at Reasonable Price Fund | — | 0.50 | — | 30,878 | 311,382 | (457,635 | ) | — | |||||||||||||||||||||||
UBS U.S. Small Cap Growth Fund | 1.24 | 0.99 | — | 118,908 | 1,500,614 | (310,133 | ) | — | |||||||||||||||||||||||
UBS Municipal Bond Fund | 0.65 | 0.40 | — | 18,179 | 476,322 | (405,902 | ) | — | |||||||||||||||||||||||
UBS Sustainable Development Bank Bond Fund | — | 0.25 | 0.15 | (7,812 | ) | 85,723 | (306,271 | ) | — | ||||||||||||||||||||||
UBS Total Return Bond Fund | 0.75 | 0.50 | — | (10,141 | ) | 184,261 | (375,033 | ) | — | ||||||||||||||||||||||
For UBS Emerging Markets Opportunity Fund Class P2, UBS Engage For Impact Fund Class P and Class P2, UBS International Sustainable Equity Fund Class P and Class P2, and UBS Sustainable Development Bank Bond Fund Class P and P2 the Advisor has entered into a temporary and voluntary agreement pursuant to which the Advisor has agreed to waive all or a portion of its management fees. For the period ended June 30, 2021, the advisory fees waived was $5,242,799, $191,297, $333,259 and $47,567, respectively. In addition, these waivers are included within the fees waived/expenses reimbursed amount disclosed in the table above.
Each Fund, except for UBS International Sustainable Equity Fund and UBS Emerging Markets Equity Opportunity Fund Class P2, will reimburse the Advisor for expenses it waives or reimburses for a period of three years following such expense waivers or reimbursements, provided that the reimbursement by a Fund of the Advisor will not cause the total operating expense ratio to exceed the contractual limit as then may be in effect for the Fund. The expenses waived or reimbursed for the period ended June 30, 2021 are subject to repayment through June 30, 2024.
UBS Emerging Markets Equity Opportunity Fund Class P2 will reimburse the Advisor for expenses it reimburses for a period of three years following such expense reimbursements, provided that the reimbursement by the Fund of the Advisor will not cause the total expense ratio to exceed the contractual limit as then may be in effect for the class. The expenses reimbursed for the period ended June 30, 2021 are subject to repayment through June 30, 2024.
170
The UBS Funds
Notes to financial statements
At June 30, 2021, the following Funds had remaining fee waivers and expense reimbursements subject to repayment to the Advisor and respective dates of expiration as follows:
Fund | Fee waivers/ expense reimbursements subject to repayment | Expires June 30, 2022 | Expires June 30, 2023 | Expires June 30, 2024 | |||||||||||||||
UBS All China Equity Fund—Class P | $ | 126,792 | $ | — | $ | — | $ | 126,7921 | |||||||||||
UBS Dynamic Alpha Fund—Class A | 580,489 | 216,606 | 163,867 | 200,016 | |||||||||||||||
UBS Dynamic Alpha Fund—Class P | 400,554 | 159,704 | 109,524 | 131,326 | |||||||||||||||
UBS Global Allocation Fund—Class A | 1,204,737 | 397,509 | 409,362 | 397,866 | |||||||||||||||
UBS Global Allocation Fund—Class P | 316,458 | 109,737 | 103,031 | 103,690 | |||||||||||||||
UBS Emerging Markets Equity Opportunity Fund—Class P | 284,322 | 2,9462 | 129,108 | 152,268 | |||||||||||||||
UBS Emerging Markets Equity Opportunity Fund—Class P2 | 109,650 | 109,650 | — | — | |||||||||||||||
UBS Engage For Impact Fund—Class P | 660,403 | 237,2243 | 295,800 | 127,379 | |||||||||||||||
UBS Engage For Impact Fund—Class P2 | 121,244 | — | — | 121,2444 | |||||||||||||||
UBS US Dividend Ruler Fund—Class P | 420,243 | — | — | 420,2435 | |||||||||||||||
UBS US Quality Growth at Reasonable Price Fund—Class P | 457,635 | — | — | 457,6355 | |||||||||||||||
UBS U.S. Small Cap Growth Fund—Class A | 223,747 | 83,376 | 80,713 | 59,658 | |||||||||||||||
UBS U.S. Small Cap Growth Fund—Class P | 806,498 | 287,096 | 268,927 | 250,475 | |||||||||||||||
UBS Municipal Bond Fund—Class A | 134,570 | 50,814 | 44,702 | 39,054 | |||||||||||||||
UBS Municipal Bond Fund—Class P | 1,082,69 | 394,044 | 321,177 | 366,848 | |||||||||||||||
UBS Sustainable Development Bank Bond Fund—Class P | 685,475 | 241,7103 | 296,902 | 146,863 | |||||||||||||||
UBS Sustainable Development Bank Bond Fund—Class P2 | 111,841 | — | — | 111,8416 | |||||||||||||||
UBS Total Return Bond Fund—Class A | 14,787 | 3,032 | 5,271 | 6,484 | |||||||||||||||
UBS Total Return Bond Fund—Class P | 1,073,017 | 370,965 | 333,503 | 368,549 | |||||||||||||||
1 For the period from February 23, 2021 (commencement of operations) through June 30, 2021.
2 For the period from February 1, 2019 (commencement of operations) through June 30, 2019.
3 For the period from October 24, 2018 (commencement of operations) through June 30, 2019.
4 For the period from February 24, 2021 (commencement of operations) through June 30, 2021.
5 For the period from July 9, 2020 (commencement of operations) through June 30, 2021.
6 For the period from October 30, 2020 (commencement of operations) through June 30, 2021.
For UBS Emerging Markets Equity Opportunity Fund Class P2, UBS International Sustainable Equity Fund Class P and P2 and UBS Sustainable Development Bank Bond Fund Class P2, the Advisor has entered into a written agreement pursuant to which the Advisor has agreed to waive its retained administration fees. For the period ended June 30, 2021, the administration fees waived were $410,504, $24,273 and $797, respectively and such amounts are not subject to future recoupment.
Each Fund pays UBS AM a monthly administration fee that is accrued daily and paid monthly at an annual rate of 0.075% of the average daily net assets of such Fund. For the period ended June 30, 2021, the Funds owed and incurred administrative fees as follows:
Fund | Administrative fees owed | Administrative fees incurred | |||||||||
UBS All China Equity Fund | $ | 110 | $ | 480 | |||||||
UBS Dynamic Alpha Fund | 2,116 | 26,142 | |||||||||
UBS Global Allocation Fund | 15,507 | 182,620 | |||||||||
UBS Emerging Markets Equity Opportunity Fund | 20,893 | 597,466 | |||||||||
UBS Engage For Impact Fund | 3,120 | 29,253 | |||||||||
UBS International Sustainable Equity Fund | 24,404 | 239,029 | |||||||||
UBS US Dividend Ruler Fund | 4,880 | 29,473 | |||||||||
171
The UBS Funds
Notes to financial statements
Fund | Administrative fees owed | Administrative fees incurred | |||||||||
UBS US Quality Growth at Reasonable Price Fund | $ | 6,806 | $ | 46,707 | |||||||
UBS U.S. Small Cap Growth Fund | 13,058 | 132,407 | |||||||||
UBS Municipal Bond Fund | 7,091 | 89,310 | |||||||||
UBS Sustainable Development Bank Bond Fund | 4,961 | 42,861 | |||||||||
UBS Total Return Bond Fund | 2,181 | 27,639 | |||||||||
The Funds may invest in shares of certain affiliated investment companies also advised or managed by the Advisor. Investments in affiliated investment companies for the period ended June 30, 2021 have been included near the end of each Fund's Portfolio of investments.
During the period ended June 30, 2021, the Funds listed below paid broker commissions to affiliates of the investment advisor as detailed in the below table. These broker commissions are reflected in the Statement of assets and liabilities within investments at cost of unaffiliated issuers, and the Statement of operations within net realized gain (loss) on, and/or change in net unrealized appreciation (depreciation) on investments and/or futures contracts.
Fund | UBS Group AG | ||||||
UBS Global Allocation Fund | $ | 609 | |||||
UBS Emerging Markets Equity Opportunity Fund | 4,037 | ||||||
UBS Engage For Impact Fund | 180 | ||||||
UBS International Sustainable Equity Fund | 7,937 | ||||||
During the period ended, June 30, 2021, some of the Funds engaged in purchase and sale transactions where an affiliate was underwriter. In such cases, the affiliate underwriter was not compensated, and each trade was approved by the Board.
Service and distribution plans
UBS AM (US) is the principal underwriter of each Fund's shares. The Trust has adopted distribution and/or service plans ("the Plans") pursuant to Rule 12b-1 under the 1940 Act for Class A shares. The Plans govern payments made for the expenses incurred in the service and/or distribution of Class A shares. Annual fees under the Plans as a percentage of the average daily net assets of each representative class of each of the Funds are as follows:
Fund | Class A | ||||||
UBS Dynamic Alpha Fund | 0.25 | % | |||||
UBS Global Allocation Fund | 0.25 | ||||||
UBS International Sustainable Equity Fund | 0.25 | ||||||
UBS U.S. Small Cap Growth Fund | 0.25 | ||||||
UBS Municipal Bond Fund | 0.25 | ||||||
UBS Total Return Bond Fund | 0.25 | ||||||
UBS AM (US) also receives the proceeds of the initial sales charges paid upon purchases of Class A shares and the contingent deferred sales charges paid by shareholders upon certain redemptions of Class A shares. At June 30,
172
The UBS Funds
Notes to financial statements
2021, certain Funds owed UBS AM (US) service and distribution fees, and for the period ended June 30, 2021, certain Funds were informed by UBS AM (US) that it had earned sales charges as follows:
Fund | Service and distribution fees owed | Sales charges earned by distributor | |||||||||
UBS Dynamic Alpha Fund—Class A | $ | 4,240 | $ | — | |||||||
UBS Global Allocation Fund—Class A | 39,491 | — | |||||||||
UBS International Sustainable Equity Fund—Class A | — | — | |||||||||
UBS U.S. Small Cap Growth Fund—Class A | 7,033 | — | |||||||||
UBS Municipal Bond Fund—Class A | 1,958 | — | |||||||||
UBS Total Return Bond Fund—Class A | 127 | — | |||||||||
Transfer agency and related services fees
UBS Financial Services Inc. provides certain services to the Funds pursuant to a delegation of authority from BNY Mellon Investment Servicing (US) Inc. ("BNY Mellon"), the Funds' transfer agent, and is compensated for these services by BNY Mellon, not the Funds.
For the period ended June 30, 2021, UBS Financial Services Inc. received from BNY Mellon, not the Funds, total delegated service fees as follows:
Fund | Delegated services fees earned | ||||||
UBS Dynamic Alpha Fund | $ | 16,693 | |||||
UBS Global Allocation Fund | 57,914 | ||||||
UBS Emerging Markets Equity Opportunity Fund | 29,521 | ||||||
UBS Engage For Impact Fund | 7,488 | ||||||
UBS International Sustainable Equity Fund | 17,549 | ||||||
UBS US Dividend Ruler Fund | 12,140 | ||||||
UBS US Quality Growth At Reasonable Price Fund | 20,104 | ||||||
UBS U.S. Small Cap Growth Fund | 4,802 | ||||||
UBS Municipal Bond Fund | 12,251 | ||||||
UBS Sustainable Development Bank Bond Fund | 7,200 | ||||||
UBS Total Return Bond Fund | 993 | ||||||
Securities lending
Each Fund may lend securities up to 331/3% of its total assets to qualified broker-dealers or institutional investors. The loans are initially secured by cash, U.S. government securities and irrevocable letters of credit in an amount at least equal to 102% of the market value of the securities loaned with respect to domestic securities and 105% of the market value of the securities loaned with respect to foreign securities. In the event that the market value of the cash, U.S. government securities, and irrevocable letters of credit securing the loan falls below 100% of the market value for domestic securities, and 103% for foreign securities, the borrower must provide additional cash, U.S. government securities, and irrevocable letters of credit so that the total securing the loan is at least 102% of the market value for domestic securities and 105% of the market value for foreign securities.
Each Fund will regain ownership of loaned securities to exercise certain beneficial rights; however, each Fund may bear the risk of delay in recovery of, or even loss of rights in, the securities loaned should the borrower fail financially. The Fund receives compensation for lending its securities from interest or dividends earned on the cash, U.S. government securities and irrevocable letters of credit held as collateral, net of fee rebates paid to the borrower plus reasonable administrative and custody fees. Cash collateral received is invested in State Street Navigator Securities
173
The UBS Funds
Notes to financial statements
Lending Government Money Market Fund, which is included in the Fund's Portfolio of investments. State Street Bank and Trust Company serves as the Fund's lending agent.
At June 30, 2021, the following Funds had securities on loan at value, cash collateral and non-cash collateral as follows:
Fund | Value of securities on loan | Cash collateral | Non-cash collateral* | Total collateral | Security types held as non-cash collateral | ||||||||||||||||||
UBS Dynamic Alpha Fund | $ | 99,385 | $ | 101,525 | $ | — | $ | 101,525 | |||||||||||||||
UBS Global Allocation Fund | 20,195,920 | 1,796,278 | 18,910,378 | 20,706,656 | U.S. Treasury Notes and U.S. Treasury Bills | ||||||||||||||||||
UBS Emerging Markets Equity Opportunity Fund | 28,331,178 | 1,296,912 | 27,647,595 | 28,944,507 | U.S. Treasury Notes and U.S. Treasury Bills | ||||||||||||||||||
UBS Engage For Impact Fund | 1,185,429 | 74,176 | 1,160,932 | 1,235,108 | U.S. Treasury Notes and U.S. Treasury Bills | ||||||||||||||||||
UBS International Sustainable Equity Fund | 10,359,349 | 192,040 | 10,581,710 | 10,773,750 | U.S. Treasury Notes and U.S. Treasury Bills | ||||||||||||||||||
UBS U.S. Small Cap Growth Fund | 4,665,805 | 1,915,599 | 2,920,367 | 4,835,966 | U.S. Treasury Notes and U.S. Treasury Bills | ||||||||||||||||||
UBS Sustainable Development Bank Bond Fund | 2,329,687 | 2,382,450 | — | 2,382,450 | |||||||||||||||||||
UBS Total Return Bond Fund | 153,496 | 156,650 | — | 156,650 | |||||||||||||||||||
* These securities are held for the benefit of the Fund at the Fund's custodian. The Fund cannot repledge or resell this collateral. As such, this collateral is excluded from the Statement of assets and liabilities.
The table below represents the disaggregation at June 30, 2021 of the gross amount of recognized liabilities for securities lending transactions. As the securities loaned are subject to termination by the Funds or the borrower at any time, the remaining contractual maturities of the transactions presented below are considered to be overnight and continuous.
Type of securities loaned | Total gross amount of recognized | ||||||||||||||
Fund | Equity securities | Corporate bonds | liabilities for securities lending transactions | ||||||||||||
UBS Dynamic Alpha Fund | $ | — | $ | 101,525 | $ | 101,525 | |||||||||
UBS Global Allocation Fund | 1,796,278 | — | 1,796,278 | ||||||||||||
UBS Emerging Markets Equity Opportunity Fund | 1,296,912 | — | 1,296,912 | ||||||||||||
UBS Engage For Impact Fund | 74,176 | — | 74,176 | ||||||||||||
UBS International Sustainable Equity Fund | 192,040 | — | 192,040 | ||||||||||||
UBS U.S. Small Cap Growth Fund | 1,915,599 | — | 1,915,599 | ||||||||||||
UBS Sustainable Development Bank Bond Fund | — | 2,382,450 | 2,382,450 | ||||||||||||
UBS Total Return Bond Fund | — | 156,650 | 156,650 | ||||||||||||
Bank line of credit
The Fund participates with other funds managed by UBS AM in a $185 million committed credit facility (the "Committed Credit Facility") with State Street Bank and Trust Company. The Committed Credit Facility is to be utilized for temporary financing until the settlement of sales or purchases of portfolio securities, the repurchase or redemption of shares of a participating Fund at the request of shareholders and other temporary or emergency purposes.
Interest on amounts borrowed is calculated based on the prevailing rates in effect at the time of borrowing. The Funds covered by the Committed Credit Facility have agreed to pay commitment fees on the average daily balance of the Committed Credit Facility not utilized. Commitment fees have been allocated among the Funds in the
174
The UBS Funds
Notes to financial statements
Committed Credit Facility as follows: 50% of the allocation is based on the relative asset size of funds and the other 50% of the allocation is based on utilization.
For the period ended June 30, 2021, the following Funds had borrowings as follows:
Fund | Average daily amount of borrowing outstanding | Days outstanding | Interest expense | Weighted average annualized interest rate | |||||||||||||||
UBS Municipal Bond Fund | $ | 933,461 | 35 | $ | 1,163 | 1.281 | % | ||||||||||||
Commission recapture program
Certain Funds participate in a brokerage commission recapture program. These Funds have established commission recapture arrangements with certain participating brokers or dealers. If a Fund's investment manager chooses to execute a transaction through a participating broker subject to best price and execution, the broker will rebate a portion of the commission back to the Fund. Any collateral benefit received through participation in the commission recapture program is directed exclusively to the Fund. For the period ended June 30, 2021, there were no recaptured commissions on the Funds.
Purchases and sales of securities
For the period June 30, 2021, aggregate purchases and sales of portfolio securities, excluding short-term securities, were as follows:
Fund | Purchases | Sales | |||||||||
UBS All China Equity Fund | $ | 1,899,967 | $ | 86,984 | |||||||
UBS Dynamic Alpha Fund | 5,771,319 | 5,979,089 | |||||||||
UBS Global Allocation Fund | 295,563,776 | 329,815,179 | |||||||||
UBS Emerging Markets Equity Opportunity Fund | 689,381,979 | 316,627,543 | |||||||||
UBS Engage For Impact Fund | 40,289,976 | 29,222,895 | |||||||||
UBS International Sustainable Equity Fund | 290,308,160 | 159,462,628 | |||||||||
UBS US Dividend Ruler Fund | 80,850,754 | 9,769,455 | |||||||||
UBS US Quality Growth At Reasonable Price Fund | 115,461,208 | 18,914,557 | |||||||||
UBS U.S. Small Cap Growth Fund | 127,996,351 | 106,260,181 | |||||||||
UBS Municipal Bond Fund | 38,122,650 | 50,284,756 | |||||||||
UBS Sustainable Development Bank Bond Fund | 55,557,559 | 9,064,376 | |||||||||
UBS Total Return Bond Fund | 62,271,318 | 62,082,919 | |||||||||
Shares of beneficial interest
There is an unlimited number of $0.001 par value shares of beneficial interest authorized. Transactions in shares of beneficial interest for each of the Funds were as follows:
UBS All China Equity Fund1
For the period ended June 30, 2021:
Class P | |||||||||||
Shares | Amount | ||||||||||
Shares sold | 200,000 | $ | 2,000,000 | ||||||||
Net increase (decrease) | 200,000 | $ | 2,000,000 | ||||||||
1 For the period from February 23, 2021 (commencement of operations) through June 30, 2021.
175
The UBS Funds
Notes to financial statements
UBS Dynamic Alpha Fund
For the year ended June 30, 2021:
Class A | Class P | ||||||||||||||||||
Shares | Amount | Shares | Amount | ||||||||||||||||
Shares sold | 4,428 | $ | 28,574 | 211,816 | $ | 1,431,574 | |||||||||||||
Shares repurchased | (535,926 | ) | (3,458,032 | ) | (632,905 | ) | (4,188,830 | ) | |||||||||||
Net increase (decrease) | (531,498 | ) | $ | (3,429,458 | ) | (421,089 | ) | $ | (2,757,256 | ) | |||||||||
For the year ended June 30, 2020:
Class A | Class P | ||||||||||||||||||
Shares | Amount | Shares | Amount | ||||||||||||||||
Shares sold | 14,558 | $ | 88,921 | 159,175 | $ | 999,053 | |||||||||||||
Shares repurchased | (1,340,311 | ) | (8,252,007 | ) | (925,017 | ) | (5,838,808 | ) | |||||||||||
Dividends reinvested | 163,909 | 1,026,069 | 125,536 | 803,427 | |||||||||||||||
Net increase (decrease) | (1,161,844 | ) | $ | (7,137,017 | ) | (640,306 | ) | $ | (4,036,328 | ) | |||||||||
UBS Global Allocation Fund
For the year ended June 30, 2021:
Class A | Class P | ||||||||||||||||||
Shares | Amount | Shares | Amount | ||||||||||||||||
Shares sold | 10,038 | $ | 136,618 | 244,148 | $ | 3,438,467 | |||||||||||||
Shares repurchased | (1,750,164 | ) | (23,572,518 | ) | (781,217 | ) | (10,944,548 | ) | |||||||||||
Dividends reinvested | 202,723 | 2,805,681 | 65,787 | 933,522 | |||||||||||||||
Net increase (decrease) | (1,537,403 | ) | $ | (20,630,219 | ) | (471,282 | ) | $ | (6,572,559 | ) | |||||||||
For the year ended June 30, 2020:
Class A | Class P | ||||||||||||||||||
Shares | Amount | Shares | Amount | ||||||||||||||||
Shares sold | 81,989 | $ | 952,814 | 506,975 | $ | 6,539,760 | |||||||||||||
Shares repurchased | (3,008,442 | ) | (36,131,245 | ) | (1,073,824 | ) | (13,097,446 | ) | |||||||||||
Dividends reinvested | 991,416 | 12,293,553 | 305,596 | 3,881,075 | |||||||||||||||
Net increase (decrease) | (1,935,037 | ) | $ | (22,884,878 | ) | (261,253 | ) | $ | (2,676,611 | ) | |||||||||
176
The UBS Funds
Notes to financial statements
UBS Emerging Markets Equity Opportunity Fund
For the year ended June 30, 2021:
Class P | Class P2 | ||||||||||||||||||
Shares | Amount | Shares | Amount | ||||||||||||||||
Shares sold | 14,147,551 | $ | 169,320,305 | 26,833,218 | $ | 319,261,194 | |||||||||||||
Shares repurchased | (3,025,956 | ) | (36,095,951 | ) | (6,974,249 | ) | (81,214,990 | ) | |||||||||||
Dividends reinvested | 127,176 | 1,540,098 | 545,332 | 6,642,141 | |||||||||||||||
Net increase (decrease) | 11,248,771 | $ | 134,764,452 | 20,404,301 | $ | 244,688,345 | |||||||||||||
For the year ended June 30, 2020:
Class P | Class P2 | ||||||||||||||||||
Shares | Amount | Shares | Amount | ||||||||||||||||
Shares sold | 13,167,373 | $ | 117,978,657 | 26,872,447 | $ | 226,512,613 | |||||||||||||
Shares repurchased | (6,596,098 | ) | (54,624,088 | ) | (6,939,570 | ) | (59,451,868 | ) | |||||||||||
Dividends reinvested | 181,865 | 1,793,187 | 410,790 | 4,066,820 | |||||||||||||||
Net increase (decrease) | 6,753,140 | $ | 65,147,756 | 20,343,667 | $ | 171,127,565 | |||||||||||||
UBS Engage For Impact Fund
For the period ended June 30, 2021:
Class P | Class P22 | ||||||||||||||||||
Shares | Amount | Shares | Amount | ||||||||||||||||
Shares sold | 1,369,755 | $ | 17,043,521 | 3,075,952 | $ | 43,396,675 | |||||||||||||
Shares repurchased | (3,430,094 | ) | (47,437,737 | ) | (88,712 | ) | (1,255,623 | ) | |||||||||||
Dividends reinvested | 20,418 | 265,026 | — | — | |||||||||||||||
Net increase (decrease) | (2,039,921 | ) | $ | (30,129,190 | ) | 2,987,240 | $ | 42,141,052 | |||||||||||
For the year ended June 30, 2020:
Class P | |||||||||||
Shares | Amount | ||||||||||
Shares sold | 1,525,300 | $ | 15,119,169 | ||||||||
Shares repurchased | (455,577 | ) | (4,654,704 | ) | |||||||
Dividends reinvested | 46,551 | 521,370 | |||||||||
Net increase (decrease) | 1,116,274 | $ | 10,985,835 | ||||||||
2 For the period February 24, 2021 (commencement of operations) through June 30, 2021.
177
The UBS Funds
Notes to financial statements
UBS International Sustainable Equity Fund
For the period ended June 30, 2021:
Class A | Class P | Class P23 | |||||||||||||||||||||||||
Shares | Amount | Shares | Amount | Shares | Amount | ||||||||||||||||||||||
Shares sold | 113,209 | $ | 1,201,424 | 15,687,291 | $ | 182,719,166 | 3,495,542 | $ | 41,172,796 | ||||||||||||||||||
Shares repurchased | (166,275 | ) | (1,815,013 | ) | (6,573,685 | ) | (76,443,156 | ) | (226,942 | ) | (2,792,095 | ) | |||||||||||||||
Dividends reinvested | 7,173 | 84,210 | 267,600 | 3,149,650 | 33,491 | 394,187 | |||||||||||||||||||||
Net increase (decrease) | (45,893 | ) | $ | (529,379 | ) | 9,381,206 | $ | 109,425,660 | 3,302,091 | $ | 38,774,888 | ||||||||||||||||
For the year ended June 30, 2020:
Class A | Class P | ||||||||||||||||||
Shares | Amount | Shares | Amount | ||||||||||||||||
Shares sold | 95,585 | $ | 916,778 | 13,137,692 | $ | 124,644,094 | |||||||||||||
Shares repurchased | (308,578 | ) | (2,714,895 | ) | (6,947,101 | ) | (66,031,812 | ) | |||||||||||
Dividends reinvested | 10,737 | 112,848 | 244,975 | 2,579,591 | |||||||||||||||
Net increase (decrease) | (202,256 | ) | $ | (1,685,269 | ) | 6,435,566 | $ | 61,191,873 | |||||||||||
3 For the period from October 30, 2020 (commencement of operations) through June 30, 2021.
UBS US Dividend Ruler Fund4
For the period ended June 30, 2021:
Class P | |||||||||||
Shares | Amount | ||||||||||
Shares sold | 7,444,278 | $ | 84,691,033 | ||||||||
Shares repurchased | (1,078,574 | ) | (12,605,771 | ) | |||||||
Dividends reinvested | 27,009 | 304,926 | |||||||||
Net increase (decrease) | 6,392,713 | $ | 72,390,188 | ||||||||
4 For the period from July 9, 2020 (commencement of operations) through June 30, 2021.
UBS US Quality Growth At Reasonable Price Fund4
For the year ended June 30, 2021:
Class P | |||||||||||
Shares | Amount | ||||||||||
Shares sold | 10,980,973 | $ | 123,322,191 | ||||||||
Shares repurchased | (2,102,969 | ) | (24,559,546 | ) | |||||||
Dividends reinvested | 20,693 | 233,830 | |||||||||
Net increase (decrease) | 8,898,697 | $ | 98,996,475 | ||||||||
4 For the period from July 9, 2020 (commencement of operations) through June 30, 2021.
178
The UBS Funds
Notes to financial statements
UBS U.S. Small Cap Growth Fund
For the year ended June 30, 2021:
Class A | Class P | ||||||||||||||||||
Shares | Amount | Shares | Amount | ||||||||||||||||
Shares sold | 257,901 | $ | 6,742,911 | 1,935,839 | $ | 57,059,671 | |||||||||||||
Shares repurchased | (295,081 | ) | (7,733,170 | ) | (1,076,007 | ) | (31,440,072 | ) | |||||||||||
Dividends reinvested | 129,889 | 3,329,059 | 510,279 | 15,053,231 | |||||||||||||||
Net increase (decrease) | 92,709 | $ | 2,338,800 | 1,370,111 | $ | 40,672,830 | |||||||||||||
For the year ended June 30, 2020:
Class A | Class P | ||||||||||||||||||
Shares | Amount | Shares | Amount | ||||||||||||||||
Shares sold | 151,607 | $ | 2,744,880 | 936,317 | $ | 19,004,079 | |||||||||||||
Shares repurchased | (415,731 | ) | (7,446,303 | ) | (1,515,406 | ) | (29,890,534 | ) | |||||||||||
Dividends reinvested | 84,387 | 1,541,748 | 307,310 | 6,352,105 | |||||||||||||||
Net increase (decrease) | (179,737 | ) | $ | (3,159,675 | ) | (271,779 | ) | $ | (4,534,350 | ) | |||||||||
UBS Municipal Bond Fund
For the year ended June 30, 2021:
Class A | Class P | ||||||||||||||||||
Shares | Amount | Shares | Amount | ||||||||||||||||
Shares sold | — | $ | — | 3,234,611 | $ | 35,344,732 | |||||||||||||
Shares repurchased | (267,440 | ) | (2,906,597 | ) | (3,769,782 | ) | (41,168,503 | ) | |||||||||||
Dividends reinvested | 18,104 | 198,055 | 183,475 | 2,004,762 | |||||||||||||||
Net increase (decrease) | (249,336 | ) | $ | (2,708,542 | ) | (351,696 | ) | $ | (3,819,009 | ) | |||||||||
For the year ended June 30, 2020:
Class A | Class P | ||||||||||||||||||
Shares | Amount | Shares | Amount | ||||||||||||||||
Shares sold | 93,589 | $ | 1,003,271 | 3,484,559 | $ | 37,321,400 | |||||||||||||
Shares repurchased | (164,173 | ) | (1,760,867 | ) | (2,199,640 | ) | (23,502,061 | ) | |||||||||||
Dividends reinvested | 16,166 | 172,512 | 126,210 | 1,346,144 | |||||||||||||||
Net increase (decrease) | (54,418 | ) | $ | (585,084 | ) | 1,411,129 | $ | 15,165,483 | |||||||||||
179
The UBS Funds
Notes to financial statements
UBS Sustainable Development Bank Bond Fund
For the period ended June 30, 2021:
Class P | Class P23 | ||||||||||||||||||
Shares | Amount | Shares | Amount | ||||||||||||||||
Shares sold | 1,430,661 | $ | 15,750,187 | 6,756,676 | $ | 73,013,100 | |||||||||||||
Shares repurchased | (3,148,022 | ) | (34,747,508 | ) | (660,559 | ) | (6,989,118 | ) | |||||||||||
Dividends reinvested | 19,415 | 214,348 | 102,495 | 1,102,672 | |||||||||||||||
Net increase (decrease) | (1,697,946 | ) | $ | (18,782,973 | ) | 6,198,612 | $ | 67,126,654 | |||||||||||
For the year ended June 30, 2020:
Class P | |||||||||||
Shares | Amount | ||||||||||
Shares sold | 3,366,710 | $ | 36,308,770 | ||||||||
Shares repurchased | (2,460,300 | ) | (26,819,184 | ) | |||||||
Dividends reinvested | 57,868 | 621,222 | |||||||||
Net increase (decrease) | 964,278 | $ | 10,110,808 | ||||||||
3 For the period from October 30, 2020 (commencement of operations) through June 30, 2021.
UBS Total Return Bond Fund
For the year ended June 30, 2021:
Class A | Class P | ||||||||||||||||||
Shares | Amount | Shares | Amount | ||||||||||||||||
Shares sold | 1,735 | $ | 27,000 | 19,241 | $ | 306,021 | |||||||||||||
Shares repurchased | (336 | ) | (5,337 | ) | (210,154 | ) | (3,306,353 | ) | |||||||||||
Dividends reinvested | 531 | 8,349 | 33,709 | 530,760 | |||||||||||||||
Net increase (decrease) | 1,930 | $ | 30,012 | (157,204 | ) | $ | (2,469,572 | ) | |||||||||||
For the year ended June 30, 2020:
Class A | Class P | ||||||||||||||||||
Shares | Amount | Shares | Amount | ||||||||||||||||
Shares sold | 10,522 | $ | 159,769 | 18,212 | $ | 283,305 | |||||||||||||
Shares repurchased | (2,026 | ) | (31,558 | ) | (280,696 | ) | (4,297,361 | ) | |||||||||||
Dividends reinvested | 693 | 10,611 | 50,157 | 767,787 | |||||||||||||||
Net increase (decrease) | 9,189 | $ | 138,822 | (212,327 | ) | $ | (3,246,269 | ) | |||||||||||
Federal tax status
It is each Fund's policy to comply with all requirements of the Internal Revenue Code applicable to regulated investment companies and to distribute substantially all of their taxable income to their shareholders. In addition, by distributing during each calendar year substantially all of its net investment income, net realized capital gains and certain other amounts, if any, each Fund intends not to be subject to a federal excise tax. Accordingly, no federal income tax provision was required.
180
The UBS Funds
Notes to financial statements
The tax character of distributions paid during the fiscal years ended June 30, 2021 and June 30, 2020 were as follows:
2021 | |||||||||||||||||||
Fund | Distributions paid from tax-exempt income | Distributions paid from ordinary income | Distributions paid from net long-term capital gains | Total distributions paid | |||||||||||||||
UBS Global Allocation Fund | $ | — | $ | 1,410,280 | $ | 2,667,270 | $ | 4,077,550 | |||||||||||
UBS Emerging Markets Equity Opportunity Fund | — | 10,787,637 | — | 10,787,637 | |||||||||||||||
UBS Engage For Impact Fund | — | 65,220 | 235,704 | 300,924 | |||||||||||||||
UBS International Sustainable Equity Fund | — | 4,020,989 | — | 4,020,989 | |||||||||||||||
UBS US Dividend Ruler Fund | — | 337,013 | — | 337,013 | |||||||||||||||
UBS US Quality Growth At Reasonable Price Fund | — | 250,762 | — | 250,762 | |||||||||||||||
UBS U.S. Small Cap Growth Fund | — | 6,327,434 | 12,787,307 | 19,114,741 | |||||||||||||||
UBS Municipal Bond Fund | 1,703,034 | 37,074 | 972,985 | 2,713,093 | |||||||||||||||
UBS Sustainable Development Bank Bond Fund | — | 1,254,524 | 595,498 | 1,850,022 | |||||||||||||||
UBS Total Return Bond Fund | — | 706,081 | — | 706,081 | |||||||||||||||
2020 | |||||||||||||||||||
Fund | Distributions paid from tax-exempt income | Distributions paid from ordinary income | Distributions paid from long term realized capital gains | Total distributions paid | |||||||||||||||
UBS Dynamic Alpha Fund | $ | — | $ | 2,063,702 | $ | — | $ | 2,063,702 | |||||||||||
UBS Global Allocation Fund | — | 7,143,270 | 10,424,363 | 17,567,633 | |||||||||||||||
UBS Emerging Markets Equity Opportunity Fund | — | 8,643,917 | — | 8,643,917 | |||||||||||||||
UBS Engage For Impact Fund | — | 567,242 | — | 567,242 | |||||||||||||||
UBS International Sustainable Equity Fund | — | 2,946,538 | — | 2,946,538 | |||||||||||||||
UBS U.S. Small Cap Growth Fund | — | 364,427 | 7,891,689 | 8,256,116 | |||||||||||||||
UBS U.S. Sustainable Equity Fund | — | 1,319,824 | 207,718 | 1,527,542 | |||||||||||||||
UBS Municipal Bond Fund | 2,008,906 | 2,076 | — | 2,010,982 | |||||||||||||||
UBS Sustainable Development Bank Bond Fund | — | 824,383 | — | 824,383 | |||||||||||||||
UBS Total Return Bond Fund | — | 1,002,242 | — | 1,002,242 | |||||||||||||||
181
The UBS Funds
Notes to financial statements
For federal income tax purposes, the estimated cost and unrealized appreciation (depreciation) in value of investments, including derivatives, held at June 30, 2021 were as follows:
Fund | Cost of investments | Gross unrealized appreciation | Gross unrealized depreciation | Net unrealized appreciation (depreciation) on investments | |||||||||||||||
UBS All China Equity Fund | $ | 1,897,455 | $ | 73,645 | $ | (207,436 | ) | $ | (133,791 | ) | |||||||||
UBS Dynamic Alpha Fund | 41,867,403 | 1,860,102 | (12,951,067 | ) | (11,090,965 | ) | |||||||||||||
UBS Global Allocation Fund | 215,535,096 | 32,969,605 | (1,309,980 | ) | 31,659,625 | ||||||||||||||
UBS Emerging Markets Equity Opportunity Fund | 890,800,787 | 169,547,524 | (17,139,907 | ) | 152,407,617 | ||||||||||||||
UBS Engage For Impact Fund | 43,189,588 | 8,397,012 | (966,152 | ) | 7,430,860 | ||||||||||||||
UBS International Sustainable Equity Fund | 377,664,715 | 60,811,943 | (7,192,181 | ) | 53,619,762 | ||||||||||||||
UBS US Dividend Ruler Fund | 74,531,311 | 7,981,624 | (38,622 | ) | 7,943,002 | ||||||||||||||
UBS US Quality Growth At Reasonable Price Fund | 101,527,341 | 14,984,079 | (70,673 | ) | 14,913,406 | ||||||||||||||
UBS U.S. Small Cap Growth Fund | 151,563,756 | 71,348,963 | (3,827,447 | ) | 67,521,516 | ||||||||||||||
UBS Municipal Bond Fund | 109,068,691 | 5,423,821 | (60,490 | ) | 5,363,331 | ||||||||||||||
UBS Sustainable Development Bank Bond Fund | 84,722,736 | 1,101,239 | (604,587 | ) | 496,652 | ||||||||||||||
UBS Total Return Bond Fund | 37,848,738 | 1,344,957 | (272,523 | ) | 1,072,434 | ||||||||||||||
The difference between book and tax basis appreciation (depreciation) on investment is primarily attributed to tax deferral of losses on wash sales, tax treatment of certain derivatives and mark-to-market of passive foreign investment companies.
At June 30, 2021, the components of accumulated earnings (deficit) on a tax basis were as follows:
Fund | Undistributed tax-exempt income | Undistributed ordinary income | Undistributed long-term capital gains | Accumulated capital and other losses | Unrealized appreciation (depreciation) | Other temporary differences | Total | ||||||||||||||||||||||||
UBS All China Equity Fund | $ | — | $ | 7,098 | $ | — | $ | (106,114 | ) | $ | (133,800 | ) | $ | (180 | ) | $ | (232,996 | ) | |||||||||||||
UBS Dynamic Alpha Fund | — | 3,290,368 | — | (32,393,785 | ) | (11,129,781 | ) | — | (40,233,198 | ) | |||||||||||||||||||||
UBS Global Allocation Fund | — | 15,075,295 | 17,883,608 | (1,077,570 | ) | 31,700,544 | (2 | ) | 63,581,875 | ||||||||||||||||||||||
| UBS Emerging Markets Equity Opportunity Fund | — | 7,791,288 | 39,750,188 | — | 149,910,047 | (20,953 | ) | 197,430,570 | |||||||||||||||||||||||
UBS Engage For Impact Fund | — | 2,639,232 | 2,536,269 | — | 7,430,548 | (29,445 | ) | 12,576,604 | |||||||||||||||||||||||
UBS International Sustainable Equity Fund | — | 3,944,607 | 13,187,627 | — | 53,626,162 | (1 | ) | 70,758,395 | |||||||||||||||||||||||
UBS US Dividend Ruler Fund | — | 1,674,678 | — | — | 7,943,002 | (26,798 | ) | 9,590,882 | |||||||||||||||||||||||
| UBS US Quality Growth At Reasonable Price Fund | — | 2,646,449 | — | — | 14,913,406 | (33,262 | ) | 17,526,593 | |||||||||||||||||||||||
UBS U.S. Small Cap Growth Fund | — | 13,440,310 | 7,885,997 | — | 67,521,516 | — | 88,847,823 | ||||||||||||||||||||||||
UBS Municipal Bond Fund | — | — | 866,290 | (102,185 | ) | 5,363,331 | (27,441 | ) | 6,099,995 | ||||||||||||||||||||||
| UBS Sustainable Development Bank Bond Fund | — | — | 116,295 | (24,512 | ) | 496,651 | (18,510 | ) | 569,924 | ||||||||||||||||||||||
UBS Total Return Bond Fund | — | 304,008 | — | (2,636,741 | ) | 1,072,830 | 1 | (1,259,902 | ) | ||||||||||||||||||||||
Net capital losses recognized by the Funds, may be carried forward indefinitely, and retain their character as short-term and/or long-term losses. These carryforwards are available as a reduction, to the extent provided in regulations, of future realized capital gains. To the extent that such losses are used to offset future net realized capital gains, it is probable these gains will not be distributed.
182
The UBS Funds
Notes to financial statements
At June 30, 2021, the following Funds had net capital losses that will be carried forward indefinitely, as follows:
Fund | Short-term losses | Long-term losses | Net capital losses | ||||||||||||
UBS All China Equity Fund | $ | 106,114 | $ | — | $ | 106,114 | |||||||||
UBS Dynamic Alpha Fund | 18,340,107 | 13,544,679 | 31,884,786 | ||||||||||||
UBS Total Return Bond Fund | 1,853,913 | 770,813 | 2,624,726 | ||||||||||||
During the fiscal year ended June 30, 2021, the following Funds had capital loss carryforwards utilized:
Capital loss carryforwards utilized | |||||||
UBS Emerging Markets Equity Opportunity Fund | $ | 12,454,148 | |||||
UBS International Sustainable Equity Fund | 8,595,504 | ||||||
Qualified late year losses are deemed to arise on the first business day of a Fund's next taxable year. For the fiscal year ended June 30, 2021, the following Funds incurred and elected to defer qualified late year losses of the following:
Post October capital loss | |||||||||||||||
Fund | Late year ordinary loss | Short-term losses | Long-term losses | ||||||||||||
UBS Municipal Bond Fund | $ | — | $ | 102,185 | $ | — | |||||||||
UBS Sustainable Development Bank Bond Fund | — | 24,512 | — | ||||||||||||
At June 30, 2021, the effect of permanent "book/tax" reclassifications resulted in increases and decreases to components of the Funds' net assets as follows:
Fund | Distributable earnings (losses) | Beneficial interest | |||||||||
UBS US Quality Growth at Reasonable Price Fund | $ | (14,817 | ) | $ | 14,817 | ||||||
This difference is primarily due to the tax treatment of equalization.
ASC 740-10 "Income Taxes—Overall" sets forth a minimum threshold for financial statement recognition of the benefit of a tax position taken or expected to be taken. The Funds have conducted an analysis and concluded, as of June 30, 2021, that there are no significant uncertain tax positions taken or expected to be taken that would require recognition in the financial statements. It is each Fund's policy to record any significant foreign tax exposures in the financial statements. The Funds recognize interest and penalties, if any, related to uncertain tax positions as income tax expense in the Statement of operations. During the period ended June 30, 2021, the Funds did not incur any interest or penalties.
Under the applicable foreign tax laws, gains on certain securities held in certain foreign countries may be subject to taxes that will be paid by the Funds.
Each of the tax years in the four year fiscal period ended June 30, 2021 or since inception in the case of UBS All China Equity Fund, UBS Emerging Markets Equity Opportunity Fund, UBS Engage For Impact Fund, UBS US Dividend Ruler Fund, UBS US Quality Growth at Reasonable Price Fund and UBS Sustainable Development Bank Bond Fund remains subject to examination by the Internal Revenue Service and state taxing authorities.
183
The UBS Funds
Report of independent registered public accounting firm
To the Shareholders and the Board of Trustees of The UBS Funds
Opinion on the Financial Statements
We have audited the accompanying statements of assets and liabilities of The UBS Funds (the "Trust"), (comprising UBS All China Equity Fund, UBS Dynamic Alpha Fund, UBS Global Allocation Fund, UBS Emerging Markets Equity Opportunity Fund, UBS Engage For Impact Fund, UBS International Sustainable Equity Fund, UBS US Dividend Ruler Fund, UBS US Quality Growth At Reasonable Price Fund, UBS U.S. Small Cap Growth Fund, UBS Municipal Bond Fund, UBS Sustainable Development Bank Bond Fund and UBS Total Return Bond Fund (collectively referred to as the "Funds")), including the portfolios of investments, as of June 30, 2021, and the related statements of operations and changes in net assets, and the financial highlights for each of the periods indicated in the table below and the related notes (collectively referred to as the "financial statements"). In our opinion, the financial statements present fairly, in all material respects, the financial position of each of the Funds comprising The UBS Funds at June 30, 2021, the results of their operations, changes in net assets and financial highlights for each of the periods indicated in the table below, in conformity with U.S. generally accepted accounting principles.
Funds comprising The UBS Funds | Statement of operations | Statement of changes in net assets | Financial highlights | ||||||||||||
| UBS Dynamic Alpha Fund UBS Global Allocation Fund UBS International Sustainable Equity Fund UBS U.S. Small Cap Growth Fund UBS Municipal Bond Fund UBS Total Return Bond Fund | For the year ended June 30, 2021 | For each of the two years in the period ended June 30, 2021 | For each of the five years in the period ended June 30, 2021 | ||||||||||||
UBS Emerging Markets Equity Opportunity Fund | For the year ended June 30, 2021 | For each of the two years in the period ended June 30, 2021 | For each of the three years in the period ended June 30, 2021 and the period from June 4, 2018 (commencement of operations) through June 30, 2018 | ||||||||||||
| UBS Engage for Impact Fund UBS Sustainable Development Bank Bond Fund | For the year ended June 30, 2021 | For each of the two years in the period ended June 30, 2021 | For each of the two years in the period ended June 30, 2021 and the period from October 24, 2018 (commencement of operations) through June 30, 2019 | ||||||||||||
UBS All China Equity Fund | For the period from February 23, 2021 (commencement of operations) through June 30, 2021 | ||||||||||||||
| UBS US Dividend Ruler Fund UBS US Quality Growth At Reasonable Price Fund | For the period from July 9, 2020 (commencement of operations) through June 30, 2021 | ||||||||||||||
Basis for Opinion
These financial statements are the responsibility of the Trust's management. Our responsibility is to express an opinion on each of the Funds' financial statements based on our audits. We are a public accounting firm registered with the Public Company Accounting Oversight Board (United States) ("PCAOB") and are required to be independent with respect to the Trust in accordance with the U.S. federal securities laws and the applicable rules and regulations of the Securities and Exchange Commission and the PCAOB.
184
The UBS Funds
Report of independent registered public accounting firm (concluded)
We conducted our audits in accordance with the standards of the PCAOB. Those standards require that we plan and perform the audit to obtain reasonable assurance about whether the financial statements are free of material misstatement, whether due to error or fraud. The Trust is not required to have, nor were we engaged to perform, an audit of the Trust's internal control over financial reporting. As part of our audits we are required to obtain an understanding of internal control over financial reporting but not for the purpose of expressing an opinion on the effectiveness of the Trust's internal control over financial reporting. Accordingly, we express no such opinion.
Our audits included performing procedures to assess the risks of material misstatement of the financial statements, whether due to error or fraud, and performing procedures that respond to those risks. Such procedures included examining, on a test basis, evidence regarding the amounts and disclosures in the financial statements. Our procedures included confirmation of securities owned as of June 30, 2021, by correspondence with the custodian and brokers or by other appropriate auditing procedures where replies from brokers were not received. Our audits also included evaluating the accounting principles used and significant estimates made by management, as well as evaluating the overall presentation of the financial statements. We believe that our audits provide a reasonable basis for our opinion.

We have served as the auditor of one or more UBS investment companies since 1978.
New York, New York
August 27, 2021
185
The UBS Funds
Federal tax information (unaudited)
We are required by Subchapter M of the Internal Revenue Code of 1986, as amended, to advise you in writing as to the federal tax status of distributions received by shareholders during the fiscal year. Accordingly, the amount of ordinary dividends paid that qualify for the dividends received deduction for corporate shareholders and the amount of foreign tax credit to be passed through to shareholders are as follows:
Fund | Dividends received deduction | Long-term capital gain | Foreign tax credit | ||||||||||||
UBS Global Allocation Fund | $ | 650 | $ | 2,667,270 | $ | — | |||||||||
UBS Emerging Markets Equity Opportunity Fund | — | — | 3,232,258 | ||||||||||||
UBS Engage For Impact Fund | 15,751 | 235,704 | — | ||||||||||||
UBS International Sustainable Equity Fund | — | — | 545,796 | ||||||||||||
UBS US Dividend Ruler Fund | 119,791 | — | — | ||||||||||||
UBS US Quality Growth At Reasonable Price Fund | 37,877 | — | — | ||||||||||||
UBS U.S. Small Cap Growth Fund | 403,954 | 12,787,307 | — | ||||||||||||
UBS Municipal Bond Fund | — | 972,985 | — | ||||||||||||
UBS Sustainable Development Bank Bond Fund | — | 595,498 | — | ||||||||||||
Also, for the fiscal period ended June 30, 2021, the foreign source income for information reporting purposes for UBS Emerging Markets Equity Opportunity Fund was $13,136,885 and for UBS International Sustainable Equity Fund was $3,378,798.
For the taxable period ended June 30, 2021, the Funds designate the amounts below as the maximum amount that may be considered qualified dividend income for individual shareholders.
Fund | Maximum amount considered qualified dividend income | ||||||
UBS Global Allocation Fund | $ | 1,408 | |||||
UBS Emerging Markets Equity Opportunity Fund | 9,584,842 | ||||||
UBS Engage For Impact Fund | 64,817 | ||||||
UBS International Sustainable Equity Fund | 4,566,785 | ||||||
UBS US Dividend Ruler Fund | 145,151 | ||||||
UBS US Quality Growth At Reasonable Price Fund | 42,466 | ||||||
UBS U.S. Small Cap Growth Fund | 421,647 | ||||||
Shareholders should not use the above information to prepare their tax returns. Since the Funds' fiscal year end is not the calendar year end, another notification will be sent with respect to calendar year 2021. Such notification, which will reflect the amount to be used by calendar year taxpayers on their federal income tax returns, will be made in conjunction with Form 1099 DIV and will be mailed in February 2022. Shareholders are advised to consult their own tax advisers with respect to the tax consequences of their investment in each of the Funds.
186
The UBS Funds
General information (unaudited)
Quarterly portfolio schedule
The Funds filed its complete schedule of portfolio holdings with the U.S. Securities and Exchange Commission ("SEC") for the first and third quarters of each fiscal year as an exhibit to its reports on Form N-PORT. The Funds' Form N-PORT reports are available on the SEC's Web site at http://www.sec.gov. (Please note that on the SEC's Web site, the "filing type" designation for this information may be "NPORT-EX.") Additionally, you may obtain copies of such portfolio holdings schedules for the first and third quarters of each fiscal year from the funds upon request by calling 1-800-647 1568.
Proxy voting policies, procedures and record
You may obtain a description of the Fund's (1) proxy voting policies, (2) proxy voting procedures and (3) information regarding how the Fund voted any proxies related to portfolio securities during the most recent 12-month period ended June 30 for which an SEC filing has been made, without charge, upon request by contacting the Fund directly at 1-800-647 1568, online on the Fund's Web site: www.ubs.com/ubsam-proxy, or on the EDGAR Database on the SEC's Web site (http://www.sec.gov).
Liquidity Risk Management Program
Pursuant to Rule 22e-4 under the 1940 Act, The UBS Funds (the "Trust") has adopted a liquidity risk management program (the "program") with respect to each of its series (each, a "Fund"). UBS Asset Management (Americas) Inc. ("UBS AM") has been designated by the Trust's Board to administer the program, and UBS AM has delegated the responsibility to carry out certain functions described in the program to an internal group which is comprised of representatives of various investment and non-investment areas of the firm. Liquidity risk is defined as the risk that a Fund could not meet redemption requests without significant dilution of remaining shareholders' interests in that Fund. The program is intended to provide a framework for the assessment, management and periodic review of each Fund's liquidity risks, taking into consideration, as applicable, the Fund's investment strategy and liquidity of portfolio investments during both normal and reasonably foreseeable stressed conditions; short-term and long-term cash flow projections during both normal and reasonably foreseeable stressed conditions; and holdings of cash and cash equivalents, as well as borrowing arrangements and other funding sources. The provisions of the program shall be administered for each Fund in a manner that is appropriately tailored to reflect the Fund's particular liquidity risks. UBS AM's process of determining the degree of liquidity of a Fund's investments is supported by a third-party liquidity assessment vendor. In June 2021, UBS AM provided the Board with a report addressing the operation of the program and assessing its adequacy and effectiveness of implementation (the "report"). The report covered the period from May 2, 2020 through May 1, 2021.
UBS AM's report concluded that the program was reasonably designed to assess and manage each Fund's liquidity risk, including during periods of market volatility and net redemptions. UBS AM reported that the program, including any applicable highly liquid investment minimum ("HLIM"), operated adequately and that the implementation of the program, including any applicable HLIM, was effective to manage each Fund's liquidity risk.
There can be no assurance that the program will achieve its objectives in the future. Please refer to a Fund's prospectus for more information regarding a Fund's exposure to liquidity risk and other risks to which an investment in a Fund may be subject.
187
The UBS Funds
Board approval of investment advisory agreements
At the meeting of the Board of Trustees (the "Board") of The UBS Funds (the "Trust"), held on June 3 and 4, 2021 (the "Meeting"), the Board, including those Trustees who are not "interested persons" (as defined in the 1940 Act) of the Trust or UBS Asset Management (Americas) Inc. (the "Advisor") and its affiliates (together, the "Independent Trustees"), considered the continuation of the investment advisory agreements (the "Advisory Agreements") between the Trust and the Advisor for the UBS Dynamic Alpha Fund, UBS Global Allocation Fund, UBS International Sustainable Equity Fund, UBS U.S. Small Cap Growth Fund, UBS Total Return Bond Fund, UBS Municipal Bond Fund, UBS Emerging Markets Equity Opportunity Fund, UBS Engage For Impact Fund, UBS All China Equity Fund, and UBS Sustainable Development Bank Bond Fund (each a "Fund," and together, the "Funds"). Prior to the Meeting, the Independent Trustees' counsel had sent to the Advisor a request detailing the information that the Independent Trustees wished to receive in connection with their consideration of the continuation of the Advisory Agreements. The Independent Trustees met with their independent counsel, as well as an independent consultant engaged by the Board to assist in the annual Advisory Agreement review process on May 27, 2021 and June 3, 2021 to discuss the materials provided to them in response to the information request, including materials prepared by the Advisor, as well as reports prepared by Broadridge Financial Solutions, Inc. ("Broadridge Reports"), an independent statistical compilation company, providing comparative expense information on an actual and contractual basis and comparative performance information for the Funds. The Independent Trustees also reviewed information provided in response to their request for additional information from the Advisor in connection with the Advisory Agreements. The Board also made reference to information and material that had been provided to the Independent Trustees throughout the year at Board meetings.
At the Meeting, the Board considered a number of factors in connection with its deliberations concerning the continuation of the Advisory Agreement for each Fund, including: (i) the nature, extent, and quality of the services provided by the Advisor to the Fund; (ii) the performance of the Fund and the Advisor; (iii) the Fund's expenses, costs of the services to be provided and profits to be realized by the Advisor and its affiliates from the relationship with the Fund; and (iv) whether economies of scale are realized by the Advisor with respect to the Fund, as it grows larger, and the extent to which the economies of scale are reflected in the level of the management fees charged. As part of the Board's review of these factors, the Board received and considered information on the impact of COVID-19 on the Funds and the Funds' performance and operations.
Nature, extent, and quality of services.
In considering the nature, extent, and quality of the services provided by the Advisor to a Fund, the Board reviewed the material presented by the Advisor describing the various services provided to each Fund. The Board noted that in addition to investment management services, the Advisor provides each Fund with operational, legal, and compliance support. The Board also considered the scope and depth of the Advisor's organization and the experience and expertise of the professionals currently providing investment management and other services to the Funds. The Board considered that the Advisor was a well-established investment management organization employing investment personnel with significant experience in the investment management industry. The Board also considered the Advisor's in-house research capabilities, as well as other research services available to it, including research services available to the Advisor as a result of securities transactions effected for the Funds and the Advisor's other investment management clients, and noted that the Advisor had extensive global research capabilities. The Board also evaluated the Advisor's portfolio management process for each Fund, including the use of risk management techniques and the proprietary technologies utilized to structure the Fund's portfolio. The Board noted that various presentations had been made by investment personnel at Board meetings throughout the year concerning the Funds' investment performance and investment strategies, including the derivative strategies utilized by certain Funds.
The Board also noted and discussed the services that the Advisor and its affiliates provide to the Funds under other agreements with the Trust, including administration services provided by the Advisor, underwriting services provided by UBS Asset Management (US) Inc. ("UBS AM (US)"), and sub-transfer agency services provided by UBS Financial
188
The UBS Funds
Board approval of investment advisory agreements (continued)
Services Inc. ("UBS Financial Services"). In connection with the non-investment management services, the Board also considered the quarterly reports that the Advisor provides to the Board throughout the year pertaining to brokerage commissions, soft dollars, portfolio valuations, and Rule 12b-1 fees, among others. In addition, the Board considered the presentations provided with respect to distribution strategies for the Funds. The Board noted management's continuing endeavors and expenditures to address areas of heightened concern in the mutual fund industry, such as liquidity risk management. After analyzing the services provided by the Advisor to each Fund, both quantitatively and qualitatively, including the impact of these services on investment performance, the Board concluded that the nature, extent, and quality of services provided to each Fund were consistent with the operational requirements of each Fund, and met the needs of the Fund's shareholders.
Performance.
In evaluating the performance of each Fund, the Board analyzed the Broadridge Reports, which compared the performance of each Fund with other funds in its respective peer universe over various time periods. The Board also reviewed the memoranda provided by the Advisor providing an analysis of the markets and the Funds' performance during the past year. In reviewing the Broadridge Reports, the Board noted that for the one-year period ended February 28, 2021, the UBS U.S. Small Cap Growth Fund and UBS Engage For Impact Fund had appeared in the top performance quintile of their respective performance universe, and the UBS Global Allocation Fund and UBS Emerging Markets Equity Opportunity Fund had appeared in the second performance quintile of their respective performance universe. The Board also noted that for the one-year period ended February 28, 2021, the UBS Dynamic Alpha Fund appeared in the third performance quintile of its performance universe, the UBS Municipal Bond Fund appeared in the fourth performance quintile of its performance universe, and the UBS International Sustainable Equity Fund, UBS Total Return Bond Fund, and UBS Sustainable Development Bank Bond Fund appeared in the fifth performance quintile of their respective performance universe, with each such Fund's annualized total return below the median of its respective performance universe during such period. The Board noted that due to the recent commencement of operations of UBS All China Equity Fund the Fund did not have performance information to evaluate.
At the Board's request, the Advisor further addressed the performance data for the UBS Dynamic Alpha Fund, UBS Municipal Bond Fund, UBS International Sustainable Equity Fund, UBS Total Return Bond Fund, and UBS Sustainable Development Bank Bond Fund, each of which had Class P shares' performance ranking below the 50th percentile within its performance universe for the one-year period ended February 28, 2021.
In explaining the performance of the UBS Dynamic Alpha Fund for the one-year period ended February 28, 2021, the Advisor explained that performance was generally negatively impacted by relative currency trades. The Advisor further explained that since March 2020, the Fund participated in the rebound of certain assets. The Board noted the quarterly progress reports that had been provided at each Board meeting, at the Board's request, during the past year and the Fund's improved performance over the one-year period ended February 28, 2020 as compared to the Fund's longer-term performance.
In reviewing the performance of the UBS Municipal Bond Fund for the one-year period ended February 28, 2021, the Advisor explained that Fund's relative underperformance can primarily be attributed to Fund's underweight position in BAA-rated securities. The Advisor explained that yield curve steepening in the first quarter of 2021 and continued demand for lower-quality credit also contributed to the Fund's relative underperformance. The Advisor noted that the Fund had better long-term performance appearing in the first and second quintiles of its performance universe for the three- and five-year periods, respectively.
In explaining the performance of the UBS International Sustainable Equity Fund for the one-year period ended February 28, 2021, the Advisor explained that security selection and sector allocation detracted from the Fund's
189
The UBS Funds
Board approval of investment advisory agreements (continued)
relative performance. The Advisor noted that the Fund's Broadridge performance category had changed during the one-year period ended February 28, 2021 and explained that when compared to its prior category, the Fund had outperformed the median for the one-year period ended February 28, 2021. The Advisor compared the Fund's strategy and portfolio characteristics to its prior Broadridge category and explained reasons why comparisons to the Fund's prior Broadridge category were appropriate. The Advisor highlighted that the Fund's performance had improved as of April 30, 2021.
In reviewing the performance of the UBS Total Return Bond Fund for the one-year period ended February 28, 2021, the Advisor noted that the broad market's response in March 2020 to the COVID-19 pandemic largely explained the Fund's relative underperformance. The Advisor noted that the Fund's greater exposure to the asset backed securities and commercial mortgage backed securities sectors detracted from relative performance as these sectors were hit particularly hard due to lock downs due to the COVID-19 pandemic. The Advisor explained that the Fund's longer duration and yield curve positioning also hindered the Fund's relative one-year performance.
In evaluating the performance of the UBS Sustainable Development Bank Bond Fund for the one-year period ended February 28, 2021, the Advisor explained that the Fund's performance universe is defined to include funds that invest primarily in US dollar and non-US dollar denominated debt securities of issuers located in at least 3 countries, whereas the Fund generally invests in a more narrow investment mandate that consists of US dollar-denominated bonds issued by multiple development banks, which are supranational entities, and the Fund will typically be expected to track the performance of high-quality US government bonds. The Advisor further explained that the Fund's peer ranking will generally be driven by the ability of other funds in the category to capitalize on the direction of credit spreads and exchange rates relative to the movements of US Treasury yields, a strategy that the Fund does not employ due to its more narrow investment mandate.
The Board concluded that the Advisor's explanations provided a sound basis for understanding the performance of each Fund that underperformed in comparison to its peer universe. The Board determined, after analyzing the performance data, that the performance of each Fund was acceptable as compared with relevant performance standards, given the investment strategies and risk profile of each Fund, the expectations of the shareholder base and the current market environment.
Fund fees and expenses.
When considering the fees and expenses borne by each Fund, and the reasonableness of the management fees paid to the Advisor in light of the services provided to each Fund, the Board compared the fees charged by the Advisor to each Fund to fees charged to the funds in its peer group for comparable services, as provided in the Broadridge Reports, on both an actual (taking into account expense limitation arrangements) and a contractual basis (assuming all funds in the peer expense group were similar in size to the respective Fund).
In examining the Broadridge Reports, and in reviewing comparative costs, it was noted that UBS Dynamic Alpha Fund, UBS Emerging Markets Equity Opportunity Fund, UBS All China Equity Fund, UBS Municipal Bond Fund, and UBS Sustainable Development Bank Bond Fund had a contractual management fee rate lower than or equal to the Broadridge median of its respective expense group. The Board noted that UBS International Sustainable Equity Fund, UBS Global Allocation Fund, UBS U.S. Small Cap Growth Fund, UBS Total Return Bond Fund, and UBS Engage For Impact Fund had a contractual management fee rate higher than the Broadridge median in its respective Broadridge expense group. The Advisor noted, however, that the results of such expense comparisons showed that the actual management fee rate for each Fund, except the UBS International Sustainable Equity Fund, was lower than or equal to the Broadridge median of the Fund's respective Broadridge expense group. In addition, the Board reviewed the actual total expenses of each Fund and noted that each Fund had total expenses that were equal to, or lower than, the Broadridge median in its respective Broadridge expense group, except for the UBS International
190
The UBS Funds
Board approval of investment advisory agreements (continued)
Sustainable Equity Fund and UBS Total Return Bond Fund. After reviewing the fee and expense information, the Board asked the Advisor to further discuss the fees and expenses of the UBS International Sustainable Equity Fund and UBS Total Return Bond Fund.
The Advisor first addressed the UBS International Sustainable Equity Fund, which reported contractual management fees, actual management fees, and total expenses that were higher than the Broadridge peer group median. The Advisor highlighted its belief that the Fund remains competitive with its current expense cap in place, as shown by the Fund's Class P actual total expense ranking in the third quintile of its expense group.
The Advisor next addressed the UBS Total Return Bond Fund, which had reported contractual management fees and total expenses that were higher than the Broadridge peer group median. The Advisor explained that it was waiving the Fund's actual advisory and administration fees in their entirety. The Advisor highlighted that the Fund's actual total expenses were only one basis point (i.e., 0.01%) above the Fund's expense group peer median.
The Board also received and considered information about the fee rates charged to other funds and accounts that are managed by the Advisor. After discussing the information about the other funds and accounts with the Advisor, the Board determined that the fees charged by the Advisor to the Funds were within a reasonable range, giving effect to differences in services performed for such other funds and accounts as compared to such fee rates. The Board, after reviewing all pertinent material, concluded that the management fee payable under each Fund's Advisory Agreement was fair and reasonable, both on an absolute basis and in comparison with the fees of other funds identified in its expense group.
Costs and profitability.
The Board considered the costs of providing services to the Funds and the profitability of the Funds to the Advisor and its affiliates by reviewing the profitability analysis provided by the Advisor, including information about its fee revenues and expenses. The Board reviewed the profitability of each Fund to the Advisor and its affiliates, and the compensation that was received for providing services to each Fund. The profitability analysis, which provided information for the last three calendar years, included schedules relating to the revenue and expenses attributable to: (i) the investment advisory and administration services provided by the Advisor; (ii) the distribution and shareholder services provided by UBS AM (US) and UBS Financial Services; (iii) the transfer agency-related services provided by UBS Financial Services; and (iv) all services provided by the Advisor, UBS AM (US), and UBS Financial Services shown on a consolidated basis. In discussing the profitability analysis with the Board, the Advisor, as requested by the Board, provided the Board with a presentation on the methodology utilized in the profitability analysis. The Board noted that the methodology used for the profitability analysis provided to the Board for purposes of its annual review of the Advisory Agreements was reasonable. The Advisor also explained to the Board the reasons for any changes in profitability of each Fund from last calendar year to this calendar year.
The Board also considered "fallout" or ancillary benefits to the Advisor or its affiliates as the result of their relationship with the Funds; for example, the ability to attract other clients due to the Advisor's role as investment advisor to the Funds and the research services available to the Advisor through soft dollar brokerage commissions. The Independent Trustees also considered the ancillary benefits received by the Advisor's affiliates, UBS Securities LLC and UBS Group AG, in the form of commissions for executing securities transactions for the Funds. Upon closely examining the information provided concerning the Advisor's profitability, the Board concluded that the level of profits realized by the Advisor and its affiliates with respect to each Fund, if any, was reasonable in relation to the nature and quality of the services that were provided.
191
The UBS Funds
Board approval of investment advisory agreements (concluded)
Economies of scale.
The Board also discussed whether economies of scale are realized by the Advisor with respect to each Fund as it grows larger, and the extent to which this is reflected in the level of management fees charged. The Board noted that with respect to most Funds, any actual or potential economies of scale are, or will be, shared with the Fund and its shareholders through existing management fee breakpoints so that as the Fund grows in size, its effective management fee declines. The Board noted that each Fund, except the UBS Engage for Impact Fund, UBS Total Return Bond Fund, and UBS Municipal Bond Fund, had a breakpoint schedule that provided for continuing breakpoints past the current asset level for the Fund. Based on each Fund's fees and expenses and the Advisor's profitability analysis, the Board concluded that any actual or potential economies of scale would be reasonably shared with a Fund and its shareholders.
After full consideration of the factors discussed above, with no single factor identified as being of paramount importance, the Board, including a majority of the Independent Trustees, with the assistance of independent counsel, concluded that the continuation of the Advisory Agreement for each Fund was in the interests of the Fund and its shareholders.
192
The UBS Funds
Trustee and officer information (unaudited)
The Trust is a Delaware statutory trust. Under Delaware law, the Board has overall responsibility for managing the business and affairs of the Trust, including general supervision and review of its investment activities. The trustees elect the officers of the Trust, who are responsible for administering the day-to-day operations of the Trust and the Funds.
The table below shows, for each trustee and officer, his or her name, address and age, the position held with the Trust, the length of time served as a trustee or officer of the Trust, the trustee's or officer's principal occupations during the last five years, the number of funds in the UBS Family of Funds overseen by the trustee or officer and other directorships held by such trustee.
The Trust's Statement of Additional Information contains additional information about the trustees and is available, without charge, upon request, by calling 1-800-647 1568.
Non-interested Trustees
| Name, address and age | Position(s) held with Trust | Term of office1 and length of time served | Principal occupation(s) during past 5 years | Number of portfolios in fund complex overseen by Trustee | Other directorships held by Trustee | ||||||||||||||||||
| Adela Cepeda; 63 c/o Keith A. Weller, Fund Secretary, UBS AM One North Wacker Drive Chicago, IL 60606 | Trustee | Since 2004 | Ms. Cepeda was a managing director at PFM Financial Advisors LLC (From 2016 to December 2019). From 1995 to 2016, Ms. Cepeda was founder and president of A.C. Advisory, Inc. | Ms. Cepeda is a trustee of three investment companies (consisting of 13 portfolios) for which UBS AM serves as investment advisor or manager. | Ms. Cepeda is a director (since 2012) of BMO Financial Corp. (U.S. holding company for BMO Harris Bank N.A.), director of the Mercer Funds (9 portfolios) (since 2005) and trustee of the Morgan Stanley Pathway Funds (11 portfolios) (since 2008). | ||||||||||||||||||
| Muhammad Gigani; 43 c/o Keith A. Weller, Fund Secretary, UBS AM One North Wacker Drive Chicago, IL 60606 | Trustee | Since January 2021 | Mr. Gigani is a Vice President—Tax of Reyes Holdings, L.L.C. (global food and beverage company) (since 2018). Formerly, Mr. Gigani held various positions at Deloitte Tax, LLP (from 2002 to 2018, most recently serving as a partner (from 2014 to 2018)). Mr. Gigani was a board member of Junior Achievement of Chicago (non-profit) (from 2016 to 2018). Mr. Gigani was also finance chair of Latin United Community Housing Association (non-profit) (from 2016 to 2018). Mr. Gigani is a Certified Public Accountant (CPA). | Mr. Gigani is a trustee of three investment companies (consisting of 13 portfolios) for which UBS AM serves as investment advisor or manager. | None. | ||||||||||||||||||
193
The UBS Funds
Trustee and officer information (unaudited)
Non-interested Trustees (continued)
| Name, address and age | Position(s) held with Trust | Term of office1 and length of time served | Principal occupation(s) during past 5 years | Number of portfolios in fund complex overseen by Trustee | Other directorships held by Trustee | ||||||||||||||||||
| Abbie J. Smith; 68 c/o Keith A. Weller, Fund Secretary, UBS AM One North Wacker Drive Chicago, IL 60606 | Trustee | Since 2009 | Ms. Smith is the Boris and Irene Stern Distinguished Service Professor of Accounting and James S. Ely, III Faculty Fellow in the University of Chicago Booth School of Business (since 1980). Formerly, Ms. Smith was a co-founding partner and Director of Research of Fundamental Investment Advisors, a hedge fund (co-founded in 2004, commenced operations in 2008) (from 2008 to 2010). | Ms. Smith is a trustee of three investment companies (consisting of 13 portfolios) for which UBS AM serves as investment advisor or manager. | Ms. Smith is a director (since 2000) of HNI Corporation (formerly known as HON Industries Inc.) (office furniture) and a director and also a member of the audit committee (since 2017). Ms. Smith was also chair (until 2015) of the audit committee of Ryder System Inc. (transportation, logistics and supply-chain management). In addition, Ms. Smith is a trustee/director (since 2000) and a member of the audit committee of the Dimensional Funds complex (132 portfolios and of Dimensional ETF Trust). | ||||||||||||||||||
| Frank K. Reilly; 85 c/o Keith A. Weller, Fund Secretary, UBS AM One North Wacker Drive Chicago, IL 60606 | Chairman and Trustee | Since 1992 | Mr. Reilly is the Bernard J. Hank Professor Emeritus of Finance in the Mendoza College of Business at the University of Notre Dame (since 1982), and is a Chartered Financial Analyst (CFA). | Mr. Reilly is a trustee of three investment companies (consisting of 13 portfolios) for which UBS AM serves as investment advisor or manager. | Mr. Reilly is a director (since 1994) of Discover Bank which is a subsidiary of Discover Financial Services, and Mr. Reilly is chairman of the audit and risk committee for Discover Bank. | ||||||||||||||||||
194
The UBS Funds
Trustee and officer information (unaudited)
Officers
| Name, address and age | Position(s) held with Trust | Term of office1 and length of time served | Principal occupation(s) during past 5 years; number of portfolios in fund complex for which person serves as officer | ||||||||||||
| Rose Ann Bubloski*; 53 | Vice President and Assistant Treasurer | Since 2011 | Ms. Bubloski is a director (since 2012) (prior to which she was an associate director (from 2008 to 2012)) and senior manager of fund accounting—US (previously named product control and investment support) of UBS Asset Management (Americas) Inc. and/or UBS Asset Management (US) Inc. ("UBS AM—Americas region.") She is vice president and assistant treasurer of 8 investment companies (consisting of 58 portfolios) for which UBS AM serves as investment advisor or manager. | ||||||||||||
| Franklin P. Dickson*; 43 | Vice President | Since 2017 | Mr. Dickson is an associate director (since 2015) and tax compliance manager (since 2017) (prior to which he was a product controller (from 2015 to 2017) of fund accounting—US (previously named product control and investment support) of UBS AM—Americas region. Mr. Dickson is a vice president of 8 investment companies (consisting of 58 portfolios) for which UBS AM serves as investment advisor or manager. | ||||||||||||
| Mark F. Kemper**; 63 | Vice President and Assistant Secretary | Since 1999 and 2019, respectively | Mr. Kemper is a managing director (since 2006) and senior legal counsel (October 2019-March 2020 and April 2021 to present), (prior to which he was Interim Head of Asia Pacific Legal (March 2020-March 2021), Interim Head of Compliance and Operational Risk Control (from June 2019 through September 2019) and general counsel of UBS AM—Americas region (from 2004-March 2019)). He has been secretary of UBS AM— Americas region (since 2004) and assistant secretary of UBS Asset Management Trust Company (since 1993). Mr. Kemper is vice president and assistant secretary of 8 investment companies (consisting of 58 portfolios) for which UBS AM serves as investment advisor or manager. Mr. Kemper is employed by UBS Business Solutions US LLC (since 2017). | ||||||||||||
| Joanne M. Kilkeary*; 53 | Vice President, Treasurer and Principal Accounting Officer | Since 2006 (Vice President) and Since 2017 (Treasurer and Principal Accounting Officer) | Ms. Kilkeary is an executive director (since 2013) (prior to which she was a director (from 2008 to 2013) and head of fund accounting—US (since November 2020) (prior to which she was head of regulatory, tax, audit and board governance for product control and investment support (from 2017 through October 2020) (prior to which she was a senior manager (from 2004 to 2017) of registered fund product control of UBS AM—Americas region). Ms. Kilkeary is a vice president and assistant treasurer of 8 investment companies (consisting of 58 portfolios) for which UBS AM serves as investment advisor or manager. | ||||||||||||
| Igor Lasun*; 42 | President | Since 2018 | Mr. Lasun Is managing director (since March 2021) (prior to which he was an executive director (from 2018 until February 2021) and head of fund development and management for UBS AM—Americas region (since 2018) (prior to which he was a senior fixed income product specialist from 2007 to 2018, and had joined the firm in 2005). In this role, he oversees development and management for both wholesale and Institutional businesses. Mr. Lasun serves as president of 7 investment companies (consisting of 57 portfolios) for which UBS AM serves as Investment advisor or manager. | ||||||||||||
| Frank S. Pluchino*; 61 | Chief Compliance Officer | Since 2018 | Mr. Pluchino is an executive director with UBS Business Solutions US LLC and is also the chief compliance officer of UBS Hedge Fund Solutions LLC (since 2010). Mr. Pluchino serves as chief compliance officer of 11 investment companies (consisting of 61 portfolios) for which UBS AM or one of its affiliates serves as investment advisor or manager. | ||||||||||||
195
The UBS Funds
Trustee and officer information (unaudited)
Officers (concluded)
| Name, address and age | Position(s) held with Trust | Term of office1 and length of time served | Principal occupation(s) during past 5 years; number of portfolios in fund complex for which person serves as officer | ||||||||||||
| Eric Sanders**; 55 | Vice President and Assistant Secretary | Since 2005 | Mr. Sanders is a director and associate general counsel with UBS Business Solutions US LLC (since 2017) and also with UBS AM—Americas region (since 2005). Mr. Sanders is a vice president and assistant secretary of 8 investment companies (consisting of 58 portfolios) for which UBS AM serves as investment advisor or manager. | ||||||||||||
| Philip Stacey**; 36 | Vice President and Assistant Secretary | Since 2018 | Mr. Stacey is an executive director and associate general counsel with UBS Business Solutions US LLC (since 2019) and also with UBS AM—Americas region since 2015. Mr. Stacey is a vice president and assistant secretary of 7 investment companies (consisting of 57 portfolios) for which UBS AM serves as investment advisor or manager. | ||||||||||||
| Keith A. Weller**; 60 | Vice President and Secretary | Since 2004 (Vice President) and Since 2019 (Secretary) | Mr. Weller is an executive director (since 2017) and deputy general counsel (since 2019) (prior to which he was senior associate general counsel) with UBS Business Solutions US LLC and also with UBS AM—Americas region (since 2005) and has been an attorney with affiliated entities since 1995. Mr. Weller is a vice president and assistant secretary of 8 investment companies (consisting of 58 portfolios) for which UBS AM serves as investment advisor or manager. | ||||||||||||
* This person's business address is 787 Seventh Avenue, New York, NY 10019
** This person's business address is One North Wacker Drive, Chicago, IL 60606.
1 Each trustee holds office for an indefinite term. Officers of the Trust are appointed by the trustees and serve at the pleasure of the Board.
196
The UBS Funds
Funds' privacy notice
This notice describes the privacy policy of the UBS Family of Funds, the PACE Funds and all closed-end funds man- aged by UBS AM (collectively, the "Funds"). The Funds are committed to protecting the personal information that they collect about individuals who are prospective, current or former investors.
The Funds collect personal information in order to process requests and transactions and to provide customer serv- ice. Personal information, which is obtained from applications and other forms or correspondence submitted to the Funds, may include name(s), address, e-mail address, telephone number, date of birth, social security number or other tax identification number, bank account information, information about your transactions and experiences with the Funds, and any affiliation a client has with UBS Financial Services Inc. or its affiliates ("Personal Information").
The Funds limit access to Personal Information to those individuals who need to know that information in order to process transactions and service accounts. These individuals are required to maintain and protect the confidentiality of Personal Information and to follow established procedures. The Funds maintain physical, electronic and proce- dural safeguards to protect Personal Information and to comply with applicable laws and regulations. The Funds may share Personal Information with their affiliates to facilitate the servicing of accounts and for other business purposes, or as otherwise required or permitted by applicable law. The Funds may also share Personal Information with non-affiliated third parties that perform services for the Funds, such as vendors that provide data or transaction processing, computer software maintenance and development, and other administrative services. When the Funds share Personal Information with a non-affiliated third party, they will do so pursuant to a contract that includes pro- visions designed to ensure that the third party will uphold and maintain privacy standards when handling Personal Information. In addition to sharing information with non-affiliated third parties to facilitate the servicing of accounts and for other business purposes, the Funds may disclose Personal Information to non-affiliated third parties as oth- erwise required or permitted by applicable law. For example, the Funds may disclose Personal Information to credit bureaus or regulatory authorities to facilitate or comply with investigations; to protect against or prevent actual or potential fraud, unauthorized transactions, claims or other liabilities; or to respond to judicial or legal process, such as subpoena requests.
Except as described in this privacy notice, the Funds will not use Personal Information for any other purpose unless the Funds describe how such Personal Information will be used and clients are given an opportunity to decline approval of such use of Personal Information relating to them (or affirmatively approve the use of Personal Information, if required by applicable law). The Funds endeavor to keep their customer files complete and accurate. The Funds should be notified if any Personal Information needs to be corrected or updated. Please call 1-800-647 1568 with any questions or concerns regarding your Personal Information or this privacy notice.
Privacy Notice
This privacy notice is not a part of the shareholder report.
This page intentionally left blank.
PRESORTED
STANDARD
U.S. POSTAGE
PAID
COMPUTERSHARE

UBS Asset Management (Americas) Inc.
1285 Avenue of the Americas
New York, NY 10019-6028
S1197
| (b) | Copy of each notice transmitted to shareholders in reliance on Rule 30e-3 under the Investment Company Act of 1940, as amended (the "1940 Act"), that contains disclosures specified by paragraph (c)(3) of that rule: Not applicable to the registrant. |
Item 2. Code of Ethics.
The registrant has adopted a code of ethics that applies to its principal executive officer, principal financial officer, principal accounting officer or controller, or persons performing similar functions pursuant to Section 406 of the Sarbanes-Oxley Act of 2002. (The registrant has designated the code of ethics adopted pursuant to Sarbanes-Oxley as a “Code of Conduct” to lessen the risk of confusion with its separate code of ethics adopted pursuant to Rule 17j-1 under the 1940 Act.).
Item 3. Audit Committee Financial Expert.
The registrant’s Board has determined that the following person serving on the registrant’s Audit Committee is an “audit committee financial expert” as defined in item 3 of Form N-CSR: Adela Cepeda. Ms. Cepeda is independent as defined in item 3 of Form N-CSR.
Item 4. Principal Accountant Fees and Services.
| (a) | Audit Fees: |
For the fiscal years ended June 30, 2021 and June 30, 2020, the aggregate Ernst & Young LLP (E&Y) audit fees for professional services rendered to the registrant were approximately $634,022 and $563,572, respectively.
Fees included in the audit fees category are those associated with the annual audits of financial statements and services that are normally provided in connection with statutory and regulatory filings.
| (b) | Audit-Related Fees: |
In each of the fiscal years ended June 30, 2021 and June 30, 2020, the aggregate audit-related fees billed by E&Y for services rendered to the registrant that are reasonably related to the performance of the audits of the financial statements, but not reported as audit fees, were approximately $31,866 and $26,046 respectively.
Fees included in the audit-related fees category are those associated with the reading and providing of comments on the 2020 and 2019 semiannual financial statements.
There were no audit-related fees required to be approved pursuant to paragraph (c)(7)(ii) of Rule 2-01 of Regulation S-X during the fiscal years indicated above.
| (c) | Tax Fees: |
In each of the fiscal years ended June 30, 2021 and June 30, 2020, the aggregate tax fees billed by E&Y for professional services rendered to the registrant were approximately $118,590 and $113,288, respectively.
Fees included in the tax fees category comprise all services performed by professional staff in the independent accountant’s tax division except those services related to the audits. This category comprises fees for review of tax compliance, tax return preparation and excise tax calculations.
There were no tax fees required to be approved pursuant to paragraph (c)(7)(ii) of Rule 2-01 of Regulation S-X during the fiscal years indicated above.
| (d) | All Other Fees: |
In each of the fiscal years ended June 30, 2021 and June 30, 2020, there were no fees billed by E&Y for products and services, other than the services reported in Item 4(a)-(c) above, rendered to the registrant.
Fees included in all other fees category would consist of services related to internal control reviews, strategy and other consulting, financial information systems design and implementation, consulting on other information systems, and other tax services unrelated to the registrant.
There were no “all other fees” required to be approved pursuant to paragraph (c)(7)(ii) of Rule 2-01 of Regulation S-X during the fiscal years indicated above.
| (e) | (1) Audit Committee Pre-Approval Policies and Procedures: |
The Audit Committee Charter contains the Audit Committee’s pre-approval policies and procedures. Reproduced below is an excerpt from the Audit Committee Charter regarding pre-approval policies and procedures:
To carry out its purposes, the Audit Committee shall have the following duties and powers:
(a) To pre-approve the engagement of, and to recommend to the Board the engagement, retention or termination of, the independent auditors to provide audit, review or attest services to The UBS Funds, and, in connection therewith, to review and evaluate the capabilities and independence of the auditors and receive the auditors’ specific representations as to their independence. In evaluating the auditor’s qualifications, performance and independence, the Committee must, among other things, obtain and review a report by the auditors, at least annually, describing the following items: (i) all relationships between the independent auditors and The UBS Funds, as well as with The UBS Funds' investment advisor or any control affiliate of the investment advisor that provides ongoing services to The UBS Funds; (ii) any material issues raised by the most recent internal quality control review, or peer review, of the audit firm, or by any inquiry or investigation by governmental or professional authorities, within the preceding five years, with respect to one or more independent audits carried out by the firm, and any steps taken to deal with any such issues; and (iii) the audit firm’s internal quality control procedures.
(b) To pre-approve all non-audit services to be provided to The UBS Funds by the independent auditors when, without such pre-approval, the auditors would not be independent of The UBS Funds under applicable federal securities laws, rules or auditing standards.
(c) To pre-approve all non-audit services to be provided by The UBS Funds’ independent auditors to The UBS Funds’ investment advisor or to any entity, that controls, is controlled by or is under common control with The UBS Funds investment advisor (“advisor affiliate”) and that provides ongoing services to The UBS Funds when, without such pre-approval by the Committee, the auditors would not be independent of The UBS Funds under applicable federal securities laws, rules or auditing standards.
(d) To establish, if deemed necessary or appropriate as an alternative to Committee pre-approval of services to be provided by the independent auditors as required by paragraphs (b) and (c) above, policies and procedures to permit such services to be pre-approved by other means, such as by action of a designated member or members of the Committee, subject to subsequent Committee review or oversight.
(e) To consider whether the non-audit services provided by The UBS Funds’ independent auditor to The UBS Funds investment advisor or any advisor affiliate that provides on-going services to The UBS Funds, which services were not pre-approved by the Committee, are compatible with maintaining the auditors’ independence.
Pursuant to Section (d), the Committee has delegated its responsibility to pre-approve the audit and permissible non-audit services required by paragraphs (a), (b) and (c) of Section 4, not exceeding $100,000 (excluding reasonable out-of-pocket expenses) on an annual basis to the Chairperson. All such pre-approvals will be subject to subsequent Committee review or oversight, including being reported to the full Committee on a quarterly basis at the Committee’s next regularly scheduled meeting after pre-approval. The Committee may not delegate to management its responsibility to pre-approve services to be performed by the independent auditor. Requests or applications to provide services that require specific pre-approval by the Committee, or the Chairperson will be submitted by both the Fund’s independent auditors and the Fund’s Treasurer or other designated Fund officer and must include a joint statement as to whether, in their view, the request or application is consistent with U.S. Securities and Exchange Commission rules on auditor independence.
(e) (2) Services approved pursuant to paragraph (c)(7)(i)(C) of Rule 2-01 of Regulation S-X:
Audit-Related Fees:
There were no amounts that were approved by the audit committee pursuant to the de minimis exception for the fiscal years ended June 30, 2021 and June 30, 2020 on behalf of the registrant.
There were no amounts that were required to be approved by the audit committee pursuant to the de minimis exception for the fiscal years ended June 30, 2021 and June 30, 2020 on behalf of the registrant’s service providers that relate directly to the operations and financial reporting of the registrant.
Tax Fees:
There were no amounts that were approved by the audit committee pursuant to the de minimis exception for the fiscal years ended June 30, 2021 and June 30, 2020 on behalf of the registrant.
There were no amounts that were required to be approved by the audit committee pursuant to the de minimis exception for the fiscal years ended June 30, 2021 and June 30, 2020 on behalf of the registrant’s service providers that relate directly to the operations and financial reporting of the registrant.
All Other Fees:
There were no amounts that were approved by the audit committee pursuant to the de minimis exception for the fiscal years ended June 30, 2021 and June 30, 2020 on behalf of the registrant.
There were no amounts that were required to be approved by the audit committee pursuant to the de minimis exception for the fiscal years ended June 30, 2021 and June 30, 2020 on behalf of the registrant’s service providers that relate directly to the operations and financial reporting of the registrant.
| (f) | For the fiscal year ended June 30, 2021, if greater than 50%, specify the percentage of hours spent on the audit of the registrant’s financial statements for the most recent fiscal year that were attributed to work performed by persons who are not full-time, permanent employees of E&Y. According to E&Y, such amount was below 50%, therefore disclosure item not applicable to this filing. |
| (g) | For the fiscal years ended June 30, 2021 and June 30, 2020, the aggregate fees billed by E&Y of $402,196 and $391,074, respectively, for non-audit services rendered on behalf of the registrant (“covered”), its investment adviser (not including any sub-adviser whose role is primarily portfolio management and is subcontracted with or overseen by another investment adviser) and any entity controlling, controlled by, or under common control with the adviser (“non-covered”) that provides ongoing services (or provided during the relevant fiscal period) to the registrant for each of the last two fiscal years of the registrant is shown in the table below: |
| 2021 | 2020 | |||||||
| Covered Services | $ | 150,456 | $ | 139,334 | ||||
| Non-Covered Services | $ | 251,740 | $ | 251,740 | ||||
(h) The registrant’s audit committee was not required to consider whether the provision of non-audit services that were rendered to the registrant’s investment adviser (not including any sub-adviser whose role is primarily portfolio management and is subcontracted with or overseen by another investment adviser), and any entity controlling, controlled by, or under common control with the investment adviser that provides ongoing services to the registrant that were not pre-approved pursuant to paragraph (c)(7)(ii) of Rule 2-01 of Regulation S-X is compatible with maintaining the principal accountant’s independence.
Item 5. Audit Committee of Listed Registrants.
Not applicable to the registrant.
Item 6. Investments.
(a) Included as part of the report to shareholders filed under Item 1 of this form.
(b) Not applicable.
Item 7. Disclosure of Proxy Voting Policies and Procedures for Closed-End Management Investment Companies.
Not applicable to the registrant.
Item 8. Portfolio Managers of Closed-End Management Investment Companies.
Not applicable to the registrant.
Item 9. Purchases of Equity Securities by Closed-End Management Investment Company and Affiliated Purchasers.
Not applicable to the registrant.
Item 10. Submission of Matters to a Vote of Security Holders.
The Nominating, Compensation and Governance Committee will consider nominees recommended by Qualifying Fund Shareholders if an Independent Trustee vacancy on the Board occurs. A Qualifying Fund Shareholder is a shareholder that: (i) owns of record, or beneficially through a financial intermediary, 1/2 of 1% or more of the Trust's outstanding shares and (ii) has been a shareholder of at least 1/2 of 1% of the Trust's total outstanding shares for 12 months or more prior to submitting the recommendation to the Nominating Committee. In order to recommend a nominee, a Qualifying Fund Shareholder should send a letter to the chairperson of the Nominating Committee, Ms. Adela Cepeda, care of Keith A. Weller, the Secretary of The UBS Funds at UBS Asset Management, One North Wacker Drive, Chicago, Illinois 60606, and indicate on the envelope "Nominating Committee." The Qualifying Fund Shareholder's letter should include: (i) the name and address of the Qualifying Fund Shareholder making the recommendation; (ii) the number of shares of each class and series of shares of the Trust which are owned of record and beneficially by such Qualifying Fund Shareholder and the length of time that such shares have been so owned by the Qualifying Fund Shareholder; (iii) a description of all arrangements and understandings between such Qualifying Fund Shareholder and any other person or persons (naming such person or persons) pursuant to which the recommendation is being made; (iv) the name and address of the nominee; and (v) the nominee's resume or curriculum vitae. The Qualifying Fund Shareholder's letter must be accompanied by a written consent of the individual to stand for election if nominated for the Board and to serve if elected by shareholders.
Item 11. Controls and Procedures.
| (a) | The registrant’s principal executive officer and principal financial officer have concluded that the registrant’s disclosure controls and procedures (as defined in Rule 30a-3(c) under the Investment Company Act of 1940, as amended) are effective based on their evaluation of these controls and procedures as of a date within 90 days of the filing date of this document. |
| (b) | The registrant’s principal executive officer and principal financial officer are aware of no changes in the registrant’s internal control over financial reporting that occurred during the period covered by this report that has materially affected, or is reasonably likely to materially affect, the registrant’s internal control over financial reporting. |
Item 12. Disclosure of Securities Lending Activities for Closed-End Management Investment Companies.
Not applicable to the registrant.
Item 13. Exhibits.
| (a) | (1) Code of Ethics as required pursuant to Section 406 of the Sarbanes-Oxley Act of 2002 (and designated by registrant as a “Code of Conduct”) is filed herewith as Exhibit EX-99. CODE ETH. |
| (a) | (2) Certifications of principal executive officer and principal financial officer pursuant to Section 302 of the Sarbanes-Oxley Act of 2002 are attached hereto as Exhibit EX-99. CERT. |
| (a) | (3) Written solicitation to purchase securities under Rule 23c-1 under the Investment Company Act of 1940 sent or given during the period covered by the report by or on behalf of the registrant to 10 or more persons – not applicable to the registrant. |
| (a) | (4) Change in the registrant's independent public accountant – Not applicable to the registrant. |
| (b) | Certifications of principal executive officer and principal financial officer pursuant to Section 906 of the Sarbanes-Oxley Act of 2002 are attached hereto as Exhibit EX-99.906CERT. |
| (c) | Disclosure pursuant to Section 13(r) of the Securities Exchange Act of 1934, as amended, is attached hereto as Exhibit EX-99. IRANNOTICE. |
SIGNATURES
Pursuant to the requirements of the Securities Exchange Act of 1934 and the Investment Company Act of 1940, the registrant has duly caused this report to be signed on its behalf by the undersigned, thereunto duly authorized.
The UBS Funds
| By: | /s/ Igor Lasun | |
| Igor Lasun | ||
| President | ||
| Date: | January 11, 2022 |
Pursuant to the requirements of the Securities Exchange Act of 1934 and the Investment Company Act of 1940, this report has been signed below by the following persons on behalf of the registrant and in the capacities and on the dates indicated.
| By: | /s/ Igor Lasun | |
| Igor Lasun | ||
| President | ||
| Date: | January 11, 2022 | |
| By: | /s/ Joanne M. Kilkeary | |
| Joanne M. Kilkeary | ||
| Vice President, Treasurer and Principal Accounting Officer | ||
| Date : | January 11, 2022 |