North American Palladium Ltd.
TABLE OF CONTENTS
| Page | |
| Management’s Discussion and Analysis | |
| INTRODUCTION | 1 |
| FORWARD-LOOKING INFORMATION | 1 |
| CAUTIONARY NOTE TO U.S. INVESTORS CONCERNING MINERAL RESERVES AND RESOURCES | 2 |
| OUR BUSINESS | 2 |
| KEY HIGHLIGHTS | 3 |
| EXECUTIVE SUMMARY | 4 |
| FINANCIAL REVIEW | 8 |
| FINANCIAL CONDITION, CASH FLOWS, LIQUIDITY AND CAPITAL RESOURCES | 13 |
| OUTSTANDING SHARE DATA | 16 |
| REVIEW OF OPERATIONS | 16 |
| EXPLORATION UPDATE | 20 |
| FUTURE ACCOUNTING STANDARDS | 27 |
| RISKS AND UNCERTAINTIES | 30 |
| INTERNAL CONTROLS | 30 |
| OTHER INFORMATION | 31 |
| NON-IFRS MEASURES | 31 |
North American Palladium Ltd.
Management’s Discussion and Analysis
INTRODUCTION
Unless the context suggests otherwise, references to “NAP” or the “Company” or similar terms refer to North American Palladium Ltd. and its subsidiaries. “LDI” refers to Lac des Iles Mines Ltd., and “Cadiscor” refers to Cadiscor Resources Inc. On March 4, 2011, the name Cadiscor Resources Inc., was changed to NAP Quebec Mines Ltd.
The following is management’s discussion and analysis (“MD&A”) of the financial condition and results of operations to enable readers of the Company’s consolidated financial statements and related notes to assess material changes in financial condition and results of operations for the quarter ended March 31, 2011, compared to those of the respective periods in the prior years. This MD&A has been prepared as of May 9, 2011 and is intended to supplement and complement the unaudited consolidated financial statements and notes thereto for the quarter ended March 31, 2011 (collectively, the “Financial Statements”). Readers are encouraged to review the Financial Statements in conjunction with their review of this MD&A and the most recent Form 40-F/Annual Information Form on file with the US Securities and Exchange Commission (“SEC”) and Canadian provincial securities regulatory authorities, available at www.sec.gov and www.sedar.com, respectively.
All amounts are in Canadian dollars unless otherwise noted and all references to production ounces refer to payable production.
FORWARD-LOOKING INFORMATION
Certain information included in this MD&A, including any information as to the Company’s future financial or operating performance and other statements, which include future oriented financial information, that express management’s expectations or estimates of future performance, constitute ‘forward looking statements’ within the meaning of the ‘safe harbor’ provisions of the United States Private Securities Litigation Reform Act of 1995 and Canadian securities laws. The words ‘expect’, ‘believe’, ‘will’, ‘intend’, ‘estimate’, ‘plan’, ‘targeting’, ‘goal’, ‘vision’ and similar expressions identify forward-looking statements. Forward-looking statements are necessarily based upon a number of estimates and assumptions that, while considered reasonable by management, are inherently subject to significant business, economic and competitive uncertainties, risks and contingencies. The Company cautions the reader that such forward-looking statements involve known and unknown risks, uncertainties and other factors that may cause the actual financial results, performance or achievements of the Company to be materially different from the Company’s estimated future results, performance or achievements expressed or implied by those forward-looking statements and that the forward-looking statements are not guarantees of future performance. These statements are also based on certain factors and assumptions including factors and assumptions related to future prices of palladium, gold and other metals, the Canadian dollar exchange rate, the ability of the Company to meet operating cost estimates, inherent risks associated with mining and processing, as well as those estimates, risks, assumptions and factors described in the Company’s most recent Form 40-F/Annual Information Form on file with the SEC and Canadian provincial securities regulatory authorities. In addition, there can be no assurance that the Company’s Lac des Iles and Sleeping Giant mines will operate as anticipated, or that the other properties can be successfully developed. The Company disclaims any obligation to update or revise any forward-looking statements, whether as a result of new information, events or otherwise, except as expressly required by law. Readers are cautioned not to put undue reliance on these forward-looking statements.
FIRST QUARTER REPORT 2011
1
North American Palladium Ltd.
CAUTIONARY NOTE TO U.S. INVESTORS CONCERNING MINERAL RESERVES AND RESOURCES
Mineral reserve and mineral resource information contained herein has been calculated in accordance with National Instrument 43-101 – Standards of Disclosure for Mineral Projects, as required by Canadian provincial securities regulatory authorities. Canadian standards differ significantly from the requirements of the SEC, and mineral reserve and mineral resource information contained herein is not comparable to similar information disclosed in accordance with the requirements of the SEC. While the terms “measured”, “indicated” and “inferred” mineral resources are required pursuant to National Instrument 43-101, the SEC does not recognize such terms. U.S. investors should understand that “inferred” mineral resources have a great amount of uncertainty as to their existence and great uncertainty as to their economic and legal feasibility. In addition, U.S. investors are cautioned not to assume that any part or all of NAP’s mineral resources constitute or will be converted into reserves. For a more detailed description of the key assumptions, parametres and methods used in calculating NAP’s mineral reserves and mineral resources, see NAP’s most recent Annual Information Form/Form 40-F on file with Canadian provincial securities regulatory authorities and the SEC.
OUR BUSINESS
North American Palladium Ltd. is a Canadian precious metals company focused on growing its production of palladium and gold in mining-friendly jurisdictions. As an established producer, the Company operates its two 100%-owned mines in Canada and has a pipeline of growth projects near its mine sites where both mills have excess capacity available for production growth.
Lac des Iles (“LDI”), the Company's flagship mine, is one of the world’s two primary palladium producers. Located approximately 85 kilometres northwest of Thunder Bay, Ontario, LDI started producing palladium in 1993. The Company is currently expanding the LDI mine to transition from mining via ramp access to mining via shaft while utilizing a highly mechanized bulk mining method. The mine expansion is currently underway, with commercial production from the shaft at an increased mining rate targeted for the fourth quarter of 2012. It is expected that this expansion will transform LDI into a long life, low cost producer of palladium.
NAP also owns and operates the Sleeping Giant gold mine located in the Abitibi region of Quebec, north of Val d’Or, where the Company plans to organically grow the gold operations through the development of its other gold assets. As part of NAP’s growth strategy for its gold operations, the Company has initiated an expansion of the Sleeping Giant mill, which is expected to process ore from NAP’s other gold development projects should they be brought into production. The Company is also currently advancing the Vezza gold project towards a production decision expected at the end of 2011, and is continuing to advance its other projects through exploration and permitting.
The Company has a strong portfolio of development and exploration assets near the LDI and Sleeping Giant mines, and is pursuing a significant exploration program in 2011 aimed at increasing its reserves and resources. With an experienced senior management team, a strong balance sheet of over $160 million in working capital (including $100 million in cash) as at March 31, 2011 and no long-term debt, NAP is well positioned to pursue its growth strategy.
NAP trades on the TSX under the symbol PDL and on the NYSE Amex under the symbol PAL. The Company’s common shares are included in the S&P/TSX Composite Index.
FIRST QUARTER REPORT 2011
2
North American Palladium Ltd.
KEY HIGHLIGHTS
| Three months ended March 31 | ||||||||
| (expressed in thousands of dollars except total cash cost and per share amounts) | 2011 | 2010 | ||||||
| FINANCIAL HIGHLIGHTS | ||||||||
| Revenue | ||||||||
| Revenue after pricing adjustments | $ | 36,714 | $ | 7,930 | ||||
| Unit sales | ||||||||
| Palladium (oz) | 30,455 | - | ||||||
| Gold (oz) | 6,300 | 6,700 | ||||||
| Platinum (oz) | 1,683 | - | ||||||
| Nickel (lb) | 133,055 | - | ||||||
| Copper (lb) | 228,591 | - | ||||||
| Earnings | ||||||||
| Net loss | $ | (10,321 | ) | $ | (18,351 | ) | ||
| Net loss per share | $ | (0.06 | ) | $ | (0.14 | ) | ||
Adjusted net income (loss)1 | $ | (6,482 | ) | $ | (8,175 | ) | ||
EBITDA1 | $ | (3,756 | ) | $ | (14,977 | ) | ||
Adjusted EBITDA1 | $ | 83 | $ | (4,801 | ) | |||
| Cash flow used in operations | ||||||||
| Cash flow used in operations before changes in non-cash working capital | $ | (6,568 | ) | $ | (12,186 | ) | ||
Cash flow used in operations before changes in non-cash working capital per share1 | $ | (0.04 | ) | $ | (0.10 | ) | ||
| Capital spending | $ | 41,144 | $ | 4,487 | ||||
| OPERATING HIGHLIGHTS | ||||||||
| Production | ||||||||
| Palladium (oz) | 30,661 | - | ||||||
| Gold (oz) | 4,906 | 4,863 | ||||||
| Platinum (oz) | 1,692 | - | ||||||
| Nickel (lb) | 133,836 | - | ||||||
| Copper (lb) | 230,006 | - | ||||||
Total cash costs1 | ||||||||
| Palladium (US$) | $ | 519 | - | |||||
| Gold (US$) | $ | 1,991 | $ | 1,417 | ||||
FINANCIAL CONDITION
| As at March 31 | As at December 31 | |||||||
| (expressed in thousands of dollars) | 2011 | 2010 | ||||||
| Net working capital | $ | 163,335 | $ | 169,559 | ||||
| Cash balance | $ | 100,136 | $ | 75,159 | ||||
| Shareholders’ equity | $ | 321,122 | $ | 290,450 | ||||
1 Non-IFRS measure. Please refer to Non-IFRS Measures on pages 31-33.
FIRST QUARTER REPORT 2011
3
North American Palladium Ltd.
EXECUTIVE SUMMARY
Financial Highlights
Revenue, after pricing adjustments, for the quarter ended March 31, 2011 was $36.7 million. Net loss for the first quarter was $10.3 million or $0.06 per share. Adjusted net loss1 for the quarter was $6.5 million. NAP used cash from operating activities of $6.6 million, before changes in non-cash working capital, or $0.04 per share1. EBITDA1 was a negative $3.8 million and adjusted EBITDA1 was $0.1 million.
Strong Balance Sheet
As at March 31, 2011, the Company had approximately $163.3 million in working capital (including $100.1 million of cash on hand) and no long-term debt. During the quarter, the Company received proceeds of $21.3 million from the exercise of Series A warrants and $22.0 million from financing of flow-through shares. The Company’s operating cash flow, together with its cash reserves and credit facilities, which remain undrawn, provide the Company with the financial flexibility to advance its development projects.
Investment in Growth
For the quarter ended March 31, 2011, the Company invested $3.8 million in exploration activities at its palladium operations ($1.9 million) and gold operations ($1.9 million) and $41.1 million in development expenditures.
LDI Mine Palladium Production
First quarter production at the LDI mine included the blending of underground ore with surface stockpiles. During the first quarter, NAP produced 30,661 ounces of payable palladium (at an average palladium head grade at the mill of 3.85 grams per tonne), at total cash costs1 (net of byproduct credits) of US$519 per ounce, compared to planned cash costs1 of US$458 per ounce.
First quarter underground tonnage production at LDI was essentially on plan (although slightly at lower grades due to stope sequencing), while production from surface stockpiles was significantly lower due to the severity of the winter (one of the coldest on record in Thunder Bay) and crew availability. To make up for the weather-related issues affecting surface production, the Company has hired additional contractors to assist with the break-up of the oversized stockpiles.
As the Company endeavours to simultaneously produce, develop and explore underground at LDI, 2011 will be a key transitional year. With the mine expansion as the Company’s number one priority, the Company is revising the 2011 mine plan to put greater emphasis on development in order to keep the expansion on track and optimize operations for future production. Accordingly, the Company has reduced its annual production guidance to 145,000 to 155,000 ounces (previously 165,000 – 175,000 ounces) for 2011 to alleviate some of the pressure on development and the congestion that results from mining while developing. Due to the high fixed cost component of operating costs with lower production volume, appreciation in the Canadian dollar and higher contractor costs since the start of the year, cash costs1 per ounce are expected to be higher. Accordingly, management has increased its cash cost1 guidance for 2011 to US$450 per ounce. This should not be construed as being indicative of cash costs for 2012, when higher grade underground ore will not be diluted by the processing of low grade surface stockpiles.
LDI Mine Expansion Update
The Company is currently expanding the LDI mine to transition from mining via ramp access to mining via shaft to increase future production at lower cash costs1 per ounce. The Company is targeting commercial production from the shaft at a capacity of 3,500 tonnes per day to commence in the fourth quarter of 2012, with plans to increase it to 5,500 tonnes per day starting in the first quarter of 2015. During the first quarter of 2011, the Company spent approximately $30.8 million (including $3.8 million on exploration) on the mine expansion development activities.
1 Non-IFRS measure. Please refer to Non-IFRS Measures on pages 31-33.
FIRST QUARTER REPORT 2011
4
North American Palladium Ltd.
During the first quarter, the Company made significant progress in advancing the critical aspects of the mine expansion development activities, which include the completion of the pilot hole for the shaft raisebore (raiseboring commenced in May), drilling the pilot hole for the vent raise, the critical foundation and construction work, as well as advancing the level development.
The Company intends to update its LDI Mine Expansion Plan in the third quarter of this year to reflect the updated reserve and resource calculation (expected in the second quarter), more current metal price assumptions, and the new seismic information that may impact stope design.
Sleeping Giant Mine Gold Production
While development of higher grade zones at depth continues, mining was focused above the 975-metre elevation – mining the remnant reserves left behind by the previous operator. During the first quarter, Sleeping Giant produced 3,699 ounces of gold (at an average head grade at the mill of 5.83 grams per tonne), at a cash cost1 of US$1,991 per ounce. The shortfall in production and higher cash costs1 reflect the Company’s ongoing challenges of hiring and retaining more skilled, underground miners, which had a negative impact on the volume of tonnes mined and the grade controls. Availability of skilled underground miners is critical for production growth at Sleeping Giant. Experienced miners are in high demand in the sector, particularly in the highly competitive Abitibi region.
Under the new leadership of Greg Struble, Vice President and Chief Operating Officer, the Sleeping Giant mine embarked on a detailed review of all operating systems for the balance of 2011. Operations will be refocused on quality of mining (fewer stopes and higher grade) from the current focus on volume (tonnage). The Company is currently evaluating all components of operating costs in the context of lower production, with a view to reducing costs to achieve break-even cash flow. Accordingly, management has reduced its 2011 gold production guidance for the remainder of 2011 to 15,000 to 20,000 ounces (previously 30,000 to 35,000 ounces).
Sleeping Giant Mine & Mill Development Update
During the quarter, the Company made good progress in the development work related to the 200-metre shaft deepening at Sleeping Giant, embarked on to give access to stopes in zones that have historically provided good tonnage and higher grades. The work at depth remains on target for completion at the end of the second quarter and will be integral for increased production and profitability in 2012. The development of the three new mining levels at depth is scheduled to commence in the third quarter. During the first quarter, the Company spent $1.8 million on the shaft deepening activities.
Management is also in the process of developing its mine plan for 2012, when the Company will have access to mining three new higher-grade levels at depth. When that process is completed in the third quarter, management will confirm or revise its current 2012 guidance range of 40,000 to 50,000 ounces of production.
The $7.0 million expansion of Sleeping Giant’s mill (from 900 tonnes per day to 1,250 tonnes per day) commenced in the first quarter and is expected to be completed at the end of the third quarter. In the first quarter, NAP retained a construction manager for this project, completed the geo-technical tests and foundation design, and received the required construction permits. The Company spent $0.2 million in the first quarter on the mill expansion.
Vezza Gold Project Development Update
During the quarter, the Company made good progress in the development work at its Vezza gold project which is currently being advanced through exploration and development towards a production decision at year-end. The Company completed the dewatering of the shaft (741 metres from surface) and the four existing underground drifts. Underground rehabilitation of the drifts, stations and underground services (power, pumping and compressed air) is nearly complete. A 5,000-metre surface drilling program has started and two underground diamond drills are mobilized on site.
1 Non-IFRS measure. Please refer to Non-IFRS Measures on pages 31-33.
FIRST QUARTER REPORT 2011
5
North American Palladium Ltd.
A bulk sample of up to 40,000 tonnes is also scheduled for the end of the third quarter of 2011. The Company has approval from the Ministry of Natural Resources and Wildlife for the bulk sample and is completing the permitting process with the Ministry of Sustainable Development, Environment and Parks. Subsequent to quarter end, the Company also announced that Vezza’s measured and indicated resource increased by 12% to 321,000 contained ounces. Inferred resources total 121,000 ounces.
Exploration Updates
During the first quarter, the Company released positive results from its 2010 drilling program for its LDI mine, Sleeping Giant mine and the Vezza gold project. The release also provided an update on exploration activities at Flordin, Discovery, Dormex, Cameron Shear and Laflamme projects. Selected highlights of the updates included continued positive drill results throughout LDI’s Offset Zone (which show that the Offset Zone continues to expand), the extension at depth on Sleeping Giant’s known zones towards the three new proposed mining levels, and confirmed continuity and grade in the near surface, eastern extension of Vezza’s deposit (where only inferred resources currently exist). Subsequent to quarter-end, the Company also released an updated gold mineral reserves and resources at Sleeping Giant and for Vezza.
During the first quarter, at its operating mines, the Company drilled 23,251 metres at LDI (of which 9,326 metres was definition drilling for the mine expansion), and 10,762 metres at Sleeping Giant.
A mineral reserve and resource update incorporating 2010 drilling at LDI is expected to be completed in the second quarter. It will exclude the new Cowboy, Outlaw and Sherriff zones as there is insufficient drilling on these zones at this time. Although the bulk of the 2010 drilling was infill drilling to facilitate planning for the mine expansion underway, early indications suggest there is likely to be a significant increase in resources driven by step-out drilling and a lower cut-off grades as a result of the increase in metal prices (palladium and by-product metals platinum, gold, copper, and nickel) since the date of the last resource update.
Outlook
The Company believes it is delivering on its vision to create a diversified mid-tier precious metals producer. NAP is well positioned to benefit from the rise in the price of palladium as the LDI mine expansion is expected to significantly increase production through the development of the Offset Zone over the next couple of years.
For the balance of 2011, the Company intends to focus on:
| · | Progressing the LDI mine expansion; |
| · | Completing the LDI reserve and resource update (Q2); |
| · | Updating the LDI mine expansion plan (Q3) |
| · | Completing the shaft deepening and mill expansion at Sleeping Giant (Q3); |
| · | Advancing the Vezza gold project through exploration and development towards a production decision by year-end; and |
| · | Continuing exploration programs aimed at increasing reserves and resources at LDI and in the gold division. |
While management is focused on organic growth, there could be attractive strategic opportunities to consider in the current environment. The Company may use its strong balance sheet to pursue platinum group metal (“PGM”) and/or gold acquisition and joint venture opportunities, but with discipline to ensure it pursues only those transactions that can deliver enhanced and sustainable shareholder value.
FIRST QUARTER REPORT 2011
6
North American Palladium Ltd.
Selected Quarterly Information
| Three months ended March 31 | ||||||||
| 2011 | 2010 | |||||||
| Revenue after pricing adjustments | $ | 36,714 | $ | 7,930 | ||||
| Loss from mining operations | (443 | ) | (10,172 | ) | ||||
| Net loss | (10,321 | ) | (18,351 | ) | ||||
| Net loss per share – Basic and diluted | (0.06 | ) | (0.14 | ) | ||||
| Cash flow from (used in) operations prior to changes in non-cash working capital | (6,568 | ) | (12,186 | ) | ||||
| Total assets | 374,978 | 211,180 | ||||||
| Obligations under capital leases | 2,810 | 3,692 | ||||||
Metal Prices
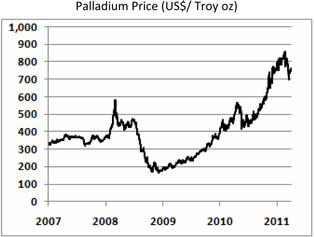 | 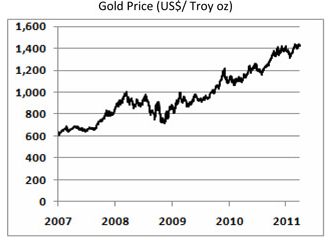 |
In 2008, the price of palladium declined significantly by 69% to US$183 per ounce prompting the Company to put the LDI mine on temporary care and maintenance. As the price of palladium began to recover, the Company restarted the LDI mine in April 2010, ahead of schedule and under budget.
During the first quarter of 2011, the palladium price averaged US$792 per ounce, ranging from a low of US$699 to a high of US$859 per ounce. The price of palladium continues to benefit from the increased investment demand, strong fabrication demand and constrained supply. Palladium is increasingly behaving like a precious metal with rising investment and jewelry demand, yet has the fundamental underpinning of an industrial metal. Palladium was the best performing metal in percentage terms in 2010 and reached a ten year high of US$859 per ounce in early 2011. As of May 9, 2011, the price of palladium was US$729 per ounce.
During the first quarter of 2011, the average price of gold was US$1,382 per ounce, with gold trading in a range of US$1,314 to US$1,437 per ounce. As of May 9, 2011, the price of gold was US$1,510. The price of gold has recently increased as the US dollar continues to weaken and with the US Federal Reserve’s commitment to keep interest rates low in the near term.
The Canadian dollar modestly strengthened during the first quarter of 2011 from $1.00 to $1.03 relative to the U.S. dollar (“USD”). The Canadian dollar was $1.03 at March 31, 2011, above parity with the U.S. currency, closing at its highest level in two and a half years amid rising commodity prices.
FIRST QUARTER REPORT 2011
7
North American Palladium Ltd.
NAP Metal Prices and Exchange Rates
| Three months ended March 31 | ||||||||
| 2011 | 2010 | |||||||
| Palladium – US$/oz | $ | 785 | - | |||||
| Platinum – US$/oz | $ | 1,768 | - | |||||
| Gold – US$/oz | $ | 1,377 | $ | 1,116 | ||||
| Nickel – US$/lb | $ | 11.53 | - | |||||
| Copper – US$/lb | $ | 4.30 | - | |||||
| Average exchange rate (Bank of Canada) – CDN$1 = US$ | $ | 1.01 | $ | 0.96 | ||||
Under LDI’s smelter agreement, metal prices are not finalized until three months after delivery to the smelter for base metals and six months for precious metals. Prior to final pricing and settlement, LDI’s metals are provisionally priced at month end forward prices. The Company enters into financial contracts to mitigate this provisional pricing exposure to rising or declining palladium prices for past production already delivered and sold to the smelters. For further details, see the Financial Review section.
Spot Metal Prices* and Exchange Rates
For comparison purposes, the following table details recorded spot metal prices and exchange rates.
| Mar-31 | Dec-31 | Sep-30 | Jun-30 | Mar 31 | Dec 31 | Sept 30 | Jun-30 | |||||||||||||||||||||||||
| 2011 | 2010 | 2010 | 2010 | 2010 | 2009 | 2009 | 2009 | |||||||||||||||||||||||||
| Palladium – US$/oz | $ | 766 | $ | 791 | $ | 573 | $ | 446 | $ | 479 | $ | 393 | $ | 294 | $ | 249 | ||||||||||||||||
| Gold – US$/oz | $ | 1,439 | $ | 1,410 | $ | 1,307 | $ | 1,244 | $ | 1,116 | $ | 1,104 | $ | 996 | $ | 934 | ||||||||||||||||
| Platinum – US$/oz | $ | 1,773 | $ | 1,731 | $ | 1,662 | $ | 1,532 | $ | 1,649 | $ | 1,461 | $ | 1,287 | $ | 1,186 | ||||||||||||||||
| Nickel – US$/lb | $ | 11.83 | $ | 11.32 | $ | 10.57 | $ | 8.78 | $ | 11.33 | $ | 8.38 | $ | 7.86 | $ | 7.26 | ||||||||||||||||
| Copper – US$/lb | $ | 4.26 | $ | 4.38 | $ | 3.65 | $ | 2.95 | $ | 3.56 | $ | 3.33 | $ | 2.78 | $ | 2.31 | ||||||||||||||||
| Exchange rate (Bank of Canada) – CDN$1 = US$ | US$ | 1.03 | US$ | 1.01 | US$ | 0.97 | US$ | 0.94 | US$ | 0.98 | US$ | 0.96 | US$ | 0.93 | US$ | 0.86 | ||||||||||||||||
* Based on the London Metal Exchange
FINANCIAL REVIEW
LDI Palladium Mine
| Three months ended March 31 | ||||||||
| 2011 | 2010 | |||||||
| Revenue after pricing adjustments | $ | 29,436 | - | |||||
| Operating expenses | ||||||||
| Production costs | $ | 20,039 | $ | 6,002 | ||||
| Smelting, refining and freight costs | 1,427 | - | ||||||
| Royalty expense | 1,126 | - | ||||||
| Depreciation and amortization | 1,755 | 35 | ||||||
| Loss (gain) on disposal of equipment | - | 12 | ||||||
| Total operating expenses | $ | 24,347 | $ | 6,049 | ||||
| Income (loss) from mining operations | $ | 5,089 | $ | (6,049 | ) | |||
FIRST QUARTER REPORT 2011
8
North American Palladium Ltd.
Revenue – LDI Mine
Revenue is affected by sales volumes, commodity prices and currency exchange rates. Metal sales for LDI are recognized in revenue at provisional prices when delivered to a smelter for treatment or designated shipping point. Final pricing is not determined until the refined metal is sold by the smelter, which in the case of LDI base metals is three months and precious metals six months after delivery to the smelter. These final pricing adjustments can result in additional revenues in a rising commodity price environment and reductions to revenue in a declining commodity price environment. Similarly, a weakening in the Canadian dollar relative to the U.S. dollar will result in additional revenues and a strengthening in the Canadian dollar will result in reduced revenues. The Corporation enters into financial contracts to mitigate the smelter agreements’ provisional pricing exposure to rising or declining palladium prices and an appreciating Canadian dollar for past production already sold. The total of these financial contracts represent 60,500 ounces of palladium as at March 31, 2011. These contracts mature from April 2011 through September 2011 at an average price of $722 per ounce (or US$706 per ounce of palladium). The amounts specified in the financial contracts substantially match final pricing settlement periods of palladium delivered to the customer under the smelter agreement. The palladium financial contracts are being recognized on a mark-to-market basis as an adjustment to revenue. The fair value of these contracts at March 31, 2011 was a liability of $1,289, included in accounts payable and accrued liabilities (December 31, 2010 - $11,098 liability).
| Three months ended March 31 | ||||||||
| 2011 | 2010 | |||||||
| Sales volumes | ||||||||
| Palladium (oz) | 30,455 | - | ||||||
| Gold (oz) | 1,200 | - | ||||||
| Platinum (oz) | 1,683 | - | ||||||
| Nickel (lbs) | 133,055 | - | ||||||
| Copper (lbs) | 228,591 | - | ||||||
| Cobalt (lbs) | 3,324 | - | ||||||
| Silver (oz) | 967 | - | ||||||
| Three months ended March 31 | ||||||||
| 2011 | 2010 | |||||||
| Revenue before pricing adjustments | $ | 31,048 | - | |||||
| Pricing adjustments | (1,612 | ) | - | |||||
| Revenue after pricing adjustments | $ | 29,436 | - | |||||
| Revenue by metal | ||||||||
| Palladium | $ | 22,496 | - | |||||
| Gold | 1,606 | - | ||||||
| Platinum | 2,770 | - | ||||||
| Nickel | 1,604 | - | ||||||
| Copper | 884 | - | ||||||
| Cobalt | 50 | - | ||||||
| Silver | 26 | - | ||||||
| $ | 29,436 | - | ||||||
For the quarter ended March 31, 2011, revenue before pricing adjustments was $31.0 million, compared to $nil for the same comparative periods last year, reflecting no production from the LDI mine. Due to the recovery of metal prices, the Company recommenced operations in April 2010 after being on care and maintenance since October 2008.
FIRST QUARTER REPORT 2011
9
North American Palladium Ltd.
Revenue after pricing adjustments from metal settlements for the quarter ended March 31, 2011 was $29.4 million, reflecting a $1.6 million negative commodity price adjustment and a nominal foreign exchange adjustment.
Operating Expenses – LDI Mine
For the quarter ended March 31, 2011, operating expenses were $24.3 million compared to $6.0 million in the same period last year. The first quarter of 2010 included costs of $6.0 million related to restarting the LDI mine and mill, which occurred in April 2010. The first quarter restart costs were expensed since the Company kept the LDI operations commercially available and retained all key senior management in anticipation of a prompt restart when metal prices recovered. Total cash costs1 per ounce of palladium sold, net of by product credits1 were US$519 for the quarter ended March 31, 2011.
Smelting, refining and freight costs for the quarter ended March 31, 2011 were $1.4 million compared to $nil in the same period last year, the increase is due to the LDI mine and mill restart in April 2010.
For the quarter ended March 31, 2011, the royalty expense was $1.1 million compared to $nil in the same period last year. In the prior year, the mine was on temporary care and maintenance.
Depreciation and amortization at the LDI mine for the quarter ended March 31, 2011 was $1.8 million, compared to a nominal amount in the quarter ended March 31, 2010.
Sleeping Giant Gold Mine
Income from mining operations for the Sleeping Giant gold mine is summarized in the following table.
| Three months ended March 31 | ||||||||
| 2011 | 2010 | |||||||
| Revenue after pricing adjustments | $ | 7,278 | $ | 7,930 | ||||
| Operating expenses | ||||||||
| Production costs | $ | 10,388 | $ | 10,049 | ||||
| Smelting, refining and freight costs | 12 | 18 | ||||||
| Depreciation and amortization | 2,362 | 1,961 | ||||||
| Loss (gain) on disposal of equipment | - | (3 | ) | |||||
| Total operating expenses | $ | 12,762 | $ | 12,025 | ||||
| Loss from mining operations | $ | (5,484 | ) | $ | (4,095 | ) | ||
Revenue – Sleeping Giant Mine
Metal sales for the Sleeping Giant gold mine are recognized at the time the title is transferred to a third party. Sales volumes are set out in the table below.
| Three months ended March 31 | ||||||||
| 2011 | 2010 | |||||||
| Sales volumes | ||||||||
| Gold (oz) | 5,100 | 6,700 | ||||||
| Silver (oz) | 11,400 | 10,000 | ||||||
1 Non-IFRS measure. Please refer to Non-IFRS Measures on pages 31-33.
FIRST QUARTER REPORT 2011
10
North American Palladium Ltd.
| Three months ended March 31 | ||||||||
| 2011 | 2010 | |||||||
| Revenue before pricing adjustments | $ | 7,278 | $ | 7,930 | ||||
| Pricing adjustments | - | - | ||||||
| Revenue after pricing adjustments | $ | 7,278 | $ | 7,930 | ||||
| Revenue by metal | ||||||||
| Gold | $ | 6,932 | $ | 7,751 | ||||
| Silver | $ | 346 | $ | 179 | ||||
| $ | 7,278 | $ | 7,930 | |||||
For the quarter ended March 31, 2011, revenue was $7.3 million, reflecting gold sales of 5,100 ounces with an average realized price of US$1,359 per ounce.
Operating Expenses – Sleeping Giant Mine
For the quarter ended March 31, 2011, total production costs at the Sleeping Giant gold mine were $10.4 million as compared to $10.0 million in the first quarter of 2010. Total cash costs1 were US$1,991 per ounce for the quarter ended March 31, 2011 compared to $1,417 per ounce for the quarter ended March 31, 2010.
Depreciation and amortization at the Sleeping Giant gold mine was $2.4 million for the quarter ended March 31, 2011 compared to $2.0 million in the prior year.
Other Expenses
The Company’s general and administration expenses for the quarter ended March 31, 2011 were $3.5 million, compared to $2.7 million, an increase of $0.8 million due to additional administration costs from increased activities at the Sleeping Giant gold mine and LDI palladium mine.
Exploration expenditures for the quarter ended March 31, 2011 were $3.9 million compared to $4.2 million in the prior year period, comprised as follows:
| Three months ended March 31 | ||||||||
| 2011 | 2010 | |||||||
| LDI Offset Zone project | $ | 566 | $ | 1,661 | ||||
| Other Ontario exploration projects* | 1,358 | 1,393 | ||||||
| Sleeping Giant mine property | 1,112 | 852 | ||||||
| Other Quebec exploration projects** | 869 | 259 | ||||||
| Exploration tax credits | (66 | ) | - | |||||
| Total exploration expenditures | $ | 3,839 | $ | 4,165 | ||||
| * | Other Ontario exploration projects are comprised of LDI exploration projects, including the Cowboy, Outlaw and Sheriff zones, West LDI, North VT Rim, and the Legris Lake option and Shebandowan. |
| ** | Other Quebec exploration projects are comprised of the Vezza, Flordin, Discovery, Dormex, Montbray, Harricana, Cameron Shear, Laflamme, and Florence properties. |
Interest and other income for the quarter ended March 31, 2011 was $0.4 million compared to $2.0 million in the prior year, which included a gain on renouncement of flow-through expenditures of $0.3 million compared to $2.0 million in the prior year quarter. Interest and other income include interest on capital leases, accretion expense, interest income and interest expense in the current and prior year.
1 Non-IFRS measure. Please refer to Non-IFRS Measures on pages 31-33.
FIRST QUARTER REPORT 2011
11
North American Palladium Ltd.
Asset Impairment
The Company reviews and evaluates its long-lived assets for impairment when events or changes in circumstances arise that may result in impairment in the carrying value of those assets. Impairment is considered to exist if total estimated future undiscounted cash flows are less than the carrying amount of the asset. In the opinion of management, for the quarter ended March 31, 2011, there were no events or changes in circumstances giving rise to an impairment in the carrying value of long-lived assets. Assumptions underlying future cash flow estimates are subject to risk and uncertainty. Any differences between significant assumptions and market conditions such as metal prices, exchange rates, recoverable metal, and/or the Company’s operating performance could have a material effect on the Company’s ability to recover the carrying amounts of its long-lived assets resulting in possible impairment charges.
Income and Mining Tax Recovery (Expense)
The income and mining tax recovery (expense) for the quarters ended March 31 are provided in the table below.
| Three months ended March 31 | ||||||||
| 2011 | 2010 | |||||||
| LDI palladium mine | ||||||||
| Ontario transitional tax credit | $ | (2,387 | ) | $ | - | |||
| Ontario resource allowance recovery | - | 315 | ||||||
| $ | (2,387 | ) | $ | 315 | ||||
| Sleeping Giant gold mine | ||||||||
| Quebec mining duties recovery | $ | 45 | - | |||||
| Quebec income tax recovery | 107 | 26 | ||||||
| Mining interests temporary difference expense | (580 | ) | 107 | |||||
| $ | (428 | ) | $ | 133 | ||||
| Corporate and other | ||||||||
| Expiration of warrants | $ | 3 | $ | 542 | ||||
| Renunciation of exploration expenditures | - | (4,335 | ) | |||||
| $ | 3 | $ | (3,793 | ) | ||||
| $ | (2,812 | ) | $ | (3,345 | ) | |||
For the quarter ended March 31, 2011, the income and mining tax expense was $2.8 million compared to a $3.3 million expense in the same period in 2010, due primarily to Ontario transitional tax credits ($2.4 million) and mining interest temporary difference expense ($0.6 million).
Net Loss
For the quarter ended March 31, 2011, the Company reported a net loss of $10.3 million or $0.06 per share compared to a net loss of $18.4 million or $0.14 per share in the prior year.
FIRST QUARTER REPORT 2011
12
North American Palladium Ltd.
Summary of Quarterly Results
(expressed in thousands of Canadian dollars except per share amounts)
2011 | 2010 | 2009* | ||||||||||||||||||||||||||||||
Q1 | Q4 | Q3 | Q2 | Q1 | Q4 | Q3 | Q2 | |||||||||||||||||||||||||
| Revenue – after pricing adjustments | $ | 36,714 | $ | 39,502 | $ | 38,451 | $ | 21,215 | $ | 7,930 | $ | 1 | $ | 1 | $ | (1,278 | ) | |||||||||||||||
| Exploration expense | 3,839 | 12,532 | 7,008 | 6,421 | 4,165 | 4,287 | 2,623 | 3,916 | ||||||||||||||||||||||||
| Cash provided by (used in) operations | 24,647 | (25,234 | ) | (20,053 | ) | (18,433 | ) | (10,172 | ) | (12,186 | ) | (8,911 | ) | 11,464 | ||||||||||||||||||
Cash provided by (used in) operations prior to changes in non-cash working capital per share1 | (0.04 | ) | - | 0.04 | (0.04 | ) | (0.11 | ) | (0.11 | ) | (0.06 | ) | (0.11 | ) | ||||||||||||||||||
| Capital expenditures | 41,144 | 20,142 | 14,589 | 10,146 | 4,487 | 4,450 | 5,647 | 1,898 | ||||||||||||||||||||||||
| Net income (loss) | (10,321 | ) | (260 | ) | 3,185 | (11,560 | ) | (14,624 | ) | (14,361 | ) | (6,194 | ) | (9,806 | ) | |||||||||||||||||
| Net loss per share – basic and diluted | $ | (0.06 | ) | - | $ | 0.02 | $ | (0.08 | ) | $ | (0.11 | ) | $ | (0.11 | ) | $ | (0.06 | ) | $ | (0.11 | ) | |||||||||||
| * | Certain prior period amounts have been reclassified to conform to the classification adopted in the current period. |
| 1 | Non-IFRS measure. Please refer to Non-IFRS Measures on pages 31-33. |
FINANCIAL CONDITION, CASH FLOWS, LIQUIDITY AND CAPITAL RESOURCES
| Three months ended March 31 | ||||||||
| 2011 | 2010 | |||||||
| Cash used in operations prior to changes in non-cash working capital | $ | (6,568 | ) | $ | (12,186 | ) | ||
| Changes in non-cash working capital | 31,215 | 2,028 | ||||||
| Cash provided by (used in) operations | 24,647 | (10,158 | ) | |||||
| Cash provided by (used in) financing | 41,474 | (228 | ) | |||||
| Cash provided by (used in) investing | (41,144 | ) | (4,482 | ) | ||||
| Increase (decrease) in cash and cash equivalents | $ | 24,977 | $ | (14,868 | ) | |||
Operating Activities
For the quarter ended March 31, 2011, cash used in operations prior to changes in non-cash working capital was $6.6 million, compared to $12.2 million in the prior year, a decrease of $5.6 million. This decrease is due primarily to the lower net loss of $10.2 million (including $2.1 million increased depreciation and amortization) partially offset by an increase of deferred income and mining tax recoveries of $4.9 million.
For the quarter ended March 31, 2011, changes in non-cash working capital resulted in a source of cash of $31.2 million compared to a source of cash of $2.0 million in the prior year. The $31.2 million amount is substantially due to a decrease in other assets ($22.2 million) representing proceeds received from the exercise of warrants, a decrease in accounts receivable ($9.8 million), a decrease in inventories ($3.7 million) and an increase in taxes payable ($2.2 million), partially offset by a decrease in accounts payable and accrued liabilities ($6.7 million).
For the quarter ended March 31, 2011, cash provided by operations was $24.6 million compared to cash used in operations of $10.2 million in the comparative period in 2010.
Financing Activities
For the quarter ended March 31, 2011, financing activities provided cash of $41.5 million of which $19.8 million was related to the exercise of warrants, partially offset by the scheduled repayment of capital leases of $0.5 million. This compared to cash used in financing activities of $0.2 million in the corresponding period last year. The Company’s obligations under capital leases increased to $2.8 million at March 31, 2011 from $2.4 million at December 31, 2010 due to new capital lease obligations of $0.9 million, offset by scheduled capital lease repayments of $0.5 million.
FIRST QUARTER REPORT 2011
13
North American Palladium Ltd.
In October 2009, the Company completed an equity offering of 18.4 million units for net proceeds of $53.6 million. Each unit consisted of one common share and one-half of one common share purchase warrant of the Company. Each whole warrant (Series A warrants) entitled the holder to purchase an additional common share at a price of $4.25 per share, subject to adjustment, at any time prior to September 30, 2011. Since the 20-day volume weighted average price of the common shares on the TSX was equal to or greater than C$5.75 per share (as per the acceleration event in the warrant indenture), on December 8, 2010 the Company announced the acceleration of the expiry of the Series A warrants to January 14, 2011. During the first quarter of 2011, $21.3 million of proceeds were received from the exercise of 5,009,986 Series A warrants. Total proceeds of $38.8 million were received from the exercise of Series A warrants and 67,938 Series A warrants were not exercised prior to expiry.
On April 28, 2010, the Company completed an equity offering of 20 million units at a price of $5.00 per unit for total net proceeds of $94.2 million (issue costs $5.8 million), which included the exercise of an over-allotment option in the amount of 2,600,000 units at a price of $5.00 per unit. Each unit consists of one common share and one-half of one common share purchase warrant of the Company. Each whole warrant (Series B warrants) entitles the holder to purchase an additional common share at a price of $6.50, subject to adjustment, at any time prior to October 28, 2011. In the event that the 20-day volume weighted average price of the common shares on the TSX is greater than $7.50 per share, the Company may accelerate the expiry date of the warrants by giving notice to the holders thereof and in such case the warrants will expire on the 30th day after the date on which such notice is given by the Company. In 2010, 1,240,000 Series B warrants were exercised for total proceeds of $8.1 million. No additional warrants were exercised during the first quarter of 2011.
Investing Activities
For the quarter ended March 31, 2011, investing activities required cash of $41.1 million, relating to additions to mining interests as set out in the table below. For the quarter ended March 31, 2010, investing activities required cash of $4.5 million, relating to additions to mining interests, the majority of which was attributable to the development of the Sleeping Giant gold mine and various mill projects at the LDI palladium mine.
FIRST QUARTER REPORT 2011
14
North American Palladium Ltd.
| Three months ended March 31 | ||||||||
| 2011 | 2010 | |||||||
| LDI palladium mine | ||||||||
| Offset Zone development | $ | 26,921 | $ | 936 | ||||
| Roby Zone development | 60 | 106 | ||||||
| Offset Zone exploration costs | 3,833 | - | ||||||
| Roby Zone exploration costs | 88 | - | ||||||
| Jaw crusher | - | 879 | ||||||
| Mill flotation redesign | - | 573 | ||||||
| Tailings management facility | 42 | - | ||||||
| Other equipment and betterments | 1,796 | 387 | ||||||
| $ | 32,740 | $ | 2,881 | |||||
| Sleeping Giant gold mine | ||||||||
| Shaft deepening | $ | 1,810 | $ | 961 | ||||
| Vezza project | 5,288 | - | ||||||
| Mill expansion | 226 | - | ||||||
| Underground and deferred development | 850 | 556 | ||||||
| Other equipment and betterments | 230 | 85 | ||||||
| $ | 8,404 | $ | 1,602 | |||||
| Corporate and other | ||||||||
| Other equipment and betterments | - | $ | 4 | |||||
| $ | 41,144 | $ | 4,487 | |||||
In addition to the mining interests acquired by cash reflected in the above table, the Company also acquired by means of finance leases, equipment in the amount $0.9 million for the quarter ended March 31, 2011.
Capital Resources
As at March 31, 2011, the Company had cash and cash equivalents of $100.1 million compared to $75.2 million as at December 31, 2010. The funds are invested in short term interest bearing deposits at a major Canadian chartered bank.
In July 2010, the Company obtained a $30 million operating line of credit with the Bank of Nova Scotia. The credit facility has a one year term, secured by the Company's accounts receivables and may be used for working capital liquidity and general corporate purposes. At March 31, 2011, the operating line of credit was undrawn.
For the quarter ended March 31, 2011, $21.3 million of proceeds were received from the exercise of Series A warrants. In addition, the Company received $22 million of proceeds from the flow-through share financing during the quarter.
The cash flow from the LDI palladium mine and the Sleeping Giant gold mine, together with the Company’s cash reserves and credit facilities, are expected to be sufficient to fund the Company’s requirements in 2011.
Contractual Obligations
| As at March 31, 2011 | Payments Due by Period | |||||||||||||||
| (expressed in thousands of Canadian dollars) | Total | Less than 1 year | 2-5 Years | >5 years | ||||||||||||
| Capital lease obligations | $ | 2,968 | $ | 1,835 | $ | 1,133 | - | |||||||||
| Operating leases | 7,822 | 5,776 | 1,633 | 413 | ||||||||||||
| Purchase obligations | 58,688 | 58,688 | ||||||||||||||
| $ | 69,478 | $ | 66,299 | $ | 2,766 | $ | 413 | |||||||||
FIRST QUARTER REPORT 2011
15
North American Palladium Ltd.
In addition to the above, the Company also has asset retirement obligations at March 31, 2011 in the amount of $12.7 million that would become payable at the time of the closures of the LDI and Sleeping Giant mines. Deposits established by the Company to offset these future outlays amount to $10.6 million. As a result, $2.1 million of funding is required prior to closure of the mines.
Related Party Transactions
There were no related party transactions for the quarter ended March 31, 2011.
OUTSTANDING SHARE DATA
As of May 9, 2011, there were 162,371,897 common shares of the Company outstanding. In addition, there were options outstanding pursuant to the Amended and Restated 2010 Corporate Stock Option Plan entitling holders thereof to acquire 3,958,332 common shares of the Company at a weighted average exercise price of $4.30 per share. As of the same date, there were also 8,760,000 Series B warrants outstanding, each warrant entitling the holder thereof to purchase one common share at a weighted average exercise price of $6.50 per share before October 28, 2011.
REVIEW OF OPERATIONS
LDI Palladium Mine
| Three months ended March 31 | ||||||||
| 2011 | 2010 | |||||||
| Tonnes of ore milled | 337,846 | - | ||||||
| Production | ||||||||
| Palladium (oz) | 30,661 | - | ||||||
| Gold (oz) | 1,207 | - | ||||||
| Platinum (oz) | 1,692 | - | ||||||
| Nickel (lbs) | 133,836 | - | ||||||
| Copper (lbs) | 230,006 | - | ||||||
| Palladium head grade (g/t) | 3.85 | - | ||||||
| Palladium recoveries (%) | 78.79 | - | ||||||
| Tonnes of ore mined | 332,523 | 24,840 | ||||||
| Cost per tonne milled | $ | 59 | - | |||||
Total cash cost ($USD)1 | $ | 519 | - | |||||
The LDI mine consists of an open pit (now depleted), an operating underground mine (currently producing from the Roby Zone), and a mill with a nominal capacity of approximately 15,000 tonnes per day. The primary deposits on the property are the Roby Zone and the Offset Zone, both disseminated magmatic nickel-copper-platinum group metal (“PGM”) deposits.
First quarter production at the LDI mine included the blending of underground ore with lower-grade surface stockpiles. During the quarter, 332,523 tonnes of ore were extracted from underground and from the surface stockpiles, of which underground ore sources provided 238,221 tonnes from the Roby Zone and some silling ore from the Offset Zone (at an average combined palladium grade of 4.76 grams per tonne), while 94,302 tonnes came from surface stockpiles (at an average palladium grade of 1.68 grams per tonne). During the first quarter of 2010, no ore was extracted as the LDI mine was on temporary care and maintenance. Ore production from the Roby Zone at the LDI mine is operating at 2,600 tonnes per day, seven days a week, on two 12-hour shifts per day. The Company has a workforce of approximately 215 people at LDI and a new collective agreement with the United Steelworkers that is effective until May 31, 2012.
1 Non-IFRS measure. Please refer to Non-IFRS Measures on pages 31-33.
FIRST QUARTER REPORT 2011
16
North American Palladium Ltd.
First quarter underground production at LDI was essentially on plan (although at slightly lower grades due to stope sequencing), while production from surface stockpiles was significantly lower due to the severity of the winter (one of the coldest on record in Thunder Bay) and crew availability.
The surface production shortfall resulted from lower than planned feed from the oversized surface source, which was impacted by weather-related issues. The freezing temperatures hampered the feed capabilities of broken oversized material into the primary crusher, as a build-up of snow and ice resulted in a period of limited or no crushing ability. This necessitated the Company to make up for the tonnage by supplementing the oversized stockpiles (at an average grade of 1.8 grams per tonne) with its secondary low-grade stockpiles (also referred to as the RGO Stockpiles in the Company’s resource report, at an average grade 0.97 grams per tonne). To make up for the weather-related issues affecting surface production, the Company has hired additional contractors to assist with the break-up of the oversized stockpiles.
During the quarter, the Company also implemented a geotechnical monitoring system following an unforeseen geotechnical occurrence that caused two sill pillars in the lower part of the Roby Zone to become unstable. Issues of this nature are not uncommon in underground mines and did not impact production as the Company initiated a controlled extraction from the affected pillars. The new system monitors seismic activity and will refine the Company’s understanding of the geotechnical data that will ultimately determine optimal stope design for the Offset Zone. As a result of the new information, the Company intends to consider various backfilling scenarios for the mine expansion.
As the Company endeavours to simultaneously produce, develop and explore underground at LDI, 2011 will be a key transitional year. With the mine expansion as the Company’s number one priority, management feels it is prudent to revise the 2011 mine plan to put greater emphasis on development in order to keep the expansion on track and optimize operations for future production. Accordingly, management has reduced its annual production guidance to 145,000 to 155,000 ounces (previously 165,000 to 175,000 ounces) for 2011 to alleviate some of the pressure on development and the congestion that results from mining while developing. Due to the high fixed cost component of operating costs with lower production volume, appreciation in the Canadian dollar and higher contractor costs since the start of the year, cash costs1 per ounce are expected to be higher. Accordingly, management has increased its cash cost guidance for 2011 to US$450 per ounce. This should not be construed as being indicative of cash costs for 2012, when higher grade underground ore will not be diluted by the processing of low grade surface stockpiles.
LDI Mill
For the quarter ended March 31, 2011, the LDI mill processed 337,846 tonnes of ore at an average of 8,819 tonnes per operating day, producing 30,661 ounces of payable palladium at an average palladium head grade of 3.85 grams per tonne, with a palladium recovery of 78.8%, and mill availability of 96.0%. During the first quarter of 2010, the LDI mill was on temporary care and maintenance. LDI’s cash costs1, net of byproduct credits, were US$519 per ounce, compared to planned cash costs1 of US$458 per ounce. Production costs, per tonne of ore milled, were $59 for the quarter ended March 31, 2011. The mill is operating on a batch basis, with a two-week operating and a two-week shutdown schedule.
LDI Mine Expansion Project Update
The Company is currently expanding the LDI mine to transition from mining via ramp access to mining via shaft to increase future production at lower cash costs1 per ounce. The Company is targeting commercial production from the shaft at a capacity of 3,500 tonnes per day to commence in the fourth quarter of 2012, with plans to increase it to 5,500 tonnes per day starting in the first quarter of 2015. During the first quarter, the Company spent approximately $31.3 million (including $3.0 million on exploration) on the mine expansion development activities.
1 Non-IFRS measure. Please refer to Non-IFRS Measures on pages 31-33.
FIRST QUARTER REPORT 2011
17
North American Palladium Ltd.
During the first quarter the Company made significant progress in advancing the critical aspects of the mine expansion construction activities; highlights include:
| · | Completed the pilot hole for the shaft raisebore machine; |
| · | Commenced raiseboring in May; |
| · | Began drilling the pilot hole for the vent raise into the Offset Zone; |
| · | Substantially completed the critical foundation work: |
| · | 80% of hoist house walls poured |
| · | 25% of head frame footings poured |
| · | 75% of collar house footings poured |
| · | 75% of walls formed |
| · | Completed development of the shaft station and installation of ground support; |
| · | Completed construction of permanent dry and commenced construction of 96-person camp addition; |
| · | Began staging the construction steel for the hoist house and head frame structures; and |
| · | Advanced level development (around Level 4925) to allow for access to the Upper Offset Zone. |
The Company intends to update its LDI Mine Expansion Plan in the third quarter of this year to take into account the updated reserve and resource calculation (expected in the second quarter), more current metal price assumptions, and the new seismic information that may impact stope design.
The mine expansion’s execution risk is mitigated since the LDI complex already includes a mill, tailings management facility, infrastructure and the Company has permits in place. Timing risk has been substantially diminished as the Company has already purchased the production, sinking and service cage hoists that are critical to the project. NAP hired a seasoned project management group with significant underground development experience. This team is onsite at LDI and is responsible for all aspects of the Offset Zone development which includes procuring the major construction components for the project as well as providing technical support to the contractors. During the first quarter, NAP successfully integrated its operating and development teams, giving the Company the flexibility to allocate resources between the two activities.
The Company estimates capital expenditures at LDI for 2011 to be approximately $147.0 million.
Development work in 2011 will be focused on:
| · | Completing the raised bore section of the production shaft and ventilation raise bore; |
| · | Installing adequate ventilation at surface and underground; |
| · | Advancing the ramp towards the 4570 mine level; |
| · | Developing the 4790 mine level; |
| · | Constructing the head frame, hoist room and substation; and |
| · | Installing the hoists. |
FIRST QUARTER REPORT 2011
18
North American Palladium Ltd.
Sleeping Giant Gold Mine
| Three months ended March 31 | ||||||||
| 2011 | 2010 | |||||||
| Tonnes of ore milled | 20,642 | 26,823 | ||||||
| Production | ||||||||
| Gold (oz) | 3,699 | 4,863 | ||||||
| Gold head grade (g/t) | 5.83 | 4.92 | ||||||
| Gold recoveries (%) | 95.62 | 95.40 | ||||||
| Tonnes of ore hoisted | 20,282 | 26,832 | ||||||
| Cost per tonne milled | $ | 503 | $ | 375 | ||||
Total cash cost ($USD)1 | $ | 1,991 | $ | 1,417 | ||||
The Sleeping Giant gold mine consists of a narrow vein underground mine and a mill with a capacity of 900 tonnes per operating day. For the quarter ended March 31, 2011, 20,282 tonnes of ore were hoisted from the underground mine with an average gold grade of 5.83 grams per tonne.
Mining activities at Sleeping Giant are still confined to the remnants left behind by the previous owners, focused above the 975-metre elevation. The shortfall in production and higher cash costs1 reflect the Company’s ongoing challenges of hiring and retaining more skilled, underground miners, which had a negative impact on the volume of tonnes mined and the grade controls. Availability of skilled underground miners is critical for production growth at Sleeping Giant. Experienced miners are in high demand in the sector, particularly in the highly competitive Abitibi region. NAP’s efforts at implementing a program to increase employee retention and to attract new underground miners and geologists are ongoing, which includes competitive compensation, retention and incentive bonuses, as well as career advancement opportunities. For the balance of 2011, a number of measures will be implemented to better manage the grade and tonnage controls at Sleeping Giant. Some of these measure include: tighter definition drilling, increased emphasis on long hole stoping opportunities where applicable, remnant mining in the older stoping areas, and above all, a stronger focus on grade control.
In 2010, recognizing that the future of the Sleeping Giant mine is at depth, the Company commenced the deepening of the mine shaft by about 200 metres to gain access to three new mining levels that follow the continuity trends of higher grade zones. The mine shaft deepening is expected to be completed in the second quarter of 2011, following which development work will commence on the three new mining levels in preparation for 2012 production
Under the new leadership of Greg Struble, Vice President and Chief Operating Officer, the mine embarked on a detailed review of all operating systems. Operations will be refocused on quality of mining (grade) from the current focus on volume (tonnage). The Company is currently evaluating all components of operating costs with a view to reduce costs to achieve break-even cash flow. Accordingly, management has reduced its 2011 gold production guidance to 15,000 to 20,000 ounces (previously 30,000 to 35,000 ounces).
The Company is conducting further infill drilling in order to develop its mine plan for 2012, when Sleeping Giant will have access to mining three new higher-grade levels at depth. The 2012 mine plan is expected to be completed in the third quarter at which time management will confirm or revise its expectation of 40,000 to 50,000 ounces of production in 2012.
Sleeping Giant Mill
For the quarter ended March 31, 2011, the mill processed 20,642 tonnes of ore, producing 3,699 ounces of gold at an average gold head grade of 5.83 grams per tonne, with a gold recovery of 95.6% and mill availability of 98.2%. Sleeping Giant’s second quarter cash costs1 were US$1,991 per ounce. Production costs per tonne of ore milled were $503 for the quarter ended March 31, 2011.
FIRST QUARTER REPORT 2011
19
North American Palladium Ltd.
At March 31, 2011, the mill contained approximately 1,757 ounces of gold that was included in inventory and valued at net realizable value, as it had not been sold by the end of the period.
The Sleeping Giant mill has a rated capacity of 900 tonnes per day and was operating at approximately 803 tonnes per operating day, for the quarter ended March 31, 2011.
In 2011, as part of NAP’s growth strategy for its gold operations, the Company is expanding the Sleeping Giant mill, which has the potential to serve NAP’s other gold projects in the Abitibi region. For a capital cost of approximately $7 million, in 2011 NAP will expand the mill to 1,250 tonnes per day. For the quarter ended March 31, 2011, the Company spent $0.2 million on the mill expansion activities. In the first quarter, NAP retained a construction manager for this project, completed the geo-technical tests and foundation design, and received the required construction permits.
EXPLORATION UPDATE
NAP’s future growth will come from its significant exploration upside and through the continued exploration and development of the Company’s projects. With permits, mine infrastructure and excess capacity at both of its mills, NAP can move from exploration success to production on an accelerated timeline.
In 2011, NAP plans to spend $8.8 million on palladium exploration, comprised of 32,000 metres of drilling, and $9.1 million on gold exploration, comprised of 49,000 metres of drilling.
Lac des Iles Mine & Property
Exploration is central to LDI’s future and will represent an important part of future growth for the mine and for the Company. Situated in unique geology, LDI’s substantial +30,000-acre land package offers exploration upside that is further complimented by the underutilized, large 15,000-tonne per day mill. Beyond the mine site, most of the land has had minimal historic exploration. The exploration success achieved during the past few years gives management great encouragement that there is strong potential to continue to grow the Company’s palladium reserve and resource base through exploration.
The LDI mine consists of the following underground zones:
| · | Roby Zone: currently being mined. |
| · | Offset Zone: discovered in 2001, located below and approximately 250 metres south west of the Roby Zone. The Offset Zone remains open in all direction and continues to expand through exploration. LDI mine expansion is currently underway to access Offset Zone ore. |
| · | Cowboy Zone*: discovered in 2009 during infill drilling of the Offset Zone, located 30 to 60 metres to the west of the Offset Zone. This new discovery has the potential to extend LDI’s mine life and could potentially impact the economics of the mine. |
| · | Outlaw Zone*: discovered in 2009, located to the west of the Offset Zone and the Cowboy Zone. Further drilling is required to explore the vertical and lateral limit of this mineralization. |
| · | Sheriff Zone*: discovered in 2010, located approximately 100 metres south east of the Offset Zone. |
| * | The disclosure regarding these mineralized areas is conceptual in nature and there has been insufficient exploration to define a mineral resource in any of these areas. The current LDI mine plan does not include the three nearby underground zones: Cowboy, Outlaw, and Sherriff. |
During the first quarter, 63 holes totaling 23,251 metres were drilled at LDI, of which 13,925 metres represented exploration drilling and 9,326 metres was definition drilling as part of the mine expansion. Most of the exploration activities during the first quarter were related to definition drilling in the Offset Zone, as well as some surface drilling targeting the south extension of the Offset Zone.
1 Non-IFRS measure. Please refer to Non-IFRS Measures on pages 31-33.
FIRST QUARTER REPORT 2011
20
North American Palladium Ltd.
During the quarter, the Company also released the remainder of the 2010 drilling results. Highlights included:
| · | Continued positive drill results throughout the Offset Zone (including 40 metres at 6.2 g/t Pd) |
| · | Excellent results from definition drilling in the top part of the Offset Zone |
| · | Offset Zone continues to extend higher towards surface |
| · | Deep drilling results confirm Offset Zone continues at depth |
| · | Cowboy Zone intersected again in Offset drilling |
A mineral reserve and resource update incorporating 2010 drilling at LDI is currently being completed, expected to be filed later in the second quarter. It will exclude the new Cowboy, Outlaw and Sherriff zones as there is insufficient drilling on these zones at this time. Although the bulk of the 2010 drilling was infill drilling to facilitate planning for the mine expansion currently underway, early indication suggests there is likely to be a significant increase in resources driven by step-out drilling and lower cut-off grades as a result of the large increase in metal prices (palladium and by-product metals platinum, gold, copper, and nickel) since the date of the last resource update.
Sleeping Giant Gold Mine & Property
The Company expects there will be additional exploration potential at the Sleeping Giant mine as well as on the surrounding property. On February 14, 2011, the Company released the remainder of the 2010 drill results, which announced that stematic drilling from underground has improved the Company’s understanding of several known zones and extended them to greater depths towards three new proposed mine levels. As well, surface drilling near the mine encountered new gold veins. The new gold veins report grades of 11.7 g/t Au and 12.3 g/t Au over 1 metre, which are comparable to grades at the mine. These new occurrences are located approximately 500 metres south of the formerly worked JD zones.
An updated reserve and resource report that incorporated all the 2010 drilling (38,000 metres) at Sleeping Giant was recently released on April 27, 2011. The 2010 drilling at the Sleeping Giant mine increased the contained ounces in the measured and indicated category giving a higher level of confidence in the mineral resource.
Compared to the 2009 reserves and resources, the 2010 drilling program nearly tripled the measured and indicated resource tonnage, while at the same time conserving roughly the same reserves at the end of the year following a year of production. Contained ounces were slightly lower in the reserves category while they more than doubled in the measured and indicated resource categories. Tighter drilling conducted during the year reduced the overall grades but increased the confidence level of the estimation, whereas the overall gold content remained roughly the same year over year. More contained ounces were in higher categories at the end of 2010.
In 2011, NAP plans to conduct 26,500 metres of drilling at Sleeping Giant, targeting the zones below the 975 mine level and the three new levels at depth. This includes 25,000 metres of underground extensional drilling and 1,500 metres of surface drilling, Induced Polarization (“IP”) survey and Reverse Circulation (“RC”) drilling. During the first quarter of 2011, 47 underground drill holes completed 10,762 metres of drilling. Currently there are two drills testing the extensions of the zones to the proposed three new mining levels to prepare for development when the shaft deepening is completed at the end of the second quarter. A series of deep holes are also being completed to test the gold zones’ extensions up to 300 metres under the three new deeper levels of the mine to plan future development at Sleeping Giant. Results are expected in the fourth quarter of 2011.
FIRST QUARTER REPORT 2011
21
North American Palladium Ltd.
Vezza Gold Property
Vezza is an advanced-stage exploration project located in the prolific Abitibi region in Quebec, approximately 85 kilometres by paved road from the Sleeping Giant mine, and approximately 25 kilometres to the south of the town of Matagami. The deposit was historically subject to extensive surface and underground exploration (approximately 85,000 metres of drilling) and substantial underground development. When NAP took over in 2010, the work continued at an aggressive pace with 12,105 metres of drilling and dewatering of the underground drifts. During 2011, the Company will continue to advance Vezza through exploration and development towards a production decision by year end. Given the project’s quick ramp up potential, production could commence early in 2012 in the range of 39,000 ounces of gold per year over a 9-year mine life.
On February 14, 2011, the Company released the remainder of the 2010 drilling results. The surface drilling program confirmed both continuity and grade in the near surface, eastern extension of the deposit where only inferred resources currently exist. On April 27, 2011, NAP released an updated resource report for Vezza, as well as provided an update on exploration and development. Highlights include:
| · | Vezza’s measured and indicated resource increased by 12% to 321,000 contained ounces. Inferred resources total 121,000 ounces. |
| · | Remainder of 2010 drill hole assays from Vezza confirm continuity and grade, including the best result of 8.6 metres grading 14.6 g/t Au in hole V-10-210. |
| · | Vezza dewatering completed and permitting for bulk sampling well underway. |
The Company has dewatered the shaft and underground drifts to conduct underground diamond drilling. Underground rehabilitation of the drifts, stations and underground services (power, pumping and compressed air) is nearly complete. A 5,000-metre surface drilling program has started and two underground diamond drills are mobilized on site.
A bulk sample of up to 40,000 tonnes is also scheduled for the end of the third quarter of 2011. The Company has approval from the Ministry of Natural Resources and Wildlife for the bulk sample and is completing the permitting process with the Ministry of Sustainable Development, Environment and Parks.
The Company is planning to spend $25.8 million in 2011 to advance the Vezza project towards a production decision expected in the fourth quarter. These expenditures are expected to be reduced by estimated pre-production revenue.
Flordin Property
The Flordin project is located in the prolific Abitibi region in Quebec, approximately 30 kilometres north of the town of Lebel-sur-Quévillion, and approximately 70 kilometres away from the Sleeping Giant mill. The Company conducted a significant drilling program in 2010, consisting of 212 holes totaling 25,720 metres, which revealed the presence of several parallel gold veins near surface. The Company believes that the Flordin gold project has the potential to provide additional feed for the Sleeping Giant mill and is currently examining open pit scenarios.
An updated estimate of mineral resources was begun by an independent consultant and is expected to be ready in the second quarter of 2011 after all the drill holes are logged and analyses received. Although not all results are yet available, selected results released on February 14, 2011 announced that systematic definition drilling extended Flordin’s known gold zones east and west and identified several new zones, immediately south of historical resources.
In 2011, NAP plans to conduct 4,500 metres of drilling to evaluate open pit potential, permitting and bulk sampling. During the first quarter, samples of the gold zones and of waste rock were sent to a specialized lab for ore sorting tests. Ore sorting, if successful, would reduce tonnage being trucked to the Sleeping Giant mill, and achieve better grade control.
FIRST QUARTER REPORT 2011
22
North American Palladium Ltd.
Discovery Property
Discovery is an advanced-stage gold exploration project located in the prolific Abitibi region in Quebec, approximately 35 kilometres northwest of the town of Lebel-sur-Quévillon, and approximately 70 kilometres from the Sleeping Giant mine and mill. The Discovery project is contiguous to the Flordin project. A 2008 scoping study confirmed the project to be economically feasible and generate positive cash flow under certain assumptions, with potential to produce 44,000 ounces of gold per year for four years. During 2011, the Company intends to update the scoping study with current costs and revised estimates of future gold prices.
In 2010, 40 drill holes totalling 25,495 metres were completed, two-thirds of which have now been logged and analyses received. Drilling was aimed at extending the 1200E zone, which was not considered in the 2008 Scoping Study, which considered the west gold zones only. Drilling the eastern extension of the 1200E zone has revealed new gold zones at depth and followed known zones deeper and eastward. An updated estimate of resources will be prepared once all data has been received and integrated into a geological model, expected in the second quarter of 2011.
In 2011, the Company plans to conduct 8,000 metres of drilling on the project, targeting the extension of the 1200R Zone, and to advance permitting.
Legris Lake Property
During the second quarter of 2010, the Company signed an Option and Purchase Agreement with prospectors pursuant to which the Company can acquire a 100% interest in the Legris Lake property in exchange for cash payments totalling $0.3 million, advance royalty payments totalling $0.1 million, and a 2.5% NSR. A portion of the royalty can be purchased by the Company and the Company has a right of first refusal on the sale of the royalties.
The property is adjacent to the south east portion of the Company’s LDI property and is comprised of 15 claims and covering an area of approximately 4,297 hectares. The property is underlain by mafic and ultramafic rocks and was optioned for its PGE potential. The property is at a preliminary exploration stage, however given its PGM potential and close proximity to the LDI mill presents an exciting exploration target. In 2011, NAP plans to conduct 3,000 metres of drilling at this property.
Dormex Property
Dormex is an early-stage gold exploration project in the Abitibi region of Quebec, located adjacent to the Sleeping Giant mine and mill and is believed to have potential gold targets similar to Sleeping Giant. The 2010 exploration program included a major reverse circulation drill program to better delineate overburden gold anomalies, as well as ground and airborne geophysics. Logging and analysis of the 2010 work (4,206 metres of drilling) is ongoing, expected to be completed during the second quarter, and is expected to influence the 2011 drilling program once all new information is interpreted and integrated.
In 2011, NAP plans to conduct 2,400 metres of drilling, IP surveys and RC drilling. The Company is currently preparing for surface drilling to follow-up on gold anomalies discovered in the 2010 reverse circulation program, and to test new geophysical targets.
Cameron Shear and Florence Properties
Cameron Shear and Florence are early-stage gold exploration projects in the Abitibi region in Quebec, adjacent to the east of the Discovery gold deposit, and near the Flordin deposit. Drilling on a number of geophysical targets has improved the Company’s understanding of the early-stage property, although economic intersections have yet been encountered at this juncture. Logging of drill core from the 2010 program is currently ongoing and is expected to be completed in the second quarter of 2011.
FIRST QUARTER REPORT 2011
23
North American Palladium Ltd.
Laflamme Gold Property
Laflamme is an early-stage gold exploration project in the Abitibi region of Quebec. The property is situated on favourable geology, following the trend from NAP’s Discovery project to the Sleeping Giant mine. The Company has the option to acquire a 50% interest in the property over four years for cash payments totalling $100,000 plus exploration expenditures totalling $1 million over four years.
In 2011, the Company plans to conduct 2,400 metres of drilling and ground geophysics. During the first quarter, three surface holes completed 1,176 metres of drilling, and the Company completed a geophysical grid and survey on the property. NAP is currently preparing for permits and access for two new drill holes on geophysical targets.
Shebandowan Property
The Company holds a 50% interest in the former producing Shebandowan mine and the surrounding Haines and Conacher properties pursuant to an Option and Joint Venture Agreement with Vale Inco Limited (“Vale”). The properties, known as the Shebandowan property, contain a series of nickel copper-PGM mineralized bodies. The land package, which totals approximately 7,842 hectares, is located 90 kilometres west of Thunder Bay, Ontario, and approximately 100 kilometres southwest from the Company’s LDI mine. Vale retains an option to increase its interest from 50% to 60%, exercisable in the event that a feasibility study on the property results in a mineral reserve and mineral resource estimate of the equivalent of 200 million pounds of nickel and other metals.
In 2010, the Company and Vale conducted a large ground geophysical survey on the property. Preliminary results support further exploration work on the property.
CRITICAL ACCOUNTING POLICIES AND ESTIMATES
Critical accounting policies generally include estimates that are highly uncertain and for which changes in those estimates could materially impact the Company’s financial statements. The following accounting policies are considered critical:
| a. | Use of Estimates |
The preparation of the interim consolidated financial statements in conformity with IFRS requires management to make judgments, estimates, and assumptions that affect the application of accounting policies and the reported amount of assets and liabilities, the disclosure of contingent assets and liabilities at the date of the financial statements and the reported amounts of revenue and expenses during the year. Significant estimates and assumptions relate to recoverability of mining operations and mineral exploration properties. While management believes that these estimates and assumptions are reasonable, actual results could vary significantly.
Certain assumptions are dependent upon reserves, which represent the estimated amount of ore that can be economically and legally extracted from the Company’s properties. In order to estimate reserves, assumptions are required about a range of geological, technical and economic factors, including quantities, grades, production techniques, recovery rates, production costs, transportation costs, commodity demand, commodity prices and exchange rates. Estimating the quantity and/or grade of reserves requires the size, shape and depth of ore bodies to be determined by analyzing geological data such as drilling samples. This process may require complex and difficult geological judgments to interpret the data. Estimates and underlying assumptions are reviewed on an ongoing basis. Revisions to accounting estimates are recognized in the period in which the estimates are revised and in any future periods affected.
Because the economic assumptions used to estimate reserves change from period to period, and because additional geological data is generated during the course of operations, estimates of reserves may change from period to period. Changes in reported reserves may affect the Company’s financial results and financial position in a number of ways, including the following:
| · | Asset carrying values may be affected due to changes in estimated future cash flows; |
FIRST QUARTER REPORT 2011
24
North American Palladium Ltd.
| · | Depreciation and amortization charged in the income statement may change where such charges are determined by the units of production basis, or where the useful economic lives of assets change; |
| · | Overburden removal costs recorded on the balance sheet or charged to the income statement may change due to changes in the units of production basis of depreciation and amortization; |
| · | Decommissioning, site restoration and environmental provisions may change where changes in estimated reserves affect expectations about the timing or cost of these activities; and |
| · | The carrying value of deferred tax assets may change due to changes in estimates of the likely recovery of the tax benefits. |
| b. | Impairment assessments of long-lived assets |
The carrying amounts of the Company’s non-financial assets, other than investment property, inventories and deferred tax assets, are reviewed at each reporting date to determine whether there is any indication of impairment. Impairment is assessed at the level of cash-generating units (“CGUs”). An impairment loss is recognized in the Consolidated Statements of Operations and Comprehensive Loss for any excess of carrying amount over the recoverable amount.
Impairment is determined for an individual asset unless the asset does not generate cash inflows that are independent of those generated from other assets or groups of assets, in which case, the individual assets are grouped together into CGUs for impairment purposes.
The recoverable amount of an asset or cash-generating unit is the greater of its “value in use” and its “fair value less costs to sell”. In assessing value in use, the estimated future cash flows are discounted to their present value using a pre-tax discount rate that reflects current market assessments of the time value of money and the risks specific to the asset.
An impairment loss is recognized in the Consolidated Statements of Operations and Comprehensive Loss if the carrying amount of an asset or its CGU exceeds its estimated recoverable amount. The recoverable amount of an asset is the higher of its fair value less costs to sell and its value in use.
Impairment losses recognized in prior periods are assessed at each reporting date for any indications that the loss has decreased or no longer exists. An impairment loss on non-financial assets other than goodwill is reversed if there has been a change in the estimates used to determine the recoverable amount, only to the extent that the asset’s carrying amount does not exceed the carrying amount that would have been determined, net of amortization, if no impairment loss had been recognized.
| c. | Depreciation and amortization of mining interests |
Mining interests relating to plant and equipment, mining leases and claims, royalty interests, and other development costs are recorded at cost with depreciation and amortization provided on the unit-of-production method over the estimated remaining ounces of palladium (LDI) and gold (NAP Quebec) to be produced based on the proven and probable reserves.
Mining interests relating to small vehicles and certain machinery with a determinable expected life are recorded at cost with depreciation provided on a straight-line basis over their estimated useful lives, ranging from three to seven years, which most closely reflects the expected pattern of consumption of the future economic benefits embodied in the asset. Straight-line depreciation is calculated over the depreciable amount, which is the cost of an asset, less its residual value.
Significant components of individual assets are assessed and if a component has a useful life that is different from the remainder of that asset, that component is depreciated separately using the unit-of-production or straight-line method as appropriate. Costs relating to VBPP and land are not amortized.
FIRST QUARTER REPORT 2011
25
North American Palladium Ltd.
Leased assets are depreciated over the shorter of the lease term and their useful lives unless it is reasonably certain that the Company will obtain ownership by the end of the lease term.
Depreciation methods, useful lives and residual values are reviewed at each financial year-end and adjusted if appropriate.
| d. | Revenue recognition |
Revenue from the sale of metals in the course of ordinary activities is measured at the fair value of the consideration received or receivable, net of volume adjustments. Revenue is recognized when persuasive evidence exists, usually in the form of an executed sales agreement, that the significant risks and rewards of ownership have been transferred to the buyer, recovery of the consideration is probable, the associated costs and possible return of goods can be estimated reliably, there is no continuing management involvement with the goods, and the amount of revenue can be measured reliably. The timing of the transfers of risks and rewards varies depending on the individual terms of the contract of sale.
Revenue from the sale of palladium and by-product metals from the LDI mine is provisionally recognized net of royalties based on quoted market prices upon the delivery of concentrate to the smelter or designated shipping point, which is when title transfers and significant rights and obligations of ownership pass. The Company’s smelter contract provides for final prices to be determined by quoted market prices in a period subsequent to the date of concentrate delivery. Variations from the provisionally priced sales are recognized as revenue adjustments until final pricing is determined. Accounts receivable is recorded net of estimated treatment and refining costs which are subject to final assay adjustments. Subsequent adjustments to provisional pricing amounts due to changes in metal prices and foreign exchange are reflected separately from initial revenues on the consolidated statements of operations and comprehensive loss.
Revenue from the sale of gold-silver doré bars from Sleeping Giant is recognized when the significant risks and rewards of ownership have transferred to the buyer and selling prices are known or can be reasonably estimated.
| e. | Asset retirement obligations |
In accordance with Company policies, asset retirement obligations relating to legal and constructive obligations for future site reclamation and closure of the Company’s mine sites are recognized when incurred and a liability and corresponding asset are recorded at fair value. Estimated closure and restoration costs are provided for in the accounting period when the obligation arising from the related disturbance occurs.
The amount of any liability recognized is estimated based on the risk-adjusted costs required to settle present obligations, discounted using a pre-tax risk-free discount rate consistent with the time period of expected cash flows. When the liability is initially recorded, a corresponding asset retirement cost is recognized as an addition to mining interests and amortized using the unit of production method.
The liability for each mine site is accreted over time to reflect the unwinding of the discount. The accretion charges are recognized as a finance cost in the Consolidated Statements of Operations and Comprehensive Loss. The liability is subject to re-measurement at each reporting date based on changes in discount rates and timing or amounts of the costs to be incurred. Changes in the liability, other than accretion charges, relating to mine rehabilitation and restoration obligations are added to or deducted from the carrying value of the related asset retirement cost in the reporting period recognized. If the change results in a reduction of the obligation in excess of the carrying value of the related asset retirement cost, the excess balance is recognized as a recovery through profit or loss in the period.
1 Non-IFRS measure. Please refer to Non-IFRS Measures on pages 31-33.
FIRST QUARTER REPORT 2011
26
North American Palladium Ltd.
ACCOUNTING STANDARDS
Impact of International Financial Reporting Standards (“IFRS”)
Accounting Policies
During the conversion project, the Company compared and evaluated the impact of IFRS standards on its operations in comparison to those standards previously applied under Canadian GAAP. The Company completed its final review of the applicability of IFRS 1 elections and has adopted IFRS during the first quarter of 2011, the first filing under IFRS.
The following discussion outlines details of certain accounting policies the Company has applied which have been reflected in the Company’s IFRS consolidated opening balance sheet for the January 1, 2010 date of transition to IFRS and subsequent periods. A detailed discussion of accounting policies applied under IFRS is included in Note 3 and the quantitative impact of adopting IFRS is further discussed in Note 20 of the condensed interim consolidated financial statements for March 31, 2011.
Functional Currency
Based upon the application of IAS 21 (The Effects of Changes in Foreign Exchange Rates), the Company has determined that the Canadian dollar appropriately represents both its functional and reporting currency for the purposes of reporting under IFRS. This methodology is consistent with Canadian GAAP applied previously and did not result in additional translation adjustments.
Mining Interests and Depreciation and Amortization
Although certain aspects of the standards under Canadian GAAP are converged with IFRS, differences still exist primarily with regards to the determination of impairment of assets under IAS 36. Under IFRS, the Company is required to identify cash generating units (“CGU’s”) independently for each of its consolidated entities. These CGU’s represent the smallest group of assets which are capable of generating cash independently from other assets held by the Company.
In determining whether impairment exists under Canadian GAAP, the Company performs a two-step approach that compares the net book value of assets to the undiscounted and discounted expected future cash flows from operations. Under IFRS, a one-step approach is used by which the determination of impairments require the comparison of the net book value of each of the CGU’s to the recoverable amount of the CGU. The recoverable amount is determined as the higher of the fair value of the expected future cash flows from that CGU, less costs to sell (“Fair Value Less Cost to Sell”) and the “Value in Use”.
Under Canadian GAAP, any impairment assessed is not reversed. Under IFRS, impairments assessed must be reversed in subsequent periods should economic conditions recover.
In accordance with IFRS 1, the Company may elect to measure certain property, plant and equipment at the date of transition to IFRSs at fair value and deem that fair value to be the cost of those assets at that date. The fair value of property, plant and equipment may be based on a previous GAAP revaluation at, or before, the date of transition to IFRS.
Under Canadian GAAP, the carrying value of the mineral properties and fixed assets at LDI were previously impaired and were written down to fair value at December 31, 2008. In addition, the Sleeping Giant mine was acquired in 2009 and was included on the books at fair value on the date of acquisition. The Company has elected to use the Canadian GAAP impaired and acquisition amounts as the deemed cost for the mineral properties and fixed assets for each mine respectively. Therefore, no adjustment existed on transition to IFRS on January 1, 2010 as no further impairments were identified subsequent to the fair value dates for each property.
Financial Instruments
Although the allocation of fair values between the debt and equity components of compound financial instruments issued by the Company is performed differently under IAS 32, Financial Instruments Presentation, from the pro-rata method applied under Canadian GAAP, the measurement of the fair values of such instruments does not differ materially.
FIRST QUARTER REPORT 2011
27
North American Palladium Ltd.
The Company has elected to apply the IFRS 1 exemption relating to compound financial instruments. Therefore, transition variances relating to debt instruments fully repaid prior to the January 1, 2010 transition date have not been recognized. As a result, only outstanding debt instruments and compound instruments denominated in foreign currencies would require retrospective restatement to comply with the standards within IAS 32 at the time of transition to IFRS on January 1, 2010.
The adoption of IAS 32 resulted in material reallocations of balances within the Company’s debt and equity accounts. The impact of the adoption of IAS 32 was limited primarily to the foreign-denominated convertible notes and related embedded derivatives issued by the Company in 2006.
Management is presently reviewing proposed amendments to IFRS standards relating to financial instruments which may further impact the adjustments required for conversion to IFRS. Therefore, the Company’s determination of the financial impact of the final transition adjustments may be impacted by future amendments to IFRS standards.
Share-Based Payment Transactions
Under Canadian GAAP, stock compensation expense can be calculated on a straight-line depreciation method over the respective vesting period for each stock option. In accordance with IFRS 2, stock compensation expense is recognized on a graduated method over the vesting period and a provision is generally applied against the recognized expense based on the historical rate of non-vesting of options.
Under Canadian GAAP, the fair value assigned to the liability of outstanding RSU’s is the value of the Company’s share price at each reporting date. Under IFRS, the fair value of the RSU liability at each reporting date is calculated by applying an option pricing model. Management has utilized the Black-Scholes model to determine the option value contained in each RSU.
The Company’s election under IFRS 1 relating to share-based payments has restricted the adjustments relating to the measurement of such equity instruments to only those instruments granted after November 7, 2002 and which have not vested at the date of transition of January 1, 2010.
Mine Reclamation Obligations
The measurement of decommissioning liabilities and related balances included in the cost of property, plant and equipment in accordance with IAS 37 – Provisions, Contingent Liabilities and Contingent Assets differs from that applied by the Company under Canadian GAAP. An election by the Company under IFRS 1 has resulted in the initial measurement of these amounts as at January 1, 2010 with prospective application of IFRS standards subsequent to that date.
Flow-Through Shares
Under Canadian GAAP, the accounting treatment of flow-through shares is addressed by Emerging Issues Committee (“EIC”) 146, Flow-Through Shares. Under IFRS, IAS 12, Income Taxes, contains no specific guidance on the appropriate accounting for flow-through shares. Therefore, entities are required to apply judgment in developing an appropriate model accounting policy based on the principles of IFRS standards.
SIC Interpretation 25, Income Taxes – Changes in the Tax Status of an Entity or its Shareholders, provides some additional guidance in that it requires that the current and deferred tax consequences of a change in tax status shall be included in profit or loss for the period, unless those consequences relate to transactions and events that result in a direct credit to the recognized amount of equity. The portion of tax liabilities or assets related to such recognized equity amounts which is not included in profit or loss must be charged or credited directly to equity.
Under Canadian GAAP, proceeds received from the issue of flow-through shares are included in the value of the Company’s common share capital. The subsequent renunciation of tax deductions by the Company results in the recognition of a future tax liability and an equivalent charge is applied to reduce common share capital.
FIRST QUARTER REPORT 2011
28
North American Palladium Ltd.
Under IFRS, on the date of issuance of the flow-through shares, the premium relating to the proceeds received in excess of the closing market price of the Company’s common shares is allocated to liabilities. As the tax attributes of the related expenditures are renounced to investors and deferred income tax expense and deferred income tax liabilities are increased by the estimated income tax benefits renounced by the Company to the investors. The premium liability is reduced pro-rata based on the percentage of flow-through expenditures renounced in comparison to renunciations required under the terms of the flow-through share agreement. The reduction to the premium liability in the period of renunciation is recognized through profit or loss as other income.
Where the Company has unused tax benefits on loss carry forwards and tax pools in excess of book value available for deduction against which a valuation allowance has been provided, the Company reduces its valuation allowance to offset the increase in deferred tax liabilities resulting in an offsetting recovery of deferred income taxes being recognized through profit or loss in the reporting period.
Revenue Recognition
Revenue from the sale of palladium and by-product metals from the LDI mine is provisionally recognized net of royalties based on quoted market prices upon the delivery of concentrate to the smelter or designated shipping point, which is when title transfers and significant rights and obligations of ownership pass. Revenue from the sale of gold-silver doré bars from Sleeping Giant is recognized when the significant risks and rewards of ownership have transferred to the buyer and selling prices are known or can be reasonably estimated.
Since each of the above methods of revenue recognition are supported by IAS 18, and the Company recognizes revenues separately for each of the metals contained in the concentrate and doré bars, management’s initial review of IAS 18 (Revenue) did not identify any significant issues which would require a material change to the Company’s existing revenue recognition policies at the IFRS transition date.
Income Taxes
Similar to Canadian GAAP, deferred tax assets and liabilities are recognized under IFRS based on temporary timing differences between the carrying value of assets and liabilities for accounting purposes and the respective value assigned to those assets and liabilities for tax purposes. As a result, the Company has recognized the corresponding increase or decrease in its reported deferred tax asset or liability balances at the January 1, 2010 IFRS transition date and subsequent reporting periods based on the resultant differences between the restated carrying value of assets and liabilities under IFRS and their associated tax bases.
Internal Controls over Financial Reporting & Disclosure Controls and Procedures
Management has continually evaluated the impact of the adoption of IFRS on the reporting and disclosure processes of the Company. Throughout the conversion project, management has made those modifications to its data analysis, information systems, and reporting processes that were required to incorporate the collection of information necessary under IFRS.
As a result of the convergence of Canadian GAAP with IFRS standards, the Company has not presently incorporated any material changes to its ICFR or DC&P during the course of its conversion project. Most changes to the Company’s internal controls were already incorporated incrementally over time as a result of the Company’s adoption of the converged standards.
In conjunction with the analysis of the Company’s January 1, 2010 opening balances under IFRS, management has implemented changes to certain of its internal reports and data analysis to facilitate the appropriate collection of data for IFRS reporting purposes. The changes were implemented in parallel to existing reporting and appropriately reconciled to previously reported totals to ensure the completeness and accuracy of the revised reports and analyses. Since these changes represented only a component part of the reporting process, no material changes to the Company’s internal controls have been specifically required as a result of these modifications.
FIRST QUARTER REPORT 2011
29
North American Palladium Ltd.
Business Activities
The conversion to IFRS may result in certain consequences which are dependent upon how certain business activities are approached, monitored, or concluded by the Company. Consideration of such issues as foreign currency, hedging activities, debt covenants, compensation arrangements, and risk management practices may be required.
Whereas foreign currency considerations, compensation arrangements, and risk management issues are addressed by the Company on a regular basis, at January 1, 2010, the Company did not have any outstanding debt, with the exception of certain capital leases, and no hedging activities or contracts existed. Management will continue to monitor the impact of IFRS upon its current and future business activities.
Information Systems
In order to facilitate the compilation of information required for IFRS reporting and disclosures, management has made appropriate modifications to its information gathering and analysis procedures. However, no material changes to the Company’s existing accounting systems or related internal controls have been required. Those changes which have been implemented generally required minor changes to reports or data analysis to ensure that additional information required for disclosures under IFRS that were not currently collected under Canadian GAAP were appropriately tracked for IFRS reporting purposes.
RISKS AND UNCERTAINTIES
The risks and uncertainties are discussed within the Company’s most recent Form 40-F/Annual Information Form on file with the SEC and Canadian provincial securities regulatory authorities.
INTERNAL CONTROLS
Disclosure Controls and Procedures
Management is responsible for the information disclosed in this management’s discussion and analysis and has in place the appropriate information systems, procedures and controls to ensure that information used internally by management and disclosed externally is, in all material respects, complete and reliable.
For the three months ended March 31, 2011, the President and Chief Executive Officer and Vice President, Finance and Chief Financial Officer certify that they have designed, or caused to be designed under their supervision, disclosure controls and procedures to provide reasonable assurance that material information relating to the Company and its consolidated subsidiaries would be made known to them by others within those entities.
The disclosure controls and procedures are evaluated annually through regular internal reviews which are carried out under the supervision of, and with the participation of, the Company’s management, including the President and Chief Executive Officer and Vice President, Finance and Chief Financial Officer.
Internal Control over Financial Reporting
For the three-months ended March 31, 2011, the President and Chief Executive Officer and Vice President, Finance and Chief Financial Officer certify that they have designed, or caused to be designed under their supervision, internal controls over financial reporting to provide reasonable assurance regarding the reliability of financial reporting and the preparation of the financial statements for external purposes in accordance with International Financial Reporting Standards (“IFRS”).
There have been no changes in the Company’s internal controls over the financial reporting that occurred during the most recent period ended March 31, 2011 that have materially affected or are reasonably likely to materially affect, the Company’s internal control over financial reporting. Additional disclosure regarding internal controls is provided within the discussion of the impact of IFRS earlier in this MD&A.
FIRST QUARTER REPORT 2011
30
North American Palladium Ltd.
Management is responsible for establishing and maintaining adequate internal controls over financial reporting. Internal control over financial reporting, no matter how well designed, has inherent limitations and can only provide reasonable assurance, not absolute assurance, with respect to the preparation and fair presentation of published financial statements and management does not expect such controls will prevent or detect all misstatements due to error or fraud. The Company is continually evolving and enhancing its systems of controls and procedures.
Under the supervision and with the participation of the President and Chief Executive Officer and the Vice President, Finance and Chief Financial Officer, management performs regular internal reviews and conducts an annual evaluation of the effectiveness of its internal control over financial reporting based on the framework in Internal Control – Integrated Framework issued by the Committee of Sponsoring Organizations of the Treadway Commission.
OTHER INFORMATION
Additional information regarding the Company is included in the Company’s Annual Information Form and Annual Report on Form 40-F, which are filed with the SEC and the provincial securities regulatory authorities, respectively. A copy of the Company’s Annual Information Form is posted on the SEDAR website at www.sedar.com. A copy of the Annual Report or Form 40-F can be obtained from the SEC’s website at www.sec.gov.
NON-IFRS MEASURES
This MD&A refers to cash used in operating activities per share and cash cost per ounce which are not recognized measures under Canadian GAAP. Such Non-IFRS financial measures do not have any standardized meaning prescribed by Canadian GAAP and are therefore unlikely to be comparable to similar measures presented by other issuers. Management uses these measures internally. The use of these measures enables management to better assess performance trends. Management understands that a number of investors, and others who follow the Company’s performance, assess performance in this way. Management believes that these measures better reflect the Company’s performance and are better indications of its expected performance in future periods. This data is intended to provide additional information and should not be considered in isolation or as a substitute for measures of performance prepared in accordance with Canadian GAAP. The following tables reconcile these non-IFRS measures to the most directly comparable Canadian GAAP measures:
Reconciliation of Cash Used in Operations per Share*
| Three months ended March 31 | ||||||||
| (expressed in thousands of dollars except per share amounts) | 2011 | 2010* | ||||||
| Cash provided by (used in) operations prior to changes in non-cash working capital | $ | (6,568 | ) | $ | (12,186 | ) | ||
| Weighted average number of shares outstanding – basic and diluted | 160,198,305 | 127,405,601 | ||||||
| Cash provided by (used in) operations prior to changes in non-cash working capital per share | $ | (0.04 | ) | $ | (0.10 | ) | ||
| * | Certain prior period amounts have been reclassified to conform to the classification adopted in the current period. |
Total Cash Costs
The Company reports total cash costs on a sales basis. Total cash costs include mine site operating costs such as mining, processing, administration, and royalties, but is exclusive of depreciation, amortization, reclamation, capital and exploration costs. Total cash costs are reduced by any by-product revenue and is then divided by ounces sold to arrive at the total by-product cash cost of sales. This measure, along with revenues, is considered to be a key indicator of a company’s ability to generate operating earnings and cash flow from its mining operations.
FIRST QUARTER REPORT 2011
31
North American Palladium Ltd.
| (a) | Reconciliation of Palladium Total Cash Cost per Ounce |
| Three months ended March 31 | ||||||||
| (expressed in thousands of dollars except per ounce amounts) | 2011 | 2010 | ||||||
| Production costs including overhead | $ | 20,039 | - | |||||
| Smelting, refining and freight costs | 1,427 | - | ||||||
| Royalty expense | 1,126 | - | ||||||
| 22,592 | - | |||||||
| Less by-product metal revenue | 6,939 | - | ||||||
| $ | 15,653 | - | ||||||
| Divided by ounces of palladium sold | 30,455 | - | ||||||
| Cash cost per ounce (CDN$) | $ | 514 | - | |||||
| Exchange rate (CDN$1 – US$) | 1.01 | - | ||||||
| Cash cost per ounce (US$) | $ | 519 | - | |||||
| (b) | Reconciliation of Gold Total Cash Cost per Ounce |
| Three months ended March 31 | ||||||||
| (expressed in thousands of dollars except per ounce amounts) | 2011 | 2010 | ||||||
| Production costs including overhead | $ | 10,388 | $ | 10,049 | ||||
| Refining and freight costs | 12 | 18 | ||||||
| 10,400 | 10,067 | |||||||
| Less by-product metal revenue | 346 | 179 | ||||||
| 10,054 | 9,888 | |||||||
| Divided by ounces of gold sold | 5,100 | 6,700 | ||||||
| Cash cost per ounce (CDN$) | $ | 1,971 | $ | 1,476 | ||||
| Exchange rate (CDN$1 – US$) | 1.01 | 0.96 | ||||||
| Cash cost per ounce (US$) | $ | 1,991 | $ | 1,417 | ||||
| (c) | Adjusted net income (loss) |
Adjusted net income (loss) is a Non-IFRS financial measure, which excludes the following from net income (loss):
| · | Exploration; |
| · | Mine startup costs; |
| · | Mine shutdown costs; |
| · | Asset impairment charges; |
| · | Loss (gain) on disposal of equipment; and |
| · | Insurance recoveries. |
| Three months ended March 31 | ||||||||
| 2011 | 2010 | |||||||
| Net loss and comprehensive loss for the year | $ | (10,321 | ) | $ | (18,351 | ) | ||
| Exploration | 3,839 | 4,165 | ||||||
| Mine startup costs | - | 6,002 | ||||||
| Loss on disposal of equipment | - | 9 | ||||||
| Adjusted net income (loss) | $ | (6,482 | ) | $ | (8,175 | ) | ||
FIRST QUARTER REPORT 2011
32
North American Palladium Ltd.
| (d) | Adjusted EBITDA |
Adjusted EBITDA is a Non-IFRS financial measure, which excludes the following from net income (loss):
| · | Income and mining tax expense (recovery); |
| · | Interest and other financing costs (income); |
| · | Depreciation and amortization; |
| · | Exploration; |
| · | Mine startup costs; |
| · | Mine shutdown costs; |
| · | Loss (gain) on disposal of equipment; and |
| · | Insurance recoveries. |
Management believes that EBITDA is a valuable indicator of the Company’s ability to generate liquidity by producing operating cash flow to fund working capital needs, service debt obligations, and fund capital expenditures.
EBITDA excludes the impact of cash costs of financing activities and taxes, and the effects of changes in operating working capital balances, and therefore is not necessarily indicative of operating profit or cash flow from operations as determined under IFRS. Other companies may calculate EBITDA differently.
| Three months ended March 31 | ||||||||
| 2011 | 2010 | |||||||
| Net loss and comprehensive loss for the year | $ | (10,321 | ) | $ | (18,351 | ) | ||
| Income and mining tax expense (recovery) | 2,812 | 3,345 | ||||||
| Interest and other financing costs (income) | (412 | ) | (1,995 | ) | ||||
| Depreciation and amortization | 4,165 | 2,024 | ||||||
| EBITDA | (3,756 | ) | (14,977 | ) | ||||
| Exploration | 3,839 | 4,165 | ||||||
| Mine startup costs | - | 6,002 | ||||||
| Loss (gain) on disposal of equipment | - | 9 | ||||||
| Adjusted EBITDA | $ | 83 | $ | (4,801 | ) | |||
FIRST QUARTER REPORT 2011
33