North American Palladium Ltd.
TABLE OF CONTENTS
| | | Page |
| | | |
| Management’s Discussion and Analysis | | |
| | | |
| INTRODUCTION | | 1 |
| | | |
| FORWARD-LOOKING INFORMATION | | 1 |
| | | |
| CAUTIONARY NOTE TO U.S. INVESTORS CONCERNING MINERAL RESERVES AND RESOURCES | | 2 |
| | | |
| OUR BUSINESS | | 2 |
| | | |
| KEY HIGHLIGHTS | | 3 |
| | | |
| EXECUTIVE SUMMARY | | 4 |
| | | |
| FINANCIAL REVIEW | | 9 |
| | | |
| FINANCIAL CONDITION, CASH FLOWS, LIQUIDITY AND CAPITAL RESOURCES | | 14 |
| | | |
| OUTSTANDING SHARE DATA | | 17 |
| | | |
| REVIEW OF OPERATIONS | | 17 |
| | | |
| EXPLORATION UPDATE | | 20 |
| | | |
| FUTURE ACCOUNTING STANDARDS | | 27 |
| | | |
| RISKS AND UNCERTAINTIES | | 30 |
| | | |
| INTERNAL CONTROLS | | 31 |
| | | |
| OTHER INFORMATION | | 31 |
| | | |
| NON-IFRS MEASURES | | 31 |
North American Palladium Ltd.
Management’s Discussion and Analysis
Unless the context suggests otherwise, references to “NAP” or the “Company” or similar terms refer to North American Palladium Ltd. and its subsidiaries. “LDI” refers to Lac des Iles Mines Ltd., and “Cadiscor” refers to Cadiscor Resources Inc. On March 4, 2011, the name Cadiscor Resources Inc., was changed to NAP Quebec Mines Ltd.
The following is management’s discussion and analysis (“MD&A”) of the financial condition and results of operations to enable readers of the Company’s consolidated financial statements and related notes to assess material changes in financial condition and results of operations for the three and six months ended June 30, 2011, compared to those of the respective periods in the prior year. This MD&A has been prepared as of August 10, 2011 and is intended to supplement and complement the unaudited consolidated financial statements and notes thereto for the three and six months ended June 30, 2011 (collectively, the “Financial Statements”). Readers are encouraged to review the Financial Statements in conjunction with their review of this MD&A and the most recent Form 40-F/Annual Information Form on file with the U.S. Securities and Exchange Commission (“SEC”) and Canadian provincial securities regulatory authorities, available at www.sec.gov and www.sedar.com, respectively.
All amounts are in Canadian dollars unless otherwise noted and all references to production ounces refer to payable production.
FORWARD-LOOKING INFORMATION
Certain information included in this MD&A, including any information as to the Company’s future financial or operating performance and other statements, which include future oriented financial information, that express management’s expectations or estimates of future performance, constitute ‘forward looking statements’ within the meaning of the ‘safe harbor’ provisions of the United States Private Securities Litigation Reform Act of 1995 and Canadian securities laws. The words ‘expect’, ‘believe’, ‘will’, ‘intend’, ‘estimate’, ‘plan’, ‘targeting’, ‘goal’, ‘vision’ and similar expressions identify forward-looking statements. Forward-looking statements are necessarily based upon a number of estimates and assumptions that, while considered reasonable by management, are inherently subject to significant business, economic and competitive uncertainties, risks and contingencies. The Company cautions the reader that such forward-looking statements involve known and unknown risks, uncertainties and other factors that may cause the actual financial results, performance or achievements of the Company to be materially different from the Company’s estimated future results, performance or achievements expressed or implied by those forward-looking statements and that the forward-looking statements are not guarantees of future performance. These statements are also based on certain factors and assumptions including factors and assumptions related to future prices of palladium, gold and other metals, the Canadian dollar exchange rate, the ability of the Company to meet operating cost estimates, inherent risks associated with mining and processing, the ability of the Company to obtain required financing, as well as those estimates, risks, assumptions and factors described in the Company’s most recent Form 40-F/Annual Information Form on file with the SEC and Canadian provincial securities regulatory authorities. In addition, there can be no assurance that the Company’s Lac des Iles and Sleeping Giant mines will operate as anticipated, or that the Offset Zone, the Vezza Gold Project and the other properties can be successfully developed. The Company disclaims any obligation to update or revise any forward-looking statements, whether as a result of new information, events or otherwise, except as expressly required by law. Readers are cautioned not to put undue reliance on these forward-looking statements.
SECOND QUARTER REPORT 2011
North American Palladium Ltd.
CAUTIONARY NOTE TO U.S. INVESTORS CONCERNING MINERAL RESERVES AND RESOURCES
Mineral reserve and mineral resource information contained herein has been calculated in accordance with National Instrument 43-101 – Standards of Disclosure for Mineral Projects, as required by Canadian provincial securities regulatory authorities. Canadian standards differ significantly from the requirements of the SEC, and mineral reserve and mineral resource information contained herein is not comparable to similar information disclosed in accordance with the requirements of the SEC. While the terms “measured”, “indicated” and “inferred” mineral resources are required pursuant to National Instrument 43-101, the SEC does not recognize such terms. U.S. investors should understand that “inferred” mineral resources have a great amount of uncertainty as to their existence and great uncertainty as to their economic and legal feasibility. In addition, U.S. investors are cautioned not to assume that any part or all of NAP’s mineral resources constitute or will be converted into reserves. For a more detailed description of the key assumptions, parametres and methods used in calculating NAP’s mineral reserves and mineral resources, see NAP’s most recent Annual Information Form/Form 40-F on file with Canadian provincial securities regulatory authorities and the SEC.
North American Palladium Ltd. is a Canadian precious metals company focused on growing its production of palladium and gold in mining-friendly jurisdictions. As an established producer, the Company operates its two 100%-owned mines in Canada and has a pipeline of growth projects near its mine sites where both mills have excess capacity available for production growth.
Lac des Iles (“LDI”), the Company's flagship mine, is one of the world’s two primary palladium producers. Located approximately 85 kilometres northwest of Thunder Bay, Ontario, LDI started producing palladium in 1993. The Company is currently expanding the LDI mine to transition from mining via ramp access to mining via shaft while utilizing a high volume bulk mining method. The mine expansion is currently underway, with commercial production from the shaft at an increased mining rate targeted for the fourth quarter of 2012. It is expected that this expansion will transform LDI into a long life, low cost producer of palladium.
NAP also owns and operates the Sleeping Giant gold mine located in the Abitibi region of Quebec, north of Val d’Or, where the Company plans to organically grow the gold operations through the development of its other gold assets. The Company is also currently advancing the Vezza gold project towards a production decision expected at the end of 2011, and is continuing to advance its other projects through exploration and permitting. The Company has a strong portfolio of development and exploration assets near the LDI and Sleeping Giant mines, and is engaged in a significant exploration program in 2011 aimed at increasing its reserves and resources.
With an experienced senior management team, a strong balance sheet of over $140 million in working capital (including $71 million in cash) as at June 30, 2011 and no long-term debt, NAP is well positioned to pursue its growth strategy.
NAP trades on the TSX under the symbol PDL and on the NYSE Amex under the symbol PAL. The Company’s common shares are included in the S&P/TSX Composite Index.
SECOND QUARTER REPORT 2011
North American Palladium Ltd.
(expressed in thousands of dollars except cash cost and per share amounts) | | Three months ended June 30 | | | Six months ended June 30 | |
| | | 2011 | | | 2010 | | | 2011 | | | 2010 | |
| FINANCIAL HIGHLIGHTS | | | | | | | | | | | | |
| Revenue | | | | | | | | | | | | |
| Revenue after pricing adjustments | | $ | 51,398 | | | $ | 21,215 | | | $ | 88,112 | | | $ | 29,145 | |
| | | | | | | | | | | | | | | | | |
| Unit sales | | | | | | | | | | | | | | | | |
| Palladium (oz) | | | 46,362 | | | | 24,089 | | | | 76,817 | | | | 24,089 | |
| Gold (oz) | | | 6,600 | | | | 5,072 | | | | 12,900 | | | | 11,772 | |
| Platinum (oz) | | | 2,609 | | | | 1,087 | | | | 4,292 | | | | 1,087 | |
| Nickel (lb) | | | 172,393 | | | | 89,633 | | | | 305,448 | | | | 89,633 | |
| Copper (lb) | | | 335,900 | | | | 173,486 | | | | 564,491 | | | | 173,486 | |
| | | | | | | | | | | | | | | | | |
| Earnings | | | | | | | | | | | | | | | | |
| Net income (loss) | | $ | 5,380 | | | $ | (11,849 | ) | | $ | (4,941 | ) | | $ | (30,200 | ) |
| Net income (loss) per share | | $ | 0.03 | | | $ | (0.08 | ) | | $ | (0.03 | ) | | $ | (0.22 | ) |
Adjusted net income (loss)1 | | $ | 11,272 | | | $ | (5,419 | ) | | $ | 4,790 | | | $ | (13,594 | ) |
EBITDA1 | | $ | 9,504 | | | $ | (6,821 | ) | | $ | 5,748 | | | $ | (21,798 | ) |
Adjusted EBITDA1 | | $ | 15,396 | | | $ | (391 | ) | | $ | 15,479 | | | $ | (5,192 | ) |
| | | | | | | | | | | | | | | | | |
| Cash flow provided by (used in) operations | | | | | | | | | | | | | | | | |
| Cash flow provided by (used in) operations before changes in non-cash working capital | | $ | 11,357 | | | | (5,698 | ) | | $ | 4,789 | | | $ | (17,884 | ) |
Cash flow provided by (used in) operations before changes in non-cash working capital per share1 | | $ | 0.07 | | | $ | (0.04 | ) | | $ | 0.03 | | | $ | (0.13 | ) |
| | | | | | | | | | | | | | | | | |
| Capital spending | | $ | 41,363 | | | $ | 10,146 | | | $ | 82,507 | | | $ | 14,633 | |
| | | | | | | | | | | | | | | | | |
| OPERATING HIGHLIGHTS | | | | | | | | | | | | | | | | |
| Production | | | | | | | | | | | | | | | | |
| Palladium (oz) | | | 46,971 | | | | 27,839 | | | | 77,632 | | | | 27,839 | |
| Gold (oz) | | | 6,634 | | | | 5,355 | | | | 11,540 | | | | 10,218 | |
| Platinum (oz) | | | 2,638 | | | | 1,273 | | | | 4,330 | | | | 1,273 | |
| Nickel (lb) | | | 174,644 | | | | 105,143 | | | | 308,480 | | | | 105,143 | |
| Copper (lb) | | | 339,579 | | | | 197,611 | | | | 569,585 | | | | 197,611 | |
| | | | | | | | | | | | | | | | | |
Cash costs1 | | | | | | | | | | | | | | | | |
| Palladium (US$) | | $ | 335 | | | $ | 304 | | | $ | 408 | | | $ | 304 | |
| Gold (US$) | | $ | 1,643 | | | $ | 1,545 | | | $ | 1,824 | | | $ | 1,475 | |
FINANCIAL CONDITION
| | | As at June 30 | | | As at December 31 | |
| (expressed in thousands of dollars) | | 2011 | | | 2010 | |
| Net working capital | | $ | 141,988 | | | $ | 169,559 | |
| Cash balance | | $ | 71,239 | | | $ | 75,159 | |
| Shareholders’ equity | | $ | 327,467 | | | $ | 290,450 | |
1 Non-IFRS measure. Please refer to Non-IFRS Measures on pages 31-33.
SECOND QUARTER REPORT 2011
North American Palladium Ltd.
EXECUTIVE SUMMARY
Financial Highlights
Revenue for the quarter ended June 30, 2011 was $51.4 million. Net income for the second quarter was $5.4 million or $0.03 per share and adjusted net income1 for the quarter was $11.3 million. NAP provided cash from operating activities of $11.4 million, before changes in non-cash working capital, or $0.07 per share1. EBITDA1 was $9.5 million and adjusted EBITDA1 was $15.4 million.
Strong Balance Sheet
As at June 30, 2011, the Company had approximately $141.8 million in working capital (including $71.2 million of cash on hand) and no long-term debt. In July 2011, the Company increased its operating line of credit with the Bank of Nova Scotia from $30 million to $60 million. The credit facility is secured by the Company's accounts receivables and inventory and may be used for working capital liquidity and general corporate purposes. The Company’s operating cash flow, together with its cash reserves and credit facilities, which remain undrawn, provide the Company with the financial flexibility to advance its development projects.
Investment in Growth
For the quarter ended June 30, 2011, the Company invested $6.1 million in exploration activities ($3.9 million at its palladium operations and $2.2 million at its gold operations) and $41.4 million in development expenditures ($31.5 million at its palladium operations and $9.9 million at its gold operations).
LDI Mine Palladium Production
LDI achieved improved results in the second quarter. Second quarter production at the LDI mine included the blending of higher grade underground ore with lower grade surface stockpiles. During the second quarter, the Company produced 46,971 ounces of payable palladium (at an average palladium head grade at the mill of 4.98 grams per tonne), at cash costs1 (net of byproduct credits) of US$335 per ounce.
LDI’s cash costs were less than the Company’s 2011 annual forecast of US$450 per ounce due in part to higher grades processed by the mill (reflecting the normal grade variability in stope sequencing) and lower production costs resulting from the Company’s inclusion in the Ontario government’s Northern Industrial Electricity Rate (“NIER”) program, as well as a reduction in heating costs.
LDI Mine Expansion Update
The Company is currently expanding the LDI mine to transition from mining via ramp access to mining via shaft to increase future production at lower cash costs1 per ounce. During the second quarter, the Company made significant progress in advancing the critical aspects of the mine expansion construction activities and remains on schedule for commercial production from Phase I of the new production shaft in the fourth quarter of 2012. The successful expansion of LDI is expected to result in increased production of over 250,000 ounces of palladium starting in 2015, once Phase II of the shaft is completed to depth of 1,385 metres. The construction of the new shaft is expected to significantly reduce mine cash costs and increase the Company’s daily mining rate. The Company is currently updating its mine expansion plan for the development of the Offset Zone, and expects to publicly release key elements of these changes towards the end of the third quarter this year.
1 Non-IFRS measure. Please refer to Non-IFRS Measures on pages 31-33.
SECOND QUARTER REPORT 2011
North American Palladium Ltd.
Highlights of the mine expansion development milestones include:
| | · | Surface engineering design work is approximately 90% complete; |
| | · | Surface construction activities are approximately 70% complete (includes hoist house, head frame, and collar house); |
| | · | Underground infrastructure design work is approximately 75% complete; |
| | · | Production shaft design work is approximately 75% complete; |
| | · | Production shaft pilot raise is approximately 50% complete; |
| | · | Shaft sinking contract bids are under review and will be awarded shortly; and |
| | · | Ramp development proceeding on schedule (currently just below the 4765 level). |
In the first half of 2011, $60.6 million was invested in the mine expansion (of which $27.4 million was spent during the second quarter). Taking into consideration the industry-wide inflationary pressures on contract labour, building materials, equipment, consumables and fuel, as well as scope changes resulting in increased materials usage and infill drilling, capital expenditures for 2011 are now estimated at $175 million, up from the January 2011 estimate of $147 million.
Sleeping Giant Mine Gold Production
While development of higher grade zones at depth continues, mining was focused above the 975-metre elevation – mining the lower grade remnant reserves left behind by the previous operator. During the second quarter, Sleeping Giant produced 4,821 ounces of gold (at an average head grade at the mill of 6.83 grams per tonne), at a cash cost1 of US$1,643 per ounce. As the Company completes the development work and refines its mining plan, the goal is to reduce operating costs to achieve break-even cash flow for the balance of 2011. Post-2011, production from Sleeping Giant is expected to increase and cash costs are expected to decline, reflecting the higher gold grades at depth.
In light of the lower volumes mined and milled, the Company has reduced fixed costs at Sleeping Giant. As part of the mine’s cost optimization program, the Company engaged USC Consulting Group LLC to support management with the various initiatives currently underway aimed at improving productivity at the mine through a focused review of the production cycles. While still early in the process, Sleeping Giant has already realized an improvement in operating results from the first quarter.
Sleeping Giant Mine & Mill Development Update
During the quarter, the Company made good progress in the development work at depth which will be integral for increased production and profitability in 2012. The 200-metre mine shaft deepening, embarked on to access higher-grade zones, was completed during the second quarter (at a cost of $1.6 million) and the transition from the sinking hoist to the production hoist is currently taking place. The development of the three new mining levels has commenced in preparation for mining in the new zones in 2012.
Completion of Sleeping Giant’s mill expansion to 1,250 tonnes per day has been deferred to 2012 to give the Company the flexibility to do a one-step increase to 1,750 tonnes per day, depending on project development timelines. In 2011, the Company will spend approximately $2.0 million on the expansion, which includes the detailed engineering work, the geotechnical tests, building and foundation designs, receiving the required construction permits, materials procurement, and refurbishing the rod mill and jaw crusher.
Vezza Gold Project Development Update
During the quarter, the Company made good progress in the development work at its advanced-stage Vezza gold project which is currently being advanced through exploration and development towards a production decision at year-end.
1 Non-IFRS measure. Please refer to Non-IFRS Measures on pages 31-33.
SECOND QUARTER REPORT 2011
North American Palladium Ltd.
Recent highlights include:
| | · | Secured key personnel and awarded underground development contract to Promec Mining Inc., a local Val d’Or mining contractor; |
| | · | Completed the dewatering and underground rehabilitation, including the refurbishing of five levels; |
| | · | Completed over 12,000 metres of surface and underground diamond drilling to date; |
| | · | Significant progress in surface and underground construction work (i.e. tree cutting, building explosive storage magazines, installed electrical stations and compressors, constructed permanent sump and pumping system, etc.); and |
| | · | Refined mining plan based on recently completed studies of crown pillars, rock mechanics, and metallurgical tests. |
A bulk sample of up to 40,000 tonnes is also scheduled for the third and fourth quarters of 2011. The Company has approval from the Ministry of Natural Resources and Wildlife and from the Ministry of Sustainable Development, Environment and Parks to allow the mining of the bulk sample, which is to be processed at the Sleeping Giant mill.
During the second quarter, the Company also announced that Vezza’s Measured and Indicated resources increased by 12% to 321,000 contained ounces, while Inferred resources now total 102,100 contained ounces.
Reflecting scope changes and the inflationary pressures affecting the mining industry today, the budget to advance Vezza to be ready for production in 2012 is now estimated at $34 million, up from the previous estimate of $26 million. Management expects that the total spend will be reduced by estimated pre-production revenue of $9 million from the bulk sample.
Exploration Updates
The Company released the following updated mineral reserve and resource estimates between April and July of 2011:
| | · | LDI, Offset Zone: Measured and Indicated resources now total 14.5 million tonnes (reflecting a 68% increase), containing 2.5 million ounces of palladium (a 41% increase), and Inferred resources total 3.1 million tonnes containing 0.5 million ounces of palladium. |
| | · | Sleeping Giant: Proven and Probable reserves now total 191,000 tonnes, containing 51,700 ounces of gold, Measured and Indicated resources total 604,900 tonnes, containing 125,800 ounces of gold, and Inferred resources total 146,000 tonnes, containing 38,700 ounces of gold. |
| | · | Vezza: Measured and Indicated resources now total 1.7 million tonnes, containing 320,900 ounces of gold, and Inferred resources total 633,000 tonnes, containing 102,100 ounces of gold. |
| | · | Flordin: Measured and Indicated resources now total 2.8 million tonnes, containing 162,000 ounces of gold, and Inferred resources total 1.9 million tonnes, containing 98,000 ounces of gold. |
The Company also released positive drill results from the first tranche of drilling of its 2011 program at its palladium and gold operations. From the beginning of the year until June 28, 2011 (the date of the palladium exploration update press release), a total of 34,800 metres had been drilled at LDI, and from the beginning of the year until July 12, 2011 (the date of the gold exploration update press release), a total of 11,234 metres have been drilled at Vezza, and 24,477 metres at Sleeping Giant.
Outlook
The Company believes it is delivering on its vision to create a diversified mid-tier precious metals producer. NAP is well positioned to benefit from the rise in the price of palladium as the LDI mine expansion is expected to significantly increase production through the development of the Offset Zone over the next couple of years.
SECOND QUARTER REPORT 2011
North American Palladium Ltd.
For the balance of 2011, the Company intends to focus on:
| | · | Updating the LDI mine expansion plan (Q3); |
| | · | Progressing the LDI mine expansion; |
| | · | Completing the development work at depth at Sleeping Giant; |
| | · | Advancing the Vezza gold project towards a production decision by year-end; and |
| | · | Continuing exploration programs aimed at increasing reserves and resources at LDI and in the gold division. |
Selected Quarterly Information
(expressed in thousands of dollars, except per share amounts) | | | Three months ended June 30 | | | Six months ended June 30 | |
| | | 2011 | | | 2010 | | | 2011 | | | 2010 | |
| Revenue | | $ | 51,398 | | | $ | 21,215 | | | $ | 88,112 | | | $ | 29,145 | |
| Income (loss) from mining operations | | | 13,882 | | | | (3,952 | ) | | | 13,439 | | | | (14,124 | ) |
| Net income (loss) | | | 5,380 | | | | (11,849 | ) | | | (4,941 | ) | | | (30,200 | ) |
| Net income (loss) per share – Basic and diluted | | | 0.03 | | | | (0.08 | ) | | | (0.03 | ) | | | (0.22 | ) |
| Cash flow provided by (used in) operations prior to changes in non-cash working capital | | | 11,357 | | | | (5,698 | ) | | | 4,789 | | | | (17,884 | ) |
| Total assets | | | 389,352 | | | | 294,987 | | | | 389,352 | | | | 294,987 | |
| Obligations under finance leases | | | 2,319 | | | | 3,304 | | | | 2,319 | | | | 3,304 | |
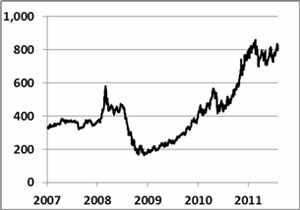
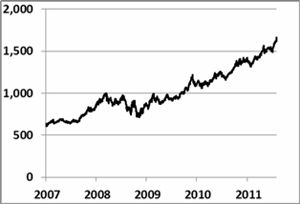
Metal Prices
| Palladium Price (US$/ Troy oz) | Gold Price (US$/ Troy oz) |
| |
In 2008, the price of palladium declined significantly by 69% to US$183 per ounce prompting the Company to put the LDI mine on temporary care and maintenance. As the price of palladium began to recover, the Company restarted the LDI mine in April 2010, ahead of schedule and under budget.
During the second quarter of 2011, palladium price averaged US$761 per ounce, ranging from a low of US$708 to a high of US$818 per ounce. The price of palladium has recovered from the effect of the Japanese earthquake and continued to benefit from strong industrial demand growth and rising investment demand. Supply constraints persisted due to operational challenges in South Africa and Russia and the uncertainty over the availability of the depleted Russian palladium stockpile. Amid global economic uncertainty in Europe and U.S., the price of palladium still showed strong support above US$700 per ounce level and reached a ten year high of US$859 per ounce in early 2011. As of August 9, 2011, the price of palladium was US$741 per ounce.
SECOND QUARTER REPORT 2011
North American Palladium Ltd.
During the second quarter of 2011, the average price of gold was US$1,508 per ounce, with gold trading in a range of US$1,429 to US$1,564 per ounce. The price of gold was US$1,740 as of August 9, 2011. The price of gold rallied as escalating global economic worries lead investors to seek out safe-haven assets like gold.
At the end of the second quarter, the Canadian dollar closed at a similar level to the U.S. dollar, compared to the first quarter of 2011. The Canadian dollar exchange rate was $1.03 at June 30, 2011. As of August 9, 2011, the Canadian dollar exchange rate was $1.02.
Average Metal Prices and Exchange Rates | | | Three months ended June 30 | | | Six months ended June 30 | |
| | | 2011 | | | 2010 | | | 2011 | | | 2010 | |
| Palladium – US$/oz | | $ | 751 | | | | - | | | $ | 769 | | | | - | |
| Platinum – US$/oz | | $ | 1,768 | | | | - | | | $ | 1,768 | | | | - | |
| Gold – US$/oz | | $ | 1,453 | | | $ | 1,210 | | | $ | 1,414 | | | $ | 1,151 | |
| Nickel – US$/lb | | $ | 11.54 | | | | - | | | $ | 11.53 | | | | - | |
| Copper – US$/lb | | $ | 4.24 | | | | - | | | $ | 4.27 | | | | - | |
| Average exchange rate (Bank of Canada) – CDN$1 = US$ | | $ | 1.03 | | | $ | 0.97 | | | $ | 1.02 | | | $ | 0.97 | |
Under LDI’s smelter agreement, metal prices are not finalized until three months after delivery to the smelter for base metals and six months for precious metals. Prior to final pricing and settlement, LDI’s metals are provisionally priced at month end forward prices. The Company enters into financial contracts to mitigate this provisional pricing exposure to rising or declining palladium prices for past production already delivered and sold to the smelters. For further details, see the Financial Review section.
Spot Metal Prices* and Exchange Rates
For comparison purposes, the following table details recorded spot metal prices and exchange rates.
| | | Jun-30 | | | Mar-31 | | | Dec-31 | | | Sep-30 | | | Jun-30 | | | Mar 31 | | | Dec 31 | | | Sept 30 | |
| | | 2011 | | | 2011 | | | 2010 | | | 2010 | | | 2010 | | | 2010 | | | 2009 | | | 2009 | |
| Palladium – US$/oz | | $ | 761 | | | $ | 766 | | | $ | 791 | | | $ | 573 | | | $ | 446 | | | $ | 479 | | | $ | 393 | | | $ | 294 | |
| Gold – US$/oz | | $ | 1,506 | | | $ | 1,439 | | | $ | 1,410 | | | $ | 1,307 | | | $ | 1,244 | | | $ | 1,116 | | | $ | 1,104 | | | $ | 996 | |
| Platinum – US$/oz | | $ | 1,722 | | | $ | 1,773 | | | $ | 1,731 | | | $ | 1,662 | | | $ | 1,532 | | | $ | 1,649 | | | $ | 1,461 | | | $ | 1,287 | |
| Nickel – US$/lb | | $ | 10.48 | | | $ | 11.83 | | | $ | 11.32 | | | $ | 10.57 | | | $ | 8.78 | | | $ | 11.33 | | | $ | 8.38 | | | $ | 7.86 | |
| Copper – US$/lb | | $ | 4.22 | | | $ | 4.26 | | | $ | 4.38 | | | $ | 3.65 | | | $ | 2.95 | | | $ | 3.56 | | | $ | 3.33 | | | $ | 2.78 | |
| Exchange rate (Bank of Canada) – CDN$1 = US$ | | US$ | 1.04 | | | US$ | 1.03 | | | US$ | 1.01 | | | US$ | 0.97 | | | US$ | 0.94 | | | US$ | 0.98 | | | US$ | 0.96 | | | US$ | 0.93 | |
* Based on the London Metal Exchange
SECOND QUARTER REPORT 2011
North American Palladium Ltd.
LDI Palladium Mine
Income from mining operations for the LDI palladium mine are summarized in the following table.
| | | Three months ended June 30 | | | Six months ended June 30 | |
| | | 2011 | | | 2010 | | | 2011 | | | 2010 | |
| Revenue after pricing adjustments | | $ | 44,329 | | | $ | 16,068 | | | $ | 73,765 | | | $ | 16,068 | |
| Operating expenses | | | | | | | | | | | | | | | | |
| Production costs | | $ | 21,131 | | | $ | 10,132 | | | $ | 41,170 | | | $ | 16,134 | |
| Smelting, refining and freight costs | | | 2,118 | | | | 1,163 | | | | 3,545 | | | | 1,163 | |
| Royalty expense | | | 1,899 | | | | 745 | | | | 3,025 | | | | 745 | |
| Inventory pricing adjustment | | | - | | | | 388 | | | | - | | | | 388 | |
| Depreciation and amortization | | | 2,594 | | | | 3,162 | | | | 4,349 | | | | 3,197 | |
| Loss (gain) on disposal of equipment | | | (242 | ) | | | 9 | | | | (242 | ) | | | 21 | |
| Total operating expenses | | $ | 27,500 | | | $ | 15,599 | | | $ | 51,847 | | | $ | 21,648 | |
| Income (loss) from mining operations | | $ | 16,829 | | | $ | 469 | | | $ | 21,918 | | | $ | (5,580 | ) |
Revenue – LDI Mine
Revenue is affected by sales volumes, commodity prices and currency exchange rates. Metal sales for LDI are recognized in revenue at provisional prices when delivered to a smelter for treatment or designated shipping point. On a substantial amount of sales, final pricing is not determined until the refined metal is sold by the smelter, which in the case of LDI base metals is three months and precious metals is six months after delivery to the smelter. These final pricing adjustments can result in additional revenues in a rising commodity price environment and reductions to revenue in a declining commodity price environment. Similarly, a weakening in the Canadian dollar relative to the U.S. dollar will result in additional revenues and a strengthening in the Canadian dollar will result in reduced revenues. The Corporation enters into financial contracts to mitigate the smelter agreements’ provisional pricing exposure to rising or declining palladium prices and an appreciating Canadian dollar for past production delivered to the smelter. The total of these financial contracts represent 75,200 ounces of palladium as at June 30, 2011. These contracts mature from July 2011 through December 2011 at an average price of $754 per ounce of palladium. The amounts specified in the financial contracts substantially match final pricing settlement periods of palladium delivered to the customer under the smelter agreement. The palladium financial contracts are being recognized on a mark-to-market basis as an adjustment to revenue. The fair value of these contracts at June 30, 2011 was an asset of $1.4 million, included in accounts receivable (December 31, 2010 - $11.1 million liability).
Sales volumes of LDI’s major commodities are set out in the table below.
| | | Three months ended June 30 | | | Six months ended June 30 | |
| | | 2011 | | | 2010 | | | 2011 | | | 2010 | |
| Sales volumes | | | | | | | | | | | | |
| Palladium (oz) | | | 46,362 | | | | 24,089 | | | | 76,817 | | | | 24,089 | |
| Gold (oz) | | | 1,790 | | | | 972 | | | | 2,990 | | | | 972 | |
| Platinum (oz) | | | 2,609 | | | | 1,087 | | | | 4,292 | | | | 1,087 | |
| Nickel (lbs) | | | 172,393 | | | | 89,633 | | | | 305,448 | | | | 89,633 | |
| Copper (lbs) | | | 335,900 | | | | 173,486 | | | | 564,491 | | | | 173,486 | |
| Cobalt (lbs) | | | 4,383 | | | | 2,319 | | | | 7,707 | | | | 2,319 | |
| Silver (oz) | | | 332 | | | | - | | | | 845 | | | | - | |
SECOND QUARTER REPORT 2011
North American Palladium Ltd.
Revenue from metal sales from the LDI palladium mine are set out below.
| | | Three months ended June 30 | | | Six months ended June 30 | |
| | | 2011 | | | 2010 | | | 2011 | | | 2010 | |
| Revenue before pricing adjustments | | $ | 45,270 | | | $ | 16,533 | | | $ | 76,318 | | | $ | 16,533 | |
| Pricing adjustments | | | (941 | ) | | | (465 | ) | | | (2,553 | ) | | | (465 | ) |
| Revenue after pricing adjustments | | $ | 44,329 | | | $ | 16,068 | | | $ | 73,765 | | | $ | 16,068 | |
| Revenue by metal | | | | | | | | | | | | | | | | |
| Palladium | | $ | 34,268 | | | $ | 11,579 | | | $ | 56,764 | | | $ | 11,579 | |
| Gold | | | 2,729 | | | | 1,284 | | | | 4,335 | | | | 1,284 | |
| Platinum | | | 4,180 | | | | 1,793 | | | | 6,950 | | | | 1,793 | |
| Nickel | | | 1,696 | | | | 540 | | | | 3,300 | | | | 540 | |
| Copper | | | 1,360 | | | | 823 | | | | 2,244 | | | | 823 | |
| Cobalt | | | 68 | | | | 45 | | | | 118 | | | | 45 | |
| Silver | | | 28 | | | | 4 | | | | 54 | | | | 4 | |
| | | $ | 44,329 | | | $ | 16,068 | | | $ | 73,765 | | | $ | 16,068 | |
For the three months ended June 30, 2011, revenue before pricing adjustments was $45.3 million, compared to $16.5 million for the same comparative period last year, reflecting the recommencement of operations at the LDI mine. For the six months ended June 30, 2011, revenue before pricing adjustments was $76.3 million, compared to $16.5 million for the same comparative period last year. Due to the recovery of metal prices, the Company recommenced operations in April 2010 after being on care and maintenance since October 2008.
Revenue after pricing adjustments from metal settlements for the three months ended June 30, 2011 was $44.3 million, reflecting a $2.0 million negative commodity price adjustment partially offset by a $1.1 million positive foreign exchange adjustment. For the six months ended June 30, 2011, revenue after pricing adjustments from metal settlements was $73.8 million, including a $3.7 million negative commodity price adjustment partially offset by a $1.1 million positive foreign exchange adjustment.
Operating Expenses – LDI Mine
For the three months ended June 30, 2011, operating expenses were $27.5 million compared to $15.6 million in the same period last year. Operating expenses for the six months ended June 30, 2011 were $51.8 million compared to $21.6 million in the same period last year. The three and six months ended June 30, 2010 included costs related to restarting the LDI mine and mill, which occurred in April 2010. Cash costs1 per ounce of palladium sold, net of by product credits1, were US$335 for the three months ended June 30, 2011 (2010 – US$304) and US$408 for the six months ended June 30, 2011 (2010 - US$304). The increase in operating expenses in 2011 result from processing lower grade stockpiles with the higher grade underground ore.
Smelting, refining and freight costs for the three months ended June 30, 2011 were $2.1 million compared to $1.2 million in the same period last year and $3.5 million compared to $1.2 million for the six months ended June 30, 2011. The increase over the prior year is due to the LDI mine and mill restart in April 2010 as well as increased production volume in 2011.
For the three months ended June 30, 2011, the royalty expense was $1.9 million compared to $0.7 million in the same period last year. Royalty expense was $3.0 million for the six months ended June 30, 2011 compared to $0.7 million for the same period last year. Royalty expense was higher in the current year as revenue increased in 2011 as well as the mine was restarted in April 2010.
SECOND QUARTER REPORT 2011
North American Palladium Ltd.
Depreciation and amortization at the LDI mine for the three months ended June 30, 2011 was $2.6 million, compared to $3.2 million for the three months ended June 30, 2010, due to an increase in the resource base related to the Offset Zone after releasing the Offset Zone scoping study in August 2010. For the six months ended June 30, 2011, depreciation and amortization was $4.3 million compared to $3.2 million in the same period last year. The increase over the prior year is due to the LDI mine and mill restart in April 2010.
During the second quarter, the Company was advised of its inclusion in the Ontario government’s Northern Industrial Electricity Rate (“NIER”) program to receive electricity price rebates of two cents per kilowatt hour. The NIER program is a three-year initiative designed to help large industries in Northern Ontario improve energy efficiency and sustainability. It is available to industrial facilities that consume greater than 50,000 megawatt hours of electricity per year. The Company’s commitment to the preparation and implementation of comprehensive energy management plans qualified the Company to participate, which resulted in a retroactive rebate of $1.9 million for LDI’s electricity costs for the period of April 1, 2010 through March 31, 2011. The rebate was treated as a reduction of second quarter operating expenses. LDI will be entitled to receive additional quarterly rebates over the next two years if it continues to meet eligibility criteria, which the Company expects will be the case.
Sleeping Giant Gold Mine
Income from mining operations for the Sleeping Giant gold mine is summarized in the following table.
| | | Three months ended June 30 | | | Six months ended June 30 | |
| | | 2011 | | | 2010 | | | 2011 | | | 2010 | |
| Revenue | | $ | 7,069 | | | $ | 5,147 | | | $ | 14,347 | | | $ | 13,077 | |
| Operating expenses | | | | | | | | | | | | | | | | |
| Production costs | | $ | 7,652 | | | $ | 6,518 | | | $ | 18,040 | | | $ | 16,567 | |
| Smelting, refining and freight costs | | | 18 | | | | 13 | | | | 30 | | | | 31 | |
| Depreciation and amortization | | | 2,300 | | | | 3,008 | | | | 4,662 | | | | 4,969 | |
| Loss (gain) on disposal of equipment | | | - | | | | (1 | ) | | | - | | | | (4 | ) |
| Total operating expenses | | $ | 9,970 | | | $ | 9,538 | | | $ | 22,732 | | | $ | 21,563 | |
| Loss from mining operations | | $ | (2,901 | ) | | $ | (4,391 | ) | | $ | (8,385 | ) | | $ | (8,486 | ) |
Revenue – Sleeping Giant Mine
Metal sales for the Sleeping Giant gold mine are recognized at the time the title is transferred to a third party. Sales volumes are set out in the table below.
Revenue from metal sales from the Sleeping Giant gold mine is set out below.
| | | Three months ended June 30 | | | Six months ended June 30 | |
| | | 2011 | | | 2010 | | | 2011 | | | 2010 | |
| Revenue | | $ | 7,069 | | | $ | 5,147 | | | $ | 14,347 | | | $ | 13,077 | |
| Revenue by metal | | | | | | | | | | | | | | | | |
| Gold | | $ | 7,069 | | | $ | 5,147 | | | $ | 14,001 | | | $ | 12,898 | |
| Silver | | | - | | | | - | | | | 346 | | | $ | 179 | |
| | | $ | 7,069 | | | $ | 5,147 | | | $ | 14,347 | | | $ | 13,077 | |
For the three months ended June 30, 2011, revenue was $7.1 million, reflecting gold sales of 4,810 ounces with an average realized price of US$1,515 per ounce, compared to $5.1 million in the prior year with gold sales of 4,100 ounces with an average realized price of US$1,210 per ounce. Revenue was $14.3 million for the six months ended June 30, 2011, compared to $13.1 million in the prior year, reflecting gold sales of 9,910 ounces with an average realized price of US$1,445 per ounce (2010 – 10,800 ounces at US$1,151 per ounce).
SECOND QUARTER REPORT 2011
North American Palladium Ltd.
Operating Expenses – Sleeping Giant Mine
For the three months ended June 30, 2011, total production costs at the Sleeping Giant gold mine were $7.7 million as compared to $6.5 million in the same period in 2010. Total production costs were $18.0 million for the six months ended June 30, 2011, compared to $16.6 million in 2010. Cash costs1 were US$1,643 per ounce for the quarter ended June 30, 2011, compared to $1,545 per ounce for the three months ended June 30, 2010 and US$1,824 per ounce for the six months ended June 30, 2011 compared to US$1,475 per ounce for the same period in the prior year due to additional volume and higher labour costs.
Depreciation and amortization at the Sleeping Giant gold mine was $2.3 million for the three months ended June 30, 2011, compared to $3.0 million in the prior year. For the six months ended June 30, 2011, depreciation and amortization was $4.7 million compared to $5.0 million in the prior year.
General and administration
The Company’s general and administration expenses for the three months ended June 30, 2011 were $3.1 million, compared to $2.6 million, an increase of $0.5 million. For the six months ended June 30, 2011, general and administration costs were $6.5 million compared to $5.3 million in the prior year, an increase of $1.2 million. The increase is due to additional administration costs from increased activities at the LDI palladium mine and the Sleeping Giant gold mine.
Exploration
Exploration expenditures for the three months ended June 30, 2011 were $6.1 million compared to $6.4 million in the prior year period and $10.0 million for the six months ended June 30, 2011 compared to $10.6 million in the same period in the prior year, comprised as follows:
| | | Three months ended June 30 | | | Six months ended June 30 | |
| | | 2011 | | | 2010 | | | 2011 | | | 2010 | |
| Ontario exploration projects* | | | 3,883 | | | | 4,152 | | | | 5,807 | | | | 7,206 | |
| Sleeping Giant mine property | | | 866 | | | | 618 | | | | 1,978 | | | | 1,470 | |
| Other Quebec exploration projects** | | | 1,385 | | | | 1,651 | | | | 2,188 | | | | 1,910 | |
| Total exploration expenditures | | $ | 6,134 | | | $ | 6,421 | | | $ | 9,973 | | | $ | 10,586 | |
| * | Ontario exploration projects are comprised of LDI exploration projects, including the Cowboy, Outlaw and Sheriff zones, West LDI, North VT Rim, and the Legris Lake option and Shebandowan. |
| ** | Other Quebec exploration projects are comprised of the Vezza, Flordin, Discovery, Dormex, Montbray, Harricana, Cameron Shear, Laflamme, and Florence properties. |
On February 18, 2011, the Company completed a private placement of 2,667,000 flow-through common shares. The Company is required to spend gross proceeds of $22.0 million on Canadian exploration expenses prior to December 31, 2011. For the three months ended June 30, 2011, $11.4 million was spent and for the six months ended June 30, 2011, $15.8 million was spent.
1 Non-IFRS measure. Please refer to Non-IFRS Measures on pages 31-33.
SECOND QUARTER REPORT 2011
North American Palladium Ltd.
Interest and other costs (income)
Interest and other income for the three months ended June 30, 2011 was $1.0 million compared to a nominal amount in the prior year. The current year balance includes a gain on renouncement of flow-through expenditures of $0.9 million. For the six months ended June 30, 2011, interest and other income was $1.4 million compared to $2.0 million in the prior year. The current year balance includes a gain on renouncement of flow-through expenditures of $1.3 million and the prior year balance consists primarily of interest income. Interest and other income also include interest on capital leases, accretion expense, interest income and interest expense in the current and prior year period.
Income and Mining Tax Recovery (Expense)
The income and mining tax recovery (expense) for the three and six months ended June 30, are provided in the table below.
| | | Three months ended June 30 | | | Six months ended June 30 | |
| | | 2011 | | | 2010 | | | 2011 | | | 2010 | |
| LDI palladium mine | | | | | | | | | | | | |
| Ontario transitional tax credit | | $ | - | | | $ | 280 | | | $ | (2,387 | ) | | $ | 280 | |
| Corporate minimum tax credit | | | - | | | | 75 | | | | - | | | | 75 | |
| Ontario resource allowance recovery | | | - | | | | - | | | | - | | | | 315 | |
| | | $ | - | | | $ | 355 | | | $ | (2,387 | ) | | $ | 670 | |
| Sleeping Giant gold mine | | | | | | | | | | | | | | | | |
| Quebec mining duties (expense) recovery | | $ | (137 | ) | | $ | 110 | | | $ | (92 | ) | | $ | 110 | |
| Quebec income tax recovery | | | - | | | | - | | | | 107 | | | | 26 | |
| Mining interests temporary difference expense | | | (84 | ) | | | 76 | | | | (664 | ) | | | 183 | |
| | | $ | (221 | ) | | $ | 186 | | | $ | (649 | ) | | $ | 319 | |
| Corporate and other | | | | | | | | | | | | | | | | |
| Expiration of warrants | | | - | | | | - | | | $ | 3 | | | $ | 542 | |
| Renunciation of exploration expenditures | | | - | | | | 609 | | | | - | | | | (3,726 | ) |
| | | | - | | | $ | 609 | | | $ | 3 | | | $ | (3,184 | ) |
| | | $ | (221 | ) | | $ | 1,150 | | | $ | (3,033 | ) | | $ | (2,195 | ) |
For the three months ended June 30, 2011, income and mining tax expense was $0.2 million compared to a $1.2 million recovery in the same period in 2010, due primarily to Quebec mining duties expense in the current year and renunciation of exploration expenditures in the prior year period. Income and mining tax expense for the six months ended June 30, 2011 was $3.0 million compared to $2.2 million in the same period in the prior year. In the current year, income and mining tax expense includes Ontario transitional tax credits ($2.4 million) and mining interest temporary differences ($0.7 million). The prior year balance includes renunciation of exploration expenditures ($3.7 million), partially offset by the expiration of warrants ($0.5 million).
Net Income (loss)
For the three months ended June 30, 2011, the Company reported net income of $5.4 million or $0.03 per share compared to a net loss of $11.8 million or $0.08 per share in the prior year. For the six months ended June 30, 2011, net loss was $4.9 million or $0.03 per share compared to a net loss of $30.2 million or $0.22 per share in the prior year.
SECOND QUARTER REPORT 2011
North American Palladium Ltd.
Summary of Quarterly Results
(expressed in thousands of Canadian dollars except per share amounts)
| | | 2011 | | | 2010 | | | 2009* | |
| | | Q2 | | | Q1 | | | Q4 | | | Q3 | | | Q2 | | | Q1 | | | Q4 | | | Q3 | |
| Revenue | | $ | 51,398 | | | $ | 36,714 | | | $ | 39,502 | | | $ | 38,451 | | | $ | 21,215 | | | $ | 7,930 | | | $ | 1 | | | $ | 1 | |
| Exploration expense | | | 6,134 | | | | 3,839 | | | | 12,532 | | | | 7,008 | | | | 6,421 | | | | 4,165 | | | | 4,287 | | | | 2,623 | |
| Cash provided by (used in) operations | | | 4,121 | | | | 24,647 | | | | (25,234 | ) | | | (20,053 | ) | | | (18,433 | ) | | | (10,172 | ) | | | (12,186 | ) | | | (8,911 | ) |
Cash provided by (used in) operations prior to changes in non-cash working capital per share1 | | | 0.07 | | | | (0.04 | ) | | | - | | | | 0.04 | | | | (0.04 | ) | | | (0.11 | ) | | | (0.11 | ) | | | (0.06 | ) |
| Capital expenditures | | | 41,363 | | | | 41,144 | | | | 20,142 | | | | 14,589 | | | | 10,146 | | | | 4,487 | | | | 4,450 | | | | 5,647 | |
| Net income (loss) | | | 5,380 | | | | (10,321 | ) | | | (260 | ) | | | 3,185 | | | | (11,560 | ) | | | (14,624 | ) | | | (14,361 | ) | | | (6,194 | ) |
| Net income (loss) per share – basic and diluted | | $ | 0.03 | | | $ | (0.06 | ) | | | - | | | $ | 0.02 | | | $ | (0.08 | ) | | $ | (0.11 | ) | | $ | (0.11 | ) | | $ | (0.06 | ) |
| * | Certain prior period amounts, prepared under Canadian GAAP, have been reclassified to conform to the current period’s classification. |
| 1 | Non-IFRS measure. Please refer to Non-IFRS Measures on pages 31-33. |
FINANCIAL CONDITION, CASH FLOWS, LIQUIDITY AND CAPITAL RESOURCES
| | | Three months ended June 30 | | | Six months ended June 30 | |
| | | 2011 | | | 2010 | | | 2011 | | | 2010 | |
| Cash provided by (used in) operations prior to changes in non-cash working capital | | $ | 11,357 | | | $ | (5,698 | ) | | $ | 4,789 | | | $ | (17,884 | ) |
| Changes in non-cash working capital | | | (7,236 | ) | | | (12,691 | ) | | | 23,979 | | | | (10,663 | ) |
| Cash provided by (used in) operations | | | 4,121 | | | | (18,389 | ) | | | 28,768 | | | | (28,547 | ) |
| Cash provided by (used in) financing | | | 7,893 | | | | 93,652 | | | | 49,367 | | | | 93,424 | |
| Cash provided by (used in) investing | | | (40,911 | ) | | | (10,120 | ) | | | (82,055 | ) | | | (14,602 | ) |
| Increase (decrease) in cash and cash equivalents | | $ | (28,897 | ) | | $ | 65,143 | | | $ | (3,920 | ) | | $ | 50,275 | |
Operating Activities
For the three months ended June 30, 2011, cash provided by operations prior to changes in non-cash working capital was $11.4 million, compared to cash used in operations of $5.7 million in the prior year, an increase of $17.1 million. This increase is due primarily to higher net income of $16.0 million (including $1.3 million decreased depreciation and amortization) and a decrease of deferred income and mining tax recoveries of $0.8 million. Cash provided by operations prior to changes in non-cash working capital was $4.8 million for the six months ended June 30, 2011, compared to cash used in operations of $17.9 million in the prior year, an increase of $22.7 million. This increase is primarily due to higher net income of $26.1 million (including $0.9 million increased depreciation and amortization) partially offset by higher deferred income and mining tax expense of $4.2 million.
For the three months ended June 30, 2011, changes in non-cash working capital resulted in a use of cash of $7.2 million compared to a use of cash of $12.7 million in the prior year. The current quarter balance of $7.2 million is substantially due to an increase in accounts receivable ($9.4 million), offset by a decrease in inventories ($1.1 million) and an increase in accounts payable and accrued liabilities ($1.1 million). Changes in non-cash working capital for the six months ended June 30, 2011 provided cash of $24.0 million compared to a use of cash of $10.7 million in the prior year. The 2011 balance is primarily due to an increase in other assets ($22.2 million) representing proceeds received from the exercise of warrants, an increase in accounts receivable ($14.8 million) and an increase in inventories ($4.1 million), partially offset by a decrease in accounts payable and accrued liabilities ($9.3 million).
SECOND QUARTER REPORT 2011
North American Palladium Ltd.
For the three months ended June 30, 2011, cash provided by operations was $4.1 million compared to cash used in operations of $18.4 million in the comparative period in 2010. Cash provided by operations for the six months ended June 30, 2011 was $28.8 million compared to cash used in operations of $28.5 million in the prior year period.
Financing Activities
For the three months ended June 30, 2011, financing activities provided cash of $7.9 million consisting of $8.4 million related to proceeds received for the mine closure deposit, partially offset by the scheduled repayment of capital leases of $0.5 million. This compared to cash provided by financing activities of $93.7 million in the corresponding period last year. For the six months ended June 30, 2011, financing activities provided cash of $49.4 million of which $19.8 million was related to the exercise of warrants. This compared to cash provided by financing activities in the prior year of $93.4 million. Net proceeds of $94.2 million were received from the April 2010 equity offering discussed below.
In October 2009, the Company completed an equity offering of 18.4 million units for net proceeds of $53.6 million. Each unit consisted of one common share and one-half of one common share purchase warrant of the Company. Each whole warrant (Series A warrants) entitled the holder to purchase an additional common share at a price of $4.25 per share, subject to adjustment, at any time prior to September 30, 2011. Since the 20-day volume weighted average price of the common shares on the TSX was equal to or greater than C$5.75 per share (as per the acceleration event in the warrant indenture), on December 8, 2010 the Company announced the acceleration of the expiry of the Series A warrants to January 14, 2011. During the first quarter of 2011, $21.3 million of proceeds were received from the exercise of 5,009,986 Series A warrants. Total proceeds of $38.8 million were received from the exercise of Series A warrants and 67,938 Series A warrants were not exercised prior to expiry.
On April 28, 2010, the Company completed an equity offering of 20 million units at a price of $5.00 per unit for total net proceeds of $94.2 million (issue costs $5.8 million), which included the exercise of an over-allotment option in the amount of 2,600,000 units at a price of $5.00 per unit. Each unit consists of one common share and one-half of one common share purchase warrant of the Company. Each whole warrant (Series B warrants) entitles the holder to purchase an additional common share at a price of $6.50, subject to adjustment, at any time prior to October 28, 2011. In the event that the 20-day volume weighted average price of the common shares on the TSX is greater than $7.50 per share, the Company may accelerate the expiry date of the warrants by giving notice to the holders thereof and in such case the warrants will expire on the 30th day after the date on which such notice is given by the Company. In 2010, 1,240,000 Series B warrants were exercised for total proceeds of $8.1 million. No additional warrants were exercised in 2011.
Investing Activities
For the three months ended June 30, 2011, investing activities required cash of $40.9 million, relating to additions to mining interests and proceeds on disposal of equipment of $0.5 million. For the three months ended June 30, 2010, investing activities required cash of $10.1 million, relating to additions to mining interests. Investing activities required cash of $82.1 million for the six months ended June 30, 2011, compared to $14.6 million cash required by investing activities for the six months ended June 30, 2011. The majority of the additions to mining interest were attributable to the development of the Sleeping Giant gold mine and various mill projects at the LDI palladium mine as set out in the table below.
SECOND QUARTER REPORT 2011
North American Palladium Ltd.
Additions to mining interests
| | | Three months ended June 30 | | | Six months ended June 30 | |
| | | 2011 | | | 2010 | | | 2011 | | | 2010 | |
| Palladium operations | | | | | | | | | | | | |
| Offset Zone development | | $ | 27,278 | | | $ | 5,036 | | | $ | 54,199 | | | $ | 5,972 | |
| Roby Zone development | | | 7 | | | | 876 | | | | 67 | | | | 982 | |
| Offset Zone exploration costs | | | 2,534 | | | | - | | | | 6,367 | | | | - | |
| Roby Zone exploration costs | | | 27 | | | | - | | | | 115 | | | | - | |
| Jaw crusher | | | - | | | | 163 | | | | - | | | | 1,042 | |
| Mill flotation redesign | | | - | | | | 223 | | | | - | | | | 796 | |
| Tailings management facility | | | 151 | | | | 297 | | | | 193 | | | | 297 | |
| Other equipment and betterments | | | 1,452 | | | | 349 | | | | 3,248 | | | | 740 | |
| | | $ | 31,450 | | | $ | 6,944 | | | $ | 64,190 | | | $ | 9,829 | |
| Gold operations | | | | | | | | | | | | | | | | |
| Vezza project | | $ | 7,320 | | | | - | | | $ | 12,608 | | | | - | |
| Sleeping Giant Shaft deepening | | | 1,584 | | | | 1,697 | | | | 3,394 | | | | 2,658 | |
| Sleeping Giant Mill expansion | | | 608 | | | | - | | | | 834 | | | | - | |
| Sleeping Giant Underground and deferred development | | | 411 | | | | 958 | | | | 1,261 | | | | 1,514 | |
| Other equipment and betterments | | | (10 | ) | | | 547 | | | | 220 | | | | 632 | |
| | | $ | 9,913 | | | $ | 3,202 | | | $ | 18,317 | | | $ | 4,804 | |
| | | $ | 41,363 | | | $ | 10,146 | | | $ | 82,507 | | | $ | 14,633 | |
In addition to the mining interests acquired by cash reflected in the above table, the Company also acquired by means of finance leases, equipment in the amount $nil for the three months ended June 30, 2011 and $0.9 million for the six months ended June 30, 2011.
Capital Resources
As at June 30, 2011, the Company had cash and cash equivalents of $71.2 million compared to $75.2 million as at December 31, 2010. The funds are invested in short term interest bearing deposits at a major Canadian chartered bank.
In July 2011, the Company increased its operating line of credit with the Bank of Nova Scotia from $30 million to $60 million. The credit facility is secured by the Company's accounts receivables and inventory and may be used for working capital liquidity and general corporate purposes.
The Company’s operating cash flow, together with its cash reserves and credit facilities, which remain undrawn, provide the Company with the financial flexibility to advance its development projects.
Contractual Obligations
| As at June 30, 2011 | | Payments Due by Period | |
| (expressed in thousands of Canadian dollars) | | Total | | | Less than 1 year | | | 2-5 Years | | | >5 years | |
| Capital lease obligations | | $ | 2,455 | | | $ | 1,525 | | | $ | 902 | | | $ | 28 | |
| Operating leases | | | 9,857 | | | | 5,074 | | | | 4,447 | | | | 336 | |
| Purchase obligations | | | 88,079 | | | | 88,079 | | | | - | | | | - | |
| | | $ | 100,391 | | | $ | 94,678 | | | $ | 5,349 | | | $ | 364 | |
SECOND QUARTER REPORT 2011
North American Palladium Ltd.
In addition to the above, the Company also has asset retirement obligations at June 30, 2011 in the amount of $20.2 million that would become payable at the time of the closures of the LDI and Sleeping Giant mines. Deposits established by the Company to offset these future outlays amount to $2.1 million. In addition, the Company obtained a letter of credit of $8.5 million to offset these future outlays. As a result, $9.6 million of funding is required prior to closure of the mines.
Related Party Transactions
There were no related party transactions for the quarter ended June 30, 2011.
As of August 9, 2011, there were 162,607,368 common shares of the Company outstanding. In addition, there were options outstanding pursuant to the Amended and Restated 2010 Corporate Stock Option Plan entitling holders thereof to acquire 3,854,582 common shares of the Company at a weighted average exercise price of $3.39 per share. As of the same date, there were also 8,760,000 Series B warrants outstanding, each warrant entitling the holder thereof to purchase one common share at a weighted average exercise price of $6.50 per share before October 28, 2011.
LDI Palladium Mine
The key operating results for the LDI palladium mine are set out in the following table.
| | | Three months ended June 30 | | | Six months ended June 30 | |
| | | 2011 | | | 2010 | | | 2011 | | | 2010 | |
| Tonnes of ore milled | | | 377,857 | | | | 203,003 | | | | 715,703 | | | | 203,003 | |
| Production | | | | | | | | | | | | | | | | |
| Palladium (oz) | | | 46,971 | | | | 27,839 | | | | 77,632 | | | | 27,839 | |
| Gold (oz) | | | 1,813 | | | | 1,118 | | | | 3,020 | | | | 1,118 | |
| Platinum (oz) | | | 2,638 | | | | 1,273 | | | | 4,330 | | | | 1,273 | |
| Nickel (lbs) | | | 174,644 | | | | 105,143 | | | | 308,480 | | | | 105,143 | |
| Copper (lbs) | | | 339,579 | | | | 197,611 | | | | 569,585 | | | | 197,611 | |
| Palladium head grade (g/t) | | | 4.98 | | | | 5.78 | | | | 4.45 | | | | 5.78 | |
| Palladium recoveries (%) | | | 83.15 | | | | 79.40 | | | | 81.37 | | | | 79.40 | |
| Tonnes of ore mined | | | 428,692 | | | | 154,394 | | | | 761,215 | | | | 179,234 | |
| Cost per tonne milled | | $ | 56 | | | $ | 50 | | | $ | 58 | | | $ | 50 | |
Cash cost ($USD)1 | | $ | 335 | | | $ | 304 | | | $ | 408 | | | $ | 304 | |
The LDI mine consists of a previously mined open pit, an operating underground mine (currently producing from the Roby Zone), and a mill with a design capacity of approximately 15,000 tonnes per day. The primary deposits on the property are the Roby Zone and the Offset Zone, both disseminated magmatic palladium-platinum group metal (“PGM”) deposits. Cowboy, Outlaw and Sheriff Zones are the other identified mineralized zones.
Second quarter production at the LDI mine included the blending of underground ore with lower-grade surface stockpiles. During the three months ended June 30, 2011, 428,692 tonnes of ore was extracted from underground and from the surface stockpiles. For the six months ended June 30, 2011, 761,215 tonnes of ore was extracted.
Ore production from the Roby Zone at the LDI mine is operating at 2,600 tonnes per day, seven days a week, on two 12-hour shifts per day. The Company has a workforce of approximately 249 people at LDI and its collective agreement with the United Steelworkers is effective until May 31, 2012.
1 Non-IFRS measure. Please refer to Non-IFRS Measures on pages 31-33.
SECOND QUARTER REPORT 2011
North American Palladium Ltd.
LDI Mill
For the three months ended June 30, 2011, the LDI mill processed 377,857 tonnes of ore at an average of 8,819 tonnes per operating day, producing 46,971 ounces of payable palladium at an average palladium head grade of 4.98 grams per tonne, with an improved palladium recovery of 83.1%, and mill availability of 98.3%. LDI’s cash costs1, net of byproduct credits, were US$335 per ounce. LDI’s cash costs in the second quarter were less than the Company’s 2011 annual forecast of US$450 per ounce due in part to higher grades processed by the mill (reflecting grade variability in stope sequencing) and lower production costs resulting from the Company’s inclusion in the NIER program, as well as seasonal factors such as a reduction in heating costs. Production costs, per tonne of ore milled, were $56 for the quarter ended June 30, 2011. The mill is operating on a batch basis, with a two-week operating and a two-week shutdown schedule.
For the six months ended June 30, 2011, the LDI mill processed 715,703 tonnes of ore at an average of 9,308 tonnes per operating day, producing 77,632 ounces of payable palladium at an average palladium head grade of 4.45 grams per tonne, palladium recovery of 81.4% and mill availability of 96.3%. LDI’s cash costs1, net of byproduct credits, were US$408 per ounce.
LDI Mine Expansion Project Update
The Company is currently expanding the LDI mine to transition from mining via ramp access to mining via shaft to increase future production at lower cash costs1 per ounce. During the second quarter the Company made significant progress in advancing the critical aspects of the mine expansion construction activities and remains on schedule for commercial production from Phase I of the new production shaft in the fourth quarter of 2012. The successful expansion of LDI is expected to result in increased production of over 250,000 ounces of palladium starting in 2015, once Phase II of the shaft is completed to depth of 1,385 metres. The addition of the new shaft is expected to significantly reduce mine cash costs and increase the Company’s daily mining rate. The Company is currently updating its mine expansion plan for the development of the Offset Zone, and expects to publicly release key elements of these changes towards the end of the third quarter this year.
Development work in 2011 is focused on:
| | · | Constructing the head frame, hoist room and electrical substation; |
| | · | Installing the service and production hoists; |
| | · | Completing the shaft raise bore and ventilation raise bore; |
| | · | Installing adequate ventilation at surface and underground; |
| | · | Advancing the ramp towards the 4570 mine level; and |
| | · | Developing the 4790 mine level in preparation for production |
Recent highlights of the mine expansion development to date include:
| | · | Surface engineering design work is approximately 90% complete; |
| | · | Surface construction activities are approximately 70% complete (includes hoist house, head frame, and collar house); |
| | · | Underground infrastructure design work is approximately 75% complete; |
| | · | Production shaft design work is approximately 75% complete; |
| | · | Production shaft pilot raise is approximately 50% complete; |
| | · | Shaft sinking contract bids are under review and will be awarded shortly; and |
| | · | Ramp development proceeding on schedule (currently just below the 4765 level). |
1 Non-IFRS measure. Please refer to Non-IFRS Measures on pages 31-33.
SECOND QUARTER REPORT 2011
North American Palladium Ltd.
In the six month period ended June 30, 2011, $60.6 million was invested in the mine expansion (of which $27.4 million was spent during the second quarter). Taking into consideration the industry-wide inflationary pressures on contract labour, building materials, equipment, consumables and fuel, as well as scope changes resulting in increased materials usage and infill drilling, capital expenditures for 2011 are now estimated at $175 million, up from the January 2011 estimate of $147 million.
The execution risk related to the mine expansion is significantly mitigated since the LDI complex already includes a mill, tailings management facility, infrastructure and the Company has permits in place. Timing risk has been substantially diminished as the Company has already purchased the production, sinking and service cage hoists that are critical to the project. The Company has also dedicated a 20-person project management group with significant underground development experience onsite at LDI overlooking all aspects of development.
Sleeping Giant Gold Mine
The key operating results for the Sleeping Giant gold mine are set out in the following table.
| | | Three months ended June 30 | | | Six months ended June 30 | |
| | | 2011 | | | 2010 | | | 2011 | | | 2010 | |
| Tonnes of ore milled | | | 22,697 | | | | 23,078 | | | | 43,339 | | | | 49,901 | |
| Production | | | | | | | | | | | | | | | | |
| Gold (oz) | | | 4,821 | | | | 4,237 | | | | 8,520 | | | | 9,100 | |
| Gold head grade (g/t) | | | 6.83 | | | | 5.71 | | | | 6.35 | | | | 5.67 | |
| Gold recoveries (%) | | | 96.77 | | | | 95.40 | | | | 96.22 | | | | 95.40 | |
| Tonnes of ore hoisted | | | 22,604 | | | | 23,750 | | | | 42,886 | | | | 50,582 | |
| Cost per tonne milled | | $ | 337 | | | $ | 282 | | | $ | 416 | | | $ | 329 | |
Cash cost ($USD)1 | | $ | 1,643 | | | $ | 1,545 | | | $ | 1,824 | | | $ | 1,475 | |
The Sleeping Giant gold mine consists of a narrow vein underground mine and a mill with a capacity of 900 tonnes per operating day. For the three months ended June 30, 2011, 22,604 tonnes of ore were hoisted from the underground mine with an average gold grade of 6.83 grams per tonne. For the six months ended June 30, 2011, 42,886 tonnes of ore were hoisted with an average gold grade of 6.35 grams per tonne.
While development at depth continues, mining at Sleeping Giant is focused above the 975-metre elevation – mining the lower grade remnant reserves left behind by the previous operator. As the Company completes the development work and refines its mining plan to reflect the labour-related challenges it faces, the goal is to reduce operating costs to achieve break-even cash flow for the balance of 2011. Post-2011, production from Sleeping Giant is expected to increase and cash costs are expected to decline, reflecting the higher gold grades at depth.
In light of the lower volumes mined and milled, the Company has reduced fixed costs at Sleeping Giant. As part of the mine’s cost optimization program, the Company engaged USC Consulting Group LLC to support management with the various initiatives currently underway aimed at improving productivity at the mine through a focused review of the production cycles. While still early in the process, Sleeping Giant has already realized an improvement in operating results from the first quarter.
During the quarter, the Company made good progress in the development work at depth which will be integral for increased production and profitability in 2012. The 200-metre mine shaft deepening, embarked on to access higher-grade zones, was completed during the second quarter and the transition from the sinking hoist to the production hoist is currently taking place. The development of the three new mining levels has commenced in preparation for mining in the new zones in 2012.
SECOND QUARTER REPORT 2011
North American Palladium Ltd.
Sleeping Giant Mill
For the three months ended June 30, 2011, the mill processed 22,697 tonnes of ore, producing 4,821 ounces of gold at an average gold head grade of 6.83 grams per tonne, with a gold recovery of 96.8% and mill availability of 93.4%. For the six months ended June 30, 2011, 43,339 tonnes of ore were processed, producing 8,520 ounces of gold at an average gold head grade of 6.35 grams per tonne, gold recovery of 96.2% and mill availability of 96.7%. Sleeping Giant’s cash costs1 were US$1,643 per ounce for the three months ended June 30, 2011 and US$1,824 per ounce for the six months ended June 30, 2011. Production costs per tonne of ore milled were $337 for the three months ended June 30, 2011 and $416 per tonne of ore milled for the six months ended June 30, 2011.
At June 30, 2011, the mill contained approximately 1,138 ounces of gold that was included in inventory and valued at net realizable value, as it had not been sold by the end of the period.
The Sleeping Giant mill has a rated capacity of 900 tonnes per day and was operating at approximately 779 tonnes per operating day, for the three months ended June 30, 2011 and 824 tonnes per operating day for the six months ended June 30, 2011.
Completion of Sleeping Giant’s mill expansion to 1,250 tonnes per day has been deferred to 2012 to give the Company the flexibility to do a one-step increase to 1,750 tonnes per day depending on project development timelines. In 2011, the Company will spend approximately $2.0 million on the expansion, which includes the detailed engineering work, the geotechnical tests, building and foundation designs, receiving the required construction permits, materials procurement, and refurbishing the rod mill and jaw crusher.
NAP’s future growth will come from its significant exploration upside and through the continued exploration and development of the Company’s projects. With permits, mine infrastructure and excess capacity at both of its mills, NAP can move from exploration success to production on an accelerated timeline.
Lac des Iles Mine & Property
Exploration is central to LDI’s future and will represent an important part of future growth for the mine and for the Company. Situated in unique geology, LDI’s substantial +30,000-acre land package offers exploration upside that is further complimented by the underutilized, large 15,000-tonne per day mill. Beyond the mine site, most of the land has had minimal historic exploration. The exploration success achieved during the past few years gives management great encouragement that there is strong potential to continue to grow the Company’s palladium reserve and resource base through exploration.
The LDI mine consists of the following underground zones:
| | · | Roby Zone: currently being mined. |
| | · | Offset Zone: discovered in 2001, located below and approximately 250 metres south west of the Roby Zone. The Offset Zone remains open in all directions and continues to expand through exploration. LDI mine expansion is currently underway to access Offset Zone ore. |
| | · | Cowboy Zone*: discovered in 2009 during infill drilling of the Offset Zone, located 30 to 60 metres to the west of the Offset Zone. This new discovery has the potential to extend LDI’s mine life and could potentially impact the economics of the mine. |
| | · | Outlaw Zone*: discovered in 2009, located to the west of the Offset Zone and the Cowboy Zone. Further drilling is required to explore the vertical and lateral limit of this mineralization. |
| | · | Sheriff Zone*: discovered in 2010, located approximately 100 metres south east of the Offset Zone. |
| * | The disclosure regarding these mineralized areas is conceptual in nature and there has been insufficient exploration to define a mineral resource in any of these areas. The current LDI mine plan does not include the three nearby underground zones: Cowboy, Outlaw, and Sheriff. |
SECOND QUARTER REPORT 2011
North American Palladium Ltd.
During the second quarter the Company released an updated mineral resource estimate for LDI’s Offset Zone. The Measured and Indicated resources now total 14.5 million tonnes (reflecting a 68% increase), containing 2.5 million ounces of palladium (a 41% increase) and Inferred resources total 3.1 million tonnes containing 0.5 million ounces of palladium. The increased resource tonnage demonstrates the potential for significantly longer mine life and underpins the significant potential to increase LDI's mineral reserves and resources with additional step-out drilling on the Offset Zone (which remains open at depth and along strike), possible Roby Zone extensions (to be evaluated this year), and through additional drilling on the newly discovered Cowboy, Outlaw and Sheriff zones. The update excluded the Cowboy, Outlaw and Sheriff zones as there is insufficient drilling on these zones at this time.
On June 28, 2011 the Company released the first tranche of drilling results from its 2011 program, which is currently underway. NAP's 2011 exploration program at LDI is aimed at expanding the size of the Offset Zone, increasing the knowledge of the Offset Zone mineralization to facilitate more efficient mine planning, and identifying potential surface deposits. Since the beginning of the year until June 28, 2011, a total of 12,950 metres have been drilled from underground, and 21,850 metres from surface, for a total of 34,800 metres. (Due to logging and assaying delays, the available results at the release date included only 71 holes totaling 24,189 metres).
Highlights included:
| | · | Surface drilling on the Offset Zone intersected significant mineralization over 150 metres south of the shaft location, underpinning significant exploration potential beyond the current resource wireframe; |
| | · | A drill following the south extension of the Offset Zone encountered some of the best grades and width ever reported on the zone with 12 metres of 16.4 grams per tonne palladium ("g/t Pd"); |
| | · | Continued positive infill drill results throughout the Offset Zone, including 65 metres at 6.4 g/t Pd in the top upper part of the zone; and |
| | · | Offset Zone drilling improved the definition of the recently discovered Sheriff Zone. |
Legris Lake Property
The property Legris Lake is adjacent to the south east portion of the Company’s LDI property and is comprised of 15 claims and covering an area of approximately 4,297 hectares. The property is underlain by mafic and ultramafic rocks and was optioned for its PGE potential. The property is at a preliminary exploration stage, however its PGM potential and close proximity to the LDI mill presents an exciting exploration target. In 2011, the Company plans to conduct 3,000 metres of drilling at this property.
Sleeping Giant Gold Mine & Property
The Company believes there is additional exploration potential at the Sleeping Giant mine as well as on the surrounding property, which is located approximately 80 kilometres north of Amos, Quebec, a major regional centre in the Abitibi District.
An updated reserve and resource report that incorporated all the 2010 drilling (38,000 metres) at Sleeping Giant was released on April 27, 2011. The 2010 drilling at the Sleeping Giant mine increased the contained ounces in the measured and indicated category giving a higher level of confidence in the mineral resource. Proven and Probable reserves now total 191,000 tonnes, containing 51,700 ounces of gold, Measured and Indicated resources total 604,900 tonnes, containing 125,800 ounces of gold, and Inferred resources total 146,000 tonnes, containing 38,700 ounces of gold.
Compared to the 2009 reserves and resources, the 2010 drilling program nearly tripled the measured and indicated resource tonnage, while at the same time conserving roughly the same reserves at the end of the year following a year of production. Contained ounces were slightly lower in the reserves category while they more than doubled in the measured and indicated resource categories. Tighter drilling conducted during the year reduced the overall grades but increased the confidence level of the estimation, whereas the overall gold content remained roughly the same year over year. More contained ounces were in higher categories at the end of 2010.
SECOND QUARTER REPORT 2011
North American Palladium Ltd.
Since the beginning of 2011 until July 12, 2011 (the date of the gold exploration update press release), 88 drill holes were completed at Sleeping Giant, totaling 24,477 metres. The primary objective of the 2011 exploration program at Sleeping Giant is to define and extend zones within the current mine on the proposed three new mining levels at depth. Of the 88 holes that were drilled, 74 holes targeted the three new levels (between mine elevations 975 and 1,175) and 13 holes at depth below these levels.
In 2011, systematic drilling from underground stations continues to improve the Company's understanding of several known zones while extending them to greater depth. The historic 20, 30, 30W and 8N18 zones were intercepted and continued to return good values. Drilling that followed geological interpretations in the lower part of the mine encountered new zones and a number of other significant gold intersections.
Vezza Gold Property
Vezza is an advanced-stage project located in the prolific Abitibi region in Quebec, approximately 85 kilometres by paved road from the Sleeping Giant mine, and approximately 25 kilometres to the south of the town of Matagami. The deposit was historically subject to extensive surface and underground exploration (approximately 85,000 metres of drilling) and substantial underground development. When the Company took over in 2010, the work continued at an aggressive pace with 12,105 metres of drilling and dewatering of the underground drifts. During 2011, the Company continues to advance Vezza through exploration and development towards a production decision by year-end. Given the project’s quick ramp up potential, production could commence in the first quarter of 2012 in the range of 39,000 ounces of gold per year over a 9-year mine life.
An updated reserve and resource report that incorporated all of the 2010 drilling (12,105 metres) at Vezza was released on April 27, 2011. Measured and Indicated resources total 1.7 million tonnes, containing 320,900 ounces of gold, and Inferred resources total 633,000 tonnes, containing 102,100 ounces of gold.
The production projection for Vezza is based upon internal technical and scientific information and mineral resources that are considered too speculative geologically to have an economic consideration applied to them that would enable them to be categorized as mineral reserves. There is no certainty that the production projection will be materialized.
From the beginning of the year until July 12, 2011 (the date of the gold exploration update press release), 36 surface holes were completed at Vezza (totaling 5,367 metres) and 61 holes from underground (totaling 5,867 metres) for a combined total of 11,234 metres in 97 holes.
Exploration drilling has confirmed the location of the mineralized zone at the interface between sedimentary and volcanic rocks. It has also confirmed grades, continuity and widths of the gold zone, which are similar or better than the last resource estimate (dated December 31, 2010). The widths and near vertical nature of the gold zone also confirm that either alimak or long hole mining methods could be used at the Vezza mine.
Recent development highlights include:
| | · | Secured key personnel and awarded underground development contract to Promec Mining Inc.; |
| | · | Completed the dewatering and underground rehabilitation, including the refurbishing of five levels; |
| | · | Completed over 12,000 metres of surface and underground diamond drilling to date; |
| | · | Significant progress in surface and underground construction work (i.e. tree cutting, building explosive storage magazines, installed electrical stations and compressors, constructed permanent sump and pumping system, etc.); and |
| | · | Refined mining plan based on recently completed studies of crown pillars, rock mechanics, and metallurgical tests. |
A bulk sample of up to 40,000 tonnes is also scheduled for the third and fourth quarters of 2011. The Company has approval from the Ministry of Natural Resources and Wildlife and from the Ministry of Sustainable Development, Environment and Parks to allow the mining of the bulk sample, which is to be processed at the Sleeping Giant mill.
SECOND QUARTER REPORT 2011
North American Palladium Ltd.
Reflecting scope changes and the inflationary pressures affecting the mining industry today, the budget to advance Vezza to be ready for production by 2012 is now estimated at $34 million, up from the previous estimate of $26 million. Management expects that the total spend will be reduced by estimated pre-production revenue of $9 million from the bulk sample.
Flordin Property
The Flordin project is located approximately 30 kilometres north of the town of Lebel-sur-Quévillion, and approximately 70 kilometres away from the Sleeping Giant mill. The Company conducted a significant drilling program in 2010, consisting of 212 holes totaling 25,720 metres, which revealed the presence of several parallel gold veins near surface. The Company believes that the Flordin gold project has the potential to provide additional feed for the Sleeping Giant mill and is currently examining open pit or a combination of open pit and underground operation scenarios. An internal study to evaluate different mining scenarios for Flordin is currently in progress.
An updated estimate of mineral resources was released on July 12, 2011 and indicates an increase in the Measured and Indicated categories of the resource estimates due to increased density of drilling. The updated resource estimate was based on 329 drill holes totaling 38,331 metres and a resource update including an additional 157 drill holes drilled will be included in a future update. Measured and Indicated resources now total 2.8 million tonnes, containing 162,035 ounces of gold, and Inferred resources total 1.9 million tonnes, containing 97,651 ounces of gold.
The Company hired an independent consulting firm to conduct ore sorting tests on Flordin's mineralized zones and waste rocks to evaluate potential pre-concentration of ore before trucking it to the Sleeping Giant mill. Preliminary results indicate that pre-concentration can reject in the order of 50% low-grade rock in run-of-mine material, reducing transport costs and increasing head grade. This technology could increase the mill feed head grade and offer significant cost savings with important implications for overall gold production costs in an eventual mining operation. A second phase of ore sorting test work is underway with larger samples in the third quarter, with results expected by year-end. The Company recently received approval from the Ministry of Natural Resources and Wildlife for a 10,000-tonne bulk sample at its Flordin project.
In 2011, the Company plans to conduct 4,500 metres of drilling to evaluate open pit potential, permitting and bulk sampling.
Discovery Property
Discovery is an advanced-stage gold exploration project located approximately 35 kilometres northwest of the town of Lebel-sur-Quévillon, and approximately 70 kilometres from the Sleeping Giant mine and mill. The Discovery project is contiguous to the Flordin project. A 2008 scoping study confirmed the project to be economically feasible and generate positive cash flow under certain assumptions, with potential to produce 44,000 ounces of gold per year for four years. During 2011, the Company intends to update the scoping study with current costs and revised estimates of future gold prices.
In 2010, 40 drill holes totalling 25,495 metres were completed, 90% of which have now been logged and analyses received. Drilling was aimed at extending the 1200E zone, which was not considered in the 2008 Scoping Study, which considered the west gold zones only. Drilling the eastern extension of the 1200E zone has revealed new gold zones at depth and followed known zones deeper, eastward and westward. An updated estimate of resources will be prepared once all data has been received and integrated into a geological model, expected in the third quarter of 2011.
The Company has recently received the Certificate of Authorization from the Quebec's Ministry of Sustainable Development, Environment and Parks to conduct underground exploration as planned in the 2008 Scoping Study.
In 2011, the Company plans to conduct 8,000 metres of drilling on the project, targeting the extension of the 1200E Zone, and to advance permitting.
SECOND QUARTER REPORT 2011
North American Palladium Ltd.
Dormex Property
Dormex is an early-stage gold exploration project located adjacent to the Sleeping Giant mine and mill and is believed to have potential gold targets similar to Sleeping Giant. The 2010 exploration program was comprised of 4,206 metres of drilling and included a major reverse circulation drill program to better delineate overburden gold anomalies, as well as ground and airborne geophysics.
In 2011, the Company plans to conduct 2,400 metres of drilling, IP surveys and RC drilling. The Company is currently preparing for surface drilling to follow-up on gold anomalies discovered in the 2010 reverse circulation program, and to test new geophysical targets.
Cameron Shear and Florence Properties
Cameron Shear and Florence are early-stage gold exploration projects adjacent to the east of the Discovery gold deposit, and near the Flordin deposit. Drilling on a number of geophysical targets has improved the Company’s understanding of the early-stage property, although economic intersections have not yet been encountered at this juncture. Logging of drill core from the 2010 program is currently ongoing and is expected to be completed in the third quarter of 2011.
Laflamme Gold Property
Laflamme is an early-stage gold exploration project in the Abitibi region of Quebec, a joint venture with Midland Exploration Inc. The property is situated on favourable geology, following the trend from the Company’s Discovery project to the Sleeping Giant mine. The Company is earning a 50% interest in the project and may acquire an additional 15% interest by completing a feasibility study. In 2010 and 2011 to date, 12 drill holes totaling 4,353 metres were completed on the property.
On June 15, 2011 Midland Exploration Inc. announced the discovery of a new mineralized zone with nickel, copper and platinum group elements. Additional results are pending, and the joint venture partners are designing a follow-up program on this intersection and other targets on the property. A helicopter-borne magnetic and electromagnetic (VTEM) anomalies associated with the discovery extend over several kilometres and thus represent an extensive prospective area that remains completely untested.
In 2011, the Company plans to conduct 2,400 metres of drilling and ground geophysics.
Shebandowan Property
The Company holds a 50% interest in the former producing Shebandowan mine and the surrounding Haines and Conacher properties pursuant to an Option and Joint Venture Agreement with Vale Inco Limited (“Vale”). The properties, known as the Shebandowan property, contain a series of nickel copper-PGM mineralized bodies. The land package, which totals approximately 7,842 hectares, is located 90 kilometres west of Thunder Bay, Ontario, and approximately 100 kilometres southwest from the Company’s LDI mine. Vale retains an option to increase its interest from 50% to 60%, exercisable in the event that a feasibility study on the property results in a mineral reserve and mineral resource estimate of the equivalent of 200 million pounds of nickel and other metals.
In 2010, the Company and Vale conducted a large ground geophysical survey on the property. Preliminary results support further exploration work on the property.
SECOND QUARTER REPORT 2011
North American Palladium Ltd.
CRITICAL ACCOUNTING POLICIES AND ESTIMATES
Critical accounting policies generally include estimates that are highly uncertain and for which changes in those estimates could materially impact the Company’s financial statements. The following accounting policies are considered critical:
The preparation of the interim consolidated financial statements in conformity with IFRS requires management to make judgments, estimates, and assumptions that affect the application of accounting policies and the reported amount of assets and liabilities, the disclosure of contingent assets and liabilities at the date of the financial statements and the reported amounts of revenue and expenses during the year. Significant estimates and assumptions relate to recoverability of mining operations and mineral exploration properties. While management believes that these estimates and assumptions are reasonable, actual results could vary significantly.
Certain assumptions are dependent upon reserves, which represent the estimated amount of ore that can be economically and legally extracted from the Company’s properties. In order to estimate reserves, assumptions are required about a range of geological, technical and economic factors, including quantities, grades, production techniques, recovery rates, production costs, transportation costs, commodity demand, commodity prices and exchange rates. Estimating the quantity and/or grade of reserves requires the size, shape and depth of ore bodies to be determined by analyzing geological data such as drilling samples. This process may require complex and difficult geological judgments to interpret the data. Estimates and underlying assumptions are reviewed on an ongoing basis. Revisions to accounting estimates are recognized in the period in which the estimates are revised and in any future periods affected.
Because the economic assumptions used to estimate reserves change from period to period, and because additional geological data is generated during the course of operations, estimates of reserves may change from period to period. Changes in reported reserves may affect the Company’s financial results and financial position in a number of ways, including the following:
| | · | Asset carrying values may be affected due to changes in estimated future cash flows; |
| | · | Depreciation and amortization charged in the income statement may change where such charges are determined by the units of production basis, or where the useful economic lives of assets change; |
| | · | Overburden removal costs recorded on the balance sheet or charged to the income statement may change due to changes in the units of production basis of depreciation and amortization; |
| | · | Decommissioning, site restoration and environmental provisions may change where changes in estimated reserves affect expectations about the timing or cost of these activities; and |
| | · | The carrying value of deferred tax assets may change due to changes in estimates of the likely recovery of the tax benefits. |
| b. | Impairment assessments of long-lived assets |
The carrying amounts of the Company’s non-financial assets, other than investment property, inventories and deferred tax assets, are reviewed at each reporting date to determine whether there is any indication of impairment. Impairment is assessed at the level of cash-generating units (“CGUs”). An impairment loss is recognized in the Consolidated Statements of Operations and Comprehensive Loss for any excess of carrying amount over the recoverable amount.
Impairment is determined for an individual asset unless the asset does not generate cash inflows that are independent of those generated from other assets or groups of assets, in which case, the individual assets are grouped together into CGUs for impairment purposes.
SECOND QUARTER REPORT 2011
North American Palladium Ltd.
The recoverable amount of an asset or cash-generating unit is the greater of its “value in use” and its “fair value less costs to sell”. In assessing value in use, the estimated future cash flows are discounted to their present value using a pre-tax discount rate that reflects current market assessments of the time value of money and the risks specific to the asset.
An impairment loss is recognized in the Consolidated Statements of Operations and Comprehensive Loss if the carrying amount of an asset or its CGU exceeds its estimated recoverable amount. The recoverable amount of an asset is the higher of its fair value less costs to sell and its value in use.
Impairment losses recognized in prior periods are assessed at each reporting date for any indications that the loss has decreased or no longer exists. An impairment loss on non-financial assets other than goodwill is reversed if there has been a change in the estimates used to determine the recoverable amount, only to the extent that the asset’s carrying amount does not exceed the carrying amount that would have been determined, net of amortization, if no impairment loss had been recognized.
| c. | Depreciation and amortization of mining interests |
Mining interests relating to plant and equipment, mining leases and claims, royalty interests, and other development costs are recorded at cost with depreciation and amortization provided on the unit-of-production method over the estimated remaining ounces of palladium (LDI) and gold (NAP Quebec) to be produced based on the proven and probable reserves.
Mining interests relating to small vehicles and certain machinery with a determinable expected life are recorded at cost with depreciation provided on a straight-line basis over their estimated useful lives, ranging from three to seven years, which most closely reflects the expected pattern of consumption of the future economic benefits embodied in the asset. Straight-line depreciation is calculated over the depreciable amount, which is the cost of an asset, less its residual value.
Significant components of individual assets are assessed and if a component has a useful life that is different from the remainder of that asset, that component is depreciated separately using the unit-of-production or straight-line method as appropriate. Costs relating to value beyond proven and probable reserves (“VBPP”) and land are not amortized.
Leased assets are depreciated over the shorter of the lease term and their useful lives unless it is reasonably certain that the Company will obtain ownership by the end of the lease term.
Depreciation methods, useful lives and residual values are reviewed at each financial year-end and adjusted if appropriate.
Revenue from the sale of metals in the course of ordinary activities is measured at the fair value of the consideration received or receivable, net of volume adjustments. Revenue is recognized when persuasive evidence exists, usually in the form of an executed sales agreement, that the significant risks and rewards of ownership have been transferred to the buyer, recovery of the consideration is probable, the associated costs and possible return of goods can be estimated reliably, there is no continuing management involvement with the goods, and the amount of revenue can be measured reliably. The timing of the transfers of risks and rewards varies depending on the individual terms of the contract of sale.
Revenue from the sale of palladium and by-product metals from the LDI mine is provisionally recognized net of royalties based on quoted market prices upon the delivery of concentrate to the smelter or designated shipping point, which is when title transfers and significant rights and obligations of ownership pass. The Company’s smelter contract provides for final prices to be determined by quoted market prices in a period subsequent to the date of concentrate delivery. Variations from the provisionally priced sales are recognized as revenue adjustments until final pricing is determined. Accounts receivable is recorded net of estimated treatment and refining costs, which are subject to final assay adjustments. Subsequent adjustments to provisional pricing amounts due to changes in metal prices and foreign exchange, are reflected separately from initial revenues on the consolidated statements of operations and comprehensive loss.
SECOND QUARTER REPORT 2011
North American Palladium Ltd.
Revenue from the sale of gold-silver doré bars from Sleeping Giant is recognized when the significant risks and rewards of ownership have transferred to the buyer and selling prices are known or can be reasonably estimated.
| e. | Asset retirement obligations |
In accordance with Company policies, asset retirement obligations relating to legal and constructive obligations for future site reclamation and closure of the Company’s mine sites are recognized when incurred and a liability and corresponding asset are recorded at fair value. Estimated closure and restoration costs are provided for in the accounting period when the obligation arising from the related disturbance occurs.
The amount of any liability recognized is estimated based on the risk-adjusted costs required to settle present obligations, discounted using a pre-tax risk-free discount rate consistent with the time period of expected cash flows. When the liability is initially recorded, a corresponding asset retirement cost is recognized as an addition to mining interests and amortized using the unit of production method.
The liability for each mine site is accreted over time to reflect the unwinding of the discount. The accretion charges are recognized as a finance cost in the Consolidated Statements of Operations and Comprehensive Loss. The liability is subject to re-measurement at each reporting date based on changes in discount rates and timing or amounts of the costs to be incurred. Changes in the liability, other than accretion charges, relating to mine rehabilitation and restoration obligations are added to or deducted from the carrying value of the related asset retirement cost in the reporting period recognized. If the change results in a reduction of the obligation in excess of the carrying value of the related asset retirement cost, the excess balance is recognized as a recovery through profit or loss in the period.
Impact of International Financial Reporting Standards (“IFRS”)
Accounting Policies
During the conversion project, the Company compared and evaluated the impact of IFRS standards on its operations in comparison to those standards previously applied under Canadian GAAP. The Company completed its final review of the applicability of IFRS 1 elections and adopted IFRS in the first quarter of 2011, the first filing under IFRS.
The following discussion outlines details of certain accounting policies the Company has applied which have been reflected in the Company’s IFRS consolidated opening balance sheet for the January 1, 2010 date of transition to IFRS and subsequent periods. A detailed discussion of accounting policies applied under IFRS is included in Note 3 and the quantitative impact of adopting IFRS is further discussed in Note 19 of the condensed interim consolidated financial statements for June 30, 2011.
Functional Currency
Based upon the application of IAS 21 (The Effects of Changes in Foreign Exchange Rates), the Company has determined that the Canadian dollar appropriately represents both its functional and reporting currency for the purposes of reporting under IFRS. This methodology is consistent with Canadian GAAP applied previously and did not result in additional translation adjustments.
SECOND QUARTER REPORT 2011
North American Palladium Ltd.
Mining Interests and Depreciation and Amortization
Although certain aspects of the standards under Canadian GAAP are converged with IFRS, differences still exist primarily with regards to the determination of impairment of assets under IAS 36. Under IFRS, the Company is required to identify cash generating units (“CGU’s”) independently for each of its consolidated entities. These CGU’s represent the smallest group of assets which are capable of generating cash independently from other assets held by the Company.
In determining whether impairment exists under Canadian GAAP, the Company performs a two-step approach that compares the net book value of assets to the undiscounted and discounted expected future cash flows from operations. Under IFRS, a one-step approach is used by which the determination of impairments require the comparison of the net book value of each of the CGU’s to the recoverable amount of the CGU. The recoverable amount is determined as the higher of the fair value of the expected future cash flows from that CGU, less costs to sell (“Fair Value Less Cost to Sell”) and the “Value in Use”.
Under Canadian GAAP, any impairment assessed is not reversed. Under IFRS, impairments assessed must be reversed in subsequent periods should economic conditions recover.
In accordance with IFRS 1, the Company may elect to measure certain property, plant and equipment at the date of transition to IFRSs at fair value and deem that fair value to be the cost of those assets at that date. The fair value of property, plant and equipment may be based on a previous GAAP revaluation at, or before, the date of transition to IFRS.
Under Canadian GAAP, the carrying value of the mineral properties and fixed assets at LDI were previously impaired and were written down to fair value at December 31, 2008. In addition, the Sleeping Giant mine was acquired in 2009 and was included on the books at fair value on the date of acquisition. The Company has elected to use the Canadian GAAP impaired and acquisition amounts as the deemed cost for the mineral properties and fixed assets for each mine respectively. Therefore, no adjustment existed on transition to IFRS on January 1, 2010 as no further impairments were identified subsequent to the fair value dates for each property.
Financial Instruments
Although the allocation of fair values between the debt and equity components of compound financial instruments issued by the Company is performed differently under IAS 32, Financial Instruments Presentation, from the pro-rata method applied under Canadian GAAP, the measurement of the fair values of such instruments does not differ materially.
The Company has elected to apply the IFRS 1 exemption relating to compound financial instruments. Therefore, transition variances relating to debt instruments fully repaid prior to the January 1, 2010 transition date have not been recognized. As a result, only outstanding debt instruments and compound instruments denominated in foreign currencies would require retrospective restatement to comply with the standards within IAS 32 at the time of transition to IFRS on January 1, 2010.
The adoption of IAS 32 resulted in material reallocations of balances within the Company’s debt and equity accounts. The impact of the adoption of IAS 32 was limited primarily to the foreign-denominated convertible notes and related embedded derivatives issued by the Company in 2006.
Management is presently reviewing proposed amendments to IFRS standards relating to financial instruments which may further impact the adjustments required for conversion to IFRS. Therefore, the Company’s determination of the financial impact of the final transition adjustments may be impacted by future amendments to IFRS standards.
Share-Based Payment Transactions
Under Canadian GAAP, stock compensation expense can be calculated on a straight-line depreciation method over the respective vesting period for each stock option. In accordance with IFRS 2, stock compensation expense is recognized on a graduated method over the vesting period and a provision is generally applied against the recognized expense based on the historical rate of non-vesting of options.
SECOND QUARTER REPORT 2011
North American Palladium Ltd.
Under Canadian GAAP, the fair value assigned to the liability of outstanding RSU’s is the value of the Company’s share price at each reporting date. Under IFRS, the fair value of the RSU liability at each reporting date is calculated by applying an option pricing model. Management has utilized the Black-Scholes model to determine the option value contained in each RSU.
The Company’s election under IFRS 1 relating to share-based payments has restricted the adjustments relating to the measurement of such equity instruments to only those instruments granted after November 7, 2002 and which have not vested at the date of transition of January 1, 2010.
Mine Reclamation Obligations
The measurement of decommissioning liabilities and related balances included in the cost of property, plant and equipment in accordance with IAS 37 – Provisions, Contingent Liabilities and Contingent Assets differs from that applied by the Company under Canadian GAAP. An election by the Company under IFRS 1 has resulted in the initial measurement of these amounts as at January 1, 2010 with prospective application of IFRS standards subsequent to that date.
Flow-Through Shares
Under Canadian GAAP, the accounting treatment of flow-through shares is addressed by Emerging Issues Committee (“EIC”) 146, Flow-Through Shares. Under IFRS, IAS 12, Income Taxes, contains no specific guidance on the appropriate accounting for flow-through shares. Therefore, entities are required to apply judgment in developing an appropriate model accounting policy based on the principles of IFRS standards.
SIC Interpretation 25, Income Taxes – Changes in the Tax Status of an Entity or its Shareholders, provides some additional guidance in that it requires that the current and deferred tax consequences of a change in tax status shall be included in profit or loss for the period, unless those consequences relate to transactions and events that result in a direct credit to the recognized amount of equity. The portion of tax liabilities or assets related to such recognized equity amounts which is not included in profit or loss must be charged or credited directly to equity.
Under Canadian GAAP, proceeds received from the issue of flow-through shares are included in the value of the Company’s common share capital. The subsequent renunciation of tax deductions by the Company results in the recognition of a future tax liability and an equivalent charge is applied to reduce common share capital.
Under IFRS, on the date of issuance of the flow-through shares, the premium relating to the proceeds received in excess of the closing market price of the Company’s common shares is allocated to liabilities. As the tax attributes of the related expenditures are renounced to investors and deferred income tax expense and deferred income tax liabilities are increased by the estimated income tax benefits renounced by the Company to the investors. The premium liability is reduced pro-rata based on the percentage of flow-through expenditures renounced in comparison to renunciations required under the terms of the flow-through share agreement. The reduction to the premium liability in the period of renunciation is recognized through profit or loss as other income.
Where the Company has unused tax benefits on loss carry forwards and tax pools in excess of book value available for deduction against which a valuation allowance has been provided, the Company reduces its valuation allowance to offset the increase in deferred tax liabilities resulting in an offsetting recovery of deferred income taxes being recognized through profit or loss in the reporting period.
Revenue Recognition
Revenue from the sale of palladium and by-product metals from the LDI mine is provisionally recognized net of royalties based on quoted market prices upon the delivery of concentrate to the smelter or designated shipping point, which is when title transfers and significant rights and obligations of ownership pass. Revenue from the sale of gold-silver doré bars from Sleeping Giant is recognized when the significant risks and rewards of ownership have transferred to the buyer and selling prices are known or can be reasonably estimated.
SECOND QUARTER REPORT 2011
North American Palladium Ltd.
Since each of the above methods of revenue recognition are supported by IAS 18, and the Company recognizes revenues separately for each of the metals contained in the concentrate and doré bars, management’s initial review of IAS 18 (Revenue) did not identify any significant issues which would require a material change to the Company’s existing revenue recognition policies at the IFRS transition date.
Income Taxes
Similar to Canadian GAAP, deferred tax assets and liabilities are recognized under IFRS based on temporary timing differences between the carrying value of assets and liabilities for accounting purposes and the respective value assigned to those assets and liabilities for tax purposes. As a result, the Company has recognized the corresponding increase or decrease in its reported deferred tax asset or liability balances at the January 1, 2010 IFRS transition date and subsequent reporting periods based on the resultant differences between the restated carrying value of assets and liabilities under IFRS and their associated tax bases.
Internal Controls over Financial Reporting & Disclosure Controls and Procedures
Management has continually evaluated the impact of the adoption of IFRS on the reporting and disclosure processes of the Company. Throughout the conversion project, management has made those modifications to its data analysis, information systems, and reporting processes that were required to incorporate the collection of information necessary under IFRS.
As a result of the convergence of Canadian GAAP with IFRS standards, the Company has not presently incorporated any material changes to its ICFR or DC&P during the course of its conversion project. Most changes to the Company’s internal controls were already incorporated incrementally over time as a result of the Company’s adoption of the converged standards.
In conjunction with the analysis of the Company’s January 1, 2010 opening balances under IFRS, management has implemented changes to certain of its internal reports and data analysis to facilitate the appropriate collection of data for IFRS reporting purposes. The changes were implemented in parallel to existing reporting and appropriately reconciled to previously reported totals to ensure the completeness and accuracy of the revised reports and analyses. Since these changes represented only a component part of the reporting process, no material changes to the Company’s internal controls have been specifically required as a result of these modifications.
Business Activities
The conversion to IFRS may result in certain consequences which are dependent upon how certain business activities are approached, monitored, or concluded by the Company. Consideration of such issues as foreign currency, hedging activities, debt covenants, compensation arrangements, and risk management practices may be required.
Whereas foreign currency considerations, compensation arrangements, and risk management issues are addressed by the Company on a regular basis, at January 1, 2010, the Company did not have any outstanding debt, with the exception of certain capital leases, and no hedging activities or contracts existed. Management will continue to monitor the impact of IFRS upon its current and future business activities.
Information Systems
In order to facilitate the compilation of information required for IFRS reporting and disclosures, management has made appropriate modifications to its information gathering and analysis procedures. However, no material changes to the Company’s existing accounting systems or related internal controls have been required. Those changes which have been implemented generally required minor changes to reports or data analysis to ensure that additional information required for disclosures under IFRS that were not currently collected under Canadian GAAP, were appropriately tracked for IFRS reporting purposes.
The risks and uncertainties are discussed within the Company’s most recent Form 40-F/Annual Information Form on file with the SEC and Canadian provincial securities regulatory authorities.
SECOND QUARTER REPORT 2011
North American Palladium Ltd.
Internal Control over Financial Reporting
There have been no changes in the Company’s internal controls over the financial reporting that occurred during the most recent period ended June 30, 2011 that have materially affected or are reasonably likely to materially affect, the Company’s internal control over financial reporting. Additional disclosure regarding internal controls is provided within the discussion of the impact of IFRS earlier in this MD&A.
Additional information regarding the Company is included in the Company’s Annual Information Form and Annual Report on Form 40-F, which are filed with the SEC and the provincial securities regulatory authorities, respectively. A copy of the Company’s Annual Information Form is posted on the SEDAR website at www.sedar.com. A copy of the Annual Report or Form 40-F can be obtained from the SEC’s website at www.sec.gov.
This MD&A refers to cash used in operating activities per share and cash cost per ounce which are not recognized measures under Canadian GAAP. Such Non-IFRS financial measures do not have any standardized meaning prescribed by Canadian GAAP and are therefore unlikely to be comparable to similar measures presented by other issuers. Management uses these measures internally. The use of these measures enables management to better assess performance trends. Management understands that a number of investors, and others who follow the Company’s performance, assess performance in this way. Management believes that these measures better reflect the Company’s performance and are better indications of its expected performance in future periods. This data is intended to provide additional information and should not be considered in isolation or as a substitute for measures of performance prepared in accordance with Canadian GAAP. The following tables reconcile these non-IFRS measures to the most directly comparable Canadian GAAP measures:
Reconciliation of Cash Used in Operations per Share*
| | | Three months ended June 30 | | | Six months ended June 30 | |
| (expressed in thousands of dollars except per share amounts) | | 2011 | | | | 2010 | * | | | 2011 | | | | 2010 | * |
| Cash provided by (used in) operations prior to changes in non-cash working capital | | $ | 11,357 | | | $ | (5,698 | ) | | $ | 4,789 | | | $ | (17,884 | ) |
| Weighted average number of shares outstanding – basic | | | 162,408,842 | | | | 141,280,348 | | | | 161,309,680 | | | | 134,381,303 | |
| Cash provided by (used in) operations prior to changes in non-cash working capital per share | | $ | 0.07 | | | $ | (0.04 | ) | | $ | 0.03 | | | $ | (0.13 | ) |
| * | Certain prior period amounts have been reclassified to conform to the classification adopted in the current period. |
Cash Costs
The Company reports cash costs on a sales basis. Cash costs include mine site operating costs such as mining, processing, administration, and royalties, but is exclusive of depreciation, amortization, reclamation, capital and exploration costs. Cash costs are reduced by any by-product revenue and is then divided by ounces sold to arrive at the by-product cash cost of sales. This measure, along with revenues, is considered to be a key indicator of a company’s ability to generate operating earnings and cash flow from its mining operations.
SECOND QUARTER REPORT 2011
North American Palladium Ltd.
| (a) | Reconciliation of Palladium Cash Cost per Ounce |
| (expressed in thousands of dollars except per ounce amounts) | | Three months ended June 30 | | | Six months ended June 30 | |
| | | 2011 | | | 2010 | | | 2011 | | | 2010 | |
| Production costs including overhead | | $ | 21,131 | | | $ | 10,132 | | | $ | 41,170 | | | $ | 10,132 | |
| Smelting, refining and freight costs | | | 2,118 | | | | 1,163 | | | | 3,545 | | | | 1,163 | |
| Royalty expense | | | 1,899 | | | | 745 | | | | 3,025 | | | | 745 | |
| Total operating expenses | | | 25,148 | | | | 12,040 | | | | 47,740 | | | | 12,040 | |
| Divided by ounces of palladium sold | | | 46,362 | | | | 24,089 | | | | 76,817 | | | | 24,089 | |
| Cash cost per ounce (CDN$) | | $ | 542 | | | $ | 500 | | | $ | 621 | | | $ | 500 | |
| Exchange rate (CDN$1 – US$) | | | 1.03 | | | | 0.97 | | | | 1.02 | | | | 0.97 | |
| Cash cost per ounce before by-product credits (US$) | | $ | 558 | | | $ | 485 | | | $ | 633 | | | $ | 485 | |
| | | | | | | | | | | | | | | | | |
| Total operating expenses | | | 25,148 | | | | 12,040 | | | | 47,740 | | | | 12,040 | |
| Less by-product metal revenue | | | 10,061 | | | | 4,489 | | | | 17,001 | | | | 4,489 | |
| | | $ | 15,087 | | | $ | 7,551 | | | $ | 30,739 | | | $ | 7,551 | |
| Divided by ounces of palladium sold | | | 46,362 | | | | 24,089 | | | | 76,817 | | | | 24,089 | |
| Cash cost per ounce (CDN$) | | $ | 325 | | | $ | 313 | | | $ | 400 | | | $ | 313 | |
| Exchange rate (CDN$1 – US$) | | | 1.03 | | | | 0.97 | | | | 1.02 | | | | 0.97 | |
| Cash cost per ounce (US$), net of by-product credits | | $ | 335 | | | $ | 304 | | | $ | 408 | | | $ | 304 | |
| (b) | Reconciliation of Gold Cash Cost per Ounce |
| (expressed in thousands of dollars except per ounce amounts) | | Three months ended June 30 | | | Six months ended June 30 | |
| | | 2011 | | | 2010 | | | 2011 | | | 2010 | |
| Production costs including overhead | | $ | 7,652 | | | $ | 6,518 | | | $ | 18,040 | | | $ | 16,567 | |
| Refining and freight costs | | | 18 | | | | 13 | | | | 30 | | | | 31 | |
| Total operating expenses | | | 7,670 | | | | 6,531 | | | | 18,070 | | | | 16,598 | |
| Less by-product metal revenue | | | - | | | | - | | | | 346 | | | | 179 | |
| | | | 7,670 | | | | 6,531 | | | | 17,724 | | | | 16,419 | |
| Divided by ounces of gold sold | | | 4,810 | | | | 4,100 | | | | 9,910 | | | | 10,800 | |
| Cash cost per ounce (CDN$) | | $ | 1,595 | | | $ | 1,593 | | | $ | 1,788 | | | $ | 1,520 | |
| Exchange rate (CDN$1 – US$) | | | 1.03 | | | | 0.97 | | | | 1.02 | | | | 0.97 | |
| Cash cost per ounce (US$) | | $ | 1,643 | | | $ | 1,545 | | | $ | 1,824 | | | $ | 1,475 | |
SECOND QUARTER REPORT 2011
North American Palladium Ltd.
| (c) | Adjusted net income (loss) |
Adjusted net income (loss) is a Non-IFRS financial measure, which excludes the following from net income (loss):
| | · | Asset impairment charges; |
| | · | Loss (gain) on disposal of equipment; and |
| | | Three months ended June 30 | | | Six months ended June 30 | |
| | | 2011 | | | 2010 | | | 2011 | | | 2010 | |
| Net income (loss) and comprehensive income (loss) for the year | | $ | 5,380 | | | $ | (11,849 | ) | | $ | (4,941 | ) | | $ | (30,200 | ) |
| Exploration | | | 6,134 | | | | 6,421 | | | | 9,973 | | | | 10,586 | |
| Mine startup costs | | | - | | | | - | | | | - | | | | 6,003 | |
| Loss on disposal of equipment | | | (242 | ) | | | 8 | | | | (242 | ) | | | 17 | |
| Adjusted net income (loss) | | $ | 11,272 | | | $ | (5,420 | ) | | $ | 4,790 | | | $ | (13,594 | ) |
Adjusted EBITDA is a Non-IFRS financial measure, which excludes the following from net income (loss):
| | · | Income and mining tax expense (recovery); |
| | · | Interest and other financing costs (income); |
| | · | Depreciation and amortization; |
| | · | Loss (gain) on disposal of equipment; and |
Management believes that EBITDA is a valuable indicator of the Company’s ability to generate liquidity by producing operating cash flow to fund working capital needs, service debt obligations, and fund capital expenditures.
EBITDA excludes the impact of cash costs of financing activities and taxes, and the effects of changes in operating working capital balances, and therefore is not necessarily indicative of operating profit or cash flow from operations as determined under IFRS. Other companies may calculate EBITDA differently.
| | | Three months ended June 30 | | | Six months ended June 30 | |
| | | 2011 | | | 2010 | | | 2011 | | | 2010 | |
| Net income (loss) and comprehensive income (loss) for the year | | $ | 5,380 | | | $ | (11,849 | ) | | $ | (4,941 | ) | | $ | (30,200 | ) |
| Income and mining tax expense (recovery) | | | 221 | | | | (1,150 | ) | | | 3,033 | | | | 2,195 | |
| Interest and other financing costs (income) | | | (1,037 | ) | | | (22 | ) | | | (1,449 | ) | | | (2,017 | ) |
| Depreciation and amortization | | | 4,940 | | | | 6,200 | | | | 9,105 | | | | 8,224 | |
| EBITDA | | | 9,504 | | | | (6,821 | ) | | | 5,748 | | | | (21,798 | ) |
| Exploration | | | 6,134 | | | | 6,421 | | | | 9,973 | | | | 10,586 | |
| Mine startup costs | | | - | | | | - | | | | - | | | | 6,003 | |
| Loss (gain) on disposal of equipment | | | (242 | ) | | | 8 | | | | (242 | ) | | | 17 | |
| Adjusted EBITDA | | $ | 15,396 | | | $ | (392 | ) | | $ | 15,479 | | | $ | (5,192 | ) |
SECOND QUARTER REPORT 2011