Filed by Falconbridge Limited
Pursuant to Rule 425 under the Securities Act of 1933
Subject Company: Falconbridge Limited
Commission File No. 333-129218

Link to searchable text of slide shown above


Searchable text section of graphics shown above
Filed by Falconbridge Limited
Pursuant to Rule 425 under the Securities Act of 1933
Subject Company: Falconbridge Limited
Commission File No. 333-129218
[GRAPHIC]
Falconbridge Limited
Corporate Profile
March 2006
[LOGO]
[LOGO]
Forward-Looking Statements
Certain statements to be made in this presentation are forward-looking statements (as defined in applicable securities legislation). Examples of such statements include, but are not limited to, statements concerning (i) our assessment of the outlook for metal markets in 2006, (ii) Inco’s offer to acquire all of the common shares of Falconbridge Limited and the benefits of such combination, (iii) our future financial requirements and funding of those requirements, (iv) our expectations with respect to our development projects and (v) our production forecast for 2006. Inherent in forward-looking statements are risks and uncertainties well beyond our ability to predict or control. Actual results and developments are likely to differ, and may differ materially, from those expressed or implied by the forward-looking statements contained in this News Release. Such statements are based on a number of assumptions which may prove to be incorrect, including, but not limited to, assumptions about the timing, steps to be taken and completion of Inco’s offer to acquire all of our common shares, the ability to successfully compete against global metals and mining and exploration companies by creating through such a combination an enterprise of increased scale; strong demand for nickel, copper and other metals in emerging markets such as China; approximately $350 million per annum in pre-tax operating and other synergies and cost savings, and other benefits being realized based on the achievement of operational efficiencies from restructuring, integration and other initiatives relating to the combination of Falconbridge and Inco; the approvals or clearances required to be obtained by Inco and Falconbridge from regulatory and other agencies and bodies being obtained in a timely manner; divestitures required by regulatory agencies being acceptable and completed in a timely manner; there being limited costs, difficulties or delays related to the integration of the Falconbridge’s operations with those of Inco; the timely completion of the steps required to be taken for the eventual combination of the two companies; business and economic conditions generally; exchange rates, energy and other anticipated and unanticipated costs and pension contributions and expenses; the supply and demand for, deliveries of, and the level and volatility of prices of, nickel, copper, aluminum, zinc and other primary metals products and other metal products Inco and Falconbridge produce; the timing of the receipt of remaining regulatory and governmental approvals for the development projects and other operations; the continued availability of financing on appropriate terms for development projects; Falconbridge’s costs of production and production and productivity levels, as well as those of its competitors; market competition; mining, processing, exploration and research and development activities; the accuracy of ore/mineral reserve estimates; premiums realized over LME cash and other benchmark prices; tax benefits/charges; the resolution of environmental and other proceedings and the impact on the combined company of various environmental regulations and initiatives; assumptions concerning political and economic stability in countries or locations in which Falconbridge operates or otherwise and the ability to continue to pay quarterly cash dividends in such amounts as Falconbridge’s Board of Directors may determine in light of other uses for such funds and other factors.
Inherent in those statements are known and unknown risks, uncertainties and other factors well beyond the Company’s ability to control or predict. Some of these known risks and uncertainties are outlined in filings by Falconbridge with applicable securities regulatory authorities, including in Falconbridge’s annual information form. Readers are encouraged to consult such filings. While Falconbridge anticipates that subsequent events and developments may cause Falconbridge’s views to change, the Company specifically disclaims any obligation to update these forward-looking statements. These forward-looking statements should not be relied upon as representing the Company’s views as of any date subsequent to the date of this news release. Although the Company has attempted to identify important factors that could cause actual actions, events or results to differ materially from those described in forward-looking statements, there may be other factors that cause actions, events or results not to be as anticipated, estimated or intended. There can be no assurance that forward-looking statements will prove to be accurate, as actual results and future events could differ materially from those anticipated in such statements. Accordingly, readers should not place undue reliance on forward-looking statements. These factors are not intended to represent a complete list of the factors that could affect Falconbridge and the combination of Inco and Falconbridge.
Agenda
1 Company Overview
2 Financial Position
3 Review of Operations & Growth Opportunities
4 Market Review and Outlook
5 Inco – Falconbridge Transaction
6 Summary
(ALL AMOUNTS ARE IN U.S. DOLLARS)
[LOGO]
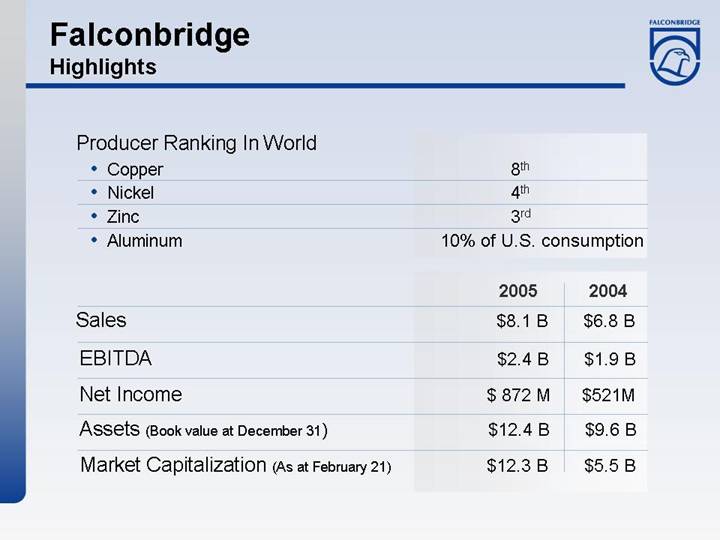
Falconbridge
Highlights
Producer Ranking In World
• Copper |
| 8th |
|
• Nickel |
| 4th |
|
• Zinc |
| 3rd |
|
• Aluminum |
| 10% of U.S. consumption |
|
|
| 2005 |
| 2004 |
| ||
Sales |
| $ | 8.1 | B | $ | 6.8 | B |
EBITDA |
| $ | 2.4 | B | $ | 1.9 | B |
Net Income |
| $ | 872 | M | $ | 521 | M |
Assets (Book value at December 31) |
| $ | 12.4 | B | $ | 9.6 | B |
Market Capitalization (As at February 21) |
| $ | 12.3 | B | $ | 5.5 | B |
[LOGO]
Falconbridge
Strategic Focus
• Focused on large-scale copper and nickel assets; also integrated zinc and aluminum producer
Operating Capital Asset Base |
| Revenue by Metal (2005) |
|
|
|
[CHART] |
| [CHART] |
[LOGO]
Production Outlook for 2006
|
|
|
| Actual |
| Forecast |
|
Production (MT) |
|
|
| 2005 |
| 2006 |
|
|
|
|
|
|
|
|
|
Copper |
| Mined |
| 462,000 |
| 475,000 |
|
| Refined |
| 544,000 |
| 635,000 |
| |
|
|
|
|
|
|
|
|
Nickel |
| Mined |
| 80,000 |
| 82,000 |
|
| Refined |
| 114,000 |
| 115,000 |
| |
|
|
|
|
|
|
|
|
Zinc |
| Mined |
| 454,000 |
| 460,000 |
|
| Refined* |
| 182,000 |
| 210,000 |
| |
|
|
|
|
|
|
|
|
Aluminum |
| Primary |
| 246,000 |
| 250,000 |
|
| Fabricated |
| 178,000 |
| 195,000 |
|
*Includes 100% of Kidd Creek refinery production and 25% of the Noranda Income Fund CEZ Refinery production
[LOGO]
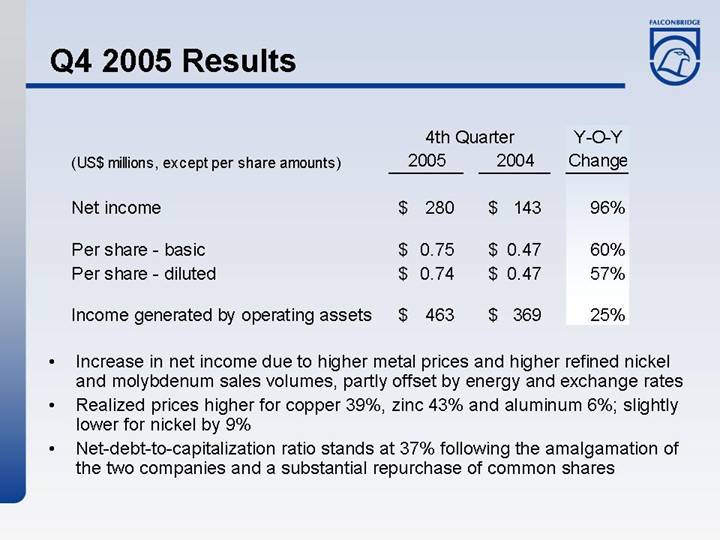
Q4 2005 Results
|
| 4th Quarter |
| Y-O-Y |
| ||||
(US$ millions, except per share amounts) |
| 2005 |
| 2004 |
| Change |
| ||
|
|
|
|
|
|
|
| ||
Net income |
| $ | 280 |
| $ | 143 |
| 96 | % |
|
|
|
|
|
|
|
| ||
Per share - basic |
| $ | 0.75 |
| $ | 0.47 |
| 60 | % |
Per share - diluted |
| $ | 0.74 |
| $ | 0.47 |
| 57 | % |
|
|
|
|
|
|
|
| ||
Income generated by operating assets |
| $ | 463 |
| $ | 369 |
| 25 | % |
• Increase in net income due to higher metal prices and higher refined nickel and molybdenum sales volumes, partly offset by energy and exchange rates
• Realized prices higher for copper 39%, zinc 43% and aluminum 6%; slightly lower for nickel by 9%
• Net-debt-to-capitalization ratio stands at 37%following the amalgamation of the two companies and a substantial repurchase of common shares
[LOGO]
Consolidated Results
|
|
|
|
|
|
|
|
|
|
|
| 2004 |
| ||||||
|
| 2005 |
| YTD |
| ||||||||||||||
US$ millions, except per share information |
| Q1 |
| Q2 |
| Q3 |
| Q4 |
| YTD |
| Dec. |
| ||||||
|
|
|
|
|
|
|
|
|
|
|
|
|
| ||||||
Revenues |
| 1,920 |
| 2,057 |
| 2,006 |
| 2,165 |
| 8,148 |
| 6,764 |
| ||||||
|
|
|
|
|
|
|
|
|
|
|
|
|
| ||||||
Operating expenses |
|
|
|
|
|
|
|
|
|
|
|
|
| ||||||
Mining, processing and refining costs |
| 595 |
| 643 |
| 615 |
| 685 |
| 2,538 |
| 1,976 |
| ||||||
Purchased raw materials |
| 748 |
| 804 |
| 816 |
| 867 |
| 3,235 |
| 2,904 |
| ||||||
Depreciation, amortization and accretion |
| 118 |
| 147 |
| 140 |
| 150 |
| 555 |
| 493 |
| ||||||
|
| 1,461 |
| 1,594 |
| 1,571 |
| 1,702 |
| 6,328 |
| 5,373 |
| ||||||
|
|
|
|
|
|
|
|
|
|
|
|
|
| ||||||
Income generated by operating assets |
| 459 |
| 463 |
| 435 |
| 463 |
| 1,820 |
| 1,391 |
| ||||||
|
|
|
|
|
|
|
|
|
|
|
|
|
| ||||||
Interest expense, net |
| 28 |
| 37 |
| 51 |
| 36 |
| 152 |
| 120 |
| ||||||
Corporate and general administration |
| 17 |
| 19 |
| 18 |
| 26 |
| 80 |
| 66 |
| ||||||
Research, development and exploration |
| 11 |
| 16 |
| 16 |
| 16 |
| 59 |
| 47 |
| ||||||
Minority interest in earnings of subsidiaries |
| 94 |
| 55 |
| 5 |
| 1 |
| 155 |
| 297 |
| ||||||
Income before undernoted |
| 309 |
| 336 |
| 345 |
| 384 |
| 1,374 |
| 861 |
| ||||||
|
|
|
|
|
|
|
|
|
|
|
|
|
| ||||||
Other expense (income) |
| 1 |
| 1 |
| (5 | ) | (14 | ) | (17 | ) | (84 | ) | ||||||
Tax expense |
| 124 |
| 133 |
| 136 |
| 118 |
| 511 |
| 351 |
| ||||||
Net income before discontinued operations |
| 184 |
| 202 |
| 214 |
| 280 |
| 880 |
| 594 |
| ||||||
|
|
|
|
|
|
|
|
|
|
|
|
|
| ||||||
Discontinued operations, net of tax |
| 8 |
| — |
| — |
| — |
| 8 |
| 73 |
| ||||||
Net income |
| 176 |
| 202 |
| 214 |
| 280 |
| 872 |
| 521 |
| ||||||
|
|
|
|
|
|
|
|
|
|
|
|
|
| ||||||
Basic earnings per common share |
| $ | 0.58 |
| $ | 0.62 |
| $ | 0.57 |
| $ | 0.75 |
| $ | 2.52 |
| $ | 1.71 |
|
Diluted earnings per common share |
| $ | 0.57 |
| $ | 0.61 |
| $ | 0.56 |
| $ | 0.74 |
| $ | 2.50 |
| $ | 1.70 |
|
[LOGO]
Income Generated by Op. Assets
|
| Twelve Months |
| ||
US$ millions |
| 2005 |
| 2004 |
|
|
|
|
|
|
|
Copper |
| 1,346 |
| 907 |
|
Nickel |
| 762 |
| 773 |
|
Zinc |
| 93 |
| 70 |
|
Aluminum |
| 159 |
| 127 |
|
Other |
| 15 |
| 7 |
|
Depreciation, amortization and accretion |
| (555 | ) | (493 | ) |
|
|
|
|
|
|
Income generated by operating assets |
| 1,820 |
| 1,391 |
|
[LOGO]
Consolidated Balance Sheet
US$ millions |
| 31-Dec-05 |
| 31-Dec-04 |
| ||
ASSETS |
|
|
|
|
| ||
Cash and cash equivalents |
| $ | 886 |
| $ | 884 |
|
Accounts receivable |
| 1,007 |
| 948 |
| ||
Metals and other inventories |
| 1,708 |
| 1,436 |
| ||
|
| 3,601 |
| 3,268 |
| ||
Operating capital assets |
| 6,803 |
| 4,870 |
| ||
Development projects |
| 1,707 |
| 1,166 |
| ||
Investments and other assets |
| 307 |
| 324 |
| ||
TOTAL ASSETS |
| $ | 12,418 |
| $ | 9,628 |
|
|
|
|
|
|
| ||
LIABILITIES AND EQUITY |
|
|
|
|
| ||
Accounts and taxes payable |
| $ | 1,691 |
| $ | 1,265 |
|
Debt due within one year |
| 353 |
| 570 |
| ||
|
| 2,044 |
| 1,835 |
| ||
Long-term debt |
| 2,598 |
| 2,736 |
| ||
Preferred share liabilities |
| 876 |
| 122 |
| ||
Future income taxes |
| 1,156 |
| 304 |
| ||
Asset retirement obligation, pension and other provisions |
| 659 |
| 595 |
| ||
Stockholders’ interests |
|
|
|
|
| ||
Interests of other shareholders |
| 54 |
| 1,197 |
| ||
Shareholders’ equity |
| 5,031 |
| 2,839 |
| ||
|
| 5,085 |
| 4,036 |
| ||
TOTAL LIABILITIES AND EQUITY |
| $ | 12,418 |
| $ | 9,628 |
|
[LOGO]
Capital Investments
(US$ millions) |
| 2005 |
| 2006F |
| ||
Koniambo development |
| $ | 96 |
| $ | 180 |
|
Kidd Mine extension |
| 114 |
| 90 |
| ||
Nickel Rim South project |
| 74 |
| 85 |
| ||
Copper dev. projects (El Morro, El Pachon, Lomas Bayas) |
| 4 |
| 50 |
| ||
Nickel dev. projects (Kabanga, Raglan) |
| 61 |
| 30 |
| ||
Sustaining Capital and other |
| 388 |
| 315 |
| ||
Total |
| $ | 737 |
| $ | 750 |
|
[LOGO]
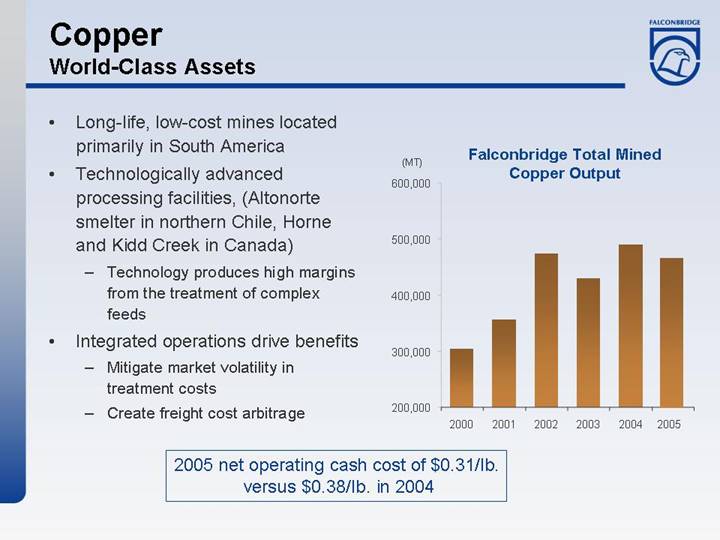
World-Class Assets
• | Long-life, low-cost mines located primarily in South America |
|
|
• | Technologically advanced processing facilities, (Altonorte smelter in northern Chile, Horne and Kidd Creek in Canada) |
|
|
| • Technology produces high margins from the treatment of complex feeds |
|
|
• | Integrated operations drive benefits |
|
|
| • Mitigate market volatility in treatment costs |
|
|
| • Create freight cost arbitrage |
Falconbridge Total Mined
Copper Output
[CHART]
2005 net operating cash cost of $0.31/lb.
versus $0.38/lb. in 2004
[LOGO]
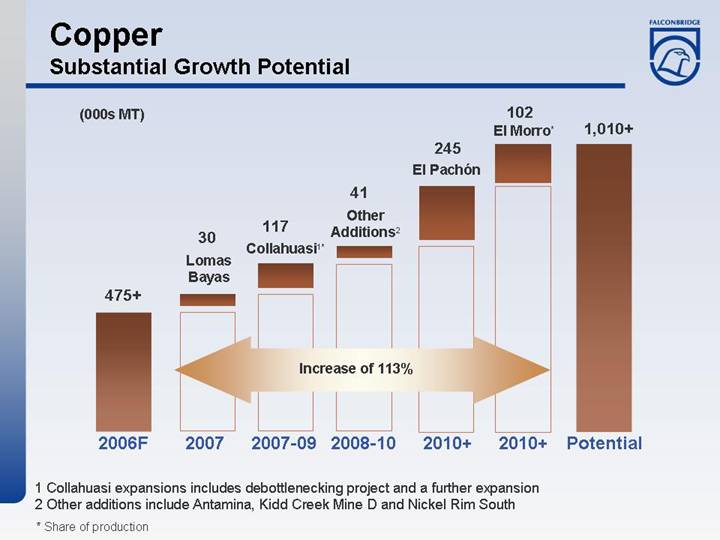
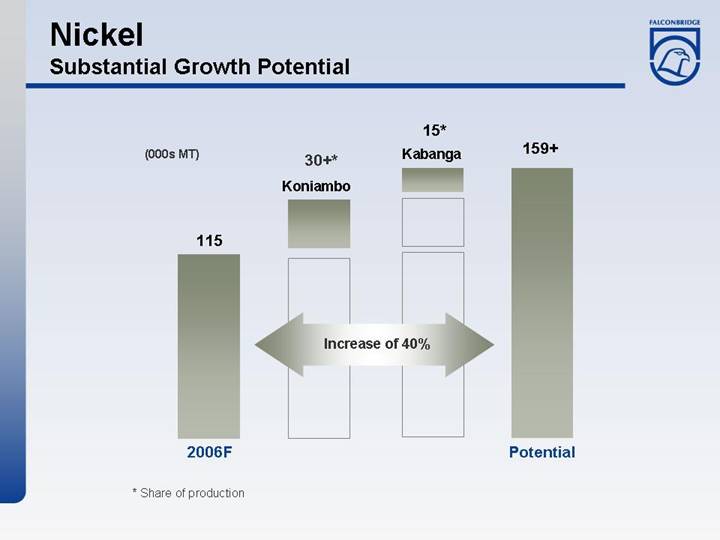
Substantial Growth Potential
[CHART]
(1) Collahuasi expansions includes debottlenecking project and a further expansion
(2) Other additions include Antamina, Kidd Creek Mine D and Nickel Rim South
* Share of production
[LOGO]
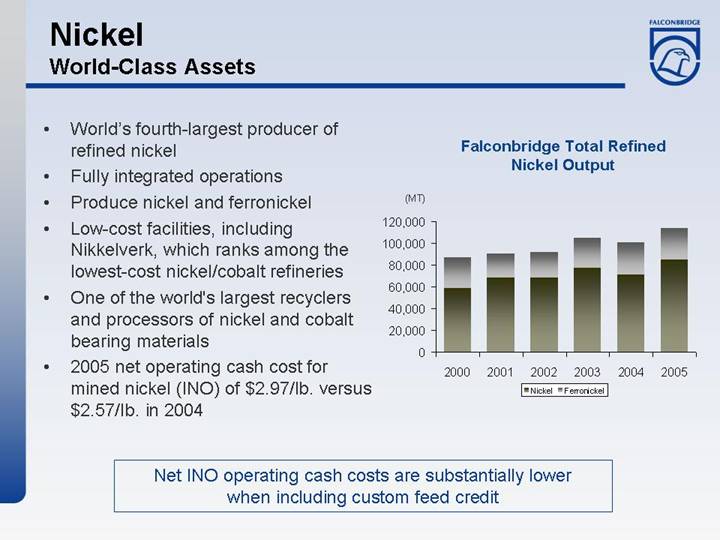
World-Class Assets
• | World’s fourth-largest producer of refined nickel |
• | Fully integrated operations |
• | Produce nickel and ferronickel |
• | Low-cost facilities, including Nikkelverk, which ranks among the lowest-cost nickel/cobalt refineries |
• | One of the world’s largest recyclers and processors of nickel and cobalt bearing materials |
• | 2005 net operating cash cost for mined nickel (INO) of $2.97/lb. versus $2.57/lb. in 2004 |
Falconbridge Total Refined
Nickel Output
[CHART]
Net INO operating cash costs are substantially lower
when including custom feed credit
[LOGO]
Integrated Operations
• | World’s third-largest zinc miner |
|
|
• | Attractive brownfield and greenfield projects under consideration |
|
|
• | Potential to maintain current production levels via available projects |
|
|
• | Well positioned to benefit from increase in zinc and lead prices |
[GRAPHIC]
2005 net operating cash cost for mined zinc of $0.41/lb.
versus $0.32/lb. in 2004
[LOGO]
Projects
Three options available to increase overall zinc production and replace depleting resources, which will allow Falconbridge to maintain its exposure to the improving zinc market
|
|
|
| Annual |
|
| ||
|
|
|
| Production |
|
| ||
Operation |
| Project |
| (100% basis) |
| Status | ||
Perseverance, |
| Brownfield |
| 125,000 |
| MT |
| Feasibility study |
Quebec (90%) |
| Development |
|
|
|
|
| completed in 2001 |
|
| Project |
|
|
|
|
|
|
|
|
|
|
|
|
|
|
|
Lennard Shelf, |
| Brownfield |
| 75,000 |
| MT |
| Currently on care |
Australia (50%) |
| Development |
|
|
|
|
| and maintenance |
|
| Project |
|
|
|
|
|
|
|
|
|
|
|
|
|
|
|
Lady Loretta, |
| Greenfield |
| 120,000 |
| MT |
| Feasibility study |
Australia (75%) |
| Development |
|
|
|
|
| completed |
|
| Project |
|
|
|
|
|
|
[LOGO]
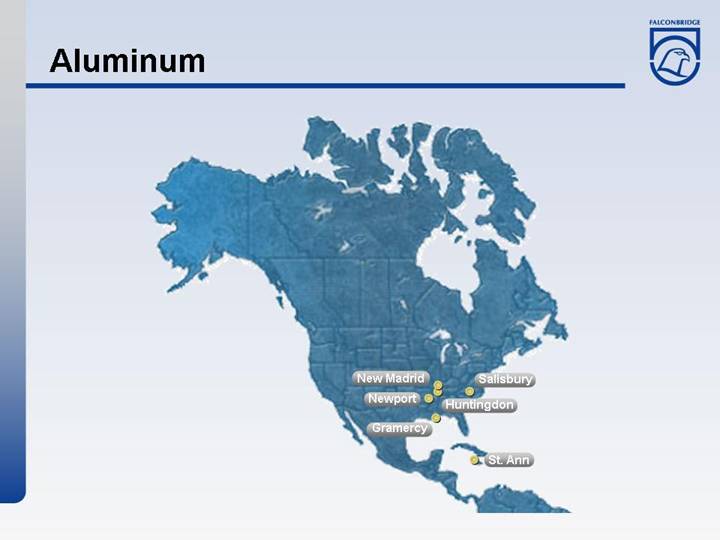
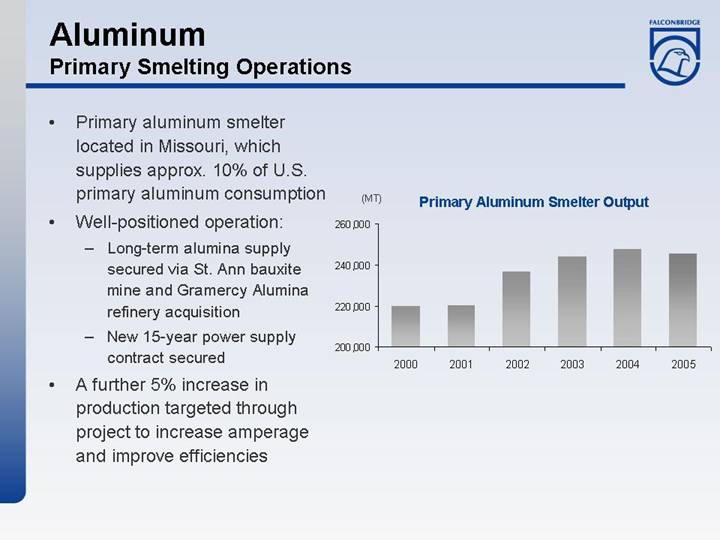
Primary Smelting Operations
• | Primary aluminum smelter located in Missouri, which supplies approx. 10% of U.S. primary aluminum consumption |
|
|
• | Well-positioned operation: |
|
|
| • Long-term alumina supply secured via St. Ann bauxite mine and Gramercy Alumina refinery acquisition |
|
|
| • New 15-year power supply contract secured |
|
|
• | A further 5% increase in production targeted through project to increase amperage and improve efficiencies |
Primary Aluminum Smelter Output
[CHART]
[LOGO]
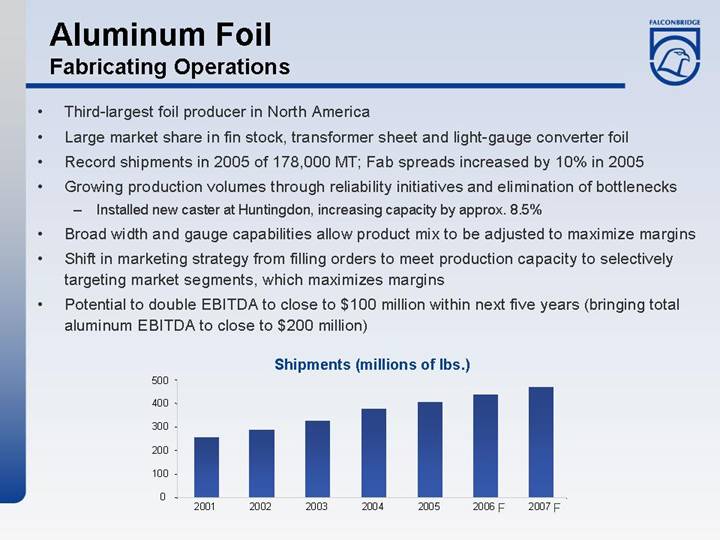
Aluminum Foil
Fabricating Operations
• Third-largest foil producer in North America
• Large market share in fin stock, transformer sheet and light-gauge converter foil
• Record shipments in 2005 of 178,000 MT; Fab spreads increased by 10% in 2005
• Growing production volumes through reliability initiatives and elimination of bottlenecks
• Installed new caster at Huntingdon, increasing capacity by approx. 8.5%
• Broad width and gauge capabilities allow product mix to be adjusted to maximize margins
• Shift in marketing strategy from filling orders to meet production capacity to selectively targeting market segments, which maximizes margins
• Potential to double EBITDA to close to $100 million within next five years (bringing total aluminum EBITDA to close to $200 million)
Shipments (millions of lbs.)
[CHART]
[LOGO]
Market Review
Copper, Nickel, Zinc & Aluminum
• Pension funds and money managers helping drive metals prices
• Excellent fundamentals prevail across metals complex
• Commodity Index Funds now providing exposure to basket of commodities
• Funds’ investments in metals expected to grow
• Rising metal prices affecting consumers
• Constrained consumer inventories providing support during price retractions
• Markets remain firmly underpinned by and exposed to supply disruptions and increased role of investment funds
[LOGO]
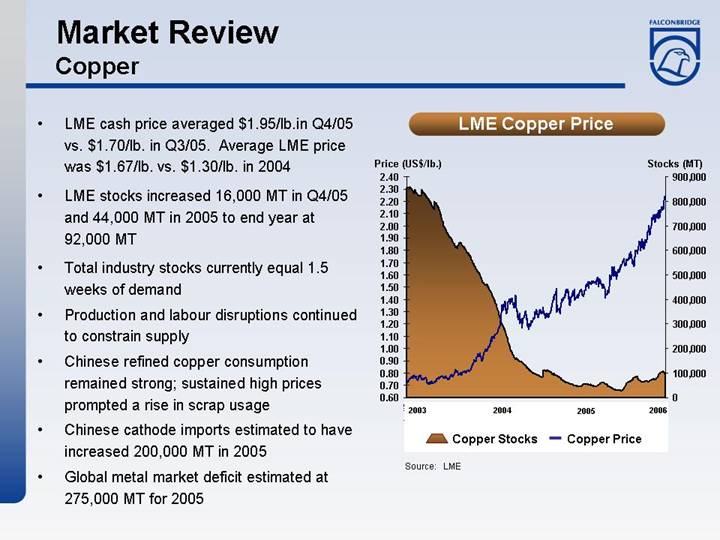
Market Review
Copper
• | LME cash price averaged $1.95/lb.in Q4/05 vs. $1.70/lb. in Q3/05. Average LME price was $1.67/lb. vs. $1.30/lb. in 2004 |
|
|
• | LME stocks increased 16,000 MT in Q4/05 and 44,000 MT in 2005 to end year at 92,000 MT |
|
|
• | Total industry stocks currently equal 1.5 weeks of demand |
|
|
• | Production and labour disruptions continued to constrain supply |
|
|
• | Chinese refined copper consumption remained strong; sustained high prices prompted a rise in scrap usage |
|
|
• | Chinese cathode imports estimated to have increased 200,000 MT in 2005 |
|
|
• | Global metal market deficit estimated at 275,000 MT for 2005 |
LME Aluminum Price
[CHART]
Source: LME
[LOGO]
Market Outlook
Copper
Copper Metal World Supply/Demand Balance
|
|
|
| % |
|
|
| % |
|
(000s MT) |
| 2005A |
| change |
| 2006F |
| change |
|
Supply |
| 17,094 |
| 7.4 | % | 18,437 |
| 7.9 | % |
Demand |
|
|
|
|
|
|
|
|
|
North America |
| 3,139 |
| 0.6 | % | 3,200 |
| 1.9 | % |
Europe |
| 4,126 |
| -0.2 | % | 4,215 |
| 2.2 | % |
Japan |
| 1,283 |
| 0.4 | % | 1,290 |
| 0.5 | % |
China |
| 3,820 |
| 7.2 | % | 4,225 |
| 10.6 | % |
Other |
| 5,001 |
| 7.4 | % | 5,170 |
| 3.4 | % |
Total Demand |
| 17,369 |
| 3.7 | % | 18,100 |
| 4.2 | % |
Balance |
| -275 |
|
|
| 377 |
|
|
|
Stocks |
| 462 |
|
|
| 799 |
|
|
|
Weeks of Supply |
| 1.4 |
|
|
| 2.3 |
|
|
|
(Stocks include: LME, CMX, SHFE, Producer, Consumer & Merchant) |
|
|
• Mine production to grow in 2006, but will be affected by declining ore grades in 2007
• Chinese infrastructure building and U.S. hurricane rebuilding continue to support demand
• Metal market to shift to small surplus from small deficit in 2005
• Reuters analyst poll forecasts average price of $1.70/lb. in 2006
[LOGO]
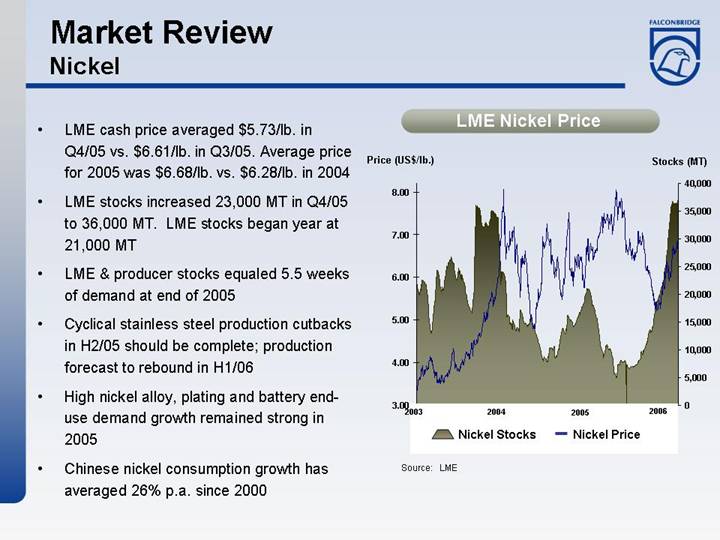
Market Review
Nickel
• | LME cash price averaged $5.73/lb. in Q4/05 vs. $6.61/lb. in Q3/05. Average price for 2005 was $6.68/lb. vs. $6.28/lb. in 2004 |
|
|
• | LME stocks increased 23,000 MT in Q4/05 to 36,000 MT. LME stocks began year at 21,000 MT |
|
|
• | LME & producer stocks equaled 5.5 weeks of demand at end of 2005 |
|
|
• | Cyclical stainless steel production cutbacks in H2/05 should be complete; production forecast to rebound in H1/06 |
|
|
• | High nickel alloy, plating and battery end-use demand growth remained strong in 2005 |
|
|
• | Chinese nickel consumption growth has averaged 26% p.a. |
| since 2000 |
LME Nickel Price
[CHART]
Source: LME
[LOGO]
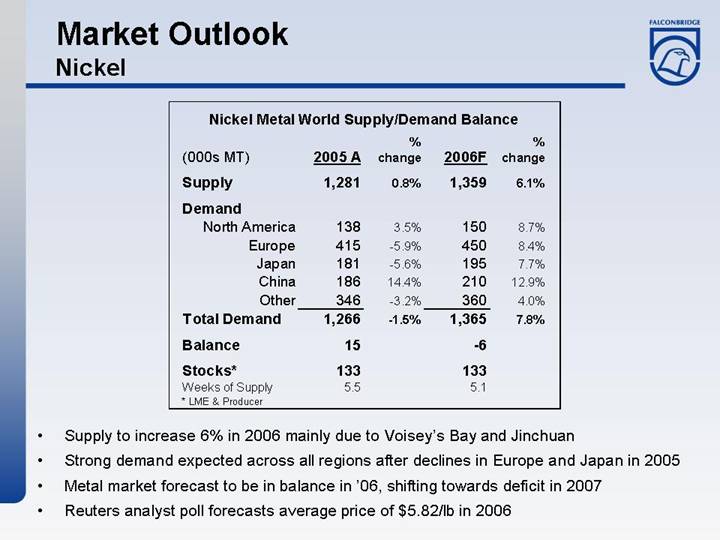
Market Outlook
Nickel
Nickel Metal World Supply/Demand Balance
|
|
|
| % |
|
|
| % |
|
(000s MT) |
| 2005 A |
| change |
| 2006F |
| change |
|
|
|
|
|
|
|
|
|
|
|
Supply |
| 1,281 |
| 0.8 | % | 1,359 |
| 6.1 | % |
|
|
|
|
|
|
|
|
|
|
Demand |
|
|
|
|
|
|
|
|
|
North America |
| 138 |
| 3.5 | % | 150 |
| 8.7 | % |
Europe |
| 415 |
| -5.9 | % | 450 |
| 8.4 | % |
Japan |
| 181 |
| -5.6 | % | 195 |
| 7.7 | % |
China |
| 186 |
| 14.4 | % | 210 |
| 12.9 | % |
Other |
| 346 |
| -3.2 | % | 360 |
| 4.0 | % |
Total Demand |
| 1,266 |
| -1.5 | % | 1,365 |
| 7.8 | % |
Balance |
| 15 |
|
|
| -6 |
|
|
|
Stocks* |
| 133 |
|
|
| 133 |
|
|
|
Weeks of Supply |
| 5.5 |
|
|
| 5.1 |
|
|
|
* LME & Producer |
|
|
|
|
|
|
|
|
|
• Supply to increase 6% in 2006 mainly due to Voisey’s Bay and Jinchuan
• Strong demand expected across all regions after declines in Europe and Japan in 2005
• Metal market forecast to be in balance in ‘06, shifting towards deficit in 2007
• Reuters analyst poll forecasts average price of $5.82/lb in 2006
[LOGO]
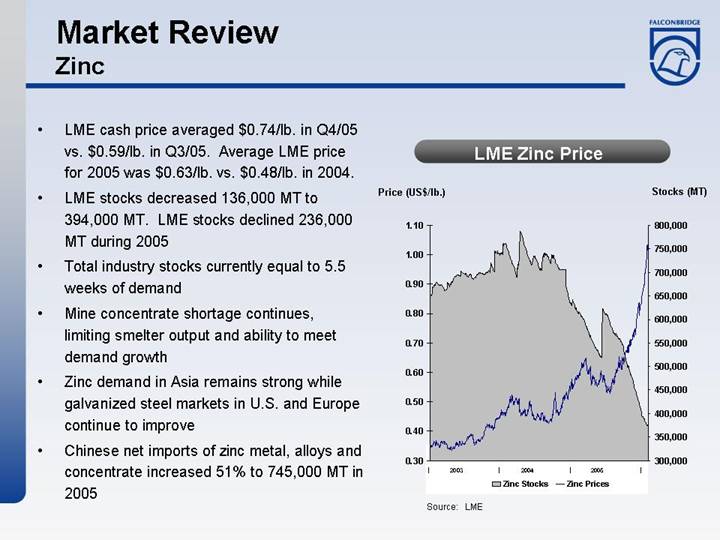
Market Review
Zinc
• | LME cash price averaged $0.74/lb. in Q4/05 vs. $0.59/lb. in Q3/05. Average LME price for 2005 was $0.63/lb. vs. $0.48/lb. in 2004. |
|
|
• | LME stocks decreased 136,000 MT to 394,000 MT. LME stocks declined 236,000 MT during 2005 |
|
|
• | Total industry stocks currently equal to 5.5 weeks of demand |
|
|
• | Mine concentrate shortage continues, limiting smelter output and ability to meet demand growth |
|
|
• | Zinc demand in Asia remains strong while galvanized steel markets in U.S. and Europe continue to improve |
|
|
• | Chinese net imports of zinc metal, alloys and concentrate |
| increased 51% to 745,000 MT in 2005 |
LME Zinc Price
[CHART]
Source: LME
[LOGO]
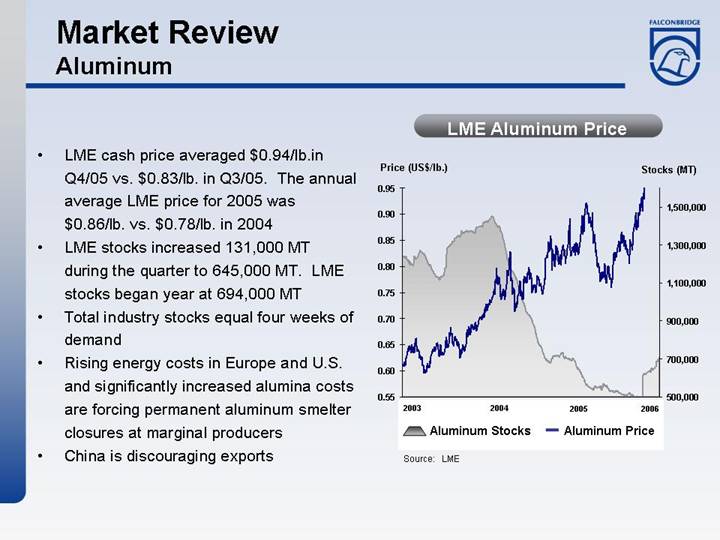
Market Review
Aluminum
• | LME cash price averaged $0.94/lb.in Q4/05 vs. $0.83/lb. in Q3/05. The annual average LME price for 2005 was $0.86/lb. vs. $0.78/lb. in 2004 |
|
|
• | LME stocks increased 131,000 MT during the quarter to 645,000 MT. LME stocks began year at 694,000 MT |
|
|
• | Total industry stocks equal four weeks of demand |
|
|
• | Rising energy costs in Europe and U.S. and significantly increased alumina costs are forcing permanent aluminum smelter closures at marginal producers |
|
|
• | China is discouraging exports |
LME Aluminum Price
[CHART]
Source: LME
[LOGO]
Market Summary
• Overall demand for metals well supported
• Inventories are low
• New supply slow to materialize
• Positive fundamentals encouraged investment fund participation
• Capital invested to increase
• Positive metal prices environment looks sustainable
[LOGO]
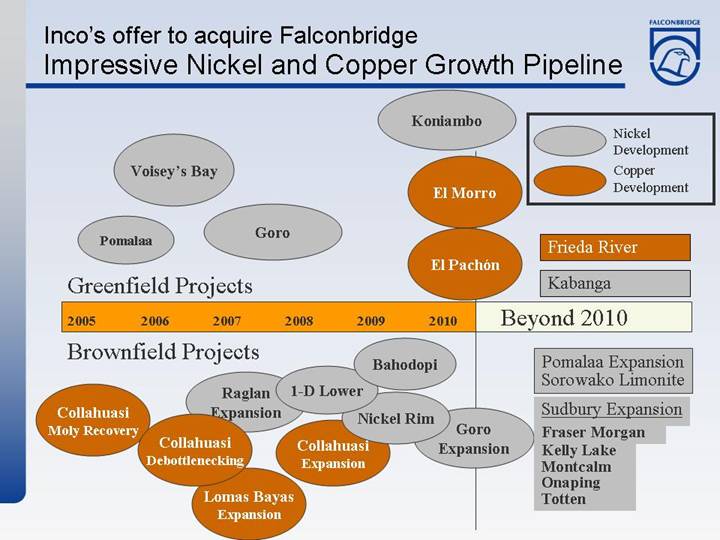
Inco’s Offer to Acquire Falconbridge
Acquisition Highlights
• Global leader in nickel and leading copper company
• Outstanding nickel and copper growth prospects
• Strong cash flow and financial strength to grow
• US$350 million in annual synergies identified
• Significantly accretive
• Reduced risk profile
• Enhanced share liquidity
• Potential re-rating in capital markets
[LOGO]
World Leader in Nickel, Strong Position in Copper
[GRAPHIC]
• Leading nickel position
• Excellent copper position
• World-class operations
• Enviable reserves and growth prospects
• Great, global marketing position
[LOGO]
Update on Regulatory Process
• Received Canadian Competition Bureau clearance in late January
• Continue to work with U.S. Department of Justice (DOJ) and European Commission (EC)
• DOJ still evaluating whether they have any significant competitive concerns
• Also still evaluating a potential remedy, if required, to address concerns
• Expect to hear back from DOJ on these areas by late April 2006
• On February 24, 2006, EC indicated it would move into their second phase review, representing an in-depth review of up to 90 business days
• Also evaluating whether they have any significant competitive concerns
[LOGO]
Super Alloys & Nickel Plating
• Nickel going into super alloys for critical rotating parts such as turbine blades for jet engines
• We’ve been large suppliers given how we’ve sought to service these users
• Amount of nickel used is less than 1% of total primary nickel demand
• A number of companies produce nickel for these uses
• Other companies could qualify to provide their nickel for these alloys
• Amount of nickel suitable for these applications is many times what is actually needed to meet demand
• Nickel for plating
• A lot of competition in supplying this use
• Market dynamics expected to address any supply issues for these two applications, or we can reach a mutually acceptable remedy to gain clearance, if required
[LOGO]
US$350 Million of Annual Synergies Identified
• Synergies at operating and corporate levels
• Significant contribution would begin in 2006
• US$350 million run rate by mid-2008 (based on June 30, 2006 transaction)
• Synergies unique to our two companies
• Estimated NPV of synergies > US$2.5 billion after tax, or Cdn$8 per new Inco share using a 7% discount rate
• Best use of Sudbury processing facilities ![]() increased nickel, copper, cobalt and PGM production
increased nickel, copper, cobalt and PGM production
• Accelerated mine development in Sudbury ![]() more jobs and investment in medium and longer term; some necessary short-term rationalization
more jobs and investment in medium and longer term; some necessary short-term rationalization
• Integration and planning well advanced with dedicated integration teams
[LOGO]
Synergy Opportunity: Maximizing throughput – matching assets to processes and feeds
[GRAPHIC]
• Economics of Falconbridge’s Fraser Morgan Mine significantly improved due to proximity to and ability to share infrastructure with Inco’s Coleman/McCreedy East Mine
• Coleman/McCreedy East could avoid $15 million of capital by using Falconbridge’s ventilation system
[LOGO]
Feed flow optimization
[GRAPHIC]
• | Reconfigure Clarabelle mill processing circuit to produce copper concentrate to feed Falconbridge’s Kidd Creek smelter |
|
|
Benefits to new Inco: | |
| |
• | Increases nickel smelting capacity and nickel production while avoiding capital expenditures that would otherwise be required |
|
|
• | Reduces working capital |
|
|
• | Reduces freight charges |
[LOGO]
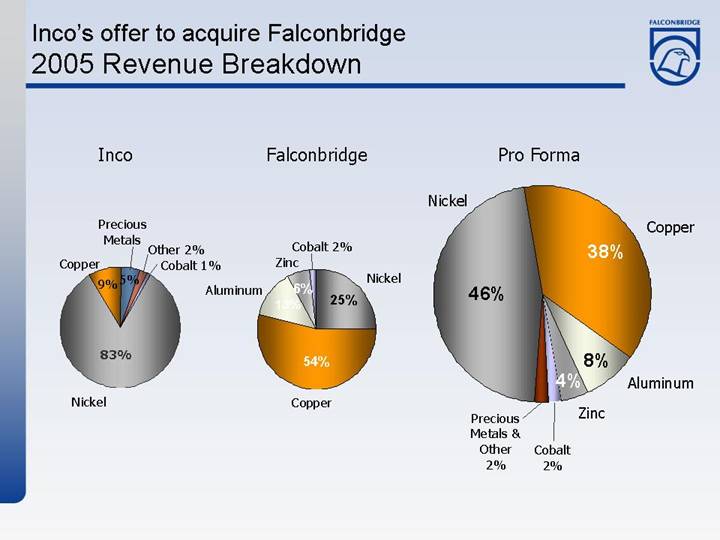
Inco’s offer to acquire Falconbridge
2005 Revenue Breakdown
Inco |
| Falconbridge |
| Pro Forma |
|
|
|
|
|
[CHART] |
| [CHART] |
| [CHART] |
[LOGO]
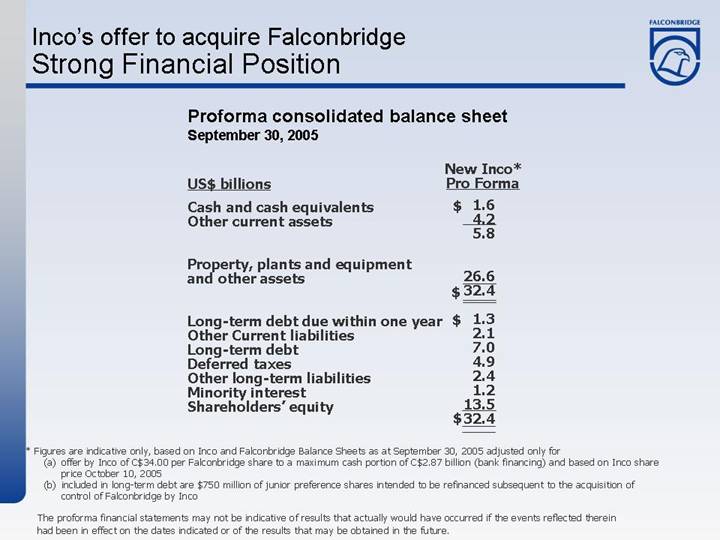
Strong Financial Position
Proforma consolidated balance sheet |
|
|
|
September 30, 2005 |
|
|
|
|
| New Inco* |
| |
US$ billions |
| Pro Forma |
| |
|
|
|
|
|
Cash and cash equivalents |
| $ | 1.6 |
|
Other current assets |
| 4.2 |
| |
|
| 5.8 |
| |
|
|
|
| |
Property, plants and equipment and other assets |
| 26.6 |
| |
|
| $ | 32.4 |
|
|
|
|
| |
Long-term debt due within one year |
| $ | 1.3 |
|
Other Current liabilities |
| 2.1 |
| |
Long-term debt |
| 7.0 |
| |
Deferred taxes |
| 4.9 |
| |
Other long-term liabilities |
| 2.4 |
| |
Minority interest |
| 1.2 |
| |
Shareholders’ equity |
| 13.5 |
| |
|
| $ | 32.4 |
|
* Figures are indicative only, based on Inco and Falconbridge Balance Sheets as at September 30, 2005 adjusted only for
(a) offer by Inco of C$34.00 per Falconbridge share to a maximum cash portion of C$2.87 billion (bank financing) and based on Inco share price October 10, 2005
(b) included in long-term debt are $750 million of junior preference shares intended to be refinanced subsequent to the acquisition of control of Falconbridge by Inco
The proforma financial statements may not be indicative of results that actually would have occurred if the events reflected therein had been in effect on the dates indicated or of the results that may be obtained in the future.
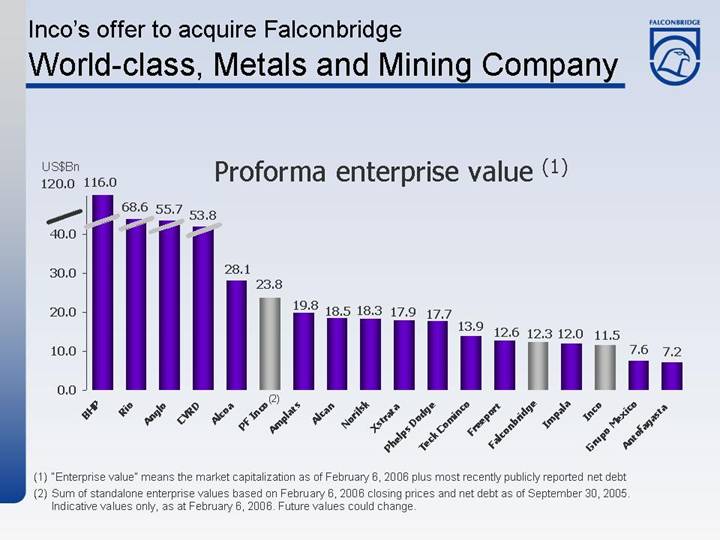
[LOGO]
World-class, Metals and Mining Company
Proforma enterprise value (1)
[CHART]
(1) “Enterprise value” means the market capitalization as of February 6, 2006 plus most recently publicly reported net debt
(2) Sum of standalone enterprise values based on February 6, 2006 closing prices and net debt as of September 30, 2005.
Indicative values only, as at February 6, 2006. Future values could change.
[LOGO]
Proforma 2005 EBITDA(1)
[CHART]
New Inco will be among top metals and mining companies on
North American stock markets
(1) Earnings before interest, taxes, depreciation and amortization based on I/B/E/S consensus median estimates and 2005 actual results where available
[LOGO]
Falconbridge Today
In an Excellent Position
• Falconbridge remains in an excellent position to add value for shareholders
• Strong industry fundamentals, particularly for copper and nickel
• Solid operating base with upside potential
• Impressive greenfield and brownfield growth projects
• Solid financial performance