Filed by Falconbridge Limited
Pursuant to Rule 425 under the Securities Act of 1933
Subject Company: Falconbridge Limited
Commission File No. 333-129218
Link to searchable text of slide shown above


Searchable text section of graphics shown above
[GRAPHIC]
Falconbridge Limited Corporate Profile
Merrill Lynch Global Metals, Mining & Steel Conference in Miami, Florida
May 9, 2006
[LOGO]
| [LOGO] |
Certain statements to be made in this presentation are forward-looking statements (as defined in applicable securities legislation). Examples of such statements include, but are not limited to, statements concerning (i) our assessment of the outlook for metal markets in 2006, (ii) Inco’s offer to acquire all of the common shares of Falconbridge Limited and the benefits of such combination, (iii) our future financial requirements and funding of those requirements, (iv) our expectations with respect to our development projects and (v) our production forecast for 2006. Inherent in forward-looking statements are risks and uncertainties well beyond our ability to predict or control. Actual results and developments are likely to differ, and may differ materially, from those expressed or implied by the forward-looking statements contained in this presentation. Such statements are based on a number of assumptions which may prove to be incorrect, including, but not limited to, assumptions about the timing, steps to be taken and completion of Inco’s offer to acquire all of our common shares, the ability to successfully compete against global metals and mining and exploration companies by creating through such a combination an enterprise of increased scale; strong demand for nickel, copper and other metals in emerging markets such as China; approximately $350 million per annum in pre-tax operating and other synergies and cost savings, and other benefits being realized based on the achievement of operational efficiencies from restructuring, integration and other initiatives relating to the combination of Falconbridge and Inco; the approvals or clearances required to be obtained by Inco and Falconbridge from regulatory and other agencies and bodies being obtained in a timely manner; divestitures required by regulatory agencies being acceptable and completed in a timely manner; there being limited costs, difficulties or delays related to the integration of the Falconbridge’s operations with those of Inco; the timely completion of the steps required to be taken for the eventual combination of the two companies; business and economic conditions generally; exchange rates, energy and other anticipated and unanticipated costs and pension contributions and expenses; the supply and demand for, deliveries of, and the level and volatility of prices of, nickel, copper, aluminum, zinc and other primary metals products and other metal products Inco and Falconbridge produce; the timing of the receipt of remaining regulatory and governmental approvals for the development projects and other operations; the continued availability of financing on appropriate terms for development projects; Falconbridge’s costs of production and production and productivity levels, as well as those of its competitors; market competition; mining, processing, exploration and research and development activities; the accuracy of ore/mineral reserve estimates; premiums realized over LME cash and other benchmark prices; tax benefits/charges; the resolution of environmental and other proceedings and the impact on the combined company of various environmental regulations and initiatives; assumptions concerning political and economic stability in countries or locations in which Falconbridge operates or otherwise and the ability to continue to pay quarterly cash dividends in such amounts as Falconbridge’s Board of Directors may determine in light of other uses for such funds and other factors.
Inherent in those statements are known and unknown risks, uncertainties and other factors well beyond the Company’s ability to control or predict. Some of these known risks and uncertainties are outlined in filings by Falconbridge with applicable securities regulatory authorities, including in Falconbridge’s annual information form. Readers are encouraged to consult such filings. While Falconbridge anticipates that subsequent events and developments may cause Falconbridge’s views to change, the Company specifically disclaims any obligation to update these forward-looking statements. These forward-looking statements should not be relied upon as representing the Company’s views as of any date subsequent to the date of this presentation. Although the Company has attempted to identify important factors that could cause actual actions, events or results to differ materially from those described in forward-looking statements, there may be other factors that cause actions, events or results not to be as anticipated, estimated or intended. There can be no assurance that forward-looking statements will prove to be accurate, as actual results and future events could differ materially from those anticipated in such statements. Accordingly, readers should not place undue reliance on forward-looking statements. These factors are not intended to represent a complete list of the factors that could affect Falconbridge and the combination of Inco and Falconbridge.
Agenda
1 Company Overview
2 Financial Position
3 Review of Operations & Growth Opportunities
4 Market Review and Outlook
5 Inco – Falconbridge Transaction
6 Summary
(ALL AMOUNTS ARE IN U.S. DOLLARS)
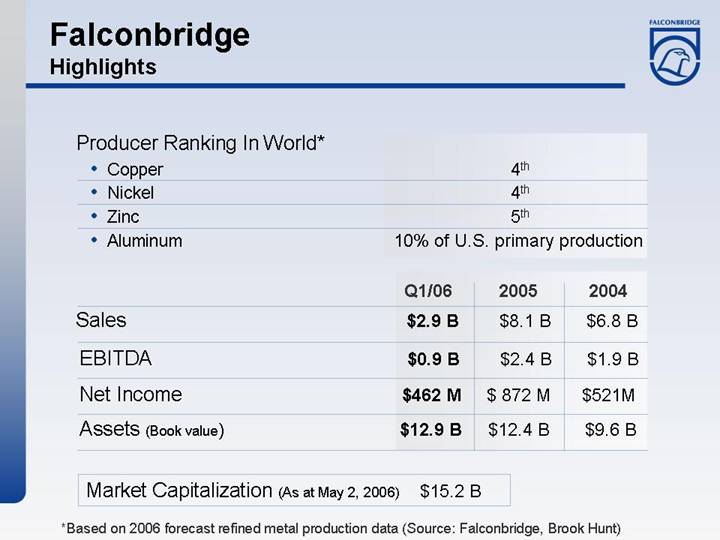
Falconbridge
Highlights
Producer Ranking In World*
• | Copper | 4th |
• | Nickel | 4th |
• | Zinc | 5th |
• | Aluminum | 10% of U.S. primary production |
|
| Q1/06 |
| 2005 |
| 2004 |
| |||
Sales |
| $ | 2.9 | B | $ | 8.1 | B | $ | 6.8 | B |
EBITDA |
| $ | 0.9 | B | $ | 2.4 | B | $ | 1.9 | B |
Net Income |
| $ | 462 | M | $ | 872 | M | $ | 521 | M |
Assets (Book value) |
| $ | 12.9 | B | $ | 12.4 | B | $ | 9.6 | B |
|
|
|
|
|
|
|
|
|
|
|
Market Capitalization (As at May 2, 2006) |
| $ | 15.2 | B |
|
|
|
|
|
|
*Based on 2006 forecast refined metal production data (Source: Falconbridge, Brook Hunt)
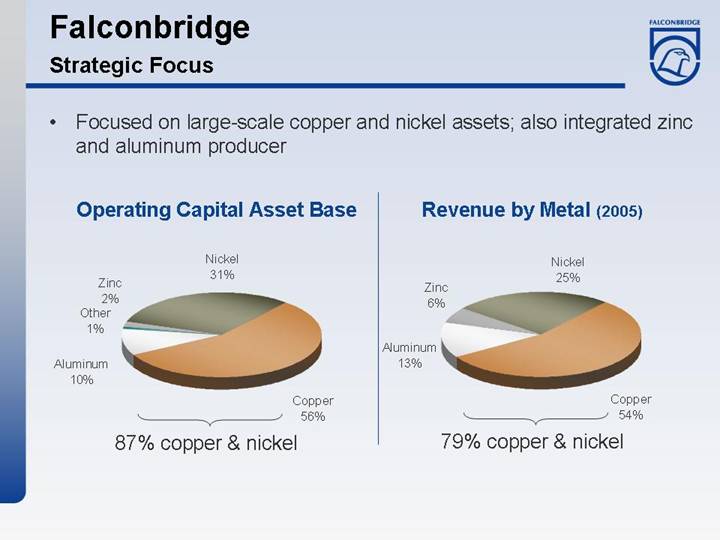
Falconbridge
Strategic Focus
• Focused on large-scale copper and nickel assets; also integrated zinc and aluminum producer
Operating Capital Asset Base
[CHART]
Revenue by Metal (2005)
[CHART]
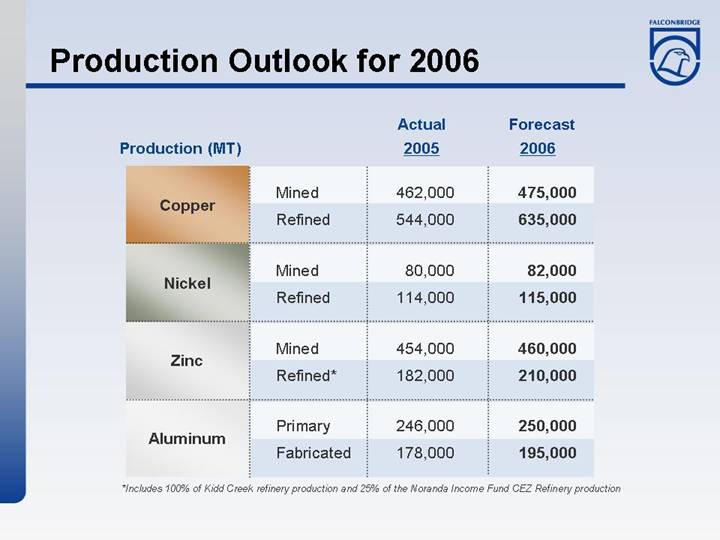
Production Outlook for 2006
|
|
|
| Actual |
| Forecast |
|
Production (MT) |
|
|
| 2005 |
| 2006 |
|
|
|
|
|
|
|
|
|
Copper |
| Mined |
| 462,000 |
| 475,000 |
|
|
| Refined |
| 544,000 |
| 635,000 |
|
|
|
|
|
|
|
|
|
Nickel |
| Mined |
| 80,000 |
| 82,000 |
|
|
| Refined |
| 114,000 |
| 115,000 |
|
|
|
|
|
|
|
|
|
Zinc |
| Mined |
| 454,000 |
| 460,000 |
|
|
| Refined* |
| 182,000 |
| 210,000 |
|
|
|
|
|
|
|
|
|
Aluminum |
| Primary |
| 246,000 |
| 250,000 |
|
|
| Fabricated |
| 178,000 |
| 195,000 |
|
*Includes 100% of Kidd Creek refinery production and 25% of the Noranda Income Fund CEZ Refinery production
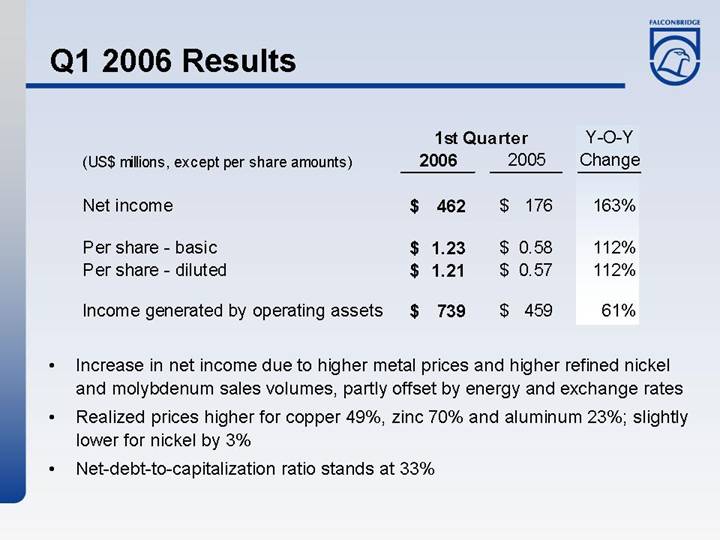
Q1 2006 Results
|
| 1st Quarter |
| Y-O-Y |
| ||||
(US$ millions, except per share amounts) |
| 2006 |
| 2005 |
| Change |
| ||
|
|
|
|
|
|
|
| ||
Net income |
| $ | 462 |
| $ | 176 |
| 163 | % |
|
|
|
|
|
|
|
| ||
Per share - basic |
| $ | 1.23 |
| $ | 0.58 |
| 112 | % |
Per share - diluted |
| $ | 1.21 |
| $ | 0.57 |
| 112 | % |
|
|
|
|
|
|
|
| ||
Income generated by operating assets |
| $ | 739 |
| $ | 459 |
| 61 | % |
• Increase in net income due to higher metal prices and higher refined nickel and molybdenum sales volumes, partly offset by energy and exchange rates
• Realized prices higher for copper 49%, zinc 70% and aluminum 23%; slightly lower for nickel by 3%
• Net-debt-to-capitalization ratio stands at 33%
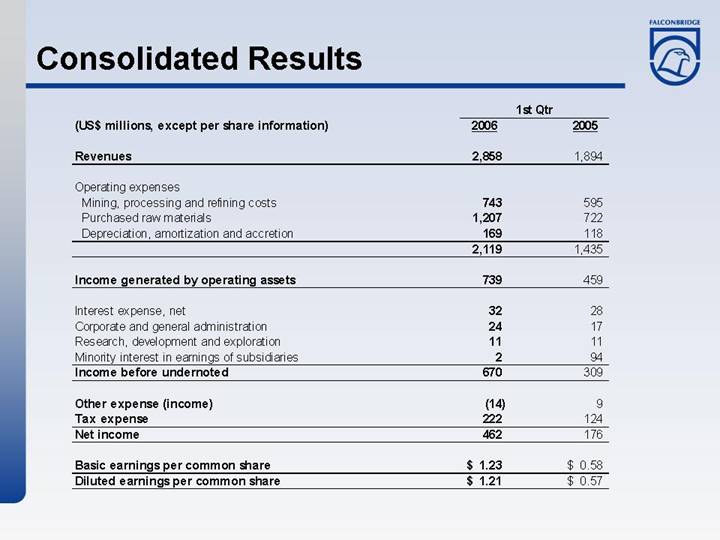
Consolidated Results
|
| 1st Qtr |
| ||||
(US$ millions, except per share information) |
| 2006 |
| 2005 |
| ||
|
|
|
|
|
| ||
Revenues |
| 2,858 |
| 1,894 |
| ||
|
|
|
|
|
| ||
Operating expenses |
|
|
|
|
| ||
Mining, processing and refining costs |
| 743 |
| 595 |
| ||
Purchased raw materials |
| 1,207 |
| 722 |
| ||
Depreciation, amortization and accretion |
| 169 |
| 118 |
| ||
|
| 2,119 |
| 1,435 |
| ||
|
|
|
|
|
| ||
Income generated by operating assets |
| 739 |
| 459 |
| ||
|
|
|
|
|
| ||
Interest expense, net |
| 32 |
| 28 |
| ||
Corporate and general administration |
| 24 |
| 17 |
| ||
Research, development and exploration |
| 11 |
| 11 |
| ||
Minority interest in earnings of subsidiaries |
| 2 |
| 94 |
| ||
Income before undernoted |
| 670 |
| 309 |
| ||
|
|
|
|
|
| ||
Other expense (income) |
| (14 | ) | 9 |
| ||
Tax expense |
| 222 |
| 124 |
| ||
Net income |
| 462 |
| 176 |
| ||
|
|
|
|
|
| ||
Basic earnings per common share |
| $ | 1.23 |
| $ | 0.58 |
|
Diluted earnings per common share |
| $ | 1.21 |
| $ | 0.57 |
|
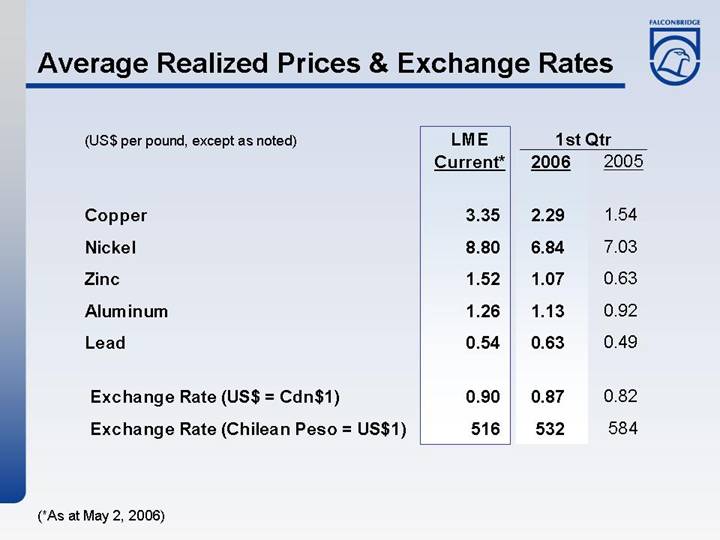
Average Realized Prices & Exchange Rates
|
| LME |
| 1st Qtr |
| ||
(US$ per pound, except as noted) |
| Current* |
| 2006 |
| 2005 |
|
|
|
|
|
|
|
|
|
Copper |
| 3.35 |
| 2.29 |
| 1.54 |
|
Nickel |
| 8.80 |
| 6.84 |
| 7.03 |
|
Zinc |
| 1.52 |
| 1.07 |
| 0.63 |
|
Aluminum |
| 1.26 |
| 1.13 |
| 0.92 |
|
Lead |
| 0.54 |
| 0.63 |
| 0.49 |
|
|
|
|
|
|
|
|
|
Exchange Rate (US$ = Cdn$1) |
| 0.90 |
| 0.87 |
| 0.82 |
|
|
|
|
|
|
|
|
|
Exchange Rate (Chilean Peso = US$1) |
| 516 |
| 532 |
| 584 |
|
(*As at May 2, 2006)
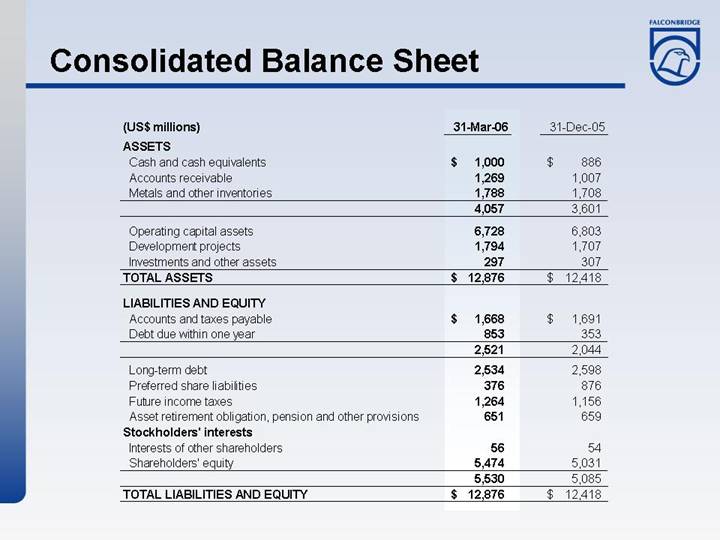
Consolidated Balance Sheet
(US$ millions) |
| 31-Mar-06 |
| 31-Dec-05 |
| ||
ASSETS |
|
|
|
|
| ||
Cash and cash equivalents |
| $ | 1,000 |
| $ | 886 |
|
Accounts receivable |
| 1,269 |
| 1,007 |
| ||
Metals and other inventories |
| 1,788 |
| 1,708 |
| ||
|
| 4,057 |
| 3,601 |
| ||
|
|
|
|
|
| ||
Operating capital assets |
| 6,728 |
| 6,803 |
| ||
Development projects |
| 1,794 |
| 1,707 |
| ||
Investments and other assets |
| 297 |
| 307 |
| ||
TOTAL ASSETS |
| $ | 12,876 |
| $ | 12,418 |
|
|
|
|
|
|
| ||
LIABILITIES AND EQUITY |
|
|
|
|
| ||
Accounts and taxes payable |
| $ | 1,668 |
| $ | 1,691 |
|
Debt due within one year |
| 853 |
| 353 |
| ||
|
| 2,521 |
| 2,044 |
| ||
|
|
|
|
|
| ||
Long-term debt |
| 2,534 |
| 2,598 |
| ||
Preferred share liabilities |
| 376 |
| 876 |
| ||
Future income taxes |
| 1,264 |
| 1,156 |
| ||
Asset retirement obligation, pension and other provisions |
| 651 |
| 659 |
| ||
Stockholders’ interests |
|
|
|
|
| ||
Interests of other shareholders |
| 56 |
| 54 |
| ||
Shareholders’ equity |
| 5,474 |
| 5,031 |
| ||
|
| 5,530 |
| 5,085 |
| ||
TOTAL LIABILITIES AND EQUITY |
| $ | 12,876 |
| $ | 12,418 |
|
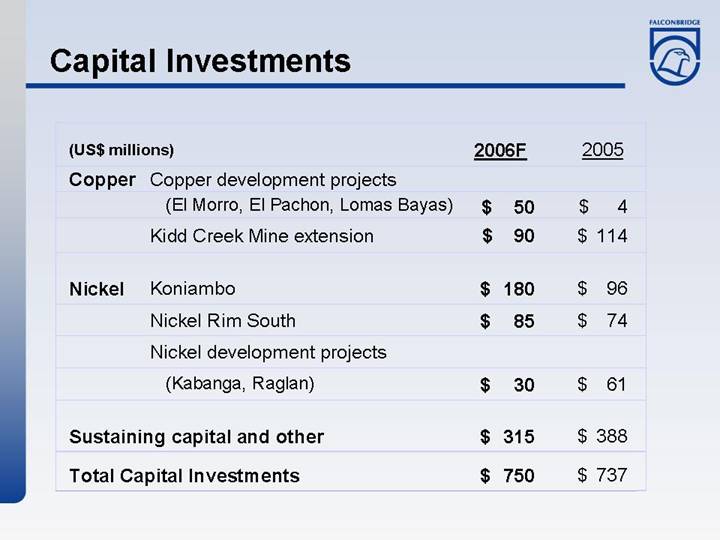
Capital Investments
(US$ millions) |
| 2006F |
| 2005 |
| |||
|
|
|
|
|
| |||
Copper | Copper development projects |
| $ | 50 |
| $ | 4 |
|
| Kidd Creek Mine extension |
| $ | 90 |
| $ | 114 |
|
|
|
|
|
|
|
| ||
Nickel | Koniambo |
| $ | 180 |
| $ | 96 |
|
| Nickel Rim South |
| $ | 85 |
| $ | 74 |
|
| Nickel development projects |
|
|
|
|
| ||
| (Kabanga, Raglan) |
| $ | 30 |
| $ | 61 |
|
|
|
|
|
|
| |||
Sustaining capital and other |
| $ | 315 |
| $ | 388 |
| |
|
|
|
|
|
| |||
Total Capital Investments |
| $ | 750 |
| $ | 737 |
| |
World-Class Assets
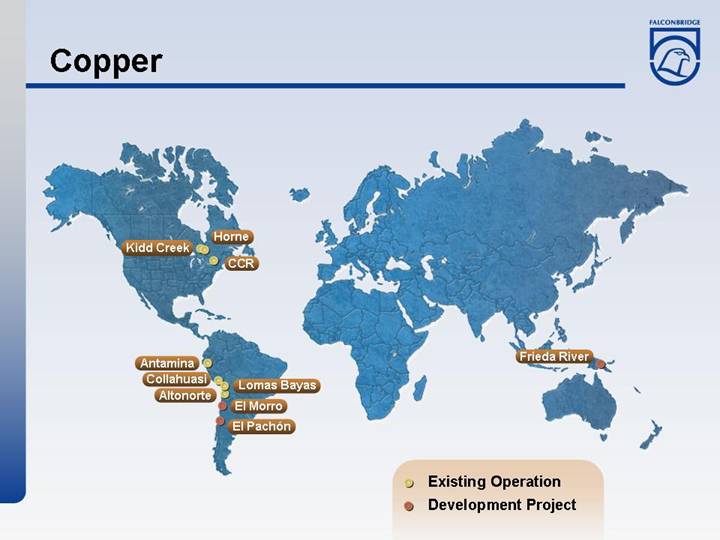
• World’s fourth largest producer of refined copper
• Long-life, low-cost mines located primarily in South America
• Technologically advanced processing facilities, (Altonorte smelter in northern Chile, Horne and Kidd Creek in Canada)
• Technology produces high margins from the treatment of complex feeds
• Integrated operations drive benefits
• Mitigate market volatility in treatment costs
• Create freight cost arbitrage
Falconbridge Total Mined Copper Output
[CHART]
Q1/06 net operating cash cost of $0.30/lb. versus $0.35/lb. in Q1/05
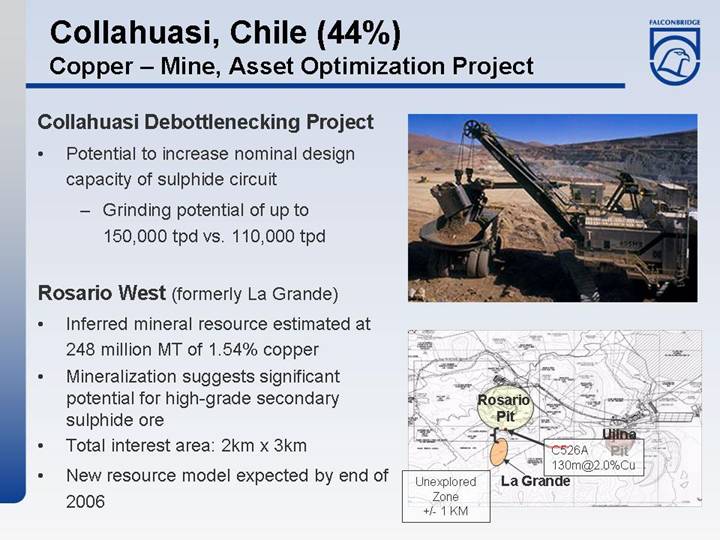
Collahuasi, Chile (44%)
Copper – Mine, Asset Optimization Project
Collahuasi Debottlenecking Project
• Potential to increase nominal design capacity of sulphide circuit
• Grinding potential of up to 150,000 tpd vs. 110,000 tpd
[GRAPHIC]
Rosario West (formerly La Grande)
• Inferred mineral resource estimated at 248 million MT of 1.54% copper
• Mineralization suggests significant potential for high-grade secondary sulphide ore
• Total interest area: 2km x 3km
• New resource model expected by end of 2006
[GRAPHIC]
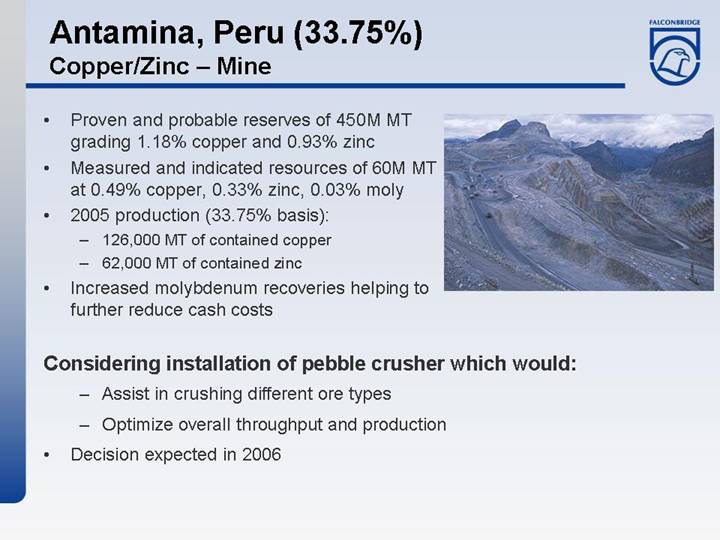
Antamina, Peru (33.75%)
Copper/Zinc – Mine
• Proven and probable reserves of 450M MT grading 1.18% copper and 0.93% zinc
• Measured and indicated resources of 60M MT at 0.49% copper, 0.33% zinc, 0.03% moly
• 2005 production (33.75% basis):
• 126,000 MT of contained copper
• 62,000 MT of contained zinc
• Increased molybdenum recoveries helping to further reduce cash costs
[GRAPHIC]
Considering installation of pebble crusher which would:
• Assist in crushing different ore types
• Optimize overall throughput and production
• Decision expected in 2006
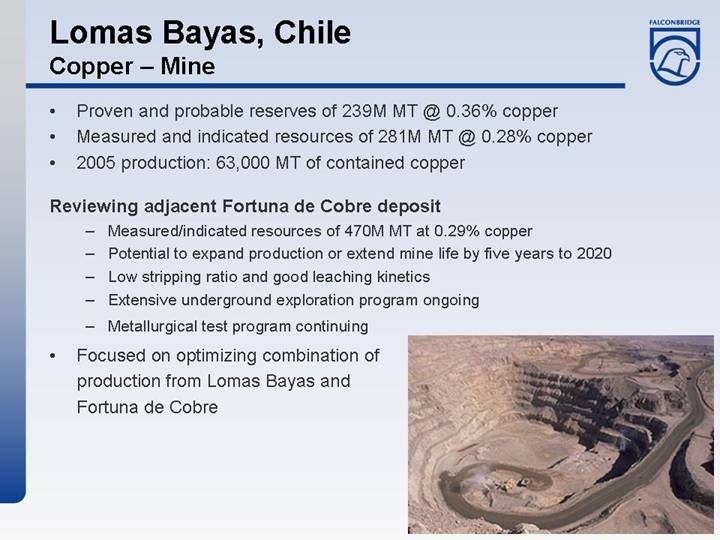
Lomas Bayas, Chile
Copper – Mine
• Proven and probable reserves of 239M MT @ 0.36% copper
• Measured and indicated resources of 281M MT @ 0.28% copper
• 2005 production: 63,000 MT of contained copper
Reviewing adjacent Fortuna de Cobre deposit
• Measured/indicated resources of 470M MT at 0.29% copper
• Potential to expand production or extend mine life by five years to 2020
• Low stripping ratio and good leaching kinetics
• Extensive underground exploration program ongoing
• Metallurgical test program continuing
• Focused on optimizing combination of production from Lomas Bayas and Fortuna de Cobre
[GRAPHIC]
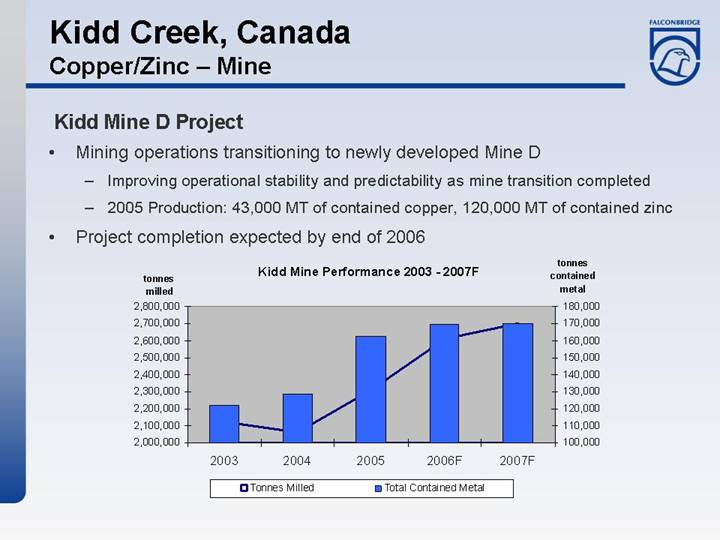
Kidd Creek, Canada
Copper/Zinc – Mine
Kidd Mine D Project
• Mining operations transitioning to newly developed Mine D
• Improving operational stability and predictability as mine transition completed
• 2005 Production: 43,000 MT of contained copper, 120,000 MT of contained zinc
• Project completion expected by end of 2006
Kidd Mine Performance 2003 - 2007F
[CHART]
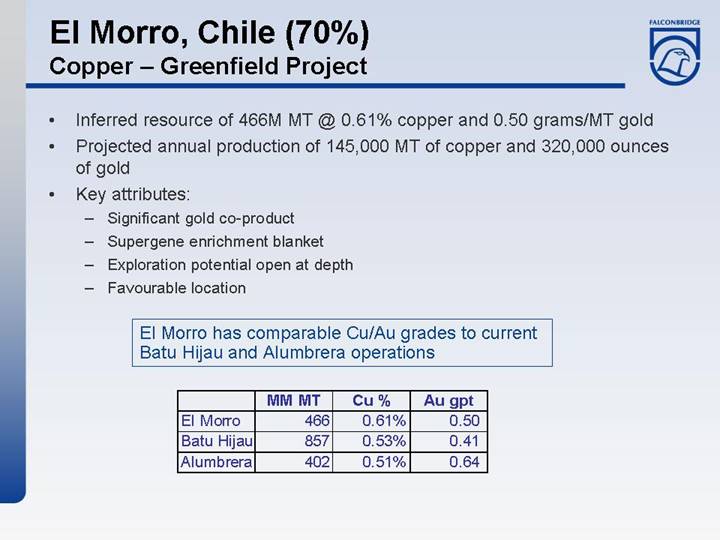
El Morro, Chile (70%)
Copper – Greenfield Project
• Inferred resource of 466M MT @ 0.61% copper and 0.50 grams/MT gold
• Projected annual production of 145,000 MT of copper and 320,000 ounces of gold
• Key attributes:
• Significant gold co-product
• Supergene enrichment blanket
• Exploration potential open at depth
• Favourable location
El Morro has comparable Cu/Au grades to current Batu Hijau and Alumbrera operations
|
| MM MT |
| Cu % |
| Au gpt |
|
El Morro |
| 466 |
| 0.61 | % | 0.50 |
|
Batu Hijau |
| 857 |
| 0.53 | % | 0.41 |
|
Alumbrera |
| 402 |
| 0.51 | % | 0.64 |
|
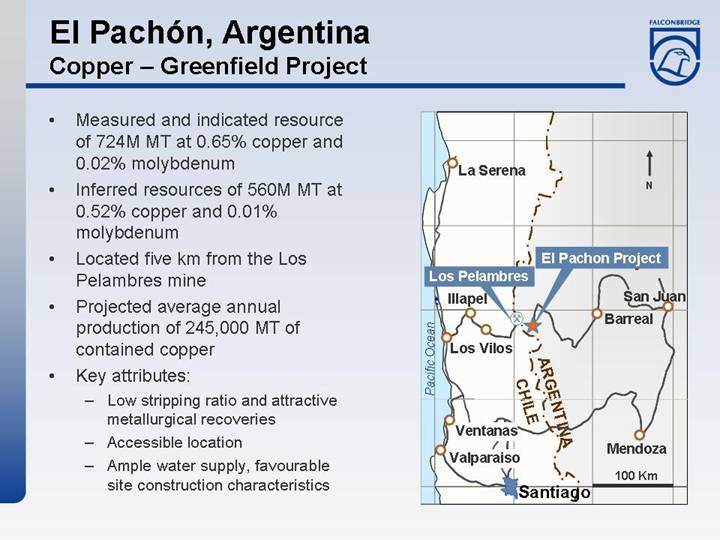
El Pachón, Argentina
Copper – Greenfield Project
• Measured and indicated resource of 724M MT at 0.65% copper and 0.02% molybdenum
• Inferred resources of 560M MT at 0.52% copper and 0.01% molybdenum
• Located five km from the Los Pelambres mine
• Projected average annual production of 245,000 MT of contained copper
• Key attributes:
• Low stripping ratio and attractive metallurgical recoveries
• Accessible location
• Ample water supply, favourable site construction characteristics
[GRAPHIC]
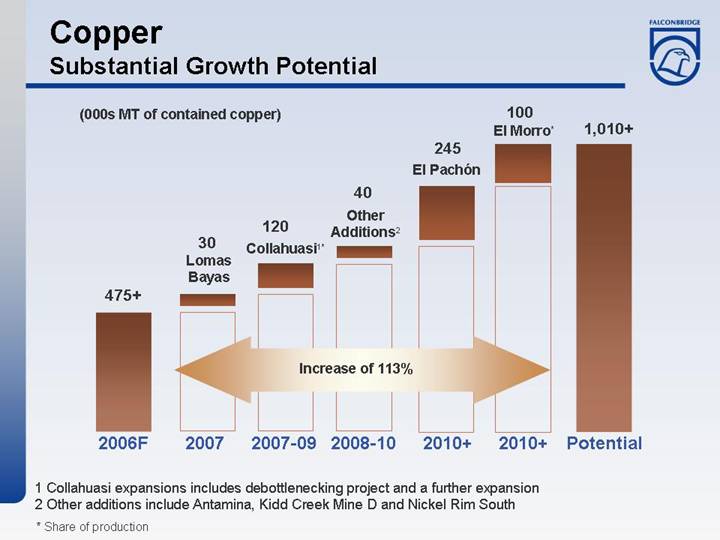
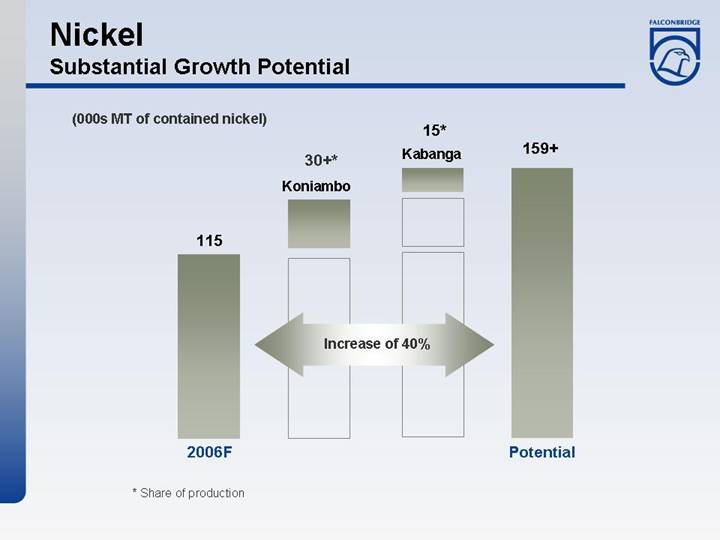
Copper
Substantial Growth Potential
(000s MT of contained copper)
[CHART]
(1) Collahuasi expansions includes debottlenecking project and a further expansion
(2) Other additions include Antamina, Kidd Creek Mine D and Nickel Rim South
* Share of production
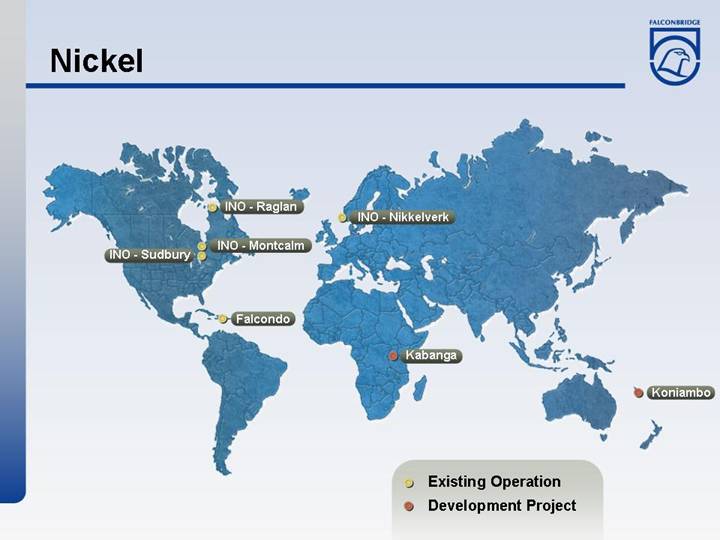
World-Class Assets
• World’s fourth-largest producer of refined nickel
• Fully integrated operations
• Produce nickel and ferronickel
• Low-cost facilities, including Nikkelverk, which ranks among the lowest-cost nickel/cobalt refineries
• One of the world’s largest recyclers and processors of nickel and cobalt bearing materials
• Q1/06 net operating cash cost for mined nickel (INO) of $2.60/lb. versus $2.51/lb. in Q1/05
Falconbridge Total Refined Nickel Output
[CHART]
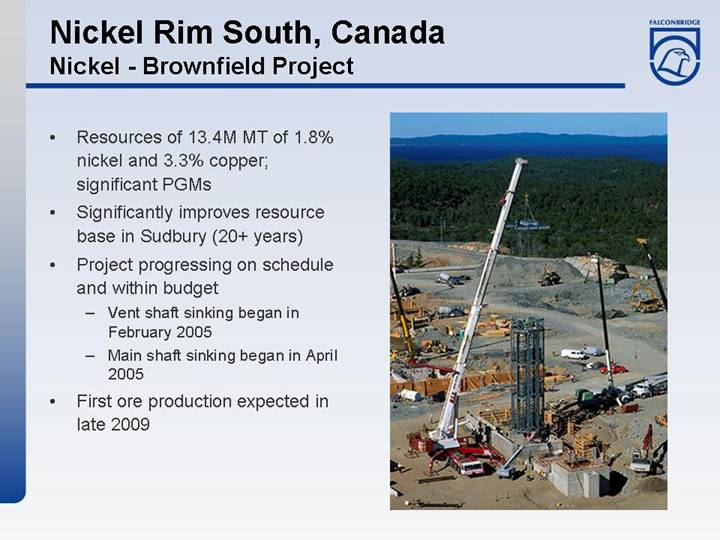
Nickel Rim South, Canada
Nickel - Brownfield Project
• Resources of 13.4M MT of 1.8% nickel and 3.3% copper; significant PGMs
• Significantly improves resource base in Sudbury (20+ years)
• Project progressing on schedule and within budget
• Vent shaft sinking began in February 2005
• Main shaft sinking began in April 2005
• First ore production expected in late 2009
[GRAPHIC]
Raglan, Canada
Nickel – Throughput Optimization Project
Phase One – conversion of mill from autogenous to semi-autogenous grinding
• Completed in October 2005; on schedule and on budget
• Increased level of annual throughput to approximately one million MT of ore per year and increase mill’s ability to process harder ore
Phase Two – maximizing throughput capacity
• Involves expanding site infrastructure and ore production to allow for mining, milling and processing of 1.3 million tonnes of ore annually; resulting in 30,500 MT of annual contained nickel production
• Expected to be complete in early in 2008
[GRAPHIC]
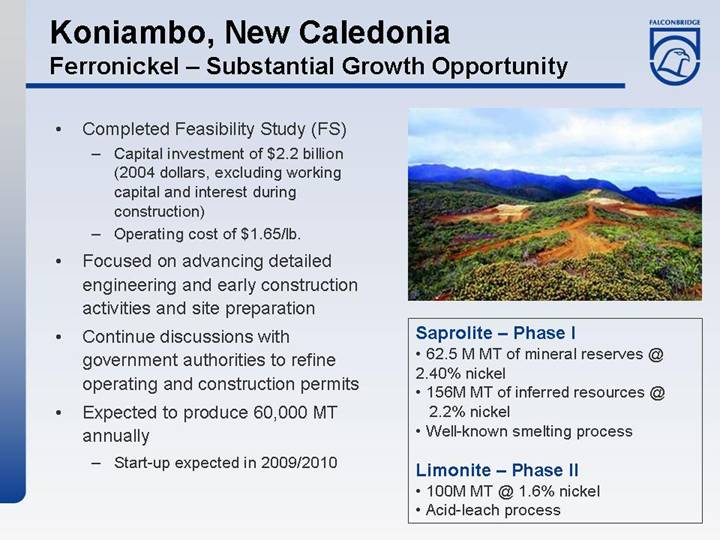
Koniambo, New Caledonia
Ferronickel – Substantial Growth Opportunity
• Completed Feasibility Study (FS)
• Capital investment of $2.2 billion (2004 dollars, excluding working capital and interest during construction)
• Operating cost of $1.65/lb.
• Focused on advancing detailed engineering and early construction activities and site preparation
• Continue discussions with government authorities to refine operating and construction permits
• Expected to produce 60,000 MT annually
• Start-up expected in 2009/2010
[GRAPHIC]
Saprolite – Phase I
• 62.5 M MT of mineral reserves @ 2.40% nickel
• 156M MT of inferred resources @ 2.2% nickel
• Well-known smelting process
Limonite – Phase II
• 100M MT @ 1.6% nickel
• Acid-leach process
Kabanga, Tanzania
Nickel – Greenfield Project
• Agreement for joint venture with Barrick Gold
• Located in northwestern Tanzania ~ 400 km west of Bulyanhulu mine; Barrick has successfully operated there before
• Initial inferred resources estimate of 26M MT grading 2.6% nickel with potential for further growth
• Potential nickel production of 30,000 to 35,000 MT per year
• Completing a work plan over the next three years at a cost of $50 million
• Current work includes infill diamond drilling, geophysical surveys and metallurgical testing and engineering study work
[GRAPHIC]
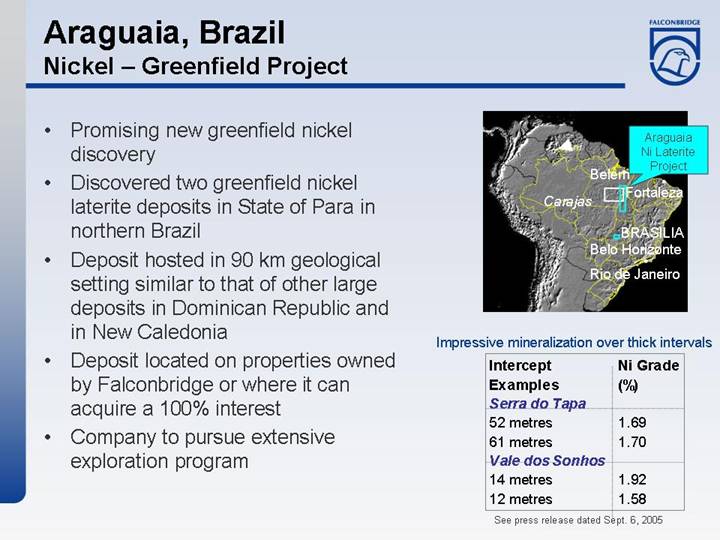
Araguaia, Brazil
Nickel – Greenfield Project
• Promising new greenfield nickel discovery
• Discovered two greenfield nickel laterite deposits in State of Para in northern Brazil
• Deposit hosted in 90 km geological setting similar to that of other large deposits in Dominican Republic and in New Caledonia
• Deposit located on properties owned by Falconbridge or where it can acquire a 100% interest
• Company to pursue extensive exploration program
[GRAPHIC]
Impressive mineralization over thick intervals
Intercept |
| Ni Grade |
|
Serra do Tapa |
|
|
|
52 metres |
| 1.69 |
|
61 metres |
| 1.70 |
|
Vale dos Sonhos |
|
|
|
14 metres |
| 1.92 |
|
12 metres |
| 1.58 |
|
See press release dated Sept. 6, 2005
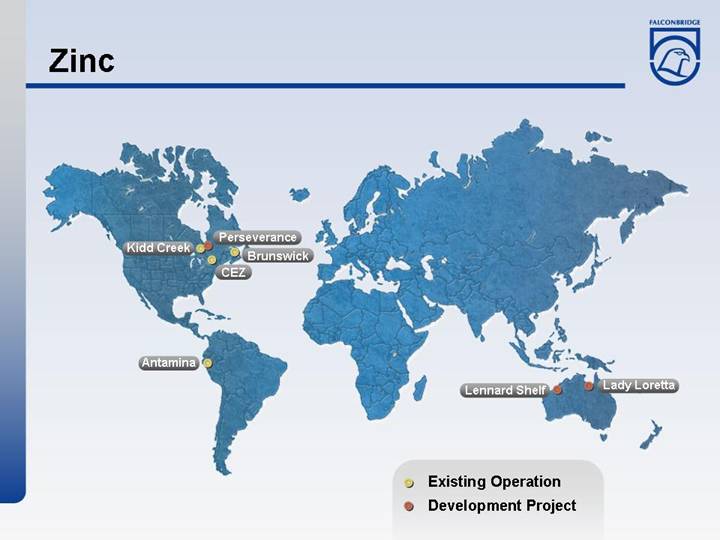
Integrated Operations
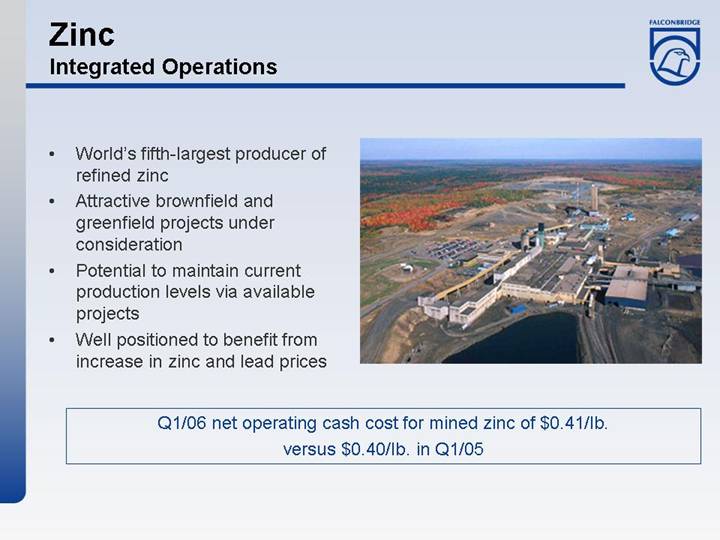
• World’s fifth-largest producer of refined zinc
• Attractive brownfield and greenfield projects under consideration
• Potential to maintain current production levels via available projects
• Well positioned to benefit from increase in zinc and lead prices
[GRAPHIC]
Q1/06 net operating cash cost for mined zinc of $0.41/lb. versus $0.40/lb. in Q1/05
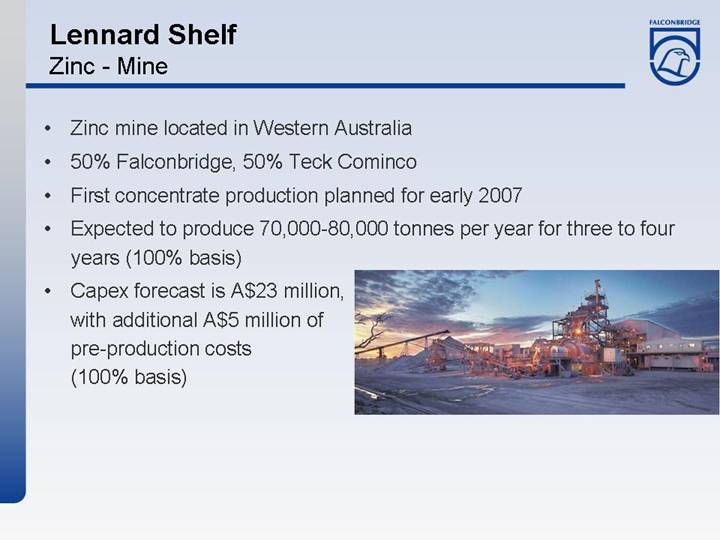
Lennard Shelf
Zinc - Mine
• Zinc mine located in Western Australia
• 50% Falconbridge, 50% Teck Cominco
• First concentrate production planned for early 2007
• Expected to produce 70,000-80,000 tonnes per year for three to four years (100% basis)
• Capex forecast is A$23 million, with additional A$5 million of pre-production costs (100% basis)
[GRAPHIC]
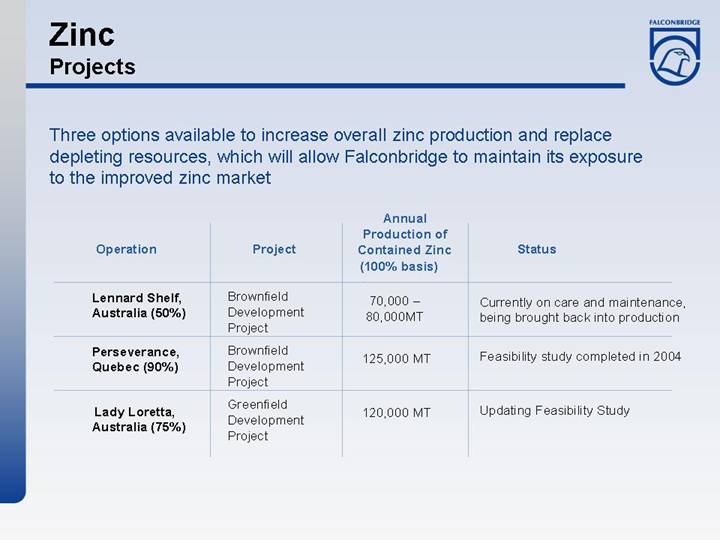
Zinc
Projects
Three options available to increase overall zinc production and replace depleting resources, which will allow Falconbridge to maintain its exposure to the improved zinc market
|
|
|
| Annual |
|
|
|
|
|
| Production of |
|
|
Operation |
| Project |
| Contained Zinc |
| Status |
|
|
|
|
|
|
|
Lennard Shelf, Australia (50%) |
| Brownfield Development Project |
| 70,000 – 80,000MT |
| Currently on care and maintenance, being brought back into production |
|
|
|
|
|
|
|
Perseverance, Quebec (90%) |
| Brownfield Development Project |
| 125,000 MT |
| Feasibility study completed in 2004 |
|
|
|
|
|
|
|
Lady Loretta, Australia (75%) |
| Greenfield Development Project |
| 120,000 MT |
| Updating Feasibility Study |
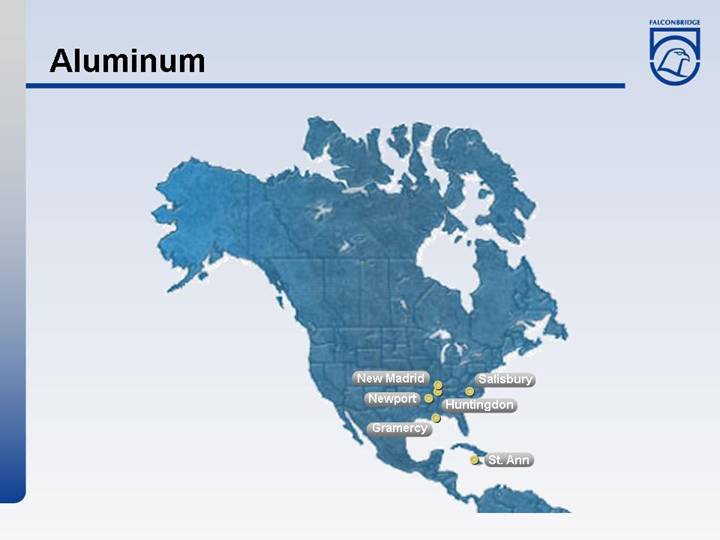
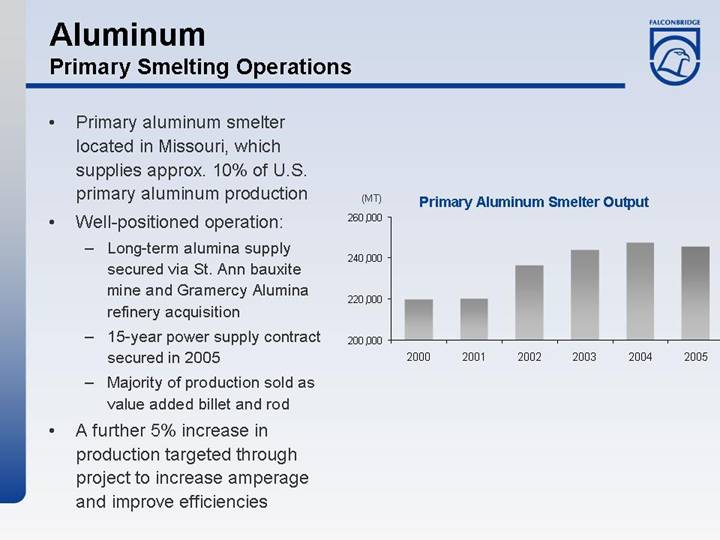
Primary Smelting Operations
• Primary aluminum smelter located in Missouri, which supplies approx. 10% of U.S. primary aluminum production
• Well-positioned operation:
• Long-term alumina supply secured via St. Ann bauxite mine and Gramercy Alumina refinery acquisition
• 15-year power supply contract secured in 2005
• Majority of production sold as value added billet and rod
• A further 5% increase in production targeted through project to increase amperage and improve efficiencies
Primary Aluminum Smelter Output
[CHART]
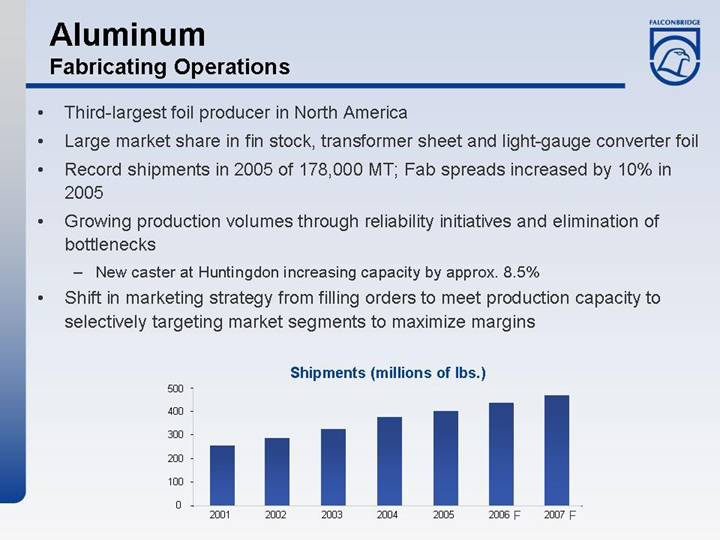
Fabricating Operations
• Third-largest foil producer in North America
• Large market share in fin stock, transformer sheet and light-gauge converter foil
• Record shipments in 2005 of 178,000 MT; Fab spreads increased by 10% in 2005
• Growing production volumes through reliability initiatives and elimination of bottlenecks
• New caster at Huntingdon increasing capacity by approx. 8.5%
• Shift in marketing strategy from filling orders to meet production capacity to selectively targeting market segments to maximize margins
Shipments (millions of lbs.)
[CHART]
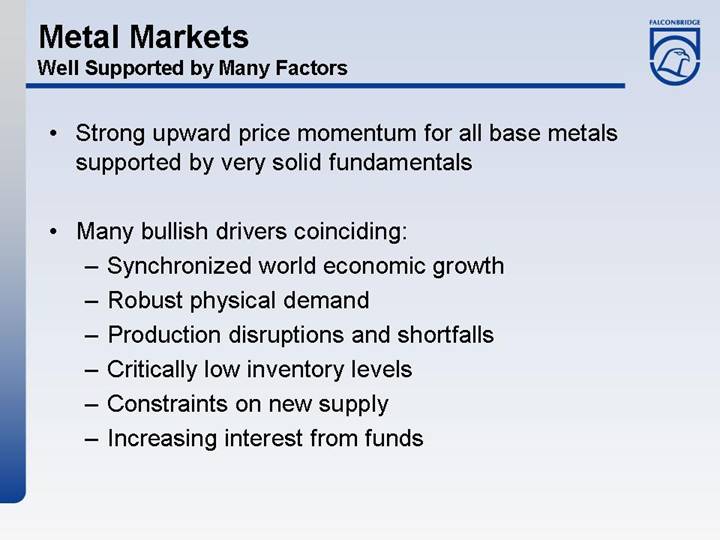
Metal Markets
Well Supported by Many Factors
• Strong upward price momentum for all base metals supported by very solid fundamentals
• Many bullish drivers coinciding:
• Synchronized world economic growth
• Robust physical demand
• Production disruptions and shortfalls
• Critically low inventory levels
• Constraints on new supply
• Increasing interest from funds
Constrained Supply
• Decade of industry underinvestment now evident
• Current production experiencing declining grades and higher energy costs
• Industry playing catch-up, but new supply constrained by:
• Rising costs
• Delays in approvals
• Competition for resources, supplies and services
• Very few significant large deposits being developed
• Current projects are smaller and higher cost
Positive Macroeconomic Environment
• IMF GDP Growth Estimates
• 2005: 4.8%
• 2006: 4.9%
• 2007: 4.7%
• Chinese GDP growth in Q1’06: 10.2%
• Industrial Production growth continues
• OECD March leading indicator rises for 10th consecutive month
• Base metals prices remain strongly correlated to Industrial Production
• Synchronized IP growth supportive of strong metals demand and prices
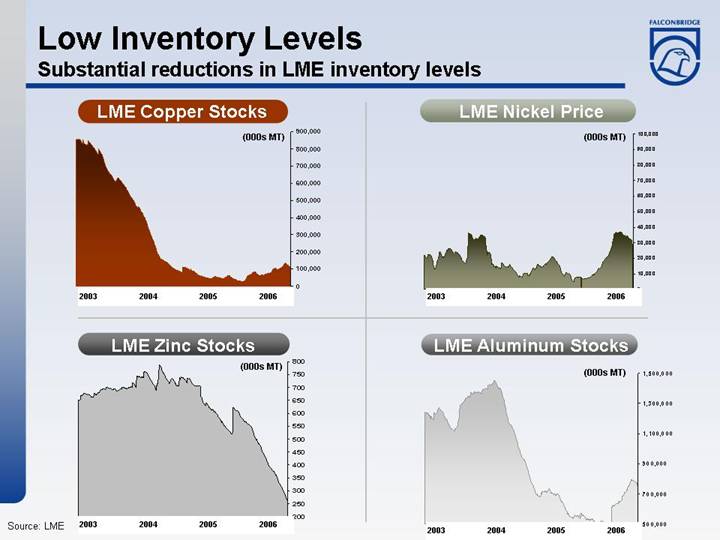
Low Inventory Levels
Substantial reductions in LME inventory levels
LME Copper Stocks
[CHART]
LME Zinc Stocks
[CHART]
LME Nickel Price
[CHART]
LME Aluminum Stocks
[CHART]
Metal Markets Summary
• Very positive industry outlook
• Solid fundamentals
• Continued role of investment funds?
• Prices to remain volatile in short term
• Longer-term price outlook supportive of ongoing strong profitability
Inco’s Offer to Acquire Falconbridge
Acquisition Highlights
• Global leader in nickel and leading copper company
• Outstanding nickel and copper growth prospects
• Strong cash flow and financial strength to grow
• US$350 million in annual synergies identified
• Significantly accretive
• Reduced risk profile
• Enhanced share liquidity
• Potential re-rating in capital markets
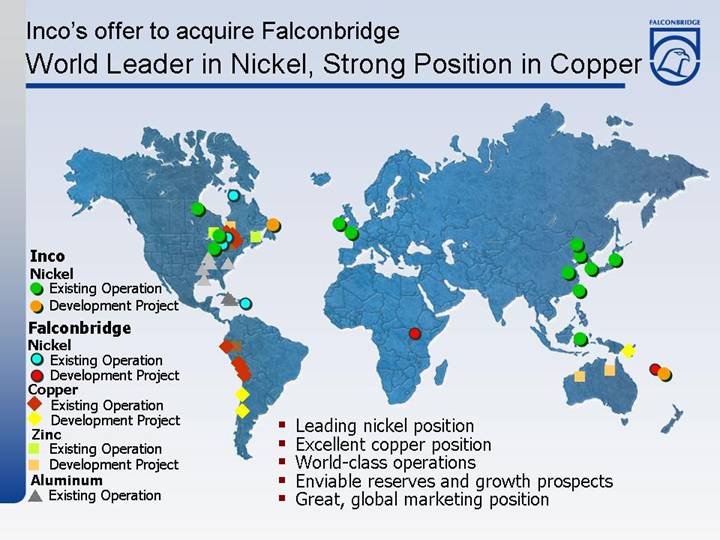
World Leader in Nickel, Strong Position in Copper
[GRAPHIC]
• Leading nickel position
• Excellent copper position
• World-class operations
• Enviable reserves and growth prospects
• Great, global marketing position
Update on Regulatory Process
• Received Canadian Competition Bureau clearance in late January
• Continue to work with U.S. Department of Justice (DOJ) and European Commission (EC)
• DOJ still evaluating whether they have any significant competitive concerns
• Also still evaluating a potential remedy, if required, to address concerns
• On February 24, 2006, EC indicated it would move into their second phase review, representing an in-depth review of up to 90 business days
• Also evaluating whether they have any significant competitive concerns
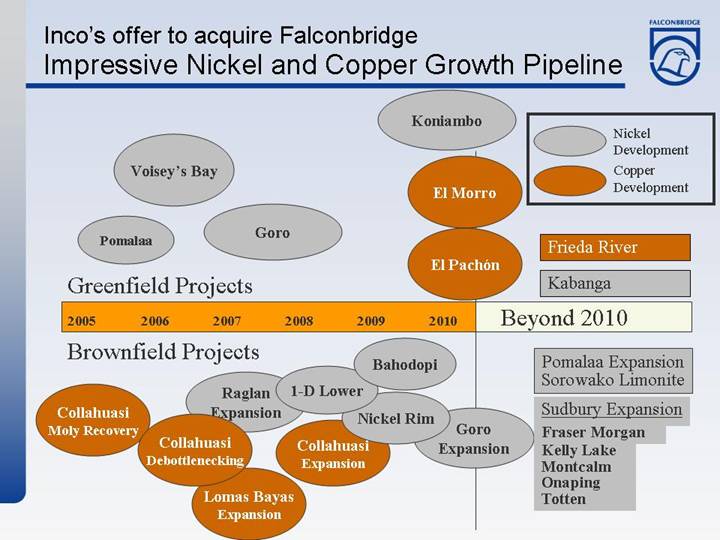
Impressive Nickel and Copper Growth Pipeline
| Koniambo | |
|
| |
Voisey’s Bay | El Morro | |
|
| |
Pomalaa | Goro | El Pachón |
Greenfield Projects
2005 | 2006 | 2007 | 2008 | 2009 | 2010 | Beyond 2010 |
Brownfield Projects
| Bahodopi |
| |||||
Collahuasi |
| Raglan | 1-D Lower | Nickel Rim | Goro |
| |
| Collahuasi | Collahuasi |
| ||||
| Lomas Bayas |
| |||||
• Nickel Development
• Copper Development
Frieda River
Kabanga
Pomalaa Expansion
Sorowako Limonite
Sudbury Expansion
Fraser Morgan
Kelly Lake
Montcalm
Onaping
Totten
US$350 Million of Annual Synergies Identified
• Synergies at operating and corporate levels
• Significant contribution would begin in 2006
• US$350 million run rate by mid-2008 (based on June 30, 2006 transaction)
• Synergies unique to our two companies
• Estimated NPV of synergies > US$2.5 billion after tax, or Cdn$8 per new Inco share using a 7% discount rate
• Best use of Sudbury processing facilities à increased nickel, copper, cobalt and PGM production
• Accelerated mine development in Sudbury à more jobs and investment in medium and longer term; some necessary short-term rationalization
• Integration and planning well advanced with dedicated integration teams
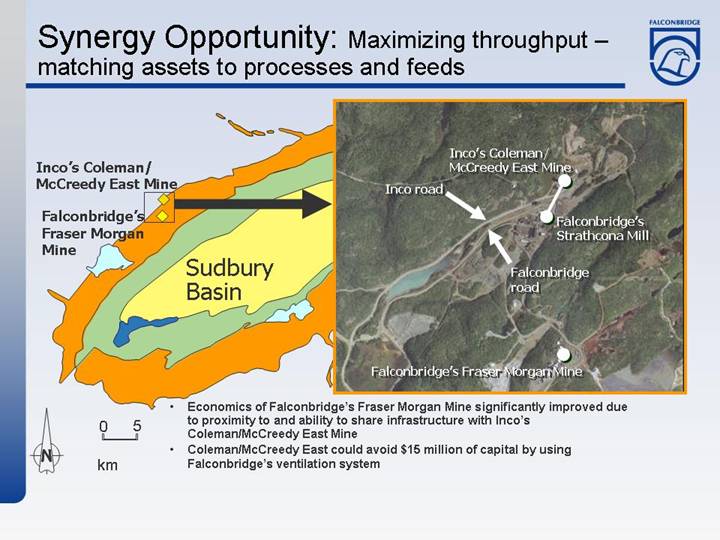
Synergy Opportunity: Maximizing throughput – matching assets to processes and feeds
[GRAPHIC]
• Economics of Falconbridge’s Fraser Morgan Mine significantly improved due to proximity to and ability to share infrastructure with Inco’s Coleman/McCreedy East Mine
• Coleman/McCreedy East could avoid $15 million of capital by using Falconbridge’s ventilation system
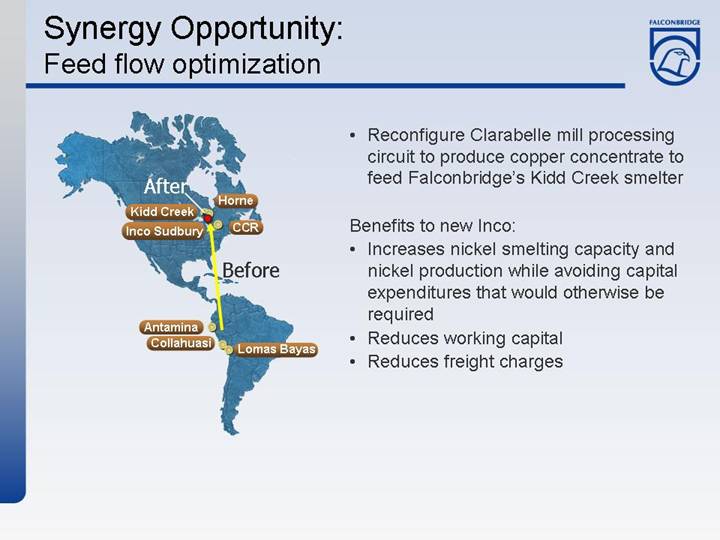
Synergy Opportunity:
Feed flow optimization
[GRAPHIC]
• Reconfigure Clarabelle mill processing circuit to produce copper concentrate to feed Falconbridge’s Kidd Creek smelter
Benefits to new Inco:
• Increases nickel smelting capacity and nickel production while avoiding capital expenditures that would otherwise be required
• Reduces working capital
• Reduces freight charges
Strong Financial Position
Proforma consolidated balance sheet
December 31, 2005
|
| New Inco* |
| |
US$ billions |
| Pro Forma |
| |
Cash and cash equivalents |
| $ | 1.8 |
|
Other current assets |
| 4.7 |
| |
|
| 6.5 |
| |
Property, plants and equipment and other assets |
| 26.9 |
| |
|
| $ | 33.4 |
|
Long-term debt due within one year |
| $ | 1.6 |
|
Other Current liabilities |
| 2.7 |
| |
Long-term debt |
| 6.8 |
| |
Deferred taxes |
| 5.0 |
| |
Other long-term liabilities |
| 2.3 |
| |
Minority interest |
| 1.1 |
| |
Shareholders’ equity |
| 13.9 |
| |
|
| $ | 33.4 |
|
* Figures are indicative only, based on Inco and Falconbridge Balance Sheets as at December 31, 2005 adjusted only for
(a) offer by Inco of C$34.00 per Falconbridge share to a maximum cash portion of C$2.87 billion (bank financing) and based on Inco share price October 10, 2005
(b) included in long-term debt are $750 million of junior preference (Series 1, 2 and 3). Falconbridge has announced that $500 million of these junior preference shares will be redeemed on April 16, 2006. The remaining $250 million are intended to be refinanced subsequent to the acquisition of control of Falconbridge by Inco
The proforma financial statements may not be indicative of results that actually would have occurred if the events reflected therein had been in effect on the dates indicated or of the results that may be obtained in the future.
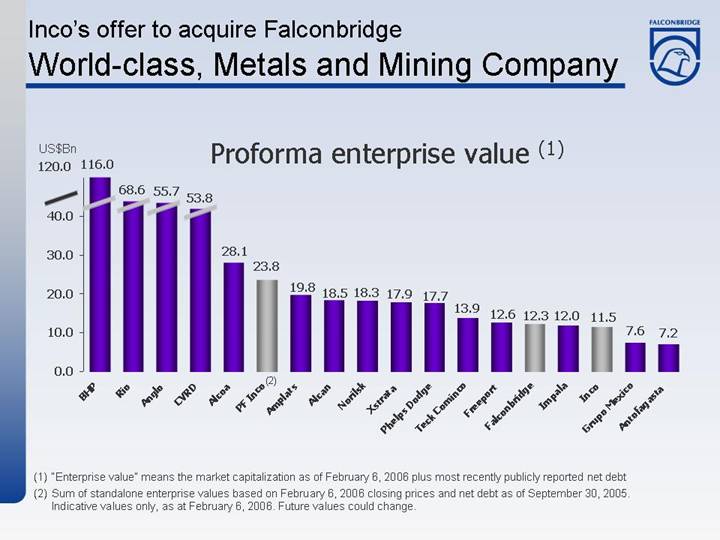
World-class, Metals and Mining Company
Proforma enterprise value (1)
[CHART]
(1) “Enterprise value” means the market capitalization as of February 6, 2006 plus most recently publicly reported net debt
(2) Sum of standalone enterprise values based on February 6, 2006 closing prices and net debt as of September 30, 2005. Indicative values only, as at February 6, 2006. Future values could change.
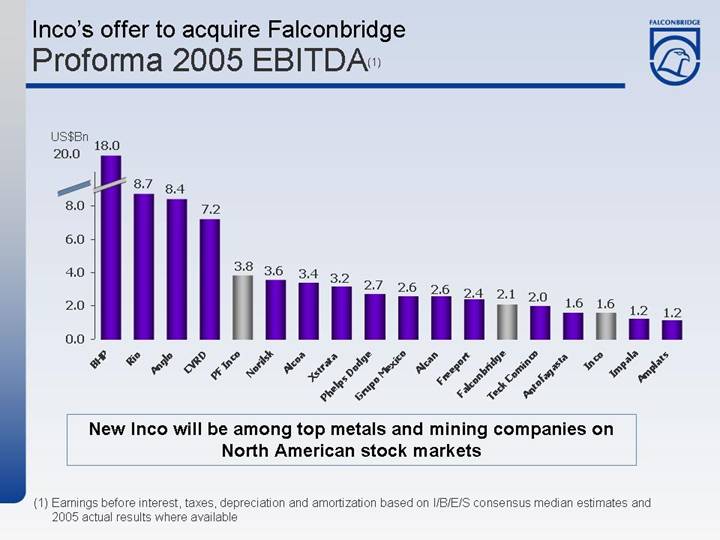
Proforma 2005 EBITDA(1)
[CHART]
New Inco will be among top metals and mining companies on North American stock markets
(1) Earnings before interest, taxes, depreciation and amortization based on I/B/E/S consensus median estimates and 2005 actual results where available
Falconbridge Today
In an Excellent Position
• Falconbridge remains in an excellent position to add value for shareholders
• Strong industry fundamentals for all our metals
• Solid operating base with upside potential
• World-class greenfield and brownfield growth projects
• Impressive financial performance
[GRAPHIC]
Falconbridge Limited Corporate Profile
Merrill Lynch Global Metals, Mining & Steel Conference in Miami, Florida
May 9, 2006
Important Legal Information
This communication is being made in respect of the share exchange takeover bid by Inco Limited for common shares of Falconbridge Limited. Inco has filed with the U.S. Securities and Exchange Commission (“SEC”) a registration statement on Form F-8 containing a share exchange take-over bid circular. Inco, if required, will file other documents regarding the transaction with the SEC. INVESTORS ARE URGED TO READ THE REGISTRATION STATEMENT AND ANY OTHER RELEVANT DOCUMENTS FILED OR TO BE FILED WITH THE SEC WHEN THEY BECOME AVAILABLE BECAUSE THEY WILL CONTAIN IMPORTANT INFORMATION. Investors will be able to obtain the documents filed with the SEC free of charge at the SEC’s website (www.sec.gov). Canadian investors will also be able to obtain information filed in respect of this bid at www.sedar.com.