UNITED STATES
SECURITIES AND EXCHANGE COMMISSION
Washington, D.C. 20549
FORM N-CSRS
CERTIFIED SHAREHOLDER REPORT OF REGISTERED MANAGEMENT
INVESTMENT COMPANIES
Investment Company Act File Number 811-07102
The Advisors’ Inner Circle Fund II
(Exact name of registrant as specified in charter)
SEI Investments
One Freedom Valley Drive
Oaks, PA 19456
(Address of principal executive offices) (Zip code)
SEI Investments
One Freedom Valley Drive
Oaks, PA 19456
(Name and address of agent for service)
Registrant’s telephone number, including area code: 1-877-446-3863
Date of fiscal year end: December 31, 2022
Date of reporting period: June 30, 2022
| Item 1. | Reports to Stockholders. |
A copy of the report transmitted to stockholders pursuant to Rule 30e-1 under the Investment Company Act of 1940, as amended (the “Act”) (17 CFR § 270.30e-1), is attached hereto.
THE ADVISORS’ INNER CIRCLE FUND II
CHAMPLAIN EMERGING MARKETS FUND
SEMI-ANNUAL REPORT
06.30.22
INVESTMENT ADVISER:
CHAMPLAIN INVESTMENT PARTNERS, LLC
| THE ADVISORS’ INNER CIRCLE FUND II | CHAMPLAIN FUNDS | |
| JUNE 30, 2022 | ||
| Table of Contents | ||||
| 1 | ||||
| 3 | ||||
| 6 | ||||
| 7 | ||||
| 8 | ||||
| 9 | ||||
| 11 | ||||
| 24 | ||||
The Fund files its complete schedule of investments with the Securities and Exchange Commission (the “SEC”) for the first and third quarters of each fiscal year as an exhibit to its reports on Form N-PORT (Form N-Q for filings prior to March 31, 2020). The Fund’s Form N-PORT is available on the SEC’s website at http://www.sec.gov, and may be reviewed and copied at the SEC’s Public Reference Room in Washington, DC. Information on the operation of the Public Reference Room may be obtained by calling 1-800-SEC-0330.
A description of the policies and procedures that the Fund uses to determine how to vote proxies relating to Fund securities, as well as information relating to how a Fund voted proxies relating to fund securities during the most recent 12-month period ended June 30, is available (i) without charge, upon request, by calling 1-866-773-3238; and (ii) on the SEC’s website at http://www.sec.gov.
| CHAMPLAIN INVESTMENT | PARTNERS | |||
| THE ADVISORS’ INNER CIRCLE FUND II | CHAMPLAIN | |
| EMERGING MARKETS FUND | ||
| JUNE 30, 2022 | ||
| (Unaudited) |
TOP TEN COMMON STOCK HOLDINGS *
Taiwan Semiconductor Manufacturing | 8.26 | % | ||
AIA Group | 4.75 | % | ||
Tencent Holdings | 4.61 | % | ||
Reliance Industries | 4.18 | % | ||
HDFC Bank | 3.72 | % | ||
JD.com, Cl A | 3.54 | % | ||
Samsung Electronics | 3.37 | % | ||
Wal-Mart de Mexico | 3.14 | % | ||
Alibaba Group Holding | 3.08 | % | ||
Unilever PLC | 2.76 | % |
*Percentages are based on total investments. Cash equivalents are not shown in the top ten chart.
| 1 | CHAMPLAIN INVESTMENT | PARTNERS | ||
| THE ADVISORS’ INNER CIRCLE FUND II | CHAMPLAIN | |
| EMERGING MARKETS FUND | ||
| JUNE 30, 2022 | ||
| (Unaudited) |
COUNTRY ALLOCATION **
China | 21.23 | % | ||
India | 21.14 | % | ||
Taiwan | 13.47 | % | ||
Hong Kong | 9.84 | % | ||
Mexico | 6.53 | % | ||
South Korea | 6.33 | % | ||
Brazil | 4.29 | % | ||
United Kingdom | 2.76 | % | ||
Indonesia | 2.49 | % | ||
Uruguay | 2.22 | % | ||
Singapore | 2.02 | % | ||
Poland | 1.49 | % | ||
South Africa | 1.45 | % | ||
Japan | 1.33 | % | ||
United States | 1.30 | % | ||
Hungary | 1.30 | % | ||
Luxembourg | 0.81 | % |
**Percentages are based on total investments.
| 2 | CHAMPLAIN INVESTMENT | PARTNERS | ||
| THE ADVISORS’ INNER CIRCLE FUND II | CHAMPLAIN EMERGING | |
| MARKETS FUND | ||
| JUNE 30, 2022 | ||
| (UNAUDITED) |
SECTOR WEIGHTINGS †:
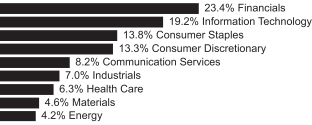
†Percentages are based on total investments.
| SCHEDULE OF INVESTMENTS |
| |||||||
| COMMON STOCK — 100.0% | ||||||||
| Shares | Value | |||||||
BRAZIL — 4.3% |
| |||||||
B3 - Brasil Bolsa Balcao | 31,100 | $ | 65,477 | |||||
WEG | 21,500 | 108,745 | ||||||
XP, Cl A * | 5,960 | 107,042 | ||||||
|
|
| ||||||
| 281,264 | ||||||||
|
|
| ||||||
CHINA — 21.2% |
| |||||||
Alibaba Group Holding * | 14,165 | 201,997 | ||||||
JD.com, Cl A | 7,207 | 232,183 | ||||||
Netease | 5,890 | 108,163 | ||||||
Shanghai Putailai New Energy Technology, Cl A | 5,845 | 73,692 | ||||||
Shenzhen Inovance Technology, Cl A | 12,952 | 127,444 | ||||||
Shenzhen Mindray Bio-Medical Electronics, Cl A | 2,795 | 130,767 | ||||||
Tencent Holdings | 6,685 | 301,922 | ||||||
WuXi AppTec, Cl H | 5,060 | 67,386 | ||||||
Wuxi Biologics Cayman * | 16,080 | 147,133 | ||||||
|
|
| ||||||
| 1,390,687 | ||||||||
|
|
| ||||||
HONG KONG — 9.9% |
| |||||||
AIA Group | 28,735 | 311,447 | ||||||
Hong Kong Exchanges & Clearing | 2,180 | 107,236 | ||||||
Shenzhou International Group Holdings | 11,495 | 139,239 | ||||||
Techtronic Industries | 8,335 | 86,941 | ||||||
|
|
| ||||||
| 644,863 | ||||||||
|
|
| ||||||
HUNGARY — 1.3% |
| |||||||
OTP Bank | 3,835 | 85,099 | ||||||
|
|
| ||||||
The accompanying notes are an integral part of the financial statements.
| 3 | CHAMPLAIN INVESTMENT | PARTNERS | ||
| THE ADVISORS’ INNER CIRCLE FUND II | CHAMPLAIN EMERGING | |
| MARKETS FUND | ||
| JUNE 30, 2022 | ||
| (UNAUDITED) |
COMMON STOCK — continued
| ||||||||
| Shares | Value | |||||||
INDIA — 21.1% |
| |||||||
Apollo Hospitals Enterprise | 1,435 | $ | 66,932 | |||||
Asian Paints | 3,545 | 120,985 | ||||||
Avenue Supermarts * | 1,130 | 48,737 | ||||||
Bajaj Finance | 1,880 | 128,563 | ||||||
Britannia Industries | 2,515 | 110,393 | ||||||
HDFC Bank | 14,265 | 243,493 | ||||||
Jubilant Foodworks | 9,600 | 62,270 | ||||||
Kotak Mahindra Bank | 5,640 | 118,631 | ||||||
Mphasis | 2,355 | 68,410 | ||||||
Reliance Industries * | 8,340 | 274,117 | ||||||
Tata Consultancy Services | 3,450 | 142,727 | ||||||
|
|
| ||||||
| 1,385,258 | ||||||||
|
|
| ||||||
INDONESIA — 2.5% |
| |||||||
Bank Central Asia | 335,475 | 163,262 | ||||||
|
|
| ||||||
JAPAN — 1.3% |
| |||||||
Keyence | 255 | 87,055 | ||||||
|
|
| ||||||
LUXEMBOURG — 0.8% |
| |||||||
L’Occitane International | 16,885 | 52,719 | ||||||
|
|
| ||||||
MEXICO — 6.5% |
| |||||||
Fomento Economico Mexicano ADR | 1,680 | 113,383 | ||||||
Grupo Financiero Banorte, Cl O | 19,575 | 109,053 | ||||||
Wal-Mart de Mexico | 59,955 | 205,638 | ||||||
|
|
| ||||||
| 428,074 | ||||||||
|
|
| ||||||
POLAND — 1.5% |
| |||||||
Dino Polska * | 1,380 | 97,917 | ||||||
|
|
| ||||||
SINGAPORE — 2.0% |
| |||||||
Nanofilm Technologies International | 21,535 | 36,054 | ||||||
United Overseas Bank | 5,100 | 96,195 | ||||||
|
|
| ||||||
| 132,249 | ||||||||
|
|
| ||||||
SOUTH AFRICA — 1.5% |
| |||||||
Clicks Group | 5,710 | 95,260 | ||||||
|
|
| ||||||
SOUTH KOREA — 6.3% |
| |||||||
Kakao | 2,270 | 122,207 | ||||||
Samsung Electronics | 5,030 | 220,818 | ||||||
The accompanying notes are an integral part of the financial statements.
| 4 | CHAMPLAIN INVESTMENT | PARTNERS | ||
| THE ADVISORS’ INNER CIRCLE FUND II | CHAMPLAIN EMERGING | |
| MARKETS FUND | ||
| JUNE 30, 2022 | ||
| (UNAUDITED) |
COMMON STOCK — continued
| ||||||||
| Shares | Value | |||||||
SOUTH KOREA — continued |
| |||||||
SK IE Technology * | 945 | $ | 71,399 | |||||
|
|
| ||||||
| 414,424 | ||||||||
|
|
| ||||||
TAIWAN — 13.5% |
| |||||||
Airtac International Group * | 1,622 | 54,061 | ||||||
Silergy | 1,430 | 115,185 | ||||||
Taiwan Semiconductor Manufacturing | 33,805 | 541,180 | ||||||
Voltronic Power Technology | 3,545 | 172,281 | ||||||
|
|
| ||||||
| 882,707 | ||||||||
|
|
| ||||||
UNITED KINGDOM — 2.8% |
| |||||||
Unilever PLC ADR | 3,945 | 180,799 | ||||||
|
|
| ||||||
UNITED STATES — 1.3% |
| |||||||
Freshworks, Cl A * | 6,490 | 85,343 | ||||||
|
|
| ||||||
URUGUAY — 2.2% |
| |||||||
MercadoLibre* | 228 | 145,206 | ||||||
|
|
| ||||||
TOTAL COMMON STOCK | ||||||||
(Cost $7,199,659) | 6,552,186 | |||||||
|
|
| ||||||
TOTAL INVESTMENTS — 100.0% | ||||||||
(Cost $7,199,659) | $ | 6,552,186 | ||||||
|
|
| ||||||
Percentages are based on Net Assets of $6,554,283.
| * | Non-income producing security. |
ADR — American Depositary Receipt
Cl — Class
PLC — Public Limited Company
As of June 30, 2022, all of the Fund’s investments were considered Level 1, in accordance with the authoritative guidance on fair value measurements and disclosure under U.S. Generally Accepted Accounting Principles.
For more information on valuation inputs, see Note 2 in the Notes to Financial Statements.
The accompanying notes are an integral part of the financial statements.
| 5 | CHAMPLAIN INVESTMENT | PARTNERS | ||
| THE ADVISORS’ INNER CIRCLE FUND II | CHAMPLAIN EMERGING | |
| MARKETS FUND | ||
| JUNE 30, 2022 | ||
| (UNAUDITED) |
STATEMENT OF ASSETS AND LIABILITIES
| Assets: | ||||
Investments, at value (Cost $7,199,659) | $ | 6,552,186 | ||
Foreign Currency, at Value (Cost $739) | 740 | |||
Cash | 22,197 | |||
Receivable for Dividends | 9,517 | |||
Receivable from Advisor | 5,570 | |||
Receivable for Capital Shares Sold | 5,304 | |||
Reclaim Receivable | 110 | |||
Prepaid Expenses | 18,237 | |||
|
| |||
Total Assets | 6,613,861 | |||
|
| |||
| Liabilities: | ||||
Accrued Foreign Capital Gains Tax on Appreciated Securities | 25,260 | |||
Payable due to Transfer Agent | 10,660 | |||
Payable due to Printing Fees | 7,302 | |||
Payable due to Custody Fees | 6,079 | |||
Payable for Capital Shares Redeemed | 3,653 | |||
Payable due to Distributor — Advisor Shares | 2,856 | |||
Payable due to Administrator | 348 | |||
Payable due to Trustees | 11 | |||
Other Accrued Expenses | 3,409 | |||
|
| |||
Total Liabilities | 59,578 | |||
|
| |||
Net Assets | $ | 6,554,283 | ||
|
| |||
| NET ASSETS CONSIST OF: | ||||
Paid-in Capital | $ | 7,596,375 | ||
Total Distributable Loss | (1,042,092 | ) | ||
|
| |||
Net Assets | $ | 6,554,283 | ||
|
| |||
| ADVISOR SHARES: | ||||
Net Assets | $ | 4,331,337 | ||
Shares Issued and Outstanding | 470,847 | |||
Net Asset Value, Offering and Redemption Price Per Share | $ | 9.20 | ||
|
| |||
| INSTITUTIONAL SHARES: | ||||
Net Assets | $ | 2,222,946 | ||
Shares Issued and Outstanding | 240,551 | |||
Net Asset Value, Offering and Redemption Price Per Share | $ | 9.24 | ||
|
| |||
The accompanying notes are an integral part of the financial statements.
| 6 | CHAMPLAIN INVESTMENT | PARTNERS | ||
| THE ADVISORS’ INNER CIRCLE FUND II | CHAMPLAIN EMERGING | |
| MARKETS FUND | ||
| FOR THE PERIOD | ||
| ENDED JUNE 30, 2022 | ||
| (UNAUDITED) |
| Investment Income | ||||
Dividends | $ | 70,057 | ||
Less: Foreign Taxes Withheld | (3,708 | ) | ||
|
|
| ||
Total Investment Income | 66,349 | |||
|
|
| ||
| Expenses | ||||
Investment Advisory Fees | 34,571 | |||
Distribution Fees — Advisor Shares | 6,367 | |||
Administration Fees | 2,365 | |||
Chief Compliance Officer Fees | 361 | |||
Trustees’ Fees | 29 | |||
Transfer Agent Fees | 31,464 | |||
Registration Fees | 15,782 | |||
Custodian Fees | 4,513 | |||
Printing Fees | 4,497 | |||
Professional Fees | 1,305 | |||
Insurance and Other Expenses | 3,263 | |||
|
|
| ||
Total Expenses | 104,517 | |||
|
|
| ||
Less: Advisory Fees Waived | (34,571 | ) | ||
Less: Reimbursement from Advisor | (23,409 | ) | ||
Less: Fees Paid Indirectly (1) | (21 | ) | ||
|
|
| ||
Net Expenses | 46,516 | |||
|
|
| ||
Net Investment Income (Loss) | 19,833 | |||
|
|
| ||
Net Realized Loss on Investments | (366,523 | ) | ||
Net Realized Loss on Foreign Capital Gains Tax | (20,310 | ) | ||
Net Realized Loss on Foreign Currency Transactions | (1,219 | ) | ||
|
|
| ||
Net Realized Gain (Loss) | (388,052 | ) | ||
|
|
| ||
Net Change in Unrealized Appreciation (Depreciation) on Investments | (2,294,889 | ) | ||
Net Change in Foreign Capital Gains Tax on Appreciated Securities | 33,399 | |||
Net Change in Depreciation on Translation of Assets and Liabilities Denominated in Foreign Currencies | (100 | ) | ||
|
|
| ||
Net Change in Unrealized Appreciation (Depreciation) | (2,261,590) | |||
|
|
| ||
Net Realized and Unrealized Gain (Loss) | (2,649,642 | ) | ||
|
|
| ||
Net Decrease in Net Assets Resulting from Operations | $ | (2,629,809 | ) | |
|
|
| ||
| (1) | See Note 4 in Notes to Financial Statements. |
The accompanying notes are an integral part of the financial statements.
| 7 | CHAMPLAIN INVESTMENT | PARTNERS | ||
| THE ADVISORS’ INNER CIRCLE FUND II | CHAMPLAIN EMERGING | |
| MARKETS FUND | ||
STATEMENTS OF CHANGES IN NET ASSETS
| Period Ended June 30, 2022 (Unaudited) | Year Ended December 31, 2021 | |||||||
| Operations: | ||||||||
Net Investment Income (Loss) | $ | 19,833 | $ | (64,511 | ) | |||
Net Realized Gain (Loss) | (388,052 | ) | 1,177,238 | |||||
Net Change in Unrealized Appreciation (Depreciation) | (2,261,590 | ) | (1,573,573 | ) | ||||
|
|
|
| |||||
Net Decrease in Net Assets Resulting from Operations | (2,629,809 | ) | (460,846 | ) | ||||
|
|
|
| |||||
| Distributions: | ||||||||
Advisor Shares | (35,612 | ) | (776,929 | ) | ||||
Institutional Shares | (18,143 | ) | (354,566 | ) | ||||
|
|
|
| |||||
Total Distributions | (53,755) | (1,131,495) | ||||||
|
|
|
| |||||
| Capital Share Transactions:(1) | ||||||||
Advisor Shares: | ||||||||
Issued | 381,154 | 2,141,085 | ||||||
Reinvestment of Distributions | 35,612 | 776,929 | ||||||
Redeemed | (444,330 | ) | (1,540,110 | ) | ||||
|
|
|
| |||||
Increase (Decrease) from Advisor Shares Capital Share Transactions | (27,564 | ) | 1,377,904 | |||||
|
|
|
| |||||
Institutional Shares: | ||||||||
Issued | 340,223 | 803,840 | ||||||
Reinvestment of Distributions | 18,143 | 354,566 | ||||||
Redeemed | (236,567 | ) | (127,662 | ) | ||||
|
|
|
| |||||
Increase from Institutional Shares Capital Share Transactions | 121,799 | 1,030,744 | ||||||
|
|
|
| |||||
Net Increase in Net Assets from Capital Share Transactions | 94,235 | 2,408,648 | ||||||
|
|
|
| |||||
Total Increase (Decrease) in Net Assets | (2,589,329) | 816,307 | ||||||
|
|
|
| |||||
| Net Assets: | ||||||||
Beginning of Period/Year | 9,143,612 | 8,327,305 | ||||||
|
|
|
| |||||
End of Period/Year | $ | 6,554,283 | $ | 9,143,612 | ||||
|
|
|
| |||||
| (1) | For share transactions, see Note 6 in the Notes to Financial Statements. |
The accompanying notes are an integral part of the financial statements.
| 8 | CHAMPLAIN INVESTMENT | PARTNERS | ||
| THE ADVISORS’ INNER CIRCLE FUND II | CHAMPLAIN EMERGING | |
| MARKETS FUND | ||
Selected Per Share Data & Ratios
For a Share Outstanding Throughout each Period/Year
| Advisor Shares | ||||||||||||||||||||||||||||
| Period Ended June 30, 2022 (Unaudited) | Year Ended December 31, 2021 | Period Ended December 31, 2020(1) | Year Ended July 31, 2020 | Year Ended July 31, 2019 | Year Ended July 31, 2018 | Year Ended July 31, 2017 | ||||||||||||||||||||||
Net Asset Value, Beginning of Period | $ | 12.95 | $ | 15.34 | $ | 12.49 | $ | 9.79 | $ | 10.15 | $ | 9.50 | $ | 8.29 | ||||||||||||||
|
|
|
|
|
|
|
|
|
|
|
|
|
|
|
|
|
|
|
|
| ||||||||
Income from Operations: | ||||||||||||||||||||||||||||
Net Investment Income (Loss)(2) | 0.02 | (0.12 | ) | (0.04 | ) | (0.02 | ) | (0.01 | ) | (0.02 | ) | — | ||||||||||||||||
Net Realized and Unrealized Gain (Loss) on Investments | (3.69 | ) | (0.44 | ) | 2.89 | 2.81 | (0.35 | ) | 0.81 | 1.25 | ||||||||||||||||||
|
|
|
|
|
|
|
|
|
|
|
|
|
|
|
|
|
|
|
|
| ||||||||
Total from Operations | (3.67 | ) | (0.56 | ) | 2.85 | 2.79 | (0.36 | ) | 0.79 | 1.25 | ||||||||||||||||||
|
|
|
|
|
|
|
|
|
|
|
|
|
|
|
|
|
|
|
|
| ||||||||
Dividends and Distributions from: |
| |||||||||||||||||||||||||||
Net Investment Income | — | — | — | (0.09 | ) | — | (0.13 | ) | (0.04 | ) | ||||||||||||||||||
Net Realized Gains | (0.08 | ) | (1.83 | ) | — | — | — | (0.01 | ) | — | ||||||||||||||||||
|
|
|
|
|
|
|
|
|
|
|
|
|
|
|
|
|
|
|
|
| ||||||||
Total Dividends and Distributions | (0.08 | ) | (1.83 | ) | — | (0.09 | ) | — | (0.14 | ) | (0.04 | ) | ||||||||||||||||
|
|
|
|
|
|
|
|
|
|
|
|
|
|
|
|
|
|
|
|
| ||||||||
Net Asset Value, End of Period | $ | 9.20 | $ | 12.95 | $ | 15.34 | $ | 12.49 | $ | 9.79 | $ | 10.15 | $ | 9.50 | ||||||||||||||
|
|
|
|
|
|
|
|
|
|
|
|
|
|
|
|
|
|
|
|
| ||||||||
Total Return † | (28.37)% | †† | (3.57)% | 22.82% | †† | 28.62% | (3.55)% | 8.25% | 15.16% | |||||||||||||||||||
|
|
|
|
|
|
|
|
|
|
|
|
|
|
|
|
|
|
|
|
| ||||||||
Ratios and Supplemental Data | ||||||||||||||||||||||||||||
Net Assets, End of Period (Thousands) | $ | 4,331 | $ | 6,141 | $ | 5,884 | $ | 5,839 | $ | 3,944 | $ | 3,931 | $ | 4,287 | ||||||||||||||
Ratio of Expenses to Average Net Assets (including waivers and reimbursements/excluding fees paid indirectly) | 1.30%* | 1.30% | 1.30%* | 1.36% | 1.50% | 1.50% | 1.51% | |||||||||||||||||||||
Ratio of Expenses to Average Net Assets (excluding waivers, reimbursements and fees paid indirectly) | 2.80%* | 2.84% | 3.00%* | 3.80% | 3.41% | 3.43% | 4.04% | |||||||||||||||||||||
Ratio of Net Investment Income (Loss) to Average Net Assets | 0.44%* | (0.74)% | (0.70)%* | (0.16)% | (0.13)% | (0.20)% | (0.01)% | |||||||||||||||||||||
Portfolio Turnover Rate | 28%†† | 44% | 11%†† | 32% | 33% | 35% | 37% | |||||||||||||||||||||
| * | Annualized |
| † | Total return would have been lower had certain expenses not been waived and assumed by the Adviser during the period. The return shown does not reflect the deduction of taxes that a shareholder would pay on Fund distributions or the redemption of Fund shares. |
| †† | Portfolio turnover and total return is for the period indicated and has not been annualized. |
| (1) | For the period August 1, 2020 to December 31, 2020. Effective August 19, 2020, the Champlain Emerging Markets Fund changed its fiscal year end to December 31st (see Note 1 in the Notes to Financial Statements). |
| (2) | Per share amounts calculated using average shares method. |
Amounts designated as “—” are $0 or round to $0. |
The accompanying notes are an integral part of the financial statements.
| 9 | CHAMPLAIN INVESTMENT | PARTNERS | ||
| THE ADVISORS’ INNER CIRCLE FUND II | CHAMPLAIN EMERGING | |
| MARKETS FUND | ||
FINANCIAL HIGHLIGHTS
Selected Per Share Data & Ratios
For a Share Outstanding Throughout each Period/Year
| Institutional Shares | ||||||||||||||||
| Period Ended June 30, 2022 (Unaudited) | Year Ended December 31, 2021 | Period Ended December 31, 2020(2) | Period Ended July 31, 2020(1) | |||||||||||||
Net Asset Value, Beginning of Period | $ | 13.00 | $ | 15.35 | $ | 12.48 | $ | 10.55 | ||||||||
|
|
|
|
|
|
|
| |||||||||
Income from Operations: | ||||||||||||||||
Net Investment Income (Loss)(3) | 0.04 | (0.08 | ) | (0.04 | ) | —^ | ||||||||||
Net Realized and Unrealized Gain (Loss) on Investments | (3.72 | ) | (0.44 | ) | 2.91 | 2.04 | ||||||||||
|
|
|
|
|
|
|
| |||||||||
Total from Operations | (3.68 | ) | (0.52 | ) | 2.87 | 2.04 | ||||||||||
|
|
|
|
|
|
|
| |||||||||
Dividends and Distributions from: | ||||||||||||||||
Net Investment Income | — | — | — | (0.11 | ) | |||||||||||
Net Realized Gains | (0.08 | ) | (1.83 | ) | — | — | ||||||||||
|
|
|
|
|
|
|
| |||||||||
Total Dividends and Distributions | (0.08 | ) | (1.83 | ) | — | (0.11 | ) | |||||||||
|
|
|
|
|
|
|
| |||||||||
Net Asset Value, End of Period | $ | 9.24 | $ | 13.00 | $ | 15.35 | $ | 12.48 | ||||||||
|
|
|
|
|
|
|
| |||||||||
Total Return † | (28.34)% | †† | (3.29)% | 23.00% | †† | 19.52% | †† | |||||||||
|
|
|
|
|
|
|
| |||||||||
| Ratios and Supplemental Data | ||||||||||||||||
Net Assets, End of Period (Thousands) | $ | 2,223 | $ | 3,003 | $ | 2,443 | $ | 12 | ||||||||
Ratio of Expenses to Average Net Assets (including waivers and reimbursements/excluding fees paid indirectly) | 1.05%* | 1.05% | 1.05%* | 1.05%* | ||||||||||||
Ratio of Expenses to Average Net Assets (excluding waivers, reimbursements and fees paid indirectly) | 2.55%* | 2.59% | 2.69%* | 3.88%* | ||||||||||||
Ratio of Net Investment Income (Loss) to Average Net Assets | 0.67%* | (0.50)% | (0.64)%* | (0.01)%* | ||||||||||||
Portfolio Turnover Rate | 28%†† | 44% | 11%†† | 32%†† | ||||||||||||
| * | Annualized |
| † | Total return would have been lower had certain expenses not been waived and assumed by the Adviser during the period. The return shown does not reflect the deduction of taxes that a shareholder would pay on Fund distributions or the redemption of Fund shares. |
| †† | Portfolio turnover and total return is for the period indicated and has not been annualized. |
| ^ | Amount less than $0.005. |
| (1) | Institutional Shares commenced operations on December 16, 2019. |
| (2) | For the period August 1, 2020 to December 31, 2020. Effective August 19, 2020, the Champlain Emerging Markets Fund changed its fiscal year end to December 31st (see Note 1 in the Notes to Financial Statements). |
| (3) | Per share amounts calculated using average shares method. |
Amounts designated as “—” are $0 or round to $0. |
The accompanying notes are an integral part of the financial statements.
| 10 | CHAMPLAIN INVESTMENT | PARTNERS | ||
| THE ADVISORS’ INNER CIRCLE FUND II | CHAMPLAIN | |
| EMERGING | ||
| MARKETS FUND | ||
| JUNE 30, 2022 |
NOTES TO FINANCIAL STATEMENTS (Unaudited)
1. ORGANIZATION:
The Advisors’ Inner Circle Fund II (the “Trust”) is organized as a Massachusetts business trust under an Amended and Restated Agreement and Declaration of Trust dated July 24, 1992. The Trust is registered under the Investment Company Act of 1940, as amended, as an open-end management investment company with nine funds. The financial statements herein are those of the Champlain Emerging Markets Fund (the “Fund”). The financial statements for the Champlain Small Company Fund (the “Small Company Fund”) and Champlain Mid Cap Fund (the “Mid Cap Fund”) are presented separately. The investment objective of the Fund is capital appreciation. The Fund is classified as a “non-diversified” investment company under the 1940 Act. The Fund invests primarily (at least 80% of its net assets) in equity securities of issuers who are economically tied to an emerging market country. The financial statements of the remaining funds within the Trust are presented separately. The assets of each Fund of the Trust are segregated, and a shareholder’s interest is limited to the fund in which shares are held. The Fund currently offers Institutional Shares which commenced operations on December 16, 2019. The Fund commenced operations on September 9, 2014 as the New Sheridan Developing World Fund (the “Predecessor Fund”), a series of ALPS Series Trust, which reorganized through a transfer of all assets and liabilities to the Champlain Emerging Markets Fund on November 16, 2015. Investor Class Shares of the Predecessor Fund were exchanged on a tax-free basis for Advisor Shares of the Fund. The Predecessor Fund had substantially similar investment objectives, investment strategies, policies and restrictions as those of the Fund. For financial reporting purposes, the Predecessor Fund’s financial and performance history prior to the reorganization has been carried forward and is reflected in the Fund’s financial highlights.
Effective November 16, 2015, the Fund has changed its fiscal year end to July 31, 2016.
Effective August 19, 2020, the Fund changed its fiscal year end to December 31.
2. SIGNIFICANT ACCOUNTING POLICIES:
The following is a summary of the significant accounting policies followed in preparation of the financial statements by the Fund. The Fund is an investment company that applies the accounting and reporting guidance issued in Topic 946 by the U.S. Financial Accounting Standards Board (“FASB”).
Use of Estimates — The preparation of financial statements, in conformity with U.S. generally accepted accounting principles (“U.S. GAAP”) requires management to make estimates and assumptions that affect the reported amount of assets and liabilities and
| 11 | CHAMPLAIN INVESTMENT | PARTNERS | ||
| THE ADVISORS’ INNER CIRCLE FUND II | CHAMPLAIN | |
| EMERGING | ||
| MARKETS FUND | ||
| JUNE 30, 2022 |
disclosure of contingent assets and liabilities at the date of the financial statements and the reported amounts of increases and decreases in net assets from operations during the reporting period. Actual results could differ from those estimates and such differences could be material.
Security Valuation — Securities listed on a securities exchange, market or automated quotation system for which quotations are readily available (except for securities traded on NASDAQ), including securities traded over the counter, are valued at the last quoted sale price on the primary exchange or market (foreign or domestic) on which they are traded, or, if there is no such reported sale, at the most recent quoted bid price. For securities traded on NASDAQ, the NASDAQ Official Closing Price will be used. Investment companies are valued at Net Asset Value.
Securities for which market prices are not “readily available” are valued in accordance with Fair Value Procedures established by the Trust’s Board of Trustees (the “Board”). The Trust’s Fair Value Procedures are implemented through a Fair Value Committee (the “Committee”) designated by the Board. Some of the more common reasons that may necessitate that a security be valued using Fair Value Procedures include: the security’s trading has been halted or suspended; the security has been de-listed from a national exchange; the security’s primary trading market is temporarily closed at a time when under normal conditions it would be open; the security has not been traded for an extended period of time; the security’s primary pricing source is not able or willing to provide a price; or trading of the security is subject to local government-imposed restrictions. When a security is valued in accordance with the Trust’s Fair Value Procedures, the Committee will determine the value after taking into consideration relevant information reasonably available to the Committee. As of June 30, 2022, there were no securities valued in accordance with the Fair Value Procedures.
For securities that principally trade on a foreign market or exchange, a significant gap in time can exist between the time of a particular security’s last trade and the time at which the Fund calculates its net asset values. The closing prices of such securities may no longer reflect their market value at the time the Fund calculates net asset value if an event that could materially affect the value of those securities (a “Significant Event”) has occurred between the time of the security’s last close and the time that the Fund calculates net asset value. A Significant Event may relate to a single issuer or to an entire market sector. If Champlain Investment Partners, LLC (the “Adviser”), the investment adviser of the Fund, becomes aware of a Significant Event that has occurred with respect to a security or group of securities after the closing of the exchange or market on which the security or securities principally trade, but before the time at which the Fund calculates net asset value, it may request that a Committee meeting be called.
| 12 | CHAMPLAIN INVESTMENT | PARTNERS | ||
| THE ADVISORS’ INNER CIRCLE FUND II | CHAMPLAIN | |
| EMERGING | ||
| MARKETS FUND | ||
| JUNE 30, 2022 |
The Fund uses MarkIt Fair Value (“MarkIt”) as a third party fair valuation vendor when the fair value trigger is met. MarkIt provides a fair value for foreign securities in the Fund based on certain factors and methodologies (involving, generally, tracking valuation correlations between the U.S. market and each non-U.S. security) applied by MarkIt in the event that there is a movement in the U.S. market that exceeds a specific threshold established by the Committee. The Committee establishes a “confidence interval” which is used to determine the level of correlation between the value of a foreign security and movements in the U.S. market before a particular security is fair valued when the threshold is exceeded. In the event that the threshold established by the Committee is exceeded on a specific day, the Fund values its non-U.S. securities that exceed the applicable “confidence interval” based upon the fair values provided by MarkIt. In such event, it is not necessary to hold a Committee meeting. In the event that the Adviser believes that the fair values provided by MarkIt are not reliable, the Adviser contacts SEI Investments Global Fund Services (the “Administrator”) and may request that a meeting of the Committee be held.
If a local market in which the Fund owns securities is closed for one or more days, the Fund shall value all securities held in that corresponding currency based on the fair value prices provided by MarkIt using the predetermined confidence interval discussed above.
In accordance with the authoritative guidance on fair value measurements and disclosure under U.S. GAAP, the Fund discloses the fair value of their investments in a hierarchy that prioritizes the inputs to valuation techniques used to measure the fair value. The objective of a fair value measurement is to determine the price that would be received to sell an asset or paid to transfer a liability in an orderly transaction between market participants at the measurement date (an exit price). Accordingly, the fair value hierarchy gives the highest priority to quoted prices (unadjusted) in active markets for identical assets or liabilities (Level 1) and the lowest priority to unobservable inputs (Level 3). The three levels of the fair value hierarchy are described below:
• Level 1 – Unadjusted quoted prices in active markets for identical, unrestricted assets or liabilities that the Fund has the ability to access at the measurement date;
• Level 2 – Quoted prices which are not active, or inputs that are observable (either directly or indirectly) for substantially the full term of the asset or liability; and other significant observable inputs (includes quoted prices for similar securities, interest rates, prepayment spreads, credit risk, referenced indices, quoted prices in inactive markets, adjusted quoted prices in active markets, etc.); and
• Level 3 – Prices, inputs or exotic modeling techniques which are both significant to the fair value measurement and unobservable (supported by little or no market activity).
| 13 | CHAMPLAIN INVESTMENT | PARTNERS | ||
| THE ADVISORS’ INNER CIRCLE FUND II | CHAMPLAIN | |
| EMERGING | ||
| MARKETS FUND | ||
| JUNE 30, 2022 |
Investments are classified within the level of the lowest significant input considered in determining fair value. Investments classified within Level 3 whose fair value measurement considers several inputs may include Level 1 or Level 2 inputs as components of the overall fair value measurement.
For details of investment classifications, reference the Schedule of Investments. The inputs or methodology used for valuing securities are not necessarily an indication of the risk associated with investing in those securities.
For the six months ended June 30, 2022, there have been no significant changes to the Fund’s fair value methodologies.
Federal Income Taxes — It is the Fund’s intention to continue to qualify as a regulated investment company under Subchapter M of the Internal Revenue Code and to distribute all of their taxable income. Accordingly, no provision for Federal income taxes has been made in the financial statements.
The Fund evaluates tax positions taken or expected to be taken in the course of preparing the Fund’s tax returns to determine whether it is “more-likely-than-not” (i.e., greater than 50-percent) that each tax position will be sustained upon examination by a taxing authority based on the technical merits of the position. Tax positions not deemed to meet the more-likely-than-not threshold are recorded as a tax benefit or expense in the current year. The Fund did not record any tax provision in the current period. However, management’s conclusions regarding tax positions taken may be subject to review and adjustment at a later date based on factors including, but not limited to, examination by tax authorities (i.e., the last 3 tax year ends, as applicable), on-going analysis of and changes to tax laws, regulations and interpretations thereof.
As of and during the six months ended June 30, 2022, the Fund did not have liabilities for any unrecognized tax benefits. The Fund recognizes interest and penalties, if any, related to unrecognized tax benefits as income tax expense on the Statement of Operations. During the six months ended June 30, 2022, the Fund did not incur any interest or penalties.
Security Transactions and Investment Income — Security transactions are accounted for on the trade date for financial reporting purposes. Costs used in determining realized gains and losses on the sales of investment securities are based on specific identification. Dividend income is recognized on the ex-dividend date and interest income is recognized on an accrual basis.
Foreign Currency Translation — The books and records of the Fund are maintained in U.S. dollars. Investment securities and other assets and liabilities denominated in a
| 14 | CHAMPLAIN INVESTMENT | PARTNERS | ||
| THE ADVISORS’ INNER CIRCLE FUND II | CHAMPLAIN | |
| EMERGING | ||
| MARKETS FUND | ||
| JUNE 30, 2022 |
foreign currency are translated into U.S. dollars on the date of valuation. The Fund do not isolate that portion of realized or unrealized gains and losses resulting from changes in the foreign exchange rate from fluctuations arising from changes in the market prices of the securities. These gains and losses are included in net realized gain (loss) on investments and net change in unrealized appreciation (depreciation) on investments on the Statement of Operations. Net realized gain (loss) on foreign currency transactions and net change in unrealized appreciation (depreciation) on translation of assets and liabilities denominated in foreign currencies represent net foreign exchange gains or losses from foreign currency exchange contracts, disposition of foreign currencies, currency gains or losses realized between trade and settlement dates on securities transactions and the difference between the amount of the investment income and foreign withholding taxes recorded on the Fund’s books and the U.S. dollar equivalent of the amounts actually received or paid.
Classes — Class specific expenses, such as distribution fees, are borne by that class of shares. Income, realized and unrealized gains/losses and non-class specific expenses are allocated to the respective class on the basis of relative net assets.
Expenses — Most expenses of the Trust can be directly attributed to a particular fund. Expenses that cannot be directly attributed to a particular fund are apportioned among the funds of the Trust based on the number of funds and/or relative net assets.
Dividends and Distributions to Shareholders — Dividends from net investment income, if any, are declared and paid annually by the Fund. Any net realized capital gains are distributed to shareholders at least annually.
Redemption Fees — The Fund imposes a 2.00% redemption fee on the value of Institutional Class shares redeemed fewer than 30 days from the date of purchase. The redemption fee is recorded as an increase to paid-in capital. The Fund did not incur any fees at the six months ended June 30, 2022 and the year ended December 31, 2021.
3. TRANSACTIONS WITH AFFILIATES:
Certain officers and a trustee of the Trust are also officers of SEI Investments Global Funds Services (the “Administrator”), a wholly owned subsidiary of SEI Investments Company, and/or SEI Investments Distribution Co. (the “Distributor”). Such officers and the trustee are paid no fees by the Trust for serving as officers and trustee of the Trust.
The services provided by the Chief Compliance Officer (“CCO”) and his staff, who are the employees of the Administrator, are paid for by the Trust as incurred. The services include regulatory oversight of the Trust’s Advisors and service providers as required by SEC regulations. The CCO’s services have been approved by and are reviewed by the Board.
| 15 | CHAMPLAIN INVESTMENT | PARTNERS | ||
| THE ADVISORS’ INNER CIRCLE FUND II | CHAMPLAIN | |
| EMERGING | ||
| MARKETS FUND | ||
| JUNE 30, 2022 |
| 4. | ADMINISTRATION, DISTRIBUTION, TRANSFER AGENT AND CUSTODIAN AGREEMENTS: |
The Fund and the Administrator are parties to an Administration Agreement, under which the Administrator provides administrative services to the Fund. For these services, the Administrator is paid an asset-based fee, which will vary depending on the number of share classes and the average daily net assets of the Fund. For the six months ended June 30, 2022, the Fund was charged $2,365 for these services.
The Fund has adopted a Distribution Plan (the “Plan”) for the Advisor Shares. Under the Plan, the Distributor, or third parties that enter into agreements with the Distributor, may receive up to 0.25% of the Fund’s average net assets attributable to the Advisor Shares as compensation for distribution services.
DST Systems, Inc. serves as the transfer agent and dividend disbursing agent for the Fund under a transfer agency agreement with the Trust. The Fund may earn cash management credits which can be used to offset transfer agent expenses. During the six months ended June 30, 2022, the Fund earned credits of $21 which were used to offset transfer agent expenses. These amounts are listed as “Fees Paid Indirectly” on the Statement of Operations.
MUFG Union Bank, N.A. acts as Custodian for the Fund. The Custodian plays no role in determining the investment policies of the Fund or which securities are to be purchased or sold by the Fund.
5. INVESTMENT ADVISORY AGREEMENT:
For its services, the Adviser is entitled to a fee, which is calculated daily and paid monthly, at an annual rate based on the average daily net assets of 0.90% on the first $250 million in assets and 0.80% on assets over $250 million.
The Adviser has contractually agreed to limit the total expenses of the Fund - Advisor Shares and Institutional Shares (excluding interest, taxes, brokerage commissions, acquired Fund fees and extraordinary expenses) to 1.30% and 1.05%, respectively. To maintain these expense limitations, the Adviser may waive a portion of its advisory fee and/or reimburse certain expenses of the Fund. If at any point it becomes unnecessary for the Adviser, Administrator, or shareholder service agent to make expense limitation reimbursements, the Adviser may retain the difference between the “Total Annual Fund Operating Expenses” and the aforementioned expense limitations to recapture all or a portion of its prior expense limitation reimbursements made during the preceding three year period.
| 16 | CHAMPLAIN INVESTMENT | PARTNERS | ||
| THE ADVISORS’ INNER CIRCLE FUND II | CHAMPLAIN | |
| EMERGING | ||
| MARKETS FUND | ||
| JUNE 30, 2022 |
At June 30, 2022, the amount the Adviser may seek as reimbursement of previously waived fees and reimbursed expenses is $97,727, $150,204 and $123,537 expiring 2023, 2024 and 2025, respectively.
6. SHARE TRANSACTIONS:
| Champlain Emerging Markets Fund | Period Ended June 30, 2022 (Unaudited) | Year Ended December 31, 2021 | ||||||
Advisor Shares | ||||||||
Issued | 33,754 | 133,194 | ||||||
Reinvestment of Distributions | 3,871 | 60,367 | ||||||
Redeemed | (40,896 | ) | (102,953 | ) | ||||
|
|
|
| |||||
Net Advisor Shares Capital Share Transactions | (3,271 | ) | 90,608 | |||||
|
|
|
| |||||
Institutional Shares | ||||||||
Issued | 30,863 | 53,629 | ||||||
Reinvestment of Distributions | 1,964 | 27,464 | ||||||
Redeemed | (23,324 | ) | (9,222 | ) | ||||
|
|
|
| |||||
Net Institutional Shares Capital Share Transactions | 9,503 | 71,871 | ||||||
|
|
|
| |||||
Net Increase in Shares Outstanding | 6,232 | 162,479 | ||||||
|
|
|
| |||||
7. INVESTMENT TRANSACTIONS:
For the six months ended June 30, 2022, the purchases and sales of investment securities other than long-term U.S. Government and short-term investments were $2,388,818 and $2,148,142, respectively. There were no purchases or sales of long-term U.S. Government securities.
8. FEDERAL TAX INFORMATION:
The amount and character of income and capital gain distributions, if any, to be paid, are determined in accordance with Federal income tax regulations, which may differ from U.S. GAAP. As a result, net investment income (loss) and net realized gain (loss) on investment transactions for a reporting period may differ significantly from distributions during such period. These book/tax differences may be temporary or permanent. To the extent these differences are permanent in nature, they are charged or credited to distributable earnings or paid-in capital, as appropriate, in the period that the differences arise.
| 17 | CHAMPLAIN INVESTMENT | PARTNERS | ||
| THE ADVISORS’ INNER CIRCLE FUND II | CHAMPLAIN | |
| EMERGING | ||
| MARKETS FUND | ||
| JUNE 30, 2022 |
The tax character of dividends and distributions declared during the fiscal year ended December 31, 2021, period ended December 31, 2020 and fiscal year ended July 31, 2020 were as follows:
| Ordinary Income | Long-Term Capital Gain | Return of Capital | Total | |||||||||||||
Emerging Markets Fund |
| |||||||||||||||
2021 | $— | $1,131,495 | $— | $1,131,495 | ||||||||||||
2020(1) | — | — | — | — | ||||||||||||
2020 | 35,940 | — | — | 35,940 | ||||||||||||
(1) For the period August 1, 2020 to December 31, 2020. Effective August 19, 2020, the Fund changed its fiscal year end to December 31 (see Note 1 in the Notes to Financials).
For tax purposes, short term gains are considered ordinary income.
As of December 31, 2021, the components of Distributable Earnings on a tax basis were as follows:
| Emerging Markets Fund | ||||
Undistributed Long-Term Capital Gain | $ | 53,686 | ||
Unrealized Appreciation | 1,587,782 | |||
Other Temporary Differences | 4 | |||
|
| |||
Total Distributable Earnings | $ | 1,641,472 | ||
|
| |||
During the year ended December 31, 2021, the Fund utilized $22,834 in capital loss carryforwards to offset capital gains.
For Federal income tax purposes, the cost of securities owned at December 31, 2021 and net realized gains or losses on securities sold for the period were different from the amounts reported for financial reporting purposes. These differences were primarily due to wash sales, which cannot be used for Federal income tax purposes in the current period and have been deferred for use in future years.
The Federal tax cost and aggregate gross unrealized appreciation and depreciation on investments held by the Fund June 30, 2022 were as follows:
| Federal Tax Cost | Aggregate Gross Unrealized Appreciation | Aggregate Gross Unrealized Depreciation | Net Unrealized Depreciation | |||||||||||||
Emerging Markets Fund | $ | 7,199,659 | $ | 604,865 | $ | (1,252,338) | $ | (647,473) | ||||||||
| 18 | CHAMPLAIN INVESTMENT | PARTNERS | ||
| THE ADVISORS’ INNER CIRCLE FUND II | CHAMPLAIN | |
| EMERGING | ||
| MARKETS FUND | ||
| JUNE 30, 2022 |
9. CONCENTRATION OF RISKS:
As with investing in all mutual funds, investing in the Fund involves risk, and there is no guarantee that the Fund will achieve its investment goals. You could lose money on your investment in a Fund, just as you could with other investments. As described in the Fund’s Prospectus, the Fund is subject to the following risks noted below, any of which may adversely affect the Fund’s net asset value and ability to meet its investment objective:
MARKET RISK – The prices of and the income generated by the Fund’s securities may decline in response to, among other things, investor sentiment, general economic and market conditions, regional or global instability, and currency and interest rate fluctuations. In addition, the impact of any epidemic, pandemic or natural disaster, or widespread fear that such events may occur, could negatively affect the global economy, as well as the economies of individual countries, the financial performance of individual companies and sectors, and the markets in general in significant and unforeseen ways. Any such impact could adversely affect the prices and liquidity of the securities and other instruments in which the Fund invests, which in turn could negatively impact the Fund’s performance and cause losses on your investment in the Fund.
ACTIVE MANAGEMENT RISK – The Fund is subject to the risk that the Adviser’s judgments about the attractiveness, value, or potential appreciation of the Fund’s investments may prove to be incorrect. If the investments selected and strategies employed by the Fund fail to produce the intended results, the Fund could underperform in comparison to other funds with similar objectives and investment strategies.
EQUITY RISK – Since it purchases equity securities, the Fund is subject to the risk that stock prices will fall over short or extended periods of time. Historically, the equity markets have moved in cycles, and the value of the Fund’s equity securities may fluctuate drastically from day to day. Individual companies may report poor results or be negatively affected by industry and/or economic trends and developments. The prices of securities issued by such companies may suffer a decline in response. These factors contribute to price volatility, which is the principal risk of investing in the Fund.
SMALL-CAPITALIZATION COMPANY RISK – The Fund is also subject to the risk that small-capitalization stocks may underperform other segments of the equity market or the equity market as a whole. The small-capitalization companies that the Fund invests in may be more vulnerable to adverse business or economic events than larger, more established companies. In particular, investments in these small-sized companies may pose additional risks, including liquidity risk, because these companies tend to have limited product lines, markets and financial resources, and may depend upon a relatively small management group. Therefore,
| 19 | CHAMPLAIN INVESTMENT | PARTNERS | ||
| THE ADVISORS’ INNER CIRCLE FUND II | CHAMPLAIN | |
| EMERGING | ||
| MARKETS FUND | ||
| JUNE 30, 2022 |
small-cap stocks may be more volatile than those of larger companies. These securities may be traded over-the-counter or listed on an exchange.
MID-CAPITALIZATION COMPANY RISK – The Fund is also subject to the risk that medium-capitalization stocks may underperform other segments of the equity market or the equity market as a whole. The medium-sized companies the Fund invests in may be more vulnerable to adverse business or economic events than larger, more established companies. In particular, investments in these medium-sized companies may pose additional risks, including liquidity risk, because these companies tend to have limited product lines, markets and financial resources, and may depend upon a relatively small management group. Therefore, mid-capitalization stocks may be more volatile than those of larger companies. These securities may be traded over-the-counter or listed on an exchange.
LARGE-CAPITALIZATION COMPANY RISK – The large capitalization companies in which the Fund invests may not respond as quickly as smaller companies to competitive challenges, and their growth rates may lag the growth rates of well-managed smaller companies during strong economic periods.
FOREIGN COMPANY RISK – Investing in foreign companies, including direct investments and through American Depositary Receipts (“ADRs”), which are traded on U.S. exchanges and represent an ownership in a foreign security, poses additional risks since political and economic events unique to a country or region will affect those markets and their issuers. These risks will not necessarily affect the U.S. economy or similar issuers located in the United States. In addition, investments in foreign companies generally are denominated in a foreign currency. Securities of foreign companies may not be registered with the SEC and foreign companies are generally not subject to the regulatory controls imposed on U.S. issuers and, as a consequence, there is generally less publically available information about foreign securities than is available about domestic securities. Income from foreign securities owned by the Fund may be reduced by a withholding tax at the source, which tax would reduce income received from the securities comprising the portfolio. The Fund may also be subject to taxes on trading profits or on transfers of securities in some countries. Foreign securities may also be more difficult to value than securities of U.S. issuers. While ADRs provide an alternative to directly purchasing the underlying foreign securities in their respective national markets and currencies, investments in ADRs continue to be subject to many of the risks associated with investing directly in foreign securities.
EMERGING MARKETS RISK – Many of the risks with respect to foreign investments are more pronounced for investments in issuers in emerging market countries. Emerging market countries tend to have fewer government exchange controls, more volatile interest and currency exchange rates, less market regulation, and less developed economic, political and
| 20 | CHAMPLAIN INVESTMENT | PARTNERS | ||
| THE ADVISORS’ INNER CIRCLE FUND II | CHAMPLAIN | |
| EMERGING | ||
| MARKETS FUND | ||
| JUNE 30, 2022 |
legal systems than do more developed countries. In addition, emerging market countries may experience high levels of inflation and may have less liquid securities markets and less efficient trading and settlement systems.
As a consequence, issuers in emerging market countries may be susceptible to increased political or social instability, economies based on only a few industries, unstable currencies, runaway inflation, highly volatile securities markets, unpredictable shifts in policies relating to foreign investments, lack of protection for investors against parties that fail to complete transactions, and the potential for government seizure of assets or nationalization of companies. Changes in the price of oil have a direct and significant effect on the economies of Gulf countries such as Bahrain, Kuwait, Oman, Qatar, and the UAE, i.e., if the price of oil increases, these countries benefit, and if the price of oil declines, these countries would be adversely affected.
FOREIGN CURRENCY RISK – As a result of the Fund’s investments in securities or other investments denominated in, and/or receiving revenues in, foreign currencies, the Fund will be subject to currency risk. Currency risk is the risk that foreign currencies will decline in value relative to the U.S. dollar, in which case, the dollar value of an investment in the Fund would be adversely affected. These currency movements may occur separately from, and in response to, events that do not otherwise affect the value of the security in the issuer’s home country.
EXCHANGE-TRADED FUNDS RISK – ETFs are pooled investment vehicles whose shares are listed and traded on U.S. stock exchanges. To the extent the Fund invests in ETFs, the Fund will be subject to substantially the same risks as those associated with the direct ownership of the securities held by such ETFs. As a shareholder of an ETF, the Fund relies on that ETF to achieve its investment objective. If the ETF fails to achieve its objective, the value of the Fund’s investment could decline, which could adversely affect the Fund’s performance. By investing in an ETF, Fund shareholders indirectly bear the Fund’s proportionate share of the fees and expenses of the ETF, in addition to the fees and expenses that Fund shareholders directly bear in connection with the Fund’s own operations. the shares of certain ETFs may trade at a premium or discount to their intrinsic value (i.e., the market value may differ from the net asset value of an ETF’s shares). For example, supply and demand for shares of an ETF or market disruptions may cause the market price of the ETF to deviate from the value of the ETF’s investments, which may be emphasized in less liquid markets.
Inverse ETFs seek to provide investment results that match a negative multiple of the performance of an underlying index. To the extent that the Fund invests in Inverse ETFs, the Fund will indirectly be subject to the risk that the performance of such ETF will fall as the performance of that ETF’s benchmark rises. Inverse ETFs often “reset” daily, meaning that
| 21 | CHAMPLAIN INVESTMENT | PARTNERS | ||
| THE ADVISORS’ INNER CIRCLE FUND II | CHAMPLAIN | |
| EMERGING | ||
| MARKETS FUND | ||
| JUNE 30, 2022 |
they are designed to achieve their stated objectives on a daily basis. Due to the effect of compounding, their performance over longer periods of time can differ significantly from the inverse of the performance of their underlying index or benchmark during the same period of time. These investment vehicles may be extremely volatile.
NON-DIVERSIFIED FUND RISK – The Fund is non-diversified, meaning that it may invest a large percentage of its assets in a single issuer or a relatively small number of issuers. Because the Fund is non-diversified, it may be more susceptible to a single adverse economic or political occurrence affecting one or more of the issuers, and may experience increased volatility due to its investments in those securities.
PORTFOLIO TURNOVER RISK – The Fund is subject to portfolio turnover risk since it may buy and sell investments frequently. Such a strategy often involves higher expenses, including brokerage commissions, and may increase the amount of capital gains (in particular, short term gains) realized by the Fund. Shareholders may pay tax on such capital gains.
10. OTHER:
At June 30, 2022, 87% of the total shares outstanding of the Fund’s Advisor Shares were held by three shareholders and 100% of the total shares outstanding of the Fund’s Institutional Shares were held by one shareholder. These shareholders were comprised of omnibus accounts that were held on behalf of various individual shareholders.
In the normal course of business, the Fund enters into contracts that provide general indemnifications. The Fund’s maximum exposure under these arrangements is dependent on future claims that may be made against the Fund and, therefore, cannot be established; however, based on experience, the risk of loss from such claim is considered remote.
11. SUBSEQUENT EVENTS:
On August 22, 2022, the Board of Trustees of the Trust, at the recommendation of the Adviser, approved a plan of liquidation providing for the liquidation of the Fund’s assets and the distribution of the net proceeds pro rata to the Fund’s shareholders. The Fund is expected to cease operations and liquidate on or about September 23, 2022.
The Fund has been evaluated by management regarding the need for additional disclosures (other than what is disclosed in the preceding paragraph) and/or adjustments resulting from subsequent events. Based on this evaluation, no additional disclosures and/or adjustments were required to the financial statements.
| 22 | CHAMPLAIN INVESTMENT | PARTNERS | ||
| THE ADVISORS’ INNER CIRCLE FUND II | CHAMPLAIN | |
| EMERGING | ||
| MARKETS FUND | ||
| JUNE 30, 2022 |
This page is intentionally left blank
| 23 | CHAMPLAIN INVESTMENT | PARTNERS | ||
| THE ADVISORS’ INNER CIRCLE FUND II | CHAMPLAIN | |
| EMERGING | ||
| MARKETS FUND | ||
| JUNE 30, 2022 |
DISCLOSURE OF FUND EXPENSES (Unaudited)
All mutual funds have operating expenses. As a shareholder of a mutual fund, your investment is affected by these ongoing costs, which include (among others) costs for portfolio management, administrative services, and shareholder reports like this one. It is important for you to understand the impact of these costs on your investment returns.
Operating expenses such as these are deducted from the mutual fund’s gross income and directly reduce your final investment return. These expenses are expressed as a percentage of the mutual fund’s average net assets; this percentage is known as the mutual fund’s expense ratio.
The following examples use the expense ratio and are intended to help you understand the ongoing costs (in dollars) of investing in your Fund and to compare these costs with those of other mutual funds. The examples are based on an investment of $1,000 made at the beginning of the period shown and held for the entire period from January 1, 2022 to June 30, 2022.
The table on the next page illustrates your Fund’s costs in two ways:
| • | Actual Fund Return. This section helps you to estimate the actual expenses after fee waivers that your Fund incurred over the period. The “Expenses Paid During Period” column shows the actual dollar expense cost incurred by a $1,000 investment in the Fund, and the “Ending Account Value” number is derived from deducting that expense cost from the Fund’s gross investment return. You can use this information, together with the actual amount you invested in the Fund, to estimate the expenses you paid over that period. Simply divide your actual account value by $1,000 to arrive at a ratio (for example, an $8,600 account value divided by $1,000 = 8.6), then multiply that ratio by the number shown for your Fund under “Expenses Paid During Period.” |
| • | Hypothetical 5% Return. This section helps you compare your Fund’s costs with those of other mutual funds. It assumes that the Fund had an annual 5% return before expenses during the year, but that the expense ratio (Column 3) for the period is unchanged. This example is useful in making comparisons because the Securities and Exchange Commission requires all mutual funds to make this 5% calculation. You can assess your Fund’s comparative cost by comparing the hypothetical result for your Fund in the “Expenses Paid During Period” column with those that appear in the same charts in the shareholder reports for other mutual funds. |
| 24 | CHAMPLAIN INVESTMENT | PARTNERS | ||
| THE ADVISORS’ INNER CIRCLE FUND II | CHAMPLAIN FUND | |
| JUNE 30, 2022 | ||
DISCLOSURE OF FUND EXPENSES (Unaudited) (Concluded)
Note: Because the hypothetical return is set at 5% for comparison purposes — NOT your Fund’s actual return — the account values shown may not apply to your specific investment.
| Beginning Account Value 1/1/22 | Ending Account Value 6/30/22 | Annualized Expense Ratios | Expenses Paid During Period * | |||||||||||||
Emerging Markets Fund | ||||||||||||||||
Actual Fund Return | ||||||||||||||||
Advisor Shares | $ | 1,000.00 | $ | 716.30 | 1.30 | % | $ | 5.53 | ||||||||
Institutional Shares | 1,000.00 | 716.60 | 1.05 | 4.47 | ||||||||||||
Hypothetical 5% Return | ||||||||||||||||
Advisor Shares | $ | 1,000.00 | $ | 1,018.35 | 1.30 | % | $ | 6.51 | ||||||||
Institutional Shares | 1,000.00 | 1,019.59 | 1.05 | 5.26 | ||||||||||||
| * | Expenses are equal to the Fund’s annualized expense ratio multiplied by the average account value over the period, multiplied by 181/365 (to reflect one-half year period shown). |
| 25 | CHAMPLAIN INVESTMENT | PARTNERS | ||
Champlain Funds
P.O. Box 219009
Kansas City, MO 64121-9009
866-773-3238
Adviser:
Champlain Investment Partners, LLC
180 Battery Street
Burlington, VT 05401
Distributor:
SEI Investments Distribution Co.
Oaks, PA 19456
Administrator:
SEI Investments Global Funds Services
One Freedom Valley Drive
Oaks, PA 19456
Legal Counsel:
Morgan, Lewis & Bockius LLP
1701 Market Street
Philadelphia, PA 19103-2921
Independent Registered Public Accounting Firm:
Ernst & Young LLP
One Commerce Square
2005 Market Street, Suite 700
Philadelphia, PA 19103
This information must be preceded or accompanied by a current
prospectus for the Fund.
CSC-SA-002-0100
| Item 2. | Code of Ethics. |
Not applicable for semi-annual report.
| Item 3. | Audit Committee Financial Expert. |
Not applicable for semi-annual report.
| Item 4. | Principal Accountant Fees and Services. |
Not applicable for semi-annual report.
| Item 5. | Audit Committee of Listed Registrants. |
Not applicable to open-end management investment companies.
| Item 6. | Schedule of Investments. |
Schedule of Investments is included as part of the Report to Shareholders filed under Item 1 of this form.
| Item 7. | Disclosure of Proxy Voting Policies and Procedures for Closed-End Management Investment Companies. |
Not applicable to open-end management investment companies.
| Item 8. | Portfolio Managers of Closed-End Management Investment Companies. |
Not applicable to open-end management investment companies.
| Item 9. | Purchases of Equity Securities by Closed-End Management Company and Affiliated Purchasers. |
Not applicable to open-end management investment companies.
| Item 10. | Submission of Matters to a Vote of Security Holders. |
There have been no changes to the procedures by which shareholders may recommend nominees to the Registrant’s Board of Trustees during the period covered by this report.
| Item 11. | Controls and Procedures. |
(a) The Registrant’s principal executive and principal financial officers, or persons performing similar functions, have concluded that the Registrant’s disclosure controls and procedures, as defined in Rule 30a-3(c) under the Act (17 CFR § 270.30a-3(c)), as of a date within 90 days of the filing date of the report, are effective based on the evaluation of these controls and procedures required by Rule 30a-3(b) under the Act (17 CFR § 270.30a-3(b)) and Rules 13a-15(b) or 15d-15(b) under the Exchange Act, as amended (17 CFR § 240.13a-15(b) or § 240.15d-15(b)).
(b) There has been no change in the Registrant’s internal control over financial reporting (as defined in Rule 30a-3(d) under the Act (17 CFR § 270.30a-3(d)) that occurred during the period covered by this report that has materially affected, or is reasonably likely to materially affect, the Registrant’s internal control over financial reporting.
Items 12. Disclosure of Securities Lending Activities for Closed-End Management Investment Companies.
Not applicable to open-end management investment companies.
| Items 13. | Exhibits. |
(a)(1) Not applicable for semi-annual report.
SIGNATURES
Pursuant to the requirements of the Securities Exchange Act of 1934 and the Investment Company Act of 1940, the Registrant has duly caused this report to be signed on its behalf by the undersigned, thereunto duly authorized.
(Registrant) | The Advisors’ Inner Circle Fund II | |||
By (Signature and Title) | /s/ Michael Beattie | |||
Michael Beattie, President | ||||
Date: September 7, 2022 | ||||
Pursuant to the requirements of the Securities Exchange Act of 1934 and the Investment Company Act of 1940, this report has been signed below by the following persons on behalf of the Registrant and in the capacities and on the dates indicated.
By (Signature and Title) | /s/ Michael Beattie | |||
Michael Beattie, President | ||||
Date: September 7, 2022 | ||||
By (Signature and Title) | /s/ Andrew Metzger | |||
Andrew Metzger, | ||||
Treasurer, Controller, and CFO | ||||
Date: September 7, 2022 | ||||