UNITED STATES
SECURITIES AND EXCHANGE COMMISSION
Washington, D.C. 20549
FORM N-CSRS
CERTIFIED SHAREHOLDER REPORT OF REGISTERED MANAGEMENT
INVESTMENT COMPANIES
Investment Company Act File Number 811-07102
The Advisors’ Inner Circle Fund II
(Exact name of registrant as specified in charter)
SEI Investments
One Freedom Valley Drive
Oaks, PA 19456
(Address of principal executive offices) (Zip code)
SEI Investments
One Freedom Valley Drive
Oaks, PA 19456
(Name and address of agent for service)
Registrant’s telephone number, including area code: 1-877-446-3863
Date of fiscal year end: December 31, 2022
Date of reporting period: June 30, 2022
Item 1. Reports to Stockholders.
A copy of the report transmitted to stockholders pursuant to Rule 30e-1 under the Investment Company Act of 1940, as amended (the “Act”) (17 CFR § 270.30e-1), is attached hereto.
THE ADVISORS’ INNER CIRCLE FUND II
CHAMPLAIN SMALL COMPANY FUND
CHAMPLAIN MID CAP FUND
SEMI-ANNUAL REPORT
06.30.22
INVESTMENT ADVISER:
CHAMPLAIN INVESTMENT PARTNERS, LLC
| THE ADVISORS’ INNER CIRCLE FUND II | CHAMPLAIN FUNDS | |
| JUNE 30, 2022 | ||
| Table of Contents | ||||
| 1 | ||||
| 16 | ||||
| 18 | ||||
| 26 | ||||
| 27 | ||||
| 28 | ||||
| 30 | ||||
| 34 | ||||
| 46 | ||||
The Funds file their complete schedules of investments with the Securities and Exchange Commission (“SEC”) for the first and third quarters of each fiscal year as an exhibit to its reports on Form N-PORT (Form N-Q for filings prior to March 31, 2020). The Funds’ Forms N-Q and Form N-PORT reports are available on the SEC’s website at http://www.sec.gov, and may be reviewed and copied at the SEC’s Public Reference Room in Washington, DC. Information on the operation of the Public Reference Room may be obtained by calling 1-800-SEC-0330.
A description of the policies and procedures that the Funds use to determine how to vote proxies relating to fund securities, as well as information relating to how the Funds voted proxies relating to fund securities during the most recent 12-month period ended June 30, is available (i) without charge, upon request, by calling 1-866-773-3238; and (ii) on the SEC’s website at http://www.sec.gov.
| CHAMPLAIN INVESTMENT | PARTNERS | |||
THE ADVISORS’ INNER CIRCLE FUND II | CHAMPLAIN SMALL COMPANY FUND & | |
| CHAMPLAIN MID CAP FUND | ||
| SHAREHOLDERS’ LETTER | ||
| (Unaudited) |
Dear Fellow Shareholders,
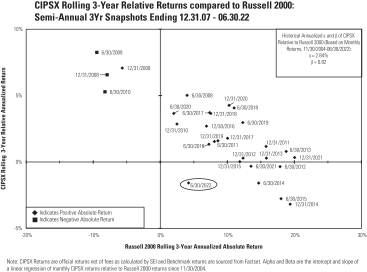
Please find below the recent and long-term performance of the Advisor Shares for both the Champlain Small Company Fund (CIPSX) and the Champlain Mid Cap Fund (CIPMX).
Performance for the periods ending June 30, 2022
| Since Fund’s Inception† | ||||||||||||||
| 6 months | 1-year | 3-year * | 5-year * | 10-year * | Cumulative** | Annualized | ||||||||
CIPSX | -26.26% | -24.36% | 2.65% | 5.56% | 9.86% | 371.24% | 9.21% | |||||||
Russell 2000 | -23.43% | -25.20% | 4.21% | 5.16% | 9.35% | 240.65% | 7.22% | |||||||
CIPMX | -28.34% | -21.54% | 6.75% | 10.19% | 12.73% | 327.37% | 10.93% | |||||||
Russell Midcap | -21.57% | -17.30% | 6.59% | 7.96% | 11.28% | 245.88% | 9.26% | |||||||
| † | Champlain Small Company Fund inception date: 11/30/04 |
Champlain Mid Cap Fund inception date: 06/30/08 |
| * | Return has been annualized. |
| ** | Return is cumulative and has not been annualized. |
The performance data quoted represents past performance. Past performance does not guarantee future results. The investment return and principal value of an investment will fluctuate so that an investor’s shares, when redeemed, may be worth more or less than their original cost, and current performance may be higher or lower than the performance quoted. For performance data current to the most recent month end, please call 1.866.773.3238.
During the past six months, both funds lagged noticeably on a relative basis and were weak on an absolute basis. Our investment process bias for reliable, growing (relevant), and relatively higher-return businesses combined with the opportunity set presented by the market has led us to be somewhat more exposed to longer-duration cash flows in both funds. This posture was unhelpful during the initial rate-driven multiple compression drawdown which began last November, particularly in the health care and technology sectors, as shares with higher free cash flow yields suffered less selling pressure than shares with lower free cash flow yields – seemingly without much regard to the discount to intrinsic or Fair Value. While we have always expected to add noticeable value every 3-year period and add compelling value every 5 years; our failure to meet these expectations certainly is disappointing. While our process exclusions have not aided relative performance in either fund as much as we would have expected during the market’s pullback since November of
| 1 | CHAMPLAIN INVESTMENT | PARTNERS | ||
THE ADVISORS’ INNER CIRCLE FUND II | CHAMPLAIN SMALL COMPANY FUND & | |
| CHAMPLAIN MID CAP FUND | ||
| SHAREHOLDERS’ LETTER | ||
| (Unaudited) |
last year, and the magnitude of distortions flowing through the economy and capital markets might also be a factor, a handful of mistakes (mostly within the Small Company Fund) and some large positions (both funds) have been relatively painful over the past 3 and 5-year periods. However, we have not demonstrated exceptionally poor execution of our investment process for either fund as measured by the magnitude of our realized losses. Whether measured against our history or relative to the historical capital destruction of our holdings, the realized losses for either fund do not seem unreasonable.
| 2 | CHAMPLAIN INVESTMENT | PARTNERS | ||
THE ADVISORS’ INNER CIRCLE FUND II | CHAMPLAIN SMALL COMPANY FUND & | |
| CHAMPLAIN MID CAP FUND | ||
| SHAREHOLDERS’ LETTER | ||
| (Unaudited) |

While both Funds remain somewhat more expensive than their primary benchmarks based on the trailing twelve-month free cash flow yield, the obvious advantage both funds have over their benchmarks for Gross Margins, Gross Profitability, and Sales/Share growth suggests to us that they remain attractive relative values. Importantly, with respect to governance, the holdings in both funds have demonstrated relatively much better capital efficiency with respect to acquisitions as measured by our capital destruction study which looks at goodwill impairments as a percentage of recent acquisition spending.
TECHNOLOGY
The Small Company Fund’s technology holdings underperformed the technology sector of both the Russell 2000 and S&P SmallCap 600 benchmarks over the past six months. Recent underperformance was primarily due to stock selection in software. The largest detractors were New Relic, Q2 Holdings, and Workiva.
New Relic announced strong fiscal third quarter results, demonstrating topline acceleration and positive underlying business trends. However, the company’s outlook for its fourth fiscal quarter was disappointing, failing to meet the market’s expectations for revenue growth and margin improvements. As a result, the stock traded off significantly on the news and has since rebounded somewhat after Jana Partners took an equity stake and played a key role in adding several new executives to the Board.
| 3 | CHAMPLAIN INVESTMENT | PARTNERS | ||
THE ADVISORS’ INNER CIRCLE FUND II | CHAMPLAIN SMALL COMPANY FUND & | |
| CHAMPLAIN MID CAP FUND | ||
| SHAREHOLDERS’ LETTER | ||
| (Unaudited) |
Q2 and Workiva continue to execute well, and we remain optimistic about their opportunity and competitive advantages. Nonetheless, macroeconomic conditions, European exposure, and diminished IPO activity weighed on Workiva, while the market remains impatient with the pace of Q2’s sales pipeline re-build following a sluggish 2021. Interestingly, Q2 was said to have received take-over interest during the period, though talks ended without a deal.
We sold our position in Cerence at a loss as the company suffers from prolonged headwinds due to supply chain constraints affecting its end markets. In addition, after the sudden and unexpected departure of the company’s CEO in December 2021, it faces significant transition issues. Upon reflection, we gave too much credit to the incoming leadership to manage the transition, navigate the adverse macro environment, and execute the company’s corporate strategy.
We exited our position in SailPoint due to its pending acquisition by private equity firm Thoma Bravo. We also sold out of our positions in Yext and Sumo Logic. Yext experienced ongoing headwinds from COVID-19, leadership changes, and new products that struggled to find the right audience. Our patience with this holding as they worked through these issues was a mistake. Though Sumo Logic has managed its business well, and significantly upgraded its executive ranks, the broader sell-off in technology stocks yielded attractive discounts in many other high-quality companies. We redeployed the capital from these sales to higher conviction opportunities in the portfolio, including Workiva and Blackline. We also redirected some of this capital to initiate a position in Freshworks, a leading software provider in IT Service Management (ITSM) and Customer Service Automation.
The Mid Cap Fund’s technology holdings underperformed the technology sector of both benchmarks over the past six months. Recent underperformance was primarily due to stock selection in software, notably our position in Asana. We believe the company has a significant opportunity in the workflow management market, and we appreciate the strategy of investing to maintain, if not widen, its dominant platform position. Despite strong execution and positive customer trends, Asana has experienced multiple contraction, even more pronounced than the broad software industry. We remain sensitive to valuation and have managed our position size accordingly.
Shares of Nutanix and Zendesk have also been weak. Supply chain delays amongst some of Nutanix’s hardware partners and elevated sales force turnover resulted in the company issuing conservative forward guidance in its most recent quarter. Though unexpected and noteworthy, these are not thesis altering developments. While the business of Zendesk has continued to perform ahead of expectations, the stock has been burdened by a series of managerial missteps and communication errors. This began in earnest with the proposed, contested, and ultimately scuttled acquisition of Momentive (MNTV). That was followed by
| 4 | CHAMPLAIN INVESTMENT | PARTNERS | ||
THE ADVISORS’ INNER CIRCLE FUND II | CHAMPLAIN SMALL COMPANY FUND & | |
| CHAMPLAIN MID CAP FUND | ||
| SHAREHOLDERS’ LETTER | ||
| (Unaudited) |
an announcement that it had been unsuccessful in its efforts to entice strategic buyers and/or financial sponsors to the table to discuss possible alternatives to its listing as a public company. These serial failures led to an elevated and public disagreement with one of the company’s largest shareholders about the oversight and management of this business. In the end Zendesk agreed to be acquired by an investor group led by Hellman & Friedman and Permira for $10.2 billion. This was a disappointing outcome. Zendesk is a unique and strategic property that had been ill served by its management and board over the course of this saga.
We exited the position in Anaplan which was acquired by private equity firm Thoma Bravo. Despite continued execution against its business plan, we traded out of the position in Smartsheet to consolidate capital into higher conviction holdings.
We initiated a position in Palantir. The company’s platform makes it easy for organizations to integrate data, define relationships between the data, and let business users analyze and find patterns in previously siloed data (ERP, CRM, finance, manufacturing, supply chain, etc.) through a single interface.
Though recent performance might suggest otherwise, our holdings possess enviable financial characteristics, dynamic growth prospects, and significant opportunity to demonstrate operating leverage. We are, however, keenly aware of the challenges each company faces when balancing investment demands to sustain/accelerate growth on the one hand and the market’s desire to see evidence of operating discipline on the other. Our holdings express that balance well.
The pandemic accelerated the adoption of many emerging categories of technology and dramatically reordered spending priorities for scores of others. Tellingly, the challenges of the past two years exposed the profound inadequacies of so many aging and re-purposed legacy products. Bridging the gap between “what was urgently needed” and “what could be done” was not handled well by the major platform providers but fell, increasingly, to an emerging class of company. There remains a significant opportunity for these companies and many of these funds’ holdings to establish themselves as category leaders and dominant franchises, particularly as enterprises remain focused on cyber security and doing more with less.
INDUSTRIALS and MATERIALS
The Small Company Fund’s industrial holdings underperformed the same sector in the Russell 2000 and S&P SmallCap 600, while the materials holdings outperformed the Russell 2000, and narrowly underperformed the S&P SmallCap 600. Within industrials, positive stock selection in commercial services and supplies was offset by weak stock selection in machinery.
| 5 | CHAMPLAIN INVESTMENT | PARTNERS | ||
THE ADVISORS’ INNER CIRCLE FUND II | CHAMPLAIN SMALL COMPANY FUND & | |
| CHAMPLAIN MID CAP FUND | ||
| SHAREHOLDERS’ LETTER | ||
| (Unaudited) |
Shares of food and beverage processing equipment maker John Bean Technologies declined 28% over the first six months of the year, and this top ten position was a material detractor to strategy returns. The company was acutely impacted early in the year by increased absenteeism due to Omicron, elevated freight costs, and a lack of component availability, though there have been signs of improvement as the year has progressed. We remain confident in our long-term investment thesis, which was strengthened by the company’s recent announcement that it is seeking strategic alternatives for its AeroTech division (25% of total company sales), to pursue a pure play FoodTech strategy. On the opposite end of the spectrum, shares of Ritchie Bros. Auctioneers are up 7% since the start of the year, the second largest contributor to returns year-to-date, and this strong relative performance has propelled the holding into the top ten. The company posted strong earnings in May, announced the completion of the search for a new CFO, and hosted an analyst day offering timely updates on the company’s ongoing transition to become the trusted global marketplace for insights, services, and transaction solutions for commercial assets. We appreciate the inherently counter-cyclical nature of Ritchie’s business model.
During the first quarter, we re-initiated a new position in Novanta, a leading global supplier of critical components and subsystems to customers in the advanced industrial and medical end markets. Given our familiarity with the holding, we moved quickly to build this position at a wide discount to our estimate of Fair Value. We view Novanta as a diversified “portfolio manager” with exposure to attractive, less cyclical end markets, such as medical, which makes up over half the company’s sales. We initiated a new position in Hayward Holdings during the second quarter. Hayward is a full-line pool equipment pure play, with 30% market share in North America. Our enthusiasm is supported by the fact that 78% of Hayward’s sales are recurring, with energy efficiency tailwinds and category trends around IoT-enablement serving to mitigate cyclicality in the business.
We exited our position in Gibraltar Industries, a holding we initiated in the first quarter 2021. Gibraltar’s solar racking business has struggled over the last year as supply chain challenges and U.S. regulatory interference have resulted in panel shortages, plaguing the industry. While these challenges may prove transitory, there remains a good amount of uncertainty around the timing of resolution. We also sold the final few basis points of our position in Chase Corporation given the competition for capital.
The Mid Cap Fund’s industrial and materials holdings underperformed the same sectors in the Russell Midcap and S&P MidCap 400 over the first half of the year. Weak stock selection in electrical equipment and professional services weighed on performance, partially offset by the lack of exposure to the building products sector.
| 6 | CHAMPLAIN INVESTMENT | PARTNERS | ||
THE ADVISORS’ INNER CIRCLE FUND II | CHAMPLAIN SMALL COMPANY FUND & | |
| CHAMPLAIN MID CAP FUND | ||
| SHAREHOLDERS’ LETTER | ||
| (Unaudited) |
Rockwell shares are down 42% since the start of the year, hampered by fiscal second quarter results that came in below management and consensus expectations, as electronic component availability (semiconductors) limited the company’s ability to ship product, forcing management to trim full year guidance. That said, order growth has been strong with low cancellation rates (~1% of orders over the last 18 months), which has led to a swelling backlog. Rockwell instituted resiliency actions to ensure chip supply and expects improved material flow from key suppliers over the coming quarters. We remain confident in the company’s longer-term trajectory and have added to the position since the start of the year. Generac was a top-five detractor to the Mid Cap Fund’s returns on a trailing six-month basis. Shares of the company have fallen 40% this year, and we capitalized on this opportunity to increase our position. While we attribute much of the share performance to overall market conditions, we are not ignoring concerns that demand for Generac’s home standby generators may wane in 2023 once the historically large backlog is worked down. We believe Generac has several levers to continue its long-term growth trajectory and we take comfort in the strong earnings and cashflow generation and >20% annualized ROIC over the last decade. We also added to other high conviction holdings IDEX Corporation and Graco during this period.
Given competition for capital within our industrials holdings, we exited the position in Clarivate. The increasing integration and execution risk after deploying roughly $13 billion on acquisitions in the last two years presents noticeably more risk than other holdings. Also, the uptick in organic growth that was expected remains unproven while leverage remains elevated. This decision to sell Clarivate was consistent with our historical pattern of high grading during major stock market corrections present more compelling opportunities. Similarly, we significantly reduced our stake in Terminix, with plans to exit the position shortly, which we deem the best course of action given progress towards the pending acquisition by UK-based Rentokil.
Valuations for our industrials are compelling, and our process favors conservatively levered companies with relatively low exposure to highly cyclical industries. The industrials in both funds also are less capital, labor, and resource intensive than the average industrial in their benchmarks. These funds’ industrials’ end market exposures also are relatively more skewed toward non-industrial opportunities.
CONSUMER
The Small Company Fund’s consumer holdings (including the position in John Wiley, classified under communication services) delivered positive relative returns compared to both the Russell 2000 and S&P SmallCap 600 benchmarks during the period. The process-driven overweight of consumer staples and underweight of consumer discretionary more than offset weak stock selection in both sectors.
| 7 | CHAMPLAIN INVESTMENT | PARTNERS | ||
THE ADVISORS’ INNER CIRCLE FUND II | CHAMPLAIN SMALL COMPANY FUND & | |
| CHAMPLAIN MID CAP FUND | ||
| SHAREHOLDERS’ LETTER | ||
| (Unaudited) |
Significant distortions in the economy have created market volatility that has increased investor interest in owning the stability of consumer staples. Further, staples’ unit volumes have held up relatively well so far, despite unprecedented levels of cost inflation-induced price increases across the sector. We believe the fund’s staples holdings, made up of strong brands in attractive categories, have better-than-average pricing power which should help them preserve market share and margin over the long-term. MGP Ingredients, Hostess Brands, and Simply Good Foods were top contributors in the period, and we trimmed these holdings to fund more attractive discounts elsewhere.
We started two new positions during the period: Leslie’s and Freshpet, both also held in the Mid Cap fund. We previously owned Freshpet in Small Cap from February 2019 to January 2021, when we exited at much higher prices and above our estimate of Fair Value. Freshpet is capitalizing on the consumer trend of pet owners prioritizing the health of their pets and subsequently, the quality of their pets’ food. Shares have been pressured recently due to supply chain volatility, capital structure changes, and general investor malaise towards scaling, high-growth businesses. However, we remain optimistic that the long-term opportunity is compelling given the brand’s leadership and first-mover advantage in the accelerating fresh, refrigerated pet food category. Leslie’s is the largest and only national-scale pool and spa care retailer. With leading market share in this highly fragmented and non-discretionary industry, we believe Leslie’s has a compelling long-term opportunity to grow and gain share. We are especially drawn to the company’s consistency, as approximately 80% of sales are non-discretionary, which has fueled 58 consecutive years of sales growth. Additionally, recent macro tailwinds of heightened levels of new pool builds during the pandemic has ushered in an influx of new pool owners who will need to service their pools for decades to come.
In 2021 and early 2022, we were encouraged by the breadth of new opportunities emerging in small cap consumer, which led us to start small positions in The Honest Company, Zevia, and European Wax Center. As the year has progressed, distortions across the market have not only put high-quality businesses on sale, but also illuminated those whose prospects may not be as compelling in an uncertain environment. Given this thinking, we exited the position in The Honest Company as several challenges to their business emerged and we believe there to be higher quality opportunities available elsewhere. We continue to believe the experience of the management team and early indications of brand strength are reasons enough to continue to hold a small amount of weight in Zevia. Meanwhile, we added to the position in European Wax Center as results continue to outperform expectations and the pipeline for franchised unit growth remains robust.
| 8 | CHAMPLAIN INVESTMENT | PARTNERS | ||
THE ADVISORS’ INNER CIRCLE FUND II | CHAMPLAIN SMALL COMPANY FUND & | |
| CHAMPLAIN MID CAP FUND | ||
| SHAREHOLDERS’ LETTER | ||
| (Unaudited) |
While the high-growth restaurant brand, Wingstop, has struggled to find momentum in this market, we added to the position as the company is currently in an enviable position with significant room for unit growth while franchisees generate higher returns today than at any point in the chain’s history. The company already has seen significant deflation in their key commodity of bone-in chicken, a stark contrast to other restaurant players who are still facing meaningful input cost inflation.
The Mid Cap Fund delivered positive relative returns compared to both benchmarks during the period as our overweight of consumer staples, underweight of consumer discretionary, and strong stock selection in discretionary more than offset weak stock selection in staples.
Strong relative performance and narrowing discounts led us to exit the position in Hershey, as well as trim the positions in Lamb Weston, J.M. Smucker, and Hormel, to redeploy the capital into wider discounts elsewhere. Specifically, we added to the position in Freshpet, including taking advantage of the liquidity provided by an equity raise during the second quarter. We also added to Planet Fitness. The highly franchised gym-operator is seeing memberships return to pre-COVID-19 levels, and innovative marketing strategies are working effectively as the member base continues to grow and over index to younger demographics. Even in a tough economy, we would expect the company’s attractive value proposition to benefit as consumers often trade-down from higher priced competitors.
Early in the second quarter we started a new position in leading specialty retailer, Bath & Body Works, the #1 specialty home fragrance & fragrant body care brand in America. The company’s products are designed for daily use, which we believe provides a “staple-like” level of consistent demand. We expect the company’s solid fundamentals, attractive valuation, and compelling return of capital program to produce strong total shareholder returns over the long-term. The company also operates a unique supply chain that is built upon the ability to be nimble and service an extensive innovation pipeline, while also sourcing most products in the US.
FINANCIALS
The Small Company Fund’s Financial holdings delivered positive relative performance against both benchmarks during the first half of 2022 because of positive stock selection in banks and our overweight positioning in insurance.
Our banks benefitted from high-quality characteristics and strong underwriting practices in the face of rising inflation and growing concerns of a recession. Considering the relative performance amongst our holdings, and in recognition of an inverted yield curve and widening corporate credit spreads, we elected to trim several of our bank positions near our estimates of Fair Value. We added to insurance broker BRP Group in the first quarter as
| 9 | CHAMPLAIN INVESTMENT | PARTNERS | ||
THE ADVISORS’ INNER CIRCLE FUND II | CHAMPLAIN SMALL COMPANY FUND & | |
| CHAMPLAIN MID CAP FUND | ||
| SHAREHOLDERS’ LETTER | ||
| (Unaudited) |
shares pulled back significantly despite the company continuing to generate above average organic growth as well as complete an attractive acquisition that bulks up their fastest growing segment. Property and casualty insurers Argo Group and James River Group both made progress toward restoring investor confidence following underwriting issues in recently exited business lines. Despite our frustration over the past several quarters, we are encouraged by strategic actions taken by the new CEOs at each company to simplify the business models, adjust the portfolio compositions, and reduce volatility in underwriting profits. While it likely will take more time for investors to adequately appreciate these improvements, we remain enthusiastic about the long-term prospects for both companies given the strong pricing trends for most lines of commercial insurance and the likelihood of ongoing industry consolidation. During the period we added modestly to James River on price weakness. We see the ongoing portfolio diversification at Palomar as predictive of greater margin consistency and along with industry-leading growth enabling a favorable outlook that is underappreciated by many investors. Thus, we added to our position on price weakness and at an attractive discount to our estimate of Fair Value. Finally, the acquisition of Bryn Mawr Bank by WSFS Financial closed and we received shares in WSFS as part of the consideration. Having spent time getting to know the WSFS team and the business model, we think WSFS compares well with our high-quality small cap banks, and we added to the position shortly after the acquisition closed.
The Mid Cap Strategy’s Financial holdings delivered outperformance against the Russell Midcap benchmark in the first half of 2022 but lagged the S&P MidCap 400 as a result of the indexes much larger exposure to the outperforming banking sector.
During the period we benefitted from stock selection and our overweight positioning in insurance, as well as our limited exposure to the relatively weak consumer finance and capital markets industries. Insurance broker Arthur J. Gallagher and insurance underwriter Everest Re, two of our larger positions in the Mid Cap Fund, continue to benefit from strong industry pricing and delivered impressive organic growth to start the year. While we expect pricing trends to remain supportive in the near term, we trimmed Gallagher early in the second quarter as shares approached our estimate of Fair Value. Meanwhile, a flattening yield curve and widening corporate credit spreads indicate there could be economic trouble ahead. Though history would indicate that our banks can outperform their peers in this environment, the range of possible outcomes has widened recently. As such, we took the opportunity to trim Texas based Cullen/Frost Bankers near Fair Value. We added back to electronic bond trading platform Tradeweb Markets, having trimmed the position in December of last year at higher prices and near our estimate of Fair Value and started a new position in FactSet, an industry-standard financial information and data analytics/services provider. The company consolidates proprietary content and third-party databases to create a
| 10 | CHAMPLAIN INVESTMENT | PARTNERS | ||
THE ADVISORS’ INNER CIRCLE FUND II | CHAMPLAIN SMALL COMPANY FUND & | |
| CHAMPLAIN MID CAP FUND | ||
| SHAREHOLDERS’ LETTER | ||
| (Unaudited) |
subscription-based, single-source platform for financial information. Beyond research, FactSet offers analytical solutions, including portfolio analytics, risk management, performance reporting, trade execution, and order management. As FactSet consolidates its leadership position, the business is set to benefit from greater entry barriers, more attractive delivery modalities in the cloud, and improved monetization of the existing customer-base.
HEALTH CARE
During this period, the health care holdings in the Small Company Fund underperformed both benchmarks due to stock selection in equipment and supplies holdings. The performance relative to the Russell 2000 was less negative due to the sector factor exclusion of binary outcome biotechnology companies.
Penumbra and Outset Medical were the largest detractors in the sector during the period as shares of both declined materially in sympathy with other higher growth, early-stage companies as investors adjusted to a rising rate environment. Outset Medical made an announcement in June that the company had placed a shipment hold on its Tablo dialysis system for use in the home setting until the FDA approves its most recent 510k submission that put further pressure on shares. Based on statements from the company, the regulatory submission is expected to be approved in short order and we are confident that our investment thesis remains intact. We used weakness in shares of Penumbra to add to our position as we expect the company’s future results to benefit from recent and upcoming product launches and management’s plan to end the year profitable.
During the period we exited STERIS Plc for market capitalization reasons and the positions in Avanos Medical, Envista Holdings, Prestige Consumer Healthcare, Tactile Systems, and Vapotherm to rebalance the capital toward higher conviction holdings also trading at meaningful discounts; in addition to Penumbra, we added to our holdings in AtriCure, Axonics and Omnicell. We also initiated a new position in Tandem Diabetes – a current Mid Cap Fund holding. Tandem is an insulin pump manufacturer benefiting from a growing diabetic patient population and an innovative pipeline of differentiated products that should drive above-market growth for years to come.
During the six-month period, the health care holdings in the Mid Cap Fund underperformed both benchmarks due to stock selection in our equipment and supplies holdings. Shares of Align Technology declined significantly year-to-date over pandemic-related fears. After reporting disappointing first quarter results in April, Align withdrew its 2022 revenue guidance due to rolling lockdowns in China and an uncertain macro environment. Notwithstanding the lack of near-term visibility, we have high conviction in the company’s leadership position in the clear aligner market and the strong, long-term growth outlook for
| 11 | CHAMPLAIN INVESTMENT | PARTNERS | ||
THE ADVISORS’ INNER CIRCLE FUND II | CHAMPLAIN SMALL COMPANY FUND & | |
| CHAMPLAIN MID CAP FUND | ||
| SHAREHOLDERS’ LETTER | ||
| (Unaudited) |
clear aligner share gains, especially within the teen orthodontic market. Given the recent share price weakness, we added slightly to our position. Shares of Tandem Diabetes Care declined materially year-to-date over worries about a competitive automated insulin delivery system from Insulet – worries we view as overblown. In May, Tandem reported strong first quarter results, and management increased its 2022 guidance. We used the weakness to add to our position.
We initiated two new positions during the period: DexCom and IDEXX Laboratories. DexCom is the market leader in Continuous Glucose Monitoring (CGM) through its elegant sensor that constantly monitors blood sugar levels and automatically transmits readings to patient’s smartphones. DexCom’s strong growth looks to be durable given the global diabetes epidemic and its best-in-class technology position. IDEXX, a franchise long-coveted by the team that historically traded at a premium to our estimate of Fair Value, is a global leader in veterinary diagnostic instruments with best-in-class accuracy and breadth of menu for in-office testing and operates over 80 reference labs for outsourced testing. We deem the company’s robust growth track record to be durable given a large global market opportunity, differentiated offering, and large direct sales force. To partially fund these new holdings, we trimmed Maravai LifeSciences and DENTSPLY SIRONA; both of which were trading as smaller discounts to our Fair Value estimates.
While some areas of health care have a short-term backlog of patients waiting to undergo (mostly elective) procedures after the recent COVID-19 case surge, we believe a continuing theme over the next few years will be patients re-engaging with the health care system who are sicker because of not visiting their doctors as regularly over the recent past. Our medical device holdings are well-positioned to continue to grow profitably as these patients re-engage with their health care providers.
CLOSING THOUGHTS
In early May, when forward looking inflation expectations broke out of their two-year range and the 10-year U.S. Treasury bond yield approached 3.25%, we raised our Risk-Free Rate (RFR) from 3.25% back to 4%. As pointed out in the sector comments above, we also moved aggressively to seize upon opportunities to upgrade both strategies’ holdings created by the stock market’s volatility. At the same time, we restricted our buys to companies whose shares presented a minimum 20% discount to our revised estimate of Fair Value.
COVID-19, and the policy responses to COVID-19, as well as geopolitics more recently, have scrambled the economy and created massive distortions. We see no clear end to a highly unpredictable environment ahead with an abundance of potential for extraordinary macro stressors and caution all of us against finding correlations and signals amongst the noise in the recent and current environments. Capital markets (including commodities and currencies),
| 12 | CHAMPLAIN INVESTMENT | PARTNERS | ||
THE ADVISORS’ INNER CIRCLE FUND II | CHAMPLAIN SMALL COMPANY FUND & | |
| CHAMPLAIN MID CAP FUND | ||
| SHAREHOLDERS’ LETTER | ||
| (Unaudited) |
supply chain, and labor issues will likely continue to challenge policy makers, companies, and investors. Thus, we have no plans to lower the risk-free rate back to 3.25% despite the sharp downturn in yields late in the 2Q.
We expect the environment and capital markets to continue to tempt investors and managers with siren songs to change one’s approach or even their philosophy. No doubt there will be some investors who successfully navigate this environment with deft trading and style shifts, but that will not be us. We will not change our investment approach, and we have not changed the complexion of your funds. We trust our investment process and how the investment team evaluates businesses and management and estimates Fair Value. Furthermore, history argues for having a very long-term investment horizon for an exceptional business if the valuation for that company does not become excessive. Indeed, this explains our limited turnover in recent years and our unwillingness to chase the recent relative strength in industries historically challenged by one or more of the following traits: capital intensity, labor intensity, resource intensity, historically low returns, and highly cyclical demand.
Though we are concerned about global economic growth and more concerned about geopolitics, sovereign debt levels, the hyper-partisan political divide in the U.S., and the unintended consequences resulting from policy decisions, we remain enthusiastic about these funds’ holdings. Importantly, we see growing potential for the current definitions of risk and non-risk assets to shift. In our minds, companies in all market cap ranges that make essential and problem-solving products, demonstrate an ability to take price at least commensurate with cost increases, allocate capital efficiently, and foster healthy corporate cultures may be much less risky than those assets some have historically considered to be non-risky or less risky, especially on real basis. We appreciate how management can “adjust the sails” at a good to great company to compensate for changes in demand, interest rates, foreign exchange rates, and even geopolitical trends.
Given the unusually attractive weighted average discount to our estimate of the holdings’ Fair Value at the end of July 2022, the absolute return potential looking out over the next many years seems especially attractive and most members of the team have increased their exposure to both funds. However, we caution that the stock market has not yet provided any obvious signs of investor capitulation which an escalation of the Ukraine conflict, a US/China confrontation, a domestic or global recession, and/or a material downgrade in overall corporate earnings estimates may trigger.
| 13 | CHAMPLAIN INVESTMENT | PARTNERS | ||
THE ADVISORS’ INNER CIRCLE FUND II | CHAMPLAIN SMALL COMPANY FUND & | |
| CHAMPLAIN MID CAP FUND | ||
| SHAREHOLDERS’ LETTER | ||
| (Unaudited) |
As always, we remain humbled by your trust and appreciative of your patience.
Sincerely yours,

Scott T. Brayman, CFA
The above commentary represents management’s assessment of the Funds and market environment at a specific point in time and should not be relied upon by the reader as research or investment advice regarding the funds or any stock in particular, nor should it be construed as a recommendation to purchase or sell a security.
Holdings are subject to change. Current and future holdings are subject to risk.
Mutual fund investing involves risk, including possible loss of principal. There can be no assurance that the Funds will achieve their stated objectives. In addition to the normal risks associated with investing, investments in smaller companies typically exhibit higher volatility. Current and future holdings are subject to risk. Diversification does not protect against market loss. A company may reduce or eliminate its dividend, causing losses to the fund.
| 14 | CHAMPLAIN INVESTMENT | PARTNERS | ||
| THE ADVISORS’ INNER CIRCLE FUND II | CHAMPLAIN FUNDS | |
DEFINITION OF THE COMPARATIVE INDICES
Beta measures the broad market’s overall volatility or risk.
Russell 2000 Index The Russell 2000 Index measures the performance of the small cap segment of the U.S. equity universe. The Russell 2000 Index is a subset of the Russell 3000 Index representing approximately 10% of the total market capitalization of that index. It includes approximately 2000 of the smallest securities based on a combination of their market cap and current index membership.
Russell Midcap Index The Russell Midcap Index measures the performance of the mid cap segment of the U.S. equity universe. The Russell Midcap Index is a subset of the Russell 1000 Index representing approximately 31% of the total market capitalization of that index. It includes approximately 800 of the smallest securities based on a combination of their market cap and current index membership.
| 15 | CHAMPLAIN INVESTMENT | PARTNERS | ||
| THE ADVISORS’ INNER CIRCLE FUND II | CHAMPLAIN | |
| SMALL COMPANY FUND | ||
| JUNE 30, 2022 | ||
| (Unaudited) |
TOP TEN COMMON STOCK HOLDINGS *
John Bean Technologies | 3.12 | % | ||
MSA Safety | 3.11 | % | ||
Pure Storage, Cl A | 2.91 | % | ||
Ritchie Bros. Auctioneers | 2.74 | % | ||
Integra LifeSciences Holdings | 2.57 | % | ||
Evoqua Water Technologies | 2.42 | % | ||
Inspire Medical Systems | 2.24 | % | ||
CONMED | 2.24 | % | ||
Lancaster Colony | 2.22 | % | ||
BlackLine | 2.16 | % |
*Percentages are based on total investments. Cash equivalents are not shown in the top ten chart.
| 16 | CHAMPLAIN INVESTMENT | PARTNERS | ||
| THE ADVISORS’ INNER CIRCLE FUND II | CHAMPLAIN | |
| MID CAP FUND | ||
| JUNE 30, 2022 | ||
| (Unaudited) |
TOP TEN COMMON STOCK HOLDINGS *
Everest Re Group | 3.42 | % | ||
Waters | 3.21 | % | ||
AMETEK | 3.10 | % | ||
Fortive | 3.08 | % | ||
Arthur J Gallagher | 2.95 | % | ||
Edwards Lifesciences | 2.92 | % | ||
Advance Auto Parts | 2.79 | % | ||
Generac Holdings | 2.73 | % | ||
IDEX | 2.36 | % | ||
STERIS PLC | 2.20 | % |
*Percentages are based on total investments. Cash equivalents are not shown in the top ten chart.
| 17 | CHAMPLAIN INVESTMENT | PARTNERS | ||
| THE ADVISORS’ INNER CIRCLE FUND II | CHAMPLAIN | |
| SMALL COMPANY FUND | ||
| JUNE 30, 2022 | ||
| (Unaudited) |
SECTOR WEIGHTINGS†:
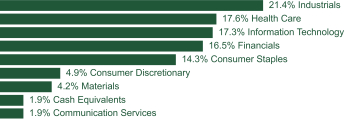
† Percentages are based on total investments.
SCHEDULE OF INVESTMENTS
| COMMON STOCK — 97.7% | ||||||||
| Shares | Value | |||||||
COMMUNICATION SERVICES — 1.9% |
| |||||||
John Wiley & Sons, Cl A | 990,000 | $ | 47,282,400 | |||||
|
|
| ||||||
CONSUMER DISCRETIONARY — 4.9% |
| |||||||
European Wax Center, Cl A | 660,000 | 11,629,200 | ||||||
Leslie’s * | 1,755,000 | 26,640,900 | ||||||
Sally Beauty Holdings * | 1,840,000 | 21,932,800 | ||||||
Shake Shack, Cl A * | 320,000 | 12,633,600 | ||||||
Wingstop | 460,000 | 34,394,200 | ||||||
Wolverine World Wide | 870,000 | 17,539,200 | ||||||
|
|
| ||||||
| 124,769,900 | ||||||||
|
|
| ||||||
CONSUMER STAPLES — 14.3% |
| |||||||
Central Garden & Pet, Cl A * | 700,000 | 28,007,000 | ||||||
elf Beauty * | 1,335,465 | 40,972,066 | ||||||
Freshpet * | 450,000 | 23,350,500 | ||||||
Hostess Brands, Cl A * | 2,390,000 | 50,691,900 | ||||||
J&J Snack Foods | 245,000 | 34,216,700 | ||||||
Lancaster Colony | 435,000 | 56,019,300 | ||||||
MGP Ingredients | 485,000 | 48,543,650 | ||||||
Simply Good Foods * | 1,235,000 | 46,645,950 | ||||||
Utz Brands, CI A | 2,250,000 | 31,095,000 | ||||||
Zevia PBC, Cl A * | 535,000 | 1,503,350 | ||||||
|
|
| ||||||
| 361,045,416 | ||||||||
|
|
| ||||||
FINANCIALS — 16.4% |
| |||||||
Argo Group International Holdings | 885,000 | 32,621,100 | ||||||
The accompanying notes are an integral part of the financial statements.
| 18 | CHAMPLAIN INVESTMENT | PARTNERS | ||
| THE ADVISORS’ INNER CIRCLE FUND II | CHAMPLAIN | |
| SMALL COMPANY FUND | ||
| JUNE 30, 2022 | ||
| (Unaudited) |
| COMMON STOCK — continued | ||||||||
| Shares | Value | |||||||
FINANCIALS — continued |
| |||||||
BRP Group, Cl A * | 1,530,000 | $ | 36,949,500 | |||||
Community Bank System | 405,000 | 25,628,400 | ||||||
CVB Financial | 1,145,000 | 28,407,450 | ||||||
German American Bancorp | 570,000 | 19,482,600 | ||||||
Independent Bank | 550,000 | 43,686,500 | ||||||
James River Group Holdings | 940,000 | 23,293,200 | ||||||
Palomar Holdings * | 400,000 | 25,760,000 | ||||||
Prosperity Bancshares | 500,000 | 34,135,000 | ||||||
Selective Insurance Group | 620,000 | 53,902,800 | ||||||
Stock Yards Bancorp | 275,000 | 16,450,500 | ||||||
UMB Financial | 570,000 | 49,077,000 | ||||||
Washington Trust Bancorp | 215,000 | 10,399,550 | ||||||
WSFS Financial | 425,000 | 17,038,250 | ||||||
|
|
| ||||||
| 416,831,850 | ||||||||
|
|
| ||||||
HEALTH CARE — 17.5% |
| |||||||
AtriCure * | 720,000 | 29,419,200 | ||||||
Axonics * | 490,000 | 27,768,300 | ||||||
Cardiovascular Systems * | 1,100,000 | 15,796,000 | ||||||
CONMED | 590,000 | 56,498,400 | ||||||
Globus Medical, Cl A * | 770,000 | 43,227,800 | ||||||
Inspire Medical Systems * | 310,000 | 56,627,700 | ||||||
Integra LifeSciences Holdings * | 1,200,000 | 64,836,000 | ||||||
Masimo * | 60,000 | 7,840,200 | ||||||
Omnicell * | 255,000 | 29,006,250 | ||||||
Outset Medical * | 755,000 | 11,219,300 | ||||||
Penumbra * | 270,000 | 33,620,400 | ||||||
Pulmonx * | 950,000 | 13,984,000 | ||||||
SI-BONE * | 805,000 | 10,626,000 | ||||||
Tandem Diabetes Care * | 445,000 | 26,339,550 | ||||||
Veracyte * | 865,000 | 17,213,500 | ||||||
|
|
| ||||||
| 444,022,600 | ||||||||
|
|
| ||||||
INDUSTRIALS — 21.3% |
| |||||||
Albany International, Cl A | 220,000 | 17,333,800 | ||||||
Altra Industrial Motion | 960,000 | 33,840,000 | ||||||
Barnes Group | 1,135,000 | 35,343,900 | ||||||
CSW Industrials | 325,000 | 33,484,750 | ||||||
ESCO Technologies | 540,000 | 36,919,800 | ||||||
Evoqua Water Technologies * | 1,885,000 | 61,281,350 | ||||||
The accompanying notes are an integral part of the financial statements.
| 19 | CHAMPLAIN INVESTMENT | PARTNERS | ||
| THE ADVISORS’ INNER CIRCLE FUND II | CHAMPLAIN | |
| SMALL COMPANY FUND | ||
| JUNE 30, 2022 | ||
| (Unaudited) |
| COMMON STOCK — continued | ||||||||
| Shares | Value | |||||||
INDUSTRIALS — continued |
| |||||||
Hayward Holdings * | 970,000 | $ | 13,958,300 | |||||
John Bean Technologies | 715,000 | 78,950,300 | ||||||
Montrose Environmental Group * | 560,000 | 18,905,600 | ||||||
MSA Safety | 650,000 | 78,695,500 | ||||||
RBC Bearings * | 165,000 | 30,516,750 | ||||||
Ritchie Bros. Auctioneers | 1,065,000 | 69,288,900 | ||||||
Standex International | 270,000 | 22,890,600 | ||||||
Transcat * | 175,000 | 9,941,750 | ||||||
|
|
| ||||||
| 541,351,300 | ||||||||
|
|
| ||||||
INFORMATION TECHNOLOGY — 17.2% |
| |||||||
Asana, Cl A * | 615,000 | 10,811,700 | ||||||
Blackbaud * | 445,000 | 25,841,150 | ||||||
BlackLine * | 820,000 | 54,612,000 | ||||||
Envestnet * | 400,000 | 21,108,000 | ||||||
Freshworks, Cl A * | 2,465,000 | 32,414,750 | ||||||
New Relic * | 1,085,000 | 54,304,250 | ||||||
Novanta * | 300,000 | 36,381,000 | ||||||
Pure Storage, Cl A * | 2,860,000 | 73,530,600 | ||||||
Q2 Holdings * | 1,110,000 | 42,812,700 | ||||||
Tenable Holdings * | 950,000 | 43,139,500 | ||||||
Workiva, Cl A * | 625,000 | 41,243,750 | ||||||
|
|
| ||||||
| 436,199,400 | ||||||||
|
|
| ||||||
MATERIALS — 4.2% |
| |||||||
Innospec | 405,000 | 38,794,950 | ||||||
Sensient Technologies | 355,000 | 28,598,800 | ||||||
TriMas | 1,415,000 | 39,181,350 | ||||||
|
|
| ||||||
| 106,575,100 | ||||||||
|
|
| ||||||
TOTAL COMMON STOCK | 2,478,077,966 | |||||||
|
|
| ||||||
| CASH EQUIVALENTS** — 1.9% | ||||||||
Fidelity Investments - Money Market Treasury Only Portfolio, Cl I, 0.094% | 20,000,000 | 20,000,000 | ||||||
The accompanying notes are an integral part of the financial statements.
| 20 | CHAMPLAIN INVESTMENT | PARTNERS | ||
| THE ADVISORS’ INNER CIRCLE FUND II | CHAMPLAIN | |
| SMALL COMPANY FUND | ||
| JUNE 30, 2022 | ||
| (Unaudited) |
| CASH EQUIVALENTS** — continued | ||||||||
| Shares | Value | |||||||
Goldman Sachs Square Treasury Instruments Fund, Institutional Shares, 1.110% | 29,265,000 | $ | 29,265,000 | |||||
|
|
| ||||||
TOTAL CASH EQUIVALENTS | 49,265,000 | |||||||
|
|
| ||||||
TOTAL INVESTMENTS — 99.6% | $ | 2,527,342,966 | ||||||
|
|
| ||||||
Percentages are based on Net Assets of $2,536,656,688.
* Non-income producing security.
** Rate reported is the 7-day effective yield as of June 30, 2022.
Cl — Class
As of June 30, 2022, all of the Fund’s investments were considered Level 1, in accordance with the authoritative guidance on fair value measurements and disclosure under U.S. Generally Accepted Accounting Principles.
For more information on valuation inputs, see Note 2 in the Notes to Financial Statements.
The accompanying notes are an integral part of the financial statements.
| 21 | CHAMPLAIN INVESTMENT | PARTNERS | ||
| THE ADVISORS’ INNER CIRCLE FUND II | CHAMPLAIN | |
| MID CAP FUND | ||
| JUNE 30, 2022 | ||
| (Unaudited) |
SECTOR WEIGHTINGS †:
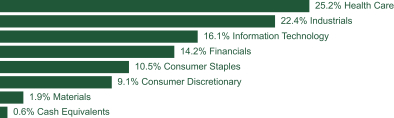
† Percentages are based on total investments.
SCHEDULE OF INVESTMENTS
| COMMON STOCK — 98.4% | ||||||||
| Shares | Value | |||||||
CONSUMER DISCRETIONARY — 9.0% |
| |||||||
Advance Auto Parts | 840,000 | $ | 145,395,600 | |||||
Bath & Body Works | 1,600,000 | 43,072,000 | ||||||
Leslie’s * | 5,460,000 | 82,882,800 | ||||||
Planet Fitness, Cl A * | 975,000 | 66,309,750 | ||||||
Terminix Global Holdings * | 111,255 | 4,522,516 | ||||||
Tractor Supply | 355,000 | 68,816,750 | ||||||
Ulta Beauty * | 165,000 | 63,604,200 | ||||||
|
|
| ||||||
| 474,603,616 | ||||||||
|
|
| ||||||
CONSUMER STAPLES — 10.3% |
| |||||||
Boston Beer, Cl A * | 145,000 | 43,930,650 | ||||||
Church & Dwight | 280,000 | 25,944,800 | ||||||
Clorox | 595,000 | 83,883,100 | ||||||
Freshpet * | 1,400,000 | 72,646,000 | ||||||
Hormel Foods | 1,375,000 | 65,120,000 | ||||||
JM Smucker | 625,000 | 80,006,250 | ||||||
Lamb Weston Holdings | 935,000 | 66,815,100 | ||||||
McCormick | 1,265,000 | 105,311,250 | ||||||
|
|
| ||||||
| 543,657,150 | ||||||||
|
|
| ||||||
FINANCIALS — 14.1% |
| |||||||
Arthur J Gallagher | 940,000 | 153,257,600 | ||||||
Cullen/Frost Bankers | 345,000 | 40,175,250 | ||||||
Everest Re Group | 635,000 | 177,977,800 | ||||||
FactSet Research Systems | 135,000 | 51,916,950 | ||||||
Northern Trust | 830,000 | 80,078,400 | ||||||
The accompanying notes are an integral part of the financial statements.
| 22 | CHAMPLAIN INVESTMENT | PARTNERS | ||
| THE ADVISORS’ INNER CIRCLE FUND II | CHAMPLAIN | |
| MID CAP FUND | ||
| JUNE 30, 2022 | ||
| (Unaudited) |
| COMMON STOCK — continued | ||||||||
| Shares | Value | |||||||
FINANCIALS — continued |
| |||||||
Prosperity Bancshares | 950,000 | $ | 64,856,500 | |||||
SVB Financial Group * | 160,000 | 63,198,400 | ||||||
Tradeweb Markets, Cl A | 1,585,000 | 108,176,250 | ||||||
|
|
| ||||||
| 739,637,150 | ||||||||
|
|
| ||||||
HEALTH CARE — 24.9% |
| |||||||
Abcam PLC ADR | 1,680,000 | 24,292,800 | ||||||
Align Technology * | 290,000 | 68,634,300 | ||||||
Bio-Rad Laboratories, Cl A * | 120,000 | 59,400,000 | ||||||
Bio-Techne | 260,000 | 90,126,400 | ||||||
Catalent * | 725,000 | 77,785,250 | ||||||
Cooper | 250,000 | 78,280,000 | ||||||
DENTSPLY SIRONA | 2,110,000 | 75,390,300 | ||||||
Dexcom * | 800,000 | 59,624,000 | ||||||
Edwards Lifesciences * | 1,595,000 | 151,668,550 | ||||||
IDEXX Laboratories * | 80,000 | 28,058,400 | ||||||
Integra LifeSciences Holdings * | 1,425,000 | 76,992,750 | ||||||
Maravai LifeSciences Holdings, Cl A * | 1,275,000 | 36,222,750 | ||||||
Masimo * | 425,000 | 55,534,750 | ||||||
STERIS PLC | 555,000 | 114,413,250 | ||||||
Tandem Diabetes Care * | 850,000 | 50,311,500 | ||||||
Veeva Systems, Cl A * | 480,000 | 95,059,200 | ||||||
Waters * | 505,000 | 167,144,900 | ||||||
|
|
| ||||||
| 1,308,939,100 | ||||||||
|
|
| ||||||
INDUSTRIALS — 22.2% |
| |||||||
AMETEK | 1,470,000 | 161,538,300 | ||||||
CoStar Group * | 1,470,000 | 88,802,700 | ||||||
Fortive | 2,945,000 | 160,149,100 | ||||||
Generac Holdings * | 675,000 | 142,141,500 | ||||||
Graco | 1,420,000 | 84,362,200 | ||||||
IDEX | 675,000 | 122,600,250 | ||||||
Nordson | 535,000 | 108,305,400 | ||||||
Rockwell Automation | 555,000 | 110,617,050 | ||||||
Toro | 1,420,000 | 107,621,800 | ||||||
Verisk Analytics, Cl A | 455,000 | 78,755,950 | ||||||
|
|
| ||||||
| 1,164,894,250 | ||||||||
|
|
| ||||||
The accompanying notes are an integral part of the financial statements.
| 23 | CHAMPLAIN INVESTMENT | PARTNERS | ||
| THE ADVISORS’ INNER CIRCLE FUND II | CHAMPLAIN | |
| MID CAP FUND | ||
| JUNE 30, 2022 | ||
| (Unaudited) |
| COMMON STOCK — continued | ||||||||
| Shares | Value | |||||||
INFORMATION TECHNOLOGY — 16.0% |
| |||||||
Akamai Technologies * | 1,100,000 | $ | 100,463,000 | |||||
Asana, Cl A * | 1,835,000 | 32,259,300 | ||||||
Nutanix, Cl A * | 2,915,000 | 42,646,450 | ||||||
Okta, Cl A * | 765,000 | 69,156,000 | ||||||
Palantir Technologies, Cl A * | 3,960,000 | 35,917,200 | ||||||
Palo Alto Networks * | 230,000 | 113,606,200 | ||||||
Pure Storage, Cl A * | 4,289,975 | 110,295,257 | ||||||
Synopsys * | 290,000 | 88,073,000 | ||||||
Workday, Cl A * | 750,000 | 104,685,000 | ||||||
Zendesk * | 680,000 | 50,367,600 | ||||||
Zscaler * | 620,000 | 92,696,200 | ||||||
|
|
| ||||||
| 840,165,207 | ||||||||
|
|
| ||||||
MATERIALS — 1.9% |
| |||||||
AptarGroup | 945,000 | 97,533,450 | ||||||
|
|
| ||||||
TOTAL COMMON STOCK | 5,169,429,923 | |||||||
|
|
| ||||||
| CASH EQUIVALENTS** — 0.6% | ||||||||
Fidelity Investments - Money Market Treasury Only Portfolio, Cl I, 0.940% | 20,000,000 | 20,000,000 | ||||||
Goldman Sachs Square Treasury Instruments Fund, Institutional Shares, 1.110% | 13,339,745 | 13,339,745 | ||||||
|
|
| ||||||
TOTAL CASH EQUIVALENTS | 33,339,745 | |||||||
|
|
| ||||||
TOTAL INVESTMENTS — 99.0% | $ | 5,202,769,668 | ||||||
|
|
| ||||||
Percentages are based on Net Assets of $5,254,824,981.
* Non-income producing security.
** Rate reported is the 7-day effective yield as of June 30, 2022.
The accompanying notes are an integral part of the financial statements.
| 24 | CHAMPLAIN INVESTMENT | PARTNERS | ||
| THE ADVISORS’ INNER CIRCLE FUND II | CHAMPLAIN | |
| MID CAP FUND | ||
| JUNE 30, 2022 | ||
| (Unaudited) |
ADR — American Depositary Receipt
Cl — Class
PLC — Public Limited Company
As of June 30, 2022, all of the Fund’s investments were considered Level 1, in accordance with the authoritative guidance on fair value measurements and disclosure under U.S. Generally Accepted Accounting Principles.
For more information on valuation inputs, see Note 2 in the Notes to Financial Statements.
The accompanying notes are an integral part of the financial statements.
| 25 | CHAMPLAIN INVESTMENT | PARTNERS | ||
| THE ADVISORS’ INNER CIRCLE FUND II | CHAMPLAIN FUNDS | |
| JUNE 30, 2022 | ||
| (Unaudited) |
STATEMENTS OF ASSETS AND LIABILITIES
| Champlain Small Company Fund | Champlain Mid Cap Fund | |||||||
| Assets: | ||||||||
Investments, at value (Cost $2,311,406,426 and $4,745,262,764, respectively) | $ | 2,527,342,966 | $ | 5,202,769,668 | ||||
Cash | 49,250 | – | ||||||
Receivable for Investment Securities Sold | 7,846,499 | 54,336,456 | ||||||
Receivable for Capital Shares Sold | 4,696,160 | 12,809,604 | ||||||
Receivable for Dividends | 2,025,575 | 3,118,063 | ||||||
Reclaim Receivable | 42,570 | 53,756 | ||||||
Prepaid Expenses | 24,689 | 85,252 | ||||||
|
|
|
| |||||
Total Assets | 2,542,027,709 | 5,273,172,799 | ||||||
|
|
|
| |||||
| Liabilities: | ||||||||
Payable due to Investment Adviser | 1,763,232 | 3,179,833 | ||||||
Payable for Capital Shares Redeemed | 1,393,816 | 11,723,124 | ||||||
Payable for Investment Securities Purchased | 1,110,759 | 2,041,349 | ||||||
Payable due to Transfer Agent | 706,668 | 852,177 | ||||||
Payable due to Distributor — Advisor Shares | 129,204 | 69,077 | ||||||
Payable due to Administrator | 133,329 | 279,135 | ||||||
Chief Compliance Officer Fees Payable | 1,513 | 3,718 | ||||||
Payable due to Trustees | – | 13,420 | ||||||
Other Accrued Expenses | 132,500 | 185,985 | ||||||
|
|
|
| |||||
Total Liabilities | 5,371,021 | 18,347,818 | ||||||
|
|
|
| |||||
Net Assets | $ | 2,536,656,688 | $ | 5,254,824,981 | ||||
|
|
|
| |||||
| NET ASSETS CONSIST OF: | ||||||||
Paid-in Capital | $ | 2,431,418,629 | $ | 4,785,133,816 | ||||
Total Distributable Earnings | 105,238,059 | 469,691,165 | ||||||
|
|
|
| |||||
Net Assets | $ | 2,536,656,688 | $ | 5,254,824,981 | ||||
|
|
|
| |||||
| ADVISOR SHARES: | ||||||||
Net Assets | $ | 347,822,487 | $ | 239,803,695 | ||||
Shares Issued and Outstanding | 19,143,401 | 12,000,724 | ||||||
Net Asset Value, Offering and Redemption Price Per Share | $ | 18.17 | $ | 19.98 | ||||
|
|
|
| |||||
| INSTITUTIONAL SHARES: | ||||||||
Net Assets | $ | 2,188,834,201 | $ | 5,015,021,286 | ||||
Shares Issued and Outstanding | 118,254,343 | 242,684,793 | ||||||
Net Asset Value, Offering and Redemption Price Per Share | $ | 18.51 | $ | 20.66 | ||||
|
|
|
| |||||
| Amounts designated as “—” are $0 or round to $0. | ||||||||
The accompanying notes are an integral part of the financial statements.
| 26 | CHAMPLAIN INVESTMENT | PARTNERS | ||
| THE ADVISORS’ INNER CIRCLE FUND II | CHAMPLAIN FUNDS | |
| FOR THE PERIOD ENDED | ||
| JUNE 30, 2022 (Unaudited) |
STATEMENTS OF OPERATIONS
| Champlain Small Company Fund | Champlain Mid Cap Fund | |||||||
| Investment Income | ||||||||
Dividends | $ | 11,599,373 | $ | 22,679,358 | ||||
Less: Foreign Taxes Withheld | (64,463) | — | ||||||
|
|
|
| |||||
Total Investment Income | 11,534,910 | 22,679,358 | ||||||
|
|
|
| |||||
| Expenses | ||||||||
Investment Advisory Fees | 12,723,882 | 22,119,313 | ||||||
Administration Fees | 969,766 | 1,934,901 | ||||||
Distribution Fees — Advisor Shares | 505,861 | 357,125 | ||||||
Trustees’ Fees | 12,293 | 22,819 | ||||||
Chief Compliance Officer Fees | 3,067 | 5,554 | ||||||
Transfer Agent Fees | 2,218,178 | 2,273,543 | ||||||
Registration Fees | 102,137 | 102,201 | ||||||
Custodian Fees | 71,837 | 134,372 | ||||||
Printing Fees | 57,915 | 99,389 | ||||||
Professional Fees | 26,469 | 50,457 | ||||||
Insurance and Other Expenses | 23,058 | 59,189 | ||||||
|
|
|
| |||||
Total Expenses | 16,714,463 | 27,158,863 | ||||||
|
|
|
| |||||
Less: Fees Paid Indirectly (1) | (281) | (919) | ||||||
|
|
|
| |||||
Net Expenses | 16,714,182 | 27,157,944 | ||||||
|
|
|
| |||||
Net Investment Loss | (5,179,272) | (4,478,586) | ||||||
|
|
|
| |||||
Net Realized Gain (Loss) on Investments | (103,836,395) | (31,263,799) | ||||||
|
|
|
| |||||
Net Realized Gain (Loss) | (103,836,395) | (31,263,799) | ||||||
|
|
|
| |||||
Net Change in Unrealized Appreciation (Depreciation) on Investments | (865,837,581) | (2,088,413,340) | ||||||
|
|
|
| |||||
Net Change in Unrealized Appreciation (Depreciation) | (865,837,581) | (2,088,413,340) | ||||||
|
|
|
| |||||
Net Realized and Unrealized Gain (Loss) | (969,673,976) | (2,119,677,139) | ||||||
|
|
|
| |||||
Net (Decrease) in Net Assets Resulting from Operations | $ | (974,853,248) | $ | (2,124,155,725) | ||||
|
|
|
| |||||
| Amount | designated as “—” is $0. |
| (1) | See Note 4 in Notes to Financial Statements. |
The accompanying notes are an integral part of the financial statements.
| 27 | CHAMPLAIN INVESTMENT | PARTNERS | ||
| THE ADVISORS’ INNER CIRCLE FUND II | CHAMPLAIN SMALL | |
| COMPANY FUND | ||
STATEMENTS OF CHANGES IN NET ASSETS
| Period Ended June 30, 2022 (Unaudited) | Year Ended December 31, 2021 | |||||||
| Operations: | ||||||||
Net Investment Loss | $ | (5,179,272) | $ | (17,930,997) | ||||
Net Realized Gain (Loss) | (103,836,395) | 175,954,951 | ||||||
Net Change in Unrealized Appreciation (Depreciation) | (865,837,581) | 261,001,689 | ||||||
|
|
|
| |||||
Net Increase (Decrease) in Net Assets Resulting from Operations | (974,853,248) | 419,025,643 | ||||||
|
|
|
| |||||
| Distributions: | ||||||||
Advisor Shares | — | (20,682,396) | ||||||
Institutional Shares | — | (144,463,109) | ||||||
|
|
|
| |||||
Total Distributions | — | (165,145,505) | ||||||
|
|
|
| |||||
| Capital Share Transactions:(1) | ||||||||
Advisor Shares: | ||||||||
Issued | 27,022,620 | 50,587,877 | ||||||
Reinvestment of Distributions | — | 20,418,559 | ||||||
Redeemed | (33,658,582) | (86,555,144) | ||||||
|
|
|
| |||||
Decrease from Advisor Shares Capital Share Transactions | (6,635,962) | (15,548,708) | ||||||
|
|
|
| |||||
Institutional Shares: | ||||||||
Issued | 275,821,449 | 987,993,974 | ||||||
Reinvestment of Distributions | — | 143,164,854 | ||||||
Redeemed | (682,100,734) | (593,426,906) | ||||||
|
|
|
| |||||
Increase (Decrease) from Institutional Shares Capital Share Transactions | (406,279,285) | 537,731,922 | ||||||
|
|
|
| |||||
Net Increase (Decrease) in Net Assets from Capital Share Transactions | (412,915,247) | 522,183,214 | ||||||
|
|
|
| |||||
Total Increase (Decrease) in Net Assets | (1,387,768,495) | 776,063,352 | ||||||
|
|
|
| |||||
| Net Assets: | ||||||||
Beginning of Period/Year | 3,924,425,183 | 3,148,361,831 | ||||||
|
|
|
| |||||
End of Period/Year | $ | 2,536,656,688 | $ | 3,924,425,183 | ||||
|
|
|
| |||||
| (1) | For share transactions, see Note 6 in the Notes to Financial Statements. |
The accompanying notes are an integral part of the financial statements.
| 28 | CHAMPLAIN INVESTMENT | PARTNERS | ||
| THE ADVISORS’ INNER CIRCLE FUND II | CHAMPLAIN | |
| MID CAP FUND | ||
STATEMENTS OF CHANGES IN NET ASSETS
| Period Ended June 30, 2022 (Unaudited) | Year Ended December 31, 2021 | |||||||
| Operations: | ||||||||
Net Investment Loss | $ | (4,478,586) | $ | (13,603,245) | ||||
Net Realized Gain (Loss) | (31,263,799) | 640,942,458 | ||||||
Net Change in Unrealized Appreciation (Depreciation) | (2,088,413,340) | 844,132,344 | ||||||
|
|
|
| |||||
Net Increase (Decrease) in Net Assets Resulting from Operations | (2,124,155,725) | 1,471,471,557 | ||||||
|
|
|
| |||||
| Distributions: | ||||||||
Advisor Shares | — | (33,034,674) | ||||||
Institutional Shares | — | (650,056,032) | ||||||
|
|
|
| |||||
Total Distributions | — | (683,090,706) | ||||||
|
|
|
| |||||
| Capital Share Transactions:(1) | ||||||||
Advisor Shares: | ||||||||
Issued | 24,219,976 | 50,413,764 | ||||||
Reinvestment of Distributions | — | 32,011,549 | ||||||
Redeemed | (41,003,582) | (76,590,880) | ||||||
|
|
|
| |||||
Increase (Decrease) from Advisor Shares Capital Share Transactions | (16,783,606) | 5,834,433 | ||||||
|
|
|
| |||||
Institutional Shares: | ||||||||
Issued | 841,753,367 | 1,550,992,470 | ||||||
Reinvestment of Distributions | — | 501,503,591 | ||||||
Redeemed | (882,571,118) | (1,114,479,105) | ||||||
|
|
|
| |||||
Increase (Decrease) from Institutional Shares Capital Share Transactions | (40,817,751) | 938,016,956 | ||||||
|
|
|
| |||||
Net Increase (Decrease) in Net Assets from Capital Share Transactions | (57,601,357) | 943,851,389 | ||||||
|
|
|
| |||||
Total Increase (Decrease) in Net Assets | (2,181,757,082) | 1,732,232,240 | ||||||
|
|
|
| |||||
| Net Assets: | ||||||||
Beginning of Period/Year | 7,436,582,063 | 5,704,349,823 | ||||||
|
|
|
| |||||
End of Period/Year | $ | 5,254,824,981 | $ | 7,436,582,063 | ||||
|
|
|
| |||||
| (1) | For share transactions, see Note 6 in the Notes to Financial Statements. |
The accompanying notes are an integral part of the financial statements.
| 29 | CHAMPLAIN INVESTMENT | PARTNERS | ||
| THE ADVISORS’ INNER CIRCLE FUND II | CHAMPLAIN SMALL | |
| COMPANY FUND | ||
FINANCIAL HIGHLIGHTS
Selected Per Share Data & Ratios
For a Share Outstanding Throughout each Period/Year
| Advisor Shares | ||||||||||||||||||||||||||||
| Period Ended June 30, 2022 (Unaudited) | Year Ended December 31, 2021 | Period Ended December 31, 2020(1) | Year Ended July 31, 2020 | Year Ended July 31, 2019 | Year Ended July 31, 2018 | Year Ended July 31, 2017 | ||||||||||||||||||||||
Net Asset Value, Beginning of Period | $ 24.64 | $ 22.93 | $ 19.10 | $ 20.36 | $ 22.83 | $ 20.89 | $ 17.74 | |||||||||||||||||||||
|
|
|
|
|
|
|
|
|
|
|
|
|
| |||||||||||||||
Income (Loss) from Operations: | ||||||||||||||||||||||||||||
Net Investment Loss(2) | (0.06 | ) | (0.18 | ) | (0.03 | ) | (0.07 | ) | (0.06 | ) | (0.12 | ) | (0.04 | ) | ||||||||||||||
Net Realized and Unrealized Gain (Loss) on Investments | (6.41 | ) | 2.99 | 5.26 | 0.37 | (0.16 | ) | 4.01 | 3.73 | |||||||||||||||||||
|
|
|
|
|
|
|
|
|
|
|
|
|
| |||||||||||||||
Total from Operations | (6.47 | ) | 2.81 | 5.23 | 0.30 | (0.22 | ) | 3.89 | 3.69 | |||||||||||||||||||
|
|
|
|
|
|
|
|
|
|
|
|
|
| |||||||||||||||
Dividends and Distributions from: | ||||||||||||||||||||||||||||
Net Investment Income | — | — | — | — | — | — | — | |||||||||||||||||||||
Net Realized Gains | — | (1.10 | ) | (1.40 | ) | (1.56 | ) | (2.25 | ) | (1.95 | ) | (0.54 | ) | |||||||||||||||
|
|
|
|
|
|
|
|
|
|
|
|
|
| |||||||||||||||
Total Dividends and Distributions | — | (1.10 | ) | (1.40 | ) | (1.56 | ) | (2.25 | ) | (1.95 | ) | (0.54 | ) | |||||||||||||||
|
|
|
|
|
|
|
|
|
|
|
|
|
| |||||||||||||||
Net Asset Value, End of Period | $ 18.17 | $ 24.64 | $ 22.93 | $ 19.10 | $ 20.36 | $ 22.83 | $ 20.89 | |||||||||||||||||||||
|
|
|
|
|
|
|
|
|
|
|
|
|
| |||||||||||||||
Total Return † | (26.26)%** | 12.42% | 27.58%** | 1.31% | 1.31% | 19.94% | 20.92%†† | |||||||||||||||||||||
|
|
|
|
|
|
|
|
|
|
|
|
|
| |||||||||||||||
Ratios and Supplemental Data | ||||||||||||||||||||||||||||
Net Assets, End of Period (Thousands) | $347,823 | $480,911 | $460,617 | $377,853 | $542,733 | $647,592 | $693,776 | |||||||||||||||||||||
Ratio of Expenses to Average Net Assets (including waivers and reimbursements/excluding fees paid indirectly) | 1.28%* | 1.26% | 1.27% | * | 1.26% | 1.24% | (3) | 1.30% | (3) | 1.31% | ||||||||||||||||||
Ratio of Expenses to Average Net Assets (excluding waivers, reimbursements and fees paid indirectly) | 1.28%* | 1.26% | 1.27%* | 1.26% | 1.23% | 1.29% | 1.33% | |||||||||||||||||||||
Ratio of Net Investment Loss to Average Net Assets | (0.54)%* | (0.71)% | (0.37)%* | (0.39)% | (0.28)% | (0.58)% | (0.23)% | |||||||||||||||||||||
Portfolio Turnover Rate | 15%** | 22% | 16%** | 30% | 30% | 35% | 40% | |||||||||||||||||||||
| * | Annualized. |
| ** | Portfolio turnover is for the period indicated and has not been annualized. |
| † | Total returns shown do not reflect the deduction of taxes that a shareholder would pay on Fund distributions or upon the redemption of Fund shares. |
| †† | Total Return would have been lower had certain expenses not been waived and assumed by the Adviser during the period. |
| (1) | For the period August 1, 2020 to December 31, 2020. Effective August 19, 2020, the Champlain Small Company Fund changed its fiscal year end to December 31st (see Note 1 in the Notes to Financial Statements). |
| (2) | Per share amounts calculated using average shares method. |
| (3) | Ratio includes previously waived investment advisory fees recovered. The impact of the recovered fees may cause a higher net expense ratio. |
Amounts designated as “—” are $0 or round to $0. |
The accompanying notes are an integral part of the financial statements.
| 30 | CHAMPLAIN INVESTMENT | PARTNERS | ||
| THE ADVISORS’ INNER CIRCLE FUND II | CHAMPLAIN SMALL | |
| COMPANY FUND | ||
FINANCIAL HIGHLIGHTS
Selected Per Share Data & Ratios
For a Share Outstanding Throughout each Period/Year
| Institutional Shares | ||||||||||||||||||||||||||||
| Period Ended June 30, 2022 (Unaudited) | Year Ended December 31, 2021 | Period Ended December 31, 2020(2) | Year Ended July 31, 2020 | Year Ended July 31, 2019 | Year Ended July 31, 2018 | Period Ended July 31, 2017(1) | ||||||||||||||||||||||
Net Asset Value, Beginning of Period | $ 25.07 | $ 23.25 | $ 19.33 | $ 20.54 | $ 22.96 | $ 20.95 | $ 18.36 | |||||||||||||||||||||
|
|
|
|
|
|
|
|
|
|
|
|
|
| |||||||||||||||
Income (Loss) from Operations: | ||||||||||||||||||||||||||||
Net Investment Income (Loss)(3) | (0.03 | ) | (0.11 | ) | (0.01 | ) | (0.03 | ) | (0.01 | ) | (0.07 | ) | 0.03 | |||||||||||||||
Net Realized and Unrealized Gain (Loss) on Investments | (6.53 | ) | 3.03 | 5.33 | 0.38 | (0.16 | ) | 4.03 | 3.10 | |||||||||||||||||||
|
|
|
|
|
|
|
|
|
|
|
|
|
| |||||||||||||||
Total from Operations | (6.56 | ) | 2.92 | 5.32 | 0.35 | (0.17 | ) | 3.96 | 3.13 | |||||||||||||||||||
|
|
|
|
|
|
|
|
|
|
|
|
|
| |||||||||||||||
Dividends and Distributions from: | ||||||||||||||||||||||||||||
Net Investment Income | — | — | — | — | — | — | — | |||||||||||||||||||||
Net Realized Gains | — | (1.10 | ) | (1.40 | ) | (1.56 | ) | (2.25 | ) | (1.95 | ) | (0.54 | ) | |||||||||||||||
|
|
|
|
|
|
|
|
|
|
|
|
|
| |||||||||||||||
Total Dividends and Distributions | — | (1.10 | ) | (1.40 | ) | (1.56 | ) | (2.25 | ) | (1.95 | ) | (0.54 | ) | |||||||||||||||
|
|
|
|
|
|
|
|
|
|
|
|
|
| |||||||||||||||
Net Asset Value, End of Period | $ 18.51 | $ 25.07 | $ 23.25 | $ 19.33 | $ 20.54 | $ 22.96 | $ 20.95 | |||||||||||||||||||||
|
|
|
|
|
|
|
|
|
|
|
|
|
| |||||||||||||||
Total Return † | (26.17)%** | 12.72% | 27.71%** | 1.55% | 1.54% | 20.23% | 17.17%†† | |||||||||||||||||||||
|
|
|
|
|
|
|
|
|
|
|
|
|
| |||||||||||||||
Ratios and Supplemental Data | ||||||||||||||||||||||||||||
Net Assets, End of Period (Thousands) | $2,188,834 | $3,443,514 | $2,687,745 | $1,755,279 | $1,416,705 | $1,167,188 | $710,522 | |||||||||||||||||||||
Ratio of Expenses to Average Net Assets (including waivers and reimbursements/excluding fees paid indirectly) | 1.03%* | 1.01% | 1.02%* | 1.02% | 0.99% | (4) | 1.05% | (4) | 1.05%* | |||||||||||||||||||
Ratio of Expenses to Average Net Assets (excluding waivers, reimbursements and fees paid indirectly) | 1.03%* | 1.01% | 1.02%* | 1.02% | 0.98% | 1.04% | 1.06%* | |||||||||||||||||||||
Ratio of Net Investment Income (Loss) to Average Net Assets | (0.30)%* | (0.45)% | (0.11)%* | (0.16)% | (0.05)% | (0.32)% | 0.18%* | |||||||||||||||||||||
Portfolio Turnover Rate | 15%** | 22% | 16%** | 30% | 30% | 35% | 40%‡ | |||||||||||||||||||||
| * | Annualized. |
| ** | Portfolio turnover and total return is for the period indicated and has not been annualized. |
| † | Total returns shown do not reflect the deduction of taxes that a shareholder would pay on Fund distributions or upon the redemption of Fund shares. |
| †† | Total Return would have been lower had certain expenses not been waived and assumed by the Adviser during the period. Total return for the period indicated has not been annualized. |
| ‡ | Portfolio return is for the period indicated and has not been annualized. |
| (1) | Institutional Shares commenced operations on August 31, 2016. |
| (2) | For the period August 1, 2020 to December 31, 2020. Effective August 19, 2020, the Champlain Small Company Fund changed its fiscal year end to December 31st (see Note 1 in the Notes to Financial Statements). |
| (3) | Per share amounts calculated using average shares method. |
| (4) | Ratio includes previously waived investment advisory fees recovered. The impact of the recovered fees may cause a higher net expense ratio. |
Amounts designated as “—” are $0 or round to $0. |
The accompanying notes are an integral part of the financial statements.
| 31 | CHAMPLAIN INVESTMENT | PARTNERS | ||
| THE ADVISORS’ INNER CIRCLE FUND II | CHAMPLAIN | |
| MID CAP FUND | ||
FINANCIAL HIGHLIGHTS
Selected Per Share Data & Ratios
For a Share Outstanding Throughout each Period/Year
| Advisor Shares | ||||||||||||||||||||||||||||
| Period Ended June 30, 2022 (Unaudited) | Year Ended December 31, 2021 | Period Ended December 31, 2020(1) | Year Ended July 31, 2020 | Year Ended July 31, 2019 | Year Ended July 31, 2018 | Year Ended July 31, 2017 | ||||||||||||||||||||||
Net Asset Value, Beginning of Period | $ 27.88 | $ 24.76 | $ 21.58 | $ 20.17 | $ 18.88 | $ 16.65 | $ 14.85 | |||||||||||||||||||||
|
|
|
|
|
|
|
|
|
|
|
|
|
| |||||||||||||||
Income (Loss) from Operations: | ||||||||||||||||||||||||||||
Net Investment Loss(2) | (0.04 | ) | (0.12 | ) | (0.03 | ) | (0.03 | ) | (0.03 | ) | (0.05 | ) | — | |||||||||||||||
Net Realized and Unrealized Gain (Loss) on Investments | (7.86 | ) | 6.09 | 4.35 | 2.26 | 2.43 | 3.13 | 2.44 | ||||||||||||||||||||
|
|
|
|
|
|
|
|
|
|
|
|
|
| |||||||||||||||
Total from Operations | (7.90 | ) | 5.97 | 4.32 | 2.23 | 2.40 | 3.08 | 2.44 | ||||||||||||||||||||
|
|
|
|
|
|
|
|
|
|
|
|
|
| |||||||||||||||
Dividends and Distributions from: | ||||||||||||||||||||||||||||
Net Investment Income | — | — | — | — | — | — | — | |||||||||||||||||||||
Net Realized Gains | — | (2.85 | ) | (1.14 | ) | (0.82 | ) | (1.11 | ) | (0.85 | ) | (0.64 | ) | |||||||||||||||
|
|
|
|
|
|
|
|
|
|
|
|
|
| |||||||||||||||
Total Dividends and Distributions | — | (2.85 | ) | (1.14 | ) | (0.82 | ) | (1.11 | ) | (0.85 | ) | (0.64 | ) | |||||||||||||||
|
|
|
|
|
|
|
|
|
|
|
|
|
| |||||||||||||||
Net Asset Value, End of Period | $ 19.98 | $ 27.88 | $ 24.76 | $ 21.58 | $ 20.17 | $ 18.88 | $ 16.65 | |||||||||||||||||||||
|
|
|
|
|
|
|
|
|
|
|
|
|
| |||||||||||||||
Total Return † | (28.34)%** | 24.60% | 20.16%** | 11.36% | 14.15% | 18.98% | 16.85% | |||||||||||||||||||||
|
|
|
|
|
|
|
|
|
|
|
|
|
| |||||||||||||||
Ratios and Supplemental Data | ||||||||||||||||||||||||||||
Net Assets, End of Period (Thousands) | $239,804 | $353,725 | $307,621 | $266,939 | $867,332 | $667,021 | $609,025 | |||||||||||||||||||||
Ratio of Expenses to Average Net Assets (including waivers and reimbursements/excluding fees paid indirectly) | 1.10%* | 1.09% | 1.09% | * | 1.11% | 1.12% | 1.15% | 1.17% | ||||||||||||||||||||
Ratio of Expenses to Average Net Assets (excluding waivers, reimbursements and fees paid indirectly) | 1.10%* | 1.09% | 1.09% | * | 1.11% | 1.12% | 1.15% | 1.17% | ||||||||||||||||||||
Ratio of Net Investment Income (Loss) to Average Net Assets | (0.39)%* | (0.44)% | (0.35)% | * | (0.14)% | (0.16)% | (0.26)% | 0.02% | ||||||||||||||||||||
Portfolio Turnover Rate | 15%** | 32% | 16% | ** | 36% | 19% | 33% | 33% | ||||||||||||||||||||
| * | Annualized. |
| ** | Portfolio turnover and total return is for the period indicated and has not been annualized. |
| † | Total return shown does not reflect the deduction of taxes that a shareholder would pay on Fund distributions or the redemption of Fund shares. |
Amounts designated as “—” are $0 or round to $0. |
| (1) | For the period August 1, 2020 to December 31, 2020. Effective August 19, 2020, the Champlain Mid Cap Fund changed its fiscal year end to December 31st (see Note 1 in the Notes to Financial Statements). |
| (2) | Per share amounts calculated using average shares method. |
Amounts designated as “—” are $0. |
The accompanying notes are an integral part of the financial statements.
| 32 | CHAMPLAIN INVESTMENT | PARTNERS | ||
| THE ADVISORS’ INNER CIRCLE FUND II | CHAMPLAIN | |
| MID CAP FUND | ||
FINANCIAL HIGHLIGHTS
Selected Per Share Data & Ratios
For a Share Outstanding Throughout each Period/Year
| Institutional Shares | ||||||||||||||||||||||||||||
| Period Ended June 30, 2022 (Unaudited) | Year Ended December 31, 2021 | Period Ended December 31, 2020(1) | Year Ended July 31, 2020 | Year Ended July 31, 2019 | Year Ended July 31, 2018 | Year Ended July 31, 2017 | ||||||||||||||||||||||
Net Asset Value, Beginning of Period | $ 28.79 | $ 25.43 | $ 22.12 | $ 20.60 | $ 19.21 | $ 16.92 | $ 15.05 | |||||||||||||||||||||
|
|
|
|
|
|
|
|
|
|
|
|
|
| |||||||||||||||
Income (Loss) from Operations: | ||||||||||||||||||||||||||||
Net Investment Income (Loss)(2) | (0.02 | ) | (0.05 | ) | (0.01 | ) | — | ^ | 0.02 | — | 0.05 | |||||||||||||||||
Net Realized and Unrealized Gain (Loss) on Investments | (8.11 | ) | 6.26 | 4.46 | 2.35 | 2.48 | 3.17 | 2.47 | ||||||||||||||||||||
|
|
|
|
|
|
|
|
|
|
|
|
|
| |||||||||||||||
Total from Operations | (8.13 | ) | 6.21 | 4.45 | 2.35 | 2.50 | 3.17 | 2.52 | ||||||||||||||||||||
|
|
|
|
|
|
|
|
|
|
|
|
|
| |||||||||||||||
Dividends and Distributions from: | ||||||||||||||||||||||||||||
Net Investment Income | — | — | — | (0.01 | ) | — | (0.03 | ) | (0.01 | ) | ||||||||||||||||||
Net Realized Gains | — | (2.85 | ) | (1.14 | ) | (0.82 | ) | (1.11 | ) | (0.85 | ) | (0.64 | ) | |||||||||||||||
|
|
|
|
|
|
|
|
|
|
|
|
|
| |||||||||||||||
Total Dividends and Distributions | — | (2.85 | ) | (1.14 | ) | (0.83 | ) | (1.11 | ) | (0.88 | ) | (0.65 | ) | |||||||||||||||
|
|
|
|
|
|
|
|
|
|
|
|
|
| |||||||||||||||
Net Asset Value, End of Period | $ 20.66 | $ 28.79 | $ 25.43 | $ 22.12 | $ 20.60 | $ 19.21 | $ 16.92 | |||||||||||||||||||||
|
|
|
|
|
|
|
|
|
|
|
|
|
| |||||||||||||||
Total Return † | (28.24)%** | 24.90% | 20.25%** | 11.70% | 14.43% | 19.20% | 17.17% | |||||||||||||||||||||
|
|
|
|
|
|
|
|
|
|
|
|
|
| |||||||||||||||
Ratios and Supplemental Data | ||||||||||||||||||||||||||||
Net Assets, End of Period (Thousands) | $5,015,021 | $7,082,857 | $5,396,729 | $4,270,561 | $2,749,406 | $1,812,490 | $939,922 | |||||||||||||||||||||
Ratio of Expenses to Average Net Assets (including waivers and reimbursements/excluding fees paid indirectly) | 0.85%* | 0.84% | 0.84%* | 0.86% | 0.87% | 0.90% | 0.93% | |||||||||||||||||||||
Ratio of Expenses to Average Net Assets (excluding waivers, reimbursements and fees paid indirectly) | 0.85%* | 0.84% | 0.84%* | 0.86% | 0.87% | 0.90% | 0.93% | |||||||||||||||||||||
Ratio of Net Investment Income (Loss) to Average Net Assets | (0.13)%* | (0.19)% | (0.10)%* | (0.01)% | 0.10% | (0.02)% | 0.33% | |||||||||||||||||||||
Portfolio Turnover Rate | 15%** | 32% | 16%** | 36% | 19% | 33% | 33% | |||||||||||||||||||||
| * | Annualized. |
| ** | Portfolio turnover is for the period indicated and has not been annualized. |
| ^ | Amount less than $0.005. |
| † | Total return shown does not reflect the deduction of taxes that a shareholder would pay on Fund distributions or the redemption of Fund shares. |
| (1) | For the period August 1, 2020 to December 31, 2020. Effective August 19, 2020, the Champlain Mid Cap Fund changed its fiscal year end to December 31st (see Note 1 in the Notes to Financial Statements). |
| (2) | Per share amounts calculated using average shares method. |
Amounts designated as “—” are $0 or round to $0. |
The accompanying notes are an integral part of the financial statements.
| 33 | CHAMPLAIN INVESTMENT | PARTNERS | ||
| THE ADVISORS’ INNER CIRCLE FUND II | CHAMPLAIN FUNDS | |
| JUNE 30, 2022 | ||
NOTES TO FINANCIAL STATEMENTS (Unaudited)
1. ORGANIZATION:
The Advisors’ Inner Circle Fund II (the “Trust”) is organized as a Massachusetts business trust under an Amended and Restated Agreement and Declaration of Trust dated July 24, 1992. The Trust is registered under the Investment Company Act of 1940, as amended, as an open-end management investment company with nine funds. The financial statements herein are those of the Champlain Small Company Fund (the “Small Company Fund”) and Champlain Mid Cap Fund (the “Mid Cap Fund”) (each a “Fund” and collectively, the “Funds”). The financial statements for Champlain Emerging Markets Fund (the “Emerging Markets Fund”) is being presented separately. The investment objective of the Funds is capital appreciation. The Champlain Funds is classified as a “diversified” investment company under the 1940 Act. The Small Company Fund invests in small companies with market capitalization of less than $2.5 billion and the Mid Cap Fund invests primarily (at least 80% of its net assets) in medium-sized companies with market capitalization of less than $15 billion. The financial statements of the remaining funds within the Trust are presented separately. The assets of each Fund of the Trust are segregated, and a shareholder’s interest is limited to the fund in which shares are held. The Funds currently offer Advisor Shares and Institutional Shares; the Small Company Fund and Mid Cap Fund which commenced operations on August 31, 2016 and January 3, 2011 respectively.
Effective August 19, 2020, the Small Company Fund and the Mid Cap Fund changed their fiscal year end to December 31.
2. SIGNIFICANT ACCOUNTING POLICIES:
The following is a summary of the significant accounting policies followed by the Funds in preparation of their financial statements. The Funds are investment companies that applies the accounting and reporting guidance issues in Topic 946 by the U.S. Financial Accounting Standards Board (“FASB”).
Use of Estimates — The preparation of financial statements, in conformity with U.S. generally accepted accounting principles (“U.S. GAAP”) requires management to make estimates and assumptions that affect the reported amount of assets and liabilities and disclosure of contingent assets and liabilities at the date of the financial statements and the reported amounts of increases and decreases in net assets from operations during the reporting period. Actual results could differ from those estimates and such differences could be material.
| 34 | CHAMPLAIN INVESTMENT | PARTNERS | ||
| THE ADVISORS’ INNER CIRCLE FUND II | CHAMPLAIN FUNDS | |
| JUNE 30, 2022 | ||
Security Valuation — Securities listed on a securities exchange, market or automated quotation system for which quotations are readily available (except for securities traded on NASDAQ), including securities traded over the counter, are valued at the last quoted sale price on the primary exchange or market (foreign or domestic) on which they are traded, or, if there is no such reported sale, at the most recent quoted bid price. For securities traded on NASDAQ, the NASDAQ Official Closing Price will be used. Investment companies are valued at Net Asset Value.
Securities for which market prices are not “readily available” are valued in accordance with Fair Value Procedures established by the Trust’s Board of Trustees (the “Board”). The Trust’s Fair Value Procedures are implemented through a Fair Value Committee (the “Committee”) designated by the Board. Some of the more common reasons that may necessitate that a security be valued using Fair Value Procedures include: the security’s trading has been halted or suspended; the security has been de-listed from a national exchange; the security’s primary trading market is temporarily closed at a time when under normal conditions it would be open; the security has not been traded for an extended period of time; the security’s primary pricing source is not able or willing to provide a price; or trading of the security is subject to local government-imposed restrictions. When a security is valued in accordance with the Trust’s Fair Value Procedures, the Committee will determine the value after taking into consideration relevant information reasonably available to the Committee. As of June 30, 2022, there were no securities valued in accordance with the Fair Value Procedures.
For securities that principally trade on a foreign market or exchange, a significant gap in time can exist between the time of a particular security’s last trade and the time at which the Fund calculates its net asset values. The closing prices of such securities may no longer reflect their market value at the time the Fund calculates net asset value if an event that could materially affect the value of those securities (a “Significant Event”) has occurred between the time of the security’s last close and the time that the Fund calculates net asset value. A Significant Event may relate to a single issuer or to an entire market sector. If Champlain Investment Partners, LLC (the “Adviser”), the investment adviser of the Fund, becomes aware of a Significant Event that has occurred with respect to a security or group of securities after the closing of the exchange or market on which the security or securities principally trade, but before the time at which the Fund calculates net asset value, it may request that a Committee meeting be called.
In accordance with the authoritative guidance on fair value measurements and disclosure under U.S. GAAP, the Funds disclose the fair value of their investments in a hierarchy that prioritizes the inputs to valuation techniques used to measure the fair value. The objective of a fair value measurement is to determine the price that would be received to
| 35 | CHAMPLAIN INVESTMENT | PARTNERS | ||
| THE ADVISORS’ INNER CIRCLE FUND II | CHAMPLAIN FUNDS | |
| JUNE 30, 2022 | ||
sell an asset or paid to transfer a liability in an orderly transaction between market participants at the measurement date (an exit price). Accordingly, the fair value hierarchy gives the highest priority to quoted prices (unadjusted) in active markets for identical assets or liabilities (Level 1) and the lowest priority to unobservable inputs (Level 3). The three levels of the fair value hierarchy are described below:
| • | Level 1 – Unadjusted quoted prices in active markets for identical, unrestricted assets or liabilities that the Funds have the ability to access at the measurement date; |
| • | Level 2 – Quoted prices which are not active, or inputs that are observable (either directly or indirectly) for substantially the full term of the asset or liability; and other significant observable inputs (includes quoted prices for similar securities, interest rates, prepayment spreads, credit risk, referenced indices, quoted prices in inactive markets, adjusted quoted prices in active markets, etc.); and |
| • | Level 3 – Prices, inputs or exotic modeling techniques which are both significant to the fair value measurement and unobservable (supported by little or no market activity). |
Investments are classified within the level of the lowest significant input considered in determining fair value. Investments classified within Level 3 whose fair value measurement considers several inputs may include Level 1 or Level 2 inputs as components of the overall fair value measurement.
For details of investment classifications, reference the Schedules of Investments. The inputs or methodology used for valuing securities are not necessarily an indication of the risk associated with investing in those securities.
For the six months ended June 30, 2022, there have been no significant changes to the Funds’ fair value methodologies.
Federal Income Taxes — It is each Fund’s intention to continue to qualify as a regulated investment company under Subchapter M of the Internal Revenue Code and to distribute all of their taxable income. Accordingly, no provision for Federal income taxes has been made in the financial statements.
The Funds evaluate tax positions taken or expected to be taken in the course of preparing the Funds’ tax returns to determine whether it is “more-likely-than-not” (i.e., greater than 50-percent) that each tax position will be sustained upon examination by a taxing authority based on the technical merits of the position. Tax positions not deemed to meet the more-likely-than-not threshold are recorded as a tax benefit or expense in the current year. The Funds did not record any tax provision in the current period. However, management’s conclusions regarding tax positions taken may be subject to review and
| 36 | CHAMPLAIN INVESTMENT | PARTNERS | ||
| THE ADVISORS’ INNER CIRCLE FUND II | CHAMPLAIN FUNDS | |
| JUNE 30, 2022 | ||
adjustment at a later date based on factors including, but not limited to, examination by tax authorities (i.e., the last 3 tax year ends, as applicable), ongoing analysis of and changes to tax laws, regulations and interpretations thereof.
As of and during the six months ended June 30, 2022, the Funds did not have liabilities for any unrecognized tax benefits. The Funds recognize interest and penalties, if any, related to unrecognized tax benefits as income tax expense on the Statements of Operations. During the six months ended June 30, 2022, the Funds did not incur any interest or penalties.
Security Transactions and Investment Income — Security transactions are accounted for on the trade date for financial reporting purposes. Costs used in determining realized gains and losses on the sales of investment securities are based on specific identification. Dividend income is recognized on the ex-dividend date and interest income is recognized on an accrual basis.
Foreign Currency Translation — The books and records of the Funds are maintained in U.S. dollars. Investment securities and other assets and liabilities denominated in a foreign currency are translated into U.S. dollars on the date of valuation. The Funds do not isolate that portion of realized or unrealized gains and losses resulting from changes in the foreign exchange rate from fluctuations arising from changes in the market prices of the securities. These gains and losses are included in net realized gain (loss) on investments and net change in unrealized appreciation (depreciation) on investments on the Statements of Operations. Net realized gain (loss) on foreign currency transactions and net change in unrealized appreciation (depreciation) on translation of assets and liabilities denominated in foreign currencies represent net foreign exchange gains or losses from foreign currency exchange contracts, disposition of foreign currencies, currency gains or losses realized between trade and settlement dates on securities transactions and the difference between the amount of the investment income and foreign withholding taxes recorded on the Funds’ books and the U.S. dollar equivalent of the amounts actually received or paid.
Classes — Class specific expenses, such as distribution fees, are borne by that class of shares. Income, realized and change in unrealized gains/losses and non-class specific expenses are allocated to the respective class on the basis of relative net assets.
Expenses — Most expenses of the Trust can be directly attributed to a particular fund. Expenses that cannot be directly attributed to a particular fund are apportioned among the funds of the Trust based on the number of funds and/or relative net assets.
| 37 | CHAMPLAIN INVESTMENT | PARTNERS | ||
| THE ADVISORS’ INNER CIRCLE FUND II | CHAMPLAIN FUNDS | |
| JUNE 30, 2022 | ||
Dividends and Distributions to Shareholders — Dividends from net investment income, if any, are declared and paid annually by the Funds. Any net realized capital gains are distributed to shareholders at least annually.
3. TRANSACTIONS WITH AFFILIATES:
Certain officers and a trustee of the Trust are also officers of the Administrator, a wholly owned subsidiary of SEI Investments Company, and/or SEI Investments Distribution Co. (the “Distributor”). Such officers and the trustee are paid no fees by the Trust for serving as officers and trustee of the Trust.
The services provided by the Chief Compliance Officer (“CCO”) and his staff, who are the employees of the Administrator, are paid for by the Trust as incurred. The services include regulatory oversight of the Trust’s advisers and service providers as required by SEC regulations. The CCO’s services and fees have been approved by and are reviewed by the Board.
| 4. | ADMINISTRATION, DISTRIBUTION, TRANSFER AGENT AND CUSTODIAN AGREEMENTS: |
The Funds and the Administrator are parties to an Administration Agreement, under which the Administrator provides administrative services to the Fund. For these services, the Administrator is paid an asset-based fee, which will vary depending on the number of share classes and the average daily net assets of the Fund. For the six months ended June 30, 2022, the Small Company Fund and Mid Cap Fund were charged $969,766 and $1,934,901 for these services, respectively.
The Funds have adopted a Distribution Plan (the “Plan”) for the Advisor Shares. Under the Plan, the Distributor, or third parties that enter into agreements with the Distributor, may receive up to 0.25% of the Funds’ average net assets attributable to the Advisor Shares as compensation for distribution services.
DST Systems, Inc. serves as the transfer agent and dividend disbursing agent for the Funds under a transfer agency agreement with the Trust. The Funds may earn cash management credits which can be used to offset transfer agent expenses. During the six months ended June 30, 2022, the Small Company Fund earned credits of $281 and the Mid Cap Fund earned credits of $919, which were used to offset transfer agent expenses. These amounts are listed as “Fees Paid Indirectly” on the Statements of Operations.
U.S. Bank, N.A. as acts as custodian (the “Custodian”) for the Small Company Fund and Mid Cap Fund. The Custodian plays no role in determining the investment policies of the Funds or which securities are to be purchased or sold by the Funds.
| 38 | CHAMPLAIN INVESTMENT | PARTNERS | ||
| THE ADVISORS’ INNER CIRCLE FUND II | CHAMPLAIN FUNDS | |
| JUNE 30, 2022 | ||
| 5. | INVESTMENT ADVISORY AGREEMENT: |
For its services, the Adviser is entitled to a fee, which is calculated daily and paid monthly, at the following annual rate base on the average daily net assets of each fund:
| Fund | Advisory Fee | |
Small Company Fund | 0.90% on the first $ 250 million in assets; 0.80% on assets over $ 250 million | |
Mid Cap Fund | 0.80% on the first $ 250 million in assets; 0.70% on assets over $ 250 million |
The Adviser has contractually agreed to limit the total expenses of the Small Company Fund – Advisor Shares, Small Company Fund – Institutional Shares, Mid Cap Fund – Advisor Shares, and Mid Cap Fund – Institutional Shares (excluding interest, taxes, brokerage commissions, acquired fund fees and extraordinary expenses) to 1.30%, 1.05%, 1.20%, and 0.95% of the Funds’ respective average daily net assets through April 30, 2023. To maintain these expense limitations, the Adviser may waive a portion of its advisory fee and/or reimburse certain expenses of the Funds. If at any point it becomes unnecessary for the Adviser, Administrator, or shareholder service agent to make expense limitation reimbursements, the Adviser may retain the difference between the “Total Annual Fund Operating Expenses” and the aforementioned expense limitations to recapture all or a portion of its prior expense limitation reimbursements made during the preceding three year period.
6. SHARE TRANSACTIONS:
| Champlain Small Company Fund | Period Ended June 30, 2022 (Unaudited) | Year Ended December 31, 2021 | ||||||
Advisor Shares | ||||||||
Issued | 1,271,561 | 2,080,811 | ||||||
Reinvestment of Distributions | — | 859,005 | ||||||
Redeemed | (1,647,879 | ) | (3,508,784 | ) | ||||
|
|
|
| |||||
Net Advisor Shares Capital Share Transactions | (376,318 | ) | (568,968 | ) | ||||
|
|
|
| |||||
Institutional Shares | ||||||||
Issued | 12,899,315 | 39,450,572 | ||||||
Reinvestment of Distributions | — | 5,920,796 | ||||||
Redeemed | (32,016,345 | ) | (23,584,252 | ) | ||||
|
|
|
| |||||
Net Institutional Shares Capital Share Transactions | (19,117,030 | ) | 21,787,116 | |||||
|
|
|
| |||||
Net Increase (Decrease) in Shares Outstanding | (19,493,348 | ) | 21,218,148 | |||||
|
|
|
| |||||
| 39 | CHAMPLAIN INVESTMENT | PARTNERS | ||
| THE ADVISORS’ INNER CIRCLE FUND II | CHAMPLAIN FUNDS | |
| JUNE 30, 2022 | ||
| Champlain Mid Cap Fund | Period Ended June 30, 2022 (Unaudited) | Year Ended December 31, 2021 | ||||||
Advisor Shares | ||||||||
Issued | 1,084,414 | 1,833,113 | ||||||
Reinvestment of Distributions | — | 1,195,353 | ||||||
Redeemed | (1,772,878 | ) | (2,765,631 | ) | ||||
|
|
|
| |||||
Net Advisor Shares Capital Share Transactions | (688,464 | ) | 262,835 | |||||
|
|
|
| |||||
Institutional Shares | ||||||||
Issued | 34,914,118 | 55,038,619 | ||||||
Reinvestment of Distributions | — | 18,131,005 | ||||||
Redeemed | (38,228,540 | ) | (39,413,460 | ) | ||||
|
|
|
| |||||
Net Institutional Shares Capital Share Transactions | (3,314,422 | ) | 33,756,164 | |||||
|
|
|
| |||||
Net Increase (Decrease) in Shares Outstanding | (4,002,886 | ) | 34,018,999 | |||||
|
|
|
| |||||
7. INVESTMENT TRANSACTIONS:
For the six months ended June 30, 2022, the purchases and sales of investment securities other than long-term U.S. Government and short-term investments were:
| Purchases | Sales | |||||||
Small Company Fund | $ | 481,977,509 | $ | 928,155,575 | ||||
Mid Cap Fund | 918,595,863 | 965,648,601 | ||||||
There were no purchases or sales of long-term U.S. Government securities for any of the Funds.
8. FEDERAL TAX INFORMATION:
The amount and character of income and capital gain distributions, if any, to be paid, are determined in accordance with Federal income tax regulations, which may differ from U.S. GAAP. As a result, net investment income (loss) and net realized gain (loss) on investment transactions for a reporting period may differ significantly from distributions during such period. These book/tax differences may be temporary or permanent. To the extent these differences are permanent in nature, they are charged or credited to distributable earnings or paid-in capital, as appropriate, in the period that the differences arise.
| 40 | CHAMPLAIN INVESTMENT | PARTNERS | ||
| THE ADVISORS’ INNER CIRCLE FUND II | CHAMPLAIN FUNDS | |
| JUNE 30, 2022 | ||
The tax character of dividends and distributions declared during the fiscal year ended December 31, 2021, period ended December 31, 2020 and fiscal year July 31, 2020 were as follows:
| Ordinary Income | Long-Term Capital Gain | Return of Capital | Total | |||||||||||||
Small Company Fund | ||||||||||||||||
2021 | $ | 89,618,158 | $ | 75,527,347 | $ | — | $ | 165,145,505 | ||||||||
2020(1) | 33,738,834 | 145,400,440 | — | 179,139,274 | ||||||||||||
2020 | 6,326,850 | 147,396,914 | — | 153,723,764 | ||||||||||||
Mid Cap Fund | ||||||||||||||||
2021 | 291,375,458 | 391,715,248 | — | 683,090,706 | ||||||||||||
2020(1) | 137,792,050 | 108,707,168 | — | 246,499,218 | ||||||||||||
2020 | 30,237,620 | 117,012,099 | — | 147,249,719 | ||||||||||||
(1) For the period August 1, 2020 to December 31, 2020. Effective August 19, 2020, the Small Company Fund and Mid Cap Fund changed their fiscal year end to December 31 (see Note 1 in the Notes to Financials).
For tax purposes, short term gains are considered ordinary income.
As of December 31, 2021, the components of Distributable Earnings on a tax basis were as follows:
| Small Company Fund | Mid Cap Fund | |||||||
Undistributed Ordinary Income | $ | 6,153,193 | $ | 13,219,653 | ||||
Undistributed Long-Term Capital Gain | 2,681,358 | 36,885,779 | ||||||
Unrealized Appreciation | 1,071,256,750 | 2,543,741,460 | ||||||
Other Temporary Differences | 6 | (2 | ) | |||||
|
|
|
| |||||
Total Distributable Earnings | $ | 1,080,091,307 | $ | 2,593,846,890 | ||||
|
|
|
| |||||
For Federal income tax purposes, the cost of securities owned at December 31, 2021 and net realized gains or losses on securities sold for the period were different from the amounts reported for financial reporting purposes. These differences were primarily due to wash sales, which cannot be used for Federal income tax purposes in the current period and have been deferred for use in future years.
The Federal tax cost and aggregate gross unrealized appreciation (depreciation) on investments held by the Funds at June 30, 2022:
| Federal Tax Cost | Aggregate Gross Unrealized Appreciation | Aggregate Gross Unrealized Depreciation | Net Unrealized Appreciation (Depreciation) | |||||||||||||
Small Company Fund | $ | 2,311,406,426 | $ | 502,535,312 | $ | (286,598,772) | $ | 215,936,540 | ||||||||
Mid Cap Fund | 4,745,262,764 | 1,060,533,846 | (603,026,942) | 457,506,904 | ||||||||||||
| 41 | CHAMPLAIN INVESTMENT | PARTNERS | ||
| THE ADVISORS’ INNER CIRCLE FUND II | CHAMPLAIN FUNDS | |
| JUNE 30, 2022 | ||
9. CONCENTRATION OF RISKS:
As with investing in all mutual funds, investing in the Funds involves risk, and there is no guarantee that the Funds will achieve their investment goals. You could lose money on your investment in a Fund, just as you could with other investments. As described in each Fund’s Prospectus, the Funds are subject to the following risks noted below, any of which may adversely affect the Fund’s net asset value and ability to meet its investment objective:
MARKET RISK (Each Fund) – The prices of and the income generated by the Fund’s securities may decline in response to, among other things, investor sentiment, general economic and market conditions, regional or global instability, and currency and interest rate fluctuations. In addition, the impact of any epidemic, pandemic or natural disaster, or widespread fear that such events may occur, could negatively affect the global economy, as well as the economies of individual countries, the financial performance of individual companies and sectors, and the markets in general in significant and unforeseen ways. Any such impact could adversely affect the prices and liquidity of the securities and other instruments in which the Fund invests, which in turn could negatively impact the Fund’s performance and cause losses on your investment in the Fund.
ACTIVE MANAGEMENT RISK (Each Fund) – The Fund is subject to the risk that the Adviser’s judgments about the attractiveness, value, or potential appreciation of the Fund’s investments may prove to be incorrect. If the investments selected and strategies employed by the Fund fail to produce the intended results, the Fund could underperform in comparison to other funds with similar objectives and investment strategies.
EQUITY RISK (Each Fund) – Since it purchases equity securities, the Fund is subject to the risk that stock prices will fall over short or extended periods of time. Historically, the equity markets have moved in cycles, and the value of the Fund’s equity securities may fluctuate drastically from day to day. Individual companies may report poor results or be negatively affected by industry and/or economic trends and developments. The prices of securities issued by such companies may suffer a decline in response. These factors contribute to price volatility, which is the principal risk of investing in the Fund.
SMALL-CAPITALIZATION COMPANY RISK (Small Company Fund) – The Fund is also subject to the risk that small-capitalization stocks may underperform other segments of the equity market or the equity market as a whole. The small-capitalization companies that the Fund invests in may be more vulnerable to adverse business or economic events than larger, more established companies. In particular, investments in these small-sized companies may pose additional risks, including liquidity risk, because these companies tend to have limited product lines, markets and financial resources, and may depend upon a relatively small management group. Therefore, small-cap stocks may be more volatile than those of larger companies. These securities may be traded over-the-counter or listed on an exchange.
| 42 | CHAMPLAIN INVESTMENT | PARTNERS | ||
| THE ADVISORS’ INNER CIRCLE FUND II | CHAMPLAIN FUNDS | |
| JUNE 30, 2022 | ||
MID-CAPITALIZATION COMPANY RISK (Mid Cap Fund) – The Fund is also subject to the risk that medium-capitalization stocks may underperform other segments of the equity market or the equity market as a whole. The medium-sized companies the Fund invests in may be more vulnerable to adverse business or economic events than larger, more established companies. In particular, investments in these medium-sized companies may pose additional risks, including liquidity risk, because these companies tend to have limited product lines, markets and financial resources, and may depend upon a relatively small management group. Therefore, mid-capitalization stocks may be more volatile than those of larger companies. These securities may be traded over-the-counter or listed on an exchange.
10. OTHER:
At June 30, 2022, 88% of the total shares outstanding of the Small Company Fund Advisor Shares were held by two shareholders, 79% of the total shares outstanding of the Small Company Fund Institutional Shares were held by five shareholders; 71% of the total shares outstanding of the Mid Cap Fund Advisor Shares were held by three shareholders, 42% of the total shares outstanding of the Mid Cap Fund Institutional Shares were held by three shareholders. These shareholders were comprised of omnibus accounts that were held on behalf of various individual shareholders.
In the normal course of business, the Funds enter into contracts that provide general indemnifications. The Funds’ maximum exposure under these arrangements is dependent on future claims that may be made against the Funds and, therefore, cannot be established; however, based on experience, the risk of loss from such claim is considered remote.
11. LINE OF CREDIT:
The Small Company Fund and Mid Cap Fund entered into agreements which enable them to participate in lines of credit with the Custodian. The Small Company Fund and Mid Cap Fund entered into a new umbrella line of credit with the Custodian which will enable the Funds to participate in a single $250 million uncommitted, senior secured line of credit, with an expiration date of March 14, 2023.
The proceeds from the borrowings shall be used to provide temporary liquidity to the Funds as necessary in order to meet redemption needs. Interest is charged to the Funds based on the outstanding principal balance of the borrowings at an annual rate equal to the Custodian’s then current prime-lending rate. These fees are included as “Other Expenses” on the Statements of Operations. From June 15, 2022 through June 16, 2022, the Small Company Fund borrowed an average of $119,800 at an interest rate of 4.00%. From June 15, 2022 through June 17, 2022, the Mid Cap Fund borrowed an average of $737,833 at an average rate of 4.00%. As of the six months ended June 30, 2022, there were no borrowings outstanding.
| 43 | CHAMPLAIN INVESTMENT | PARTNERS | ||
| THE ADVISORS’ INNER CIRCLE FUND II | CHAMPLAIN FUNDS | |
| JUNE 30, 2022 | ||
12. SUBSEQUENT EVENTS:
The Funds have been evaluated by management regarding the need for additional disclosures and/or adjustments resulting from subsequent events. Based on this evaluation, no additional disclosures and/or adjustments were required to the financial statements.
| 44 | CHAMPLAIN INVESTMENT | PARTNERS | ||
| THE ADVISORS’ INNER CIRCLE FUND II | CHAMPLAIN FUNDS | |
| JUNE 30, 2022 | ||
This page is intentionally left blank
| 45 | CHAMPLAIN INVESTMENT | PARTNERS | ||
| THE ADVISORS’ INNER CIRCLE FUND II | CHAMPLAIN FUNDS | |
| JUNE 30, 2022 | ||
| DISCLOSURE | OF FUND EXPENSES (Unaudited) |
All mutual funds have operating expenses. As a shareholder of a mutual fund, your investment is affected by these ongoing costs, which include (among others) costs for portfolio management, administrative services, and shareholder reports like this one. It is important for you to understand the impact of these costs on your investment returns.
Operating expenses such as these are deducted from the mutual fund’s gross income and directly reduce your final investment return. These expenses are expressed as a percentage of the mutual fund’s average net assets; this percentage is known as the mutual fund’s expense ratio.
The following examples use the expense ratio and are intended to help you understand the ongoing costs (in dollars) of investing in your Fund and to compare these costs with those of other mutual funds. The examples are based on an investment of $1,000 made at the beginning of the period shown and held for the entire period from January 1, 2022 to June 30, 2022.
The table on the next page illustrates your Fund’s costs in two ways:
| • | Actual Fund Return. This section helps you to estimate the actual expenses after fee waivers that your Fund incurred over the period. The “Expenses Paid During Period” column shows the actual dollar expense cost incurred by a $1,000 investment in the Fund, and the “Ending Account Value” number is derived from deducting that expense cost from the Fund’s gross investment return. You can use this information, together with the actual amount you invested in the Fund, to estimate the expenses you paid over that period. Simply divide your actual account value by $1,000 to arrive at a ratio (for example, an $8,600 account value divided by $1,000 = 8.6), then multiply that ratio by the number shown for your Fund under “Expenses Paid During Period.” |
| • | Hypothetical 5% Return. This section helps you compare your Fund’s costs with those of other mutual funds. It assumes that the Fund had an annual 5% return before expenses during the year, but that the expense ratio (Column 3) for the period is unchanged. This example is useful in making comparisons because the Securities and Exchange Commission requires all mutual funds to make this 5% calculation. You can assess your Fund’s comparative cost by comparing the hypothetical result for your Fund in the “Expenses Paid During Period” column with those that appear in the same charts in the shareholder reports for other mutual funds. |
| 46 | CHAMPLAIN INVESTMENT | PARTNERS | ||
| THE ADVISORS’ INNER CIRCLE FUND II | CHAMPLAIN FUNDS | |
| JUNE 30, 2022 | ||
| DISCLOSURE | OF FUND EXPENSES (Unaudited) (Concluded) |
Note: Because the hypothetical return is set at 5% for comparison purposes — NOT your Fund’s actual return — the account values shown may not apply to your specific investment.
| Beginning Account Value 1/1/22 | Ending Account Value 6/30/22 | Annualized Expense Ratios | Expenses Period * | |||||||||||||
Small Company Fund | ||||||||||||||||
Actual Fund Return | ||||||||||||||||
Advisor Shares | $ | 1,000.00 | $ | 737.40 | 1.28 | % | $ | 5.51 | ||||||||
Institutional Shares | 1,000.00 | 738.30 | 1.03 | 4.44 | ||||||||||||
Hypothetical 5% Return | ||||||||||||||||
Advisor Shares | $ | 1,000.00 | $ | 1,018.45 | 1.28 | % | $ | 6.41 | ||||||||
Institutional Shares | 1,000.00 | 1,019.69 | 1.03 | 5.16 | ||||||||||||
Mid Cap Fund | ||||||||||||||||
Actual Fund Return | ||||||||||||||||
Advisor Shares | $ | 1,000.00 | $ | 716.60 | 1.10 | % | $ | 4.68 | ||||||||
Institutional Shares | 1,000.00 | 717.60 | 0.85 | 3.62 | ||||||||||||
Hypothetical 5% Return | ||||||||||||||||
Advisor Shares | $ | 1,000.00 | $ | 1,019.34 | 1.10 | % | $ | 5.51 | ||||||||
Institutional Shares | 1,000.00 | 1,020.58 | 0.85 | 4.26 | ||||||||||||
| * | Expenses are equal to the Fund’s annualized expense ratio multiplied by the average account value over the period, multiplied by 181/365 (to reflect one-half year period shown). |
| 47 | CHAMPLAIN INVESTMENT | PARTNERS | ||
[THIS PAGE INTENTIONALLY LEFT BLANK]
[THIS PAGE INTENTIONALLY LEFT BLANK]
Champlain Funds
P.O. Box 219009
Kansas City, MO 64121-9009
866-773-3238
Adviser:
Champlain Investment Partners, LLC
180 Battery Street
Burlington, VT 05401
Distributor:
SEI Investments Distribution Co.
Oaks, PA 19456
Administrator:
SEI Investments Global Funds Services
One Freedom Valley Drive
Oaks, PA 19456
Legal Counsel:
Morgan, Lewis & Bockius LLP
1701 Market Street
Philadelphia, PA 19103-2921
Independent Registered Public Accounting Firm:
Ernst & Young LLP
One Commerce Square
2005 Market Street, Suite 700
Philadelphia, PA 19103
This information must be preceded or accompanied by a current prospectus for the Funds.
CSC-SA-001-1800
Item 2. Code of Ethics.
Not applicable for semi-annual report.
Item 3. Audit Committee Financial Expert.
Not applicable for semi-annual report.
Item 4. Principal Accountant Fees and Services.
Not applicable for semi-annual report.
Item 5. Audit Committee of Listed Registrants.
Not applicable to open-end management investment companies.
Item 6. Schedule of Investments.
Schedule of Investments is included as part of the Report to Shareholders filed under Item 1 of this form.
Item 7. Disclosure of Proxy Voting Policies and Procedures for Closed-End Management Investment Companies.
Not applicable to open-end management investment companies.
Item 8. Portfolio Managers of Closed-End Management Investment Companies.
Not applicable to open-end management investment companies.
Item 9. Purchases of Equity Securities by Closed-End Management Company and Affiliated Purchasers.
Not applicable to open-end management investment companies.
Item 10. Submission of Matters to a Vote of Security Holders.
There have been no changes to the procedures by which shareholders may recommend nominees to the Registrant’s Board of Trustees during the period covered by this report.
Item 11. Controls and Procedures.
(a) The Registrant’s principal executive and principal financial officers, or persons performing similar functions, have concluded that the Registrant’s disclosure controls and procedures, as defined in Rule 30a-3(c) under the Act (17 CFR § 270.30a-3(c)), as of a date within 90 days of the filing date of the report, are effective based on the evaluation of these controls and procedures required by Rule 30a-3(b) under the Act (17 CFR § 270.30a-3(b)) and Rules 13a-15(b) or 15d-15(b) under the Exchange Act, as amended (17 CFR § 240.13a-15(b) or § 240.15d-15(b)).
(b) There has been no change in the Registrant’s internal control over financial reporting (as defined in Rule 30a-3(d) under the Act (17 CFR § 270.30a-3(d)) that occurred during the period covered by this report that has materially affected, or is reasonably likely to materially affect, the Registrant’s internal control over financial reporting.
Items 12. Disclosure of Securities Lending Activities for Closed-End Management Investment Companies.
Not applicable to open-end management investment companies.
Items 13. Exhibits.
(a)(1) Not applicable for semi-annual report.
SIGNATURES
Pursuant to the requirements of the Securities Exchange Act of 1934 and the Investment Company Act of 1940, the Registrant has duly caused this report to be signed on its behalf by the undersigned, thereunto duly authorized.
(Registrant) | The Advisors’ Inner Circle Fund II | |||||
By (Signature and Title) | /s/ Michael Beattie | |||||
Michael Beattie, President | ||||||
Date: September 7, 2022
Pursuant to the requirements of the Securities Exchange Act of 1934 and the Investment Company Act of 1940, this report has been signed below by the following persons on behalf of the Registrant and in the capacities and on the dates indicated.
By (Signature and Title) | /s/ Michael Beattie | |||||
Michael Beattie, President |
Date: September 7, 2022
By (Signature and Title) | /s/ Andrew Metzger | |||||
Andrew Metzger, Treasurer, Controller, and CFO |
Date: September 7, 2022