FORM 6-K
SECURITIES AND EXCHANGE COMMISSION
Washington, D.C. 20549
Report of Foreign Issuer
Pursuant to Rule 13a-16 or 15d-16
of the Securities Exchange Act of 1934
For the month of July, 2022
Commission File Number: 001-12518
Banco Santander, S.A.
(Exact name of registrant as specified in its charter)
Ciudad Grupo Santander
28660 Boadilla del Monte (Madrid) Spain
(Address of principal executive office)
Indicate by check mark whether the registrant files or will file annual reports under cover of Form 20-F or Form 40-F:
Form 20-F ☒ Form 40-F ☐
Indicate by check mark if the registrant is submitting the Form 6-K in paper as permitted by Regulation S-T Rule 101(b)(1):
Yes ☐ No ☒
Indicate by check mark if the registrant is submitting the Form 6-K in paper as permitted by Regulation S-T Rule 101(b)(7):
Yes ☐ No ☒
BANCO SANTANDER, S.A.
________________________
TABLE OF CONTENTS
| Part 1. January - June 2022 Financial Report | |||||

| January - June | 2022 | ||||
Index

This report was approved by the board of directors on 27 July 2022, following a favourable report from the audit committee. Important information regarding this report can be found on pages 89 and 90.
Key consolidated data
| BALANCE SHEET (EUR million) | Jun-22 | Mar-22 | % | Jun-22 | Jun-21 | % | Dec-21 | ||||||||||||||||
| Total assets | 1,722,840 | 1,666,012 | 3.4 | 1,722,840 | 1,568,636 | 9.8 | 1,595,835 | ||||||||||||||||
| Loans and advances to customers | 1,037,721 | 1,011,497 | 2.6 | 1,037,721 | 954,518 | 8.7 | 972,682 | ||||||||||||||||
| Customer deposits | 973,787 | 957,820 | 1.7 | 973,787 | 894,127 | 8.9 | 918,344 | ||||||||||||||||
| Total funds | 1,204,407 | 1,196,544 | 0.7 | 1,204,407 | 1,121,969 | 7.3 | 1,153,656 | ||||||||||||||||
| Total equity | 97,462 | 99,378 | (1.9) | 97,462 | 95,745 | 1.8 | 97,053 | ||||||||||||||||
| Note: Total funds includes customer deposits, mutual funds, pension funds and managed portfolios | |||||||||||||||||||||||
| INCOME STATEMENT (EUR million) | Q2'22 | Q1'22 | % | H1'22 | H1'21 | % | 2021 | ||||||||||||||||
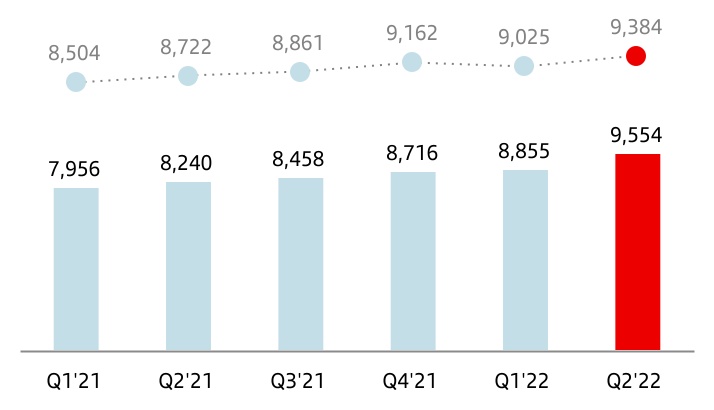
| Net interest income | 9,554 | 8,855 | 7.9 | 18,409 | 16,196 | 13.7 | 33,370 | ||||||||||||||||
| Total income | 12,815 | 12,305 | 4.1 | 25,120 | 22,695 | 10.7 | 46,404 | ||||||||||||||||
| Net operating income | 6,915 | 6,770 | 2.1 | 13,685 | 12,318 | 11.1 | 24,989 | ||||||||||||||||
| Profit before tax | 3,744 | 4,171 | (10.2) | 7,915 | 6,914 | 14.5 | 14,547 | ||||||||||||||||
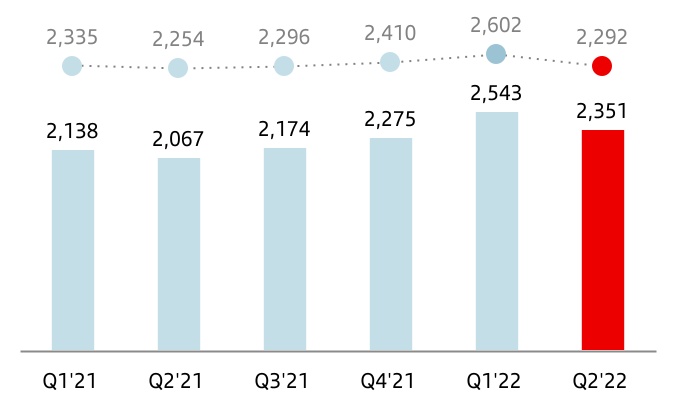
| Profit attributable to the parent | 2,351 | 2,543 | (7.6) | 4,894 | 3,675 | 33.2 | 8,124 | ||||||||||||||||
| Changes in constant euros: | |||||||||||||||||||||||
| Q2'22 / Q1'22: NII: +4.0%; Total income: +0.2%; Net operating income: -2.6%; Profit before tax: -14.4%; Attributable profit: -11.9% | |||||||||||||||||||||||
| H1'22 / H1'21: NII: +6.9%; Total income: +4.1%; Net operating income: +3.1%; Profit before taxes: +4.4%; Attributable profit: +20.8% | |||||||||||||||||||||||
| EPS, PROFITABILITY AND EFFICIENCY (%) | Q2'22 | Q1'22 | % | H1'22 | H1'21 | % | 2021 | ||||||||||||||||
| EPS (euros) | 0.131 | 0.141 | (7.2) | 0.272 | 0.197 | 38.1 | 0.438 | ||||||||||||||||
| RoE | 10.44 | 11.49 | 10.98 | 9.53 | 9.66 | ||||||||||||||||||
| RoTE | 13.10 | 14.21 | 13.69 | 11.82 | 11.96 | ||||||||||||||||||
| RoA | 0.63 | 0.71 | 0.66 | 0.61 | 0.62 | ||||||||||||||||||
| RoRWA | 1.76 | 1.95 | 1.86 | 1.66 | 1.69 | ||||||||||||||||||
| Efficiency ratio | 46.0 | 45.0 | 45.5 | 45.7 | 46.2 | ||||||||||||||||||
UNDERLYING INCOME STATEMENT (1) (EUR million) | Q2'22 | Q1'22 | % | H1'22 | H1'21 | % | 2021 | ||||||||||||||||
| Net interest income | 9,554 | 8,855 | 7.9 | 18,409 | 16,196 | 13.7 | 33,370 | ||||||||||||||||
| Total income | 12,815 | 12,305 | 4.1 | 25,120 | 22,695 | 10.7 | 46,404 | ||||||||||||||||
| Net operating income | 6,915 | 6,770 | 2.1 | 13,685 | 12,318 | 11.1 | 24,989 | ||||||||||||||||
| Profit before tax | 3,744 | 4,171 | (10.2) | 7,915 | 7,628 | 3.8 | 15,260 | ||||||||||||||||
| Profit attributable to the parent | 2,351 | 2,543 | (7.6) | 4,894 | 4,205 | 16.4 | 8,654 | ||||||||||||||||
| Changes in constant euros: | |||||||||||||||||||||||
| Q2'22 / Q1'22: NII: +4.0%; Total income: +0.2%; Net operating income: -2.6%; Profit before tax: -14.4%; Attributable profit: -11.9% | |||||||||||||||||||||||
| H1'22 / H1'21: NII: +6.9%; Total income: +4.1%; Net operating income: +3.1%; Profit before tax: -4.8%; Attributable profit: +6.7% | |||||||||||||||||||||||
UNDERLYING EPS AND PROFITABILITY (1) (%) | Q2'22 | Q1'22 | % | H1'22 | H1'21 | % | 2021 | ||||||||||||||||
| Underlying EPS (euros) | 0.131 | 0.141 | (7.2) | 0.272 | 0.227 | 19.5 | 0.468 | ||||||||||||||||
| Underlying RoE | 10.44 | 11.49 | 10.98 | 10.17 | 10.29 | ||||||||||||||||||
| Underlying RoTE | 13.10 | 14.21 | 13.69 | 12.62 | 12.73 | ||||||||||||||||||
| Underlying RoA | 0.63 | 0.71 | 0.66 | 0.65 | 0.65 | ||||||||||||||||||
| Underlying RoRWA | 1.76 | 1.95 | 1.86 | 1.75 | 1.78 | ||||||||||||||||||
January - June 2022 |  | 3 | ||||||
| SOLVENCY (%) | Jun-22 | Mar-22 | Jun-22 | Jun-21 | Dec-21 | ||||||||||||||||||
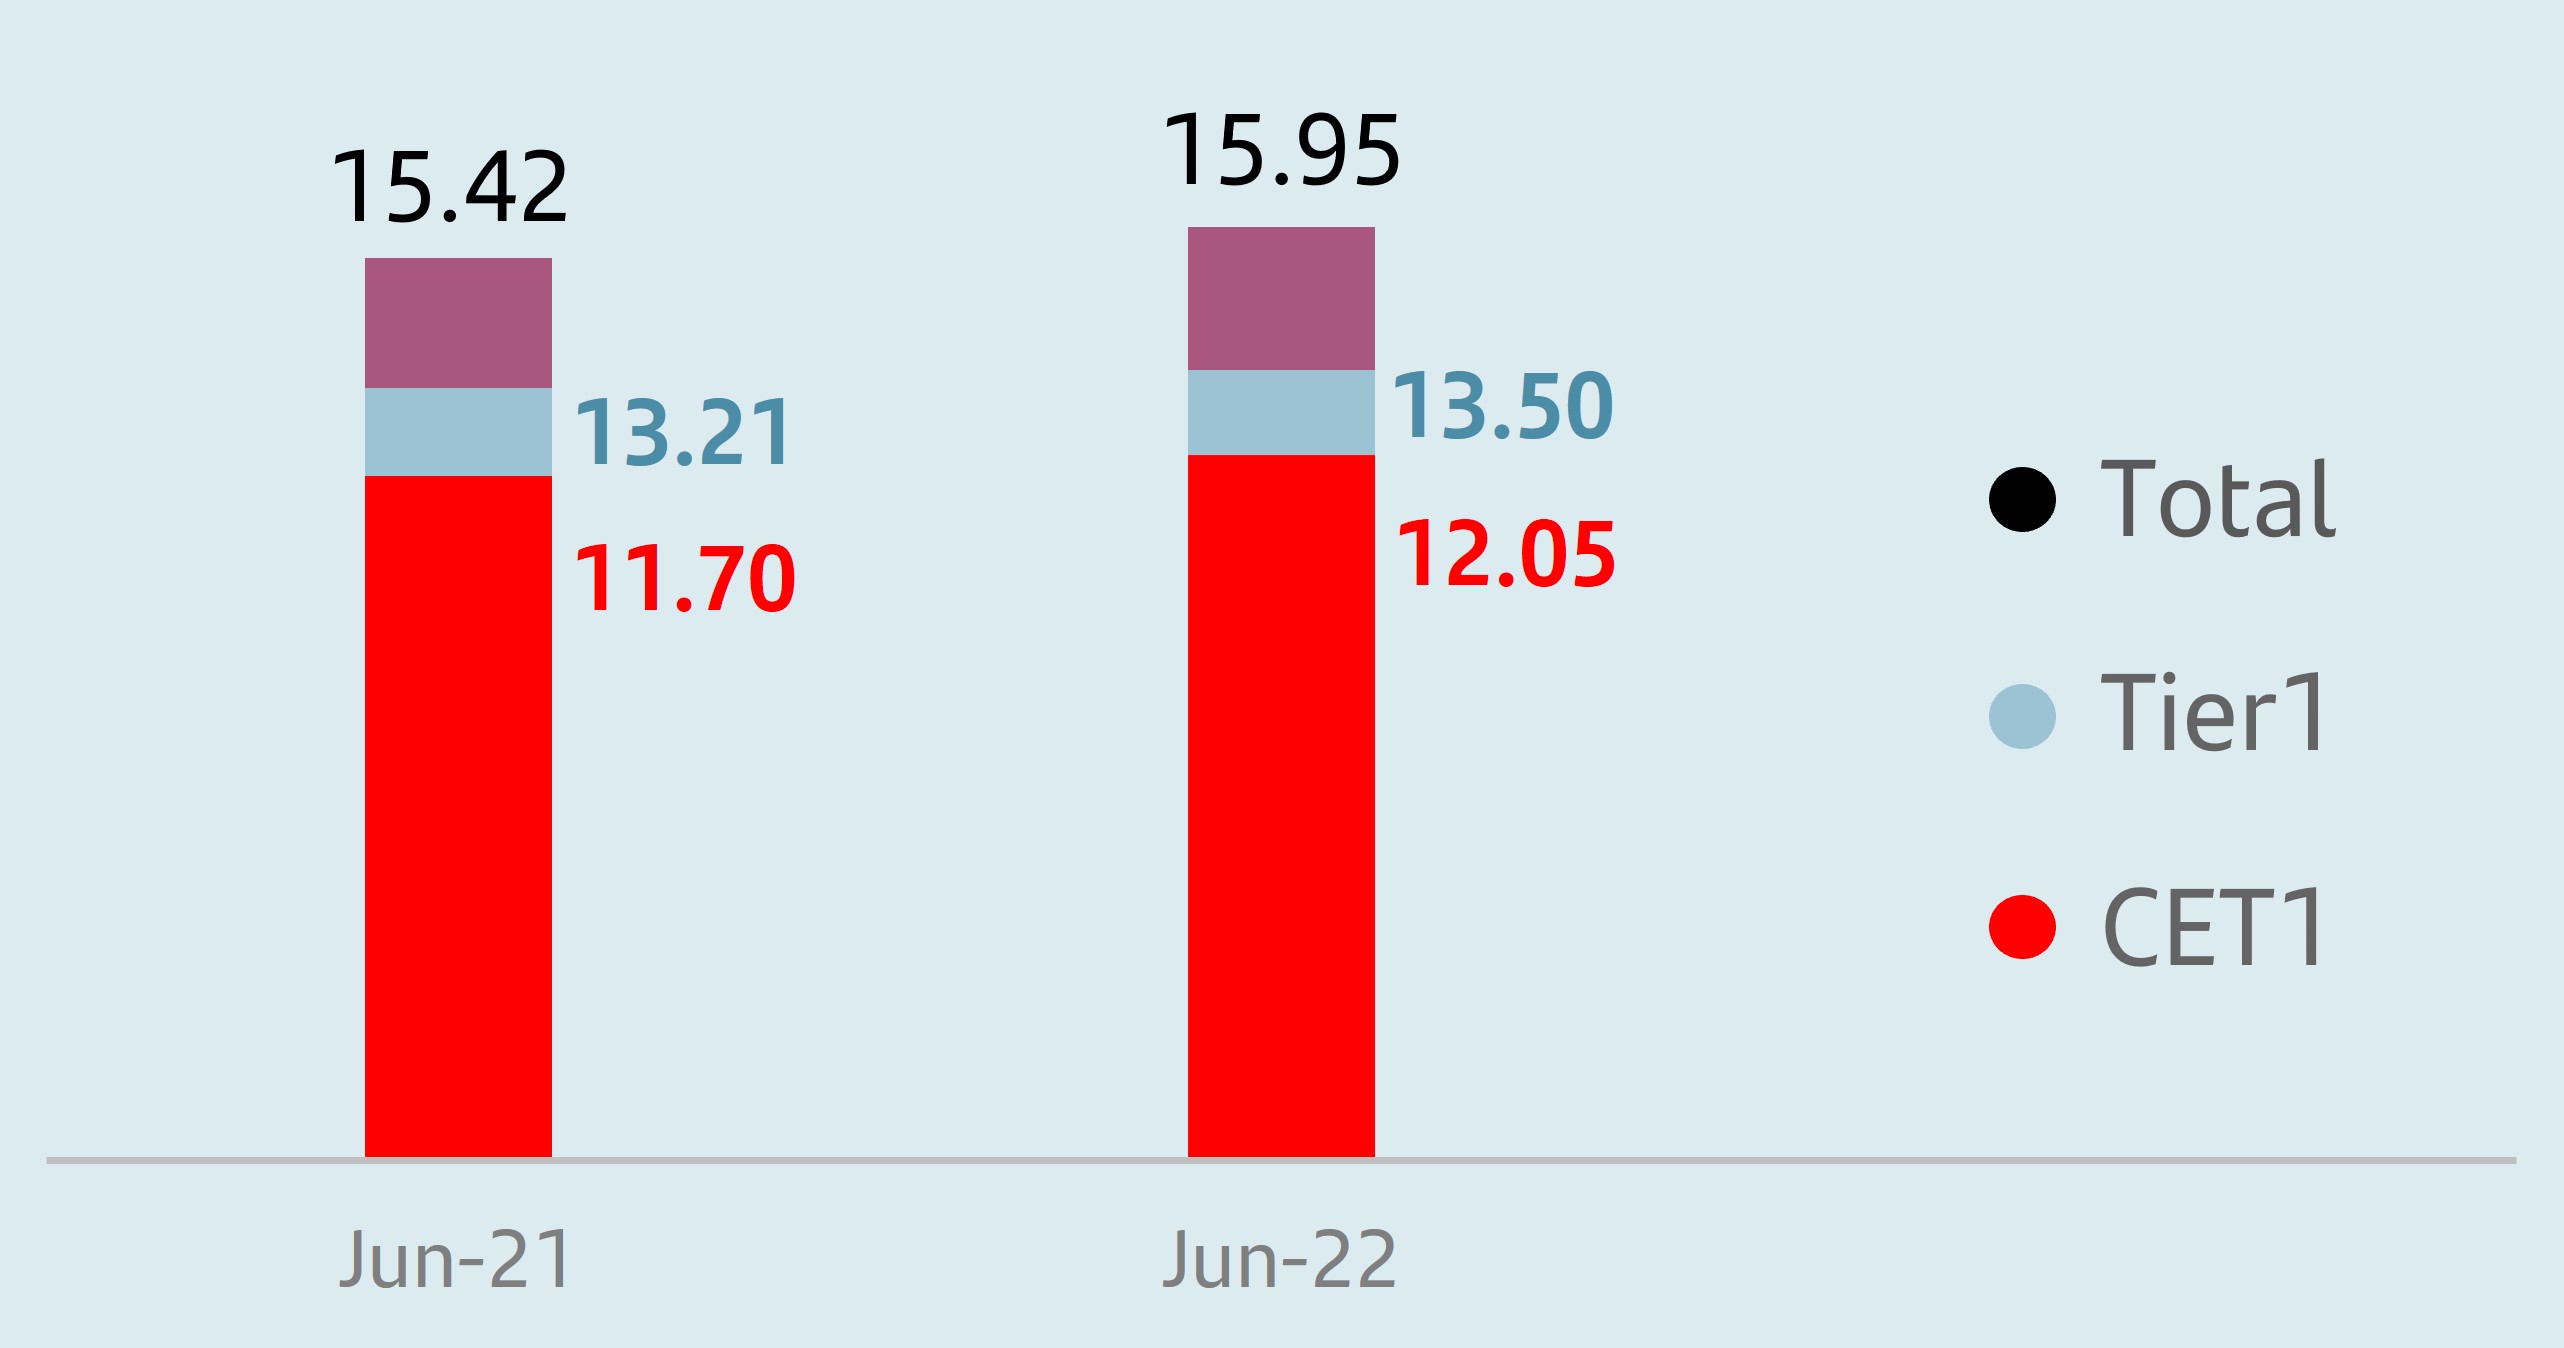
| Fully-loaded CET1 ratio | 12.05 | 12.12 | 12.05 | 11.70 | 12.12 | ||||||||||||||||||
| Fully-loaded total capital ratio | 15.95 | 16.15 | 15.95 | 15.42 | 16.41 | ||||||||||||||||||
| CREDIT QUALITY (%) | Q2'22 | Q1'22 | H1'22 | H1'21 | 2021 | ||||||||||||||||||
Cost of credit (2) | 0.83 | 0.77 | 0.83 | 0.94 | 0.77 | ||||||||||||||||||
| NPL ratio | 3.05 | 3.26 | 3.05 | 3.22 | 3.16 | ||||||||||||||||||
| Total coverage ratio | 71 | 69 | 71 | 73 | 71 | ||||||||||||||||||
| MARKET CAPITALIZATION AND SHARES | Jun-22 | Mar-22 | % | Jun-22 | Jun-21 | % | Dec-21 | ||||||||||||||||
| Shares (millions) | 16,794 | 17,341 | (3.2) | 16,794 | 17,341 | (3.2) | 17,341 | ||||||||||||||||
| Share price (euros) | 2.688 | 3.100 | (13.3) | 2.688 | 3.220 | (16.5) | 2.941 | ||||||||||||||||
| Market capitalization (EUR million) | 45,143 | 53,756 | (16.0) | 45,143 | 55,828 | (19.1) | 50,990 | ||||||||||||||||
| Tangible book value per share (euros) | 4.24 | 4.29 | 4.24 | 3.98 | 4.12 | ||||||||||||||||||
| Price / Tangible book value per share (X) | 0.63 | 0.72 | 0.63 | 0.81 | 0.71 | ||||||||||||||||||
| CUSTOMERS (thousands) | Q2'22 | Q1'22 | % | H1'22 | H1'21 | % | 2021 | ||||||||||||||||
| Total customers | 156,896 | 154,762 | 1.4 | 156,896 | 149,497 | 4.9 | 152,943 | ||||||||||||||||
| Loyal customers | 26,494 | 25,978 | 2.0 | 26,494 | 24,196 | 9.5 | 25,548 | ||||||||||||||||
| Loyal retail customers | 24,361 | 23,799 | 2.4 | 24,361 | 22,076 | 10.4 | 23,359 | ||||||||||||||||
| Loyal SME & corporate customers | 2,133 | 2,179 | (2.1) | 2,133 | 2,121 | 0.6 | 2,189 | ||||||||||||||||
| Digital customers | 49,870 | 49,158 | 1.4 | 49,870 | 45,444 | 9.7 | 47,489 | ||||||||||||||||
| Digital sales / Total sales (%) | 55 | 56 | 56 | 52 | 54 | ||||||||||||||||||
| OTHER DATA | Jun-22 | Mar-22 | % | Jun-22 | Jun-21 | % | Dec-21 | ||||||||||||||||
| Number of shareholders | 3,985,638 | 3,975,210 | 0.3 | 3,985,638 | 3,879,232 | 2.7 | 3,936,922 | ||||||||||||||||
| Number of employees | 200,651 | 200,294 | 0.2 | 200,651 | 192,843 | 4.0 | 199,177 | ||||||||||||||||
| Number of branches | 9,193 | 9,248 | (0.6) | 9,193 | 9,423 | (2.4) | 9,229 | ||||||||||||||||
| (1) In addition to financial information prepared in accordance with International Financial Reporting Standards (IFRS) and derived from our consolidated financial statements, this report contains certain financial measures that constitute alternative performance measures (APMs) as defined in the Guidelines on Alternative Performance Measures issued by the European Securities and Markets Authority (ESMA) on 5 October 2015, and other non-IFRS measures, including the figures related to “underlying” results, which do not include the items recorded in the separate line of “net capital gains and provisions”, above the line of profit attributable to the parent. Further details are provided in the “Alternative performance measures” section of the appendix to this report. For further details on the APMs and non-IFRS measures used, including its definition or a reconciliation between any applicable management indicators and the financial data presented in the annual consolidated financial statements prepared under IFRS, please see our 2021 Annual Financial Report, published in the CNMV on 25 February 2022, our 20-F report for the year ending 31 December 2021 filed with the SEC in the United States on 1 March 2022, as updated by the Form 6-K filed with the SEC on 8 April 2022 in order to reflect our new organizational and reporting structure, as well as the “Alternative performance measures” section of the appendix to this report. | ||
| (2) Allowances for loan-loss provisions over the last 12 months / Average loans and advances to customers over the last 12 months. | ||
| 4 | | January - June 2022 | ||||||
Business model | Group financial information | Financial information by segments | Responsible banking Corporate governance Santander share | Appendix | ||||||||||||||||||||||
Our business model is based on three pillars
| 01. Customer focus | 02. Our scale | 03. Diversification | |||||||||||||||||||||
Deepening the relationships with our customers | Local scale and global reach | Geographic and business diversification | |||||||||||||||||||||
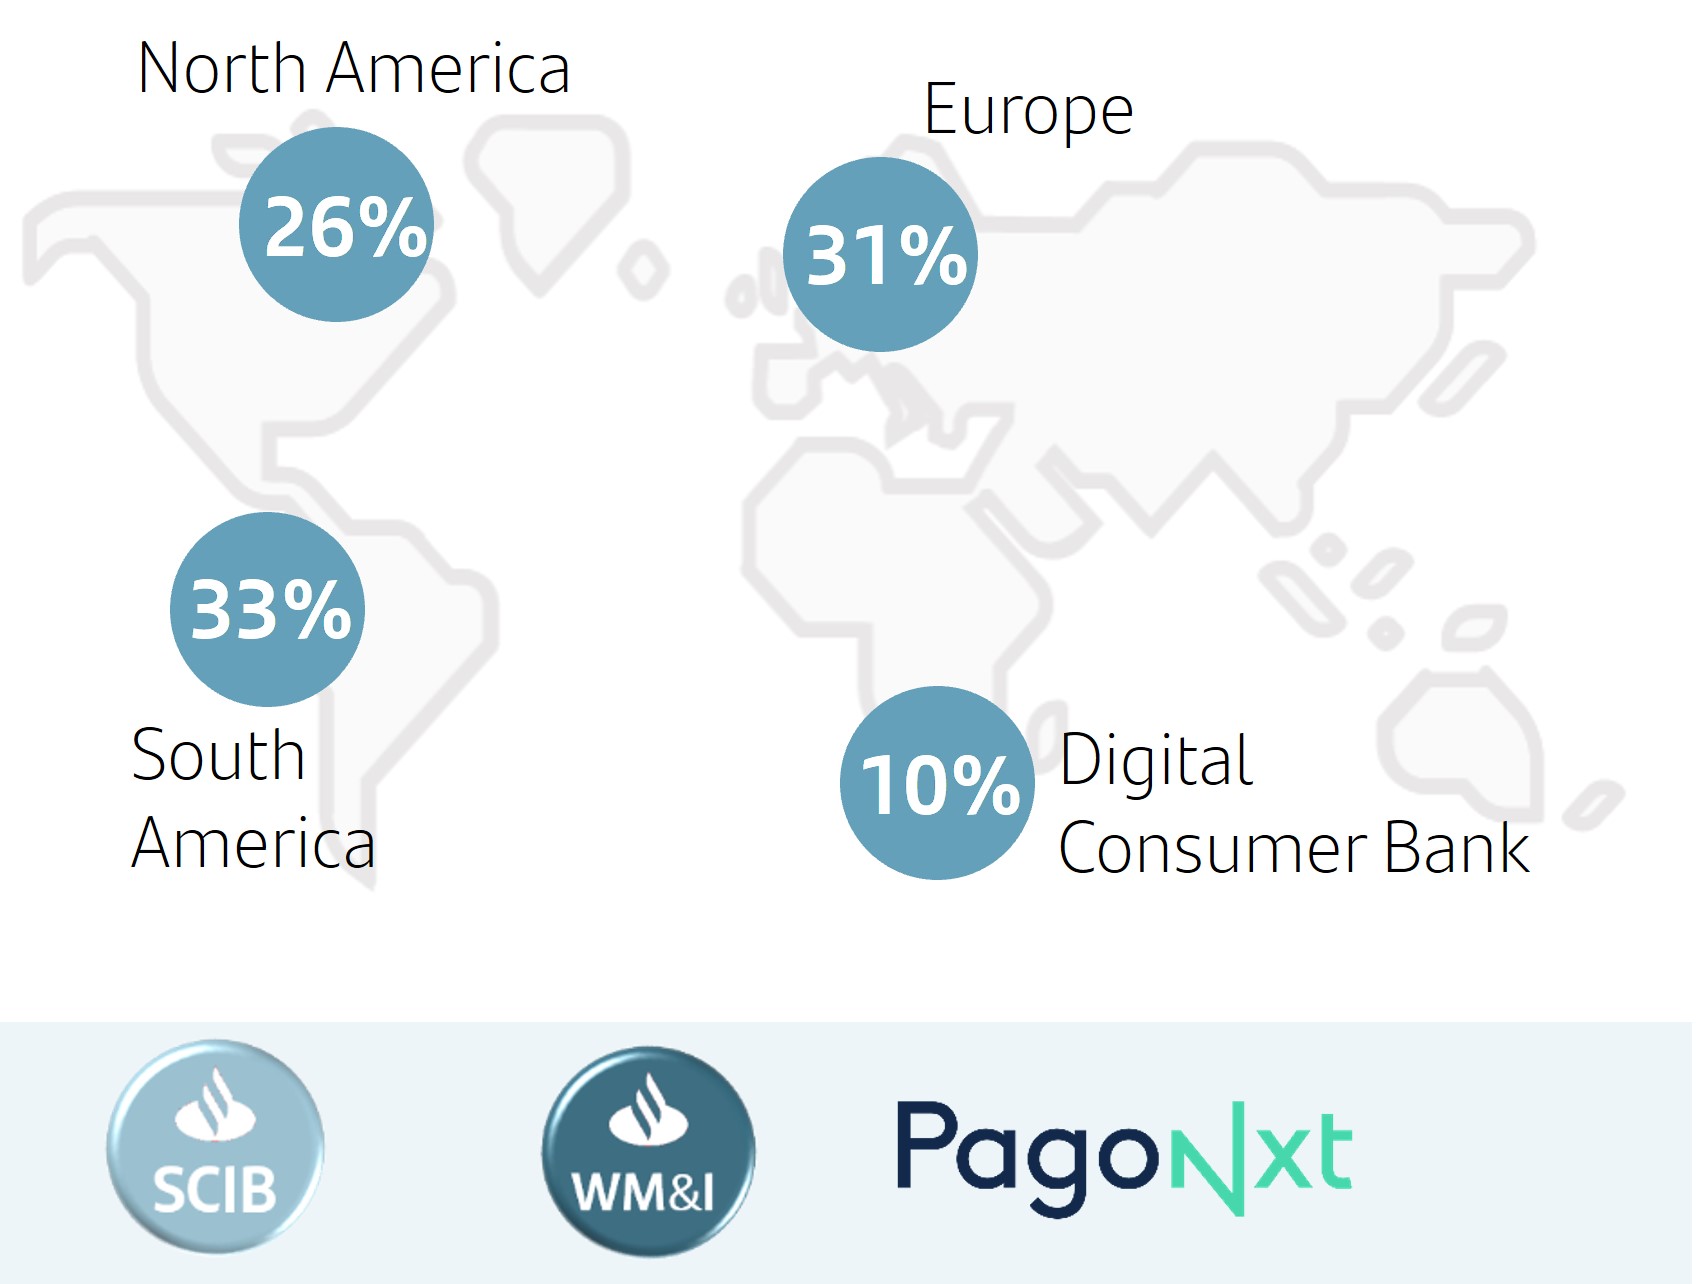
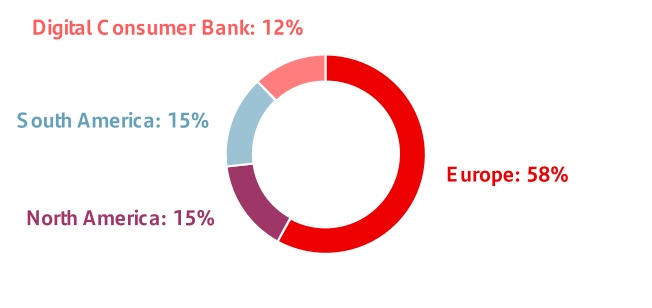
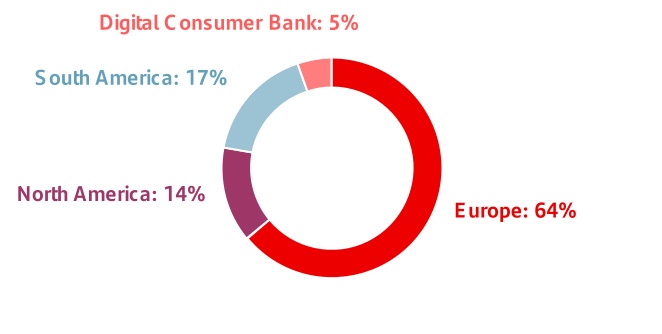
 | Top 3 NPS1 in 6 out of 9 markets | Top 3 in lending2 in 10 of our markets | Balanced profit distribution3 | ||||||||||||||||||||
 | |||||||||||||||||||||||
 | 157 mn total customers |  | |||||||||||||||||||||
| 1. NPS – internal benchmark of individual customers' satisfaction audited by Stiga / Deloitte in H1'22. | 2. Market share in lending as of March 2022 including only privately-owned banks. UK benchmark refers to the mortgage market. Digital Consumer Bank (DCB) refers to auto in Europe. | 3. H1'22 underlying attributable profit by region. Operating areas excluding Corporate Centre. | |||||||||||||||||||||
| Our business model remains a source of great strength and resilience | |||||||||||||||||||||||
Our corporate culture
The Santander Way remains unchanged to continue to deliver for all our stakeholders
Our purpose To help people and businesses prosper. | 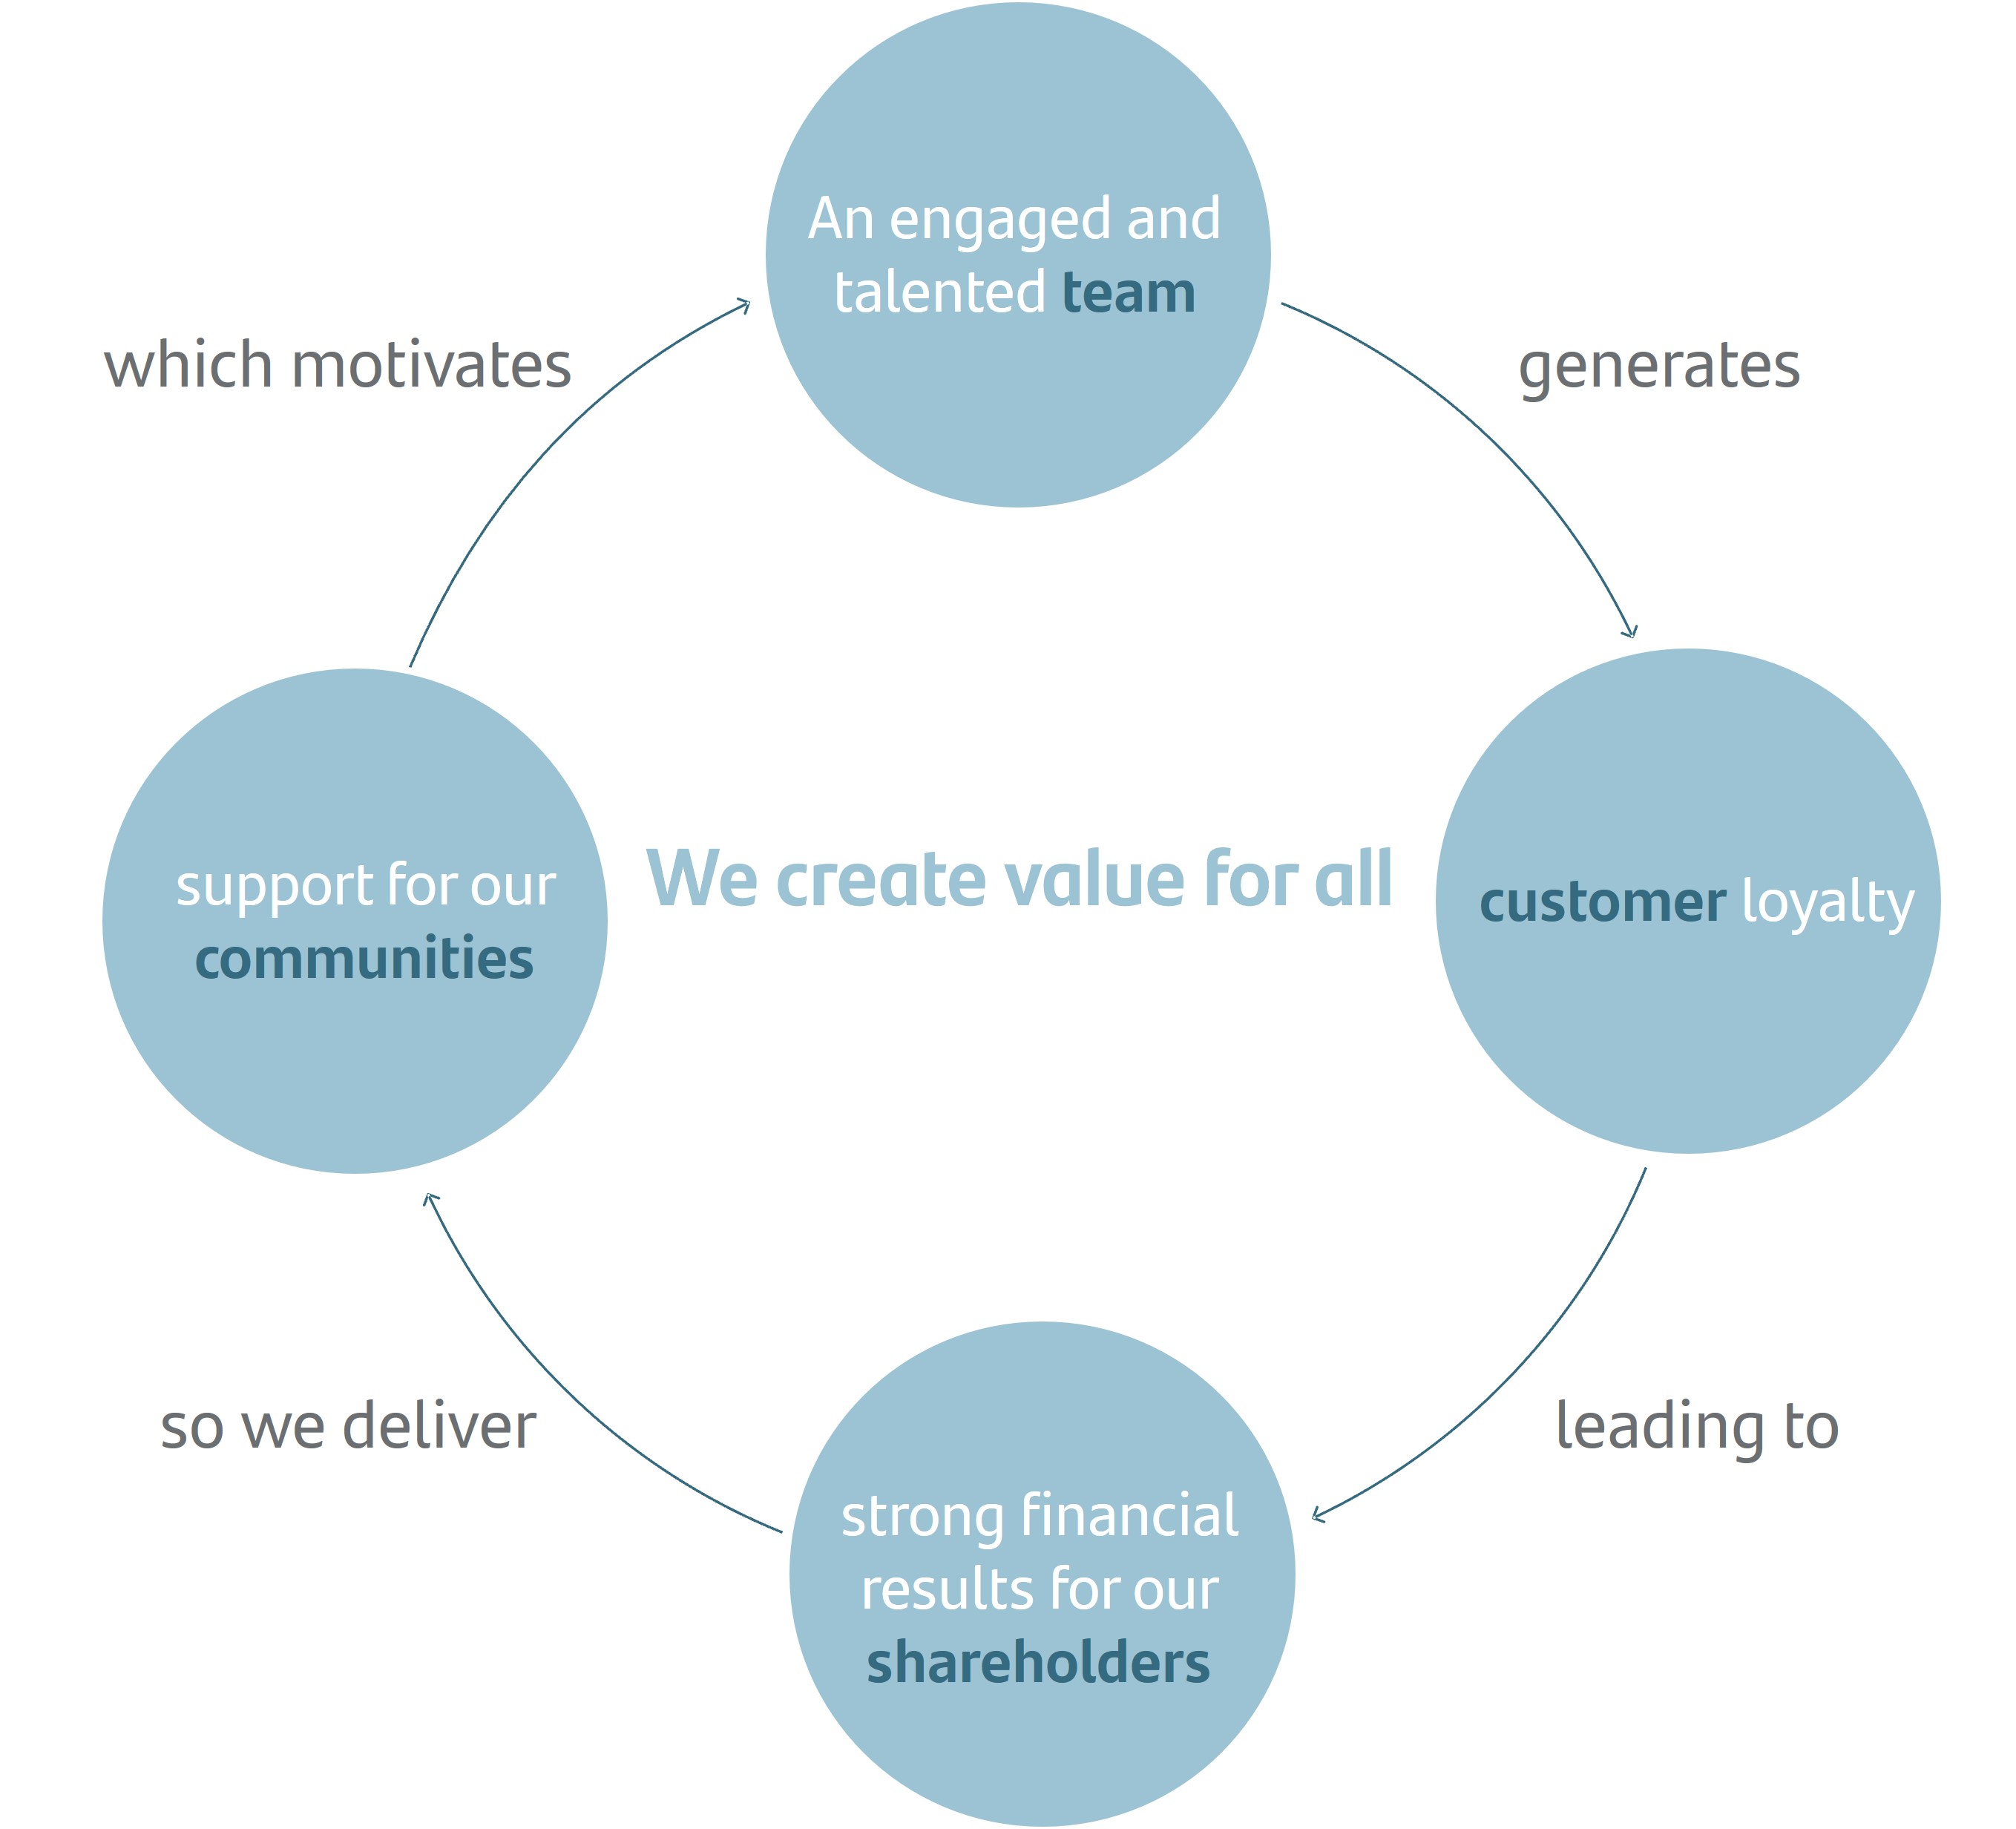 | ||||||||||
Our aim To be the best open financial services platform, by acting responsibly and earning the lasting loyalty of our people, customers, shareholders and communities. | |||||||||||
Our how Everything we do should be Simple, Personal and Fair. | |||||||||||
January - June 2022 | | 5 | ||||||
 | HIGHLIGHTS OF THE PERIOD | |||||||
 | u | In Q2'22, attributable profit amounted to EUR 2,351 million. The quarter-on-quarter comparison was affected by regulatory charges (Single Resolution Fund and, in Poland, Institutional Protection Scheme - IPS -). Excluding the regulatory charges, profit was 5% higher compared to the previous quarter (+1% in constant euros). | |||||||||
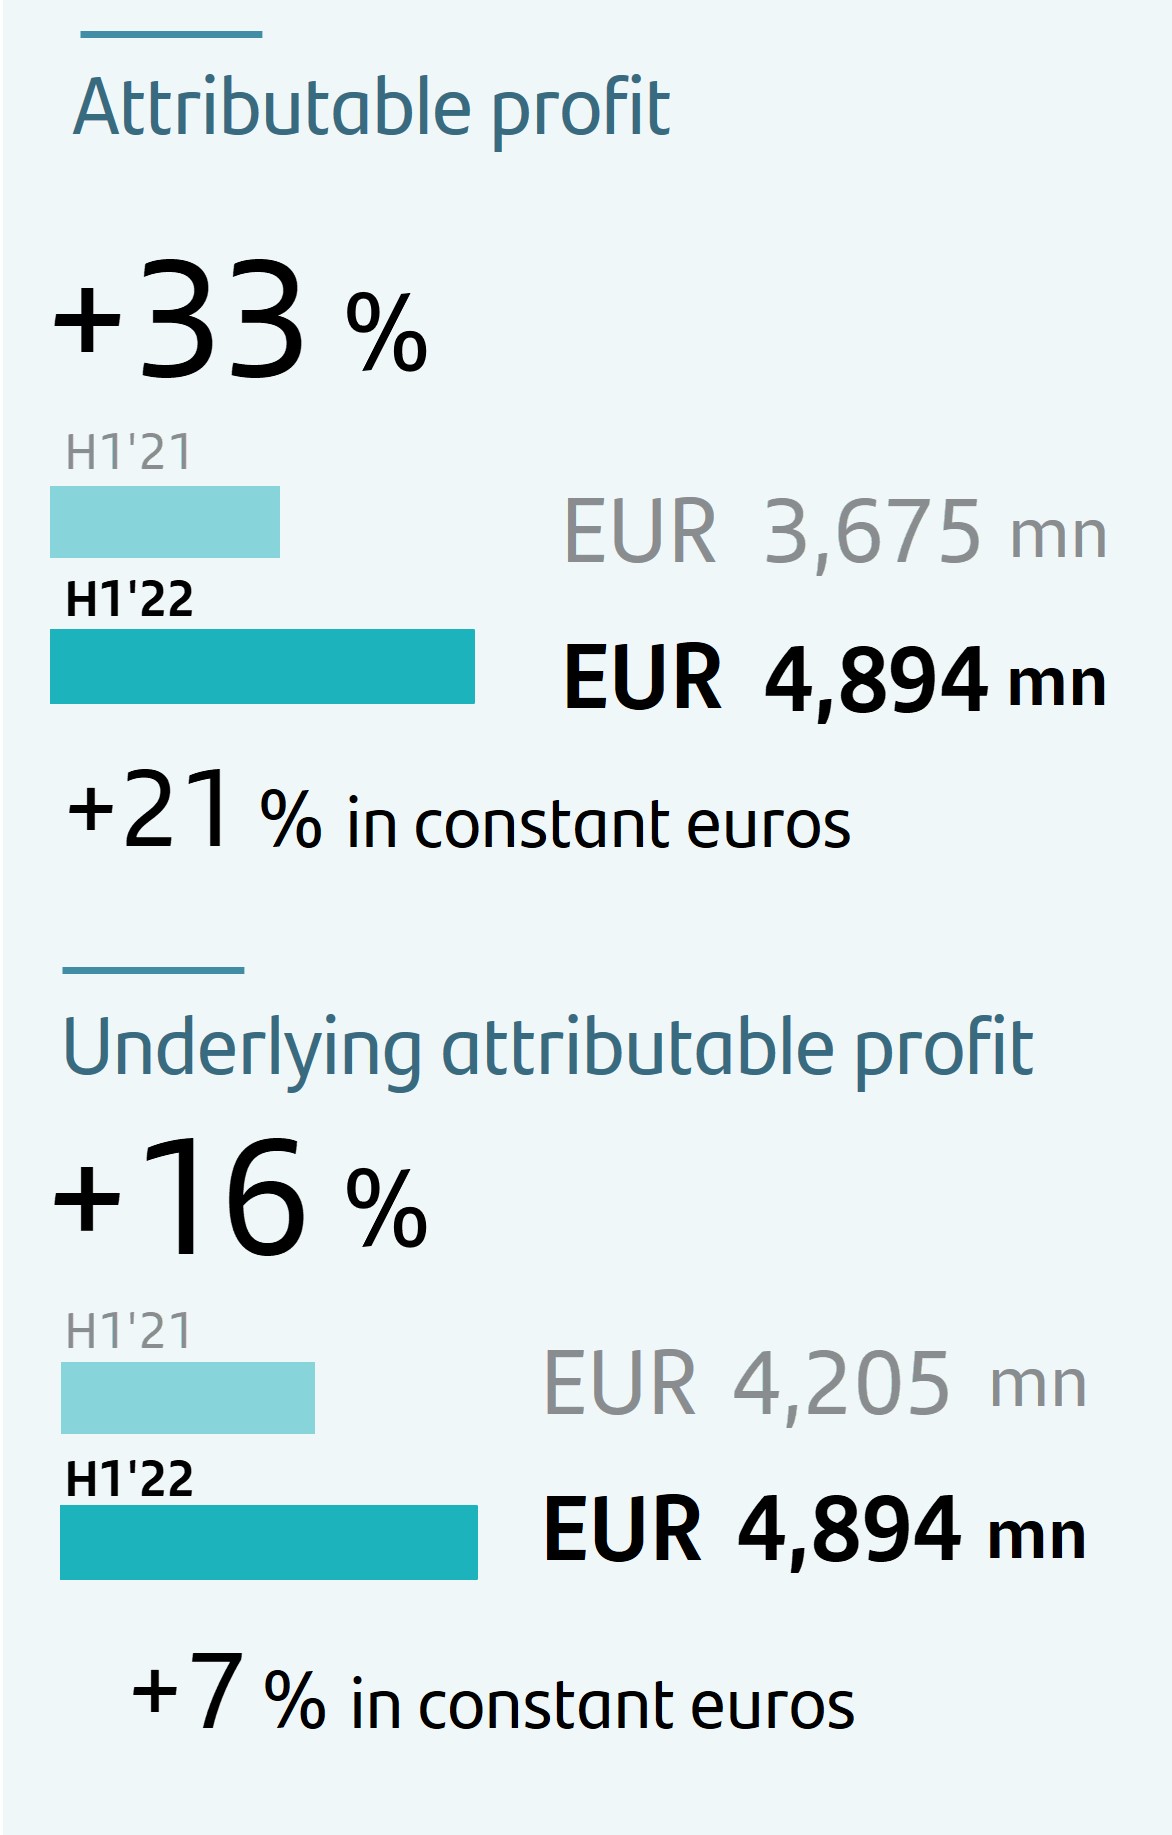
| u | In the first half of 2022, attributable profit rose to EUR 4,894 million, 33% more than in the first six months of 2021 (+21% in constant euros), when we recorded EUR 530 million of net charges for restructuring costs. Underlying profit also amounted to EUR 4,894 million, 16% higher (+7% in constant euros) versus the first half of 2021 (before restructuring costs). | ||||||||||
| u | Our geographic and business diversification to some extent protects us from adverse circumstances and enables us to resiliently face the indirect impacts arising from the Russia-Ukraine conflict. Santander's presence in and exposure to Russia and Ukraine is negligible. | ||||||||||
| u | In 2022, although it is difficult to make projections in the current environment, our strategy and business model are a clear competitive advantage. Under the main scenario we are considering, we believe we will meet the Group targets for the year announced at the Group's 2021 earnings presentation. | ||||||||||
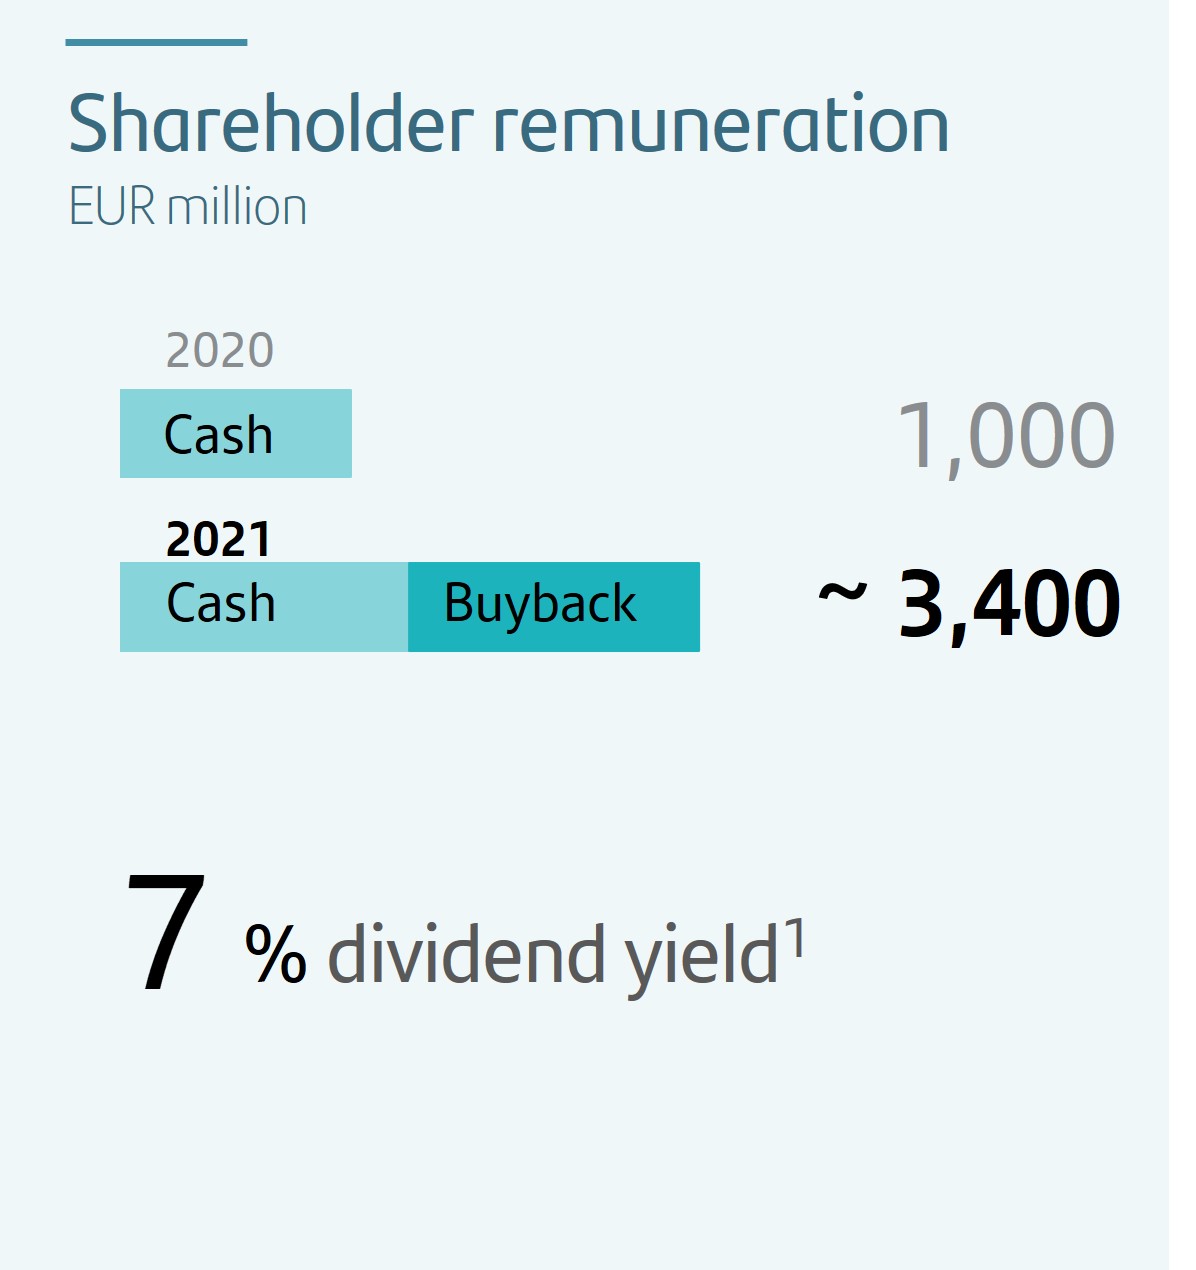 | u | In applying the shareholder remuneration policy for 2021, the bank paid a second interim cash dividend of EUR 5.15 cents per share in May 2022 against 2021 results. In addition, a second share buyback programme was implemented for a total amount of EUR 865 million, in which 286,309,445 own shares were acquired, equivalent to 1.7% of the bank's share capital, whose redemption was executed by the board of directors on 28 June 2022. As a result, the total amount allocated to shareholders was around EUR 3.4 billion, equivalent to approximately 40% of the Group's underlying attributable profit in 2021. | |||||||||
| u | The board approved a payout for 2022 of approximately 40% of underlying attributable profit, which will include both the cash dividend and the share buybacks, which are each expected to account for 50% of the payout2. | ||||||||||
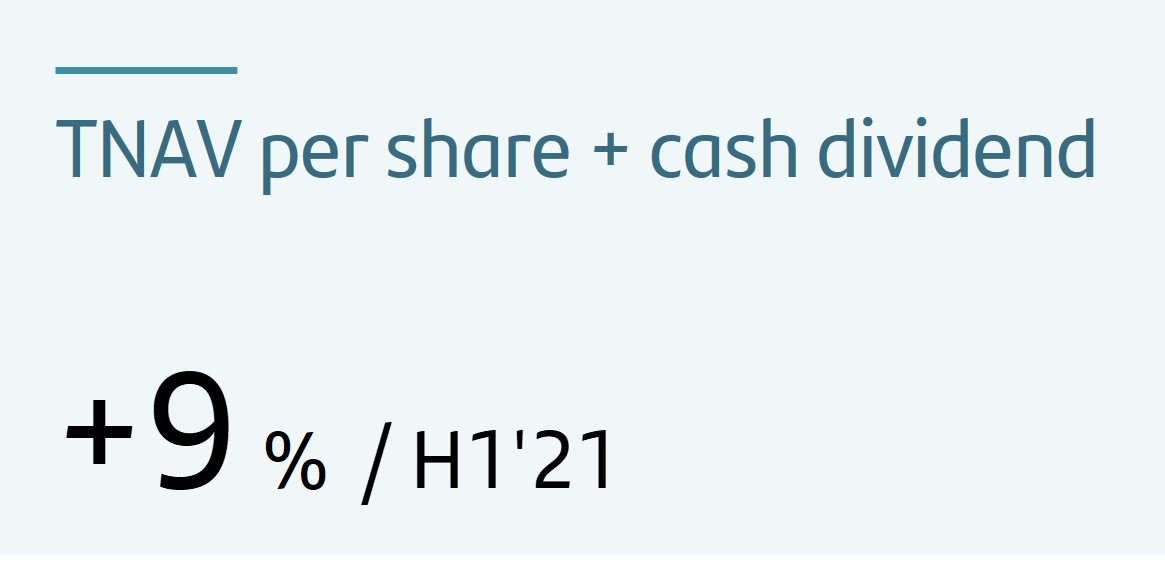 | u | TNAV per share was EUR 4.24, +9% year-on-year including the cash dividend per share paid in November 2021 and May 2022. In the quarter, TNAV per share plus dividend remained largely unchanged. | |||||||||
 | u | Santander is the leader in renewable energy financing and mobilized close to EUR 74.4 billion between 2019 and the end of H1'22. The Group's target is to mobilize EUR 220 billion in green finance by 2030. | |||||||||
| u | We have set three new decarbonization targets for 2030 (measured in emission reductions vs. 2019) in the energy (-29%), aviation (-33%) and steel (-32%) sectors. | ||||||||||
| u | In the first half, we granted EUR 426 million in loans through our microfinance programmes in 8 countries. | ||||||||||
| u | We were named Best Global Bank for Financial Inclusion by Euromoney, highlighting our programmes in South America and Mexico, and Best Bank for Corporate Responsibility in Central and Eastern Europe for our support to refugees from the Russia-Ukraine conflict. | ||||||||||
(1) As % of H1'22 average share price.
(2) Implementation of the shareholder remuneration policy is subject to future corporate and regulatory decisions and approvals.
| 6 | | January - June 2022 | ||||||
 | GROWTH | |||||||
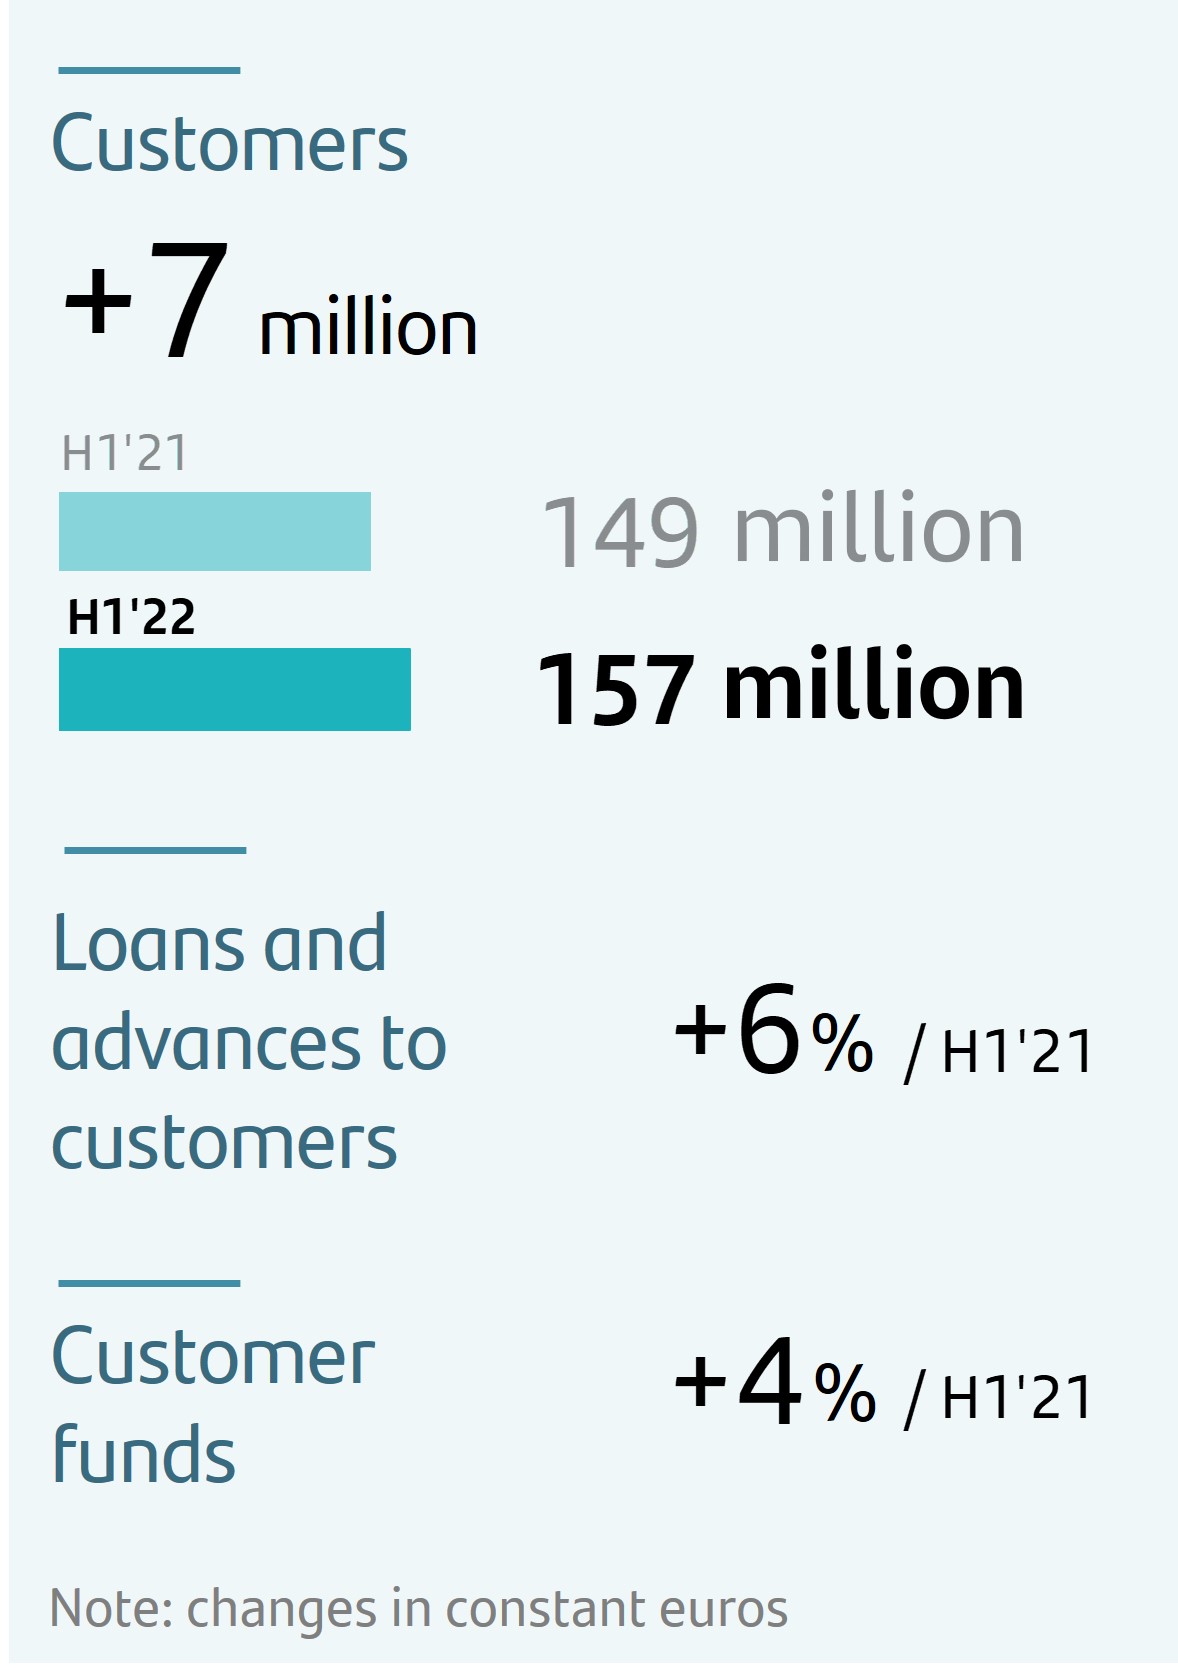 | u | Total customers amounted to 157 million, +7.4 million compared to June 2021. Loyal customers reached 26.5 million, 9% higher year-on-year. | |||||||||
| u | Digital adoption continued to be key, as we now have more than 50 million digital customers, an increase of 4 million since June 2021. In H1'22, 56% of sales were made through digital channels (52% in H1'21). | ||||||||||
| u | Business volumes continued to grow in a context of uncertainty. In this environment, loans and advances to customers rose 3% in the quarter and +9% year-on-year. Customer deposits rose 2% in the quarter and +9% year-on-year. Excluding the exchange rate impact, gross loans and advances to customers excluding reverse repos were 2% higher compared to Q1'22 and +6% versus H1'21. Customer funds excluding repos increased 1% in the quarter and 4% year-on-year. | ||||||||||
| u | Greater activity, together with higher interest rates and margin management, was reflected in the 14% rise in net interest income and a 13% increase in net fee income in euros (both grew +7% in constant euros). | ||||||||||
 | PROFITABILITY | |||||||
 | u | The increase in profit, underpinned by the positive performance across regions, Digital Consumer Bank (DCB) and the global businesses, was reflected in higher profitability. | |||||||||
| u | Sustained earnings per share growth, which rose 38% year-on-year to EUR 27.2 cents in H1'22 (+19% compared to H1'21 underlying EPS). | ||||||||||
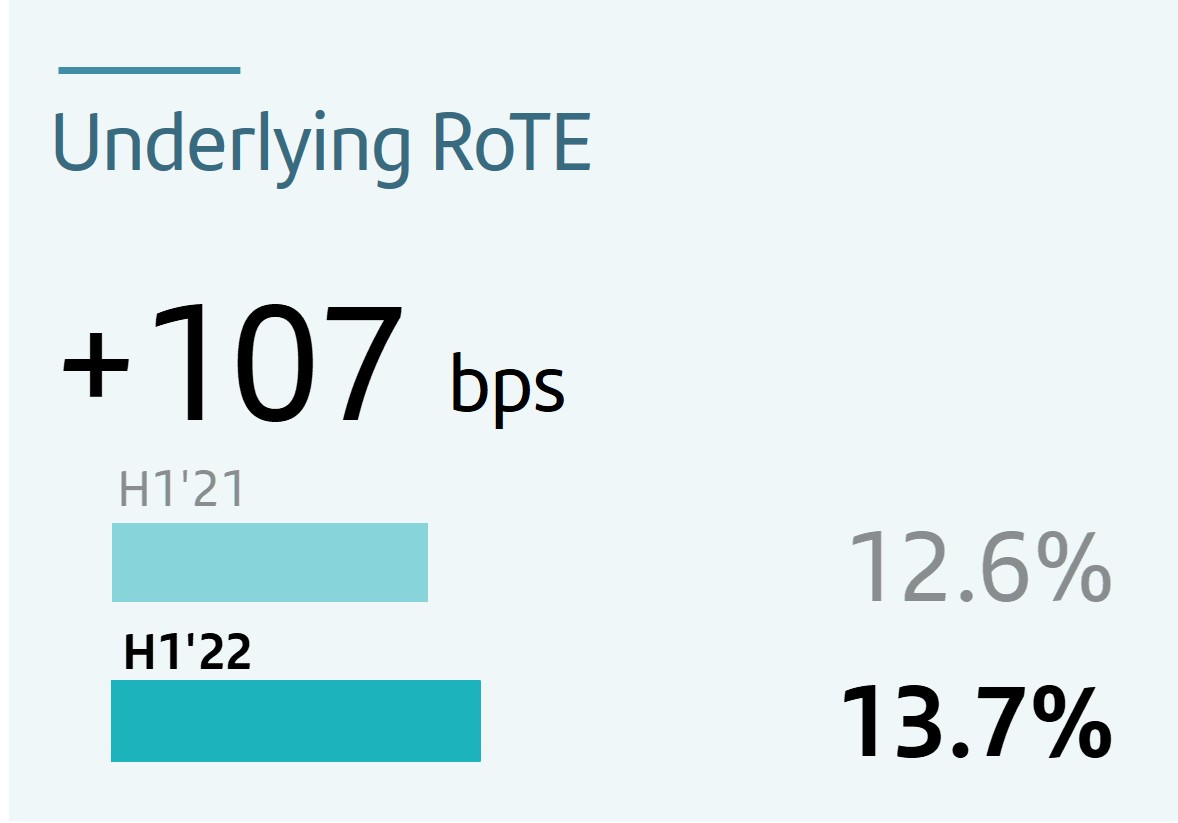
| u | RoTE of 13.7%, RoRWA was 1.86%, both clearly exceeding H1'21 and FY'21 figures. | ||||||||||
 | STRENGTH | |||||||
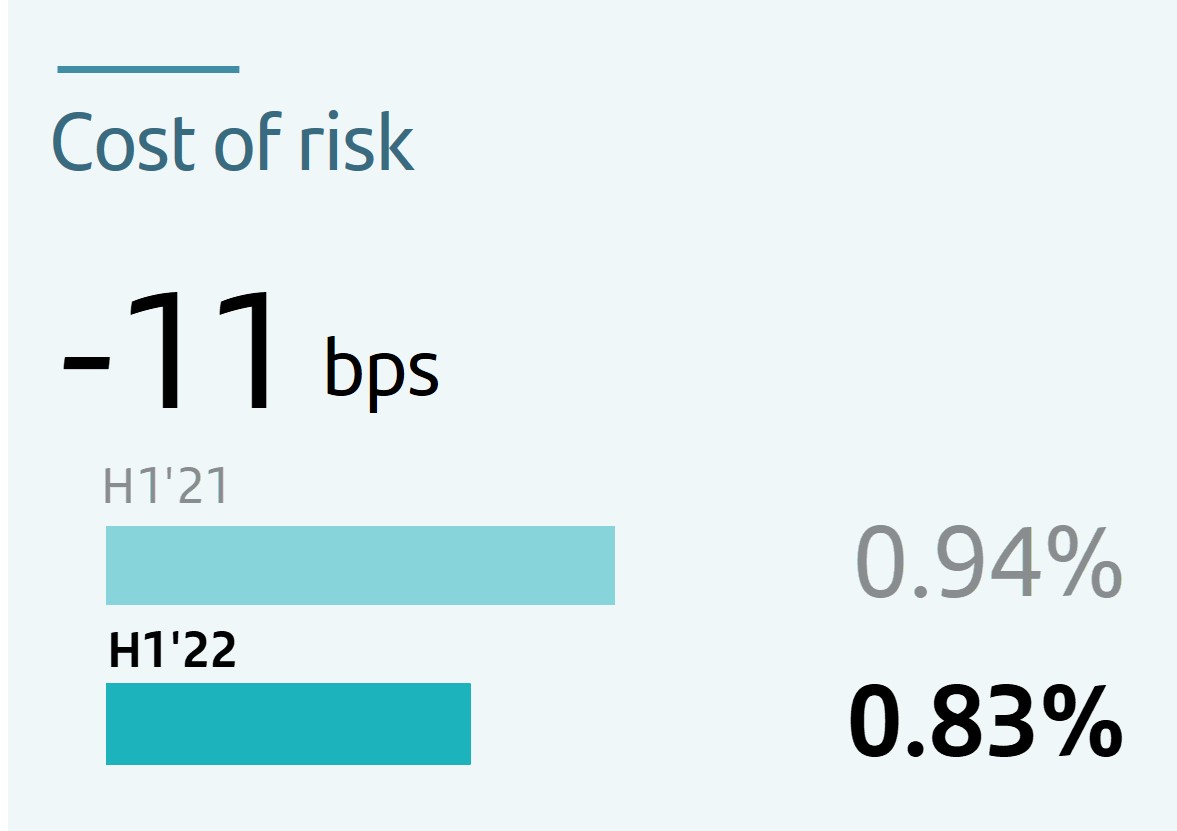 | u | Regarding credit quality, the cost of risk stood at 0.83% (0.94% in June 2021). | |||||||||
| u | The NPL ratio was 3.05%, 21 bps lower quarter-on-quarter and -17 bps year-on-year, mainly driven by the positive performance in Europe (favoured by portfolio sales in Spain) and somewhat offset by the increases in South America. | ||||||||||
| u | Total loan-loss reserves reached EUR 24,195 million, with a coverage of 71% (+2 pp vs. Q1'22). | ||||||||||
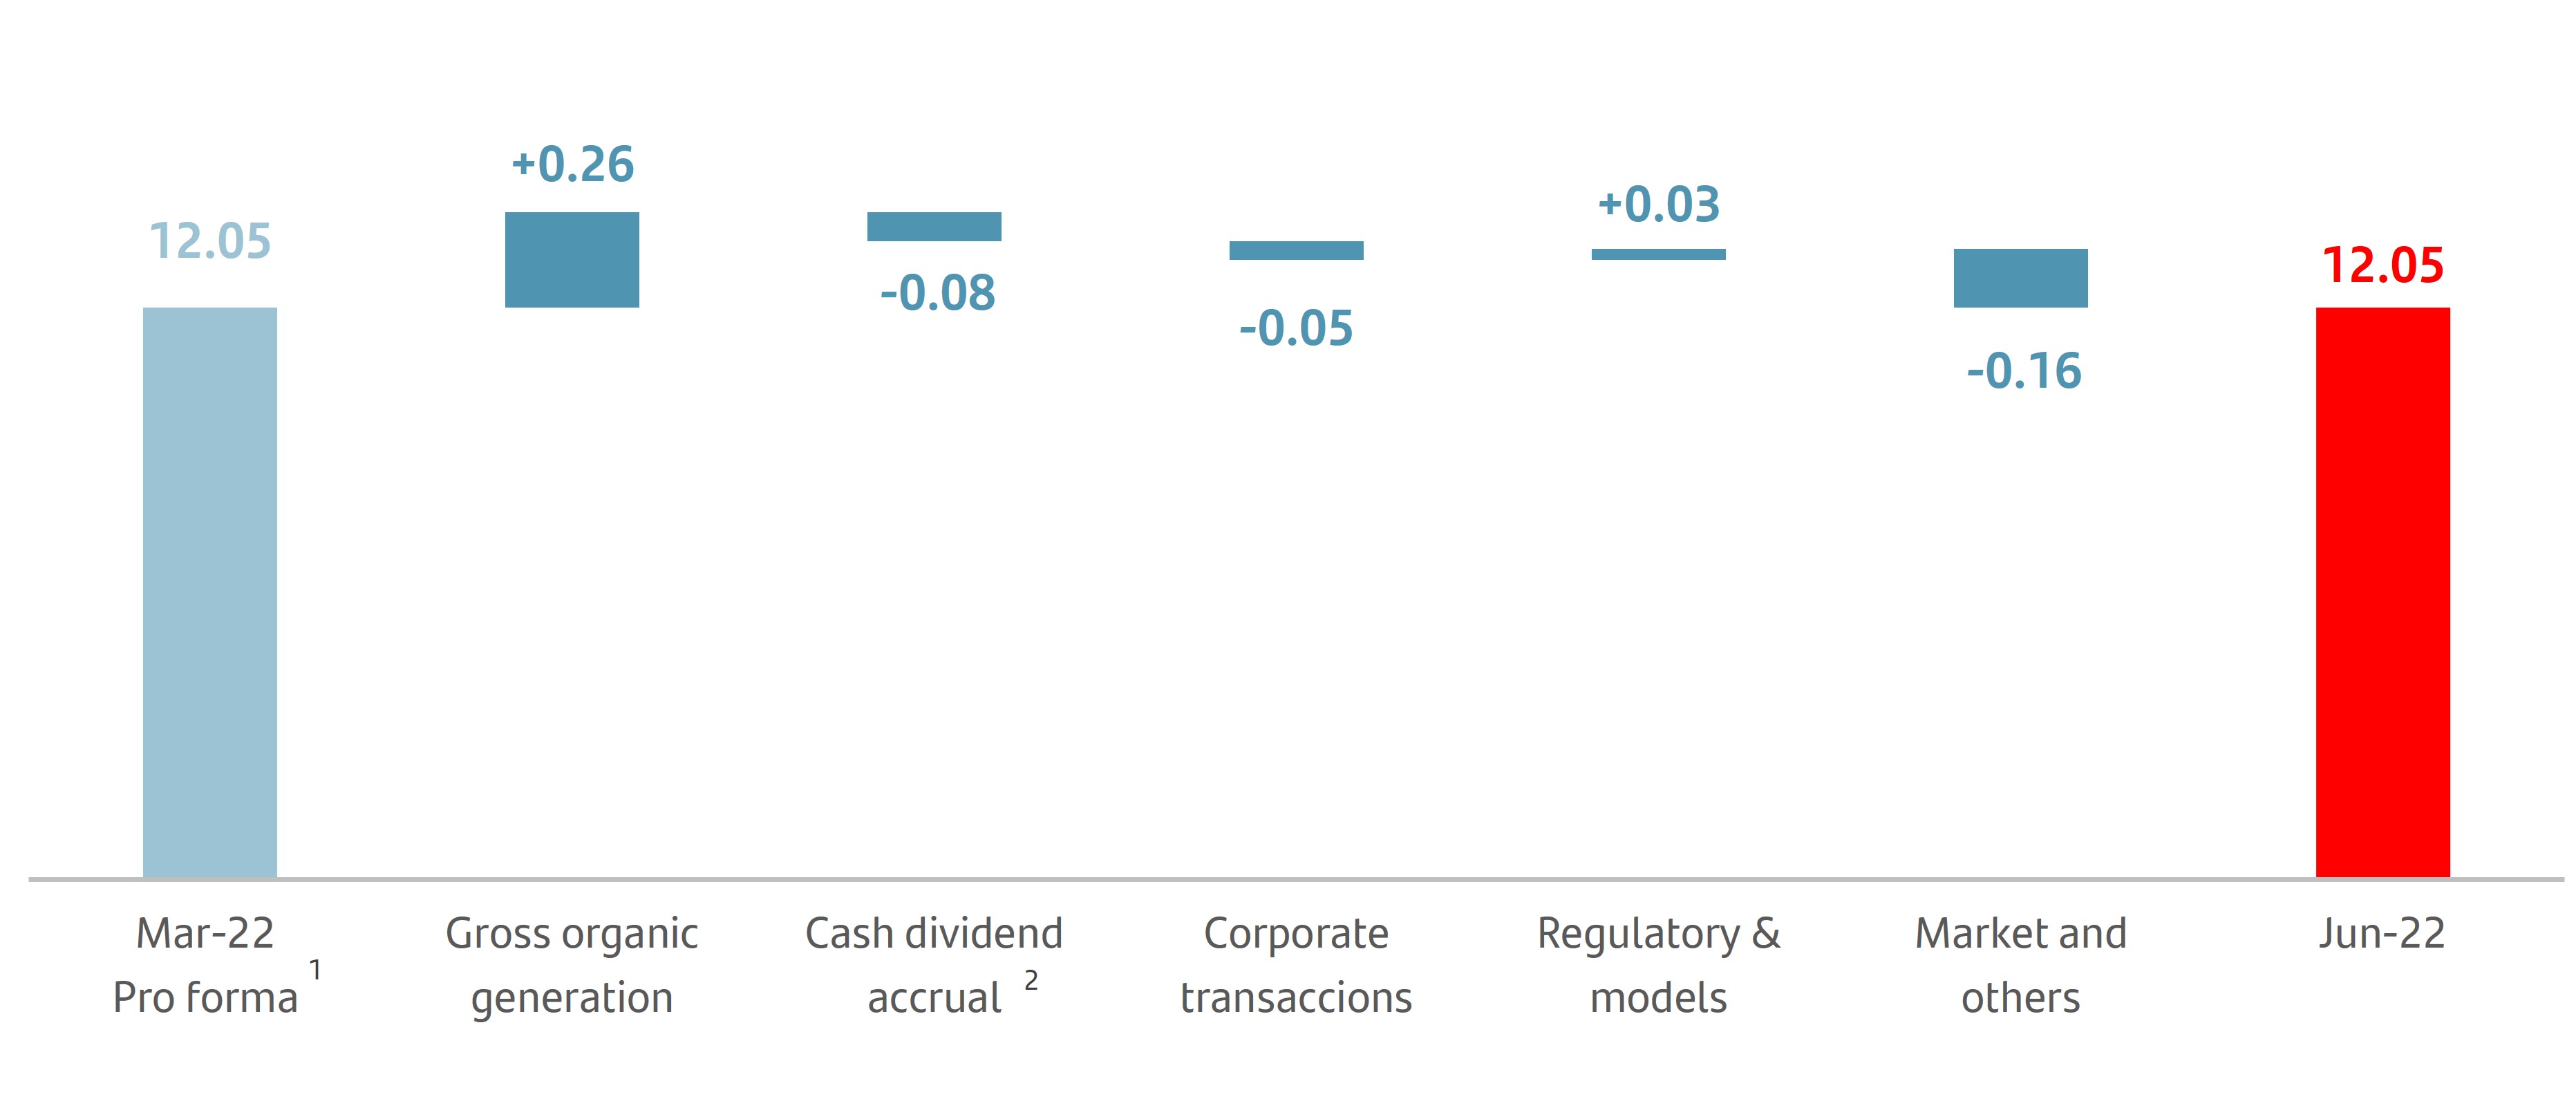
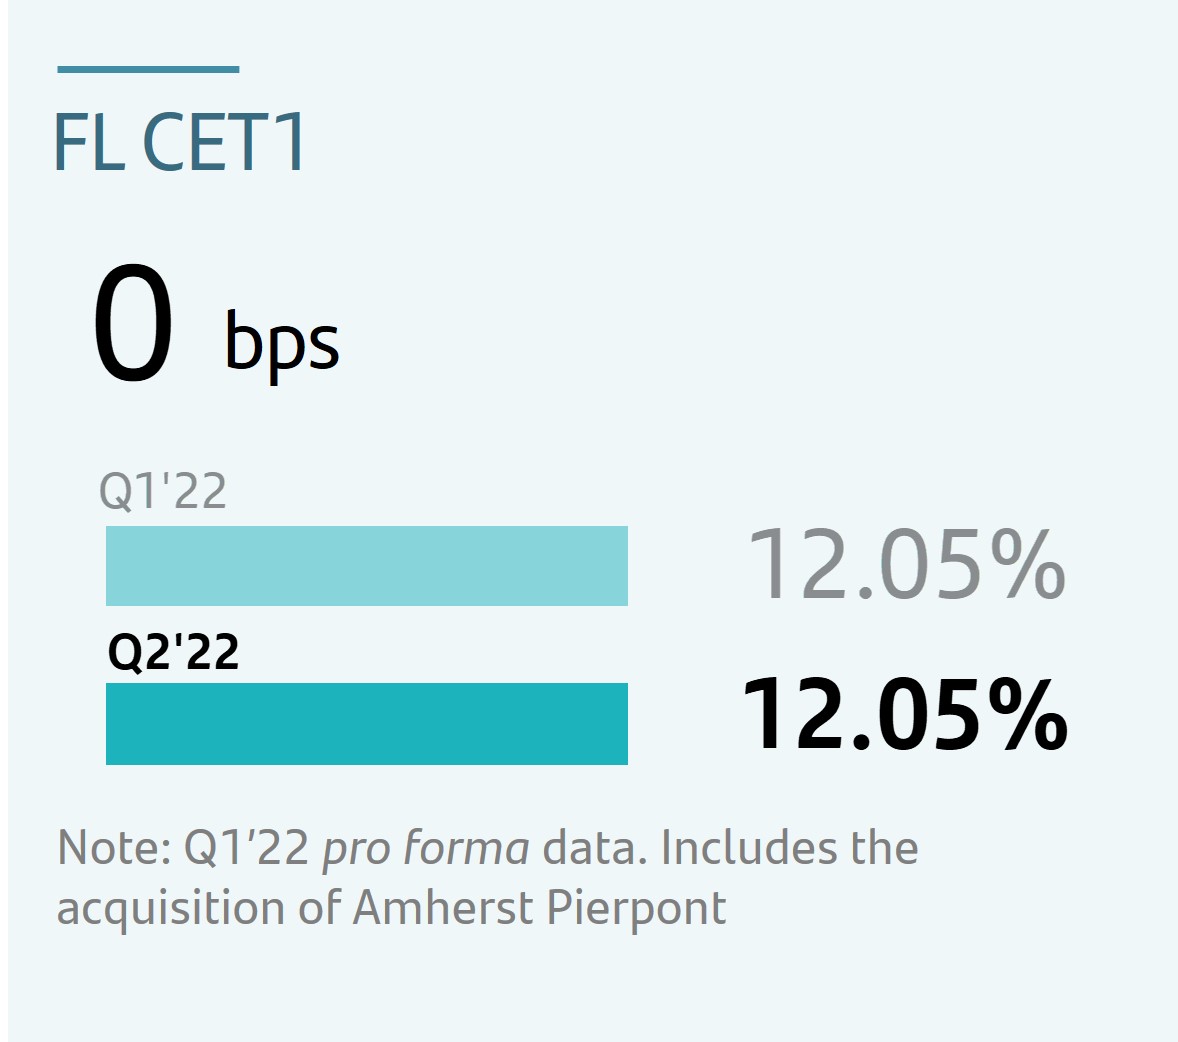 | u | The fully-loaded CET1 ratio was 12.05%. In the quarter, net organic generation of 18 bps, resulting from gross organic generation of 26 bps from Q2'22 profit and an 8 bp charge for a future dividend payment. In addition, negative impacts from market performance and corporate transactions, and positive impacts from models. | |||||||||
January - June 2022 | | 7 | ||||||
| GRUPO SANTANDER RESULTS | ||||||||
| Grupo Santander. Summarized income statement | ||||||||||||||||||||||||||
| EUR million | ||||||||||||||||||||||||||
| Change | Change | |||||||||||||||||||||||||
| Q2'22 | Q1'22 | % | % excl. FX | H1'22 | H1'21 | % | % excl. FX | |||||||||||||||||||
| Net interest income | 9,554 | 8,855 | 7.9 | 4.0 | 18,409 | 16,196 | 13.7 | 6.9 | ||||||||||||||||||
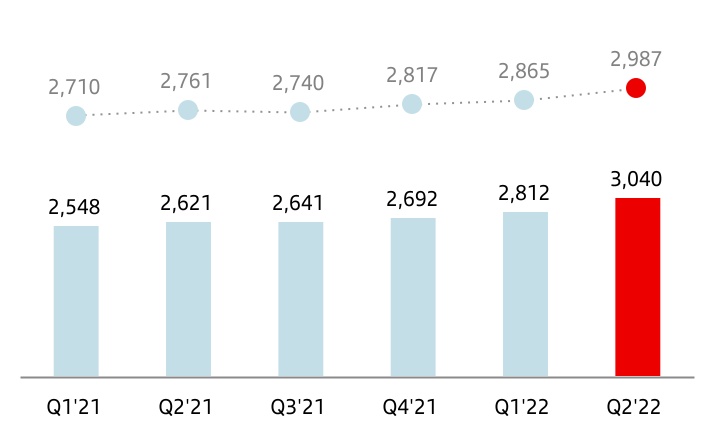
| Net fee income (commission income minus commission expense) | 3,040 | 2,812 | 8.1 | 4.2 | 5,852 | 5,169 | 13.2 | 7.0 | ||||||||||||||||||
| Gains or losses on financial assets and liabilities and exchange differences (net) | 356 | 387 | (8.0) | (11.0) | 743 | 894 | (16.9) | (20.7) | ||||||||||||||||||
| Dividend income | 267 | 68 | 292.6 | 288.2 | 335 | 309 | 8.4 | 8.1 | ||||||||||||||||||
| Share of results of entities accounted for using the equity method | 179 | 133 | 34.6 | 30.8 | 312 | 163 | 91.4 | 80.8 | ||||||||||||||||||
| Other operating income / expenses | (581) | 50 | — | — | (531) | (36) | — | — | ||||||||||||||||||
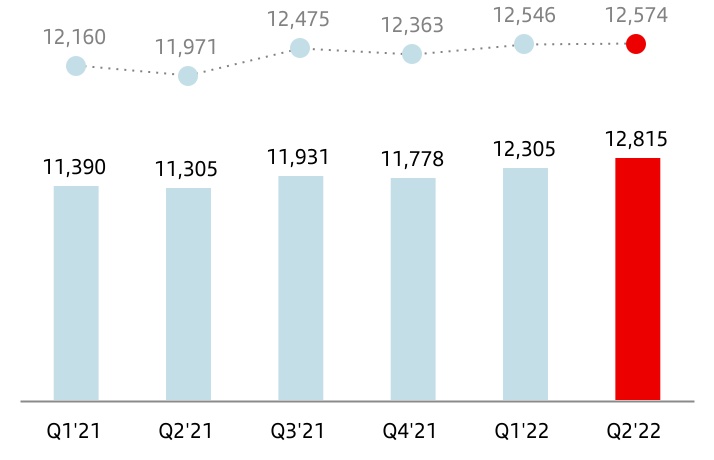
| Total income | 12,815 | 12,305 | 4.1 | 0.2 | 25,120 | 22,695 | 10.7 | 4.1 | ||||||||||||||||||
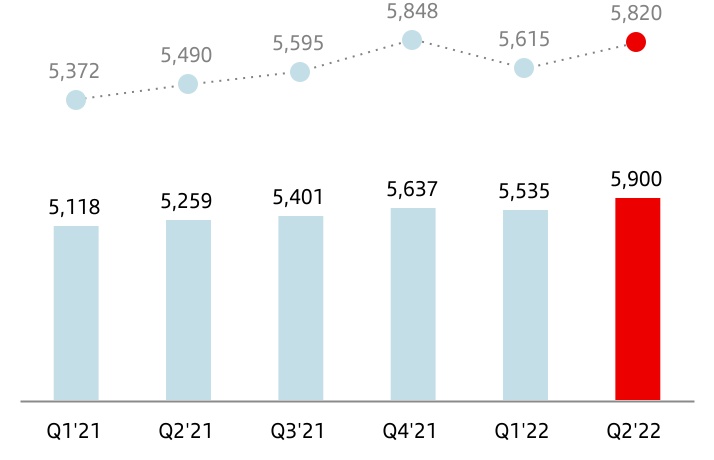
| Operating expenses | (5,900) | (5,535) | 6.6 | 3.6 | (11,435) | (10,377) | 10.2 | 5.3 | ||||||||||||||||||
| Administrative expenses | (5,162) | (4,831) | 6.9 | 3.9 | (9,993) | (8,996) | 11.1 | 6.1 | ||||||||||||||||||
| Staff costs | (3,085) | (2,863) | 7.8 | 4.9 | (5,948) | (5,438) | 9.4 | 4.8 | ||||||||||||||||||
| Other general administrative expenses | (2,077) | (1,968) | 5.5 | 2.3 | (4,045) | (3,558) | 13.7 | 8.0 | ||||||||||||||||||
| Depreciation and amortization | (738) | (704) | 4.8 | 2.2 | (1,442) | (1,381) | 4.4 | 0.2 | ||||||||||||||||||
| Provisions or reversal of provisions | (480) | (455) | 5.5 | 3.9 | (935) | (1,490) | (37.2) | (38.2) | ||||||||||||||||||
| Impairment or reversal of impairment of financial assets not measured at fair value through profit or loss (net) | (2,640) | (2,123) | 24.4 | 17.9 | (4,763) | (3,804) | 25.2 | 17.2 | ||||||||||||||||||
| Impairment on other assets (net) | (26) | (35) | (25.7) | (28.2) | (61) | (130) | (53.1) | (54.5) | ||||||||||||||||||
| Gains or losses on non-financial assets and investments, net | (6) | 2 | — | — | (4) | 52 | — | — | ||||||||||||||||||
| Negative goodwill recognized in results | — | — | — | — | — | — | — | — | ||||||||||||||||||
| Gains or losses on non-current assets held for sale not classified as discontinued operations | (19) | 12 | — | — | (7) | (32) | (78.1) | (78.1) | ||||||||||||||||||
| Profit or loss before tax from continuing operations | 3,744 | 4,171 | (10.2) | (14.4) | 7,915 | 6,914 | 14.5 | 4.4 | ||||||||||||||||||
| Tax expense or income from continuing operations | (1,072) | (1,302) | (17.7) | (21.9) | (2,374) | (2,474) | (4.0) | (12.8) | ||||||||||||||||||
| Profit from the period from continuing operations | 2,672 | 2,869 | (6.9) | (11.0) | 5,541 | 4,440 | 24.8 | 14.0 | ||||||||||||||||||
| Profit or loss after tax from discontinued operations | — | — | — | — | — | — | — | — | ||||||||||||||||||
| Profit for the period | 2,672 | 2,869 | (6.9) | (11.0) | 5,541 | 4,440 | 24.8 | 14.0 | ||||||||||||||||||
| Profit attributable to non-controlling interests | (321) | (326) | (1.5) | (4.0) | (647) | (765) | (15.4) | (20.3) | ||||||||||||||||||
| Profit attributable to the parent | 2,351 | 2,543 | (7.6) | (11.9) | 4,894 | 3,675 | 33.2 | 20.8 | ||||||||||||||||||
| EPS (euros) | 0.131 | 0.141 | (7.2) | 0.272 | 0.197 | 38.1 | ||||||||||||||||||||
| Diluted EPS (euros) | 0.130 | 0.140 | (7.2) | 0.271 | 0.196 | 38.1 | ||||||||||||||||||||
| Memorandum items: | ||||||||||||||||||||||||||
| Average total assets | 1,707,903 | 1,624,930 | 5.1 | 1,666,474 | 1,539,167 | 8.3 | ||||||||||||||||||||
| Average stockholders' equity | 90,035 | 88,532 | 1.7 | 89,125 | 82,669 | 7.8 | ||||||||||||||||||||
| 8 | | January - June 2022 | ||||||
| Executive summary | |||||||||||||||||||||||||||||||||||||||||||||||||||||||||||||||||||||||||||||||||||||||||||||||
Profit (H1'22 vs H1'21). In constant euros | Performance (H1'22 vs H1'21). In constant euros | ||||||||||||||||||||||||||||||||||||||||||||||||||||||||||||||||||||||||||||||||||||||||||||||
| Strong profit growth underpinned by our geographic and business diversification | Profit growth driven by higher revenue, cost control and lower minority interest and tax burden | ||||||||||||||||||||||||||||||||||||||||||||||||||||||||||||||||||||||||||||||||||||||||||||||
| Attributable profit | Total income | Costs | Provisions | ||||||||||||||||||||||||||||||||||||||||||||||||||||||||||||||||||||||||||||||||||||||||||||
| EUR 4,894 mn | +21% vs H1'21 | +4.1% | +5.3% | +18.1% | |||||||||||||||||||||||||||||||||||||||||||||||||||||||||||||||||||||||||||||||||||||||||||
| +7% vs H1'21 underlying att. profit | |||||||||||||||||||||||||||||||||||||||||||||||||||||||||||||||||||||||||||||||||||||||||||||||
| Efficiency | Profitability | ||||||||||||||||||||||||||||||||||||||||||||||||||||||||||||||||||||||||||||||||||||||||||||||
| The Group's efficiency ratio improved compared to FY'21, mainly driven by Europe | Strong improvement in our profitability ratios | ||||||||||||||||||||||||||||||||||||||||||||||||||||||||||||||||||||||||||||||||||||||||||||||
| Group | Europe | RoTE | RoRWA | ||||||||||||||||||||||||||||||||||||||||||||||||||||||||||||||||||||||||||||||||||||||||||||
| 45.5% | 48.5% | 13.7% | 1.86% | ||||||||||||||||||||||||||||||||||||||||||||||||||||||||||||||||||||||||||||||||||||||||||||
| -0.7 pp vs 2021 | -3.7 pp vs 2021 | +1.9 pp | +1.1 pp | 1 | +0.2 pp | +0.1 pp | 2 | ||||||||||||||||||||||||||||||||||||||||||||||||||||||||||||||||||||||||||||||||||||||||
| Changes vs H1'21 | 1.vs underlying RoTE | 2. vs und. RoRWA | |||||||||||||||||||||||||||||||||||||||||||||||||||||||||||||||||||||||||||||||||||||||||||||
è Results performance compared to H1'21
The Group presents, both at the total level and for each of the business units, the changes in euros produced in the income statement, as well as variations excluding the exchange rate effect (FX), on the understanding that the latter provide a better analysis of the Group’s management of the country units. For the Group as a whole, exchange rates had a positive impact of 7 pp in revenue and 5 pp in costs.
u Total income
Total income of EUR 25,120 million in the first half of 2022, up 11% year-on-year. Excluding the exchange rate impact, total income increased 4%. Net interest income and net fee income accounted for 97% of total income. By line:
•Net interest income amounted to EUR 18,409 million, 14% higher compared to the first half of 2021. Stripping out the exchange rate impact, growth was 7%, mainly due to the increase in activity, greater volumes and higher interest rates.
By country, and at constant exchange rates, increases were recorded in the UK (+13%), Poland (+92%), Brazil (+2%), Mexico (+9%), Chile (+7%) and Argentina (+93%).
| Net interest income | |||||
| EUR million | |||||
 | constant euros | ||||
On the other hand, the US remained unchanged, mainly due to the Bluestem portfolio disposal in 2021 (excluding this impact, net interest income would have increased 2%). Declines in Spain (-6%, due to lower ALCO volumes and some change of mix towards mortgages) and Portugal (-8%, due to ALCO portfolio sales in H1'21).
•Net fee income rose 13% year-on-year to EUR 5,852 million. Excluding the exchange rate impact, net fee income was 7% higher, driven by higher volumes and improved activity, with significant increases in high value-added products and services.
Card and point of sale turnover increased 20% and 30%, respectively, and card transactions were 18% higher. Transactional fees rose 9%.
In Wealth Management & Insurance (WM&I), net fee income from mutual funds and pensions grew 5% and insurance premiums rose 17%.
| Net fee income | |||||
| EUR million | |||||
| constant euros | ||||
January - June 2022 | | 9 | ||||||
In Santander Corporate & Investment Banking (SCIB), net fee income increased 10%, underscored by double-digit growth in the core businesses. Together, both businesses accounted for close to 50% of the Group’s total fee income (SCIB: 18%; WM&I: 30%).
By region, net fee income Europe was up 7%, supported by growth in all countries except the UK, mainly due to the transfer of its SCIB business. 1% decrease in North America, affected by the Bluestem portfolio disposal. Excluding it, fee income would have increased 4% in the region (the US would have fallen mainly due to lower fee income in SCIB). 16% increase in Mexico driven by fee income from insurance, cards and account management. +10% in South America driven by greater transactionality, with growth in all countries and +7% at Digital Consumer Bank driven by the rise in new lending.
•Gains on financial transactions, accounted for 3% of total income and were 17% lower year-on-year at EUR 743 million (-21% excluding the exchange rate impact), weighed down by the falls in Spain and Portugal, due to ALCO portfolio sales recorded in 2021, and the Corporate Centre, affected by the negative impact of FX hedging, offset by the positive impact of exchange rates in the countries' results.
•Dividend income was EUR 335 million in H1'22, increasing 8% in euros and constant euros.
•The results of entities accounted for using the equity method rose to EUR 312 million, due to the greater contribution from Group entities in Spain and Brazil.
•Other operating income recorded a loss of EUR 531 million compared to -EUR 36 million in H1'21, mainly due to the lower leasing income (approximately EUR 240 million less year-on-year), higher contribution to the SRF, higher provisions for the contribution to the BFG in Poland, where we also recorded an EUR 88 million contribution for the creation of an Institutional Protection Scheme along with several Polish local entities to strengthen the liquidity and solvency of the members of this newly established company, and impact of high inflation in Argentina.
| Total income | |||||
| EUR million | |||||
| constant euros | ||||
u Costs
Operating costs amounted to EUR 11,435 million, 10% higher than H1'21 (+5% excluding the exchange rate impact), due to the sharp increase in inflation. In real terms (excluding the rise in average inflation), costs fell 4% in constant euros.
Our disciplined cost management enabled us to maintain one of the best efficiency ratios in the sector, which stood at 45.5% in H1'22, improving 0.2 pp versus June 2021 and -0.7 pp versus FY'21, mainly driven by Europe.
Our transformation plan continued to progress across countries towards a more integrated and digital operating model. This allows us to increase efficiencies and productivity with better business dynamics and improved customer service and satisfaction. The year-on-year cost trends in constant euros were as follows:
•In Europe, costs were down 1%, -7% in real terms, on the back of our transformation process and operating improvement. In real terms, falls across in the region: -11% in Spain, -5% in the UK, -17% Portugal and -1% Poland. The region's efficiency ratio improved to 48.5%, an improvement of 3.9 pp versus H1'21.
•In North America, costs increased 5%. In real terms, they dropped 3%. They remained stable in the US (-8% in real terms) while Mexico recorded an increase due to investments in digitalization and insourcing of employees. The efficiency ratio stood at 46.6% (+3.4 pp vs H1'21).
•In South America, the rise in costs (+16%) was significantly distorted by soaring average inflation in the region (17%) which was reflected in salary agreements (salary increase in Brazil in September 2021) and greater overall expenses. In real terms, costs in Brazil remained stable, in Chile they fell 2% and rose 3% in Argentina. The efficiency ratio was 35.3% (+0.8 pp vs H1'21).
•Costs at Digital Consumer Bank increased 2% affected by inflation, strategic investments and perimeter effects (Allane, TIMFin and Greece). In real terms, costs fell 3%. The efficiency ratio stood at 48.5% (-0.3 pp vs H1'21).
| Operating expenses | |||||
| EUR million | |||||
| constant euros | ||||
| 10 | | January - June 2022 | ||||||
u Provisions or reversal of provisions
Provisions (net of provisions reversals) amounted to EUR 935 million (EUR 1,490 million in H1'21). This item includes the charges for restructuring costs recorded in 2021 (EUR 530 million net of tax).
u Impairment or reversal of impairment of financial assets not measured at fair value through profit or loss (net)
Impairment or reversal of impairment on financial assets not measured at fair value through profit or loss (net) amounted to EUR 4,763 million, 25% higher than in the same period of 2021 (+17% in constant euros). This comparison was affected by the releases recorded in the UK and the US in Q2'21, the EUR 184 million charge for CHF mortgages recorded in Poland and DCB this year and the rise in Brazil, driven by individual volumes.
u Impairment on other assets (net)
The impairment on other assets (net) stood at EUR 61 million, down from EUR 130 million in H1'21.
u Gains or losses on non-financial assets and investments (net)
-EUR 4 million was recorded in this line in H1'22 (EUR 52 million in H1'21).
| Net loan-loss provisions | |||||
| EUR million | |||||
| constant euros | ||||
u Negative goodwill recognized in results
No negative goodwill was recorded in H1'22 or H1'21.
u Gains or losses on non-current assets held for sale not classified as discontinued operations
This item, which mainly includes impairment of foreclosed assets recorded and the sale of properties acquired upon foreclosure, totalled -EUR 7 million in H1'22, compared to -EUR 32 million in H1'21.
u Profit before tax
Profit before tax was EUR 7,915 million in H1'22, 14% higher year-on-year (+4% in constant euros).
u Income tax
Total corporate income tax was EUR 2,374 million (EUR 2,474 million in H1'21).
u Attributable profit to non-controlling interests
Attributable profit to non-controlling interests amounted to EUR 647 million, down 15% year-on-year (-20% excluding the exchange rate impact), mainly due to the buyback of minority interests of SC USA in the US.
u Attributable profit to the parent
Attributable profit to the parent amounted to EUR 4,894 million in H1'22, compared to EUR 3,675 million in the same period of 2021. This represents a 33% increase in euros and +21% in constant euros, receiving an uplift from higher revenue, lower minority interests and no results outside the ordinary course of our business.
RoTE stood at 13.69% (11.82% in H1'21), RoRWA at 1.86% (1.66% in H1'21) and earnings per share stood at EUR 0.272 (EUR 0.197 in H1'21).
January - June 2022 | | 11 | ||||||
u Underlying profit attributable to the parent
Profit attributable to the parent recorded in H1'22 was not affected by the recording of results that are outside the ordinary course of our business. As such, attributable profit and underlying profit attributable to the parent in H1'22 amounted to EUR 4,894 million.
In H1'21, profit attributable to the parent was affected by restructuring costs, mainly in the UK and Portugal. Excluding these charges from the line where they were recorded, and including them separately in the net capital gains and provisions line, adjusted profit or underlying profit attributable to the parent in H1'21 stood at EUR 4,205 million.
As a result, profit in H1'22 was 16% higher in euros and +7% in constant euros compared to the adjusted profit or underlying in the same period of 2021.
For more details, see 'Alternative Performance Measures' section in the appendix of this report.
The Group’s cost of risk (considering the last 12 months) stood at 0.83%, slightly higher than FY'21 (0.77%) when we recorded releases mainly in the second and fourth quarters.
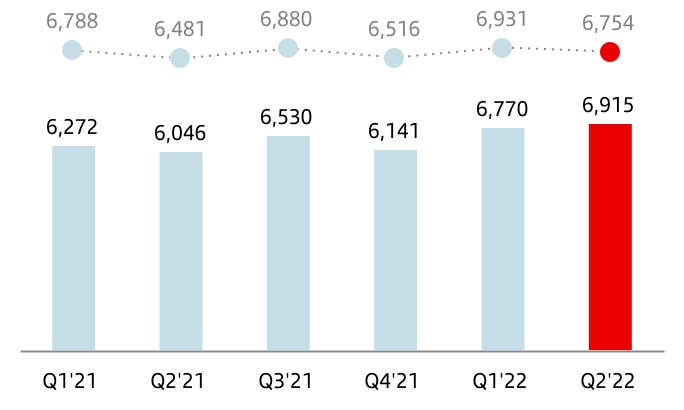
Before recording loan-loss provisions, Grupo Santander's underlying net operating income (total income less operating expenses) was EUR 13,685 million, 11% higher year-on-year in euros, +3% excluding the FX impact. This is the highest net operating income ever recorded in a first half of a year. The performance in constant euros is detailed below.
By line:
•Total income increased mainly due to net interest income (+7%) and net fee income (+7%), which maintained a positive quarterly growth trend given the greater commercial activity.
•Costs were up driven by soaring inflation.
By region:
•In Europe, net operating income increased 17% underscored by higher total income and lower costs.
•In North America, net operating income fell 9%, -6% excluding the impact from the sale of the Bluestem portfolio, dampened by lower fee income and leasing in the US. Growth in Mexico was 9%.
•In South America, net operating income growth was 7% with rises of 2% in Brazil, 17% in Chile and 88% in Argentina.
•In Digital Consumer Bank, net operating income increased 3%.
In H1'22, Grupo Santander’s underlying RoTE was 13.69% (12.62% in H1'21), underlying RoRWA was 1.86% (1.75% in H1'21) and underlying earnings per share was EUR 0.272 (EUR 0.227 in H1'21).
| Summarized underlying income statement | ||||||||||||||||||||||||||
| EUR million | Change | Change | ||||||||||||||||||||||||
| Q2'22 | Q1'22 | % | % excl. FX | H1'22 | H1'21 | % | % excl. FX | |||||||||||||||||||
| Net interest income | 9,554 | 8,855 | 7.9 | 4.0 | 18,409 | 16,196 | 13.7 | 6.9 | ||||||||||||||||||
| Net fee income | 3,040 | 2,812 | 8.1 | 4.2 | 5,852 | 5,169 | 13.2 | 7.0 | ||||||||||||||||||
Gains (losses) on financial transactions (1) | 356 | 387 | (8.0) | (11.0) | 743 | 894 | (16.9) | (20.7) | ||||||||||||||||||
| Other operating income | (135) | 251 | — | — | 116 | 436 | (73.4) | (76.7) | ||||||||||||||||||
| Total income | 12,815 | 12,305 | 4.1 | 0.2 | 25,120 | 22,695 | 10.7 | 4.1 | ||||||||||||||||||
| Administrative expenses and amortizations | (5,900) | (5,535) | 6.6 | 3.6 | (11,435) | (10,377) | 10.2 | 5.3 | ||||||||||||||||||
| Net operating income | 6,915 | 6,770 | 2.1 | (2.6) | 13,685 | 12,318 | 11.1 | 3.1 | ||||||||||||||||||
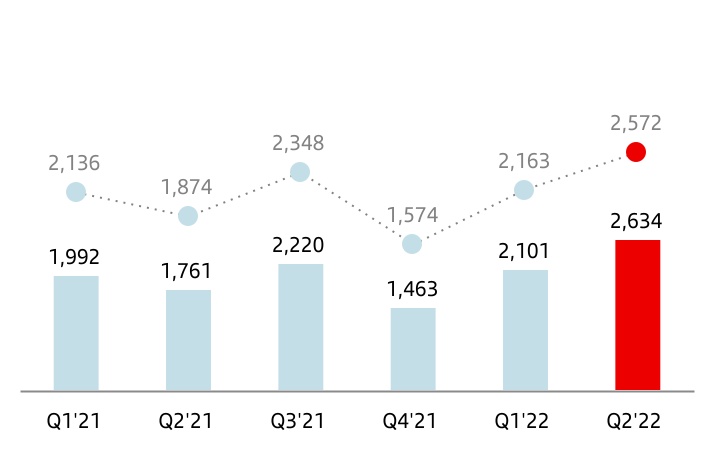
| Net loan-loss provisions | (2,634) | (2,101) | 25.4 | 18.9 | (4,735) | (3,753) | 26.2 | 18.1 | ||||||||||||||||||
| Other gains (losses) and provisions | (537) | (498) | 7.8 | 5.7 | (1,035) | (937) | 10.5 | 9.1 | ||||||||||||||||||
| Profit before tax | 3,744 | 4,171 | (10.2) | (14.4) | 7,915 | 7,628 | 3.8 | (4.8) | ||||||||||||||||||
| Tax on profit | (1,072) | (1,302) | (17.7) | (21.9) | (2,374) | (2,658) | (10.7) | (18.4) | ||||||||||||||||||
| Profit from continuing operations | 2,672 | 2,869 | (6.9) | (11.0) | 5,541 | 4,970 | 11.5 | 2.6 | ||||||||||||||||||
| Net profit from discontinued operations | — | — | — | — | — | — | — | — | ||||||||||||||||||
| Consolidated profit | 2,672 | 2,869 | (6.9) | (11.0) | 5,541 | 4,970 | 11.5 | 2.6 | ||||||||||||||||||
| Non-controlling interests | (321) | (326) | (1.5) | (4.0) | (647) | (765) | (15.4) | (20.3) | ||||||||||||||||||
| Net capital gains and provisions | — | — | — | — | — | (530) | (100.0) | (100.0) | ||||||||||||||||||
| Profit attributable to the parent | 2,351 | 2,543 | (7.6) | (11.9) | 4,894 | 3,675 | 33.2 | 20.8 | ||||||||||||||||||
Underlying profit attributable to the parent (2) | 2,351 | 2,543 | (7.6) | (11.9) | 4,894 | 4,205 | 16.4 | 6.7 | ||||||||||||||||||
(1) Includes exchange differences.
(2) Excludes net capital gains and provisions.
| 12 | | January - June 2022 | ||||||
è Results performance compared to the previous quarter
Underlying profit attributable to the parent and profit attributable to the parent recorded the same amount, both in Q2'22 and Q1'22, as profit was not affected by results outside the ordinary course of our business in either period.
As a result, profit in the second quarter amounted to EUR 2,351 million, an 8% decrease in euros and -12% in constant euros.
This performance was driven by the contribution to the SRF, which is usually recorded in the second quarter, in Spain, Portugal, Digital Consumer Bank and the Corporate Centre and the EUR 88 million contribution to the IPS in Poland, as previously explained.
Excluding these impacts, underlying attributable profit was 5% higher. Excluding the exchange rate impact, it rose 1%, as follows:
•Total income remained broadly in line with the previous quarter (+0.2%) due to the aforementioned contributions. Excluding these contributions, total income increased 4%.
| Net operating income | |||||
| EUR million | |||||
| constant euros | ||||
Net interest income was up 4% supported by higher interest rates and volumes. By region, of note was the 6% rise in Europe, driven by Poland and the UK. In North America, net interest income growth was 4%, with a positive performance both in the US and Mexico, and South America also rose 4% backed by Chile and Argentina, which offset the fall in Brazil.
Net fee income rose 4% with positive performance across regions and Digital Consumer Bank.
Gains on financial transactions dropped 11%, partly due to FX hedging.
•Costs rose 4% affected by the overall increase in inflation.
•Net loan-loss provisions increased 19% mainly due to Poland (CHF mortgages) and Brazil, driven by individual volumes.
| Underlying profit attributable to the parent* | |||||
| EUR million | |||||
| constant euros | ||||
(*) Excluding net capital gains and provisions.
January - June 2022 | | 13 | ||||||
| Grupo Santander. Condensed balance sheet | |||||||||||||||||
| EUR million | |||||||||||||||||
| Change | |||||||||||||||||
| Assets | Jun-22 | Jun-21 | Absolute | % | Dec-21 | ||||||||||||
| Cash, cash balances at central banks and other demand deposits | 211,276 | 183,091 | 28,185 | 15.4 | 210,689 | ||||||||||||
| Financial assets held for trading | 163,235 | 102,792 | 60,443 | 58.8 | 116,953 | ||||||||||||
| Debt securities | 41,668 | 34,114 | 7,554 | 22.1 | 26,750 | ||||||||||||
| Equity instruments | 10,686 | 13,545 | (2,859) | (21.1) | 15,077 | ||||||||||||
| Loans and advances to customers | 15,090 | 265 | 14,825 | — | 6,829 | ||||||||||||
| Loans and advances to central banks and credit institutions | 27,076 | — | 27,076 | — | 14,005 | ||||||||||||
| Derivatives | 68,715 | 54,868 | 13,847 | 25.2 | 54,292 | ||||||||||||
| Financial assets designated at fair value through profit or loss | 16,870 | 61,324 | (44,454) | (72.5) | 21,493 | ||||||||||||
| Loans and advances to customers | 7,755 | 25,353 | (17,598) | (69.4) | 10,826 | ||||||||||||
| Loans and advances to central banks and credit institutions | 1,396 | 28,791 | (27,395) | (95.2) | 3,152 | ||||||||||||
| Other (debt securities an equity instruments) | 7,719 | 7,180 | 539 | 7.5 | 7,515 | ||||||||||||
| Financial assets at fair value through other comprehensive income | 91,998 | 114,505 | (22,507) | (19.7) | 108,038 | ||||||||||||
| Debt securities | 82,664 | 103,549 | (20,885) | (20.2) | 97,922 | ||||||||||||
| Equity instruments | 2,131 | 2,751 | (620) | (22.5) | 2,453 | ||||||||||||
| Loans and advances to customers | 7,203 | 8,205 | (1,002) | (12.2) | 7,663 | ||||||||||||
| Loans and advances to central banks and credit institutions | — | — | — | — | — | ||||||||||||
| Financial assets measured at amortized cost | 1,129,690 | 1,003,417 | 126,273 | 12.6 | 1,037,898 | ||||||||||||
| Debt securities | 57,520 | 29,038 | 28,482 | 98.1 | 35,708 | ||||||||||||
| Loans and advances to customers | 1,007,673 | 920,695 | 86,978 | 9.4 | 947,364 | ||||||||||||
| Loans and advances to central banks and credit institutions | 64,497 | 53,684 | 10,813 | 20.1 | 54,826 | ||||||||||||
| Investments in subsidiaries, joint ventures and associates | 7,665 | 7,562 | 103 | 1.4 | 7,525 | ||||||||||||
| Tangible assets | 34,640 | 32,678 | 1,962 | 6.0 | 33,321 | ||||||||||||
| Intangible assets | 18,349 | 16,454 | 1,895 | 11.5 | 16,584 | ||||||||||||
| Goodwill | 13,877 | 12,854 | 1,023 | 8.0 | 12,713 | ||||||||||||
| Other intangible assets | 4,472 | 3,600 | 872 | 24.2 | 3,871 | ||||||||||||
| Other assets | 49,117 | 46,813 | 2,304 | 4.9 | 43,334 | ||||||||||||
| Total assets | 1,722,840 | 1,568,636 | 154,204 | 9.8 | 1,595,835 | ||||||||||||
| Liabilities and shareholders' equity | |||||||||||||||||
| Financial liabilities held for trading | 114,406 | 68,982 | 45,424 | 65.8 | 79,469 | ||||||||||||
| Customer deposits | 13,799 | — | 13,799 | — | 6,141 | ||||||||||||
| Debt securities issued | — | — | — | — | — | ||||||||||||
| Deposits by central banks and credit institutions | 14,860 | — | 14,860 | — | 7,526 | ||||||||||||
| Derivatives | 67,152 | 52,440 | 14,712 | 28.1 | 53,566 | ||||||||||||
| Other | 18,595 | 16,542 | 2,053 | 12.4 | 12,236 | ||||||||||||
| Financial liabilities designated at fair value through profit or loss | 40,823 | 54,131 | (13,308) | (24.6) | 32,733 | ||||||||||||
| Customer deposits | 31,463 | 38,005 | (6,542) | (17.2) | 25,608 | ||||||||||||
| Debt securities issued | 5,597 | 5,491 | 106 | 1.9 | 5,454 | ||||||||||||
| Deposits by central banks and credit institutions | 3,763 | 10,635 | (6,872) | (64.6) | 1,671 | ||||||||||||
| Other | — | — | — | — | — | ||||||||||||
| Financial liabilities measured at amortized cost | 1,427,721 | 1,310,433 | 117,288 | 9.0 | 1,349,169 | ||||||||||||
| Customer deposits | 928,525 | 856,122 | 72,403 | 8.5 | 886,595 | ||||||||||||
| Debt securities issued | 255,049 | 237,739 | 17,310 | 7.3 | 240,709 | ||||||||||||
| Deposits by central banks and credit institutions | 203,511 | 182,770 | 20,741 | 11.3 | 191,992 | ||||||||||||
| Other | 40,636 | 33,802 | 6,834 | 20.2 | 29,873 | ||||||||||||
| Liabilities under insurance contracts | 858 | 1,014 | (156) | (15.4) | 770 | ||||||||||||
| Provisions | 8,590 | 10,400 | (1,810) | (17.4) | 9,583 | ||||||||||||
| Other liabilities | 32,980 | 27,931 | 5,049 | 18.1 | 27,058 | ||||||||||||
| Total liabilities | 1,625,378 | 1,472,891 | 152,487 | 10.4 | 1,498,782 | ||||||||||||
| Shareholders' equity | 122,037 | 117,552 | 4,485 | 3.8 | 119,649 | ||||||||||||
| Capital stock | 8,397 | 8,670 | (273) | (3.1) | 8,670 | ||||||||||||
| Reserves (including treasury stock) | 108,746 | 105,207 | 3,539 | 3.4 | 103,691 | ||||||||||||
| Profit attributable to the Group | 4,894 | 3,675 | 1,219 | 33.2 | 8,124 | ||||||||||||
| Less: dividends | — | — | — | — | (836) | ||||||||||||
| Other comprehensive income | (32,526) | (32,181) | (345) | 1.1 | (32,719) | ||||||||||||
| Minority interests | 7,951 | 10,374 | (2,423) | (23.4) | 10,123 | ||||||||||||
| Total equity | 97,462 | 95,745 | 1,717 | 1.8 | 97,053 | ||||||||||||
| Total liabilities and equity | 1,722,840 | 1,568,636 | 154,204 | 9.8 | 1,595,835 | ||||||||||||
| 14 | | January - June 2022 | ||||||
| GRUPO SANTANDER BALANCE SHEET | ||||||||
Executive summary 1 | ||||||||||||||||||||||||||||||||||||||||||||||||||||||||||||||||||||||||||||||||
Loans and advances to customers (excl. reverse repos) | Customer funds (deposits excl. repos + mutual funds) | |||||||||||||||||||||||||||||||||||||||||||||||||||||||||||||||||||||||||||||||
| Loans and advances to customers maintained a positive growth trend, increasing both QoQ and YoY | Customer funds maintained its growth trend, mainly backed by customer deposits | |||||||||||||||||||||||||||||||||||||||||||||||||||||||||||||||||||||||||||||||
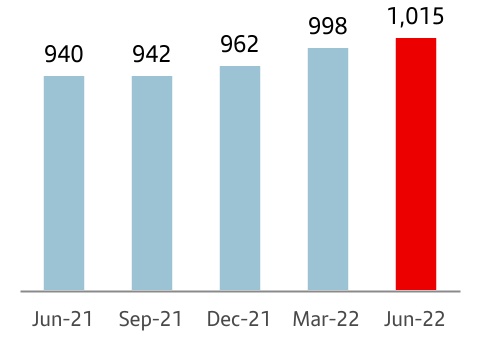
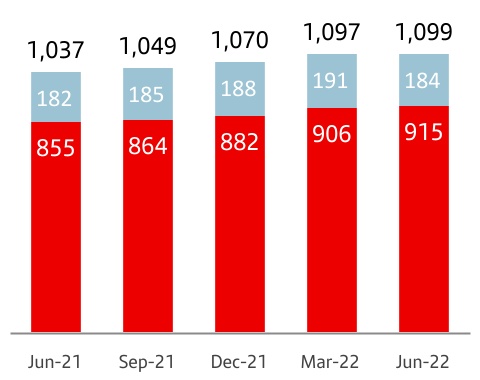
| 1,015 | +2% QoQ | +6% YoY | 1,099 | +1% QoQ | +4% YoY | |||||||||||||||||||||||||||||||||||||||||||||||||||||||||||||||||||||||||||
| EUR billion | EUR billion | |||||||||||||||||||||||||||||||||||||||||||||||||||||||||||||||||||||||||||||||
è By segment (YoY changes): | è By product (YoY changes): | |||||||||||||||||||||||||||||||||||||||||||||||||||||||||||||||||||||||||||||||
| Growth backed by individuals and large corporates | Demand deposits accounted for 65% of customer funds and mutual funds were impacted by market performance | |||||||||||||||||||||||||||||||||||||||||||||||||||||||||||||||||||||||||||||||
| Individuals | SMEs and corporates | CIB | Demand | Time | Mutual funds | |||||||||||||||||||||||||||||||||||||||||||||||||||||||||||||||||||||||||||
| +7% | 0% | +13% | +3% | +13% | -2% | |||||||||||||||||||||||||||||||||||||||||||||||||||||||||||||||||||||||||||
| (1) Changes in constant euros | ||||||||||||||||||||||||||||||||||||||||||||||||||||||||||||||||||||||||||||||||
è Loans and advances to customers
Loans and advances to customers stood at EUR 1,037,721 million in June 2022, 3% higher quarter-on-quarter and +9% year-on-year.
For the purpose of analysing traditional commercial banking loans, the Group uses gross loans and advances to customers excluding reverse repos, which exceeded EUR 1 trillion (EUR 1,015,434 million). In addition, in order to facilitate the analysis of the Group's management, the comments below do not include the exchange rate impact.
In the quarter, gross loans and advances to customers, excluding reverse repos, rose 2%, with increases in all markets, as follows:
•In Europe, loans grew 2%. They rose 2% in Spain, the UK and Poland while in Portugal loans were 1% higher.
•In North America, growth in Mexico was 2% and 1% in the US. In the region as a whole, loans rose 1%.
•In South America, loans increased 5%, with Brazil increasing 3%, Chile +5%, Argentina +17% and Uruguay +6%.
•In Digital Consumer Bank (DCB) growth was 3%, with growth in Openbank of 14%.
| Gross loans and advances to customers (excl. reverse repos) | |||||
| EUR billion | |||||
| +8 | % | * | |||
| Jun-22 / Jun-21 | |||||
(*) In constant EUR: +6%
Compared to June 2021, gross loans and advances to customers (excluding reverse repos and the FX impact) grew 6%, with broad-based growth across countries, as follows:
•In Europe, growth was 5%. Poland rose 8% driven by corporates and institutions and CIB, Spain +7% due to individuals, private banking and institutions, the UK grew 4% backed by mortgages and Portugal increased 2% also driven by mortgages.
•+7% in North America as the US grew 5% propelled by auto financing, SCIB and WM, while Mexico was up 11% with rises in most segments, except SMEs.
•Growth in South America was 12%, with Argentina increasing 55% driven by auto, SMEs and corporates, Chile +11% backed by individuals, Brazil rose 9% owing to individuals and SMEs, and Uruguay recorded a 14% increase.
•Digital Consumer Bank increased 4%, receiving an uplift from new lending, which rose 10% year-on-year, and increased in most countries. Openbank increased 52%.
As of June 2022, gross loans and advances to customers excluding reverse repos maintained a balanced structure: individuals (61%), SMEs and corporates (25%) and SCIB (14%).
| Gross loans and advances to customers (excl. reverse repos) | ||
| % operating areas. June 2022 | ||
January - June 2022 | | 15 | ||||||
è Customer funds
Customer deposits amounted to EUR 973,787 million in June 2022, increasing 2% quarter-on-quarter and 9% year-on-year.
The Group uses customer funds (customer deposits excluding repos, plus mutual funds) for the purpose of analysing traditional retail banking funds, which amounted to EUR 1,098,708 million in June 2022. Just as for loans and advances to customers, the comments below do not include the exchange rate impact.
•In the second quarter, customer funds grew 1%, as follows:
–By product, customer deposits excluding repos rose 1% while mutual funds decreased 3%.
–By primary segment, customer funds rose in South America (+3%) and DCB (+2%), had no material change in Europe and declined in North America (-2%). By country, customer funds increased 18% in Argentina and 3% in Brazil, but declined 3% both in Poland and the US. The other countries remained stable.
•Compared to June 2021, customer funds were up 4%, excluding the exchange rate impact:
–By product, deposits excluding repos rose 5%. Demand deposits grew 3% (with rises Europe and South America and falls in North America) and time deposits were 13% higher driven by all three regions, notably North America. Mutual funds dropped 2% with widespread falls across most countries due to the impact from markets and the rising interest rate environment.
–By region, customer funds increased 4% in Europe, with rises in Spain (+9%), Portugal (+5%) and Poland (+1%), while the UK decreased 3%. 3% rise in North America (the US: +3%; Mexico: +3%) and +5% South America in (Brazil: +3%; Chile: -6%; Argentina: +73%; Uruguay: +18%).
–7% rise in DCB, where Openbank increased 14%.
With this performance, the weight of demand deposits as a percentage of total customer funds was 65%, time deposits accounted for 18% of the total and mutual funds 17%.
| Customer funds | ||
| EUR billion | ||
| +6 | % | * | ||||||
| +1 | % | |||||||
| +7 | % | |||||||
•Total | ||||||||
•Mutual funds | ||||||||
•Deposits exc. repos | ||||||||
| Jun-22 / Jun-21 | ||||||||
(*) In constant EUR: +4%
In addition to capturing customer deposits, the Group, for strategic reasons, maintains a selective policy of issuing securities in the international fixed income markets and strives to adapt the frequency and volume of its market operations to the structural liquidity needs of each unit, as well as to the receptiveness of each market.
In the first half of 2022, the Group issued:
•Medium- and long-term covered bonds amounting to EUR 5,158 million and EUR 12,421 million of senior debt placed in the market.
•There were EUR 5,592 million of securitizations placed in the market. Additionally, we extended the maturity of an additional EUR 160 million.
•In order to strengthen the Group’s situation, issuances to meet the TLAC requirement amounted to EUR 5,091 million (EUR 4,974 million of senior non-preferred debt and EUR 117 million of subordinated debt).
•Maturities of medium- and long-term debt of EUR 17,243 million.
The net loan-to-deposit ratio was 107%, the same as in June 2021. The ratio of deposits plus medium- and long-term funding to the Group’s loans was 116%, underscoring the comfortable funding structure.
The Group's access to wholesale funding markets as well as the cost of issuances depends, in part, on the ratings of the rating agencies.
The ratings of Banco Santander, S.A. by the main rating agencies were: Fitch A- senior non-preferred debt, A senior long-term and F2/F1 senior short-term;, Moody's A2 long-term and P-1 short-term; and DBRS A High and R-1 Medium short-term. In December, Standard & Poor's (S&P) raised its long-term rating to A+ (from A) and maintained its short-term rating at A-1. Moody's, DBRS and Fitch maintained their stable outlooks. In March, S&P upgraded it to stable as a result of the sovereign's outlook upgrade.
Sometimes the methodology applied by the agencies limits a bank's rating to the sovereign rating of the country where it is headquartered. Banco Santander, S.A. is still rated above the sovereign debt rating of the Kingdom of Spain by Moody’s, DBRS and S&P and at the same level by Fitch, which demonstrates our financial strength and diversification.
| Customer funds | ||
| % operating areas. June 2022 | ||
| 16 | | January - June 2022 | ||||||
| SOLVENCY RATIOS | ||||||||
| Executive summary | ||||||||||||||||||||||||||||||||||||||||||||||||||||||||||||||||||||||||||||||||||||||||||||||||||
| Fully-loaded capital ratio | Fully-loaded CET1 ratio | |||||||||||||||||||||||||||||||||||||||||||||||||||||||||||||||||||||||||||||||||||||||||||||||||
| Fully-loaded CET1 ratio over 12% at the end of June 2022 | We continued to generate capital organically in the quarter, backed by profit and RWA management | |||||||||||||||||||||||||||||||||||||||||||||||||||||||||||||||||||||||||||||||||||||||||||||||||
 | Gross organic generation | +26 bps | ||||||||||||||||||||||||||||||||||||||||||||||||||||||||||||||||||||||||||||||||||||||||||||||||
Cash dividend accrual2 | -8 bps | |||||||||||||||||||||||||||||||||||||||||||||||||||||||||||||||||||||||||||||||||||||||||||||||||
| TNAV per share | ||||||||||||||||||||||||||||||||||||||||||||||||||||||||||||||||||||||||||||||||||||||||||||||||||
TNAV per share was EUR 4.24, in line with the previous quarter and 9% higher year-on-year including cash dividends | ||||||||||||||||||||||||||||||||||||||||||||||||||||||||||||||||||||||||||||||||||||||||||||||||||
At the end of June 2022, the total phased-in capital ratio (applying the IFRS 9 transitional arrangements) stood at 16.18% and the phased-in CET1 ratio at 12.25%. We comfortably meet the levels required by the European Central Bank on a consolidated basis (13.01% for the total capital ratio and 8.85% for the CET1 ratio). This results in a distance to the maximum distributable amount (MDA) of 307 bps and a CET1 management buffer of 340 bps.
The total fully-loaded capital ratio stood at 15.95% and the fully-loaded CET1 ratio at 12.05%.
We maintained strong net organic generation in the quarter, 18 bps, resulting from gross organic generation of 26 bps (from Q2'22 earnings and RWA management), and the -8 bps accrual for the future cash dividend payment, corresponding to 20% of Q2'22 profit.
Additionally, in the quarter there was a 5 bp reduction stemming from corporate transactions (mainly due to the increase in Ebury's stake), a 16 bp negative impact from markets (of which -13 bps from portfolio valuations) and a 3 bp positive impact from models and others.
The fully-loaded leverage ratio stood at 4.67%, and the phased-in at 4.73%, following the end of the temporary measures approved during the pandemic which permitted the exclusion of reserves with Eurosystem central banks.
Lastly, the TNAV per share ended June 2022 at EUR 4.24, in line with March 2022 including the EUR 5.15 cents cash dividend paid in May. Compared to the same period last year, TNAV per share increased 9%, including the previously mentioned dividend, and EUR 4.85 cents cash dividend paid in November 2021.
| Eligible capital. June 2022 | ||||||||
| EUR million | ||||||||
| Fully-loaded | Phased-in* | |||||||
| CET1 | 72,964 | 74,091 | ||||||
| Basic capital | 81,758 | 82,885 | ||||||
| Eligible capital | 96,585 | 97,850 | ||||||
| Risk-weighted assets | 605,405 | 604,777 | ||||||
| CET1 capital ratio | 12.05 | 12.25 | ||||||
| Tier 1 capital ratio | 13.50 | 13.71 | ||||||
| Total capital ratio | 15.95 | 16.18 | ||||||
| Fully-loaded CET1 ratio performance | ||
| % | ||
 | ||
(1) Data published in Q1'22, which included the acquisition of Amherst Pierpont (completed in April 2022).
(2) Cash dividend accrual corresponding to 20% of Q2'22 profit. The implementation of the shareholder remuneration policy is subject to future corporate and regulatory decisions and approvals.
(*) The phased-in ratio includes the transitory treatment of IFRS 9, calculated in accordance with article 473 bis of the Capital Requirements Regulation (CRR2) and subsequent modifications introduced by Regulation 2020/873 of the European Union. Total phased-in capital ratios include the transitory treatment according to chapter 4, title 1, part 10 of the CRR2.
January - June 2022 | | 17 | ||||||
| RISK MANAGEMENT | ||||||||
| Executive summary | |||||||||||||||||||||||||||||||||||||||||||||||||||||
| Credit risk | Market risk | ||||||||||||||||||||||||||||||||||||||||||||||||||||
| Credit quality indicators remain at contained levels even in the current environment. | Despite the uncertainty caused by the Russia-Ukraine conflict, our risk profile remained stable with a slight increase in VaR levels | ||||||||||||||||||||||||||||||||||||||||||||||||||||
Cost of risk2 | NPL ratio | Coverage ratio | Q2'22 | Average VaR | EUR 13.5 million | ||||||||||||||||||||||||||||||||||||||||||||||||
| 0.83% | 3.05% | 71% | |||||||||||||||||||||||||||||||||||||||||||||||||||
| +6 bps vs Q1'22 | -21 bps vs Q1'22 | +2 pp vs Q1'22 | |||||||||||||||||||||||||||||||||||||||||||||||||||
| Structural and liquidity risk | Operational risk | ||||||||||||||||||||||||||||||||||||||||||||||||||||
| Robust and diversified liquidity buffer, with ratios well above regulatory requirements | Losses, by Basel categories, remained in line with the previous quarter | ||||||||||||||||||||||||||||||||||||||||||||||||||||
| Liquidity Coverage Ratio (LCR) | |||||||||||||||||||||||||||||||||||||||||||||||||||||
165% +8 pp vs Q1'22 | |||||||||||||||||||||||||||||||||||||||||||||||||||||
u Russia-Ukraine conflict monitoring
As mentioned in the previous quarter, Santander's direct exposure to Russia and Ukraine is immaterial.
Nevertheless, we are continuously monitoring the geopolitical events with special focus on key indicators, as well as on the most affected customers due to the increased inflation (energy, oil and commodities prices) as a consequence of the Russia-Ukraine conflict.
The Compliance teams continue to review the correct application of the sanctions established by the international community and are carrying out assessments and analyses to provide senior management with the necessary data.
u Credit risk management
Total risk: our exposure increased to EUR 1,121,726 million, +3% vs Q1'22 and +7% year-on-year in constant euros, despite the economic slowdown caused by the rise in interest rates to reduce inflation, the disruption of global production chains as a result of covid-19 outbreaks in Asia and the impact on energy and food prices from the Russia-Ukraine conflict.
Credit impaired loans: EUR 34,259 million, 3% lower in constant compared to the previous quarter, due to portfolio sales, mainly in Spain, together with proactive risk management.
NPL ratio: 3.05%, a 21 bp decrease quarter-on-quarter and -17 bps year-on-year, explained by the positive performance in Europe and North America (-37 bps and -12 bps vs Q1’22, respectively) somewhat mitigated by the rise in South America.
Loan-loss provisions amounted to EUR 4,735 million, an 18% increase compared to the previous year in constant euros, which led to a cost of risk of 0.83% (+6 bps in the quarter), currently with no signs of deterioration despite the current inflationary scenario.
This loan-loss provisions performance, together with the aforementioned portfolio sales, brought the total loan-loss reserves to EUR 24,195 million, a 2% decrease compared to Q1’22 in constant euros.
Total coverage of credit impaired loans stood at 71% (+2 pp compared to the previous quarter). Moreover, to fully understand this value, it should be noted that a significant part of our portfolios in Spain and the UK has real estate collateral, which requires lower coverage levels.
| Key metrics performance by geographic area | ||||||||||||||||||||||||||||||||||||||
Loan-loss provisions1 | Cost of risk (%)2 | NPL ratio (%) | Total coverage ratio (%) | |||||||||||||||||||||||||||||||||||
| H1'22 | Chg (%) / H1'21 | H1'22 | Chg (bps) / H1'21 | H1'22 | Chg (bps) / H1'21 | H1'22 | Chg (pp) / Q1'21 | |||||||||||||||||||||||||||||||
| Europe | 1,146 | (4.3) | 0.37 | (12) | 2.63 | (67) | 50.2 | 1.8 | ||||||||||||||||||||||||||||||
| North America | 962 | 48.8 | 1.09 | (59) | 2.71 | 43 | 111.4 | (40.9) | ||||||||||||||||||||||||||||||
| South America | 2,333 | 37.8 | 2.97 | 46 | 5.39 | 102 | 86.9 | (11.2) | ||||||||||||||||||||||||||||||
| Digital Consumer Bank | 287 | (7.0) | 0.44 | (20) | 2.22 | 5 | 97.4 | (14.4) | ||||||||||||||||||||||||||||||
| TOTAL GROUP | 4,735 | 18.1 | 0.83 | (11) | 3.05 | (17) | 70.6 | (2.2) | ||||||||||||||||||||||||||||||
| (1) EUR million and % change in constant euros. | ||||||||||||||||||||||||||||||||||||||
| (2) Allowances for loan-loss provisions over the last 12 months / Average loans and advances to customers over the last 12 months. | ||||||||||||||||||||||||||||||||||||||
For more detailed information regarding the countries, please see the Alternative Performance Measures section. | ||||||||||||||||||||||||||||||||||||||
| 18 | | January - June 2022 | ||||||
Regarding the measures implemented to mitigate the impact of the pandemic, all moratoria programmes granted by the Group had fully expired by the end of the second quarter, with a better-than-expected performance. As for government liquidity programmes, we are closely monitoring their performance as grace periods come to an end. This type of programme was mostly granted in Spain, where 87% have now expired and credit quality is in line with expectations, with no concerning signs of deterioration.
IFRS 9 stages evolution: the distribution of the portfolio remained stable in the quarter.
| Coverage ratio by stage | |||||||||||||||||||||||
| EUR billion | |||||||||||||||||||||||
Exposure1 | Coverage | ||||||||||||||||||||||
| Jun-22 | Mar-22 | Jun-21 | Jun-22 | Mar-22 | Jun-21 | ||||||||||||||||||
| Stage 1 | 998 | 967 | 904 | 0.5 | % | 0.5 | % | 0.5 | % | ||||||||||||||
| Stage 2 | 66 | 68 | 70 | 8.5 | % | 8.0 | % | 8.2 | % | ||||||||||||||
| Stage 3 | 34 | 36 | 33 | 40.1 | % | 41.0 | % | 42.2 | % | ||||||||||||||
(1) Exposure subject to impairment. Additionally, in June 2022 there is EUR 23 billion in loans and advances to customers not subject to impairment recorded at mark to market with changes through P&L (EUR 22 billion in March 2022 and EUR 26 billion in June 2021).
Stage 1: financial instruments for which no significant increase in credit risk is identified since its initial recognition.
Stage 2: if there has been a significant increase in credit risk since the date of initial recognition but the impairment event has not materialized, the financial instrument is classified in Stage 2.
Stage 3: a financial instrument is catalogued in this stage when it shows effective signs of impairment as a result of one or more events that have already occurred resulting in a loss.
| Credit impaired loans and loan-loss allowances | |||||||||||
| EUR million | |||||||||||
| Change (%) | |||||||||||
| Q2'22 | QoQ | YoY | |||||||||
| Balance at beginning of period | 35,670 | 7.3 | 9.8 | ||||||||
| Net additions | 2,115 | (44.0) | (17.4) | ||||||||
| Increase in scope of consolidation | — | — | — | ||||||||
| Exchange rate differences and other | (247) | — | — | ||||||||
| Write-offs | (3,279) | 36.5 | 54.7 | ||||||||
| Balance at period-end | 34,259 | (4.0) | 3.0 | ||||||||
| Loan-loss allowances | 24,195 | (2.4) | (0.2) | ||||||||
| For impaired assets | 13,739 | (6.0) | (2.1) | ||||||||
| For other assets | 10,456 | 2.8 | 2.4 | ||||||||
u Market risk
The risk associated with global corporate banking trading activity is mainly interest rate driven, focused on servicing our customers' needs and measured in daily VaR terms at 99%.
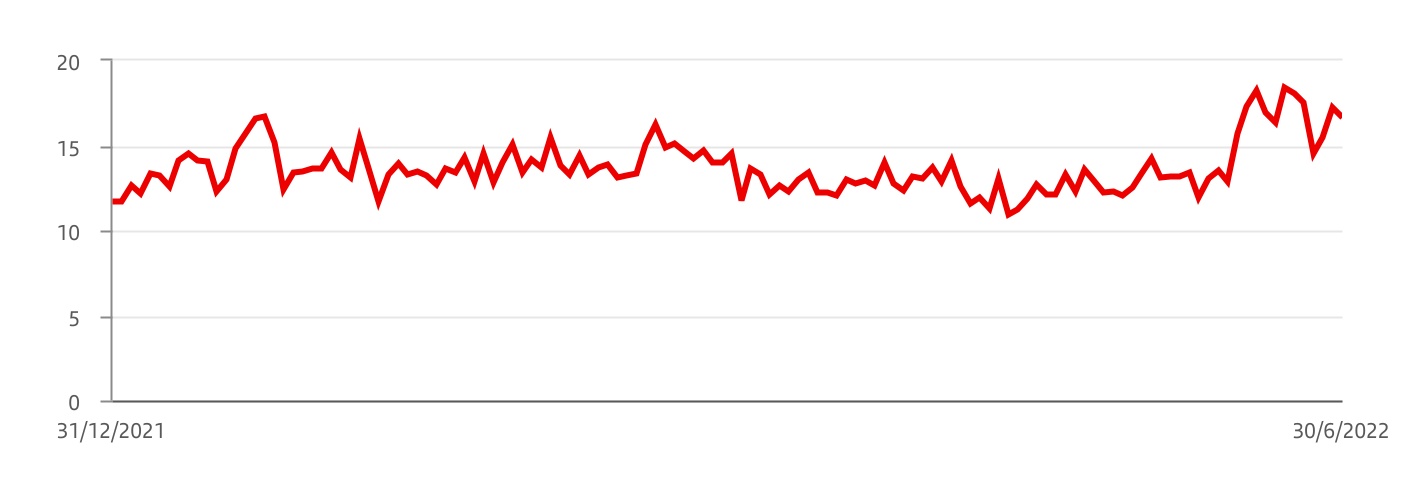
In the second quarter of 2022, the VaR fluctuated around an average value of EUR 13.5 million, reflecting our low market risk profile in an environment of high uncertainty caused by a new covid-19 outbreak in Asia, pressure from high global inflation and the Russia-Ukraine conflict. VaR rebounded slightly at the end of the period driven by increased volatility mainly due to the recent actions taken by central banks, who accelerated their policies to combat inflation. The quarter’s closing VaR was EUR 17 million. These figures remain low compared to the size of the Group’s balance sheet and activity.
Trading portfolios.(1) VaR by geographic region | ||||||||||||||
| EUR million | ||||||||||||||
| 2022 | 2021 | |||||||||||||
| Second quarter | Average | Latest | Average | |||||||||||
| Total | 13.5 | 16.6 | 9.1 | |||||||||||
| Europe | 10.2 | 13.3 | 7.9 | |||||||||||
| North America | 2.0 | 2.1 | 2.4 | |||||||||||
| South America | 7.8 | 10.7 | 6.0 | |||||||||||
1. Activity performance in Santander Corporate & Investment Banking markets.
Trading portfolios.(1) VaR by market factor | ||||||||||||||
| EUR million | ||||||||||||||
| Second quarter 2022 | Min. | Avg. | Max. | Last | ||||||||||
| VaR total | 10.9 | 13.5 | 18.4 | 16.6 | ||||||||||
| Diversification effect | (8.8) | (14.1) | (28.0) | (18.8) | ||||||||||
| Interest rate VaR | 9.0 | 11.6 | 17.9 | 16.6 | ||||||||||
| Equity VaR | 3.2 | 4.2 | 5.6 | 3.4 | ||||||||||
| FX VaR | 2.7 | 5.2 | 10.3 | 5.3 | ||||||||||
| Credit spreads VaR | 3.8 | 5.1 | 8.5 | 6.1 | ||||||||||
| Commodities VaR | 1.0 | 1.5 | 4.0 | 4.0 | ||||||||||
1.Activity performance in Santander Corporate & Investment Banking markets.
Note: In the North America, South America and Asia portfolios, VaR corresponding to the credit spreads factor other than sovereign risk is not relevant and is included in the interest rate factor.
January - June 2022 | | 19 | ||||||
Trading portfolios1. VaR performance | ||
| EUR million | ||
| (1) Corporate & Investment Banking performance in financial markets | ||||||||||||||
u Structural and liquidity risk
Structural exchange rate risk: mainly driven by transactions in foreign currencies related to permanent financial investments, their results and related hedges. Our dynamic management of this risk seeks to limit the impact of foreign exchange rate movements on the Group's core capital ratio. In the quarter, hedging of currencies impacting this ratio remained close to 100%.
Structural interest rate risk: uncertainty over the Russia-Ukraine conflict continued to put pressure on commodity prices, reflected in persistent high levels of inflation. The Central Banks latest actions suggest a faster upward adjustment in interest rates than initially expected, causing higher market volatility. In this context, our structural debt portfolios were negatively impacted, although risk remained at comfortable levels.
Liquidity risk: the Group maintained a comfortable liquidity risk position, supported by a robust and diversified liquidity buffer, with ratios well above regulatory limits.
u Operational risk
In general, our operational risk profile remained stable in the second quarter of 2022, after a moderate increase in the first quarter. The following aspects were closely monitored during this period:
•The Russia-Ukraine conflict and the compliance with international financial measures and sanctions are still a priority.
•IT risks, mainly related to transformation plans due to business strategy and regulatory changes, proactive management of obsolete technology and IT services provided by third parties, in order to ensure availability for services and operations.
•Regulatory compliance, due to increasing regulatory requirements (such as ESG, operational resilience, data management regulations, among others) across the Group.
•Cyber threats across the financial industry, also focused on alerts derived from the Russia-Ukraine conflict, strengthening the bank's monitoring and control environment mechanisms.
•Third party risk exposure, maintaining a close oversight on critical providers, focusing on their control environment including business continuity capabilities, supply chains, cyber risk management and compliance with service level agreements.
•New types of fraud, mainly in online banking transactions (e.g. customer fraud) and in the loan admission processes (e.g. identity theft).
•Emerging risks derived from our transformation initiatives, consumer protection in different markets and climate risk.
Regarding the second quarter performance, losses (by Basel categories) remained in line with the previous quarter.
| 20 | | January - June 2022 | ||||||
| GENERAL BACKGROUND | ||||||||
Grupo Santander conducted its business in the second quarter of 2022 in an environment marked by market volatility, uncertainty stemming from the Russia-Ukraine conflict and the increase in inflation related to higher commodity prices, in particular energy and food. Other factors, such as China's zero-covid strategy and its impact on global production chains, have also exacerbated these issues and together have fuelled speculation of a potential future weakening of the global economy. Against this backdrop, central banks in industrialized countries moved ahead with monetary policy normalization, while policies in Latin America continued to tighten.
| Country | GDP Change1 | Economic performance | |||||||||
 | Eurozone | +5.4% | GDP in Q2'22 is expected to slow down due to the effect of the Russia-Ukraine conflict on business confidence, the persistence of supply issues and the rise in inflation. However, the labour market remained dynamic (unemployment rate of 6.6% in May, the lowest since the introduction of the euro). The rise in inflation concerned the ECB, who raised interest rate by 50 bps in July. | ||||||||
 | Spain | +6.3% | In Q2'22, the dynamism of the labour market remained, boosted by the end of covid-19-related restrictions. All this despite the uncertainty stemming from the Russia-Ukraine conflict and the tightening of financing conditions. Inflation continued to rise to 10.2% in June. | ||||||||
 | United Kingdom | +8.7% | Economic growth started to slow down in February due to higher energy and production costs, which had an impact on inflation (9.4% in June), in turn affecting households. Employment remained strong in an environment of tight labour supply (unemployment rate at 3.8%). To tackle high inflation, the BoE raised interest rates to 1.25% in June. | ||||||||
 | Portugal | +11.9% | The economy continued to expand, albeit at a slower pace, backed by both consumption and tourism. Despite rising inflation (8.7% in June) damaging purchasing power, the labour market remained robust (unemployment rate at 5.9%) and contributed to economic growth. Positive economic performance is having a favourable impact on public accounts (deficit reduction between January-April). | ||||||||
 | Poland | +8.5% | Economic growth is losing momentum in Q2'22 due to the consequences of the Russia-Ukraine conflict. Government measures to support households in the face of sharp price increases (CPI of 15.5% in June) and supply cuts, as well as the strong labour market (unemployment rate at 3%) should enable economic growth to slow down gradually. The official interest rate was raised to 6.5% to tame inflation. | ||||||||
 | United States | +3.5% | Inflation reached 9.1% in June. Core inflation stood at 5.9% and forecasts suggest it has not yet peaked. Employment grew at a healthy pace and unemployment stood at low levels (3.5%). The Fed accelerated rate hikes (to 1.5-1.75% in June) and expects further rapid raises this year, increasing fears of recession. | ||||||||
 | Mexico | +1.8% | The recovery of GDP growth that began in early 2022 continued in Q2'22 supported by industry and services. However, greater global uncertainty and heightened inflation (8% in June) could result in a slowdown. The central bank reaffirmed its commitment to price stability and accelerated the process of interest rate hikes (125 bps in Q2'22 to 7.75%) and maintained a restrictive policy. | ||||||||
 | Brazil | +1.7% | After a positive first quarter, economic growth remained dynamic in Q2'22, with expansion in services and manufacturing and a strong labour market. Inflation started to moderate slightly in May, but remained high (11.9% in June) and the central bank raised the official rate by 150 bps in Q2'22 to 13.25% and announced at least one more hike. | ||||||||
 | Chile | +7.2% | GDP growth weakened in 2022 following the strong growth recorded in 2021, as the effects of fiscal and monetary impulses of the previous year faded. Soaring inflation (12.5% in June) prompted the central bank to move ahead with monetary tightening, raising the official rate by 350 bps in Q2'22 and 75 bps in July to 9.75%. | ||||||||
 | Argentina | +6.0% | In the first technical review of the agreement with the IMF, Argentina met the established targets, allowing the refinancing of debt maturities with the organization. The economy showed some volatility, although economic slowdown prevailed in the last few months. Inflation remained high (5.5% monthly in Q2'22) and the central bank continued to raise the official rate (750 bps in Q2'22 to 52%). | ||||||||
(1) Year-on-year change for Q1'22.
January - June 2022 | | 21 | ||||||
| DESCRIPTION OF SEGMENTS | ||||||||
We base segment reporting on financial information presented to the chief operating decision maker, which excludes certain statutory results items that distort year-on-year comparisons and are not considered for management reporting. This financial information (underlying basis) is computed by adjusting reported results for the effects of certain gains and losses (e.g. capital gains, write-downs, impairment of goodwill, etc.). These gains and losses are items that management and investors ordinarily identify and consider separately to better understand the underlying trends in the business.
Santander has aligned the information in this chapter with the underlying information used internally for management reporting and with that presented in the Group's other public documents.
Santander's executive committee has been selected to be its chief operating decision maker. The Group's operating segments reflect its organizational and managerial structures. The executive committee reviews internal reporting based on these segments to assess performance and allocate resources.
The segments are split by geographic area in which profits are earned and type of business. We prepare the information by aggregating the figures for Santander’s various geographic areas and business units, relating it to both the accounting data of the business units integrated in each segment and that provided by management information systems. The same general principles as those used in the Group are applied.
With the aim of increasing transparency and improving capital allocation to continue enhancing our profitability, on 4 April 2022, we announced that, starting and effective with the financial information for the first quarter of 2022, inclusive, we would carry out the following modifications to our reporting:
a. Main changes in the composition of Grupo Santander's segments announced in April 2022
The main changes, which have been applied to management information for all periods included in the consolidated financial statements, are the following:
1.Reallocation of certain financial costs from the Corporate Centre to the country units:
•Further clarity in the MREL/TLAC regulation makes it possible to better allocate the cost of eligible debt issuances to the country units.
•Other financial costs, primarily associated with the cost of funding the excess capital held by the country units above the Group's CET1 ratio, have been reassigned accordingly.
2.Downsizing of Other Europe.
•The Corporate & Investment Banking branches of Banco Santander, S.A. in Europe and other business lines previously reported under 'Other Europe' have been now integrated into the Spain unit to reflect how the business will be managed and supervised, in line with other regions.
The Group recast the corresponding information of earlier periods considering the changes included in this section to facilitate a homogeneous comparison.
In addition to these changes, we completed the usual annual adjustment of the perimeter of the Global Customer Relationship Model between Retail Banking and Santander Corporate & Investment Banking and between Retail Banking and Wealth Management & Insurance.
The above-mentioned changes have no impact on the Group’s reported consolidated financial figures.
| 22 | | January - June 2022 | ||||||
b. Current composition of Grupo Santander segments
Primary segments
This primary level of segmentation, which is based on the Group’s management structure, comprises five reportable segments: four operating areas plus the Corporate Centre. The operating areas are:
Europe: comprises all business activity carried out in the region, except that included in Digital Consumer Bank. Detailed financial information is provided on Spain, the UK, Portugal and Poland.
North America: comprises all the business activities carried out in Mexico and the US, which includes the holding company (SHUSA) and the businesses of Santander Bank, Santander Consumer USA (SC USA), the specialized business unit Banco Santander International, Santander Investment Securities (SIS) and Santander's New York branch.
South America: includes all the financial activities carried out by Grupo Santander through its banks and subsidiary banks in the region. Detailed information is provided on Brazil, Chile, Argentina, Uruguay, Peru and Colombia.
Digital Consumer Bank: includes Santander Consumer Finance, which incorporates the entire consumer finance business in Europe, Openbank and ODS.
Secondary segments
At this secondary level, Grupo Santander is structured into Retail Banking, Santander Corporate & Investment Banking (SCIB), Wealth Management & Insurance (WM&I) and PagoNxt.
Retail Banking: this covers all customer banking businesses, including consumer finance, except those of corporate banking which are managed through Santander Corporate & Investment Banking, asset management, private banking and insurance, which are managed by Wealth Management & Insurance. The results of the hedging positions in each country are also included, conducted within the sphere of their respective assets and liabilities committees.
Santander Corporate & Investment Banking: this business reflects revenue from global corporate banking, investment banking and markets worldwide including treasuries managed globally (always after the appropriate distribution with Retail Banking customers), as well as equity business.
Wealth Management & Insurance: includes the asset management business (Santander Asset Management), the corporate unit of Private Banking and International Private Banking in Miami and Switzerland (Santander Private Banking) and the insurance business (Santander Insurance).
PagoNxt: this includes digital payment solutions, providing global technology solutions for our banks and new customers in the open market. It is structured in four businesses: Merchant, International Trade, Payments and Consumer.
In addition to these operating units, both primary and secondary segments, the Group continues to maintain the area of Corporate Centre, that includes the centralized activities relating to equity stakes in financial companies, financial management of the structural exchange rate position, assumed within the sphere of the Group’s assets and liabilities committee, as well as management of liquidity and of shareholders’ equity via issuances, adapting this management to the changes described above.
As the Group’s holding entity, this area manages all capital and reserves and allocations of capital and liquidity with the rest of businesses. It also incorporates goodwill impairment but not the costs related to the Group’s central services (charged to the areas), except for corporate and institutional expenses related to the Group’s functioning.
The businesses included in each of the primary segments in this report and the accounting principles under which their results are presented here may differ from the businesses included and accounting principles applied in the financial information separately prepared and disclosed by our subsidiaries (some of which are publicly listed) which in name or geographical description may seem to correspond to the business areas covered in this report. Accordingly, the results of operations and trends shown for our business areas in this document may differ materially from those of such subsidiaries. The results of our business areas presented below are provided on the basis of underlying results only and generally including the impact of foreign exchange rate fluctuations. However, for a better understanding of the changes in the performance of our business areas, we also provide and discuss the year-on-year changes to our results excluding such exchange rate impacts. On the other hand, certain figures contained in this report, including financial information, have been subject to rounding to enhance their presentation. Accordingly, in certain instances, the sum of the numbers in a column or a row in tables contained in this report may not conform exactly to the total figure given for that column or row. | ||
January - June 2022 | | 23 | ||||||
| January-June 2022 | ||||||||||||||||||||
| Main items of the underlying income statement | ||||||||||||||||||||
| EUR million | ||||||||||||||||||||
| Primary segments | Net interest income | Net fee income | Total income | Net operating income | Profit before tax | Underlying profit attributable to the parent | ||||||||||||||
| Europe | 5,820 | 2,316 | 8,581 | 4,417 | 2,693 | 1,839 | ||||||||||||||
| Spain | 2,015 | 1,475 | 3,937 | 1,994 | 904 | 652 | ||||||||||||||
| United Kingdom | 2,418 | 202 | 2,633 | 1,285 | 995 | 736 | ||||||||||||||
| Portugal | 340 | 245 | 613 | 363 | 327 | 225 | ||||||||||||||
| Poland | 894 | 268 | 1,090 | 751 | 444 | 207 | ||||||||||||||
| Other | 152 | 126 | 307 | 25 | 23 | 18 | ||||||||||||||
| North America | 4,483 | 937 | 5,780 | 3,088 | 2,061 | 1,578 | ||||||||||||||
| US | 2,877 | 394 | 3,665 | 1,984 | 1,378 | 1,090 | ||||||||||||||
| Mexico | 1,606 | 529 | 2,096 | 1,166 | 747 | 546 | ||||||||||||||
| Other | 0 | 14 | 19 | (62) | (64) | (58) | ||||||||||||||
| South America | 6,427 | 2,175 | 8,933 | 5,780 | 3,165 | 1,946 | ||||||||||||||
| Brazil | 4,421 | 1,600 | 6,393 | 4,442 | 2,270 | 1,365 | ||||||||||||||
| Chile | 1,038 | 222 | 1,357 | 868 | 646 | 391 | ||||||||||||||
| Argentina | 732 | 264 | 821 | 345 | 168 | 145 | ||||||||||||||
| Other | 236 | 90 | 362 | 126 | 82 | 44 | ||||||||||||||
| Digital Consumer Bank | 2,032 | 425 | 2,573 | 1,325 | 1,010 | 572 | ||||||||||||||
| Corporate Centre | (353) | (1) | (747) | (926) | (1,014) | (1,040) | ||||||||||||||
| TOTAL GROUP | 18,409 | 5,852 | 25,120 | 13,685 | 7,915 | 4,894 | ||||||||||||||
| Secondary segments | ||||||||||||||||||||
| Retail Banking | 16,714 | 3,791 | 20,635 | 11,610 | 5,997 | 3,991 | ||||||||||||||
| Corporate & Investment Banking | 1,714 | 1,027 | 3,612 | 2,324 | 2,291 | 1,531 | ||||||||||||||
| Wealth Management & Insurance | 329 | 655 | 1,222 | 726 | 705 | 515 | ||||||||||||||
| PagoNxt | 5 | 379 | 398 | (50) | (64) | (104) | ||||||||||||||
| Corporate Centre | (353) | (1) | (747) | (926) | (1,014) | (1,040) | ||||||||||||||
| TOTAL GROUP | 18,409 | 5,852 | 25,120 | 13,685 | 7,915 | 4,894 | ||||||||||||||
| Underlying attributable profit to the parent distribution* | ||
| January - June 2022 | ||

(*) As a % of operating areas. Excluding the Corporate Centre.
| Underlying attributable profit to the parent. H1'22 | ||
| EUR million. % change YoY in constant euros | ||
| Europe | | |||||||
| ||||||||
| ||||||||
| ||||||||
| North America | | |||||||
| ||||||||
| South America | | |||||||
| ||||||||
| ||||||||
| Digital Consumer Bank | DCB | |||||||
| Global businesses |  | |||||||
 | ||||||||
 | ||||||||
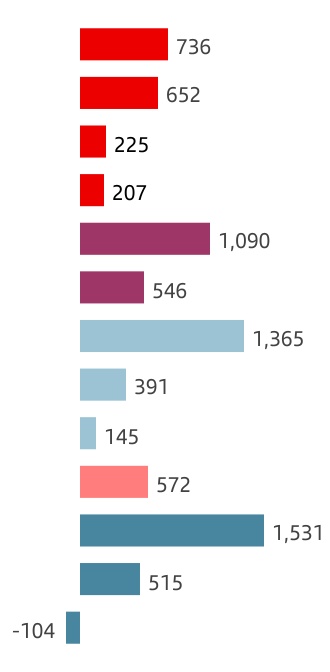
| +6 | % | |
| +86 | % | |
| -2 | % | |
| +381 | % | |
| -21 | % | |
| +32 | % | |
| -1 | % | |
| +27 | % | |
| +58 | % | |
| +16 | % | |
| +28 | % | |
| +15 | % | |
| -16 | % | |
| 24 | | January - June 2022 | ||||||
| January-June 2021 | ||||||||||||||||||||
| Main items of the underlying income statement | ||||||||||||||||||||
| EUR million | ||||||||||||||||||||
| Primary segments | Net interest income | Net fee income | Total income | Net operating income | Profit before tax | Underlying profit attributable to the parent | ||||||||||||||
| Europe | 5,207 | 2,157 | 7,903 | 3,760 | 1,963 | 1,312 | ||||||||||||||
| Spain | 2,139 | 1,378 | 3,901 | 1,874 | 512 | 351 | ||||||||||||||
| United Kingdom | 2,076 | 238 | 2,298 | 999 | 973 | 677 | ||||||||||||||
| Portugal | 370 | 210 | 715 | 427 | 333 | 229 | ||||||||||||||
| Poland | 475 | 253 | 759 | 438 | 127 | 44 | ||||||||||||||
| Other | 147 | 79 | 229 | 23 | 18 | 11 | ||||||||||||||
| North America | 3,949 | 861 | 5,421 | 3,079 | 2,478 | 1,581 | ||||||||||||||
| US | 2,610 | 432 | 3,684 | 2,152 | 1,996 | 1,253 | ||||||||||||||
| Mexico | 1,339 | 414 | 1,730 | 978 | 535 | 378 | ||||||||||||||
| Other | 0 | 14 | 7 | (52) | (53) | (50) | ||||||||||||||
| South America | 5,326 | 1,770 | 7,303 | 4,785 | 3,105 | 1,639 | ||||||||||||||
| Brazil | 3,696 | 1,330 | 5,199 | 3,697 | 2,350 | 1,178 | ||||||||||||||
| Chile | 1,008 | 190 | 1,251 | 770 | 591 | 321 | ||||||||||||||
| Argentina | 437 | 161 | 561 | 212 | 98 | 106 | ||||||||||||||
| Other | 185 | 88 | 292 | 107 | 66 | 35 | ||||||||||||||
| Digital Consumer Bank | 2,010 | 395 | 2,486 | 1,272 | 888 | 485 | ||||||||||||||
| Corporate Centre | (297) | (13) | (418) | (577) | (806) | (812) | ||||||||||||||
| TOTAL GROUP | 16,196 | 5,169 | 22,695 | 12,318 | 7,628 | 4,205 | ||||||||||||||
| Secondary segments | ||||||||||||||||||||
| Retail Banking | 14,859 | 3,489 | 18,995 | 10,629 | 6,270 | 3,576 | ||||||||||||||
| Corporate & Investment Banking | 1,407 | 889 | 2,869 | 1,764 | 1,688 | 1,140 | ||||||||||||||
| Wealth Management & Insurance | 228 | 596 | 1,063 | 615 | 598 | 432 | ||||||||||||||
| PagoNxt | (2) | 209 | 189 | (108) | (118) | (127) | ||||||||||||||
| Corporate Centre | (297) | (13) | (418) | (577) | (806) | (812) | ||||||||||||||
| TOTAL GROUP | 16,196 | 5,169 | 22,695 | 12,318 | 7,628 | 4,205 | ||||||||||||||
January - June 2022 | | 25 | ||||||
Business model | ||||||||||||||||||||||||||
| Primary segments | ||||||||||||||||||||||||||
 | EUROPE | Underlying attributable profit | ||||||
| EUR 1,839 mn | ||||||||
Executive summary → We continue to accelerate our business transformation in One Santander in Europe, in order to achieve superior growth and a more efficient operating model. This should allow us to further improve profitability and increase RoTE in the coming years. → Overall growth in volumes quarter-on-quarter and in the last 12 months, when loans and deposits both grew 5% in constant euros. → Higher revenue, continued efficiency improvement and better cost of risk, led to an underlying attributable profit of EUR 1,839 million, up 40% year-on-year in euros and +38% excluding the exchange rate impact. | ||||||||
Strategy
Our goal with One Santander in Europe is to create a better bank where customers and our people feel a deep connection and that delivers sustainable value for our shareholders having a positive impact in society. In order to achieve our goals of growing our customer base and loyalty while delivering a more efficient and profitable business model, we are making progress in the business transformation through our action plan, defined around three main blocks:
•Grow our business by better serving our customers through regional simplification and an improved value proposition.
•Redefining customer interaction by enhancing our digital capabilities to offer comprehensive experiences (such as OneApp).
•Create a common operating model that embeds technology into our business, leveraging our scale in the region.
Key developments by country in the quarter:
•Spain: sustained customer base growth with strong commercial activity based on offering the best customer experience through all channels with a simple and innovative value proposition. We focused on product simplification and process automatization to reduce the cost to serve while accelerating the transition to an agile organization.
•United Kingdom: we continue to focus on growing the mortgage business. Our transformation programme continues to deliver efficiency improvements through the simplification and digitalization of key processes.
•Portugal: the digital and commercial transformation plans implemented in 2021 enabled us to continue executing our strategy to increase our customer base, by leveraging service quality. Customer revenue improved and costs decreased while maintaining an adequate risk management.
 | Loyal customers | | Spain | UK | Portugal | Poland | |||||||||||||||||||||||||||||
| Thousands | 10,536 | 2,880 | 4,464 | 883 | 2,307 | ||||||||||||||||||||||||||||||
| YoY change | +4% | +4% | +2% | +6% | +7% | ||||||||||||||||||||||||||||||
 | Digital customers | | Spain | UK | Portugal | Poland | |||||||||||||||||||||||||||||
| Thousands | 16,816 | 5,697 | 6,765 | 1,019 | 3,170 | ||||||||||||||||||||||||||||||
| YoY change | +7% | +7% | +6% | +4% | +11% | ||||||||||||||||||||||||||||||
| 26 | | January - June 2022 | ||||||
Business model | ||||||||||||||||||||||||||
| Primary segments | ||||||||||||||||||||||||||
•Poland: we remained focused on providing the best customer and employee experience, simplifying our products and internal processes through digitalization, while developing platforms to accelerate our progress towards our responsible banking commitments.
To deliver on our targets to tackle climate change, we developed a new governance structure, identifying five key verticals for which we have appointed business leaders in each country: green buildings, clean mobility, renewable energy, agro and circular economy. With this specialization, we strive to create business opportunities to help our customers through joint projects with other relevant players. In Spain, we are already developing a green commercial proposition based on retrofitting, that goes from awareness to turnkey products.
Business performance
We developed our activities in H1'22 amid a complex and uncertain macro environment marked by the continuation of the Russia-Ukraine conflict. This led to higher inflation and, therefore, lower growth forecasts, interest rates hikes in some countries, changes in expectations for eurozone interest rates, and higher market volatility.
Loans and advances to customers grew 4% year-on-year. In gross terms, excluding the exchange rate impact and reverse repurchase agreements, growth was 5%, primarily driven by the mortgage business (mainly in the UK and Spain, but also by the positive trends in Portugal) and cards (primarily in the UK and Portugal). Loans to corporates and SMEs slowed down due to previous government support programmes and a lower demand in previous months.
Customer deposits rose 4%. Excluding the exchange rate impact and repurchase agreements, customer deposits increased 5%, with positive trends in all countries except in the UK, where rising interest rates led to an increase in price competition to capture funds, especially in the retail segment. Mutual funds decreased due to the rising interest rate environment, mainly in Poland.
| Europe. Business performance | ||||||||||||||||||||||||||||||||||||||
| June 2022. EUR billion and YoY % change in constant euros | ||||||||||||||||||||||||||||||||||||||
| 589 | +5% | | 705 | +4% | |||||||||||||||||||||||||||||||||
| ||
| ||
| ||
| ||
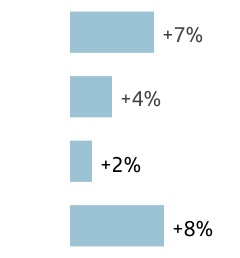 aaaaa
aaaaa | ||
| ||
| ||
| ||
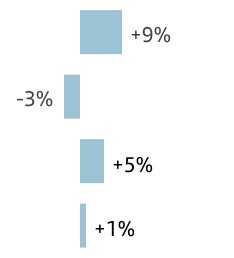
| Gross loans and advances to customers excl. reverse repos | Customer deposits excl. repos + mutual funds | |||||||||||||||||||||||||||||||||||||
Results
Underlying attributable profit in the first half of 2022 was EUR 1,839 million, 40% higher than in the same period of 2021. Excluding the exchange rate impact, profit rose 38%, with the following detail:
•Total income was up 8%, driven by net interest income performance in the UK and Poland, benefitting from higher volumes and interest rate hikes in recent quarters. Net fee income increased in Spain, Poland and Portugal, partially offsetting lower non-recurring results due to ALCO portfolio sales recorded in 2021.
•Our transformation plans enabled us to lower costs by 1% in a high-inflation environment. In real terms, costs fell 7%.
•Loan-loss provisions decreased 4% year-on-year, even with the new provisions related to the CHF portfolio in Poland. Excluding this impact, loan-loss provisions dropped 13%, primarily driven by Spain.
By country:
•Spain: underlying attributable profit recovered driven by strong net fee income growth, higher productivity and a sharp LLP reduction, which drove the six-month annualized cost of risk down to 0.61%.
•United Kingdom: underlying attributable profit increased, reflecting margin management after recent interest rate hikes and boosted by the mortgage business. The cost of risk remained low due to proper credit risk management.
•Portugal: underlying attributable profit fell slightly, mainly due to 2021 non-recurring results from ALCO portfolio sales. Continued positive performance in net fee income propelled by transactional and insurance businesses, while costs and provisions continued downward.
•Poland: underlying attributable profit increased five fold on the back of sharp NII growth. Costs rose reflecting inflationary pressures, while loan-loss provisions increased mainly due to higher provisioning required for the CHF mortgage portfolio.
In the quarter, underlying attributable profit decreased 19% primarily driven by higher regulatory charges: SRF in Spain and Portugal and Institutional Protection Scheme (IPS) in Poland.
| Europe. Underlying income statement | ||||||||||||||||||||||||||
| EUR million and % change | ||||||||||||||||||||||||||
| / | Q1'22 | / | H1'21 | |||||||||||||||||||||||
| Q2'22 | % | excl. FX | H1'22 | % | excl. FX | |||||||||||||||||||||
| Revenue | 4,276 | -1 | 0 | 8,581 | +9 | +8 | ||||||||||||||||||||
| Expenses | -2,104 | +2 | +2 | -4,164 | 0 | -1 | ||||||||||||||||||||
| Net operating income | 2,172 | -3 | -3 | 4,417 | +17 | +17 | ||||||||||||||||||||
| LLPs | -631 | +23 | +23 | -1,146 | -5 | -4 | ||||||||||||||||||||
| PBT | 1,199 | -20 | -19 | 2,693 | +37 | +35 | ||||||||||||||||||||
| Underlying attrib. profit | 821 | -19 | -19 | 1,839 | +40 | +38 | ||||||||||||||||||||
January - June 2022 | | 27 | ||||||
Business model | ||||||||||||||||||||||||||
| Primary segments | ||||||||||||||||||||||||||
| Spain | Underlying attributable profit | ||||||
| EUR 652 mn | ||||||||
Commercial activity and business performance
The quarter was marked by rising inflation, downward growth revisions and market instability. Against this backdrop, we consolidated the growth trend in customers.
In individuals, we maintained positive dynamics both in mortgage and consumer lending, increasing new lending volumes in the quarter. In addition, the insurance protection business continued to grow at double-digit rates year-on-year.
In corporates, we improved on Q1 figures, with quarter-on-quarter growth in factoring (+23%), confirming (+9%) and trade discount (+6%). The trend in long-term funding remained positive (+9%).
Transactional products maintained their year-on-year growth path, also improving our market shares in terms of volumes and number of customers in PoS.
As a result, loans and advances to customers grew 10% year-on-year (+7% in gross terms, excluding reverse repurchase agreements and the exchange rate impact), mainly backed by individuals, private banking and institutions. In the quarter, lending volumes rose 2%.
Customer funds increased 9% versus H1'21, notably deposits (+12% excluding repos) driven both by demand deposits (+9%) and time deposits (+27%). Market volatility continued to impact mutual fund assets under management, but assets under management remained virtually stable compared to June 2021.
Results
Underlying attributable profit in the first half of 2022 amounted to EUR 652 million, 86% higher year-on-year. By line:
•Total income rose 1% year-on-year, backed by net fee income (+7%), compensating the fall in net interest income due to the lower contribution from the ALCO portfolio and the change of mix towards mortgages.
•The cost base continued to fall (-4%) despite soaring inflation and the expansion of the wholesale business, which reflects the progress in the transformation of the operating model.
•The NPL ratio improved further (3.83%; -133 bps year-on-year, partially driven by NPL sales), enabling us to continue reducing LLPs (-26%) and driving the six month annualized cost of credit to 0.61%.
Compared to the first quarter, underlying attributable profit declined 21%, impacted by the contribution to the Single Resolution Fund.
| Spain. Underlying income statement | ||||||||||||||||||||
| EUR million and % change | ||||||||||||||||||||
| Q2'22 | / Q1'22 | H1'22 | / H1'21 | |||||||||||||||||
| Revenue | 1,916 | -5 | 3,937 | +1 | ||||||||||||||||
| Expenses | -971 | 0 | -1,943 | -4 | ||||||||||||||||
| Net operating income | 945 | -10 | 1,994 | +6 | ||||||||||||||||
| LLPs | -416 | +6 | -807 | -26 | ||||||||||||||||
| PBT | 385 | -26 | 904 | +77 | ||||||||||||||||
| Underlying attrib. profit | 287 | -21 | 652 | +86 | ||||||||||||||||
| United Kingdom | Underlying attributable profit | ||||||
| EUR 736 mn | ||||||||
Commercial activity and business performance
In the first half of 2022, we delivered a positive performance amid a challenging backdrop of rising inflation and interest rates.
We continued to adapt our operating model to meet the changing needs of our customers and increased remote banking capabilities. Our customers further utilized digital channels for banking services, with 70% of refinanced mortgage loans processed online, 90% of new current accounts opened through digital channels and digital transactions up 12% year-on-year.
In June 2022, we increased the rate on our 1|2|3 Current Account by 25 bps to 0.75% and our eSaver accounts by 50 bps. Santander UK remains the only bank in the UK to offer customers both cashback on household bills and interest on current account balances.
Loans and advances to customers decreased by 1% year-on-year. In gross terms and excluding reverse repos and the exchange rate impact, growth was 4%, supported by an increase of GBP 7.1 billion in net mortgage lending (GBP 18.9 billion in gross new lending) in a strong housing market.
Customer deposits declined by 6%. Excluding repos and the exchange rate impact, customer deposits contracted 3% primarily due to the CIB business transfer. This performance also reflected reductions in retail liability balances, as customers return to more normal spending patterns following the covid-19 pandemic.
Results
Underlying attributable profit in the first half of 2022 increased 9% year-on-year to EUR 736 million, +6% excluding the exchange rate impact, as follows:
•Total income was up 11% driven by strong NII growth (+13%) benefitting from higher interest rates and a resilient mortgage market. This performance was partially offset by lower fee income due to the transfer of the CIB business.
•Operating expenses grew slightly due to technology investments and inflationary pressures. In real terms, costs were down 5% as we continue to see savings from our transformation programme. The efficiency ratio improved 5.3 pp to 51.2%.
•Loan-loss provisions rose to EUR 125 million (EUR 70 million release in H1'21), reflecting the impact of a downturn in the economic forecast and increased affordability in our retail portfolios. However, cost of risk remained very low.
In the quarter, underlying attributable profit decreased 3% in constant euros as higher revenue and efficiency improvement was offset by higher provisions.
| United Kingdom. Underlying income statement | ||||||||||||||||||||||||||
| EUR million and % change | ||||||||||||||||||||||||||
| / | Q1'22 | / | H1'21 | |||||||||||||||||||||||
| Q2'22 | % | excl. FX | H1'22 | % | excl. FX | |||||||||||||||||||||
| Revenue | 1,342 | +4 | +5 | 2,633 | +15 | +11 | ||||||||||||||||||||
| Expenses | -677 | +1 | +2 | -1,348 | +4 | +1 | ||||||||||||||||||||
| Net operating income | 666 | +7 | +9 | 1,285 | +29 | +25 | ||||||||||||||||||||
| LLPs | -74 | +45 | +46 | -125 | — | — | ||||||||||||||||||||
| PBT | 492 | -2 | -1 | 995 | +2 | -1 | ||||||||||||||||||||
| Underlying attrib. profit | 361 | -4 | -3 | 736 | +9 | +6 | ||||||||||||||||||||
| 28 | | January - June 2022 | ||||||
Business model | ||||||||||||||||||||||||||
| Primary segments | ||||||||||||||||||||||||||
| Portugal | Underlying attributable profit | ||||||
| EUR 225 mn | ||||||||
Commercial activity and business performance
Activity and business volumes continued to rise as a result of our strategy of selective growth, customer loyalty and improved service quality. As a result, we further increased the number of loyal (+6%) and digital (+4%) customers.
New mortgage lending maintained its momentum, with market shares over 20% and stock figures at record highs. As a result, loans and advances to customers increased 2% (as well as in gross terms and excluding reverse repos). On the other hand, good portfolio management reduced the NPL ratio 37 bps to 3.33%.
Customer funds were up 5%. Customer deposits increased 6%, as well as excluding repos, boosted by demand deposits (+10%), while mutual funds dropped 4%, reflecting the challenging market environment.
Results
Underlying attributable profit in the first half of 2022 was 2% lower year-on-year at EUR 225 million, dampened by lower gains on financial transactions (-71%), which included ALCO capital gains recorded in 2021:
•Customer revenue grew 1% driven by the positive trend in net fee income (+17%), which mitigated weak NII performance, dampened by still low interest rates and reduced ALCO portfolio volumes.
•Costs continued on their downward trend (-13%), benefiting from the business and digital transformation and enabled the efficiency ratio to stand below 41%.
•Loan-loss provisions plummeted by 84%, driving the cost of risk to virtually 0%.
Compared to the previous quarter, profit was 48% lower, mainly due to the contribution to the SRF and to the banking sector, as net interest income and net fee income increased slightly, costs remained flat and loan-loss provisions decreased.
| Portugal. Underlying income statement | ||||||||||||||||||||
| EUR million and % change | ||||||||||||||||||||
| Q2'22 | / Q1'22 | H1'22 | / H1'21 | |||||||||||||||||
| Revenue | 281 | -16 | 613 | -14 | ||||||||||||||||
| Expenses | -125 | 0 | -251 | -13 | ||||||||||||||||
| Net operating income | 155 | -25 | 363 | -15 | ||||||||||||||||
| LLPs | -3 | -62 | -11 | -84 | ||||||||||||||||
| PBT | 112 | -48 | 327 | -2 | ||||||||||||||||
| Underlying attrib. profit | 77 | -48 | 225 | -2 | ||||||||||||||||
| Poland | Underlying attributable profit | ||||||
| EUR 207 mn | ||||||||
Commercial activity and business performance
In H1'22 we remained focused on providing the best customer and employee experience. To this end, we further simplified our products and internal processes through digitalization, while developing platforms to accelerate our progress towards our responsible banking commitments. We also implemented several initiatives to strongly support Ukrainians.
In retail banking, we maximized the number of self-service products and increased digital sales and customer acquisition through digital channels. Regarding the bancassurance business, of note was the integration of Allianz, renaming our joint venture Santander Allianz.
In corporates, we enhanced the iBiznes24 digital platform in the quarter by extending its capabilities with Trade Finance products. In the wholesale platform, we facilitated operations of up to PLN 5 million, including multi-currency functionalities and streamlined operations with leasing products.
As a result, loans and advances to customers rose 5% year-on-year. Gross loans and advances to customers, excluding reverse repos and the exchange rate impact, increased 8% on the back of corporates and institutions and CIB, where we maintained our leadership position, mainly in the green transition sphere.
Customer deposits were 2% higher. Excluding repos and the exchange rate impact, they were up 6% strongly driven by time deposits (+89%), which benefited from interest rates hikes in recent quarters. Customer funds excluding repos rose 1% in constant euros.
Results
In the first half of 2022, a near five-fold increase in underlying attributable profit to EUR 207 million. By line and in constant euros:
•Total income was 47% higher year-on-year driven by a strong net interest income performance, which virtually doubled year-on-year following higher interest rates and greater volumes.
•Operating costs were 8% up, impacted by inflationary pressures, but decreased 1% in real terms.
•Loan-loss provisions were affected by CHF mortgage-related charges (previously reported in other gains (losses) and provisions). Excluding this impact, LLPs remained flat. The NPL ratio stood at 3.45%.
The quarter-on-quarter comparison showed a similar performance, with revenue growth (+14%) driven by net interest income.
| Poland. Underlying income statement | ||||||||||||||||||||||||||
| EUR million and % change | ||||||||||||||||||||||||||
| / | Q1'22 | / | H1'21 | |||||||||||||||||||||||
| Q2'22 | % | excl. FX | H1'22 | % | excl. FX | |||||||||||||||||||||
| Revenue | 579 | +13 | +14 | 1,090 | +44 | +47 | ||||||||||||||||||||
| Expenses | -173 | +4 | +5 | -339 | +5 | +8 | ||||||||||||||||||||
| Net operating income | 406 | +18 | +19 | 751 | +71 | +75 | ||||||||||||||||||||
| LLPs | -138 | +117 | +118 | -202 | +78 | +82 | ||||||||||||||||||||
| PBT | 208 | -12 | -11 | 444 | +250 | +258 | ||||||||||||||||||||
| Underlying attrib. profit | 95 | -15 | -15 | 207 | +371 | +381 | ||||||||||||||||||||
January - June 2022 | | 29 | ||||||
Business model | ||||||||||||||||||||||||||
| Primary segments | ||||||||||||||||||||||||||
 | NORTH AMERICA | Underlying attributable profit | ||||||
| EUR 1,578 mn | ||||||||
Executive summary → In North America, we continue leveraging our own local individual strengths and capabilities in Mexico and the US while capitalizing on Group’s scale and connectivity. → In volumes, loans and advances to customers increased 7% in constant euros driven by growth in most segments in Mexico and in auto, Wealth Management and CIB in the US. Customer funds rose 3% in constant euros boosted by higher retail and corporate deposits in the US, and deposits and mutual funds in Mexico. → Underlying attributable profit remained broadly stable year-on-year in euros. In constant euros, profit was down 10% impacted by LLP normalization and lower lease income in the US, primarily due to an increase in the share of lease-end vehicles repurchased at dealerships. Strong profit increase in Mexico. | ||||||||
Strategy
In line with our strategy to deploy capital towards our businesses where we can grow profitably, during the first half of the year:
•After receiving Federal Reserve approval on 31 January 2022, SHUSA completed the acquisition of the remaining shares of common stock of Santander Consumer USA (SC USA).
•Santander US discontinued mortgage and home equity originations to focus efforts on products, services and digital capabilities that have greater potential for growth.
In terms of our regional strategy, synergies across countries leverage our joint initiatives, including:
•Further development and strengthening of the USMX trade corridor: SCIB and Commercial Banking continue to deepen relationships with existing customers, which was reflected in revenue growth, adding more than 180 new large clients to the Group in the last 4 years.
•Boost customer attraction and retention through loyalty strategies, while broadening our tailored products and services proposition for a more straightforward customer experience. We are taking advantage of successful proven businesses and improved interactions to drive customer loyalty, NPS and CX.
•Create synergies and reduce duplications in our business model, by leveraging our regional capabilities and sharing best practices to optimize expenses and improve profitability.
•Strengthen One Santander in North America, by unifying a common and regional approach by promoting a strong level of
collaboration between both countries and the Group, to forge future growth within the region.
•In line with our global responsible banking agenda and public commitments, we are focusing on expanding and implementing sustainable finance opportunities within our businesses. Our regional operations are carbon neutral and we continue to contribute on building a more inclusive society, with more than 670,000 financially empowered people in the region during H1'22.
In addition, in terms of their local priorities:
United States
Santander US has refocused its business model towards a simpler, more integrated structure around four segments that benefit from the Group’s connectivity or have a distinct competitive advantage: Consumer, Commercial, CIB and Wealth Management:
•After the acquisition of the remaining minority stake in SC USA, the amendment extension of the Stellantis agreement through 2025, the expansion of our partnership with AutoFi Inc., the new preferred finance partnership with Mitsubishi Motors North America (MMNA) and the increased ability to benefit from deposit funding, Santander US is well positioned to grow its Auto business profitably.
•Within our CIB business, Santander US closed its acquisition of APS, which will transform CIB’s asset structuring and distribution capabilities, enhancing our fixed income markets business and creating self-clearing capabilities.
| Loyal customers | | United States | Mexico | |||||||||||||||||||
| Thousands | 4,477 | 364 | 4,113 | ||||||||||||||||||||
| YoY change | +8% | -5% | +10% | ||||||||||||||||||||
| Digital customers | | United States | Mexico | |||||||||||||||||||
| Thousands | 6,959 | 1,031 | 5,762 | ||||||||||||||||||||
| YoY change | +9% | +1% | +12% | ||||||||||||||||||||
| 30 | | January - June 2022 | ||||||
Business model | ||||||||||||||||||||||||||
| Primary segments | ||||||||||||||||||||||||||
• Top 10 CRE and Multifamily lender, funded by commercial deposits and serving leading US developers and investors.
• Leading brand in Latin American High Net Worth leveraging connectivity with Group.
Santander US announced a multi-year programme to accelerate its new consumer banking digital transformation strategy, leveraging Santander’s global technology assets and expertise to expand our digital capabilities, increase efficiency and enhance the experience for customers across the United States.
During the quarter, Santander US resumed its capital distributions with a USD 1.5 billion dividend. In June, the Federal Reserve Board released the results of its Supervisory Stress Test. With minimum capital ratios ranked in the top quartile among participating banks, the results indicate that Santander US can remain well capitalized during times of severe market stress.
Mexico
We continue to focus on multi-channel innovation, promoting digital channels and strengthening our value proposition:
•We are strengthening synergies between lines of business, highlighting projects to increase profitability through attracting new payroll and portability, commercial alliances and customer referrals.
•We maintained the momentum of the LikeU credit card, our flagship product, reaching more than 635,000 cards issued since its launch 10 months ago. We continued to drive ongoing improvement in acceptance and security processes to provide a better experience for our customers and reduce fraud.
•Santander Personal is our digital and personalized channel for high-income customers, which has a module in Supermóvil through which customers receive investment advice and can take out products in an agile and secure way.
•We launched a tailored proposition, Hipoteca Integral, to serve the mixed-income population (fixed and variable), recognizing the total income of families, with the backing of the housing credit insurance of Sociedad Hipotecaria Federal. We also improved the conditions of our land acquisition offering, for high-potential and loyal customers.
•In auto, we increased financing of pre-owned vehicles, improving the mix (90% new cars and 10% pre-owned vs 97% and 3%, respectively, in 2020), to adapt to the current market situation and increase profitability.
Business performance. June 2022 | ||||||||||||||||||||||||||||||||||||||
| EUR billion and YoY % change in constant euros | ||||||||||||||||||||||||||||||||||||||
| 152 | +7% | | 151 | +3% | |||||||||||||||||||||||||||||||||
| ||
| ||
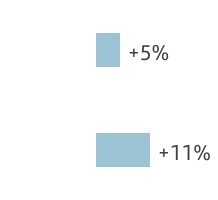
| ||
| ||
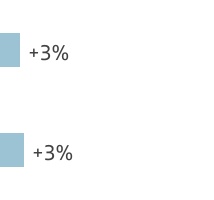
| Gross loans and advances to customers excl. reverse repos | Customer deposits excl. repos + mutual funds | |||||||||||||||||||||||||||||||||||||
In addition, we implemented cost of risk models by product line to improve the quality of the portfolio. In Plan Piso, we financed more than 120 dealers, mostly new customers.
•In SMEs, we made further progress with our customer attraction strategy through commercial agreements in strategic sectors and we continued to attract digital customers through our alliance with CONTPAQi. In the acquiring business, we continue to promote our main products (G-Mini, G-Advance, G-Smart and G-Store) by offering competitive rates and commissions.
Business performance
Loans and advances grew 30% year-on-year. In gross terms, excluding reverse repos and the exchange rate impact, they were up 7% boosted by growth in individuals and commercial loans in Mexico (except SMEs) and a positive performance in auto, CIB and WM in the US.
Customer deposits rose 34% year-on-year. Excluding repos and the exchange rate impact, customer deposits increased 4% mainly driven by positive dynamics in individual deposits in Mexico and the continued strong performance across most US businesses in a highly competitive market.
Results
During the first six months of 2022, underlying attributable profit amounted to EUR 1,578 million, broadly stable in euros year-on-year. In constant euros, profit dropped 10% (-8% excluding the Bluestem portfolio divestiture). By line:
•Total income reduced 3% (-1% ex. divestiture), mainly affected by other operating income (-55%) primarily due to an increase in the share of lease-end vehicles repurchased at dealerships in the US. Net interest income increased 3% (+4% like-for-like) and net fee income fell 1% (+4% like-for-like), dampened by lower fees from the US's SafetyNet programme, which offset the strong performance in insurance, credit cards and account management in Mexico.
•Costs rose 5% primarily due to higher-than-expected inflation. However, strict cost control remains in both countries to absorb this impact.
•Loan-loss provisions increased 49%, mainly from the cost of risk normalization in the US, countered by the decrease in Mexico due to the positive performance in cards, SME and CIB portfolios.
In the quarter, underlying attributable profit fell 10% in constant euros due to lower lease income and higher costs. Net interest income and net fee income showed signs of recovery.
| North America. Underlying income statement | ||||||||||||||||||||||||||
| EUR million and % change | ||||||||||||||||||||||||||
| / | Q1'22 | / | H1'21 | |||||||||||||||||||||||
| Q2'22 | % | excl. FX | H1'22 | % | excl. FX | |||||||||||||||||||||
| Revenue | 2,986 | +7 | +1 | 5,780 | +7 | -3 | ||||||||||||||||||||
| Expenses | -1,432 | +14 | +7 | -2,692 | +15 | +5 | ||||||||||||||||||||
| Net operating income | 1,554 | +1 | -5 | 3,088 | 0 | -9 | ||||||||||||||||||||
| LLPs | -524 | +19 | +13 | -962 | +64 | +49 | ||||||||||||||||||||
| PBT | 1,011 | -4 | -10 | 2,061 | -17 | -25 | ||||||||||||||||||||
| Underlying attrib. profit | 772 | -4 | -10 | 1,578 | 0 | -10 | ||||||||||||||||||||
January - June 2022 | | 31 | ||||||
Business model | ||||||||||||||||||||||||||
| Primary segments | ||||||||||||||||||||||||||
| United States | Underlying attributable profit | ||||||
| EUR 1,090 mn | ||||||||
Commercial activity and business performance
Following record profits during H1'21, Santander US again exhibited a strong performance in H1'22, supported by the progress of our strategic initiatives. The foundational work conducted over recent years, the resilience and higher integration of our core business lines together with the strength of our balance sheet allows Santander US to perform in line with its financial goals despite more challenging market conditions.
The stock of loans and advances to customers grew 33% year-on-year. In gross terms, excluding reverse repos and the exchange rate impact, loans grew 5% led by growth in CIB, Consumer Auto and Wealth Management. Auto originations decreased 17% as stronger volumes in Core Non-Prime were offset by lower originations in Prime and Lease. Used car prices remain near all-time highs as new vehicle production continues to be impacted by global supply chain issues.
Customer deposits grew 43% year-on-year. After strong growth throughout 2021, customer deposits increased 5% excluding repos and the exchange rate impact, while maintaining deposit costs relatively stable despite the significantly higher rate environment.
Results
Underlying attributable profit in the first half of 2022 was EUR 1,090 million, 13% lower in euros year-on-year. When measured in constant euros, profit was down 21% (19% lower adjusted for the Bluestem portfolio divestiture). By line:
•Total income decreased 10% (-7% ex-divestiture). Despite rate benefits and strong deposit pricing behaviour, net interest income fell due to the Bluestem portfolio sale (+2% excluding this impact) and auto loan pricing competition pressure. Net fee income also declined, driven by the Bluestem portfolio sale, lower capital markets fees and initiatives to lower consumer fees (SafetyNet). Other income was affected by reduced leasing income.
•Operating expenses were stable despite the inflationary pricing pressure on personnel costs. In real terms, costs decreased 8%.
•On the back of exceptionally low figures in H1'21, cost of risk remained at historically low levels, although loan-loss provisions increased 245% as we evaluate the impact of more adverse macroeconomic outlook on our customers.
Despite NII growth (+3%), underlying attributable profit was 18% lower quarter-on-quarter in constant euros, due to lower lease income, decreased capital markets activity and greater costs due to APS, while credit continues to perform well.
| United States. Underlying income statement | ||||||||||||||||||||||||||
| EUR million and % change | ||||||||||||||||||||||||||
| / | Q1'22 | / | H1'21 | |||||||||||||||||||||||
| Q2'22 | % | excl. FX | H1'22 | % | excl. FX | |||||||||||||||||||||
| Revenue | 1,854 | +2 | -3 | 3,665 | -1 | -10 | ||||||||||||||||||||
| Expenses | -883 | +11 | +5 | -1,682 | +10 | 0 | ||||||||||||||||||||
| Net operating income | 970 | -4 | -9 | 1,984 | -8 | -16 | ||||||||||||||||||||
| LLPs | -338 | +32 | +26 | -594 | +280 | +245 | ||||||||||||||||||||
| PBT | 640 | -13 | -18 | 1,378 | -31 | -37 | ||||||||||||||||||||
| Underlying attrib. profit | 507 | -13 | -18 | 1,090 | -13 | -21 | ||||||||||||||||||||
| Mexico | Underlying attributable profit | ||||||
| EUR 546 mn | ||||||||
Commercial activity and business performance
In Mexico, we have gained market share in individual loans for 26 months running, and in total loans for six straight months. The positive performance in individual loans was driven by the mortgage and auto strategies that continued to bear fruit.
We are one of the largest mortgage originators in the country, with an innovative product range and an offering for each customer profile, such as Hipoteca Plus, Hipoteca Free and Hipoteca Integral. In auto, we further consolidated our position, becoming the third largest player in the market with a 14% market share. In addition, consumer credit showed a significant recovery in recent months.
The stock of loans and advances to customers grew 20% year-on-year. In gross terms, excluding reverse repos and the exchange rate impact, it was up 11%, supported by individual loans (mortgages: +12%, consumer: +12% and cards: +15%) and corporate loans (+16% in CIB and +8% in companies and institutions, which offset the 3% decline in SMEs).
Customer deposits grew 15% year-on-year. Excluding reverse repos and the exchange rate impact, customer deposits increased 2% boosted by time deposits and mutual funds were 6% higher.
Results
Underlying attributable profit in the first half of 2022 of EUR 546 million, 45% higher in euros year-on-year. In constant euros, growth of 32%. By line:
•Total income rose 10%. Net interest income increased 9% supported by higher volumes and the rise in interest rates. Positive net fee income performance (+16%) mainly from credit cards, insurance and account management. Gains on financial transactions dropped due to gains on ALCO portfolio sales recorded in 2021 and a weak first half of the year in markets.
•Operating expenses increased 13%, affected by investments in digitalization and insourcing of employees.
•Loan-loss provisions dropped 23% due to the positive portfolio performance.
Compared to the previous quarter, underlying attributable profit increased 11% in constant euros driven by the upturn in net interest income (+5%), higher net fee income (+7%) and lower provisions (-7%).
| Mexico. Underlying income statement | ||||||||||||||||||||||||||
| EUR million and % change | ||||||||||||||||||||||||||
| / | Q1'22 | / | H1'21 | |||||||||||||||||||||||
| Q2'22 | % | excl. FX | H1'22 | % | excl. FX | |||||||||||||||||||||
| Revenue | 1,115 | +14 | +6 | 2,096 | +21 | +10 | ||||||||||||||||||||
| Expenses | -498 | +15 | +7 | -930 | +24 | +13 | ||||||||||||||||||||
| Net operating income | 617 | +12 | +4 | 1,166 | +19 | +9 | ||||||||||||||||||||
| LLPs | -184 | +1 | -7 | -367 | -15 | -23 | ||||||||||||||||||||
| PBT | 407 | +20 | +11 | 747 | +40 | +27 | ||||||||||||||||||||
| Underlying attrib. profit | 297 | +19 | +11 | 546 | +45 | +32 | ||||||||||||||||||||
| 32 | | January - June 2022 | ||||||
Business model | ||||||||||||||||||||||||||
| Primary segments | ||||||||||||||||||||||||||
 | SOUTH AMERICA | Underlying attributable profit | ||||||
| EUR 1,946 mn | ||||||||
Executive summary → We continued with our strategy to strengthen connectivity and share best practices across countries, capturing new business opportunities. → We remain focused on delivering profitable growth, increasing loyalty and customer attraction, as well as controlling risks and costs through the strength of our model. → Quarter-on-quarter and year-on-year growth in both gross loans and advances to customers and customer deposits, while we continue to expand ESG initiatives in the region. → Underlying attributable profit increased 19% year-on-year (+7% in constant euros) backed by positive revenue performance and a lower tax burden. | ||||||||
Strategy
South America continued to be a region with great growth potential and opportunities for banking penetration and progress in financial inclusion. In this environment, we remained focused on growing the number of customers and enhancing digitalization, consolidating new technologies and innovative solutions.
We maintained our strategy of capturing synergies across business units:
•In consumer finance, we remained focused on exchanging positive experiences across countries such as the management platform for new and used vehicle financing and the consolidation of Cockpit in Chile, Argentina and Peru. Santander Chile, through Santander Consumer Finance, recorded a positive performance both in loans and results. In Uruguay, auto financing increased 38% year-on-year and in Perú, the financial entity specialized in auto loans continued to expand, reaching a 31.7% market share in new lending in June.
•In payment methods, we remained focused on e-commerce strategies and on the business of instant domestic and international transfers. Getnet, a successful model developed in Brazil, is delivering very positive results in other countries: in Chile, Getnet has more than 111,000 PoS terminals and in Argentina we remained the second largest company in payments processing. In Uruguay, we launched the digital onboarding for current accounts and credit cards.
•We continued to make headway in the development of joint initiatives between SCIB and corporates to deepen relationships with multinational clients, boosting loyalty and customer acquisition in all countries, especially in Chile and Argentina.
•We continued to promote inclusive and sustainable businesses, such as Prospera, our micro-credit programme, which was launched in Chile in the first quarter and continues to be implemented in Brazil (776,000 active customers), Uruguay (10,000 entrepreneurs), Colombia (present in 332 municipalities) and Peru (45,000 customers). In addition, we further developed our ESG initiatives. In Chile, we introduced the Eco card, a new range of sustainable cards made with recycled PVC, and, in Brazil, we began to replace plastic cards with environmentally friendly models. In Argentina, we made headway in new partnerships to promote sustainable activities.
The main initiatives by country were:
•Brazil: we continued to grow our customer base and increase loyalty. Our aim is to become the best consumer company in the country, build the best platform for corporates and consolidate our position in investments. In addition, we remained the only global bank in the wholesale segment with leadership in FX, Infrastructure, Equities, Agribusiness and Cash Management.
| Loyal customers | | Brazil | Chile | Argentina | Other South America | |||||||||||||||||||||||||||||
| Thousands | 11,147 | 8,534 | 816 | 1,632 | 166 | ||||||||||||||||||||||||||||||
| YoY change | +16% | +19% | +5% | +4% | +16% | ||||||||||||||||||||||||||||||
| Digital customers | | Brazil | Chile | Argentina | Other South America | |||||||||||||||||||||||||||||
| Thousands | 25,269 | 19,847 | 1,963 | 2,850 | 609 | ||||||||||||||||||||||||||||||
| YoY change | +11% | +14% | +5% | +5% | -4% | ||||||||||||||||||||||||||||||
January - June 2022 | | 33 | ||||||
Business model | ||||||||||||||||||||||||||
| Primary segments | ||||||||||||||||||||||||||
To this end, we continue to boost our multi-channel strategy: in physical channels, where we serve over 15 million visits per month, of note was our Bank to Go model, which streamlines and tailors customer service. Regarding digital channels, we reached 537 million accesses per month and almost 4 million contracts monthly. In the remote channels, sales increased substantially and in the external channels, focused on geographic expansion, we produced BRL 1.3 billion per month in contracts.
•Chile: we remained focused on digital banking and enhancing customer service. We continued to promote Santander Life and Superdigital, which already have one million and 334,000 customers, respectively. Positive performance in Santander Consumer Finance, which accounted for 45% of new lending. In ESG, in order to boost banking and help micro-entrepreneurs with their business performance, we launched a current account integrated with Getnet and the Cuenta Life for SMEs.
•Argentina: we remained focused on optimizing and improving customer service, developing our open financial services platform, strengthening Getnet's value proposition, which exceeded 85,000 PoS, and MODO, a systemic solution that promotes digital payments and financial inclusion. In addition, we boosted consumer and auto lending and signed new commercial alliances in the quarter.
•Uruguay: we remained the country's leading privately-owned bank. Our offering and alliances with dealers enabled us to become the market leader in auto finance, with a 30% market share. Soy Santander, a fully-digital loyalty proposition for individuals, increased transactions by 15% year-on-year. In ESG, the carbon neutral credit for vehicle purchases reached 3,260 customers.
•Peru: our strategy focuses on supporting global companies and the corporate segment, boosting growth through joint initiatives between SCIB and corporates, combining tailored and value-added products. We made progress in digitalization, through our Office Banking and Nexus platforms, digital onboarding of customers and the use of data intelligence for internal controls. This was reflected in the significant increase in the number of customers and loyalty.
| South America. Business performance | ||||||||||||||||||||||||||||||||||||||
| June 2022. EUR billion and YoY % change in constant euros | ||||||||||||||||||||||||||||||||||||||
| 148 | +12% | | 182 | +5% | |||||||||||||||||||||||||||||||||
| ||
| ||
| ||
 | ||
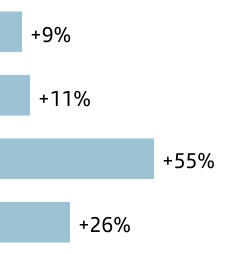
| ||
| ||
| ||
| ||
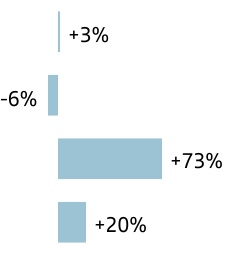
| Gross loans and advances to customers excl. reverse repos | Customer deposits excl. repos + mutual funds | |||||||||||||||||||||||||||||||||||||
•Colombia: we continue to offer sustainable and inclusive financial solutions. In SCIB, we continued to participate in important operations for the country's development and launched joint initiatives with Corporate. Regarding consumer finance, we continued to consolidate our position in the new and used vehicle markets, with a 66% increase in our portfolio year-on-year. In ESG, we continued to promote Prospera and increased the number of credit lines granted to entrepreneurs, 30% of which went to the agricultural segment and 54% to female entrepreneurs.
Business performance
Loans and advances to customers rose 13% year-on-year. Gross loans and advances to customers (excluding reverse repos and exchange rates) increased 12% year-on-year, with rises in all country units.
Customer deposits were 8% higher year-on-year. Excluding the exchange rate impact and reverse repos, customer deposits rose 5%, with increases in all units except Chile and Peru. Mutual funds were 4% higher excluding the exchange rate impact.
Results
Underlying attributable profit in the first six months of 2022 amounted to EUR 1,946 million, up 19% year-on-year. Excluding the exchange rate impact, it was 7% higher, as follows:
•In total income, of note was the performance in net interest income and net fee income (+9% and +10%, respectively) and the 48% rise in gains on financial transactions (Brazil, Chile and Argentina).
•Costs were 16% higher, heavily affected by inflation. In real terms, they decreased 1%, reflecting management efforts.
•Loan-loss provisions increased 38% mainly due to the rises recorded in the main countries. The cost of risk stood at 2.97%.
By country, of note was the strong profit growth recorded in all markets except Brazil, where it was slightly lower as the positive performance in revenue could not offset higher costs and provisions.
Compared to the first quarter of 2022, underlying attributable profit was up 8% in constant euros, benefitting from the increase in the main revenue lines and a lower tax burden.
| South America. Underlying income statement | ||||||||||||||||||||||||||
| EUR million and % change | ||||||||||||||||||||||||||
| / | Q1'22 | / | H1'21 | |||||||||||||||||||||||
| Q2'22 | % | excl. FX | H1'22 | % | excl. FX | |||||||||||||||||||||
| Revenue | 4,738 | +13 | +5 | 8,933 | +22 | +10 | ||||||||||||||||||||
| Expenses | -1,669 | +12 | +6 | -3,153 | +25 | +16 | ||||||||||||||||||||
| Net operating income | 3,069 | +13 | +4 | 5,780 | +21 | +7 | ||||||||||||||||||||
| LLPs | -1,335 | +34 | +23 | -2,333 | +56 | +38 | ||||||||||||||||||||
| PBT | 1,604 | +3 | -5 | 3,165 | +2 | -9 | ||||||||||||||||||||
| Underlying attrib. profit | 1,046 | +16 | +8 | 1,946 | +19 | +7 | ||||||||||||||||||||
| 34 | | January - June 2022 | ||||||
Business model | ||||||||||||||||||||||||||
| Primary segments | ||||||||||||||||||||||||||
| Brazil | Underlying attributable profit | ||||||
| EUR 1,365 mn | ||||||||
Commercial activity and business performance
In Brazil, we remained focused on customer experience and satisfaction throughout the cycle, with simple and tailored solutions for each profile. As a result, we continued to expand commercial activity. In cards, turnover grew 17% year-on-year. In home equity, we are the leading private company with a 20% market share. In agribusiness, the portfolio increased 33% year-on-year. In auto, we remained the leader in individuals with a 23% market share. Additionally, we launched Green Building, which offers business financing for environmentally certified constructions.
In ESG, we continue to promote social and financial inclusion: Prospera Microfinance reached a portfolio of BRL 2.2 billion and we committed to use 100% renewable energy in our facilities by 2025.
As a result, we were named one of the Best Consumer Companies in the country by Consumidor Moderno magazine and as the Best of ESG 2022 in the financial services category by Exame magazine.
Loans and advances to customers rose 16% year-on-year. Gross loans and advances to customers excluding reverse repos and the exchange rate impact, grew 9% driven by the double-digit increase in individuals and SMEs, broadly absorbing a weaker performance in corporates and CIB.
Customer deposits surged 13%. Excluding the exchange rate impact and repos, they rose 4% year-on-year drien by time deposits (+7%), more than offsetting the fall in demand deposits (-3%).
Results
In the first half of 2022, underlying attributable profit amounted to EUR 1,365 million, +16% year-on-year. Excluding the exchange rate impact, profit dropped 1%, as follows:
•Total income rose 5% due to higher customer revenue (+2% due to higher average volumes and management of spreads, partially offset by initial negative sensitivity to interest rate increases) and higher gains on financial transactions.
•Costs rose 11%, strongly impacted by inflation, and were reflected in higher personnel expenses (salary increase approved in September 2021) and administrative costs. However, in real terms, costs remained flat and the efficiency ratio around 30%, one of the best globally.
•Net loan-loss provisions increased 41% due to the change of mix, with a greater weight of loans to individuals, which grew at double digit rates. The cost of risk was 4.26% (+74 bps compared to June 2021) and the NPL ratio was 6.34%.
Compared to the first quarter, profit was 6% higher in constant euros, driven by gains on financial transactions, fee income and a lower tax burden.
| Brazil. Underlying income statement | ||||||||||||||||||||||||||
| EUR million and % change | ||||||||||||||||||||||||||
| / | Q1'22 | / | H1'21 | |||||||||||||||||||||||
| Q2'22 | % | excl. FX | H1'22 | % | excl. FX | |||||||||||||||||||||
| Revenue | 3,374 | +12 | 0 | 6,393 | +23 | +5 | ||||||||||||||||||||
| Expenses | -1,022 | +10 | -2 | -1,951 | +30 | +11 | ||||||||||||||||||||
| Net operating income | 2,352 | +13 | +1 | 4,442 | +20 | +2 | ||||||||||||||||||||
| LLPs | -1,163 | +37 | +24 | -2,015 | +65 | +41 | ||||||||||||||||||||
| PBT | 1,146 | +2 | -9 | 2,270 | -3 | -18 | ||||||||||||||||||||
| Underlying attrib. profit | 737 | +18 | +6 | 1,365 | +16 | -1 | ||||||||||||||||||||
| Chile | Underlying attributable profit | ||||||
| EUR 391 mn | ||||||||
Commercial activity and business performance
We remained focused on improving customer satisfaction through the transformation of our commercial network and our digital banking proposition, expanding Santander Life and Superdigital. Getnet is firmly established in the country and has installed 111,000 PoS terminals, with a 20% market share.
At the beginning of the year, we launched the Santander Life SME account and Prospera, transactional products integrated with Getnet, which are aimed at boosting banking penetration and helping micro-entrepreneurs to improve their businesses. As a result, we exceeded 4 million customers in the country and remained first in service quality in terms of NPS.
In volumes, loans and advances to customers decreased 2% year-on-year. Gross loans and advances to customers excluding reverse repurchase agreements and at constant exchange rates, were 11% higher, mainly driven by individuals (+11% boosted by the impact that charges in the UF had on mortgages and growth in cards), corporates and institutions (+12%) and CIB (+61%).
Customer deposits dropped 16%. Excluding the exchange rate impact and repurchase agreements, customer deposits decreased 7% as customers are normalizing their liquidity levels, following strong growth in 2021, due to the withdrawal of pension funds and state aids during the pandemic.
Results
Underlying attributable profit in the first half of 2022 amounted to EUR 391 million, 22% higher year-on-year. In constant euros, profit grew 27%, as follows:
•Total income rose 13% driven by the increase in net interest income (positive impact from the UF portfolio and greater volumes), the double-digit rise in net fee income (greater customer base and transactionality) and gains on financial transactions (+48% driven by business with customers).
•Costs rose 6%, below inflation (8%), which enabled net operating income to increase 17% and the efficiency ratio to improve to 36.0% (-2.4 pp year-on-year).
•Loan-loss provisions were 17% higher, the NPL ratio remained virtually stable and the cost of risk fell to 0.89%. NPL indicators remain better than pre-pandemic levels, although they are expected to normalize.
In the second quarter, profit rose 8% in constant euros boosted by the growth in net interest income, following the rise in inflation, and a lower tax burden.
| Chile. Underlying income statement | ||||||||||||||||||||||||||
| EUR million and % change | ||||||||||||||||||||||||||
| / | Q1'22 | / | H1'21 | |||||||||||||||||||||||
| Q2'22 | % | excl. FX | H1'22 | % | excl. FX | |||||||||||||||||||||
| Revenue | 707 | +9 | +8 | 1,357 | +8 | +13 | ||||||||||||||||||||
| Expenses | -255 | +9 | +8 | -489 | +2 | +6 | ||||||||||||||||||||
| Net operating income | 452 | +9 | +8 | 868 | +13 | +17 | ||||||||||||||||||||
| LLPs | -110 | +16 | +16 | -205 | +13 | +17 | ||||||||||||||||||||
| PBT | 323 | 0 | -1 | 646 | +9 | +14 | ||||||||||||||||||||
| Underlying attrib. profit | 204 | +9 | +8 | 391 | +22 | +27 | ||||||||||||||||||||
January - June 2022 | | 35 | ||||||
Business model | ||||||||||||||||||||||||||
| Primary segments | ||||||||||||||||||||||||||
| Argentina | Underlying attributable profit | ||||||
| EUR 145 mn | ||||||||
Commercial activity and business performance
Santander Argentina remained centred on improving customer service through innovation and process digitalization. The number of loyal customers increased and our app was the best rated among banking app. We continue to build our open financial services platform, strengthening the value proposition of Getnet, Santander Consumer, Superdigital and MODO.
In addition, we signed new alliances in the quarter, for example with Gentos, to boost the livestock business through a sustainable approach; the commercial alliance with Acindar Pymes, which will provide better access to financing for initiatives related to renewable energy; and the SuperClub+ programme, which provides benefits for Aerolíneas Argentinas' tourism products.
Loans and advances to customers were up 37% year-on-year. In gross terms, excluding reverse repos and the exchange rate impact, loans and advances to customers rose 55% year-on-year, driven by auto loans, SMEs and corporates.
Customer deposits increased 45% with respect June 2021. Excluding repos and the exchange rate impact, customer deposits rose 67% with growth in demand (+65%) and time (+71%) deposits, and mutual funds were 94% higher. As a result, customer funds increased 73% in constant euros.
These high growth rates, as in the case of results, are impacted by high inflation in the country.
Results
Underlying attributable profit in the first half of 2022 was EUR 145 million, 37% higher compared to the first half of 2021. At constant exchange rates, profit was 58% higher. By line:
•Total income grew 69%, underpinned by net interest income (+93%), net fee income (+88%, mainly driven by transactional fees and mutual funds) and gains on financial transactions (+102%). This performance clearly outstripped inflation.
•Costs rose 57%, in line with inflation and at a much slower pace than revenue. This drove a 4.2 pp improvement in the efficiency ratio, which improved to 58.0% and net operating income rose 88%.
•Loan-loss provisions increased due to extraordinarily low levels in the first six months of 2021 (following large pandemic-related provisioning in 2020). The cost of risk stood at 3.07%, lower than in June 21 and in line with December 2021.
In the second quarter, profit surged 60% in constant euros, mainly due to customer revenue.
| Argentina. Underlying income statement | ||||||||||||||||||||||||||
| EUR million and % change | ||||||||||||||||||||||||||
| / | Q1'22 | / | H1'21 | |||||||||||||||||||||||
| Q2'22 | % | excl. FX | H1'22 | % | excl. FX | |||||||||||||||||||||
| Revenue | 458 | +26 | +40 | 821 | +46 | +69 | ||||||||||||||||||||
| Expenses | -260 | +20 | +34 | -477 | +36 | +57 | ||||||||||||||||||||
| Net operating income | 198 | +34 | +49 | 345 | +63 | +88 | ||||||||||||||||||||
| LLPs | -33 | -15 | -4 | -72 | +48 | +71 | ||||||||||||||||||||
| PBT | 97 | +38 | +52 | 168 | +72 | +98 | ||||||||||||||||||||
| Underlying attrib. profit | 86 | +45 | +60 | 145 | +37 | +58 | ||||||||||||||||||||
| Other South America |  |  |  | ||||||||
Uruguay
Gross loans and advances to customers, excluding reverse repurchase agreements and the exchange rate impact were up 14% year-on-year. Customer deposits excluding repos and exchange rates rose 2%, spurred by time deposits (+31%).
Underlying attributable profit in the first six months of EUR 60 million, up 18% year-on-year and +3% in constant euros, as follows:
•Total income up 8% boosted by net interest income following interest rate hikes and higher inflation and gains on financial transactions.
•Costs remained virtually flat (+0.5%). As a result, the efficiency ratio stood at 45.0% (-3.1 pp year-on-year).
•Loan-loss provisions rose, normalizing following the low levels recorded in 2021. The cost of risk remained low (1.34%) and the NPL ratio fell to 2.72%.
Compared to the previous quarter, underlying attributable profit declined 5% in constant euros due to LLP normalization, partly mitigated by higher gains on financial transactions and lower costs.
Peru
Gross loans and advances to customers excluding reverse repos and the exchange rate impact rose 22% year-on-year and customer deposits (excluding repos and at constant exchange rates) were 2% lower dampened by time deposits (-5%), as demand deposits were 5% higher.
In the first half of 2022, underlying attributable profit amounted to EUR 33 million, 29% higher year-on-year. Excluding the exchange rate impact, growth was 18%, as follows:
•Total income rose 14%, mainly led by net interest income (+33%). Costs rose 49%, mainly driven by inflation and the launch of new businesses.
•Loan-loss provisions dropped 44% and the cost of risk remained very low (0.31%).
Colombia
Gross loans and advances to customers (excluding reverse repos and the exchange rate impact) were 61% higher year-on-year. Customer deposits (excluding repos and exchange rates) rose 57% due to demand deposits (+125%).
In the first half of 2022, underlying attributable profit of EUR 13 million, 11% higher year-on-year. At constant exchange rates, profit was 9% higher, due to:
•Total income growth of 29% (driven by net interest income and gains on financial transactions) and a 60% rise in costs.
•Loan-loss provisions dropped 37% and the cost of risk improved 50 bps year-on-year to 0.22%.
| Other South America. Underlying income statement | ||||||||||||||||||||||||||
| EUR million and % change | ||||||||||||||||||||||||||
| Net operating income | Underlying attrib. profit | |||||||||||||||||||||||||
| / | H1'21 | / | H1'21 | |||||||||||||||||||||||
| H1'22 | % | excl. FX | H1'22 | % | excl. FX | |||||||||||||||||||||
| Uruguay | 110 | +31 | +14 | 60 | +18 | +3 | ||||||||||||||||||||
| Peru | 56 | +8 | -1 | 33 | +29 | +18 | ||||||||||||||||||||
| Colombia | 25 | +5 | +3 | 13 | +11 | +9 | ||||||||||||||||||||
| 36 | | January - June 2022 | ||||||
Business model | ||||||||||||||||||||||||||
| Primary segments | ||||||||||||||||||||||||||
| DCB | DIGITAL CONSUMER BANK | Underlying attributable profit | ||||||
| EUR 572 mn | ||||||||
Executive summary → Continuing to reinforce auto leadership via new strategic alliances, leasing and subscription. In H1, we signed the binding agreement with Stellantis, continued BNPL deployment and new leasing contracts showed double-digit growth. → New lending +10% year-on-year in constant euros. In auto, global production issues dampened the new auto market. In this context, we gained market share in new and used cars in most markets. Strong year-on-year increase in consumer new lending. → Underlying attributable profit amounted to EUR 572 million, improving 18% year-on-year in euros. In constant euros, +16% due to net fee income (+7% year-on-year) and cost of risk improvement. RoRWA remained high, c.2%. | ||||||||
Strategy
Digital Consumer Bank (DCB) is the leading consumer finance bank in Europe, created through the combination of Santander Consumer Finance's (SCF) scale and leadership in consumer finance in Europe, and Openbank’s retail banking and digital capabilities.
SCF is Europe's consumer finance leader, present in 18 countries (16 in Europe including the recent launch in Greece, China and Canada) and works through more than 130,000 associated points of sale (mainly auto dealers and retail merchants). In addition, it is developing pan-European initiatives to boost Direct business across its footprint.
Openbank is the largest 100% digital bank in Europe. It offers current accounts, cards, loans, mortgages, a state-of-the-art robo-advisor service and open platform brokerage services. Openbank is currently active in Spain, the Netherlands, Germany and Portugal, and we are working on its expansion across Europe and the Americas.
DCB's aim is to generate synergies for both businesses:
•SCF is dedicated to helping our customers and partners (OEMs, car dealers and retailers) to enhance their sales capacity by financing their products and developing advanced technologies to give them a competitive edge. SCF is the top mobility financer and provider in Europe.
| Digital Consumer Bank. Loan distribution | |||||
| June 2022 | |||||
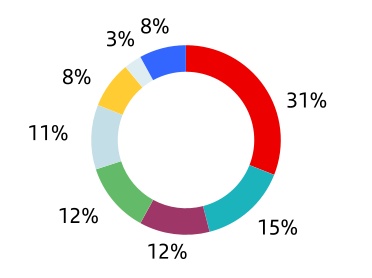
| Germany | ||||||||
| Nordics | ||||||||
| France | ||||||||
| Spain | ||||||||
| The UK | ||||||||
| Italy | ||||||||
| Poland | ||||||||
| Others | ||||||||
•Openbank will continue to focus on customer loyalty and engagement targets by applying Openbank's IT and business philosophy, while ensuring an unbeatable time to market.
Our main priorities for 2022 are to:
•Secure leadership in global digital consumer lending focusing on growth and transformation within three dimensions:
–Auto: strengthen our auto financing leadership position, gain market share, reinforce the leasing business and develop subscription services. SCF is focusing on providing its partners advanced digital financing capabilities to support their sales growth strategy and the best customer experience. We had a EUR 93 billion loan book at the end of June.
–Consumer Non-Auto: gain market share in consumer lending and develop buy now, pay later (BNPL) 2.0 to strengthen our top 3 position in Europe. We had a loan book of EUR 20 billion as of 30 June. In Retail, the aim is to continue improving digital capabilities to increase loyalty among our 3.8 million customers (Openbank and SC Germany Retail), boosting digital banking activity.
–Simplification and efficiency from self-contained banks to European hubs (Western Hub, Nordics, Germany) through: legal structure simplification, shared services and IT commonality, and capital and liquidity optimization.
•Increase profit leveraging strategic operations initiated in 2021, e.g. Stellantis (Auto), leasing and subscription launch and BNPL development (Non-Auto).
•Launch of tech transformation projects to seize on the fast-growing transition to online, support digital customer base expansion and provide our partners with digital tools to achieve a single European digital connection (via auto marketplaces). All this while maintaining high profitability and one of the best efficiency ratios in the sector.
January - June 2022 | | 37 | ||||||
Business model | ||||||||||||||||||||||||||
| Primary segments | ||||||||||||||||||||||||||
To contribute to the transition to a greener economy, we continue to develop new business solutions and partnerships. In 2021, we financed >140,000 fully-electric vehicles and >23,000 solar panels. In H1'22, in the context of a shrinking new car market, we financed 71,000 fully-electric vehicles (+72% year-on-year) and solar panel financing grew 69% year-on-year. Electric chargers and green heating systems financing is also booming.
We are actively partnering several European, American, Japanese and Chinese OEMs with strong electric product portfolios to develop joint solutions within our footprint to capture growth in a market that is evolving towards reduced emissions.
Business performance
New lending increased 10% year-on-year in H1'22, despite impacts from the covid-19 Omicron wave, the microchip crisis and global supply chain disruptions from the Russia-Ukraine conflict.
In this environment, we further increased market share in new and used cars and most countries. New car registrations in Europe fell 14% in H1 while our new car volumes were up 2%. Regarding used vehicles, new lending rose 19% compared to a 10% fall in the European market.
In Auto, "tactical" leasing solutions, together with a commercial focus, generated a 16% increase in new contracts year-on-year. We also started to develop our proprietary digital leasing platform for Europe (gradual rollout expected to start before year end) with the ambition of disrupting the market.
SCF's new subscription service Wabi is live in Spain, Norway and Germany and will expand to other countries in the coming years. In June, SCF launched Ulity, its new, white-label platform for developing vehicle subscription-based solutions for companies.
In H1, we expanded our partnership with Stellantis in a transaction expected to complete in H1'23 (following the required authorizations). We also entered into a long-term global partnership with Piaggio Group, Europe's leader in scooters.
In Non-Auto, Zinia, our new buy now, pay later initiative is already achieving outstanding results in Germany, with more than 3 million contracts since its launch and more than 33 thousand merchants connected. The focus for 2022 is the full roll out of the new tech stack and to the Netherlands and Spain.
| Activity | ||||||||||||||||||||||||||||||||
| June 2022. EUR billion and % change in constant euros | ||||||||||||||||||||||||||||||||
| +3% | ||||||||||||||||||||||||||||||||
| QoQ | +2% | |||||||||||||||||||||||||||||||
| QoQ | ||||||||||||||||||||||||||||||||
| 119 | ||||||||||||||||||||||||||||||||
| +4% | 60 | +7% | ||||||||||||||||||||||||||||||
| YoY | YoY | |||||||||||||||||||||||||||||||
| Gross loans and advances to customers excl. reverse repos | Customer deposits excl. repos + mutual funds | |||||||||||||||||||||||||||||||
The TIMFin joint venture in 2021 represented a strategic alliance with the leading Italian Telco, a new vertical for DCB. The company has >1 million contracts since launch as well as >5,700 active points of sale.
The stock of loans and advances to customers increased 4% year-on-year. In gross terms, excluding reverse repos and the exchange rate impact, it also increased 4% to EUR 119 billion.
These good results have been achieved in an unstable environment where higher fuel prices and inflation are generating uncertainty and reducing our customers' disposable income. We will keep a prudent market approach and remain vigilant so to react quickly to any specific event affecting our activity.
Results
Underlying attributable profit in the first half was EUR 572 million, 18% higher in euros year-on-year (RoRWA c.2%). In constant euros growth of 16% year-on-year, by line:
•Total income rose 3% mainly driven by growth in net fee income (+7%) due to increased volumes and leasing activity. Net interest income increased 1%.
•Costs grew 2% affected by inflation, strategic investments to boost future income and lower running costs, and perimeter effects (Allane, TIMFin and Greece). In real terms, costs fell 3%. The efficiency ratio stood at 48.5% (34 bp improvement on H1'21).
•Loan-loss provisions fell 7% driven by the maintained good credit quality performance. Cost of risk fell a further 20 bps to 0.44%.
•By country, the largest contribution to underlying attributable profit came from Germany (EUR 183 million), the UK (EUR 126 million), the Nordic countries (EUR 126 million), France (EUR 87 million) and Spain (EUR 76 million).
Compared to the previous quarter, underlying attributable profit increased 3% despite the SRF charge in the quarter (+18% excluding it) due to strength in net fee income, lower costs and decreases in provisions (even with a EUR 23 million CHF mortgage-related charge).
| Digital Consumer Bank. Underlying income statement | ||||||||||||||||||||||||||
| EUR million and % change | ||||||||||||||||||||||||||
| / | Q1'22 | / | H1'21 | |||||||||||||||||||||||
| Q2'22 | % | excl. FX | H1'22 | % | excl. FX | |||||||||||||||||||||
| Revenue | 1,261 | -4 | -4 | 2,573 | +3 | +3 | ||||||||||||||||||||
| Expenses | -603 | -6 | -6 | -1,248 | +3 | +2 | ||||||||||||||||||||
| Net operating income | 658 | -1 | -1 | 1,325 | +4 | +3 | ||||||||||||||||||||
| LLPs | -139 | -6 | -6 | -287 | -7 | -7 | ||||||||||||||||||||
| PBT | 508 | +1 | +2 | 1,010 | +14 | +13 | ||||||||||||||||||||
| Underlying attrib. profit | 290 | +3 | +3 | 572 | +18 | +16 | ||||||||||||||||||||
| 38 | | January - June 2022 | ||||||
Business model | ||||||||||||||||||||||||||
| Primary segments | ||||||||||||||||||||||||||
 | Corporate Centre | Underlying attributable profit | ||||||
| -EUR 1,040 mn | ||||||||
Executive summary → In the current environment, the Corporate Centre continued with its role supporting the Group. → The Corporate Centre’s objective is to monitor the Group's strategy and aid the operating units by contributing value and carrying out the corporate function of oversight and control. It also carries out functions related to financial and capital management. → Underlying attributable loss increased 28% compared to the first half of 2021, mainly due to the fall in gains on financial transactions due to exchange rate differences from the hedging of results and costs from the higher liquidity buffer, partially offset by lower provision charges. | ||||||||
Strategy and functions
The Corporate Centre contributes value to the Group in various ways:
•Making the Group’s governance more solid, through global control frameworks and supervision.
•Fostering the exchange of best practices in cost management, which enables us to be one of the most efficient banks in the sector.
•Contributing to the launch of projects that will be developed by our global businesses aimed at leveraging our worldwide presence to generate economies of scale.
It also coordinates the relationship with European regulators and supervisors and develops functions related to financial and capital management, as follows:
•Financial Management functions:
–Structural management of liquidity risk associated with funding the Group’s recurring activity and stakes of a financial nature.
–This activity is carried out by the different funding sources (issuances and other), always maintaining an adequate profile in volumes, maturities and costs. The price of these operations with other Group units is the market rate that includes all liquidity concepts (which the Group supports by immobilizing funds during the term of the operation) and regulatory requirements (TLAC/MREL).
–Interest rate risk is also actively managed in order to dampen the impact of interest rate changes on net interest income, conducted via high credit quality, very liquid and low capital consumption derivatives.
–Strategic management of the exposure to exchange rates in equity and dynamic in the countervalue of the units’ annual results in euros. Net investments in equity are currently covered by EUR 20,336 million (mainly Brazil, the UK, Mexico, Chile, the US, Poland and Norway) with different instruments (spot, fx, forwards).
•Management of total capital and reserves: efficient capital allocation to each of the units in order to maximize shareholder return.
Results
In the first half of 2022, underlying attributable loss of EUR 1,040 million, 28% higher than in H1'21 (-EUR 812 million), as follows:
•Net interest income decreased due to the higher liquidity buffer.
•Lower gains on financial transactions (EUR 276 million less than in H1'21), due to negative foreign currency hedging results (-EUR 300 million), that partly offset the positive performance of exchange rates in the countries' results.
•This was largely offset by the sharp decrease in provisions compared to the same period of the previous year.
| Corporate Centre. Underlying income statement | ||||||||||||||||||||||||||
| EUR million | ||||||||||||||||||||||||||
| Q2'22 | Q1'22 | Chg. | H1'22 | H1'21 | Chg. | |||||||||||||||||||||
| Total income | -446 | -301 | +48% | -747 | -418 | +79% | ||||||||||||||||||||
| Net operating income | -538 | -388 | +39% | -926 | -577 | +60% | ||||||||||||||||||||
| PBT | -577 | -437 | +32% | -1,014 | -806 | +26% | ||||||||||||||||||||
| Underlying attrib. profit | -577 | -462 | +25% | -1,040 | -812 | +28% | ||||||||||||||||||||
January - June 2022 | | 39 | ||||||
 | Retail Banking | Underlying attributable profit | ||||||
| EUR 3,991 mn | ||||||||
| Executive summary | |||||||||||||||||||||||||||||||||||||||||||||||||||||
Results. (H1'21 vs. H1'22). % change in constant euros | Business performance. EUR bn. % change in constant euros | ||||||||||||||||||||||||||||||||||||||||||||||||||||
| Profit increased driven by total income, a slight efficiency improvement and lower minority interests and tax burden | Continued growth in asset and liability volumes at a mid-single digit | ||||||||||||||||||||||||||||||||||||||||||||||||||||
| Total income | Costs | Provisions | Loans and advances to customers | Customer funds | |||||||||||||||||||||||||||||||||||||||||||||||||
| +2% | +3% | +26% | 842 | +5% YoY | 804 | +3% YoY | |||||||||||||||||||||||||||||||||||||||||||||||
| Customers | |||||||||||||||||||||||||||||||||||||||||||||||||||||
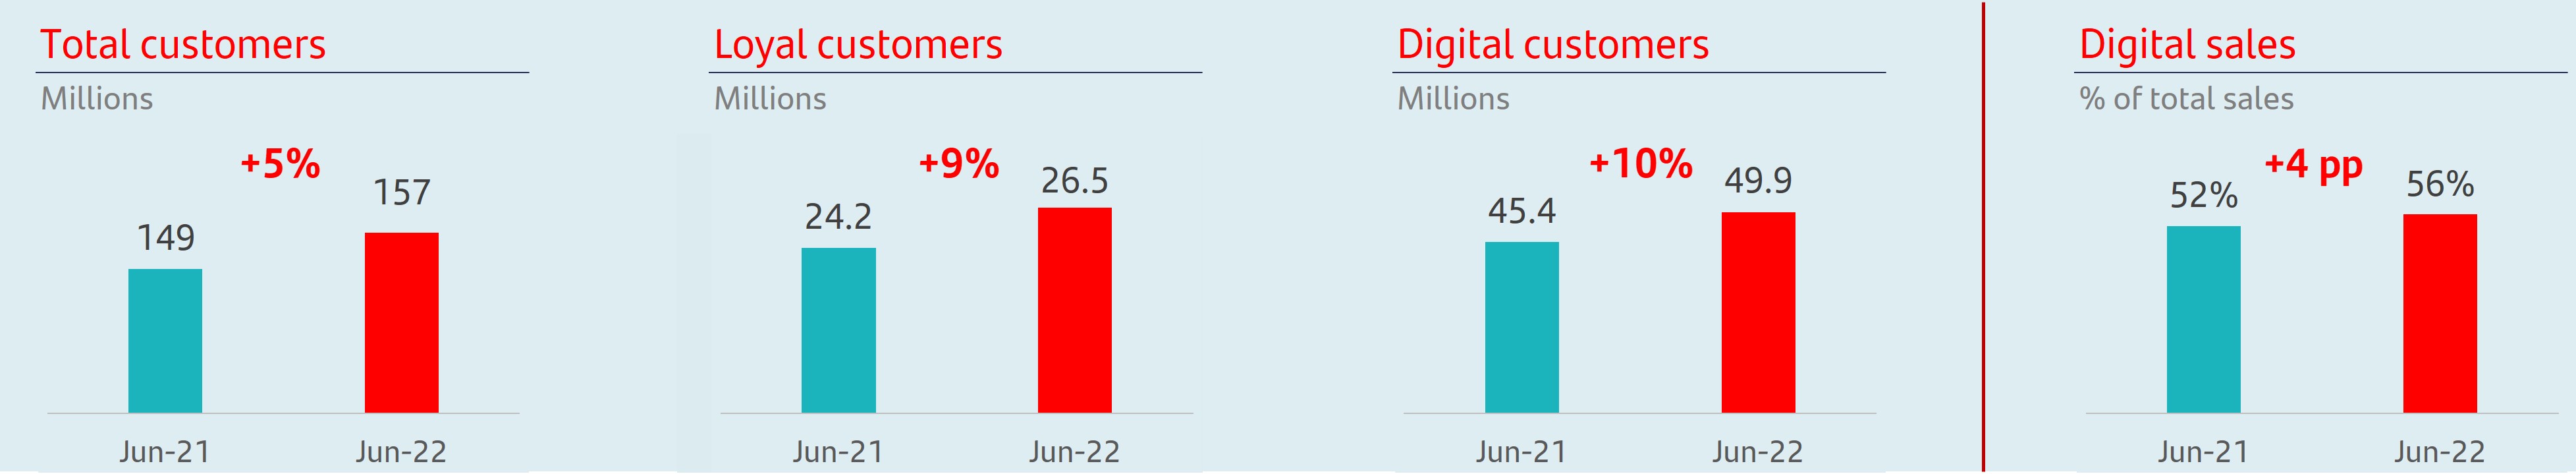 | |||||||||||||||||||||||||||||||||||||||||||||||||||||
Commercial activity
We continued to accelerate the implementation and development of our digital transformation, focusing on our multi-channel strategy and the digitalization of processes and businesses. Our aim is to ensure personalized support tailored to the needs of each customer, which also adresses one of our main priorities: the continuous improvement our customer service.
In addition, we rolled out several commercial initiatives, with tailored products and services for each segment, as explained in the comments regarding the regions and countries:
•In individuals, mortgages continued to grow in the majority of our markets, with positive trends in Spain, the UK and Portugal, where new mortgage lending reached record highs. We also introduced new products such as Hipoteca Integral in Mexico, which considers a family’s total income, gives a previously excluded segment of the population the opportunity to access mortgages.
We are also digitalizing the processes for granting consumer loans in most countries.
•In auto finance, we made headway in new alliances and partnerships and renewing existing ones, both in Europe and the US.
•Regarding corporates, we continued to offer differentiated products and services for SMEs, companies and SCIB, while launching joint initiatives between them to deepen relationships with multinational clients. For example, we launched Green Building in Brazil, which offers business financing for environmentally certified construction projects for SMEs and wholesale banking.
These initiatives allowed us to reach 157 million customers across the Group. The number of loyal customers increased 9% year-on-year to 26.5 million, digital customers rose 10% year-on-year to 49.9 million and digital sales accounted for 56% of total sales.
Results
Underlying attributable profit in the first half of 2022 was EUR 3,991 million, 12% higher year-on-year. Excluding the exchange rate impact, it was 3% higher, as follows:
•Total income grew 2% driven by higher net interest income (+6%) and net fee income (+3%) which offset lower gains on financial transactions.
•Costs increased 3%, affected by inflation. Net operating income grew 1% and efficiency stood at 43.7%.
•Loan-loss provisions rose 26%, mainly driven by the increases in North and South America.
•Lower tax burden and lower impacts from minority interests.
| Retail Banking. Underlying income statement | ||||||||||||||||||||||||||
| EUR million and % change | ||||||||||||||||||||||||||
| / | Q1'22 | / | H1'21 | |||||||||||||||||||||||
| Q2'22 | % | excl. FX | H1'22 | % | excl. FX | |||||||||||||||||||||
| Revenue | 10,541 | +4 | +1 | 20,635 | +9 | +2 | ||||||||||||||||||||
| Expenses | -4,626 | +5 | +2 | -9,025 | +8 | +3 | ||||||||||||||||||||
| Net operating income | 5,915 | +4 | -1 | 11,610 | +9 | +1 | ||||||||||||||||||||
| LLPs | -2,621 | +24 | +18 | -4,732 | +35 | +26 | ||||||||||||||||||||
| PBT | 2,838 | -10 | -14 | 5,997 | -4 | -12 | ||||||||||||||||||||
| Underlying attrib. profit | 1,936 | -6 | -10 | 3,991 | +12 | +3 | ||||||||||||||||||||
| 40 | | January - June 2022 | ||||||
| Santander Corporate & Investment Banking | Underlying attributable profit | ||||||
| EUR 1,531 mn | ||||||||
| Executive summary | ||||||||||||||||||||||||||||||||||||||||||||||||||||||||||||||
Results. (H1'22 vs. H1'21). % change in constant euros | Our aim and strategic priorities | |||||||||||||||||||||||||||||||||||||||||||||||||||||||||||||
| Total income | Underlying att. profit | 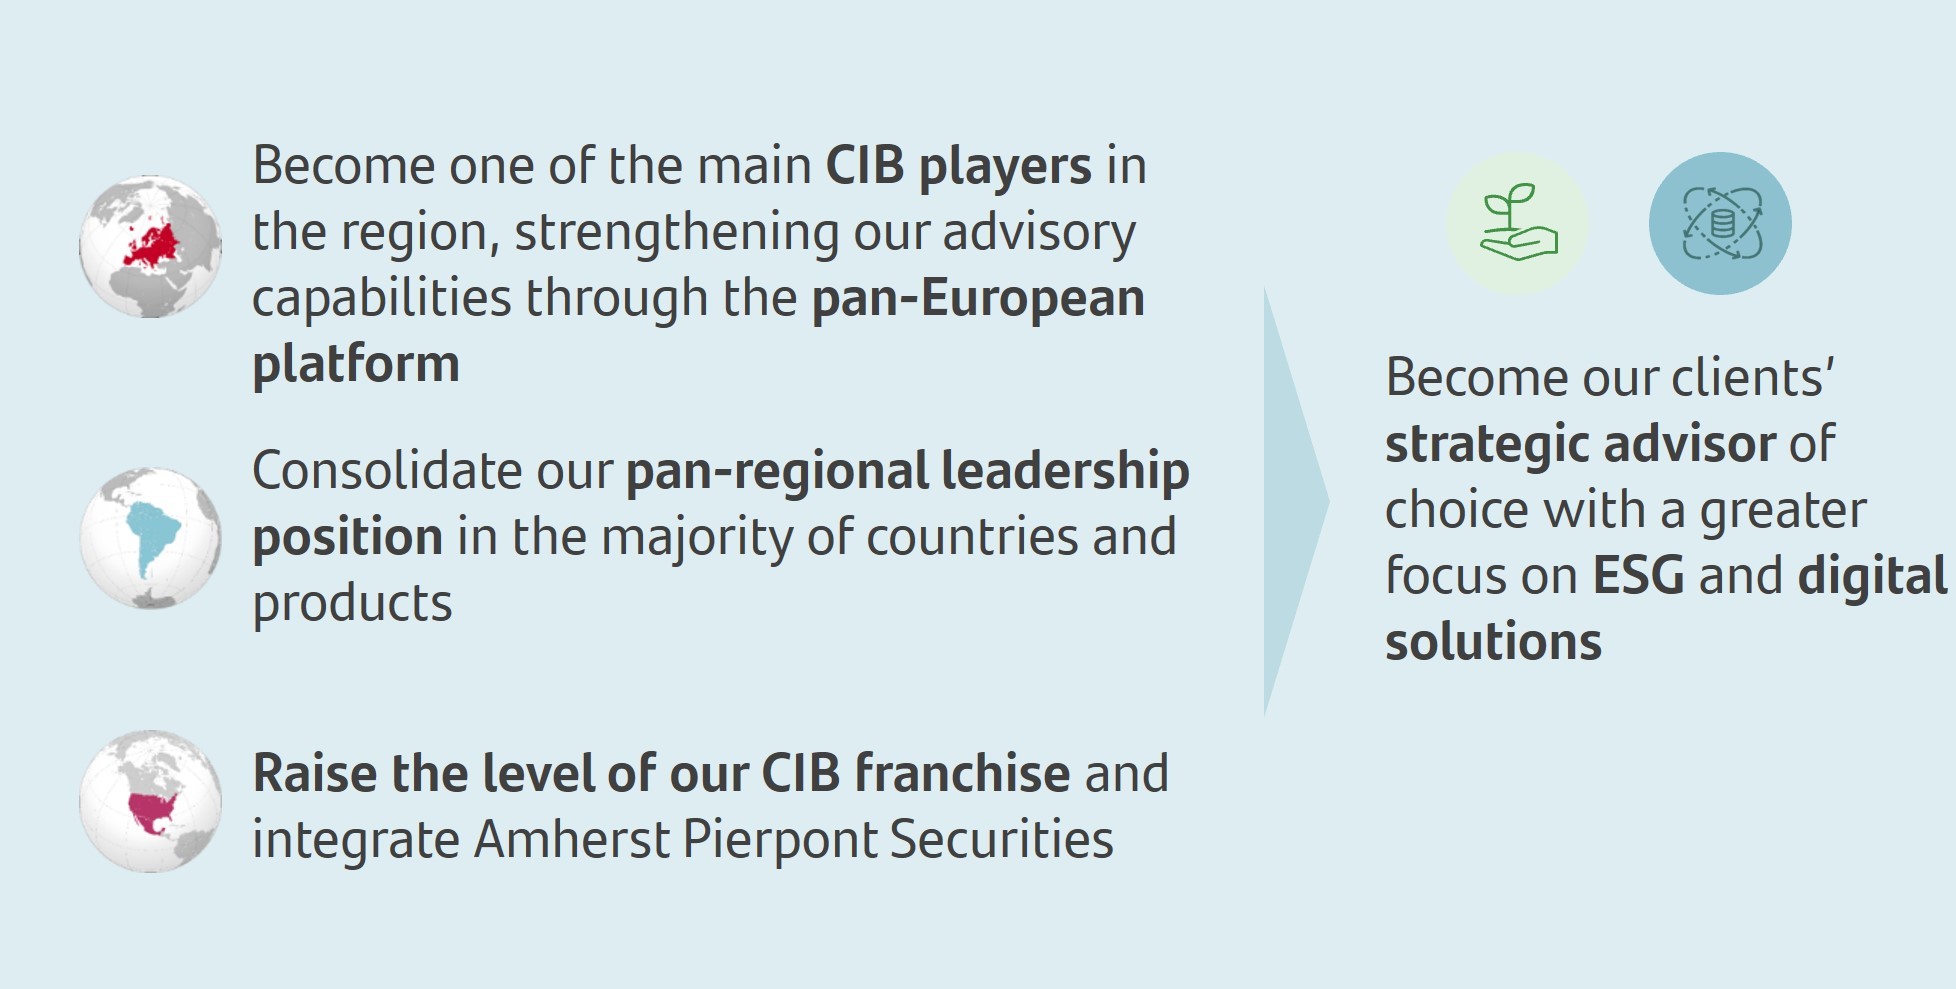 | ||||||||||||||||||||||||||||||||||||||||||||||||||||||||||||
| +20% | +28% | |||||||||||||||||||||||||||||||||||||||||||||||||||||||||||||
| Efficiency ratio | RoTE | |||||||||||||||||||||||||||||||||||||||||||||||||||||||||||||
| 35.7% | 24.3% | |||||||||||||||||||||||||||||||||||||||||||||||||||||||||||||
Revenue growth by business and region* | Other highlights in the quarter | |||||||||||||||||||||||||||||||||||||||||||||||||||||||||||||
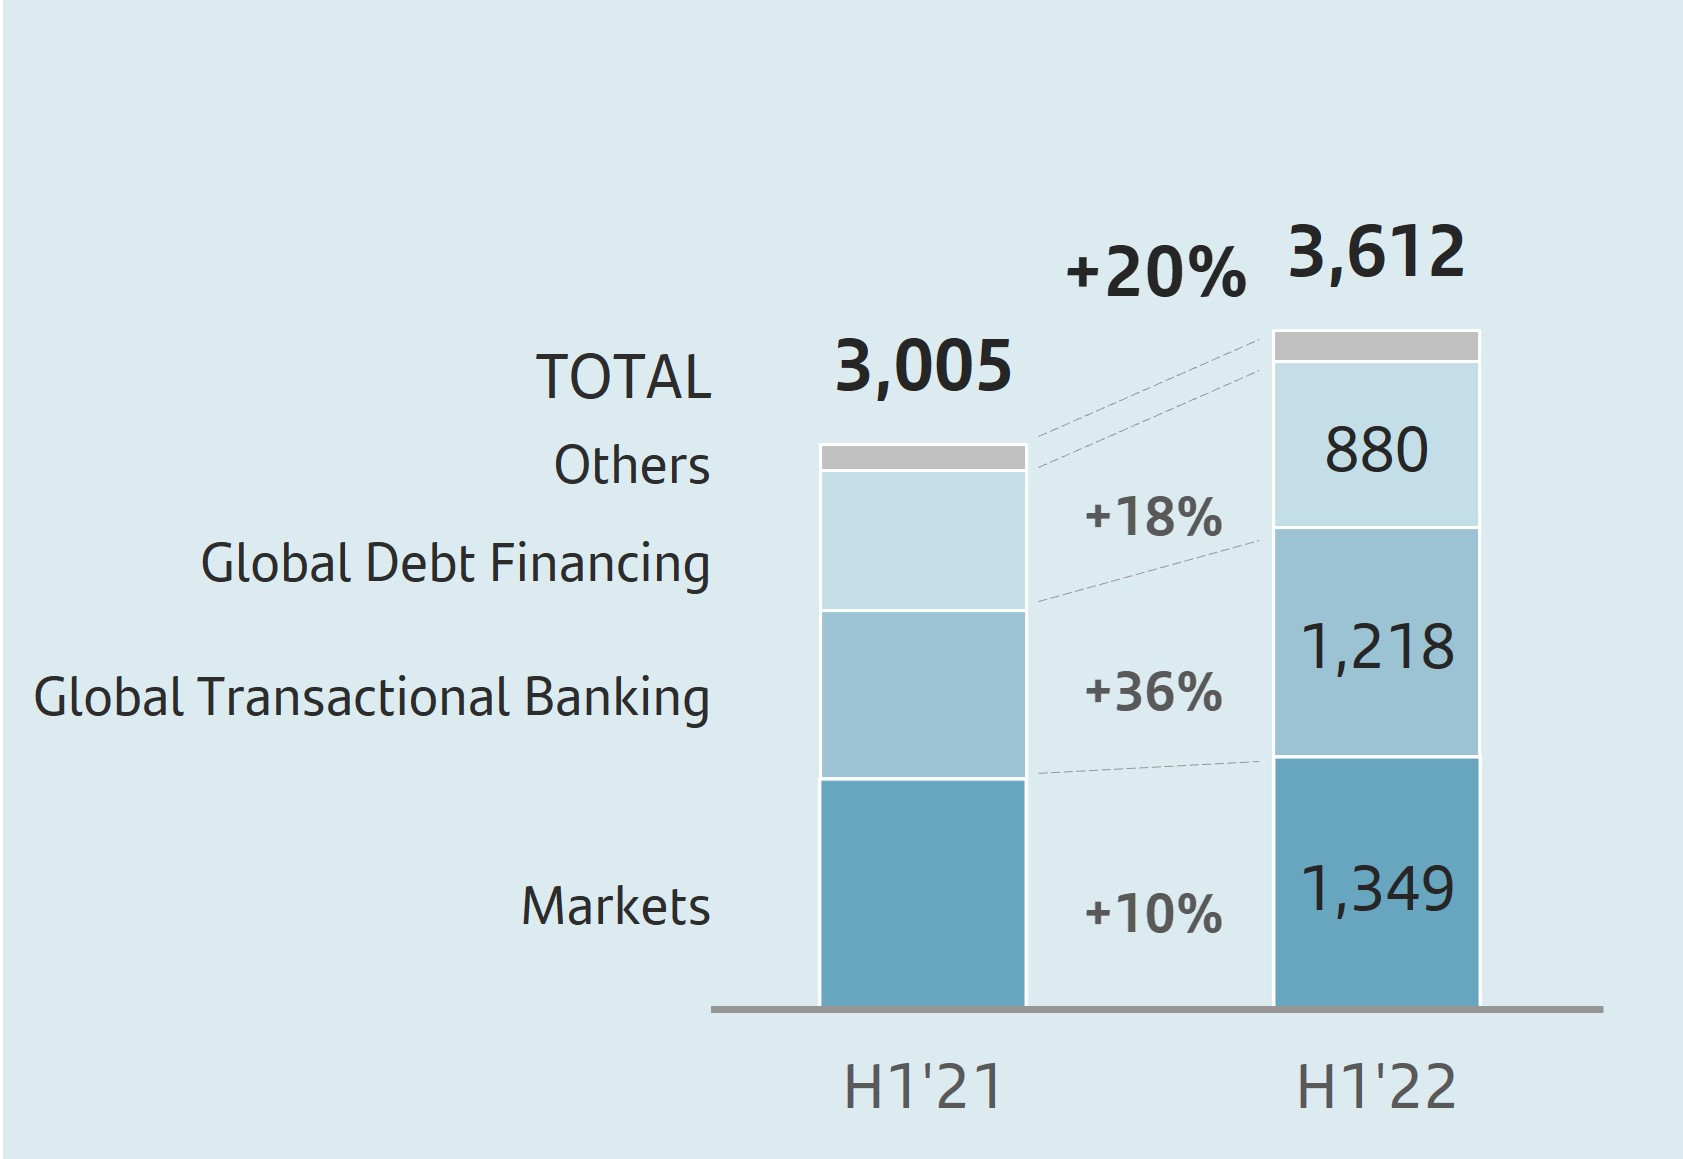 | 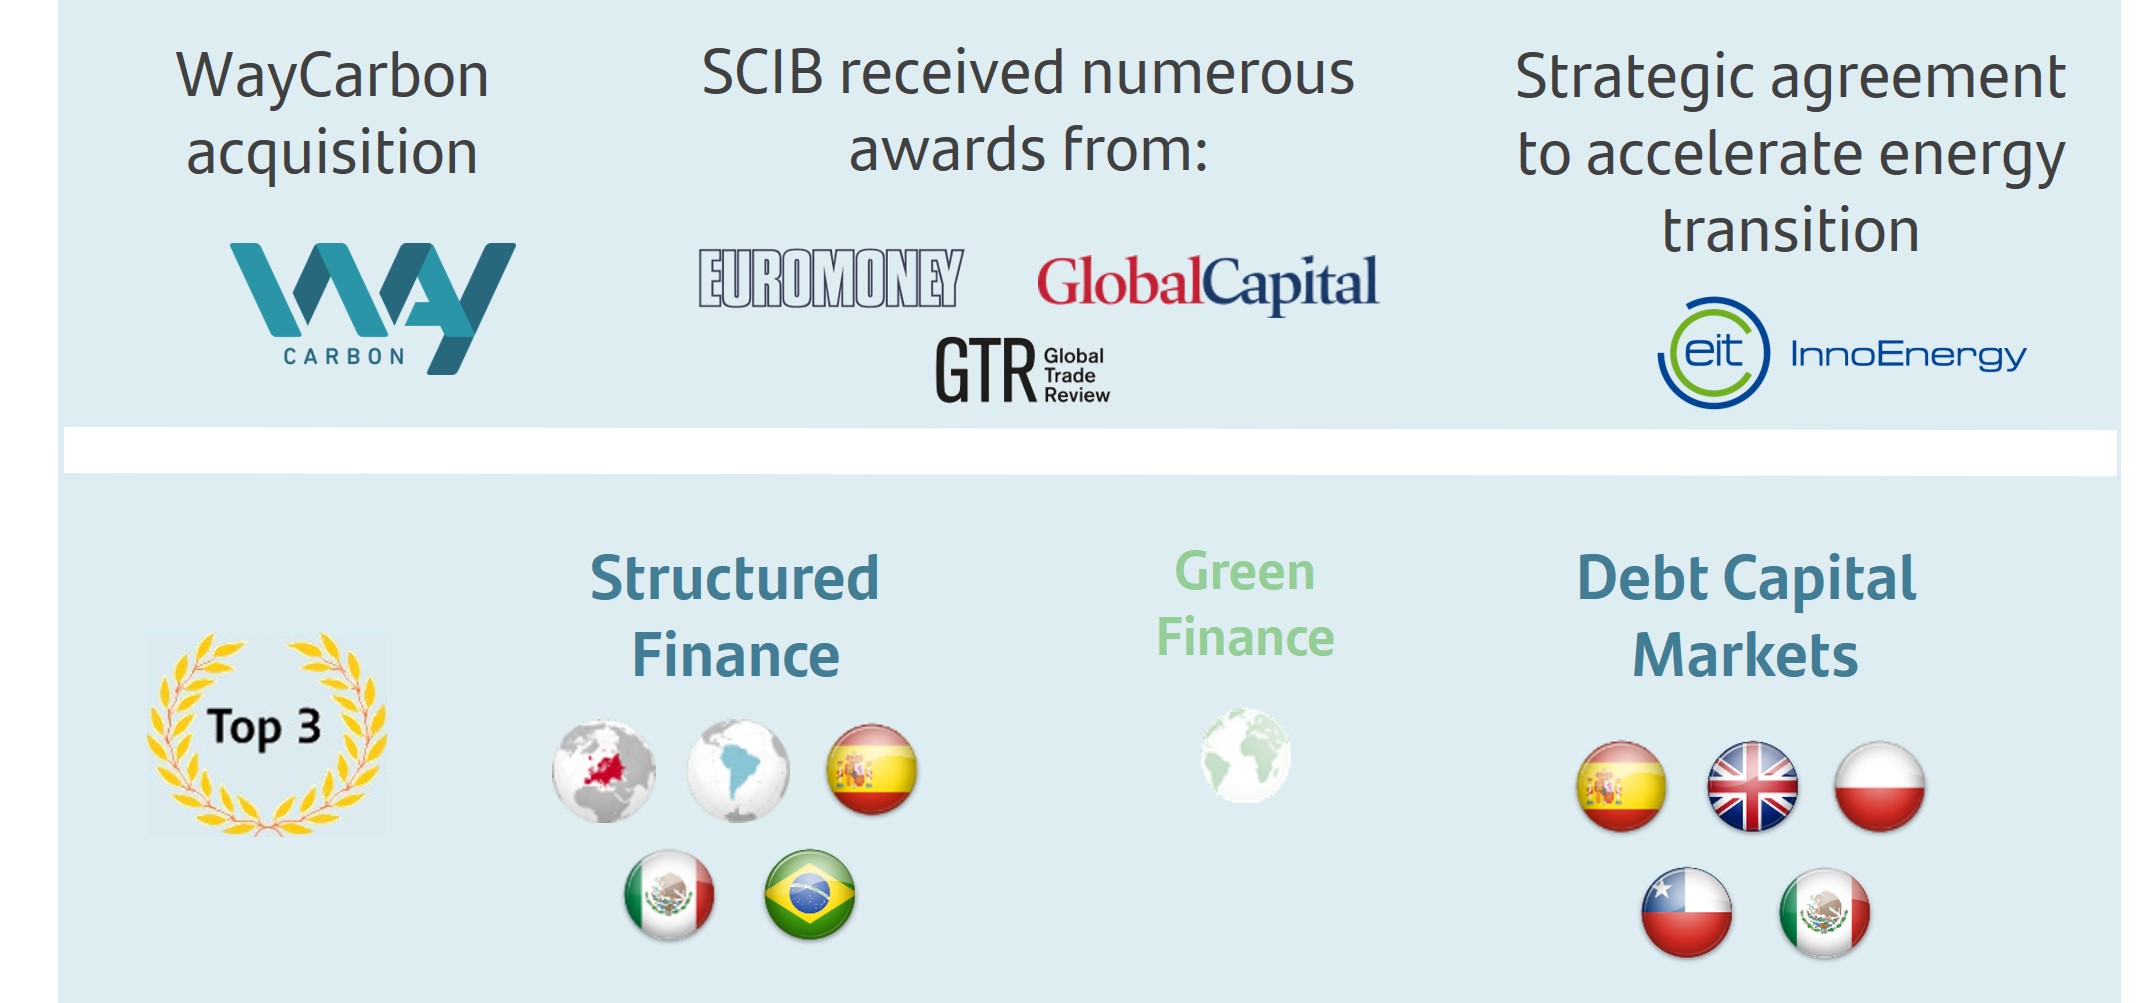 | |||||||||||||||||||||||||||||||||||||||||||||||||||||||||||||
| +11% | |||||||||||||||||||||||||||||||||||||||||||||||||||||||||||||
| +31% | |||||||||||||||||||||||||||||||||||||||||||||||||||||||||||||
| +29% | |||||||||||||||||||||||||||||||||||||||||||||||||||||||||||||
| * Constant EUR million | ||||||||||||||||||||||||||||||||||||||||||||||||||||||||||||||
Strategy
In a challenging macroeconomic environment due to geopolitical uncertainty arising from the Russia-Ukraine conflict, our priority has been to support our clients in these difficult times, while ensuring compliance with international restrictions and sanctions.
In this context, SCIB continued to make headway in the execution of its strategy to transform the business and become our clients' strategic advisor of choice, via specialized high value-added products and services; focusing on ESG and the digital transformation.
Our goal with this transformation is to become one of the leading investment banks in Europe. To this end, SCIB is strengthening its client advisory services through a pan-European platform, consolidating its leadership in Latin America in most countries and products, and continues to accelerate growth in the US, focusing on the integration of broker-dealer Amherst Pierpont Securities (APS) as a first step towards achieving its growth ambitions.
To accelerate the execution of our strategy within the sustainability sphere, in April 2022 , Banco Santander completed its plan to acquire 80% of WayCarbon Soluções Ambientais e Projetos de Carbono (‘WayCarbon’), a leading Brazil-based ESG consultancy firm that provides three core services: ESG consultancy; ESG strategy management software; and carbon credit trading.
This alliance further strengthens our commitment to the energy transition and our leadership in sustainable projects and renewable energy financing. In addition, we will expand our product portfolio in voluntary carbon markets, reforestation and conservation programmes, among others.
In ESG, of note in the quarter was Santander's role as financial advisor and intermediary for SCR Sibelco N.V. ("Sibelco") in the acquisition of 93.8% of Krynicki Recykling S.A.'s share capital, a Polish glass recycling company, for approximately PLN 375 million. This transaction will allow Sibelco to strengthen its market position in the glass recycling sector in Poland and the European Economic Community.
In Debt Capital Markets (DCM), SCIB acted as structurer for State Grid International Development and CFE (large Chinese and Mexican utilities) in their first green and sustainability bond issuances, respectively. In addition, SCIB structured a sustainable financing framework for Hexagon, a UK housing association. This structure enabled the client to issue a sustainability instrument, with an offering that will enable this not-for-profit organization to deliver on its commitment to provide safe, warm and energy-efficient homes for its residents.
Global Transaction Banking (GTB) closed the first sustainability-linked transaction to finance the acquisition of aircraft and several financings for the supply of components for the manufacture of electric vehicles and the construction of renewable energy plants. In addition, regarding supply chain disruptions, GTB continued to support our clients by providing new products to facilitate access to supplies and inventory management.
Of note in the Digital Solutions Group (DSG) was its activity in M&A in the digital environment and advising Telepass on the acquisition of Eurotoll.
January - June 2022 | | 41 | ||||||

Results
Underlying attributable profit in the first half of 2022 amounted to EUR 1,531 million (26% of the Group's total operating areas), 34% higher than in H1'21, becoming one of the best in SCIB's history, backed by double-digit growth across core businesses, notably GTB and GDF. In constant euros, profit was 28% higher, by line:
Revenue performance by business was as follows:
•Markets: 10% increase vs H1'21. Macroeconomic uncertainty led to risk reductions, where different assets suffered losses. The only gains were recorded in FX portfolios, due to increased volatility in currencies and commodities.
By region, in Markets Europe & Asia, this uncertainty resulted in lower sales activity with clients. On the other hand, good management of the Market Making teams allowed us to protect the value of our trading books.
In Latin America, we recorded excellent results despite the slowdown in activity compared to the first quarter of 2022. Positive contribution from virtually all countries with strong, double-digit increases, except Peru and Uruguay.
•GDF (Global Debt Financing): in a geopolitical environment of rising inflation and volatility, total income was 18% higher compared to H1'21. Despite government bond market volumes falling by more than 25% globally and in Europe, SCIB gained market share, and ranked in Europe's top 5 for corporate clients and financial institutions.
Regarding Structured Finance, we continue to lead League Tables globally, participating in relevant transactions in the renewable energy sector, within our ESG strategy, such as Origis Energy Debt Raise or Great Pathfinder.
•GTB (Global Transactional Banking): revenue grew 36% year-on-year. Cash Management continued the trend set in the first quarter, with significant growth both in terms of transactionality and revenue from liabilities, favoured by the rise in interest rates in Latin America. Trade & Working Capital Solutions continued to support its clients through new solutions that facilitate access to supplies, inventory management and working capital optimization.
This strong performance allowed us to receive awards from experts, being named: Best Supply Chain Finance Bank Global and Best Trade Finance Bank in Latin America by Global Trade Review; Best Supply Chain Finance Provider of the Year by BCR; and Best Trade Financier in Latin America by Trade Finance Global.
Export Finance is the leader in ESG financing. Of note was Santander's role as Green Loan Coordinator, Underwriter and Mandated Lead Arranger in a EUR 1 billion green facility with Iberdrola, 95% guaranteed by a European ECA, being Iberdrola's largest ECA-backed green loan in the last 20 years.
•CF (Corporate Finance): strong performance in Mergers and Acquisitions (M&A), 31% increase in total income in the first half of 2021, although partially offset by the slowdown in Equity Capital Markets due to stagnation in the global equity placement markets.
In the Telecommunications, Media & Technology (TMT) industry, there continues to be a strong appetite for investment, where Santander remains very active. Of note were two M&A transactions for a total amount of over EUR 3 billion.
In Energy, Santander maintained its leadership position as financial advisor in the renewable energy market. It is worth highlighting the advisory services provided to Q-Energy in the sale of a EUR 1 billion asset portfolio.
In CRH (Consumer Retail Healthcare), Santander continued to strengthen its Consumer and Retail franchise. Also noteworthy was the sale of 75% of HFEB to the Canadian pension fund PSP.
In Infrastructures, despite the current challenging environment, Santander continued to be a key player in the sector. Of note was its advising role to the consortium between Globalvia and Kinetic in the acquisition of Go-Ahead, a listed UK transport company. The transaction, worth over EUR 1.2 billion, is Santander's first takeover bid as advisor in the UK.
Operating expenses increased 12% year-on-year due to investments in products and franchises under development. However, at 35.7%, efficiency remained at lower levels than the previous year and well below the sector.
Sharp improvement in loan-loss provisions compared to the first half of 2021, which was still heavily affected by the macroeconomic deterioration caused by the covid-19 pandemic.
Compared to the previous quarter, underlying attributable profit increased 2% but fell slightly in constant euros (-1%), dampened by higher costs and the contribution to the SRF.
| SCIB. Underlying income statement | ||||||||||||||||||||||||||
| EUR million and % change | ||||||||||||||||||||||||||
| / | Q1'22 | / | H1'21 | |||||||||||||||||||||||
| Q2'22 | % | excl. FX | H1'22 | % | excl. FX | |||||||||||||||||||||
| Revenue | 1,849 | +5 | +1 | 3,612 | +26 | +20 | ||||||||||||||||||||
| Expenses | -673 | +9 | +7 | -1,289 | +17 | +12 | ||||||||||||||||||||
| Net operating income | 1,176 | +2 | -1 | 2,324 | +32 | +25 | ||||||||||||||||||||
| LLPs | 10 | -25 | -27 | 23 | — | — | ||||||||||||||||||||
| PBT | 1,149 | +1 | -3 | 2,291 | +36 | +28 | ||||||||||||||||||||
| Underlying attrib. profit | 772 | +2 | -1 | 1,531 | +34 | +28 | ||||||||||||||||||||
| 42 | | January - June 2022 | ||||||
| Wealth Management & Insurance | Underlying attributable profit | ||||||
| EUR 515 mn | ||||||||
| Executive summary | ||||||||||||||||||||||||||||||||||||||||||||||||||||||||||||||||||||||||||||||||||||||
Results (H1'22 vs. H1'21). % change in constant euros | Growth drivers H1'22 | |||||||||||||||||||||||||||||||||||||||||||||||||||||||||||||||||||||||||||||||||||||
Total fee income generated1 | Total contribution to profit1 | Assets under management (AuMs) | RoTE |  |  |  | ||||||||||||||||||||||||||||||||||||||||||||||||||||||||||||||||||||||||||||||||
| Net new money | AuMs | Gross written premiums | ||||||||||||||||||||||||||||||||||||||||||||||||||||||||||||||||||||||||||||||||||||
| +6% | +15% | -4% | 57.1% | EUR 5.8 bn | EUR 189 bn | +17% | ||||||||||||||||||||||||||||||||||||||||||||||||||||||||||||||||||||||||||||||||
| (2.3% of total CAL) | (-4% vs June 21) | vs June 21 | ||||||||||||||||||||||||||||||||||||||||||||||||||||||||||||||||||||||||||||||||||||
| Total contribution to profit by business | Other highlights in the period | |||||||||||||||||||||||||||||||||||||||||||||||||||||||||||||||||||||||||||||||||||||
| Constant EUR million (incl. fee income ceded to the Group) | Private Banking |  | SAM |  | Insurance |  | ||||||||||||||||||||||||||||||||||||||||||||||||||||||||||||||||||||||||||||||||
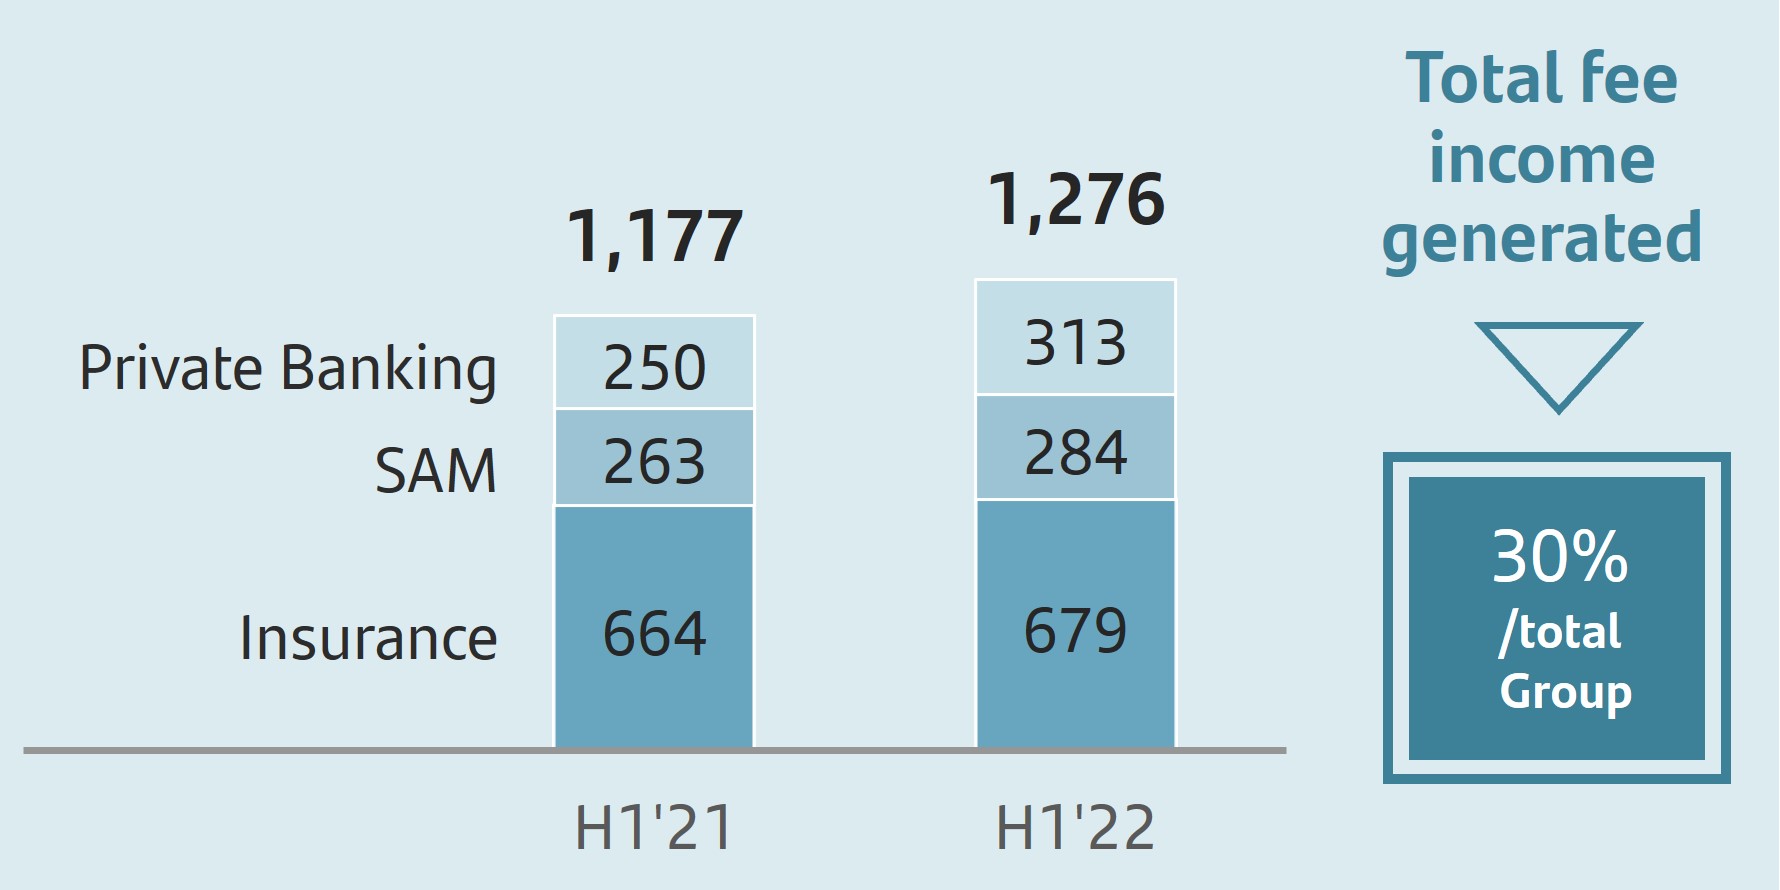 | ||||||||||||||||||||||||||||||||||||||||||||||||||||||||||||||||||||||||||||||||||||||
Customer growth +5% vs June 21 | SRI* EUR 14.5 bn | Fee income1 EUR 795 mn +6% vs. H1'21 | ||||||||||||||||||||||||||||||||||||||||||||||||||||||||||||||||||||||||||||||||||||
| (Total WM&I: EUR 30.1 bn) | ||||||||||||||||||||||||||||||||||||||||||||||||||||||||||||||||||||||||||||||||||||||
 | ||||||||||||||||||||||||||||||||||||||||||||||||||||||||||||||||||||||||||||||||||||||
| (1) Excluding insurance one-offs in 2021 | * Sustainable Responsible Investment | |||||||||||||||||||||||||||||||||||||||||||||||||||||||||||||||||||||||||||||||||||||
Commercial activity
We maintain our objective to become the best responsible Wealth & Protection Manager in Europe and Latin America, being one of the Group's growth drivers:
•In Private Baking, despite market volatility and inflationary pressures, we continued to leverage our scale to enable clients to benefit from our global platform and to foster collaboration across markets and segments, with collaboration volumes increasing 22% to EUR 9.6 billion. We are the leader in the large flow of investment from Latin America to Spain and the United States.
| Collaboration volumes | ||||||||||||||||||||
| Constant EUR billion | ||||||||||||||||||||
| 10 | ||||||||||||||||||||
| 〉 | +22% | |||||||||||||||||||
| vs. H1'21 | ||||||||||||||||||||
We continue to renew our value proposition, widening our product range according to market trends, with a particular focus on alternative products, collateralized lending, investment banking and ESG. We also continued to grow our discretionary advisory service, to offer our clients value-added solutions tailored to their specific investment needs and risk profiles, which account for 11.6% of total assets under management, 0.4% more than the same period last year.
Our range of alternative products exceeded EUR 2.59 billion (EUR 1.67 billion in H1'21) in both Santander Asset Management (SAM) and third-party funds. In the first six months, we launched several funds, such as Laurion, Blackrock, Compass, Ameris, Sancus and Qualitas.
Our real estate investment service, where we are capturing a large part of the existing flow between Latin America and Europe and the United States, reached a total volume of EUR 109 million through transactions in the period.
Our Sustainable Responsible Investment (SRI) products amounted to EUR 18.3 billion, (classified according to Article 8 or 9 under the SFDR or similar criteria applicable in Latin America).
•In Santander Asset Management, market volatility affected overall asset valuations and investment flows. We continued to improve and complete our local and global product proposition. We made further headway in our ESG strategy, offering 35 products globally, and assets under management (including sustainability strategies) of around EUR 14.5 billion. The range of alternative products aimed primarily at our institutional clients and Family Offices is becoming increasingly robust, with 5 funds already launched with EUR 689 million of AuMs and EUR 307 million already invested.
Regarding our operational and technological transformation, we launched the new Santander Activa management service in Spain in June, a fully digital (available on the web and app) automated portfolio management service (robo-advisor), that offers a quick and simple take-out process.
•In Insurance, we maintained a healthy growth rate in premiums, mainly in the protection business. The credit-related business was slightly affected by the macroeconomic environment, especially in Brazil and Chile.
January - June 2022 | | 43 | ||||||
Protection insurance sales were particularly strong in Europe. The new savings value proposition developed in Spain was particularly successful, completing the range of unit linked products.
In the Americas, we continued to consolidate the improvements to our value proposition, with healthy dynamics in the distribution mix through channels and in non-credit related insurance sales. It is worth highlighting helpS, our new, fully-digital assistance proposal in Brazil that enables us to access new customer segments.
The motor vehicle insurance business was 8% higher. The Autocompara platform, which operates in Argentina, Brazil, Chile, Mexico and Uruguay, reached 1.6 million active policies (+4% year-on-year). Regarding our digital strategy, we continued to increase the number of insurance policies distributed through our digital channels at double-digit rates, which now account for 20% of the total sales volumes (+21% year-on-year).
Business performance
Total assets under management amounted to EUR 395 billion, 4% lower year-on-year, dampened by markets since early 2022, especially in Europe.
| Business performance: SAM and Private Banking | ||||||||||||||||||||
| Constant EUR billion | ||||||||||||||||||||
| Total assets under management | ||
| Funds and investment* | ||
| - SAM | ||
| - Private Banking | ||
| Custody of customer funds | ||
| Customer deposits | ||
| Customer loans | ||
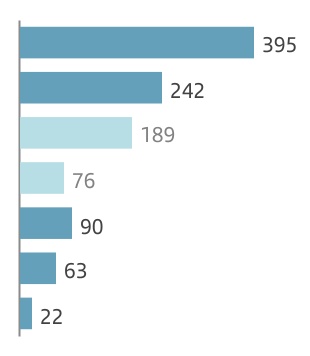
| / Mar-22 | / Jun-21 | ||||
| -1 | % | -4 | % | ||
| -2 | % | -3 | % | ||
| -3 | % | -4 | % | ||
| -5 | % | -5 | % | ||
| -2 | % | -12 | % | ||
| +3 | % | +11 | % | ||
| +3 | % | +13 | % | ||
Note: Total assets marketed and/or managed in 2022 and 2021.
(*) Total adjusted private banking customer funds managed by SAM.
•In Private Banking, the volume of customer assets and liabilities reached EUR 251.4 billion, 3% lower than in June 2021, affected by custody valuations. Net new money amounted to EUR 5.8 billion (2.3% of total volume). Net profit in H1'22 was EUR 313 million, up 25% compared to H1'21, primarily backed by growth in total income. Private Banking customers increased 5% to 115,000 clients.
•In SAM, total assets under management decreased 4% compared to June 2021 to EUR 189 billion. Net sales recorded outflows of EUR 1.747 billion (0.9% of the total). Total contribution to the Group's profit (including ceded fee income) was EUR 284 million, 8% higher year-on-year.
•In Insurance, the volume of gross written premiums in H1'22 amounted to EUR 5.5 billion (+17% year-on-year), with protection premiums growing 9% despite lower lending demand in Latin America. Total fee income rose 2% (+6% excluding the impact from insurance portfolio buybacks in 2021) and fee income from protection insurance was 5% higher. Total contribution to profit stood at EUR 679 million, +2% year-on-year (+13% excluding insurance earn-out one-offs and insurance portfolio buybacks in 2021).
Results
Underlying attributable profit was EUR 515 million in the first half of 2022, up 15% year-on-year in constant euros (+29% excluding insurance one-offs in 2021), as follows:
•Total income increased 10% due to higher revenue as a result of improved margins and net fee income, and the increase in the insurance protection business, especially non-credit related (+18% excluding the impact of insurance one-offs in 2021). Total fee income generated amounted to EUR 1,785 million (+4% year-on-year; +6% excluding insurance one-offs in 2021) and represented 30% of the Group's total.
| Total fee income generated | ||||||||||||||||||||||||||||||||
| Constant EUR million | ||||||||||||||||||||||||||||||||
| 1,785 | ||||||||||||||||||||||||||||||||
| 〉 | +4% | 30% | ||||||||||||||||||||||||||||||
| vs. H1'21 | / total Group | |||||||||||||||||||||||||||||||
•Operating expenses were 5% higher year-on-year, due to the investments carried out together with higher costs related to increased commercial activity and the perimeter of several operations, such as the acquisition of Crédit Agricole's business in Miami in 2021.
•As a result, net operating income rose 14%.
The total contribution to the Group (including net profit and total fees generated net of tax) was EUR 1,276 million in H1'22, 8% higher than in the same period of 2021 (+15% excluding insurance one-offs in 2021).
Compared to the previous quarter, underlying attributable profit increased 7% primarily due to the positive performance in total income and cost stability.
| Total contribution to profit | ||||||||||||||
| EUR million and % change in constant euros | ||||||||||||||
| Q2'22 | H1'22 | |||||||||||||
 | 662 | | 1,276 | |||||||||||
| +8 | % | / Q1'22 | +8 | % | / H1'21 | |||||||||
| WM&I. Underlying income statement | ||||||||||||||||||||||||||
| EUR million and % change | ||||||||||||||||||||||||||
| / | Q1'22 | / | H1'21 | |||||||||||||||||||||||
| Q2'22 | % | excl. FX | H1'22 | % | excl. FX | |||||||||||||||||||||
| Revenue | 635 | +8 | +5 | 1,222 | +15 | +10 | ||||||||||||||||||||
| Expenses | -252 | +3 | 0 | -496 | +10 | +5 | ||||||||||||||||||||
| Net operating income | 384 | +12 | +9 | 726 | +18 | +14 | ||||||||||||||||||||
| LLPs | -9 | — | — | -8 | -15 | -14 | ||||||||||||||||||||
| PBT | 367 | +9 | +6 | 705 | +18 | +14 | ||||||||||||||||||||
| Underlying attrib. profit | 270 | +10 | +7 | 515 | +19 | +15 | ||||||||||||||||||||
| 44 | | January - June 2022 | ||||||
| Underlying attributable profit | |||||||
| -EUR 104 mn | ||||||||
| Executive summary | ||||||||||||||||||||||||||||||||||||||||||||||||||||||||||||||||||||||||||||||||
| Revenue performance | Our business | |||||||||||||||||||||||||||||||||||||||||||||||||||||||||||||||||||||||||||||||
| Solid revenue growth* | Merchants | International Trade | Payments | Consumers | ||||||||||||||||||||||||||||||||||||||||||||||||||||||||||||||||||||||||||||
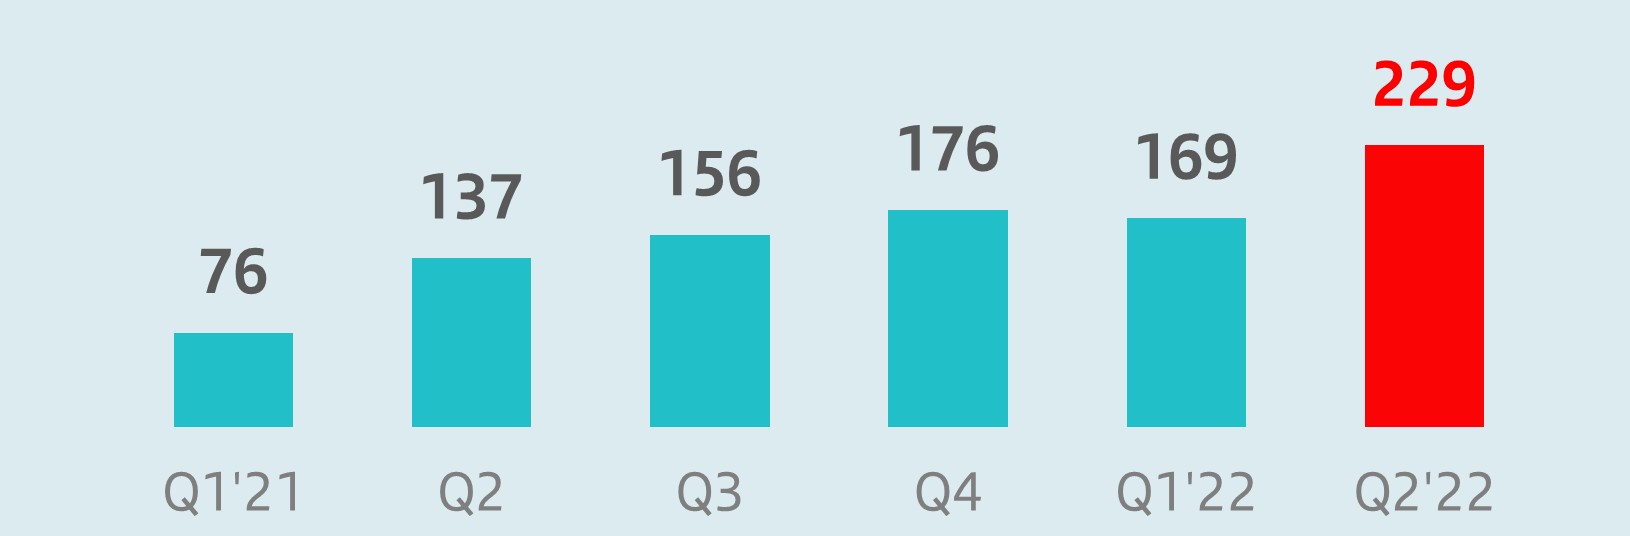 | +87%H1'22 vs. H1'21 | Global payments solutions for all merchant segments | International trading solutions for business | Wholesale account-to-account payment solutions | Financial marketplace for the underbanked | |||||||||||||||||||||||||||||||||||||||||||||||||||||||||||||||||||||||||||
| Our main strategic priorities | Main growth drivers | |||||||||||||||||||||||||||||||||||||||||||||||||||||||||||||||||||||||||||||||
•Scaling up our global technology platform | Merchants Total Payments Volume* | Active merchants | International Trade active customers | |||||||||||||||||||||||||||||||||||||||||||||||||||||||||||||||||||||||||||||
•Accelerating our commercial growth | ||||||||||||||||||||||||||||||||||||||||||||||||||||||||||||||||||||||||||||||||
•Pursuing the open market opportunity | +35% H1'22 vs H1'21 | +5% Jun-22 vs Jun-21 | >25k | |||||||||||||||||||||||||||||||||||||||||||||||||||||||||||||||||||||||||||||
| (*) Constant EUR million | ||||||||||||||||||||||||||||||||||||||||||||||||||||||||||||||||||||||||||||||||
.
Strategy
PagoNxt aims to achieve a global leadership position in payments through our distinctive, holistic and customer-centric value proposition. We are one-of-a-kind paytech business providing customers with a one-stop shop for innovative payments and integrated value-added solutions.
We address several high-growth and strategic business segments, namely:
•Merchants: providing global and integrated acquiring, processing and value-added solutions for physical and e-commerce merchants of all sizes.

•International Trade: delivering specialized cross-border trading solutions – payments, FX, cash management, trade finance – for business customers, in a large and global addressable market yet to be fully digitalized.


•Payments: providing wholesale account-to-account payments processing and instant connectivity to schemes in multiple geographies through a highly-scalable model.

•Consumer: providing a financial marketplace for the economic inclusion of the underbanked and low-income population, with a focus on Latin America.

PagoNxt's technology platform and specialist teams serve the payments needs of Grupo Santander and additionally cater for open market opportunities beyond Santander's business.
PagoNxt's strategy is anchored on the following key levers:
•Scaling up our global, cloud-native, data-driven, secure and efficient platform. We operate a connected, real-time, flexible and highly scalable technology platform that is fully cloud and API-based to ensure access to PagoNxt's latest features through a single integration. We process and generate insights to help our customers and their businesses leverage the full power of data and make data-driven decisions.
•Accelerating commercial growth by continuing to strengthen our commerce and international trade ecosystem, our offerings and our distribution through Santander's commercial muscle.
•Decisively pursuing the open market opportunity through direct commercialization and distribution partnerships, increasing our market penetration in Europe, North America and South America and extending our footprint in additional strategic regions.
January - June 2022 | | 45 | ||||||
Business performance
In the first half of the year, PagoNxt had several important achievements, effectively responding to the current market challenges:
•Getnet continued its growth, reaching 1.27 million active merchants (+5% vs. Jun-21) and EUR 74.6 billion in Total Payments Volume (TPV), 35% higher compared to the first half of 2021.
–TPV in Getnet Brazil grew 23% in H1 boosted by our e-commerce proposition, which has become one of our main growth drivers, positioning us as one of the main players in the industry. Our growth strategy is also centred on leveraging our relationship with Santander Brasil, pursuing opportunities through all sales channels (digital, call centre, branches, Prospera). Additionally, we are boosting our independent channel through partnerships, direct sales (owned and third parties, including franchises) and digital sales. Our ambition is to be the one-stop-shop platform for solutions for SMEs and long-tail customers. In Q2, PagoNxt announced its plan to acquire the minority interests in Getnet Brazil.
–Getnet Europe, our pan-European acquirer, grew significantly in H1. TPV increased 53% and active merchants rose 15% year-on-year, mainly driven by our exposure to high-growth verticals in Spain. In addition, we continue to develop our open market strategy in the region, with an initial focus on developing solutions for highly specialized industries, such as airlines and mobility. Through our activity with European merchants, our presence in the region now includes nine countries.
–Getnet Mexico continued to fuel growth, with TPV increasing by 38% in H1 year-on-year. This rise was driven by the progressive recovery across key sectors and by the development of the open market distribution channel through partnerships with financial institutions, independent software vendors (ISVs) and payment ecosystems.
•Our One Trade platform continued to develop new and innovative solutions to become the core provider of international capabilities to Grupo Santander. In the last quarter, the platform expanded its reach, implementing new cross-border payments capabilities for Santander España and new Trading FX capabilities for Santander Chile.
•More broadly in Grupo Santander payments, PagoNxt is accelerating its roadmap to become the wholesale payments provider of Santander, centralizing all types of non-card payments.
•In the quarter, Ebury extended its B2B cross-border trade presence and portfolio in the open market, acquiring the Brazilian fintech, Bexs.
•On the consumer side, our Superdigital business recorded 637 thousand active users in Brazil, Argentina and Uruguay in Q2. The global platform will shortly be launched in Colombia, Peru and Mexico.
| Merchant Acquiring | ||||||||||||||||||||||||||||||||||||||||||||
| Active merchants | Total Payments Volume | |||||||||||||||||||||||||||||||||||||||||||
| Millions | Constant EUR billion | |||||||||||||||||||||||||||||||||||||||||||
| 1.27 | ||||||||||||||||||||||||||||||||||||||||||||
| 1.21 | +5% | +35% | 74.6 | |||||||||||||||||||||||||||||||||||||||||
| 55.1 | ||||||||||||||||||||||||||||||||||||||||||||
| Jun-21 | Jun-22 | H1'21 | H1'22 | |||||||||||||||||||||||||||||||||||||||||
Results
In the first half of 2022, underlying attributable loss decreased year-on-year to -EUR 104 million, compared to -EUR 123 million in the first half of 2021.
Total income was EUR 398 million, an 87% increase in constant euros compared to the first half of 2021, backed by the overall increase in business activity and volumes across regions, especially in our Merchant and Trade businesses (Getnet, Ebury).
This revenue growth keeps PagoNxt on track to achieve its 50% revenue growth target for 2022.
| PagoNxt. Revenue performance | ||||||||||||||||||||
| Constant EUR million and % change in constant euros | ||||||||||||||||||||
| 398 | ||||||||||||||||||||
| +87% | ||||||||||||||||||||
| 213 | ||||||||||||||||||||
| H1'21 | H1'22 | |||||||||||||||||||
In the period, PagoNxt has continued its investment phase to develop and implement its global technology.
Compared to the previous quarter, underlying attributable profit was similar and stood at -EUR 50 million.
| PagoNxt. Underlying income statement | ||||||||||||||||||||||||||
| EUR million and % change | ||||||||||||||||||||||||||
| / | Q1'22 | / | H1'21 | |||||||||||||||||||||||
| Q2'22 | % | excl. FX | H1'22 | % | excl. FX | |||||||||||||||||||||
| Revenue | 236 | +46 | +35 | 398 | +110 | +87 | ||||||||||||||||||||
| Expenses | -258 | +36 | +31 | -447 | +50 | +43 | ||||||||||||||||||||
| Net operating income | -22 | -22 | 0 | -50 | -54 | -50 | ||||||||||||||||||||
| LLPs | -9 | +222 | +199 | -11 | +142 | +107 | ||||||||||||||||||||
| PBT | -33 | +5 | +25 | -64 | -46 | -42 | ||||||||||||||||||||
| Underlying attrib. profit | -50 | -8 | -3 | -104 | -18 | -16 | ||||||||||||||||||||
| 46 | | January - June 2022 | ||||||
| RESPONSIBLE BANKING | ||||||||
 | Responsible Banking targets | ||||
This quarter we set three new decarbonization targets and continued to make progress on the other medium-term commitments:
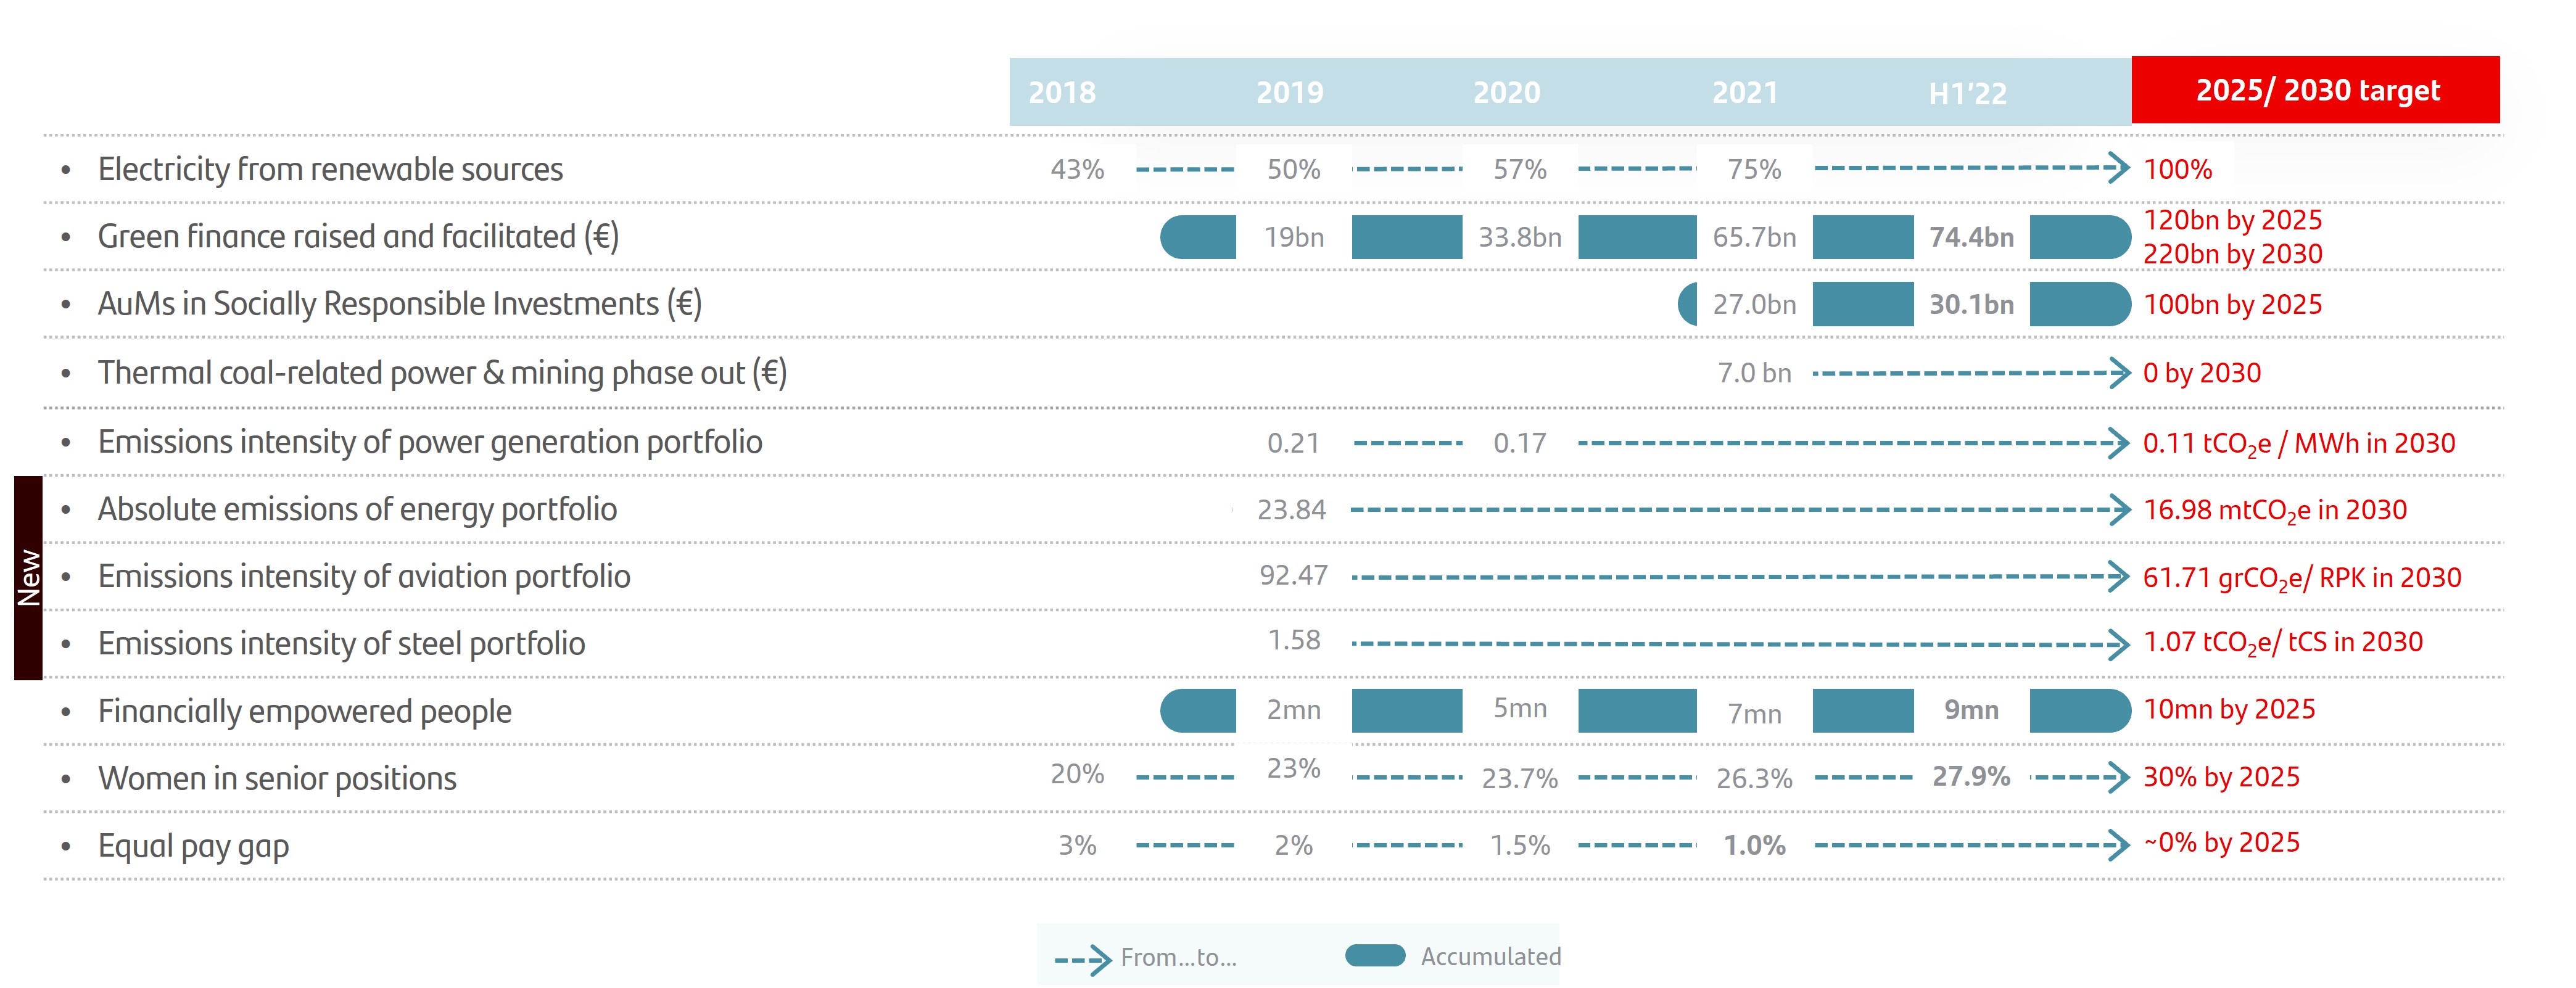
More information available on our corporate website.
Note: H1'22 data provisional and not audited
 | Q2'22 highlights | ||||
☑ We announced three new decarbonization targets for 2030 (measured in emissions reductions vs 2019) in the following sectors: energy1 (-29%), aviation (-33%) and steel (-32%).
☑ We appointed a new Head of Green Finance to drive the transition to a greener economy for our customers.
☑ Euromoney named us Best Global Bank for Financial Inclusion, highlighting our programmes in South America and Mexico, and Best Bank for Corporate Responsibility in Central and Eastern Europe for our support to refugees from Russia-Ukraine conflict.
Of note among the implemented initiatives were:
 | Environmental | ||||
♣ In line with our commitment to grant EUR 120 billion in green finance by 2025 and EUR 220 billion by 2030, we mobilized EUR 8.7 billion in green finance in the first half of 2022, reaching EUR 74.4 billion since 2019.
♣ The volume of AuMs in socially responsible investments amounted to EUR 30.1 billion.
♣ We continued to support our wholesale customers, through:
•The EUR 1 billion green export loan with Iberdrola. The funds will mainly finance the purchase of turbines for wind farms in Europe.
•Participation in the issuance of green bonds for the ICO and the Junta de Andalucía, for EUR 500 million each.
��New partnerships: SCIB and EIT InnoEnergy will work together to foster innovation in the development of sustainable energy solutions. Agreement with EcoVadis to incorporate ESG metrics in the bank's global confirming programmes.
(1) Energy refers to Oil & Gas. Further detail on our Climate Finance Report 2021 - June 2022.
January - June 2022 | | 47 | ||||||
♣ New features and products for our customers:
•In Spain, we added a carbon footprint calculator on our app and website that considers the customer's entire transaction, allows them to offset their own footprint and gives eco-advice for its reduction. We also offer a "turnkey" service that includes everything from the online simulation of the home renovation to the management of European aid and the energy efficiency loan.
•In the UK, we introduced the Green Mortgages Hub platform to inform and promote energy efficiency in our customers' homes.
•In Brazil, we designed a Sustainable Business Plan for financing real estate projects that includes environmental certifications and the ability to significantly reduce waste and water and energy consumption.
 | Social | ||||
t We continue to strengthen our financial inclusion and empowerment proposition:
•We have financially empowered more than 9 million people since 2019, making headway towards our 10 million target in 2025, mainly driven by the expansion of our financial education programmes in the UK (The Numbers Game) and Poland (Finansiaki), as well as Tuiio, our financing programme in Mexico.
•We have granted over EUR 426 million in loans through our microfinance programmes in 8 countries.
•In Mexico, we launched Hipoteca Integral, backed by Sociedad Hipotecaria Federal (SHF, the federal mortgage company), enabling access to mortgages to eight million families that do not have stable incomes.
•In Portugal, we made headway in our proposal for senior customers by opening a call centre intended for 70+ customers to improve the experience of this segment.
•In the US, we extended our partnership with Operation HOPE, an NGO specialized in financial education and inclusion, to continue supporting people from all walks of life.
t We promote a diverse and inclusive workplace: Santander's headquarters hosted the EMEA Women in Payments Symposium. The event, sponsored by Santander Women's Network, brought together female professionals in the payments industry, in order to boost professional development and gender equality.
t We support the communities where we operate:
•Santander Universities, opened new calls for scholarship applications (7,900 spots) related to sustainability and the development of key skills for the labour market, together with Harvard Business Publishing, LSE and Cambridge Judge School.
•We continue to support Ukraine through Poland's recent partnership with the United Nations High Commissioner for Refugees, enabling rapid and safe arrival to the country.
 | Governance | ||||
v We introduced new mandatory ESG training for all employees. In addition, jointly with the International Association for Sustainable Economy, we provide employees with an internal and an external certification. The latter is aimed at those employees who are involved in the Responsible Banking agenda.
v We published annual sustainability reports in Mexico, Portugal and Brazil.
 | Q2'22 Awards | ||||
☑ IR Magazine gave Santander awards for Best Annual Report and Best ESG Materiality Reporting.
☑ In Brazil, Exame magazine named us Best ESG in the financial institutions category.
☑ In Spain, we received the IMEF - MEF 2022 Gender Equality Award and we entered the Best LinkedIn Companies 2022 ranking.
☑ In Poland, we were awarded with the gold leaf in the CSR Leaves awards, as well as being named, together with the Santander Fundakja foundation, in the Responsible Business in Poland best practice report.
☑ We ranked among the top 10 companies to work for in Uruguay by Great Place to Work for companies with over 150 employees.

| 48 | | January - June 2022 | ||||||
| CORPORATE GOVERNANCE | ||||||||
| A responsible bank has a solid governance model with well-defined functions, it manages risks and opportunities prudently and defines its long-term strategy looking out for the interests of all its stakeholders and society in general |  | ||||
àChanges in the board of directors
On 17 June, it was announced that, following a favourable report from the nomination committee and after a rigorous succession process, the bank's board of directors had proposed, the currently CEO of Santander México and regional head of North America, Mr Hector Grisi, as Group CEO and member of the board effective 1 January 2023, subject to the corresponding approvals. Mr Grisi’s appointment will take place once regulatory approvals have been obtained. Mr Grisi will succeed Mr José Antonio Álvarez, who, after the transition period, will remain on the board of directors as non-executive vice chair.
On 21 April, once the corresponding regulatory approval was obtained, Mr Germán de la Fuente joined the board of directors as an independent director, filling the vacancy of Mr Álvaro Cardoso de Souza.
Mr R. Martín Chávez resigned, for personal reasons, as an independent director of Banco Santander effective on 1 July, thereby stepping down from the committees he had been assigned. Mr Chávez remains a director of PagoNxt.
àChanges in the composition of the board committees
Ms Ana Botín has been appointed as chair of the innovation and technology committee, replacing Mr R. Martín Chávez, effective on 18 April 2022.
Mr Germán de la Fuente joined the audit committee on 21 April 2022.
àShare capital. Amendment of Article 5 of the Bylaws
On 1 April, the board of directors reduced the bank's share capital in the amount of EUR 129,965,136.50 by cancelling 259,930,273 of its own shares acquired in the buy-back programme carried out between October and November 2021 within the framework of the shareholder remuneration against 2021 results. The reduction was approved by the general shareholders' meeting on 1 April 2022 and was registered in the Commercial Registry of Cantabria on 25 April 2022.
Likewise, on 28 June 2022, a second share capital reduction in the amount of EUR 143,154,722.50 was executed by the board, as a result the cancellation of 286,309,445 of its own shares acquired in the buy-back programme carried out between March and May 2022 within the framework of the shareholder remuneration against 2021 results. The reduction was approved by the general shareholders' meeting on 1 April 2022, which delegated to the board the power to set its terms in all matters not specified and was registered in the Commercial Registry of Cantabria on 1 July 2022.
Following the aforementioned reductions, the bank's share capital has been set at EUR 8,397,200,792, represented by 16,794,401,584 shares with a nominal value of EUR 0.50 for each share, belonging to the same class and with the same rights.
àOther amendments of the Bylaws
On 26 May, once the ECB provided authorization for the amendments to the Bylaws approved at the ordinary general shareholders' meeting on 1 April 2022 (Articles 6, 12, 16, 19, 26, 29, 45, 48, 52, 58, 59, 59 bis of the Bylaws and the introduction of a new Article 64 bis), they were registered in the Commercial Registry of Cantabria. Their purpose is to:
•conform them to the amendments introduced in the Spanish Companies Act and introduce certain technical clarifications regarding to the right to know the identity of the ultimate beneficiary of the shares and the time at which newly-issued shares are transferable, the directors' remuneration, capital reductions, convertible securities and the powers of the audit committee with respect to the directors’ report and related party transactions;
•clarify that the board can establish direct reporting lines from other executives to the board itself or to its committees;
January - June 2022 | | 49 | ||||||
•allow the board of directors to appoint more than one vice secretary and reflect this possibility in the regulation of the presiding committee of the general shareholders’ meeting;
•provide for the ability of directors to attend the meetings remotely if there are justified grounds as determined by the board or the chair of the meeting; and
•include a technical clarification regarding the distribution of dividends other than in cash or own funds instruments of the Bank, in accordance with the criteria of the European Banking Authority.
àAmendment of the Rules and Regulations of the General Shareholders’ Meeting
Likewise, on 26 May 2022, the amendments to the Rules and regulations of the general shareholders’ meeting approved at the general meeting on 1 April 2022 (Articles 6, 13, 17 and 19, the elimination of the Additional Provision and the introduction of a new Article 15 bis) were registered in the Commercial Registry of Cantabria and submitted to the National Securities Market Commission. The amendments were introduced to conform the regulatory text to the amendments to the Bylaws approved by the general shareholders’ meeting and to the amendments implemented to the Spanish Companies Act regarding attendance at the general meeting remotely, as well as to modify the minimum time that may be allocated to the shareholders presentations at the general meeting.
àAmendment of the Rules and Regulations of the Board of Directors
On 13 June 2022, the amendments to the Rules and regulations of the board of directors (Articles 3, 8, 13, 17, 19, 27 and 33) were registered in the Commercial Registry of Cantabria and submitted to the National Securities Market Commission. The amendments were introduced to conform to the amended Bylaws, as approved by the general shareholders’ meeting, to clarify the term of office of directors appointed by co-option and to strengthen coordination between the audit committee and the responsible banking, sustainability and culture committee.
| 50 | | January - June 2022 | ||||||
| SANTANDER SHARE | ||||||||
In application of the shareholder remuneration policy for 2021, the bank paid a second cash dividend of EUR 5.15 cents per share against 2021 results. In addition, as detailed in the Corporate Governance chapter, a second share buyback programme was implemented for a total amount of EUR 865 million, equivalent to 1.7% of the bank's share capital, whose redemption was executed by the board of directors on 28 June 2022.
As a result, total shareholder remuneration totalled around EUR 3.4 billion, equivalent to a share of approximately 40% of 2021 underlying attributable profit.
à Share price performance
Santander's shares are listed in 5 markets, in Spain, Mexico, Poland, the US (as an ADR) and the UK (as a CDI).
The OECD has identified several factors that are contributing to the downturn of the global economy, including heightened inflation that is in turn reducing disposable income and lowering consumption, economic uncertainty that deters business investment and threatens to curb supply in the coming years, China's zero-covid-19 policy that is disrupting global supply chains and the Russia-Ukraine conflict that is negatively affecting the distribution of basic food and energy commodities.
The decisions taken by central banks to combat soaring inflation, including interest rate hikes in the US, the UK and Latin America, as well as the increasingly accelerated reduction of the asset purchase programme by the European Central Bank (ECB) have had a negative impact on our share price performance.
In recent weeks, concerns about inflation and a potential recession forced the main central banks to act more aggressively. Therefore, the Fed raised interest rates by another 75 basis points, compared with the expected 50 bp increase, and the ECB raised interest rate by 50 bps in July. Moreover, the ECB announced its new tool to tackle the so-called financial fragmentation,which arises from the increase in the risk premiums of South-European countries; the Transmission Protection Instrument (TPI).
The impact of these measures is leading to a depreciation trend in currency exchange rates against the dollar, which is now close to parity with the euro.
In this environment, the Santander share price ended the first six months with an 8.6% decrease versus December 2021, a better performance than that of the main comparable indices, primarily due to its very limited exposure to Russia and Ukraine, geographic diversification, good Q1'22 results and a positive performance of Latin American currencies.
The main global equity markets ended the first half with declines. The banking sector recorded an overall worse performance, affected by the different exposures to Russia. The DJ Stoxx Banks fell 13.9% and the MSCI World Banks 17.4%, compared to the 7.1% Ibex 35 decrease and the 9.7% DJ Stoxx 50 decline.
| Share price | ||||||||||||||
 |  | |||||||||||||
START 31/12/2021 | END 30/06/2022 | |||||||||||||
| €2.941 | €2.688 | |||||||||||||
 |  | |||||||||||||
Maximum 10/02/2022 | Minimum 07/03/2022 | |||||||||||||
| €3.482 | €2.490 | |||||||||||||
| Comparative share performance | ||
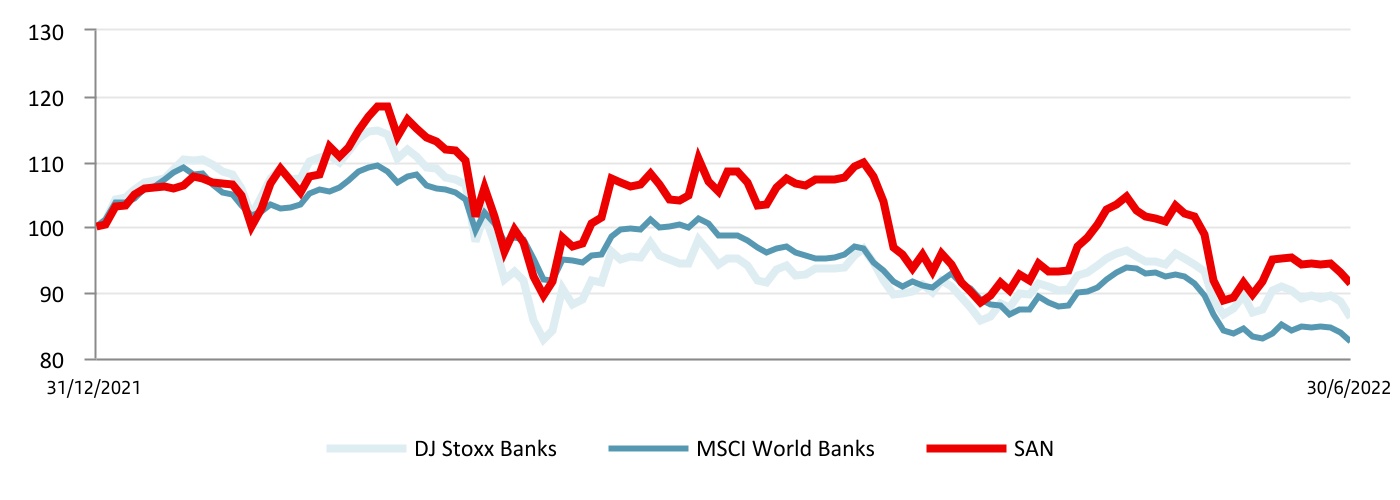
January - June 2022 | | 51 | ||||||
àMarket capitalization and trading
As at 30 June 2022, Santander was the second largest bank in the Eurozone by market capitalization and the 37th in the world among financial entities (EUR 45,143 million).
The share’s weighting in the DJ Stoxx Banks index was 6.8% and 12.4% in the DJ Euro Stoxx Banks. In the domestic market, its weight in the Ibex 35 as at end-June was 10.6%.
A total of 8,157 million shares were traded in the period for an effective value of EUR 24,486 million and a liquidity ratio of 47%.
The daily trading volume was 64.2 million shares with an effective value of EUR 193 million.
àShareholder base
The total number of Santander shareholders at 30 June 2022 was 3,985,638, of which 3,453,534 were European (75.10% of the capital stock) and 520,769 from the Americas (23.84% of the capital stock).
Excluding the board, which holds 1.10% of the Bank’s capital stock, retail shareholders account for 42.59% and institutional shareholders account for 56.31%.
| Share capital distribution by geographic area | ||||||||
| June 2022 | ||||||||
| The Americas | Europe | Other | ||||||
| 23.84% | 75.10% | 1.06% | ||||||
 | ||||||||
 | 2nd | Bank in the Eurozone by market capitalization | ||||||
EUR 45,143 million | ||||||||
| The Santander share | |||||
| June 2022 | |||||
| Shares and trading data | |||||
| Shares (number) | 16,794,401,584 | ||||
| Average daily turnover (number of shares) | 64,228,243 | ||||
| Share liquidity (%) | 47 | ||||
| (Number of shares traded during the year / number of shares) | |||||
| Stock market indicators | |||||
| Price / Tangible book value (X) | 0.63 | ||||
| Free float (%) | 99.98 | ||||
| Share capital distribution by type of shareholder | |||||
| June 2022 | |||||
| Institutions | |||||
| 56.31% | |||||
| Board * | |||||
| 1.10% | |||||
| Retail | |||||
| 42.59% | |||||
(*) Shares owned or represented by directors.
| 52 | | January - June 2022 | ||||||
2022 A P P E N D I X
January - June 2022 | | 53 | ||||||
| Net fee income. Consolidated | ||||||||||||||||||||
| EUR million | ||||||||||||||||||||
| Q2'22 | Q1'22 | Change (%) | H1'22 | H1'21 | Change (%) | |||||||||||||||
| Fees from services | 1,772 | 1,597 | 11.0 | 3,369 | 2,843 | 18.5 | ||||||||||||||
| Wealth management and marketing of customer funds | 1,004 | 923 | 8.8 | 1,927 | 1,783 | 8.1 | ||||||||||||||
| Securities and custody | 264 | 292 | (9.6) | 556 | 543 | 2.4 | ||||||||||||||
| Net fee income | 3,040 | 2,812 | 8.1 | 5,852 | 5,169 | 13.2 | ||||||||||||||
| Underlying operating expenses. Consolidated | ||||||||||||||||||||
| EUR million | ||||||||||||||||||||
| Q2'22 | Q1'22 | Change (%) | H1'22 | H1'21 | Change (%) | |||||||||||||||
| Staff costs | 3,085 | 2,863 | 7.8 | 5,948 | 5,438 | 9.4 | ||||||||||||||
| Other general administrative expenses | 2,077 | 1,968 | 5.5 | 4,045 | 3,558 | 13.7 | ||||||||||||||
| Information technology | 596 | 565 | 5.5 | 1,161 | 1,048 | 10.8 | ||||||||||||||
| Communications | 108 | 100 | 8.0 | 208 | 199 | 4.5 | ||||||||||||||
| Advertising | 144 | 121 | 19.0 | 265 | 233 | 13.7 | ||||||||||||||
| Buildings and premises | 192 | 167 | 15.0 | 359 | 332 | 8.1 | ||||||||||||||
| Printed and office material | 24 | 23 | 4.3 | 47 | 42 | 11.9 | ||||||||||||||
| Taxes (other than tax on profits) | 139 | 141 | (1.4) | 280 | 264 | 6.1 | ||||||||||||||
| Other expenses | 874 | 851 | 2.7 | 1,725 | 1,440 | 19.8 | ||||||||||||||
| Administrative expenses | 5,162 | 4,831 | 6.9 | 9,993 | 8,996 | 11.1 | ||||||||||||||
| Depreciation and amortization | 738 | 704 | 4.8 | 1,442 | 1,381 | 4.4 | ||||||||||||||
| Operating expenses | 5,900 | 5,535 | 6.6 | 11,435 | 10,377 | 10.2 | ||||||||||||||
| Operating means. Consolidated | |||||||||||||||||||||||
Employees1 | Branches2 | ||||||||||||||||||||||
| Jun-22 | Jun-21 | Change | Jun-22 | Jun-21 | Change | ||||||||||||||||||
| Europe | 63,579 | 66,398 | (2,819) | 3,178 | 3,401 | (223) | |||||||||||||||||
| Spain | 26,272 | 26,152 | 120 | 1,921 | 1,951 | (30) | |||||||||||||||||
| United Kingdom | 20,320 | 22,451 | (2,131) | 450 | 553 | (103) | |||||||||||||||||
| Portugal | 4,977 | 6,049 | (1,072) | 386 | 418 | (32) | |||||||||||||||||
| Poland | 10,468 | 10,443 | 25 | 413 | 471 | (58) | |||||||||||||||||
| Other | 1,542 | 1,303 | 239 | 8 | 8 | — | |||||||||||||||||
| North America | 43,779 | 41,670 | 2,109 | 1,859 | 1,920 | (61) | |||||||||||||||||
| US | 14,943 | 15,610 | (667) | 486 | 544 | (58) | |||||||||||||||||
| Mexico | 28,236 | 25,543 | 2,693 | 1,373 | 1,376 | (3) | |||||||||||||||||
| Other | 600 | 517 | 83 | — | — | — | |||||||||||||||||
| South America | 75,588 | 67,198 | 8,390 | 3,786 | 3,788 | (2) | |||||||||||||||||
| Brazil | 53,743 | 45,115 | 8,628 | 2,936 | 2,940 | (4) | |||||||||||||||||
| Chile | 9,921 | 10,628 | (707) | 306 | 332 | (26) | |||||||||||||||||
| Argentina | 8,514 | 8,814 | (300) | 407 | 408 | (1) | |||||||||||||||||
| Other | 3,410 | 2,641 | 769 | 137 | 108 | 29 | |||||||||||||||||
| Digital Consumer Bank | 15,894 | 15,834 | 60 | 370 | 314 | 56 | |||||||||||||||||
| Corporate Centre | 1,811 | 1,743 | 68 | ||||||||||||||||||||
| Total Group | 200,651 | 192,843 | 7,808 | 9,193 | 9,423 | (230) | |||||||||||||||||
(1) UK and Poland figures have been changed to headcount to align with the other units.
(2) Branch data for Brazil has been adjusted to the show number of physical branches rather than operating units.
| Underlying net loan-loss provisions. Consolidated | ||||||||||||||||||||
| EUR million | ||||||||||||||||||||
| Q2'22 | Q1'22 | Change (%) | H1'22 | H1'21 | Change (%) | |||||||||||||||
| Non-performing loans | 2,988 | 2,409 | 24.0 | 5,397 | 4,353 | 24.0 | ||||||||||||||
| Country-risk | — | 1 | (100.0) | 1 | (1) | — | ||||||||||||||
| Recovery of written-off assets | (354) | (309) | 14.6 | (663) | (599) | 10.7 | ||||||||||||||
| Net loan-loss provisions | 2,634 | 2,101 | 25.4 | 4,735 | 3,753 | 26.2 | ||||||||||||||
| 54 | | January - June 2022 | ||||||
| Loans and advances to customers. Consolidated | |||||||||||||||||
| EUR million | |||||||||||||||||
| Change | |||||||||||||||||
| Jun-22 | Jun-21 | Absolute | % | Dec-21 | |||||||||||||
| Commercial bills | 57,171 | 42,529 | 14,642 | 34.4 | 49,603 | ||||||||||||
| Secured loans | 563,525 | 522,412 | 41,113 | 7.9 | 542,404 | ||||||||||||
| Other term loans | 288,070 | 275,974 | 12,096 | 4.4 | 269,526 | ||||||||||||
| Finance leases | 39,139 | 38,054 | 1,085 | 2.9 | 38,503 | ||||||||||||
| Receivable on demand | 13,244 | 9,995 | 3,249 | 32.5 | 10,304 | ||||||||||||
| Credit cards receivable | 21,884 | 18,459 | 3,425 | 18.6 | 20,397 | ||||||||||||
| Impaired assets | 32,402 | 32,136 | 266 | 0.8 | 31,645 | ||||||||||||
| Gross loans and advances to customers (excl. reverse repos) | 1,015,435 | 939,559 | 75,876 | 8.1 | 962,382 | ||||||||||||
| Reverse repos | 45,738 | 38,536 | 7,202 | 18.7 | 33,264 | ||||||||||||
| Gross loans and advances to customers | 1,061,173 | 978,095 | 83,078 | 8.5 | 995,646 | ||||||||||||
| Loan-loss allowances | 23,452 | 23,577 | (125) | (0.5) | 22,964 | ||||||||||||
| Loans and advances to customers | 1,037,721 | 954,518 | 83,203 | 8.7 | 972,682 | ||||||||||||
| Total funds. Consolidated | |||||||||||||||||
| EUR million | |||||||||||||||||
| Change | |||||||||||||||||
| Jun-22 | Jun-21 | Absolute | % | Dec-21 | |||||||||||||
| Demand deposits | 717,516 | 685,086 | 32,430 | 4.7 | 717,728 | ||||||||||||
| Time deposits | 197,420 | 169,491 | 27,929 | 16.5 | 164,259 | ||||||||||||
| Mutual funds | 183,773 | 182,491 | 1,282 | 0.7 | 188,096 | ||||||||||||
| Customer funds | 1,098,709 | 1,037,068 | 61,641 | 5.9 | 1,070,083 | ||||||||||||
| Pension funds | 14,250 | 15,858 | (1,608) | (10.1) | 16,078 | ||||||||||||
| Managed portfolios | 32,597 | 29,493 | 3,104 | 10.5 | 31,138 | ||||||||||||
| Repos | 58,851 | 39,550 | 19,301 | 48.8 | 36,357 | ||||||||||||
| Total funds | 1,204,407 | 1,121,969 | 82,438 | 7.3 | 1,153,656 | ||||||||||||
Eligible capital (phased-in) 1. Consolidated | |||||||||||||||||
| EUR million | |||||||||||||||||
| Change | |||||||||||||||||
| Jun-22 | Jun-21 | Absolute | % | Dec-21 | |||||||||||||
| Capital stock and reserves | 117,619 | 115,678 | 1,941 | 1.7 | 114,806 | ||||||||||||
| Attributable profit | 4,894 | 3,675 | 1,219 | 33.2 | 8,124 | ||||||||||||
| Dividends | (979) | (2,102) | 1,124 | (53.4) | (1,731) | ||||||||||||
| Other retained earnings | (32,506) | (34,048) | 1,542 | (4.5) | (34,395) | ||||||||||||
| Minority interests | 6,971 | 6,347 | 625 | 9.8 | 6,736 | ||||||||||||
| Goodwill and intangible assets | (17,084) | (15,823) | (1,261) | 8.0 | (16,064) | ||||||||||||
| Other deductions | (4,825) | (2,862) | (1,962) | 68.6 | (5,076) | ||||||||||||
| Core CET1 | 74,091 | 70,864 | 3,227 | 4.6 | 72,402 | ||||||||||||
| Preferred shares and other eligible tier 1 | 8,794 | 9,109 | (315) | (3.5) | 10,050 | ||||||||||||
| Tier 1 | 82,885 | 79,973 | 2,913 | 3.6 | 82,452 | ||||||||||||
| Generic funds and eligible tier 2 instruments | 14,965 | 12,567 | 2,398 | 19.1 | 14,865 | ||||||||||||
| Eligible capital | 97,850 | 92,539 | 5,311 | 5.7 | 97,317 | ||||||||||||
| Risk-weighted assets | 604,777 | 584,999 | 19,778 | 3.4 | 578,930 | ||||||||||||
| CET1 capital ratio | 12.25 | 12.11 | 0.14 | 12.51 | |||||||||||||
| Tier 1 capital ratio | 13.71 | 13.67 | 0.03 | 14.24 | |||||||||||||
| Total capital ratio | 16.18 | 15.82 | 0.36 | 16.81 | |||||||||||||
(1) The phased-in ratio includes the transitory treatment of IFRS 9, calculated in accordance with article 473 bis of the Regulation on Capital Requirements (CRR) and subsequent amendments introduced by Regulation 2020/873 of the European Union. Total phased-in capital ratios include the transitory treatment according to chapter 4, title 1, part 10 of the CRR2.
January - June 2022 | | 55 | ||||||
| EUROPE | |||||||||||||||||||||||
| EUR million | |||||||||||||||||||||||
| / | Q1'22 | / | H1'21 | ||||||||||||||||||||
| Underlying income statement | Q2'22 | % | % excl. FX | H1'22 | % | % excl. FX | |||||||||||||||||
| Net interest income | 2,981 | 5.0 | 5.6 | 5,820 | 11.8 | 10.5 | |||||||||||||||||
| Net fee income | 1,162 | 0.7 | 0.7 | 2,316 | 7.3 | 7.0 | |||||||||||||||||
Gains (losses) on financial transactions (1) | 170 | (14.6) | (14.8) | 370 | (21.1) | (21.5) | |||||||||||||||||
| Other operating income | (37) | — | — | 76 | 8.6 | 9.5 | |||||||||||||||||
| Total income | 4,276 | (0.7) | (0.3) | 8,581 | 8.6 | 7.7 | |||||||||||||||||
| Administrative expenses and amortizations | (2,104) | 2.1 | 2.5 | (4,164) | 0.5 | (0.5) | |||||||||||||||||
| Net operating income | 2,172 | (3.2) | (2.8) | 4,417 | 17.5 | 16.7 | |||||||||||||||||
| Net loan-loss provisions | (631) | 22.6 | 22.9 | (1,146) | (4.6) | (4.3) | |||||||||||||||||
| Other gains (losses) and provisions | (342) | 45.2 | 45.8 | (578) | (2.8) | (2.6) | |||||||||||||||||
| Profit before tax | 1,199 | (19.8) | (19.4) | 2,693 | 37.2 | 35.0 | |||||||||||||||||
| Tax on profit | (331) | (21.5) | (21.1) | (753) | 19.3 | 17.7 | |||||||||||||||||
| Profit from continuing operations | 867 | (19.1) | (18.7) | 1,940 | 45.7 | 43.2 | |||||||||||||||||
| Net profit from discontinued operations | — | — | — | — | — | — | |||||||||||||||||
| Consolidated profit | 867 | (19.1) | (18.7) | 1,940 | 45.7 | 43.2 | |||||||||||||||||
| Non-controlling interests | (47) | (15.1) | (14.5) | (102) | 401.7 | 412.6 | |||||||||||||||||
| Underlying profit attributable to the parent | 821 | (19.4) | (18.9) | 1,839 | 40.2 | 37.7 | |||||||||||||||||
| Balance sheet | |||||||||||||||||||||||
| Loans and advances to customers | 609,342 | 1.1 | 1.8 | 609,342 | 4.2 | 4.2 | |||||||||||||||||
| Cash, central banks and credit institutions | 234,343 | 4.0 | 4.5 | 234,343 | 16.7 | 16.4 | |||||||||||||||||
| Debt instruments | 66,134 | (2.2) | (1.9) | 66,134 | (14.6) | (14.0) | |||||||||||||||||
| Other financial assets | 47,046 | 5.5 | 5.4 | 47,046 | (4.8) | (4.9) | |||||||||||||||||
| Other asset accounts | 29,091 | (1.1) | (0.9) | 29,091 | (10.9) | (11.1) | |||||||||||||||||
| Total assets | 985,956 | 1.7 | 2.3 | 985,956 | 4.3 | 4.3 | |||||||||||||||||
| Customer deposits | 626,163 | 0.4 | 1.1 | 626,163 | 4.5 | 4.7 | |||||||||||||||||
| Central banks and credit institutions | 173,956 | 4.4 | 4.5 | 173,956 | 12.7 | 11.3 | |||||||||||||||||
| Marketable debt securities | 72,129 | 2.4 | 3.5 | 72,129 | (8.7) | (8.5) | |||||||||||||||||
| Other financial liabilities | 58,095 | 16.0 | 16.0 | 58,095 | 5.9 | 5.7 | |||||||||||||||||
| Other liabilities accounts | 11,151 | 0.2 | 0.6 | 11,151 | (6.8) | (6.4) | |||||||||||||||||
| Total liabilities | 941,494 | 2.1 | 2.7 | 941,494 | 4.7 | 4.6 | |||||||||||||||||
| Total equity | 44,462 | (6.8) | (6.3) | 44,462 | (2.2) | (2.1) | |||||||||||||||||
| Memorandum items: | |||||||||||||||||||||||
Gross loans and advances to customers (2) | 589,371 | 0.9 | 1.5 | 589,371 | 4.8 | 4.8 | |||||||||||||||||
| Customer funds | 705,411 | (0.1) | 0.5 | 705,411 | 3.5 | 3.8 | |||||||||||||||||
Customer deposits (3) | 608,753 | 0.7 | 1.4 | 608,753 | 5.2 | 5.4 | |||||||||||||||||
| Mutual funds | 96,658 | (5.2) | (5.0) | 96,658 | (5.9) | (5.7) | |||||||||||||||||
| Ratios (%), operating means and customers | |||||||||||||||||||||||
| Underlying RoTE | 7.86 | (1.81) | 8.80 | 2.13 | |||||||||||||||||||
| Efficiency ratio | 49.2 | 1.3 | 48.5 | (3.9) | |||||||||||||||||||
| NPL ratio | 2.63 | (0.37) | 2.63 | (0.67) | |||||||||||||||||||
| Total coverage ratio | 50.19 | 1.1 | 50.2 | 1.8 | |||||||||||||||||||
| Number of employees | 63,579 | 0.9 | 63,579 | (4.2) | |||||||||||||||||||
| Number of branches | 3,178 | (1.2) | 3,178 | (6.6) | |||||||||||||||||||
| Number of loyal customers (thousands) | 10,536 | 1.9 | 10,536 | 3.9 | |||||||||||||||||||
| Number of digital customers (thousands) | 16,816 | 1.4 | 16,816 | 7.1 | |||||||||||||||||||
(1) Includes exchange differences.
(2) Excluding reverse repos.
(3) Excluding repos.
| 56 | | January - June 2022 | ||||||
| Spain | |||||||||||||||||
| EUR million | |||||||||||||||||
| / Q1'22 | / H1'21 | ||||||||||||||||
| Underlying income statement | Q2'22 | % | H1'22 | % | |||||||||||||
| Net interest income | 1,017 | 2.0 | 2,015 | (5.8) | |||||||||||||
| Net fee income | 730 | (2.1) | 1,475 | 7.1 | |||||||||||||
Gains (losses) on financial transactions (1) | 84 | (35.2) | 215 | (20.7) | |||||||||||||
| Other operating income | 84 | (43.1) | 232 | 104.5 | |||||||||||||
| Total income | 1,916 | (5.2) | 3,937 | 0.9 | |||||||||||||
| Administrative expenses and amortizations | (971) | (0.1) | (1,943) | (4.1) | |||||||||||||
| Net operating income | 945 | (9.9) | 1,994 | 6.4 | |||||||||||||
| Net loan-loss provisions | (416) | 6.3 | (807) | (25.6) | |||||||||||||
| Other gains (losses) and provisions | (144) | 4.0 | (283) | 1.7 | |||||||||||||
| Profit before tax | 385 | (25.9) | 904 | 76.7 | |||||||||||||
| Tax on profit | (98) | (36.6) | (252) | 56.0 | |||||||||||||
| Profit from continuing operations | 287 | (21.4) | 652 | 86.2 | |||||||||||||
| Net profit from discontinued operations | — | — | — | — | |||||||||||||
| Consolidated profit | 287 | (21.4) | 652 | 86.2 | |||||||||||||
| Non-controlling interests | — | (87.8) | — | (80.9) | |||||||||||||
| Underlying profit attributable to the parent | 287 | (21.4) | 652 | 86.1 | |||||||||||||
| Balance sheet | |||||||||||||||||
| Loans and advances to customers | 266,419 | 3.8 | 266,419 | 9.6 | |||||||||||||
| Cash, central banks and credit institutions | 148,909 | 6.5 | 148,909 | 22.7 | |||||||||||||
| Debt instruments | 31,648 | 0.7 | 31,648 | (18.4) | |||||||||||||
| Other financial assets | 42,115 | 3.1 | 42,115 | (8.3) | |||||||||||||
| Other asset accounts | 18,545 | 0.0 | 18,545 | (5.7) | |||||||||||||
| Total assets | 507,636 | 4.2 | 507,636 | 8.3 | |||||||||||||
| Customer deposits | 311,889 | 3.6 | 311,889 | 13.3 | |||||||||||||
| Central banks and credit institutions | 92,908 | 4.9 | 92,908 | 3.0 | |||||||||||||
| Marketable debt securities | 25,533 | (2.3) | 25,533 | (13.6) | |||||||||||||
| Other financial liabilities | 51,315 | 16.3 | 51,315 | 2.9 | |||||||||||||
| Other liabilities accounts | 5,974 | (0.5) | 5,974 | 21.2 | |||||||||||||
| Total liabilities | 487,620 | 4.6 | 487,620 | 8.4 | |||||||||||||
| Total equity | 20,017 | (6.0) | 20,017 | 5.0 | |||||||||||||
| Memorandum items: | |||||||||||||||||
Gross loans and advances to customers (2) | 253,429 | 2.3 | 253,429 | 7.0 | |||||||||||||
| Customer funds | 376,818 | 1.8 | 376,818 | 8.5 | |||||||||||||
Customer deposits (3) | 302,690 | 3.2 | 302,690 | 11.7 | |||||||||||||
| Mutual funds | 74,128 | (3.5) | 74,128 | (2.7) | |||||||||||||
| Ratios (%), operating means and customers | |||||||||||||||||
| Underlying RoTE | 5.77 | (1.60) | 6.62 | 2.70 | |||||||||||||
| Efficiency ratio | 50.7 | 2.6 | 49.4 | (2.6) | |||||||||||||
| NPL ratio | 3.83 | (0.64) | 3.83 | (1.33) | |||||||||||||
| Total coverage ratio | 49.4 | (1.0) | 49.4 | 3.7 | |||||||||||||
| Number of employees | 26,272 | 0.7 | 26,272 | 0.5 | |||||||||||||
| Number of branches | 1,921 | (1.5) | 1,921 | (1.5) | |||||||||||||
| Number of loyal customers (thousands) | 2,880 | 3.7 | 2,880 | 4.4 | |||||||||||||
| Number of digital customers (thousands) | 5,697 | 3.3 | 5,697 | 7.4 | |||||||||||||
(1) Includes exchange differences.
(2) Excluding reverse repos.
(3) Excluding repos.
January - June 2022 | | 57 | ||||||
| United Kingdom | |||||||||||||||||||||||
| EUR million | |||||||||||||||||||||||
| / | Q1'22 | / | H1'21 | ||||||||||||||||||||
| Underlying income statement | Q2'22 | % | % excl. FX | H1'22 | % | % excl. FX | |||||||||||||||||
| Net interest income | 1,227 | 2.9 | 4.3 | 2,418 | 16.5 | 13.1 | |||||||||||||||||
| Net fee income | 110 | 19.1 | 20.6 | 202 | (15.0) | (17.5) | |||||||||||||||||
Gains (losses) on financial transactions (1) | 6 | 10.9 | 12.3 | 12 | — | — | |||||||||||||||||
| Other operating income | — | — | — | 1 | 19.6 | 16.1 | |||||||||||||||||
| Total income | 1,342 | 4.0 | 5.4 | 2,633 | 14.6 | 11.2 | |||||||||||||||||
| Administrative expenses and amortizations | (677) | 0.8 | 2.1 | (1,348) | 3.8 | 0.7 | |||||||||||||||||
| Net operating income | 666 | 7.4 | 8.9 | 1,285 | 28.7 | 24.9 | |||||||||||||||||
| Net loan-loss provisions | (74) | 44.7 | 46.4 | (125) | — | — | |||||||||||||||||
| Other gains (losses) and provisions | (99) | 50.8 | 52.5 | (165) | 76.5 | 71.3 | |||||||||||||||||
| Profit before tax | 492 | (2.0) | (0.7) | 995 | 2.2 | (0.8) | |||||||||||||||||
| Tax on profit | (132) | 3.5 | 4.9 | (259) | (12.7) | (15.3) | |||||||||||||||||
| Profit from continuing operations | 361 | (3.9) | (2.6) | 736 | 8.8 | 5.6 | |||||||||||||||||
| Net profit from discontinued operations | — | — | — | — | — | — | |||||||||||||||||
| Consolidated profit | 361 | (3.9) | (2.6) | 736 | 8.8 | 5.6 | |||||||||||||||||
| Non-controlling interests | — | — | — | — | — | — | |||||||||||||||||
| Underlying profit attributable to the parent | 361 | (3.9) | (2.6) | 736 | 8.8 | 5.6 | |||||||||||||||||
| Balance sheet | |||||||||||||||||||||||
| Loans and advances to customers | 259,566 | (1.1) | 0.7 | 259,566 | (0.6) | (0.4) | |||||||||||||||||
| Cash, central banks and credit institutions | 65,291 | (4.6) | (2.8) | 65,291 | 4.0 | 4.2 | |||||||||||||||||
| Debt instruments | 6,178 | (6.5) | (4.9) | 6,178 | (25.5) | (25.4) | |||||||||||||||||
| Other financial assets | 575 | 29.8 | 32.1 | 575 | (37.0) | (36.9) | |||||||||||||||||
| Other asset accounts | 5,269 | (6.7) | (5.0) | 5,269 | (29.9) | (29.8) | |||||||||||||||||
| Total assets | 336,878 | (2.0) | (0.2) | 336,878 | (1.1) | (0.9) | |||||||||||||||||
| Customer deposits | 229,033 | (3.4) | (1.6) | 229,033 | (6.0) | (5.8) | |||||||||||||||||
| Central banks and credit institutions | 45,991 | 2.0 | 3.8 | 45,991 | 50.2 | 50.5 | |||||||||||||||||
| Marketable debt securities | 43,115 | 5.9 | 7.8 | 43,115 | (3.1) | (3.0) | |||||||||||||||||
| Other financial liabilities | 3,013 | (6.4) | (4.7) | 3,013 | 12.0 | 12.2 | |||||||||||||||||
| Other liabilities accounts | 1,911 | (4.3) | (2.6) | 1,911 | (48.3) | (48.2) | |||||||||||||||||
| Total liabilities | 323,063 | (1.5) | 0.3 | 323,063 | (0.6) | (0.5) | |||||||||||||||||
| Total equity | 13,815 | (11.3) | (9.7) | 13,815 | (10.8) | (10.6) | |||||||||||||||||
| Memorandum items: | |||||||||||||||||||||||
Gross loans and advances to customers (2) | 250,841 | (0.3) | 1.5 | 250,841 | 3.4 | 3.6 | |||||||||||||||||
| Customer funds | 228,556 | (2.4) | (0.7) | 228,556 | (3.1) | (2.9) | |||||||||||||||||
Customer deposits (3) | 220,998 | (2.1) | (0.3) | 220,998 | (2.7) | (2.6) | |||||||||||||||||
| Mutual funds | 7,557 | (11.4) | (9.8) | 7,557 | (12.0) | (11.9) | |||||||||||||||||
| Ratios (%), operating means and customers | |||||||||||||||||||||||
| Underlying RoTE | 10.66 | (0.21) | 10.78 | 0.38 | |||||||||||||||||||
| Efficiency ratio | 50.4 | (1.6) | 51.2 | (5.3) | |||||||||||||||||||
| NPL ratio | 1.17 | (0.26) | 1.17 | (0.13) | |||||||||||||||||||
| Total coverage ratio | 32.9 | 6.8 | 32.9 | (4.4) | |||||||||||||||||||
| Number of employees | 20,320 | 0.4 | 20,320 | (9.5) | |||||||||||||||||||
| Number of branches | 450 | — | 450 | (18.6) | |||||||||||||||||||
| Number of loyal customers (thousands) | 4,464 | 0.9 | 4,464 | 1.9 | |||||||||||||||||||
| Number of digital customers (thousands) | 6,765 | 0.3 | 6,765 | 5.8 | |||||||||||||||||||
(1) Includes exchange differences.
(2) Excluding reverse repos.
(3) Excluding repos.
| 58 | | January - June 2022 | ||||||
| Portugal | |||||||||||||||||
| EUR million | |||||||||||||||||
| / Q1'22 | / H1'21 | ||||||||||||||||
| Underlying income statement | Q2'22 | % | H1'22 | % | |||||||||||||
| Net interest income | 171 | 0.5 | 340 | (8.0) | |||||||||||||
| Net fee income | 123 | 0.6 | 245 | 16.8 | |||||||||||||
Gains (losses) on financial transactions (1) | 14 | (52.0) | 44 | (71.4) | |||||||||||||
| Other operating income | (27) | — | (16) | (6.9) | |||||||||||||
| Total income | 281 | (15.6) | 613 | (14.3) | |||||||||||||
| Administrative expenses and amortizations | (125) | (0.1) | (251) | (13.3) | |||||||||||||
| Net operating income | 155 | (25.1) | 363 | (15.0) | |||||||||||||
| Net loan-loss provisions | (3) | (61.8) | (11) | (84.4) | |||||||||||||
| Other gains (losses) and provisions | (40) | — | (24) | 1.0 | |||||||||||||
| Profit before tax | 112 | (47.7) | 327 | (1.7) | |||||||||||||
| Tax on profit | (35) | (47.7) | (101) | (2.0) | |||||||||||||
| Profit from continuing operations | 78 | (47.7) | 226 | (1.5) | |||||||||||||
| Net profit from discontinued operations | — | — | — | — | |||||||||||||
| Consolidated profit | 78 | (47.7) | 226 | (1.5) | |||||||||||||
| Non-controlling interests | — | (18.5) | (1) | 59.2 | |||||||||||||
| Underlying profit attributable to the parent | 77 | (47.8) | 225 | (1.6) | |||||||||||||
| Balance sheet | |||||||||||||||||
| Loans and advances to customers | 39,565 | 1.1 | 39,565 | 2.0 | |||||||||||||
| Cash, central banks and credit institutions | 11,725 | 16.9 | 11,725 | 34.4 | |||||||||||||
| Debt instruments | 7,986 | (6.5) | 7,986 | (11.5) | |||||||||||||
| Other financial assets | 1,391 | (3.0) | 1,391 | (4.3) | |||||||||||||
| Other asset accounts | 1,406 | 12.3 | 1,406 | 1.7 | |||||||||||||
| Total assets | 62,072 | 2.8 | 62,072 | 4.6 | |||||||||||||
| Customer deposits | 43,769 | 1.7 | 43,769 | 5.6 | |||||||||||||
| Central banks and credit institutions | 10,169 | 10.1 | 10,169 | 7.0 | |||||||||||||
| Marketable debt securities | 2,699 | 3.0 | 2,699 | 8.7 | |||||||||||||
| Other financial liabilities | 285 | 12.0 | 285 | 30.5 | |||||||||||||
| Other liabilities accounts | 1,327 | (7.2) | 1,327 | (21.6) | |||||||||||||
| Total liabilities | 58,249 | 3.0 | 58,249 | 5.2 | |||||||||||||
| Total equity | 3,823 | 0.5 | 3,823 | (5.0) | |||||||||||||
| Memorandum items: | |||||||||||||||||
Gross loans and advances to customers (2) | 40,564 | 1.1 | 40,564 | 1.8 | |||||||||||||
| Customer funds | 47,550 | 0.9 | 47,550 | 4.8 | |||||||||||||
Customer deposits (3) | 43,769 | 1.7 | 43,769 | 5.6 | |||||||||||||
| Mutual funds | 3,781 | (7.7) | 3,781 | (4.0) | |||||||||||||
| Ratios (%), operating means and customers | |||||||||||||||||
| Underlying RoTE | 8.32 | (6.67) | 11.73 | 0.29 | |||||||||||||
| Efficiency ratio | 44.6 | 7.0 | 40.9 | 0.5 | |||||||||||||
| NPL ratio | 3.33 | (0.09) | 3.33 | (0.37) | |||||||||||||
| Total coverage ratio | 74.3 | 1.4 | 74.3 | 1.3 | |||||||||||||
| Number of employees | 4,977 | (0.6) | 4,977 | (17.7) | |||||||||||||
| Number of branches | 386 | (0.8) | 386 | (7.7) | |||||||||||||
| Number of loyal customers (thousands) | 883 | 1.9 | 883 | 5.9 | |||||||||||||
| Number of digital customers (thousands) | 1,019 | — | 1,019 | 3.9 | |||||||||||||
(1) Includes exchange differences.
(2) Excluding reverse repos.
(3) Excluding repos.
January - June 2022 | | 59 | ||||||
| Poland | |||||||||||||||||||||||
| EUR million | |||||||||||||||||||||||
| / | Q1'22 | / | H1'21 | ||||||||||||||||||||
| Underlying income statement | Q2'22 | % | % excl. FX | H1'22 | % | % excl. FX | |||||||||||||||||
| Net interest income | 486 | 19.4 | 20.2 | 894 | 88.1 | 92.2 | |||||||||||||||||
| Net fee income | 130 | (5.7) | (5.1) | 268 | 5.8 | 8.1 | |||||||||||||||||
Gains (losses) on financial transactions (1) | 44 | 238.9 | 240.3 | 57 | 38.7 | 41.7 | |||||||||||||||||
| Other operating income | (81) | 70.6 | 71.5 | (129) | — | — | |||||||||||||||||
| Total income | 579 | 13.5 | 14.2 | 1,090 | 43.6 | 46.7 | |||||||||||||||||
| Administrative expenses and amortizations | (173) | 4.4 | 5.0 | (339) | 5.5 | 7.8 | |||||||||||||||||
| Net operating income | 406 | 17.8 | 18.6 | 751 | 71.5 | 75.2 | |||||||||||||||||
| Net loan-loss provisions | (138) | 117.4 | 118.4 | (202) | 78.0 | 81.8 | |||||||||||||||||
| Other gains (losses) and provisions | (60) | 31.6 | 32.4 | (106) | (46.6) | (45.5) | |||||||||||||||||
| Profit before tax | 208 | (11.7) | (11.1) | 444 | 250.4 | 257.9 | |||||||||||||||||
| Tax on profit | (66) | (4.1) | (3.5) | (135) | 116.5 | 121.1 | |||||||||||||||||
| Profit from continuing operations | 142 | (14.8) | (14.2) | 309 | 379.5 | 389.8 | |||||||||||||||||
| Net profit from discontinued operations | — | — | — | — | — | — | |||||||||||||||||
| Consolidated profit | 142 | (14.8) | (14.2) | 309 | 379.5 | 389.8 | |||||||||||||||||
| Non-controlling interests | (47) | (14.0) | (13.4) | (102) | 398.5 | 409.2 | |||||||||||||||||
| Underlying profit attributable to the parent | 95 | (15.2) | (14.6) | 207 | 370.7 | 380.8 | |||||||||||||||||
| Balance sheet | |||||||||||||||||||||||
| Loans and advances to customers | 30,245 | 0.9 | 2.2 | 30,245 | 4.7 | 8.9 | |||||||||||||||||
| Cash, central banks and credit institutions | 3,779 | 0.2 | 1.5 | 3,779 | 100.1 | 108.2 | |||||||||||||||||
| Debt instruments | 13,011 | (8.6) | (7.4) | 13,011 | (14.2) | (10.8) | |||||||||||||||||
| Other financial assets | 841 | 20.3 | 21.8 | 841 | 8.1 | 12.5 | |||||||||||||||||
| Other asset accounts | 1,714 | 7.6 | 8.9 | 1,714 | 33.2 | 38.6 | |||||||||||||||||
| Total assets | 49,591 | (1.3) | (0.1) | 49,591 | 3.3 | 7.5 | |||||||||||||||||
| Customer deposits | 36,558 | (3.6) | (2.4) | 36,558 | 1.5 | 5.6 | |||||||||||||||||
| Central banks and credit institutions | 4,644 | 10.0 | 11.4 | 4,644 | 103.1 | 111.4 | |||||||||||||||||
| Marketable debt securities | 782 | (15.4) | (14.3) | 782 | (68.3) | (67.0) | |||||||||||||||||
| Other financial liabilities | 1,160 | 10.6 | 11.9 | 1,160 | 37.4 | 42.9 | |||||||||||||||||
| Other liabilities accounts | 1,609 | 27.8 | 29.4 | 1,609 | 29.7 | 35.0 | |||||||||||||||||
| Total liabilities | 44,753 | (1.4) | (0.1) | 44,753 | 4.4 | 8.7 | |||||||||||||||||
| Total equity | 4,838 | (1.1) | 0.1 | 4,838 | (6.4) | (2.6) | |||||||||||||||||
| Memorandum items: | |||||||||||||||||||||||
Gross loans and advances to customers (2) | 30,972 | 0.4 | 1.7 | 30,972 | 3.6 | 7.8 | |||||||||||||||||
| Customer funds | 39,684 | (4.3) | (3.1) | 39,684 | (2.6) | 1.3 | |||||||||||||||||
Customer deposits (3) | 36,556 | (3.6) | (2.4) | 36,556 | 1.5 | 5.6 | |||||||||||||||||
| Mutual funds | 3,128 | (11.7) | (10.6) | 3,128 | (34.1) | (31.5) | |||||||||||||||||
| Ratios (%), operating means and customers | |||||||||||||||||||||||
| Underlying RoTE | 12.38 | (2.59) | 13.70 | 10.99 | |||||||||||||||||||
| Efficiency ratio | 29.9 | (2.6) | 31.1 | (11.2) | |||||||||||||||||||
| NPL ratio | 3.45 | (0.04) | 3.45 | (1.13) | |||||||||||||||||||
| Total coverage ratio | 76.0 | (2.5) | 76.0 | 3.6 | |||||||||||||||||||
| Number of employees | 10,468 | 1.5 | 10,468 | 0.2 | |||||||||||||||||||
| Number of branches | 413 | (1.7) | 413 | (12.3) | |||||||||||||||||||
| Number of loyal customers (thousands) | 2,307 | 1.6 | 2,307 | 6.5 | |||||||||||||||||||
| Number of digital customers (thousands) | 3,170 | 1.3 | 3,170 | 11.2 | |||||||||||||||||||
(1) Includes exchange differences.
(2) Excluding reverse repos.
(3) Excluding repos.
| 60 | | January - June 2022 | ||||||
| Other Europe | |||||||||||||||||||||||
| EUR million | |||||||||||||||||||||||
| / | Q1'22 | / | H1'21 | ||||||||||||||||||||
| Underlying income statement | Q2'22 | % | % excl. FX | H1'22 | % | % excl. FX | |||||||||||||||||
| Net interest income | 80 | 10.3 | 7.6 | 152 | 3.5 | (0.5) | |||||||||||||||||
| Net fee income | 69 | 23.1 | 19.7 | 126 | 58.2 | 47.0 | |||||||||||||||||
Gains (losses) on financial transactions (1) | 21 | 2.2 | (1.6) | 42 | 107.6 | 77.7 | |||||||||||||||||
| Other operating income | (12) | — | — | (12) | (29.0) | (32.2) | |||||||||||||||||
| Total income | 158 | 5.9 | 2.9 | 307 | 34.0 | 26.0 | |||||||||||||||||
| Administrative expenses and amortizations | (158) | 26.2 | 23.7 | (282) | 36.9 | 30.8 | |||||||||||||||||
| Net operating income | 1 | (97.9) | — | 25 | 8.6 | (11.2) | |||||||||||||||||
| Net loan-loss provisions | (1) | (53.7) | (51.0) | (2) | (52.5) | (54.8) | |||||||||||||||||
| Other gains (losses) and provisions | 1 | — | — | — | (85.2) | (85.3) | |||||||||||||||||
| Profit before tax | 1 | (95.8) | (99.5) | 23 | 26.9 | (0.3) | |||||||||||||||||
| Tax on profit | (1) | (80.1) | (84.4) | (6) | (14.2) | (27.7) | |||||||||||||||||
| Profit from continuing operations | — | — | — | 17 | 52.6 | 15.0 | |||||||||||||||||
| Net profit from discontinued operations | — | — | — | — | — | — | |||||||||||||||||
| Consolidated profit | — | — | — | 17 | 52.6 | 15.0 | |||||||||||||||||
| Non-controlling interests | 1 | 614.0 | 614.0 | 1 | 199.4 | 197.7 | |||||||||||||||||
| Underlying profit attributable to the parent | 1 | (96.2) | (99.8) | 18 | 56.2 | 18.4 | |||||||||||||||||
| Balance sheet | |||||||||||||||||||||||
| Loans and advances to customers | 13,547 | (4.5) | (9.9) | 13,547 | 5.0 | (6.9) | |||||||||||||||||
| Cash, central banks and credit institutions | 4,640 | 36.2 | 29.4 | 4,640 | (23.1) | (32.0) | |||||||||||||||||
| Debt instruments | 7,310 | 7.1 | 6.3 | 7,310 | 18.2 | 16.8 | |||||||||||||||||
| Other financial assets | 2,125 | 83.7 | 73.1 | 2,125 | 572.7 | 379.6 | |||||||||||||||||
| Other asset accounts | 2,157 | (9.7) | (12.0) | 2,157 | (22.7) | (26.3) | |||||||||||||||||
| Total assets | 29,779 | 6.5 | 2.1 | 29,779 | 5.5 | (3.9) | |||||||||||||||||
| Customer deposits | 4,914 | 9.5 | 3.6 | 4,914 | 54.3 | 38.4 | |||||||||||||||||
| Central banks and credit institutions | 20,244 | 4.0 | — | 20,244 | (6.7) | (14.9) | |||||||||||||||||
| Marketable debt securities | — | — | — | — | — | 975.0 | |||||||||||||||||
| Other financial liabilities | 2,322 | 61.1 | 53.1 | 2,322 | 90.7 | 72.5 | |||||||||||||||||
| Other liabilities accounts | 330 | (25.2) | (25.4) | 330 | (19.1) | (19.6) | |||||||||||||||||
| Total liabilities | 27,809 | 7.6 | 3.2 | 27,809 | 4.9 | (4.4) | |||||||||||||||||
| Total equity | 1,970 | (7.7) | (11.8) | 1,970 | 14.6 | 3.1 | |||||||||||||||||
| Memorandum items: | |||||||||||||||||||||||
Gross loans and advances to customers (2) | 13,565 | (4.5) | (9.8) | 13,565 | 5.0 | (6.9) | |||||||||||||||||
| Customer funds | 12,803 | (3.7) | (5.5) | 12,803 | 5.1 | 2.1 | |||||||||||||||||
Customer deposits (3) | 4,740 | 10.0 | 3.9 | 4,740 | 57.5 | 40.4 | |||||||||||||||||
| Mutual funds | 8,063 | (10.2) | (10.2) | 8,063 | (12.1) | (12.1) | |||||||||||||||||
| Resources | |||||||||||||||||||||||
| Number of employees | 1,542 | 11.3 | 1,542 | 18.3 | |||||||||||||||||||
(1) Includes exchange differences.
(2) Excluding reverse repos.
(3) Excluding repos.
January - June 2022 | | 61 | ||||||
| NORTH AMERICA | |||||||||||||||||||||||
| EUR million | |||||||||||||||||||||||
| / | Q1'22 | / | H1'21 | ||||||||||||||||||||
| Underlying income statement | Q2'22 | % | % excl. FX | H1'22 | % | % excl. FX | |||||||||||||||||
| Net interest income | 2,352 | 10.3 | 4.0 | 4,483 | 13.5 | 3.1 | |||||||||||||||||
| Net fee income | 494 | 11.6 | 4.7 | 937 | 8.8 | (1.0) | |||||||||||||||||
Gains (losses) on financial transactions (1) | 39 | (51.2) | (55.3) | 120 | (7.4) | (15.9) | |||||||||||||||||
| Other operating income | 101 | (27.7) | (31.9) | 240 | (50.1) | (54.9) | |||||||||||||||||
| Total income | 2,986 | 6.9 | 0.6 | 5,780 | 6.6 | (3.2) | |||||||||||||||||
| Administrative expenses and amortizations | (1,432) | 13.7 | 7.4 | (2,692) | 14.9 | 4.6 | |||||||||||||||||
| Net operating income | 1,554 | 1.2 | (5.0) | 3,088 | 0.3 | (9.1) | |||||||||||||||||
| Net loan-loss provisions | (524) | 19.3 | 12.5 | (962) | 63.6 | 48.8 | |||||||||||||||||
| Other gains (losses) and provisions | (19) | (57.4) | (62.0) | (65) | 442.9 | 396.7 | |||||||||||||||||
| Profit before tax | 1,011 | (3.8) | (9.8) | 2,061 | (16.9) | (24.7) | |||||||||||||||||
| Tax on profit | (229) | (2.9) | (8.9) | (464) | (22.8) | (30.0) | |||||||||||||||||
| Profit from continuing operations | 782 | (4.0) | (10.0) | 1,596 | (15.0) | (23.0) | |||||||||||||||||
| Net profit from discontinued operations | — | — | — | — | — | — | |||||||||||||||||
| Consolidated profit | 782 | (4.0) | (10.0) | 1,596 | (15.0) | (23.0) | |||||||||||||||||
| Non-controlling interests | (10) | 17.7 | 9.5 | (18) | (93.8) | (94.4) | |||||||||||||||||
| Underlying profit attributable to the parent | 772 | (4.3) | (10.2) | 1,578 | (0.2) | (9.7) | |||||||||||||||||
| Balance sheet | |||||||||||||||||||||||
| Loans and advances to customers | 163,729 | 12.3 | 5.9 | 163,729 | 29.6 | 14.6 | |||||||||||||||||
| Cash, central banks and credit institutions | 35,174 | (4.4) | (9.8) | 35,174 | (5.1) | (16.0) | |||||||||||||||||
| Debt instruments | 45,137 | 15.1 | 8.9 | 45,137 | 27.1 | 12.8 | |||||||||||||||||
| Other financial assets | 13,945 | 23.1 | 16.5 | 13,945 | 28.4 | 14.2 | |||||||||||||||||
| Other asset accounts | 23,878 | 8.4 | 2.2 | 23,878 | 14.0 | 0.8 | |||||||||||||||||
| Total assets | 281,862 | 10.4 | 4.2 | 281,862 | 22.1 | 8.1 | |||||||||||||||||
| Customer deposits | 154,450 | 10.7 | 4.4 | 154,450 | 34.2 | 18.7 | |||||||||||||||||
| Central banks and credit institutions | 31,023 | 9.8 | 3.9 | 31,023 | 1.1 | (10.4) | |||||||||||||||||
| Marketable debt securities | 40,708 | 6.3 | 0.2 | 40,708 | 6.3 | (6.1) | |||||||||||||||||
| Other financial liabilities | 20,813 | 38.0 | 30.8 | 20,813 | 46.5 | 30.4 | |||||||||||||||||
| Other liabilities accounts | 6,764 | 5.2 | (0.7) | 6,764 | 12.5 | (0.4) | |||||||||||||||||
| Total liabilities | 253,758 | 11.5 | 5.2 | 253,758 | 24.2 | 9.9 | |||||||||||||||||
| Total equity | 28,104 | 1.8 | (3.9) | 28,104 | 6.2 | (5.9) | |||||||||||||||||
| Memorandum items: | |||||||||||||||||||||||
Gross loans and advances to customers (2) | 151,578 | 7.2 | 1.1 | 151,578 | 20.6 | 6.7 | |||||||||||||||||
| Customer funds | 151,098 | 3.6 | (2.2) | 151,098 | 16.2 | 2.8 | |||||||||||||||||
Customer deposits (3) | 123,599 | 3.5 | (2.3) | 123,599 | 17.5 | 4.0 | |||||||||||||||||
| Mutual funds | 27,498 | 3.9 | (1.7) | 27,498 | 10.4 | (2.1) | |||||||||||||||||
| Ratios (%), operating means and customers | |||||||||||||||||||||||
| Underlying RoTE | 11.79 | (0.72) | 12.17 | (2.08) | |||||||||||||||||||
| Efficiency ratio | 48.0 | 2.9 | 46.6 | 3.4 | |||||||||||||||||||
| NPL ratio | 2.71 | (0.12) | 2.71 | 0.43 | |||||||||||||||||||
| Total coverage ratio | 111.4 | 0.9 | 111.4 | (40.9) | |||||||||||||||||||
| Number of employees | 43,779 | (0.2) | 43,779 | 5.1 | |||||||||||||||||||
| Number of branches | 1,859 | — | 1,859 | (3.2) | |||||||||||||||||||
| Number of loyal customers (thousands) | 4,477 | 2.6 | 4,477 | 8.3 | |||||||||||||||||||
| Number of digital customers (thousands) | 6,959 | 1.0 | 6,959 | 9.4 | |||||||||||||||||||
(1) Includes exchange differences.
(2) Excluding reverse repos.
(3) Excluding repos.
| 62 | | January - June 2022 | ||||||
| United States | |||||||||||||||||||||||
| EUR million | |||||||||||||||||||||||
| / | Q1'22 | / | H1'21 | ||||||||||||||||||||
| Underlying income statement | Q2'22 | % | % excl. FX | H1'22 | % | % excl. FX | |||||||||||||||||
| Net interest income | 1,499 | 8.8 | 3.3 | 2,877 | 10.2 | (0.1) | |||||||||||||||||
| Net fee income | 198 | 0.5 | (4.8) | 394 | (8.8) | (17.3) | |||||||||||||||||
Gains (losses) on financial transactions (1) | 31 | (53.7) | (57.5) | 98 | 9.2 | (1.0) | |||||||||||||||||
| Other operating income | 126 | (25.3) | (29.9) | 296 | (46.4) | (51.4) | |||||||||||||||||
| Total income | 1,854 | 2.4 | (3.0) | 3,665 | (0.5) | (9.8) | |||||||||||||||||
| Administrative expenses and amortizations | (883) | 10.7 | 5.2 | (1,682) | 9.8 | (0.5) | |||||||||||||||||
| Net operating income | 970 | (4.2) | (9.4) | 1,984 | (7.8) | (16.5) | |||||||||||||||||
| Net loan-loss provisions | (338) | 32.2 | 26.0 | (594) | 280.2 | 244.6 | |||||||||||||||||
| Other gains (losses) and provisions | 7 | — | — | (12) | — | — | |||||||||||||||||
| Profit before tax | 640 | (13.3) | (18.2) | 1,378 | (31.0) | (37.4) | |||||||||||||||||
| Tax on profit | (133) | (14.2) | (19.1) | (288) | (39.7) | (45.4) | |||||||||||||||||
| Profit from continuing operations | 507 | (13.1) | (18.0) | 1,090 | (28.2) | (34.9) | |||||||||||||||||
| Net profit from discontinued operations | — | — | — | — | — | — | |||||||||||||||||
| Consolidated profit | 507 | (13.1) | (18.0) | 1,090 | (28.2) | (34.9) | |||||||||||||||||
| Non-controlling interests | — | — | — | — | (100.0) | (100.0) | |||||||||||||||||
| Underlying profit attributable to the parent | 507 | (13.1) | (18.0) | 1,090 | (13.0) | (21.2) | |||||||||||||||||
| Balance sheet | |||||||||||||||||||||||
| Loans and advances to customers | 124,681 | 14.1 | 7.3 | 124,681 | 33.0 | 17.2 | |||||||||||||||||
| Cash, central banks and credit institutions | 21,368 | (9.0) | (14.4) | 21,368 | (16.0) | (26.0) | |||||||||||||||||
| Debt instruments | 22,276 | 32.4 | 24.5 | 22,276 | 39.9 | 23.2 | |||||||||||||||||
| Other financial assets | 5,859 | 22.3 | 15.0 | 5,859 | 63.8 | 44.3 | |||||||||||||||||
| Other asset accounts | 19,455 | 8.2 | 1.7 | 19,455 | 12.7 | (0.7) | |||||||||||||||||
| Total assets | 193,639 | 12.3 | 5.6 | 193,639 | 24.2 | 9.4 | |||||||||||||||||
| Customer deposits | 113,256 | 13.6 | 6.8 | 113,256 | 42.7 | 25.7 | |||||||||||||||||
| Central banks and credit institutions | 14,682 | 18.1 | 11.0 | 14,682 | (15.6) | (25.7) | |||||||||||||||||
| Marketable debt securities | 32,489 | 3.7 | (2.5) | 32,489 | 1.1 | (10.9) | |||||||||||||||||
| Other financial liabilities | 8,620 | 73.1 | 62.8 | 8,620 | 121.1 | 94.8 | |||||||||||||||||
| Other liabilities accounts | 4,450 | 1.9 | (4.2) | 4,450 | 14.7 | 1.0 | |||||||||||||||||
| Total liabilities | 173,497 | 13.6 | 6.8 | 173,497 | 26.9 | 11.8 | |||||||||||||||||
| Total equity | 20,142 | 2.9 | (3.3) | 20,142 | 4.7 | (7.8) | |||||||||||||||||
| Memorandum items: | |||||||||||||||||||||||
Gross loans and advances to customers (2) | 111,590 | 7.2 | 0.8 | 111,590 | 19.3 | 5.1 | |||||||||||||||||
| Customer funds | 101,521 | 3.0 | (3.1) | 101,521 | 16.4 | 2.5 | |||||||||||||||||
Customer deposits (3) | 88,015 | 3.6 | (2.6) | 88,015 | 18.8 | 4.7 | |||||||||||||||||
| Mutual funds | 13,506 | (0.7) | (6.6) | 13,506 | 2.7 | (9.5) | |||||||||||||||||
| Ratios (%), operating means and customers | |||||||||||||||||||||||
| Underlying RoTE | 10.49 | (1.95) | 11.50 | (3.95) | |||||||||||||||||||
| Efficiency ratio | 47.7 | 3.6 | 45.9 | 4.3 | |||||||||||||||||||
| NPL ratio | 2.64 | (0.11) | 2.64 | 0.64 | |||||||||||||||||||
| Total coverage ratio | 121.0 | (1.2) | 121.0 | (64.7) | |||||||||||||||||||
| Number of employees | 14,943 | (3.9) | 14,943 | (4.3) | |||||||||||||||||||
| Number of branches | 486 | (0.4) | 486 | (10.7) | |||||||||||||||||||
| Number of loyal customers (thousands) | 364 | 0.8 | 364 | (4.9) | |||||||||||||||||||
| Number of digital customers (thousands) | 1,031 | (1.2) | 1,031 | 0.6 | |||||||||||||||||||
(1) Includes exchange differences.
(2) Excluding reverse repos.
(3) Excluding repos.
January - June 2022 | | 63 | ||||||
| Mexico | |||||||||||||||||||||||
| EUR million | |||||||||||||||||||||||
| / | Q1'22 | / | H1'21 | ||||||||||||||||||||
| Underlying income statement | Q2'22 | % | % excl. FX | H1'22 | % | % excl. FX | |||||||||||||||||
| Net interest income | 853 | 13.3 | 5.3 | 1,606 | 20.0 | 9.3 | |||||||||||||||||
| Net fee income | 283 | 15.5 | 7.4 | 529 | 27.6 | 16.2 | |||||||||||||||||
Gains (losses) on financial transactions (1) | 9 | (32.1) | (38.4) | 22 | (45.8) | (50.7) | |||||||||||||||||
| Other operating income | (30) | 3.1 | (4.5) | (60) | (4.3) | (12.8) | |||||||||||||||||
| Total income | 1,115 | 13.6 | 5.6 | 2,096 | 21.2 | 10.3 | |||||||||||||||||
| Administrative expenses and amortizations | (498) | 15.2 | 7.1 | (930) | 23.7 | 12.6 | |||||||||||||||||
| Net operating income | 617 | 12.3 | 4.4 | 1,166 | 19.2 | 8.6 | |||||||||||||||||
| Net loan-loss provisions | (184) | 0.5 | (7.0) | (367) | (15.0) | (22.6) | |||||||||||||||||
| Other gains (losses) and provisions | (26) | (0.2) | (7.6) | (53) | 361.0 | 319.8 | |||||||||||||||||
| Profit before tax | 407 | 19.6 | 11.4 | 747 | 39.6 | 27.1 | |||||||||||||||||
| Tax on profit | (99) | 19.9 | 11.6 | (182) | 43.5 | 30.7 | |||||||||||||||||
| Profit from continuing operations | 308 | 19.5 | 11.3 | 565 | 38.4 | 26.0 | |||||||||||||||||
| Net profit from discontinued operations | — | — | — | — | — | — | |||||||||||||||||
| Consolidated profit | 308 | 19.5 | 11.3 | 565 | 38.4 | 26.0 | |||||||||||||||||
| Non-controlling interests | (11) | 24.9 | 16.5 | (19) | (37.0) | (42.6) | |||||||||||||||||
| Underlying profit attributable to the parent | 297 | 19.3 | 11.1 | 546 | 44.5 | 31.6 | |||||||||||||||||
| Balance sheet | |||||||||||||||||||||||
| Loans and advances to customers | 39,007 | 6.8 | 1.5 | 39,007 | 19.6 | 6.8 | |||||||||||||||||
| Cash, central banks and credit institutions | 13,499 | 2.7 | (2.3) | 13,499 | 18.2 | 5.6 | |||||||||||||||||
| Debt instruments | 22,860 | 2.1 | (2.9) | 22,860 | 16.7 | 4.3 | |||||||||||||||||
| Other financial assets | 7,915 | 21.1 | 15.1 | 7,915 | 8.6 | (2.9) | |||||||||||||||||
| Other asset accounts | 4,179 | 10.6 | 5.2 | 4,179 | 21.9 | 8.9 | |||||||||||||||||
| Total assets | 87,459 | 6.2 | 1.0 | 87,459 | 17.6 | 5.1 | |||||||||||||||||
| Customer deposits | 41,011 | 2.9 | (2.2) | 41,011 | 14.8 | 2.6 | |||||||||||||||||
| Central banks and credit institutions | 16,211 | 2.8 | (2.2) | 16,211 | 22.2 | 9.2 | |||||||||||||||||
| Marketable debt securities | 8,219 | 17.9 | 12.2 | 8,219 | 33.3 | 19.1 | |||||||||||||||||
| Other financial liabilities | 12,026 | 19.5 | 13.6 | 12,026 | 17.2 | 4.7 | |||||||||||||||||
| Other liabilities accounts | 2,262 | 10.7 | 5.3 | 2,262 | 7.2 | (4.3) | |||||||||||||||||
| Total liabilities | 79,729 | 6.7 | 1.5 | 79,729 | 18.1 | 5.5 | |||||||||||||||||
| Total equity | 7,730 | 0.7 | (4.2) | 7,730 | 13.3 | 1.2 | |||||||||||||||||
| Memorandum items: | |||||||||||||||||||||||
Gross loans and advances to customers (2) | 39,943 | 7.2 | 2.0 | 39,943 | 24.4 | 11.2 | |||||||||||||||||
| Customer funds | 49,393 | 4.4 | (0.7) | 49,393 | 15.2 | 2.9 | |||||||||||||||||
Customer deposits (3) | 35,401 | 2.8 | (2.2) | 35,401 | 13.8 | 1.7 | |||||||||||||||||
| Mutual funds | 13,992 | 8.8 | 3.5 | 13,992 | 18.9 | 6.2 | |||||||||||||||||
| Ratios (%), operating means and customers | |||||||||||||||||||||||
| Underlying RoTE | 16.83 | 2.12 | 15.81 | 2.79 | |||||||||||||||||||
| Efficiency ratio | 44.6 | 0.6 | 44.4 | 0.9 | |||||||||||||||||||
| NPL ratio | 2.95 | (0.14) | 2.95 | (0.15) | |||||||||||||||||||
| Total coverage ratio | 84.1 | 4.6 | 84.1 | (6.5) | |||||||||||||||||||
| Number of employees | 28,236 | 1.6 | 28,236 | 10.5 | |||||||||||||||||||
| Number of branches | 1,373 | 0.1 | 1,373 | (0.2) | |||||||||||||||||||
| Number of loyal customers (thousands) | 4,113 | 2.8 | 4,113 | 9.7 | |||||||||||||||||||
| Number of digital customers (thousands) | 5,762 | 1.7 | 5,762 | 11.6 | |||||||||||||||||||
(1) Includes exchange differences.
(2) Excluding reverse repos.
(3) Excluding repos.
| 64 | | January - June 2022 | ||||||
| Other North America | |||||||||||||||||||||||
| EUR million | |||||||||||||||||||||||
| / | Q1'22 | / | H1'21 | ||||||||||||||||||||
| Underlying income statement | Q2'22 | % | % excl. FX | H1'22 | % | % excl. FX | |||||||||||||||||
| Net interest income | — | — | — | — | 32.6 | 32.6 | |||||||||||||||||
| Net fee income | 13 | — | — | 14 | (1.9) | (1.9) | |||||||||||||||||
Gains (losses) on financial transactions (1) | — | — | — | 1 | 165.7 | 165.7 | |||||||||||||||||
| Other operating income | 5 | — | — | 4 | — | — | |||||||||||||||||
| Total income | 17 | 897.3 | 897.3 | 19 | 157.9 | 157.9 | |||||||||||||||||
| Administrative expenses and amortizations | (51) | 73.1 | 73.0 | (81) | 36.3 | 36.3 | |||||||||||||||||
| Net operating income | (34) | 21.6 | 21.5 | (62) | 18.9 | 18.9 | |||||||||||||||||
| Net loan-loss provisions | (1) | — | — | (1) | — | — | |||||||||||||||||
| Other gains (losses) and provisions | — | 899.8 | 899.8 | (1) | (15.9) | (15.9) | |||||||||||||||||
| Profit before tax | (36) | 28.5 | 28.4 | (64) | 21.2 | 21.2 | |||||||||||||||||
| Tax on profit | 3 | 66.0 | 65.1 | 5 | 84.4 | 84.4 | |||||||||||||||||
| Profit from continuing operations | (33) | 25.8 | 25.7 | (59) | 17.8 | 17.8 | |||||||||||||||||
| Net profit from discontinued operations | — | — | — | — | — | — | |||||||||||||||||
| Consolidated profit | (33) | 25.8 | 25.7 | (59) | 17.8 | 17.8 | |||||||||||||||||
| Non-controlling interests | 1 | 614.0 | 614.0 | 1 | 216.7 | 216.7 | |||||||||||||||||
| Underlying profit attributable to the parent | (32) | 23.5 | 23.4 | (58) | 16.8 | 16.8 | |||||||||||||||||
| Balance sheet | |||||||||||||||||||||||
| Loans and advances to customers | 41 | 526.5 | 526.5 | 41 | 129.2 | 129.2 | |||||||||||||||||
| Cash, central banks and credit institutions | 308 | 61.3 | 61.3 | 308 | 43.9 | 43.9 | |||||||||||||||||
| Debt instruments | — | — | — | — | — | — | |||||||||||||||||
| Other financial assets | 171 | — | — | 171 | — | — | |||||||||||||||||
| Other asset accounts | 243 | (8.8) | (8.8) | 243 | (8.4) | (8.4) | |||||||||||||||||
| Total assets | 764 | 64.4 | 64.4 | 764 | 53.1 | 53.1 | |||||||||||||||||
| Customer deposits | 184 | — | — | 184 | — | — | |||||||||||||||||
| Central banks and credit institutions | 130 | 144.5 | 144.4 | 130 | 706.9 | 706.9 | |||||||||||||||||
| Marketable debt securities | — | — | — | — | — | — | |||||||||||||||||
| Other financial liabilities | 167 | 424.0 | 424.0 | 167 | 260.5 | 260.5 | |||||||||||||||||
| Other liabilities accounts | 51 | 164.0 | 164.0 | 51 | 126.9 | 126.9 | |||||||||||||||||
| Total liabilities | 532 | 357.9 | 357.8 | 532 | 457.5 | 457.5 | |||||||||||||||||
| Total equity | 232 | (33.4) | (33.4) | 232 | (42.5) | (42.5) | |||||||||||||||||
| Memorandum items: | |||||||||||||||||||||||
Gross loans and advances to customers (2) | 45 | 556.9 | 556.9 | 45 | 141.2 | 141.2 | |||||||||||||||||
| Customer funds | 184 | — | — | 184 | — | — | |||||||||||||||||
Customer deposits (3) | 184 | — | — | 184 | — | — | |||||||||||||||||
| Mutual funds | — | — | — | — | — | — | |||||||||||||||||
| Resources | |||||||||||||||||||||||
| Number of employees | 600 | 11.9 | 600 | 16.1 | |||||||||||||||||||
(1) Includes exchange differences.
(2) Excluding reverse repos.
(3) Excluding repos.
January - June 2022 | | 65 | ||||||
| SOUTH AMERICA | |||||||||||||||||||||||
| EUR million | |||||||||||||||||||||||
| / | Q1'22 | / | H1'21 | ||||||||||||||||||||
| Underlying income statement | Q2'22 | % | % excl. FX | H1'22 | % | % excl. FX | |||||||||||||||||
| Net interest income | 3,390 | 11.6 | 4.0 | 6,427 | 20.7 | 9.2 | |||||||||||||||||
| Net fee income | 1,162 | 14.8 | 6.9 | 2,175 | 22.9 | 10.0 | |||||||||||||||||
Gains (losses) on financial transactions (1) | 380 | 68.6 | 64.9 | 606 | 58.2 | 48.0 | |||||||||||||||||
| Other operating income | (195) | 142.6 | 183.4 | (275) | 56.9 | 64.8 | |||||||||||||||||
| Total income | 4,738 | 12.9 | 4.9 | 8,933 | 22.3 | 10.2 | |||||||||||||||||
| Administrative expenses and amortizations | (1,669) | 12.5 | 6.1 | (3,153) | 25.2 | 15.7 | |||||||||||||||||
| Net operating income | 3,069 | 13.2 | 4.3 | 5,780 | 20.8 | 7.4 | |||||||||||||||||
| Net loan-loss provisions | (1,335) | 33.6 | 22.9 | (2,333) | 56.4 | 37.8 | |||||||||||||||||
| Other gains (losses) and provisions | (130) | (13.8) | (19.2) | (281) | 49.7 | 40.0 | |||||||||||||||||
| Profit before tax | 1,604 | 2.7 | (5.4) | 3,165 | 1.9 | (9.3) | |||||||||||||||||
| Tax on profit | (389) | (23.6) | (31.8) | (897) | (24.7) | (34.6) | |||||||||||||||||
| Profit from continuing operations | 1,215 | 15.5 | 7.5 | 2,268 | 18.5 | 7.1 | |||||||||||||||||
| Net profit from discontinued operations | — | — | — | — | — | — | |||||||||||||||||
| Consolidated profit | 1,215 | 15.5 | 7.5 | 2,268 | 18.5 | 7.1 | |||||||||||||||||
| Non-controlling interests | (169) | 10.6 | 4.6 | (322) | 17.2 | 10.6 | |||||||||||||||||
| Underlying profit attributable to the parent | 1,046 | 16.3 | 7.9 | 1,946 | 18.7 | 6.6 | |||||||||||||||||
| Balance sheet | |||||||||||||||||||||||
| Loans and advances to customers | 140,767 | (0.9) | 4.6 | 140,767 | 12.8 | 11.0 | |||||||||||||||||
| Cash, central banks and credit institutions | 51,061 | 2.3 | 6.7 | 51,061 | 1.2 | (1.7) | |||||||||||||||||
| Debt instruments | 59,378 | (1.5) | 3.2 | 59,378 | 18.9 | 13.7 | |||||||||||||||||
| Other financial assets | 24,049 | 25.6 | 36.0 | 24,049 | 93.1 | 96.8 | |||||||||||||||||
| Other asset accounts | 18,746 | 3.0 | 7.9 | 18,746 | 15.4 | 11.3 | |||||||||||||||||
| Total assets | 294,001 | 1.5 | 6.9 | 294,001 | 15.8 | 13.1 | |||||||||||||||||
| Customer deposits | 134,690 | (1.3) | 3.6 | 134,690 | 8.2 | 5.7 | |||||||||||||||||
| Central banks and credit institutions | 47,517 | 4.5 | 10.1 | 47,517 | 6.2 | 3.2 | |||||||||||||||||
| Marketable debt securities | 32,457 | 1.5 | 7.5 | 32,457 | 41.3 | 40.6 | |||||||||||||||||
| Other financial liabilities | 45,501 | 9.7 | 16.2 | 45,501 | 43.4 | 39.7 | |||||||||||||||||
| Other liabilities accounts | 10,819 | 3.2 | 9.4 | 10,819 | 18.3 | 13.8 | |||||||||||||||||
| Total liabilities | 270,984 | 1.9 | 7.3 | 270,984 | 16.3 | 13.6 | |||||||||||||||||
| Total equity | 23,017 | (2.8) | 2.2 | 23,017 | 10.7 | 7.5 | |||||||||||||||||
| Memorandum items: | |||||||||||||||||||||||
Gross loans and advances to customers (2) | 147,965 | (0.7) | 4.8 | 147,965 | 13.8 | 11.9 | |||||||||||||||||
| Customer funds | 181,506 | (1.5) | 3.4 | 181,506 | 7.8 | 5.1 | |||||||||||||||||
Customer deposits (3) | 124,100 | — | 5.0 | 124,100 | 7.4 | 5.4 | |||||||||||||||||
| Mutual funds | 57,407 | (4.5) | (0.1) | 57,407 | 8.8 | 4.5 | |||||||||||||||||
| Ratios (%), operating means and customers | |||||||||||||||||||||||
| Underlying RoTE | 21.43 | 1.60 | 20.80 | 0.57 | |||||||||||||||||||
| Efficiency ratio | 35.2 | (0.2) | 35.3 | 0.8 | |||||||||||||||||||
| NPL ratio | 5.39 | 0.33 | 5.39 | 1.02 | |||||||||||||||||||
| Total coverage ratio | 86.9 | (5.3) | 86.9 | (11.2) | |||||||||||||||||||
| Number of employees | 75,588 | (0.3) | 75,588 | 12.5 | |||||||||||||||||||
| Number of branches | 3,786 | (0.4) | 3,786 | (0.1) | |||||||||||||||||||
| Number of loyal customers (thousands) | 11,147 | 1.7 | 11,147 | 15.7 | |||||||||||||||||||
| Number of digital customers (thousands) | 25,269 | 1.5 | 25,269 | 11.4 | |||||||||||||||||||
(1) Includes exchange differences.
(2) Excluding reverse repos.
(3) Excluding repos.
| 66 | | January - June 2022 | ||||||
| Brazil | |||||||||||||||||||||||
| EUR million | |||||||||||||||||||||||
| / | Q1'22 | / | H1'21 | ||||||||||||||||||||
| Underlying income statement | Q2'22 | % | % excl. FX | H1'22 | % | % excl. FX | |||||||||||||||||
| Net interest income | 2,279 | 6.4 | (4.9) | 4,421 | 19.6 | 2.1 | |||||||||||||||||
| Net fee income | 857 | 15.4 | 3.7 | 1,600 | 20.3 | 2.6 | |||||||||||||||||
Gains (losses) on financial transactions (1) | 245 | 171.6 | 151.3 | 335 | 63.3 | 39.3 | |||||||||||||||||
| Other operating income | (7) | — | — | 36 | — | — | |||||||||||||||||
| Total income | 3,374 | 11.8 | 0.2 | 6,393 | 23.0 | 4.9 | |||||||||||||||||
| Administrative expenses and amortizations | (1,022) | 9.9 | (1.6) | (1,951) | 29.9 | 10.8 | |||||||||||||||||
| Net operating income | 2,352 | 12.6 | 1.0 | 4,442 | 20.1 | 2.5 | |||||||||||||||||
| Net loan-loss provisions | (1,163) | 36.6 | 23.6 | (2,015) | 64.8 | 40.6 | |||||||||||||||||
| Other gains (losses) and provisions | (43) | (62.2) | (69.8) | (157) | 26.4 | 7.8 | |||||||||||||||||
| Profit before tax | 1,146 | 2.0 | (9.0) | 2,270 | (3.4) | (17.6) | |||||||||||||||||
| Tax on profit | (327) | (22.6) | (32.3) | (751) | (28.1) | (38.7) | |||||||||||||||||
| Profit from continuing operations | 819 | 16.9 | 5.1 | 1,519 | 16.3 | (0.8) | |||||||||||||||||
| Net profit from discontinued operations | — | — | — | — | — | — | |||||||||||||||||
| Consolidated profit | 819 | 16.9 | 5.1 | 1,519 | 16.3 | (0.8) | |||||||||||||||||
| Non-controlling interests | (81) | 11.4 | (0.2) | (154) | 20.4 | 2.7 | |||||||||||||||||
| Underlying profit attributable to the parent | 737 | 17.5 | 5.7 | 1,365 | 15.9 | (1.1) | |||||||||||||||||
| Balance sheet | |||||||||||||||||||||||
| Loans and advances to customers | 85,642 | (0.6) | 3.0 | 85,642 | 16.2 | 7.1 | |||||||||||||||||
| Cash, central banks and credit institutions | 37,700 | 4.6 | 8.4 | 37,700 | 15.5 | 6.4 | |||||||||||||||||
| Debt instruments | 41,215 | (6.7) | (3.3) | 41,215 | 9.4 | 0.8 | |||||||||||||||||
| Other financial assets | 8,344 | 3.5 | 7.3 | 8,344 | 40.0 | 29.0 | |||||||||||||||||
| Other asset accounts | 13,387 | 2.3 | 6.0 | 13,387 | 14.1 | 5.2 | |||||||||||||||||
| Total assets | 186,289 | (0.7) | 2.9 | 186,289 | 15.2 | 6.2 | |||||||||||||||||
| Customer deposits | 86,561 | (1.0) | 2.6 | 86,561 | 13.0 | 4.1 | |||||||||||||||||
| Central banks and credit institutions | 27,661 | (2.6) | 1.0 | 27,661 | (4.1) | (11.6) | |||||||||||||||||
| Marketable debt securities | 22,359 | 1.6 | 5.3 | 22,359 | 64.9 | 51.9 | |||||||||||||||||
| Other financial liabilities | 28,255 | (0.8) | 2.8 | 28,255 | 25.9 | 16.0 | |||||||||||||||||
| Other liabilities accounts | 6,084 | 4.6 | 8.5 | 6,084 | (8.4) | (15.6) | |||||||||||||||||
| Total liabilities | 170,920 | (0.7) | 2.9 | 170,920 | 15.4 | 6.3 | |||||||||||||||||
| Total equity | 15,369 | (0.4) | 3.3 | 15,369 | 13.1 | 4.2 | |||||||||||||||||
| Memorandum items: | |||||||||||||||||||||||
Gross loans and advances to customers (2) | 91,266 | (0.2) | 3.5 | 91,266 | 18.0 | 8.7 | |||||||||||||||||
| Customer funds | 121,810 | (0.6) | 3.0 | 121,810 | 11.4 | 2.7 | |||||||||||||||||
Customer deposits (3) | 76,693 | 1.9 | 5.6 | 76,693 | 13.2 | 4.3 | |||||||||||||||||
| Mutual funds | 45,118 | (4.5) | (1.0) | 45,118 | 8.6 | — | |||||||||||||||||
| Ratios (%), operating means and customers | |||||||||||||||||||||||
| Underlying RoTE | 21.93 | 0.95 | 21.46 | (0.61) | |||||||||||||||||||
| Efficiency ratio | 30.3 | (0.5) | 30.5 | 1.6 | |||||||||||||||||||
| NPL ratio | 6.34 | 0.66 | 6.34 | 1.79 | |||||||||||||||||||
| Total coverage ratio | 92.3 | (8.8) | 92.3 | (20.0) | |||||||||||||||||||
| Number of employees | 53,743 | (0.2) | 53,743 | 19.1 | |||||||||||||||||||
| Number of branches | 2,936 | (0.7) | 2,936 | (0.1) | |||||||||||||||||||
| Number of loyal customers (thousands) | 8,534 | 2.4 | 8,534 | 19.4 | |||||||||||||||||||
| Number of digital customers (thousands) | 19,847 | 1.1 | 19,847 | 13.6 | |||||||||||||||||||
(1) Includes exchange differences.
(2) Excluding reverse repos.
(3) Excluding repos.
January - June 2022 | | 67 | ||||||
| Chile | |||||||||||||||||||||||
| EUR million | |||||||||||||||||||||||
| / | Q1'22 | / | H1'21 | ||||||||||||||||||||
| Underlying income statement | Q2'22 | % | % excl. FX | H1'22 | % | % excl. FX | |||||||||||||||||
| Net interest income | 554 | 14.8 | 14.0 | 1,038 | 3.0 | 7.0 | |||||||||||||||||
| Net fee income | 110 | (2.1) | (2.8) | 222 | 16.4 | 21.0 | |||||||||||||||||
Gains (losses) on financial transactions (1) | 49 | (23.8) | (24.4) | 114 | 41.9 | 47.6 | |||||||||||||||||
| Other operating income | (7) | (33.2) | (33.8) | (17) | (40.4) | (38.0) | |||||||||||||||||
| Total income | 707 | 8.7 | 8.0 | 1,357 | 8.5 | 12.8 | |||||||||||||||||
| Administrative expenses and amortizations | (255) | 8.8 | 8.1 | (489) | 1.7 | 5.7 | |||||||||||||||||
| Net operating income | 452 | 8.7 | 8.0 | 868 | 12.7 | 17.2 | |||||||||||||||||
| Net loan-loss provisions | (110) | 16.4 | 15.6 | (205) | 12.8 | 17.3 | |||||||||||||||||
| Other gains (losses) and provisions | (19) | — | — | (17) | — | — | |||||||||||||||||
| Profit before tax | 323 | 0.2 | (0.5) | 646 | 9.2 | 13.5 | |||||||||||||||||
| Tax on profit | (31) | (43.9) | (44.5) | (86) | (31.0) | (28.3) | |||||||||||||||||
| Profit from continuing operations | 292 | 9.3 | 8.5 | 560 | 19.9 | 24.6 | |||||||||||||||||
| Net profit from discontinued operations | — | — | — | — | — | — | |||||||||||||||||
| Consolidated profit | 292 | 9.3 | 8.5 | 560 | 19.9 | 24.6 | |||||||||||||||||
| Non-controlling interests | (88) | 10.8 | 10.1 | (168) | 15.0 | 19.6 | |||||||||||||||||
| Underlying profit attributable to the parent | 204 | 8.6 | 7.9 | 391 | 22.1 | 26.9 | |||||||||||||||||
| Balance sheet | |||||||||||||||||||||||
| Loans and advances to customers | 39,247 | (6.4) | 4.9 | 39,247 | (1.7) | 11.6 | |||||||||||||||||
| Cash, central banks and credit institutions | 7,310 | (6.6) | 4.6 | 7,310 | (37.8) | (29.4) | |||||||||||||||||
| Debt instruments | 10,829 | 7.9 | 21.0 | 10,829 | 30.2 | 47.8 | |||||||||||||||||
| Other financial assets | 15,450 | 40.8 | 57.8 | 15,450 | 145.5 | 178.6 | |||||||||||||||||
| Other asset accounts | 3,401 | 9.6 | 22.8 | 3,401 | 18.0 | 33.8 | |||||||||||||||||
| Total assets | 76,237 | 3.2 | 15.6 | 76,237 | 10.2 | 25.1 | |||||||||||||||||
| Customer deposits | 28,014 | (10.7) | — | 28,014 | (15.9) | (4.6) | |||||||||||||||||
| Central banks and credit institutions | 14,432 | 18.5 | 32.8 | 14,432 | 23.7 | 40.4 | |||||||||||||||||
| Marketable debt securities | 9,445 | (0.4) | 11.6 | 9,445 | 4.0 | 18.0 | |||||||||||||||||
| Other financial liabilities | 15,991 | 34.2 | 50.4 | 15,991 | 87.8 | 113.2 | |||||||||||||||||
| Other liabilities accounts | 3,865 | 7.4 | 20.3 | 3,865 | 106.6 | 134.5 | |||||||||||||||||
| Total liabilities | 71,746 | 4.7 | 17.3 | 71,746 | 11.3 | 26.3 | |||||||||||||||||
| Total equity | 4,491 | (15.6) | (5.5) | 4,491 | (4.7) | 8.1 | |||||||||||||||||
| Memorandum items: | |||||||||||||||||||||||
Gross loans and advances to customers (2) | 40,389 | (6.4) | 4.9 | 40,389 | (1.8) | 11.4 | |||||||||||||||||
| Customer funds | 34,989 | (11.3) | (0.6) | 34,989 | (17.3) | (6.2) | |||||||||||||||||
Customer deposits (3) | 27,292 | (12.4) | (1.9) | 27,292 | (18.0) | (6.9) | |||||||||||||||||
| Mutual funds | 7,697 | (7.1) | 4.0 | 7,697 | (14.8) | (3.3) | |||||||||||||||||
| Ratios (%), operating means and customers | |||||||||||||||||||||||
| Underlying RoTE | 23.94 | 2.58 | 22.74 | 4.14 | |||||||||||||||||||
| Efficiency ratio | 36.1 | — | 36.0 | (2.4) | |||||||||||||||||||
| NPL ratio | 4.70 | (0.01) | 4.70 | 0.13 | |||||||||||||||||||
| Total coverage ratio | 60.4 | (0.4) | 60.4 | (3.5) | |||||||||||||||||||
| Number of employees | 9,921 | (3.1) | 9,921 | (6.7) | |||||||||||||||||||
| Number of branches | 306 | (2.5) | 306 | (7.8) | |||||||||||||||||||
| Number of loyal customers (thousands) | 816 | (1.8) | 816 | 5.0 | |||||||||||||||||||
| Number of digital customers (thousands) | 1,963 | (1.7) | 1,963 | 5.1 | |||||||||||||||||||
(1) Includes exchange differences.
(2) Excluding reverse repos.
(3) Excluding repos.
| 68 | | January - June 2022 | ||||||
| Argentina | |||||||||||||||||||||||
| EUR million | |||||||||||||||||||||||
| / | Q1'22 | / | H1'21 | ||||||||||||||||||||
| Underlying income statement | Q2'22 | % | % excl. FX | H1'22 | % | % excl. FX | |||||||||||||||||
| Net interest income | 432 | 44.1 | 58.9 | 732 | 67.4 | 92.9 | |||||||||||||||||
| Net fee income | 143 | 18.6 | 31.9 | 264 | 63.4 | 88.3 | |||||||||||||||||
Gains (losses) on financial transactions (1) | 63 | 20.5 | 33.9 | 115 | 75.2 | 101.8 | |||||||||||||||||
| Other operating income | (180) | 65.4 | 81.6 | (289) | 180.3 | 223.0 | |||||||||||||||||
| Total income | 458 | 25.8 | 39.6 | 821 | 46.4 | 68.7 | |||||||||||||||||
| Administrative expenses and amortizations | (260) | 20.1 | 33.5 | (477) | 36.5 | 57.3 | |||||||||||||||||
| Net operating income | 198 | 34.3 | 48.6 | 345 | 62.9 | 87.7 | |||||||||||||||||
| Net loan-loss provisions | (33) | (15.2) | (4.0) | (72) | 48.0 | 70.6 | |||||||||||||||||
| Other gains (losses) and provisions | (67) | 78.4 | 95.4 | (105) | 61.0 | 85.5 | |||||||||||||||||
| Profit before tax | 97 | 38.0 | 52.5 | 168 | 71.5 | 97.7 | |||||||||||||||||
| Tax on profit | (11) | 1.9 | 14.2 | (22) | — | — | |||||||||||||||||
| Profit from continuing operations | 86 | 44.6 | 59.5 | 146 | 36.6 | 57.4 | |||||||||||||||||
| Net profit from discontinued operations | — | — | — | — | — | — | |||||||||||||||||
| Consolidated profit | 86 | 44.6 | 59.5 | 146 | 36.6 | 57.4 | |||||||||||||||||
| Non-controlling interests | — | (8.7) | 3.0 | — | (42.1) | (33.3) | |||||||||||||||||
| Underlying profit attributable to the parent | 86 | 44.8 | 59.7 | 145 | 37.2 | 58.0 | |||||||||||||||||
| Balance sheet | |||||||||||||||||||||||
| Loans and advances to customers | 6,098 | 11.3 | 18.0 | 6,098 | 36.8 | 57.6 | |||||||||||||||||
| Cash, central banks and credit institutions | 3,615 | 30.1 | 38.0 | 3,615 | 12.7 | 29.9 | |||||||||||||||||
| Debt instruments | 4,511 | 4.6 | 11.0 | 4,511 | 106.2 | 137.6 | |||||||||||||||||
| Other financial assets | 35 | 15.6 | 22.6 | 35 | (54.9) | (48.0) | |||||||||||||||||
| Other asset accounts | 1,062 | 2.0 | 8.2 | 1,062 | 27.2 | 46.5 | |||||||||||||||||
| Total assets | 15,320 | 12.3 | 19.1 | 15,320 | 42.3 | 64.0 | |||||||||||||||||
| Customer deposits | 11,279 | 14.0 | 21.0 | 11,279 | 44.8 | 66.9 | |||||||||||||||||
| Central banks and credit institutions | 719 | 37.4 | 45.8 | 719 | (13.0) | 0.3 | |||||||||||||||||
| Marketable debt securities | 156 | (14.0) | (8.8) | 156 | 146.3 | 183.8 | |||||||||||||||||
| Other financial liabilities | 956 | 3.2 | 9.5 | 956 | 41.7 | 63.2 | |||||||||||||||||
| Other liabilities accounts | 400 | (31.7) | (27.5) | 400 | 27.5 | 46.9 | |||||||||||||||||
| Total liabilities | 13,510 | 11.6 | 18.4 | 13,510 | 39.8 | 61.1 | |||||||||||||||||
| Total equity | 1,810 | 17.9 | 25.1 | 1,810 | 64.5 | 89.5 | |||||||||||||||||
| Memorandum items: | |||||||||||||||||||||||
Gross loans and advances to customers (2) | 6,336 | 10.3 | 17.0 | 6,336 | 34.4 | 54.9 | |||||||||||||||||
| Customer funds | 14,822 | 10.9 | 17.7 | 14,822 | 49.8 | 72.6 | |||||||||||||||||
Customer deposits (3) | 11,279 | 14.0 | 21.0 | 11,279 | 44.8 | 66.9 | |||||||||||||||||
| Mutual funds | 3,543 | 2.1 | 8.3 | 3,543 | 67.9 | 93.5 | |||||||||||||||||
| Ratios (%), operating means and customers | |||||||||||||||||||||||
| Underlying RoTE | 23.13 | 4.80 | 20.93 | (2.67) | |||||||||||||||||||
| Efficiency ratio | 56.8 | (2.7) | 58.0 | (4.2) | |||||||||||||||||||
| NPL ratio | 2.48 | (0.73) | 2.48 | (0.86) | |||||||||||||||||||
| Total coverage ratio | 171.1 | 9.4 | 171.1 | 3.5 | |||||||||||||||||||
| Number of employees | 8,514 | (0.4) | 8,514 | (3.4) | |||||||||||||||||||
| Number of branches | 407 | — | 407 | (0.2) | |||||||||||||||||||
| Number of loyal customers (thousands) | 1,632 | 1.2 | 1,632 | 4.0 | |||||||||||||||||||
| Number of digital customers (thousands) | 2,850 | 7.4 | 2,850 | 4.9 | |||||||||||||||||||
(1) Includes exchange differences.
(2) Excluding reverse repos.
(3) Excluding repos.
January - June 2022 | | 69 | ||||||
| Other South America | |||||||||||||||||||||||
| EUR million | |||||||||||||||||||||||
| / | Q1'22 | / | H1'21 | ||||||||||||||||||||
| Underlying income statement | Q2'22 | % | % excl. FX | H1'22 | % | % excl. FX | |||||||||||||||||
| Net interest income | 125 | 12.2 | 2.3 | 236 | 27.4 | 14.3 | |||||||||||||||||
| Net fee income | 52 | 38.8 | 27.8 | 90 | 2.9 | (5.7) | |||||||||||||||||
Gains (losses) on financial transactions (1) | 23 | 25.0 | 16.6 | 41 | 31.4 | 21.1 | |||||||||||||||||
| Other operating income | (1) | (81.4) | (85.2) | (6) | (52.7) | (55.2) | |||||||||||||||||
| Total income | 199 | 22.6 | 12.3 | 362 | 23.7 | 11.8 | |||||||||||||||||
| Administrative expenses and amortizations | (132) | 27.4 | 19.8 | (236) | 27.3 | 18.5 | |||||||||||||||||
| Net operating income | 67 | 14.0 | (0.5) | 126 | 17.5 | 1.0 | |||||||||||||||||
| Net loan-loss provisions | (28) | 113.4 | 97.4 | (41) | 5.5 | (4.2) | |||||||||||||||||
| Other gains (losses) and provisions | (1) | 59.9 | 44.4 | (2) | 30.8 | 17.6 | |||||||||||||||||
| Profit before tax | 37 | (16.2) | (29.6) | 82 | 24.3 | 3.4 | |||||||||||||||||
| Tax on profit | (19) | (0.9) | (10.2) | (39) | 23.1 | 11.2 | |||||||||||||||||
| Profit from continuing operations | 18 | (28.1) | (44.0) | 43 | 25.4 | (2.8) | |||||||||||||||||
| Net profit from discontinued operations | — | — | — | — | — | — | |||||||||||||||||
| Consolidated profit | 18 | (28.1) | (44.0) | 43 | 25.4 | (2.8) | |||||||||||||||||
| Non-controlling interests | 1 | 553.5 | 550.5 | 1 | 171.3 | 167.1 | |||||||||||||||||
| Underlying profit attributable to the parent | 19 | (25.4) | (41.5) | 44 | 26.7 | (1.6) | |||||||||||||||||
| Balance sheet | |||||||||||||||||||||||
| Loans and advances to customers | 9,780 | 15.7 | 11.2 | 9,780 | 45.5 | 26.0 | |||||||||||||||||
| Cash, central banks and credit institutions | 2,436 | (25.5) | (30.1) | 2,436 | (14.6) | (28.4) | |||||||||||||||||
| Debt instruments | 2,823 | 58.4 | 48.4 | 2,823 | 58.5 | 33.6 | |||||||||||||||||
| Other financial assets | 220 | 186.6 | 180.5 | 220 | 72.6 | 58.4 | |||||||||||||||||
| Other asset accounts | 895 | (6.9) | (9.4) | 895 | 12.3 | 5.7 | |||||||||||||||||
| Total assets | 16,154 | 11.0 | 5.9 | 16,154 | 31.6 | 13.3 | |||||||||||||||||
| Customer deposits | 8,836 | 13.1 | 5.5 | 8,836 | 30.2 | 8.0 | |||||||||||||||||
| Central banks and credit institutions | 4,706 | 7.0 | 6.5 | 4,706 | 37.6 | 26.1 | |||||||||||||||||
| Marketable debt securities | 497 | 65.1 | 53.0 | 497 | 90.4 | 57.7 | |||||||||||||||||
| Other financial liabilities | 299 | 81.7 | 75.8 | 299 | 174.2 | 151.1 | |||||||||||||||||
| Other liabilities accounts | 470 | (3.1) | (8.3) | 470 | 46.1 | 24.9 | |||||||||||||||||
| Total liabilities | 14,807 | 12.5 | 7.3 | 14,807 | 35.9 | 16.4 | |||||||||||||||||
| Total equity | 1,347 | (2.8) | (7.0) | 1,347 | (2.4) | (12.3) | |||||||||||||||||
| Memorandum items: | |||||||||||||||||||||||
Gross loans and advances to customers (2) | 9,973 | 15.7 | 11.1 | 9,973 | 45.1 | 25.6 | |||||||||||||||||
| Customer funds | 9,885 | 10.9 | 3.1 | 9,885 | 44.7 | 20.0 | |||||||||||||||||
Customer deposits (3) | 8,836 | 13.1 | 5.5 | 8,836 | 30.2 | 8.0 | |||||||||||||||||
| Mutual funds | 1,049 | (4.8) | (13.3) | 1,049 | — | — | |||||||||||||||||
| Resources | |||||||||||||||||||||||
| Number of employees | 3,410 | 8.8 | 3,410 | 29.1 | |||||||||||||||||||
(1) Includes exchange differences.
(2) Excluding reverse repos.
(3) Excluding repos.
| 70 | | January - June 2022 | ||||||
| DIGITAL CONSUMER BANK | |||||||||||||||||||||||
| EUR million | |||||||||||||||||||||||
| / | Q1'22 | / | H1'21 | ||||||||||||||||||||
| Underlying income statement | Q2'22 | % | % excl. FX | H1'22 | % | % excl. FX | |||||||||||||||||
| Net interest income | 1,012 | (0.7) | (0.5) | 2,032 | 1.1 | 0.6 | |||||||||||||||||
| Net fee income | 219 | 6.1 | 6.2 | 425 | 7.5 | 7.5 | |||||||||||||||||
Gains (losses) on financial transactions (1) | 18 | — | — | 18 | 96.8 | 96.0 | |||||||||||||||||
| Other operating income | 12 | (86.1) | (85.9) | 98 | 37.6 | 31.7 | |||||||||||||||||
| Total income | 1,261 | (3.9) | (3.6) | 2,573 | 3.5 | 3.0 | |||||||||||||||||
| Administrative expenses and amortizations | (603) | (6.5) | (6.3) | (1,248) | 2.8 | 2.5 | |||||||||||||||||
| Net operating income | 658 | (1.3) | (1.1) | 1,325 | 4.2 | 3.4 | |||||||||||||||||
| Net loan-loss provisions | (139) | (5.9) | (5.8) | (287) | (6.8) | (7.0) | |||||||||||||||||
| Other gains (losses) and provisions | (11) | (36.3) | (36.1) | (28) | (62.9) | (62.6) | |||||||||||||||||
| Profit before tax | 508 | 1.3 | 1.5 | 1,010 | 13.7 | 12.5 | |||||||||||||||||
| Tax on profit | (122) | 10.8 | 11.0 | (233) | 1.6 | 1.2 | |||||||||||||||||
| Profit from continuing operations | 385 | (1.4) | (1.2) | 777 | 17.9 | 16.5 | |||||||||||||||||
| Net profit from discontinued operations | — | — | — | — | — | — | |||||||||||||||||
| Consolidated profit | 385 | (1.4) | (1.2) | 777 | 17.9 | 16.5 | |||||||||||||||||
| Non-controlling interests | (96) | (12.5) | (12.3) | (205) | 18.1 | 17.8 | |||||||||||||||||
| Underlying profit attributable to the parent | 290 | 2.8 | 3.2 | 572 | 17.9 | 16.0 | |||||||||||||||||
| Balance sheet | |||||||||||||||||||||||
| Loans and advances to customers | 116,796 | 2.3 | 3.2 | 116,796 | 3.6 | 3.9 | |||||||||||||||||
| Cash, central banks and credit institutions | 14,484 | (17.8) | (17.1) | 14,484 | (16.0) | (15.8) | |||||||||||||||||
| Debt instruments | 7,830 | 48.0 | 49.0 | 7,830 | 36.5 | 37.2 | |||||||||||||||||
| Other financial assets | 134 | 34.3 | 35.0 | 134 | 223.5 | 224.3 | |||||||||||||||||
| Other asset accounts | 7,627 | 4.0 | 4.5 | 7,627 | 17.7 | 17.6 | |||||||||||||||||
| Total assets | 146,871 | 1.6 | 2.5 | 146,871 | 3.3 | 3.5 | |||||||||||||||||
| Customer deposits | 57,556 | 1.1 | 2.0 | 57,556 | 6.5 | 6.8 | |||||||||||||||||
| Central banks and credit institutions | 39,369 | 6.7 | 7.8 | 39,369 | 6.8 | 6.9 | |||||||||||||||||
| Marketable debt securities | 31,043 | (3.0) | (2.2) | 31,043 | (8.0) | (7.8) | |||||||||||||||||
| Other financial liabilities | 1,687 | 9.8 | 10.5 | 1,687 | 16.0 | 16.3 | |||||||||||||||||
| Other liabilities accounts | 4,632 | 3.6 | 4.2 | 4,632 | 10.1 | 10.3 | |||||||||||||||||
| Total liabilities | 134,286 | 1.9 | 2.7 | 134,286 | 3.1 | 3.3 | |||||||||||||||||
| Total equity | 12,584 | (1.1) | 0.3 | 12,584 | 5.4 | 5.9 | |||||||||||||||||
| Memorandum items: | |||||||||||||||||||||||
Gross loans and advances to customers (2) | 119,348 | 2.2 | 3.2 | 119,348 | 3.3 | 3.6 | |||||||||||||||||
| Customer funds | 59,765 | 0.8 | 1.6 | 59,765 | 6.4 | 6.7 | |||||||||||||||||
Customer deposits (3) | 57,556 | 1.1 | 2.0 | 57,556 | 6.5 | 6.8 | |||||||||||||||||
| Mutual funds | 2,209 | (7.3) | (7.3) | 2,209 | 2.8 | 2.8 | |||||||||||||||||
| Ratios (%), operating means and customers | |||||||||||||||||||||||
| Underlying RoTE | 11.39 | (1.21) | 11.99 | 1.65 | |||||||||||||||||||
| Efficiency ratio | 47.8 | (1.4) | 48.5 | (0.3) | |||||||||||||||||||
| NPL ratio | 2.22 | (0.04) | 2.22 | 0.05 | |||||||||||||||||||
| Total coverage ratio | 97.4 | (1.9) | 97.4 | (14.4) | |||||||||||||||||||
| Number of employees | 15,894 | 0.2 | 15,894 | 0.4 | |||||||||||||||||||
| Number of branches | 370 | (0.3) | 370 | 17.8 | |||||||||||||||||||
| Number of total customers (thousands) | 19,388 | 1.1 | 19,388 | (0.2) | |||||||||||||||||||
(1) Includes exchange differences.
(2) Excluding reverse repos.
(3) Excluding repos.
January - June 2022 | | 71 | ||||||
| CORPORATE CENTRE | |||||||||||||||||||||||
| EUR million | |||||||||||||||||||||||
| Underlying income statement | Q2'22 | Q1'22 | % | H1'22 | H1'21 | % | |||||||||||||||||
| Net interest income | (181) | (172) | 5.0 | (353) | (297) | 18.9 | |||||||||||||||||
| Net fee income | 2 | (3) | — | (1) | (13) | (92.8) | |||||||||||||||||
Gains (losses) on financial transactions (1) | (253) | (119) | 113.0 | (371) | (96) | 288.4 | |||||||||||||||||
| Other operating income | (15) | (7) | 108.9 | (22) | (12) | 82.6 | |||||||||||||||||
| Total income | (446) | (301) | 48.1 | (747) | (418) | 78.8 | |||||||||||||||||
| Administrative expenses and amortizations | (92) | (87) | 6.0 | (179) | (160) | 12.3 | |||||||||||||||||
| Net operating income | (538) | (388) | 38.7 | (926) | (577) | 60.4 | |||||||||||||||||
| Net loan-loss provisions | (4) | (1) | 268.2 | (5) | (163) | (96.7) | |||||||||||||||||
| Other gains (losses) and provisions | (34) | (48) | (28.2) | (82) | (66) | 25.0 | |||||||||||||||||
| Profit before tax | (577) | (437) | 32.0 | (1,014) | (806) | 25.8 | |||||||||||||||||
| Tax on profit | (1) | (25) | (96.7) | (26) | (5) | 434.9 | |||||||||||||||||
| Profit from continuing operations | (577) | (462) | 24.9 | (1,040) | (811) | 28.2 | |||||||||||||||||
| Net profit from discontinued operations | — | — | — | — | — | — | |||||||||||||||||
| Consolidated profit | (577) | (462) | 24.9 | (1,040) | (811) | 28.2 | |||||||||||||||||
| Non-controlling interests | — | — | — | — | (1) | (98.6) | |||||||||||||||||
| Underlying profit attributable to the parent | (577) | (462) | 25.0 | (1,040) | (812) | 28.1 | |||||||||||||||||
| Balance sheet | |||||||||||||||||||||||
| Loans and advances to customers | 7,087 | 6,901 | 2.7 | 7,087 | 5,832 | 21.5 | |||||||||||||||||
| Cash, central banks and credit institutions | 108,644 | 87,582 | 24.0 | 108,644 | 71,908 | 51.1 | |||||||||||||||||
| Debt instruments | 6,928 | 5,000 | 38.6 | 6,928 | 1,605 | 331.7 | |||||||||||||||||
| Other financial assets | 522 | 2,261 | (76.9) | 522 | 2,016 | (74.1) | |||||||||||||||||
| Other asset accounts | 129,429 | 132,306 | (2.2) | 129,429 | 118,374 | 9.3 | |||||||||||||||||
| Total assets | 252,610 | 234,051 | 7.9 | 252,610 | 199,736 | 26.5 | |||||||||||||||||
| Customer deposits | 928 | 1,193 | (22.2) | 928 | 1,017 | (8.8) | |||||||||||||||||
| Central banks and credit institutions | 69,730 | 57,936 | 20.4 | 69,730 | 38,664 | 80.3 | |||||||||||||||||
| Marketable debt securities | 84,309 | 75,134 | 12.2 | 84,309 | 69,217 | 21.8 | |||||||||||||||||
| Other financial liabilities | 287 | 947 | (69.7) | 287 | 534 | (46.3) | |||||||||||||||||
| Other liabilities accounts | 9,063 | 8,162 | 11.0 | 9,063 | 8,009 | 13.2 | |||||||||||||||||
| Total liabilities | 164,317 | 143,371 | 14.6 | 164,317 | 117,441 | 39.9 | |||||||||||||||||
| Total equity | 88,292 | 90,679 | (2.6) | 88,292 | 82,295 | 7.3 | |||||||||||||||||
| Memorandum items: | |||||||||||||||||||||||
Gross loans and advances to customers (2) | 7,172 | 6,962 | 3.0 | 7,172 | 6,138 | 16.9 | |||||||||||||||||
| Customer funds | 928 | 1,193 | (22.2) | 928 | 1,021 | (9.2) | |||||||||||||||||
Customer deposits (3) | 928 | 1,193 | (22.2) | 928 | 1,017 | (8.8) | |||||||||||||||||
| Mutual funds | — | — | — | — | 4 | (100.0) | |||||||||||||||||
| Resources | |||||||||||||||||||||||
| Number of employees | 1,811 | 1,747 | 3.7 | 1,811 | 1,743 | 3.9 | |||||||||||||||||
(1) Includes exchange differences.
(2) Excluding reverse repos.
(3) Excluding repos.
| 72 | | January - June 2022 | ||||||
| RETAIL BANKING | |||||||||||||||||||||||
| EUR million | |||||||||||||||||||||||
| / | Q1'22 | / | H1'21 | ||||||||||||||||||||
| Underlying income statement | Q2'22 | % | % excl. FX | H1'22 | % | % excl. FX | |||||||||||||||||
| Net interest income | 8,620 | 6.5 | 2.6 | 16,714 | 12.5 | 5.7 | |||||||||||||||||
| Net fee income | 1,975 | 8.8 | 4.9 | 3,791 | 8.7 | 2.6 | |||||||||||||||||
Gains (losses) on financial transactions (1) | 153 | 189.2 | 210.0 | 206 | (46.5) | (48.2) | |||||||||||||||||
| Other operating income | (208) | — | — | (76) | — | — | |||||||||||||||||
| Total income | 10,541 | 4.4 | 0.5 | 20,635 | 8.6 | 2.0 | |||||||||||||||||
| Administrative expenses and amortizations | (4,626) | 5.1 | 2.2 | (9,025) | 7.9 | 2.9 | |||||||||||||||||
| Net operating income | 5,915 | 3.9 | (0.8) | 11,610 | 9.2 | 1.3 | |||||||||||||||||
| Net loan-loss provisions | (2,621) | 24.2 | 17.8 | (4,732) | 34.9 | 25.8 | |||||||||||||||||
| Other gains (losses) and provisions | (456) | 7.2 | 4.8 | (881) | 3.4 | 1.2 | |||||||||||||||||
| Profit before tax | 2,838 | (10.2) | (14.0) | 5,997 | (4.4) | (12.2) | |||||||||||||||||
| Tax on profit | (650) | (23.3) | (27.6) | (1,499) | (26.0) | (32.8) | |||||||||||||||||
| Profit from continuing operations | 2,188 | (5.3) | (9.0) | 4,499 | 5.9 | (2.1) | |||||||||||||||||
| Net profit from discontinued operations | — | — | — | — | — | — | |||||||||||||||||
| Consolidated profit | 2,188 | (5.3) | (9.0) | 4,499 | 5.9 | (2.1) | |||||||||||||||||
| Non-controlling interests | (251) | (1.6) | (3.9) | (507) | (24.3) | (28.6) | |||||||||||||||||
| Underlying profit attributable to the parent | 1,936 | (5.8) | (9.7) | 3,991 | 11.6 | 2.7 | |||||||||||||||||
(1) Includes exchange differences.
| CORPORATE & INVESTMENT BANKING | |||||||||||||||||||||||
| EUR million | |||||||||||||||||||||||
| / | Q1'22 | / | H1'21 | ||||||||||||||||||||
| Underlying income statement | Q2'22 | % | % excl. FX | H1'22 | % | % excl. FX | |||||||||||||||||
| Net interest income | 928 | 18.1 | 14.5 | 1,714 | 21.8 | 16.4 | |||||||||||||||||
| Net fee income | 506 | (3.0) | (5.9) | 1,027 | 15.5 | 9.9 | |||||||||||||||||
Gains (losses) on financial transactions (1) | 429 | 1.5 | (2.3) | 851 | 55.9 | 48.4 | |||||||||||||||||
| Other operating income | (13) | — | — | 20 | (25.8) | (19.8) | |||||||||||||||||
| Total income | 1,849 | 4.9 | 1.4 | 3,612 | 25.9 | 20.2 | |||||||||||||||||
| Administrative expenses and amortizations | (673) | 9.5 | 6.5 | (1,289) | 16.6 | 11.9 | |||||||||||||||||
| Net operating income | 1,176 | 2.5 | (1.3) | 2,324 | 31.7 | 25.4 | |||||||||||||||||
| Net loan-loss provisions | 10 | (25.3) | (26.8) | 23 | — | — | |||||||||||||||||
| Other gains (losses) and provisions | (36) | 93.1 | 89.4 | (55) | 630.1 | — | |||||||||||||||||
| Profit before tax | 1,149 | 0.7 | (3.1) | 2,291 | 35.7 | 28.5 | |||||||||||||||||
| Tax on profit | (325) | (1.1) | (6.1) | (654) | 37.6 | 27.9 | |||||||||||||||||
| Profit from continuing operations | 824 | 1.4 | (1.8) | 1,637 | 35.0 | 28.7 | |||||||||||||||||
| Net profit from discontinued operations | — | — | — | — | — | — | |||||||||||||||||
| Consolidated profit | 824 | 1.4 | (1.8) | 1,637 | 35.0 | 28.7 | |||||||||||||||||
| Non-controlling interests | (52) | (2.6) | (6.9) | (106) | 45.7 | 34.2 | |||||||||||||||||
| Underlying profit attributable to the parent | 772 | 1.7 | (1.4) | 1,531 | 34.3 | 28.4 | |||||||||||||||||
(1) Includes exchange differences.
January - June 2022 | | 73 | ||||||
| WEALTH MANAGEMENT & INSURANCE | |||||||||||||||||||||||
| EUR million | |||||||||||||||||||||||
| / | Q1'22 | / | H1'21 | ||||||||||||||||||||
| Underlying income statement | Q2'22 | % | % excl. FX | H1'22 | % | % excl. FX | |||||||||||||||||
| Net interest income | 184 | 26.4 | 23.8 | 329 | 44.3 | 39.0 | |||||||||||||||||
| Net fee income | 334 | 4.0 | 1.6 | 655 | 9.9 | 5.2 | |||||||||||||||||
Gains (losses) on financial transactions (1) | 29 | (4.0) | (5.9) | 58 | (1.7) | (4.7) | |||||||||||||||||
| Other operating income | 89 | (1.7) | (6.4) | 179 | (0.5) | (3.3) | |||||||||||||||||
| Total income | 635 | 8.3 | 5.4 | 1,222 | 14.9 | 10.5 | |||||||||||||||||
| Administrative expenses and amortizations | (252) | 3.1 | 0.2 | (496) | 10.5 | 5.5 | |||||||||||||||||
| Net operating income | 384 | 12.0 | 9.2 | 726 | 18.1 | 14.2 | |||||||||||||||||
| Net loan-loss provisions | (9) | — | — | (8) | (14.5) | (13.8) | |||||||||||||||||
| Other gains (losses) and provisions | (8) | 66.6 | 64.2 | (13) | 103.9 | 106.2 | |||||||||||||||||
| Profit before tax | 367 | 8.5 | 5.7 | 705 | 17.7 | 13.7 | |||||||||||||||||
| Tax on profit | (81) | 3.4 | 1.3 | (159) | 9.9 | 6.7 | |||||||||||||||||
| Profit from continuing operations | 286 | 10.1 | 7.0 | 546 | 20.2 | 15.9 | |||||||||||||||||
| Net profit from discontinued operations | — | — | — | — | — | — | |||||||||||||||||
| Consolidated profit | 286 | 10.1 | 7.0 | 546 | 20.2 | 15.9 | |||||||||||||||||
| Non-controlling interests | (16) | 6.1 | 2.4 | (30) | 41.2 | 35.7 | |||||||||||||||||
| Underlying profit attributable to the parent | 270 | 10.3 | 7.3 | 515 | 19.2 | 14.9 | |||||||||||||||||
(1) Includes exchange differences.
| PAGONXT | |||||||||||||||||||||||
| EUR million | |||||||||||||||||||||||
| / | Q1'22 | / | H1'21 | ||||||||||||||||||||
| Underlying income statement | Q2'22 | % | % excl. FX | H1'22 | % | % excl. FX | |||||||||||||||||
| Net interest income | 3 | 85.6 | 72.1 | 5 | — | — | |||||||||||||||||
| Net fee income | 222 | 41.2 | 30.9 | 379 | 82.0 | 63.3 | |||||||||||||||||
Gains (losses) on financial transactions (1) | (2) | — | — | (1) | — | — | |||||||||||||||||
| Other operating income | 13 | 501.1 | 446.2 | 15 | — | — | |||||||||||||||||
| Total income | 236 | 45.6 | 35.0 | 398 | 110.1 | 86.8 | |||||||||||||||||
| Administrative expenses and amortizations | (258) | 35.6 | 30.5 | (447) | 50.2 | 42.9 | |||||||||||||||||
| Net operating income | (22) | (22.2) | (0.3) | (50) | (54.3) | (50.5) | |||||||||||||||||
| Net loan-loss provisions | (9) | 222.5 | 198.9 | (11) | 142.2 | 107.2 | |||||||||||||||||
| Other gains (losses) and provisions | (3) | 171.4 | 153.4 | (4) | (28.6) | (31.6) | |||||||||||||||||
| Profit before tax | (33) | 4.6 | 24.8 | (64) | (45.5) | (41.8) | |||||||||||||||||
| Tax on profit | (15) | (28.7) | (39.3) | (36) | 278.7 | 180.4 | |||||||||||||||||
| Profit from continuing operations | (48) | (8.8) | (3.4) | (101) | (21.2) | (18.6) | |||||||||||||||||
| Net profit from discontinued operations | — | — | — | — | — | — | |||||||||||||||||
| Consolidated profit | (48) | (8.8) | (3.4) | (101) | (21.2) | (18.6) | |||||||||||||||||
| Non-controlling interests | (2) | 44.2 | 24.9 | (3) | — | — | |||||||||||||||||
| Underlying profit attributable to the parent | (50) | (7.6) | (2.7) | (104) | (18.5) | (15.8) | |||||||||||||||||
(1) Includes exchange differences.
| 74 | | January - June 2022 | ||||||
| ALTERNATIVE PERFORMANCE MEASURES (APMs) | ||||||||
In addition to the financial information prepared under IFRS, this consolidated directors’ report contains financial measures that constitute alternative performance measures (‘APMs’) to comply with the guidelines on alternative performance measures issued by the European Securities and Markets Authority on 5 October 2015 and non-IFRS measures.
The financial measures contained in this consolidated directors’ report that qualify as APMs and non-IFRS measures have been calculated using the financial information from Santander but are not defined or detailed in the applicable financial information framework or under IFRS and have neither been audited nor reviewed by our auditors.
We use these APMs and non-IFRS measures when planning, monitoring and evaluating our performance. We consider these APMs and non-IFRS financial measures to be useful metrics for management and investors to facilitate operating performance comparisons from period to period. While we believe that these APMs and non-IFRS financial measures are useful in evaluating our business, this information should be considered as supplemental in nature and is not meant as a substitute of IFRS measures. In addition, the way in which Santander defines and calculates these
APMs and non-IFRS measures may differ from the calculations and by other companies with similar measures and, therefore, may not be comparable.
The APMs and non-IFRS measures we use in this document can be categorised as follows:
Underlying results
In addition to IFRS results measures, we present some results measures which are non-IFRS measures and which we refer to as underlying measures. These underlying measures allow in our view a better year-on-year comparability as they exclude items outside the ordinary performance of our business which are grouped in the non-IFRS line net capital gains and provisions and are further detailed on page 12 of this report.
In addition, in the section "Financial information by segments", relative to the primary and secondary segments, results are presented on an underlying basis in accordance with IFRS 8, and reconciled on an aggregate basis to our IFRS consolidated results to the consolidated financial statements, which are set out below.
| Reconciliation of underlying results to statutory results | |||||||||||
| EUR million | |||||||||||
| January-June 2022 | |||||||||||
| Underlying results | Adjustments | Statutory results | |||||||||
| Net interest income | 18,409 | — | 18,409 | ||||||||
| Net fee income | 5,852 | — | 5,852 | ||||||||
Gains (losses) on financial transactions (1) | 743 | — | 743 | ||||||||
| Other operating income | 116 | — | 116 | ||||||||
| Total income | 25,120 | — | 25,120 | ||||||||
| Administrative expenses and amortizations | (11,435) | — | (11,435) | ||||||||
| Net operating income | 13,685 | — | 13,685 | ||||||||
| Net loan-loss provisions | (4,735) | — | (4,735) | ||||||||
| Other gains (losses) and provisions | (1,035) | — | (1,035) | ||||||||
| Profit before tax | 7,915 | — | 7,915 | ||||||||
| Tax on profit | (2,374) | — | (2,374) | ||||||||
| Profit from continuing operations | 5,541 | — | 5,541 | ||||||||
| Net profit from discontinued operations | — | — | — | ||||||||
| Consolidated profit | 5,541 | — | 5,541 | ||||||||
| Non-controlling interests | (647) | — | (647) | ||||||||
| Profit attributable to the parent | 4,894 | — | 4,894 | ||||||||
(1) Includes exchange differences.
January - June 2022 | | 75 | ||||||
| Reconciliation of underlying results to statutory results | |||||||||||
| EUR million | |||||||||||
| January-June 2021 | |||||||||||
| Underlying results | Adjustments | Statutory results | |||||||||
| Net interest income | 16,196 | — | 16,196 | ||||||||
| Net fee income | 5,169 | — | 5,169 | ||||||||
Gains (losses) on financial transactions (1) | 894 | — | 894 | ||||||||
| Other operating income | 436 | — | 436 | ||||||||
| Total income | 22,695 | — | 22,695 | ||||||||
| Administrative expenses and amortizations | (10,377) | — | (10,377) | ||||||||
| Net operating income | 12,318 | — | 12,318 | ||||||||
| Net loan-loss provisions | (3,753) | — | (3,753) | ||||||||
| Other gains (losses) and provisions | (937) | (714) | (1,651) | ||||||||
| Profit before tax | 7,628 | (714) | 6,914 | ||||||||
| Tax on profit | (2,658) | 184 | (2,474) | ||||||||
| Profit from continuing operations | 4,970 | (530) | 4,440 | ||||||||
| Net profit from discontinued operations | — | — | — | ||||||||
| Consolidated profit | 4,970 | (530) | 4,440 | ||||||||
| Non-controlling interests | (765) | — | (765) | ||||||||
| Profit attributable to the parent | 4,205 | (530) | 3,675 | ||||||||
(1) Includes exchange differences.
Explanation of adjustments:
Restructuring costs for a net impact of -EUR 530 million, mainly in the UK and Portugal.
| 76 | | January - June 2022 | ||||||
Profitability and efficiency ratios
The purpose of the profitability and efficiency ratios is to measure the ratio of profit to capital, to tangible capital, to assets and to risk weighted assets, while the efficiency ratio measures how much general administrative expenses (personnel and other) and amortization costs are needed to generate revenue.
Additionally, the goodwill adjustments have been removed from the RoTE numerator as, since they are not considered in the denominator, we believe this calculation is more correct.
| Ratio | Formula | Relevance of the metric | ||||||||||||
| RoE | Attributable profit to the parent | This ratio measures the return that shareholders obtain on the funds invested in the Bank and as such measures the company's ability to pay shareholders. | ||||||||||||
| (Return on equity) | Average stockholders’ equity 1 (excl. minority interests) | |||||||||||||
| Underlying RoE | Underlying attributable profit to the parent | This ratio measures the return that shareholders obtain on the funds invested in the Bank excluding items outside the ordinary performance of our business. | ||||||||||||
Average stockholders’ equity 1 (excl. minority interests) | ||||||||||||||
| RoTE | Attributable profit to the parent2 | This indicator is used to evaluate the profitability of the company as a percentage of its tangible equity. It's measured as the return that shareholders receive as a percentage of the funds invested in the entity less intangible assets. | ||||||||||||
| (Return on tangible equity) | Average stockholders' equity 1 (excl. minority interests) - intangible assets | |||||||||||||
| Underlying RoTE | Underlying attributable profit to the parent | This indicator measures the profitability of the tangible equity of a company arising from ordinary activities, i.e. excluding items outside the ordinary performance of our business. | ||||||||||||
Average stockholders' equity 1 (excl. minority interests) - intangible assets | ||||||||||||||
| RoA | Consolidated profit | This metric measures the profitability of a company as a percentage of its total assets. It is an indicator that reflects the efficiency of the company's total funds in generating profit. | ||||||||||||
| (Return on assets) | Average total assets | |||||||||||||
| Underlying RoA | Underlying consolidated profit | This metric measures the profitability of a company as a percentage of its total assets, excluding non-recurring results. It is an indicator that reflects the efficiency of the company's total funds in generating underlying profit. | ||||||||||||
| Average total assets | ||||||||||||||
| RoRWA | Consolidated profit | The return adjusted for risk is a derivative of the RoA metric. The difference is that RoRWA measures profit in relation to the bank's risk-weighted assets. | ||||||||||||
| (Return on risk weighted assets) | Average risk-weighted assets | |||||||||||||
| Underlying RoRWA | Underlying consolidated profit | This relates the consolidated profit (excluding items outside the ordinary performance of our business) to the bank's risk-weighted assets. | ||||||||||||
| Average risk-weighted assets | ||||||||||||||
| Efficiency ratio | Operating expenses 3 | One of the most commonly used indicators when comparing productivity of different financial entities. It measures the amount of funds used to generate the bank's total income. | ||||||||||||
| Total income | ||||||||||||||
1. Stockholders’ equity = Capital and Reserves + Accumulated other comprehensive income + Attributable profit to the parent + Dividends.
2. Excluding the adjustment to the valuation of goodwill.
3. Operating expenses = Administrative expenses + amortizations.
January - June 2022 | | 77 | ||||||
Profitability and efficiency (1) (2) (3) (4) | Q2'22 | Q1'22 | H1'22 | H1'21 | ||||||||||
| RoE | 10.44 | % | 11.49 | % | 10.98 | % | 9.53 | % | ||||||
| Attributable profit to the parent | 9,404 | 10,173 | 9,789 | 7,880 | ||||||||||
| Average stockholders' equity (excluding minority interests) | 90,035 | 88,532 | 89,125 | 82,669 | ||||||||||
| Underlying RoE | 10.44 | % | 11.49 | % | 10.98 | % | 10.17 | % | ||||||
| Attributable profit to the parent | 9,404 | 10,173 | 9,789 | 7,880 | ||||||||||
| (-) Net capital gains and provisions | — | — | — | -530 | ||||||||||
| Underlying attributable profit to the parent | 9,404 | 10,173 | 9,789 | 8,410 | ||||||||||
| Average stockholders' equity (excluding minority interests) | 90,035 | 88,532 | 89,125 | 82,669 | ||||||||||
| RoTE | 13.10 | % | 14.21 | % | 13.69 | % | 11.82 | % | ||||||
| Attributable profit to the parent | 9,404 | 10,173 | 9,789 | 7,880 | ||||||||||
| (+) Goodwill impairment | — | — | — | — | ||||||||||
| Attributable profit to the parent (excluding goodwill impairment) | 9,404 | 10,173 | 9,789 | 7,880 | ||||||||||
| Average stockholders' equity (excluding minority interests) | 90,035 | 88,532 | 89,125 | 82,669 | ||||||||||
| (-) Average intangible assets | 18,255 | 16,959 | 17,630 | 16,015 | ||||||||||
| Average stockholders' equity (excl. minority interests) - intangible assets | 71,780 | 71,573 | 71,495 | 66,654 | ||||||||||
| Underlying RoTE | 13.10 | % | 14.21 | % | 13.69 | % | 12.62 | % | ||||||
| Attributable profit to the parent | 9,404 | 10,173 | 9,789 | 7,880 | ||||||||||
| (-) Net capital gains and provisions | — | — | — | -530 | ||||||||||
| Underlying attributable profit to the parent | 9,404 | 10,173 | 9,789 | 8,410 | ||||||||||
| Average stockholders' equity (excl. minority interests) - intangible assets | 71,780 | 71,573 | 71,495 | 66,654 | ||||||||||
| RoA | 0.63 | % | 0.71 | % | 0.66 | % | 0.61 | % | ||||||
| Consolidated profit | 10,688 | 11,476 | 11,082 | 9,410 | ||||||||||
| Average total assets | 1,707,903 | 1,624,930 | 1,666,474 | 1,539,167 | ||||||||||
| Underlying RoA | 0.63 | % | 0.71 | % | 0.66 | % | 0.65 | % | ||||||
| Consolidated profit | 10,688 | 11,476 | 11,082 | 9,410 | ||||||||||
| (-) Net capital gains and provisions | — | — | — | -530 | ||||||||||
| Underlying consolidated profit | 10,688 | 11,476 | 11,082 | 9,940 | ||||||||||
| Average total assets | 1,707,903 | 1,624,930 | 1,666,474 | 1,539,167 | ||||||||||
| RoRWA | 1.76 | % | 1.95 | % | 1.86 | % | 1.66 | % | ||||||
| Consolidated profit | 10,688 | 11,476 | 11,082 | 9,410 | ||||||||||
| Average risk weighted-assets | 606,154 | 588,776 | 597,276 | 567,231 | ||||||||||
| Underlying RoRWA | 1.76 | % | 1.95 | % | 1.86 | % | 1.75 | % | ||||||
| Consolidated profit | 10,688 | 11,476 | 11,082 | 9,410 | ||||||||||
| (-) Net capital gains and provisions | — | — | — | -530 | ||||||||||
| Underlying consolidated profit | 10,688 | 11,476 | 11,082 | 9,940 | ||||||||||
| Average risk-weighted assets | 606,154 | 588,776 | 597,276 | 567,231 | ||||||||||
| Efficiency ratio | 46.0 | % | 45.0 | % | 45.5 | % | 45.7 | % | ||||||
| Underlying operating expenses | 5,900 | 5,535 | 11,435 | 10,377 | ||||||||||
| Operating expenses | 5,900 | 5,535 | 11,435 | 10,377 | ||||||||||
| Net capital gains and provisions impact in operating expenses | — | — | — | — | ||||||||||
| Underlying total income | 12,815 | 12,305 | 25,120 | 22,695 | ||||||||||
| Total income | 12,815 | 12,305 | 25,120 | 22,695 | ||||||||||
| Net capital gains and provisions impact on total income | — | — | — | — | ||||||||||
| (1) Averages included in the RoE, RoTE, RoA and RoRWA denominators are calculated using 4 months' worth of data in the case of quarterly figures (from March to June in Q2 and December to March in Q1) and 7 months in the case of annual figures (from December to June). | ||||||||||||||
| (2) For periods less than one year, and if there are results in the net capital gains and provisions line, the profit used to calculate RoE and RoTE is the annualized underlying attributable profit to which said results are added without annualizing. | ||||||||||||||
| (3) For periods less than one year, and if there are results in the net capital gains and provisions line, the profit used to calculate RoA and RoRWA is the annualized underlying consolidated profit, to which said results are added without annualizing. | ||||||||||||||
| (4) The risk weighted assets included in the denominator of the RoRWA metric are calculated in line with the criteria laid out in the CRR (Capital Requirements Regulation). | ||||||||||||||
| 78 | | January - June 2022 | ||||||
| Efficiency ratio | ||||||||||||||||||||
| H1'22 | H1'21 | |||||||||||||||||||
| % | Total income | Operating expenses | % | Total income | Operating expenses | |||||||||||||||
| Europe | 48.5 | 8,581 | 4,164 | 52.4 | 7,903 | 4,143 | ||||||||||||||
| Spain | 49.4 | 3,937 | 1,943 | 52.0 | 3,901 | 2,027 | ||||||||||||||
| United Kingdom | 51.2 | 2,633 | 1,348 | 56.5 | 2,298 | 1,299 | ||||||||||||||
| Portugal | 40.9 | 613 | 251 | 40.4 | 715 | 289 | ||||||||||||||
| Poland | 31.1 | 1,090 | 339 | 42.3 | 759 | 321 | ||||||||||||||
| North America | 46.6 | 5,780 | 2,692 | 43.2 | 5,421 | 2,343 | ||||||||||||||
| US | 45.9 | 3,665 | 1,682 | 41.6 | 3,684 | 1,531 | ||||||||||||||
| Mexico | 44.4 | 2,096 | 930 | 43.5 | 1,730 | 752 | ||||||||||||||
| South America | 35.3 | 8,933 | 3,153 | 34.5 | 7,303 | 2,518 | ||||||||||||||
| Brazil | 30.5 | 6,393 | 1,951 | 28.9 | 5,199 | 1,502 | ||||||||||||||
| Chile | 36.0 | 1,357 | 489 | 38.5 | 1,251 | 481 | ||||||||||||||
| Argentina | 58.0 | 821 | 477 | 62.3 | 561 | 349 | ||||||||||||||
| Digital Consumer Bank | 48.5 | 2,573 | 1,248 | 48.8 | 2,486 | 1,214 | ||||||||||||||
| Underlying RoTE | ||||||||||||||||||||
| H1'22 | H1'21 | |||||||||||||||||||
| % | Underlying profit attributable to the parent | Average stockholders' equity (excl. minority interests) - intangible assets | % | Underlying profit attributable to the parent | Average stockholders' equity (excl. minority interests) - intangible assets | |||||||||||||||
| Europe | 8.80 | 3,677 | 41,777 | 6.68 | 2,623 | 39,298 | ||||||||||||||
| Spain | 6.62 | 1,305 | 19,711 | 3.91 | 701 | 17,912 | ||||||||||||||
| United Kingdom | 10.78 | 1,472 | 13,649 | 10.40 | 1,353 | 13,011 | ||||||||||||||
| Portugal | 11.73 | 451 | 3,842 | 11.44 | 458 | 4,004 | ||||||||||||||
| Poland | 13.70 | 415 | 3,027 | 2.71 | 88 | 3,253 | ||||||||||||||
| North America | 12.17 | 3,156 | 25,935 | 14.25 | 3,162 | 22,199 | ||||||||||||||
| US | 11.50 | 2,180 | 18,952 | 15.46 | 2,506 | 16,216 | ||||||||||||||
| Mexico | 15.81 | 1,092 | 6,904 | 13.02 | 755 | 5,803 | ||||||||||||||
| South America | 20.80 | 3,891 | 18,712 | 20.22 | 3,278 | 16,210 | ||||||||||||||
| Brazil | 21.46 | 2,730 | 12,719 | 22.07 | 2,355 | 10,669 | ||||||||||||||
| Chile | 22.74 | 783 | 3,443 | 18.60 | 641 | 3,447 | ||||||||||||||
| Argentina | 20.93 | 291 | 1,389 | 23.60 | 212 | 898 | ||||||||||||||
| Digital Consumer Bank | 11.99 | 1,144 | 9,538 | 10.34 | 970 | 9,381 | ||||||||||||||
January - June 2022 | | 79 | ||||||
Credit risk indicators
The credit risk indicators measure the quality of the credit portfolio and the percentage of non-performing loans covered by provisions.
| Ratio | Formula | Relevance of the metric | ||||||||||||
NPL ratio (Non-performing loans) | Credit impaired loans and advances to customers, customer guarantees and customer commitments granted | The NPL ratio is an important variable regarding financial institutions' activity since it gives an indication of the level of risk the entities are exposed to. It calculates risks that are, in accounting terms, declared to be credit impaired as a percentage of the total outstanding amount of customer credit and contingent liabilities. | ||||||||||||
Total Risk 1 | ||||||||||||||
| Total coverage ratio | Total allowances to cover impairment losses on loans and advances to customers, customer guarantees and customer commitments granted | The total coverage ratio is a fundamental metric in the financial sector. It reflects the level of provisions as a percentage of the credit impaired assets. Therefore it is a good indicator of the entity's solvency against client defaults both present and future. | ||||||||||||
| Credit impaired loans and advances to customers, customer guarantees and customer commitments granted | ||||||||||||||
| Cost of risk | Allowances for loan-loss provisions over the last 12 months | This ratio quantifies loan-loss provisions arising from credit risk over a defined period of time for a given loan portfolio. As such, it acts as an indicator of credit quality. | ||||||||||||
| Average loans and advances to customers over the last 12 months | ||||||||||||||
(1) Total risk = Total loans and advances and guarantees to customers (including credit impaired assets) + contingent liabilities granted that are credit impaired
| Credit risk (I) | Jun-22 | Mar-22 | Jun-22 | Jun-21 | ||||||||||
| NPL ratio | 3.05 | % | 3.26 | % | 3.05 | % | 3.22 | % | ||||||
| Credit impaired loans and advances to customers, customer guarantees and customer commitments granted | 34,259 | 35,670 | 34,259 | 33,266 | ||||||||||
| Gross loans and advances to customers registered under the headings “financial assets measured at amortized cost” and "financial assets designated at fair value through profit or loss" classified in stage 3 (OCI), excluding POCI (Purchased or Originated Credit Impaired) that is currently impaired | 32,100 | 33,447 | 32,100 | 31,705 | ||||||||||
| POCI exposure (Purchased or Originated Credit Impaired) that is currently impaired | 303 | 334 | 303 | 431 | ||||||||||
| Customer guarantees and customer commitments granted classified in stage 3 | 1,846 | 1,879 | 1,846 | 1,122 | ||||||||||
| Doubtful exposure of loans and advances to customers at fair value through profit or loss | 10 | 10 | 10 | 8 | ||||||||||
| Total risk | 1,121,726 | 1,093,023 | 1,121,726 | 1,032,084 | ||||||||||
| Impaired and non-impaired gross loans and advances to customers | 1,061,172 | 1,035,523 | 1,061,172 | 978,096 | ||||||||||
| Impaired and non-impaired customer guarantees and customer commitments granted | 60,554 | 57,500 | 60,554 | 53,988 | ||||||||||
| 80 | | January - June 2022 | ||||||
| Credit risk (II) | Jun-22 | Mar-22 | Jun-22 | Jun-21 | ||||||||||
| Total coverage ratio | 71 | % | 69 | % | 71 | % | 73 | % | ||||||
| Total allowances to cover impairment losses on loans and advances to customers, customer guarantees and customer commitments granted | 24,195 | 24,778 | 24,195 | 24,239 | ||||||||||
| Total allowances to cover impairment losses on loans and advances to customers measured at amortized cost and designated at fair value through OCI | 23,452 | 24,025 | 23,452 | 23,577 | ||||||||||
| Total allowances to cover impairment losses on customer guarantees and customer commitments granted | 743 | 753 | 743 | 662 | ||||||||||
| Credit impaired loans and advances to customers, customer guarantees and customer commitments granted | 34,259 | 35,670 | 34,259 | 33,266 | ||||||||||
| Gross loans and advances to customers registered under the headings “financial assets measured at amortized cost” and "financial assets designated at fair value through profit or loss" classified in stage 3 (OCI), excluding POCI (Purchased or Originated Credit Impaired) that is currently impaired | 32,100 | 33,447 | 32,100 | 31,705 | ||||||||||
| POCI exposure (Purchased or Originated Credit Impaired) that is currently impaired | 303 | 334 | 303 | 431 | ||||||||||
| Customer guarantees and customer commitments granted classified in stage 3 | 1,846 | 1,879 | 1,846 | 1,122 | ||||||||||
| Doubtful exposure of loans and advances to customers at fair value through profit or loss | 10 | 10 | 10 | 8 | ||||||||||
| Cost of risk | 0.83 | % | 0.77 | % | 0.83 | % | 0.94 | % | ||||||
| Underlying allowances for loan-loss provisions over the last 12 months | 8,417 | 7,545 | 8,417 | 8,899 | ||||||||||
| Average loans and advances to customers over the last 12 months | 1,010,282 | 985,401 | 1,010,282 | 948,351 | ||||||||||
| NPL ratio | ||||||||||||||||||||
| H1'22 | H1'21 | |||||||||||||||||||
| % | Credit impaired loans and advances to customers, customer guarantees and customer commitments granted | Total risk | % | Credit impaired loans and advances to customers, customer guarantees and customer commitments granted | Total risk | |||||||||||||||
| Europe | 2.63 | 17,264 | 656,029 | 3.30 | 20,804 | 629,681 | ||||||||||||||
| Spain | 3.83 | 11,565 | 301,693 | 5.16 | 14,344 | 277,793 | ||||||||||||||
| United Kingdom | 1.17 | 3,046 | 261,116 | 1.30 | 3,424 | 263,318 | ||||||||||||||
| Portugal | 3.33 | 1,410 | 42,310 | 3.71 | 1,539 | 41,517 | ||||||||||||||
| Poland | 3.45 | 1,162 | 33,640 | 4.58 | 1,496 | 32,675 | ||||||||||||||
| North America | 2.71 | 4,811 | 177,452 | 2.28 | 3,149 | 137,802 | ||||||||||||||
| US | 2.64 | 3,551 | 134,761 | 2.00 | 2,043 | 102,175 | ||||||||||||||
| Mexico | 2.95 | 1,260 | 42,646 | 3.10 | 1,106 | 35,627 | ||||||||||||||
| South America | 5.39 | 8,720 | 161,884 | 4.36 | 6,215 | 142,500 | ||||||||||||||
| Brazil | 6.34 | 6,364 | 100,389 | 4.55 | 3,920 | 86,157 | ||||||||||||||
| Chile | 4.70 | 2,032 | 43,271 | 4.57 | 1,985 | 43,472 | ||||||||||||||
| Argentina | 2.48 | 159 | 6,422 | 3.34 | 158 | 4,728 | ||||||||||||||
| Digital Consumer Bank | 2.22 | 2,664 | 119,753 | 2.18 | 2,521 | 115,838 | ||||||||||||||
January - June 2022 | | 81 | ||||||
| Total coverage ratio | ||||||||||||||||||||
| H1'22 | H1'21 | |||||||||||||||||||
| % | Total allowances to cover impairment losses on loans and advances to customers, customer guarantees and customer commitments granted | Credit impaired loans and advances to customers, customer guarantees and customer commitments granted | % | Total allowances to cover impairment losses on loans and advances to customers, customer guarantees and customer commitments granted | Credit impaired loans and advances to customers, customer guarantees and customer commitments granted | |||||||||||||||
| Europe | 50.2 | 8,665 | 17,264 | 48.4 | 10,061 | 20,804 | ||||||||||||||
| Spain | 49.4 | 5,713 | 11,565 | 45.7 | 6,559 | 14,344 | ||||||||||||||
| United Kingdom | 32.9 | 1,004 | 3,046 | 37.4 | 1,280 | 3,424 | ||||||||||||||
| Portugal | 74.3 | 1,047 | 1,410 | 73.0 | 1,123 | 1,539 | ||||||||||||||
| Poland | 76.0 | 883 | 1,162 | 72.4 | 1,084 | 1,496 | ||||||||||||||
| North America | 111.4 | 5,362 | 4,811 | 152.3 | 4,796 | 3,149 | ||||||||||||||
| US | 121.0 | 4,298 | 3,551 | 185.7 | 3,794 | 2,043 | ||||||||||||||
| Mexico | 84.1 | 1,060 | 1,260 | 90.6 | 1,002 | 1,106 | ||||||||||||||
| South America | 86.9 | 7,580 | 8,720 | 98.1 | 6,098 | 6,215 | ||||||||||||||
| Brazil | 92.3 | 5,876 | 6,364 | 112.3 | 4,403 | 3,920 | ||||||||||||||
| Chile | 60.4 | 1,227 | 2,032 | 63.9 | 1,268 | 1,985 | ||||||||||||||
| Argentina | 171.1 | 272 | 159 | 167.6 | 265 | 158 | ||||||||||||||
| Digital Consumer Bank | 97.4 | 2,596 | 2,664 | 111.9 | 2,820 | 2,521 | ||||||||||||||
| Cost of risk | ||||||||||||||||||||
| H1'22 | H1'21 | |||||||||||||||||||
| % | Underlying allowances for loan-loss provisions over the last 12 months | Average loans and advances to customers over the last 12 months | % | Underlying allowances for loan-loss provisions over the last 12 months | Average loans and advances to customers over the last 12 months | |||||||||||||||
| Europe | 0.37 | 2,237 | 604,293 | 0.49 | 2,865 | 581,334 | ||||||||||||||
| Spain | 0.79 | 2,043 | 259,039 | 0.91 | 2,246 | 247,145 | ||||||||||||||
| United Kingdom | -0.02 | -52 | 249,120 | 0.09 | 208 | 243,289 | ||||||||||||||
| Portugal | -0.05 | -21 | 40,194 | 0.41 | 158 | 39,035 | ||||||||||||||
| Poland | 0.95 | 288 | 30,398 | 0.88 | 259 | 29,529 | ||||||||||||||
| North America | 1.09 | 1,584 | 145,667 | 1.67 | 2,136 | 127,577 | ||||||||||||||
| US | 0.78 | 856 | 110,316 | 1.34 | 1,289 | 96,047 | ||||||||||||||
| Mexico | 2.05 | 726 | 35,430 | 2.74 | 847 | 30,929 | ||||||||||||||
| South America | 2.97 | 4,092 | 137,575 | 2.51 | 2,981 | 118,697 | ||||||||||||||
| Brazil | 4.26 | 3,507 | 82,420 | 3.51 | 2,331 | 66,377 | ||||||||||||||
| Chile | 0.89 | 364 | 41,056 | 1.07 | 430 | 40,092 | ||||||||||||||
| Argentina | 3.07 | 164 | 5,324 | 3.94 | 142 | 3,614 | ||||||||||||||
| Digital Consumer Bank | 0.44 | 506 | 116,090 | 0.64 | 735 | 114,798 | ||||||||||||||
| 82 | | January - June 2022 | ||||||
Other indicators
The market capitalization indicator provides information on the volume of tangible equity per share. The loan-to-deposit ratio (LTD) identifies the relationship between net customer loans and advances and customer deposits, assessing the proportion of loans and advances granted by the Group that are funded by customer deposits.
The Group also uses gross customer loan magnitudes excluding reverse repurchase agreements (repos) and customer deposits excluding repos. In order to analyse the evolution of the traditional commercial banking business of granting loans and capturing deposits, repos and reverse repos are excluded, as they are mainly treasury business products and highly volatile.
| Ratio | Formula | Relevance of the metric | ||||||||||||
| TNAV per share | Tangible book value 1 | This is a very commonly used ratio used to measure the company's accounting value per share having deducted the intangible assets. It is useful in evaluating the amount each shareholder would receive if the company were to enter into liquidation and had to sell all the company's tangible assets. | ||||||||||||
| (Tangible equity net asset value per share) | Number of shares excluding treasury stock | |||||||||||||
| Price / tangible book value per share (X) | Share price | This is one of the most commonly used ratios by market participants for the valuation of listed companies both in absolute terms and relative to other entities. This ratio measures the relationship between the price paid for a company and its accounting equity value. | ||||||||||||
| TNAV per share | ||||||||||||||
| LTD ratio | Net loans and advances to customers | This is an indicator of the bank's liquidity. It measures the total (net) loans and advances to customers as a percentage of customer deposits. | ||||||||||||
| (Loan-to-deposit) | Customer deposits | |||||||||||||
| Loans and advances (excl. reverse repos) | Gross loans and advances to customers excluding reverse repos | In order to aid analysis of the commercial banking activity, reverse repos are excluded as they are highly volatile treasury products. | ||||||||||||
| Deposits (excl. repos) | Customer deposits excluding repos | In order to aid analysis of the commercial banking activity, repos are excluded as they are highly volatile treasury products. | ||||||||||||
| PAT + After tax fees paid to SAN (in Wealth Management & Insurance) | Net profit + fees paid from Santander Asset Management and Santander Insurance to Santander, net of taxes, excluding Private Banking customers | Metric to assess Wealth Management & Insurance's total contribution to Grupo Santander profit. | ||||||||||||
(1) Tangible book value = Stockholders' equity - intangible assets
| Others | Jun-22 | Mar-22 | Jun-22 | Jun-21 | ||||||||||
| TNAV (tangible book value) per share | 4.24 | 4.29 | 4.24 | 3.98 | ||||||||||
| Tangible book value | 71,162 | 72,940 | 71,162 | 68,917 | ||||||||||
| Number of shares excl. treasury stock (million) | 16,791 | 17,008 | 16,791 | 17,306 | ||||||||||
| Price / Tangible book value per share (X) | 0.63 | 0.72 | 0.63 | 0.81 | ||||||||||
| Share price (euros) | 2.688 | 3.100 | 2.688 | 3.220 | ||||||||||
| TNAV (tangible book value) per share | 4.24 | 4.29 | 4.24 | 3.98 | ||||||||||
| Loan-to-deposit ratio | 107 | % | 106 | % | 107 | % | 107 | % | ||||||
| Net loans and advances to customers | 1,037,721 | 1,011,497 | 1,037,721 | 954,518 | ||||||||||
| Customer deposits | 973,787 | 957,820 | 973,787 | 894,127 | ||||||||||
| Q2'22 | Q1'22 | H1'22 | H1'21 | |||||||||||
| PAT + After tax fees paid to SAN (in WM&I) (Constant EUR million) | 662 | 614 | 1,276 | 1,177 | ||||||||||
| Profit after tax | 282 | 264 | 546 | 471 | ||||||||||
| Net fee income net of tax | 380 | 350 | 730 | 706 | ||||||||||
January - June 2022 | | 83 | ||||||
Local currency measures
We make use of certain financial measures in local currency to help in the assessment of our ongoing operating performance. These non-IFRS financial measures include the results of operations of our subsidiary banks located outside the Eurozone, excluding the impact of foreign exchange. Because changes in foreign currency exchange rates do not have an operating impact on the results, we believe that evaluating their performance on a local currency basis provides an additional and meaningful assessment of performance to both management and the company’s investors.
The Group presents, at both the Group level as well as the business unit level, the real changes in the income statement as well as the changes excluding the exchange rate effect, as it considers the latter facilitates analysis, since it enables businesses movements to be identified without taking into account the impact of converting each local currency into euros.
Said variations, excluding the impact of exchange rate movements, are calculated by converting P&L lines for the different business units comprising the Group into our presentation currency, the euro, applying the average exchange rate for the first half of 2022 to all periods contemplated in the analysis.
The Group presents, at both the Group level as well as the business unit level, the changes in euros in the balance sheet as well as the changes excluding the exchange rate effect for loans and advances to customers excluding reverse repos and customer funds (which comprise deposits and mutual funds) excluding repos. As with the income statement, the reason is to facilitate analysis by isolating the changes in the balance sheet that are not caused by converting each local currency into euros.
These changes excluding the impact of exchange rate movements are calculated by converting loans and advances to customers excluding reverse repos and customer funds excluding repos, into our presentation currency, the euro, applying the closing exchange rate on the last working day of June 2022 to all periods contemplated in the analysis.
The average and period-end exchange rates for the main currencies in which the Group operates are set out in the table below.
| Exchange rates: 1 euro / currency parity | ||||||||||||||||||||
| Average (income statement) | Period-end (balance sheet) | |||||||||||||||||||
| H1'22 | H1'21 | Jun-22 | Mar-22 | Jun-21 | ||||||||||||||||
| US dollar | 1.092 | 1.205 | 1.045 | 1.111 | 1.186 | |||||||||||||||
| Pound sterling | 0.842 | 0.868 | 0.860 | 0.845 | 0.858 | |||||||||||||||
| Brazilian real | 5.527 | 6.480 | 5.473 | 5.280 | 5.941 | |||||||||||||||
| Mexican peso | 22.142 | 24.316 | 21.073 | 22.157 | 23.587 | |||||||||||||||
| Chilean peso | 902.582 | 868.037 | 979.495 | 874.158 | 863.161 | |||||||||||||||
| Argentine peso | 122.552 | 110.020 | 130.825 | 123.315 | 113.539 | |||||||||||||||
| Polish zloty | 4.634 | 4.537 | 4.702 | 4.644 | 4.519 | |||||||||||||||
| 84 | | January - June 2022 | ||||||
| Condensed consolidated financial statements | ||||||||||||||||||||||||||
| INTERIM CONDENSED CONSOLIDATED FINANCIAL STATEMENTS | ||||||||
•CONSOLIDATED BALANCE SHEET
•CONSOLIDATED INCOME STATEMENT
NOTE: The following financial information for the first six months of 2022 and 2021 (attached herewith) corresponds to the condensed consolidated financial statements prepared in accordance with the International Financial Reporting Standards.
| Interim condensed consolidated balance sheet | ||||||||||||||
| EUR million | ||||||||||||||
| ASSETS | Jun-22 | Dec-21 | Jun-21 | |||||||||||
| Cash, cash balances at central banks and other deposits on demand | 211,276 | 210,689 | 183,091 | |||||||||||
| Financial assets held for trading | 163,235 | 116,953 | 102,792 | |||||||||||
| Non-trading financial assets mandatorily at fair value through profit or loss | 5,845 | 5,536 | 4,838 | |||||||||||
| Financial assets designated at fair value through profit or loss | 11,025 | 15,957 | 56,486 | |||||||||||
| Financial assets at fair value through other comprehensive income | 91,998 | 108,038 | 114,505 | |||||||||||
| Financial assets at amortized cost | 1,129,690 | 1,037,898 | 1,003,417 | |||||||||||
| Hedging derivatives | 6,735 | 4,761 | 5,430 | |||||||||||
| Changes in the fair value of hedged items in portfolio hedges of interest risk | (1,769) | 410 | 1,434 | |||||||||||
| Investments | 7,665 | 7,525 | 7,562 | |||||||||||
| Joint ventures entities | 1,971 | 1,692 | 1,620 | |||||||||||
| Associated entities | 5,694 | 5,833 | 5,942 | |||||||||||
| Assets under insurance or reinsurance contracts | 310 | 283 | 276 | |||||||||||
| Tangible assets | 34,640 | 33,321 | 32,678 | |||||||||||
| Property, plant and equipment | 33,621 | 32,342 | 31,712 | |||||||||||
| For own-use | 13,513 | 13,259 | 12,921 | |||||||||||
| Leased out under an operating lease | 20,108 | 19,083 | 18,791 | |||||||||||
| Investment property | 1,019 | 979 | 966 | |||||||||||
| Of which : Leased out under an operating lease | 838 | 839 | 863 | |||||||||||
| Intangible assets | 18,349 | 16,584 | 16,454 | |||||||||||
| Goodwill | 13,877 | 12,713 | 12,854 | |||||||||||
| Other intangible assets | 4,472 | 3,871 | 3,600 | |||||||||||
| Tax assets | 29,025 | 25,196 | 24,707 | |||||||||||
| Current tax assets | 8,293 | 5,756 | 4,956 | |||||||||||
| Deferred tax assets | 20,732 | 19,440 | 19,751 | |||||||||||
| Other assets | 10,981 | 8,595 | 9,889 | |||||||||||
| Insurance contracts linked to pensions | 128 | 149 | 162 | |||||||||||
| Inventories | 7 | 6 | 5 | |||||||||||
| Other | 10,846 | 8,440 | 9,722 | |||||||||||
| Non-current assets held for sale | 3,835 | 4,089 | 5,077 | |||||||||||
| TOTAL ASSETS | 1,722,840 | 1,595,835 | 1,568,636 | |||||||||||
January - June 2022 | | 85 | ||||||
| Condensed consolidated financial statements | ||||||||||||||||||||||||||
| Interim condensed consolidated balance sheet | ||||||||||||||
| EUR million | ||||||||||||||
| LIABILITIES | Jun-22 | Dec-21 | Jun-21 | |||||||||||
| Financial liabilities held for trading | 114,406 | 79,469 | 68,982 | |||||||||||
| Financial liabilities designated at fair value through profit or loss | 40,823 | 32,733 | 54,131 | |||||||||||
| Financial liabilities at amortized cost | 1,427,721 | 1,349,169 | 1,310,433 | |||||||||||
| Hedging derivatives | 9,269 | 5,463 | 6,573 | |||||||||||
| Changes in the fair value of hedged items in portfolio hedges of interest rate risk | (94) | 248 | 427 | |||||||||||
| Liabilities under insurance or reinsurance contracts | 858 | 770 | 1,014 | |||||||||||
| Provisions | 8,590 | 9,583 | 10,400 | |||||||||||
| Pensions and other post-retirement obligations | 2,525 | 3,185 | 3,454 | |||||||||||
| Other long term employee benefits | 1,071 | 1,242 | 1,407 | |||||||||||
| Taxes and other legal contingencies | 2,242 | 1,996 | 2,169 | |||||||||||
| Contingent liabilities and commitments | 743 | 733 | 661 | |||||||||||
| Other provisions | 2,009 | 2,427 | 2,709 | |||||||||||
| Tax liabilities | 10,085 | 8,649 | 9,154 | |||||||||||
| Current tax liabilities | 2,853 | 2,187 | 2,711 | |||||||||||
| Deferred tax liabilities | 7,232 | 6,462 | 6,443 | |||||||||||
| Other liabilities | 13,720 | 12,698 | 11,777 | |||||||||||
| Liabilities associated with non-current assets held for sale | — | — | — | |||||||||||
| TOTAL LIABILITIES | 1,625,378 | 1,498,782 | 1,472,891 | |||||||||||
| EQUITY | ||||||||||||||
| Shareholders' equity | 122,037 | 119,649 | 117,552 | |||||||||||
| Capital | 8,397 | 8,670 | 8,670 | |||||||||||
| Called up paid capital | 8,397 | 8,670 | 8,670 | |||||||||||
| Unpaid capital which has been called up | — | — | — | |||||||||||
| Share premium | 46,273 | 47,979 | 47,979 | |||||||||||
| Equity instruments issued other than capital | 672 | 658 | 641 | |||||||||||
| Equity component of the compound financial instrument | — | — | — | |||||||||||
| Other equity instruments issued | 672 | 658 | 641 | |||||||||||
| Other equity | 151 | 152 | 165 | |||||||||||
| Accumulated retained earnings | 66,698 | 60,273 | 60,280 | |||||||||||
| Revaluation reserves | — | — | — | |||||||||||
| Other reserves | (5,038) | (4,477) | (3,762) | |||||||||||
| (-) Own shares | (10) | (894) | (96) | |||||||||||
| Profit attributable to shareholders of the parent | 4,894 | 8,124 | 3,675 | |||||||||||
| (-) Interim dividends | — | (836) | — | |||||||||||
| Other comprehensive income (loss) | (32,526) | (32,719) | (32,181) | |||||||||||
| Items not reclassified to profit or loss | (3,809) | (4,241) | (4,962) | |||||||||||
| Items that may be reclassified to profit or loss | (28,717) | (28,478) | (27,219) | |||||||||||
| Non-controlling interest | 7,951 | 10,123 | 10,374 | |||||||||||
| Other comprehensive income | (2,090) | (2,104) | (1,817) | |||||||||||
| Other items | 10,041 | 12,227 | 12,191 | |||||||||||
| TOTAL EQUITY | 97,462 | 97,053 | 95,745 | |||||||||||
| TOTAL LIABILITIES AND EQUITY | 1,722,840 | 1,595,835 | 1,568,636 | |||||||||||
| MEMORANDUM ITEMS: OFF BALANCE SHEET AMOUNTS | ||||||||||||||
| Loan commitments granted | 275,865 | 262,737 | 247,154 | |||||||||||
| Financial guarantees granted | 12,881 | 10,758 | 12,121 | |||||||||||
| Other commitments granted | 91,195 | 75,733 | 81,277 | |||||||||||
| 86 | | January - June 2022 | ||||||
| Condensed consolidated financial statements | ||||||||||||||||||||||||||
| Interim condensed consolidated income statement | ||||||||
| EUR million | ||||||||
| H1'22 | H1'21 | |||||||
| Interest income | 30,869 | 21,933 | ||||||
| Financial assets at fair value through other comprehensive income | 2,211 | 1,292 | ||||||
| Financial assets at amortized cost | 26,073 | 19,149 | ||||||
| Other interest income | 2,585 | 1,492 | ||||||
| Interest expense | (12,460) | (5,737) | ||||||
| Interest income/ (charges) | 18,409 | 16,196 | ||||||
| Dividend income | 335 | 309 | ||||||
| Income from companies accounted for using the equity method | 312 | 163 | ||||||
| Commission income | 7,792 | 6,676 | ||||||
| Commission expense | (1,940) | (1,507) | ||||||
| Gain or losses on financial assets and liabilities not measured at fair value through profit or loss, net | 233 | 344 | ||||||
| Financial assets at amortized cost | 28 | 77 | ||||||
| Other financial assets and liabilities | 205 | 267 | ||||||
| Gain or losses on financial assets and liabilities held for trading, net | 718 | 347 | ||||||
| Reclassification of financial assets at fair value through other comprehensive income | — | — | ||||||
| Reclassification of financial assets from amortized cost | — | — | ||||||
| Other gains (losses) | 718 | 347 | ||||||
| Gains or losses on non-trading financial assets and liabilities mandatorily at fair value through profit or loss | (15) | 10 | ||||||
| Reclassification of financial assets at fair value through other comprehensive income | — | — | ||||||
| Reclassification of financial assets from amortized cost | — | — | ||||||
| Other gains (losses) | (15) | 10 | ||||||
| Gain or losses on financial assets and liabilities measured at fair value through profit or loss, net | 756 | 221 | ||||||
| Gain or losses from hedge accounting, net | 128 | 57 | ||||||
| Exchange differences, net | (1,077) | (85) | ||||||
| Other operating income | 819 | 1,167 | ||||||
| Other operating expenses | (1,461) | (1,289) | ||||||
| Income from assets under insurance and reinsurance contracts | 1,349 | 769 | ||||||
| Expenses from liabilities under insurance and reinsurance contracts | (1,238) | (683) | ||||||
| Total income | 25,120 | 22,695 | ||||||
| Administrative expenses | (9,993) | (8,996) | ||||||
| Staff costs | (5,948) | (5,438) | ||||||
| Other general and administrative expenses | (4,045) | (3,558) | ||||||
| Depreciation and amortization | (1,442) | (1,381) | ||||||
| Provisions or reversal of provisions, net | (935) | (1,490) | ||||||
| Impairment or reversal of impairment of financial assets not measured at fair value through profit or loss and net gains and losses from changes | (4,763) | (3,804) | ||||||
| Financial assets at fair value through other comprehensive income | (1) | (19) | ||||||
| Financial assets at amortized cost | (4,762) | (3,785) | ||||||
| Impairment of investments in subsidiaries, joint ventures and associates, net | — | — | ||||||
| Impairment on non-financial assets, net | (61) | (130) | ||||||
| Tangible assets | (24) | (125) | ||||||
| Intangible assets | (29) | (3) | ||||||
| Others | (8) | (2) | ||||||
| Gain or losses on non-financial assets and investments, net | (4) | 52 | ||||||
| Negative goodwill recognized in results | — | — | ||||||
| Gains or losses on non-current assets held for sale not classified as discontinued operations | (7) | (32) | ||||||
| Operating profit/(loss) before tax | 7,915 | 6,914 | ||||||
| Tax expense or income from continuing operations | (2,374) | (2,474) | ||||||
| Profit/(loss) for the period from continuing operations | 5,541 | 4,440 | ||||||
| Profit/( loss) after tax from discontinued operations | — | — | ||||||
| Profit/(loss) for the period | 5,541 | 4,440 | ||||||
| Profit attributable to non-controlling interests | 647 | 765 | ||||||
| Profit/(loss) attributable to the parent | 4,894 | 3,675 | ||||||
| Earnings/(losses) per share | ||||||||
| Basic | 0.27 | 0.20 | ||||||
| Diluted | 0.27 | 0.20 | ||||||
January - June 2022 | | 87 | ||||||
| GLOSSARY | ||||||||
•Active customer: Those customers who comply with the minimum balance, income and/or transactionality requirements as defined according to the business area
•ADR: American Depositary Receipt
•ALCO: Assets and Liabilities Committee
•APIs: Application Programming Interface
•APM: Alternative Performance Measures
•AuMs: Assets under management
•bn: Billion
•bps: basis points
•CAL: consumer, assets and liabilities
•CDI: CREST Depository Interest
•CET1: Core equity tier 1
•CIB: Corporate & Investment Banking
•CNMV: Spanish National Securities Market Commission (Comisión Nacional del Mercado de Valores)
•DCB: Digital Consumer Bank
•DGF: Deposit guarantee fund
•Digital customers: Every consumer of a commercial bank’s services who has logged on to their personal online banking and/or mobile banking in the last 30 days
•EBA: European Banking Authority
•ECB: European Central Bank
•EPS: Earnings per share
•ESG: Environmental, Social and Governance
•ESMA: European Securities and Markets Authority
•Fed: Federal Reserve
•Financially empowered people: People (unbanked, underbanked or financially vulnerable), who are given access to the financial system, receive tailored finance and increase their knowledge and resilience through financial education.
•FX: Foreign Exchange
•GDP: Gross Domestic Product
•ICO: Insitituto de Crédito Oficial (Official Credit Institution)
•IFRS 9: International Financial Reporting Standard 9, regarding financial instruments
•IMF: International Monetary Fund
•IPO: Initial Public Offering
•LCR: Liquidity Coverage Ratio
•LLPs: Loan-loss provisions
•Loyal customers: Active customers who receive most of their financial services from the Group according to the commercial segment that they belong to. Various engaged customer levels have been defined taking profitability into account.
•MDA: Maximum Distribution Amount
•mn: Million
•NII: Net Interest Income
•NPLs: Non-performing loans
•NPS: Net Promoter Score
•PBT: Profit before tax
•POS: Point of Sale
•pp: percentage points
•PPI: Payment protection insurance
•QoQ: Quarter-on- quarter
•Repos: Repurchase agreements
•RoA: Return on assets
•RoE: Return on equity
•RoRWA: Return on risk weighted assets
•RoTE: Return on tangible equity
•RWAs: Risk weighted assets
•SAM: Santander Asset Management
•SBNA: Santander Bank N.A.
•SCF: Santander Consumer Finance
•SCIB: Santander Corporate & Investment Banking
•SC USA: Santander Consumer USA
•SEC: Securities and Exchanges Commission
•SH USA: Santander Holdings USA, Inc.
•SMEs: Small and medium enterprises
•SRF: Single resolution fund
•TLAC: The total loss-absorption capacity requirement which is required to be met under the CRD V package
•TLTRO: Targeted longer-term refinancing operations
•TNAV: Tangible net asset value
•VaR: Value at Risk
•WM&I: Wealth Management & Insurance
•YoY: Year-on- year
| 88 | | January - June 2022 | ||||||
| IMPORTANT INFORMATION | ||||||||
Non-IFRS and alternative performance measures
This report contains, in addition to the financial information prepared in accordance with International Financial Reporting Standards (“IFRS”) and derived from our financial statements, alternative performance measures (“APMs”) as defined in the Guidelines on Alternative Performance Measures issued by the European Securities and Markets Authority (ESMA) on 5 October 2015 (ESMA/2015/1415en) and other non-IFRS measures (“Non-IFRS Measures”). These financial measures that qualify as APMs and non-IFRS measures have been calculated with information from Santander Group; however those financial measures are not defined or detailed in the applicable financial reporting framework nor have been audited or reviewed by our auditors. We use these APMs and non-IFRS measures when planning, monitoring and evaluating our performance. We consider these APMs and non-IFRS measures to be useful metrics for our management and investors to compare operating performance between accounting periods, as these measures exclude items outside the ordinary course performance of our business, which are grouped in the “management adjustment” line and are further detailed in Section 3.2 of the Economic and Financial Review in our Directors’ Report included in our Annual Report on Form 20-F for the year ended 31 December 2021. Nonetheless, these APMs and non-IFRS measures should be considered supplemental information to, and are not meant to substitute IFRS measures. Furthermore, companies in our industry and others may calculate or use APMs and non-IFRS measures differently, thus making them less useful for comparison purposes. For further details on APMs and Non-IFRS Measures, including its definition or a reconciliation between any applicable management indicators and the financial data presented in the consolidated financial statements prepared under IFRS, please see the 2021 Annual Report on Form 20-F filed with the U.S. Securities and Exchange Commission (the “SEC”) on 1 March 2022, as updated by the Form 6-K filed with the SEC on 8 April 2022 in order to reflect our new organizational and reporting structure, as well as the section “Alternative performance measures” of the annex to this Banco Santander, S.A. (“Santander”) Q2 2022 Financial Report, published as Inside Information on 28 July 2022. These documents are available on Santander’s website (www.santander.com). Underlying measures, which are included in this report, are non-IFRS measures.
The businesses included in each of our geographic segments and the accounting principles under which their results are presented here may differ from the included businesses and local applicable accounting principles of our public subsidiaries in such geographies. Accordingly, the results of operations and trends shown for our geographic segments may differ materially from those of such subsidiaries.
Forward-looking statements
Banco Santander, S.A. (“Santander”) advises that this report contains “forward-looking statements” as per the meaning of the U.S. Private Securities Litigation Reform Act of 1995. These statements may be identified by words like “expect”, “project”, “anticipate”, “should”, “intend”, “probability”, “risk”, “VaR”, “RoRAC”, “RoRWA”, “TNAV”, “target”, “goal”, “objective”, “estimate”, “future” and similar expressions. Found throughout this report, they include (but are not limited to) statements on our future business development, economic performance and shareholder remuneration policy. However, a number of risks, uncertainties and other important factors may cause actual developments and results to differ materially from our expectations. The following important factors, in addition to others discussed elsewhere in this report, could affect our future results and could cause materially different outcomes from those anticipated in forward-looking statements: (1) general economic or industry conditions of areas where we have significant operations or investments (such as a worse economic environment; higher volatility in the capital markets; inflation or deflation; changes in demographics, consumer spending, investment or saving habits; and the effects of the war in Ukraine or the COVID-19 pandemic in the global economy); (2) exposure to various market risks (particularly interest rate risk, foreign exchange rate risk, equity price risk and risks associated with the replacement of benchmark indices); (3) potential losses from early repayments on our loan and investment portfolio, declines in value of collateral securing our loan portfolio, and counterparty risk; (4) political stability in Spain, the United Kingdom, other European countries, Latin America and the US (5) changes in legislation, regulations, taxes, including regulatory capital and liquidity requirements, especially in view of the UK exit of the European Union and increased regulation in response to financial crises; (6) our ability to integrate successfully our acquisitions and related challenges that result from the inherent diversion of management’s focus and resources from other strategic opportunities and operational matters; and (7) changes in our access to liquidity and funding on acceptable terms, in particular if resulting from credit spreads shifts or downgrade in credit ratings for the entire Group or significant subsidiaries.
Numerous factors could affect our future results and could cause those results deviating from those anticipated in the forward-looking statements. Other unknown or unpredictable factors could cause actual results to differ materially from those in the forward-looking statements.
Forward-looking statements speak only as of the date of this report and are informed by the knowledge, information and views available on such date. Santander is not required to update or revise any forward-looking statements, regardless of new information, future events or otherwise.
January - June 2022 | | 89 | ||||||
No offer
The information contained in this report is subject to, and must be read in conjunction with, all other publicly available information, including, where relevant any fuller disclosure document published by Santander. Any person at any time acquiring securities must do so only on the basis of such person’s own judgment as to the merits or the suitability of the securities for its purpose and only on such information as is contained in such public information having taken all such professional or other advice as it considers necessary or appropriate in the circumstances and not in reliance on the information contained in this report. No investment activity should be undertaken on the basis of the information contained in this report. In making this report available Santander gives no advice and makes no recommendation to buy, sell or otherwise deal in shares in Santander or in any other securities or investments whatsoever.
Neither this report nor any of the information contained therein constitutes an offer to sell or the solicitation of an offer to buy any securities. No offering of securities shall be made in the United States except pursuant to registration under the U.S. Securities Act of 1933, as amended, or an exemption therefrom. Nothing contained in this report is intended to constitute an invitation or inducement to engage in investment activity for the purposes of the prohibition on financial promotion in the U.K. Financial Services and Markets Act 2000.
Historical performance is not indicative of future results
Statements about historical performance or accretion must not be construed to indicate that future performance, share price or results (including earnings per share) in any future period will necessarily match or exceed those of any prior period. Nothing in this report should be taken as a profit forecast.
Third Party Information
In particular, regarding the data provided by third parties, neither Santander, nor any of its administrators, directors or employees, either explicitly or implicitly, guarantees that these contents are exact, accurate, comprehensive or complete, nor are they obliged to keep them updated, nor to correct them in the case that any deficiency, error or omission were to be detected. Moreover, in reproducing these contents in by any means, Santander may introduce any changes it deems suitable, may omit partially or completely any of the elements of this document, and in case of any deviation between such a version and this one, Santander assumes no liability for any discrepancy.
This document is a translation of a document originally issued in Spanish. Should there be any discrepancies between the English and the Spanish versions, only the original Spanish version should be binding. | ||
| 90 | | January - June 2022 | ||||||
SIGNATURE
Pursuant to the requirements of the Securities Exchange Act of 1934, the registrant has duly caused this report to be signed on its behalf by the undersigned, thereunto duly authorized.
| Banco Santander, S.A. | ||||||||
| Date: 28 July 2022 | By: | /s/ José García Cantera | ||||||
| Name: | José García Cantera | |||||||
| Title: | Chief Financial Officer | |||||||