UNITED STATES
SECURITIES AND EXCHANGE COMMISSION
Washington, D.C. 20549
FORM N-CSR
CERTIFIED SHAREHOLDER REPORT OF REGISTERED
MANAGEMENT INVESTMENT COMPANIES
Investment Company Act file number (811-07168)
Hennessy Funds Trust
(Exact name of registrant as specified in charter)
7250 Redwood Blvd., Suite 200
Novato, CA 94945
(Address of principal executive offices) (Zip code)
Neil J. Hennessy
7250 Redwood Blvd., Suite 200
Novato, CA 94945
(Name and address of agent for service)
800-966-4354
Registrant's telephone number, including area code
Date of fiscal year end: October 31, 2012
Date of reporting period: October 31, 2012
Item 1. Reports to Stockholders.
HENNESSY FUNDS
ANNUAL REPORT
OCTOBER 31, 2012

Hennessy Focus Fund
Hennessy Gas Utility Index Fund
Hennessy Small Cap Financial Fund
Hennessy Large Cap Financial Fund
Hennessy Technology Fund
Hennessy Equity and Income Fund
Hennessy Core Bond Fund

Contents
| Letter to shareholders | 1 |
| Performance overview (unaudited) | |
| Hennessy Focus Fund | 3 |
| Hennessy Gas Utility Index Fund | 6 |
| Hennessy Small Cap Financial Fund | 8 |
| Hennessy Large Cap Financial Fund | 10 |
| Hennessy Technology Fund | 12 |
| Hennessy Equity and Income Fund | 14 |
| Hennessy Core Bond Fund | 18 |
| Financial statements | |
| Schedules of investments | |
| Hennessy Focus Fund | 22 |
| Hennessy Gas Utility Index Fund | 25 |
| Hennessy Small Cap Financial Fund | 28 |
| Hennessy Large Cap Financial Fund | 31 |
| Hennessy Technology Fund | 34 |
| Hennessy Equity and Income Fund | 37 |
| Hennessy Core Bond Fund | 43 |
| Statements of assets and liabilities | 48 |
| Statements of operations | 50 |
| Statements of changes in net assets | 52 |
| Financial highlights | |
| Hennessy Focus Fund | 56 |
| Hennessy Gas Utility Index Fund | 58 |
| Hennessy Small Cap Financial Fund | 60 |
| Hennessy Large Cap Financial Fund | 62 |
| Hennessy Technology Fund | 64 |
| Hennessy Equity and Income Fund | 66 |
| Hennessy Core Bond Fund | 68 |
| Notes to the financial statements | 70 |
| Report of Independent Registered Public Accounting Firm | 80 |
| Directors/Trustees and Officers of the Funds | 81 |
| Expense example | 83 |
| Proxy voting policy | 85 |
| Quarterly Filings on Form N-Q | 85 |
| Federal Tax Distribution Information | 85 |
| Householding | 85 |
| Board Approval of Investment Advisory Agreements | 86 |
| Privacy Policy | 87 |
WWW.HENNESSYFUNDS.COM
December, 2012
Dear Hennessy Funds Shareholder:
The past year has been jam-packed with politics, continued economic uncertainty in the United States and around the world, and most recently, non-stop talk of the possible effects of the looming “Fiscal Cliff.”
Since the economic crisis of 2008, most Americans seem to have taken a “glass half empty” view and now seem to expect doom and gloom. Talking about the decline of America has become a popular pastime around the world, and even Americans are jumping into the discussion. In fact, it feels like the United States has become an “underdog,” while China and other emerging nations are coined as the new world economic leaders. But the reality is that the U.S. remains the world’s largest economy, and the stock market has continued to perform well. Following the crisis in 2008, the Dow Jones Industrial Average was up 23% in 2009, up 14% in 2010, and up 8% in 2011. I believe, however, that many Americans, including individuals, business leaders, and political leaders, have remained resilient and continue to exhibit the stamina to work hard and the character to succeed.
I am not saying that our economy isn’t without issues. But, I believe investors may be missing some key facts about our economy, and those facts transcend the rhetoric. In last year’s shareholder letter, I told you that the major obstacle facing the U.S. economy and the stock market was clarity from our leaders in Washington on taxes, regulation and healthcare. With the elections behind us, we have the clarity that President Obama will be our leader for another four years. We know that the Democrats have the majority in the Senate and the Republicans have the majority in the House. But where does that leave our economy, the financial markets and investors?
Post-Election Economy
The moment the last ballot was cast in November, the media began its talk of the “Fiscal Cliff.” The dramatic use of the word “Cliff” is making everyone nervous. I keep picturing the old Road Runner cartoons with the Coyote plummeting off a cliff and landing in a cloud of dust. It is my somewhat controversial opinion that we should drive right off the Fiscal Cliff and force our policy makers to get things “right” and not compromise for the sake of a compromise. I strongly believe that if we fall off the “Cliff,” in six months’ time our leaders would have to work together to create better policies, rather than trying to force quick fixes on these issues critical to our economy and our nation.
The election, the Fiscal Cliff and slow earnings growth may be eroding the confidence of our business leaders, who have cut costs and driven profits. However, companies here in the U.S. are still sitting on record amounts of cash. Businesses require faith in their government to execute strategies that will put that capital to work and to hire in earnest. Now that there is some clarity, it must, in my opinion, be coupled with actionable policy on taxes and regulation for corporate attitudes and behavior to shift. Corporate America, and frankly most of America, is losing its tolerance with polarized and stagnant politics.
For better or worse, business leaders need to know what regulations they’ll have to comply with, what tax rates will be and what healthcare will cost. The writing is on the wall for higher taxes, and the Healthcare Reform Law appears to be here to stay. The current administration seems to feel that they have a “green light” to push the 200 regulations related to Dodd-Frank and the numerous policies outlined in the Healthcare Reform Law into practice in the next four years. I know that innovative business leaders in this country will implement new strategies as they seek to remain profitable, because that’s what they do. Many of America’s business leaders have shown that they have the character to succeed in any political or economic climate.
Financial Markets
The stock market will be forced to wade through this murky economy as we continue to navigate the partisan political quagmire. Many companies comprising the Dow Jones Industrial Average Index or the S&P 500 have strong balance sheets, respectable fundamentals and reasonable returns. When our fiscal year ended on October 31, 2012, the Dow Jones was going strong at 9.51% calendar year to date. Of course, after the election, the market “rioted” in order to force some decisions on the Fiscal Cliff. In fact, in the ten days after the election, we saw the Dow lose 4%. But in the long term, I believe the strengths of the economy should filter through to the markets. We are in the midst of a slow but steady recovery that won’t easily be derailed. I am, therefore, expecting another year with slow to moderate growth. There are still plenty of great stocks to buy. We are seeing improvement in many sectors, including the housing industry, and we still see strength in lower-end retailers.
Investors
Investors are still uncertain about putting their cash to work in the stock market, and they continue to flock to fixed income products. Like business leaders, I believe that investors feel the same frustration with partisanship in Washington, and they need more answers in order to believe in the economic recovery. The strength I have seen in many of the lower-end retailers tells me that investors and consumers are still looking for value for their dollar. Many industry statistics report
HENNESSY FUNDS 1-800-966-4354
1
that Americans have been paying down their debt and saving more, even with interest rates at all-time lows. And, I believe, the average investor could be experiencing some long-awaited comfort in the slow return of the housing market in our country.
While fiscal 2012 proved another difficult year for the economy, at Hennessy Funds we remain focused on our proven investment strategies, and we will not compromise our long-standing commitment to manage our portfolios in the best interest of our shareholders. As investors regain their confidence and return to investing based on facts and fundamentals, I believe we should return to steady, long-term market gains.
On October 26, 2012, Hennessy became the investment manager to the ten FBR Funds. We want to welcome new shareholders to the Hennessy family of Funds. We are excited to now offer all of our shareholders an expanded line-up of products, including 16 domestic equity, sector and specialty, as well as more conservative balanced and fixed income mutual funds.
I personally would like to take a moment to reach out to the victims of Hurricane Sandy and Sandy Hook Elementary School. No words can express the sorrow we feel for the families who lost loved ones.
Thank you for your continued confidence and investment in the Hennessy Funds. If you have any questions or want to speak with us directly, please don’t hesitate to call us at (800) 966-4354.
Best regards,

Neil J. Hennessy
President and Chief Investment Officer
Past performance does not guarantee future results.
Mutual fund investing involves risk. Principal loss is possible. Small and medium-capitalization companies tend to have more limited liquidity and greater price volatility than large-capitalization companies. Investments in foreign securities may involve greater volatility and political, economic and currency risk and differences in accounting methods. A non-diversified fund, one that may concentrate its assets in fewer individual holdings than a diversified fund, is more exposed to individual stock volatility than a diversified fund. A fund that concentrates its investments within one or a small group of industries may be more volatile than a fund that invests in a broader range of industries. Real estate values (and the values of real estate-related securities) fluctuate with changes in general and local economic conditions and are particularly sensitive to economic downturns. IPO shares are subject to market risk and liquidity risk. The yields and principal values of debt securities will also fluctuate. Generally, values of debt securities change inversely with interest rates. Some Funds may invest a portion of its assets in lower rated, high-yielding bonds (commonly known as “junk bonds”). Mortgage- and asset-backed securities are subject to prepayment risk, which is the risk that the borrower will prepay some or all of the principal owed to the issuer.
Opinions expressed are those of Neil Hennessy and are subject to change, are not guaranteed and should not be considered investment advice.
The Dow Jones Industrial Average and S&P 500 are unmanaged indices of common stocks comprised of major companies and assumes reinvestment of dividends. You cannot invest directly in an index.
WWW.HENNESSYFUNDS.COM
2
Performance Overview (Unaudited)
The opinions expressed in the following commentaries reflect those of the Portfolio Managers as of the date written. Any such opinions are subject to change based on market or other conditions. These opinions may not be relied upon as investment advice. Investment decisions for the Hennessy Funds are based on several factors, and may not be relied upon as an indication of trading intent on behalf of any Hennessy Fund. Security positions can and do change.
Hennessy Focus Fund (formerly FBR Focus Fund)
Investor Class Shares (HFCSX)
AVERAGE ANNUAL TOTAL RETURN PERIODS ENDED OCTOBER 31, 2012
| One Year | Five Year | Ten Year | |
| Hennessy Focus Fund – Investor Class | 16.17% | 4.15% | 13.28% |
| Russell 2000 Index | 12.08% | 1.19% | 9.58% |
| Russell Midcap Growth Index | 9.09% | 1.55% | 10.03% |
Gross expense ratio: 1.39%.
Performance data quoted represents past performance; past performance does not guarantee future results. The investment return and principal value of an investment will fluctuate so that an investor’s shares, when redeemed, may be worth more or less than their original cost. Current performance of the fund may be lower or higher than the performance quoted. Performance data current to the most recent month end may be obtained by visiting www.hennessyfunds.com. Performance for periods prior to 10/26/12 is that of the FBR Focus Fund. The gross expense ratio presented is that from the most recent prospectus.
PERFORMANCE NARRATIVE
Portfolio Managers: Brian Macauley, CFA®, David Rainey, CFA®, and Ira Rothberg, CFA®, of Broad Run Investment Management, LLC, sub-advisor.
Over the previous twelve months, how did the Fund perform and what factors contributed to this performance?
For the twelve-month period ended October 31, 2012, the Investor Class of the Hennessy Focus Fund returned 16.17% compared to 12.08% for the Russell 2000 Index, 9.09% for the Russell Midcap Growth Index and 7.71% for the Morningstar Mid Cap Growth Category.
The Fund’s favorable absolute and relative returns were a result of improved business prospects for its largest holdings, owing to a better overall economic outlook and company-specific developments. Major contributors to performance during the period included American Tower Corp., Bally Technologies, Inc. and News Corp.
| • | American Tower completed its conversion to a REIT structure in early 2012, which improved its tax efficiency, and the business continued to benefit from growing U.S. and international demand for improved wireless voice and data service. |
| • | Bally Technologies continued to outpace its competitors with its strong gaming systems business, popular new product innovations and expansion into previously underpenetrated market segments. |
| • | News Corp. continued to benefit from strong pricing power in its cable and broadcast channels, international expansion in emerging television markets and an aggressive share repurchase program. |
There were no negative contributors this year - each of the Fund’s 23 portfolio companies contributed positively to performance.
We invest with a long-term time horizon and encourage Fund shareholders to do the same. Despite the discussion of one-year results referenced above, we encourage fellow shareholders to evaluate the Fund’s performance over three-, five-, and ten-year periods.
Portfolio managers’ comments on the Fund and the related investment outlook.
It is our belief that the three characteristics that best predict a company’s ability to create value over a five- to ten-year time frame are a high quality business, a large growth opportunity and skilled management.
As we reflect on the Fund’s performance over the last year, we see several instances where management action created additional value for shareholders. Some examples include American Tower’s international expansion and REIT conversion, Aon PLC’s change in domicile to a lower tax jurisdiction, and White River Capital, Inc.’s large special dividend. But even more noteworthy is an event that occurred subsequent to the end of the Fund’s fiscal year end; Penn National Gaming, Inc.’s (PENN, 7.2% of total assets at 10/31/12) announcement of a corporate reorganization.
On November 15, 2012, PENN announced its intent to become the first gaming company to split its business into two separate publicly traded companies, a REIT focused on owning gaming properties, and a management company focused on operating and developing gaming properties. The stock rose more than 30% on this announcement. This novel transaction should provide significant tax savings and expanded appeal to income-oriented investors (with a corresponding higher valuation multiple). Other benefits include fewer regulatory license ownership restrictions and potential new avenues of growth for both of the entities. The transformation is expected to be completed in 12 to 18 months.
HENNESSY FUNDS 1-800-966-4354
3
The Fund has been invested in PENN, alongside its remarkable CEO, Peter Carlino, for more than a decade. While the timing and details of this recent announcement were a surprise, it is no surprise to us that Peter has once again found a thoughtful and innovative way to create value for shareholders. Time after time, Peter has demonstrated this ability through savvy casino projects, share repurchases, acquisitions and corporate transactions. Peter’s record is not perfect, and there have been some disappointments along the way, but on balance he has been excellent. Across the public gaming companies, shareholder returns have been poor over the last decade, but PENN’s share price has compounded at more than an 18% per annum clip thanks to Peter’s leadership.
Occasionally, a great management team creates value through a large, high profile transaction like the recent PENN announcement, and sometimes it comes through more modest developments such as American Tower’s REIT conversion, Aon’s change in domicile, or White River’s special dividend. But most often the benefits of great management accrue incrementally and behind the scenes through better strategic positioning and more productive use of company cash flows. Over the course of one quarter or one year these small advantages have little discernible impact on stock price performance. However, over the course of five or ten years, the time horizon over which we invest, these small incremental advantages can accumulate into big differences in company and stock price performance. Since inception, the Fund has had an average portfolio company holding period of approximately six years.
We find that many investors, because they have such short investment time horizon, do not place much emphasis on management quality. Other investors find assessing management so subjective that they don’t even try. This is welcome news to us because we believe this often allows us to invest with the best management team in an industry without having to pay a premium valuation to do so.
How do we identify the very best management teams? Well, the historical track record is one of the most obvious and best indicators of management capability. But we also look for three other indicators: 1) they have a strong economic incentive to create shareholder value because of a large share ownership and/or thoughtful compensation program; 2) they run the business to maximize long-term profits, even if this means sacrificing some short-term profitability; and 3) they are thoughtful and transparent about how they allocate the company’s cash flow across new projects, acquisitions, share repurchases and dividends. Peter Carlino of PENN measures up very well on these metrics, as do the CEOs and management teams of most of our portfolio companies.
Today, we think that the Fund is well positioned because we believe it contains a collection of high quality businesses with large growth opportunities, run by skilled management teams. These companies are trading at valuations that in our opinion should allow for a favorable rate of capital appreciation over the long term.
CHANGE IN VALUE OF $10,000 INVESTMENT
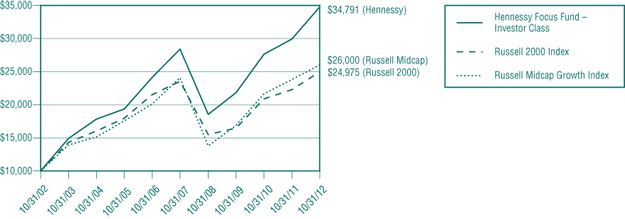
This chart assumes an initial gross investment of $10,000 made on October 31, 2002. Returns shown include the reinvestment of all dividends. Returns shown do not reflect the deduction of taxes that a shareholder would pay on Fund distributions or the redemption of Fund shares.
WWW.HENNESSYFUNDS.COM
4
Hennessy Focus Fund (formerly FBR Focus Fund)
Institutional Class Shares (HFCIX)
AVERAGE ANNUAL TOTAL RETURN PERIODS ENDED OCTOBER 31, 2012
| Since Inception | |||
| One Year | Three Year | (05/30/08) | |
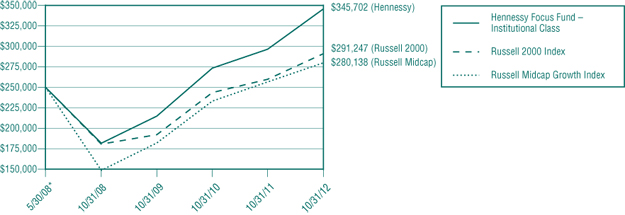
| Hennessy Focus Fund – Institutional Class | 16.51% | 17.20% | 7.61% |
| Russell 2000 Index | 12.08% | 14.82% | 3.51% |
| Russell Midcap Growth Index | 9.09% | 15.42% | 2.61% |
Gross expense ratio: 1.09%.
Performance data quoted represents past performance; past performance does not guarantee future results. The investment return and principal value of an investment will fluctuate so that an investor’s shares, when redeemed, may be worth more or less than their original cost. Current performance of the fund may be lower or higher than the performance quoted. Performance data current to the most recent month end may be obtained by visiting www.hennessyfunds.com. Performance for periods prior to 10/26/12 is that of the FBR Focus Fund. The gross expense ratio presented is that from the most recent prospectus.
CHANGE IN VALUE OF $250,000 INVESTMENT
* Inception date
This chart assumes an initial gross investment of $250,000 (minimum investment) made on May 30, 2008 (inception date of share class). Returns shown include the reinvestment of all dividends. Returns shown do not reflect the deduction of taxes that a shareholder would pay on Fund distributions or the redemption of Fund shares.
A non-diversified fund, one that may concentrate its assets in fewer holdings than a diversified fund, is more exposed to individual stock volatility than a diversified fund. The Fund invests in small and medium capitalized companies, which involves additional risks such as limited liquidity and greater volatility.
The Russell Midcap Growth and Russell 2000 are unmanaged indices commonly used to measure the performance of U.S. stocks. One cannot invest directly in an index.
References to specific securities should not be considered a recommendation to buy or sell any security. The Fund’s composition, holdings and sector allocations are shown as a percentage of the Fund’s total net assets and are subject to change. Please refer to the Schedule of Investments in this report.
Cash flow measures the cash generated by a business after paying all operating costs, interest expense and taxes.
Each Morningstar category average represents a universe of funds with similar investment objectives. © 2012 Morningstar, Inc. All Rights Reserved. The information contained herein: 1) is proprietary to Morningstar; 2) may not be copied or distributed and 3) is not warranted to be accurate, complete or timely. Neither Morningstar nor its content providers are responsible for any damages or losses arising from any use of this information. Past performance does not guarantee future results.
HENNESSY FUNDS 1-800-966-4354
5
Hennessy Gas Utility Index Fund (formerly FBR Gas Utility Index Fund)
Investor Class Shares (GASFX)
AVERAGE ANNUAL TOTAL RETURN PERIODS ENDED OCTOBER 31, 2012
| One Year | Five Year | Ten Year | |
| Hennessy Gas Utility Index Fund – Investor Class | 12.41% | 6.09% | 13.11% |
| S&P 500 Index | 15.21% | 0.36% | 6.91% |
| AGA Stock Index | 11.45% | 6.24% | 13.28% |
Gross expense ratio: 0.65%.
Performance data quoted represents past performance; past performance does not guarantee future results. The investment return and principal value of an investment will fluctuate so that an investor’s shares, when redeemed, may be worth more or less than their original cost. Current performance of the fund may be lower or higher than the performance quoted. Performance data current to the most recent month end may be obtained by visiting www.hennessyfunds.com. Performance for periods prior to 10/26/12 is that of the FBR Gas Utility Index Fund. The gross expense ratio presented is that from the most recent prospectus.
PERFORMANCE NARRATIVE
Portfolio Manager: Winsor H. Aylesworth
Over the previous twelve months, how did the Fund perform and what factors contributed to this performance?
For the twelve-month period ended October 31, 2012, the Hennessy Gas Utility Index Fund returned 12.41%. This compares to the S&P 500 Index, the American Gas Association (AGA) Stock Index and the Morningstar Utilities Category Average, which returned 15.21%, 11.45% and 10.87% for the same period, respectively. The Fund finished its fiscal year slightly outperforming its benchmark and other utility indices while underperforming the S&P 500 Index. The investment environment for this twelve-month period was one where investors assumed slightly more risk than in the previous year and more conservative investments such as bonds, REITs and utility stocks reverted to more normalized returns. Our natural gas distribution orientation continued to reward the investor as ample natural gas supplies continued to provide opportunities for growth in distribution.
When the Fund outperforms its AGA Stock Index benchmark, we like to reassure and warn investors that this is the exception and not the rule. As an index fund, it is managed to provide investors the benchmark return LESS expenses. The fact that the Fund exceeded the benchmark is not a result of stock selection or some exotic strategy. It is simply a result of “managing the process” and the movement of the market as one buys or sells investments. I would not expect this outperformance to continue and there could, in fact, be some times when the Fund will underperform more than it should due to the randomness of the process. But for the time being I, as a fellow investor, am thankful for the outperformance.
Two of the Fund’s best performers for the year were Cheniere Energy, Inc. (+40%) and The Williams Companies, Inc. (+47%). Cheniere’s business focuses on the liquid natural gas market. They are currently developing export facilities on the Gulf Coast in addition to their import facilities to take advantage of large discrepancies in worldwide natural gas prices. Williams Companies owns one of the largest collections of interstate gas pipelines in the U.S. They have been and should continue to be a beneficiary of the increased demand for this available, clean and relatively inexpensive fuel. One of the Fund’s worst performers was Excelon Corp. (-15%). This diversified utility has exposure to coal and nuclear fueled electric generation along with its gas distribution business. The Coal and Nuclear industries have not been beneficiaries of the natural gas revolution.
Portfolio manager comments on the Fund and the related investment outlook:
We believe the outlook for the future for the Fund’s companies appears positive as the nation enters its post-election period. With the U.S. emphasis on natural gas and the nation’s recognition that natural gas will be key to any energy policy going forward, the Fund should be positioned to take advantage of these trends. If wholesale prices stay at or near historic lows (below $5.00 per BTU), growth in demand should occur naturally with potentially positive impact on earnings and dividends. Political and weather issues can impact things on a short term basis, but the inevitable growth of the industry is more a matter of how fast versus not at all.
I look forward to the future and hope that as investors you do, too. As a fellow shareholder, I thank you for your support.
WWW.HENNESSYFUNDS.COM
6
CHANGE IN VALUE OF $10,000 INVESTMENT
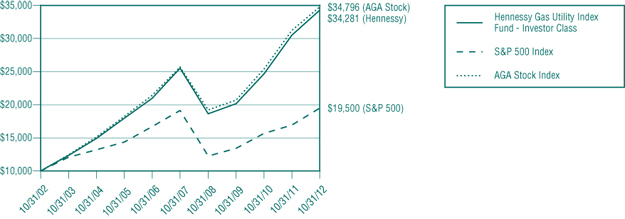
This chart assumes an initial gross investment of $10,000 made on October 31, 2002. Returns shown include the reinvestment of all dividends. Returns shown do not reflect the deduction of taxes that a shareholder would pay on Fund distributions or the redemption of Fund shares.
A non-diversified fund, one that may concentrate its assets in fewer holdings than a diversified fund, is more exposed to individual stock volatility than a diversified fund. Investments are focused in the natural gas distribution and transmission industry, which may be adversely affected by rising interest rates, weather, and the wholesale pricing of alternative fuels. Investments in foreign securities may involve greater volatility and political, economic and currency risk and differences in accounting methods.
The S&P 500 is an unmanaged index commonly used to measure the performance of U.S. stocks. The AGA Stock Index is a market capitalization weighted index, adjusted monthly, consisting of member companies of the AGA. One cannot invest directly in an index.
References to specific securities should not be considered a recommendation to buy or sell any security. The Fund’s composition, holdings and sector allocations are shown as a percentage of the Fund’s total net assets and are subject to change. Please refer to the Schedule of Investments in this report.
Each Morningstar category average represents a universe of funds with similar investment objectives. © 2012 Morningstar, Inc. All Rights Reserved. The information contained herein: 1) is proprietary to Morningstar; 2) may not be copied or distributed and 3) is not warranted to be accurate, complete or timely. Neither Morningstar nor its content providers are responsible for any damages or losses arising from any use of this information. Past performance is no guarantee of future results.
HENNESSY FUNDS 1-800-966-4354
7
Hennessy Small Cap Financial Fund (formerly FBR Small Cap Financial Fund)
Investor Class Shares (HSFNX)
AVERAGE ANNUAL TOTAL RETURN PERIODS ENDED OCTOBER 31, 2012
| One Year | Five Year | Ten Year | |
| Hennessy Small Cap Financial Fund – Investor Class | 20.65% | 4.57% | 6.36% |
| Russell 2000 Index | 12.08% | 1.19% | 9.58% |
| NASDAQ Bank Index | 20.45% | -6.40% | 0.62% |
Gross expense ratio: 1.56%.
Performance data quoted represents past performance; past performance does not guarantee future results. The investment return and principal value of an investment will fluctuate so that an investor’s shares, when redeemed, may be worth more or less than their original cost. Current performance of the fund may be lower or higher than the performance quoted. Performance data current to the most recent month end may be obtained by visiting www.hennessyfunds.com. Performance for periods prior to 10/26/12 is that of the FBR Small Cap Financial Fund. The gross expense ratio presented is that from the most recent prospectus.
PERFORMANCE NARRATIVE
Portfolio Manager: David H. Ellison
Over the previous twelve months, how did the Fund perform and what factors contributed to this performance?
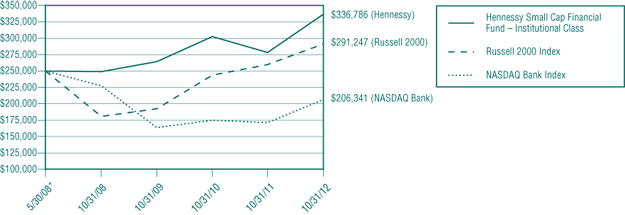
For the twelve-month period ended October 31, 2012, the Investor Class of the Hennessy Small Cap Financial Fund returned 20.65%. This compares to the Russell 2000 Index, the NASDAQ Bank Index, and the Morningstar Financial Category Average, which returned 12.08%, 20.45% and 17.67% for the same period, respectively.
Favorable performance during the period was driven by companies seeing improved credit metrics. Earnings quality and quantity moved higher during the period and the stocks followed this trend. The slowly improving economy generally and the improved housing market specifically drove this favorable trend.
Portfolio manager comments on the Fund and the related investment outlook:
The Fund ended the twelve-month period fully invested and continues to be predominantly invested in small banks and thrifts across the U.S. The improved housing market has been the reason for recent outperformance relative to the market in general. We expect to see continued slow improvement in housing. This improvement should drive reduced loan losses and loan growth going forward. Companies in the Fund have plenty of capital to grow and liquidity to take advantage of the favorable trends in housing that we have seen and which we believe should continue.
There are, however, negative trends to watch. In the short run, we are mindful of impacts from government fiscal policies (fiscal cliff, etc.). Other more specific negatives include the impact of persistently low rates on lending margins and the slow recovery in loan demand.
We remain constructive on the period ahead. We will, as always, be mindful of the downside risks and look to protect our shareholders as warranted.
CHANGE IN VALUE OF $10,000 INVESTMENT
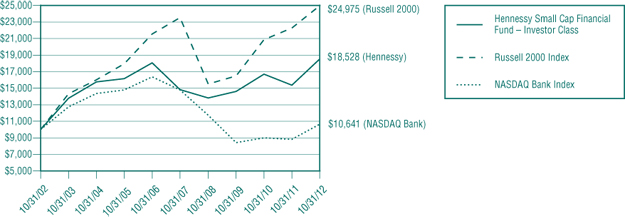
This chart assumes an initial gross investment of $10,000 made on October 31, 2002. Returns shown include the reinvestment of all dividends. Returns shown do not reflect the deduction of taxes that a shareholder would pay on Fund distributions or the redemption of Fund shares.
WWW.HENNESSYFUNDS.COM
8
Hennessy Small Cap Financial Fund (formerly FBR Small Cap Financial Fund)
Institutional Class Shares (HISFX)
AVERAGE ANNUAL TOTAL RETURN PERIODS ENDED OCTOBER 31, 2012
| Since Inception | |||
| One Year | Three Year | (05/30/08) | |
| Hennessy Small Cap Financial Fund – Institutional Class | 20.95% | 8.41% | 6.97% |
| Russell 2000 Index | 12.08% | 14.82% | 3.51% |
| NASDAQ Bank Index | 20.45% | 8.07% | -4.25% |
Gross expense ratio: 1.29%.
Performance data quoted represents past performance; past performance does not guarantee future results. The investment return and principal value of an investment will fluctuate so that an investor’s shares, when redeemed, may be worth more or less than their original cost. Current performance of the fund may be lower or higher than the performance quoted. Performance data current to the most recent month end may be obtained by visiting www.hennessyfunds.com. Performance for periods prior to 10/26/12 is that of the FBR Small Cap Financial Fund. The gross expense ratio presented is that from the most recent prospectus.
CHANGE IN VALUE OF $250,000 INVESTMENT
* Inception date
This chart assumes an initial gross investment of $250,000 (minimum investment) made on May 30, 2008 (inception date of share class). Returns shown include the reinvestment of all dividends. Returns shown do not reflect the deduction of taxes that a shareholder would pay on Fund distributions or the redemption of Fund shares.
A non-diversified fund, one that may concentrate its assets in fewer holdings than a diversified fund, is more exposed to individual stock volatility than a diversified fund. The Fund invests in smaller companies, which involves additional risks such as limited liquidity and greater volatility. Investors are focused in the financial services industry which may be adversely affected by regulatory or other market conditions such as rising interest rates.
The NASDAQ Bank Index is a capitalization weighted index of domestic and foreign common stocks of banks that are traded on the NASDAQ National Market System. The Russell 2000® Index is an unmanaged total return index of the smallest 2000 companies in the Russell 3000 Index, as ranked by total market capitalization. One cannot invest directly in an index.
References to specific securities should not be considered a recommendation to buy or sell any security. The Fund’s composition, holdings and sector allocations are shown as a percentage of the Fund’s total net assets and are subject to change. Please refer to the Schedule of Investments in this report.
Each Morningstar category average represents a universe of funds with similar investment objectives. © 2012 Morningstar, Inc. All Rights Reserved. The information contained herein: 1) is proprietary to Morningstar; 2) may not be copied or distributed and 3) is not warranted to be accurate, complete or timely. Neither Morningstar nor its content providers are responsible for any damages or losses arising from any use of this information. Past performance does not guarantee future results.
HENNESSY FUNDS 1-800-966-4354
9
Hennessy Large Cap Financial Fund (formerly FBR Large Cap Financial Fund)
Investor Class Shares (HLFNX)
AVERAGE ANNUAL TOTAL RETURN PERIODS ENDED OCTOBER 31, 2012
| One Year | Five Year | Ten Year | |
| Hennessy Large Cap Financial Fund – Investor Class | 18.89% | -0.39% | 4.16% |
| S&P 500 Index | 15.21% | 0.36% | 6.91% |
| KBW Bank Index | 26.36% | -11.58% | -1.48% |
Gross expense ratio: 1.45%.
Performance data quoted represents past performance; past performance does not guarantee future results. The investment return and principal value of an investment will fluctuate so that an investor’s shares, when redeemed, may be worth more or less than their original cost. Current performance of the fund may be lower or higher than the performance quoted. Performance data current to the most recent month end may be obtained by visiting www.hennessyfunds.com. Performance for periods prior to 10/26/12 is that of the FBR Large Cap Financial Fund. The gross expense ratio presented is that from the most recent prospectus.
PERFORMANCE NARRATIVE
Portfolio Manager: David H. Ellison
Over the previous twelve months, how did the Fund perform and what factors contributed to this performance?
For the twelve-month period ended October 31, 2012, the Hennessy Large Cap Financial Fund returned 18.89%. This compares to the KBW Bank Index, the S&P 500 Index and the Morningstar Financial Category Average, which returned 26.36%, 15.21% and 17.67% for the same period, respectively.
Favorable performance during the period was driven by exposure to large commercial banks, credit card and brokerage companies. Exposure to insurance and specialty lenders detracted from performance during the period.
Continued improvement in housing demand, loan quality and commercial business activity drove revenue gains during the period. Continued declines in credit costs and operating expense cuts drove expense control during the period. The industry has been working to improve their balance sheets for over four years. This work is revealing itself in improved earnings quality, adequate loss reserves and capital stability. The ongoing improvement in industry fundamentals has translated into earnings growth, and the stocks followed this upward trend during the period.
Portfolio manager comments on the Fund and the related investment outlook:
The Fund ended the twelve-month period in a fully invested position. We expect to see continued improvement in core fundamentals which should limit downside risk in the stocks and offer upside potential as earnings quality and quantity improve.
There are, however, fundamental negatives to watch. The big one, in the short run, is the economic impact of government fiscal policies (fiscal cliff, etc.). Other more specific negatives include the impact of low rates on lending profitability and the slow recovery, thus far, in loan demand.
We remain constructive on the period ahead. We will, as always, be mindful of the downside risks and look to protect our shareholders as warranted.
WWW.HENNESSYFUNDS.COM
10
CHANGE IN VALUE OF $10,000 INVESTMENT
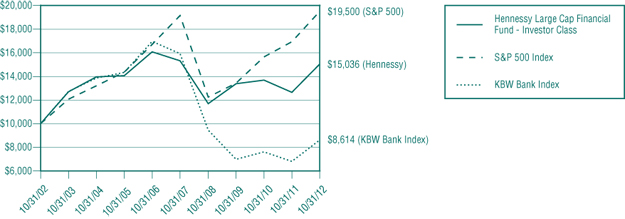
This chart assumes an initial gross investment of $10,000 made on October 31, 2002. Returns shown include the reinvestment of all dividends. Returns shown do not reflect the deduction of taxes that a shareholder would pay on Fund distributions or the redemption of Fund shares.
A non-diversified fund, one that may concentrate its assets in fewer holdings that a diversified fund, is more exposed to individual stock volatility than a diversified fund. Investors are focused in the financial services industry which may be adversely affected by regulatory or other market conditions such as rising interest rates. The Fund invests in small and medium capitalized companies, which involves additional risks such as limited liquidity and greater volatility
The S&P 500 Index is an unmanaged index commonly used to measure the performance of U.S. stocks. The KBW Bank Index measures Bank stock performance. One cannot invest directly in an index.
References to specific securities should not be considered a recommendation to buy or sell any security. The Fund’s composition, holdings and sector allocations are shown as a percentage of the Fund’s total net assets and are subject to change. Please refer to the Schedule of Investments in this report.
Each Morningstar category average represents a universe of funds with similar investment objectives. © 2012 Morningstar, Inc. All Rights Reserved. The information contained herein: 1) is proprietary to Morningstar; 2) may not be copied or distributed and 3) is not warranted to be accurate, complete or timely. Neither Morningstar nor its content providers are responsible for any damages or losses arising from any use of this information. Past performance does not guarantee future results.
HENNESSY FUNDS 1-800-966-4354
11
Hennessy Technology Fund (formerly FBR Technology Fund)
Investor Class Shares (HTECX)
AVERAGE ANNUAL TOTAL RETURN PERIODS ENDED OCTOBER 31, 2012
| One Year | Five Year | Ten Year | |
| Hennessy Technology Fund – Investor Class | -1.75% | -2.42% | 7.74% |
| S&P 500 Index | 15.21% | 0.36% | 6.91% |
| NASDAQ Composite Index | 12.32% | 1.86% | 9.31% |
Gross expense ratio: 2.94%. Net expense ratio: 1.98%. Hennessy Advisors, Inc. has agreed to maintain this expense limitation through February 28, 2015.
Performance data quoted represents past performance; past performance does not guarantee future results. The investment return and principal value of an investment will fluctuate so that an investor’s shares, when redeemed, may be worth more or less than their original cost. Current performance of the fund may be lower or higher than the performance quoted. Performance data current to the most recent month end may be obtained by visiting www.hennessyfunds.com. Performance for periods prior to 10/26/12 is that of the FBR Technology Fund. Investment performance reflects fee waivers in effect. In the absence of such waivers, total return would be reduced. The gross and net expense ratios presented are from the most recent prospectus.
PERFORMANCE NARRATIVE
Portfolio Managers: David H. Ellison and Winsor H. Aylesworth
Over the previous twelve months, how did the Fund perform and what factors contributed to this performance?
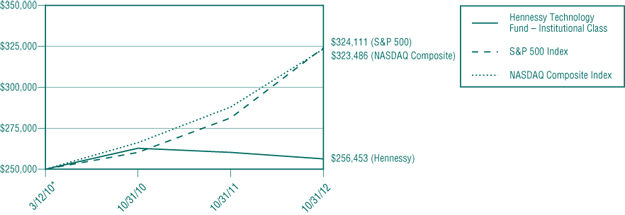
For the twelve-month period ended October 31, 2012, the Investor Class of the Hennessy Technology Fund returned -1.75%. This compares to the S&P 500 Index, the NASDAQ Composite Index and the Morningstar Technology Category Average, which returned 15.21%, 12.32% and 2.73% for the same period, respectively.
The Fund’s relatively breakeven performance clearly underperformed against the S&P 500 and NASDAQ indices. It performed better against its peer group but still fell short of the group’s average. Certainly the Fund’s approach of sticking with low leveraged, low debt and less volatile technology issues continued to provide investors with non-exceptional returns as the market seemed to prefer issues with riskier profiles.
Several holdings were major contributors to performance. 3D Systems Corp. (+167%) and Cirrus Logic, Inc. (+145%) were two such holdings. 3D Systems is involved in simplifying 3D design, while Cirrus is a semi-conductor manufacturer that is benefiting from the growth of the ever popular cell phone device market. Intel Corp. (-8%) was a significant detractor of performance. One of the main reasons Intel had so much impact was that it was a top 10 holding of the Fund.
Portfolio managers’ comments on the Fund and the related investment outlook:
In our opinion, the outlook for technology stocks continues to be good. As the world struggles with all the issues that make press headlines, most of the solutions involve some form of technology. Add to that the desire of the consumer to own the newest, best, fastest tech “gadget”, which means that there should always be a market for good growing technology firms in one’s portfolio. Our consistent approach to investing in technology companies that combine conservative balance sheets with above average growth in revenues and profits has the potential to reward investors. We thank you for your support.
CHANGE IN VALUE OF $10,000 INVESTMENT

This chart assumes an initial gross investment of $10,000 made on October 31, 2002. Returns shown include the reinvestment of all dividends. Returns shown do not reflect the deduction of taxes that a shareholder would pay on Fund distributions or the redemption of Fund shares.
WWW.HENNESSYFUNDS.COM
12
Hennessy Technology Fund (formerly FBR Technology Fund)
Institutional Class Shares (HTCIX)
AVERAGE ANNUAL TOTAL RETURN PERIODS ENDED OCTOBER 31, 2012
| Since Inception | ||
| One Year | (03/12/10) | |
| Hennessy Technology Fund – Institutional Class | -1.47% | 0.97% |
| S&P 500 Index | 15.21% | 10.34% |
| NASDAQ Composite Index | 12.32% | 10.25% |
Gross expense ratio: 2.56%. Net expense ratio: 1.73%. Hennessy Advisors, Inc. has agreed to maintain this expense limitation through February 28, 2015.
Performance data quoted represents past performance; past performance does not guarantee future results. The investment return and principal value of an investment will fluctuate so that an investor’s shares, when redeemed, may be worth more or less than their original cost. Current performance of the fund may be lower or higher than the performance quoted. Performance data current to the most recent month end may be obtained by visiting www.hennessyfunds.com. Performance for periods prior to 10/26/12 is that of the FBR Technology Fund. Investment performance reflects fee waivers in effect. In the absence of such waivers, total return would be reduced. The gross and net expense ratios presented are from the most recent prospectus.
CHANGE IN VALUE OF $250,000 INVESTMENT
* Inception date
This chart assumes an initial gross investment of $250,000 (minimum investment) made on March 12, 2010 (inception date of share class). Returns shown include the reinvestment of all dividends. Returns shown do not reflect the deduction of taxes that a shareholder would pay on Fund distributions or the redemption of Fund shares.
A non-diversified fund, one that may concentrate its assets in fewer holdings than a diversified fund, is more exposed to individual stock volatility than a diversified fund. Investments are focused in the technology industry, which may be adversely affected by rapidly changing technology, availability of capital, R&D, government regulation and the relatively high risks of obsolescence caused by scientific and technological advances. Investments in foreign securities may involve greater volatility and political, economic and currency risk and differences in accounting methods. The Fund may invest in IPO’s which will fluctuate considerably due to the absence of a prior public market and may have a magnified impact on the Fund. The Fund invests in small and medium capitalized companies, which involves additional risks such as limited liquidity and greater volatility.
NASDAQ Composite Index is a broad-based capitalization-weighted index of all the NASDAQ National Market and Small Cap stocks. The S&P 500 Index is an unmanaged index commonly used to measure the performance of U.S. stocks. One cannot invest directly in an index.
References to specific securities should not be considered a recommendation to buy or sell any security. The Fund’s composition, holdings and sector allocations are shown as a percentage of the Fund’s total net assets and are subject to change. Please refer to the Schedule of Investments in this report.
Each Morningstar category average represents a universe of funds with similar investment objectives. © 2012 Morningstar, Inc. All Rights Reserved. The information contained herein: 1) is proprietary to Morningstar; 2) may not be copied or distributed and 3) is not warranted to be accurate, complete or timely. Neither Morningstar nor its content providers are responsible for any damages or losses arising from any use of this information. Past performance does not guarantee future results.
HENNESSY FUNDS 1-800-966-4354
13
Hennessy Equity and Income Fund (formerly FBR Balanced Fund)
Investor Class Shares (HEIFX)
AVERAGE ANNUAL TOTAL RETURN PERIODS ENDED OCTOBER 31, 2012
| One Year | Five Year | Ten Year | |
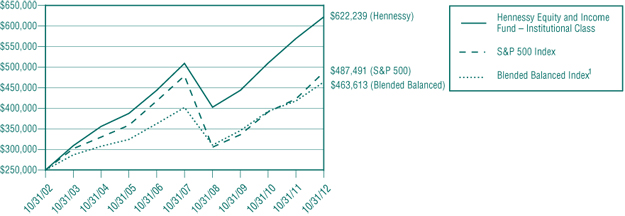
| Hennessy Equity and Income Fund – Investor Class | 9.01% | 3.85% | 9.29% |
| S&P 500 Index | 15.21% | 0.36% | 6.91% |
Blended Balanced Index1 | 10.85% | 2.88% | 6.37% |
Gross expense ratio: 1.34%.
Performance data quoted represents past performance; past performance does not guarantee future results. The investment return and principal value of an investment will fluctuate so that an investor’s shares, when redeemed, may be worth more or less than their original cost. Current performance of the fund may be lower or higher than the performance quoted. Performance data current to the most recent month end may be obtained by visiting www.hennessyfunds.com. Performance for periods prior to 10/26/12 is that of the FBR Balanced Fund. Performance for periods prior to March 12, 2010 is that of the AFBA 5 Star Balanced Fund. The gross expense ratio presented is that from the most recent prospectus.
PERFORMANCE NARRATIVE
For the twelve-month period ended October 31, 2012, the Investor Class of the Hennessy Equity and Income Fund returned 9.01%. This compares to the S&P 500 Index, the Blended Balanced Index1 and the Morningstar Moderate Allocation Category Average which returned 15.21%, 10.85% and 9.47% for the same period, respectively.
The London Company: Sub-Advisors of the Equity Portion of the Fund
Portfolio Managers: Stephen M. Goddard, CFA®, Jonathan T. Moody, CFA®, J. Brian Campbell, CFA®, Mark DeVaul, CFA®, CPA and Tom Megson. Mr. Goddard is the lead Portfolio Manager for the Fund.
What factors contributed to the performance of the equity portion of the Hennessy Equity and Income Fund?
The London Company’s goal is to provide top quartile risk adjusted returns over full market cycles. It has not been uncommon for the portfolio to lag somewhat when the market has made strong upward moves, like we have seen over the past year. The portfolio generally kept pace with the market until the last three months of the period, when higher beta and lower dividend paying stocks dominated the market’s performance. In our opinion, this should prove to be a short term phenomenon. We have found that the best way for us to provide value to our clients is through our efforts to protect our portfolio when the market experiences downside turbulence. Frequently, this has meant giving up some upside when the market was strong. However, experience has shown us that investing for the long term and focusing on, what in our opinion are, superior businesses with strong balance sheets run by shareholder oriented management teams has been the best approach as we seek to preserve and grow purchasing power over time.
Over the past year, both sector allocation and stock selection have been negative contributors to relative performance. The market sectors that performed well during the last year returned two to three times as much as the bottom performing sectors in many cases. The top performing sectors included the Telecommunications, Healthcare, and Consumer Discretionary sectors while the laggards included the Energy, Materials and Utilities sectors.
The top sector detractor for the portfolio was Information Technology, driven by stock selection. Notable detractors included Dell, Inc., Corning, Inc., Intel Corp. and Cisco Systems, Inc., which gave up a portion of last year’s gains. We believe the latter three companies are sound franchises currently selling at attractive values.
The largest sector contributor was from Materials, where strong stock selection more than offset sector allocation. NewMarket Corp., in particular, continues to perform well after a strong year last year. The company recently announced a special dividend. Other notable contributors include Wells Fargo & Co., Visa, Inc., Wal-Mart Stores, Inc. and Verizon Communications, Inc.
Portfolio managers’ comments on the equity portion of the Fund and the related investment outlook:
As prudent managers of capital, we focus on fundamental facts and guard against speculation. While there are many headline concerns and fears, including the “fiscal cliff”, slowing GDP growth, European sovereign debt, and Middle East angst, they are already well known. It is the out-of-left-field events that usually catch the markets off guard. Positive attributes in the market include visible progress in housing and services, underleveraged corporate balance sheets, attractive valuations and healthy merger premiums. Should we experience dividend growth, stock buybacks, and premiums from acquisitions, this could result in equity returns leading other asset classes. Free cash flow yields of many stocks that we follow have been 10% and above. The spread to 10-year U.S. Treasuries, which recently yielded 1.7%, is breathtaking. Equity risk premiums have rarely been greater, due to the continuing outflow from stock funds to bond funds and the low allocation to U.S. equities by investors of all stripes.
| 1 | The Blended Balanced Index consists of 60% common stocks represented by the S&P 500 Index and 40% bonds represented by the Barclays Capital Intermediate U.S. Government/Credit Index. |
WWW.HENNESSYFUNDS.COM
14
Looking forward, it is our view that confidence, not credit, is what needs to increase. Confidence comes from having stable and transparent tax policy and regulatory rules. With policy certainty, corporations should part with their excess cash to hire and expand. Equity returns should continue to outpace inflation and the returns of other mainstream, liquid asset classes given reasonable valuations and investor demand for income and, more importantly, growth in income. Payout ratios are at multi-decade lows and many companies have room to substantially boost their dividends. In fact, we have recently seen several companies pay a special dividend and we would not be surprised to see more of this as we approach the end of the year. Dividends continue to grow and should remain, we believe, key determinants of outperformance in a low interest rate world.
Financial Counselors, Inc.: Sub-Advisors of the Fixed Income Portion of the Fund
Portfolio Managers: Gary B. Cloud, CFA® and Peter G. Greig, CFA®
What factors contributed to the performance of the fixed income portion of the Hennessy Equity and Income Fund?
A pro-cyclical asset allocation in the Fund helped performance due to an overweight in corporate bonds and an underweight in U.S. Treasury securities. Higher yielding fixed income securities in the portfolio boosted the interest income component of total return, adding to performance. The duration, convexity and roll down component of total return had a neutral effect on Fund performance. The amortization and pay down effect had the largest negative impact on Fund performance.
Portfolio managers’ comments on the fixed income portion of the Fund and the related investment outlook.
The investment climate over the last twelve months was fairly tame as the numbing effect of Quantitative Easing leveled out many of the real economic and political uncertainties impacting markets. Federal Reserve (“Fed”) policy makers continued their aggressive monetary policy initiatives and extended the projected timeline for zero interest rates until the 2nd quarter of 2015. Ten-Year Treasury yields declined approximately .45% during the period and ended at 1.72%.
Many of the issues dogging financial markets over the last year remain unresolved. Peripheral and Core European sovereign debt dynamics continue to spin wildly for Greece, Spain and Italy. Investors are unclear whether the European Union will backstop countries who have already received a bailout and how the Outright Monetary Transaction program will be implemented and funded for Spain and possibly Italy. Politics, unfunded social safety nets and unsustainable debt dynamics continue to be significant market drivers on both sides of the Atlantic.
A status quo U.S. election cycle has left the political class in America staring at the same individuals across the bargaining table, discussing the same unresolved issues with neither side seemingly able to bridge their ideological differences. Clearly, the minority party is on the defensive and they will need to be part of an increase in the U.S. statutory debt limit, which must be approved during the first few months of 2013. A balanced agreement that raises revenues and begins to deal with long term entitlement spending issues would be positive for financial markets. A weak agreement that raises the debt ceiling, but doesn’t address long term spending issues, will likely lead to further downgrades to U.S. credit metrics.
All of these issues have a big impact on the Fund’s security holdings and portfolio positioning. The range of possible outcomes from the immense number of economic, political and geo-political variables is high. The 10-Year Treasury yield could find its way to 1.25% or lower under one set of circumstances and over 2.25% under another. Therefore, the portfolio has been structured to emphasize liquidity and quality in its holdings, which should allow for rapid repositioning as conditions change.
The Fed has committed to keeping the Fund’s rate low for a number of years, even with a recovering economy and a lower employment rate, which has yet to happen in any material way. Therefore, the Fund has invested in securities that we believe provide good income potential over Treasuries, and we expect to continue that positioning into 2013.
Corporations have remained liquid with large cash balances and have favorable access to low funding rates in the market. Dividend pay-out ratios are low and EBITA (Earnings Before Interest, Taxes and Amortization) coverage ratios are high by historical measures. These factors have led the Fund to be overweight credit sensitive fixed income securities. We believe this sector should continue to provide solid return potential for investors.
One potential risk in the bond market in the next year or so is an unwelcome back-up in Treasury rates for reasons unrelated to inflation and stronger economic growth. An example would be investors’ concern about the level and trajectory of the U.S. federal debt dynamics. We will continue to monitor these events and be on alert for any material change in sentiment toward U.S. debt obligations.
HENNESSY FUNDS 1-800-966-4354
15
CHANGE IN VALUE OF $10,000 INVESTMENT
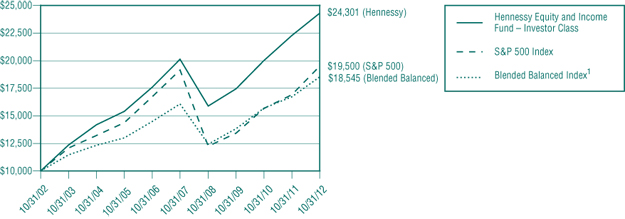
This chart assumes an initial gross investment of $10,000 made on October 31, 2002. Returns shown include the reinvestment of all dividends. Returns shown do not reflect the deduction of taxes that a shareholder would pay on Fund distributions or the redemption of Fund shares.
Hennessy Equity and Income Fund (formerly FBR Balanced Fund)
Institutional Class Shares (HEIIX)
AVERAGE ANNUAL TOTAL RETURN PERIODS ENDED OCTOBER 31, 2012
| One Year | Five Year | Ten Year | |
| Hennessy Equity and Income Fund – Institutional Class | 9.23% | 4.10% | 9.55% |
| S&P 500 Index | 15.21% | 0.36% | 6.91% |
Blended Balanced Index1 | 10.85% | 2.88% | 6.37% |
Gross expense ratio: 1.06%.
Performance data quoted represents past performance; past performance does not guarantee future results. The investment return and principal value of an investment will fluctuate so that an investor’s shares, when redeemed, may be worth more or less than their original cost. Current performance of the fund may be lower or higher than the performance quoted. Performance data current to the most recent month end may be obtained by visiting www.hennessyfunds.com. Performance for periods prior to 10/26/12 is that of the FBR Balanced Fund. Performance for periods prior to March 12, 2010 is that of the AFBA 5 Star Balanced Fund. The gross expense ratio presented is that from the most recent prospectus.
CHANGE IN VALUE OF $250,000 INVESTMENT
This chart assumes an initial gross investment of $250,000 (minimum investment) made on October 31, 2002. Returns shown include the reinvestment of all dividends. Returns shown do not reflect the deduction of taxes that a shareholder would pay on Fund distributions or the redemption of Fund shares.
WWW.HENNESSYFUNDS.COM
16
Investments in debt securities typically decrease in value when interest rates rise. The risk is greater for longer term debt securities. Investment by the Fund in lower-rated and non-rated securities presents a greater risk of loss to principal and interest than higher-rated securities. Investments in Asset-Backed and Mortgage-Backed securities include additional risks that investors should be aware of including credit risk, prepayment risk, possible illiquidity and default, as well as increased susceptibility to adverse economic developments. Investments in foreign securities may involve greater volatility and political, economic and currency risk and differences in accounting methods. The Fund may invest in IPO’s which will fluctuate considerably due to the absence of a prior public market and may have a magnified impact on the Fund.
References to specific securities should not be considered a recommendation to buy or sell any security. The Fund’s composition, holdings and sector allocations are shown as a percentage of the Fund’s total net assets and are subject to change. Please refer to the Schedule of Investments in this report.
Duration is a commonly used measure of the potential volatility of the price of a debt security, or the aggregate market value of a portfolio of debt securities, prior to maturity. Securities with a longer duration generally have more volatile prices than securities of comparable quality with a shorter duration. Free cash flow is revenue less operating expenses including interest expense and maintenance capital spending. It is the discretionary cash that a company has after all expenses and is available for purposes such as dividend payments, investing back into the business or share repurchases. Beta measures the sensitivity of rates of return on a fund to general market movements.
Each Morningstar category average represents a universe of funds with similar investment objectives. © 2012 Morningstar, Inc. All Rights Reserved. The information contained herein: 1) is proprietary to Morningstar; 2) may not be copied or distributed and 3) is not warranted to be accurate, complete or timely. Neither Morningstar nor its content providers are responsible for any damages or losses arising from any use of this information. Past performance does not guarantee future results.
| 1 | The Blended Balanced Index consists of 60% common stocks represented by the S&P 500 Index and 40% bonds represented by the Barclays Capital Intermediate U.S. Government/Credit Index. The S&P 500 is an unmanaged index commonly used to measure the performance of U.S. stocks. One cannot invest directly in an index. |
HENNESSY FUNDS 1-800-966-4354
17
Hennessy Core Bond Fund (formerly FBR Core Bond Fund)
Investor Class Shares (HCBFX)
AVERAGE ANNUAL TOTAL RETURN PERIODS ENDED OCTOBER 31, 2012
| One Year | Five Year | Ten Year | |
| Hennessy Core Bond Fund – Investor Class | 7.38% | 6.10% | 7.31% |
| Barclays Capital Intermediate U.S. Government/Credit Index | 4.24% | 5.59% | 4.81% |
Gross expense ratio: 2.02%. Net expense ratio: 1.51%. Hennessy Advisors, Inc. has agreed to maintain this expense limitation through February 28, 2015.
Performance data quoted represents past performance; past performance does not guarantee future results. The investment return and principal value of an investment will fluctuate so that an investor’s shares, when redeemed, may be worth more or less than their original cost. Current performance of the fund may be lower or higher than the performance quoted. Performance data current to the most recent month end may be obtained by visiting www.hennessyfunds.com. Performance for periods prior to 10/26/12 is that of the FBR Core Bond Fund. Performance for periods prior to March 12, 2010 is that of the AFBA 5 Star Total Return Bond Fund. Investment performance reflects fee waivers in effect. In the absence of such waivers, total return would be reduced. The gross and net expense ratios presented are from the most recent prospectus.
PERFORMANCE NARRATIVE
Financial Counselors, Inc.: Sub-Advisor. Portfolio Managers: Gary B. Cloud, CFA® and Peter G. Greig, CFA®
Over the previous twelve months, how did the Fund perform and what factors contributed to this performance?
For the twelve-month period ended October 31, 2012, the Investor Class of the Hennessy Core Bond Fund returned 7.38%. This compares to the Barclays Capital Intermediate U.S. Government/Credit Index and the Morningstar Intermediate Term Bond Category Average which returned 4.24% and 7.38% for the same period, respectively.
A pro-cyclical asset allocation in the Fund helped performance due to an overweight in corporate bonds and an underweight in U.S. Treasury securities. Higher yielding fixed income securities in the portfolio boosted the interest income component of total return, adding to performance. The duration, convexity and roll down component of total return had a neutral effect on Fund performance. The amortization and pay down effect had the largest negative impact on Fund performance.
Portfolio managers’ comments on the Fund and the related investment outlook:
The investment climate over the last twelve months was fairly tame as the numbing effect of Quantitative Easing leveled out many of the real economic and political uncertainties impacting markets. Federal Reserve (“Fed”) policy makers continued their aggressive monetary policy initiatives and extended the projected timeline for zero interest rates until the 2nd quarter of 2015. Ten-Year Treasury yields declined approximately .45% during the period and ended at 1.72%.
Many of the issues dogging financial markets over the last year remain unresolved. Peripheral and Core European sovereign debt dynamics continue to spin wildly for Greece, Spain and Italy. Investors are unclear whether the European Union will backstop countries who have already received a bailout and how the Outright Monetary Transaction program will be implemented and funded for Spain and possibly Italy. Politics, unfunded social safety nets and unsustainable debt dynamics continue to be significant market drivers on both sides of the Atlantic.
A status quo U.S. election cycle has left the political class in America staring at the same individuals across the bargaining table, discussing the same unresolved issues with neither side seemingly able to bridge their ideological differences. Clearly, the minority party is on the defensive, and they will need to be part of an increase in the U.S. statutory debt limit, which must be approved during the first few months of 2013. A balanced agreement that raises revenues and begins to deal with long term entitlement spending issues would be positive for financial markets. A weak agreement that raises the debt ceiling, but doesn’t address long term spending issues, will likely lead to further downgrades to U.S. credit metrics.
All of these issues have a big impact on the Fund’s security holdings and portfolio positioning. The range of possible outcomes from the immense number of economic, political and geo-political variables is high. The 10-Year Treasury yield could find its way to 1.25% or lower under one set of circumstances and over 2.25% under another. Therefore, the portfolio has been structured to emphasize liquidity and quality in its holdings, which should allow for rapid repositioning as conditions change.
The Fed has committed to keeping the Fund’s rate low for a number of years, even with a recovering economy and a lower employment rate, which has yet to happen in any material way. Therefore, the Fund has invested in securities that we believe provide good income potential over Treasuries, and we expect to continue that positioning into 2013.
Corporations have remained liquid with large cash balances and have favorable access to low funding rates in the market. Dividend pay-out ratios are low and EBITA (Earnings Before Interest, Taxes and Amortization) coverage ratios are high by historical measures. These factors have led the Fund to be overweight credit sensitive fixed income securities. We believe this sector should continue to provide solid return potential for investors.
One potential risk in the bond market in the next year or so is an unwelcome back-up in Treasury rates for reasons unrelated to inflation and stronger economic growth. An example would be investors’ concern about the level and trajectory of the U.S. federal debt dynamics. We will continue to monitor these events and be on alert for any material change in sentiment toward U.S. debt obligations.
WWW.HENNESSYFUNDS.COM
18
CHANGE IN VALUE OF $10,000 INVESTMENT
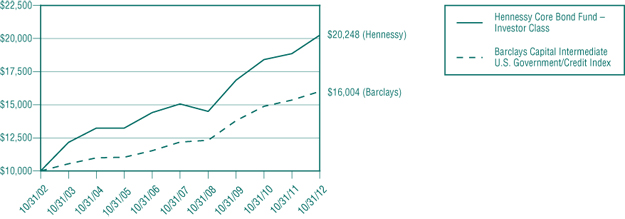
This chart assumes an initial gross investment of $10,000 made on October 31, 2002. Returns shown include the reinvestment of all dividend and other distributions. Returns shown do not reflect the deduction of taxes that a shareholder would pay on Fund distributions or the redemption of Fund shares.
HENNESSY FUNDS 1-800-966-4354
19
Hennessy Core Bond Fund (formerly FBR Core Bond Fund)
Institutional Class Shares (HCBIX)
AVERAGE ANNUAL TOTAL RETURN PERIODS ENDED OCTOBER 31, 2012
| One Year | Five Year | Ten Year | |
| Hennessy Core Bond Fund – Institutional Class | 7.63% | 6.34% | 7.58% |
| Barclays Capital Intermediate U.S. Government/Credit Index | 4.24% | 5.59% | 4.81% |
Gross expense ratio: 1.52%. Net expense ratio: 1.26%. Hennessy Advisors, Inc. has agreed to maintain this expense limitation through February 28, 2015.
Performance data quoted represents past performance; past performance does not guarantee future results. The investment return and principal value of an investment will fluctuate so that an investor’s shares, when redeemed, may be worth more or less than their original cost. Current performance of the fund may be lower or higher than the performance quoted. Performance data current to the most recent month end may be obtained by visiting www.hennessyfunds.com. Performance for periods prior to 10/26/12 is that of the FBR Core Bond Fund. Performance for periods prior to March 12, 2010 is that of the AFBA 5 Star Total Return Bond Fund. Investment performance reflects fee waivers in effect. In the absence of such waivers, total return would be reduced. The gross and net expense ratios presented are from the most recent prospectus.
CHANGE IN VALUE OF $250,000 INVESTMENT
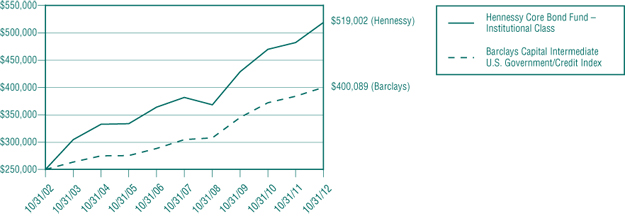
This chart assumes an initial gross investment of $250,000 (minimum investment) made on October 31, 2002. Returns shown include the reinvestment of all dividend and other distributions. Returns shown do not reflect the deduction of taxes that a shareholder would pay on Fund distributions or the redemption of Fund shares.
Investments in debt securities typically decrease in value when interest rates rise. The risk is greater for longer term debt securities. Investment by the Fund in lower-rated and non-rated securities presents a greater risk of loss to principal and interest than higher-rated securities. Investments in Asset-Backed and Mortgage-Backed securities include additional risks that investors should be aware of including credit risk, prepayment risk, possible illiquidity and default, as well as increased susceptibility to adverse economic developments. Investments in foreign securities may involve greater volatility and political, economic and currency risk and differences in accounting methods. The Fund may invest in IPO’s which will fluctuate considerably due to the absence of a prior public market and may have a magnified impact on the Fund.
The Barclays Capital Intermediate U.S. Government/Credit Total Return Index is an unmanaged index commonly used to measure the performance of U.S. bonds. One cannot invest directly in an index.
References to specific securities should not be considered a recommendation to buy or sell any security. The Fund’s composition, holdings and sector allocations are shown as a percentage of the Fund’s total net assets and are subject to change. Please refer to the Schedule of Investments in this report.
Duration is a commonly used measure of the potential volatility of the price of a debt security, or the aggregate market value of a portfolio of debt securities, prior to maturity. Securities with a longer duration generally have more volatile prices than securities of comparable quality with a shorter duration.
Each Morningstar category average represents a universe of funds with similar investment objectives. © 2012 Morningstar, Inc. All Rights Reserved. The information contained herein: 1) is proprietary to Morningstar; 2) may not be copied or distributed and 3) is not warranted to be accurate, complete or timely. Neither Morningstar nor its content providers are responsible for any damages or losses arising from any use of this information. Past performance does not guarantee future results.
WWW.HENNESSYFUNDS.COM
20
(This Page Intentionally Left Blank.)
HENNESSY FUNDS 1-800-966-4354
21
Schedule of Investments
HENNESSY FOCUS FUND
(formerly FBR Focus Fund)
As of October 31, 2012
(% of Net Assets)
| TOP TEN EQUITY HOLDINGS | % net assets | |
| American Tower Corp. | 9.92% | |
| Markel Corp. | 8.22% | |
| O’Reilly Automotive, Inc. | 7.97% | |
| CarMax, Inc. | 7.91% | |
| Bally Technologies, Inc. | 7.43% | |
| Penn National Gaming, Inc. | 7.18% | |
| News Corp. | 5.75% | |
| Aon PLC | 5.19% | |
| Google, Inc. | 4.98% | |
| World Fuel Services Corp. | 3.80% |
Note: For presentation purposes, the Fund has grouped some of the industry categories. For purposes of categorizing securities for compliance with Section 8(b)(1) of the Investment Company Act of 1940, the Fund uses more specific industry classifications.
WWW.HENNESSYFUNDS.COM
22
| COMMON STOCKS – 80.86% | Number of | % of | ||||||||||||
| Shares | Value | Net Assets | ||||||||||||
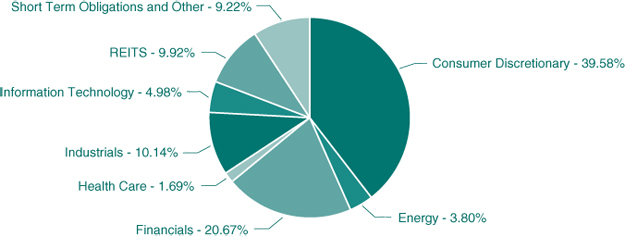
| Consumer Discretionary – 39.58% | ||||||||||||||
| Bally Technologies, Inc. (a) | 1,169,000 | $ | 58,356,480 | 7.43 | % | |||||||||
| CarMax, Inc. (a) | 1,840,088 | 62,102,970 | 7.91 | % | ||||||||||
| Dick’s Sporting Goods, Inc. | 30,000 | 1,500,000 | 0.19 | % | ||||||||||
| Lamar Advertising Co., Class A (a) | 630,000 | 24,727,500 | 3.15 | % | ||||||||||
| News Corp., Class A | 1,886,000 | 45,113,120 | 5.75 | % | ||||||||||
| O’Reilly Automotive, Inc. (a) | 730,000 | 62,546,400 | 7.97 | % | ||||||||||
| Penn National Gaming, Inc. (a) | 1,393,670 | 56,346,078 | 7.18 | % | ||||||||||
| 310,692,548 | 39.58 | % | ||||||||||||
| Energy – 3.80% | ||||||||||||||
| World Fuel Services Corp. | 859,150 | 29,812,505 | 3.80 | % | ||||||||||
| Financials – 20.67% | ||||||||||||||
| Aon PLC | 755,000 | 40,732,250 | 5.19 | % | ||||||||||
| Diamond Hill Investment Group, Inc. | 94,910 | 7,306,172 | 0.93 | % | ||||||||||
| Markel Corp. (a) | 136,640 | 64,485,881 | 8.22 | % | ||||||||||
| Marlin Business Services Corp. | 454,839 | 10,274,813 | 1.31 | % | ||||||||||
| T. Rowe Price Group, Inc. | 125,000 | 8,117,500 | 1.03 | % | ||||||||||
| The Charles Schwab Corp. | 2,017,000 | 27,390,860 | 3.49 | % | ||||||||||
| White River Capital, Inc. | 173,137 | 3,917,225 | 0.50 | % | ||||||||||
| 162,224,701 | 20.67 | % | ||||||||||||
| Health Care – 1.69% | ||||||||||||||
| Henry Schein, Inc. (a) | 180,000 | 13,280,400 | 1.69 | % | ||||||||||
| Industrials – 10.14% | ||||||||||||||
| American Woodmark Corp. (a) | 680,160 | 15,643,680 | 1.99 | % | ||||||||||
| Encore Capital Group, Inc. (a) | 528,337 | 15,321,773 | 1.95 | % | ||||||||||
| Roadrunner Transportation | ||||||||||||||
| Systems, Inc. (a) | 904,200 | 15,760,206 | 2.01 | % | ||||||||||
| Simpson Manufacturing Company, Inc. | 850,000 | 25,891,000 | 3.30 | % | ||||||||||
| UTi Worldwide, Inc. | 500,000 | 6,945,000 | 0.89 | % | ||||||||||
| 79,561,659 | 10.14 | % | ||||||||||||
| Information Technology – 4.98% | ||||||||||||||
| Google, Inc., Class A (a) | 57,500 | 39,086,775 | 4.98 | % | ||||||||||
| Total Common Stocks | ||||||||||||||
| (Cost $363,928,738) | 634,658,588 | 80.86 | % | |||||||||||
| REITS – 9.92% | ||||||||||||||
| Financials – 9.92% | ||||||||||||||
| American Tower Corp., Class A | 1,034,000 | 77,849,860 | 9.92 | % | ||||||||||
Total Reits (Cost $5,433,992) | 77,849,860 | 9.92 | % | |||||||||||
| SHORT-TERM INVESTMENTS – 9.33% | ||||||||||||||
| Money Market Fund – 9.33% | ||||||||||||||
| Federated Government Obligations | ||||||||||||||
| Fund – Class I, 0.01% (b) | 35,215,396 | 35,215,396 | 4.49 | % | ||||||||||
| Fidelity Institutional Money Market | ||||||||||||||
| Government Portfolio – Class I, | ||||||||||||||
| 0.01% (b) | 38,000,000 | 38,000,000 | 4.84 | % | ||||||||||
| Total Money Market Fund | ||||||||||||||
| (Cost $73,215,396) | 73,215,396 | 9.33 | % | |||||||||||
| Total Short-Term Investments | ||||||||||||||
| (Cost $73,215,396) | 73,215,396 | 9.33 | % | |||||||||||
| Total Investments | ||||||||||||||
| (Cost $442,578,126) – 100.11% | 785,723,844 | 100.11 | % | |||||||||||
| Liabilities in Excess | ||||||||||||||
| of Other Assets – (0.11)% | (838,651 | ) | (0.11 | )% | ||||||||||
TOTAL NET ASSETS – 100.00% | $ | 784,885,193 | 100.00 | % | ||||||||||
Percentages are stated as a percent of net assets.
(a)Non-income producing security.
(b)The rate listed is the fund’s 7-day yield as of October 31, 2012.
The accompanying notes are an integral part of these financial statements.
HENNESSY FUNDS 1-800-966-4354
23
Summary of Fair Value Exposure at October 31, 2012
The following is a summary of the inputs used to value the Fund’s net assets as of October 31, 2012 (See Note 4 in the accompanying notes to the financial statements):
| Common Stock | Level 1 | Level 2 | Level 3 | Total | ||||||||||||
| Consumer Discretionary | $ | 310,692,548 | $ | — | $ | — | $ | 310,692,548 | ||||||||
| Energy | 29,812,505 | — | — | 29,812,505 | ||||||||||||
| Financials | 158,307,476 | 3,917,225 | — | 162,224,701 | ||||||||||||
| Health Care | 13,280,400 | — | — | 13,280,400 | ||||||||||||
| Industrials | 79,561,659 | — | — | 79,561,659 | ||||||||||||
| Information Technology | 39,086,775 | — | — | 39,086,775 | ||||||||||||
| Total Common Stock | $ | 630,741,363 | $ | 3,917,225 | $ | — | $ | 634,658,588 | ||||||||
| REITS | ||||||||||||||||
| Financials | $ | 77,849,860 | $ | — | $ | — | $ | 77,849,860 | ||||||||
| Total REITS | $ | 77,849,860 | $ | — | $ | — | $ | 77,849,860 | ||||||||
| Short-Term Investments | ||||||||||||||||
| Money Market Funds | $ | 73,215,396 | $ | — | $ | — | $ | 73,215,396 | ||||||||
| Total Short-Term Investments | $ | 73,215,396 | $ | — | $ | — | $ | 73,215,396 | ||||||||
| Total Investments in Securities | $ | 781,806,619 | $ | 3,917,225 | $ | — | $ | 785,723,844 | ||||||||
Transfers between levels are recognized at the end of the reporting period. During the period ended October 31, 2012, the Fund recognized transfers between levels 1 and 2.
Level 2 Reconciliation Disclosure
The following amounts were transferred in/(out) of Level 2 assets:
| Total Common Stock | ||||
| Transfers into Level 2 | $ | 3,917,225 | ||
| Transfers out of Level 2 | — | |||
| Net transfers in and/or (out) of Level 2 | $ | 3,917,225 | ||
The accompanying notes are an integral part of these financial statements.
WWW.HENNESSYFUNDS.COM
24
HENNESSY GAS UTILITY INDEX FUND
(formerly FBR Gas Utility Index Fund)
As of October 31, 2012
(% of Net Assets)
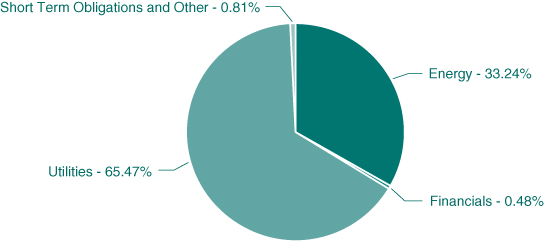
| TOP TEN EQUITY HOLDINGS | % net assets | |
| TransCanada Corp. | 5.07% | |
| Spectra Energy Corp. | 5.00% | |
| National Grid PLC | 4.97% | |
| The Williams Companies, Inc. | 4.95% | |
| Enbridge, Inc. | 4.93% | |
| Kinder Morgan, Inc. | 4.92% | |
| Energy Transfer Equity, LP | 4.91% | |
| ONEOK, Inc. | 4.73% | |
| Sempra Energy | 4.71% | |
| Dominion Resources, Inc. | 4.49% |
Note: For presentation purposes, the Fund has grouped some of the industry categories. For purposes of categorizing securities for compliance with Section 8(b)(1) of the Investment Company Act of 1940, the Fund uses more specific industry classifications.
HENNESSY FUNDS 1-800-966-4354
25
| COMMON STOCKS – 99.19% | Number of | % of | |||||||||||
| Shares | Value | Net Assets | |||||||||||
| Energy – 33.24% | |||||||||||||
| Cheniere Energy, Inc. (a) | 1,031,133 | $ | 16,590,930 | 2.22 | % | ||||||||
| Enbridge, Inc. | 925,401 | 36,803,198 | 4.93 | % | |||||||||
| Energen Corp. | 94,129 | 4,391,118 | 0.59 | % | |||||||||
| Energy Transfer Equity, LP | 832,256 | 36,627,587 | 4.91 | % | |||||||||
| EQT Corp. | 80,410 | 4,875,258 | 0.65 | % | |||||||||
| Kinder Morgan, Inc. | 1,058,904 | 36,754,558 | 4.92 | % | |||||||||
| Spectra Energy Corp. | 1,293,997 | 37,357,693 | 5.00 | % | |||||||||
| The Williams Companies, Inc. | 1,056,092 | 36,952,659 | 4.95 | % | |||||||||
| TransCanada Corp. | 837,877 | 37,897,177 | 5.07 | % | |||||||||
| 248,250,178 | 33.24 | % | |||||||||||
| Financials – 0.48% | |||||||||||||
| Berkshire Hathaway, Inc., Class A (a) | 28 | 3,626,140 | 0.48 | % | |||||||||
| Utilities – 65.47% | |||||||||||||
| AGL Resources, Inc. | 542,470 | 22,149,050 | 2.97 | % | |||||||||
| ALLETE, Inc. | 1,625 | 67,633 | 0.01 | % | |||||||||
| Alliant Energy Corp. | 55,492 | 2,480,492 | 0.33 | % | |||||||||
| Ameren Corp. | 87,890 | 2,889,823 | 0.39 | % | |||||||||
| Atmos Energy Corp. | 472,745 | 17,004,638 | 2.28 | % | |||||||||
| Avista Corp. | 67,099 | 1,705,657 | 0.23 | % | |||||||||
| Black Hills Corp. | 44,600 | 1,595,342 | 0.21 | % | |||||||||
| CenterPoint Energy, Inc. | 824,873 | 17,874,998 | 2.39 | % | |||||||||
| CH Energy Group, Inc. | 18,380 | 1,195,251 | 0.16 | % | |||||||||
| Chesapeake Utilities Corp. | 40,416 | 1,898,340 | 0.25 | % | |||||||||
| CMS Energy Corp. | 446,148 | 10,850,319 | 1.45 | % | |||||||||
| Consolidated Edison, Inc. | 266,970 | 16,119,649 | 2.16 | % | |||||||||
| Corning Natural Gas Corp. | 13,085 | 248,610 | 0.03 | % | |||||||||
| Delta Natural Gas Company, Inc. | 36,690 | 721,325 | 0.10 | % | |||||||||
| Dominion Resources, Inc. | 635,556 | 33,544,646 | 4.49 | % | |||||||||
| DTE Energy Co. | 184,715 | 11,470,802 | 1.54 | % | |||||||||
| Duke Energy Corp. | 81,837 | 5,375,873 | 0.72 | % | |||||||||
| Entergy Corp. | 7,650 | 555,237 | 0.07 | % | |||||||||
| Exelon Corp. | 261,581 | 9,359,368 | 1.25 | % | |||||||||
| Gas Natural, Inc. | 32,956 | 328,901 | 0.04 | % | |||||||||
| Integrys Energy Group, Inc. | 217,521 | 11,754,835 | 1.57 | % | |||||||||
| MDU Resources Group, Inc. | 354,285 | 7,698,613 | 1.03 | % | |||||||||
| MGE Energy, Inc. | 20,017 | 1,053,695 | 0.14 | % | |||||||||
| National Fuel Gas Co. | 284,398 | 14,987,775 | 2.01 | % | |||||||||
| National Grid PLC – ADR | 650,706 | 37,096,749 | 4.97 | % | |||||||||
| New Jersey Resources Corp. | 172,342 | 7,662,325 | 1.03 | % | |||||||||
| NiSource, Inc. | 987,943 | 25,162,908 | 3.37 | % | |||||||||
| Northeast Utilities | 115,375 | 4,534,238 | 0.61 | % | |||||||||
| Northwest Natural Gas Co. | 138,197 | 6,430,306 | 0.86 | % | |||||||||
| NV Energy, Inc. | 35,750 | 679,607 | 0.09 | % | |||||||||
| ONEOK, Inc. | 745,996 | 35,285,611 | 4.73 | % | |||||||||
| Pepco Holdings, Inc. | 42,704 | 848,528 | 0.11 | % | |||||||||
| PG&E Corp. | 587,109 | 24,963,875 | 3.34 | % | |||||||||
| Piedmont Natural Gas Company, Inc. | 408,276 | 13,011,756 | 1.74 | % | |||||||||
| PPL Corp. | 71,735 | 2,121,921 | 0.28 | % | |||||||||
| Public Service Enterprise Group, Inc. | 489,176 | 15,673,199 | 2.10 | % | |||||||||
| Questar Corp. | 770,015 | 15,585,104 | 2.09 | % | |||||||||
| RGC Resources, Inc. | 26,517 | 474,654 | 0.06 | % | |||||||||
| SCANA Corp. | 118,823 | 5,831,833 | 0.78 | % | |||||||||
| Sempra Energy | 504,255 | 35,171,786 | 4.71 | % | |||||||||
| South Jersey Industries, Inc. | 124,581 | 6,302,553 | 0.84 | % | |||||||||
| Southwest Gas Corp. | 247,701 | 10,767,562 | 1.44 | % | |||||||||
| TECO Energy, Inc. | 153,390 | 2,741,079 | 0.37 | % | |||||||||
| The Empire District Electric Co. | 16,500 | 358,215 | 0.05 | % | |||||||||
| The Laclede Group, Inc. | 107,349 | 4,470,012 | 0.60 | % | |||||||||
| UGI Corp. | 189,875 | 6,131,064 | 0.82 | % | |||||||||
| UIL Holdings Corp. | 115,204 | 4,166,929 | 0.56 | % | |||||||||
| Unitil Corp. | 39,075 | 1,039,004 | 0.14 | % | |||||||||
| UNS Energy Corp. | 13,980 | 596,107 | 0.08 | % | |||||||||
| Vectren Corp. | 170,916 | 5,053,986 | 0.68 | % | |||||||||
| WGL Holdings, Inc. | 252,332 | 10,035,244 | 1.35 | % | |||||||||
| Wisconsin Energy Corp. | 139,460 | 5,365,026 | 0.72 | % | |||||||||
| Xcel Energy, Inc. | 298,497 | 8,432,540 | 1.13 | % | |||||||||
| 488,924,593 | 65.47 | % | |||||||||||
| Total Common Stocks | |||||||||||||
| (Cost $542,831,237) | 740,800,911 | 99.19 | % | ||||||||||
| SHORT-TERM INVESTMENTS – 0.59% | |||||||||||||
| Money Market Fund – 0.59% | |||||||||||||
| Fidelity Institutional Money Market | |||||||||||||
| Government Portfolio – Class I, | |||||||||||||
| 0.01% (b) | 4,388,486 | 4,388,486 | 0.59 | % | |||||||||
| Total Money Market Fund | |||||||||||||
| (Cost $4,388,486) | 4,388,486 | 0.59 | % | ||||||||||
| Total Short-Term Investments | |||||||||||||
| (Cost $4,388,486) | 4,388,486 | 0.59 | % | ||||||||||
| Total Investments | |||||||||||||
| (Cost $547,219,723) – 99.78% | 745,189,397 | 99.78 | % | ||||||||||
| Other Assets in | |||||||||||||
| Excess of Liabilities – 0.22% | 1,631,035 | 0.22 | % | ||||||||||
TOTAL NET ASSETS – 100.00% | $ | 746,820,432 | 100.00 | % | |||||||||
Percentages are stated as a percent of net assets.
(a)Non-income producing security.
(b)The rate listed is the fund’s 7-day yield as of October 31, 2012.
ADR – American Depositary Receipt
The accompanying notes are an integral part of these financial statements.
WWW.HENNESSYFUNDS.COM
26
Summary of Fair Value Exposure at October 31, 2012
The following is a summary of the inputs used to value the Fund’s net assets as of October 31, 2012 (See Note 4 in the accompanying notes to the financial statements):
| Common Stock | Level 1 | Level 2 | Level 3 | Total | ||||||||||||
| Energy | $ | 248,250,178 | $ | — | $ | — | $ | 248,250,178 | ||||||||
| Financials | 3,626,140 | — | — | 3,626,140 | ||||||||||||
| Utilities | 488,675,983 | 248,610 | — | 488,924,593 | ||||||||||||
| Total Common Stock | $ | 740,552,301 | $ | 248,610 | $ | — | $ | 740,800,911 | ||||||||
| Short-Term Investments | ||||||||||||||||
| Money Market Funds | $ | 4,388,486 | $ | — | $ | — | $ | 4,388,486 | ||||||||
| Total Short-Term Investments | $ | 4,388,486 | $ | — | $ | — | $ | 4,388,486 | ||||||||
| Total Investments in Securities | $ | 744,940,787 | $ | 248,610 | $ | — | $ | 745,189,397 | ||||||||
Transfers between levels are recognized at the end of the reporting period. During the period ended October 31, 2012, the Fund recognized transfers between levels 1 and 2.
Level 2 Reconciliation Disclosure
The following amounts were transferred in/(out) of Level 2 assets:
| Total Common Stock | ||||
| Transfers into Level 2 | $ | 248,610 | ||
| Transfers out of Level 2 | — | |||
| Net transfers in and/or (out) of Level 2 | $ | 248,610 | ||
The accompanying notes are an integral part of these financial statements.
HENNESSY FUNDS 1-800-966-4354
27
HENNESSY SMALL CAP FINANCIAL FUND
(formerly FBR Small Cap Financial Fund)
As of October 31, 2012
(% of Net Assets)

| TOP TEN EQUITY HOLDINGS | % net assets | |
| Banner Corp. | 3.30% | |
| KB Home | 3.14% | |
| Hingham Institution for Savings | 3.04% | |
| KKR Financial Holdings LLC | 2.90% | |
| Sterling Financial Corp. | 2.87% | |
| Flushing Financial Corp. | 2.84% | |
| BankUnited, Inc. | 2.70% | |
| Washington Federal, Inc. | 2.50% | |
| CapitalSource, Inc. | 2.47% | |
| Encore Capital Group, Inc. | 2.47% |
Note: For presentation purposes, the Fund has grouped some of the industry categories. For purposes of categorizing securities for compliance with Section 8(b)(1) of the Investment Company Act of 1940, the Fund uses more specific industry classifications.
WWW.HENNESSYFUNDS.COM
28
| COMMON STOCKS – 91.36% | Number of | % of | |||||||||||
| Shares | Value | Net Assets | |||||||||||
| Consumer Discretionary – 3.14% | |||||||||||||
| KB Home | 415,000 | $ | 6,631,700 | 3.14 | % | ||||||||
| Financials – 81.70% | |||||||||||||
| Associated Banc-Corp. | 150,000 | 1,933,500 | 0.91 | % | |||||||||
| Astoria Financial Corp. | 495,000 | 4,964,850 | 2.35 | % | |||||||||
| BancorpSouth, Inc. | 95,000 | 1,344,250 | 0.64 | % | |||||||||
| BankUnited, Inc. | 240,000 | 5,690,400 | 2.70 | % | |||||||||
| Banner Corp. | 240,000 | 6,957,600 | 3.30 | % | |||||||||
| BBCN Bancorp, Inc. | 180,000 | 2,147,400 | 1.02 | % | |||||||||
| Brookline Bancorp, Inc. | 370,000 | 3,137,600 | 1.49 | % | |||||||||
| CapitalSource, Inc. | 660,000 | 5,220,600 | 2.47 | % | |||||||||
| Capitol Federal Financial | 150,000 | 1,786,500 | 0.85 | % | |||||||||
| Central Pacific Financial Corp. (a) | 77,409 | 1,112,367 | 0.53 | % | |||||||||
| City National Corp. | 35,000 | 1,788,500 | 0.85 | % | |||||||||
| Fifth Third Bancorp | 85,000 | 1,235,050 | 0.58 | % | |||||||||
| First Commonwealth Financial Corp. | 180,000 | 1,179,000 | 0.56 | % | |||||||||
| First Connecticut Bancorp, Inc. | 250,067 | 3,423,417 | 1.62 | % | |||||||||
| First Horizon National Corp. | 500,000 | 4,655,000 | 2.21 | % | |||||||||
| First Niagara Financial Group, Inc. | 385,000 | 3,187,800 | 1.51 | % | |||||||||
| FirstMerit Corp. | 25,000 | 346,500 | 0.16 | % | |||||||||
| Flagstar Bancorp, Inc. (a) | 260,000 | 3,588,000 | 1.70 | % | |||||||||
| Flushing Financial Corp. | 385,000 | 5,986,750 | 2.84 | % | |||||||||
| Fulton Financial Corp. | 400,000 | 3,888,000 | 1.84 | % | |||||||||
| Green Dot Corp., Class A (a) | 100,000 | 1,019,000 | 0.48 | % | |||||||||
| Hingham Institution for Savings | 94,331 | 6,409,792 | 3.04 | % | |||||||||
| HomeStreet, Inc. (a) | 70,000 | 3,134,600 | 1.49 | % | |||||||||
| IBERIABANK Corp. | 20,000 | 995,800 | 0.47 | % | |||||||||
| Independent Bank Corp. | 120,000 | 3,541,200 | 1.68 | % | |||||||||
| Investors Bancorp, Inc. | 20,000 | 359,800 | 0.17 | % | |||||||||
| KeyCorp | 190,000 | 1,599,800 | 0.76 | % | |||||||||
| KKR Financial Holdings LLC | 600,000 | 6,126,000 | 2.90 | % | |||||||||
| MB Financial, Inc. | 75,000 | 1,519,500 | 0.72 | % | |||||||||
| MBIA, Inc. (a) | 470,000 | 4,653,000 | 2.21 | % | |||||||||
| MGIC Investment Corp. (a) | 1,200,000 | 2,064,000 | 0.98 | % | |||||||||
| National Penn Bancshares, Inc. | 100,000 | 893,000 | 0.42 | % | |||||||||
| Netspend Holdings, Inc. (a) | 450,000 | 4,819,500 | 2.28 | % | |||||||||
| NorthStar Realty Finance Corp. | 700,000 | 4,599,000 | 2.18 | % | |||||||||
| Northwest Bancshares, Inc. | 205,000 | 2,439,500 | 1.16 | % | |||||||||
| OceanFirst Financial Corp. | 260,000 | 3,624,400 | 1.72 | % | |||||||||
| Ocwen Financial Corp. (a) | 65,000 | 2,507,050 | 1.19 | % | |||||||||
| People’s United Financial, Inc. | 55,000 | 661,650 | 0.31 | % | |||||||||
| Popular, Inc. (a) | 255,000 | 4,929,150 | 2.34 | % | |||||||||
| PrivateBancorp, Inc. | 140,000 | 2,262,400 | 1.07 | % | |||||||||
| Provident Financial Services, Inc. | 100,000 | 1,500,000 | 0.71 | % | |||||||||
| RAIT Financial Trust | 520,000 | 2,901,600 | 1.37 | % | |||||||||
| Rockville Financial, Inc. | 300,000 | 3,987,000 | 1.89 | % | |||||||||
| Sterling Financial Corp. | 285,000 | 6,059,100 | 2.87 | % | |||||||||
| Susquehanna Bancshares, Inc. | 470,000 | 4,873,900 | 2.31 | % | |||||||||
| Synovus Financial Corp. | 1,000,000 | 2,450,000 | 1.16 | % | |||||||||
| TCF Financial Corp. | 400,000 | 4,576,000 | 2.17 | % | |||||||||
| Territorial Bancorp, Inc. | 150,000 | 3,390,000 | 1.61 | % | |||||||||
| TFS Financial Corp. (a) | 190,000 | 1,700,500 | 0.81 | % | |||||||||
| United Community Banks (a) | 219,164 | 1,906,727 | 0.90 | % | |||||||||
| United Financial Bancorp, Inc. | 210,013 | 3,227,900 | 1.53 | % | |||||||||
| Valley National Bancorp | 25,000 | 243,500 | 0.12 | % | |||||||||
| Washington Federal, Inc. | 315,000 | 5,285,700 | 2.50 | % | |||||||||
| Webster Financial Corp. | 20,000 | 440,000 | 0.21 | % | |||||||||
| Wintrust Financial Corp. | 90,000 | 3,325,500 | 1.58 | % | |||||||||
| WSFS Financial Corp. | 56,803 | 2,405,891 | 1.14 | % | |||||||||
| Zions Bancorp. | 110,000 | 2,361,700 | 1.12 | % | |||||||||
| 172,366,244 | 81.70 | % | |||||||||||
| Industrials – 5.49% | |||||||||||||
| Encore Capital Group, Inc. (a) | 180,000 | 5,220,000 | 2.47 | % | |||||||||
| PHH Corp. (a) | 160,000 | 3,329,600 | 1.58 | % | |||||||||
| Portfolio Recovery Associates, Inc. (a) | 29,000 | 3,034,850 | 1.44 | % | |||||||||
| 11,584,450 | 5.49 | % | |||||||||||
| Information Technology – 1.03% | |||||||||||||
| MoneyGram International, Inc. (a) | 140,000 | 2,175,600 | 1.03 | % | |||||||||
| Total Common Stocks | |||||||||||||
| (Cost $169,114,949) | 192,757,994 | 91.36 | % | ||||||||||
| MUTUAL FUNDS – 0.89% | |||||||||||||
| American Capital Ltd. | 160,000 | 1,886,400 | 0.89 | % | |||||||||
Total Mutual Funds (Cost $1,395,555) | 1,886,400 | 0.89 | % | ||||||||||
| SHORT-TERM INVESTMENTS – 7.84% | |||||||||||||
| Money Market Fund – 7.84% | |||||||||||||
| Federated Government Obligations | |||||||||||||
| Fund – Class I, 0.01% (b) | 6,036,379 | 6,036,379 | 2.86 | % | |||||||||
| Fidelity Institutional Money Market | |||||||||||||
| Government Portfolio – Class I, | |||||||||||||
| 0.01% (b) | 10,500,000 | 10,500,000 | 4.98 | % | |||||||||
| Total Money Market Fund | |||||||||||||
| (Cost $16,536,379) | 16,536,379 | 7.84 | % | ||||||||||
| Total Short-Term Investments | |||||||||||||
| (Cost $16,536,379) | 16,536,379 | 7.84 | % | ||||||||||
| Total Investments | |||||||||||||
| (Cost $187,046,883) – 100.09% | 211,180,773 | 100.09 | % | ||||||||||
| Liabilities in Excess of | |||||||||||||
| Other Assets – (0.09)% | (185,706 | ) | (0.09 | )% | |||||||||
TOTAL NET ASSETS – 100.00% | $ | 210,995,067 | 100.00 | % | |||||||||
Percentages are stated as a percent of net assets.
(a)Non-income producing security.
(b)The rate listed is the fund’s 7-day yield as of October 31, 2012.
The accompanying notes are an integral part of these financial statements.
HENNESSY FUNDS 1-800-966-4354
29
Summary of Fair Value Exposure at October 31, 2012
The following is a summary of the inputs used to value the Fund’s net assets as of October 31, 2012 (See Note 4 in the accompanying notes to the financial statements):
| Common Stock | Level 1 | Level 2 | Level 3 | Total | ||||||||||||
| Consumer Discretionary | $ | 6,631,700 | $ | — | $ | — | $ | 6,631,700 | ||||||||
| Financials | 172,366,244 | — | — | 172,366,244 | ||||||||||||
| Industrials | 11,584,450 | — | — | 11,584,450 | ||||||||||||
| Information Technology | 2,175,600 | — | — | 2,175,600 | ||||||||||||
| Total Common Stock | $ | 192,757,994 | $ | — | $ | — | $ | 192,757,994 | ||||||||
| Mutual Funds | ||||||||||||||||
| Mutual Funds | $ | 1,886,400 | $ | — | $ | — | $ | 1,886,400 | ||||||||
| Total Mutual Funds | $ | 1,886,400 | $ | — | $ | — | $ | 1,886,400 | ||||||||
| Short-Term Investments | ||||||||||||||||
| Money Market Funds | $ | 16,536,379 | $ | — | $ | — | $ | 16,536,379 | ||||||||
| Total Short-Term Investments | $ | 16,536,379 | $ | — | $ | — | $ | 16,536,379 | ||||||||
| Total Investments in Securities | $ | 211,180,773 | $ | — | $ | — | $ | 211,180,773 | ||||||||
Transfers between levels are recognized at the end of the reporting period. During the period ended October 31, 2012, the Fund recognized no transfers between levels.
The accompanying notes are an integral part of these financial statements.
WWW.HENNESSYFUNDS.COM
30
HENNESSY LARGE CAP FINANCIAL FUND
(formerly FBR Large Cap Financial Fund)
As of October 31, 2012
(% of Net Assets)
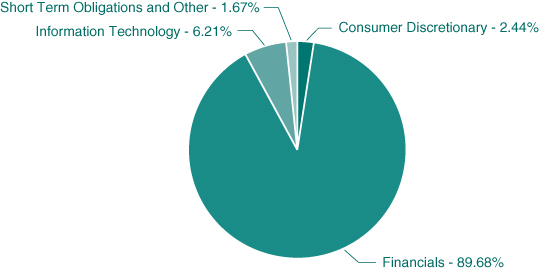
| TOP TEN EQUITY HOLDINGS | % net assets | |
| Citigroup, Inc. | 5.20% | |
| Bank of America Corp. | 5.19% | |
| JPMorgan Chase & Co. | 5.16% | |
| SunTrust Banks, Inc. | 4.63% | |
| Morgan Stanley | 4.57% | |
| Wells Fargo & Co. | 4.43% | |
| CIT Group, Inc. | 4.37% | |
| Capital One Financial Corp. | 4.37% | |
| KeyCorp | 4.23% | |
| Huntington Bancshares, Inc. | 3.95% |
Note: For presentation purposes, the Fund has grouped some of the industry categories. For purposes of categorizing securities for compliance with Section 8(b)(1) of the Investment Company Act of 1940, the Fund uses more specific industry classifications.
HENNESSY FUNDS 1-800-966-4354
31
| COMMON STOCKS – 98.33% | Number of | % of | |||||||||||||
| Shares | Value | Net Assets | |||||||||||||
| Consumer Discretionary – 2.44% | |||||||||||||||
| Lennar Corp. | 20,000 | $ | 749,400 | 1.16 | % | ||||||||||
| Toll Brothers, Inc. (a) | 25,000 | 825,250 | 1.28 | % | |||||||||||
| 1,574,650 | 2.44 | % | |||||||||||||
| Financials – 89.68% | |||||||||||||||
| American Express Co. | 28,000 | 1,567,160 | 2.42 | % | |||||||||||
| American International Group, Inc. (a) | 55,000 | 1,921,150 | 2.97 | % | |||||||||||
| Ameriprise Financial, Inc. | 10,000 | 583,700 | 0.90 | % | |||||||||||
| Bank of America Corp. | 360,000 | 3,355,200 | 5.19 | % | |||||||||||
| BB&T Corp. | 20,000 | 579,000 | 0.90 | % | |||||||||||
| Capital One Financial Corp. | 47,000 | 2,827,990 | 4.37 | % | |||||||||||
| CIT Group, Inc. (a) | 76,000 | 2,828,720 | 4.37 | % | |||||||||||
| Citigroup, Inc. | 90,000 | 3,365,100 | 5.20 | % | |||||||||||
| Comerica, Inc. | 80,000 | 2,384,800 | 3.69 | % | |||||||||||
| Discover Financial Services | 25,000 | 1,025,000 | 1.58 | % | |||||||||||
| Fifth Third Bancorp | 172,000 | 2,499,160 | 3.87 | % | |||||||||||
| Huntington Bancshares, Inc. | 400,000 | 2,556,000 | 3.95 | % | |||||||||||
| JPMorgan Chase & Co. | 80,000 | 3,334,400 | 5.16 | % | |||||||||||
| KeyCorp | 325,000 | 2,736,500 | 4.23 | % | |||||||||||
| Lincoln National Corp. | 20,000 | 495,800 | 0.77 | % | |||||||||||
| M&T Bank Corp. | 18,000 | 1,873,800 | 2.90 | % | |||||||||||
| MetLife, Inc. | 25,000 | 887,250 | 1.37 | % | |||||||||||
| Morgan Stanley | 170,000 | 2,954,600 | 4.57 | % | |||||||||||
| New York Community Bancorp, Inc. | 25,000 | 346,500 | 0.54 | % | |||||||||||
| Prudential Financial, Inc. | 10,000 | 570,500 | 0.88 | % | |||||||||||
| Regions Financial Corp. | 350,000 | 2,282,000 | 3.53 | % | |||||||||||
| SunTrust Banks, Inc. | 110,000 | 2,992,000 | 4.63 | % | |||||||||||
| The Blackstone Group LP | 95,000 | 1,459,200 | 2.26 | % | |||||||||||
| The Charles Schwab Corp. | 30,000 | 407,400 | 0.63 | % | |||||||||||
| The Goldman Sachs Group, Inc. | 15,000 | 1,835,850 | 2.84 | % | |||||||||||
| The PNC Financial Services Group, Inc. | 40,000 | 2,327,600 | 3.60 | % | |||||||||||
| The Travelers Companies, Inc. | 10,000 | 709,400 | 1.10 | % | |||||||||||
| U.S. Bancorp (b) | 65,000 | 2,158,650 | 3.34 | % | |||||||||||
| Wells Fargo & Co. | 85,000 | 2,863,650 | 4.43 | % | |||||||||||
| Zions Bancorp. | 105,000 | 2,254,350 | 3.49 | % | |||||||||||
| 57,982,430 | 89.68 | % | |||||||||||||
| Information Technology – 6.21% | |||||||||||||||
| Alliance Data Systems Corp. (a) | 4,000 | 572,200 | 0.88 | % | |||||||||||
| MasterCard, Inc., Class A | 3,000 | 1,382,790 | 2.14 | % | |||||||||||
| Total System Services, Inc. | 30,000 | 674,700 | 1.04 | % | |||||||||||
| Visa, Inc., Class A | 10,000 | 1,387,600 | 2.15 | % | |||||||||||
| 4,017,290 | 6.21 | % | |||||||||||||
| Total Common Stocks | |||||||||||||||
| (Cost $55,975,454) | 63,574,370 | 98.33 | % | ||||||||||||
| SHORT-TERM INVESTMENTS – 1.77% | |||||||||||||||
| Money Market Fund – 1.77% | |||||||||||||||
| Fidelity Institutional Money Market | |||||||||||||||
| Government Portfolio – Class I, | |||||||||||||||
| 0.01% (c) | 1,146,076 | 1,146,076 | 1.77 | % | |||||||||||
| Total Money Market Fund | |||||||||||||||
| (Cost $1,146,076) | 1,146,076 | 1.77 | % | ||||||||||||
| Total Short-Term Investments | |||||||||||||||
| (Cost $1,146,076) | 1,146,076 | 1.77 | % | ||||||||||||
| Total Investments | |||||||||||||||
| (Cost $57,121,530) – 100.10% | 64,720,446 | 100.10 | % | ||||||||||||
| Liabilities in Excess of | |||||||||||||||
| Other Assets – (0.10)% | (64,555 | ) | (0.10 | )% | |||||||||||
TOTAL NET ASSETS – 100.00% | $ | 64,655,891 | 100.00 | % | |||||||||||
Percentages are stated as a percent of net assets.
| (a) | Non-income producing security. |
| (b) | Investment in affiliated security. Quasar Distributors, LLC, which serves as the Fund’s distributor, is a subsidiary of U.S. Bancorp. Details of transactions with this affiliated company for the year ended October 31, 2012, are as follows: |
| Issuer | U.S. Bancorp |
| Beginning Cost | $1,753,019 |
| Purchase Cost | $1,031,566 |
| Sales Cost | $1,095,702 |
| Ending Cost | $1,688,883 |
| Dividend Income | $59,925 |
| Shares | 65,000 |
| Market Value | $2,158,650 |
| (c) | The rate listed is the fund’s 7-day yield as of October 31, 2012. |
The accompanying notes are an integral part of these financial statements.
WWW.HENNESSYFUNDS.COM
32
Summary of Fair Value Exposure at October 31, 2012
The following is a summary of the inputs used to value the Fund’s net assets as of October 31, 2012 (See Note 4 in the accompanying notes to the financial statements):
| Common Stock | Level 1 | Level 2 | Level 3 | Total | ||||||||||||
| Consumer Discretionary | $ | 1,574,650 | $ | — | $ | — | $ | 1,574,650 | ||||||||
| Financials | 57,982,430 | — | — | 57,982,430 | ||||||||||||
| Information Technology | 4,017,290 | — | — | 4,017,290 | ||||||||||||
| Total Common Stock | $ | 63,574,370 | $ | — | $ | — | $ | 63,574,370 | ||||||||
| Short-Term Investments | ||||||||||||||||
| Money Market Funds | $ | 1,146,076 | $ | — | $ | — | $ | 1,146,076 | ||||||||
| Total Short-Term Investments | $ | 1,146,076 | $ | — | $ | — | $ | 1,146,076 | ||||||||
| Total Investments in Securities | $ | 64,720,446 | $ | — | $ | — | $ | 64,720,446 | ||||||||
Transfers between levels are recognized at the end of the reporting period. During the period ended October 31, 2012, the Fund recognized no transfers between levels.
The accompanying notes are an integral part of these financial statements.
HENNESSY FUNDS 1-800-966-4354
33
HENNESSY TECHNOLOGY FUND
(formerly FBR Technology Fund)
As of October 31, 2012
(% of Net Assets)
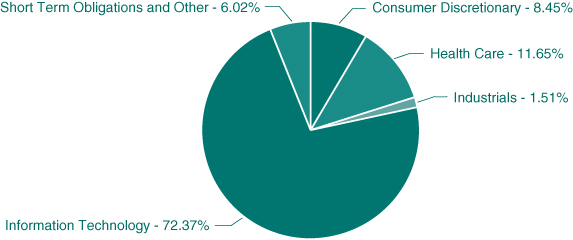
| TOP TEN EQUITY HOLDINGS | % net assets | |
| Microsoft Corp. | 4.40% | |
| Visa, Inc. | 4.32% | |
| QUALCOMM, Inc. | 4.31% | |
| Amazon.com, Inc. | 4.29% | |
| Google, Inc. | 4.21% | |
| Oracle Corp. | 4.20% | |
| Intel Corp. | 4.18% | |
| priceline.com, Inc. | 4.16% | |
| eBay, Inc. | 4.16% | |
| Cisco Systems, Inc. | 4.14% |
Note: For presentation purposes, the Fund has grouped some of the industry categories. For purposes of categorizing securities for compliance with Section 8(b)(1) of the Investment Company Act of 1940, the Fund uses more specific industry classifications.
WWW.HENNESSYFUNDS.COM
34
| COMMON STOCKS – 93.98% | Number of | % of | |||||||||||
| Shares | Value | Net Assets | |||||||||||
| Consumer Discretionary – 8.45% | |||||||||||||
| Amazon.com, Inc. (a) | 990 | $ | 230,492 | 4.29 | % | ||||||||
| priceline.com, Inc. (a) | 390 | 223,770 | 4.16 | % | |||||||||
| 454,262 | 8.45 | % | |||||||||||
| Health Care – 11.65% | |||||||||||||
| Alexion Pharmaceuticals, Inc. (a) | 1,765 | 159,521 | 2.97 | % | |||||||||
| athenahealth, Inc. (a) | 525 | 33,752 | 0.63 | % | |||||||||
| Catamaran Corp. (a) | 1,165 | 54,941 | 1.02 | % | |||||||||
| Cerner Corp. (a) | 1,555 | 118,475 | 2.21 | % | |||||||||
| HealthStream, Inc. (a) | 1,125 | 28,733 | 0.53 | % | |||||||||
| Intuitive Surgical, Inc. (a) | 362 | 196,284 | 3.65 | % | |||||||||
| Myriad Genetics, Inc. (a) | 1,305 | 34,152 | 0.64 | % | |||||||||
| 625,858 | 11.65 | % | |||||||||||
| Industrials – 1.51% | |||||||||||||
| Quanta Services, Inc. (a) | 2,000 | 51,860 | 0.96 | % | |||||||||
| Westport Innovations, Inc. (a) | 1,050 | 29,463 | 0.55 | % | |||||||||
| 81,323 | 1.51 | % | |||||||||||
| Information Technology – 72.37% | |||||||||||||
| 3D Systems Corp. (a) | 735 | 31,973 | 0.60 | % | |||||||||
| Analog Devices, Inc. | 2,725 | 106,575 | 1.98 | % | |||||||||
| Apple, Inc. | 248 | 147,585 | 2.75 | % | |||||||||
| Applied Materials, Inc. | 11,310 | 119,886 | 2.23 | % | |||||||||
| Aruba Networks, Inc. (a) | 1,805 | 32,797 | 0.61 | % | |||||||||
| Automatic Data Processing, Inc. | 3,850 | 222,491 | 4.14 | % | |||||||||
| Cirrus Logic, Inc. (a) | 770 | 31,385 | 0.58 | % | |||||||||
| Cisco Systems, Inc. | 12,995 | 222,734 | 4.14 | % | |||||||||
| Cognizant Technology | |||||||||||||
| Solutions Corp., Class A (a) | 2,727 | 181,755 | 3.38 | % | |||||||||
| CoStar Group, Inc. (a) | 365 | 30,258 | 0.56 | % | |||||||||
| Datawatch Corp. (a) | 1,710 | 29,874 | 0.56 | % | |||||||||
| eBay, Inc. (a) | 4,630 | 223,583 | 4.16 | % | |||||||||
| Equinix, Inc. (a) | 440 | 79,380 | 1.48 | % | |||||||||
| Fortinet, Inc. (a) | 1,640 | 31,767 | 0.59 | % | |||||||||
| Google, Inc., Class A (a) | 333 | 226,363 | 4.21 | % | |||||||||
| iGATE Corp. (a) | 2,075 | 33,304 | 0.62 | % | |||||||||
| Intel Corp. | 10,380 | 224,467 | 4.18 | % | |||||||||
| IPG Photonics Corp. (a) | 510 | 27,071 | 0.50 | % | |||||||||
| KLA-Tencor Corp. | 1,535 | 71,408 | 1.33 | % | |||||||||
| Liquidity Services, Inc. (a) | 765 | 31,541 | 0.59 | % | |||||||||
| LivePerson, Inc. (a) | 2,160 | 33,890 | 0.63 | % | |||||||||
| MICROS Systems, Inc. (a) | 685 | 31,092 | 0.58 | % | |||||||||
| Microsoft Corp. | 8,290 | 236,555 | 4.40 | % | |||||||||
| MIPS Technologies, Inc. (a) | 4,140 | 28,939 | 0.54 | % | |||||||||
| NetApp, Inc. (a) | 3,325 | 89,443 | 1.66 | % | |||||||||
| Netgear, Inc. (a) | 955 | 33,912 | 0.63 | % | |||||||||
| NeuStar, Inc. (a) | 810 | 29,638 | 0.55 | % | |||||||||
| Oracle Corp. | 7,270 | 225,733 | 4.20 | % | |||||||||
| PROS Holdings, Inc. (a) | 1,158 | 22,384 | 0.42 | % | |||||||||
| QUALCOMM, Inc. | 3,955 | 231,664 | 4.31 | % | |||||||||
| Red Hat, Inc. (a) | 1,775 | 87,277 | 1.62 | % | |||||||||
| RF Industries Ltd | 7,278 | 32,096 | 0.60 | % | |||||||||
| salesforce.com, Inc. (a) | 1,265 | 184,665 | 3.44 | % | |||||||||
| SolarWinds, Inc. (a) | 675 | 34,148 | 0.64 | % | |||||||||
| Sourcefire, Inc. (a) | 725 | 31,023 | 0.58 | % | |||||||||
| Syntel, Inc. | 564 | 33,620 | 0.63 | % | |||||||||
| Teradyne, Inc. (a) | 2,265 | 33,114 | 0.62 | % | |||||||||
| Ultratech, Inc. (a) | 1,150 | 35,547 | 0.66 | % | |||||||||
| Visa, Inc., Class A | 1,675 | 232,423 | 4.32 | % | |||||||||
| Western Digital Corp. | 2,300 | 78,729 | 1.46 | % | |||||||||
| WEX, Inc. (a) | 500 | 36,890 | 0.69 | % | |||||||||
| 3,888,979 | 72.37 | % | |||||||||||
| Total Common Stocks | |||||||||||||
| (Cost $4,960,725) | 5,050,422 | 93.98 | % | ||||||||||
| SHORT-TERM INVESTMENTS – 6.70% | |||||||||||||
| Money Market Fund – 6.70% | |||||||||||||
| Federated Government Obligations | |||||||||||||
| Fund – Class I, 0.01% (b) | 90,194 | 90,194 | 1.68 | % | |||||||||
| Fidelity Institutional Money Market | |||||||||||||
| Government Portfolio – Class I, | |||||||||||||
| 0.01% (b) | 270,000 | 270,000 | 5.02 | % | |||||||||
| Total Money Market Fund | |||||||||||||
| (Cost $360,194) | 360,194 | 6.70 | % | ||||||||||
| Total Short-Term Investments | |||||||||||||
| (Cost $360,194) | 360,194 | 6.70 | % | ||||||||||
| Total Investments | �� | ||||||||||||
| (Cost $5,320,919) – 100.68% | 5,410,616 | 100.68 | % | ||||||||||
| Liabilities in Excess of | |||||||||||||
| Other Assets – (0.68)% | (36,572 | ) | (0.68 | )% | |||||||||
TOTAL NET ASSETS – 100.00% | $ | 5,374,044 | 100.00 | % | |||||||||
Percentages are stated as a percent of net assets.
(a)Non-income producing security.
(b)The rate listed is the fund’s 7-day yield as of October 31, 2012.
The accompanying notes are an integral part of these financial statements.
HENNESSY FUNDS 1-800-966-4354
35
Summary of Fair Value Exposure at October 31, 2012
The following is a summary of the inputs used to value the Fund’s net assets as of October 31, 2012 (See Note 4 in the accompanying notes to the financial statements):
| Common Stock | Level 1 | Level 2 | Level 3 | Total | ||||||||||||
| Consumer Discretionary | $ | 454,262 | $ | — | $ | — | $ | 454,262 | ||||||||
| Health Care | 625,858 | — | — | 625,858 | ||||||||||||
| Industrials | 81,323 | — | — | 81,323 | ||||||||||||
| Information Technology | 3,888,979 | — | — | 3,888,979 | ||||||||||||
| Total Common Stock | $ | 5,050,422 | $ | — | $ | — | $ | 5,050,422 | ||||||||
| Short-Term Investments | ||||||||||||||||
| Money Market Funds | $ | 360,194 | $ | — | $ | — | $ | 360,194 | ||||||||
| Total Short-Term Investments | $ | 360,194 | $ | — | $ | — | $ | 360,194 | ||||||||
| Total Investments in Securities | $ | 5,410,616 | $ | — | $ | — | $ | 5,410,616 | ||||||||
Transfers between levels are recognized at the end of the reporting period. During the period ended October 31, 2012, the Fund recognized no transfers between levels.
The accompanying notes are an integral part of these financial statements.
WWW.HENNESSYFUNDS.COM
36
HENNESSY EQUITY AND INCOME FUND
(formerly FBR Balanced Fund)
As of October 31, 2012
(% of Net Assets)
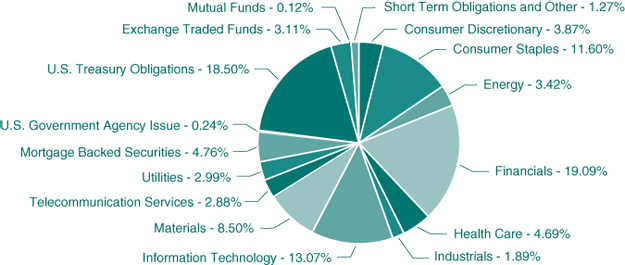
| TOP TEN HOLDINGS | % net assets | |
| U.S. Treasury Note, 4.125%, 5/15/2015 | 4.27% | |
| U.S. Treasury Note, 2.250%, 5/31/2014 | 3.22% | |
| NewMarket Corp. | 3.05% | |
| U.S. Treasury Bond, 3.125%, 2/15/2042 | 2.46% | |
| Albemarle Corp. | 2.20% | |
| Bristol-Myers Squibb Co. | 2.19% | |
| Wells Fargo & Co. | 2.16% | |
| Dominion Resources, Inc. | 2.16% | |
| Verizon Communications, Inc. | 2.13% | |
| CarMax, Inc. | 2.03% |
Note: For presentation purposes, the Fund has grouped some of the industry categories. For purposes of categorizing securities for compliance with Section 8(b)(1) of the Investment Company Act of 1940, the Fund uses more specific industry classifications.
HENNESSY FUNDS 1-800-966-4354
37
| COMMON STOCKS – 53.02% | Number of | % of | |||||||||||
| Shares | Value | Net Assets | |||||||||||
| Consumer Discretionary – 3.30% | |||||||||||||
| CarMax, Inc. (a) | 183,681 | $ | 6,199,234 | 2.03 | % | ||||||||
| Lowes Companies, Inc. | 120,173 | 3,891,201 | 1.27 | % | |||||||||
| 10,090,435 | 3.30 | % | |||||||||||
| Consumer Staples – 11.13% | |||||||||||||
| Altria Group, Inc. | 156,700 | 4,983,060 | 1.63 | % | |||||||||
| Brown-Forman Corp., Class B | 31,273 | 2,003,348 | 0.66 | % | |||||||||
| Energizer Holdings, Inc. (a) | 62,597 | 4,567,703 | 1.50 | % | |||||||||
| Lorillard, Inc. | 24,643 | 2,858,834 | 0.94 | % | |||||||||
| Philip Morris International, Inc. | 39,105 | 3,463,139 | 1.13 | % | |||||||||
| Reynolds American, Inc. | 97,076 | 4,042,245 | 1.32 | % | |||||||||
| The Coca-Cola Co. | 127,720 | 4,748,630 | 1.55 | % | |||||||||
| The Hershey Co. | 27,973 | 1,925,941 | 0.63 | % | |||||||||
| Wal-Mart Stores, Inc. | 72,073 | 5,406,916 | 1.77 | % | |||||||||
| 33,999,816 | 11.13 | % | |||||||||||
| Energy – 3.30% | |||||||||||||
| Chevron Corp. | 54,601 | 6,017,576 | 1.97 | % | |||||||||
| ConocoPhillips | 49,755 | 2,878,327 | 0.94 | % | |||||||||
| Phillips 66 | 24,874 | 1,173,058 | 0.39 | % | |||||||||
| 10,068,961 | 3.30 | % | |||||||||||
| Financials – 7.64% | |||||||||||||
| Alexander & Baldwin, Inc. (a) | 85,703 | 2,479,388 | 0.81 | % | |||||||||
| Berkshire Hathaway, Inc., Class B (a) | 68,295 | 5,897,273 | 1.93 | % | |||||||||
| Eaton Vance Corp. | 205,410 | 5,780,237 | 1.89 | % | |||||||||
| PennantPark Investment Corp. | 19,000 | 209,000 | 0.07 | % | |||||||||
| Wells Fargo & Co. | 196,089 | 6,606,239 | 2.16 | % | |||||||||
| White Mountains Insurance Group Ltd. | 4,623 | 2,370,212 | 0.78 | % | |||||||||
| 23,342,349 | 7.64 | % | |||||||||||
| Health Care – 3.39% | |||||||||||||
| Bristol-Myers Squibb Co. | 201,058 | 6,685,178 | 2.19 | % | |||||||||
| Pfizer, Inc. | 146,948 | 3,654,597 | 1.20 | % | |||||||||
| 10,339,775 | 3.39 | % | |||||||||||
| Industrials – 1.31% | |||||||||||||
| ACCO Brands Corp. (a) | 61,446 | 444,869 | 0.15 | % | |||||||||
| FedEx Corp. | 37,579 | 3,456,892 | 1.13 | % | |||||||||
| Matson, Inc. | 3,913 | 83,152 | 0.03 | % | |||||||||
| 3,984,913 | 1.31 | % | |||||||||||
| Information Technology – 10.85% | |||||||||||||
| Cisco Systems, Inc. | 281,313 | 4,821,705 | 1.58 | % | |||||||||
| Corning, Inc. | 382,781 | 4,497,677 | 1.47 | % | |||||||||
| EMC Corp. (a) | 249,520 | 6,093,278 | 2.00 | % | |||||||||
| Intel Corp. | 232,224 | 5,021,844 | 1.64 | % | |||||||||
| International Business Machines Corp. | 20,165 | 3,922,698 | 1.28 | % | |||||||||
| Microsoft Corp. | 158,202 | 4,514,294 | 1.48 | % | |||||||||
| Visa, Inc., Class A | 30,733 | 4,264,511 | 1.40 | % | |||||||||
| 33,136,007 | 10.85 | % | |||||||||||
Materials – 7.09% | |||||||||||||
| Albemarle Corp. | 121,772 | 6,710,855 | 2.20 | % | |||||||||
| MeadWestvaco Corp. | 188,821 | 5,606,096 | 1.84 | % | |||||||||
| NewMarket Corp. | 34,378 | 9,327,095 | 3.05 | % | |||||||||
| 21,644,046 | 7.09 | % | |||||||||||
| Telecommunication Services – 2.13% | |||||||||||||
| Verizon Communications, Inc. | 145,511 | 6,495,611 | 2.13 | % | |||||||||
| Utilities – 2.88% | |||||||||||||
| Dominion Resources, Inc. | 125,149 | 6,605,364 | 2.16 | % | |||||||||
| Duke Energy Corp. | 33,546 | 2,203,637 | 0.72 | % | |||||||||
| 8,809,001 | 2.88 | % | |||||||||||
| Total Common Stocks | |||||||||||||
| (Cost $141,852,592) | 161,910,914 | 53.02 | % | ||||||||||
| PREFERRED STOCKS – 0.01% | |||||||||||||
| Financials – 0.01% | |||||||||||||
| Federal National Mortgage Association, | |||||||||||||
| Perpetual, Series S, 8.250%, 12/31/2015 | 10,600 | 18,020 | 0.01 | % | |||||||||
| Total Preferred Stocks | |||||||||||||
| (Cost $265,000) | 18,020 | 0.01 | % | ||||||||||
| REITS – 2.36% | |||||||||||||
| Financials – 2.36% | |||||||||||||
| Apollo Commercial Real | |||||||||||||
| Estate Finance, Inc. | 7,000 | 118,370 | 0.04 | % | |||||||||
| Chimera Investment Corp. | 115,000 | 307,050 | 0.10 | % | |||||||||
| Hatteras Financial Corp. | 131,141 | 3,576,215 | 1.17 | % | |||||||||
| Starwood Property Trust, Inc. | 4,500 | 103,140 | 0.03 | % | |||||||||
| UDR, Inc. | 128,371 | 3,115,564 | 1.02 | % | |||||||||
Total Reits (Cost $7,057,220) | 7,220,339 | 2.36 | % | ||||||||||
| CORPORATE BONDS – 16.61% | |||||||||||||
| Consumer Discretionary – 0.57% | |||||||||||||
| Best Buy Company, Inc. | |||||||||||||
| 6.750%, 07/15/2013 | 300,000 | 306,802 | 0.10 | % | |||||||||
| Comcast Corp. | |||||||||||||
| 4.950%, 06/15/2016 | 600,000 | 682,928 | 0.22 | % | |||||||||
| Marriott International, Inc., Series J | |||||||||||||
| 5.625%, 02/15/2013 | 150,000 | 151,916 | 0.05 | % | |||||||||
| Starbucks Corp. | |||||||||||||
| 6.250%, 08/15/2017 | 300,000 | 367,475 | 0.12 | % | |||||||||
| The Home Depot, Inc. | |||||||||||||
| 5.400%, 03/01/2016 | 200,000 | 230,528 | 0.08 | % | |||||||||
| 1,739,649 | 0.57 | % | |||||||||||
| Consumer Staples – 0.47% | |||||||||||||
| Anheuser-Busch InBev Worldwide, Inc. | |||||||||||||
| 7.750%, 01/15/2019 | 150,000 | 203,758 | 0.07 | % | |||||||||
| CVS Caremark Corp. | |||||||||||||
| 4.750%, 05/18/2020 | 400,000 | 471,966 | 0.16 | % | |||||||||
| Diageo Capital PLC | |||||||||||||
| 7.375%, 01/15/2014 | 350,000 | 378,131 | 0.12 | % | |||||||||
The accompanying notes are an integral part of these financial statements.
WWW.HENNESSYFUNDS.COM
38
| CORPORATE BONDS | Number of | % of | |||||||||||
| Shares | Value | Net Assets | |||||||||||
| Consumer Staples (Continued) | |||||||||||||
| Wal-Mart Stores, Inc. | |||||||||||||
| 5.000%, 10/25/2040 | 300,000 | $ | 368,863 | 0.12 | % | ||||||||
| 1,422,718 | 0.47 | % | |||||||||||
| Energy – 0.12% | |||||||||||||
| Devon Energy Corp. | |||||||||||||
| 5.625%, 01/15/2014 | 200,000 | 212,190 | 0.07 | % | |||||||||
| Husky Energy, Inc. | |||||||||||||
| 5.900%, 06/15/2014 | 150,000 | 162,018 | 0.05 | % | |||||||||
| 374,208 | 0.12 | % | |||||||||||
| Financials – 9.08% | |||||||||||||
| Aflac, Inc. | |||||||||||||
| 8.500%, 05/15/2019 | 650,000 | 884,436 | 0.29 | % | |||||||||
| American Express Credit Corp. | |||||||||||||
| 2.750%, 09/15/2015 | 650,000 | 685,684 | 0.22 | % | |||||||||
| American Express Credit Corp., Series C | |||||||||||||
| 7.300%, 08/20/2013 | 60,000 | 63,238 | 0.02 | % | |||||||||
| American International Group, Inc. | |||||||||||||
| 4.250%, 09/15/2014 | 270,000 | 286,060 | 0.09 | % | |||||||||
| 5.850%, 01/16/2018 | 575,000 | 673,357 | 0.22 | % | |||||||||
| Associated Banc-Corp | |||||||||||||
| 5.125%, 03/28/2016 | 700,000 | 768,149 | 0.25 | % | |||||||||
| Associates Corporation of North America | |||||||||||||
| 6.950%, 11/01/2018 | 300,000 | 362,870 | 0.12 | % | |||||||||
| Bank of Montreal | |||||||||||||
| 2.500%, 01/11/2017 | 400,000 | 421,486 | 0.14 | % | |||||||||
| Capital One Financial Corp. | |||||||||||||
| 4.750%, 07/15/2021 | 1,000,000 | 1,149,437 | 0.38 | % | |||||||||
| Caterpillar Financial Services Corp. | |||||||||||||
| 4.900%, 08/15/2013 | 325,000 | 336,496 | 0.11 | % | |||||||||
| Citigroup, Inc. | |||||||||||||
| 6.125%, 11/21/2017 | 1,455,000 | 1,727,773 | 0.57 | % | |||||||||
| CME Group, Inc. | |||||||||||||
| 5.750%, 02/15/2014 | 375,000 | 399,492 | 0.13 | % | |||||||||
| Credit Suisse USA, Inc. | |||||||||||||
| 5.125%, 08/15/2015 | 575,000 | 638,219 | 0.21 | % | |||||||||
| Discover Financial Services | |||||||||||||
| 5.200%, 04/27/2022 (b) | 900,000 | 1,018,544 | 0.33 | % | |||||||||
| Fifth Third Bancorp | |||||||||||||
| 3.625%, 01/25/2016 | 700,000 | 754,872 | 0.25 | % | |||||||||
| First Niagara Financial Group, Inc. | |||||||||||||
| 6.750%, 03/19/2020 | 590,000 | 692,220 | 0.23 | % | |||||||||
| General Electric Capital Corp. | |||||||||||||
| 5.500%, 06/04/2014 | 250,000 | 268,993 | 0.09 | % | |||||||||
| 5.625%, 05/01/2018 | 1,050,000 | 1,248,732 | 0.41 | % | |||||||||
| HSBC Finance Corp. | |||||||||||||
| 2.375%, 02/13/2015 | 1,000,000 | 1,034,814 | 0.34 | % | |||||||||
| 5.000%, 06/30/2015 | 700,000 | 764,907 | 0.25 | % | |||||||||
| JPMorgan Chase & Co. | |||||||||||||
| 5.125%, 09/15/2014 | 650,000 | 694,813 | 0.23 | % | |||||||||
| KeyCorp | |||||||||||||
| 3.750%, 08/13/2015 | 400,000 | 430,853 | 0.14 | % | |||||||||
| 5.100%, 03/24/2021 | 450,000 | 533,482 | 0.17 | % | |||||||||
| Lazard Group | |||||||||||||
| 6.850%, 06/15/2017 | 320,000 | 363,226 | 0.12 | % | |||||||||
| Lincoln National Corp. | |||||||||||||
| 6.250%, 02/15/2020 | 780,000 | 927,134 | 0.30 | % | |||||||||
| Manulife Financial Corp. | |||||||||||||
| 3.400%, 09/17/2015 | 300,000 | 315,456 | 0.10 | % | |||||||||
| Merrill Lynch & Company, Inc. | |||||||||||||
| 6.875%, 04/25/2018 (c) | 455,000 | 550,002 | 0.18 | % | |||||||||
| Merrill Lynch & Company, Inc., | |||||||||||||
| Series MTNC, 0.800%, 01/15/2015 (c) | 250,000 | 244,861 | 0.08 | % | |||||||||
| MetLife, Inc., Series A | |||||||||||||
| 6.817%, 08/15/2018 | 100,000 | 126,531 | 0.04 | % | |||||||||
| Morgan Stanley | |||||||||||||
| 4.750%, 04/01/2014 | 250,000 | 259,442 | 0.08 | % | |||||||||
| 5.75%, 01/25/2021 | 250,000 | 280,177 | 0.09 | % | |||||||||
| 6.625%, 04/01/2018 | 250,000 | 291,106 | 0.10 | % | |||||||||
| Prudential Financial, Inc. | |||||||||||||
| 5.500%, 03/15/2016 | 310,000 | 352,351 | 0.12 | % | |||||||||
| Prudential Financial, Inc., Series MTNB | |||||||||||||
| 5.100%, 09/20/2014 | 285,000 | 307,147 | 0.10 | % | |||||||||
| Qwest Capital Funding, Inc. | |||||||||||||
| 6.500%, 11/15/2018 | 700,000 | 805,429 | 0.26 | % | |||||||||
| Raymond James Financial, Inc. | |||||||||||||
| 5.625%, 04/01/2024 | 700,000 | 778,816 | 0.26 | % | |||||||||
| St. Paul Travelers, Inc. | |||||||||||||
| 5.500%, 12/01/2015 | 275,000 | 313,289 | 0.10 | % | |||||||||
| SunTrust Banks, Inc. | |||||||||||||
| 3.600%, 04/15/2016 | 250,000 | 268,255 | 0.09 | % | |||||||||
| 5.250%, 11/05/2012 | 375,000 | 375,024 | 0.12 | % | |||||||||
| 6.000%, 09/11/2017 | 250,000 | 297,525 | 0.10 | % | |||||||||
| The Bear Stearns Companies, Inc. | |||||||||||||
| 6.400%, 10/02/2017 | 1,350,000 | 1,628,462 | 0.53 | % | |||||||||
| The Goldman Sachs Group, Inc. | |||||||||||||
| 5.375%, 03/15/2020 | 1,100,000 | 1,245,661 | 0.41 | % | |||||||||
| The Hartford Financial Services | |||||||||||||
| Group, Inc., 5.375%, 03/15/2017 | 300,000 | 341,000 | 0.11 | % | |||||||||
| The Royal Bank of Scotland PLC | |||||||||||||
| 4.375%, 03/16/2016 | 400,000 | 435,655 | 0.14 | % | |||||||||
| Wachovia Corp. | |||||||||||||
| 5.250%, 08/01/2014 | 300,000 | 322,136 | 0.11 | % | |||||||||
| Westpac Banking Corp. | |||||||||||||
| 4.200%, 02/27/2015 | 500,000 | 537,352 | 0.18 | % | |||||||||
| 4.875%, 11/19/2019 | 450,000 | 520,897 | 0.17 | % | |||||||||
| 27,725,861 | 9.08 | % | |||||||||||
| Health Care – 1.30% | |||||||||||||
| Agilent Technologies, Inc. | |||||||||||||
| 5.000%, 07/15/2020 | 650,000 | 753,658 | 0.25 | % | |||||||||
| GlaxoSmithKline Capital, Inc. | |||||||||||||
| 1.500%, 05/08/2017 | 500,000 | 511,885 | 0.17 | % | |||||||||
| 2.850%, 05/08/2022 | 1,000,000 | 1,054,525 | 0.34 | % | |||||||||
| 4.850%, 05/15/2013 | 325,000 | 332,687 | 0.11 | % | |||||||||
| Merck & Co., Inc. | |||||||||||||
| 6.000%, 09/15/2017 | 850,000 | 1,049,332 | 0.34 | % | |||||||||
| UnitedHealth Group, Inc. | |||||||||||||
| 5.375%, 03/15/2016 | 250,000 | 284,367 | 0.09 | % | |||||||||
| 3,986,454 | 1.30 | % | |||||||||||
The accompanying notes are an integral part of these financial statements.
HENNESSY FUNDS 1-800-966-4354
39
| CORPORATE BONDS | Number of | % of | |||||||||||
| Shares | Value | Net Assets | |||||||||||
| Industrials – 0.58% | |||||||||||||
| FedEx Corp. | |||||||||||||
| 7.375%, 01/15/2014 | 300,000 | $ | 323,547 | 0.11 | % | ||||||||
| John Deere Capital Corp. | |||||||||||||
| 1.850%, 09/15/2016 | 1,000,000 | 1,036,491 | 0.34 | % | |||||||||
| Swiss RE Solutions | |||||||||||||
| 7.000%, 02/15/2026 | 150,000 | 186,806 | 0.06 | % | |||||||||
| The Boeing Co. | |||||||||||||
| 5.000%, 03/15/2014 | 220,000 | 233,225 | 0.07 | % | |||||||||
| 1,780,069 | 0.58 | % | |||||||||||
| Information Technology – 2.22% | |||||||||||||
| Altera Corp. | |||||||||||||
| 1.750%, 05/15/2017 | 1,000,000 | 1,026,843 | 0.34 | % | |||||||||
| Applied Materials, Inc. | |||||||||||||
| 4.300%, 06/15/2021 | 300,000 | 342,570 | 0.11 | % | |||||||||
| Corning, Inc. | |||||||||||||
| 6.850%, 03/01/2029 | 275,000 | 345,130 | 0.11 | % | |||||||||
| Dell, Inc. | |||||||||||||
| 4.625%, 04/01/2021 | 550,000 | 605,602 | 0.20 | % | |||||||||
| eBay, Inc. | |||||||||||||
| 3.250%, 10/15/2020 | 250,000 | 272,914 | 0.09 | % | |||||||||
| Hewlett Packard Co. | |||||||||||||
| 2.650%, 06/01/2016 | 250,000 | 250,506 | 0.08 | % | |||||||||
| 3.000%, 09/15/2016 | 150,000 | 151,252 | 0.05 | % | |||||||||
| 6.000%, 09/15/2041 | 250,000 | 246,970 | 0.08 | % | |||||||||
| Intel Corp. | |||||||||||||
| 3.300%, 10/01/2021 | 250,000 | 274,867 | 0.09 | % | |||||||||
| Juniper Networks, Inc. | |||||||||||||
| 4.600%, 03/15/2021 | 1,000,000 | 1,078,275 | 0.35 | % | |||||||||
| KLA-Tencor Corp. | |||||||||||||
| 6.900%, 05/01/2018 | 650,000 | 784,351 | 0.26 | % | |||||||||
| Symantec Corp. | |||||||||||||
| 2.750%, 06/15/2017 | 500,000 | 519,679 | 0.17 | % | |||||||||
| 3.950%, 06/15/2022 | 500,000 | 520,628 | 0.17 | % | |||||||||
| 4.200%, 09/15/2020 | 350,000 | 372,616 | 0.12 | % | |||||||||
| 6,792,203 | 2.22 | % | |||||||||||
| Materials – 1.41% | |||||||||||||
| Alcoa, Inc. | |||||||||||||
| 6.150%, 08/15/2020 | 625,000 | 685,079 | 0.22 | % | |||||||||
| AngloGold Ashanti Holdings PLC | |||||||||||||
| 5.125%, 08/01/2022 | 1,000,000 | 1,021,769 | 0.34 | % | |||||||||
| Barrick Gold Financeco LLC | |||||||||||||
| 6.125%, 09/15/2013 | 350,000 | 366,836 | 0.12 | % | |||||||||
| BHP Billiton Finance USA Ltd. | |||||||||||||
| 6.750%, 11/01/2013 | 250,000 | 265,884 | 0.09 | % | |||||||||
| El du Pont de Nemours & Co. | |||||||||||||
| 4.750%, 03/15/2015 | 315,000 | 345,796 | 0.11 | % | |||||||||
| International Paper Co. | |||||||||||||
| 9.375%, 05/15/2019 | 250,000 | 344,541 | 0.11 | % | |||||||||
| Rio Tinto Finance USA PLC | |||||||||||||
| 2.000%, 03/22/2017 | 640,000 | 654,893 | 0.22 | % | |||||||||
| The Dow Chemical Co. | |||||||||||||
| 4.250%, 11/15/2020 | 550,000 | 611,743 | 0.20 | % | |||||||||
| 4,296,541 | 1.41 | % | |||||||||||
| Telecommunication Services – 0.75% | |||||||||||||
| AT&T, Inc. | |||||||||||||
| 2.950%, 05/15/2016 | 275,000 | 295,326 | 0.10 | % | |||||||||
| 3.000%, 02/15/2022 | 250,000 | 266,242 | 0.09 | % | |||||||||
| 5.350%, 09/01/2040 | 200,000 | 246,261 | 0.08 | % | |||||||||
| CenturyLink, Inc. | |||||||||||||
| 5.150%, 06/15/2017 | 400,000 | 431,577 | 0.14 | % | |||||||||
| Deutsche Telekom International | |||||||||||||
| Finance BV, 5.875%, 08/20/2013 | 400,000 | 416,358 | 0.13 | % | |||||||||
| Verizon Communications, Inc. | |||||||||||||
| 8.750%, 11/01/2018 | 450,000 | 628,671 | 0.21 | % | |||||||||
| 2,284,435 | 0.75 | % | |||||||||||
| Utilities – 0.11% | |||||||||||||
| Sempra Energy | |||||||||||||
| 6.500%, 06/01/2016 | 275,000 | 325,919 | 0.11 | % | |||||||||
| Total Corporate Bonds | |||||||||||||
| (Cost $47,708,435) | 50,728,057 | 16.61 | % | ||||||||||
| MORTGAGE BACKED SECURITIES – 4.76% | |||||||||||||
| Federal Home Loan Mortgage Corp. | |||||||||||||
| 3.000%, 05/01/2042 | 4,800,602 | 5,032,259 | 1.65 | % | |||||||||
| 3.000%, 09/01/2042 | 2,995,149 | 3,139,683 | 1.03 | % | |||||||||
| 5.000%, 05/01/2020 | 212,270 | 233,373 | 0.08 | % | |||||||||
| 5.500%, 04/01/2037 | 410,186 | 458,488 | 0.15 | % | |||||||||
| Federal National Mortgage Association | |||||||||||||
| 3.500%, 01/01/2042 | 1,237,561 | 1,319,697 | 0.43 | % | |||||||||
| 4.000%, 12/01/2041 | 1,684,911 | 1,807,671 | 0.59 | % | |||||||||
| 4.000%, 10/01/2041 | 1,745,535 | 1,872,712 | 0.61 | % | |||||||||
| 4.500%, 08/01/2020 | 248,361 | 268,259 | 0.09 | % | |||||||||
| 6.000%, 10/01/2037 | 353,001 | 392,473 | 0.13 | % | |||||||||
| Total Mortgage Backed Securities | |||||||||||||
| (Cost $14,171,252) | 14,524,615 | 4.76 | % | ||||||||||
| U.S. GOVERNMENT AGENCY ISSUE – 0.24% | |||||||||||||
| Federal Home Loan Banks | |||||||||||||
| 5.750%, 06/15/2037 | 600,000 | 723,556 | 0.24 | % | |||||||||
| Total U.S. Government | |||||||||||||
| Agency Issues | |||||||||||||
| (Cost $701,826) | 723,556 | 0.24 | % | ||||||||||
| U.S. TREASURY OBLIGATIONS – 18.50% | |||||||||||||
| U.S. Treasury Bond – 5.56% | |||||||||||||
| U.S. Treasury Bond | |||||||||||||
| 3.125%, 02/15/2042 | 7,090,000 | 7,516,506 | 2.46 | % | |||||||||
| 5.000%, 05/15/2037 | 3,360,000 | 4,799,024 | 1.57 | % | |||||||||
| 5.250%, 02/15/2029 | 1,925,000 | 2,690,188 | 0.88 | % | |||||||||
| U.S. Treasury Inflation Indexed Bond | |||||||||||||
| 0.125%, 07/15/2022 | 1,803,258 | 1,976,540 | 0.65 | % | |||||||||
| 16,982,258 | 5.56 | % | |||||||||||
| U.S. Treasury Note – 12.94% | |||||||||||||
| 1.000%, 05/15/2014 | 3,000,000 | 3,034,455 | 0.99 | % | |||||||||
| 1.250%, 09/30/2015 | 2,450,000 | 2,511,826 | 0.82 | % | |||||||||
| 2.125%, 08/15/2021 | 2,280,000 | 2,399,522 | 0.79 | % | |||||||||
The accompanying notes are an integral part of these financial statements.
WWW.HENNESSYFUNDS.COM
40
| U.S. TREASURY OBLIGATIONS | Number of | % of | |||||||||||||
| Shares | Value | Net Assets | |||||||||||||
| U.S. Treasury Note (Continued) | |||||||||||||||
| 2.250%, 05/31/2014 | 9,550,000 | $ | 9,850,309 | 3.22 | % | ||||||||||
| 3.125%, 10/31/2016 | 1,655,000 | 1,823,862 | 0.60 | % | |||||||||||
| 3.500%, 05/15/2020 | 3,060,000 | 3,562,510 | 1.17 | % | |||||||||||
| 3.750%, 11/15/2018 | 2,825,000 | 3,296,642 | 1.08 | % | |||||||||||
| 4.125%, 05/15/2015 | 11,900,000 | 13,037,009 | 4.27 | % | |||||||||||
| 39,516,135 | 12.94 | % | |||||||||||||
| Total U.S. Treasury Obligations | |||||||||||||||
| (Cost $56,156,707) | 56,498,393 | 18.50 | % | ||||||||||||
| EXCHANGE TRADED FUNDS – 3.11% | |||||||||||||||
| iShares iBoxx $High Yield | |||||||||||||||
| Corporation Bond Fund | 39,800 | 3,686,674 | 1.21 | % | |||||||||||
| iShares S&P U.S. Preferred | |||||||||||||||
| Stock Index Fund | 49,500 | 1,982,475 | 0.65 | % | |||||||||||
| Powershares ETF Trust II | |||||||||||||||
| Senior Loan Portfolio | 17,500 | 434,700 | 0.14 | % | |||||||||||
| SPDR Barclays Capital High Yield Bond | 84,500 | 3,407,885 | 1.11 | % | |||||||||||
| Total Exchange Traded Funds | |||||||||||||||
| (Cost $9,440,996) | 9,511,734 | 3.11 | % | ||||||||||||
| MUTUAL FUNDS – 0.12% | |||||||||||||||
| Calamos Convertible Opportunities | |||||||||||||||
| and Income Fund | 18,500 | 231,435 | 0.07 | % | |||||||||||
| NGP Capital Resources Co. | 8,000 | 58,640 | 0.02 | % | |||||||||||
| Wells Fargo Advantage Income | |||||||||||||||
| Opportunities Fund | 8,000 | 83,440 | 0.03 | % | |||||||||||
Total Mutual Funds (Cost $378,764) | 373,515 | 0.12 | % | ||||||||||||
| SHORT-TERM INVESTMENTS – 0.68% | |||||||||||||||
| Money Market Fund – 0.68% | |||||||||||||||
| Fidelity Institutional Money Market | |||||||||||||||
| Government Portfolio – Class I, | |||||||||||||||
| 0.01% (d) | 2,086,102 | 2,086,102 | 0.68 | % | |||||||||||
| Total Money Market Fund | |||||||||||||||
| (Cost $2,086,102) | 2,086,102 | 0.68 | % | ||||||||||||
| Total Short-Term Investments | |||||||||||||||
| (Cost $2,086,102) | 2,086,102 | 0.68 | % | ||||||||||||
| Total Investments | |||||||||||||||
| (Cost $279,818,894) – 99.41% | 303,595,245 | 99.41 | % | ||||||||||||
| Other Assets in Excess | |||||||||||||||
| of Liabilities – 0.59% | 1,809,970 | 0.59 | % | ||||||||||||
TOTAL NET ASSETS – 100.00% | $ | 305,405,215 | 100.00 | % | |||||||||||
Percentages are stated as a percent of net assets.
| (a) | Non-income producing security. |
| (b) | This security is a restricted security under Rule 144A of the Securities Act of 1933. These securities may be resold in transactions exempt from registration, normally to qualified institutional buyers. As of October 31, 2012, the total amount of 144A securities was $1,018,544 or 0.33% of total net assets. |
| (c) | Variable/floating rate security. |
| (d) | The rate listed is the fund’s 7-day yield as of October 31, 2012. |
The accompanying notes are an integral part of these financial statements.
HENNESSY FUNDS 1-800-966-4354
41
Summary of Fair Value Exposure at October 31, 2012
The following is a summary of the inputs used to value the Fund’s net assets as of October 31, 2012 (See Note 4 in the accompanying notes to the financial statements):
| Common Stock | Level 1 | Level 2 | Level 3 | Total | |||||||||||||
| Consumer Discretionary | $ | 10,090,435 | $ | — | $ | — | $ | 10,090,435 | |||||||||
| Consumer Staples | 33,999,816 | — | — | 33,999,816 | |||||||||||||
| Energy | 10,068,961 | — | — | 10,068,961 | |||||||||||||
| Financials | 23,342,349 | — | — | 23,342,349 | |||||||||||||
| Health Care | 10,339,775 | — | — | 10,339,775 | |||||||||||||
| Industrials | 3,984,913 | — | — | 3,984,913 | |||||||||||||
| Information Technology | 33,136,007 | — | — | 33,136,007 | |||||||||||||
| Materials | 21,644,046 | — | — | 21,644,046 | |||||||||||||
| Telecommunication Services | 6,495,611 | — | — | 6,495,611 | |||||||||||||
| Utilities | 8,809,001 | — | — | 8,809,001 | |||||||||||||
| Total Common Stock | $ | 161,910,914 | $ | — | $ | — | $ | 161,910,914 | |||||||||
| Preferred Stock | $ | 18,020 | $ | — | $ | — | $ | 18,020 | |||||||||
| REITS | |||||||||||||||||
| Financials | $ | 7,220,339 | $ | — | $ | — | $ | 7,220,339 | |||||||||
| Corporate Bonds | |||||||||||||||||
| Consumer Discretionary | $ | — | $ | 1,739,649 | $ | — | $ | 1,739,649 | |||||||||
| Consumer Staples | — | 1,422,718 | — | 1,422,718 | |||||||||||||
| Energy | — | 374,208 | — | 374,208 | |||||||||||||
| Financials | — | 27,725,861 | — | 27,725,861 | |||||||||||||
| Health Care | — | 3,986,454 | — | 3,986,454 | |||||||||||||
| Industrials | — | 1,780,069 | — | 1,780,069 | |||||||||||||
| Information Technology | — | 6,792,203 | — | 6,792,203 | |||||||||||||
| Materials | — | 4,296,541 | — | 4,296,541 | |||||||||||||
| Telecommunication Services | — | 2,284,435 | — | 2,284,435 | |||||||||||||
| Utilities | — | 325,919 | — | 325,919 | |||||||||||||
| Total Corporate Bonds | $ | — | $ | 50,728,057 | $ | — | $ | 50,728,057 | |||||||||
| Mortgage Backed Securities | $ | — | $ | 14,524,615 | $ | — | $ | 14,524,615 | |||||||||
| U.S. Government Agency Issues | $ | — | $ | 723,556 | $ | — | $ | 723,556 | |||||||||
| U.S. Treasury Obligations | |||||||||||||||||
| U.S. Treasury Bonds | $ | — | $ | 16,982,258 | $ | — | $ | 16,982,258 | |||||||||
| U.S. Treasury Notes | — | 39,516,135 | — | 39,516,135 | |||||||||||||
| Total U.S. Treasury Obligations | $ | — | $ | 56,498,393 | $ | — | $ | 56,498,393 | |||||||||
| Exchange Traded Funds | $ | 9,511,734 | $ | — | $ | — | $ | 9,511,734 | |||||||||
| Mutual Funds | $ | 373,515 | $ | — | $ | — | $ | 373,515 | |||||||||
| Short-Term Investments | |||||||||||||||||
| Money Market Funds | $ | 2,086,102 | $ | — | $ | — | $ | 2,086,102 | |||||||||
| Total Short-Term Investments | $ | 2,086,102 | $ | — | $ | — | $ | 2,086,102 | |||||||||
| Total Investments in Securities | $ | 181,120,624 | $ | 122,474,621 | $ | — | $ | 303,595,245 | |||||||||
Transfers between levels are recognized at the end of the reporting period. During the period ended October 31, 2012, the Fund recognized no transfers between levels.
The accompanying notes are an integral part of these financial statements.
WWW.HENNESSYFUNDS.COM
42
HENNESSY CORE BOND FUND
(formerly FBR Core Bond Fund)
As of October 31, 2012
(% of Net Assets)
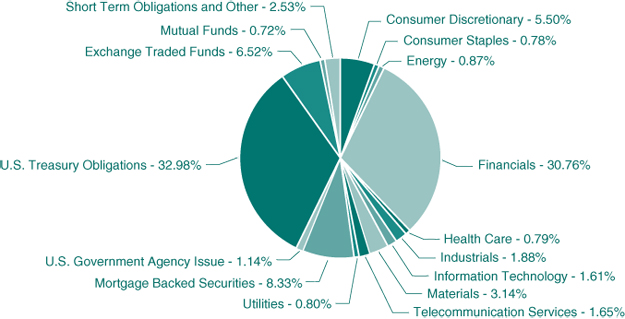
| TOP TEN HOLDINGS* | % net assets | |
| U.S. Treasury Note, 4.125%, 05/15/2015 | 10.48% | |
| U.S. Treasury Bond, 5.000%, 05/15/2037 | 5.46% | |
| U.S. Treasury Bond, 3.125%, 02/15/2042 | 4.88% | |
| U.S. Treasury Note, 3.500%, 05/15/2020 | 3.08% | |
| iShares iBoxx $High Yield Corporation Bond Fund | 2.79% | |
| U.S. Treasury Note, 3.250%, 05/31/2016 | 2.66% | |
| U.S. Treasury Note, 2.125%, 08/15/2021 | 2.08% | |
| SPDR Barclays Capital High Yield Bond | 2.08% | |
| Federal National Mortgage Association 4.000%, 12/1/2041 | 1.84% | |
| U.S. Treasury Inflation Index Bond | 1.79% |
* Excludes short-term investments.
Note: For presentation purposes, the Fund has grouped some of the industry categories. For purposes of categorizing securities for compliance with Section 8(b)(1) of the Investment Company Act of 1940, the Fund uses more specific industry classifications.
HENNESSY FUNDS 1-800-966-4354
43
| COMMON STOCKS – 0.48% | Number of | % of | |||||||||||
| Shares | Value | Net Assets | |||||||||||
| Financials – 0.48% | |||||||||||||
| PennantPark Investment Corp. | 16,000 | $ | 176,000 | 0.48 | % | ||||||||
| Total Common Stocks | |||||||||||||
| (Cost $176,399) | 176,000 | 0.48 | % | ||||||||||
| CONVERTIBLE PREFERRED STOCKS – 1.55% | |||||||||||||
| Financials – 1.55% | |||||||||||||
| Boston Private Capital Trust I | 13,350 | 572,381 | 1.55 | % | |||||||||
| Total Convertible Preferred Stocks | |||||||||||||
| (Cost $638,783) | 572,381 | 1.55 | % | ||||||||||
| PREFERRED STOCKS – 0.04% | |||||||||||||
| Financials – 0.04% | |||||||||||||
| Federal National Mortgage Association, | |||||||||||||
| Perpetual Series S, 8.250%, 12/31/2015 (a) | 7,900 | 13,430 | 0.04 | % | |||||||||
| Total Preferred Stocks | |||||||||||||
| (Cost $197,500) | 13,430 | 0.04 | % | ||||||||||
| REITS – 1.29% | |||||||||||||
| Financials – 1.29% | |||||||||||||
| Apollo Commercial Real | |||||||||||||
| Estate Finance, Inc. | 8,500 | 143,735 | 0.39 | % | |||||||||
| Chimera Investment Corp. | 72,500 | 193,575 | 0.53 | % | |||||||||
| Starwood Property Trust, Inc. | 6,000 | 137,520 | 0.37 | % | |||||||||
Total Reits (Cost $494,648) | 474,830 | 1.29 | % | ||||||||||
| CORPORATE BONDS – 44.42% | |||||||||||||
| Consumer Discretionary – 5.50% | |||||||||||||
| Best Buy Company, Inc. | |||||||||||||
| 7.000%, 07/15/2013 | 275,000 | 281,235 | 0.76 | % | |||||||||
| Comcast Corp. | |||||||||||||
| 6.500%, 01/15/2017 | 250,000 | 305,300 | 0.83 | % | |||||||||
| Royal Caribbean Cruises Ltd. | |||||||||||||
| 7.500%, 10/15/2027 | 575,000 | 619,563 | 1.68 | % | |||||||||
| Starbucks Corp. | |||||||||||||
| 6.250%, 08/15/2017 | 275,000 | 336,852 | 0.91 | % | |||||||||
| The Home Depot, Inc. | |||||||||||||
| 5.400%, 03/01/2016 | 120,000 | 138,317 | 0.37 | % | |||||||||
| YUM! Brands, Inc. | |||||||||||||
| 5.300%, 09/15/2019 | 300,000 | 349,749 | 0.95 | % | |||||||||
| 2,031,016 | 5.50 | % | |||||||||||
| Consumer Staples – 0.78% | |||||||||||||
| Altria Group, Inc. | |||||||||||||
| 9.250%, 08/06/2019 | 84,000 | 118,698 | 0.32 | % | |||||||||
| Anheuser-Busch InBev Worldwide, Inc. | |||||||||||||
| 7.750%, 01/15/2019 | 125,000 | 169,798 | 0.46 | % | |||||||||
| 288,496 | 0.78 | % | |||||||||||
| Energy – 0.87% | |||||||||||||
| Devon Energy Corp. | |||||||||||||
| 5.625%, 01/15/2014 | 175,000 | 185,666 | 0.50 | % | |||||||||
| Husky Energy, Inc. | |||||||||||||
| 5.900%, 06/15/2014 | 125,000 | 135,015 | 0.37 | % | |||||||||
| 320,681 | 0.87 | % | |||||||||||
| Financials – 27.40% | |||||||||||||
| Aflac, Inc. | |||||||||||||
| 8.500%, 05/15/2019 | 250,000 | 340,168 | 0.92 | % | |||||||||
| American Express Credit Corp., Series C | |||||||||||||
| 5.125%, 08/25/2014 | 275,000 | 296,999 | 0.80 | % | |||||||||
| 7.300%, 08/20/2013 | 60,000 | 63,238 | 0.17 | % | |||||||||
| American International Group, Inc. | |||||||||||||
| 5.850%, 01/16/2018 | 350,000 | 409,869 | 1.11 | % | |||||||||
| Associated Banc-Corp | |||||||||||||
| 5.125%, 03/28/2016 | 250,000 | 274,339 | 0.74 | % | |||||||||
| Associates Corporation of North America | |||||||||||||
| 6.950%, 11/01/2018 | 250,000 | 302,391 | 0.82 | % | |||||||||
| Capital One Financial Corp. | |||||||||||||
| 6.750%, 09/15/2017 | 200,000 | 246,401 | 0.67 | % | |||||||||
| Citigroup, Inc. | |||||||||||||
| 6.125%, 11/21/2017 | 250,000 | 296,868 | 0.80 | % | |||||||||
| CME Group, Inc. | |||||||||||||
| 5.750%, 02/15/2014 | 300,000 | 319,594 | 0.87 | % | |||||||||
| Credit Suisse USA, Inc. | |||||||||||||
| 5.125%, 08/15/2015 | 225,000 | 249,738 | 0.68 | % | |||||||||
| Discover Financial Services | |||||||||||||
| 5.200%, 04/27/2022 (b) | 350,000 | 396,101 | 1.07 | % | |||||||||
| Fifth Third Bancorp | |||||||||||||
| 6.250%, 05/01/2013 | 250,000 | 257,009 | 0.70 | % | |||||||||
| General Electric Capital Corp. | |||||||||||||
| 5.625%, 05/01/2018 | 375,000 | 445,976 | 1.21 | % | |||||||||
| JPMorgan Chase & Co. | |||||||||||||
| 6.300%, 04/23/2019 | 250,000 | 308,734 | 0.84 | % | |||||||||
| KeyCorp | |||||||||||||
| 6.500%, 05/14/2013 | 300,000 | 309,336 | 0.84 | % | |||||||||
| Lazard Group | |||||||||||||
| 6.850%, 06/15/2017 | 300,000 | 340,525 | 0.92 | % | |||||||||
| Manulife Financial Corp. | |||||||||||||
| 3.400%, 09/17/2015 | 300,000 | 315,456 | 0.85 | % | |||||||||
| Merrill Lynch & Company, Inc. | |||||||||||||
| 6.875%, 04/25/2018 | 420,000 | 507,694 | 1.38 | % | |||||||||
| MetLife, Inc., Series A | |||||||||||||
| 6.817%, 08/15/2018 | 275,000 | 347,960 | 0.94 | % | |||||||||
| Morgan Stanley | |||||||||||||
| 6.625%, 04/01/2018 | 250,000 | 291,106 | 0.79 | % | |||||||||
| Prudential Financial, Inc. | |||||||||||||
| 5.500%, 03/15/2016 | 288,000 | 327,346 | 0.89 | % | |||||||||
| Prudential Financial, Inc., Series MTNB | |||||||||||||
| 5.100%, 09/20/2014 | 250,000 | 269,427 | 0.73 | % | |||||||||
| Simon Property Group, Inc. | |||||||||||||
| 6.125%, 05/30/2018 | 350,000 | 430,081 | 1.16 | % | |||||||||
| SunTrust Banks, Inc. | |||||||||||||
| 5.250%, 11/05/2012 | 215,000 | 215,013 | 0.58 | % | |||||||||
| 6.000%, 09/11/2017 | 300,000 | 357,030 | 0.97 | % | |||||||||
| The Goldman Sachs Group, Inc. | |||||||||||||
| 5.375%, 03/15/2020 | 500,000 | 566,209 | 1.53 | % | |||||||||
| The Hartford Financial | |||||||||||||
| Services Group, Inc. | |||||||||||||
| 5.375%, 03/15/2017 | 300,000 | 341,000 | 0.92 | % | |||||||||
| The Royal Bank of Scotland PLC | |||||||||||||
| 4.375%, 03/16/2016 | 300,000 | 326,741 | 0.89 | % | |||||||||
The accompanying notes are an integral part of these financial statements.
WWW.HENNESSYFUNDS.COM
44
| CORPORATE BONDS | Number of | % of | |||||||||||
| Shares | Value | Net Assets | |||||||||||
| Financials (Continued) | |||||||||||||
| Qwest Capital Funding, Inc. | |||||||||||||
| 6.500%, 11/15/2018 | 300,000 | $ | 345,184 | 0.94 | % | ||||||||
| Westpac Banking Corp. | |||||||||||||
| 4.200%, 02/27/2015 | 250,000 | 268,676 | 0.73 | % | |||||||||
| 4.875%, 11/19/2019 | 300,000 | 347,265 | 0.94 | % | |||||||||
| 10,113,474 | 27.40 | % | |||||||||||
| Health Care – 0.79% | |||||||||||||
| Agilent Technologies, Inc. | |||||||||||||
| 5.000%, 07/15/2020 | 250,000 | 289,869 | 0.79 | % | |||||||||
| Industrials – 1.88% | |||||||||||||
| American Railcar Industries, Inc. | |||||||||||||
| 7.500%, 03/01/2014 | 31,000 | 31,465 | 0.09 | % | |||||||||
| FedEx Corp. | |||||||||||||
| 7.375%, 01/15/2014 | 275,000 | 296,585 | 0.80 | % | |||||||||
| Swiss Re Solutions Holding Corp. | |||||||||||||
| 7.000%, 02/15/2026 | 125,000 | 155,672 | 0.42 | % | |||||||||
| The Boeing Co. | |||||||||||||
| 5.000%, 03/15/2014 | 200,000 | 212,022 | 0.57 | % | |||||||||
| 695,744 | 1.88 | % | |||||||||||
| Information Technology – 1.61% | |||||||||||||
| Hewlett Packard Co. | |||||||||||||
| 3.000%, 09/15/2016 | 125,000 | 126,043 | 0.34 | % | |||||||||
| 6.000%, 09/15/2041 | 100,000 | 98,788 | 0.27 | % | |||||||||
| KLA-Tencor Corp. | |||||||||||||
| 6.900%, 05/01/2018 | 130,000 | 156,870 | 0.42 | % | |||||||||
| Symantec Corp. | |||||||||||||
| 4.200%, 09/15/2020 | 200,000 | 212,924 | 0.58 | % | |||||||||
| 594,625 | 1.61 | % | |||||||||||
| Materials – 3.14% | |||||||||||||
| AngloGold Ashanti Holdings PLC | |||||||||||||
| 5.125%, 08/01/2022 | 350,000 | 357,619 | 0.97 | % | |||||||||
| Barrick Gold Financeco LLC | |||||||||||||
| 6.125%, 09/15/2013 | 300,000 | 314,431 | 0.85 | % | |||||||||
| El du Pont de Nemours & Co. | |||||||||||||
| 4.750%, 03/15/2015 | 285,000 | 312,863 | 0.85 | % | |||||||||
| International Paper Co. | |||||||||||||
| 9.375%, 05/15/2019 | 125,000 | 172,270 | 0.47 | % | |||||||||
| 1,157,183 | 3.14 | % | |||||||||||
| Telecommunication Services – 1.65% | |||||||||||||
| Deutsche Telekom | |||||||||||||
| International Finance BV | |||||||||||||
| 5.875%, 08/20/2013 | 275,000 | 286,246 | 0.78 | % | |||||||||
| Rogers Communications, Inc. | |||||||||||||
| 7.500%, 03/15/2015 | 280,000 | 323,037 | 0.87 | % | |||||||||
| 609,283 | 1.65 | % | |||||||||||
| Utilities – 0.80% | |||||||||||||
| Sempra Energy | |||||||||||||
| 6.500%, 06/01/2016 | 250,000 | 296,290 | 0.80 | % | |||||||||
| Total Corporate Bonds | |||||||||||||
| (Cost $14,750,107) | 16,396,661 | 44.42 | % | ||||||||||
| MORTGAGE BACKED | |||||||||||||
| SECURITIES – 8.33% | |||||||||||||
| U.S. Government Agency Issues – 8.33% | |||||||||||||
| Federal Home Loan Mortgage Corp. | |||||||||||||
| 5.500%, 04/01/2037 | 468,784 | 523,986 | 1.42 | % | |||||||||
| Federal National Mortgage Association | |||||||||||||
| 3.000%, 08/01/2042 | 547,493 | 574,876 | 1.56 | % | |||||||||
| 3.500%, 01/01/2042 | 441,986 | 471,320 | 1.27 | % | |||||||||
| 4.000%, 12/01/2041 | 631,842 | 677,877 | 1.84 | % | |||||||||
| 4.500%, 08/01/2020 | 310,563 | 335,444 | 0.91 | % | |||||||||
| 6.000%, 10/01/2037 | 441,251 | 490,591 | 1.33 | % | |||||||||
| Total Mortgage Backed Securities | |||||||||||||
| (Cost $2,902,843) | 3,074,094 | 8.33 | % | ||||||||||
| U.S. GOVERNMENT AGENCY ISSUE – 1.14% | |||||||||||||
| Financials – 1.14% | |||||||||||||
| Federal Home Loan Bank | |||||||||||||
| 5.750%, 06/15/2037 | 350,000 | 422,074 | 1.14 | % | |||||||||
| Total U.S. Government | |||||||||||||
| Agency Issue | |||||||||||||
| (Cost $409,398) | 422,074 | 1.14 | % | ||||||||||
| U.S. GOVERNMENT NOTES/BONDS – 32.98% | |||||||||||||
| U.S. Treasury Bonds – 13.64% | |||||||||||||
| U.S. Treasury Bond | |||||||||||||
| 3.125%, 02/15/2042 | 1,700,000 | 1,802,265 | 4.88 | % | |||||||||
| 5.000%, 05/15/2037 | 1,410,000 | 2,013,876 | 5.46 | % | |||||||||
| 5.250%, 02/15/2029 | 400,000 | 559,000 | 1.51 | % | |||||||||
| U.S. Treasury Inflation Index Bond | |||||||||||||
| 0.125%, 07/15/2022 | 601,086 | 658,847 | 1.79 | % | |||||||||
| Total U.S. Treasury Bonds | |||||||||||||
| (Cost $4,845,314) | 5,033,988 | 13.64 | % | ||||||||||
| U.S. Treasury Notes – 19.34% | |||||||||||||
| 2.125%, 08/15/2021 | 730,000 | 768,268 | 2.08 | % | |||||||||
| 3.250%, 05/31/2016 | 895,000 | 982,962 | 2.66 | % | |||||||||
| 3.500%, 05/15/2020 | 975,000 | 1,135,114 | 3.08 | % | |||||||||
| 3.625%, 08/15/2019 | 200,000 | 233,547 | 0.63 | % | |||||||||
| 3.875%, 05/15/2018 | 130,000 | 151,541 | 0.41 | % | |||||||||
| 4.125%, 05/15/2015 | 3,530,000 | 3,867,281 | 10.48 | % | |||||||||
| Total U.S. Treasury Notes | |||||||||||||
| (Cost $7,094,480) | 7,138,713 | 19.34 | % | ||||||||||
| Total U.S. Treasury Notes/Bonds | |||||||||||||
| (Cost $11,939,794) | 12,172,701 | 32.98 | % | ||||||||||
| EXCHANGE TRADED FUNDS – 6.52% | |||||||||||||
| iShares iBoxx $High Yield | |||||||||||||
| Corporation Bond Fund | 11,100 | 1,028,193 | 2.79 | % | |||||||||
| iShares S&P U.S. Preferred | |||||||||||||
| Stock Index Fund | 15,250 | 610,762 | 1.65 | % | |||||||||
| SPDR Barclays Capital High Yield Bond | 19,000 | 766,270 | 2.08 | % | |||||||||
| Total Exchange Traded Funds | |||||||||||||
| (Cost $2,366,528) | 2,405,225 | 6.52 | % | ||||||||||
The accompanying notes are an integral part of these financial statements.
HENNESSY FUNDS 1-800-966-4354
45
| MUTUAL FUNDS – 0.72% | Number of | % of | |||||||||||||
| Shares | Value | Net Assets | |||||||||||||
| Calamos Convertible Opportunities | |||||||||||||||
| and Income Fund | 10,500 | $ | 131,355 | 0.35 | % | ||||||||||
| NGP Capital Resources Co. | 7,000 | 51,310 | 0.14 | % | |||||||||||
| Wells Fargo Advantage | |||||||||||||||
| Income Opportunities Fund | 8,000 | 83,440 | 0.23 | % | |||||||||||
Total Mutual Funds (Cost $271,006) | 266,105 | 0.72 | % | ||||||||||||
| SHORT-TERM INVESTMENTS – 1.75% | |||||||||||||||
| Money Market Fund – 1.75% | |||||||||||||||
| Fidelity Institutional Money Market | |||||||||||||||
| Government Portfolio – Class I, | |||||||||||||||
| 0.01% (c) | 646,320 | 646,320 | 1.75 | % | |||||||||||
| Total Money Market Fund | |||||||||||||||
| (Cost $646,320) | 646,320 | 1.75 | % | ||||||||||||
| Total Short-Term Investments | |||||||||||||||
| (Cost $646,320) | 646,320 | 1.75 | % | ||||||||||||
| Total Investments | |||||||||||||||
| (Cost $34,793,326) – 99.22% | 36,619,821 | 99.22 | % | ||||||||||||
| Other Assets in Excess | |||||||||||||||
| of Liabilities – 0.78% | 289,081 | 0.78 | % | ||||||||||||
TOTAL NET ASSETS – 100.00% | $ | 36,908,902 | 100.00 | % | |||||||||||
Percentages are stated as a percent of net assets.
| (a) | Non-income producing security. |
| (b) | This security is a restricted security under Rule 144A of the Securities Act of 1933. These securities may be resold in transactions exempt from registration, normally to qualified institutional buyers. As of October 31, 2012, the total amount of 144A securities was $396,101 or 1.07% of total net assets. |
| (c) | The rate listed is the fund’s 7-day yield as of October 31, 2012. |
The accompanying notes are an integral part of these financial statements.
WWW.HENNESSYFUNDS.COM
46
Summary of Fair Value Exposure at October 31, 2012
The following is a summary of the inputs used to value the Fund’s net assets as of October 31, 2012 (See Note 4 in the accompanying notes to the financial statements):
| Common Stock | Level 1 | Level 2 | Level 3 | Total | |||||||||||||
| Financials | $ | 176,000 | $ | — | $ | — | $ | 176,000 | |||||||||
| Total Common Stock | $ | 176,000 | $ | — | $ | — | $ | 176,000 | |||||||||
| Convertible Preferred Stock | $ | — | $ | 572,381 | $ | — | $ | 572,381 | |||||||||
| Preferred Stock | $ | 13,430 | $ | — | $ | — | $ | 13,430 | |||||||||
| REITS | |||||||||||||||||
| Financials | $ | 474,830 | $ | — | $ | — | $ | 474,830 | |||||||||
| Corporate Bonds | |||||||||||||||||
| Consumer Discretionary | $ | — | $ | 2,031,016 | $ | — | $ | 2,031,016 | |||||||||
| Consumer Staples | — | 288,496 | — | 288,496 | |||||||||||||
| Energy | — | 320,681 | — | 320,681 | |||||||||||||
| Financials | — | 10,113,474 | — | 10,113,474 | |||||||||||||
| Health Care | — | 289,869 | — | 289,869 | |||||||||||||
| Industrials | — | 695,744 | — | 695,744 | |||||||||||||
| Information Technology | — | 594,625 | — | 594,625 | |||||||||||||
| Materials | — | 1,157,183 | — | 1,157,183 | |||||||||||||
| Telecommunication Services | — | 609,283 | — | 609,283 | |||||||||||||
| Utilities | — | 296,290 | — | 296,290 | |||||||||||||
| Total Corporate Bonds | $ | — | $ | 16,396,661 | $ | — | $ | 16,396,661 | |||||||||
| Mortgage Backed Securities | $ | — | $ | 3,074,094 | $ | — | $ | 3,074,094 | |||||||||
| U.S. Government Agency Issues | $ | — | $ | 422,074 | $ | — | $ | 422,074 | |||||||||
| U.S. Treasury Obligations | |||||||||||||||||
| U.S. Treasury Bonds | $ | — | $ | 5,033,988 | $ | — | $ | 5,033,988 | |||||||||
| U.S. Treasury Notes | — | 7,138,713 | — | 7,138,713 | |||||||||||||
| Total U.S. Treasury Obligations | $ | — | $ | 12,172,701 | $ | — | $ | 12,172,701 | |||||||||
| Exchange Traded Funds | $ | 2,405,225 | $ | — | $ | — | $ | 2,405,225 | |||||||||
| Mutual Funds | $ | 266,105 | $ | — | $ | — | $ | 266,105 | |||||||||
| Short-Term Investments | |||||||||||||||||
| Money Market Funds | $ | 646,320 | $ | — | $ | — | $ | 646,320 | |||||||||
| Total Short-Term Investments | $ | 646,320 | $ | — | $ | — | $ | 646,320 | |||||||||
| Total Investments in Securities | $ | 3,981,910 | $ | 32,637,911 | $ | — | $ | 36,619,821 | |||||||||
Transfers between levels are recognized at the end of the reporting period. During the period ended October 31, 2012, the Fund recognized transfers between levels 1 and 2.
Level 2 Reconciliation Disclosure
The following amounts were transferred in/(out) of Level 2 assets:
| Total Common Stock | ||||
| Transfers into Level 2 | $ | 572,381 | ||
| Transfers out of Level 2 | — | |||
| Net transfers in and/or (out) of Level 2 | $ | 572,381 | ||
The accompanying notes are an integral part of these financial statements.
HENNESSY FUNDS 1-800-966-4354
47
Financial Statements
Statements of Assets and Liabilities as of October 31, 2012 |
| HENNESSY | HENNESSY | |||||||||||
| HENNESSY | GAS UTILITY | SMALL CAP | ||||||||||
| FOCUS FUND | INDEX FUND | FINANCIAL FUND | ||||||||||
| ASSETS: | ||||||||||||
| Investments in unaffiliated securities, at value (cost $442,578,126, $547,219,723, | ||||||||||||
| $187,046,883, $55,432,647, $5,320,919, $279,818,894 and $34,793,326, respectively) | $ | 785,723,844 | $ | 745,189,397 | $ | 211,180,773 | ||||||
| Investments in affiliated securities, at value (cost $0, $0, | ||||||||||||
| $0, $1,688,883, $0, $0 and $0, respectively) | — | — | — | |||||||||
| Cash | — | 1,393 | 43,200 | |||||||||
| Dividends and interest receivable | 119,620 | 1,221,344 | 170,505 | |||||||||
| Receivable for fund shares sold | 874,489 | 1,776,838 | 57,918 | |||||||||
| Receivable for securities sold | — | — | — | |||||||||
| Due from advisor | — | — | — | |||||||||
| Prepaid expenses and other assets | 65,538 | 76,587 | 18,322 | |||||||||
| Total Assets | 786,783,491 | 748,265,559 | 211,470,718 | |||||||||
| LIABILITIES: | ||||||||||||
| Payable for securities purchased | — | 661,420 | — | |||||||||
| Payable for fund shares redeemed | 734,915 | 243,646 | 159,456 | |||||||||
| Distribution payable | — | — | — | |||||||||
| Payable to advisor | 594,508 | 248,508 | 153,494 | |||||||||
| Payable to administrator | 93,848 | 24,851 | 23,832 | |||||||||
| Distribution and service fee payable | 148,902 | — | 35,430 | |||||||||
| Accrued accounting fees | 313 | 808 | 806 | |||||||||
| Accrued custody fees | 6,190 | 4,970 | 1,520 | |||||||||
| Accrued directors fees | 90 | 90 | 90 | |||||||||
| Accrued expenses and other payables | 319,532 | 260,834 | 101,023 | |||||||||
| Total Liabilities | 1,898,298 | 1,445,127 | 475,651 | |||||||||
| NET ASSETS | $ | 784,885,193 | $ | 746,820,432 | $ | 210,995,067 | ||||||
| NET ASSETS CONSIST OF: | ||||||||||||
| Capital stock | $ | 383,937,147 | $ | 548,299,308 | $ | 194,158,088 | ||||||
| Accumulated net investment income (loss) | (5,555,872 | ) | 452,765 | 715,079 | ||||||||
| Accumulated net realized gain (loss) on investments | 63,358,200 | 103,930 | (8,011,990 | ) | ||||||||
| Unrealized net appreciation (depreciation) on investments | 343,145,718 | 197,964,429 | 24,133,890 | |||||||||
| Total Net Assets | $ | 784,885,193 | $ | 746,820,432 | $ | 210,995,067 | ||||||
| NET ASSETS | ||||||||||||
| Investor Class: | ||||||||||||
| Shares authorized ($.0001 par value) | Unlimited | Unlimited | Unlimited | |||||||||
| Net assets applicable to outstanding Investor Class shares | 707,606,129 | 746,820,432 | 167,202,081 | |||||||||
| Shares issued and outstanding | 13,665,453 | 32,401,084 | 8,556,424 | |||||||||
| Net asset value, offering price and redemption price per share | $ | 51.78 | $ | 23.05 | $ | 19.54 | ||||||
| Institutional Class: | ||||||||||||
| Shares authorized ($.0001 par value) | Unlimited | N/A | Unlimited | |||||||||
| Net assets applicable to outstanding Institutional Class shares | 77,279,064 | N/A | 43,792,986 | |||||||||
| Shares issued and outstanding | 1,480,757 | N/A | 3,549,265 | |||||||||
| Net asset value, offering price and redemption price per share | $ | 52.19 | N/A | $ | 12.34 | |||||||
The accompanying notes are an integral part of these financial statements.
WWW.HENNESSYFUNDS.COM
48
| HENNESSY | HENNESSY | HENNESSY | HENNESSY | |||||||||||
| LARGE CAP | TECHNOLOGY | EQUITY AND | CORE BOND | |||||||||||
| FINANCIAL FUND | FUND | INCOME FUND | FUND | |||||||||||
| $ | 62,561,796 | $ | 5,410,616 | $ | 303,595,245 | $ | 36,619,821 | |||||||
| 2,158,650 | — | — | — | |||||||||||
| 23,400 | — | 28,726 | — | |||||||||||
| 32,609 | 466 | 1,467,803 | 377,070 | |||||||||||
| 14,297 | 8,995 | 254,017 | 138 | |||||||||||
| — | — | 459,684 | — | |||||||||||
| — | 3,183 | — | — | |||||||||||
| 13,668 | 2,420 | 53,560 | 22,347 | |||||||||||
| 64,804,420 | 5,425,680 | 305,859,035 | 37,019,376 | |||||||||||
| — | — | — | — | |||||||||||
| 20,646 | 7,742 | 132,989 | 107 | |||||||||||
| — | — | — | 44,772 | |||||||||||
| 50,217 | — | 139,264 | 13,075 | |||||||||||
| 7,887 | 839 | 28,792 | 4,107 | |||||||||||
| 13,949 | 997 | 42,598 | 762 | |||||||||||
| 478 | 870 | 4,121 | 2,516 | |||||||||||
| 510 | 60 | 1,720 | 260 | |||||||||||
| 90 | 90 | 90 | 90 | |||||||||||
| 54,752 | 41,038 | 104,246 | 44,785 | |||||||||||
| 148,529 | 51,636 | 453,820 | 110,474 | |||||||||||
| $ | 64,655,891 | $ | 5,374,044 | $ | 305,405,215 | $ | 36,908,902 | |||||||
| $ | 64,680,077 | $ | 7,693,908 | $ | 284,296,411 | $ | 34,345,436 | |||||||
| 50,837 | (64,030 | ) | 312,645 | 2,309 | ||||||||||
| (7,673,939 | ) | (2,345,531 | ) | (2,980,192 | ) | 734,662 | ||||||||
| 7,598,916 | 89,697 | 23,776,351 | 1,826,495 | |||||||||||
| $ | 64,655,891 | $ | 5,374,044 | $ | 305,405,215 | $ | 36,908,902 | |||||||
| Unlimited | Unlimited | Unlimited | Unlimited | |||||||||||
| 64,655,891 | 4,441,496 | 196,915,311 | 3,569,561 | |||||||||||
| 4,566,545 | 416,427 | 14,103,277 | 357,974 | |||||||||||
| $ | 14.16 | $ | 10.67 | $ | 13.96 | $ | 9.97 | |||||||
| N/A | Unlimited | Unlimited | Unlimited | |||||||||||
| N/A | 932,548 | 108,489,904 | 33,339,341 | |||||||||||
| N/A | 86,944 | 8,163,499 | 3,679,087 | |||||||||||
| N/A | $ | 10.73 | $ | 13.29 | $ | 9.06 | ||||||||
HENNESSY FUNDS 1-800-966-4354
49
Financial Statements
Statements of Operations as of October 31, 2012 |
| HENNESSY | HENNESSY | |||||||||||
| HENNESSY | GAS UTILITY | SMALL CAP | ||||||||||
| FOCUS FUND | INDEX FUND | FINANCIAL FUND | ||||||||||
| INVESTMENT INCOME: | ||||||||||||
Dividend income from unaffiliated securities(1) | $ | 4,454,002 | $ | 20,690,218 | $ | 3,666,139 | ||||||
| Dividend income from affiliated securities | — | — | — | |||||||||
| Interest income | 7,813 | 818 | 847 | |||||||||
| Total investment income | 4,461,815 | 20,691,036 | 3,666,986 | |||||||||
| EXPENSES: | ||||||||||||
| Investment advisory fees | 6,539,937 | 2,427,576 | 1,647,875 | |||||||||
| Administration and accounting fees | 501,693 | 703,080 | 119,524 | |||||||||
| Custodian fees | 36,280 | 31,581 | 8,126 | |||||||||
| Transfer agent fees – Investor Class | 186,737 | 163,720 | 51,702 | |||||||||
| Transfer agent fees – Institutional Class | 13,371 | — | 7,099 | |||||||||
| Distribution and service fees (See Note 6) | 1,659,066 | — | 395,608 | |||||||||
| Federal and state registration fees | 52,877 | 60,312 | 49,038 | |||||||||
| Audit fees | 19,204 | 19,200 | 19,201 | |||||||||
| Legal fees | 34,481 | 44,445 | 39,800 | |||||||||
| Compliance expense | 32,239 | 33,458 | 13,550 | |||||||||
| Insurance fees | 96,636 | 63,019 | 27,723 | |||||||||
| Reports to shareholders Investor Class | 85,801 | 78,173 | 32,695 | |||||||||
| Reports to shareholders Institutional Class | 3,891 | — | 2,003 | |||||||||
| Directors’ fees and expenses | 16,187 | 16,186 | 16,182 | |||||||||
| Sub-transfer agent expenses – Investor Class (See Note 6) | 739,160 | 545,625 | 145,366 | |||||||||
| Sub-transfer agent expenses – Institutional Class (See Note 6) | 40,959 | — | 26,453 | |||||||||
| Interest expense (See Note 7) | — | 132 | 62 | |||||||||
| Other | 1,865 | 1,306 | 2,223 | |||||||||
| Total expenses before reimbursement from advisor | 10,060,384 | 4,187,813 | 2,604,230 | |||||||||
| Expense (reimbursement)/recoupment | — | — | 1,024 | |||||||||
| Net expenses | 10,060,384 | 4,187,813 | 2,605,254 | |||||||||
| NET INVESTMENT INCOME (LOSS) | $ | (5,598,569 | ) | $ | 16,503,223 | $ | 1,061,732 | |||||
| REALIZED AND UNREALIZED GAINS (LOSSES): | ||||||||||||
| Net realized gain (loss) on: | ||||||||||||
| Investments from unaffiliated securities | $ | 63,683,118 | $ | 15,896,840 | $ | 1,944,040 | ||||||
| Investments from affiliated securities | — | — | — | |||||||||
| Long-term capital gain distributions from regulated investment companies | — | — | — | |||||||||
| Change in unrealized appreciation (depreciation) on investments | 49,854,427 | 38,631,748 | 30,826,479 | |||||||||
| Net gain (loss) on investments | 113,537,545 | 54,528,588 | 32,770,519 | |||||||||
| NET INCREASE (DECREASE) IN NET ASSETS RESULTING FROM OPERATIONS | $ | 107,938,976 | $ | 71,031,811 | $ | 33,832,251 | ||||||
(1) Net of foreign taxes withheld of $0, $303,444, $0, $0, $0, $0 and $0, respectively.
The accompanying notes are an integral part of these financial statements.
WWW.HENNESSYFUNDS.COM
50
| HENNESSY | HENNESSY | HENNESSY | HENNESSY | |||||||||||
| LARGE CAP | TECHNOLOGY | EQUITY AND | CORE BOND | |||||||||||
| FINANCIAL FUND | FUND | INCOME FUND | FUND | |||||||||||
| $ | 952,396 | $ | 53,911 | $ | 3,632,536 | $ | 202,657 | |||||||
| 59,925 | — | — | — | |||||||||||
| 197 | 38 | 2,229,010 | 1,074,105 | |||||||||||
| 1,012,518 | 53,949 | 5,861,546 | 1,276,762 | |||||||||||
| 549,491 | 60,210 | 1,726,176 | 251,697 | |||||||||||
| 44,066 | 9,241 | 168,966 | 33,776 | |||||||||||
| 3,200 | — | 10,834 | 1,819 | |||||||||||
| 13,914 | 5,757 | 42,161 | 3,318 | |||||||||||
| — | 2,675 | 34,660 | 7,475 | |||||||||||
| 152,636 | 13,989 | 340,404 | 9,766 | |||||||||||
| 12,592 | 30,490 | 40,309 | 26,018 | |||||||||||
| 19,200 | 19,198 | 20,329 | 20,330 | |||||||||||
| 43,465 | 40,124 | 44,205 | 40,075 | |||||||||||
| 10,982 | 8,856 | 16,078 | 9,811 | |||||||||||
| 10,170 | 1,063 | 22,588 | 3,785 | |||||||||||
| 7,672 | 2,615 | 17,320 | — | |||||||||||
| — | 592 | 6,532 | — | |||||||||||
| 16,187 | 16,186 | 16,186 | 16,187 | |||||||||||
| 73,853 | 12,307 | 108,483 | 8,666 | |||||||||||
| — | 485 | 35,345 | 10,040 | |||||||||||
| 80 | 19 | — | — | |||||||||||
| 3,178 | — | 3,662 | — | |||||||||||
| 960,686 | 223,807 | 2,654,238 | 442,763 | |||||||||||
| — | (96,067 | ) | (179,947 | ) | (102,642 | ) | ||||||||
| 960,686 | 127,740 | 2,474,291 | 340,121 | |||||||||||
| $ | 51,832 | $ | (73,791 | ) | $ | 3,387,255 | $ | 936,641 | ||||||
| $ | (3,007,601 | ) | $ | 105,389 | $ | 1,448,410 | $ | 730,827 | ||||||
| 137,738 | — | — | — | |||||||||||
| — | — | 3,301 | 2,641 | |||||||||||
| 13,073,690 | (96,492 | ) | 10,755,082 | 675,399 | ||||||||||
| 10,203,827 | 8,897 | 12,206,793 | 1,408,867 | |||||||||||
| $ | 10,255,659 | $ | (64,894 | ) | $ | 15,594,048 | $ | 2,345,508 | ||||||
HENNESSY FUNDS 1-800-966-4354
51
Financial Statements
| Statements of Changes in Net Assets |
| Hennessy Focus Fund | ||||||||
| Year Ended | Year Ended | |||||||
| October 31, 2012 | October 31, 2011 | |||||||
| OPERATIONS: | ||||||||
| Net investment income (loss) | $ | (5,598,569 | ) | $ | (7,221,589 | ) | ||
| Net realized gain (loss) on securities | 63,683,118 | 69,789,480 | ||||||
| Long-term capital gain distributions from regulated investment companies | — | — | ||||||
| Change in unrealized appreciation (depreciation) on securities | 49,854,427 | (10,251,836 | ) | |||||
| Net increase (decrease) in net assets resulting from operations | 107,938,976 | 52,316,055 | ||||||
| DISTRIBUTIONS TO SHAREHOLDERS FROM: | ||||||||
| Net investment income – Investor Class | — | — | ||||||
| Net investment income – Institutional Class | — | — | ||||||
| Net realized gains – Investor Class | (63,544,133 | ) | (24,307,241 | ) | ||||
| Net realized gains – Institutional Class | (5,298,059 | ) | (1,335,587 | ) | ||||
| Total distributions | (68,842,192 | ) | (25,642,828 | ) | ||||
| CAPITAL SHARE TRANSACTIONS: | ||||||||
| Proceeds from shares subscribed – Investor Class | 179,555,653 | 116,123,991 | ||||||
| Proceeds from shares subscribed – Institutional Class | 31,219,319 | 28,327,587 | ||||||
| Dividends reinvested – Investor Class | 61,703,733 | 23,268,243 | ||||||
| Dividends reinvested – Institutional Class | 4,808,848 | 1,290,549 | ||||||
| Cost of shares redeemed – Investor Class | (179,761,921 | ) | (224,457,709 | ) | ||||
| Cost of shares redeemed – Institutional Class | (12,079,868 | ) | (18,533,787 | ) | ||||
| Net increase (decrease) in net assets derived from capital share transactions | 85,445,764 | (73,981,126 | ) | |||||
| TOTAL INCREASE (DECREASE) IN NET ASSETS | 124,542,548 | (47,307,899 | ) | |||||
| NET ASSETS: | ||||||||
| Beginning of year | 660,342,645 | 707,650,544 | ||||||
| End of year | $ | 784,885,193 | $ | 660,342,645 | ||||
| Accumulated net investment income (loss), end of period | $ | (5,555,872 | ) | $ | — | |||
| CHANGES IN SHARES OUTSTANDING: | ||||||||
| Shares sold – Investor Class | 3,675,823 | 2,351,234 | ||||||
| Shares sold – Institutional Class | 640,920 | 909,520 | ||||||
| Shares issued to holders as reinvestment of dividends – Investor Class | 1,379,779 | 473,509 | ||||||
| Shares issued to holders as reinvestment of dividends – Institutional Class | 106,958 | 26,215 | ||||||
| Shares redeemed – Investor Class | (3,665,085 | ) | (4,651,789 | ) | ||||
| Shares redeemed – Institutional Class | (246,768 | ) | (662,843 | ) | ||||
| Net increase (decrease) in shares outstanding | 1,891,627 | (1,554,154 | ) | |||||
The accompanying notes are an integral part of these financial statements.
WWW.HENNESSYFUNDS.COM
52
| Hennessy Gas Utility Index Fund | Hennessy Small Cap Financial Fund | Hennessy Large Cap Financial Fund | ||||||||||||||||||||
| Year Ended | Year Ended | Year Ended | Year Ended | Year Ended | Year Ended | |||||||||||||||||
| October 31, 2012 | October 31, 2011 | October 31, 2012 | October 31, 2011 | October 31, 2012 | October 31, 2011 | |||||||||||||||||
| $ | 16,503,223 | $ | 8,042,465 | $ | 1,061,732 | $ | 2,102,026 | $ | 51,832 | $ | (210,507 | ) | ||||||||||
| 15,896,840 | 3,417,370 | 1,944,040 | (5,543,171 | ) | (2,869,863 | ) | (2,300,974 | ) | ||||||||||||||
| — | — | — | — | — | — | |||||||||||||||||
| 38,631,748 | 53,861,410 | 30,826,479 | (17,139,877 | ) | 13,073,690 | (4,407,932 | ) | |||||||||||||||
| 71,031,811 | 65,321,245 | 33,832,251 | (20,581,022 | ) | 10,255,659 | (6,919,413 | ) | |||||||||||||||
| (16,153,180 | ) | (8,022,358 | ) | (2,581,343 | ) | (725,603 | ) | — | — | |||||||||||||
| — | — | (600,281 | ) | (256,185 | ) | — | — | |||||||||||||||
| (3,837,545 | ) | (2,818,013 | ) | — | (1,605,904 | ) | — | — | ||||||||||||||
| — | — | — | (275,476 | ) | — | — | ||||||||||||||||
| (19,990,725 | ) | (10,840,371 | ) | (3,181,624 | ) | (2,863,168 | ) | — | — | |||||||||||||
| 455,625,004 | 174,605,319 | 35,833,043 | 94,080,317 | 16,478,942 | 32,559,261 | |||||||||||||||||
| — | — | 29,798,695 | 12,177,273 | — | — | |||||||||||||||||
| 18,728,680 | 10,114,130 | 2,505,214 | 2,253,869 | — | — | |||||||||||||||||
| — | — | 541,245 | 504,775 | — | — | |||||||||||||||||
| (212,356,106 | ) | (49,459,579 | ) | (52,499,033 | ) | (139,260,794 | ) | (17,762,354 | ) | (18,672,760 | ) | |||||||||||
| — | — | (9,935,564 | ) | (13,968,745 | ) | — | — | |||||||||||||||
| 261,997,578 | 135,259,870 | 6,243,600 | (44,213,305 | ) | (1,283,412 | ) | 13,886,501 | |||||||||||||||
| 313,038,664 | 189,740,744 | 36,894,227 | (67,657,495 | ) | 8,972,247 | 6,967,088 | ||||||||||||||||
| 433,781,768 | 244,041,024 | 174,100,840 | 241,758,335 | 55,683,644 | 48,716,556 | |||||||||||||||||
| $ | 746,820,432 | $ | 433,781,768 | $ | 210,995,067 | $ | 174,100,840 | $ | 64,655,891 | $ | 55,683,644 | |||||||||||
| $ | 452,765 | $ | 93,553 | $ | 715,079 | $ | 2,346,347 | $ | 50,837 | $ | — | |||||||||||
| 20,822,498 | 8,918,950 | 2,027,671 | 4,827,202 | 1,270,324 | 2,347,452 | |||||||||||||||||
| — | — | 2,516,251 | 950,220 | — | — | |||||||||||||||||
| 855,456 | 396,830 | 151,831 | 116,283 | — | — | |||||||||||||||||
| — | — | 52,043 | 40,309 | — | — | |||||||||||||||||
| (9,730,123 | ) | (2,550,055 | ) | (2,981,029 | ) | (7,556,513 | ) | (1,379,184 | ) | (1,455,102 | ) | |||||||||||
| — | — | (904,613 | ) | (1,242,590 | ) | — | — | |||||||||||||||
| 11,947,831 | 6,765,725 | 862,154 | (2,865,089 | ) | (108,860 | ) | 892,350 | |||||||||||||||
HENNESSY FUNDS 1-800-966-4354
53
Financial Statements
| Statements of Changes in Net Assets |
| Hennessy Technology Fund | ||||||||
| Year Ended | Year Ended | |||||||
| October 31, 2012 | October 31, 2011 | |||||||
| OPERATIONS: | ||||||||
| Net investment income (loss) | $ | (73,791 | ) | $ | (131,860 | ) | ||
| Net realized gain (loss) on securities | 105,389 | 1,108,080 | ||||||
| Long-term capital gain distributions from regulated investment companies | — | — | ||||||
| Change in unrealized appreciation (depreciation) on securities | (96,492 | ) | (909,888 | ) | ||||
| Net increase (decrease) in net assets resulting from operations | (64,894 | ) | 66,332 | |||||
| DISTRIBUTIONS TO SHAREHOLDERS FROM: | ||||||||
| Net investment income – Investor Class | — | — | ||||||
| Net investment income – Institutional Class | — | — | ||||||
| Net realized gains – Investor Class | — | — | ||||||
| Net realized gains – Institutional Class | — | — | ||||||
| Total distributions | — | — | ||||||
| CAPITAL SHARE TRANSACTIONS: | ||||||||
| Proceeds from shares subscribed – Investor Class | 1,102,171 | 933,790 | ||||||
| Proceeds from shares subscribed – Institutional Class | 117,282 | 141,716 | ||||||
| Dividends reinvested – Investor Class | — | — | ||||||
| Dividends reinvested – Institutional Class | — | — | ||||||
| Cost of shares redeemed – Investor Class | (2,317,205 | ) | (3,427,601 | ) | ||||
| Cost of shares redeemed – Institutional Class | (318,228 | ) | (3,677,007 | ) | ||||
| Net increase (decrease) in net assets derived from capital share transactions | (1,415,980 | ) | (6,029,102 | ) | ||||
| TOTAL INCREASE (DECREASE) IN NET ASSETS | (1,480,874 | ) | (5,962,770 | ) | ||||
| NET ASSETS: | ||||||||
| Beginning of year | 6,854,918 | 12,817,688 | ||||||
| End of year | $ | 5,374,044 | $ | 6,854,918 | ||||
| Accumulated net investment income (loss), end of period | $ | (64,030 | ) | $ | — | |||
| CHANGES IN SHARES OUTSTANDING: | ||||||||
| Shares sold – Investor Class | 100,084 | 80,830 | ||||||
| Shares sold – Institutional Class | 10,510 | 12,475 | ||||||
| Shares issued to holders as reinvestment of dividends – Investor Class | — | — | ||||||
| Shares issued to holders as reinvestment of dividends – Institutional Class | — | — | ||||||
| Shares redeemed – Investor Class | (208,443 | ) | (302,424 | ) | ||||
| Shares redeemed – Institutional Class | (29,733 | ) | (325,462 | ) | ||||
| Net increase (decrease) in shares outstanding | (127,582 | ) | (534,581 | ) | ||||
The accompanying notes are an integral part of these financial statements.
WWW.HENNESSYFUNDS.COM
54
| Hennessy Equity and Income Fund | Hennessy Core Bond Fund | |||||||||||||
| Year Ended | Year Ended | Year Ended | Year Ended | |||||||||||
| October 31, 2012 | October 31, 2011 | October 31, 2012 | October 31, 2011 | |||||||||||
| $ | 3,387,255 | $ | 2,261,233 | $ | 936,641 | $ | 1,061,269 | |||||||
| 1,448,410 | 3,679,665 | 730,827 | 344,435 | |||||||||||
| 3,301 | — | 2,641 | — | |||||||||||
| 10,755,082 | 4,044,861 | 675,399 | (741,372 | ) | ||||||||||
| 15,594,048 | 9,985,759 | 2,345,508 | 664,332 | |||||||||||
| (1,939,551 | ) | (938,298 | ) | (79,978 | ) | (137,452 | ) | |||||||
| (1,382,811 | ) | (1,201,869 | ) | (855,949 | ) | (925,575 | ) | |||||||
| — | — | (35,520 | ) | (67,867 | ) | |||||||||
| — | — | (224,731 | ) | (403,399 | ) | |||||||||
| (3,322,362 | ) | (2,140,167 | ) | (1,196,178 | ) | (1,534,293 | ) | |||||||
| �� | ||||||||||||||
| 186,044,450 | 21,892,863 | 750,864 | 1,121,100 | |||||||||||
| 58,487,290 | 11,344,367 | 9,744,071 | 207,173 | |||||||||||
| 1,782,862 | 799,608 | 100,421 | 171,157 | |||||||||||
| 787,199 | 582,146 | 276,637 | 201,570 | |||||||||||
| (55,147,222 | ) | (11,356,943 | ) | (1,491,425 | ) | (1,567,151 | ) | |||||||
| (10,854,505 | ) | (2,741,528 | ) | (915,194 | ) | (662,060 | ) | |||||||
| 181,100,074 | 20,520,513 | 8,465,374 | (528,211 | ) | ||||||||||
| 193,371,760 | 28,366,105 | 9,614,704 | (1,398,172 | ) | ||||||||||
| 112,033,455 | 83,667,350 | 27,294,198 | 28,692,370 | |||||||||||
| $ | 305,405,215 | $ | 112,033,455 | $ | 36,908,902 | $ | 27,294,198 | |||||||
| $ | 312,645 | $ | 223,082 | $ | 2,309 | $ | 8,277 | |||||||
| 13,582,962 | 1,737,714 | 77,850 | 117,394 | |||||||||||
| 4,455,425 | 945,356 | 1,098,239 | 23,618 | |||||||||||
| 129,222 | 64,232 | 10,455 | 18,179 | |||||||||||
| 60,174 | 49,108 | 31,173 | 23,287 | |||||||||||
| (3,976,644 | ) | (913,207 | ) | (153,825 | ) | (164,856 | ) | |||||||
| (818,985 | ) | (233,375 | ) | (102,473 | ) | (75,253 | ) | |||||||
| 13,432,154 | 1,649,828 | 961,419 | (57,631 | ) | ||||||||||
HENNESSY FUNDS 1-800-966-4354
55
Financial Highlights
| Hennessy Focus Fund (formerly FBR Focus Fund) |
For an Investor Class share outstanding throughout each year
| Year Ended October 31, | ||||||||||||||||||||
| 2012 | 2011 | 2010 | 2009 | 2008 | ||||||||||||||||
| PER SHARE DATA: | ||||||||||||||||||||
| Net asset value, beginning of year | $ | 49.80 | $ | 47.57 | $ | 37.56 | $ | 37.40 | $ | 57.97 | ||||||||||
| Income from investment operations: | ||||||||||||||||||||
| Net investment income (loss) | (0.39 | ) | (0.50 | )(1) | (0.64 | ) | (0.42 | ) | (0.44 | ) | ||||||||||
| Net realized and unrealized gains (losses) on securities | 7.61 | 4.44 | 10.65 | 5.76 | (19.51 | ) | ||||||||||||||
| Total from investment operations | 7.22 | 3.94 | 10.01 | 5.34 | (19.95 | ) | ||||||||||||||
| Less Distributions: | ||||||||||||||||||||
| Dividends from net investment income | — | — | — | — | (0.12 | ) | ||||||||||||||
| Dividends from net realized gains | (5.24 | ) | (1.72 | ) | — | (5.19 | ) | (0.51 | ) | |||||||||||
| Total distributions | (5.24 | ) | (1.72 | ) | — | (5.19 | ) | (0.63 | ) | |||||||||||
| Paid-in capital from redemption fees | 0.00 | (2) | 0.01 | 0.00 | (2) | 0.01 | 0.01 | |||||||||||||
| Net asset value, end of year | $ | 51.78 | $ | 49.80 | $ | 47.57 | $ | 37.56 | $ | 37.40 | ||||||||||
| TOTAL RETURN | 16.17 | % | 8.35 | % | 26.65 | % | 17.74 | % | (34.73 | )% | ||||||||||
| SUPPLEMENTAL DATA AND RATIOS: | ||||||||||||||||||||
| Net assets, end of year (millions) | $ | 707.61 | $ | 611.34 | $ | 670.84 | $ | 759.77 | $ | 717.78 | ||||||||||
| Ratio of expenses to average net assets | 1.41 | % | 1.44 | % | 1.51 | % | 1.43 | % | 1.42 | % | ||||||||||
| Ratio of net investment loss to average net assets | (0.79 | )% | (1.01 | )% | (1.31 | )% | (1.16 | )% | (0.67 | )% | ||||||||||
Portfolio turnover rate(3) | 13 | % | 13 | % | 5 | % | 5 | % | 17 | % | ||||||||||
(1) Calculated based on average shares outstanding method.
(2) Amount is less than $0.01.
(3) Portfolio turnover is calculated on the basis of the Fund as a whole.
The accompanying notes are an integral part of these financial statements.
WWW.HENNESSYFUNDS.COM
56
Financial Highlights
| Hennessy Focus Fund (formerly FBR Focus Fund) |
For an Institutional Class share outstanding throughout each period*
| Period Ended | ||||||||||||||||||||
| Year Ended October 31, | October 31, | |||||||||||||||||||
| 2012 | 2011 | 2010 | 2009 | 2008(1) | ||||||||||||||||
| PER SHARE DATA: | ||||||||||||||||||||
| Net asset value, beginning of period | $ | 50.02 | $ | 47.64 | $ | 37.84 | $ | 130.93 | $ | 180.00 | ||||||||||
| Income from investment operations: | ||||||||||||||||||||
| Net investment income (loss) | (0.22 | ) | (0.37 | )(2) | (0.41 | ) | (0.25 | ) | (0.20 | ) | ||||||||||
| Net realized and unrealized gains (losses) on securities | 7.63 | 4.47 | 10.58 | 0.59 | (49.05 | ) | ||||||||||||||
| Total from investment operations | 7.41 | 4.10 | 10.17 | 0.34 | (49.25 | ) | ||||||||||||||
| Less Distributions: | ||||||||||||||||||||
| Dividends from net investment income | — | — | (0.37 | ) | — | — | ||||||||||||||
| Dividends from net realized gains | (5.24 | ) | (1.72 | ) | — | (93.45 | ) | — | ||||||||||||
| Total distributions | (5.24 | ) | (1.72 | ) | (0.37 | ) | (93.45 | ) | — | |||||||||||
| Paid-in capital from redemption fees | 0.00 | (3) | 0.00 | (3) | 0.00 | (3) | 0.02 | 0.18 | ||||||||||||
| Net asset value, end of period | $ | 52.19 | $ | 50.02 | $ | 47.64 | $ | 37.84 | $ | 130.93 | ||||||||||
| TOTAL RETURN | 16.51 | % | 8.53 | % | 27.32 | % | 18.15 | % | (27.30 | )%(4) | ||||||||||
| SUPPLEMENTAL DATA AND RATIOS: | ||||||||||||||||||||
| Net assets, end of period (millions) | $ | 77.28 | $ | 49.01 | $ | 36.81 | $ | 34.23 | $ | 16.83 | ||||||||||
| Ratio of expenses to average net assets | 1.12 | % | 1.15 | % | 1.26 | % | 1.15 | % | 1.05 | %(5) | ||||||||||
| Ratio of net investment income (loss) to average net assets | (0.52 | )% | (0.76 | )% | (1.06 | )% | (0.88 | )% | (0.70 | )%(5) | ||||||||||
Portfolio turnover rate(6) | 13 | % | 13 | % | 5 | % | 5 | % | 17 | %(4) | ||||||||||
| * | Per share amounts have been restated on a retroactive basis to reflect a 1:18 reverse stock split effective December 10, 2010. |
| (1) | Institutional Class shares commenced operations on May 30, 2008. |
| (2) | Calculated based on average shares outstanding method. |
| (3) | Amount is less than $0.01. |
| (4) | Not Annualized. |
| (5) | Annualized. |
| (6) | Portfolio turnover is calculated on the basis of the Fund as a whole. |
The accompanying notes are an integral part of these financial statements.
HENNESSY FUNDS 1-800-966-4354
57
Financial Highlights
| Hennessy Gas Utility Index Fund (formerly FBR Gas Utility Index Fund) |
For an Investor Class share outstanding throughout each year
| Year Ended October 31, | ||||||||||||||||||||
| 2012 | 2011 | 2010 | 2009 | 2008 | ||||||||||||||||
| PER SHARE DATA: | ||||||||||||||||||||
| Net asset value, beginning of year | $ | 21.21 | $ | 17.83 | $ | 15.13 | $ | 15.26 | $ | 23.14 | ||||||||||
| Income from investment operations: | ||||||||||||||||||||
| Net investment income | 0.58 | 0.51 | (1) | 0.58 | 0.49 | 0.47 | ||||||||||||||
| Net realized and unrealized gains (losses) on securities | 1.99 | 3.59 | 2.72 | 0.60 | (6.13 | ) | ||||||||||||||
| Total from investment operations | 2.57 | 4.10 | 3.30 | 1.09 | (5.66 | ) | ||||||||||||||
| Less Distributions: | ||||||||||||||||||||
| Dividends from net investment income | (0.58 | ) | (0.51 | ) | (0.58 | ) | (0.49 | ) | (0.47 | ) | ||||||||||
| Dividends from realized capital gains | (0.16 | ) | (0.21 | ) | (0.02 | ) | (0.74 | ) | (1.75 | ) | ||||||||||
| Total distributions | (0.74 | ) | (0.72 | ) | (0.60 | ) | (1.23 | ) | (2.22 | ) | ||||||||||
| Paid-in capital from redemption fees | 0.01 | 0.00 | (2) | 0.00 | (2) | 0.01 | 0.00 | (2) | ||||||||||||
| Net asset value, end of year | $ | 23.05 | $ | 21.21 | $ | 17.83 | $ | 15.13 | $ | 15.26 | ||||||||||
| TOTAL RETURN | 12.41 | % | 23.54 | % | 22.25 | % | 8.18 | % | (26.81 | )% | ||||||||||
| SUPPLEMENTAL DATA AND RATIOS: | ||||||||||||||||||||
| Net assets, end of year (millions) | $ | 746.82 | $ | 433.78 | $ | 244.04 | $ | 193.68 | $ | 198.57 | ||||||||||
| Ratio of expenses to average net assets: | ||||||||||||||||||||
| Before expense reimbursement | 0.69 | % | 0.71 | % | 0.77 | % | 0.76 | % | 0.70 | % | ||||||||||
| After expense reimbursement | 0.69 | % | 0.71 | % | 0.76 | % | 0.76 | % | 0.70 | % | ||||||||||
| Ratio of net investment income to average net assets: | ||||||||||||||||||||
| Before expense reimbursement | 2.72 | % | 2.68 | % | 3.50 | % | 3.51 | % | 2.39 | % | ||||||||||
| After expense reimbursement | 2.72 | % | 2.68 | % | 3.51 | % | 3.51 | % | 2.39 | % | ||||||||||
| Portfolio turnover rate | 16 | % | 17 | % | 16 | % | 26 | % | 27 | % | ||||||||||
(1) Calculated based on average shares outstanding method.
(2) Amount is less than $0.01.
The accompanying notes are an integral part of these financial statements.
WWW.HENNESSYFUNDS.COM
58
(This Page Intentionally Left Blank.)
HENNESSY FUNDS 1-800-966-4354
59
Financial Highlights
| Hennessy Small Cap Financial Fund (formerly FBR Small Cap Financial Fund) |
For an Investor Class share outstanding throughout each year
| Year Ended October 31, | ||||||||||||||||||||
| 2012 | 2011 | 2010 | 2009 | 2008 | ||||||||||||||||
| PER SHARE DATA: | ||||||||||||||||||||
| Net asset value, beginning of year | $ | 16.48 | $ | 18.11 | $ | 15.91 | $ | 15.22 | $ | 23.18 | ||||||||||
| Income from investment operations: | ||||||||||||||||||||
| Net investment income (loss) | 0.11 | 0.21 | (1) | 0.08 | 0.06 | 0.24 | ||||||||||||||
| Net realized and unrealized gains (losses) on securities | 3.24 | (1.66 | ) | 2.17 | 0.81 | (1.69 | ) | |||||||||||||
| Total from investment operations | 3.35 | (1.45 | ) | 2.25 | 0.87 | (1.45 | ) | |||||||||||||
| Less Distributions: | ||||||||||||||||||||
| Dividends from net investment income | (0.29 | ) | (0.06 | ) | (0.07 | ) | (0.19 | ) | (0.28 | ) | ||||||||||
| Dividends from net realized gains | — | (0.13 | ) | — | — | (6.24 | ) | |||||||||||||
| Total distributions | (0.29 | ) | (0.19 | ) | (0.07 | ) | (0.19 | ) | (6.52 | ) | ||||||||||
| Paid-in capital from redemption fees | 0.00 | (2) | 0.01 | 0.02 | 0.01 | 0.01 | ||||||||||||||
| Net asset value, end of year | $ | 19.54 | $ | 16.48 | $ | 18.11 | $ | 15.91 | $ | 15.22 | ||||||||||
| TOTAL RETURN | 20.65 | % | (8.12 | )% | 14.27 | % | 5.89 | % | (6.76 | )% | ||||||||||
| SUPPLEMENTAL DATA AND RATIOS: | ||||||||||||||||||||
| Net assets, end of year (millions) | $ | 167.20 | $ | 154.21 | $ | 216.75 | $ | 187.56 | $ | 181.80 | ||||||||||
| Ratio of expenses to average net assets: | ||||||||||||||||||||
| Before expense reimbursement/recoupment | 1.45 | % | 1.52 | % | 1.51 | % | 1.51 | % | 1.49 | % | ||||||||||
| After expense reimbursement/recoupment | 1.45 | % | 1.52 | % | 1.51 | % | 1.51 | % | 1.49 | % | ||||||||||
| Ratio of net investment income to average net assets: | ||||||||||||||||||||
| Before expense reimbursement/recoupment | 0.56 | % | 0.81 | % | 0.35 | % | 0.50 | % | 1.48 | % | ||||||||||
| After expense reimbursement/recoupment | 0.56 | % | 0.81 | % | 0.35 | % | 0.50 | % | 1.48 | % | ||||||||||
Portfolio turnover rate(3) | 43 | % | 70 | % | 89 | % | 118 | % | 147 | % | ||||||||||
(1) Calculated based on average shares outstanding method.
(2) Amount is less than $0.01.
(3) Portfolio turnover is calculated on the basis of the Fund as a whole.
The accompanying notes are an integral part of these financial statements.
WWW.HENNESSYFUNDS.COM
60
Financial Highlights
| Hennessy Small Cap Financial Fund (formerly FBR Small Cap Financial Fund) |
For an Institutional Class share outstanding throughout each period
| Period Ended | ||||||||||||||||||||
| Year Ended October 31, | October 31, | |||||||||||||||||||
| 2012 | 2011 | 2010 | 2009 | 2008(1) | ||||||||||||||||
| PER SHARE DATA: | ||||||||||||||||||||
| Net asset value, beginning of period | $ | 10.55 | 11.70 | 10.34 | $ | 9.96 | 10.00 | |||||||||||||
| Income from investment operations: | ||||||||||||||||||||
| Net investment income | 0.16 | 0.19 | (2) | 0.09 | 0.19 | 0.02 | ||||||||||||||
| Net realized and unrealized gains (losses) on securities | 1.98 | (1.09 | ) | 1.40 | 0.40 | (0.06 | ) | |||||||||||||
| Total from investment operations | 2.14 | (0.90 | ) | 1.49 | 0.59 | (0.04 | ) | |||||||||||||
| Less Distributions: | ||||||||||||||||||||
| Dividends from net investment income | (0.35 | ) | (0.12 | ) | (0.13 | ) | (0.21 | ) | — | |||||||||||
| Dividends from net realized gains | — | (0.13 | ) | — | — | — | ||||||||||||||
| Total distributions | (0.35 | ) | (0.25 | ) | (0.13 | ) | (0.21 | ) | — | |||||||||||
| Paid-in capital from redemption fees | 0.00 | (3) | — | 0.00 | (3) | — | — | |||||||||||||
| Net asset value, end of period | $ | 12.34 | $ | 10.55 | $ | 11.70 | $ | 10.34 | $ | 9.96 | ||||||||||
| TOTAL RETURN | 20.95 | % | (8.00 | )% | 14.52 | % | 6.14 | % | (0.40 | )%(4) | ||||||||||
| SUPPLEMENTAL DATA AND RATIOS: | ||||||||||||||||||||
| Net assets, end of period (millions) | $ | 43.79 | $ | 19.89 | $ | 25.01 | $ | 10.64 | $ | 3.95 | ||||||||||
| Ratio of expenses to average net assets: | ||||||||||||||||||||
| Before expense reimbursement | 1.25 | % | 1.34 | % | 1.23 | % | 1.56 | % | 1.31 | %(5) | ||||||||||
| After expense reimbursement | 1.25 | % | 1.34 | % | 1.23 | % | 1.56 | % | 1.31 | %(5) | ||||||||||
| Ratio of net investment income to average net assets: | ||||||||||||||||||||
| Before expense reimbursement | 0.72 | % | 1.00 | % | 0.61 | % | 0.04 | % | 1.49 | %(5) | ||||||||||
| After expense reimbursement | 0.72 | % | 1.00 | % | 0.61 | % | 0.04 | % | 1.49 | %(5) | ||||||||||
Portfolio turnover rate(6) | 43 | % | 70 | % | 89 | % | 118 | % | 147 | %(4) | ||||||||||
(1) Institutional Class shares commenced operations on May 30, 2008.
(2) Calculated based on average shares outstanding method.
(3) Amount is less than $0.01.
(4) Not Annualized.
(5) Annualized.
(6) Portfolio turnover is calculated on the basis of the Fund as a whole.
The accompanying notes are an integral part of these financial statements.
HENNESSY FUNDS 1-800-966-4354
61
Financial Highlights
| Hennessy Large Cap Financial Fund (formerly FBR Large Cap Financial Fund) |
For an Investor Class share outstanding throughout each year
| Year Ended October 31, | ||||||||||||||||||||
| 2012 | 2011 | 2010 | 2009 | 2008 | ||||||||||||||||
| PER SHARE DATA: | ||||||||||||||||||||
| Net asset value, beginning of year | $ | 11.91 | $ | 12.88 | $ | 12.61 | $ | 11.14 | $ | 18.71 | ||||||||||
| Income from investment operations: | ||||||||||||||||||||
| Net investment income (loss) | 0.01 | (0.04 | )(1) | (0.08 | ) | 0.00 | (2) | 0.14 | ||||||||||||
| Net realized and unrealized gains (losses) on investments | 2.24 | (0.93 | ) | 0.35 | 1.58 | (3.86 | ) | |||||||||||||
| Total from investment operations | 2.25 | (0.97 | ) | 0.27 | 1.58 | (3.72 | ) | |||||||||||||
| Less Distributions: | ||||||||||||||||||||
| Dividends from net investment income | — | — | — | (0.10 | ) | (0.18 | ) | |||||||||||||
| Distribution in Excess of Net Investment Income | — | — | — | (0.02 | ) | — | ||||||||||||||
| Dividends from net realized gains | — | — | — | — | (3.68 | ) | ||||||||||||||
| Total distributions | — | — | — | (0.12 | ) | (3.86 | ) | |||||||||||||
| Paid-in capital from redemption fees | 0.00 | (2) | 0.00 | (2) | 0.00 | (2) | 0.01 | 0.01 | ||||||||||||
| Net asset value, end of year | $ | 14.16 | $ | 11.91 | $ | 12.88 | $ | 12.61 | $ | 11.14 | ||||||||||
| TOTAL RETURN | 18.89 | % | (7.53 | )% | 2.14 | % | 14.52 | % | (23.76 | )% | ||||||||||
| SUPPLEMENTAL DATA AND RATIOS: | ||||||||||||||||||||
| Net assets, end of year (millions) | $ | 64.66 | $ | 55.68 | $ | 48.72 | $ | 37.20 | $ | 24.27 | ||||||||||
| Ratio of expenses to average net assets: | ||||||||||||||||||||
| Before expense reimbursement | 1.57 | % | 1.61 | % | 1.78 | % | 1.81 | % | 2.01 | % | ||||||||||
| After expense reimbursement | 1.57 | % | 1.61 | % | 1.78 | % | 1.81 | % | 1.88 | % | ||||||||||
| Ratio of net investment income/(loss) to average net assets: | ||||||||||||||||||||
| Before expense reimbursement | 0.09 | % | (0.34 | )% | (0.73 | )% | (0.08 | )% | 1.50 | % | ||||||||||
| After expense reimbursement | 0.09 | % | (0.34 | )% | (0.73 | )% | (0.08 | )% | 1.63 | % | ||||||||||
| Portfolio turnover rate | 93 | % | 97 | % | 150 | % | 220 | % | 509 | % | ||||||||||
(1) Calculated based on average shares outstanding method.
(2) Amount is less than $0.01.
The accompanying notes are an integral part of these financial statements.
WWW.HENNESSYFUNDS.COM
62
(This Page Intentionally Left Blank.)
HENNESSY FUNDS 1-800-966-4354
63
Financial Highlights
| Hennessy Technology Fund (formerly FBR Technology Fund) |
For an Investor Class share outstanding throughout each year
| Year Ended October 31, | ||||||||||||||||||||
| 2012 | 2011 | 2010 | 2009 | 2008 | ||||||||||||||||
| PER SHARE DATA: | ||||||||||||||||||||
| Net asset value, beginning of year | $ | 10.86 | $ | 11.00 | $ | 9.05 | $ | 6.96 | $ | 13.34 | ||||||||||
| Income from investment operations: | ||||||||||||||||||||
| Net investment income (loss) | (0.15 | ) | (0.17 | )(1) | (0.14 | ) | (0.08 | ) | (0.12 | ) | ||||||||||
| Net realized and unrealized gains (losses) on investments | (0.04 | ) | 0.03 | 2.08 | 2.16 | (5.03 | ) | |||||||||||||
| Total from investment operations | (0.19 | ) | (0.14 | ) | 1.94 | 2.08 | (5.15 | ) | ||||||||||||
| Less Distributions: | ||||||||||||||||||||
| Dividends from net investment income | — | — | — | — | — | |||||||||||||||
| Dividends from net realized gains | — | — | — | — | (1.23 | ) | ||||||||||||||
| Total distributions | — | — | — | — | (1.23 | ) | ||||||||||||||
| Paid-in capital from redemption fees | 0.00 | (2) | 0.00 | (2) | 0.01 | 0.01 | 0.00 | (2) | ||||||||||||
| Net asset value, end of year | $ | 10.67 | $ | 10.86 | $ | 11.00 | $ | 9.05 | $ | 6.96 | ||||||||||
| TOTAL RETURN | (1.75 | )% | (1.27 | )% | 21.55 | % | 30.03 | % | (42.30 | )% | ||||||||||
| SUPPLEMENTAL DATA AND RATIOS: | ||||||||||||||||||||
| Net assets, end of year (millions) | $ | 4.44 | $ | 5.70 | $ | 8.21 | $ | 8.39 | $ | 7.69 | ||||||||||
| Ratio of expenses to average net assets: | ||||||||||||||||||||
| Before expense reimbursement | 3.20 | % | 2.79 | % | 2.50 | % | 3.00 | % | 1.92 | % | ||||||||||
| After expense reimbursement | 1.95 | % | 1.95 | % | 1.95 | % | 1.95 | % | 1.84 | % | ||||||||||
| Ratio of net investment income/(loss) to average net assets: | ||||||||||||||||||||
| Before expense reimbursement | (2.39 | )% | (2.38 | )% | (1.64 | )% | (2.10 | )% | (0.68 | )% | ||||||||||
| After expense reimbursement | (1.14 | )% | (1.54 | )% | (1.10 | )% | (1.05 | )% | (0.60 | )% | ||||||||||
Portfolio turnover rate(3) | 138 | % | 141 | % | 353 | % | 211 | % | 175 | % | ||||||||||
(1) Calculated based on average shares outstanding method.
(2) Amount is less than $0.01.
(3) Portfolio turnover is calculated on the basis of the Fund as a whole.
The accompanying notes are an integral part of these financial statements.
WWW.HENNESSYFUNDS.COM
64
Financial Highlights
| Hennessy Technology Fund (formerly FBR Technology Fund) |
For an Institutional Class share outstanding throughout each period
| For the Year Ended | Period Ended | |||||||||||
| October 31, | October 31, | |||||||||||
| 2012 | 2011 | 2010(1) | ||||||||||
| PER SHARE DATA: | ||||||||||||
| Net asset value, beginning of period | $ | 10.89 | $ | 11.00 | $ | 10.46 | ||||||
| Income from investment operations: | ||||||||||||
| Net investment income (loss) | (0.11 | ) | (0.14 | )(2) | (0.07 | ) | ||||||
| Net realized and unrealized gains (losses) on investments | (0.05 | ) | 0.03 | 0.61 | ||||||||
| Total from investment operations | (0.16 | ) | (0.11 | ) | 0.54 | |||||||
| Paid-in capital from redemption fees | 0.00 | (3) | 0.00 | (3) | 0.00 | (3) | ||||||
| Net asset value, end of period | $ | 10.73 | $ | 10.89 | $ | 11.00 | ||||||
| TOTAL RETURN | (1.47 | )% | (1.00 | )% | 5.16 | %(4) | ||||||
| �� | ||||||||||||
| SUPPLEMENTAL DATA AND RATIOS: | ||||||||||||
| Net assets, end of period (millions) | $ | 0.93 | $ | 1.16 | $ | 4.61 | ||||||
| Ratio of expenses to average net assets: | ||||||||||||
| Before expense reimbursement | 4.11 | % | 3.45 | % | 2.34 | %(5) | ||||||
| After expense reimbursement | 1.70 | % | 1.70 | % | 1.70 | %(5) | ||||||
| Ratio of net investment income/(loss) to average net assets: | ||||||||||||
| Before expense reimbursement | (3.31 | )% | (2.99 | )% | (1.41 | )%(5) | ||||||
| After expense reimbursement | (0.90 | )% | (1.24 | )% | (0.77 | )%(5) | ||||||
Portfolio turnover rate(6) | 138 | % | 141 | % | 353 | %(4) | ||||||
(1) Institutional Class shares commenced operations on March 12, 2010.
(2) Calculated based on average shares outstanding method.
(3) Amount is less than $0.01.
(4) Not Annualized.
(5) Annualized.
(6) Portfolio turnover is calculated on the basis of the Fund as a whole.
The accompanying notes are an integral part of these financial statements.
HENNESSY FUNDS 1-800-966-4354
65
Financial Highlights
| Hennessy Equity and Income Fund (formerly FBR Balanced Fund) |
For an Investor Class share outstanding throughout each period
| For the Period | ||||||||||||||||||||||||
| April 1, | ||||||||||||||||||||||||
| For the Year | 2010 to | |||||||||||||||||||||||
| Ended October 31, | October 31, | Year Ended March 31, | ||||||||||||||||||||||
| 2012 | 2011 | 2010(1) | 2010 | 2009 | 2008 | |||||||||||||||||||
| PER SHARE DATA: | ||||||||||||||||||||||||
| Net asset value, beginning of period | $ | 12.99 | $ | 11.93 | $ | 11.52 | $ | 8.92 | $ | 12.27 | $ | 14.48 | ||||||||||||
| Income from investment operations: | ||||||||||||||||||||||||
| Net investment income | 0.18 | 0.29 | (2) | 0.17 | (2) | 0.29 | (2) | 0.32 | (2) | 0.39 | (2) | |||||||||||||
| Net realized and unrealized gains (losses) on securities | 0.99 | 1.04 | 0.40 | 2.61 | (3.23 | ) | 0.34 | |||||||||||||||||
| Total from investment operations | 1.17 | 1.33 | 0.57 | 2.90 | (2.91 | ) | 0.73 | |||||||||||||||||
| Less Distributions: | ||||||||||||||||||||||||
| Dividends from net investment income | (0.20 | ) | (0.27 | ) | (0.16 | ) | (0.30 | ) | (0.25 | ) | (0.37 | ) | ||||||||||||
| Dividends from realized capital gains | 0.00 | — | — | — | (0.17 | ) | (2.57 | ) | ||||||||||||||||
| Return of capital | — | — | — | — | (0.03 | ) | — | |||||||||||||||||
| Total distributions | (0.20 | ) | (0.27 | ) | (0.16 | ) | (0.30 | ) | (0.45 | ) | (2.94 | ) | ||||||||||||
| Paid-in capital from redemption fees | 0.00 | (3) | 0.00 | (3) | 0.00 | (3) | 0.00 | (3) | 0.01 | — | ||||||||||||||
| Net asset value, end of period | $ | 13.96 | $ | 12.99 | $ | 11.93 | $ | 11.52 | $ | 8.92 | $ | 12.27 | ||||||||||||
| TOTAL RETURN | 9.01 | % | 11.30 | % | 5.04 | %(4) | 32.76 | % | (24.28 | )% | 4.45 | % | ||||||||||||
| SUPPLEMENTAL DATA AND RATIOS: | ||||||||||||||||||||||||
| Net assets, end of period (millions) | $ | 196.92 | $ | 56.75 | $ | 41.50 | $ | 46.81 | $ | 18.86 | $ | 21.70 | ||||||||||||
| Ratio of expenses to average net assets: | ||||||||||||||||||||||||
| Before expense reimbursement | 1.33 | % | 1.54 | % | 1.60 | %(5) | 1.69 | % | 1.84 | % | 1.66 | % | ||||||||||||
| After expense reimbursement | 1.24 | % | 1.24 | % | 1.24 | %(5) | 1.25 | % | 1.32 | % | 1.33 | % | ||||||||||||
| Ratio of net investment income to average net assets: | ||||||||||||||||||||||||
| Before expense reimbursement | 1.37 | % | 2.03 | % | 2.21 | %(5) | 2.26 | % | 2.50 | % | 2.42 | % | ||||||||||||
| After expense reimbursement | 1.46 | % | 2.33 | % | 2.56 | %(5) | 2.70 | % | 3.03 | % | 2.75 | % | ||||||||||||
Portfolio turnover rate(6) | 34 | % | 35 | % | 27 | %(4) | 26 | % | 32 | % | 110 | % | ||||||||||||
(1) The Fund changed its fiscal year end from March 31 to October 31.
(2) Calculated based on average shares outstanding method.
(3) Amount is less than $0.01.
(4) Not Annualized.
(5) Annualized.
(6) Portfolio turnover is calculated on the basis of the Fund as a whole.
The accompanying notes are an integral part of these financial statements.
WWW.HENNESSYFUNDS.COM
66
Financial Highlights
| Hennessy Equity and Income Fund (formerly FBR Balanced Fund) |
For an Institutional Class share outstanding throughout each period
| For the Period | ||||||||||||||||||||||||
| April 1, | ||||||||||||||||||||||||
| For the Year | 2010 to | |||||||||||||||||||||||
| Ended October 31, | October 31, | Year Ended March 31, | ||||||||||||||||||||||
| 2012 | 2011 | 2010(1) | 2010 | 2009 | 2008 | |||||||||||||||||||
| PER SHARE DATA: | ||||||||||||||||||||||||
| Net asset value, beginning of period | $ | 12.38 | $ | 11.38 | $ | 10.99 | $ | 8.52 | $ | 11.75 | $ | 13.98 | ||||||||||||
| Income from investment operations: | ||||||||||||||||||||||||
| Net investment income (loss) | 0.22 | 0.32 | (2) | 0.18 | (2) | 0.30 | (2) | 0.33 | (2) | 0.42 | (2) | |||||||||||||
| Net realized and unrealized gains (losses) on investments | 0.92 | 0.99 | 0.38 | 2.50 | (3.10 | ) | 0.33 | |||||||||||||||||
| Total from investment operations | 1.14 | 1.31 | 0.56 | 2.80 | (2.77 | ) | 0.75 | |||||||||||||||||
| Less Distributions: | ||||||||||||||||||||||||
| Dividends from net investment income | (0.23 | ) | (0.31 | ) | (0.17 | ) | (0.33 | ) | (0.26 | ) | (0.41 | ) | ||||||||||||
| Dividends from net realized gains | — | — | — | — | (0.17 | ) | (2.57 | ) | ||||||||||||||||
| Return of capital | — | — | — | — | (0.04 | ) | — | |||||||||||||||||
| Total distributions | (0.23 | ) | (0.31 | ) | (0.17 | ) | (0.33 | ) | (0.47 | ) | (2.98 | ) | ||||||||||||
| Paid-in capital from redemption fees | 0.00 | (3) | 0.00 | (3) | 0.00 | (3) | 0.00 | (3) | 0.01 | — | ||||||||||||||
| Net asset value, end of period | $ | 13.29 | $ | 12.38 | $ | 11.38 | $ | 10.99 | $ | 8.52 | $ | 11.75 | ||||||||||||
| TOTAL RETURN | 9.23 | % | 11.62 | % | 5.19 | %(4) | 33.10 | % | (24.13 | )% | 4.75 | % | ||||||||||||
| SUPPLEMENTAL DATA AND RATIOS: | ||||||||||||||||||||||||
| Net assets, end of period (millions) | $ | 108.49 | $ | 55.28 | $ | 42.17 | $ | 39.40 | $ | 31.13 | $ | 41.21 | ||||||||||||
| Ratio of expenses to average net assets: | ||||||||||||||||||||||||
| Before expense reimbursement | 1.06 | % | 1.12 | % | 1.20 | %(5) | 1.43 | % | 1.58 | % | 1.41 | % | ||||||||||||
| After expense reimbursement | 0.99 | % | 0.99 | % | 0.99 | %(5) | 0.99 | % | 1.07 | % | 1.08 | % | ||||||||||||
| Ratio of net investment income to average net assets: | ||||||||||||||||||||||||
| Before expense reimbursement | 1.68 | % | 2.56 | % | 2.60 | %(5) | 2.57 | % | 2.73 | % | 2.67 | % | ||||||||||||
| After expense reimbursement | 1.75 | % | 2.69 | % | 2.82 | %(5) | 3.01 | % | 3.24 | % | 3.00 | % | ||||||||||||
Portfolio turnover rate(6) | 34 | % | 35 | % | 27 | %(4) | 26 | % | 32 | % | 110 | % | ||||||||||||
(1) The Fund changed its fiscal year end from March 31 to October 31.
(2) Calculated based on average shares outstanding method.
(3) Amount is less than $0.01.
(4) Not Annualized.
(5) Annualized.
(6) Portfolio turnover is calculated on the basis of the Fund as a whole.
The accompanying notes are an integral part of these financial statements.
HENNESSY FUNDS 1-800-966-4354
67
Financial Highlights
| Hennessy Core Bond Fund (formerly FBR Core Bond Fund) |
For an Investor Class share outstanding throughout each period
| For the Period | ||||||||||||||||||||||||
| April 1, | ||||||||||||||||||||||||
| For the Year | 2010 to | |||||||||||||||||||||||
| Ended October 31, | October 31, | Year Ended March 31, | ||||||||||||||||||||||
| 2012 | 2011 | 2010(1) | 2010 | 2009 | 2008 | |||||||||||||||||||
| PER SHARE DATA: | ||||||||||||||||||||||||
| Net asset value, beginning of period | $ | 9.56 | $ | 9.82 | $ | 9.39 | $ | 8.75 | $ | 9.16 | $ | 9.71 | ||||||||||||
| Income from investment operations: | ||||||||||||||||||||||||
| Net investment income | 0.28 | 0.35 | (2) | 0.23 | (2) | 0.38 | (2) | 0.35 | (2) | 0.42 | (2) | |||||||||||||
| Net realized and unrealized gains (losses) on investments | 0.41 | (0.14 | ) | 0.42 | 0.69 | (0.44 | ) | — | ||||||||||||||||
| Total from investment operations | 0.69 | 0.21 | 0.65 | 1.07 | (0.09 | ) | 0.42 | |||||||||||||||||
| Less Distributions: | ||||||||||||||||||||||||
| Dividends from net investment income | (0.20 | ) | (0.32 | ) | (0.22 | ) | (0.38 | ) | (0.32 | ) | (0.39 | ) | ||||||||||||
| Dividends from net realized gains | (0.08 | ) | (0.15 | ) | — | (0.05 | ) | — | (0.58 | ) | ||||||||||||||
| Total distributions | (0.28 | ) | (0.47 | ) | (0.22 | ) | (0.43 | ) | (0.32 | ) | (0.97 | ) | ||||||||||||
| Paid-in capital from redemption fees | 0.00 | (3) | 0.00 | (3) | 0.00 | (3) | 0.00 | (3) | 0.00 | (3) | — | |||||||||||||
| Net asset value, end of period | $ | 9.97 | $ | 9.56 | $ | 9.82 | $ | 9.39 | $ | 8.75 | $ | 9.16 | ||||||||||||
| TOTAL RETURN | 7.38 | % | 2.35 | % | 6.98 | %(4) | 12.33 | % | (0.93 | )% | 4.48 | % | ||||||||||||
| SUPPLEMENTAL DATA AND RATIOS: | ||||||||||||||||||||||||
| Net assets, end of period (millions) | $ | 3.57 | $ | 4.05 | $ | 4.45 | $ | 4.62 | $ | 2.06 | $ | 2.03 | ||||||||||||
| Ratio of expenses to average net assets: | ||||||||||||||||||||||||
| Before expense reimbursement | 2.12 | % | 2.38 | % | 2.10 | %(5) | 1.93 | % | 2.14 | % | 2.19 | % | ||||||||||||
| After expense reimbursement | 1.30 | % | 1.30 | % | 1.30 | %(5) | 1.31 | % | 1.33 | % | 1.33 | % | ||||||||||||
| Ratio of net investment income to average net assets: | ||||||||||||||||||||||||
| Before expense reimbursement | 2.01 | % | 2.58 | % | 3.37 | %(5) | 3.49 | % | 3.21 | % | 3.53 | % | ||||||||||||
| After expense reimbursement | 2.83 | % | 3.66 | % | 4.17 | %(5) | 4.11 | % | 4.02 | % | 4.40 | % | ||||||||||||
Portfolio turnover rate(6) | 75 | % | 57 | % | 46 | %(4) | 28 | % | 39 | % | 102 | % | ||||||||||||
(1) The Fund changed its fiscal year end from March 31 to October 31.
(2) Calculated based on average shares outstanding method.
(3) Amount is less than $0.01.
(4) Not Annualized.
(5) Annualized.
(6) Portfolio turnover is calculated on the basis of the Fund as a whole.
The accompanying notes are an integral part of these financial statements.
WWW.HENNESSYFUNDS.COM
68
Financial Highlights
| Hennessy Core Bond Fund (formerly FBR Core Bond Fund) |
For an Institutional Class share outstanding throughout each period
| For the Period | ||||||||||||||||||||||||
| April 1, | ||||||||||||||||||||||||
| For the Year | 2010 to | |||||||||||||||||||||||
| Ended October 31, | October 31, | Year Ended March 31, | ||||||||||||||||||||||
| 2012 | 2011 | 2010(1) | 2010 | 2009 | 2008 | |||||||||||||||||||
| PER SHARE DATA: | ||||||||||||||||||||||||
| Net asset value, beginning of period | $ | 8.77 | $ | 9.05 | $ | 8.67 | $ | 8.11 | $ | 8.52 | $ | 9.10 | ||||||||||||
| Income from investment operations: | ||||||||||||||||||||||||
| Net investment income | 0.27 | 0.34 | (2) | 0.23 | (2) | 0.37 | (2) | 0.35 | (2) | 0.39 | (2) | |||||||||||||
| Net realized and unrealized gains (losses) on investments | 0.38 | (0.12 | ) | 0.38 | 0.64 | (0.42 | ) | 0.03 | ||||||||||||||||
| Total from investment operations | 0.65 | 0.22 | 0.61 | 1.01 | (0.07 | ) | 0.42 | |||||||||||||||||
| Less Distributions: | ||||||||||||||||||||||||
| Dividends from net investment income | (0.28 | ) | (0.35 | ) | (0.23 | ) | (0.40 | ) | (0.34 | ) | (0.42 | ) | ||||||||||||
| Dividends from net realized gains | (0.08 | ) | (0.15 | ) | — | (0.05 | ) | — | (0.58 | ) | ||||||||||||||
| Total distributions | (0.36 | ) | (0.50 | ) | (0.23 | ) | (0.45 | ) | (0.34 | ) | (1.00 | ) | ||||||||||||
| Paid-in capital from redemption fees | 0.00 | (3) | 0.00 | (3) | 0.00 | (3) | 0.00 | (3) | 0.00 | (3) | — | |||||||||||||
| Net asset value, end of period | $ | 9.06 | $ | 8.77 | $ | 9.05 | $ | 8.67 | $ | 8.11 | $ | 8.52 | ||||||||||||
| TOTAL RETURN | 7.63 | % | 2.62 | % | 7.15 | %(4) | 12.62 | % | (0.74 | )% | 4.78 | % | ||||||||||||
| SUPPLEMENTAL DATA AND RATIOS: | ||||||||||||||||||||||||
| Net assets, end of period (millions) | $ | 33.34 | $ | 23.25 | $ | 24.25 | $ | 23.89 | $ | 22.05 | $ | 21.95 | ||||||||||||
| Ratio of expenses to average net assets: | ||||||||||||||||||||||||
| Before expense reimbursement | 1.31 | % | 1.43 | % | 1.47 | %(5) | 1.69 | % | 1.89 | % | 1.94 | % | ||||||||||||
| After expense reimbursement | 1.05 | % | 1.05 | % | 1.05 | %(5) | 1.06 | % | 1.08 | % | 1.08 | % | ||||||||||||
| Ratio of net investment income to average net assets: | ||||||||||||||||||||||||
| Before expense reimbursement | 2.74 | % | 3.54 | % | 4.00 | %(5) | 3.74 | % | 3.46 | % | 3.60 | % | ||||||||||||
| After expense reimbursement | 3.00 | % | 3.92 | % | 4.41 | %(5) | 4.37 | % | 4.27 | % | 4.46 | % | ||||||||||||
Portfolio turnover rate(6) | 75 | % | 57 | % | 46 | %(4) | 28 | % | 39 | % | 102 | % | ||||||||||||
(1) The Fund changed its fiscal year end from March 31 to October 31.
(2) Calculated based on average shares outstanding method.
(3) Amount is less than $0.01.
(4) Not Annualized.
(5) Annualized.
(6) Portfolio turnover is calculated on the basis of the Fund as a whole.
The accompanying notes are an integral part of these financial statements.
HENNESSY FUNDS 1-800-966-4354
69
Notes to the Financial Statements
October 31, 2012
1). ORGANIZATION
The Hennessy Focus Fund (the “Focus Fund”), Hennessy Gas Utility Index Fund (the “Gas Fund”), Hennessy Small Cap Financial Fund (the “Small Cap Financial Fund”), Hennessy Large Cap Financial Fund (the “Large Cap Financial Fund”), Hennessy Technology Fund (the “Technology Fund”), Hennessy Equity and Income Fund (the “Equity and Income Fund”), and Hennessy Core Bond Fund (the “Core Bond Fund”) (each a “Fund” and collectively, the “Funds”), are each a series of the Hennessy Funds Trust (the “Trust”), which was organized as a Delaware Statutory Trust on September 17, 1992. Each Fund is a successor to a series of The FBR Funds, a Delaware Statutory Trust, pursuant to a reorganization that took place after the close of business on October 26, 2012. The Focus Fund, Gas Fund, Small Cap Financial Fund, Large Cap Financial Fund, Technology Fund, Equity and Income Fund and Core Bond Fund are the successors to the FBR Focus Fund, FBR Gas Utility Index Fund, FBR Small Cap Financial Fund, FBR Large Cap Financial Fund, FBR Technology Fund, FBR Balanced Fund and the FBR Core Bond Fund, respectively (each a “Predecessor Fund” and collectively, the “Predecessor Funds”).
Prior to October 26, 2012, each Fund had no investment operations. As a result of the reorganization, holders of the Investor Class shares of the Predecessor Funds received Investor Class shares of the Funds (the Investor Class shares of each Fund is the successor to the accounting and performance information of the corresponding Predecessor Fund), and holders of the Institutional Class shares of the Predecessor Funds received Institutional Class shares of the Funds (the Institutional Class shares of each Fund is the successor to the accounting and performance information of the corresponding Predecessor Fund). The Focus Fund, Gas Fund, Small Cap Financial Fund, Large Cap Financial Fund and Technology Fund are open-end, non-diversified management investment companies registered under the 1940 Act. The Equity and Income Fund and Core Bond Fund are open-end, diversified management investment companies registered under the 1940 Act. The investment objective of the Focus Fund, Small Cap Financial Fund, Large Cap Financial Fund, and Technology Fund is capital appreciation. The investment objective of the Gas Fund is income and capital appreciation. The investment objective of the Equity and Income Fund is long-term capital growth and current income. The investment objective of the Core Bond Fund is current income with capital growth as a secondary objective.
The Focus Fund, Small Cap Financial Fund, Technology Fund, Equity and Income Fund and Core Bond Fund offer Investor and Institutional Class shares. Each class of shares differs principally in its respective administration, 12b-1 distribution and service fees, and transfer agent expenses and sales charges, if any. Each class has identical rights to earnings, assets and voting privileges, except for class-specific expenses and exclusive rights to vote on matters affecting only individual classes. The Gas Fund and Large Cap Financial Fund offer only Investor Class shares.
2). SIGNIFICANT ACCOUNTING POLICIES
The following is a summary of significant accounting policies consistently followed by the Funds in the preparation of the financial statements. These policies are in conformity with U.S. generally accepted accounting principles (“GAAP”).
| a). | Investment Valuation – All investments in securities are recorded at their estimated fair value, as described in Note 4. |
| b). | Federal Income Taxes – Provision for Federal income taxes or excise taxes has not been made since the Funds have elected to be taxed as “regulated investment companies” and intend to distribute substantially all taxable income to shareholders and otherwise comply with the provisions of the Internal Revenue Code applicable to regulated investment companies. Net investment income or loss and realized gains and losses for federal income tax purposes may differ from that reported on the financial statements because of temporary book and tax basis differences. Temporary differences are primarily the result of the treatment of wash sales for tax reporting purposes. Distributions from net realized gains for book purposes may include short-term capital gains, which are included as ordinary income to shareholders for tax purposes. |
| Due to inherent differences in the recognition of income, expenses, and realized gains/losses under U.S. generally accepted accounting principles and federal income tax purposes, permanent differences between book and tax basis reporting for the 2012 fiscal year have been identified and appropriately reclassified on the Statement of Assets and Liabilities. |
| Accumulated Net | Accumulated Net | Paid In | ||||||||||||
| Investment Income/(Loss) | Realized Gain/(Loss) | Capital | ||||||||||||
| Focus Fund | $ | 42,697 | $ | (42,697 | ) | $ | — | |||||||
| Gas Fund | $ | 9,169 | $ | (9,169 | ) | $ | — | |||||||
| Small Cap Financial Fund | $ | 488,624 | $ | (488,624 | ) | $ | — | |||||||
| Large Cap Financial Fund | $ | (995 | ) | $ | (5 | ) | $ | 1,000 | ||||||
| Technology Fund | $ | 9,761 | $ | — | $ | (9,761 | ) | |||||||
| Equity and Income Fund | $ | 24,670 | $ | (24,670 | ) | $ | — | |||||||
| Core Bond Fund | $ | (6,682 | ) | $ | 6,681 | $ | 1 | |||||||
| The permanent differences primarily relate to net operating losses and capital loss carryovers lost due to expiration. |
| c). | Income and Expenses – Dividend income is recognized on the ex-dividend date or as soon as information is available to the Funds and interest income, which includes the amortization of premium and accretion of discount, is recognized on an accrual basis. Income, expenses (other than expenses attributable to a specific class), and realized and unrealized gains or losses on investments are allocated to each class of shares based on its respective net assets. |
| d). | Distributions to Shareholders – Dividends from net investment income for the Focus Fund, Small Cap Financial Fund, Large Cap Financial Fund and Technology Fund, if any, are declared and paid out annually, usually in November or December of each year. The Gas Fund and Equity and Income Fund declare and pay any such dividends quarterly. The Core Bond Fund declares and pays |
WWW.HENNESSYFUNDS.COM
70
| net investment income, if any, monthly. Distributions from net realized capital gains, if any, are declared and paid annually, usually in November or December of each year, for all of the Funds. Income and capital gain distributions are determined in accordance with U.S. federal income tax regulations. |
| e). | Security Transactions – Investment and shareholder transactions are recorded on the trade date. The Funds determine the gain or loss realized from the investment transactions by comparing the original cost of the security lot sold with the net sale proceeds. Discounts and premiums on securities purchased are accreted/amortized over the life of the respective security. |
| f). | Use of Estimates – The preparation of financial statements in accordance with U.S. generally accepted accounting principles requires management to make estimates and assumptions that may affect the reported amounts of assets and liabilities and disclosure of contingent assets and liabilities at the date of the financial statements and the reported amounts of income and expenses during the reporting period. Actual results could differ from those estimates. |
| g). | Share Valuation – The net asset value (“NAV”) per share of each Fund is calculated by dividing the sum of the value of the securities held by each Fund, plus cash or other assets, minus all liabilities (including estimated accrued expenses) by the total number of shares outstanding for each Fund, rounded to the nearest cent. The Funds’ shares will not be priced on the days on which the New York Stock Exchange is closed for trading. The offering and redemption price per share for each Fund is equal to each Fund’s net asset value per share. The Funds charged a 1% redemption fee on shares redeemed or exchanged within 90 days of purchase through October 26, 2012. These fees were deducted from the redemption proceeds otherwise payable to the shareholder. The redemption fees were retained by each Fund and treated as additional paid-in capital and allocated to each respective class of shares (if applicable). Such fees become part of that Fund’s daily NAV calculation. |
| h). | Foreign Currency – Values of investments denominated in foreign currencies are converted into U.S. dollars using the spot market rate of exchange at the time of valuation. Purchases and sales of investments and income are translated into U.S. dollars using the spot market rate of exchange prevailing on the respective dates of such transactions. The effect of changes in foreign exchange rates on realized and unrealized security gains and losses is reflected as a component of such gains or losses. Foreign investments present additional risks due to currency fluctuations, economic and political factors, lower liquidity, government regulations, differences in accounting standards and other factors. |
| i). | Repurchase Agreements – The Funds may enter into repurchase agreements with member banks or security dealers of the Federal Reserve whom the investment advisor deems creditworthy. The repurchase price generally equals the price paid by the Fund plus interest negotiated on the basis of current short-term rates. |
| Securities pledged as collateral for repurchase agreements are held by the custodian bank until the respective agreements mature. Provisions of the repurchase agreements ensure that the market value of the collateral, including accrued interest thereon, is sufficient, in the event of default of the counterparty. If the counterparty defaults and the value of the collateral declines or if the counterparty enters an insolvency proceeding, realization of the collateral by the Fund may be delayed or limited. |
| j). | Accounting for Uncertainty in Income Taxes – The Funds have adopted accounting policies regarding recognition and measurement of tax positions taken or expected to be taken on a tax return. The Funds have reviewed all open tax years and major jurisdictions and concluded that there is no impact on the Funds’ net assets and no tax liability resulting from unrecognized tax benefits relating to uncertain income tax positions taken or expected to be taken on a tax return. As of October 31, 2012, open Federal and state tax years for the Funds include the tax years ended October 31, 2009 through 2012. |
| k). | Derivatives – The Funds may invest in, or enter into, derivatives, such as options, futures contracts, options on futures contracts and swaps, for a variety of reasons, including to hedge certain risks, to provide a substitute for purchasing or selling particular securities or to increase potential income gain. Derivatives may provide a cheaper, quicker or more specifically focused way for a Fund to invest than “traditional” securities would. The main purpose of utilizing these derivative instruments is for hedging purposes. |
| The Funds have adopted the financial accounting reporting rules as required by the Derivatives and Hedging Topic of the FASB Accounting Standards Codification (“FASB ASC”). The Funds are required to include enhanced disclosure that enables investors to understand how and why an entity uses derivatives, how derivatives are accounted for, and how derivatives instruments affect an entity’s results of operations and financial position. During the year ended October 31, 2012, the Funds did not hold any derivative instruments. |
| l). | Events Subsequent to the Fiscal Period End – The Funds have adopted financial reporting rules regarding subsequent events which requires an entity to recognize in the financial statements the effects of all subsequent events that provide additional evidence about conditions that existed at the date of the balance sheet. Management has evaluated the Funds’ related events and transactions that occurred subsequent to October 31, 2012, through the date of issuance of the Funds’ financial statements. There were no events or transactions that occurred during this period that materially impacted the amounts or disclosures in the Fund’s financial statements. |
| m). | New Accounting Pronouncements – In April 2011, FASB issued ASU No. 2011-03 “Reconsideration of Effective Control for Repurchase Agreements”. ASU 2011-03 amends FASB ASC Topic 860, Transfers and Servicing, specifically the criteria required to determine whether a repurchase agreement (repo) and similar agreements should be accounted for as sales of financial assets or secured borrowings with commitments. ASU No. 2011-03 changes the assessment of effective control by focusing on the transferor’s contractual rights and obligations and removing the criterion to assess its ability to exercise those rights or honor those obligations. This could result in changes to the way entities account for certain transactions including repurchase agreements, mortgage dollar rolls and reverse repurchase agreements. The ASU will become effective on a prospective basis for new transfers and modifications to existing transactions as of the beginning of the first interim or annual period beginning on or after December 15, 2011. Management continues to evaluate the application of this pronouncement to the Funds, and is not in a position at this time to evaluate the significance of its impact, if any, on the Funds’ financial statements. |
HENNESSY FUNDS 1-800-966-4354
71
| In May 2011, the Financial Accounting Standards Board (“FASB”) issued ASU No. 2011-04 “Amendments to Achieve Common Fair Value Measurement and Disclosure Requirements” in GAAP and the International Financial Reporting Standards (“IFRSs”). ASU No. 2011-04 amends FASB ASC Topic 820, Fair Value Measurements and Disclosures, to establish common requirements for measuring fair value and for disclosing information about fair value measurements in accordance with GAAP and IFRSs. ASU No. 2011-04 is effective for fiscal years beginning after December 15, 2011 and for interim periods within those fiscal years. Management is currently evaluating the impact of these amendments and does not believe they will have a material impact on the Funds’ financial statements. |
| In December 2011, FASB issued ASU No. 2011-11 related to disclosures about offsetting assets and liabilities. The amendments in this ASU require an entity to disclose information about offsetting and related arrangements to enable users of its financial statements to understand the effect of those arrangements on its financial position. The ASU is effective for annual reporting periods beginning on or after January 1, 2013, and interim periods within those annual periods. The guidance requires retrospective applications for all comparative periods presented. Management is currently evaluating the impact ASU 2011-11 will have on the financial statements disclosures. |
3). RISK FACTORS
Market Risks – Loss of money is a risk of investing in the Funds. The net asset value of the Funds can be expected to change daily and you may lose money. As with any mutual fund, there is no guarantee that the Funds’ performance will be positive over any period of time, either short-term or long-term. A Fund’s success depends largely on the Adviser’s ability to select favorable investments. Also, different types of investments shift in and out of favor depending on market and economic conditions. For example, at various times stocks will be more or less favorable than bonds and small-cap or mid-cap stocks will be more or less favorable than large-cap company stocks. Because of this, the Funds may perform better or worse than other types of funds depending on what is in “favor.”
Equity Investments – Because each of the Funds, with the exception of the Core Bond Fund, invests in equity securities, fluctuations in the stock market in general, as well as in the value of particular equity securities held by a Fund, can affect the Fund’s performance. The value of equity securities will fluctuate due to many factors, including the past and predicted earnings of the issuer, the quality of the issuer’s management, general market conditions, and forecasts for the issuer’s industry and the value of the issuer’s assets.
IPO Investments – The Technology, Equity and Income and Core Bond Funds invest in IPO shares which are subject to market risk and liquidity risk. The market value of IPO shares will fluctuate considerably due to facts such as the absence of a prior public market, unseasoned trading, the small number of shares available for trading and limited public information about the issuer. The purchase of IPO shares may involve high transaction costs. When a fund’s asset base is small, a significant portion of the fund’s performance could be attributable to investments in IPOs, because such investments would have a magnified impact on the fund.
Temporary Defensive Position – Each of the Funds may, from time to time, take temporary defensive positions in response to adverse market, economic, political or other conditions. To the extent the assets of a Fund are invested in temporary defensive positions, the Fund may not achieve its investment objective. For temporary defensive purposes, the Fund may invest in cash and/or short-term obligations.
Industry Concentration – Because of their narrow focus, the Large Cap Financial and the Small Cap Financial, the Technology and the Gas Funds are tied closely to and affected by the financial services, technology, and natural gas distribution and transmission industries, respectively. The value of the Funds may be subject to greater volatility than funds with portfolios that are less concentrated.
Investments in Derivatives – The Focus, Small Cap Financial, Large Cap Financial and Technology Funds may engage in derivative instruments such as options, futures and forward foreign currency exchange contracts. Derivative instruments are instruments that derive their value from a different underlying security, index or financial indicator. A Fund may use derivatives for either hedging or non-hedging purposes, or for both purposes, including for purposes of enhancing return. Investing for non-hedging purposes may be considered speculative and involve additional risks.
Foreign Investments – The Technology, Gas, Equity and Income and Core Bond Funds invest in foreign securities which presents unique investment risks. The value of securities denominated in or indexed to foreign currencies, and of dividends and interest from such securities, can change significantly when foreign currencies strengthen or weaken relative to the U.S. dollar. Many foreign countries lack uniform accounting and disclosure standards comparable to those applicable to U.S. companies, and it may be more difficult to obtain reliable information regarding an issuer’s financial condition and operations. The Fund may invest in both sponsored and unsponsored ADRs which are receipts issued by a U.S. bank or trust company evidencing ownership of an indirect interest in underlying securities issued by a foreign issuer. In a sponsored ADR arrangement, the non-U.S. issuer assumes the obligation to pay some or all of the depositary’s transaction fees. Under an unsponsored ADR arrangement, the non-U.S. issuer assumes no obligations and the depositary’s transaction fees are paid directly by the ADR holders. Because unsponsored ADR arrangements are organized independently and without the cooperation of the issuer of the underlying securities, available information concerning the non-U.S. issuer may not be as current as for sponsored ADRs and voting rights with respect to the deposited securities are not passed through.
Debt Investments – The Equity and Income and Core Bond Funds invest in debt securities. The yields and principal values of debt securities will also fluctuate. Generally, values of debt securities change inversely with interest rates. That is, as interest rates go up, the values of debt securities tend to go down and vice versa. Furthermore, these fluctuations tend to increase as a bond’s maturity increases such that a longer term bond will increase or decrease more for a given change in interest rates than a shorter term bond.
High Yield Investments – The Equity and Income and Core Bond Funds may invest a small portion of their assets in lower-rated, high-yielding bonds (commonly known as “junk bonds”). These bonds have a greater degree of default risk than higher-rated bonds. Default risk is the possibility that the issuer of a debt security will fail to make timely payments of principal or interest to the Funds.
Mortgage-Backed and Asset-Backed Securities Investments – The Equity and Income and Core Bond Funds may invest in mortgage and asset-backed securities that are subject to prepayment risk, which is the risk that the borrower will prepay some or all of the principal
WWW.HENNESSYFUNDS.COM
72
owed to the issuer. If prepayment occurs, the Funds may have to replace the security by investing the proceeds in a less attractive security. This may reduce a Fund’s share price and income distribution.
Mid-Cap and Small-Cap Investments – The Focus, Large Cap Financial, Small Cap Financial and Technology Funds invest in the securities of mid-cap and small-cap companies generally involves greater risk than investing in larger, more established companies. This greater risk is, in part, attributable to the fact that the securities of mid-cap and small-cap companies usually have more limited marketability. Because mid-cap and small-cap companies have fewer shares outstanding than larger companies, it also may be more difficult to buy or sell significant amounts of such shares without unfavorable impact on prevailing prices. Additionally, securities of mid-cap and small-cap companies are typically subject to greater changes in earnings and business prospects than are larger, more established companies and typically there is less publicly available information concerning mid-cap and small-cap companies than for larger, more established companies. Although investing in securities of mid-cap and small-cap companies offers potential above-average returns if the companies are successful, there is a risk that companies will not succeed and the prices of the companies’ shares could significantly decline in value.
Securities of mid-cap and small-cap companies, especially those whose business involves emerging products or concepts, may be more volatile due to their limited product lines, markets or financial resources and may lack management depth. Securities of mid-cap and small-cap companies also may be more volatile than larger companies or the market averages in general because of their general susceptibility to economic downturns, especially in the financial services group of industries where changes in interest rates and demand for financial services are so closely tied to the economy.
Non-Diversification – The Focus, Large Cap Financial, Small Cap Financial, Technology and Gas Funds are classified as “non-diversified��� investment companies under the 1940 Act, which means each Fund may own larger positions in a smaller number of securities. A fund that is less diversified may be more susceptible to adverse economic, political, or regulatory developments affecting a single issuer than a fund that is more broadly diversified. However, each Fund intends to qualify for treatment as a regulated investment company under the Internal Revenue Code of 1986, as amended, which requires that, among other things, at the close of each quarter of each Fund’s taxable year, a Fund may not (1) with respect to 50% of its total assets, invest more than 5% of its total assets in the securities of any one issuer or own more than 10% of outstanding voting securities of any one issuer, or (2) invest more than 25% of the value of its total assets in securities of any one issuer. These limits do not apply to U.S. Government securities or securities of other registered investment companies.
Real Estate-Related Risk – Because the Small Cap Financial Fund focuses on financial services companies that may invest in real estate, the Fund is subject to the risks associated with ownership of real estate and with the real estate industry in general. Real estate values (and the values of real estate-related securities) fluctuate with changes in general and local economic conditions and are particularly sensitive to economic downturns. Real estate values are also affected by changes in interest rates and governmental actions such as tax and zoning changes.
Index Tracking – While the Gas Fund seeks to track the performance of the American Gas Association Index (“Index”) as closely as possible, the Fund’s return may not always be able to match or achieve a high correlation with the return of the Index due to such factors as the various expenses incurred by the Fund, such as management fees, transaction costs and other operating expenses which are not incurred by the Index. In addition, the Fund may not be fully invested at all times in the Index as a result of cash flows into the Fund or reserves of cash that are maintained in order to meet redemption requests and cover operating expenses.
4). SECURITIES VALUATION
The Funds have adopted authoritative fair valuation accounting standards which establish an authoritative definition of fair value and set out a hierarchy for measuring fair value. These standards require additional disclosures about the various inputs and valuation techniques used to develop the measurements of fair value and a discussion in changes in valuation techniques and related inputs during the period. These inputs are summarized in the three broad levels listed below:
| Level 1 – | Quoted unadjusted prices for identical instruments in active markets to which the Fund has access at the date of measurement. |
| Level 2 – | Quoted prices for similar instruments in active markets; quoted prices for identical or similar instruments in markets that are not active; and model-derived valuations in which all significant inputs and significant value drivers are observable in active markets. Level 2 inputs are those in markets for which there are few transactions, the prices are not current, the prices are fair value adjusted due to post market close subsequent events (foreign markets), little public information exists or instances where prices vary substantially over time or among brokered market makers. These inputs may also include interest rates, prepayment speeds, credit risk curves, default rates and similar data. |
| Level 3 – | Model-derived valuations in which one or more significant inputs or significant value drivers are unobservable. Unobservable inputs are those inputs that reflect the Funds’ own assumptions that market participant’s would use to price the asset or liability based on the best available information. |
Following is a description of the valuation techniques applied to the Funds’ major categories of assets and liabilities measured at fair value on a recurring basis.
Equity Securities – Equity securities, including common stocks, preferred stocks, foreign issued common stocks, exchange traded funds, closed-end mutual funds and real estate investment trust, which are traded on a securities exchange for which a last-quoted sales price is readily available will be valued at the last sales price as reported by the primary exchange on which the securities are listed. Securities listed on the NASDAQ National Market System (“NASDAQ”) will be valued at the NASDAQ Official Closing Price, which may differ from the last sales price reported. Securities traded on a securities exchange for which a last-quoted sales price is not readily available will be valued at the mean between the bid and ask prices. To the extent these securities are actively traded and valuation adjustments are not applied, they are categorized in Level 1 of the fair value hierarchy.
HENNESSY FUNDS 1-800-966-4354
73
Investment Companies – Investments in investment companies (e.g., mutual funds and exchange traded funds) are generally priced at the ending net asset value (NAV) provided by the service agent of the Funds and will be classified as Level 1 securities.
Debt Securities – Debt securities, such as corporate bonds, asset backed securities, mortgage backed securities, municipal bonds, U.S. Treasuries and U.S. government agency issues are valued at market on the basis of valuations furnished by an independent pricing service which utilizes both dealer-supplied valuations and formula-based techniques. The pricing service may consider recently executed transactions in securities of the issuer or comparable issuers, market price quotations (where observable), bond spreads, and fundamental data relating to the issuer. In addition, the model may incorporate market observable data such as reported sales of similar securities, broker quotes, yields, bids, offers, and reference data. Certain securities are valued principally using dealer quotations. These securities will generally be classified in level 2 of the fair value hierarchy.
Short-Term Securities – Short-term equity investments, including money market funds, are valued in the manner specified above. Short-term debt investments are valued at amortized cost, if their original maturity was 60 days or less, or by amortizing the values as of the 61st day prior to maturity, if their original term to maturity exceeded 60 days. Short-term securities are generally in Level 1 or Level 2 of the fair market hierarchy depending on the inputs used and market activity levels for specific securities.
The Board of Trustees of the Funds (the “Board”) has adopted fair value pricing procedures that are followed when a price for a security is not readily available or if a significant event has occurred that indicates the closing price of a security no longer represents the true value of that security. Fair value pricing determinations are made in good faith in accordance with these procedures. There are numerous criteria that will be given consideration in determining a fair value of a security. Some of these criteria are: trading volume of security and markets, value of other like securities and news events with direct bearing to security or market. Fair value pricing results in an estimated price that reasonably reflects the current market conditions in order to rate the portfolio holdings such that shareholder transactions receive a fair net asset value. Depending on the relative significance of the valuation inputs, these securities may be classified in either Level 2 or Level 3 of the fair value hierarchy.
Fair valuing of foreign securities may be determined with the assistance of a pricing service using correlations between the movement of prices of such securities and indices of domestic securities and other appropriate indicators, such as closing market prices of relevant American Depositary Receipts or futures contracts. The effect of using fair value pricing is that the Funds’ NAV will reflect the affected portfolio securities’ value as determined in the judgment of the Board or its designee instead of being determined by the market. Using a fair value pricing methodology to price securities may result in a value that is different from a security’s most recent closing price and from the prices used by other investment companies to calculate their net asset values and are considered level 2 prices in the fair valuation hierarchy. Because the Funds invest in foreign securities, the value of the Funds’ portfolio securities may change on days when you will not be able to purchase or redeem your shares. Depending on the relative significance of the valuation inputs, these securities may be classified in either level 2 or level 3 of the fair value hierarchy.
The Board has delegated day-to-day valuation issues to a Valuation Committee which is comprised of one or more representatives from Hennessy Advisors, Inc., the Fund’s advisor. The function of the Valuation Committee is to value securities where current and reliable market quotations are not readily available. All actions taken by the Valuation Committee are reviewed and ratified by the Board.
The Funds have performed an analysis of all existing investments to determine the significance and character of all inputs to their fair value determination. Various inputs are used in determining the value of each Fund’s investments. The inputs or methodology used for valuing securities are not necessarily an indication of the risk associated with investing in those securities. Details related to the fair valuation hierarchy of the Funds’ securities as of October 31, 2012, are included with each Fund’s Schedule of Investments.
5). INVESTMENT TRANSACTIONS
Purchases and sales of investment securities (excluding government and short-term investments) during the year ended October 31, 2012, were as follows:
| Small Cap | Large Cap | |||||||||||||||
| Focus | Gas | Financial | Financial | |||||||||||||
| Fund | Fund | Fund | Fund | |||||||||||||
| Purchases | $ | 83,926,873 | $ | 383,778,993 | $ | 76,057,181 | $ | 54,261,498 | ||||||||
| Sales | $ | 105,401,370 | $ | 94,134,968 | $ | 74,303,904 | $ | 54,263,790 | ||||||||
| Equity and | ||||||||||||||||
| Technology | Income | Core Bond | ||||||||||||||
| Fund | Fund | Fund | ||||||||||||||
| Purchases | $ | 8,666,862 | $ | 144,916,403 | $ | 7,353,476 | ||||||||||
| Sales | $ | 10,158,171 | $ | 18,061,058 | $ | 6,338,771 | ||||||||||
Purchases and sales/maturities of long-term U.S. Government Securities for the Equity and Income Fund were $106,893,406 and $52,906,358, respectively, for the year ended October 31, 2012. Purchases and sales/maturities of long-term U.S. Government Securities for the Core Bond Fund were $23,891,718 and $16,804,925, respectively, for the year ended October 31, 2012. There were no purchases or sales/maturities of long-term U.S. Government Securities for the Focus Fund, Gas Fund, Small Cap Financial Fund, Large Cap Financial Fund, and Technology Fund for the year ended October 31, 2012.
6). INVESTMENT MANAGEMENT FEE AND OTHER TRANSACTIONS WITH AFFILIATES
Hennessy Advisors, Inc. (the “Advisor”) is the Advisor of the Funds. The Advisor provides the Funds with investment management services under a Management Agreement. The Advisor furnishes all investment advice, office space, facilities, and provides most of the
WWW.HENNESSYFUNDS.COM
74
personnel needed by the Funds. As compensation for its services, the Advisor is entitled to a monthly fee from each Fund. The fee is based upon the average daily net assets of the Funds at the annual rate of:
| Focus Fund | 0.90% | ||
| Gas Fund | 0.40% | ||
| Small Cap Financial Fund | 0.90% | ||
| Large Cap Financial Fund | 0.90% | ||
| Technology Fund | 0.90% | ||
| Equity and Income Fund | 0.80% | ||
| Core Bond Fund | 0.80% |
Advisor fees payable for the Funds as of October 31, 2012, were:
| Focus Fund | $594,508 | ||
| Gas Fund | $248,508 | ||
| Small Cap Financial Fund | $153,494 | ||
| Large Cap Financial Fund | $ 50,217 | ||
| Technology Fund | $ — | ||
| Equity and Income Fund | $139,264 | ||
| Core Bond Fund | $ 13,075 |
Prior to the close of business on October 26, 2012, FBR Fund Advisers, Inc. (“FBR”), acted as investment advisor to the Predecessor Funds. FBR furnished all investment advice, office space, facilities, and provided most of the personnel needed by the Funds. As compensation for its services, the Advisor was entitled to a monthly fee from each Fund. The fee was based upon the average daily net assets of the Funds at the annual rate of:
| Focus Fund | 0.90% | ||
| Gas Fund | 0.40% | ||
| Small Cap Financial Fund | 0.90% | ||
| Large Cap Financial Fund | 0.90% | ||
| Technology Fund | 0.90% | ||
| Equity and Income Fund | 0.80% | ||
| Core Bond Fund | 0.80% |
The Advisor has delegated the day to day management of the Focus Fund to a sub-advisor, Broad Run Investment Management, LLC (“Broad Run”). The Advisor has delegated the day to day management of the Equity and Income Fund to Financial Counselors, Inc. (“FCI”) and The London Company (“London Co.”, “Broad Run”, and “FCI”, each a “Sub-Advisor”). The Advisor has delegated the day to day management of the Core Bond Fund to FCI. Broad Run became the Sub-Advisor effective at the close of business on October 26, 2012. Both FCI and London Co. were Sub-Advisors during the entire year ended October 31, 2012. The Advisor pays the Sub-Advisor fees for each of the Funds from its own assets and these fees are not an additional expense of the Funds.
The Advisor has contractually agreed to limit each class of shares of each Fund’s total operating expenses and to maintain these limitations with regard to each class of shares of each Fund through February 28, 2015. The following are the limits for the Funds, based on average daily net assets (excluding interest, taxes, brokerage commissions, dividend expenses, acquired fund fees and expenses, extraordinary legal expenses, or any other extraordinary expenses, and for the Equity and Income Fund and Core Bond Fund, also excluding 12b-1 fees):
| Investor Class | Institutional Class | ||
| Focus Fund | 1.95% | 1.70% | |
| Gas Fund | 0.85% | N/A | |
| Small Cap Financial Fund | 1.95% | 1.70% | |
| Large Cap Financial Fund | 1.95% | N/A | |
| Technology Fund | 1.95% | 1.70% | |
| Equity and Income Fund | 1.08%* | 1.08% | |
| Core Bond Fund | 1.05%* | 1.05% |
| * | Amount shown excludes the 12b-1 fee. Including the 12b-1 fee, the amounts are 1.33% and 1.30% for the Equity and Income Fund and Core Bond Fund, respectively. |
For a period of three years after the year in which the Advisor waives or reimburses expenses, the Advisor may seek reimbursement from the Funds to the extent that total annual Fund operating expenses are less than the expense limitation in effect at the time of the reimbursement. The Advisor waived or reimbursed expenses of $770 and $759 for the Technology and Core Bond Funds, respectively, during the period October 27, 2012 through October 31, 2012. As of October 31, 2012, cumulative expenses subject to potential recovery to the aforementioned conditions and year of expiration are as follows:
| Amount | Year of Expiration | ||
| Technology Fund | $770 | 2015 | |
| Core Bond Fund | $759 | 2015 |
During the period November 1, 2011 through the close of business on October 26, 2012, FBR had contractually agreed to limit each class of shares of each Fund’s total operating expenses and to maintain the expense limitations listed above with regard to each class of shares of each Fund through February 28, 2015.
Prior to the close of business on October 26, 2012, with respect to the Equity and Income Fund, FBR had agreed to voluntarily limit fees and/or pay expenses in amounts necessary in order to limit the total annual operating expenses of the Equity and Income Fund, after
HENNESSY FUNDS 1-800-966-4354
75
any such fee waivers and/or expense reimbursements, to 0.99% (excluding 12b-1 fees, brokerage costs, interest, taxes, acquired fund fees and expenses, dividend expenses, and extraordinary expenses such as litigation and merger or reorganization costs and other expenses not incurred in the ordinary course of such Fund’s business). The fee reductions and expenses reimbursed are reflected as a reduction of total expenses in the Statement of Operations.
During the period November 1, 2011, through October 26, 2012, in connection with certain expense limitation arrangements between the Equity and Income Fund, Core Bond Fund and FBR, these Funds had agreed to pay FBR for certain amounts waived and/or reimbursed by the Armed Forces Benefit Association (“AFBA”) pursuant to an expense limitation agreement, as assigned, provided that such repayment does not cause the total fund operating expenses for a Fund to exceed certain specified limits and the repayment is made within three years after the year in which AFBA incurred the expense.
The Trust, on behalf of the Investor Class shares of each Fund, has adopted a Distribution Plan (the “Plan”) pursuant to Rule 12b-1 under the 1940 Act. Under the Plan, each Fund, except the Gas Fund, pays Quasar Distributors, LLC (the “Distributor”) a fee at an annual rate of up to 0.25% of each Fund’s average daily net assets attributable to Investor Class shares. Amounts paid under the Plan may be spent on any activities or expenses primarily intended to result in the sale of shares, including but not limited to, advertising, compensation for sales and marketing activities or financial institutions and others such as dealers and distributors, shareholder account servicing, the printing and mailing of prospectuses to other than current shareowners and the printing and mailing of sales literature. Quasar acts as the Funds’ principal underwriter in a continuous public offering of the Funds’ shares. The Distributor is an affiliated company of U.S. Bank, N.A.
During the period November 1, 2011, through October 26, 2012, each Fund, except the Gas Fund, paid FBR Investment Services, Inc., (the “Former Distributor”) a fee at an annual rate of up to 0.25% of each Fund’s average daily net assets attributable to Investor Class shares. Fees paid to the Former Distributor under the Plan were payable without regard to actual expenses incurred.
U.S. Bancorp Fund Services, LLC (“USBFS” or the “Administrator”) acts as the Funds’ Administrator under an Administration Agreement. Administrative services under this agreement include custody, distribution, fund accounting, fund administration and transfer agent services. In addition, the Administrator prepares various federal and state regulatory filings, reports and returns for the Funds; prepares reports and materials to be supplied to the directors; monitors the activities of the Funds’ custodian, transfer agent and accountants; coordinates the preparation and payment of the Funds’ expenses and reviews the Funds’ expense accruals.
Pursuant to the Administrative Services Agreement, during the period November 1, 2011, through October 26, 2012, FBR also provided administrative services to the Funds including oversight of service providers. FBR received 0.04% of average daily net assets of the Trust. FBR also provided the Funds with office space, facilities and business equipment and generally administered the Funds’ business affairs and provided the services of executive and clerical personnel for administering the affairs of the Funds. FBR compensated all personnel, Officers and Trustees of the Funds if such persons were employees of FBR. For the year ended October 31, 2012, USBFS earned $629,224 and FBR earned $732,653 in administration fees.
The Funds have entered into agreements with various brokers, dealers and financial intermediaries in connection with the sale of shares of the Funds. The agreements provide for periodic payments by the Funds to the brokers, dealers and financial intermediaries for providing certain shareholder maintenance services (sub-transfer agent expenses). These shareholder services include: the pre-processing and quality control of new accounts, shareholder correspondence, answering customer inquiries regarding account status and facilitating shareholder telephone transactions. Fees paid by the Funds to various brokers, dealers and financial intermediaries for the year ended October 31, 2012, were:
| Focus Fund | $780,119 | ||
| Gas Fund | $545,625 | ||
| Small Cap Financial Fund | $171,819 | ||
| Large Cap Financial Fund | $ 73,853 | ||
| Technology Fund | $ 12,792 | ||
| Equity and Income Fund | $143,828 | ||
| Core Bond Fund | $ 18,706 |
During the period November 1, 2011 through October 26, 2012, the Small Cap Financial Fund and the Large Cap Financial Fund paid $13,440 and $1,450, respectively, in brokerage commissions from portfolio transactions to FBR Capital Markets & Co. (“FBR & Co.”), an affiliate of FBR and the former distributor. No other Fund paid commissions to FBR & Co. during the year.
7). LINE OF CREDIT
The Funds have a $70,000,000 line of credit, whereas each Fund may draw an amount up to 30% of its net assets, intended to provide short-term financing, if necessary, subject to certain restrictions, in connection with shareholder redemptions. The credit facility is with its custodian bank, U.S. Bank, N.A. Borrowings under this arrangement bear interest at the bank’s prime rate. During the year ended October 31, 2012, the Gas Fund had an outstanding average daily balance and a weighted average interest rate of $3,992 and 3.25%, respectively. The maximum amount outstanding for the Gas Fund during the period was $1,461,000. During the year ended October 31, 2012, the Large Cap Financial Fund had an outstanding average daily balance and a weighted average interest rate of $1,617 and 3.25%, respectively. The maximum amount outstanding for the Large Cap Financial Fund during the period was $242,000. During the year ended October 31, 2012, the Technology Fund had an outstanding average daily balance and a weighted average interest rate of $571 and 3.25%, respectively. The maximum amount outstanding for the Technology Fund during the period was $209,000. During the year ended October 31, 2012, the Focus Fund, Small Cap Financial Fund, Equity and Income Fund and Core Bond Fund had no line of credit activity.
WWW.HENNESSYFUNDS.COM
76
8). FEDERAL TAX INFORMATION
As of October 31, 2012, the components of accumulated earnings (losses) for income tax purposes were as follows:
| Small Cap | Large Cap | |||||||||||||||
| Focus | Gas | Financial | Financial | |||||||||||||
| Fund | Fund | Fund | Fund | |||||||||||||
| Cost of investments for tax purposes | $ | 442,578,126 | $ | 564,677,823 | $ | 191,400,745 | $ | 61,160,366 | ||||||||
| Gross tax unrealized appreciation | 357,306,224 | 201,268,754 | 33,959,132 | 9,016,974 | ||||||||||||
| Gross tax unrealized depreciation | (14,160,506 | ) | (20,757,180 | ) | (14,179,104 | ) | (5,456,894 | ) | ||||||||
| Net tax unrealized appreciation (depreciation) | $ | 343,145,718 | $ | 180,511,574 | $ | 19,780,028 | $ | 3,560,080 | ||||||||
| Net unrealized gain/loss - foreign currency | — | (5,245 | ) | — | — | |||||||||||
| Undistributed ordinary income | $ | — | $ | 3,186,762 | $ | 715,079 | $ | 50,837 | ||||||||
| Undistributed long-term capital gains | 63,358,200 | 14,828,033 | — | — | ||||||||||||
| Total distributable earnings | $ | 63,358,200 | $ | 18,014,795 | $ | 715,079 | $ | 50,837 | ||||||||
| Other accumulated gains/(losses) | $ | (5,555,872 | ) | $ | — | $ | (3,658,128 | ) | $ | (3,635,103 | ) | |||||
| Total accumulated earnings/(losses) | $ | 400,948,046 | $ | 198,521,124 | $ | 16,836,979 | $ | (24,186 | ) | |||||||
| Equity and | ||||||||||||||||
| Technology | Income | Core Bond | ||||||||||||||
| Fund | Fund | Fund | ||||||||||||||
| Cost of investments for tax purposes | $ | 5,457,305 | $ | 279,885,717 | $ | 34,804,033 | ||||||||||
| Gross tax unrealized appreciation | 326,484 | 28,255,283 | 2,158,247 | |||||||||||||
| Gross tax unrealized depreciation | (373,173 | ) | (4,545,755 | ) | (342,459 | ) | ||||||||||
| Net tax unrealized appreciation (depreciation) | $ | (46,689 | ) | $ | 23,709,528 | $ | 1,815,788 | |||||||||
| Undistributed ordinary income | $ | — | $ | 312,645 | $ | 379,230 | ||||||||||
| Undistributed long-term capital gains | — | — | 368,448 | |||||||||||||
| Total distributable earnings | $ | — | $ | 312,645 | $ | 747,678 | ||||||||||
| Other accumulated gains/(losses) | $ | (2,273,175 | ) | $ | (2,913,369 | ) | $ | — | ||||||||
| Total accumulated earnings/(losses) | $ | (2,319,864 | ) | $ | 21,108,804 | $ | 2,563,466 | |||||||||
The difference between book-basis and tax-basis unrealized appreciation is attributable primarily to capital loss carry overs, wash sales, and partnership adjustments.
At October 31, 2012, the Funds had capital loss carryforwards which expire as follows:
| Small Cap Financial Fund | 3,568,128 | 10/31/19 | |
| Large Cap Financial Fund | 10,229 | 10/31/16 | |
| 1,162,148 | 10/31/17 | ||
| 874,811 | 10/31/19 | ||
| 398,257 | indefinite (ST) | ||
| 1,189,658 | indefinite (LT) | ||
| Technology Fund | 237,174 | 10/31/16 | |
| 1,908,045 | 10/31/17 | ||
| 60,544 | indefinite (LT) | ||
| Equity and Income Fund | 2,913,369 | 10/31/17 |
During the year ended October 31, 2012, the Small Cap Financial Fund and the Equity and Income Fund utilized $2,807,880 and $1,432,437 of capital loss carryforwards, respectively.
At October 31, 2012, the Focus Fund, Gas Fund, and Core Bond Fund had no tax basis capital losses to offset future capital gains.
Under recently enacted legislation, capital losses sustained in the year ended December 31, 2011 and in future taxable years will not expire and may be carried over by the Fund without limitation; however, they will retain the character of the original loss. Furthermore, any losses incurred during those taxable years will be required to be utilized prior to the losses incurred in the pre-enactment taxable years. As a result of this ordering rule, pre-enactment capital loss carryforwards may be more likely to expire unused. Under pre-enactment law, capital losses could be carried forward for eight years, and carried forward as short-term capital losses, irrespective of the character of the original loss.
The tax character of distributions paid during 2012 and 2011 for the Funds were as follows:
| Year Ended | Year Ended | |||||||||
| Focus Fund | October 31, 2012 | October 31, 2011 | ||||||||
| Ordinary Income | $ | — | $ | — | ||||||
| Long-term capital gain | 68,842,192 | 25,642,828 | ||||||||
| $ | 68,842,192 | $ | 25,642,828 | |||||||
HENNESSY FUNDS 1-800-966-4354
77
| Year Ended | Year Ended | |||||||||
| Gas Fund | October 31, 2012 | October 31, 2011 | ||||||||
| Ordinary Income | $ | 18,087,340 | $ | 8,228,128 | ||||||
| Long-term capital gain | 1,903,385 | 2,612,243 | ||||||||
| $ | 19,990,725 | $ | 10,840,371 | |||||||
| Year Ended | Year Ended | |||||||||
| Small Cap Financial Fund | October 31, 2012 | October 31, 2011 | ||||||||
| Ordinary Income | $ | 3,181,624 | $ | 2,863,168 | ||||||
| Long-term capital gain | — | — | ||||||||
| $ | 3,181,624 | $ | 2,863,168 | |||||||
| Year Ended | Year Ended | |||||||||
| Large Cap Financial Fund | October 31, 2012 | October 31, 2011 | ||||||||
| Ordinary Income | $ | — | $ | — | ||||||
| Long-term capital gain | — | — | ||||||||
| $ | — | $ | — | |||||||
| Year Ended | Year Ended | |||||||||
| Technology Fund | October 31, 2012 | October 31, 2011 | ||||||||
| Ordinary Income | $ | — | $ | — | ||||||
| Long-term capital gain | — | — | ||||||||
| $ | — | $ | — | |||||||
| Year Ended | Year Ended | |||||||||
| Equity and Income Fund | October 31, 2012 | October 31, 2011 | ||||||||
| Ordinary Income | $ | 3,322,362 | $ | 2,140,167 | ||||||
| Long-term capital gain | — | — | ||||||||
| $ | 3,322,362 | $ | 2,140,167 | |||||||
| Year Ended | Year Ended | |||||||||
| Core Bond Fund | October 31, 2012 | October 31, 2011 | ||||||||
| Ordinary Income | $ | 1,054,980 | $ | 1,086,378 | ||||||
| Long-term capital gain | 141,198 | 447,915 | ||||||||
| $ | 1,196,178 | $ | 1,534,293 | |||||||
At October 31, 2012 the following funds deferred, on a tax basis, post-October losses of:
| Post | |||||||||
| Late Year | October | ||||||||
| Ordinary Loss Deferral | Loss Deferral | ||||||||
| Focus Fund | (5,555,872 | ) | — | ||||||
| Gas Fund | — | — | |||||||
| Small Cap Financial Fund | — | — | |||||||
| Large Cap Financial Fund | — | — | |||||||
| Technology Fund | (64,030 | ) | — | ||||||
| Equity and Income Fund | — | — | |||||||
| Core Bond Fund | — | — | |||||||
9). FUND REORGANIZATION
On October 25, 2012, the shareholders of the FBR Focus Fund, FBR Gas Utility Index Fund, FBR Small Cap Financial Fund, FBR Large Cap Financial Fund, FBR Technology Fund, FBR Balanced Fund and FBR Core Bond Fund approved the agreement and plan of reorganization providing for the transfer of assets and the assumption of liabilities of the FBR Focus Fund, FBR Gas Utility Index Fund, FBR Small Cap Financial Fund, FBR Large Cap Financial Fund, FBR Technology Fund, FBR Balanced Fund and FBR Core Bond Fund by each of the Hennessy Focus Fund, Hennessy Gas Utility Index Fund, Hennessy Small Cap Financial Fund, Hennessy Large Cap Financial Fund, Hennessy Technology Fund, Hennessy Equity and Income Fund and Hennessy Core Bond Fund, respectively. Each of the FBR Funds was reorganized into a Hennessy Fund created to carry out the reorganizations, with each Hennessy Fund having the same investment objective and substantially similar principal investment strategies as its corresponding FBR Fund. The reorganization was effective as of the close of business on October 26, 2012. The following tables illustrate the specifics of each Fund’s reorganization:
WWW.HENNESSYFUNDS.COM
78
| FBR Focus Fund | Shares issued to Shareholders | Hennessy Focus Fund | |||
| Net Assets | of FBR Focus Fund | Net Assets | Combined Net Assets | Tax Status of Transfer | |
$778,311,000(1) | 15,154,076 | $0 | $778,311,000 | Non-taxable |
(1) Includes accumulated realized gains and unrealized appreciation in the amounts of $132,243,088 and $336,125,053 respectively.
| FBR Gas Utility Index | Shares issued to Shareholders | Hennessy Gas Utility Index | |||
| Fund Net Assets | of FBR Gas Utility Index Fund | Fund Net Assets | Combined Net Assets | Tax Status of Transfer | |
$741,949,009(2) | 32,378,877 | $0 | $741,949,009 | Non-taxable |
(2) Includes accumulated realized gains and unrealized appreciation in the amounts of $3,950,643 and $194,357,194 respectively.
| FBR Small Cap Financial | Shares issued to Shareholders | Hennessy Small Cap | |||
| Fund Net Assets | of FBR Small Cap Financial Fund | Financial Fund Net Assets | Combined Net Assets | Tax Status of Transfer | |
$210,320,731(3) | 12,112,883 | $0 | $210,320,883 | Non-taxable |
(3) Includes accumulated realized losses and unrealized appreciation in the amounts of ($7,187,955) and $22,624,133 respectively.
| FBR Large Cap Financial | Shares issued to Shareholders | Hennessy Large Cap | |||
| Fund Net Assets | of FBR Large Cap Financial Fund | Financial Fund Net Assets | Combined Net Assets | Tax Status of Transfer | |
$64,199,213(4) | 4,567,064 | $0 | $64,199,213 | Non-taxable |
(4) Includes accumulated realized losses and unrealized appreciation in the amounts of ($7,700,523) and $7,128,156 respectively.
| FBR Technology | Shares issued to Shareholders | Hennessy Technology | |||
| Fund Net Assets | of FBR Technology Fund | Fund Net Assets | Combined Net Assets | Tax Status of Transfer | |
$5,413,138(5) | 504,081 | $0 | $5,413,138 | Non-taxable |
(5) Includes accumulated realized losses and unrealized appreciation in the amounts of ($2,345,527) and $119,831 respectively.
| FBR Balanced Fund | Shares issued to Shareholders | Hennessy Equity and | |||
| Net Assets | of FBR Balanced Fund | Income Fund Net Assets | Combined Net Assets | Tax Status of Transfer | |
$304,557,978(6) | 22,268,632 | $0 | $304,557,978 | Non-taxable |
(6) Includes accumulated realized losses and unrealized appreciation in the amounts of ($2,836,830) and $22,782,279 respectively.
| FBR Core Bond | Shares issued to Shareholders | Hennessy Core Bond | |||
| Fund Net Assets | of FBR Core Bond Fund | Fund Net Assets | Combined Net Assets | Tax Status of Transfer | |
$36,814,419(7) | 4,033,537 | $0 | $36,814,419 | Non-taxable |
(7) Includes accumulated realized gains and unrealized appreciation in the amounts of $1,455,845 and $1,687,723 respectively.
HENNESSY FUNDS 1-800-966-4354
79
Report of Independent Registered Public Accounting Firm
To the Board of Trustees and Shareholders
Hennessy Funds Trust
Novato, CA
We have audited the accompanying statements of assets and liabilities, including the schedules of investments, of the Hennessy Focus Fund (formerly FBR Focus Fund), Hennessy Gas Utility Index Fund (formerly FBR Gas Utility Index Fund), Hennessy Small Cap Financial Fund (formerly FBR Small Cap Financial Fund), Hennessy Large Cap Financial Fund (formerly FBR Large Cap Financial Fund), Hennessy Technology Fund (formerly FBR Technology Fund), Hennessy Equity and Income Fund (formerly FBR Balanced Fund), and Hennessy Core Bond Fund (formerly FBR Core Bond Fund) (the “Funds”), each a series of Hennessy Funds Trust (successor to a series of The FBR Funds) as of October 31, 2012, and the related statements of operations for the year then ended, the statements of changes in net assets for each of the two years in the period then ended and the financial highlights for each of the five years in the period then ended, except for the Hennessy Equity and Income Fund and the Hennessy Core Bond Fund which includes the statements of operations for the year then ended and statements of changes in net assets and financial highlights for each of the two years in the period then ended, and the financial highlights for the seven month period ended October 31, 2010 and the year ended March 31, 2010. With respect to the Hennessy Equity and Income Fund and Hennessy Core Bond Fund, the financial highlights for each of the two years in the period ended March 31, 2009 have been audited by other auditors, whose reports dated May 27, 2009 expressed unqualified opinions on such financial highlights. These financial statements and financial highlights are the responsibility of the Funds’ management. Our responsibility is to express an opinion on these financial statements and financial highlights based on our audits.
We conducted our audits in accordance with standards of the Public Company Accounting Oversight Board (United States). Those standards require that we plan and perform the audits to obtain reasonable assurance about whether the financial statements and financial highlights are free of material misstatement. The Funds are not required to have, nor were we engaged to perform, an audit of the Funds’ internal control over financial reporting. Our audits included consideration of internal control over financial reporting as a basis for designing audit procedures that are appropriate in the circumstances, but not for the purposes of expressing an opinion on the effectiveness of the Funds’ internal control over financial reporting. Accordingly, we express no such opinion. An audit includes examining, on a test basis, evidence supporting the amounts and disclosures in the financial statements. Our procedures included confirmation of securities owned as of October 31, 2012, by correspondence with the custodian and brokers. An audit also includes assessing the accounting principles used and significant estimates made by management, as well as evaluating the overall financial statement presentation. We believe that our audits provide a reasonable basis for our opinion.
In our opinion, the financial statements and financial highlights referred to above present fairly, in all material respects, the financial position of the Hennessy Focus Fund, Hennessy Gas Utility Index Fund, Hennessy Small Cap Financial Fund, Hennessy Large Cap Financial Fund, Hennessy Technology Fund, Hennessy Equity and Income Fund, and Hennessy Core Bond Fund, as of October 31, 2012, the results of their operations, the changes in their net assets, and the financial highlights for the periods referred to above in conformity with accounting principles generally accepted in the United States of America.
| TAIT, WELLER & BAKER LLP |
Philadelphia, Pennsylvania
December 27, 2012
WWW.HENNESSYFUNDS.COM
80
Directors/Trustees and Officers of the Funds (Unaudited)
The business and affairs of the Funds are managed under the direction of the Funds’ Board of Directors/Trustees. Information pertaining to the Directors and Officers of the Funds is set forth below. The Funds’ Statement of Additional Information includes additional information about the Funds’ Directors/Trustees and Officers and is available, without charge, upon request by calling 1-800-966-4354.
| Number of | |||||
| Portfolios | Other | ||||
| in the Fund | Directorships | ||||
| Position(s) | Term of Office | Complex | (During Past | ||
| Held with | and Length of | Principal Occupation(s) | Overseen | 5 Years) Held | |
| Name, Address, and Age | the Fund | Time Served | During Past 5 Years | by Trustee | by Trustee |
| Disinterested Trustees (as defined below) | |||||
| J. Dennis DeSousa | Trustee | Indefinite, until | Mr. DeSousa is a real estate investor. | 16 | None. |
| Age: 76 | successor elected | ||||
| Address: | |||||
| c/o Hennessy Advisors, Inc. | Served since January | ||||
| 7250 Redwood Blvd. | 1996 HMFI and HFI; | ||||
| Suite 200 | since July 2005 HFT; | ||||
| Novato, CA 94945 | and since September | ||||
| 2009 HSFT | |||||
| Robert T. Doyle | Trustee | Indefinite, until | Mr. Doyle has been the Sheriff of | 16 | None. |
| Age: 65 | successor elected | Marin County, California since 1996. | |||
| Address: | |||||
| c/o Hennessy Advisors, Inc. | Served since January | ||||
| 7250 Redwood Blvd. | 1996 HMFI and HFI; | ||||
| Suite 200 | since July 2005 HFT; | ||||
| Novato, CA 94945 | and since September | ||||
| 2009 HSFT | |||||
| Gerald P. Richardson | Trustee | Indefinite, until | Mr. Richardson is an independent | 16 | None. |
| Age: 67 | successor elected | consultant in the securities industry. | |||
| Address: | |||||
| c/o Hennessy Advisors, Inc. | Served since May 2004 | ||||
| 7250 Redwood Blvd. | HMFI and HFI; since | ||||
| Suite 200 | July 2005 HFT; and | ||||
| Novato, CA 94945 | since September | ||||
| 2009 HSFT | |||||
| “Interested Persons” (as defined in the 1940 Act) | |||||
Neil J. Hennessy(1) | Trustee, | Trustee: | Mr. Hennessy has been employed by | 16 | Director of Hennessy |
| Age: 56 | President and | Indefinite, until | Hennessy Advisors, Inc., the Funds’ | Advisors, Inc. | |
| Address: | Chairman of | successor elected | investment advisor, since 1989. He | ||
| c/o Hennessy Advisors, Inc. | the Board | currently serves as President, Chairman, | |||
| 7250 Redwood Blvd. | Served since January | CEO, Portfolio Manager and CIO of | |||
| Suite 200 | 1996 HMFI and HFI; | Hennessy Advisors, Inc. | |||
| Novato, CA 94945 | since July 2005 HFT; | ||||
| and since September | |||||
| 2009 HSFT | |||||
| Officer: | |||||
| 1 year term | |||||
| Served since June 2008 | |||||
| HMFI, HFI and HFT; and | |||||
| since September 2009 HSFT | |||||
Joe Fahy(1) | Vice President | 1 year term | Mr. Fahy has been employed by | N/A | N/A |
| Age: 34 | and Chief | Hennessy Advisors, Inc., the Funds’ | |||
| Address: | Compliance | Since June 2010 HMFI, | investment advisor, since 2005. | ||
| c/o Hennessy Advisors, Inc. | Officer | HFI, HFT and HSFT | |||
| 7250 Redwood Blvd. | |||||
| Suite 200 | |||||
| Novato, CA 94945 | |||||
(1) All Officers of the Hennessy Funds and employees of the Manager are Interested Persons of the Fund.
HENNESSY FUNDS 1-800-966-4354
81
| Number of | |||||
| Portfolios | Other | ||||
| in the Fund | Directorships | ||||
| Position(s) | Term of Office | Complex | (During Past | ||
| Held with | and Length of | Principal Occupation(s) | Overseen | 5 Years) Held | |
| Name, Address, and Age | the Fund | Time Served | During Past 5 Years | by Trustee | by Trustee |
| Interested Persons | |||||
Teresa M. Nilsen(1) | Executive | 1 year term | Ms. Nilsen has been employed by | N/A | N/A |
| Age: 46 | Vice President | Hennessy Advisors, Inc., the Funds’ | |||
| Address: | and Treasurer | Since January 1996 | investment advisor, since 1989. She | ||
| c/o Hennessy Advisors, Inc. | HMFI and HFI; since | currently serves as Executive Vice | |||
| 7250 Redwood Blvd. | July 2005 HFT; and | President, Chief Operations Officer, | |||
| Suite 200 | since September | Chief Financial Officer and Secretary | |||
| Novato, CA 94945 | 2009 HSFT | of Hennessy Advisors, Inc. | |||
Daniel B. Steadman(1) | Executive | 1 year term | Mr. Steadman has been employed by | N/A | N/A |
| Age: 56 | Vice President | Hennessy Advisors, Inc., the Funds’ | |||
| Address: | and Secretary | Since March 2000 | investment advisor, since 2000. He | ||
| c/o Hennessy Advisors, Inc. | HMFI and HFI; since | currently serves as Executive Vice | |||
| 7250 Redwood Blvd. | July 2005 HFT; and | President and Chief Compliance Officer | |||
| Suite 200 | since September | of Hennessy Advisors, Inc. | |||
| Novato, CA 94945 | 2009 HSFT | ||||
David Ellison(1) | Senior | 1 year term | Mr. Ellison has served as Portfolio | N/A | N/A |
| Age: 54 | Vice President | Manager of the Hennessy Large Cap | |||
| Address: | & Chief | Since October 2012 | Financial Fund (formerly the FBR Large | ||
| 100 Federal Street | Investment | Cap Financial Fund), the Hennessy | |||
| 29th Floor | Officer | Small Cap Financial Fund (formerly the | |||
| Boston, MA 02110 | FBR Small Cap Financial Fund), and the | ||||
| Hennessy Technology Fund (formerly | |||||
| the FBR Technology Fund) since inception. | |||||
| Mr. Ellison previously served as Director, | |||||
| CIO & President of FBR Advisers, Inc. from | |||||
| December 1999 to October 2012. | |||||
Brian Peery(1) | Vice President | 1 year term | Mr. Peery has been employed by | N/A | N/A |
| Age: 43 | and | Hennessy Advisors, Inc., the Funds’ | |||
| Address: | Co-Portfolio | As Vice President, since | investment advisor, since 2002. | ||
| c/o Hennessy Advisors, Inc. | Manager | March 2003 HMFI and | |||
| 7250 Redwood Blvd. | HFI; since July 2005 | ||||
| Suite 200 | HFT; and since | ||||
| Novato, CA 94945 | September 2009 HSFT | ||||
| As Co-Portfolio Manager, | |||||
| since February 2011 | |||||
| HMFI, HFI, HFT and HSFT | |||||
Winsor (Skip) Aylesworth(1) | Vice President & | 1 year term | Mr. Aylesworth has been Portfolio | N/A | N/A |
| Age: 65 | Portfolio Manager | Manager of the Hennessy Gas Utility | |||
| Address: | Since October 2012 | Index Fund (formerly the FBR Gas Utility | |||
| 100 Federal Street | Index Fund) since 1998 and Portfolio | ||||
| 29th Floor | Manager of the Hennessy Technology | ||||
| Boston, MA 02110 | Fund (formerly the FBR Technology | ||||
| Fund) since inception. | |||||
| Mr. Aylesworth previously served as | |||||
| Executive Vice President of the FBR | |||||
| Funds from 1999 to October 2012. |
(1) All Officers of the Hennessy Funds and employees of the Manager are Interested Persons of the Fund.
Key:
HMFI = Hennessy Mutual Funds, Inc.
HFI = Hennessy Funds, Inc.
HFT = Hennessy Funds Trust
HSFT = Hennessy SPARX Funds Trust
WWW.HENNESSYFUNDS.COM
82
Expense Example (Unaudited)
October 31, 2012
As a shareholder of the Funds, you incur two types of costs: (1) transaction costs, including sales charges (loads) on purchase payments, reinvested dividends, or other distributions; redemption fees; and exchange fees; and (2) ongoing costs, including management fees; service fees; and other Fund expenses. This Example is intended to help you understand your ongoing costs (in dollars) of investing in each of the Funds and to compare these costs with the ongoing costs of investing in other mutual funds. The Example is based on an investment of $1,000 invested at the beginning of the period and held for the entire period from May 1, 2012 through October 31, 2012.
Actual Expenses
The first set of lines of the table below provide information about actual account values and actual expenses. Although the Funds charge no sales loads or transaction fees, you will be assessed fees for outgoing wire transfers, returned checks and stop payment orders at prevailing rates charged by U.S. Bancorp Fund Services, LLC, the Funds’ transfer agent. If you request that a redemption be made by wire transfer, currently a $15.00 fee is charged by the Funds’ transfer agent. IRA accounts will be charged a $15.00 annual maintenance fee. The example below includes, but is not limited to, management fees, shareholder servicing fees, fund accounting, custody and transfer agent fees. However, the example below does not include portfolio trading commissions and related expenses, and other extraordinary expenses as determined under generally accepted accounting principles. You may use the information within these lines, together with the amount you invested, to estimate the expenses that you paid over the six-month period. Simply divide your account value by $1,000 (for example, an $8,600 account value divided by $1,000 = 8.6), then multiply the result by the number in the first line under the heading entitled “Expenses Paid During Period” to estimate the expenses you paid on your account during this period.
Hypothetical Example for Comparison Purposes
The second set of lines within the table below provide information about hypothetical account values and hypothetical expenses based on the Funds’ actual expense ratios and an assumed rate of return of 5% per year before expenses, which is not the Funds’ actual return. The hypothetical account values and expenses may not be used to estimate the actual ending account balance or expenses you paid for the period. You may use this information to compare the ongoing costs of investing in the Funds and other funds. To do so, compare this 5% hypothetical example with the 5% hypothetical examples that appear in the shareholder reports of the other funds. Please note that the expenses shown in the table are meant to highlight your ongoing costs only and do not reflect any transactional costs, such as sales charges (loads), or exchange fees. Therefore, the second line of the table is useful in comparing ongoing costs only, and will not help you determine the relative total costs of owning different funds. In addition, if these transactional costs were included, your costs would have been higher.
HENNESSY FUNDS 1-800-966-4354
83
| Beginning | Ending | Expenses Paid | |
| Account Value | Account Value | During Period(1) | |
| Investor Class | 5/1/12 | 10/31/12 | 5/1/12 – 10/31/12 |
| Actual | |||
| Focus Fund – Investor Class | $1,000.00 | $1,016.70 | $7.20 |
| Gas Fund – Investor Class | $1,000.00 | $1,046.80 | $3.65 |
| Small Cap Financial Fund – Investor Class | $1,000.00 | $1,072.40 | $7.61 |
| Large Cap Financial Fund – Investor Class | $1,000.00 | $1,017.20 | $8.01 |
| Technology Fund – Investor Class | $1,000.00 | $ 897.40 | $9.30 |
| Equity and Income Fund – Investor Class | $1,000.00 | $1,008.30 | $6.26 |
| Core Bond Fund – Investor Class | $1,000.00 | $1,038.50 | $6.66 |
| Hypothetical (5% return before expenses) | |||
| Focus Fund – Investor Class | $1,000.00 | $1,018.00 | $7.20 |
| Gas Fund – Investor Class | $1,000.00 | $1,021.57 | $3.61 |
| Small Cap Financial Fund – Investor Class | $1,000.00 | $1,017.80 | $7.41 |
| Large Cap Financial Fund – Investor Class | $1,000.00 | $1,017.19 | $8.01 |
| Technology Fund – Investor Class | $1,000.00 | $1,015.33 | $9.88 |
| Equity and Income Fund – Investor Class | $1,000.00 | $1,018.90 | $6.29 |
| Core Bond Fund – Investor Class | $1,000.00 | $1,018.60 | $6.60 |
| (1) | Expenses are equal to the Focus Fund’s expense ratio of 1.42%, the Gas Utility Index Fund’s expense ratio of 0.71%, the Small Cap Financial Fund’s expense ratio of 1.46%, the Large Cap Financial Fund’s expense ratio of 1.58%, the Technology Fund’s expense ratio of 1.95%, the Equity and Income Fund’s expense ratio of 1.24%, and the Core Bond Fund’s expense ratio of 1.30% multiplied by the average account value over the period, multiplied by 184/366 days (to reflect one-half year period). |
| Beginning | Ending | Expenses Paid | |
| Account Value | Account Value | During Period(2) | |
| Institutional Class | 5/1/12 | 10/31/12 | 5/1/12 – 10/31/12 |
| Actual | |||
| Focus Fund – Institutional Class | $1,000.00 | $1,018.30 | $5.73 |
| Small Cap Financial Fund – Institutional Class | $1,000.00 | $1,074.00 | $6.73 |
| Technology Fund – Institutional Class | $1,000.00 | $ 897.20 | $8.11 |
| Equity and Income Fund – Institutional Class | $1,000.00 | $1,009.80 | $5.00 |
| Core Bond Fund – Institutional Class | $1,000.00 | $1,039.70 | $5.38 |
| Hypothetical (5% return before expenses) | |||
| Focus Fund – Institutional Class | $1,000.00 | $1,019.46 | $5.74 |
| Small Cap Financial Fund – Institutional Class | $1,000.00 | $1,018.65 | $6.55 |
| Technology Fund – Institutional Class | $1,000.00 | $1,016.59 | $8.62 |
| Equity and Income Fund – Institutional Class | $1,000.00 | $1,020.16 | $5.03 |
| Core Bond Fund – Institutional Class | $1,000.00 | $1,019.86 | $5.33 |
| (2) | Expenses are equal to the Focus Fund’s expense ratio of 1.13%, the Small Cap Financial Fund’s expense ratio of 1.29%, the Technology Fund’s expense ratio of 1.70%, the Equity and Income Fund’s expense ratio of 0.99%, and the Core Bond Fund’s expense ratio of 1.05% multiplied by the average account value over the period, multiplied by 184/366 days (to reflect one-half year period). |
WWW.HENNESSYFUNDS.COM
84
How to Obtain a Copy of the Funds’ Proxy Voting Policy and Proxy Voting Records
A description of the policies and procedures that the Funds use to determine how to vote proxies relating to portfolio securities is available without charge: (1) by calling 1-800-966-4354; (2) on the Hennessy Funds website at www.hennessyfunds.com; or (3) on the U.S. Securities and Exchange Commission’s website at www.sec.gov. Hennessy Funds’ proxy voting record is available on the SEC’s website at www.sec.gov no later than August 31 for the prior 12 months ending June 30.
Quarterly Filings on Form N-Q
The Funds file their complete schedule of portfolio holdings with the SEC for the first and third quarters of each fiscal year on Form N-Q. The Funds’ Form N-Q will be available on the SEC’s website at www.sec.gov. The Funds’ Form N-Q may be reviewed and copied at the SEC’s Public Reference Room in Washington, DC and information on the operation of the Public Reference Room may be obtained by calling 1-800-SEC-0330. Information included in the Funds’ N-Q will also be available upon request by calling 1-800-966-4354.
Federal Tax Distribution Information (Unaudited)
For the fiscal year ended October 31, 2012, certain dividends paid by the Funds may be subject to a maximum tax rate of 15%, as provided for by the Jobs and Growth Tax Relief Reconciliation Act of 2003.
The percentage of dividends declared from ordinary income designated as qualified dividend income was as follows:
| Focus Fund | 0.00% | ||
| Gas Fund | 98.42% | ||
| Small Cap Financial Fund | 100.00% | ||
| Large Cap Financial Fund | 0.00% | ||
| Technology Fund | 0.00% | ||
| Equity and Income Fund | 80.59% | ||
| Core Bond Fund | 16.15% |
For corporate shareholders, the percent of ordinary income distributions qualifying for the corporate dividends received deduction for the fiscal year ended October 31, 2012, was as follows:
| Focus Fund | 0.00% | ||
| Gas Fund | 94.00% | ||
| Small Cap Financial Fund | 100.00% | ||
| Large Cap Financial Fund | 0.00% | ||
| Technology Fund | 0.00% | ||
| Equity and Income Fund | 80.80% | ||
| Core Bond Fund | 15.75% |
The percentage of taxable ordinary income distributions that are designated as short-term capital gain distributions under Internal Revenue Section 871(k)(2)(C) for each Fund were as follows:
| Focus Fund | 0.00% | ||
| Gas Fund | 11.00% | ||
| Small Cap Financial Fund | 0.00% | ||
| Large Cap Financial Fund | 0.00% | ||
| Technology Fund | 0.00% | ||
| Equity and Income Fund | 0.00% | ||
| Core Bond Fund | 13.00% |
Householding
To help keep the Funds’ costs as low as possible, we generally deliver a single copy of most financial reports and prospectuses to shareholders who share an address, even if the accounts are registered under different names. This process, known as “householding,” does not apply to account statements. You may, of course, request an individual copy of a prospectus or financial report at any time. If you would like to receive separate mailings, please call the Transfer Agent at 1-800-261-6950 or 1-414-765-4124 and we will begin individual delivery within 30 days of your request. If your account is held through a financial institution or other intermediary, please contact them directly to request individual delivery.
HENNESSY FUNDS 1-800-966-4354
85
Board Approval of Investment Advisory Agreements (Unaudited)
On October 7, 2012, the Board of Directors/Trustees of Hennessy Funds Trust approved the new investment advisory agreement for the Hennessy Focus Fund, the Hennessy Large Cap Financial Fund, the Hennessy Small Cap Financial Fund, the Hennessy Technology Fund, the Hennessy Gas Utility Index Fund, the Hennessy Equity and Income Fund and the Hennessy Core Bond Fund, and the new sub-advisory agreements for the Hennessy Focus Fund, the Hennessy Equity and Income Fund and the Hennessy Core Bond Fund (each a “Fund” and collectively, “Hennessy Funds”). Each of these Funds was established to affect an agreement and plan of reorganization with, respectively, the FBR Focus Fund, the FBR Large Cap Financial Fund, the FBR Small Cap Financial Fund, the FBR Technology Fund, the FBR Gas Utility Index Fund, the FBR Balanced Fund, and the FBR Core Bond Fund. Each Fund has the same investment objective and substantially identical principal investment strategies as its corresponding FBR Fund.
In reaching a decision to engage Hennessy Advisors, Inc. as the Funds’ investment adviser, the Board, including all of the Trustees who are not “interested persons” of the Funds, considered (1) the nature, extent and quality of the services to be provided by Hennessy Advisors; (2) the compensation to be paid under the new investment advisory agreement, which is the same as the compensation under the investment advisory agreements for the FBR Funds, and the fairness of such compensation in light of the services to be provided; (3) the expense ratio of the Funds under the new investment advisory agreements, which is expected to be the same as under the investment advisory agreements for the FBR Funds, or slightly lower, and the willingness of Hennessy Advisors to maintain current expense caps in place for at least the two-year period following the closing of the reorganizations; (4) the qualifications of Hennessy Advisors’ personnel, portfolio management capabilities and investment methodologies; (5) Hennessy Advisors’ Code of Ethics and its operations, compliance program and policies with respect to trade allocation and brokerage practices; (6) the financial condition of Hennessy Advisors; (7) the appropriateness of the selection of Hennessy Advisors; (8) the extent to which economies of scale are relevant given the Funds’ current asset size and current asset growth potential; (9) the benefits that Fund shareholders will realize by being part of the Hennessy Funds family; (10) the terms of the proposed reorganizations, including the anticipated tax-free nature of the transactions for the FBR Funds and their shareholders; (11) financial arrangements relating to Hennessy Advisors’ acquisition of FBR Fund Advisers, Inc.; (12) Hennessy Advisors’ prior experience with mutual fund acquisitions and its experience with the use and oversight of sub-advisers in connection with the mutual funds that they manage; (13) the plans of Hennessy Advisors to maintain the current portfolio managers for the FBR Funds as portfolio managers of the corresponding Funds for at least the one-year period following the closing of the reorganizations; (14) the plans of Hennessy Advisors to maintain certain employees of FBR Fund Advisers as employees of Hennessy Advisors for at least the one-year period following the closing of the reorganizations; (15) the plans of Hennessy Advisors to continue to retain the compliance services firm that provides compliance services to the FBR Funds as a compliance consultant for at least the one-year period following the closing of the reorganizations; (16) the plans of the Hennessy Funds to retain each of the Trustees who are not interested persons of the FBR Funds to serve on an advisory board of the Hennessy Funds for a two-year period following the closing of the reorganizations; (17) that FBR Fund Advisers and Hennessy Advisors are bearing all of the costs of the reorganizations (other than fees and expenses related to any portfolio realignment), including proxy solicitation costs, and that the Funds will not incur any of the costs of carrying out and completing the reorganizations; (18) that the interests of shareholders of the FBR Funds will not be diluted as a result of the reorganizations; and (19) the nature, extent and quality of the non-advisory services to be provided by various service providers to the Hennessy Funds following the closing of the reorganizations, including the fund administration, fund accounting, shareholder servicing, distribution, transfer agency and custody services, which will not change as a result of the reorganizations as the FBR Funds and the Hennessy Funds use the same service providers for these services.
In reaching a decision to engage The London Company as sub-advisor for the Hennessy Equity and Income Fund, Financial Counselors, Inc. as sub-advisor to the Hennessy Equity and Income Fund and the Hennessy Core Bond Fund, and Broad Run Investment Management, LLC as sub-advisor for the Hennessy Focus Fund, the Board, including all of the Trustees who are not “interested persons” of the Funds, considered (1) the nature, extent and quality of the services to be provided by The London Company, Financial Counselors, Inc. and Broad Run Investment Management, LLC; (2) the compensation to be paid under the new sub-advisory agreements, which will be borne by Hennessy Advisors, and the fairness of such compensation in light of the services to be provided; (3) the expense ratio of the Funds under the new investment advisory agreements and sub-advisory agreements, which is expected to be the same as under the investment advisory agreements for the FBR Funds (and sub-advisory agreements), or slightly lower, and the willingness of Hennessy Advisors to maintain current expense caps in place for at least the two-year period following the closing of the reorganizations; (4) the qualifications of the personnel, portfolio management capabilities and investment methodologies of The London Company, Financial Counselors, Inc. and Broad Run Investment Management, LLC; (5) the operations, compliance program and policies with respect to trade allocation and brokerage practices of The London Company, Financial Counselors, Inc. and Broad Run Investment Management, LLC; (6) the financial condition of The London Company, Financial Counselors, Inc. and Broad Run Investment Management, LLC; (7) the appropriateness of the selection of The London Company, Financial Counselors, Inc. and Broad Run Investment Management, LLC; and (8) the extent to which economies of scale are relevant given the Funds’ current asset size and current asset growth potential.
Thus, based upon its review, the Board concluded that the new investment advisory agreement, with respect to each Fund, and each of the new sub-advisory agreements, with respect to the Hennessy Equity and Income Fund, the Hennessy Core Bond Fund and the Hennessy Focus Fund, is reasonable, fair and in the best interests of that Fund and the Fund’s shareholders, and the fees provided under these agreements are fair and reasonable.
WWW.HENNESSYFUNDS.COM
86
Privacy Policy
We collect the following non-public personal information about you:
| • | information we receive from you on or in applications or other forms, correspondence, or conversations, including, but not limited to, your name, address, phone number, social security number, assets, income and date of birth; |
| and |
| • | information about your transactions with us, our affiliates, or others, including, but not limited to, your account number and balance, payment history, parties to transactions, cost basis information and other financial information. |
We do not disclose any non-public personal information about our current or former shareholders to nonaffiliated third parties, except as permitted by law. For example, we are permitted by law to disclose all of the information we collect, as described above, to our Transfer Agent to process your transactions. Furthermore, we restrict access to your non-public personal information to those persons who require such information to provide products or services to you. We maintain physical, electronic and procedural safeguards that comply with federal standards to guard your non-public personal information.
In the event that you hold shares of the Fund through a financial intermediary, including, but not limited to, a broker-dealer, bank or trust company, the privacy policy of your financial intermediary would govern how your non-public personal information would be shared with nonaffiliated third parties.
HENNESSY FUNDS 1-800-966-4354
87
(This Page Intentionally Left Blank.)
WWW.HENNESSYFUNDS.COM
88
For information, questions
or assistance, please call
The Hennessy Funds
1-800-966-4354 or 1-415-899-1555
INVESTMENT ADVISOR
Hennessy Advisors, Inc.
7250 Redwood Blvd., Suite 200
Novato, California 94945
ADMINISTRATOR, TRANSFER
AGENT, DIVIDEND PAYING
AGENT & SHAREHOLDER
SERVICING AGENT
U.S. Bancorp Fund Services, LLC
P.O. Box 701
Milwaukee, Wisconsin 53201-0701
CUSTODIAN
U.S. Bank N.A.
Custody Operations
1555 North River Center Dr., Suite 302
Milwaukee, Wisconsin 53212
DIRECTORS/TRUSTEES
Neil J. Hennessy
Robert T. Doyle
J. Dennis DeSousa
Gerald P. Richardson
COUNSEL
Foley & Lardner LLP
777 East Wisconsin Avenue
Milwaukee, Wisconsin 53202-5306
INDEPENDENT REGISTERED
PUBLIC ACCOUNTING FIRM
Tait, Weller & Baker LLP
1818 Market Street, Suite 2400
Philadelphia, Pennsylvania 19103
DISTRIBUTOR
Quasar Distributors, LLC
615 East Michigan Street
Milwaukee, Wisconsin 53202
WWW.HENNESSYFUNDS.COM
This report has been prepared for shareholders and may be distributed to
others only if preceded or accompanied by a current prospectus.
HENNESSY FUNDS
ANNUAL REPORT
OCTOBER 31, 2012

Hennessy Cornerstone Growth Fund
Hennessy Cornerstone Mid Cap 30 Fund
Hennessy Cornerstone Large Growth Fund
Hennessy Cornerstone Value Fund
Hennessy Large Value Fund
Hennessy Total Return Fund
Hennessy Balanced Fund
Hennessy Japan Fund
Hennessy Japan Small Cap Fund
(This Page Intentionally Left Blank.)
Contents
| Letter to shareholders | 2 |
| Performance overview (unaudited) | |
| Hennessy Cornerstone Growth Fund | 4 |
| Hennessy Cornerstone Mid Cap 30 Fund | 6 |
| Hennessy Cornerstone Large Growth Fund | 8 |
| Hennessy Cornerstone Value Fund | 10 |
| Hennessy Large Value Fund | 12 |
| Hennessy Total Return Fund | 14 |
| Hennessy Balanced Fund | 15 |
| Hennessy Japan Fund | 16 |
| Hennessy Japan Small Cap Fund | 18 |
| Financial statements | |
| Schedules of investments | |
| Hennessy Cornerstone Growth Fund | 21 |
| Hennessy Cornerstone Mid Cap 30 Fund | 26 |
| Hennessy Cornerstone Large Growth Fund | 29 |
| Hennessy Cornerstone Value Fund | 33 |
| Hennessy Large Value Fund | 36 |
| Hennessy Total Return Fund | 39 |
| Hennessy Balanced Fund | 43 |
| Hennessy Japan Fund | 46 |
| Hennessy Japan Small Cap Fund | 49 |
| Statements of assets and liabilities | 52 |
| Statements of operations | 54 |
| Statements of changes in net assets | 56 |
| Statement of cash flows – Hennessy Total Return Fund | 61 |
| Financial highlights | |
| Hennessy Cornerstone Growth Fund | 62 |
| Hennessy Cornerstone Mid Cap 30 Fund | 64 |
| Hennessy Cornerstone Large Growth Fund | 66 |
| Hennessy Cornerstone Value Fund | 68 |
| Hennessy Large Value Fund | 70 |
| Hennessy Total Return Fund | 72 |
| Hennessy Balanced Fund | 73 |
| Hennessy Japan Fund | 74 |
| Hennessy Japan Small Cap Fund | 76 |
| Notes to the financial statements | 77 |
| Report of Independent Registered Public Accounting Firm | 86 |
| Directors/Trustees and Officers of the Funds | 87 |
| Expense example | 89 |
| Proxy voting policy | 91 |
| Quarterly Filings on Form N-Q | 91 |
| Federal Tax Distribution Information | 91 |
| Privacy Policy | 92 |
HENNESSY FUNDS 1-800-966-4354
December, 2012
Dear Hennessy Funds Shareholder:
The past year has been jam-packed with politics, continued economic uncertainty in the United States and around the world, and most recently, non-stop talk of the possible effects of the looming “Fiscal Cliff.”
Since the economic crisis of 2008, most Americans seem to have taken a “glass half empty” view and now seem to expect doom and gloom. Talking about the decline of America has become a popular pastime around the world, and even Americans are jumping into the discussion. In fact, it feels like the United States has become an “underdog,” while China and other emerging nations are coined as the new world economic leaders. But the reality is that the U.S. remains the world’s largest economy, and the stock market has continued to perform well. Following the crisis in 2008, the Dow Jones Industrial Average was up 23% in 2009, up 14% in 2010, and up 8% in 2011. I believe, however, that many Americans, including individuals, business leaders, and political leaders, have remained resilient and continue to exhibit the stamina to work hard and the character to succeed.
I am not saying that our economy isn’t without issues. But, I believe investors may be missing some key facts about our economy, and those facts transcend the rhetoric. In last year’s shareholder letter, I told you that the major obstacle facing the U.S. economy and the stock market was clarity from our leaders in Washington on taxes, regulation and healthcare. With the elections behind us, we have the clarity that President Obama will be our leader for another four years. We know that the Democrats have the majority in the Senate and the Republicans have the majority in the House. But where does that leave our economy, the financial markets and investors?
Post-Election Economy
The moment the last ballot was cast in November, the media began its talk of the “Fiscal Cliff.” The dramatic use of the word “Cliff” is making everyone nervous. I keep picturing the old Road Runner cartoons with the Coyote plummeting off a cliff and landing in a cloud of dust. It is my somewhat controversial opinion that we should drive right off the Fiscal Cliff and force our policy makers to get things “right” and not compromise for the sake of a compromise. I strongly believe that if we fall off the “Cliff,” in six months’ time our leaders would have to work together to create better policies, rather than trying to force quick fixes on these issues critical to our economy and our nation.
The election, the Fiscal Cliff and slow earnings growth may be eroding the confidence of our business leaders, who have cut costs and driven profits. However, companies here in the U.S. are still sitting on record amounts of cash. Businesses require faith in their government to execute strategies that will put that capital to work, and to hire in earnest. Now that there is some clarity, it must, in my opinion, be coupled with actionable policy on taxes and regulation for corporate attitudes and behavior to shift. Corporate America, and frankly most of America, is losing its tolerance with polarized and stagnant politics.
For better or worse, business leaders need to know what regulations they’ll have to comply with, what tax rates will be and what healthcare will cost. The writing is on the wall for higher taxes, and the Healthcare Reform Law appears to be here to stay. The current administration seems to feel that they have a “green light” to push the 200 regulations related to Dodd-Frank and the numerous policies outlined in the Healthcare Reform Law into practice in the next four years. I know that innovative business leaders in this country will implement new strategies as they seek to remain profitable, because that’s what they do. Many of America’s business leaders have shown that they have the character to succeed in any political or economic climate.
Financial Markets
The stock market will be forced to wade through this murky economy as we continue to navigate the partisan political quagmire. Many companies comprising the Dow Jones Industrial Average Index or the S&P 500 have strong balance sheets, respectable fundamentals and reasonable returns. When our fiscal year ended on October 31, 2012, the Dow Jones was going strong at 9.51% calendar year to date. Of course, after the election, the market “rioted” in order to force some decisions on the Fiscal Cliff. In fact, in the ten days after the election, we saw the Dow lose 4%. But in the long term, I believe the strengths of the economy should filter through to the markets. We are in the midst of a slow but steady recovery that won’t easily be derailed. I am, therefore, expecting another year with slow to moderate growth. There are still plenty of great stocks to buy. We are seeing improvement in many sectors, including the housing industry, and we still see strength in lower-end retailers.
Investors
Investors are still uncertain about putting their cash to work in the stock market, and they continue to flock to fixed income products. Like business leaders, I believe that investors feel the same frustration with partisanship in Washington, and they need more answers in order to believe in the economic recovery. The strength I have seen in many of the lower-end retailers tells me that investors and consumers are still looking for value for their dollar. Many industry statistics report
WWW.HENNESSYFUNDS.COM
2
that Americans have been paying down their debt and saving more, even with interest rates at all-time lows. And, I believe, the average investor could be experiencing some long-awaited comfort in the slow return of the housing market in our country.
Japan Market
I remain very excited about the possibilities for growth in the Japanese market. Japanese companies have been employing the same tactics as U.S. based companies: they are saving money, paying dividends and making strategic acquisitions. With the passing of the torch to a new Prime-minister (Shinzo Abe) it looks as though the final piece to the economic puzzle in Japan may be in place. It appears that the Japanese Government is supporting the weakening of the Yen, and that companies in Japan are prepared to increase their exports. While I remain hopeful that the U.S. Administration’s actions and policies will support business and encourage personal success, Japan’s governing body seems to truly want Japanese companies and citizens to prosper and is taking action. In a surprise move, Shinzo Abe’s call for an inflation target of 2% and a Yen of around 90 (up from approximately 76) to the dollar could do two things. First, it could help to end the deflation that has hampered the country for years, and second, it can encourage Japanese business leaders to increased profits, which would in turn drive more revenues for the Japanese Government. All told, I truly believe that companies in Japan are poised to take off, and in turn so should the Japanese markets. I am confident that Japan is on the brink of the financial comeback that many investors have been waiting for.
While fiscal 2012 proved another difficult year for the global economy, at Hennessy Funds we remain focused on our proven investment strategies, and we will not compromise our long-standing commitment to manage our portfolios in the best interest of our shareholders. As investors regain their confidence and return to investing based on facts and fundamentals, I believe we should return to steady, long-term market gains.
In late October, Hennessy Funds added seven new funds to our family of funds. We are excited to now offer our shareholders an expanded line-up of products, including 16 traditional domestic equity, sector and specialty, as well as more conservative balanced and fixed income mutual funds.
I personally would like to take a moment to reach out to the victims of Hurricane Sandy and Sandy Hook Elementary School. No words can express the sorrow we feel for the families who lost loved ones.
Thank you for your continued confidence and investment in the Hennessy Funds. If you have any questions or want to speak with us directly, please don’t hesitate to call us at (800) 966-4354.
Best regards,
Neil J. Hennessy
President and Chief Investment Officer
Past performance does not guarantee future results.
Mutual fund investing involves risk. Principal loss is possible. Small and medium-capitalization companies tend to have more limited liquidity and greater price volatility than large-capitalization companies. Investments in foreign securities may involve greater volatility and political, economic and currency risk and differences in accounting methods. A non-diversified fund, one that may concentrate its assets in fewer individual holdings than a diversified fund, is more exposed to individual stock volatility than a diversified fund. A fund that concentrates its investments within one or a small group of industries may be more volatile than a fund that invests in a broader range of industries. Real estate values (and the values of real estate-related securities) fluctuate with changes in general and local economic conditions and are particularly sensitive to economic downturns. IPO shares are subject to market risk and liquidity risk. The yields and principal values of debt securities will also fluctuate. Generally, values of debt securities change inversely with interest rates. Some Funds may invest a portion of its assets in lower rated, high-yielding bonds (commonly known as “junk bonds”). Mortgage- and asset-backed securities are subject to prepayment risk, which is the risk that the borrower will prepay some or all of the principal owed to the issuer.
Opinions expressed are those of Neil Hennessy and are subject to change, are not guaranteed and should not be considered investment advice.
The Dow Jones Industrial Average and the S&P 500 Index are unmanaged indices of common stocks comprised of major companies and assume reinvestment of dividends. You cannot invest directly in an index.
HENNESSY FUNDS 1-800-966-4354
3
Performance Overview (Unaudited)
The opinions expressed in the following commentaries reflect those of the Portfolio Managers as of the date written. Any such opinions are subject to change based on market or other conditions. These opinions may not be relied upon as investment advice. Investment decisions for the Hennessy Funds are based on several factors, and may not be relied upon as an indication of trading intent on behalf of any Hennessy Fund. Security positions can and do change.
Hennessy Cornerstone Growth Fund
Investor Class Shares (HFCGX)
AVERAGE ANNUAL TOTAL RETURN PERIODS ENDED OCTOBER 31, 2012
| Since Inception | ||||
| One Year | Five Years | Ten Years | (11/1/96) | |
| Hennessy Cornerstone Growth Fund – Investor Class | 24.17% | -6.06% | 4.80% | 8.11% |
| Russell 2000 Index | 12.08% | 1.19% | 9.58% | 7.04% |
| S&P 500 Index | 15.21% | 0.36% | 6.91% | 6.35% |
Gross expense ratio: 1.33%.
Performance data quoted represents past performance; past performance does not guarantee future results. The investment return and principal value of an investment will fluctuate so that an investor’s shares, when redeemed, may be worth more or less than their original cost. Current performance of the Fund may be lower or higher than the performance quoted. Performance data current to the most recent month end may be obtained by visiting www.hennessyfunds.com.
The gross expense ratio presented is that from the most recent prospectus.
PERFORMANCE NARRATIVE*
The Hennessy Cornerstone Growth Fund returned 24.17% for the twelve-month period ended October 31, 2012, significantly outperforming both the Russell 2000 Index, which returned 12.08%, and the S&P 500, which returned 15.21%, for the same period. The Fund’s outperformance versus the Russell 2000 Index was primarily due to stock selection within the Industrial, Consumer Discretionary and Materials sectors. This offset negative stock selection and sector allocation within Health Care and Financial stocks. United Rentals (up nearly 75%) was the biggest positive contributor within the Industrials sector. The equipment rental company posted very good revenue and earnings numbers throughout the year as rental rates are anticipated to show approximately 7% year over year increase. Overall, the best preforming stock in the portfolio during the 12-month period was American Vanguard (up approximately 190%) as a historically tight crop supply, high prices and strong farm incomes drove revenues and earnings for the agrichemical manufacturer. The consumer electronics company, VOXX International, was the poorest performing stock in the portfolio during the period (down approximately 4%). While year over year revenues were up, earnings remained roughly the same in the latter part of the year, contributing to the stock’s decline during the second half of the year.
The Hennessy Cornerstone Funds employ time-tested, purely quantitative stock selection formulas resulting in a highly-disciplined and repeatable investment process.
CHANGE IN VALUE OF $10,000 INVESTMENT
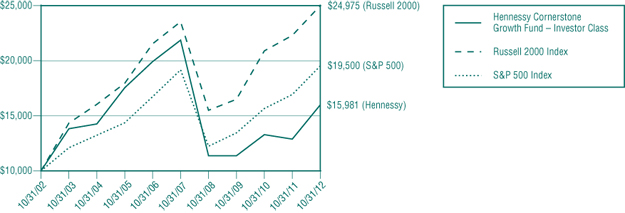
This chart assumes an initial gross investment of $10,000 made on October 31, 2002. Returns shown include the reinvestment of all dividends.
The table and the graph do not reflect the deduction of taxes that a shareholder would pay on Fund distributions or the redemption of Fund shares.
WWW.HENNESSYFUNDS.COM
4
Hennessy Cornerstone Growth Fund
Institutional Class Shares (HICGX)
AVERAGE ANNUAL TOTAL RETURN PERIODS ENDED OCTOBER 31, 2012
| Since Inception | |||
| One Year | Three Years | (3/3/08) | |
| Hennessy Cornerstone Growth Fund – Institutional Class | 24.58% | 12.37% | -1.35% |
| Russell 2000 Index | 12.08% | 14.82% | 5.41% |
| S&P 500 Index | 15.21% | 13.21% | 3.53% |
Gross expense ratio: 1.09%. Net expense ratio: 0.98%. The expense ratio is contractually capped at 0.98% indefinitely.
Performance data quoted represents past performance; past performance does not guarantee future results. The investment return and principal value of an investment will fluctuate so that an investor’s shares, when redeemed, may be worth more or less than their original cost. Current performance of the Fund may be lower or higher than the performance quoted. Performance data current to the most recent month end may be obtained by visiting www.hennessyfunds.com. Investment performance reflects fee waivers in effect. In the absence of such waivers, total return would be reduced.
The expense ratios presented are those from the most recent prospectus.
CHANGE IN VALUE OF $250,000 INVESTMENT
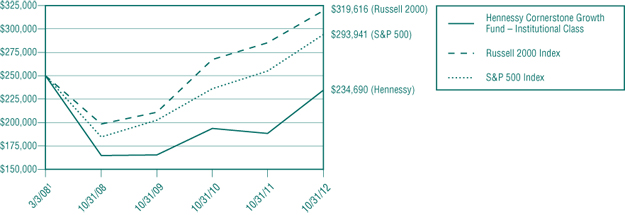
1 Inception date
This chart assumes an initial gross investment of $250,000 (minimum investment) made on March 3, 2008 (inception date of share class). Returns shown include the reinvestment of all dividends.
The table and the graph do not reflect the deduction of taxes that a shareholder would pay on Fund distributions or the redemption of Fund shares.
The S&P 500 Index and Russell 2000 Index are unmanaged indices commonly used to measure the performance of U.S. Stocks. You cannot invest directly in an index. Small and medium-capitalization companies tend to have limited liquidity and greater price volatility than large-capitalization companies. Investments in foreign securities involve greater volatility and political, economic and currency risk and differences in accounting methods. References to specific securities should not be considered a recommendation to buy or sell any security. Fund holdings and sector allocations are subject to change. Please refer to the included Schedule of Investments.
| * | On October 26, 2012 Hennessy purchased the assets of the FBR Funds. The FBR Small Cap Fund was reorganized into the Hennessy Cornerstone Growth Fund, which has a similar investment objective. These holdings had very little impact on the overall performance of the Fund as those securities were held for only a few days prior to the close of the fiscal year-end. |
HENNESSY FUNDS 1-800-966-4354
5
Hennessy Cornerstone Mid Cap 30 Fund (formerly Hennessy Focus 30 Fund)
Investor Class Shares (HFMDX)
AVERAGE ANNUAL TOTAL RETURN PERIODS ENDED OCTOBER 31, 2012
| Since Inception | |||
| One Year | Five Years | (9/17/03) | |
| Hennessy Cornerstone Mid Cap 30 Fund – Investor Class | 15.72% | 3.94% | 9.92% |
| S&P Midcap 400 Index | 12.11% | 3.12% | 8.56% |
| S&P 500 Index | 15.21% | 0.36% | 5.69% |
Gross expense ratio: 1.36%.
Performance data quoted represents past performance; past performance does not guarantee future results. The investment return and principal value of an investment will fluctuate so that an investor’s shares, when redeemed, may be worth more or less than their original cost. Current performance of the Fund may be lower or higher than the performance quoted. Performance data current to the most recent month end may be obtained by visiting www.hennessyfunds.com.
The gross expense ratio presented is that from the most recent prospectus.
PERFORMANCE NARRATIVE*
The Hennessy Cornerstone Mid Cap 30 Fund returned 15.72% for the twelve-month period ended October 31, 2012, outperforming both the S&P Midcap 400 Index and the S&P 500 Index, which returned 12.11% and 15.21% respectively for the same period. The Fund was aided by stock selection within the Consumer Discretionary, Consumer Staples and Energy sectors, but performance was hampered by the relative weighting within the Financial and Health Care sectors, which were both underweight versus the benchmarks. Sunoco Logistics and Tesoro Corporation, both in the Energy sector, were our largest contributors to Fund performance, with the stocks up 55% and 45% respectively during the period. Tesoro’s turnaround was significant as the company was our largest negative contributor for the first half of the year, but a nearly $300 million contract with the Department of Defense and an improving market environment drove the stock higher during the latter portion of the year. Our worst performing stock during the period was Towers Watson, the human resource and financial consulting company, which was down 17% for the year after reporting disappointing fiscal fourth quarter numbers in August.
The Hennessy Cornerstone Funds employ time-tested, purely quantitative stock selection formulas resulting in a highly-disciplined and repeatable investment process.
CHANGE IN VALUE OF $10,000 INVESTMENT

1 Inception date
This chart assumes an initial gross investment of $10,000 made on September 17, 2003 (inception). Returns shown include the reinvestment of all dividends.
The table and the graph do not reflect the deduction of taxes that a shareholder would pay on Fund distributions or the redemption of Fund shares.
WWW.HENNESSYFUNDS.COM
6
Hennessy Cornerstone Mid Cap 30 Fund (formerly Hennessy Focus 30 Fund)
Institutional Class Shares (HIMDX)
AVERAGE ANNUAL TOTAL RETURN PERIODS ENDED OCTOBER 31, 2012
| Since Inception | |||
| One Year | Three Years | (3/3/08) | |
| Hennessy Cornerstone Mid Cap 30 Fund – Institutional Class | 16.15% | 17.68% | 5.50% |
| S&P Midcap 400 Index | 12.11% | 15.81% | 6.37% |
| S&P 500 Index | 15.21% | 13. 21% | 3.53% |
Gross expense ratio: 1.14%. Net expense ratio: 0.98%. The expense ratio is contractually capped at 0.98% indefinitely.
Performance data quoted represents past performance; past performance does not guarantee future results. The investment return and principal value of an investment will fluctuate so that an investor’s shares, when redeemed, may be worth more or less than their original cost. Current performance of the Fund may be lower or higher than the performance quoted. Performance data current to the most recent month end may be obtained by visiting www.hennessyfunds.com. Investment performance reflects fee waivers in effect. In the absence of such waivers, total return would be reduced.
The expense ratios presented are those from the most recent prospectus.
CHANGE IN VALUE OF $250,000 INVESTMENT
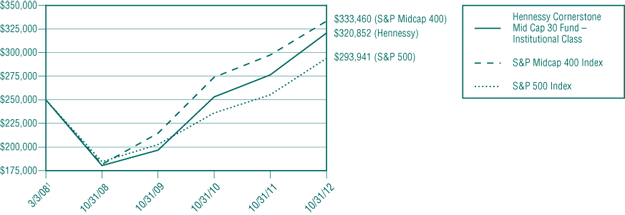
1 Inception date
This chart assumes an initial gross investment of $250,000 (minimum investment) made on March 3, 2008 (inception date of share class). Returns shown include the reinvestment of all dividends.
The table and the graph do not reflect the deduction of taxes that a shareholder would pay on Fund distributions or the redemption of Fund shares.
The S&P 500 Index and S&P Midcap 400 Index are unmanaged indices commonly used to measure the performance of U.S. Stocks. You cannot invest directly in an index. Small and medium-capitalization companies tend to have limited liquidity and greater price volatility than large-capitalization companies. References to specific securities should not be considered a recommendation to buy or sell any security. Fund holdings and sector allocations are subject to change. Please refer to the included Schedule of Investments.
| * | On October 26, 2012 Hennessy purchased the assets of the FBR Funds. The FBR Mid Cap Fund was reorganized into the Hennessy Cornerstone Mid Cap 30 Fund, which has a similar investment objective. These holdings had very little impact on the overall performance of the Fund as those securities were held for only a few days prior to the close of the fiscal year-end. |
HENNESSY FUNDS 1-800-966-4354
7
Hennessy Cornerstone Large Growth Fund
Investor Class Shares (HFLGX)
AVERAGE ANNUAL TOTAL RETURN PERIODS ENDED OCTOBER 31, 2012
| Since Inception | |||
| One Year | Three Years | (3/20/09) | |
| Hennessy Cornerstone Large Growth Fund – Investor Class | 9.14% | 12.99% | 21.70% |
| Russell 1000 Index | 14.97% | 13.48% | 21.26% |
| S&P 500 Index | 15.21% | 13.21% | 20.83% |
Gross expense ratio: 1.26%.
Performance data quoted represents past performance; past performance does not guarantee future results. The investment return and principal value of an investment will fluctuate so that an investor’s shares, when redeemed, may be worth more or less than their original cost. Current performance of the Fund may be lower or higher than the performance quoted. Performance data current to the most recent month end may be obtained by visiting www.hennessyfunds.com.
The gross expense ratio presented is that from the most recent prospectus.
PERFORMANCE NARRATIVE*
The Hennessy Cornerstone Large Growth Fund returned 9.14% for the twelve-month period ended October 31, 2012, underperforming both the Russell 1000 Index and the S&P 500 Index, which returned 14.97% and 15.21% respectively for the same period. The largest positive contribution to the Fund’s performance was stock selection in the Industrials sector and both allocation and stock selection in the Energy sector. Stock selection within the Materials and Information Technology sectors were negative contributors to overall performance, as was our relative underweighting in the Financial sector. The biggest drawdown on performance was from the investment in Apollo Group (down roughly 58%), the educational program provider perhaps best known for their University of Phoenix division. The stock had a difficult year as an improving labor market and heightened competition weighed on the company. The company’s most recent earnings announcement in October was saddled with further disappointment as net income dropped by roughly 60% as the company was hurt by higher costs and declining enrollment. The single largest contributor to Fund performance was Gap Inc. (up 92%), which started trending higher in February after announcing that earnings would be better than expected and that strategies the company was implementing to improve business performance were starting to pay off. Gap, Inc. continued to move higher throughout the year, posting impressive same store sales numbers and earnings through the summer and fall months.
The Hennessy Cornerstone Funds employ time-tested, purely quantitative stock selection formulas resulting in a highly-disciplined and repeatable investment process.
CHANGE IN VALUE OF $10,000 INVESTMENT
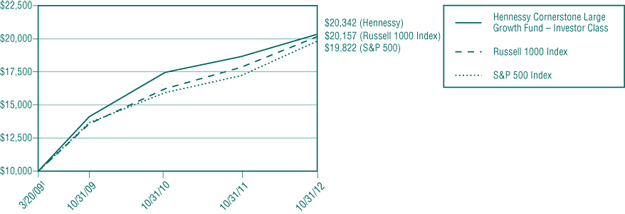
1 Inception date
This chart assumes an initial gross investment of $10,000 made on March 20, 2009 (inception). Returns shown include the reinvestment of all dividends.
The table and the graph do not reflect the deduction of taxes that a shareholder would pay on Fund distributions or the redemption of Fund shares.
WWW.HENNESSYFUNDS.COM
8
Hennessy Cornerstone Large Growth Fund
Institutional Class Shares (HILGX)
AVERAGE ANNUAL TOTAL RETURN PERIODS ENDED OCTOBER 31, 2012
| Since Inception | |||
| One Year | Three Years | (3/20/09) | |
| Hennessy Cornerstone Large Growth Fund – Institutional Class | 9.43% | 13.31% | 22.05% |
| Russell 1000 Index | 14.97% | 13.48% | 21.26% |
| S&P 500 Index | 15.21% | 13.21% | 20.83% |
Gross expense ratio: 1.14%. Net expense ratio: 0.98%. The expense ratio is contractually capped at 0.98% indefinitely.
Performance data quoted represents past performance; past performance does not guarantee future results. The investment return and principal value of an investment will fluctuate so that an investor’s shares, when redeemed, may be worth more or less than their original cost. Current performance of the Fund may be lower or higher than the performance quoted. Performance data current to the most recent month end may be obtained by visiting www.hennessyfunds.com. Investment performance reflects fee waivers in effect. In the absence of such waivers, total return would be reduced.
The expense ratios presented are that from the most recent prospectus.
CHANGE IN VALUE OF $250,000 INVESTMENT
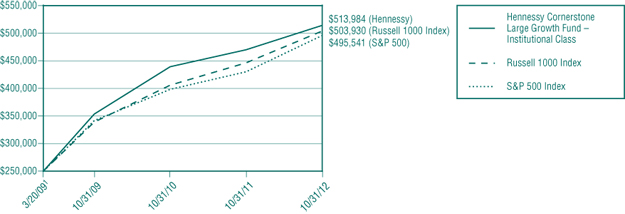
1 Inception date
This chart assumes an initial gross investment of $250,000 (minimum investment) made on March 20, 2009 (inception). Returns shown include the reinvestment of all dividends.
The table and the graph do not reflect the deduction of taxes that a shareholder would pay on Fund distributions or the redemption of Fund shares.
The S&P 500 and Russell 1000 are unmanaged indices commonly used to measure the performance of U.S. stocks. One cannot invest directly in an index. The Fund may invest in medium-capitalization companies, which tend to have limited liquidity and greater price volatility than large-capitalization companies. References to specific securities should not be considered a recommendation to buy or sell any security. Fund holdings and sector allocations are subject to change. Please refer to the included Schedule of Investments.
| * | On October 26, 2012 Hennessy purchased the assets of the FBR Funds. The FBR Large Cap Fund was reorganized into the Hennessy Cornerstone Large Growth Fund, which has a similar investment objective. These holdings had very little impact on the overall performance of the Fund as those securities were held for only a few days prior to the close of the fiscal year-end. |
HENNESSY FUNDS 1-800-966-4354
9
Hennessy Cornerstone Value Fund
Investor Class Shares (HFCVX)
AVERAGE ANNUAL TOTAL RETURN PERIODS ENDED OCTOBER 31, 2012
| Since Inception | ||||
| One Year | Five Years | Ten Years | (11/1/96) | |
| Hennessy Cornerstone Value Fund – Investor Class | 12.79% | -0.46% | 6.77% | 5.73% |
| Russell 1000 Value Index | 16.89% | -1.00% | 7.34% | 7.18% |
| S&P 500 Index | 15.21% | 0.36% | 6.91% | 6.35% |
Gross expense ratio: 1.31%.
Performance data quoted represents past performance; past performance does not guarantee future results. The investment return and principal value of an investment will fluctuate so that an investor’s shares, when redeemed, may be worth more or less than their original cost. Current performance of the Fund may be lower or higher than the performance quoted. Performance data current to the most recent month end may be obtained by visiting www.hennessyfunds.com.
The gross expense ratio presented is that from the most recent prospectus.
PERFORMANCE NARRATIVE
The Hennessy Cornerstone Value Fund returned 12.79% for the twelve-month period ended October 31, 2012, underperforming its benchmark, the Russell 1000 Value Index, which returned 16.89%, and the S&P 500 Index, which returned 15.21% for the same period. The Fund’s performance was aided by both asset allocation and stock selection in the Information Technology sector, and the relative underweighting in the Utilities sector. The stronger performance within the Energy sector was offset by the underperformance within the Telecom Service sector. The Fund’s overall performance was hurt by positions in France Telecom and Spanish telecommunications provider, Telefonica (down 23% and 28% respectively), as concerns over European affairs continued to weaken the performance of those stocks. The Fund no longer holds positions in those stocks. The best performing holding in the Fund, and the largest single contributor to performance was Seagate Technologies (up 76%) which significantly raised 2012 revenue guidance, buoyed by disk drive shortages due to floods in Thailand. This disk shortage subsequently drove both disk drive prices and corporate earnings higher. The portfolio continues to hold the position in Seagate.
The Hennessy Cornerstone Funds employ time-tested, purely quantitative stock selection formulas resulting in a highly-disciplined and repeatable investment process.
CHANGE IN VALUE OF $10,000 INVESTMENT
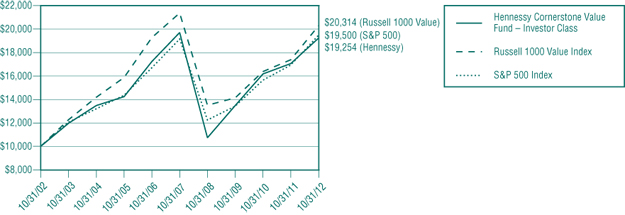
This chart assumes an initial gross investment of $10,000 made on October 31, 2002. Returns shown include the reinvestment of all dividends.
The table and the graph do not reflect the deduction of taxes that a shareholder would pay on Fund distributions or the redemption of Fund shares.
WWW.HENNESSYFUNDS.COM
10
Hennessy Cornerstone Value Fund
Institutional Class Shares (HICVX)
AVERAGE ANNUAL TOTAL RETURN PERIODS ENDED OCTOBER 31, 2012
| Since Inception | |||
| One Year | Three Years | (3/3/08) | |
| Hennessy Cornerstone Value Fund – Institutional Class | 13.13% | 13.00% | 3.86% |
| Russell 1000 Value Index | 16.89% | 12.81% | 2.02% |
| S&P 500 Index | 15.21% | 13.21% | 3.53% |
Gross expense ratio: 1.14%. Net expense ratio: 0.98%. The expense ratio is contractually capped at 0.98% indefinitely.
Performance data quoted represents past performance; past performance does not guarantee future results. The investment return and principal value of an investment will fluctuate so that an investor’s shares, when redeemed, may be worth more or less than their original cost. Current performance of the Fund may be lower or higher than the performance quoted. Performance data current to the most recent month end may be obtained by visiting www.hennessyfunds.com. Investment performance reflects fee waivers in effect. In the absence of such waivers, total return would be reduced.
The expense ratios presented are those from the most recent prospectus.
CHANGE IN VALUE OF $250,000 INVESTMENT

* Inception date
This chart assumes an initial gross investment of $250,000 (minimum investment) made on March 3, 2008 (inception date of share class). Returns shown include the reinvestment of all dividends.
The table and the graph do not reflect the deduction of taxes that a shareholder would pay on Fund distributions or the redemption of Fund shares.
The Russell 1000 Value Index and S&P 500 Index are unmanaged indices commonly used to measure the performance of U.S. Stocks. You cannot invest directly in an index. The Fund may invest in medium-capitalization companies which tend to have limited liquidity and greater price volatility than large-capitalization companies. Investments in foreign securities involve greater volatility and political, economic and currency risk and differences in accounting methods. References to specific securities should not be considered a recommendation to buy or sell any security. Fund holdings and sector allocations are subject to change. Please refer to the included Schedule of Investments.
HENNESSY FUNDS 1-800-966-4354
11
Hennessy Large Value Fund (formerly Hennessy Select Large Value Fund)
Investor Class Shares (HLVFX)
AVERAGE ANNUAL TOTAL RETURN PERIODS ENDED OCTOBER 31, 2012
| Since Inception | ||||
| One Year | Five Years | Ten Years | (9/30/84) | |
| Hennessy Large Value Fund – Investor Class | 16.07% | -1.85% | 5.30% | 9.51% |
| Russell 1000 Value Index | 16.89% | -1.00% | 7.34% | 10.88% |
| S&P 500 Index | 15.21% | 0.36% | 6.91% | 10.55% |
Gross expense ratio: 1.38%.
Performance data quoted represents past performance; past performance does not guarantee future results. The performance for periods prior to March 20, 2009 reflects the performance of the Tamarack Value Fund, the predecessor to the Hennessy Select Large Value Fund. The investment return and principal value of an investment will fluctuate so that an investor’s shares, when redeemed, may be worth more or less than their original cost. Current performance of the Fund may be lower or higher than the performance quoted. Performance data current to the most recent month end may be obtained by visiting www.hennessyfunds.com.
The gross expense ratio presented is that from the most recent prospectus.
PERFORMANCE NARRATIVE
RBC GLOBAL ASSET MANAGEMENT (U.S.) INC., SUB-ADVISOR
The Hennessy Large Value Fund returned 16.07% for the twelve-month period ended October 31, 2012, slightly underperforming its benchmark, the Russell 1000 Value Index, which returned 16.89% for the same period, but outperforming the S&P 500 Index, which returned 15.21%. The Fund’s strong absolute performance was the result of stock selection across a number of sectors, led by Consumer Discretionary, Utilities and Materials. Conversely, stock selection in Health Care and Energy detracted from performance. Sector allocation detracted modestly from performance as the Fund’s sector neutral mandate, by design, limits the impact of sector weighting decisions, with the Fund’s managers instead making bets at the industry level.
The largest contributor to the Fund’s performance for the period, by a significant margin, was the Consumer Discretionary sector. Exposure to the improving U.S. housing market was the primary driver of returns as home improvement retailer Home Depot (+76%) and homebuilder PulteGroup (+109%) both outperformed. While we have taken some profits in each, we continue to believe in the continued progress of the housing market recovery and are actively looking for additional second derivative opportunities (i.e. Home Depot) as a means of investing in this theme. Also contributing to the sector’s outperformance was the decision to hold companies geared to the more cost conscious consumer, such as retailers TJX Companies (+40%), Target (+25%), and Macy’s (+28%). Media names Comcast Corporation (+63%) and CBS (+27%) were also significant contributors to the sector’s outperformance. Comcast, a provider of cable, telephone, and high speed internet, saw a marked increase in subscriptions for their higher margin, high-speed broadband internet offering as well as improving results at the company’s television network, NBC. CBS benefitted from its position as the #1 rated network, best in class content, and revenue generating retransmission contracts with local affiliates.
While Utilities and Materials sectors (both at +11%) generally underperformed versus the broader index, the Fund, due to strong stock selection in both sectors, outperformed significantly within these sectors, returning +20% and +25% respectively. Within Utilities, the Fund benefitted both from what it owned, NextEra (+20%), and from what it avoided, Exelon (-15%). The Fund’s outperformance in Materials was driven by one of the Fund’s top overall contributing stocks, Solutia Inc. (+70%), which was the beneficiary of a buyout from Eastman Chemical early in 2012.
The Health Care sector, which was significantly impacted by “Obamacare,” and the Energy sector, which sold off with declining oil prices, were the most impactful detractors from Fund performance. Within Health Care, Humana (-24%) and Watson Pharmaceuticals (-11%) both sold off as neither company was able to meet increased expectations. In Humana’s case, expectations for margin improvement went unrealized and the company subsequently missed estimates in both the first and second quarters of 2012, while expectations of a significant windfall for Watson from generic cholesterol drug Lipitor proved to be too lofty as the company failed to capture as much of the market as anticipated. Both Humana and Watson have been eliminated from the portfolio.
Within the Energy sector, Occidental Petroleum (-13%) was the largest detractor from performance as the company’s production growth lagged and the firm has been unable to monetize its substantial oil reserves in California. Oil States International (-12%), a services company with significant exposure to the Canadian Oil Sands and coal mining in Australia, was also a significant headwind for performance despite consistently beating estimates, as concerns about the strength of the companies two aforementioned primary markets weighed on the stock’s performance. We continue to believe in the longer term prospects of both companies and maintain their positions in the Fund.
WWW.HENNESSYFUNDS.COM
12
CHANGE IN VALUE OF $10,000 INVESTMENT

This chart assumes an initial gross investment of $10,000 made on October 31, 2002. Returns shown include the reinvestment of all dividends.
The table and the graph do not reflect the deduction of taxes that a shareholder would pay on Fund distributions or the redemption of Fund shares.
Hennessy Large Value Fund (formerly Hennessy Select Large Value Fund)
Institutional Class Shares (HLVIX)
AVERAGE ANNUAL TOTAL RETURN PERIODS ENDED OCTOBER 31, 2012
| Since Inception | |||
| One Year | Three Years | (3/20/09) | |
| Hennessy Large Value Fund – Institutional Class | 16.58% | 10.91% | 17.85% |
| Russell 1000 Value Index | 16.89% | 12.81% | 21.14% |
| S&P 500 Index | 15.21% | 13.21% | 20.83% |
Gross expense ratio: 1.21%. Net expense ratio: 0.98%. The expense ratio is contractually capped at 0.98% indefinitely.
Performance data quoted represents past performance; past performance does not guarantee future results. The investment return and principal value of an investment will fluctuate so that an investor’s shares, when redeemed, may be worth more or less than their original cost. Current performance of the Fund may be lower or higher than the performance quoted. Performance data current to the most recent month end may be obtained by visiting www.hennessyfunds.com. Investment performance reflects fee waivers in effect. In the absence of such waivers, total return would be reduced.
The gross and net expense ratios presented are those from the most recent prospectus.
CHANGE IN VALUE OF $250,000 INVESTMENT
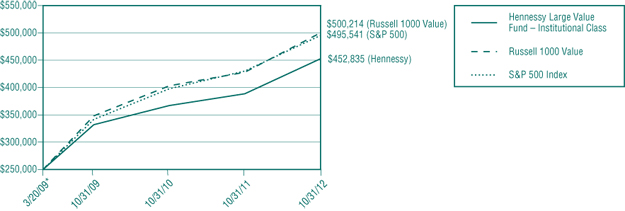
* Inception date
This chart assumes an initial gross investment of $250,000 (minimum investment) made on March 20, 2009 (inception date of share class). Returns shown include the reinvestment of all dividends.
The table and the graph do not reflect the deduction of taxes that a shareholder would pay on Fund distributions or the redemption of Fund shares.
HENNESSY FUNDS 1-800-966-4354
13
The S&P 500 and Russell 1000 Value are unmanaged indices commonly used to measure the performance of U.S. stocks. The Russell 1000 Value measures large-cap, value-oriented stocks. One cannot invest directly in an index.
The Fund may invest in medium-capitalization companies, which tend to have limited liquidity and greater price volatility than large-capitalization companies.
The Fund’s composition and sector weightings are shown as a percentage of the Fund’s total net assets. Portfolio composition and sector weightings are subject to change at any time and should not be considered a recommendation to buy or sell a particular security. Please refer to the Schedule of Investments within this Annual Report for additional portfolio information, including percentages of holdings.
Hennessy Total Return Fund
Investor Class Shares (HDOGX)
AVERAGE ANNUAL TOTAL RETURN PERIODS ENDED OCTOBER 31, 2012
| Since Inception | ||||
| One Year | Five Years | Ten Years | (7/29/98) | |
| Hennessy Total Return Fund | 11.78% | 0.22% | 5.89% | 3.72% |
| Dow Jones Industrial Average | 12.56% | 1.60% | 7.23% | 5.11% |
| S&P 500 Index | 15.21% | 0.36% | 6.91% | 3.46% |
Gross expense ratio: 1.34%.
Performance data quoted represents past performance; past performance does not guarantee future results. The investment return and principal value of an investment will fluctuate so that an investor’s shares, when redeemed, may be worth more or less than their original cost. Current performance of the Fund may be lower or higher than the performance quoted. Performance data current to the most recent month end may be obtained by visiting www.hennessyfunds.com.
The gross expense ratio presented is that from the most recent prospectus.
PERFORMANCE NARRATIVE
The Hennessy Total Return Fund returned 11.78% for the twelve-month period ended October 31, 2012, underperforming the Dow Jones Industrial Average, which returned 12.56%, and the S&P 500 Index, which returned 15.21% for the same period. The Fund’s roughly 25% weighting in Treasury Bills hampered overall Fund performance as yields continue to flirt with historically low levels, at times essentially equaling zero. The Fund’s approximately 75% equity weighting was able to nearly capture the weighted return of the Dow Jones Industrial Average, with the Fund’s three largest holdings, AT&T, Verizon and Pfizer, all posting 20%+ returns during the period. Dividend yield is one of the primary criteria in the stock selection process for this Fund. With dividends taken into account, eight of the companies in our top ten holdings posted gains during the twelve-month period, with only Intel and DuPont posting negative returns.
The Hennessy Cornerstone Funds employ time-tested, purely quantitative stock selection formulas resulting in a highly-disciplined and repeatable investment process.
CHANGE IN VALUE OF $10,000 INVESTMENT
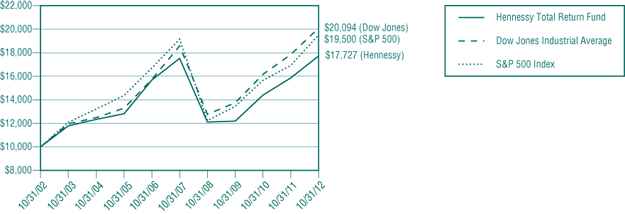
This chart assumes an initial gross investment of $10,000 made on October 31, 2002. Returns shown include the reinvestment of all dividend and other distributions.
The table and the graph do not reflect the deduction of taxes that a shareholder would pay on Fund distributions or the redemption of Fund shares.
The Dow Jones Industrial Average and S&P 500 Index are unmanaged indices commonly used to measure the performance of U.S. Stocks. You cannot invest directly in an index. The Fund is non-diversified, meaning it concentrates its assets in fewer individual holdings than a diversified fund, making it more exposed to individual stock volatility than a diversified fund. References to specific securities should not be considered a recommendation to buy or sell any security. Fund holdings are subject to change. Please refer to the included Schedule of Investments.
WWW.HENNESSYFUNDS.COM
14
Hennessy Balanced Fund
Investor Class Shares (HBFBX)
AVERAGE ANNUAL TOTAL RETURN PERIODS ENDED OCTOBER 31, 2012
| Since Inception | ||||
| One Year | Five Years | Ten Years | (3/8/96) | |
| Hennessy Balanced Fund | 7.13% | 0.98% | 4.00% | 4.17% |
| Dow Jones Industrial Average | 12.56% | 1.60% | 7.23% | 7.75% |
| S&P 500 Index | 15.21% | 0.36% | 6.91% | 6.85% |
Gross expense ratio: 1.62%.
Performance data quoted represents past performance; past performance does not guarantee future results. The investment return and principal value of an investment will fluctuate so that an investor’s shares, when redeemed, may be worth more or less than their original cost. Current performance of the Fund may be lower or higher than the performance quoted. Performance data current to the most recent month end may be obtained by visiting www.hennessyfunds.com.
The gross expense ratio presented is that from the most recent prospectus.
PERFORMANCE NARRATIVE
The Hennessy Balanced Fund returned 7.13% for the twelve-month period ended October 31, 2012, underperforming the Dow Jones Industrial Average, which returned 12.56%, and the S&P 500 Index, which returned 15.21% for the same period. The Fund’s relative underperformance to its benchmarks is due primarily to the continued low yields on Treasury Bills, which represent approximately 50% of the Fund’s holdings. While the portfolio may underperform the indices in periods where equities rise sharply, the strategy is geared to capture near market returns with a lower risk profile, since only half of the assets are invested in equities. Conversely, if equity markets were to fall sharply, we would expect the Fund to perform better than the indices. Ultimately, the overall goal of this portfolio is to capture upside performance while mitigating downside risk.
The Hennessy Cornerstone Funds employ time-tested, purely quantitative stock selection formulas resulting in a highly-disciplined and repeatable investment process.
CHANGE IN VALUE OF $10,000 INVESTMENT
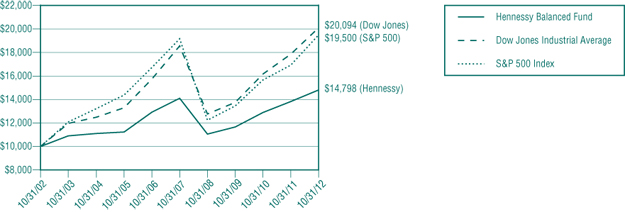
This chart assumes an initial gross investment of $10,000, made on October 31, 2002. Returns shown include the reinvestment of all dividend and other distributions.
The table and the graph do not reflect the deduction of taxes that a shareholder would pay on Fund distributions or the redemption of Fund shares.
The Dow Jones Industrial Average and S&P 500 Index are unmanaged indices commonly used to measure the performance of U.S. Stocks. You cannot invest directly in an index. The Fund is non-diversified, meaning it concentrates its assets in fewer individual holdings than a diversified fund, making it more exposed to individual stock volatility than a diversified fund. References to specific securities should not be considered a recommendation to buy or sell any security. Fund holdings are subject to change. Please refer to the included Schedule of Investments.
HENNESSY FUNDS 1-800-966-4354
15
Hennessy Japan Fund (formerly Hennessy Select SPARX Japan Fund)
Investor Class Shares (HJPNX)
AVERAGE ANNUAL TOTAL RETURN PERIODS ENDED OCTOBER 31, 2012
| Since Inception | |||
| One Year | Five Years | (10/31/03) | |
| Hennessy Japan Fund – Investor Class | 10.08% | -0.95% | 6.06% |
| Russell/Nomura Total Market Index | -1.86% | -5.97% | 1.65% |
| TOPIX | -3.10% | -6.13% | 1.30% |
Gross expense ratio: 1.87%.
Performance data quoted represents past performance; past performance does not guarantee future results. The investment return and principal value of an investment will fluctuate so that an investor’s shares, when redeemed, may be worth more or less than their original cost. Current performance of the Fund may be lower or higher than the performance quoted. Performance data current to the most recent month end may be obtained by visiting www.hennessyfunds.com.
The gross expense ratio presented is that from the most recent prospectus.
PERFORMANCE NARRATIVE
SPARX ASSET MANAGEMENT CO., LTD., SUB-ADVISOR
The Hennessy Japan Fund returned 10.08% for the twelve-month period ended October 31, 2012, significantly outperforming both the Russell/Nomura Total Market Index and TOPIX, which lost -1.86% and -3.10% respectively, for the same period. The largest positive contributors to the Fund’s performance among the TOPIX 33 sub-industries were wholesalers, retailers and automakers. Conversely, machinery manufacturers, iron & steel makers, and nonferrous metal producers were among the worst performers.
Among the strongest performing stocks during the twelve-month period were Ryohin Keikaku Co., Ltd., the operator of the “MUJI” brand chain of retail stores, Misumi Group Inc., a distributor of metal mold components and Shimano, Inc., the bicycle parts manufacturer with leading global market share.
Shares of Ryohin Keikaku jumped 42% on the back of a series of upbeat broker reports, citing the company’s improved domestic gross margin and overseas profitability. Shares of Misumi appreciated 17% as the company’s resilient business model garnered investor interest amid uncertain global economic conditions. Shares of Shimano climbed 28% following the release of its favorable full-term earnings results for the year ended December 2011.
Conversely, Terumo Corp., the medical equipment manufacturer, Komatsu Ltd., one of the largest global manufacturers of construction machinery, and Daikin Industries, Ltd., the leading global manufacturer of commercial-use air conditioners, were among the major detractors to the Fund’s performance during the period. Shares of Terumo fell -16% after the company announced disappointing earnings guidance for the fiscal year ending in May 2012. Shares of Komatsu fell -15% due to concerns about its earnings outlook amid the European debt crisis and the economic slowdown in China. Daikin fell -7% as its share price has been under pressure for much of the year due to mounting concerns over its businesses in China and Europe, the company’s two largest overseas markets.
CHANGE IN VALUE OF $10,000 INVESTMENT

* Inception date
This chart assumes an initial gross investment of $10,000 made on October 31, 2003 (inception). Returns shown include the reinvestment of all dividends.
The table and the graph do not reflect the deduction of taxes that a shareholder would pay on Fund distributions or the redemption of Fund shares.
WWW.HENNESSYFUNDS.COM
16
Hennessy Japan Fund (formerly Hennessy Select SPARX Japan Fund)
Institutional Class Shares (HJPIX)
AVERAGE ANNUAL TOTAL RETURN PERIODS ENDED OCTOBER 31, 2012
| Since Inception | |||
| One Year | Five Years | (10/31/03) | |
| Hennessy Japan Fund – Institutional Class | 10.33% | -0.80% | 6.22% |
| Russell/Nomura Total Market Index | -1.86% | -5.97% | 1.65% |
| TOPIX | -3.10% | -6.13% | 1.30% |
Gross expense ratio: 1.65%.
Performance data quoted represents past performance; past performance does not guarantee future results. The investment return and principal value of an investment will fluctuate so that an investor’s shares, when redeemed, may be worth more or less than their original cost. Current performance of the Fund may be lower or higher than the performance quoted. Performance data current to the most recent month end may be obtained by visiting www.hennessyfunds.com.
The gross expense ratio presented is that from the most recent prospectus.
CHANGE IN VALUE OF $250,000 INVESTMENT
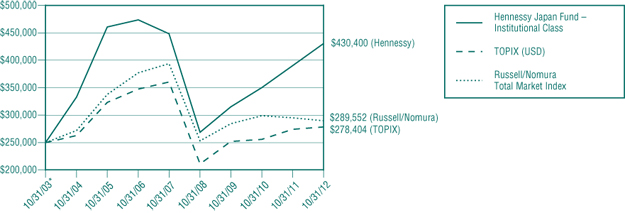
* Inception date
This chart assumes an initial gross investment of $250,000 (minimum investment) made on October 31, 2003 (inception). Returns shown include the reinvestment of all dividends.
The table and the graph do not reflect the deduction of taxes that a shareholder would pay on Fund distributions or the redemption of Fund shares.
The Russell/Nomura Total Market Index contains the top 98% of all stocks listed on Japan’s stock exchange and registered on Japan’s OTC market, in terms of market capitalization. The Tokyo Stock Price Index (TOPIX) is a market capitalization-weighted index of all companies listed on the First Section of the Tokyo Stock Exchange. The Russell/Nomura Total Market and TOPIX indices are presented in U.S. Dollar terms and take into account reinvestment of dividends. One cannot invest directly in an index.
Small and medium-capitalization companies tend to have limited liquidity and greater price volatility than large-capitalization companies. Investments in foreign securities involve greater volatility and political, economic and currency risk and differences in accounting methods.
The Fund’s composition and sector weightings are shown as a percentage of the Fund’s total net assets. Portfolio composition and sector weightings are subject to change at any time and should not be considered a recommendation to buy or sell a particular security. Please refer to the Schedule of Investments within this Annual Report for additional portfolio information, including percentages of holdings.
HENNESSY FUNDS 1-800-966-4354
17
Hennessy Japan Small Cap Fund (formerly Hennessy Select SPARX Japan Smaller Companies Fund)
Investor Class Shares (HJPSX)
AVERAGE ANNUAL TOTAL RETURN PERIODS ENDED OCTOBER 31, 2012
| Since Inception | |||
| One Year | Five Years | (8/31/07) | |
| Hennessy Japan Small Cap Fund – Investor Class | 4.91% | 0.34% | 2.16% |
| Russell/Nomura Small Cap Index | 0.79% | -1.18% | -0.63% |
| TOPIX | -3.10% | -6.13% | -5.61% |
Gross expense ratio: 2.11%.
Performance data quoted represents past performance; past performance does not guarantee future results. The investment return and principal value of an investment will fluctuate so that an investor’s shares, when redeemed, may be worth more or less than their original cost. Current performance of the Fund may be lower or higher than the performance quoted. Performance data current to the most recent month end may be obtained by visiting www.hennessyfunds.com.
The gross expense ratio presented is that from the most recent prospectus.
PERFORMANCE NARRATIVE
SPARX ASSET MANAGEMENT CO., LTD., SUB-ADVISOR
The Hennessy Japan Small Cap Fund returned 4.91% for the twelve-month period ended October 31, 2012, outperforming both the Russell/Nomura Japan Small Cap Index, which returned 0.79% and the TOPIX which lost -3.10%, for the same period.
The largest positive contributors to the Fund’s performance among the TOPIX 33 sub-industries were wholesalers, service industry firms and construction firms. Conversely, electronic appliance makers, insurers and machinery manufacturers were among the worst performers.
Among the strongest performing stocks during the twelve-month period were shares of SMS Co., Ltd., which operates a recruiting website for workers in the nursing and medical industry, UKC Holdings Corp., a trading firm dealing in Sony-made semiconductors and electronic parts and Nippon Carbide Industries Co., Inc., a chemical company. Shares of SMS surged 119% due to a newspaper article which featured the company as a future high-growth company. Shares of UKC increased 96% after the firm revised upward its earnings forecast for the fiscal year ending in March 2013 on the back of favorable sales. Shares of Nippon Carbide increased 68% amid rising expectations that demand for its products will increase after being featured on television.
On the other hand, Nippon Chemi-Con Corporation, Japan’s largest manufacturer of aluminum electrolytic capacitors, Micronics Japan Co., Ltd., the leading manufacturer of semiconductor measuring devices, and Kyosan Electronics, one of largest signal manufacturers in Japan, were the biggest detractors to the Fund’s performance during the period. Shares of Nippon Chemi-Con declined -63% on concerns that a decrease in demand for electronics in its current fiscal year ending in March 2013 would negatively impact the company’s earnings. Shares of Micronics Japan fell -39% because of a rating downgrade by a number of securities companies due to worsening conditions in the dynamic random access memory (DRAM) market. Shares of Kyosan Electronics dropped -25% as we believe investors were concerned about the company’s earnings outlook for the fiscal year ending in March 2013 on the back of weak overseas demand.
CHANGE IN VALUE OF $10,000 INVESTMENT
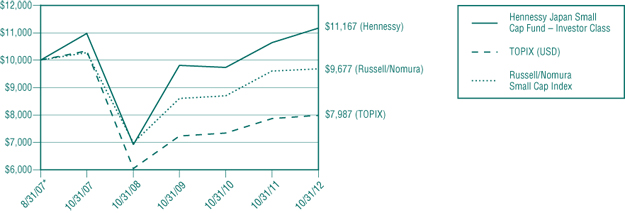
* Inception date
This chart assumes an initial gross investment of $10,000 made on August 31, 2007 (inception). Returns shown include the reinvestment of all dividends.
The table and the graph do not reflect the deduction of taxes that a shareholder would pay on Fund distributions or the redemption of Fund shares.
WWW.HENNESSYFUNDS.COM
18
The Russell/Nomura Small Cap Index contains the bottom 15% of the Russell/Nomura Total Market Index, which contains the top 98% of all stocks listed on Japan’s stock exchange and registered on Japan’s OTC market, in terms of market capitalization. The Tokyo Stock Price Index (TOPIX) is a market capitalization-weighted index of all companies listed on the First Section of the Tokyo Stock Exchange. The Russell/Nomura Small Cap and TOPIX indices are presented in U.S. Dollar terms and take into account reinvestment of dividends. One cannot invest directly in an index.
Small and medium-capitalization companies tend to have limited liquidity and greater price volatility than large-capitalization companies. Investments in foreign securities involve greater volatility and political, economic and currency risk and differences in accounting methods.
The Fund’s composition and sector weightings are shown as a percentage of the Fund’s total net assets. Portfolio composition and sector weightings are subject to change at any time and should not be considered a recommendation to buy or sell a particular security. Please refer to the Schedule of Investments within this Annual Report for additional portfolio information, including percentages of holdings.
HENNESSY FUNDS 1-800-966-4354
19
(This Page Intentionally Left Blank.)
WWW.HENNESSYFUNDS.COM
20
Schedule of Investments
HENNESSY CORNERSTONE GROWTH FUND
As of October 31, 2012
(% of Net Assets)
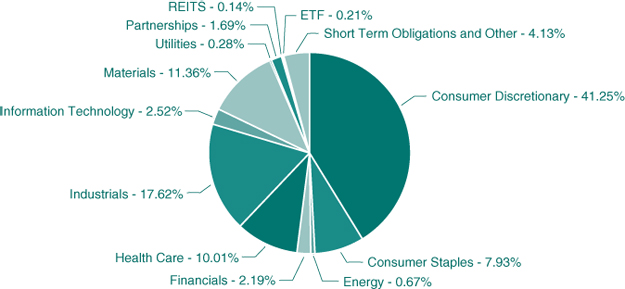
| TOP TEN EQUITY HOLDINGS | % net assets | |
| American Vanguard Corp. | 3.60% | |
| Cambrex Corp. | 2.80% | |
| Susser Holdings Corp. | 2.33% | |
| Lithia Motors, Inc. | 2.25% | |
| NewMarket Corp. | 2.23% | |
| Papa Johns International, Inc. | 2.11% | |
| DXP Enterprises, Inc. | 2.09% | |
| Pier 1 Imports, Inc. | 2.08% | |
| Metropolitan Health Networks, Inc. | 2.08% | |
| Leapfrog Enterprises, Inc. | 2.04% |
The holdings reflected include stocks that were previously held in the former FBR Small Cap Fund, which was reorganized into the Hennessy Cornerstone Growth Fund as of close of business on 10/26/12. These positions will be held until the customary rebalance of the Hennessy Cornerstone Growth portfolio, generally in the winter.
Note: For presentation purposes, the Fund has grouped some of the industry categories. For purposes of categorizing securities for compliance with Section 8(b)(1) of the Investment Company Act of 1940, the Fund uses more specific industry classifications.
HENNESSY FUNDS 1-800-966-4354
21
| COMMON STOCKS – 93.83% | Number of | % of | |||||||||||
| Shares | Value | Net Assets | |||||||||||
| Consumer Discretionary – 41.25% | |||||||||||||
| American Axle & Manufacturing | |||||||||||||
| Holdings, Inc. (a) | 25,000 | $ | 271,750 | 0.09 | % | ||||||||
| Arctic Cat, Inc. (a) | 140,200 | 5,085,054 | 1.68 | % | |||||||||
| Asbury Automotive Group, Inc. (a) | 6,000 | 190,320 | 0.06 | % | |||||||||
| Ascena Retail Group, Inc. (a) | 16,000 | 316,800 | 0.11 | % | |||||||||
| Bally Technologies, Inc. (a) | 4,000 | 199,680 | 0.07 | % | |||||||||
| Caribou Coffee, Inc. (a) | 270,900 | 3,242,673 | 1.07 | % | |||||||||
| Chico’s FAS, Inc. | 13,000 | 241,800 | 0.08 | % | |||||||||
| Churchill Downs, Inc. | 84,096 | 5,493,992 | 1.82 | % | |||||||||
| Crocs, Inc. (a) | 6,000 | 75,600 | 0.03 | % | |||||||||
| Dollar General Corp. (a) | 112,585 | 5,473,883 | 1.81 | % | |||||||||
| Dominos Pizza, Inc. | 143,600 | 5,833,032 | 1.93 | % | |||||||||
| Express, Inc. (a) | 6,000 | 66,780 | 0.02 | % | |||||||||
| Foot Locker, Inc. | 178,400 | 5,976,400 | 1.97 | % | |||||||||
| Genesco, Inc. (a) | 78,800 | 4,515,240 | 1.49 | % | |||||||||
| Group 1 Automotive, Inc. | 85,300 | 5,289,453 | 1.75 | % | |||||||||
| KB Home | 4,000 | 63,920 | 0.02 | % | |||||||||
| La-Z-Boy, Inc. | 344,300 | 5,584,546 | 1.84 | % | |||||||||
| Leapfrog Enterprises, Inc. (a) | 699,100 | 6,180,044 | 2.04 | % | |||||||||
| Lithia Motors, Inc. | 199,300 | 6,816,060 | 2.25 | % | |||||||||
| Macy’s, Inc. | 133,100 | 5,067,117 | 1.67 | % | |||||||||
| Mens Wearhouse, Inc. | 128,150 | 4,202,038 | 1.39 | % | |||||||||
| Oxford Industries, Inc. | 96,850 | 5,373,238 | 1.78 | % | |||||||||
| Papa Johns International, Inc. (a) | 119,900 | 6,393,068 | 2.11 | % | |||||||||
| Penn National Gaming, Inc. (a) | 12,000 | 485,160 | 0.16 | % | |||||||||
| Pier 1 Imports, Inc. | 309,100 | 6,305,640 | 2.08 | % | |||||||||
| Pool Corp. | 137,009 | 5,770,819 | 1.91 | % | |||||||||
| Ross Stores, Inc. | 91,840 | 5,597,648 | 1.85 | % | |||||||||
| Sally Beauty Holdings, Inc. (a) | 229,400 | 5,523,952 | 1.82 | % | |||||||||
| Select Comfort Corp. (a) | 4,000 | 111,320 | 0.04 | % | |||||||||
| Standard Motor Products, Inc. | 209,600 | 3,936,288 | 1.30 | % | |||||||||
| Standard Pacific Corp. (a) | 15,000 | 103,500 | 0.03 | % | |||||||||
| Steven Madden Ltd. (a) | 7,500 | 321,900 | 0.11 | % | |||||||||
| Sturm Ruger & Co, Inc. | 4,000 | 188,920 | 0.06 | % | |||||||||
| The Buckle, Inc. | 5,600 | 252,952 | 0.08 | % | |||||||||
| The Children’s Place Retail Stores, Inc. (a) | 3,000 | 175,290 | 0.06 | % | |||||||||
| The Finish Line, Inc. | 10,000 | 208,050 | 0.07 | % | |||||||||
| TJX Companies, Inc. | 138,030 | 5,746,189 | 1.90 | % | |||||||||
| Tractor Supply Co. | 56,100 | 5,399,064 | 1.78 | % | |||||||||
| Vitamin Shoppe, Inc. (a) | 2,500 | 143,100 | 0.05 | % | |||||||||
| VOXX International Corp. (a) | 369,000 | 2,295,180 | 0.76 | % | |||||||||
| Wolverine World Wide, Inc. | 8,000 | 334,960 | 0.11 | % | |||||||||
| 124,852,420 | 41.25 | % | |||||||||||
| Consumer Staples – 7.93% | |||||||||||||
| CVS Caremark Corp. | 110,800 | 5,141,120 | 1.70 | % | |||||||||
| Elizabeth Arden, Inc. (a) | 120,500 | 5,685,190 | 1.88 | % | |||||||||
| Hain Celestial Group, Inc. (a) | 2,500 | 144,500 | 0.05 | % | |||||||||
| Susser Holdings Corp. (a) | 196,800 | 7,072,992 | 2.33 | % | |||||||||
| Whole Foods Market, Inc. | 62,950 | 5,963,253 | 1.97 | % | |||||||||
| 24,007,055 | 7.93 | % | |||||||||||
| Energy – 0.67% | |||||||||||||
| Atwood Oceanics, Inc. (a) | 10,012 | 478,574 | 0.16 | % | |||||||||
| Comstock Resources, Inc. (a) | 8,000 | 136,960 | 0.04 | % | |||||||||
| Energy XXI (Bermuda) Ltd. | 9,000 | 297,900 | 0.10 | % | |||||||||
| Kodiak Oil & Gas Corp. (a) | 38,000 | 351,120 | 0.11 | % | |||||||||
| Oasis Petroleum, Inc. (a) | 13,000 | 381,810 | 0.13 | % | |||||||||
| Rosetta Resources, Inc. (a) | 4,000 | 184,160 | 0.06 | % | |||||||||
| Superior Energy Services, Inc. (a) | 10,000 | 203,300 | 0.07 | % | |||||||||
| 2,033,824 | 0.67 | % | |||||||||||
| Financials – 2.19% | |||||||||||||
| Associated Banc-Corp. | 28,000 | 360,920 | 0.12 | % | |||||||||
| BankUnited, Inc. | 12,000 | 284,520 | 0.09 | % | |||||||||
| Berkshire Hills Bancorp, Inc. | 10,000 | 234,800 | 0.08 | % | |||||||||
| Brookline Bancorp, Inc. | 59,729 | 506,502 | 0.17 | % | |||||||||
| Capitol Federal Financial | 29,454 | 350,797 | 0.12 | % | |||||||||
| Chicopee Bancorp, Inc. (a) | 19,139 | 286,894 | 0.09 | % | |||||||||
| CNO Financial Group, Inc. | 23,000 | 220,340 | 0.07 | % | |||||||||
| First Horizon National Corp. | 32,253 | 300,275 | 0.10 | % | |||||||||
| Fulton Financial Corp. | 30,200 | 293,544 | 0.10 | % | |||||||||
| Horace Mann Educators Corp. | 24,000 | 461,040 | 0.15 | % | |||||||||
| Independent Bank Corp. | 11,000 | 324,610 | 0.11 | % | |||||||||
| Investors Title Co. | 3,407 | 223,499 | 0.07 | % | |||||||||
| Newport Bancorp, Inc. (a) | 6,000 | 100,230 | 0.03 | % | |||||||||
| Peoples Federal Bancshares, Inc. | 9,000 | 153,450 | 0.05 | % | |||||||||
| SI Financial Group, Inc. | 7,300 | 80,300 | 0.03 | % | |||||||||
| Susquehanna Bancshares, Inc. | 34,000 | 352,580 | 0.12 | % | |||||||||
| Tower Group, Inc. | 18,000 | 324,360 | 0.11 | % | |||||||||
| United Financial Bancorp, Inc. | 48,877 | 751,240 | 0.25 | % | |||||||||
| Waddell & Reed Financial, Inc. | 24,000 | 799,920 | 0.26 | % | |||||||||
| Washington Federal, Inc. | 13,400 | 224,852 | 0.07 | % | |||||||||
| 6,634,673 | 2.19 | % | |||||||||||
| Health Care – 10.01% | |||||||||||||
| Abiomed, Inc. (a) | 8,000 | 158,560 | 0.05 | % | |||||||||
| Allscripts Healthcare Solutions, Inc. (a) | 16,000 | 206,720 | 0.07 | % | |||||||||
| athenahealth, Inc. (a) | 2,000 | 128,580 | 0.04 | % | |||||||||
| Cambrex Corp. (a) | 702,200 | 8,482,576 | 2.80 | % | |||||||||
| Centene Corp. (a) | 107,800 | 4,094,244 | 1.35 | % | |||||||||
| Cepheid, Inc. (a) | 10,000 | 303,100 | 0.10 | % | |||||||||
| Genomic Health, Inc. (a) | 2,000 | 62,500 | 0.02 | % | |||||||||
| Greenway Medical Technologies, Inc. (a) | 8,000 | 132,720 | 0.04 | % | |||||||||
| Health Management Associates, Inc. (a) | 16,000 | 116,800 | 0.04 | % | |||||||||
The accompanying notes are an integral part of these financial statements.
WWW.HENNESSYFUNDS.COM
22
| COMMON STOCKS | Number of | % of | |||||||||||
| Shares | Value | Net Assets | |||||||||||
| Health Care (Continued) | |||||||||||||
HMS Holdings Corp. (a) | 1,000 | $ | 23,090 | 0.01 | % | ||||||||
| Impax Laboratories, Inc. (a) | 15,000 | 318,750 | 0.11 | % | |||||||||
| Jazz Pharmaceuticals, Inc. (a) | 4,000 | 214,920 | 0.07 | % | |||||||||
| MAKO Surgical Corp. (a) | 1,000 | 15,150 | 0.01 | % | |||||||||
| MedAssets, Inc. (a) | 18,000 | 319,140 | 0.11 | % | |||||||||
| Medidata Solutions, Inc. (a) | 10,000 | 420,200 | 0.14 | % | |||||||||
| Metropolitan Health Networks, Inc. (a) | 574,614 | 6,280,531 | 2.08 | % | |||||||||
| Molina Healthcare, Inc. (a) | 150,800 | 3,780,556 | 1.25 | % | |||||||||
| Myriad Genetics, Inc. (a) | 9,000 | 235,530 | 0.08 | % | |||||||||
| NPS Pharmaceuticals, Inc. (a) | 6,000 | 55,440 | 0.02 | % | |||||||||
| Obagi Medical Products, Inc. (a) | 11,000 | 135,630 | 0.04 | % | |||||||||
| Orexigen Therapeutics, Inc. (a) | 12,000 | 63,960 | 0.02 | % | |||||||||
| Sarepta Therapeutics, Inc. (a) | 2,000 | 42,620 | 0.01 | % | |||||||||
| Seattle Genetics, Inc. (a) | 4,500 | 113,220 | 0.04 | % | |||||||||
| Sirona Dental Systems, Inc. (a) | 8,000 | 458,080 | 0.15 | % | |||||||||
| The Cooper Companies, Inc. | 2,000 | 191,960 | 0.06 | % | |||||||||
| VIVUS, Inc. (a) | 3,000 | 44,700 | 0.01 | % | |||||||||
| Wellcare Health Plans, Inc. (a) | 82,000 | 3,903,200 | 1.29 | % | |||||||||
| 30,302,477 | 10.01 | % | |||||||||||
| Industrials – 17.62% | |||||||||||||
| A.O. Smith Corp. | 10,000 | 607,700 | 0.20 | % | |||||||||
| Alaska Air Group, Inc. (a) | 6,000 | 229,440 | 0.08 | % | |||||||||
| American Woodmark Corp. (a) | 16,000 | 368,000 | 0.12 | % | |||||||||
| Atlas Air Worldwide Holdings, Inc. (a) | 5,000 | 274,950 | 0.09 | % | |||||||||
| Avis Budget Group, Inc. (a) | 28,000 | 462,840 | 0.15 | % | |||||||||
| Cintas Corp. | 125,300 | 5,238,793 | 1.73 | % | |||||||||
| DXP Enterprises Inc. (a) | 128,300 | 6,316,209 | 2.09 | % | |||||||||
| Dycom Industries, Inc. (a) | 205,600 | 2,927,744 | 0.97 | % | |||||||||
| Encore Capital Group, Inc. (a) | 12,000 | 348,000 | 0.11 | % | |||||||||
| Genesee & Wyoming, Inc., Class A (a) | 2,000 | 144,940 | 0.05 | % | |||||||||
| Innerworkings, Inc. (a) | 411,965 | 5,940,535 | 1.96 | % | |||||||||
| JetBlue Airways Corp. (a) | 50,000 | 264,500 | 0.09 | % | |||||||||
| Lennox International, Inc. | 6,000 | 300,300 | 0.10 | % | |||||||||
| Mueller Industries, Inc. | 98,050 | 4,294,590 | 1.42 | % | |||||||||
| Navigant Consulting, Inc. (a) | 348,500 | 3,620,915 | 1.20 | % | |||||||||
| Old Dominion Freight Line, Inc. (a) | 162,400 | 5,446,896 | 1.80 | % | |||||||||
| Primoris Services Corp. | 294,900 | 4,119,753 | 1.36 | % | |||||||||
| Roadrunner Transportation | |||||||||||||
| Systems, Inc. (a) | 16,000 | 278,880 | 0.09 | % | |||||||||
| Sauer-Danfoss, Inc. | 7,000 | 280,420 | 0.09 | % | |||||||||
| Sun Hydraulics Corp. | 10,000 | 266,400 | 0.09 | % | |||||||||
| Terex Corp. (a) | 20,000 | 451,000 | 0.15 | % | |||||||||
| The Manitowoc Co, Inc. | 15,000 | 213,750 | 0.07 | % | |||||||||
| Trex Co, Inc. (a) | 8,000 | 279,520 | 0.09 | % | |||||||||
| Triumph Group, Inc. | 73,800 | 4,827,996 | 1.59 | % | |||||||||
| United Rentals, Inc. (a) | 126,339 | 5,136,944 | 1.70 | % | |||||||||
| US Airways Group, Inc. (a) | 18,000 | 219,240 | 0.07 | % | |||||||||
| USG Corp. (a) | 8,000 | 213,680 | 0.07 | % | |||||||||
| Werner Enterprises, Inc. | 11,250 | 260,550 | 0.09 | % | |||||||||
| 53,334,485 | 17.62 | % | |||||||||||
| Information Technology – 2.52% | |||||||||||||
| Aruba Networks, Inc. (a) | 6,500 | 118,105 | 0.04 | % | |||||||||
| Brocade Communications | |||||||||||||
| Systems, Inc. (a) | 25,100 | 133,030 | 0.04 | % | |||||||||
| Cirrus Logic, Inc. (a) | 6,000 | 244,560 | 0.08 | % | |||||||||
| Comm Vault Systems, Inc. (a) | 3,000 | 187,410 | 0.06 | % | |||||||||
| Compuware Corp. (a) | 18,000 | 155,880 | 0.05 | % | |||||||||
| Fusion-io, Inc. (a) | 1,000 | 23,600 | 0.01 | % | |||||||||
| Guidewire Software, Inc. (a) | 2,000 | 61,280 | 0.02 | % | |||||||||
| Jack Henry & Associates, Inc. | 18,000 | 684,000 | 0.23 | % | |||||||||
| MKS Instrument, Inc. | 9,000 | 212,670 | 0.07 | % | |||||||||
| Nanometrics, Inc. (a) | 4,000 | 55,040 | 0.02 | % | |||||||||
| Netgear, Inc. (a) | 115,000 | 4,083,650 | 1.35 | % | |||||||||
| OmniVision Technologies, Inc. (a) | 2,000 | 28,600 | 0.01 | % | |||||||||
| Open Text Corp. (a) | 5,175 | 278,881 | 0.09 | % | |||||||||
| Qlik Technologies, Inc. (a) | 4,600 | 84,686 | 0.03 | % | |||||||||
| Radware Ltd. (a) | 6,000 | 196,800 | 0.06 | % | |||||||||
| Sourcefire, Inc. (a) | 7,000 | 299,530 | 0.10 | % | |||||||||
| Splunk, Inc. (a) | 2,000 | 56,100 | 0.02 | % | |||||||||
| The Ultimate Software Group, Inc. (a) | 1,800 | 182,448 | 0.06 | % | |||||||||
| TriQuint Semiconductor, Inc. (a) | 18,000 | 84,600 | 0.03 | % | |||||||||
| Wex, Inc. (a) | 6,000 | 442,680 | 0.15 | % | |||||||||
| 7,613,550 | 2.52 | % | |||||||||||
| Materials – 11.36% | |||||||||||||
| American Vanguard Corp. | 305,300 | 10,908,369 | 3.60 | % | |||||||||
| Cytec Inds, Inc. | 3,000 | 206,460 | 0.07 | % | |||||||||
| H.B. Fuller Co. | 161,600 | 4,912,640 | 1.62 | % | |||||||||
| Huntsman Corp. | 7,000 | 105,280 | 0.04 | % | |||||||||
| Innospec, Inc. (a) | 10,000 | 323,800 | 0.11 | % | |||||||||
| Kaiser Aluminum Corp. | 3,000 | 181,740 | 0.06 | % | |||||||||
| Kraton Performance Polymers, Inc. (a) | 7,000 | 152,740 | 0.05 | % | |||||||||
| Neenah Paper, Inc. | 192,205 | 4,978,109 | 1.64 | % | |||||||||
| NewMarket Corp. | 24,900 | 6,755,619 | 2.23 | % | |||||||||
| PolyOne Corp. | 14,000 | 265,020 | 0.09 | % | |||||||||
| W.R. Grace & Co. (a) | 87,150 | 5,591,544 | 1.85 | % | |||||||||
| 34,381,321 | 11.36 | % | |||||||||||
| Utilities – 0.28% | �� | ||||||||||||
| ALLETE, Inc. | 10,400 | 432,848 | 0.14 | % | |||||||||
| Portland General Electric Co. | 15,400 | 421,960 | 0.14 | % | |||||||||
| 854,808 | 0.28 | % | |||||||||||
| Total Common Stocks | |||||||||||||
| (Cost $255,299,237) | 284,014,613 | 93.83 | % | ||||||||||
The accompanying notes are an integral part of these financial statements.
HENNESSY FUNDS 1-800-966-4354
23
| RIGHTS – 0.00% | Number of | % of | |||||||||||
| Shares | Value | Net Assets | |||||||||||
| Forest Laboratories, Inc. (a) (b) | 5,500 | $ | 5,225 | 0.00 | % | ||||||||
| Total Rights | |||||||||||||
| (Cost $0) | 5,225 | 0.00 | % | ||||||||||
| PARTNERSHIPS – 1.69% | |||||||||||||
| Energy – 1.69% | |||||||||||||
| Oneok Partners L.P. | 83,900 | 5,113,705 | 1.69 | % | |||||||||
| Total Partnerships | |||||||||||||
| (Cost $4,781,651) | 5,113,705 | 1.69 | % | ||||||||||
| REITS – 0.14% | |||||||||||||
| Potlatch Corp. | 4,000 | 153,920 | 0.05 | % | |||||||||
| Sunstone Hotel Investors, Inc. (a) | 28,000 | 276,640 | 0.09 | % | |||||||||
| 430,560 | 0.14 | % | |||||||||||
Total Reits (Cost $421,475) | 430,560 | 0.14 | % | ||||||||||
| EXCHANGE TRADED FUNDS – 0.21% | |||||||||||||
| ishares Russell 2000 Index | 8,000 | 649,920 | 0.21 | % | |||||||||
| Total Exchange Traded Funds | |||||||||||||
| (Cost $677,334) | 649,920 | 0.21 | % | ||||||||||
| SHORT-TERM INVESTMENTS – 3.67% | |||||||||||||
| Money Market Fund – 3.67% | |||||||||||||
| Fidelity Government Portfolio – | |||||||||||||
| Institutional Class, 0.01% (c) | 11,098,776 | 11,098,776 | 3.67 | % | |||||||||
| Total Money Market Fund | |||||||||||||
| (Cost $11,098,776) | 11,098,776 | 3.67 | % | ||||||||||
| Total Short-Term Investments | |||||||||||||
| (Cost $11,098,776) | 11,098,776 | 3.67 | % | ||||||||||
| Total Investments | |||||||||||||
| (Cost $272,278,473) – 99.54% | 301,312,799 | 99.54 | % | ||||||||||
| Other Assets in Excess | |||||||||||||
| of Liabilities – 0.46% | 1,398,120 | 0.46 | % | ||||||||||
TOTAL NET ASSETS – 100.00% | $ | 302,710,919 | 100.00 | % | |||||||||
Percentages are stated as a percent of net assets.
(a)Non-income producing security.
(b)Security is fair valued.
(c)The rate listed is the fund’s 7-day yield as of October 31, 2012.
Summary of Fair Value Exposure at October 31, 2012
The following is a summary of the inputs used to value the Fund’s net assets as of October 31, 2012 (See Note 3 in the accompanying notes to the financial statements):
| Common Stock | Level 1 | Level 2 | Level 3 | Total | |||||||||||||
| Consumer Discretionary | $ | 124,852,420 | $ | — | $ | — | $ | 124,852,420 | |||||||||
| Consumer Staples | 24,007,055 | — | — | 24,007,055 | |||||||||||||
| Energy | 2,033,824 | — | — | 2,033,824 | |||||||||||||
| Financials | 6,534,443 | 100,230 | — | 6,634,673 | |||||||||||||
| Health Care | 30,302,477 | — | — | 30,302,477 | |||||||||||||
| Industrials | 53,334,485 | — | — | 53,334,485 | |||||||||||||
| Information Technology | 7,613,550 | — | — | 7,613,550 | |||||||||||||
| Materials | 34,381,321 | — | — | 34,381,321 | |||||||||||||
| Utilities | 854,808 | — | — | 854,808 | |||||||||||||
| Total Common Stock | $ | 283,914,383 | $ | 100,230 | $ | — | $ | 284,014,613 | |||||||||
| Rights | $ | — | $ | — | $ | 5,225 | $ | 5,225 | |||||||||
| Partnerships | |||||||||||||||||
| Energy | $ | 5,113,705 | $ | — | $ | — | $ | 5,113,705 | |||||||||
| Total Partnerships | $ | 5,113,705 | $ | — | $ | — | $ | 5,113,705 | |||||||||
| REITS | |||||||||||||||||
| Financials | $ | 430,560 | $ | — | $ | — | $ | 430,560 | |||||||||
| Total REITS | $ | 430,560 | $ | — | $ | — | $ | 430,560 | |||||||||
| Exchange Traded Funds | |||||||||||||||||
| ishares Russell 2000 Index | $ | 649,920 | $ | — | $ | — | $ | 649,920 | |||||||||
| Total Exchange Traded Funds | $ | 649,920 | $ | — | $ | — | $ | 649,920 | |||||||||
| Short-Term Investments | |||||||||||||||||
| Money Market Funds | $ | 11,098,776 | $ | — | $ | — | $ | 11,098,776 | |||||||||
| Total Short-Term Investments | $ | 11,098,776 | $ | — | $ | — | $ | 11,098,776 | |||||||||
| Total Investments in Securities | $ | 301,207,344 | $ | 100,230 | $ | 5,225 | $ | 301,312,799 | |||||||||
Transfers between levels are recognized at the end of the reporting period. During the period ended October 31, 2012, the Fund recognized no transfers between levels.
The accompanying notes are an integral part of these financial statements.
WWW.HENNESSYFUNDS.COM
24
Level 3 Reconciliation Disclosure
Following is a reconciliation of level 3 assets for which significant unobservable inputs were used to determine fair value.
| Common Stock | |||||
| Balance as of 10/31/11 | $ | — | |||
| Accrued discounts/premiums | — | ||||
| Realized gain (loss) | — | ||||
| Change in unrealized appreciation (depreciation) | — | ||||
| Purchases* | 5,225 | ||||
| (Sales) | — | ||||
| Transfer in and/or out of Level 3 | — | ||||
| Balance as of 10/31/12 | $ | 5,225 | |||
| Net in unrealized appreciation/depreciation during | |||||
| the year for level 3 investments held at October 31, 2012 | $ | 5,225 | |||
* Acquired in merger.
The accompanying notes are an integral part of these financial statements.
HENNESSY FUNDS 1-800-966-4354
25
HENNESSY CORNERSTONE MID CAP 30 FUND
(formerly Hennessy Focus 30 Fund)
As of October 31, 2012
(% of Net Assets)

| TOP TEN EQUITY HOLDINGS | % net assets | |
| Sunoco Logistics Partners L.P. | 3.93% | |
| LKQ Corp. | 3.85% | |
| Tesoro Corp. | 3.85% | |
| HSN, Inc. | 3.84% | |
| Ross Stores, Inc. | 3.68% | |
| Petsmart, Inc. | 3.66% | |
| Sally Beauty Holdings, Inc. | 3.48% | |
| Dominos Pizza, Inc. | 3.38% | |
| Oneok Partners L.P. | 3.31% | |
| Triumph Group, Inc. | 3.30% |
The holdings reflected include stocks that were previously held in the former FBR Mid Cap Fund, which was reorganized into the Hennessy Focus 30 Fund (now known as the Hennessy Cornerstone Mid Cap 30 Fund) as of close of business on 10/26/12. These positions were held until the customary rebalance of the Hennessy Cornerstone Mid Cap 30 portfolio, which took place subsequent to the fiscal year end in the fall of 2012.
Note: For presentation purposes, the Fund has grouped some of the industry categories. For purposes of categorizing securities for compliance with Section 8(b)(1) of the Investment Company Act of 1940, the Fund uses more specific industry classifications.
WWW.HENNESSYFUNDS.COM
26
| COMMON STOCKS – 92.96% | Number of | % of | |||||||||||
| Shares | Value | Net Assets | |||||||||||
| Consumer Discretionary – 31.81% | |||||||||||||
| Abercrombie & Fitch Co., Class A | 2,815 | $ | 86,083 | 0.05 | % | ||||||||
| Bed Bath & Beyond, Inc. (a) | 3,900 | 224,952 | 0.12 | % | |||||||||
| Big Lots, Inc. (a) | 2,980 | 86,807 | 0.05 | % | |||||||||
| Dominos Pizza, Inc. | 155,800 | 6,328,596 | 3.38 | % | |||||||||
| Family Dollar Stores, Inc. | 83,900 | 5,534,044 | 2.95 | % | |||||||||
| Genesco, Inc. (a) | 85,400 | 4,893,420 | 2.61 | % | |||||||||
| Genuine Parts Co. | 90,100 | 5,638,458 | 3.01 | % | |||||||||
| HSN, Inc. | 138,300 | 7,194,366 | 3.84 | % | |||||||||
| LKQ Corp. (a) | 345,700 | 7,221,673 | 3.85 | % | |||||||||
| Magna International, Inc. | 10,930 | 485,401 | 0.26 | % | |||||||||
| Mattel, Inc. | 12,824 | 471,667 | 0.25 | % | |||||||||
| Petsmart, Inc. | 103,500 | 6,871,365 | 3.66 | % | |||||||||
| Ross Stores, Inc. | 113,300 | 6,905,635 | 3.68 | % | |||||||||
| Sally Beauty Holdings, Inc. (a) | 270,900 | 6,523,272 | 3.48 | % | |||||||||
| Tiffany & Co. | 8,735 | 552,227 | 0.29 | % | |||||||||
| Tupperware Brands Corp. | 1,650 | 97,515 | 0.05 | % | |||||||||
| V.F. Corp. | 2,229 | 348,794 | 0.19 | % | |||||||||
| Williams-Sonoma, Inc. | 3,700 | 171,051 | 0.09 | % | |||||||||
| 59,635,326 | 31.81 | % | |||||||||||
| Consumer Staples – 9.13% | |||||||||||||
| Bunge Ltd. | 3,022 | 214,652 | 0.11 | % | |||||||||
| Casey’s General Stores, Inc. | 103,900 | 5,356,045 | 2.86 | % | |||||||||
| Dr. Pepper Snapple Group, Inc. | 123,200 | 5,279,120 | 2.82 | % | |||||||||
| Monster Beverage Corp. (a) | 8,000 | 357,360 | 0.19 | % | |||||||||
| PriceSmart, Inc. | 68,400 | 5,676,516 | 3.03 | % | |||||||||
| Tyson Foods, Inc., Class A | 13,275 | 223,153 | 0.12 | % | |||||||||
| 17,106,846 | 9.13 | % | |||||||||||
| Energy – 6.86% | |||||||||||||
| Energen Corp. | 3,277 | 152,872 | 0.08 | % | |||||||||
| Ensco PLC – ADR | 2,335 | 135,010 | 0.07 | % | |||||||||
| Helmerich & Payne, Inc. | 2,640 | 126,192 | 0.07 | % | |||||||||
| Nabors Industries Ltd. (a) | 7,800 | 105,222 | 0.06 | % | |||||||||
| Newfield Exploration Co. (a) | 2,925 | 79,326 | 0.04 | % | |||||||||
| Pioneer Natural Resources Co. | 2,425 | 256,201 | 0.14 | % | |||||||||
| Plains Exploration & Production Co. (a) | 2,900 | 103,414 | 0.05 | % | |||||||||
| Rowan Companies, Inc. (a) | 3,750 | 118,913 | 0.06 | % | |||||||||
| Tesoro Corp. | 191,400 | 7,217,694 | 3.85 | % | |||||||||
| Tidewater, Inc. | 2,750 | 130,652 | 0.07 | % | |||||||||
| World Fuel Services Corp. | 127,900 | 4,438,130 | 2.37 | % | |||||||||
| 12,863,626 | 6.86 | % | |||||||||||
| Financials – 1.79% | |||||||||||||
| Comerica, Inc. | 6,375 | 190,039 | 0.10 | % | |||||||||
| Fifth Third Bancorp | 17,900 | 260,087 | 0.14 | % | |||||||||
| First Niagara Financial Group, Inc. | 10,800 | 89,424 | 0.05 | % | |||||||||
| KeyCorp | 26,950 | 226,919 | 0.12 | % | |||||||||
| M&T Bank Corp. | 2,546 | 265,039 | 0.14 | % | |||||||||
| New York Community Bancorp, Inc. | 11,785 | 163,340 | 0.09 | % | |||||||||
| People’s United Financial, Inc. | 10,250 | 123,307 | 0.07 | % | |||||||||
| Raymond James Financial, Inc. | 8,700 | 331,818 | 0.18 | % | |||||||||
| Regions Financial Corp. | 32,200 | 209,944 | 0.11 | % | |||||||||
| Reinsurance Group of America, Inc. | 4,500 | 238,140 | 0.13 | % | |||||||||
| SEI Investments Co. | 15,450 | 338,046 | 0.18 | % | |||||||||
| T. Rowe Price Group, Inc. | 6,821 | 442,956 | 0.23 | % | |||||||||
| W.R. Berkley Corp. | 6,800 | 264,452 | 0.14 | % | |||||||||
| Zions Bancorporation | 9,600 | 206,112 | 0.11 | % | |||||||||
| 3,349,623 | 1.79 | % | |||||||||||
| Health Care – 0.78% | |||||||||||||
| C.R. Bard, Inc. | 2,446 | 235,281 | 0.12 | % | |||||||||
| Covance, Inc. (a) | 2,600 | 126,646 | 0.07 | % | |||||||||
| Endo Pharmaceuticals Holdings, Inc. (a) | 9,050 | 259,373 | 0.14 | % | |||||||||
| Forest Laboratories, Inc. (a) | 6,438 | 217,025 | 0.12 | % | |||||||||
| Humana, Inc. | 1,400 | 103,978 | 0.05 | % | |||||||||
| Techne Corp. | 3,385 | 228,014 | 0.12 | % | |||||||||
| Varian Medical Systems, Inc. (a) | 4,444 | 296,681 | 0.16 | % | |||||||||
| 1,466,998 | 0.78 | % | |||||||||||
| Industrials – 12.51% | |||||||||||||
| Copart, Inc. (a) | 14,970 | 430,986 | 0.23 | % | |||||||||
| Kansas City Southern | 5,950 | 478,737 | 0.26 | % | |||||||||
| Kirby Corp. (a) | 3,700 | 212,676 | 0.11 | % | |||||||||
| MSC Industrial Direct | |||||||||||||
| Company, Inc., Class A | 2,800 | 208,880 | 0.11 | % | |||||||||
| Mueller Industries, Inc. | 111,000 | 4,861,800 | 2.59 | % | |||||||||
| Pall Corp. | 7,195 | 452,997 | 0.24 | % | |||||||||
| Roper Industries, Inc. | 4,592 | 501,309 | 0.27 | % | |||||||||
| Spirit AeroSystems | |||||||||||||
| Holdings, Inc., Class A (a) | 10,300 | 160,989 | 0.09 | % | |||||||||
| Teledyne Technologies, Inc. (a) | 90,600 | 5,801,118 | 3.09 | % | |||||||||
| Towers Watson & Co. | 77,332 | 4,153,502 | 2.22 | % | |||||||||
| Triumph Group, Inc. | 94,600 | 6,188,732 | 3.30 | % | |||||||||
| 23,451,726 | 12.51 | % | |||||||||||
| Information Technology – 3.60% | |||||||||||||
| Activision Blizzard, Inc. | 23,968 | 261,012 | 0.14 | % | |||||||||
| Check Point Software | |||||||||||||
| Technologies Ltd. (a) | 8,403 | 374,186 | 0.20 | % | |||||||||
| Dolby Laboratories, Inc., Class A (a) | 2,825 | 89,242 | 0.05 | % | |||||||||
| FactSet Research Systems, Inc. | 3,797 | 343,818 | 0.18 | % | |||||||||
| FLIR Systems, Inc. | 4,575 | 88,892 | 0.05 | % | |||||||||
| Jabil Circuit, Inc. | 247,400 | 4,289,916 | 2.29 | % | |||||||||
| Microchip Technology, Inc. | 4,900 | 153,615 | 0.08 | % | |||||||||
| Paychex, Inc. | 9,575 | 310,517 | 0.16 | % | |||||||||
| SanDisk Corp. (a) | 3,400 | 141,984 | 0.07 | % | |||||||||
| Seagate Technology PLC | 6,700 | 183,044 | 0.10 | % | |||||||||
The accompanying notes are an integral part of these financial statements.
HENNESSY FUNDS 1-800-966-4354
27
| COMMON STOCKS | Number of | % of | |||||||||||
| Shares | Value | Net Assets | |||||||||||
| Information Technology (Continued) | |||||||||||||
| Siliconware Precision | |||||||||||||
| Industries Co. Ltd. ADR – ADR | 30,900 | $ | 148,320 | 0.08 | % | ||||||||
| Western Digital Corp. | 4,900 | 167,727 | 0.09 | % | |||||||||
| Xilinx, Inc. | 6,200 | 203,112 | 0.11 | % | |||||||||
| 6,755,385 | 3.60 | % | |||||||||||
| Materials – 0.15% | |||||||||||||
| Sigma-Aldrich Corp. | 3,984 | 279,438 | 0.15 | % | |||||||||
| Telecommunication Services – 0.11% | |||||||||||||
| Telephone & Data Systems, Inc. | 7,880 | 195,975 | 0.11 | % | |||||||||
| Utilities – 26.22% | |||||||||||||
| Alliant Energy Corp. | 119,100 | 5,323,770 | 2.84 | % | |||||||||
| Ameren Corp. | 7,300 | 240,024 | 0.13 | % | |||||||||
| Centerpoint Energy, Inc. | 233,800 | 5,066,446 | 2.70 | % | |||||||||
| CMS Energy Corp. | 235,900 | 5,737,088 | 3.06 | % | |||||||||
| New Jersey Resources Corp. | 107,700 | 4,788,342 | 2.55 | % | |||||||||
| NiSource, Inc. | 217,300 | 5,534,631 | 2.95 | % | |||||||||
| NRG Energy, Inc. | 12,500 | 269,500 | 0.14 | % | |||||||||
| Pinnacle West Capital Corp. | 106,700 | 5,651,899 | 3.02 | % | |||||||||
| Scana Corp. | 116,200 | 5,703,096 | 3.04 | % | |||||||||
| UIL Holdings Corp. | 146,400 | 5,295,288 | 2.83 | % | |||||||||
| Westar Energy, Inc. | 186,650 | 5,543,505 | 2.96 | % | |||||||||
| 49,153,589 | 26.22 | % | |||||||||||
| Total Common Stocks | |||||||||||||
| (Cost $150,891,239) | 174,258,532 | 92.96 | % | ||||||||||
| PARTNERSHIPS – 7.24% | |||||||||||||
| Energy – 7.24% | |||||||||||||
| Oneok Partners L.P. | 101,800 | 6,204,710 | 3.31 | % | |||||||||
| Sunoco Logistics Partners L.P. | 150,400 | 7,371,104 | 3.93 | % | |||||||||
| 13,575,814 | 7.24 | % | |||||||||||
Total Partnerships (Cost $9,490,863) | 13,575,814 | 7.24 | % | ||||||||||
| SHORT-TERM INVESTMENTS – 1.20% | |||||||||||||
| Money Market Fund – 1.20% | |||||||||||||
| Fidelity Government Portfolio – | |||||||||||||
| Institutional Class, 0.01% (b) | 2,256,267 | 2,256,267 | 1.20 | % | |||||||||
| Total Money Market Fund | |||||||||||||
| (Cost $2,256,267) | 2,256,267 | 1.20 | % | ||||||||||
| Total Short-Term Investments | |||||||||||||
| (Cost $2,256,267) | 2,256,267 | 1.20 | % | ||||||||||
| Total Investments | |||||||||||||
| (Cost $162,638,369) – 101.40% | 190,090,613 | 101.40 | % | ||||||||||
| Liabilities in Excess of | |||||||||||||
| Other Assets – (1.40)% | (2,618,963 | ) | (1.40 | )% | |||||||||
TOTAL NET ASSETS – 100.00% | $ | 187,471,650 | 100.00 | % | |||||||||
Percentages are stated as a percent of net assets.
(a)Non-income producing security.
(b)The rate listed is the fund’s 7-day yield as of October 31, 2012.
ADR – American Depositary Receipt
Summary of Fair Value Exposure at October 31, 2012
The following is a summary of the inputs used to value the Fund’s net assets as of October 31, 2012 (See Note 3 in the accompanying notes to the financial statements):
| Common Stock | Level 1 | Level 2 | Level 3 | Total | |||||||||||||
| Consumer Discretionary | $ | 59,635,326 | $ | — | $ | — | $ | 59,635,326 | |||||||||
| Consumer Staples | 17,106,846 | — | — | 17,106,846 | |||||||||||||
| Energy | 12,863,626 | — | — | 12,863,626 | |||||||||||||
| Financials | 3,349,623 | — | — | 3,349,623 | |||||||||||||
| Health Care | 1,466,998 | — | — | 1,466,998 | |||||||||||||
| Industrials | 23,451,726 | — | — | 23,451,726 | |||||||||||||
| Information Technology | 6,755,385 | — | — | 6,755,385 | |||||||||||||
| Materials | 279,438 | — | — | 279,438 | |||||||||||||
| Telecommunication Services | 195,975 | — | — | 195,975 | |||||||||||||
| Utilities | 49,153,589 | — | — | 49,153,589 | |||||||||||||
| Total Common Stock | $ | 174,258,532 | $ | — | $ | — | $ | 174,258,532 | |||||||||
| Partnerships | |||||||||||||||||
| Energy | $ | 13,575,814 | — | — | $ | 13,575,814 | |||||||||||
| Short-Term Investments | |||||||||||||||||
| Money Market Funds | $ | 2,256,267 | $ | — | $ | — | $ | 2,256,267 | |||||||||
| Total Short-Term Investments | $ | 2,256,267 | $ | — | $ | — | $ | 2,256,267 | |||||||||
| Total Investments in Securities | $ | 190,090,613 | $ | — | $ | — | $ | 190,090,613 | |||||||||
Transfers between levels are recognized at the end of the reporting period. During the period ended October 31, 2012, the Fund recognized no transfers between levels.
The accompanying notes are an integral part of these financial statements.
WWW.HENNESSYFUNDS.COM
28
HENNESSY CORNERSTONE LARGE GROWTH FUND
As of October 31, 2012
(% of Net Assets)
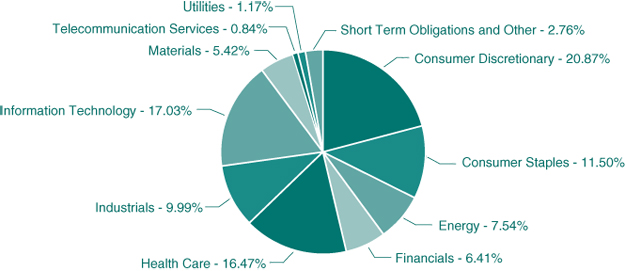
| TOP TEN EQUITY HOLDINGS | % net assets | |
| Gilead Sciences, Inc. | 2.66% | |
| Eli Lilly & Co. | 2.33% | |
| The Gap, Inc. | 2.13% | |
| TJX Companies, Inc. | 2.12% | |
| International Business Machines Corp. | 2.09% | |
| Microsoft Corp. | 2.01% | |
| Mattel, Inc. | 1.90% | |
| Wal-Mart Stores, Inc. | 1.85% | |
| Intel Corp. | 1.79% | |
| Kimberly Clark Corp. | 1.69% |
The holdings reflected include stocks that were previously held in he former FBR Large Cap Fund, which was reorganized into the Hennessy Cornerstone Large Growth Fund as of close of business on 10/26/12. These positions will be held until the customary rebalance of the Hennessy Cornerstone Large Growth portfolio, generally in the winter.
Note: For presentation purposes, the Fund has grouped some of the industry categories. For purposes of categorizing securities for compliance with Section 8(b)(1) of the Investment Company Act of 1940, the Fund uses more specific industry classifications.
HENNESSY FUNDS 1-800-966-4354
29
| COMMON STOCKS – 97.24% | Number of | % of | |||||||||||
| Shares | Value | Net Assets | |||||||||||
| Consumer Discretionary – 20.87% | |||||||||||||
| Advance Auto Parts, Inc. | 21,800 | $ | 1,546,492 | 1.41 | % | ||||||||
| Amazon.com, Inc. (a) | 1,000 | 232,820 | 0.21 | % | |||||||||
| AMC Networks, Inc. (a) | 10,625 | 496,400 | 0.45 | % | |||||||||
| Apollo Group, Inc. (a) | 35,800 | 718,864 | 0.65 | % | |||||||||
| Autoliv, Inc. | 19,400 | 1,117,440 | 1.02 | % | |||||||||
| Bed Bath & Beyond, Inc. (a) | 5,800 | 334,544 | 0.30 | % | |||||||||
| Best Buy Co., Inc. | 49,200 | 748,332 | 0.68 | % | |||||||||
| Cablevision Systems Corp. | 31,900 | 555,698 | 0.51 | % | |||||||||
| Coach, Inc. | 8,000 | 448,400 | 0.41 | % | |||||||||
| DIRECTV (a) | 30,200 | 1,543,522 | 1.41 | % | |||||||||
| Dish Network Corp. | 51,100 | 1,820,693 | 1.66 | % | |||||||||
| Genuine Parts Co. | 9,700 | 607,026 | 0.55 | % | |||||||||
| Guess?, Inc. | 9,400 | 232,932 | 0.21 | % | |||||||||
| Kohl’s Corp. | 11,700 | 623,376 | 0.57 | % | |||||||||
| Limited Brands, Inc. | 35,700 | 1,709,673 | 1.56 | % | |||||||||
| Mattel, Inc. | 56,600 | 2,081,748 | 1.90 | % | |||||||||
| Nordstrom, Inc. | 30,700 | 1,742,839 | 1.59 | % | |||||||||
| The Gap, Inc. | 65,500 | 2,339,660 | 2.13 | % | |||||||||
| Tiffany & Co. | 7,500 | 474,150 | 0.43 | % | |||||||||
| TJX Companies, Inc. | 56,000 | 2,331,280 | 2.12 | % | |||||||||
| TRW Automotive Holdings Corp. (a) | 25,900 | 1,204,609 | 1.10 | % | |||||||||
| 22,910,498 | 20.87 | % | |||||||||||
| Consumer Staples – 11.50% | |||||||||||||
| Campbell Soup Co. | 44,500 | 1,569,515 | 1.43 | % | |||||||||
| General Mills, Inc. | 38,600 | 1,547,088 | 1.41 | % | |||||||||
| Hormel Foods Corp. | 14,900 | 439,997 | 0.40 | % | |||||||||
| Kimberly Clark Corp. | 22,200 | 1,852,590 | 1.69 | % | |||||||||
| Pepsico, Inc. | 4,000 | 276,960 | 0.25 | % | |||||||||
| Procter & Gamble Co. | 7,800 | 540,072 | 0.49 | % | |||||||||
| Sysco Corp. | 48,100 | 1,494,467 | 1.36 | % | |||||||||
| The Coca-Cola Co. | 10,000 | 371,800 | 0.34 | % | |||||||||
| The Estee Lauder | |||||||||||||
| Companies, Inc., Class A | 9,600 | 591,552 | 0.54 | % | |||||||||
| Unilever PLC ADR – ADR | 15,000 | 559,350 | 0.51 | % | |||||||||
| Walgreen Co. | 38,200 | 1,345,786 | 1.23 | % | |||||||||
| Wal-Mart Stores, Inc. | 27,100 | 2,033,042 | 1.85 | % | |||||||||
| 12,622,219 | 11.50 | % | |||||||||||
| Energy – 7.54% | |||||||||||||
| Apache Corp. | 4,202 | 347,716 | 0.32 | % | |||||||||
| Chevron Corp. | 14,600 | 1,609,066 | 1.47 | % | |||||||||
| Cimarex Energy Co. | 16,200 | 926,316 | 0.84 | % | |||||||||
| Devon Energy Corp. | 8,800 | 512,248 | 0.47 | % | |||||||||
| Diamond Offshore Drilling, Inc. | 21,400 | 1,481,736 | 1.35 | % | |||||||||
| Exxon Mobil Corp. | 18,500 | 1,686,645 | 1.53 | % | |||||||||
| Halliburton Co. | 11,000 | 355,190 | 0.32 | % | |||||||||
| Hess Corp. | 9,000 | 470,340 | 0.43 | % | |||||||||
| Murphy Oil Corp. | 8,200 | 492,000 | 0.45 | % | |||||||||
| Range Resources Corp. | 6,000 | 392,160 | 0.36 | % | |||||||||
| 8,273,417 | 7.54 | % | |||||||||||
| Financials – 6.41% | |||||||||||||
| Bank of America Corp. | 60,000 | 559,200 | 0.51 | % | |||||||||
| Capital One Financial Corp. | 5,000 | 300,850 | 0.28 | % | |||||||||
| Discover Financial Services | 12,000 | 492,000 | 0.45 | % | |||||||||
| Franklin Resources, Inc. | 3,575 | 456,885 | 0.42 | % | |||||||||
| J.P. Morgan Chase & Co. | 13,725 | 572,058 | 0.52 | % | |||||||||
| Prudential Financial, Inc. | 6,200 | 353,710 | 0.32 | % | |||||||||
| T. Rowe Price Group, Inc. | 9,000 | 584,460 | 0.53 | % | |||||||||
| The Chubb Corp. | 5,800 | 446,484 | 0.41 | % | |||||||||
| The PNC Financial Services Group, Inc. | 6,000 | 349,140 | 0.32 | % | |||||||||
| The Progressive Corp. | 70,000 | 1,561,000 | 1.42 | % | |||||||||
| Torchmark Corp. | 4,400 | 222,596 | 0.20 | % | |||||||||
| U.S. Bancorp (b) | 17,000 | 564,570 | 0.51 | % | |||||||||
| Wells Fargo & Co. | 17,000 | 572,730 | 0.52 | % | |||||||||
| 7,035,683 | 6.41 | % | |||||||||||
| Health Care – 16.47% | |||||||||||||
| Abbott Laboratories | 8,640 | 566,093 | 0.52 | % | |||||||||
| Aetna, Inc. | 35,000 | 1,529,500 | 1.39 | % | |||||||||
| Baxter International, Inc. | 8,475 | 530,789 | 0.48 | % | |||||||||
| C.R. Bard, Inc. | 2,970 | 285,685 | 0.26 | % | |||||||||
| Cerner Corp. (a) | 8,200 | 624,758 | 0.57 | % | |||||||||
| CIGNA Corp. | 31,400 | 1,601,400 | 1.46 | % | |||||||||
| Eli Lilly & Co. | 52,600 | 2,557,938 | 2.33 | % | |||||||||
| Forest Laboratories, Inc. (a) | 44,500 | 1,500,095 | 1.37 | % | |||||||||
| Gilead Sciences, Inc. (a) | 43,400 | 2,914,744 | 2.66 | % | |||||||||
| HCA Holdings, Inc. | 43,300 | 1,230,153 | 1.12 | % | |||||||||
| Humana, Inc. | 19,100 | 1,418,557 | 1.29 | % | |||||||||
| Merck & Co., Inc. | 11,400 | 520,182 | 0.47 | % | |||||||||
| Novartis AG – ADR | 8,700 | 526,002 | 0.48 | % | |||||||||
| Stryker Corp. | 10,700 | 562,820 | 0.51 | % | |||||||||
| UnitedHealth Group, Inc. | 29,900 | 1,674,400 | 1.53 | % | |||||||||
| Wellpoint, Inc. | 600 | 36,768 | 0.03 | % | |||||||||
| 18,079,884 | 16.47 | % | |||||||||||
| Industrials – 9.99% | |||||||||||||
| 3M Co. | 9,600 | 840,960 | 0.77 | % | |||||||||
| Cummins, Inc. | 6,000 | 561,480 | 0.51 | % | |||||||||
| FedEx Corp. | 6,100 | 561,139 | 0.51 | % | |||||||||
| General Dynamics Corp. | 20,000 | 1,361,600 | 1.24 | % | |||||||||
| General Electric Co. | 37,600 | 791,856 | 0.72 | % | |||||||||
| Lockheed Martin Corp. | 18,900 | 1,770,363 | 1.61 | % | |||||||||
| Norfolk Southern Corp. | 8,600 | 527,610 | 0.48 | % | |||||||||
| Raytheon Co. | 30,300 | 1,713,768 | 1.56 | % | |||||||||
| The Boeing Co. | 18,900 | 1,331,316 | 1.21 | % | |||||||||
The accompanying notes are an integral part of these financial statements.
WWW.HENNESSYFUNDS.COM
30
| COMMON STOCKS | Number of | % of | |||||||||||
| Shares | Value | Net Assets | |||||||||||
| Industrials (Continued) | |||||||||||||
| The Timken Co. | 28,200 | $ | 1,113,618 | 1.02 | % | ||||||||
| Union Pacific Corp. | 3,200 | 393,696 | 0.36 | % | |||||||||
| 10,967,406 | 9.99 | % | |||||||||||
| Information Technology – 17.03% | |||||||||||||
| Apple, Inc. | 2,050 | 1,219,955 | 1.11 | % | |||||||||
| Applied Materials, Inc. | 116,700 | 1,237,020 | 1.13 | % | |||||||||
| Automatic Data Processing, Inc. | 7,000 | 404,530 | 0.37 | % | |||||||||
| Check Point Software | |||||||||||||
| Technologies Ltd. (a) | 7,000 | 311,710 | 0.28 | % | |||||||||
| Cisco Systems, Inc. | 30,000 | 514,200 | 0.47 | % | |||||||||
| Citrix Systems, Inc. (a) | 3,600 | 222,516 | 0.20 | % | |||||||||
| Dell, Inc. | 89,500 | 826,085 | 0.75 | % | |||||||||
| Google, Inc., Class A (a) | 1,100 | 747,747 | 0.68 | % | |||||||||
| Harris Corp. | 30,600 | 1,400,868 | 1.28 | % | |||||||||
| Hewlett-Packard Co. | 36,500 | 505,525 | 0.46 | % | |||||||||
| Intel Corp. | 91,000 | 1,967,875 | 1.79 | % | |||||||||
| International Business Machines Corp. | 11,800 | 2,295,454 | 2.09 | % | |||||||||
| LAM Research Corp. (a) | 31,700 | 1,122,180 | 1.02 | % | |||||||||
| LinkedIn Corp., Class A (a) | 900 | 96,237 | 0.09 | % | |||||||||
| MICROS Systems, Inc. (a) | 7,000 | 317,730 | 0.29 | % | |||||||||
| Microsoft Corp. | 77,350 | 2,207,182 | 2.01 | % | |||||||||
| NetApp, Inc. (a) | 9,900 | 266,310 | 0.24 | % | |||||||||
| Oracle Corp. | 19,000 | 589,950 | 0.54 | % | |||||||||
| Paychex, Inc. | 12,000 | 389,160 | 0.35 | % | |||||||||
| Rackspace Hosting, Inc. (a) | 6,000 | 382,140 | 0.35 | % | |||||||||
| Salesforce.com, Inc. (a) | 1,800 | 262,764 | 0.24 | % | |||||||||
| Texas Instruments, Inc. | 42,900 | 1,205,061 | 1.10 | % | |||||||||
| Yahoo, Inc. (a) | 12,300 | 206,763 | 0.19 | % | |||||||||
| 18,698,962 | 17.03 | % | |||||||||||
| Materials – 5.42% | |||||||||||||
| Cliffs Natural Resources Inc. | 17,500 | 634,725 | 0.58 | % | |||||||||
| Eastman Chemical Co. | 28,200 | 1,670,568 | 1.52 | % | |||||||||
| EI Du Pont de Nemours & Co. | 6,000 | 267,120 | 0.24 | % | |||||||||
| Freeport-McMoRan Copper & Gold, Inc. | 41,000 | 1,594,080 | 1.45 | % | |||||||||
| Monsanto Co. | 3,000 | 258,210 | 0.24 | % | |||||||||
| Newmont Mining Corp. | 28,000 | 1,527,400 | 1.39 | % | |||||||||
| 5,952,103 | 5.42 | % | |||||||||||
| Telecommunication Services – 0.84% | |||||||||||||
| AT&T, Inc. | 15,000 | 518,850 | 0.47 | % | |||||||||
| Verizon Communications, Inc. | 9,000 | 401,760 | 0.37 | % | |||||||||
| 920,610 | 0.84 | % | |||||||||||
| Utilities – 1.17% | |||||||||||||
| Edison International | 4,800 | 225,312 | 0.20 | % | |||||||||
| Exelon Corp. | 14,000 | 500,920 | 0.46 | % | |||||||||
| PG&E Corp. | 8,500 | 361,420 | 0.33 | % | |||||||||
| Public Service Enterprise Group, Inc. | 6,100 | 195,444 | 0.18 | % | |||||||||
| 1,283,096 | 1.17 | % | |||||||||||
| Total Common Stocks | |||||||||||||
| (Cost $98,172,303) | 106,743,878 | 97.24 | % | ||||||||||
| SHORT-TERM INVESTMENTS – 2.77% | |||||||||||||
| Money Market Fund – 2.77% | |||||||||||||
| Fidelity Government Portfolio – | |||||||||||||
| Institutional Class, 0.01% (c) | 3,045,421 | 3,045,421 | 2.77 | % | |||||||||
| Total Money Market Fund | |||||||||||||
| (Cost $3,045,421) | 3,045,421 | 2.77 | % | ||||||||||
| Total Short-Term Investments | |||||||||||||
| (Cost $3,045,421) | 3,045,421 | 2.77 | % | ||||||||||
| Total Investments | |||||||||||||
| (Cost $101,217,724) – 100.01% | 109,789,299 | 100.01 | % | ||||||||||
| Liabilities in Excess of | |||||||||||||
| Other Assets – (0.01)% | (14,113 | ) | (0.01 | )% | |||||||||
TOTAL NET ASSETS – 100.00% | $ | 109,775,186 | 100.00 | % | |||||||||
Percentages are stated as a percent of net assets.
| (a) | Non-income producing security. |
| (b) | Investment in affiliated security. Quasar Distributors, LLC, which serves as the Fund’s distributor, is a subsidiary of U.S. Bancorp. The position is a result of the merger with the former FBR Large Cap Fund which occurred on October 26, 2012. Details of transactions with this affiliated company for the year ended October 31, 2012, are as follows: |
| Issuer | U.S. Bancorp | |
| Beginning Cost* | $420,211 | |
| Purchase Cost | $— | |
| Sales Cost | $— | |
| Ending Cost | $420,211 | |
| Dividend Income | $— | |
| Shares | 17,000 | |
| Market Value | $564,570 |
| * | Represents cost at October 26, 2012 acquisition. |
| (c) | The rate listed is the fund’s 7-day yield as of October 31, 2012. |
ADR – American Depositary Receipt
The accompanying notes are an integral part of these financial statements.
HENNESSY FUNDS 1-800-966-4354
31
Summary of Fair Value Exposure at October 31, 2012
The following is a summary of the inputs used to value the Fund’s net assets as of October 31, 2012 (See Note 3 in the accompanying notes to the financial statements):
| Common Stock | Level 1 | Level 2 | Level 3 | Total | |||||||||||||
| Consumer Discretionary | $ | 22,910,498 | $ | — | $ | — | $ | 22,910,498 | |||||||||
| Consumer Staples | 12,622,219 | — | — | 12,622,219 | |||||||||||||
| Energy | 8,273,417 | — | — | 8,273,417 | |||||||||||||
| Financials | 7,035,683 | — | — | 7,035,683 | |||||||||||||
| Health Care | 18,079,884 | — | — | 18,079,884 | |||||||||||||
| Industrials | 10,967,406 | — | — | 10,967,406 | |||||||||||||
| Information Technology | 18,698,962 | — | — | 18,698,962 | |||||||||||||
| Materials | 5,952,103 | — | — | 5,952,103 | |||||||||||||
| Telecommunication Services | 920,610 | — | — | 920,610 | |||||||||||||
| Utilities | 1,283,096 | — | — | 1,283,096 | |||||||||||||
| Total Common Stock | $ | 106,743,878 | $ | — | $ | — | $ | 106,743,878 | |||||||||
| Short-Term Investments | |||||||||||||||||
| Money Market Funds | $ | 3,045,421 | $ | — | $ | — | $ | 3,045,421 | |||||||||
| Total Short-Term Investments | $ | 3,045,421 | $ | — | $ | — | $ | 3,045,421 | |||||||||
| Total Investments in Securities | $ | 109,789,299 | $ | — | $ | — | $ | 109,789,299 | |||||||||
Transfers between levels are recognized at the end of the reporting period. During the period ended October 31, 2012, the Fund recognized no transfers between levels.
The accompanying notes are an integral part of these financial statements.
WWW.HENNESSYFUNDS.COM
32
HENNESSY CORNERSTONE VALUE FUND
As of October 31, 2012
(% of Net Assets)
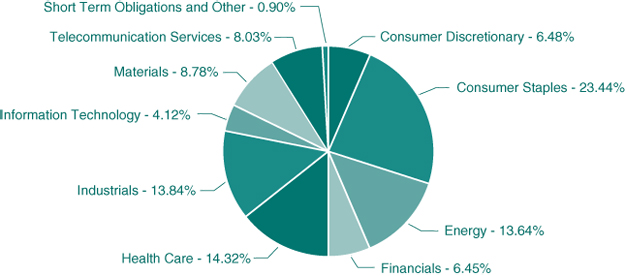
| TOP TEN EQUITY HOLDINGS | % net assets | |
| Seagate Technology PLC | 2.55% | |
| Encana Corp. | 2.37% | |
| Mattel, Inc. | 2.36% | |
| Carnival Corp. | 2.29% | |
| Sun Life Financial, Inc. | 2.29% | |
| HSBC Holdings PLC – ADR | 2.27% | |
| Eli Lilly & Co. | 2.24% | |
| Philip Morris International, Inc. | 2.23% | |
| Abbott Labs | 2.18% | |
| Merck & Co., Inc. | 2.17% |
Note: For presentation purposes, the Fund has grouped some of the industry categories. For purposes of categorizing securities for compliance with Section 8(b)(1) of the Investment Company Act of 1940, the Fund uses more specific industry classifications.
HENNESSY FUNDS �� 1-800-966-4354
33
| COMMON STOCKS – 99.10% | Number of | % of | |||||||||||
| Shares | Value | Net Assets | |||||||||||
| Consumer Discretionary – 6.48% | |||||||||||||
| Carnival Corp. | 77,100 | $ | 2,920,548 | 2.29 | % | ||||||||
| Mattel, Inc. | 81,700 | 3,004,926 | 2.36 | % | |||||||||
| Thomson Reuters Corp. | 82,700 | 2,337,102 | 1.83 | % | |||||||||
| 8,262,576 | 6.48 | % | |||||||||||
| Consumer Staples – 23.44% | |||||||||||||
| Altria Group, Inc. | 81,300 | 2,585,340 | 2.03 | % | |||||||||
| Avon Products, Inc. | 132,000 | 2,044,680 | 1.60 | % | |||||||||
| Campbell Soup Co. | 73,500 | 2,592,345 | 2.03 | % | |||||||||
| ConAgra Foods, Inc. | 86,800 | 2,416,512 | 1.90 | % | |||||||||
| H.J. Heinz Co. | 44,000 | 2,530,440 | 1.98 | % | |||||||||
| Kellogg Co. | 46,000 | 2,406,720 | 1.89 | % | |||||||||
| Kimberly Clark Corp. | 31,800 | 2,653,710 | 2.08 | % | |||||||||
| Pepsico, Inc. | 36,300 | 2,513,412 | 1.97 | % | |||||||||
| Philip Morris International, Inc. | 32,100 | 2,842,776 | 2.23 | % | |||||||||
| Procter & Gamble Co. | 35,700 | 2,471,868 | 1.94 | % | |||||||||
| Reynolds American, Inc. | 57,100 | 2,377,644 | 1.87 | % | |||||||||
| Sysco Corp. | 78,900 | 2,451,423 | 1.92 | % | |||||||||
| 29,886,870 | 23.44 | % | |||||||||||
| Energy – 13.64% | |||||||||||||
| BP PLC – ADR | 52,800 | 2,264,592 | 1.78 | % | |||||||||
| Chevron Corp. | 22,000 | 2,424,620 | 1.90 | % | |||||||||
| ConocoPhillips | 32,100 | 1,856,985 | 1.46 | % | |||||||||
| Encana Corp. | 134,300 | 3,028,465 | 2.37 | % | |||||||||
| Phillips 66 | 16,050 | 756,918 | 0.59 | % | |||||||||
| Royal Dutch Shell PLC – ADR | 33,500 | 2,294,080 | 1.80 | % | |||||||||
| Total SA – ADR | 45,600 | 2,298,240 | 1.80 | % | |||||||||
| Transocean Ltd. | 54,100 | 2,471,829 | 1.94 | % | |||||||||
| 17,395,729 | 13.64 | % | |||||||||||
| Financials – 6.45% | |||||||||||||
| Banco Santander SA – ADR | 323,400 | 2,412,564 | 1.89 | % | |||||||||
| HSBC Holdings PLC – ADR | 58,700 | 2,897,432 | 2.27 | % | |||||||||
| Sun Life Financial, Inc. | 117,600 | 2,916,480 | 2.29 | % | |||||||||
| 8,226,476 | 6.45 | % | |||||||||||
| Health Care – 14.32% | |||||||||||||
| Abbott Laboratories | 42,500 | 2,784,600 | 2.18 | % | |||||||||
| Bristol-Myers Squibb Co. | 69,800 | 2,320,850 | 1.82 | % | |||||||||
| Eli Lilly & Co. | 58,600 | 2,849,718 | 2.24 | % | |||||||||
| GlaxoSmithKline PLC – ADR | 51,700 | 2,321,330 | 1.82 | % | |||||||||
| Johnson & Johnson | 36,100 | 2,556,602 | 2.00 | % | |||||||||
| Merck & Co., Inc. | 60,600 | 2,765,178 | 2.17 | % | |||||||||
| Pfizer, Inc. | 107,200 | 2,666,064 | 2.09 | % | |||||||||
| 18,264,342 | 14.32 | % | |||||||||||
| Industrials – 13.84% | |||||||||||||
| Emerson Electric Co. | 47,300 | 2,290,739 | 1.80 | % | |||||||||
| General Electric Co. | 123,800 | 2,607,228 | 2.04 | % | |||||||||
| Lockheed Martin Corp. | 28,600 | 2,678,962 | 2.10 | % | |||||||||
| Northrop Grumman Corp. | 39,100 | 2,685,779 | 2.11 | % | |||||||||
| Raytheon Co. | 47,400 | 2,680,944 | 2.10 | % | |||||||||
| Republic Services, Inc. | 85,100 | 2,412,585 | 1.89 | % | |||||||||
| Waste Management, Inc. | 69,900 | 2,288,526 | 1.80 | % | |||||||||
| 17,644,763 | 13.84 | % | |||||||||||
| Information Technology – 4.12% | |||||||||||||
| Intel Corp. | 92,700 | 2,004,638 | 1.57 | % | |||||||||
| Seagate Technology PLC | 119,200 | 3,256,544 | 2.55 | % | |||||||||
| 5,261,182 | 4.12 | % | |||||||||||
| Materials – 8.78% | |||||||||||||
| Arcelormittal SA Luxembourg – ADR | 115,300 | 1,702,981 | 1.34 | % | |||||||||
| EI Du Pont de Nemours & Co. | 47,600 | 2,119,152 | 1.66 | % | |||||||||
| International Paper Co. | 73,400 | 2,629,922 | 2.06 | % | |||||||||
| Nucor Corp. | 55,200 | 2,215,176 | 1.74 | % | |||||||||
| Southern Copper Corp. | 66,300 | 2,526,030 | 1.98 | % | |||||||||
| 11,193,261 | 8.78 | % | |||||||||||
| Telecommunication Services – 8.03% | |||||||||||||
| AT&T, Inc. | 77,600 | 2,684,184 | 2.10 | % | |||||||||
| BCE, Inc. | 56,300 | 2,458,058 | 1.93 | % | |||||||||
| CenturyLink, Inc. | 62,800 | 2,410,264 | 1.89 | % | |||||||||
| Verizon Communications, Inc. | 60,300 | 2,691,792 | 2.11 | % | |||||||||
| 10,244,298 | 8.03 | % | |||||||||||
| Total Common Stocks | |||||||||||||
| (Cost $107,028,943) | 126,379,497 | 99.10 | % | ||||||||||
| SHORT-TERM INVESTMENTS – 1.00% | |||||||||||||
| Money Market Fund – 1.00% | |||||||||||||
| Fidelity Government Portfolio – | |||||||||||||
| Institutional Class, 0.01% (a) | 1,273,206 | 1,273,206 | 1.00 | % | |||||||||
| Total Money Market Fund | |||||||||||||
| (Cost $1,273,206) | 1,273,206 | 1.00 | % | ||||||||||
| Total Short-Term Investments | |||||||||||||
| (Cost $1,273,206) | 1,273,206 | 1.00 | % | ||||||||||
| Total Investments | |||||||||||||
| (Cost $108,302,149) – 100.10% | 127,652,703 | 100.10 | % | ||||||||||
| Liabilities in Excess | |||||||||||||
| of Other Assets – (0.10)% | (131,398 | ) | (0.10 | )% | |||||||||
TOTAL NET ASSETS – 100.00% | $ | 127,521,305 | 100.00 | % | |||||||||
Percentages are stated as a percent of net assets.
(a)The rate listed is the fund’s 7-day yield as of October 31, 2012.
ADR – American Depositary Receipt
The accompanying notes are an integral part of these financial statements.
WWW.HENNESSYFUNDS.COM
34
Summary of Fair Value Exposure at October 31, 2012
The following is a summary of the inputs used to value the Fund’s net assets as of October 31, 2012 (See Note 3 in the accompanying notes to the financial statements):
| Common Stock | Level 1 | Level 2 | Level 3 | Total | |||||||||||||
| Consumer Discretionary | $ | 8,262,576 | $ | — | $ | — | $ | 8,262,576 | |||||||||
| Consumer Staples | 29,886,870 | — | — | 29,886,870 | |||||||||||||
| Energy | 17,395,729 | — | — | 17,395,729 | |||||||||||||
| Financials | 8,226,476 | — | — | 8,226,476 | |||||||||||||
| Health Care | 18,264,342 | — | — | 18,264,342 | |||||||||||||
| Industrials | 17,644,763 | — | — | 17,644,763 | |||||||||||||
| Information Technology | 5,261,182 | — | — | 5,261,182 | |||||||||||||
| Materials | 11,193,261 | — | — | 11,193,261 | |||||||||||||
| Telecommunication Services | 10,244,298 | — | — | 10,244,298 | |||||||||||||
| Total Common Stock | $ | 126,379,497 | $ | — | $ | — | $ | 126,379,497 | |||||||||
| Short-Term Investments | |||||||||||||||||
| Money Market Funds | $ | 1,273,206 | $ | — | $ | — | $ | 1,273,206 | |||||||||
| Total Short-Term Investments | $ | 1,273,206 | $ | — | $ | — | $ | 1,273,206 | |||||||||
| Total Investments in Securities | $ | 127,652,703 | $ | — | $ | — | $ | 127,652,703 | |||||||||
Transfers between levels are recognized at the end of the reporting period. During the period ended October 31, 2012, the Fund recognized no transfers between levels.
Level 3 Reconciliation Disclosure
Following is a reconciliation of level 3 assets for which significant unobservable inputs were used to determine fair value.
| Common Stock | |||||
| Balance as of 10/31/11 | $ | — | |||
| Accrued discounts/premiums | — | ||||
| Realized gain (loss) | — | ||||
| Change in unrealized appreciation (depreciation) | — | ||||
| Purchases | — | ||||
| (Sales) | — | (1) | |||
| Transfer in and/or out of Level 3 | — | ||||
| Balance as of 10/31/12 | $ | — | |||
| Change in unrealized appreciation/depreciation during | |||||
| the year for level 3 investments held at October 31, 2012. | $ | — | |||
(1) Telefonica de Argentina was fair valued at $0 and written off during the period and was no longer held as of October 31, 2012.
The accompanying notes are an integral part of these financial statements.
HENNESSY FUNDS 1-800-966-4354
35
HENNESSY LARGE VALUE FUND
(formerly Hennessy Select Large Value Fund)
As of October 31, 2012
(% of Net Assets)
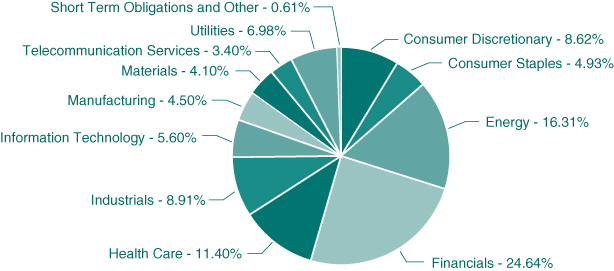
| TOP TEN EQUITY HOLDINGS | % net assets | |
| Chevron Corp. | 4.69% | |
| Exxon Mobil Corp. | 4.06% | |
| Johnson & Johnson | 3.64% | |
| General Electric Co. | 3.60% | |
| Wells Fargo & Co. | 2.77% | |
| J.P. Morgan Chase & Co. | 2.72% | |
| Cisco Systems, Inc. | 2.16% | |
| Citigroup, Inc. | 2.05% | |
| Nextera Energy, Inc. | 2.04% | |
| Comcast Corp. | 1.96% |
Note: For presentation purposes, the Fund has grouped some of the industry categories. For purposes of categorizing securities for compliance with Section 8(b)(1) of the Investment Company Act of 1940, the Fund uses more specific industry classifications.
WWW.HENNESSYFUNDS.COM
36
| COMMON STOCKS – 99.39% | Number of | % of | |||||||||||
| Shares | Value | Net Assets | |||||||||||
| Consumer Discretionary – 8.62% | |||||||||||||
| Abercrombie & Fitch Co., Class A | 19,645 | $ | 600,744 | 0.48 | % | ||||||||
| CBS Corp. | 40,330 | 1,306,692 | 1.05 | % | |||||||||
| Comcast Corp. | 65,290 | 2,449,028 | 1.96 | % | |||||||||
| Ford Motor Co. | 74,880 | 835,661 | 0.67 | % | |||||||||
| Macy’s, Inc. | 25,095 | 955,367 | 0.77 | % | |||||||||
| Pulte Homes, Inc. (a) | 38,575 | 668,890 | 0.52 | % | |||||||||
| Target Corp. | 30,470 | 1,942,462 | 1.55 | % | |||||||||
| The Home Depot, Inc. | 22,740 | 1,395,781 | 1.12 | % | |||||||||
| Time Warner, Inc. | 14,450 | 628,142 | 0.50 | % | |||||||||
| 10,782,767 | 8.62 | % | |||||||||||
| Consumer Staples – 4.93% | |||||||||||||
| Altria Group, Inc. | 19,550 | 621,690 | 0.50 | % | |||||||||
| Bunge Ltd. | 19,235 | 1,366,262 | 1.09 | % | |||||||||
| CVS Caremark Corp. | 33,535 | 1,556,024 | 1.24 | % | |||||||||
| Pepsico, Inc. | 9,160 | 634,238 | 0.51 | % | |||||||||
| Procter & Gamble Co. | 28,670 | 1,985,111 | 1.59 | % | |||||||||
| 6,163,325 | 4.93 | % | |||||||||||
| Energy – 16.31% | |||||||||||||
| Anadarko Petroleum Corp. | 14,085 | 969,189 | 0.77 | % | |||||||||
| Chevron Corp. | 53,215 | 5,864,825 | 4.69 | % | |||||||||
| ConocoPhillips | 20,115 | 1,163,653 | 0.93 | % | |||||||||
| Exxon Mobil Corp. | 55,690 | 5,077,257 | 4.06 | % | |||||||||
| Helmerich & Payne, Inc. | 31,660 | 1,513,348 | 1.21 | % | |||||||||
| Hess Corp. | 18,510 | 967,333 | 0.77 | % | |||||||||
| National Oilwell Varco, Inc. | 10,635 | 783,799 | 0.63 | % | |||||||||
| Occidental Petroleum Corp. | 24,685 | 1,949,128 | 1.56 | % | |||||||||
| Oil States International, Inc. (a) | 12,760 | 932,756 | 0.75 | % | |||||||||
| Valero Energy Corp. | 40,440 | 1,176,804 | 0.94 | % | |||||||||
| 20,398,092 | 16.31 | % | |||||||||||
| Financials – 24.64% | |||||||||||||
| Ace Ltd. | 23,980 | 1,886,027 | 1.51 | % | |||||||||
| Affiliated Managers Group, Inc. (a) | 6,215 | 786,198 | 0.63 | % | |||||||||
| Allstate Corp. | 40,740 | 1,628,785 | 1.30 | % | |||||||||
| American International Group, Inc. (a) | 31,800 | 1,110,774 | 0.89 | % | |||||||||
| Apartment Investment & | |||||||||||||
| Management Co. | 44,250 | 1,181,032 | 0.94 | % | |||||||||
| Capital One Financial Corp. | 16,560 | 996,415 | 0.80 | % | |||||||||
| Citigroup, Inc. | 68,525 | 2,562,150 | 2.05 | % | |||||||||
| Invesco Ltd. | 64,665 | 1,572,653 | 1.26 | % | |||||||||
| J.P. Morgan Chase & Co. | 81,710 | 3,405,673 | 2.72 | % | |||||||||
| Lincoln National Corp. | 28,175 | 698,458 | 0.56 | % | |||||||||
| Morgan Stanley | 36,975 | 642,625 | 0.51 | % | |||||||||
| Peabody Energy Corp. | 11,385 | 317,641 | 0.25 | % | |||||||||
| Prudential Financial, Inc. | 16,670 | 951,023 | 0.76 | % | |||||||||
| Simon Property Group, Inc. | 14,018 | 2,133,680 | 1.71 | % | |||||||||
| State Street Corp. | 25,950 | 1,156,592 | 0.92 | % | |||||||||
| The Chubb Corp. | 16,315 | 1,255,929 | 1.00 | % | |||||||||
| The Goldman Sachs Group, Inc. | 8,330 | 1,019,509 | 0.82 | % | |||||||||
| The PNC Financial Services Group, Inc. | 37,295 | 2,170,196 | 1.73 | % | |||||||||
| Torchmark Corp. | 27,855 | 1,409,184 | 1.13 | % | |||||||||
| Wells Fargo & Co. | 102,990 | 3,469,733 | 2.77 | % | |||||||||
| Weyerhaeuser Co. | 17,105 | 473,637 | 0.38 | % | |||||||||
| 30,827,914 | 24.64 | % | |||||||||||
| Health Care – 11.40% | |||||||||||||
| HCA Holdings, Inc. | 36,045 | 1,024,038 | 0.82 | % | |||||||||
| Johnson & Johnson | 64,320 | 4,555,142 | 3.64 | % | |||||||||
| McKesson Corp. | 19,195 | 1,791,086 | 1.43 | % | |||||||||
| Medtronic, Inc. | 16,360 | 680,249 | 0.54 | % | |||||||||
| Merck & Co., Inc. | 40,287 | 1,838,296 | 1.47 | % | |||||||||
| Pfizer, Inc. | 82,900 | 2,061,723 | 1.65 | % | |||||||||
| UnitedHealth Group, Inc. | 41,320 | 2,313,920 | 1.85 | % | |||||||||
| 14,264,454 | 11.40 | % | |||||||||||
| Industrials – 8.91% | |||||||||||||
| Eaton Corp. | 3,450 | 162,909 | 0.13 | % | |||||||||
| FedEx Corp. | 5,465 | 502,725 | 0.40 | % | |||||||||
| General Electric Co. | 213,620 | 4,498,837 | 3.60 | % | |||||||||
| Honeywell International, Inc. | 27,890 | 1,707,984 | 1.37 | % | |||||||||
| KBR, Inc. | 36,480 | 1,016,333 | 0.81 | % | |||||||||
| Raytheon Co. | 16,740 | 946,814 | 0.76 | % | |||||||||
| The Boeing Co. | 15,365 | 1,082,311 | 0.87 | % | |||||||||
| Union Pacific Corp. | 9,855 | 1,212,461 | 0.97 | % | |||||||||
| 11,130,374 | 8.91 | % | |||||||||||
| Information Technology – 5.60% | |||||||||||||
| Cisco Systems, Inc. | 157,160 | 2,693,722 | 2.16 | % | |||||||||
| Ebay, Inc. (a) | 16,365 | 790,266 | 0.63 | % | |||||||||
| Hewlett-Packard Co. | 36,335 | 503,240 | 0.40 | % | |||||||||
| Intel Corp. | 52,575 | 1,136,934 | 0.91 | % | |||||||||
| MasterCard, Inc., Class A | 1,230 | 566,944 | 0.45 | % | |||||||||
| Texas Instruments, Inc. | 46,900 | 1,317,421 | 1.05 | % | |||||||||
| 7,008,527 | 5.60 | % | |||||||||||
| Manufacturing – 4.50% | |||||||||||||
| Apple, Inc. | 905 | 538,565 | 0.43 | % | |||||||||
| EMC Corp. (a) | 37,700 | 920,634 | 0.74 | % | |||||||||
| Ingredion, Inc. | 29,085 | 1,787,564 | 1.43 | % | |||||||||
| Kraft Foods Group, Inc. | 19,316 | 878,492 | 0.70 | % | |||||||||
| Micron Technology, Inc. (a) | 90,425 | 490,556 | 0.39 | % | |||||||||
| Mondelez Intl, Inc. | 38,405 | 1,019,269 | 0.81 | % | |||||||||
| 5,635,080 | 4.50 | % | |||||||||||
| Materials – 4.10% | |||||||||||||
| Eastman Chemical Co. | 24,895 | 1,474,780 | 1.18 | % | |||||||||
| FMC Corp. | 19,510 | 1,044,175 | 0.83 | % | |||||||||
| Freeport-McMoRan Copper & Gold, Inc. | 32,925 | 1,280,124 | 1.02 | % | |||||||||
The accompanying notes are an integral part of these financial statements.
HENNESSY FUNDS 1-800-966-4354
37
| COMMON STOCKS | Number of | % of | |||||||||||
| Shares | Value | Net Assets | |||||||||||
| Materials (Continued) | |||||||||||||
| PPG Industries, Inc. | 11,390 | $ | 1,333,541 | 1.07 | % | ||||||||
| 5,132,620 | 4.10 | % | |||||||||||
| Telecommunication Services – 3.40% | |||||||||||||
| AT&T, Inc. | 51,030 | 1,765,128 | 1.41 | % | |||||||||
| CenturyLink, Inc. | 36,707 | 1,408,815 | 1.13 | % | |||||||||
| Verizon Communications, Inc. | 24,080 | 1,074,931 | 0.86 | % | |||||||||
| 4,248,874 | 3.40 | % | |||||||||||
| Utilities – 6.98% | |||||||||||||
| Edison International | 41,660 | 1,955,521 | 1.56 | % | |||||||||
| Nextera Energy, Inc. | 36,370 | 2,548,082 | 2.04 | % | |||||||||
| Northeast Utilities | 59,270 | 2,329,311 | 1.86 | % | |||||||||
| Oge Energy Corp. | 33,035 | 1,902,155 | 1.52 | % | |||||||||
| 8,735,069 | 6.98 | % | |||||||||||
| Total Common Stocks | |||||||||||||
| (Cost $105,483,754) | 124,327,096 | 99.39 | % | ||||||||||
| SHORT-TERM INVESTMENTS – 0.93% | |||||||||||||
| Money Market Fund – 0.93% | |||||||||||||
| Fidelity Government Portfolio – | |||||||||||||
| Institutional Class, 0.01% (b) | 1,164,771 | 1,164,771 | 0.93 | % | |||||||||
| Total Money Market Fund | |||||||||||||
| (Cost $1,164,771) | 1,164,771 | 0.93 | % | ||||||||||
| Total Short-Term Investments | |||||||||||||
| (Cost $1,164,771) | 1,164,771 | 0.93 | % | ||||||||||
| Total Investments | |||||||||||||
| (Cost $106,648,525) – 100.32% | 125,491,867 | 100.32 | % | ||||||||||
| Liabilities in Excess | |||||||||||||
| of Other Assets – (0.32)% | (401,422 | ) | (0.32 | )% | |||||||||
TOTAL NET ASSETS – 100.00% | $ | 125,090,445 | 100.00 | % | |||||||||
Percentages are stated as a percent of net assets.
(a)Non-income producing security.
(b)The rate listed is the fund’s 7-day yield as of October 31, 2012.
Summary of Fair Value Exposure at October 31, 2012
The following is a summary of the inputs used to value the Fund’s net assets as of October 31, 2012 (See Note 3 in the accompanying notes to the financial statements):
| Common Stock | Level 1 | Level 2 | Level 3 | Total | |||||||||||||
| Consumer Discretionary | $ | 10,782,767 | $ | — | $ | — | $ | 10,782,767 | |||||||||
| Consumer Staples | 6,163,325 | — | — | 6,163,325 | |||||||||||||
| Energy | 20,398,092 | — | — | 20,398,092 | |||||||||||||
| Financials | 30,827,914 | — | — | 30,827,914 | |||||||||||||
| Health Care | 14,264,454 | — | — | 14,264,454 | |||||||||||||
| Industrials | 11,130,374 | — | — | 11,130,374 | |||||||||||||
| Information Technology | 7,008,527 | — | — | 7,008,527 | |||||||||||||
| Manufacturing | 5,635,080 | — | — | 5,635,080 | |||||||||||||
| Materials | 5,132,620 | — | — | 5,132,620 | |||||||||||||
| Telecommunication Services | 4,248,874 | — | — | 4,248,874 | |||||||||||||
| Utilities | 8,735,069 | — | — | 8,735,069 | |||||||||||||
| Total Common Stock | $ | 124,327,096 | $ | — | $ | — | $ | 124,327,096 | |||||||||
| Short-Term Investments | |||||||||||||||||
| Money Market Funds | $ | 1,164,771 | $ | — | $ | — | $ | 1,164,771 | |||||||||
| Total Short-Term Investments | $ | 1,164,771 | $ | — | $ | — | $ | 1,164,771 | |||||||||
| Total Investments in Securities | $ | 125,491,867 | $ | — | $ | — | $ | 125,491,867 | |||||||||
Transfers between levels are recognized at the end of the reporting period. During the period ended October 31, 2012, the Fund recognized no transfers between levels.
The accompanying notes are an integral part of these financial statements.
WWW.HENNESSYFUNDS.COM
38
HENNESSY TOTAL RETURN FUND
As of October 31, 2012
(% of Net Assets)

| TOP TEN EQUITY HOLDINGS | % net assets | |
| Pfizer, Inc. | 7.02% | |
| Merck & Co., Inc. | 6.92% | |
| Verizon Communications, Inc. | 6.87% | |
| AT&T, Inc. | 6.68% | |
| Johnson & Johnson | 6.55% | |
| Proctor & Gamble Co. | 6.51% | |
| EI Du Pont de Nemours & Co. | 5.51% | |
| Intel Corp. | 5.00% | |
| Chevron Corp. | 4.44% | |
| General Electric Co. | 3.38% |
Note: For presentation purposes, the Fund has grouped some of the industry categories. For purposes of categorizing securities for compliance with Section 8(b)(1) of the Investment Company Act of 1940, the Fund uses more specific industry classifications.
HENNESSY FUNDS 1-800-966-4354
39
| COMMON STOCKS – 67.35% | Number of | % of | |||||||||||
| Shares | Value | Net Assets | |||||||||||
| Consumer Discretionary – 2.37% | |||||||||||||
| McDonald’s Corp. | 21,200 | $ | 1,840,160 | 2.37 | % | ||||||||
| Consumer Staples – 6.51% | |||||||||||||
| Procter & Gamble Co. | 73,000 | 5,054,520 | 6.51 | % | |||||||||
| Energy – 4.44% | |||||||||||||
| Chevron Corp. | 31,300 | 3,449,573 | 4.44 | % | |||||||||
| Financials – 2.74% | |||||||||||||
| J.P. Morgan Chase & Co. | 51,100 | 2,129,848 | 2.74 | % | |||||||||
| Health Care – 20.49% | |||||||||||||
| Johnson & Johnson | 71,800 | 5,084,876 | 6.55 | % | |||||||||
| Merck & Co., Inc. | 117,800 | 5,375,214 | 6.92 | % | |||||||||
| Pfizer, Inc. | 219,300 | 5,453,991 | 7.02 | % | |||||||||
| 15,914,081 | 20.49 | % | |||||||||||
| Industrials – 3.38% | |||||||||||||
| General Electric Co. | 124,700 | 2,626,182 | 3.38 | % | |||||||||
| Information Technology – 5.00% | |||||||||||||
| Intel Corp. | 179,500 | 3,881,687 | 5.00 | % | |||||||||
| Manufacturing – 3.36% | |||||||||||||
| Kraft Foods Group, Inc. | 20,900 | 950,532 | 1.22 | % | |||||||||
| Mondelez International, Inc. | 62,700 | 1,664,058 | 2.14 | % | |||||||||
| 2,614,590 | 3.36 | % | |||||||||||
| Materials – 5.51% | |||||||||||||
| EI Du Pont de Nemours & Co. | 96,100 | 4,278,372 | 5.51 | % | |||||||||
| Telecommunication Services – 13.55% | |||||||||||||
| AT&T, Inc. | 149,900 | 5,185,041 | 6.68 | % | |||||||||
| Verizon Communications, Inc. | 119,500 | 5,334,480 | 6.87 | % | |||||||||
| 10,519,521 | 13.55 | % | |||||||||||
| Total Common Stocks | |||||||||||||
| (Cost $43,913,975) | 52,308,534 | 67.35 | % | ||||||||||
| SHORT-TERM INVESTMENTS – 69.74% | |||||||||||||
| Money Market Fund – 5.37% | |||||||||||||
| Federated Government Obligations | |||||||||||||
| Fund – Class I, 0.02% (b) | 471,379 | 471,379 | 0.61 | % | |||||||||
| Fidelity Government Portfolio – | |||||||||||||
| Institutional Class, 0.01% (b) | 3,700,000 | 3,700,000 | 4.76 | % | |||||||||
| Total Money Market Fund | |||||||||||||
| (Cost $4,171,379) | 4,171,379 | 5.37 | % | ||||||||||
U.S. Treasury Bill* – 64.37% | |||||||||||||
| 0.053%, 11/08/2012 (c) | 18,000,000 | 17,999,755 | 23.17 | % | |||||||||
| 0.089%, 12/13/2012 (c) | 20,000,000 | 19,997,900 | 25.75 | % | |||||||||
| 0.084%, 01/17/2013 (c) | 12,000,000 | 11,997,888 | 15.45 | % | |||||||||
| Total U.S. Treasury Bill | |||||||||||||
| (Cost $49,995,345) | 49,995,543 | 64.37 | % | ||||||||||
| Total Short-Term Investments | |||||||||||||
| (Cost $54,166,724) | 54,166,922 | 69.74 | % | ||||||||||
| Total Investments | |||||||||||||
| (Cost $98,080,699) – 137.09% | 106,475,456 | 137.09 | % | ||||||||||
| Liabilities in Excess of | |||||||||||||
| Other Assets – (37.09)% | (28,804,669 | ) | (37.09 | )% | |||||||||
TOTAL NET ASSETS – 100.00% | $ | 77,670,787 | 100.00 | % | |||||||||
Percentages are stated as a percent of net assets.
| (a) | Non-income producing security. |
| (b) | The rate listed is the fund’s 7-day yield as of October 31, 2012. |
| (c) | The rate listed is discount rate at issue. |
| * | Collateral or partial collateral for securities sold subject to repurchase. |
The accompanying notes are an integral part of these financial statements.
WWW.HENNESSYFUNDS.COM
40
Summary of Fair Value Exposure at October 31, 2012
The following is a summary of the inputs used to value the Fund’s net assets as of October 31, 2012 (See Note 3 in the accompanying notes to the financial statements):
| Common Stock | Level 1 | Level 2 | Level 3 | Total | |||||||||||||
| Consumer Discretionary | $ | 1,840,160 | $ | — | $ | — | $ | 1,840,160 | |||||||||
| Consumer Staples | 5,054,520 | — | — | 5,054,520 | |||||||||||||
| Energy | 3,449,573 | — | — | 3,449,573 | |||||||||||||
| Financials | 2,129,848 | — | — | 2,129,848 | |||||||||||||
| Health Care | 15,914,081 | — | — | 15,914,081 | |||||||||||||
| Industrials | 2,626,182 | — | — | 2,626,182 | |||||||||||||
| Information Technology | 3,881,687 | — | — | 3,881,687 | |||||||||||||
| Manufacturing | 2,614,590 | — | — | 2,614,590 | |||||||||||||
| Materials | 4,278,372 | — | — | 4,278,372 | |||||||||||||
| Telecommunication Services | 10,519,521 | — | — | 10,519,521 | |||||||||||||
| Total Common Stock | $ | 52,308,534 | $ | — | $ | — | $ | 52,308,534 | |||||||||
| Short-Term Investments | |||||||||||||||||
| Money Market Funds | $ | 4,171,379 | $ | — | $ | — | $ | 4,171,379 | |||||||||
| U.S. Treasury Bills | — | 49,995,543 | — | 49,995,543 | |||||||||||||
| Total Short-Term Investments | $ | 4,171,379 | $ | 49,995,543 | $ | — | $ | 54,166,922 | |||||||||
| Total Investments in Securities | $ | 56,479,913 | $ | 49,995,543 | $ | — | $ | 106,475,456 | |||||||||
Transfers between levels are recognized at the end of the reporting period. During the period ended October 31, 2012, the Fund recognized no transfers between levels.
Reverse repurchase agreements are carried at face value, hence, are not included in the fair valuation hierarchy. The face value of the reverse repurchase agreements at October 31, 2012, was $28,790,000. Due to the short term nature of the reverse repurchase agreements, face value approximates fair value. The face value plus interest due at maturity is equal to $28,808,500.
The accompanying notes are an integral part of these financial statements.
HENNESSY FUNDS 1-800-966-4354
41
Schedule of Reverse Repurchase Agreements
Hennessy Total Return Fund as of October 31, 2012 |
| Face | Principal | Maturity | Maturity | ||||||||||
| Value | Counterparty | Rate | Trade Date | Date | Amount | ||||||||
| $ | 10,800,000 | UBS Financial Services, Inc. | 0.28 | % | 8/24/12 | 11/8/12 | $ | 10,806,384 | |||||
| 10,794,000 | UBS Financial Services, Inc. | 0.27 | % | 9/21/12 | 12/13/12 | 10,800,719 | |||||||
| 7,196,000 | UBS Financial Services, Inc. | 0.30 | % | 10/19/12 | 1/17/13 | 7,201,397 | |||||||
| $ | 28,790,000 | $ | 28,808,500 | ||||||||||
As of October 31, 2012, the fair value of securities held as collateral for reverse repurchase agreements was $49,995,543 as noted on the Schedule of Investments.
The accompanying notes are an integral part of these financial statements.
WWW.HENNESSYFUNDS.COM
42
HENNESSY BALANCED FUND
As of October 31, 2012
(% of Net Assets)
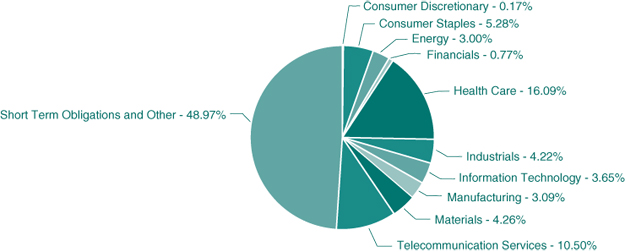
| TOP TEN EQUITY HOLDINGS | % net assets | |
| Johnson & Johnson | 5.51% | |
| Verizon Communications, Inc. | 5.37% | |
| Merck & Co., Inc. | 5.33% | |
| Proctor & Gamble Co. | 5.28% | |
| Pfizer, Inc. | 5.25% | |
| AT&T, Inc. | 5.13% | |
| EI Du Pont de Nemours & Co. | 4.26% | |
| General Electric Co. | 4.22% | |
| Intel Corp. | 3.65% | |
| Chevron Corp. | 3.00% |
Note: For presentation purposes, the Fund has grouped some of the industry categories. For purposes of categorizing securities for compliance with Section 8(b)(1) of the Investment Company Act of 1940, the Fund uses more specific industry classifications.
HENNESSY FUNDS 1-800-966-4354
43
| COMMON STOCKS – 51.03% | Number of | % of | |||||||||||
| Shares | Value | Net Assets | |||||||||||
| Consumer Discretionary – 0.17% | |||||||||||||
| McDonald’s Corp. | 500 | $ | 43,400 | 0.17 | % | ||||||||
| Consumer Staples – 5.28% | |||||||||||||
| Procter & Gamble Co. | 19,200 | 1,329,408 | 5.28 | % | |||||||||
| Energy – 3.00% | |||||||||||||
| Chevron Corp. | 6,850 | 754,939 | 3.00 | % | |||||||||
| Financials – 0.77% | |||||||||||||
| J.P. Morgan Chase & Co. | 4,650 | 193,812 | 0.77 | % | |||||||||
| Health Care – 16.09% | |||||||||||||
| Johnson & Johnson | 19,600 | 1,388,072 | 5.51 | % | |||||||||
| Merck & Co., Inc. | 29,400 | 1,341,522 | 5.33 | % | |||||||||
| Pfizer, Inc. | 53,150 | 1,321,840 | 5.25 | % | |||||||||
| 4,051,434 | 16.09 | % | |||||||||||
| Industrials – 4.22% | |||||||||||||
| General Electric Co. | 50,450 | 1,062,477 | 4.22 | % | |||||||||
| Information Technology – 3.65% | |||||||||||||
| Intel Corp. | 42,450 | 917,981 | 3.65 | % | |||||||||
| Manufacturing – 3.09% | |||||||||||||
| Kraft Foods Group, Inc. | 6,216 | 282,704 | 1.12 | % | |||||||||
| Mondelez International, Inc. | 18,650 | 494,971 | 1.97 | % | |||||||||
| 777,675 | 3.09 | % | |||||||||||
| Materials – 4.26% | |||||||||||||
| EI Du Pont de Nemours & Co. | 24,100 | 1,072,932 | 4.26 | % | |||||||||
| Telecommunication Services – 10.50% | |||||||||||||
| AT&T, Inc. | 37,300 | 1,290,207 | 5.13 | % | |||||||||
| Verizon Communications, Inc. | 30,300 | 1,352,592 | 5.37 | % | |||||||||
| 2,642,799 | 10.50 | % | |||||||||||
| Total Common Stocks | |||||||||||||
| (Cost $11,199,593) | 12,846,857 | 51.03 | % | ||||||||||
| SHORT-TERM INVESTMENTS – 49.03% | |||||||||||||
| Money Market Funds – 2.56% | |||||||||||||
| Fidelity Government Portfolio – | |||||||||||||
| Institutional Class, 0.01 (b) | 644,312 | 644,312 | 2.56 | % | |||||||||
| Total Money Market Funds | |||||||||||||
| (Cost $644,312) | 644,312 | 2.56 | % | ||||||||||
| U.S. Treasury Bills – 46.47% | |||||||||||||
| 0.069%, 11/15/2012 (c) | 1,600,000 | 1,599,943 | 6.36 | % | |||||||||
| 0.089%, 12/13/2012 (c) | 2,100,000 | 2,099,753 | 8.34 | % | |||||||||
| 0.084%, 01/10/2013 (c) | 2,600,000 | 2,599,594 | 10.33 | % | |||||||||
| 0.114%, 02/07/2013 (c) | 800,000 | 799,761 | 3.18 | % | |||||||||
| 0.129%, 03/07/2013 (c) | 700,000 | 699,687 | 2.78 | % | |||||||||
| 0.155%, 05/02/2013 (c) | 200,000 | 199,846 | 0.79 | % | |||||||||
| 0.155%, 05/30/2013 (c) | 700,000 | 699,368 | 2.78 | % | |||||||||
| 0.160%, 06/27/2013 (c) | 800,000 | 799,181 | 3.18 | % | |||||||||
| 0.165%, 08/22/2013 (c) | 1,000,000 | 998,675 | 3.97 | % | |||||||||
| 0.170%, 09/19/2013 (c) | 1,200,000 | 1,198,231 | 4.76 | % | |||||||||
| Total U.S. Treasury Bills | |||||||||||||
| (Cost $11,698,583) | 11,694,039 | 46.47 | % | ||||||||||
| Total Short-Term Investments | |||||||||||||
| (Cost $12,342,895) | 12,338,351 | 49.03 | % | ||||||||||
| Total Investments | |||||||||||||
| (Cost $23,542,488) – 100.06% | 25,185,208 | 100.06 | % | ||||||||||
| Liabilities in Excess of | |||||||||||||
| Other Assets – (0.06)% | (15,432 | ) | (0.06 | )% | |||||||||
TOTAL NET ASSETS – 100.00% | $ | 25,169,776 | 100.00 | % | |||||||||
Percentages are stated as a percent of net assets.
| (a) | Non-income producing security. |
| (b) | The rate listed is the fund’s 7-day yield as of October 31, 2012. |
| (c) | The rate listed is discount rate at issue. |
The accompanying notes are an integral part of these financial statements.
WWW.HENNESSYFUNDS.COM
44
Summary of Fair Value Exposure at October 31, 2012
The following is a summary of the inputs used to value the Fund’s net assets as of October 31, 2012 (See Note 3 in the accompanying notes to the financial statements):
| Common Stock | Level 1 | Level 2 | Level 3 | Total | |||||||||||||
| Consumer Discretionary | $ | 43,400 | $ | — | $ | — | $ | 43,400 | |||||||||
| Consumer Staples | 1,329,408 | — | — | 1,329,408 | |||||||||||||
| Energy | 754,939 | — | — | 754,939 | |||||||||||||
| Financials | 193,812 | — | — | 193,812 | |||||||||||||
| Health Care | 4,051,434 | — | — | 4,051,434 | |||||||||||||
| Industrials | 1,062,477 | — | — | 1,062,477 | |||||||||||||
| Information Technology | 917,981 | — | — | 917,981 | |||||||||||||
| Manufacturing | 777,675 | — | — | 777,675 | |||||||||||||
| Materials | 1,072,932 | — | — | 1,072,932 | |||||||||||||
| Telecommunication Services | 2,642,799 | — | — | 2,642,799 | |||||||||||||
| Total Common Stock | $ | 12,846,857 | $ | — | $ | — | $ | 12,846,857 | |||||||||
| Short-Term Investments | |||||||||||||||||
| Money Market Funds | $ | 644,312 | $ | — | $ | — | $ | 644,312 | |||||||||
| U.S. Treasury Bills | — | 11,694,039 | — | 11,694,039 | |||||||||||||
| Total Short-Term Investments | $ | 644,312 | $ | 11,694,039 | $ | — | $ | 12,338,351 | |||||||||
| Total Investments in Securities | $ | 13,491,169 | $ | 11,694,039 | $ | — | $ | 25,185,208 | |||||||||
Transfers between levels are recognized at the end of the reporting period. During the period ended October 31, 2012, the Fund recognized no transfers between levels.
The accompanying notes are an integral part of these financial statements.
HENNESSY FUNDS 1-800-966-4354
45
HENNESSY JAPAN FUND
(formerly Hennessy Select SPARX Japan Fund)
As of October 31, 2012
(% of Net Assets)
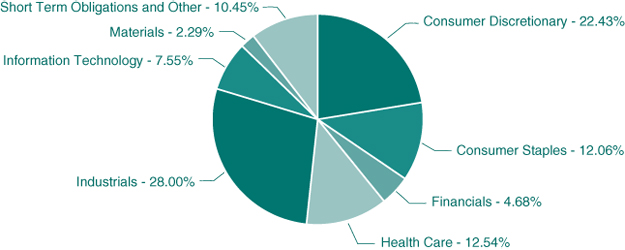
| TOP TEN EQUITY HOLDINGS | % net assets | |
| Ryohin Keikaku Co., Ltd. | 8.40% | |
| Keyence Corp. | 7.55% | |
| Misumi Group, Inc. | 7.29% | |
| Shimano, Inc. | 6.82% | |
| Rohto Pharmaceutical Co., Ltd. | 6.14% | |
| Sumitomo Corp. | 5.90% | |
| Asics Corp. | 5.51% | |
| Kao Corp. | 5.00% | |
| Mitsubishi Corp. | 4.54% | |
| Unicharm Corp. | 4.17% |
Note: For presentation purposes, the Fund has grouped some of the industry categories. For purposes of categorizing securities for compliance with Section 8(b)(1) of the Investment Company Act of 1940, the Fund uses more specific industry classifications.
WWW.HENNESSYFUNDS.COM
46
| COMMON STOCKS – 89.55% | Number of | % of | |||||||||||
| Shares | Value | Net Assets | |||||||||||
| Consumer Discretionary – 22.43% | |||||||||||||
| Asics Corp. | 73,300 | $ | 1,064,195 | 5.51 | % | ||||||||
| Isuzu Motors, Ltd. | 62,000 | 327,746 | 1.70 | % | |||||||||
| Ryohin Keikaku Co., Ltd. | 24,500 | 1,623,513 | 8.40 | % | |||||||||
| Shimano, Inc. | 20,900 | 1,316,886 | 6.82 | % | |||||||||
| 4,332,340 | 22.43 | % | |||||||||||
| Consumer Staples – 12.06% | |||||||||||||
| Kao Corp. | 34,400 | 966,113 | 5.00 | % | |||||||||
| Pigeon Corp. | 12,100 | 557,785 | 2.89 | % | |||||||||
| Unicharm Corp. | 14,900 | 806,313 | 4.17 | % | |||||||||
| 2,330,211 | 12.06 | % | |||||||||||
| Financials – 4.68% | |||||||||||||
| Mizuho Financial Group | 256,900 | 402,261 | 2.08 | % | |||||||||
| Sumitomo Mitsui Financial Group, Inc. | 16,400 | 502,087 | 2.60 | % | |||||||||
| 904,348 | 4.68 | % | |||||||||||
| Health Care – 12.54% | |||||||||||||
| Mani, Inc. | 13,700 | 507,979 | 2.63 | % | |||||||||
| Rohto Pharmaceutical Co., Ltd. | 86,000 | 1,187,173 | 6.14 | % | |||||||||
| Terumo Corp. | 16,900 | 728,248 | 3.77 | % | |||||||||
| 2,423,400 | 12.54 | % | |||||||||||
| Industrials – 28.00% | |||||||||||||
| Daikin Industries | 21,200 | 586,366 | 3.04 | % | |||||||||
| Itochu Corp. | 56,500 | 565,496 | 2.93 | % | |||||||||
| Komatsu, Ltd. | 12,200 | 255,523 | 1.32 | % | |||||||||
| Marubeni Corp. | 89,000 | 576,387 | 2.98 | % | |||||||||
| Misumi Group, Inc. | 57,400 | 1,408,576 | 7.29 | % | |||||||||
| Mitsubishi Corp. | 49,100 | 876,456 | 4.54 | % | |||||||||
| Sumitomo Corp. | 83,600 | 1,139,381 | 5.90 | % | |||||||||
| 5,408,185 | 28.00 | % | |||||||||||
| Information Technology – 7.55% | |||||||||||||
| Keyence Corp. | 5,500 | 1,459,226 | 7.55 | % | |||||||||
| Materials – 2.29% | |||||||||||||
| Fuji Seal International, Inc. | 20,800 | 442,941 | 2.29 | % | |||||||||
| Total Common Stocks | |||||||||||||
| (Cost $13,838,320) | 17,300,651 | 89.55 | % | ||||||||||
| SHORT-TERM INVESTMENTS – 10.10% | |||||||||||||
| Money Market Fund – 10.10% | |||||||||||||
| Federated Treasury Obligations | |||||||||||||
| Fund, 0.01% (a) | 80,730 | 80,730 | 0.42 | % | |||||||||
| Federated Government | |||||||||||||
| Obligations Fund – Class I, 0.02% (a) | 935,000 | 935,000 | 4.84 | % | |||||||||
| Fidelity Government Portfolio – | |||||||||||||
| Institutional Class, 0.01% (a) | 935,000 | 935,000 | 4.84 | % | |||||||||
| Total Money Market Funds | |||||||||||||
| (Cost $1,950,730) | 1,950,730 | 10.10 | % | ||||||||||
| Total Investments | |||||||||||||
| (Cost $15,789,050) – 99.65% | 19,251,381 | 99.65 | % | ||||||||||
| Other Assets in Excess | |||||||||||||
| of Liabilities – 0.35% | 66,840 | 0.35 | % | ||||||||||
TOTAL NET ASSETS – 100.00% | $ | 19,318,221 | 100.00 | % | |||||||||
Percentages are stated as a percent of net assets.
(a)The rate listed is the fund’s 7-day yield as of October 31, 2012.
The accompanying notes are an integral part of these financial statements.
HENNESSY FUNDS 1-800-966-4354
47
Summary of Fair Value Exposure at October 31, 2012
The following is a summary of the inputs used to value the Fund’s net assets as of October 31, 2012 (See Note 3 in the accompanying notes to the financial statements):
| Common Stock | Level 1 | Level 2 | Level 3 | Total | |||||||||||||
| Consumer Discretionary | $ | 4,332,340 | $ | — | $ | — | $ | 4,332,340 | |||||||||
| Consumer Staples | 2,330,211 | — | — | 2,330,211 | |||||||||||||
| Financials | 904,348 | — | — | 904,348 | |||||||||||||
| Health Care | 2,423,400 | — | — | 2,423,400 | |||||||||||||
| Industrials | 5,408,185 | — | — | 5,408,185 | |||||||||||||
| Information Technology | 1,459,226 | — | — | 1,459,226 | |||||||||||||
| Materials | 442,941 | — | — | 442,941 | |||||||||||||
| Total Common Stock | $ | 17,300,651 | $ | — | $ | — | $ | 17,300,651 | |||||||||
| Short-Term Investments | |||||||||||||||||
| Money Market Funds | $ | 1,950,730 | $ | — | $ | — | $ | 1,950,730 | |||||||||
| Total Short-Term Investments | $ | 1,950,730 | $ | — | $ | — | $ | 1,950,730 | |||||||||
| Total Investments in Securities | $ | 19,251,381 | $ | — | $ | — | $ | 19,251,381 | |||||||||
Transfers between levels are recognized at the end of the reporting period. During the period ended October 31, 2012, the Fund recognized all transfers between Levels 2 and 1.
Transfers between Level 2 and Level 1 relate to the use of a fair valuation pricing service. On days when the fair valuation pricing service is used, non-U.S. dollar denominated securities move from a Level 1 to a Level 2 classification. Due to the use of the fair value pricing service as described in Note 3, 100% of the common stocks held at October 31, 2011 were classified as Level 2. Such securities still held at October 31, 2012 were transferred to Level 1. Other than transfers due to the use of the fair value pricing service, no transfers were recognized.
The accompanying notes are an integral part of these financial statements.
WWW.HENNESSYFUNDS.COM
48
HENNESSY JAPAN SMALL CAP FUND
(formerly Hennessy Select SPARX Japan Smaller Companies Fund)
As of October 31, 2012
(% of Net Assets)
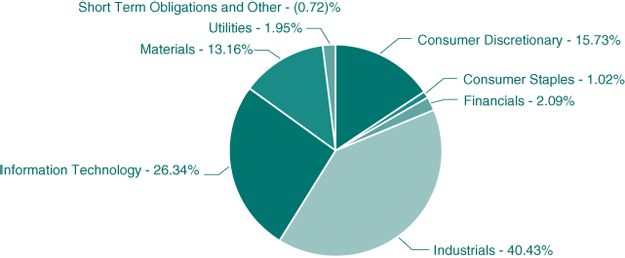
| TOP TEN EQUITY HOLDINGS | % net assets | |
| Gulliver International Co., Ltd. | 2.93% | |
| Mirait Holdings Corp. | 2.92% | |
| Morita Holdings Corp. | 2.80% | |
| Shin Nippon Air Technologies Co., Ltd. | 2.61% | |
| Yushiro Chemical | 2.55% | |
| UKC Holdings Corp. | 2.52% | |
| Towa Corp. | 2.42% | |
| Konishi Co., Ltd. | 2.35% | |
| Iriso Electronics | 2.34% | |
| Nisshinbo Holdings | 2.31% |
Note: For presentation purposes, the Fund has grouped some of the industry categories. For purposes of categorizing securities for compliance with Section 8(b)(1) of the Investment Company Act of 1940, the Fund uses more specific industry classifications.
HENNESSY FUNDS 1-800-966-4354
49
| COMMON STOCKS – 100.72% | Number of | % of | |||||||||||
| Shares | Value | Net Assets | |||||||||||
| Consumer Discretionary – 15.73% | |||||||||||||
| Accordia Golf Co., Ltd. | 151 | $ | 107,438 | 2.10 | % | ||||||||
| Ahresty Corp. | 18,300 | 72,898 | 1.43 | % | |||||||||
| Gulliver International Co., Ltd. | 3,910 | 149,631 | 2.93 | % | |||||||||
| Nippon Seiki Co., Ltd. | 11,000 | 105,687 | 2.07 | % | |||||||||
| Seiko Holdings | 37,000 | 97,332 | 1.91 | % | |||||||||
| Tohokushinsha Film Corp. | 12,100 | 84,880 | 1.66 | % | |||||||||
| Tomy Company Ltd | 13,700 | 75,511 | 1.48 | % | |||||||||
| Village Vanguard Co., Ltd. | 111 | 109,985 | 2.15 | % | |||||||||
| 803,362 | 15.73 | % | |||||||||||
| Consumer Staples – 1.02% | |||||||||||||
| Nippon Suisan | 23,700 | 51,954 | 1.02 | % | |||||||||
| Financials – 2.09% | |||||||||||||
| Kenedix, Inc. (a) | 823 | 106,702 | 2.09 | % | |||||||||
| Industrials – 40.43% | |||||||||||||
| Aichi Corp. | 24,800 | 98,790 | 1.94 | % | |||||||||
| Anest Iwata Corp. | 13,000 | 49,180 | 0.96 | % | |||||||||
| Asunaro Aoki Construction, Ltd. | 15,000 | 81,173 | 1.59 | % | |||||||||
| Fuji Machine Mfg | 6,000 | 84,855 | 1.66 | % | |||||||||
| Hanwa Co Ltd | 30,000 | 104,848 | 2.05 | % | |||||||||
| Japan Pulp & Paper | 17,000 | 50,683 | 0.99 | % | |||||||||
| Kito Corp. | 63 | 52,717 | 1.03 | % | |||||||||
| Kyosan Electric Manufacturing Co., Ltd. | 30,000 | 97,708 | 1.91 | % | |||||||||
| Mirait Holdings Corp. | 18,400 | 149,127 | 2.92 | % | |||||||||
| Morita Holdings Corp. | 17,000 | 142,891 | 2.80 | % | |||||||||
| NEC Capital Solutions Ltd. | 3,900 | 54,716 | 1.07 | % | |||||||||
| Nihon Trim Co., Ltd. | 2,550 | 69,061 | 1.35 | % | |||||||||
| Nippon Yusoki Co., Ltd. | 35,000 | 93,824 | 1.84 | % | |||||||||
| Nisshinbo Holdings | 18,000 | 117,700 | 2.31 | % | |||||||||
| Nittoku Eng Co. | 10,300 | 114,961 | 2.25 | % | |||||||||
| Prestige International, Inc. | 6,900 | 79,000 | 1.55 | % | |||||||||
| Sankyu, Inc. | 33,000 | 114,919 | 2.25 | % | |||||||||
| SBS Holdings, Inc. | 9,200 | 115,475 | 2.26 | % | |||||||||
| Shin Nippon Air Technologies Co., Ltd. | 24,300 | 133,021 | 2.61 | % | |||||||||
| Skymark Airlines (a) | 15,700 | 83,387 | 1.63 | % | |||||||||
| Tocalo Co Ltd | 5,200 | 75,495 | 1.48 | % | |||||||||
| Toshin Group Co., Ltd. | 3,800 | 101,248 | 1.98 | % | |||||||||
| 2,064,779 | 40.43 | % | |||||||||||
| Information Technology – 26.34% | |||||||||||||
| Asahi Net, Inc. | 11,000 | 53,326 | 1.04 | % | |||||||||
| D.A. Consortium, Inc. | 372 | 111,698 | 2.19 | % | |||||||||
| Elecom Co., Ltd. | 1,100 | 17,403 | 0.34 | % | |||||||||
| Iriso Electronics | 8,600 | 119,256 | 2.34 | % | |||||||||
| Macnica, Inc. | 3,100 | 61,006 | 1.19 | % | |||||||||
| Nihon Dempa Kogyo | 9,000 | 97,632 | 1.91 | % | |||||||||
| Nippon Chemi-con Corp. (a) | 67,000 | 97,357 | 1.91 | % | |||||||||
| Roland DG Corp. | 9,500 | 102,462 | 2.01 | % | |||||||||
| SIIX Corp. | 7,100 | 104,592 | 2.05 | % | |||||||||
| SMS Co., Ltd. | 30 | 66,366 | 1.30 | % | |||||||||
| SRA Holdings, Inc. | 7,100 | 77,377 | 1.52 | % | |||||||||
| Tamura Corp. | 47,000 | 103,031 | 2.02 | % | |||||||||
| Towa Corp. | 22,000 | 123,462 | 2.42 | % | |||||||||
| UKC Holdings Corp. | 6,900 | 128,700 | 2.52 | % | |||||||||
| UT Holdings Co., Ltd. | 150 | 80,797 | 1.58 | % | |||||||||
| 1,344,465 | 26.34 | % | |||||||||||
| Materials – 13.16% | |||||||||||||
| Fujikura Kasei Co., Ltd. | 25,200 | 106,381 | 2.08 | % | |||||||||
| Harima Chems Group | 12,500 | 57,466 | 1.13 | % | |||||||||
| Konishi Co., Ltd. | 8,000 | 119,754 | 2.35 | % | |||||||||
| Nippon Carbide Industries Co., Inc. | 29,000 | 71,928 | 1.41 | % | |||||||||
| Nippon Paper Group | 4,600 | 52,609 | 1.03 | % | |||||||||
| Okabe Co., Ltd. | 16,000 | 100,814 | 1.97 | % | |||||||||
| Ube Material Inds | 12,000 | 32,770 | 0.64 | % | |||||||||
| Yushiro Chemical | 13,600 | 130,327 | 2.55 | % | |||||||||
| 672,049 | 13.16 | % | |||||||||||
| Utilities – 1.95% | |||||||||||||
| Shizuokagas Co. | 14,000 | 99,612 | 1.95 | % | |||||||||
| Total Common Stocks | |||||||||||||
| (Cost $5,003,931) | 5,142,923 | 100.72 | % | ||||||||||
| SHORT-TERM INVESTMENTS – 1.66% | |||||||||||||
| Money Market Fund – 1.66% | |||||||||||||
| Fidelity Government Portfolio – | |||||||||||||
| Institutional Class, 0.01% (b) | 84,955 | 84,955 | 1.66 | % | |||||||||
| Total Money Market Fund | |||||||||||||
| (Cost $84,955) | 84,955 | 1.66 | % | ||||||||||
| Total Short-Term Investments | |||||||||||||
| (Cost $84,955) | 84,955 | 1.66 | % | ||||||||||
| Total Investments | |||||||||||||
| (Cost $5,088,886) – 102.38% | 5,227,878 | 102.38 | % | ||||||||||
| Liabilities in Excess | |||||||||||||
| of Other Assets – (2.38)% | (121,356 | ) | (2.38 | )% | |||||||||
TOTAL NET ASSETS – 100.00% | $ | 5,106,522 | 100.00 | % | |||||||||
Percentages are stated as a percent of net assets.
| (a) | Non-income producing security. |
| (b) | The rate listed is the fund’s 7-day yield as of October 31, 2012. |
The accompanying notes are an integral part of these financial statements.
WWW.HENNESSYFUNDS.COM
50
Summary of Fair Value Exposure at October 31, 2012
The following is a summary of the inputs used to value the Fund’s net assets as of October 31, 2012 (See Note 3 in the accompanying notes to the financial statements):
| Common Stock | Level 1 | Level 2 | Level 3 | Total | |||||||||||||
| Consumer Discretionary | $ | 803,362 | $ | — | $ | — | $ | 803,362 | |||||||||
| Consumer Staples | 51,954 | — | — | 51,954 | |||||||||||||
| Financials | 106,702 | — | — | 106,702 | |||||||||||||
| Industrials | 2,064,779 | — | — | 2,064,779 | |||||||||||||
| Information Technology | 1,344,465 | — | — | 1,344,465 | |||||||||||||
| Materials | 672,049 | — | — | 672,049 | |||||||||||||
| Utilities | 99,612 | — | — | 99,612 | |||||||||||||
| Total Common Stock | $ | 5,142,923 | $ | — | $ | — | $ | 5,142,923 | |||||||||
| Short-Term Investments | |||||||||||||||||
| Money Market Funds | $ | 84,955 | $ | — | $ | — | $ | 84,955 | |||||||||
| Total Short-Term Investments | $ | 84,955 | $ | — | $ | — | $ | 84,955 | |||||||||
| Total Investments in Securities | $ | 5,227,878 | $ | — | $ | — | $ | 5,227,878 | |||||||||
Transfers between levels are recognized at the end of the reporting period. During the period ended October 31, 2012, the Fund recognized all transfers between Levels 2 and 1.
Transfers between Level 2 and Level 1 relate to the use of a fair valuation pricing service. On days when the fair valuation pricing service is used, non-U.S. dollar denominated securities move from a Level 1 to a Level 2 classification. Due to the use of the fair value pricing service as described in Note 3, 100% of the common stocks held at October 31, 2011 were classified as Level 2. Such securities still held at October 31, 2012 were transferred to Level 1. Other than transfers due to the use of the fair value pricing service, no transfers were recognized.
The accompanying notes are an integral part of these financial statements.
HENNESSY FUNDS 1-800-966-4354
51
Financial Statements
Statements of Assets and Liabilities as of October 31, 2012 |
| HENNESSY | HENNESSY | ||||||||||||
| HENNESSY | CORNERSTONE | CORNERSTONE | |||||||||||
| CORNERSTONE | MID CAP 30 | LARGE GROWTH | |||||||||||
| GROWTH FUND | FUND | FUND | |||||||||||
| ASSETS: | |||||||||||||
| Investments in unaffiliated securities, at value (cost $272,278,473, $162,638,369, | |||||||||||||
| $100,797,513, $108,302,149, $106,648,525, $98,080,699, $23,542,488, | |||||||||||||
| $15,789,050 and $5,088,886, respectively) | $ | 301,312,799 | $ | 190,090,613 | $ | 109,224,729 | |||||||
| Investments in affiliated securities, at value (cost $0, $0, | |||||||||||||
| $420,211, $0, $0, $0, $0, $0 and $0, respectively | — | — | 564,570 | ||||||||||
| Cash | 960 | — | 6,391 | ||||||||||
| Dividends and interest receivable | 31,990 | 265,093 | 224,443 | ||||||||||
| Receivable for fund shares sold | 2,163,544 | 139,040 | 4,323 | ||||||||||
| Receivable for securities sold | — | 7,618 | — | ||||||||||
| Prepaid expenses and other assets | 39,686 | 26,755 | 25,322 | ||||||||||
| Total Assets | 303,548,979 | 190,529,119 | 110,049,778 | ||||||||||
| LIABILITIES: | |||||||||||||
| Payable for securities purchased | — | — | — | ||||||||||
| Payable for fund shares redeemed | 303,772 | 2,686,552 | 65,403 | ||||||||||
| Payable to Advisor | 180,177 | 122,844 | 64,209 | ||||||||||
| Payable to Administrator | 181,093 | 116,411 | 61,517 | ||||||||||
| Payable to Auditor | 37,828 | 40,189 | 38,909 | ||||||||||
| Accrued distribution fees | 5,355 | 1,250 | 1,623 | ||||||||||
| Accrued service fees | 21,786 | 13,866 | 6,537 | ||||||||||
| Reverse repurchase agreement | — | — | — | ||||||||||
| Accrued interest payable | 157 | 3,218 | 70 | ||||||||||
| Accrued directors fees | 3,094 | 3,144 | 3,105 | ||||||||||
| Accrued expenses and other payables | 104,798 | 69,995 | 33,219 | ||||||||||
| Total Liabilities | 838,060 | 3,057,469 | 274,592 | ||||||||||
| NET ASSETS | $ | 302,710,919 | $ | 187,471,650 | $ | 109,775,186 | |||||||
| NET ASSETS CONSIST OF: | |||||||||||||
| Capital stock | $ | 520,774,583 | $ | 204,115,102 | $ | 104,023,299 | |||||||
| Accumulated net investment income (loss) | (2,592,872 | ) | 1,029,849 | 1,080,454 | |||||||||
| Accumulated net realized gain (loss) on investments | (244,505,118 | ) | (45,125,545 | ) | (3,900,142 | ) | |||||||
| Unrealized net appreciation on investments | 29,034,326 | 27,452,244 | 8,571,575 | ||||||||||
| Total Net Assets | $ | 302,710,919 | $ | 187,471,650 | $ | 109,775,186 | |||||||
| NET ASSETS | |||||||||||||
| Investor Class: | |||||||||||||
| Shares authorized ($.0001 par value) | 25,000,000,000 | 25,000,000,000 | Unlimited | ||||||||||
| Net assets applicable to outstanding Investor Class shares | 265,600,452 | 145,846,928 | 75,832,638 | ||||||||||
| Shares issued and outstanding | 21,459,180 | 10,370,435 | 7,043,085 | ||||||||||
| Net asset value, offering price and redemption price per share | $ | 12.38 | $ | 14.06 | $ | 10.77 | |||||||
| Institutional Class: | |||||||||||||
| Shares authorized ($.0001 par value) | 25,000,000,000 | 25,000,000,000 | Unlimited | ||||||||||
| Net assets applicable to outstanding Institutional Class shares | 37,110,467 | 41,624,722 | 33,942,548 | ||||||||||
| Shares issued and outstanding | 2,951,325 | 2,908,254 | 3,127,989 | ||||||||||
| Net asset value, offering price and redemption price per share | $ | 12.57 | $ | 14.31 | $ | 10.85 | |||||||
The accompanying notes are an integral part of these financial statements.
WWW.HENNESSYFUNDS.COM
52
| HENNESSY | HENNESSY | HENNESSY | HENNESSY | HENNESSY | ||||||||||||||||||
| CORNERSTONE | LARGE | TOTAL RETURN | BALANCED | HENNESSY | JAPAN SMALL | |||||||||||||||||
| VALUE FUND | VALUE FUND | FUND | FUND | JAPAN FUND | CAP FUND | |||||||||||||||||
| $ | 127,652,703 | $ | 125,491,867 | $ | 106,475,456 | $ | 25,185,208 | $ | 19,251,381 | $ | 5,227,878 | |||||||||||
| — | — | — | — | — | — | |||||||||||||||||
| — | — | — | — | — | — | |||||||||||||||||
| 304,293 | 127,655 | 168,549 | 42,812 | 155,495 | 36,552 | |||||||||||||||||
| 20,732 | 8,094 | 234,589 | 5,001 | 57,204 | 17,021 | |||||||||||||||||
| — | 1,599,483 | — | — | — | 86,396 | |||||||||||||||||
| 26,692 | 22,084 | 16,720 | 10,985 | 19,845 | 14,230 | |||||||||||||||||
| 128,004,420 | 127,249,183 | 106,895,314 | 25,244,006 | 19,483,925 | 5,382,077 | |||||||||||||||||
| — | 1,831,281 | — | — | — | 14,053 | |||||||||||||||||
| 259,226 | 91,681 | 248,117 | — | 100,457 | 221,091 | |||||||||||||||||
| 81,603 | 91,323 | 39,979 | 12,940 | 16,290 | 5,399 | |||||||||||||||||
| 80,562 | 80,969 | 49,637 | 16,812 | 11,481 | 3,866 | |||||||||||||||||
| 20,392 | 19,574 | 18,705 | 16,470 | 19,139 | 17,660 | |||||||||||||||||
| — | — | 25,042 | 13,023 | — | — | |||||||||||||||||
| 10,813 | 10,739 | 6,663 | 2,157 | 877 | 450 | |||||||||||||||||
| — | — | 28,790,000 | — | — | — | |||||||||||||||||
| — | — | 10,063 | — | 19 | — | |||||||||||||||||
| 3,235 | 3,351 | 2,486 | 2,509 | 3,328 | 3,328 | |||||||||||||||||
| 27,284 | 29,820 | 33,835 | 10,319 | 14,113 | 9,708 | |||||||||||||||||
| 483,115 | 2,158,738 | 29,224,527 | 74,230 | 165,704 | 275,555 | |||||||||||||||||
| $ | 127,521,305 | $ | 125,090,445 | $ | 77,670,787 | $ | 25,169,776 | $ | 19,318,221 | $ | 5,106,522 | |||||||||||
| $ | 149,994,707 | $ | 135,081,967 | $ | 76,377,331 | $ | 24,793,394 | $ | 49,296,211 | $ | 3,913,887 | |||||||||||
| 2,446,268 | 1,060,739 | 78,405 | 2,932 | — | (57,735 | ) | ||||||||||||||||
| (44,270,224 | ) | (29,895,603 | ) | (7,179,706 | ) | (1,269,270 | ) | (33,436,445 | ) | 1,112,310 | ||||||||||||
| 19,350,554 | 18,843,342 | 8,394,757 | 1,642,720 | 3,458,455 | 138,060 | |||||||||||||||||
| $ | 127,521,305 | $ | 125,090,445 | $ | 77,670,787 | $ | 25,169,776 | $ | 19,318,221 | $ | 5,106,522 | |||||||||||
| 25,000,000,000 | Unlimited | 100,000,000 | 100,000,000 | Unlimited | Unlimited | |||||||||||||||||
| 124,989,938 | 125,033,860 | 77,670,787 | 25,169,776 | 10,382,773 | 5,106,522 | |||||||||||||||||
| 8,913,769 | 5,059,089 | 6,144,368 | 2,118,394 | 674,038 | 484,408 | |||||||||||||||||
| $ | 14.02 | $ | 24.71 | $ | 12.64 | $ | 11.88 | $ | 15.40 | $ | 10.54 | |||||||||||
| 25,000,000,000 | Unlimited | N/A | N/A | Unlimited | N/A | |||||||||||||||||
| 2,531,367 | 56,585 | N/A | N/A | 8,935,448 | N/A | |||||||||||||||||
| 180,337 | 2,279 | N/A | N/A | 572,688 | N/A | |||||||||||||||||
| $ | 14.04 | $ | 24.83 | N/A | N/A | $ | 15.60 | N/A | ||||||||||||||
HENNESSY FUNDS 1-800-966-4354
53
Financial Statements
Statements of Operations For the Year Ended October 31, 2012 |
| HENNESSY | HENNESSY | |||||||||||
| HENNESSY | CORNERSTONE | CORNERSTONE | ||||||||||
| CORNERSTONE | MID CAP 30 | LARGE GROWTH | ||||||||||
| GROWTH FUND | FUND | FUND | ||||||||||
| INVESTMENT INCOME: | ||||||||||||
Dividend income from unaffiliated securities(1) | $ | 1,465,565 | $ | 3,202,959 | $ | 2,062,487 | ||||||
| Dividend income from affiliated securities | — | — | — | |||||||||
| Interest income | 3,469 | 908 | 226 | |||||||||
| Total investment income | 1,469,034 | 3,203,867 | 2,062,713 | |||||||||
| EXPENSES: | ||||||||||||
| Investment advisory fees | 1,612,148 | 1,205,874 | 574,284 | |||||||||
| Administration, fund accounting, custody and transfer agent fees | 555,538 | 415,538 | 197,895 | |||||||||
| Distribution fees – Investor Class (See Note 6) | — | — | — | |||||||||
| Service fees – Investor Class (See Note 6) | 214,761 | 139,469 | 76,989 | |||||||||
| Federal and state registration fees | 31,975 | 38,642 | 35,094 | |||||||||
| Audit fees | 27,011 | 25,353 | 23,206 | |||||||||
| Legal fees | 5,521 | 5,521 | 5,020 | |||||||||
| Compliance expense | 10,925 | 10,925 | 10,925 | |||||||||
| Reports to shareholders | 61,166 | 42,617 | 16,319 | |||||||||
| Directors’ fees and expenses | 15,553 | 15,453 | 15,029 | |||||||||
| Sub-transfer agent expenses – Investor Class (See Note 6) | 342,871 | 240,406 | 19,637 | |||||||||
| Sub-transfer agent expenses – Institutional Class (See Note 6) | 588 | 14,108 | 29 | |||||||||
| Interest expense (See Notes 4 and 7) | 777 | 6,607 | — | |||||||||
| Other | 22,830 | 16,396 | 10,473 | |||||||||
| Total expenses before reimbursement from advisor | 2,901,664 | 2,176,909 | 984,900 | |||||||||
| Administration expense waiver (See Note 6) | (4,007 | ) | (42,487 | ) | (2,641 | ) | ||||||
| Net expenses | 2,897,657 | 2,134,422 | 982,259 | |||||||||
| NET INVESTMENT INCOME (LOSS) | (1,428,623 | ) | 1,069,445 | 1,080,454 | ||||||||
| REALIZED AND UNREALIZED GAINS (LOSSES): | ||||||||||||
| Net realized gain (loss) on: | ||||||||||||
| Investments from unaffiliated securities | 3,675,303 | 465,078 | 171,724 | |||||||||
| Investments from affiliated securities | — | — | — | |||||||||
| Change in unrealized appreciation on investments | 43,342,497 | 21,872,356 | 5,528,323 | |||||||||
| Net gain (loss) on investments | 47,017,800 | 22,337,434 | 5,700,047 | |||||||||
| NET INCREASE IN NET ASSETS RESULTING FROM OPERATIONS | $ | 45,589,177 | $ | 23,406,879 | $ | 6,780,501 | ||||||
(1) Net of foreign taxes withheld of $0, $0, $0, $194,035, $2,092, $0, $0 $30,259 and $18,352 respectively.
The accompanying notes are an integral part of these financial statements.
WWW.HENNESSYFUNDS.COM
54
| HENNESSY | HENNESSY | HENNESSY | HENNESSY | HENNESSY | ||||||||||||||||||
| CORNERSTONE | LARGE | TOTAL RETURN | BALANCED | HENNESSY | JAPAN SMALL | |||||||||||||||||
| VALUE FUND | VALUE FUND | FUND | FUND | JAPAN FUND | CAP FUND | |||||||||||||||||
| $ | 4,848,327 | $ | 3,201,079 | $ | 1,968,445 | $ | 420,859 | $ | 401,971 | $ | 248,588 | |||||||||||
| — | — | — | — | — | — | |||||||||||||||||
| 2,032 | 138 | 18,574 | 8,469 | 148 | 179 | |||||||||||||||||
| 4,850,359 | 3,201,217 | 1,987,019 | 429,328 | 402,119 | 248,767 | |||||||||||||||||
| 912,705 | 1,065,815 | 425,005 | 136,881 | 205,473 | 179,755 | |||||||||||||||||
| 314,513 | 319,745 | 180,627 | 58,174 | 52,396 | 38,198 | |||||||||||||||||
| — | — | 106,251 | 34,220 | — | — | |||||||||||||||||
| 121,418 | 125,342 | 70,834 | 22,814 | 10,851 | 14,980 | |||||||||||||||||
| 35,915 | 33,242 | 27,337 | 24,655 | 36,957 | 20,530 | |||||||||||||||||
| 23,671 | 22,550 | 21,456 | 19,070 | 21,703 | 20,212 | |||||||||||||||||
| 5,521 | 7,020 | 5,516 | 5,516 | 5,020 | 5,520 | |||||||||||||||||
| 10,925 | 10,925 | 10,925 | 10,925 | 10,925 | 10,925 | |||||||||||||||||
| 25,082 | 43,944 | 15,038 | 4,455 | 8,547 | 6,518 | |||||||||||||||||
| 15,427 | 15,305 | 10,587 | 10,688 | 15,282 | 15,293 | |||||||||||||||||
| 72,797 | 89,951 | 30,149 | 20,402 | 15,567 | 23,539 | |||||||||||||||||
| 1,874 | — | N/A | N/A | 5,132 | N/A | |||||||||||||||||
| 708 | — | 57,585 | — | 2,204 | 3,166 | |||||||||||||||||
| 15,079 | 14,859 | 8,912 | 3,147 | 10,078 | 10,086 | |||||||||||||||||
| 1,555,635 | 1,748,698 | 970,222 | 350,947 | 400,135 | 348,722 | |||||||||||||||||
| (4,229 | ) | (118 | ) | — | — | — | N/A | |||||||||||||||
| 1,551,406 | 1,748,580 | 970,222 | 350,947 | 400,135 | 348,722 | |||||||||||||||||
| 3,298,953 | 1,452,637 | 1,016,797 | 78,381 | 1,984 | (99,955 | ) | ||||||||||||||||
| 3,221,518 | 9,806,738 | 3,337,953 | 493,334 | (816,325 | ) | 2,043,302 | ||||||||||||||||
| — | — | — | — | — | — | |||||||||||||||||
| 8,250,584 | 7,541,982 | 3,331,681 | 918,830 | 2,653,253 | (380,675 | ) | ||||||||||||||||
| 11,472,102 | 17,348,720 | 6,669,634 | 1,412,164 | 1,836,928 | 1,662,627 | |||||||||||||||||
| $ | 14,771,055 | $ | 18,801,357 | $ | 7,686,431 | $ | 1,490,545 | $ | 1,838,912 | $ | 1,562,672 | |||||||||||
HENNESSY FUNDS 1-800-966-4354
55
Financial Statements
| Statements of Changes in Net Assets |
| Hennessy Cornerstone Growth Fund | ||||||||
| Year Ended | Year Ended | |||||||
| October 31, 2012 | October 31, 2011 | |||||||
| OPERATIONS: | ||||||||
| Net investment income (loss) | $ | (1,428,623 | ) | $ | (1,513,994 | ) | ||
| Net realized gain on securities | 3,675,303 | 39,880,443 | ||||||
| Change in unrealized appreciation (depreciation) on securities | 43,342,497 | (41,240,390 | ) | |||||
| Net increase (decrease) in net assets resulting from operations | 45,589,177 | (2,873,941 | ) | |||||
| DISTRIBUTIONS TO SHAREHOLDERS FROM: | ||||||||
| Net investment income – Investor Class | — | — | ||||||
| Net investment income – Institutional Class | — | — | ||||||
| Net realized gains – Investor Class | — | — | ||||||
| Net realized gains – Institutional Class | — | — | ||||||
| Total distributions | — | — | ||||||
| CAPITAL SHARE TRANSACTIONS: | ||||||||
| Proceeds from shares issued in the Reorganization – Investor Class (See Note 9) | — | 25,825,466 | ||||||
| Proceeds from shares issued in the Reorganization – Institutional Class (See Note 9) | 34,071,809 | 339,345 | ||||||
| Proceeds from shares subscribed – Investor Class | 90,544,279 | 5,686,546 | ||||||
| Proceeds from shares subscribed – Institutional Class | 418,215 | 120,828 | ||||||
| Dividends reinvested – Investor Class | — | — | ||||||
| Dividends reinvested – Institutional Class | — | — | ||||||
| Cost of shares redeemed – Investor Class | (54,063,454 | ) | (51,326,442 | ) | ||||
| Cost of shares redeemed – Institutional Class | (778,530 | ) | (1,075,812 | ) | ||||
| Net increase (decrease) in net assets derived from capital share transactions | 70,192,319 | (20,430,069 | ) | |||||
| TOTAL INCREASE (DECREASE) IN NET ASSETS | 115,781,496 | (23,304,010 | ) | |||||
| NET ASSETS: | ||||||||
| Beginning of period | 186,929,423 | 210,233,433 | ||||||
| End of period | $ | 302,710,919 | $ | 186,929,423 | ||||
| Accumulated net investment income (loss), end of period | $ | (2,592,872 | ) | $ | 16,688 | |||
| CHANGES IN SHARES OUTSTANDING: | ||||||||
| Shares issued in connection with Acquisition – Investor Class (See Note 9) | — | 2,524,476 | ||||||
| Shares issued in connection with Acquisition – Institutional Class (See Note 9) | 2,732,499 | 32,783 | ||||||
| Shares sold – Investor Class | 7,702,040 | 536,989 | ||||||
| Shares sold – Institutional Class | 35,989 | 11,197 | ||||||
| Shares issued to holders as reinvestment of dividends – Investor Class | — | — | ||||||
| Shares issued to holders as reinvestment of dividends – Institutional Class | — | — | ||||||
| Shares redeemed – Investor Class | (4,743,651 | ) | (4,705,581 | ) | ||||
| Shares redeemed – Institutional Class | (67,781 | ) | (94,611 | ) | ||||
| Net increase (decrease) in shares outstanding | 5,659,096 | (1,694,747 | ) | |||||
The accompanying notes are an integral part of these financial statements.
WWW.HENNESSYFUNDS.COM
56
| Hennessy Cornerstone Mid Cap 30 Fund | Hennessy Cornerstone Large Growth Fund | Hennessy Cornerstone Value Fund | ||||||||||||||||||||
| Year Ended | Year Ended | Year Ended | Year Ended | Year Ended | Year Ended | |||||||||||||||||
| October 31, 2012 | October 31, 2011 | October 31, 2012 | October 31, 2011 | October 31, 2012 | October 31, 2011 | |||||||||||||||||
| $ | 1,069,445 | $ | (1,184,998 | ) | $ | 1,080,454 | $ | 559,148 | $ | 3,298,953 | $ | 4,048,072 | ||||||||||
| 465,078 | 21,853,896 | 171,724 | 15,375,964 | 3,221,518 | 10,696,825 | |||||||||||||||||
| 21,872,356 | (10,298,635 | ) | 5,528,323 | (10,653,411 | ) | $ | 8,250,584 | (7,231,439 | ) | |||||||||||||
| 23,406,879 | 10,370,263 | 6,780,501 | 5,281,701 | 14,771,055 | 7,513,458 | |||||||||||||||||
| — | — | (557,836 | ) | (626,839 | ) | (3,784,445 | ) | (4,238,610 | ) | |||||||||||||
| — | — | (1,312 | ) | (968 | ) | (49,840 | ) | (44,764 | ) | |||||||||||||
| — | — | (15,350,002 | ) | (109,149 | ) | — | — | |||||||||||||||
| — | — | (25,963 | ) | (99 | ) | — | — | |||||||||||||||
| — | — | (15,935,113 | ) | (737,055 | ) | (3,834,285 | ) | (4,283,374 | ) | |||||||||||||
| — | — | — | — | — | — | |||||||||||||||||
| 16,374,686 | — | 33,698,161 | — | — | — | |||||||||||||||||
| 61,505,408 | 59,931,720 | 2,170,407 | 1,432,151 | 16,434,099 | 10,694,626 | |||||||||||||||||
| 4,266,258 | 7,761,938 | 51,923 | 88,409 | 1,336,353 | 83,602 | |||||||||||||||||
| — | — | 14,646,437 | 671,356 | 3,373,717 | 3,846,379 | |||||||||||||||||
| — | — | 27,274 | 1,067 | 37,743 | 25,543 | |||||||||||||||||
| (81,736,037 | ) | (45,594,300 | ) | (9,670,991 | ) | (7,591,682 | ) | (21,987,512 | ) | (57,199,244 | ) | |||||||||||
| (6,640,858 | ) | (6,751,235 | ) | (16,525 | ) | (21,081 | ) | (188,855 | ) | (323,943 | ) | |||||||||||
| (6,230,543 | ) | 15,348,123 | 40,906,686 | (5,419,780 | ) | (994,455 | ) | (42,873,037 | ) | |||||||||||||
| 17,176,336 | 25,718,386 | 31,752,074 | (875,134 | ) | 9,942,315 | (39,642,953 | ) | |||||||||||||||
| 170,295,314 | 144,576,928 | 78,023,112 | 78,898,246 | 117,578,990 | 157,221,943 | |||||||||||||||||
| $ | 187,471,650 | $ | 170,295,314 | $ | 109,775,186 | $ | 78,023,112 | $ | 127,521,305 | $ | 117,578,990 | |||||||||||
| $ | 1,029,849 | $ | — | $ | 1,080,454 | $ | 559,148 | $ | 2,446,268 | $ | 3,329,807 | |||||||||||
| — | — | — | — | — | — | |||||||||||||||||
| 1,154,875 | — | 3,110,613 | — | — | — | |||||||||||||||||
| 4,595,496 | 4,688,679 | 204,448 | 113,003 | 1,221,855 | 847,873 | |||||||||||||||||
| 312,388 | 598,584 | 4,836 | 7,307 | 100,889 | 6,843 | |||||||||||||||||
| — | — | 1,455,027 | 55,671 | 264,813 | 312,206 | |||||||||||||||||
| — | — | 2,689 | 88 | 2,967 | 2,077 | |||||||||||||||||
| (6,262,135 | ) | (3,673,362 | ) | (911,650 | ) | (610,123 | ) | (1,636,482 | ) | (4,539,225 | ) | |||||||||||
| (512,726 | ) | (538,511 | ) | (1,399 | ) | (1,715 | ) | (14,382 | ) | (25,568 | ) | |||||||||||
| (712,102 | ) | 1,075,390 | 3,864,564 | (435,769 | ) | (60,340 | ) | (3,395,794 | ) | |||||||||||||
HENNESSY FUNDS 1-800-966-4354
57
Financial Statements
| Statements of Changes in Net Assets |
| Hennessy Large Value Fund | ||||||||
| Year Ended | Year Ended | |||||||
| October 31, 2012 | October 31, 2011 | |||||||
| OPERATIONS: | ||||||||
| Net investment income (loss) | $ | 1,452,637 | $ | 1,283,875 | ||||
| Net realized gain (loss) on securities | 9,806,738 | 11,600,606 | ||||||
| Change in unrealized appreciation (depreciation) on securities | 7,541,982 | (5,464,551 | ) | |||||
| Net increase (decrease) in net assets resulting from operations | 18,801,357 | 7,419,930 | ||||||
| DISTRIBUTIONS TO SHAREHOLDERS FROM: | ||||||||
| Net investment income – Investor Class | (1,007,288 | ) | (1,291,601 | ) | ||||
| Net investment income – Institutional Class | (471 | ) | (582 | ) | ||||
| Net realized gains – Investor Class | — | — | ||||||
| Net realized gains – Institutional Class | — | — | ||||||
| Total distributions | (1,007,759 | ) | (1,292,183 | ) | ||||
| CAPITAL SHARE TRANSACTIONS: | ||||||||
| Proceeds from shares subscribed – Investor Class | 1,325,949 | 1,847,792 | ||||||
| Proceeds from shares subscribed – Institutional Class | 13,303 | 10,610 | ||||||
| Dividends reinvested – Investor Class | 961,881 | 1,235,299 | ||||||
| Dividends reinvested – Institutional Class | 471 | 528 | ||||||
| Cost of shares redeemed – Investor Class | (19,010,445 | ) | (16,781,736 | ) | ||||
| Cost of shares redeemed – Institutional Class | (289 | ) | (12,669 | ) | ||||
| Net increase (decrease) in net assets derived from capital share transactions | (16,709,130 | ) | (13,700,176 | ) | ||||
| TOTAL INCREASE (DECREASE) IN NET ASSETS | 1,084,468 | (7,572,429 | ) | |||||
| NET ASSETS: | ||||||||
| Beginning of period | 124,005,977 | 131,578,406 | ||||||
| End of period | $ | 125,090,445 | $ | 124,005,977 | ||||
| Accumulated net investment income (loss), end of period | $ | 1,060,739 | $ | 634,102 | ||||
| CHANGES IN SHARES OUTSTANDING: | ||||||||
| Shares sold – Investor Class | 56,881 | 84,224 | ||||||
| Shares sold – Institutional Class | 579 | 497 | ||||||
| Shares issued to holders as reinvestment of dividends – Investor Class | 43,942 | 56,743 | ||||||
| Shares issued to holders as reinvestment of dividends – Institutional Class | 21 | 24 | ||||||
| Shares redeemed – Investor Class | (817,082 | ) | (759,938 | ) | ||||
| Shares redeemed – Institutional Class | (13 | ) | (615 | ) | ||||
| Net increase (decrease) in shares outstanding | (715,672 | ) | (619,065 | ) | ||||
(1) Certain prior year balances have been reclassified to match current year presentation.
The accompanying notes are an integral part of these financial statements.
WWW.HENNESSYFUNDS.COM
58
| Hennessy Total Return Fund | Hennessy Balanced Fund | Hennessy Japan Fund | ||||||||||||||||||||
| Year Ended | Year Ended | Year Ended | Year Ended | Year Ended | Year Ended | |||||||||||||||||
| October 31, 2012 | October 31, 2011 | October 31, 2012 | October 31, 2011 | October 31, 2012 | October 31, 2011 | |||||||||||||||||
| $ | 1,016,797 | $ | 1,021,401 | $ | 78,381 | $ | 57,635 | $ | 1,984 | $ | (82,227 | ) | ||||||||||
| 3,337,953 | 3,288,471 | 493,334 | 498,835 | (816,325 | ) | 1,052,378 | ||||||||||||||||
| 3,331,681 | 2,165,518 | 918,830 | 310,456 | 2,653,253 | (4,618,650 | ) | ||||||||||||||||
| 7,686,431 | 6,475,390 | 1,490,545 | 866,926 | 1,838,912 | (3,648,499 | ) | ||||||||||||||||
| (1,013,041 | ) | (1,003,505 | ) | (81,724 | ) | (55,526 | ) | — | — | |||||||||||||
| N/A | N/A | N/A | N/A | — | — | |||||||||||||||||
| — | — | — | — | — | — | |||||||||||||||||
| N/A | N/A | N/A | N/A | — | — | |||||||||||||||||
| (1,013,041 | ) | (1,003,505 | ) | (81,724 | ) | (55,526 | ) | — | — | |||||||||||||
| 29,998,535 | 11,718,225 | 13,386,838 | 8,374,392 | 6,766,669 | 68,660,478 | |||||||||||||||||
| N/A | N/A | N/A | N/A | 157,102 | 1,179,768 | |||||||||||||||||
| 923,418 | 905,737 | 77,883 | 53,435 | — | — | |||||||||||||||||
| N/A | N/A | N/A | N/A | — | — | |||||||||||||||||
| (24,056,017 | ) | (23,040,187 | ) | (7,726,009 | ) | (3,720,748 | ) | (12,101,974 | ) | (68,498,669 | )(1) | |||||||||||
| N/A | N/A | N/A | N/A | (1,853,965 | ) | (16,765,426 | ) | |||||||||||||||
| 6,865,936 | (10,416,225 | ) | 5,738,712 | 4,707,079 | (7,032,168 | ) | (15,423,849 | ) | ||||||||||||||
| 13,539,326 | (4,944,340 | ) | 7,147,533 | 5,518,479 | (5,193,256 | ) | (19,072,348 | ) | ||||||||||||||
| 64,131,461 | 69,075,801 | 18,022,243 | 12,503,764 | 24,511,477 | 43,583,825 | |||||||||||||||||
| $ | 77,670,787 | $ | 64,131,461 | $ | 25,169,776 | $ | 18,022,243 | $ | 19,318,221 | $ | 24,511,477 | |||||||||||
| $ | 78,405 | $ | 74,649 | $ | 2,932 | $ | 6,275 | $ | — | $ | — | |||||||||||
| 2,462,738 | 1,061,206 | 1,156,321 | 760,081 | 460,787 | 4,803,522 | |||||||||||||||||
| N/A | N/A | N/A | N/A | 10,560 | 80,655 | |||||||||||||||||
| 74,537 | 81,262 | 6,678 | 4,931 | — | — | |||||||||||||||||
| N/A | N/A | N/A | N/A | — | — | |||||||||||||||||
| (1,983,914 | ) | (2,087,396 | ) | (663,666 | ) | (344,283 | ) | (845,443 | ) | (5,335,288 | ) | |||||||||||
| N/A | N/A | N/A | N/A | (124,185 | ) | (1,256,328 | ) | |||||||||||||||
| 553,361 | (944,928 | ) | 499,333 | 420,729 | (498,281 | ) | (1,707,439 | ) | ||||||||||||||
HENNESSY FUNDS 1-800-966-4354
59
Financial Statements
| Statements of Changes in Net Assets |
| Hennessy Japan Small Cap Fund | ||||||||
| Year Ended | Year Ended | |||||||
| October 31, 2012 | October 31, 2011 | |||||||
| OPERATIONS: | ||||||||
| Net investment income (loss) | $ | (99,955 | ) | $ | 41,453 | |||
| Net realized gain (loss) on securities | 2,043,302 | 1,413,091 | ||||||
| Change in unrealized appreciation (depreciation) on securities | (380,675 | ) | (331,017 | ) | ||||
| Net increase (decrease) in net assets resulting from operations | 1,562,672 | 1,123,527 | ||||||
| DISTRIBUTIONS TO SHAREHOLDERS FROM: | ||||||||
| Net investment income – Investor Class | (99,101 | ) | — | |||||
| Net investment income – Institutional Class | N/A | N/A | ||||||
| Net realized gains – Investor Class | — | — | ||||||
| Net realized gains – Institutional Class | N/A | N/A | ||||||
| Total distributions | (99,101 | ) | — | |||||
| CAPITAL SHARE TRANSACTIONS: | ||||||||
| Proceeds from shares subscribed – Investor Class | 2,526,353 | 18,301,075 | ||||||
| Proceeds from shares subscribed – Institutional Class | N/A | N/A | ||||||
| Dividends reinvested – Investor Class | 95,320 | — | ||||||
| Dividends reinvested – Institutional Class | N/A | N/A | ||||||
| Cost of shares redeemed – Investor Class | (23,061,781 | ) | (10,506,600 | )(1) | ||||
| Cost of shares redeemed – Institutional Class | N/A | N/A | ||||||
| Net increase (decrease) in net assets derived from capital share transactions | (20,440,108 | ) | 7,794,475 | |||||
| TOTAL INCREASE (DECREASE) IN NET ASSETS | (18,976,537 | ) | 8,918,002 | |||||
| NET ASSETS: | ||||||||
| Beginning of period | 24,083,059 | 15,165,057 | ||||||
| End of period | $ | 5,106,522 | $ | 24,083,059 | ||||
| Accumulated net investment income (loss), end of period | $ | (57,735 | ) | $ | (190,480 | ) | ||
| CHANGES IN SHARES OUTSTANDING: | ||||||||
| Shares sold – Investor Class | 235,392 | 1,751,882 | ||||||
| Shares sold – Institutional Class | N/A | N/A | ||||||
| Shares issued to holders as reinvestment of dividends – Investor Class | 9,570 | — | ||||||
| Shares issued to holders as reinvestment of dividends – Institutional Class | N/A | N/A | ||||||
| Shares redeemed – Investor Class | (2,148,260 | ) | (1,007,763 | ) | ||||
| Shares redeemed – Institutional Class | N/A | N/A | ||||||
| Net increase (decrease) in shares outstanding | (1,903,298 | ) | 744,119 | |||||
(1) Certain prior year balances have been reclassified to match current year presentation.
The accompanying notes are an integral part of these financial statements.
WWW.HENNESSYFUNDS.COM
60
Statement of Cash Flows
Hennessy Total Return Fund For the Year Ended October 31, 2012 |
| Cash Flows From Operating Activities: | ||||
| Net increase in net assets from operations | $ | 7,686,431 | ||
| Adjustments to reconcile net increase in net assets from operations to net cash used in operating activities: | ||||
| Purchase of investment securities | (266,722,396 | ) | ||
| Proceeds on sale of securities | 248,951,662 | |||
| Decrease in other receivables, net | 750,048 | |||
| Increase in other assets | (60 | ) | ||
| Increase in accrued expenses and other payables | 276,380 | |||
| Net accretion of discount on securities | (18,326 | ) | ||
| Net realized gain on investments | (3,337,953 | ) | ||
| Unrealized appreciation on securities | (3,331,681 | ) | ||
| Net cash used in operating activities | (15,745,895 | ) | ||
| Cash Flows From Financing Activities: | ||||
| Increase in reverse repurchase agreements | 9,893,000 | |||
| Proceeds on shares sold | 29,998,535 | |||
| Payment on shares repurchased | (24,056,017 | ) | ||
| Cash dividends paid, net of dividends reinvested | (89,623 | ) | ||
| Net cash provided by financing activities | 15,745,895 | |||
| Cash at beginning of year | — | |||
| Cash at end of year | — | |||
| Net increase (decrease) in cash | $ | — | ||
| Cash paid for interest | $ | 52,901 | ||
The accompanying notes are an integral part of these financial statements.
HENNESSY FUNDS 1-800-966-4354
61
Financial Highlights
| Hennessy Cornerstone Growth Fund |
For an Investor Class share (formerly Original Class share) outstanding throughout each year
| Year Ended October 31 | ||||||||||||||||||||
| 2012 | 2011 | 2010 | 2009 | 2008 | ||||||||||||||||
| PER SHARE DATA: | ||||||||||||||||||||
| Net asset value, beginning of year | $ | 9.97 | $ | 10.28 | $ | 8.81 | $ | 8.80 | $ | 19.4 | ||||||||||
| Income from investment operations: | ||||||||||||||||||||
| Net investment loss | (0.07 | ) | (0.08 | ) | (0.10 | ) | (0.04 | ) | (0.05 | ) | ||||||||||
| Net realized and unrealized gains (losses) on securities | 2.48 | (0.23 | ) | 1.57 | 0.05 | (8.32 | ) | |||||||||||||
| Total from investment operations | 2.41 | (0.31 | ) | 1.47 | 0.01 | (8.37 | ) | |||||||||||||
| Less Distributions: | ||||||||||||||||||||
| Dividends from net investment income | — | — | — | — | — | |||||||||||||||
| Dividends from net realized gains | — | — | — | — | (2.24 | ) | ||||||||||||||
| Total distributions | — | — | — | — | (2.24 | ) | ||||||||||||||
| Net asset value, end of period | $ | 12.38 | $ | 9.97 | $ | 10.28 | $ | 8.81 | $ | 8.80 | ||||||||||
| TOTAL RETURN | 24.17 | % | (3.02 | )% | 16.69 | % | 0.11 | % | (48.00 | )% | ||||||||||
| SUPPLEMENTAL DATA AND RATIOS: | ||||||||||||||||||||
| Net assets, end of period (millions) | $ | 265.60 | $ | 184.40 | $ | 207.11 | $ | 228.96 | $ | 312.50 | ||||||||||
| Ratio of expenses to average net assets | 1.34 | % | 1.33 | % | 1.34 | % | 1.36 | % | 1.25 | % | ||||||||||
| Ratio of net investment loss to average net assets | (0.66 | )% | (0.78 | )% | (0.89 | )% | (0.42 | )% | (0.29 | )% | ||||||||||
Portfolio turnover rate(1) | 90 | % | 106 | % | 103 | % | 108 | % | 103 | % | ||||||||||
(1) Portfolio turnover is calculated on the basis of the Fund as a whole.
The accompanying notes are an integral part of these financial statements.
WWW.HENNESSYFUNDS.COM
62
Financial Highlights
| Hennessy Cornerstone Growth Fund |
For an Institutional Class share outstanding throughout each period
| Period Ended | ||||||||||||||||||||
| Year Ended October 31, | October 31, | |||||||||||||||||||
| 2012 | 2011 | 2010 | 2009 | 2008(1) | ||||||||||||||||
| PER SHARE DATA: | ||||||||||||||||||||
| Net asset value, beginning of period | $ | 10.09 | $ | 10.37 | $ | 8.86 | $ | 8.82 | $ | 13.29 | ||||||||||
| Income from investment operations: | ||||||||||||||||||||
| Net investment income (loss) | (0.04 | ) | (0.05 | ) | (0.07 | ) | — | 0.01 | ||||||||||||
| Net realized and unrealized gains (losses) on securities | 2.52 | (0.23 | ) | 1.58 | 0.04 | (4.48 | ) | |||||||||||||
| Total from investment operations | 2.48 | (0.28 | ) | 1.51 | 0.04 | (4.47 | ) | |||||||||||||
| Less Distributions: | ||||||||||||||||||||
| Dividends from net investment income | — | — | — | — | — | |||||||||||||||
| Dividends from net realized gains | — | — | — | — | — | |||||||||||||||
| Total distributions | — | — | — | — | — | |||||||||||||||
| Net asset value, end of period | $ | 12.57 | $ | 10.09 | $ | 10.37 | $ | 8.86 | $ | 8.82 | ||||||||||
| TOTAL RETURN | 24.58 | % | (2.70 | )% | 17.04 | % | 0.45 | % | (34.13 | )%(2) | ||||||||||
| SUPPLEMENTAL DATA AND RATIOS: | ||||||||||||||||||||
| Net assets, end of period (millions) | $ | 37.11 | $ | 2.53 | $ | 3.12 | $ | 4.68 | $ | 5.09 | ||||||||||
| Ratio of expenses to average net assets: | ||||||||||||||||||||
| Before expense reimbursement | 1.11 | % | 1.09 | % | 1.09 | % | 1.11 | % | 1.12 | %(3) | ||||||||||
| After expense reimbursement | 0.98 | % | 0.98 | % | 0.98 | % | 0.98 | % | 0.98 | %(3) | ||||||||||
| Ratio of net investment income (loss) to average net assets: | ||||||||||||||||||||
| Before expense reimbursement | (0.38 | )% | (0.55 | )% | (0.64 | )% | (0.17 | )% | 0.15 | %(3) | ||||||||||
| After expense reimbursement | (0.51 | )% | (0.44 | )% | (0.53 | )% | (0.04 | )% | 0.29 | %(3) | ||||||||||
Portfolio turnover rate(4) | 90 | % | 106 | % | 103 | % | 108 | % | 103 | %(2) | ||||||||||
| (1) | Institutional Class shares commenced operations on March 3, 2008. |
| (2) | Not Annualized. |
| (3) | Annualized. |
| (4) | Portfolio turnover is calculated on the basis of the Fund as a whole. |
The accompanying notes are an integral part of these financial statements.
HENNESSY FUNDS 1-800-966-4354
63
Financial Highlights
| Hennessy Cornerstone Mid Cap 30 Fund (formerly the Hennessy Focus 30 Fund) |
For an Investor Class share (formerly Original Class share) outstanding throughout each year
| Year Ended October 31, | ||||||||||||||||||||
| 2012 | 2011 | 2010 | 2009 | 2008 | ||||||||||||||||
| PER SHARE DATA: | ||||||||||||||||||||
| Net asset value, beginning of year | $ | 12.15 | $ | 11.18 | $ | 8.73 | $ | 8.02 | $ | 13.67 | ||||||||||
| Income from investment operations: | ||||||||||||||||||||
| Net investment income (loss) | 0.08 | (0.09 | ) | (0.03 | ) | (0.02 | ) | (0.06 | ) | |||||||||||
| Net realized and unrealized gains (losses) on investments | 1.83 | 1.06 | 2.48 | 0.73 | (3.57 | ) | ||||||||||||||
| Total from investment operations | 1.91 | 0.97 | 2.45 | 0.71 | (3.63 | ) | ||||||||||||||
| Less Distributions: | ||||||||||||||||||||
| Dividends from net investment income | — | — | — | — | — | |||||||||||||||
| Dividends from net realized gains | — | — | — | — | (2.02 | ) | ||||||||||||||
| Total distributions | — | — | — | — | (2.02 | ) | ||||||||||||||
| Net asset value, end of period | $ | 14.06 | $ | 12.15 | $ | 11.18 | $ | 8.73 | $ | 8.02 | ||||||||||
| TOTAL RETURN | 15.72 | % | 8.68 | % | 28.06 | % | 8.85 | % | (30.81 | )% | ||||||||||
| SUPPLEMENTAL DATA AND RATIOS: | ||||||||||||||||||||
| Net assets, end of period (millions) | $ | 145.85 | $ | 146.23 | $ | 123.20 | $ | 128.36 | $ | 167.32 | ||||||||||
| Ratio of expenses to average net assets | 1.37 | % | 1.36 | % | 1.39 | % | 1.39 | % | 1.27 | % | ||||||||||
| Ratio of net investment income (loss) to average net assets | 0.59 | % | (0.79 | )% | (0.26 | )% | (0.20 | )% | (0.62 | )% | ||||||||||
Portfolio turnover rate(1) | 25 | % | 107 | % | 87 | % | 90 | % | 123 | % | ||||||||||
(1) Portfolio turnover is calculated on the basis of the Fund as a whole.
The accompanying notes are an integral part of these financial statements.
WWW.HENNESSYFUNDS.COM
64
Financial Highlights
| Hennessy Cornerstone Mid Cap 30 Fund (formerly the Hennessy Focus 30 Fund) |
For an Institutional Class share outstanding throughout each period
| Period Ended | ||||||||||||||||||||
| Year Ended October 31, | October 31, | |||||||||||||||||||
| 2012 | 2011 | 2010 | 2009 | 2008(1) | ||||||||||||||||
| PER SHARE DATA: | ||||||||||||||||||||
| Net asset value, beginning of period | $ | 12.32 | $ | 11.29 | $ | 8.78 | $ | 8.04 | $ | 11.15 | ||||||||||
| Income from investment operations: | ||||||||||||||||||||
| Net investment income (loss) | 0.09 | (0.05 | ) | 0.02 | 0.02 | (0.02 | ) | |||||||||||||
| Net realized and unrealized gains (losses) on investments | 1.90 | 1.08 | 2.49 | 0.72 | (3.09 | ) | ||||||||||||||
| Total from investment operations | 1.99 | 1.03 | 2.51 | 0.74 | (3.11 | ) | ||||||||||||||
| Less Distributions: | ||||||||||||||||||||
| Dividends from net investment income | — | — | — | — | — | |||||||||||||||
| Dividends from net realized gains | — | — | — | — | — | |||||||||||||||
| Total distributions | — | — | — | — | — | |||||||||||||||
| Net asset value, end of period | $ | 14.31 | $ | 12.32 | $ | 11.29 | $ | 8.78 | $ | 8.04 | ||||||||||
| TOTAL RETURN | 16.15 | % | 9.12 | % | 28.59 | % | 9.20 | % | (27.89 | )%(2) | ||||||||||
| SUPPLEMENTAL DATA AND RATIOS: | ||||||||||||||||||||
| Net assets, end of period (millions) | $ | 41.62 | $ | 24.06 | $ | 21.38 | $ | 27.44 | $ | 26.78 | ||||||||||
| Ratio of expenses to average net assets: | ||||||||||||||||||||
| Before expense reimbursement | 1.16 | % | 1.14 | % | 1.16 | % | 1.15 | % | 1.13 | %(3) | ||||||||||
| After expense reimbursement | 0.98 | % | 0.98 | % | 0.98 | % | 0.98 | % | 0.98 | %(3) | ||||||||||
| Ratio of net investment income (loss) to average net assets: | ||||||||||||||||||||
| Before expense reimbursement | 0.90 | % | (0.41 | )% | (0.03 | )% | 0.04 | % | (0.28 | )%(3) | ||||||||||
| After expense reimbursement | 1.08 | % | (0.57 | )% | 0.15 | % | 0.21 | % | (0.13 | )%(3) | ||||||||||
Portfolio turnover rate(4) | 25 | % | 107 | % | 87 | % | 90 | % | 123 | %(2) | ||||||||||
(1) Institutional Class shares commenced operations on March 3, 2008.
(2) Not Annualized.
(3) Annualized.
(4) Portfolio turnover is calculated on the basis of the Fund as a whole.
The accompanying notes are an integral part of these financial statements.
HENNESSY FUNDS 1-800-966-4354
65
Financial Highlights
| Hennessy Cornerstone Large Growth Fund |
For an Investor Class share (formerly Original Class share) outstanding throughout each period
| One Month | ||||||||||||||||||||||||
| Ended | Year Ended | |||||||||||||||||||||||
| Year Ended October 31, | October 31, | September 30, | ||||||||||||||||||||||
| 2012 | 2011 | 2010 | 2009(1) | 2009(2) | 2008(2) | |||||||||||||||||||
| PER SHARE DATA: | ||||||||||||||||||||||||
| Net asset value, beginning of period | $ | 12.37 | $ | 11.70 | $ | 9.49 | $ | 9.60 | $ | 10.09 | $ | 12.61 | ||||||||||||
| Income from investment operations: | ||||||||||||||||||||||||
| Net investment income (loss) | 0.13 | 0.09 | 0.09 | — | (3) | 0.05 | — | (3)(4) | ||||||||||||||||
| Net realized and unrealized gains (losses) on securities | 0.80 | 0.69 | 2.17 | (0.11 | ) | (0.54 | ) | (2.52 | ) | |||||||||||||||
| Total from investment operations | 0.93 | 0.78 | 2.26 | (0.11 | ) | (0.49 | ) | (2.52 | ) | |||||||||||||||
| Less Distributions: | ||||||||||||||||||||||||
| Dividends from net investment income | (0.07 | ) | (0.09 | ) | (0.05 | ) | — | — | — | |||||||||||||||
| Dividends from net realized gains | (2.46 | ) | (0.02 | ) | — | — | — | — | ||||||||||||||||
| Total distributions | (2.53 | ) | (0.11 | ) | (0.05 | ) | — | — | — | |||||||||||||||
| Net asset value, end of period | $ | 10.77 | $ | 12.37 | $ | 11.70 | $ | 9.49 | $ | 9.60 | $ | 10.09 | ||||||||||||
| TOTAL RETURN | 9.14 | % | 6.70 | % | 23.88 | % | (1.15 | )%(5) | (4.86 | )% | (19.98 | )% | ||||||||||||
| SUPPLEMENTAL DATA AND RATIOS: | ||||||||||||||||||||||||
| Net assets, end of period (millions) | $ | 75.83 | $ | 77.88 | $ | 78.83 | $ | 69.41 | $ | 70.61 | $ | 80.91 | ||||||||||||
| Ratio of expenses to average net assets: | ||||||||||||||||||||||||
| Before expense reimbursement/recoupment | 1.27 | % | 1.26 | % | 1.30 | % | 1.26 | %(6) | 1.40 | % | 1.16 | % | ||||||||||||
| After expense reimbursement/recoupment | 1.27 | % | 1.30 | % | 1.30 | % | 1.30 | %(6) | 1.17 | % | 0.98 | % | ||||||||||||
| Ratio of net investment income to average net assets: | ||||||||||||||||||||||||
| Before expense reimbursement/recoupment | 1.35 | % | 0.72 | % | 0.84 | % | (0.01 | )%(6) | 0.36 | % | (0.19 | )% | ||||||||||||
| After expense reimbursement/recoupment | 1.35 | % | 0.68 | % | 0.84 | % | (0.05 | )%(6) | 0.59 | % | (0.01 | )% | ||||||||||||
Portfolio turnover rate(7) | 0 | % | 70 | % | 83 | % | 0 | %(5) | 116 | % | 38 | % | ||||||||||||
| (1) | For the one month period ended October 31, 2009. Effective October 31, 2009, the Fund changed its fiscal year end to October 31st from September 30th. |
| (2) | The financial highlights set forth for periods prior to March 20, 2009 represent the historical financial highlights of the Tamarack Large Cap Growth Fund, Class S shares. The assets of the Tamarack Large Cap Growth Fund were acquired by the Hennessy Cornerstone Large Growth Fund on March 20, 2009. At the time RBC Global Asset Management (U.S.), Inc. (formerly known as Voyageur Asset Management Inc.) ceased to be investment advisor and Hennessy Advisors, Inc. became investment advisor. The return of the Tamarack Large Cap Growth Fund, Class S shares during the period October 1, 2008 through March 20, 2009 was (33.30)%. The return of the Hennessy Cornerstone Large Growth Fund, Original Class shares during the period March 20, 2009 through September 30, 2009 was 42.64%. |
| (3) | Amount is less than $0.01 or ($0.01) per share. |
| (4) | Per share net investment income (loss) has been calculated using the average daily shares method. |
| (5) | Not annualized. |
| (6) | Annualized. |
| (7) | Portfolio turnover is calculated on the basis of the Fund as a whole. |
The accompanying notes are an integral part of these financial statements.
WWW.HENNESSYFUNDS.COM
66
Financial Highlights
| Hennessy Cornerstone Large Growth Fund |
For an Institutional Class share outstanding throughout each period
| One Month | Period | |||||||||||||||||||
| Ended | Ended | |||||||||||||||||||
| Year Ended October 31, | October 31, | September 30, | ||||||||||||||||||
| 2012 | 2011 | 2010 | 2009(1) | 2009(2) | ||||||||||||||||
| PER SHARE DATA: | ||||||||||||||||||||
| Net asset value, beginning of period | $ | 12.44 | $ | 11.76 | $ | 9.51 | $ | 9.61 | $ | 6.73 | ||||||||||
| Income from investment operations: | ||||||||||||||||||||
| Net investment income | 0.07 | 0.08 | 0.10 | — | (3) | 0.03 | ||||||||||||||
| Net realized and unrealized gains (losses) on securities | 0.89 | 0.74 | 2.20 | (0.10 | ) | 2.85 | ||||||||||||||
| Total from investment operations | 0.96 | 0.82 | 2.30 | (0.10 | ) | 2.88 | ||||||||||||||
| Less Distributions: | ||||||||||||||||||||
| Dividends from net investment income | (0.09 | ) | (0.12 | ) | (0.05 | ) | — | — | ||||||||||||
| Dividends from net realized gains | (2.46 | ) | (0.02 | ) | — | — | — | |||||||||||||
| Total distributions | (2.55 | ) | (0.14 | ) | (0.05 | ) | — | — | ||||||||||||
| Net asset value, end of period | $ | 10.85 | $ | 12.44 | $ | 11.76 | $ | 9.51 | $ | 9.61 | ||||||||||
| TOTAL RETURN | 9.43 | % | 6.99 | % | 24.26 | % | (1.04 | )%(4) | 42.79 | %(4) | ||||||||||
| SUPPLEMENTAL DATA AND RATIOS: | ||||||||||||||||||||
| Net assets, end of period (millions) | $ | 33.94 | $ | 0.14 | $ | 0.07 | $ | 0.04 | $ | 0.04 | ||||||||||
| Ratio of expenses to average net assets: | ||||||||||||||||||||
| Before expense reimbursement | 1.41 | % | 1.14 | % | 1.16 | % | 1.14 | %(5) | 16.51 | %(5) | ||||||||||
| After expense reimbursement | 0.98 | % | 0.98 | % | 0.98 | % | 0.98 | %(5) | 0.98 | %(5) | ||||||||||
| Ratio of net investment income to average net assets: | ||||||||||||||||||||
| Before expense reimbursement | 6.44 | % | 0.81 | % | 0.90 | % | 0.12 | %(5) | (14.54 | )%(5) | ||||||||||
| After expense reimbursement | 6.87 | % | 0.97 | % | 1.08 | % | 0.28 | %(5) | 0.99 | %(5) | ||||||||||
Portfolio turnover rate(6) | 0 | % | 70 | % | 83 | % | 0 | %(4) | 116 | %(4) | ||||||||||
| (1) | For the one month period ended October 31, 2009. Effective October 31, 2009, the Fund changed its fiscal year end to October 31st from September 30th. |
| (2) | Institutional Class shares commenced operations on March 20, 2009. |
| (3) | Amount is less than $0.01 or ($0.01) per share. |
| (4) | Not annualized. |
| (5) | Annualized. |
| (6) | Portfolio turnover is calculated on the basis of the Fund as a whole. |
The accompanying notes are an integral part of these financial statements.
HENNESSY FUNDS 1-800-966-4354
67
Financial Highlights
| Hennessy Cornerstone Value Fund |
For an Investor Class share (formerly Original Class share) outstanding throughout each year
| Year Ended October 31, | ||||||||||||||||||||
| 2012 | 2011 | 2010 | 2009 | 2008 | ||||||||||||||||
| PER SHARE DATA: | ||||||||||||||||||||
| Net asset value, beginning of year | $ | 12.84 | $ | 12.53 | $ | 10.63 | $ | 9.05 | $ | 17.06 | ||||||||||
| Income from investment operations: | ||||||||||||||||||||
| Net investment income | 0.37 | 0.45 | 0.29 | 0.24 | 0.55 | |||||||||||||||
| Net realized and unrealized gains (losses) on investments | 1.23 | 0.23 | 1.81 | 1.87 | (8.15 | ) | ||||||||||||||
| Total from investment operations | 1.60 | 0.68 | 2.10 | 2.11 | (7.60 | ) | ||||||||||||||
| Less Distributions: | ||||||||||||||||||||
| Dividends from net investment income | (0.42 | ) | (0.37 | ) | (0.20 | ) | (0.53 | ) | (0.41 | ) | ||||||||||
| Dividends from net realized gains | — | — | — | — | — | |||||||||||||||
| Total distributions | (0.42 | ) | (0.37 | ) | (0.20 | ) | (0.53 | ) | (0.41 | ) | ||||||||||
| Net asset value, end of period | $ | 14.02 | $ | 12.84 | $ | 12.53 | $ | 10.63 | $ | 9.05 | ||||||||||
| TOTAL RETURN | 12.79 | % | 5.58 | % | 19.98 | % | 25.51 | % | (45.50 | )% | ||||||||||
| SUPPLEMENTAL DATA AND RATIOS: | ||||||||||||||||||||
| Net assets, end of period (millions) | $ | 124.99 | $ | 116.41 | $ | 155.87 | $ | 145.91 | $ | 97.10 | ||||||||||
| Ratio of expenses to average net assets | 1.26 | % | 1.31 | % | 1.29 | % | 1.27 | % | 1.20 | % | ||||||||||
| Ratio of net investment income to average net assets | 2.67 | % | 2.94 | % | 2.33 | % | 3.19 | % | 3.92 | % | ||||||||||
Portfolio turnover rate(1) | 47 | % | 40 | % | 91 | % | 59 | % | 53 | % | ||||||||||
(1) Portfolio turnover is calculated on the basis of the Fund as a whole.
The accompanying notes are an integral part of these financial statements.
WWW.HENNESSYFUNDS.COM
68
Financial Highlights
| Hennessy Cornerstone Value Fund |
For an Institutional Class share outstanding throughout each period
| Period Ended | ||||||||||||||||||||
| Year Ended October 31, | October 31, | |||||||||||||||||||
| 2012 | 2011 | 2010 | 2009 | 2008(1) | ||||||||||||||||
| PER SHARE DATA: | ||||||||||||||||||||
| Net asset value, beginning of period | $ | 12.86 | $ | 12.54 | $ | 10.63 | $ | 9.06 | $ | 13.79 | ||||||||||
| Income from investment operations: | ||||||||||||||||||||
| Net investment income | 0.45 | 0.36 | 0.30 | 0.30 | 0.34 | |||||||||||||||
| Net realized and unrealized gains (losses) on investments | 1.19 | 0.37 | 1.83 | 1.83 | (5.07 | ) | ||||||||||||||
| Total from investment operations | 1.64 | 0.73 | 2.13 | 2.13 | (4.73 | ) | ||||||||||||||
| Less Distributions: | ||||||||||||||||||||
| Dividends from net investment income | (0.46 | ) | (0.41 | ) | (0.22 | ) | (0.56 | ) | — | |||||||||||
| Dividends from net realized gains | — | — | — | — | — | |||||||||||||||
| Total distributions | (0.46 | ) | (0.41 | ) | (0.22 | ) | (0.56 | ) | — | |||||||||||
| Net asset value, end of period | $ | 14.04 | $ | 12.86 | $ | 12.54 | $ | 10.63 | $ | 9.06 | ||||||||||
| TOTAL RETURN | 13.13 | % | 6.00 | % | 20.31 | % | 25.87 | % | (34.30 | )%(2) | ||||||||||
| SUPPLEMENTAL DATA AND RATIOS: | ||||||||||||||||||||
| Net assets, end of period (millions) | $ | 2.53 | $ | 1.17 | $ | 1.35 | $ | 1.11 | $ | 0.87 | ||||||||||
| Ratio of expenses to average net assets: | ||||||||||||||||||||
| Before expense reimbursement | 1.20 | % | 1.14 | % | 1.10 | % | 1.13 | % | 1.14 | %(3) | ||||||||||
| After expense reimbursement | 0.98 | % | 0.98 | % | 0.98 | % | 0.98 | % | 0.98 | %(3) | ||||||||||
| Ratio of net investment income to average net assets: | ||||||||||||||||||||
| Before expense reimbursement | 2.72 | % | 3.04 | % | 2.52 | % | 3.33 | % | 4.94 | %(3) | ||||||||||
| After expense reimbursement | 2.94 | % | 3.20 | % | 2.64 | % | 3.48 | % | 5.10 | %(3) | ||||||||||
Portfolio turnover rate(4) | 47 | % | 40 | % | 91 | % | 59 | % | 53 | %(2) | ||||||||||
| (1) | Institutional Class shares commenced operations on March 3, 2008. |
| (2) | Not Annualized. |
| (3) | Annualized. |
| (4) | Portfolio turnover is calculated on the basis of the Fund as a whole. |
The accompanying notes are an integral part of these financial statements.
HENNESSY FUNDS 1-800-966-4354
69
Financial Highlights
| Hennessy Large Value Fund (formerly the Hennessy Select Large Value Fund) |
For a Investor Class share (formerly Original Class share) outstanding throughout each period
| One Month | ||||||||||||||||||||||||
| Ended | Year Ended | |||||||||||||||||||||||
| Year Ended October 31, | October 31, | September 30, | ||||||||||||||||||||||
| 2012 | 2011 | 2010 | 2009(1) | 2009(2) | 2008(2) | |||||||||||||||||||
| PER SHARE DATA: | ||||||||||||||||||||||||
| Net asset value, beginning of period | $ | 21.47 | $ | 20.57 | $ | 18.88 | $ | 19.49 | $ | 21.80 | $ | 43.12 | ||||||||||||
| Income from investment operations: | ||||||||||||||||||||||||
| Net investment income | 0.28 | 0.22 | 0.14 | 0.01 | 0.31 | 0.42 | (3) | |||||||||||||||||
| Net realized and unrealized gains (losses) on securities | 3.14 | 0.89 | 1.78 | (0.62 | ) | (2.21 | ) | (7.43 | ) | |||||||||||||||
| Total from investment operations | 3.42 | 1.11 | 1.92 | (0.61 | ) | (1.90 | ) | (7.01 | ) | |||||||||||||||
| Less Distributions: | ||||||||||||||||||||||||
| Dividends from net investment income | (0.18 | ) | (0.21 | ) | (0.23 | ) | — | (0.41 | ) | (0.78 | ) | |||||||||||||
| Dividends from net realized gains | — | — | — | — | — | (13.53 | ) | |||||||||||||||||
| Total distributions | (0.18 | ) | (0.21 | ) | (0.23 | ) | — | (0.41 | ) | (14.31 | ) | |||||||||||||
| Net asset value, end of period | $ | 24.71 | $ | 21.47 | $ | 20.57 | $ | 18.88 | $ | 19.49 | $ | 21.80 | ||||||||||||
| TOTAL RETURN | 16.07 | % | 5.36 | % | 10.22 | % | (3.13 | )%(5) | (8.43 | )% | (22.42 | )% | ||||||||||||
| SUPPLEMENTAL DATA AND RATIOS: | ||||||||||||||||||||||||
| Net assets, end of period (millions) | $ | 125.00 | $ | 123.97 | $ | 131.54 | $ | 132.77 | $ | 138.34 | $ | 174.23 | ||||||||||||
| Ratio of expenses to average net assets: | ||||||||||||||||||||||||
| Before expense reimbursement | 1.40 | % | 1.38 | % | 1.41 | % | 1.37 | %(6) | 1.42 | % | 1.22 | % | ||||||||||||
| After expense reimbursement | 1.40 | % | 1.38 | % | 1.38 | % | 1.30 | %(6) | 1.17 | % | 1.02 | % | ||||||||||||
| Ratio of net investment income to average net assets: | ||||||||||||||||||||||||
| Before expense reimbursement | 1.16 | % | 0.97 | % | 0.64 | % | 0.28 | %(6) | 1.46 | % | 1.32 | % | ||||||||||||
| After expense reimbursement | 1.16 | % | 0.97 | % | 0.67 | % | 0.35 | %(6) | 1.71 | % | 1.52 | % | ||||||||||||
Portfolio turnover rate(4) | 111 | % | 149 | % | 146 | % | 10 | %(5) | 142 | % | 162 | % | ||||||||||||
| (1) | For the one month ended October 31, 2009. Effective October 31, 2009, the Fund changed its fiscal year end to October 31st from September 30th. |
| (2) | The financial highlights set forth for periods prior to March 20, 2009 represent the historical financial highlights of the Tamarack Value Fund, Class S shares. The assets of the Tamarack Value Fund were acquired by the Hennessy Select Large Value Fund on March 20, 2009. Prior to the reorganization, Tamarack Value Fund also offered Class A, Class C and R shares. At that time RBC Global Asset Management (U.S.), Inc., (formerly known as Voyageur Asset Management Inc.) ceased to be investment advisor and Hennessy Advisors, Inc. became investment advisor. The return of the Tamarack Value Fund, Class S shares during the period October 1, 2008 through March 20, 2009 was (33.09)%. The return of the Hennessy Select Large Value Fund, Original Class shares during the period March 20, 2009 through September 30, 2009 was 36.84%. |
| (3) | Per share net investment income (loss) has been calculated using the average daily shares method. |
| (4) | Portfolio turnover is calculated on the basis of the Fund as a whole. |
| (5) | Not annualized. |
| (6) | Annualized. |
The accompanying notes are an integral part of these financial statements.
WWW.HENNESSYFUNDS.COM
70
Financial Highlights
| Hennessy Large Value Fund (formerly the Hennessy Select Large Value Fund) |
For an Institutional Class share outstanding throughout each period
| One Month | Period | |||||||||||||||||||
| Ended | Ended | |||||||||||||||||||
| Year Ended October 31, | October 31, | September 30, | ||||||||||||||||||
| 2012 | 2011 | 2010 | 2009(1) | 2009(2) | ||||||||||||||||
| PER SHARE DATA: | ||||||||||||||||||||
| Net asset value, beginning of period | $ | 21.56 | $ | 20.65 | $ | 18.92 | $ | 19.53 | $ | 14.25 | ||||||||||
| Income from investment operations: | ||||||||||||||||||||
| Net investment income (loss) | 0.39 | 0.27 | 0.21 | — | (3) | 0.08 | ||||||||||||||
| Net realized and unrealized gains (losses) on securities | 3.15 | 0.92 | 1.80 | (0.61 | ) | 5.20 | ||||||||||||||
| Total from investment operations | 3.54 | 1.19 | 2.01 | (0.61 | ) | 5.28 | ||||||||||||||
| Less Distributions: | ||||||||||||||||||||
| Dividends from net investment income | (0.27 | ) | (0.28 | ) | (0.28 | ) | — | — | ||||||||||||
| Dividends from net realized gains | — | — | — | — | — | |||||||||||||||
| Total distributions | (0.27 | ) | (0.28 | ) | (0.28 | ) | — | — | ||||||||||||
| Net asset value, end of period | $ | 24.83 | $ | 21.56 | $ | 20.65 | $ | 18.92 | $ | 19.53 | ||||||||||
| TOTAL RETURN | 16.58 | % | 5.76 | % | 10.65 | % | (3.12 | )%(4) | 37.05 | %(4) | ||||||||||
| SUPPLEMENTAL DATA AND RATIOS: | ||||||||||||||||||||
| Net assets, end of period (millions) | $ | 0.06 | $ | 0.04 | $ | 0.04 | $ | 0.03 | $ | 0.03 | ||||||||||
| Ratio of expenses to average net assets: | ||||||||||||||||||||
| Before expense reimbursement | 1.22 | % | 1.21 | % | 1.22 | % | 1.20 | %(5) | 26.18 | %(5) | ||||||||||
| After expense reimbursement | 0.98 | % | 0.98 | % | 0.98 | % | 0.98 | %(5) | 0.98 | %(5) | ||||||||||
| Ratio of net investment income to average net assets: | ||||||||||||||||||||
| Before expense reimbursement | 1.29 | % | 1.13 | % | 0.80 | % | 0.44 | %(5) | (24.06 | )%(5) | ||||||||||
| After expense reimbursement | 1.53 | % | 1.36 | % | 1.04 | % | 0.66 | %(5) | 1.14 | %(5) | ||||||||||
Portfolio turnover rate(6) | 111 | % | 149 | % | 146 | % | 10 | %(4) | 142 | %(4) | ||||||||||
| (1) | For the one month ended October 31, 2009. Effective October 31, 2009, the Fund changed its fiscal year end to October 31st from September 30th. |
| (2) | Institutional Class shares commenced operations on March 20, 2009. |
| (3) | Amount is less than $0.01 or $(0.01). |
| (4) | Not annualized. |
| (5) | Annualized. |
| (6) | Portfolio turnover is calculated on the basis of the Fund as a whole. |
The accompanying notes are an integral part of these financial statements.
HENNESSY FUNDS 1-800-966-4354
71
Financial Highlights
| Hennessy Total Return Fund |
For an Investor Class share (formerly Original Class share) outstanding throughout each year
| Year Ended October 31, | ||||||||||||||||||||
| 2012 | 2011 | 2010 | 2009 | 2008 | ||||||||||||||||
| PER SHARE DATA: | ||||||||||||||||||||
| Net asset value, beginning of year | $ | 11.47 | $ | 10.57 | $ | 9.10 | $ | 9.22 | $ | 13.73 | ||||||||||
| Income from investment operations: | ||||||||||||||||||||
| Net investment income | 0.18 | 0.18 | 0.16 | 0.18 | 0.28 | |||||||||||||||
| Net realized and unrealized gains (losses) on securities | 1.17 | 0.89 | 1.48 | (0.14 | ) | (4.49 | ) | |||||||||||||
| Total from investment operations | 1.35 | 1.07 | 1.64 | 0.04 | (4.21 | ) | ||||||||||||||
| Less Distributions: | ||||||||||||||||||||
| Dividends from net investment income | (0.18 | ) | (0.17 | ) | (0.17 | ) | (0.16 | ) | (0.30 | ) | ||||||||||
| Dividends from realized capital gains | — | — | — | — | — | |||||||||||||||
| Total distributions | (0.18 | ) | (0.17 | ) | (0.17 | ) | (0.16 | ) | (0.30 | ) | ||||||||||
| Net asset value, end of period | $ | 12.64 | $ | 11.47 | $ | 10.57 | $ | 9.10 | $ | 9.22 | ||||||||||
| TOTAL RETURN | 11.78 | % | 10.22 | % | 18.09 | % | 0.69 | % | (30.97 | )% | ||||||||||
| SUPPLEMENTAL DATA AND RATIOS: | ||||||||||||||||||||
| Net assets, end of period (millions) | $ | 77.67 | $ | 64.13 | $ | 69.08 | $ | 52.38 | $ | 58.22 | ||||||||||
Gross ratio of expenses, including interest expense, to average net assets | 1.37 | % | 1.34 | % | 1.33 | % | 1.56 | % | 2.36 | % | ||||||||||
| Ratio of interest expense to average net assets | 0.08 | % | 0.10 | % | 0.08 | % | 0.29 | % | 1.16 | % | ||||||||||
Net ratio of expenses, excluding interest expense, to average net assets | 1.29 | % | 1.24 | % | 1.25 | % | 1.27 | % | 1.20 | % | ||||||||||
| Ratio of net investment income to average net assets | 1.44 | % | 1.56 | % | 1.62 | % | 2.12 | % | 2.43 | % | ||||||||||
| Portfolio turnover rate | 22 | % | 21 | % | 41 | % | 41 | % | 16 | % | ||||||||||
The accompanying notes are an integral part of these financial statements.
WWW.HENNESSYFUNDS.COM
72
Financial Highlights
| Hennessy Balanced Fund |
For an Investor Class share (formerly Original Class share) outstanding throughout each year
| Year Ended October 31, | ||||||||||||||||||||
| 2012 | 2011 | 2010 | 2009 | 2008 | ||||||||||||||||
| PER SHARE DATA: | ||||||||||||||||||||
| Net asset value, beginning of year | $ | 11.13 | $ | 10.43 | $ | 9.48 | $ | 9.11 | $ | 12.51 | ||||||||||
| Income from investment operations: | ||||||||||||||||||||
| Net investment income | 0.04 | 0.05 | 0.05 | 0.10 | 0.25 | |||||||||||||||
| Net realized and unrealized gains (losses) on securities | 0.75 | 0.70 | 0.95 | 0.38 | (2.80 | ) | ||||||||||||||
| Total from investment operations | 0.79 | 0.75 | 1.00 | 0.48 | (2.55 | ) | ||||||||||||||
| Less Distributions: | ||||||||||||||||||||
| Dividends from net investment income | (0.04 | ) | (0.05 | ) | (0.05 | ) | (0.11 | ) | (0.26 | ) | ||||||||||
| Dividends from realized capital gains | — | — | — | — | (0.59 | ) | ||||||||||||||
| Total distributions | (0.04 | ) | (0.05 | ) | (0.05 | ) | (0.11 | ) | (0.85 | ) | ||||||||||
| Net asset value, end of period | $ | 11.88 | $ | 11.13 | $ | 10.43 | $ | 9.48 | $ | 9.11 | ||||||||||
| TOTAL RETURN | 7.13 | % | 7.16 | % | 10.53 | % | 5.46 | % | (21.55 | )% | ||||||||||
| SUPPLEMENTAL DATA AND RATIOS: | ||||||||||||||||||||
| Net assets, end of period (millions) | $ | 25.17 | $ | 18.02 | $ | 12.50 | $ | 11.47 | $ | 11.46 | ||||||||||
| Ratio of net expenses to average net assets | 1.54 | % | 1.61 | % | 1.65 | % | 1.73 | % | 1.56 | % | ||||||||||
| Ratio of net investment income to average net assets | 0.34 | % | 0.42 | % | 0.45 | % | 1.17 | % | 2.31 | % | ||||||||||
| Portfolio turnover rate | 17 | % | 39 | % | 57 | % | 46 | % | 13 | % | ||||||||||
The accompanying notes are an integral part of these financial statements.
HENNESSY FUNDS 1-800-966-4354
73
Financial Highlights
| Hennessy Japan Fund (formerly the Hennessy Select SPARX Japan Fund) |
For an Investor Class share (formerly Original Class share) outstanding throughout each year
| Year Ended October 31, | ||||||||||||||||||||
| 2012 | 2011 | 2010 | 2009(1) | 2008(1) | ||||||||||||||||
| PER SHARE DATA: | ||||||||||||||||||||
| Net asset value, beginning of year | $ | 13.99 | $ | 12.58 | $ | 11.38 | $ | 9.73 | $ | 16.24 | ||||||||||
| Income from investment operations: | ||||||||||||||||||||
| Net investment income (loss) | (0.02 | ) | (0.10 | ) | (0.04 | ) | 0.02 | 0.05 | ||||||||||||
| Net realized and unrealized gains (losses) on securities | 1.43 | 1.51 | 1.25 | 1.66 | (6.56 | ) | ||||||||||||||
| Total from investment operations | 1.41 | 1.41 | 1.21 | 1.68 | (6.51 | ) | ||||||||||||||
| Less Distributions: | ||||||||||||||||||||
| Dividends from net investment income | — | — | (0.01 | ) | (0.03 | ) | — | |||||||||||||
| Dividends from net realized gains | — | — | — | — | — | |||||||||||||||
| Return of capital | — | — | (0.01 | ) | — | — | ||||||||||||||
| Total distributions | — | — | (0.02 | ) | (0.03 | ) | — | |||||||||||||
| Redemption fees retained | — | — | 0.01 | — | (2) | — | (2) | |||||||||||||
| Net asset value, end of period | $ | 15.40 | $ | 13.99 | $ | 12.58 | $ | 11.38 | $ | 9.73 | ||||||||||
| TOTAL RETURN | 10.08 | % | 11.21 | % | 11.04 | % | 17.36 | % | (40.09 | )% | ||||||||||
| SUPPLEMENTAL DATA AND RATIOS: | ||||||||||||||||||||
| Net assets, end of period (millions) | $ | 10.38 | $ | 14.81 | $ | 20.01 | $ | 28.29 | $ | 15.86 | ||||||||||
| Ratio of expenses to average net assets: | ||||||||||||||||||||
| Before expense reimbursement | 2.03 | % | 1.86 | % | 1.71 | % | 1.75 | % | 1.72 | % | ||||||||||
| After expense reimbursement | 2.03 | % | 1.86 | % | 1.59 | % | 1.24 | % | 1.25 | % | ||||||||||
| Ratio of net investment income (loss) to average net assets: | ||||||||||||||||||||
| Before expense reimbursement | (0.09 | )% | (0.54 | )% | (0.27 | )% | (0.34 | )% | (0.10 | )% | ||||||||||
| After expense reimbursement | (0.09 | )% | (0.54 | )% | (0.15 | )% | 0.17 | % | 0.37 | % | ||||||||||
Portfolio turnover rate(3) | 2 | % | 166 | % | 8 | % | 17 | % | 35 | % | ||||||||||
| (1) | The financial highlights set forth for periods prior to September 17, 2009 represent the historical financial highlights of the SPARX Japan Fund. On September 17, 2009 Hennessy Advisors, Inc., became the investment advisor to the Fund and the Fund changed its name to Hennessy Select SPARX Japan Fund. |
| (2) | Amount is less than $0.01. |
| (3) | Portfolio turnover is calculated on the basis of the Fund as a whole. |
The accompanying notes are an integral part of these financial statements.
WWW.HENNESSYFUNDS.COM
74
Financial Highlights
| Hennessy Japan Fund (formerly the Hennessy Select SPARX Japan Fund) |
For an Institutional Class share outstanding throughout each year
| Year Ended October 31, | ||||||||||||||||||||
| 2012 | 2011 | 2010 | 2009(1) | 2008(1) | ||||||||||||||||
| PER SHARE DATA: | ||||||||||||||||||||
| Net asset value, beginning of period | $ | 14.14 | $ | 12.66 | $ | 11.44 | $ | 9.78 | $ | 16.33 | ||||||||||
| Income from investment operations: | ||||||||||||||||||||
| Net investment income (loss) | 0.02 | 0.03 | 0.01 | 0.03 | 0.05 | |||||||||||||||
| Net realized and unrealized gains (losses) on securities | 1.44 | 1.45 | 1.23 | 1.66 | (6.60 | ) | ||||||||||||||
| Total from investment operations | 1.46 | 1.48 | 1.24 | 1.69 | (6.55 | ) | ||||||||||||||
| Less Distributions: | ||||||||||||||||||||
| Dividends from net investment income | — | — | (0.01 | ) | (0.03 | ) | — | |||||||||||||
| Dividends from net realized gains | — | — | — | — | — | |||||||||||||||
| Return of capital | — | — | (0.01 | ) | — | — | ||||||||||||||
| Total distributions | — | — | (0.02 | ) | (0.03 | ) | — | |||||||||||||
| Redemption fees retained | — | — | — | — | (2) | — | (2) | |||||||||||||
| Net asset value, end of period | $ | 15.60 | $ | 14.14 | $ | 12.66 | $ | 11.44 | $ | 9.78 | ||||||||||
| TOTAL RETURN | 10.33 | % | 11.69 | % | 11.07 | % | 17.37 | % | (40.11 | )% | ||||||||||
| SUPPLEMENTAL DATA AND RATIOS: | ||||||||||||||||||||
| Net assets, end of period (millions) | $ | 8.94 | $ | 9.70 | $ | 23.57 | $ | 25.55 | $ | 37.03 | ||||||||||
| Ratio of expenses to average net assets: | ||||||||||||||||||||
| Before expense reimbursement | 1.85 | % | 1.64 | % | 1.45 | % | 1.75 | % | 1.72 | % | ||||||||||
| After expense reimbursement | 1.85 | % | 1.64 | % | 1.40 | % | 1.24 | % | 1.25 | % | ||||||||||
| Ratio of net investment income (loss) to average net assets: | ||||||||||||||||||||
| Before expense reimbursement | 0.13 | % | 0.19 | % | 0.02 | % | (0.34 | )% | (0.10 | )% | ||||||||||
| After expense reimbursement | 0.13 | % | 0.19 | % | 0.07 | % | 0.17 | % | 0.37 | % | ||||||||||
Portfolio turnover rate(3) | 2 | % | 166 | % | 8 | % | 17 | % | 35 | % | ||||||||||
| (1) | The financial highlights set forth for periods prior to September 17, 2009 represent the historical financial highlights of the SPARX Japan Fund. On September 17, 2009 Hennessy Advisors, Inc., became the investment advisor to the Fund and the Fund changed its name to Hennessy Select SPARX Japan Fund. |
| (2) | Amount is less than $0.01 or $(0.01). |
| (3) | Portfolio turnover is calculated on the basis of the Fund as a whole. |
The accompanying notes are an integral part of these financial statements.
HENNESSY FUNDS 1-800-966-4354
75
Financial Highlights
| Hennessy Japan Small Cap Fund (formerly the Hennessy Select SPARX Japan Smaller Companies Fund) |
For an Investor Class share (formerly Original Class share) outstanding throughout each year
| Year Ended October 31, | ||||||||||||||||||||
| 2012 | 2011 | 2010 | 2009(1) | 2008(1) | ||||||||||||||||
| PER SHARE DATA: | ||||||||||||||||||||
| Net asset value, beginning of period | $ | 10.09 | $ | 9.23 | $ | 9.74 | $ | 6.87 | $ | 10.98 | ||||||||||
| Income from investment operations: | ||||||||||||||||||||
| Net investment income (loss) | (0.68 | ) | 0.06 | — | (2) | 0.07 | 0.02 | (3) | ||||||||||||
| Net realized and unrealized gains (losses) on securities | 1.17 | 0.80 | (0.10 | ) | 2.80 | (4.08 | ) | |||||||||||||
| Total from investment operations | 0.49 | 0.86 | (0.10 | ) | 2.87 | (4.06 | ) | |||||||||||||
| Less Distributions: | ||||||||||||||||||||
| Dividends from net investment income | (0.04 | ) | — | (0.42 | ) | — | (0.07 | ) | ||||||||||||
| Dividends from net realized gains | — | — | — | — | — | |||||||||||||||
| Total distributions | (0.04 | ) | — | (0.42 | ) | — | (0.07 | ) | ||||||||||||
| Redemption fees retained | — | — | 0.01 | — | (2) | 0.02 | ||||||||||||||
| Net asset value, end of period | $ | 10.54 | $ | 10.09 | $ | 9.23 | $ | 9.74 | $ | 6.87 | ||||||||||
| TOTAL RETURN | 4.91 | % | 9.32 | % | (0.72 | )% | 41.78 | % | (37.00 | )% | ||||||||||
| SUPPLEMENTAL DATA AND RATIOS: | ||||||||||||||||||||
| Net assets, end of period (millions) | $ | 5.11 | $ | 24.08 | $ | 15.17 | $ | 16.20 | $ | 11.74 | ||||||||||
| Ratio of expenses to average net assets: | ||||||||||||||||||||
| Before expense reimbursement | 2.33 | % | 2.10 | % | 2.14 | % | 3.10 | % | 4.47 | % | ||||||||||
| After expense reimbursement | 2.33 | % | 2.10 | % | 2.01 | % | 1.60 | % | 1.60 | % | ||||||||||
| Ratio of net investment income (loss) to average net assets: | ||||||||||||||||||||
| Before expense reimbursement | (0.66 | )% | 0.17 | % | (0.14 | )% | (0.86 | )% | (2.60 | )% | ||||||||||
| After expense reimbursement | (0.66 | )% | 0.17 | % | (0.01 | )% | 0.64 | % | 0.26 | % | ||||||||||
| Portfolio turnover rate | 49 | % | 61 | % | 100 | % | 138 | % | 55 | % | ||||||||||
| (1) | The financial highlights set forth for periods prior to September 17, 2009 represent the historical financial highlights of the SPARX Japan Smaller Companies Fund. On September 17, 2009 Hennessy Advisors, Inc., became the investment advisor to the Fund and the Fund changed its name to Hennessy Select SPARX Japan Smaller Companies Fund. |
| (2) | Amount is less than $0.01 or $(0.01). |
| (3) | Calculated based on average shares outstanding. |
The accompanying notes are an integral part of these financial statements.
WWW.HENNESSYFUNDS.COM
76
Notes to the Financial Statements
October 31, 2012
1). ORGANIZATION
The Hennessy Cornerstone Growth Fund (the “Growth Fund”), Hennessy Cornerstone Mid Cap 30 Fund (the “Mid Cap 30 Fund”, formerly known as the Hennessy Focus 30 Fund), and the Hennessy Cornerstone Value Fund (the “Value Fund”), are each series of Hennessy Mutual Funds, Inc., which was organized as a Maryland corporation on May 20, 1996. These Funds are open-end, diversified management investment companies registered under the Investment Company Act of 1940, as amended (the “1940 Act”). The investment objective of both the Growth Fund and Mid Cap 30 Fund is long-term growth of capital. The investment objective of the Value Fund is total return, consisting of capital appreciation and current income.
The Hennessy Cornerstone Large Growth Fund (the “Large Growth Fund”) and Hennessy Large Value Fund (the “Large Value Fund”, formerly known as the Hennessy Select Large Value Fund), are each series of Hennessy Funds Trust (the “Trust”), which was organized as a Delaware Statutory Trust on September 17, 1992. These Funds are open-end, diversified management investment companies registered under the 1940 Act. The investment objective of the Large Growth Fund is long-term growth of capital. The investment objective of the Large Value Fund is long-term growth of capital and current income.
The Hennessy Balanced Fund (the “Balanced Fund”), and Hennessy Total Return Fund (the “Total Return Fund”), are each series of Hennessy Funds, Inc., which was organized as a Maryland corporation on January 11, 1996. The Balanced and Total Return Funds are open-end, non-diversified management investment companies registered under the 1940 Act. The investment objective of the Balanced Fund is a combination of capital appreciation and current income. The investment objective of the Total Return Fund is total return, consisting of capital appreciation and current income.
The Hennessy Japan Fund (the “Japan Fund”, formerly known as the Hennessy Select SPARX Japan Fund and the Hennessy Japan Small Cap Fund (the “Japan Small Cap Fund”, formerly known as the Hennessy Select SPARX Japan Smaller Companies Fund), are each series of Hennessy SPARX Funds Trust, which was organized as a Massachusetts business trust on July 24, 1995. The Japan Fund and the Japan Small Cap Fund are open-end, diversified management investment companies registered under the 1940 Act. Although these Funds will each be considered a “diversified” mutual fund, the Funds may employ a relatively focused investment strategy and may hold securities of fewer issuers than other diversified funds. The investment objective of the Japan Fund and the Japan Small Cap Fund is long-term capital appreciation.
The Growth Fund, Mid Cap 30 Fund, Large Growth Fund, Value Fund, Large Value Fund, Total Return Fund, Balanced Fund, Japan Fund and Japan Small Cap Fund collectively represent the Hennessy Funds (the “Funds”).
The Growth Fund, Mid Cap 30 Fund, Large Growth Fund, Value Fund, Large Value Fund and Japan Fund offer Investor and Institutional Class shares. Prior to October 26, 2012, the Investor Class shares were known as Original Class shares. Each class of shares differs principally in its respective administration, shareholder servicing and transfer agent expenses and sales charges, if any. Each class has identical rights to earnings, assets and voting privileges, except for class-specific expenses and exclusive rights to vote on matters affecting only individual classes. The Total Return Fund, Balanced Fund and Japan Small Cap Fund offer only Investor Class shares.
2). SIGNIFICANT ACCOUNTING POLICIES
The following is a summary of significant accounting policies consistently followed by the Funds in the preparation of the financial statements. These policies are in conformity with U.S. generally accepted accounting principles (“GAAP”).
| a). | Investment Valuation – All investments in securities are recorded at their estimated fair value, as described in Note 3. |
| b). | Federal Income Taxes – Provision for Federal income taxes or excise taxes has not been made since the Funds have elected to be taxed as “regulated investment companies” and intend to distribute substantially all taxable income to shareholders and otherwise comply with the provisions of the Internal Revenue Code applicable to regulated investment companies. Net investment income or loss and realized gains and losses for federal income tax purposes may differ from that reported on the financial statements because of temporary book and tax basis differences. Temporary differences are primarily the result of the treatment of wash sales for tax reporting purposes. Distributions from net realized gains for book purposes may include short-term capital gains, which are included as ordinary income to shareholders for tax purposes. |
| Due to inherent differences in the recognition of income, expenses, and realized gains/losses under U.S. generally accepted accounting principles and federal income tax purposes, permanent differences between book and tax basis reporting for the 2012 fiscal year have been identified and appropriately reclassified on the Statement of Assets and Liabilities. |
| Accumulated Net | Accumulated Net | Paid In | ||||||||||||
| Investment Income/(Loss) | Realized Gain/(Loss) | Capital | ||||||||||||
| Growth Fund | $ | (1,180,937 | ) | $ | 2,766,634 | $ | (1,585,697 | ) | ||||||
| Mid Cap 30 Fund | $ | (39,596 | ) | $ | 1,567,459 | $ | (1,527,863 | ) | ||||||
| Large Growth Fund | $ | — | $ | 4,678,538 | $ | (4,678,538 | ) | |||||||
| Value Fund | $ | (348,207 | ) | $ | 306,487 | $ | 41,720 | |||||||
| Large Value Fund | $ | (18,241 | ) | $ | 18,323 | $ | (82 | ) | ||||||
| Total Return Fund | $ | — | $ | — | $ | — | ||||||||
| Balanced Fund | $ | — | $ | — | $ | — | ||||||||
| Japan Fund | $ | (1,984 | ) | $ | 4,767 | $ | (2,783 | ) | ||||||
| Japan Small Cap Fund | $ | 331,801 | $ | (233,429 | ) | $ | (98,372 | ) | ||||||
| The permanent differences primarily relate to Net Operating Losses, 988 currency transactions, partnership sales adjustments, and PFIC sale adjustments. |
WWW.HENNESSYFUNDS.COM
77
| c). | Income and Expenses – Dividend income is recognized on the ex-dividend date or as soon as information is available to the Funds and interest income, which includes the amortization of premium and accretion of discount, is recognized on an accrual basis. Income, expenses (other than expenses attributable to a specific class), and realized and unrealized gains or losses on investments are allocated to each class of shares based on its respective net assets. |
| d). | Distributions to Shareholders – Dividends from net investment income for the Growth Fund, Mid Cap 30 Fund, Large Growth Fund, Value Fund, Large Value Fund, Japan Fund and Japan Small Cap Fund, if any, are declared and paid out annually, usually in November or December of each year. Dividends from net investment income for the Total Return Fund and Balanced Fund are declared and paid on a calendar quarter basis. Distributions of net realized capital gains, if any, are declared and paid annually, usually in November or December of each year, for all of the Funds. |
| e). | Security Transactions – Investment and shareholder transactions are recorded on the trade date. The Funds determine the gain or loss realized from the investment transactions by comparing the original cost of the security lot sold with the net sale proceeds. Discounts and premiums on securities purchased are accreted/amortized over the life of the respective security. |
| f). | Use of Estimates – The preparation of financial statements in conformity with GAAP requires management to make estimates and assumptions that affect the reported amounts of assets and liabilities and disclosure of contingent assets and liabilities at the date of the financial statements and the reported change in net assets during the reporting period. Actual results could differ from those estimates. |
| g). | Share Valuation – The net asset value (“NAV”) per share of each Fund is calculated by dividing the sum of the value of the securities held by each Fund, plus cash or other assets, minus all liabilities (including estimated accrued expenses) by the total number of shares outstanding for each Fund, rounded to the nearest cent. The Funds’ shares will not be priced on the days on which the New York Stock Exchange is closed for trading. The offering and redemption price per share for each Fund is equal to each Fund’s net asset value per share. |
| h). | Foreign Currency – Values of investments denominated in foreign currencies are converted into U.S. dollars using the spot market rate of exchange at the time of valuation. Purchases and sales of investments and income are translated into U.S. dollars using the spot market rate of exchange prevailing on the respective dates of such transactions. The effect of changes in foreign exchange rates on realized and unrealized security gains and losses is reflected as a component of such gains or losses. Foreign investments present additional risks due to currency fluctuations, economic and political factors, lower liquidity, government regulations, differences in accounting standards and other factors. |
| i). | Forward Contracts – The Funds may enter into forward currency contracts to reduce their exposure to changes in foreign currency exchange rates on their foreign holdings and to lock in the U.S. dollar cost of firm purchase and sale commitments for securities denominated in foreign currencies. A forward currency contract is a commitment to purchase or sell a foreign currency at a future date at a negotiated forward rate. The gain or loss arising from the difference between the U.S. dollar cost of the original contract and the value of the foreign currency in U.S. dollars upon closing of such contract is included in net realized gain or loss from foreign currency transactions. During the year ended October 31, 2012, the Funds did not enter into any forward contracts. |
| j). | Repurchase Agreements – The Funds may enter into repurchase agreements with member banks or security dealers of the Federal Reserve whom the investment advisor deems creditworthy. The repurchase price generally equals the price paid by the Fund plus interest negotiated on the basis of current short-term rates. |
| Securities pledged as collateral for repurchase agreements are held by the custodian bank until the respective agreements mature. Provisions of the repurchase agreements ensure that the market value of the collateral, including accrued interest thereon, is sufficient, in the event of default of the counterparty. If the counterparty defaults and the value of the collateral declines or if the counterparty enters an insolvency proceeding, realization of the collateral by the Fund may be delayed or limited. |
| k). | Accounting for Uncertainty in Income Taxes – The Funds have adopted accounting policies regarding recognition and measurement of tax positions taken or expected to be taken on a tax return. The Funds have reviewed all open tax years and major jurisdictions and concluded that there is no impact on the Funds’ net assets and no tax liability resulting from unrecognized tax benefits relating to uncertain income tax positions taken or expected to be taken on a tax return. As of October 31, 2012, open Federal and state tax years for the Funds include the tax years ended October 31, 2009 through 2012. |
| l). | Derivatives – The Funds may invest in, or enter into, derivatives, such as options, futures contracts, options on futures contracts and swaps, for a variety of reasons, including to hedge certain risks, to provide a substitute for purchasing or selling particular securities or to increase potential income gain. Derivatives may provide a cheaper, quicker or more specifically focused way for a Fund to invest than “traditional” securities would. The main purpose of utilizing these derivative instruments is for hedging purposes. |
| The Funds have adopted the financial accounting reporting rules as required by the Derivatives and Hedging Topic of the FASB Accounting Standards Codification (“FASB ASC”). The Funds are required to include enhanced disclosure that enables investors to understand how and why an entity uses derivatives, how derivatives are accounted for, and how derivatives instruments affect an entity’s results of operations and financial position. During the year ended October 31, 2012, the Funds did not hold any derivative instruments. |
| m). | Events Subsequent to the Fiscal Period End – The Funds have adopted financial reporting rules regarding subsequent events which requires an entity to recognize in the financial statements the effects of all subsequent events that provide additional evidence about conditions that existed at the date of the balance sheet. Management has evaluated the Funds’ related events and transactions that occurred subsequent to October 31, 2012, through the date of issuance of the Funds’ financial statements. There were no events or transactions that occurred during this period that materially impacted the amounts or disclosures in the Funds’ financial statements. |
WWW.HENNESSYFUNDS.COM
78
| n). | New Accounting Pronouncements – In December 2011, FASB issued ASU No. 2011-11 related to disclosures about offsetting assets and liabilities. The amendments in this ASU require an entity to disclose information about offsetting and related arrangements to enable users of its financial statements to understand the effect of those arrangements on its financial position. The ASU is effective for annual reporting periods beginning on or after January 1, 2013, and interim periods within those annual periods. The guidance requires retrospective applications for all comparative periods presented. Management is currently evaluating the impact ASU 2011-11 will have on the financial statements disclosures. |
3). SECURITIES VALUATION
The Funds have adopted authoritative fair valuation accounting standards which establish an authoritative definition of fair value and set out a hierarchy for measuring fair value. These standards require additional disclosures about the various inputs and valuation techniques used to develop the measurements of fair value and a discussion in changes in valuation techniques and related inputs during the period. These inputs are summarized in the three broad levels listed below:
| Level 1 – | Quoted unadjusted prices for identical instruments in active markets to which the Fund has access at the date of measurement. |
| Level 2 – | Quoted prices for similar instruments in active markets; quoted prices for identical or similar instruments in markets that are not active; and model-derived valuations in which all significant inputs and significant value drivers are observable in active markets. Level 2 inputs are those in markets for which there are few transactions, the prices are not current, the prices are fair value adjusted due to post market close subsequent events (foreign markets), little public information exists or instances where prices vary substantially over time or among brokered market makers. These inputs may also include interest rates, prepayment speeds, credit risk curves, default rates and similar data. |
| Level 3 – | Model-derived valuations in which one or more significant inputs or significant value drivers are unobservable. Unobservable inputs are those inputs that reflect the Funds’ own assumptions that market participant’s would use to price the asset or liability based on the best available information. |
Following is a description of the valuation techniques applied to the Funds’ major categories of assets and liabilities measured at fair value on a recurring basis.
Equity Securities – Equity securities, including common stocks, preferred stocks, foreign issued common stocks, exchange traded funds, closed-end mutual funds and real estate investment trusts, which are traded on a securities exchange for which a last-quoted sales price is readily available will be valued at the last sales price as reported by the primary exchange on which the securities are listed. Securities listed on the Nasdaq National Market System (“Nasdaq”) will be valued at the Nasdaq Official Closing Price, which may differ from the last sales price reported. Securities traded on a securities exchange for which a last-quoted sales price is not readily available will be valued at the mean between the bid and ask prices. To the extent these securities are actively traded and valuation adjustments are not applied, they are categorized in Level 1 of the fair value hierarchy.
Mutual Funds – Investments in mutual funds are generally priced at the ending net asset value (“NAV”) provided by the service agent of the Funds and will be classified as Level 1 securities.
Investment Companies – Investments in investment companies (e.g. mutual funds and exchange traded funds) are generally priced at the ending net asset value (NAV) provided by the service agent of the Funds and will be classified as Level 1 securities.
U.S. Government Securities – U.S. government securities are normally valued using a model that incorporates market observable data such as reported sales of similar securities, broker quotes, yields, bids, offers, and reference data. Certain securities are valued principally using prices furnished by a pricing service. U.S. government securities are generally categorized in Level 2 of the fair value hierarchy based on the inputs used and market activity levels for specific securities.
Short-Term Securities – Short-term equity investments, including money market funds, are valued in the manner specified above. Short-term debt investments are valued at amortized cost, if their original maturity was 60 days or less, or by amortizing the values as of the 61st day prior to maturity, if their original term to maturity exceeded 60 days. Short-term securities are generally in Level 1 or Level 2 of the fair market hierarchy depending on the inputs used and market activity levels for specific securities.
The Board of Directors/Trustees of the Funds (the “Board”) has adopted fair value pricing procedures that are followed when a price for a security is not readily available or if a significant event has occurred that indicates the closing price of a security no longer represents the true value of that security. Fair value pricing determinations are made in good faith in accordance with these procedures. There are numerous criteria that will be given consideration in determining a fair value of a security. Some of these criteria are: trading volume of security and markets, value of other like securities and news events with direct bearing to security or market. Fair value pricing results in an estimated price that reasonably reflects the current market conditions in order to rate the portfolio holdings such that shareholder transactions receive a fair net asset value. Depending on the relative significance of the valuation inputs, these securities may be classified in either Level 2 or Level 3 of the fair value hierarchy.
Fair valuing of foreign securities may be determined with the assistance of a pricing service using correlations between the movement of prices of such securities and indices of domestic securities and other appropriate indicators, such as closing market prices of relevant American Depositary Receipts or futures contracts. The effect of using fair value pricing is that the Funds’ NAV will reflect the affected portfolio securities’ value as determined in the judgment of the Board or its designee instead of being determined by the market. Using a fair value pricing methodology to price securities may result in a value that is different from a security’s most recent closing price and from the prices used by other investment companies to calculate their net asset values and are considered Level 2 prices in the fair valuation hierarchy. Because the Funds invest in foreign securities, the value of the Funds’ portfolio securities may change on days when you will not be able to purchase or redeem your shares. Depending on the relative significance of the valuation inputs, these securities may be classified in either Level 2 or Level 3 of the fair value hierarchy.
HENNESSY FUNDS 1-800-966-4354
79
The Board has delegated day-to-day valuation issues to a Valuation Committee which is comprised of one or more representatives from Hennessy Advisors, Inc., the Fund’s advisor. The function of the Valuation Committee is to value securities where current and reliable market quotations are not readily available. All actions taken by the Valuation Committee are reviewed and ratified by the Board.
The Funds have performed an analysis of all existing investments to determine the significance and character of all inputs to their fair value determination. Various inputs are used in determining the value of each Fund’s investments. The inputs or methodology used for valuing securities are not necessarily an indication of the risk associated with investing in those securities. Details related to the fair valuation hierarchy of the Funds’ securities as of October 31, 2012, are included with each Fund’s Schedule of Investments.
4). REVERSE REPURCHASE AGREEMENTS
The Total Return Fund may enter into reverse repurchase agreements with the same parties with whom it may enter into repurchase agreements. Under a reverse repurchase agreement, the Fund sells securities and agrees to repurchase them at a mutually agreed upon date and price. Reverse repurchase agreements are regarded as a form of secured borrowing by the Fund. Securities sold under reverse repurchase agreements are reflected as a liability on the Statement of Assets and Liabilities. Interest payments made are recorded as a component of interest expense on the Statement of Operations.
For the year ended October 31, 2012, the average daily balance and average interest rate in effect for reverse repurchase agreements were $22,131,044 and 0.26%, respectively. At October 31, 2012, the interest rate in effect for the outstanding reverse repurchase agreements, scheduled to mature on November 8, 2012, ($10,800,000), December 13, 2012 ($10,794,000), and January 17, 2013 ($7,196,000), were 0.28%, 0.27% and 0.30%, respectively. Outstanding reverse repurchase agreements at October 31, 2012 were equal to 37.07% of the Total Return Fund’s net assets.
5). INVESTMENT TRANSACTIONS
Purchases and sales of investment securities (excluding government and short-term investments) during the year ended October 31, 2012 were as follows:
| Growth | Mid Cap 30 | Large Growth | Value | Large Value | |
| Fund | Fund | Fund | Fund | Fund | |
| Purchases | $226,967,274 | $39,499,217 | $ — | $58,195,967 | $136,908,387 |
| Sales | $192,094,061 | $53,398,542 | $8,666,147 | $56,321,280 | $152,295,014 |
| Total Return | Balanced | Japan | Japan Small Cap | ||
| Fund | Fund | Fund | Fund | ||
| Purchases | $11,487,835 | $4,746,748 | $ 462,576 | $ 7,218,187 | |
| Sales | $12,611,127 | $1,924,682 | $6,340,937 | $27,506,821 |
Purchases and sales/maturities of long-term U.S. Government Securities for the Balanced Fund were $1,699,110 and $700,000, respectively, for the year ended October 31, 2012. There were no purchases or sales/maturities of long-term U.S. Government Securities for the Growth Fund, Mid Cap 30 Fund, Large Growth Fund, Value Fund, Large Value Fund, Total Return Fund, Japan Fund or Japan Small Cap Fund for the year ended October 31, 2012.
6). INVESTMENT MANAGEMENT FEE AND OTHER TRANSACTIONS WITH AFFILIATES
Hennessy Advisors, Inc. (the “Advisor”) is the Advisor of the Funds. The Advisor provides the Funds with investment management services under a Management Agreement. The Advisor furnishes all investment advice, office space, facilities, and provides most of the personnel needed by the Funds. As compensation for its services, the Advisor is entitled to a monthly fee from each Fund. The fee is based upon the average daily net assets of the Funds at the annual rate of:
| Growth Fund | 0.74% | ||
| Mid Cap 30 Fund | 0.74% | ||
| Large Growth Fund | 0.74% | ||
| Value Fund | 0.74% | ||
| Large Value Fund | 0.85% | ||
| Total Return Fund | 0.60% | ||
| Balanced Fund | 0.60% | ||
| Japan Fund | 1.00% | ||
| Japan Small Cap Fund | 1.20% |
Advisor fees payable for the Funds as of October 31, 2012, were:
| Growth Fund | $180,177 | ||
| Mid Cap 30 Fund | $122,844 | ||
| Large Growth Fund | $64,209 | ||
| Value Fund | $81,603 | ||
| Large Value Fund | $91,323 | ||
| Total Return Fund | $39,979 | ||
| Balanced Fund | $12,940 | ||
| Japan Fund | $16,290 | ||
| Japan Small Cap Fund | $5,399 |
WWW.HENNESSYFUNDS.COM
80
The Advisor has delegated the day to day management of the Large Value Fund to a Sub-Advisor, RBC Global Asset Management (U.S.), Inc. (“RBC”). The Advisor has delegated the day to day management of the Japan and Japan Small Cap Funds to a Sub-Advisor, SPARX Asset Management Co. Ltd. (“SPARX”). The Advisor pays the Sub-Advisor fees for each of the Funds from its own assets and these fees are not an additional expense of the Funds.
The Advisor has agreed to waive its fees and absorb expenses to the extent that the total annual operating expenses (excluding all Federal, state and local taxes, interest, brokerage commissions, acquired fund fees and expenses and other costs incurred in connection with the purchase and sale of securities and extraordinary items) do not exceed 0.98% of the Funds’ net assets for the Institutional Class shares in the Growth, Mid Cap 30, Large Growth, Value and Large Value Funds. The expense limitation agreement for the Institutional Class shares can only be terminated by the Board. For a period of three years after the year in which the Advisor waives or reimburses expenses, the Advisor may seek reimbursement from the Funds to the extent that total annual Fund operating expenses are less than the expense limitation in effect at the time of the reimbursement. During the three years ended October 31, 2012, no Advisor fees were waived and therefore no expenses are subject to potential recovery.
The Large Value Fund, Japan Fund, and Japan Small Cap Fund each previously had operating expense limitation agreements which have since expired and/or have been terminated by the Board. As of October 31, 2012, cumulative expenses subject to potential recovery to the aforementioned conditions and year of expiration are as follows:
| Oct. 31, 2013 | Oct. 31, 2014 | Oct. 31, 2015 | Total | |
| Large Value Fund – Inv. Class | $38,444 | $ — | $ — | $38,444 |
| Japan Fund – Inv. Class | $37,425 | $ — | $ — | $37,425 |
| Japan Fund – Inst. Class | $12,915 | $ — | $ — | $12,915 |
| Japan Small Cap Fund – Inv. Class | $19,527 | $ — | $ — | $19,527 |
The Board has approved a Shareholder Servicing Plan for the Investor Class shares of each of the Funds which was instituted to compensate the Advisor for the non-investment management services it provides to the Funds. The Plan provides for a monthly fee paid to the Advisor at an annual rate of 0.10% of the average daily net assets of the Funds.
Service fees payable for the Funds as of October 31, 2012 were:
| Growth Fund | $21,786 | ||
| Mid Cap 30 Fund | $13,866 | ||
| Large Growth Fund | $6,537 | ||
| Value Fund | $10,813 | ||
| Large Value Fund | $10,739 | ||
| Total Return Fund | $6,663 | ||
| Balanced Fund | $2,157 | ||
| Japan Fund | $877 | ||
| Japan Small Cap Fund | $450 |
The Funds have entered into agreements with various brokers, dealers and financial intermediaries in connection with the sale of shares of the Funds. The agreements provide for periodic payments by the Funds to the brokers, dealers and financial intermediaries for providing certain shareholder maintenance services (sub-transfer agent expenses). These shareholder services include: the pre-processing and quality control of new accounts, shareholder correspondence, answering customer inquiries regarding account status and facilitating shareholder telephone transactions. Fees paid by the Funds to various brokers, dealers and financial intermediaries for the year ended October 31, 2012, were:
| Growth Fund | $343,459 | ||
| Mid Cap 30 Fund | $254,514 | ||
| Large Growth Fund | $19,666 | ||
| Value Fund | $74,671 | ||
| Large Value Fund | $89,951 | ||
| Total Return Fund | $30,149 | ||
| Balanced Fund | $20,402 | ||
| Japan Fund | $20,699 | ||
| Japan Small Cap Fund | $23,539 |
The Total Return Fund and Balanced Fund have adopted a plan pursuant to Rule 12b-1 which authorizes payments in connection with the distribution of the Total Return and Balanced Fund shares at an annual rate not to exceed 0.15% of each Fund’s average daily net assets. Amounts paid under the Plan may be spent on any activities or expenses primarily intended to result in the sale of shares, including but not limited to, advertising, compensation for sales and marketing activities or financial institutions and others such as dealers and distributors, shareholder account servicing, the printing and mailing of prospectuses to other than current shareowners and the printing and mailing of sales literature.
U.S. Bancorp Fund Services, LLC (the “Administrator”) acts as the Funds’ Administrator under an Administration Agreement. Administrative services under this agreement include custody, distribution, fund accounting, fund administration and transfer agent services. In addition, the Administrator prepares various federal and state regulatory filings, reports and returns for the Funds; prepares reports and materials to be supplied to the directors; monitors the activities of the Funds’ custodian, transfer agent and accountants; coordinates the preparation and payment of the Funds’ expenses and reviews the Funds’ expense accruals. Fees paid to U.S. Bancorp Fund Services, LLC for the year ended October 31, 2012, were:
HENNESSY FUNDS 1-800-966-4354
81
| Growth Fund | $555,538 | ||
| Mid Cap 30 Fund | $415,538 | ||
| Large Growth Fund | $197,895 | ||
| Value Fund | $314,513 | ||
| Large Value Fund | $319,745 | ||
| Total Return Fund | $180,627 | ||
| Balanced Fund | $58,174 | ||
| Japan Fund | $52,396 | ||
| Japan Small Cap Fund | $38,198 |
The Administrator has voluntarily waived all or a portion of its administration fees allocated to the Institutional Class shares of the Growth Fund, Mid Cap 30 Fund, Large Growth, Value and Large Value Fund. The administration fees voluntarily waived by the Administrator during the year ended October, 2012, were $4,007, $42,487, $2,641, $4,229 and $118, respectively.
Quasar Distributors, LLC (the “Distributor”) acts as the Funds’ principal underwriter in a continuous public offering of the Funds’ shares. The Distributor is an affiliated company of U.S. Bank, N.A.
7). LINE OF CREDIT
The Growth Fund, Mid Cap 30 Fund, Value Fund, Japan Fund and Japan Small Cap Fund have lines of credit of (i) $35,000,000, $25,000,000, $10,000,000, $3,000,000 and $3,000,000, respectively, or (ii) the lesser of 33.33% of each Fund’s net assets, intended to provide short-term financing, if necessary, subject to certain restrictions, in connection with shareholder redemptions. The credit facility is with its custodian bank, U.S. Bank, N.A. Borrowings under this arrangement bear interest at the bank’s prime rate. During the year ended October 31, 2012, the Growth Fund had an outstanding average daily balance and a weighted average interest rate of $8,374 and 3.25%, respectively. The maximum amount outstanding for the Growth Fund during the period was $1,583,000. During the year ended October 31, 2012, the Mid Cap 30 Fund had an outstanding average daily balance and a weighted average interest rate of $168,847 and 3.25%, respectively. The maximum amount outstanding for the Mid Cap 30 Fund during the period was $10,039,000. During the year ended October 31, 2012, the Value Fund had an outstanding average daily balance and a weighted average interest rate of $6,735 and 3.25%, respectively. The maximum amount outstanding for the Value Fund during the period was $939,000. During the year ended October 31, 2012, the Japan Fund had an outstanding average daily balance and a weighted average interest rate of $120 and 3.25%, respectively. The maximum amount outstanding for the Japan Fund during the period was $44,000. During the year ended October 31, 2012, the Japan Small Cap Fund had an outstanding average daily balance and a weighted average interest rate of $51,249 and 3.25%, respectively. The maximum amount outstanding for the Japan Small Cap Fund during the period was $3,000,000.
8). FEDERAL TAX INFORMATION
As of October 31, 2012, the components of accumulated earnings (losses) for income tax purposes were as follows:
| Growth | Mid Cap 30 | Large Growth | ||||||||||
| Fund | Fund | Fund | ||||||||||
| Cost of investments for tax purposes | $ | 272,787,207 | $ | 162,770,617 | $ | 101,226,194 | ||||||
| Gross tax unrealized appreciation | 44,200,587 | 30,575,395 | 18,829,340 | |||||||||
| Gross tax unrealized depreciation | (15,674,995 | ) | (3,255,399 | ) | (10,266,235 | ) | ||||||
| Net tax unrealized appreciation (depreciation) | $ | 28,525,592 | $ | 27,319,996 | $ | 8,563,105 | ||||||
| Undistributed ordinary income | $ | — | $ | 1,029,849 | $ | 1,080,454 | ||||||
| Undistributed long-term capital gains | — | — | 169,340 | |||||||||
| Total distributable earnings | $ | — | $ | 1,029,849 | $ | 1,249,794 | ||||||
| Other accumulated gains/(loss) | $ | (246,589,256 | ) | $ | (44,993,297 | ) | $ | (4,061,012 | ) | |||
| Total accumulated earnings/(loss) | $ | (218,063,664 | ) | $ | (16,643,452 | ) | $ | 5,751,887 | ||||
| Value | Large Value | Total Return | ||||||||||
| Fund | Fund | Fund | ||||||||||
| Cost of investments for tax purposes | $ | 108,730,517 | $ | 107,067,386 | $ | 98,251,218 | ||||||
| Gross tax unrealized appreciation | 21,078,375 | 20,433,398 | 8,394,757 | |||||||||
| Gross tax unrealized depreciation | (2,156,189 | ) | (2,008,917 | ) | (170,519 | ) | ||||||
| Net tax unrealized appreciation (depreciation) | $ | 18,922,186 | $ | 18,424,481 | $ | 8,224,238 | ||||||
| Undistributed ordinary income | $ | 2,446,268 | $ | 1,060,739 | $ | 78,405 | ||||||
| Undistributed long-term capital gains | — | — | — | |||||||||
| Total distributable earnings | $ | 2,446,268 | $ | 1,060,739 | $ | 78,405 | ||||||
| Other accumulated gains/(loss) | $ | (43,841,856 | ) | $ | (29,476,742 | ) | $ | (7,009,187 | ) | |||
| Total accumulated earnings/(loss) | $ | (22,473,402 | ) | $ | (9,991,522 | ) | $ | 1,293,456 | ||||
WWW.HENNESSYFUNDS.COM
82
| Balanced | Japan | Japan Small Cap | ||||||||||
| Fund | Fund | Fund | ||||||||||
| Cost of investments for tax purposes | $ | 23,578,357 | $ | 15,823,302 | $ | 5,091,643 | ||||||
| Gross tax unrealized appreciation | 1,793,810 | 4,105,359 | 590,961 | |||||||||
| Gross tax unrealized depreciation | (186,959 | ) | (677,280 | ) | (454,726 | ) | ||||||
| Net tax unrealized appreciation (depreciation) | $ | 1,606,851 | $ | 3,428,079 | $ | 136,235 | ||||||
| Undistributed ordinary income | $ | 2,932 | $ | — | $ | — | ||||||
| Undistributed long-term capital gains | — | — | 1,115,067 | |||||||||
| Total distributable earnings | $ | 2,932 | $ | — | $ | 1,115,067 | ||||||
| Other accumulated gains/(loss) | $ | (1,233,401 | ) | $ | (33,406,069 | ) | $ | (58,667 | ) | |||
| Total accumulated earnings/(loss) | $ | 376,382 | $ | (29,977,990 | ) | $ | 1,192,635 | |||||
The difference between book-basis and tax-basis unrealized appreciation is attributable primarily to capital loss carry overs, wash sales, and partnership adjustments.
At October 31, 2012, the Funds had capital loss carryforwards which expire as follows:
| Growth Fund | $60,841,121 | 10/31/16 | |
| 183,155,263 | 10/31/17 | ||
| Mid Cap 30 Fund | 3,858,159 | 10/31/16 | |
| 41,135,138 | 10/31/17 | ||
| Large Growth Fund | 4,061,012 | 10/31/16 | |
| Value Fund | 43,841,856 | 10/31/17 | |
| Large Value Fund | 29,468,928 | 10/31/17 | |
| Total Return Fund | 7,009,187 | 10/31/17 | |
| Balanced Fund | 1,233,401 | 10/31/17 | |
| Japan Fund | 4,786,618 | 10/31/15 | |
| 6,231,544 | 10/31/16 | ||
| 15,450,664 | 10/31/17 | ||
| 6,121,138 | 10/31/18 | ||
| 373,080 | Indefinite ST | ||
| 439,149 | Indefinite LT |
At October 31, 2012, the Japan Small Cap Fund had no tax basis capital losses to offset future capital gains.
During the year ended October 31, 2012, the capital loss carry forwards utilized for each fund was as follows:
| Growth Fund | 5,439,299 | |
| Mid Cap 30 Fund | 573,537 | |
| Large Growth Fund | 2,352 | |
| Value Fund | 2,872,985 | |
| Large Value Fund | 9,750,615 | |
| Total Return Fund | 3,320,669 | |
| Balanced Fund | 502,700 | |
| Japan Fund | — | |
| Japan Small Cap Fund | 694,391 |
Under recently enacted legislation, capital losses sustained in the year ended December 31, 2011 and in future taxable years will not expire and may be carried over by the Fund without limitation; however, they will retain the character of the original loss. Furthermore, any losses incurred during those taxable years will be required to be utilized prior to the losses incurred in the pre-enactment taxable years. As a result of this ordering rule, pre-enactment capital loss carryforwards may be more likely to expire unused. Under pre-enactment law, capital losses could be carried forward for eight years, and carried forward as short-term capital losses, irrespective of the character of the original loss.
At October 31, 2012 the following funds deferred, on a tax basis, post-October losses of:
| Post October Late Year | Post October | |||||||||
| Ordinary Loss Deferral | Loss Deferral | |||||||||
| Growth Fund | $ | 2,592,872 | — | |||||||
| Mid Cap 30 Fund | — | — | ||||||||
| Large Growth Fund | — | — | ||||||||
| Value Fund | — | — | ||||||||
| Large Value Fund | — | — | ||||||||
| Total Return Fund | — | — | ||||||||
| Balanced Fund | — | — | ||||||||
| Japan Fund | — | — | ||||||||
| Japan Small Cap Fund | 57,735 | — | ||||||||
HENNESSY FUNDS 1-800-966-4354
83
The tax character of distributions paid during 2012 and 2011 for the Funds were as follows:
| Year Ended | Year Ended | ||||||||
| Growth Fund | October 31, 2012 | October 31, 2011 | |||||||
| Ordinary Income | $ | — | $ | — | |||||
| Long-term capital gain | — | — | |||||||
| $ | — | $ | — | ||||||
| Year Ended | Year Ended | ||||||||
| Mid Cap 30 Fund | October 31, 2012 | October 31, 2011 | |||||||
| Ordinary Income | $ | — | $ | — | |||||
| Long-term capital gain | — | — | |||||||
| $ | — | $ | — | ||||||
| Year Ended | Year Ended | ||||||||
| Large Growth Fund | October 31, 2012 | October 31, 2011 | |||||||
| Ordinary Income | $ | 559,148 | $ | 627,807 | |||||
| Long-term capital gain | 15,375,965 | 109,248 | |||||||
| $ | 15,935,113 | $ | 737,055 | ||||||
| Year Ended | Year Ended | ||||||||
| Value Fund | October 31, 2012 | October 31, 2011 | |||||||
| Ordinary Income | $ | 3,834,285 | $ | 4,283,374 | |||||
| Long-term capital gain | — | — | |||||||
| $ | 3,834,285 | $ | 4,283,374 | ||||||
| Year Ended | Year Ended | ||||||||
| Large Value Fund | October 31, 2012 | October 31, 2011 | |||||||
| Ordinary Income | $ | 1,007,759 | $ | 1,292,183 | |||||
| Long-term capital gain | — | — | |||||||
| $ | 1,007,759 | $ | 1,292,183 | ||||||
| Year Ended | Year Ended | ||||||||
| Total Return Fund | October 31, 2012 | October 31, 2011 | |||||||
| Ordinary Income | $ | 1,013,041 | $ | 1,003,505 | |||||
| Long-term capital gain | — | — | |||||||
| $ | 1,013,041 | $ | 1,003,505 | ||||||
| Year Ended | Year Ended | ||||||||
| Balanced Fund | October 31, 2012 | October 31, 2011 | |||||||
| Ordinary Income | $ | 81,724 | $ | 55,526 | |||||
| Long-term capital gain | — | — | |||||||
| $ | 81,724 | $ | 55,526 | ||||||
| Year Ended | Year Ended | ||||||||
| Japan Fund | October 31, 2012 | October 31, 2011 | |||||||
| Ordinary Income | $ | — | $ | — | |||||
| Long-term capital gain | — | — | |||||||
| $ | — | $ | — | ||||||
| Year Ended | Year Ended | ||||||||
| Japan Small Cap Fund | October 31, 2012 | October 31, 2011 | |||||||
| Ordinary Income | $ | 99,101 | $ | — | |||||
| Long-term capital gain | — | — | |||||||
| $ | 99,101 | $ | — | ||||||
9). FUND REORGANIZATIONS
On October 25, 2012, the shareholders of the FBR Large Cap Fund, FBR Mid Cap Fund and FBR Small Cap Fund approved the agreement and plan of reorganization providing for the transfer of assets and the assumption of liabilities of the FBR Large Cap Fund, FBR Mid Cap Fund and FBR Small Cap Fund by each of the Hennessy Cornerstone Large Growth Fund, the Hennessy Cornerstone Mid Cap 30 Fund, and the Hennessy Cornerstone Growth Fund, respectively. The reorganization was effective as of the close of business on October 26, 2012. The following tables illustrate the specifics of each Fund’s reorganization:
| FBR Small Cap | Shares issued to Shareholders | Hennessy Cornerstone | |||
| Fund Net Assets | of FBR Small Cap Fund | Growth Fund Net Assets | Combined Net Assets | Tax Status of Transfer | |
$34,071,809(1) | 2,732,499 | $265,131,165 | $299,202,974 | Non-taxable |
| (1) | Includes accumulated realized losses and unrealized appreciation in the amounts of ($5,680,576) and $1,928,859 respectively. |
WWW.HENNESSYFUNDS.COM
84
| FBR Mid Cap | Shares issued to Shareholders | Hennessy Cornerstone | |||
| Fund Net Assets | of FBR Mid Cap Fund | Mid Cap 30 Fund Net Assets | Combined Net Assets | Tax Status of Transfer | |
$16,374,686(1) | 1,154,875 | $171,822,952 | $188,197,638 | Non-taxable |
| (1) | Includes accumulated realized losses and unrealized appreciation in the amounts of ($3,572,309) and $2,496,269 respectively. |
| FBR Large Cap | Shares issued to Shareholders | Hennessy Cornerstone | |||
| Fund Net Assets | of FBR Large Cap Fund | Large Growth Fund Net Assets | Combined Net Assets | Tax Status of Transfer | |
$33,698,161(1) | 3,110,613 | $75,963,129 | $109,661,290 | Non-taxable |
| (1) | Includes accumulated realized losses and unrealized appreciation in the amounts of ($8,751,401) and $4,423,584 respectively. |
Assuming the reorganization had been completed on November 1, 2011, the beginning of the annual reporting period of each of the respective Hennessy Funds, the pro forma results of operations (unaudited) for the year ended October 31, 2012, would have been as follows:
| Hennessy Cornerstone | Hennessy Cornerstone | Hennessy Cornerstone | ||||||||||||
| Growth Fund | Mid Cap 30 Fund | Large Growth Fund | ||||||||||||
| Net investment income/(loss) | $ | (1,277,452 | ) | $ | 1,183,817 | $ | 1,514,359 | |||||||
| Net realized gain/(loss) on investments | $ | 6,068,686 | $ | 415,390 | $ | 501,406 | ||||||||
| Change in unrealized appreciation/depreciation on investments | $ | 46,095,075 | $ | 22,755,030 | $ | 7,914,251 | ||||||||
| Net increase/(decrease) in net assets resulting from operations | $ | 50,886,309 | $ | 24,354,237 | $ | 9,930,016 | ||||||||
Because the combined investment portfolios have been managed as a single integrated portfolio since the reorganization was completed, it is not practicable to separate the amounts of revenue and earnings for the respective FBR Funds that have been included in each of the Hennessy Funds’ statement of operations since October 26, 2012.
HENNESSY FUNDS 1-800-966-4354
85
Report of Independent Registered Public Accounting Firm
The Shareholders and Board of Directors/Trustees of Hennessy Mutual Funds, Inc., Hennessy Funds, Inc.,
Hennessy Funds Trust, and Hennessy SPARX Funds Trust:
We have audited the accompanying statements of assets and liabilities of the Hennessy Cornerstone Growth Fund, Hennessy Cornerstone Mid Cap 30 Fund, Hennessy Cornerstone Large Growth Fund, Hennessy Cornerstone Value Fund, Hennessy Large Value Fund, Hennessy Total Return Fund, Hennessy Balanced Fund, Hennessy Japan Fund, and Hennessy Japan Small Cap Fund, including the schedules of investments, as of October 31, 2012, and the related statements of operations for the year then ended, statements of changes in net assets for the two-year period then ended, statement of cash flows for the year then ended for the Hennessy Total Return Fund, and the financial highlights for each of the periods presented in the five-year period then ended (each of the years in the three-year period ended October 31, 2012, month ended October 31, 2009, and year ended September 30, 2009 for Hennessy Cornerstone Large Growth Fund and Hennessy Large Value Fund, and each of the years in the four-year period ended October 31, 2012 for Hennessy Japan Fund and Hennessy Japan Small Cap Fund). These financial statements and financial highlights are the responsibility of management. Our responsibility is to express an opinion on these financial statements based on our audits. The financial highlights for the periods presented through September 30, 2008 of the Hennessy Cornerstone Large Growth Fund and Hennessy Large Value Fund were audited by other auditors whose report dated November 26, 2008 expressed an unqualified opinion on those financial highlights. The financial highlights for the periods presented through October 31, 2008 of the Hennessy Japan Fund and Hennessy Japan Small Cap Fund were audited by other auditors whose report dated December 10, 2008 expressed an unqualified opinion on those financial highlights.
We conducted our audits in accordance with generally accepted auditing standards as established by the Auditing Standards Board (United States) and in accordance with the auditing standards of the Public Company Accounting Oversight Board (United States). Those standards require that we plan and perform the audit to obtain reasonable assurance about whether the financial statements are free of material misstatement. An audit includes examining, on a test basis, evidence supporting the amounts and disclosures in the financial statements. Our procedures included confirmation of securities owned as of October 31, 2012, by correspondence with custodians or brokers, or by other appropriate auditing procedures. An audit also includes assessing the accounting principles used and significant estimates made by management, as well as evaluating the overall financial statement presentation. We believe that our audits provide a reasonable basis for our opinion.
In our opinion, the financial statements and financial highlights referred to above present fairly, in all material respects, the financial position of the Hennessy Cornerstone Growth Fund, Hennessy Cornerstone Mid Cap 30 Fund, Hennessy Cornerstone Large Growth Fund, Hennessy Cornerstone Value Fund, Hennessy Large Value Fund, Hennessy Total Return Fund, Hennessy Balanced Fund, Hennessy Japan Fund, and Hennessy Japan Small Cap as of October 31, 2012, and the results of their operations, changes in their net assets, cash flows of the Hennessy Total Return Fund, and the financial highlights for each of the periods described in the first paragraph above, in conformity with U.S. generally accepted accounting principles.

December 28, 2012
Milwaukee, WI
WWW.HENNESSYFUNDS.COM
86
Directors/Trustees and Officers of the Funds (Unaudited)
The business and affairs of the Funds are managed under the direction of the Funds’ Board of Directors/Trustees. Information pertaining to the Directors and Officers of the Funds is set forth below. The Funds’ Statement of Additional Information includes additional information about the Funds’ Directors/Trustees and Officers and is available, without charge, upon request by calling 1-800-966-4354.
| Number of | |||||
| Portfolios | Other | ||||
| in the Fund | Directorships | ||||
| Position(s) | Term of Office | Complex | (During Past | ||
| Held with | and Length of | Principal Occupation(s) | Overseen | 5 Years) Held | |
| Name, Address, and Age | the Fund | Time Served | During Past 5 Years | by Trustee | by Trustee |
| Disinterested Trustees (as defined below) | |||||
| J. Dennis DeSousa | Trustee | Indefinite, until | Mr. DeSousa is a real estate investor. | 16 | None. |
| Age: 76 | successor elected | ||||
| Address: | |||||
| c/o Hennessy Advisors, Inc. | Served since January | ||||
| 7250 Redwood Blvd. | 1996 HMFI and HFI; | ||||
| Suite 200 | since July 2005 HFT; | ||||
| Novato, CA 94945 | and since September | ||||
| 2009 HSFT | |||||
| Robert T. Doyle | Trustee | Indefinite, until | Mr. Doyle has been the Sheriff of | 16 | None. |
| Age: 65 | successor elected | Marin County, California since 1996. | |||
| Address: | |||||
| c/o Hennessy Advisors, Inc. | Served since January | ||||
| 7250 Redwood Blvd. | 1996 HMFI and HFI; | ||||
| Suite 200 | since July 2005 HFT; | ||||
| Novato, CA 94945 | and since September | ||||
| 2009 HSFT | |||||
| Gerald P. Richardson | Trustee | Indefinite, until | Mr. Richardson is an independent | 16 | None. |
| Age: 67 | successor elected | consultant in the securities industry. | |||
| Address: | |||||
| c/o Hennessy Advisors, Inc. | Served since May 2004 | ||||
| 7250 Redwood Blvd. | HMFI and HFI; since | ||||
| Suite 200 | July 2005 HFT; and | ||||
| Novato, CA 94945 | since September | ||||
| 2009 HSFT | |||||
| “Interested Persons” (as defined in the 1940 Act) | |||||
Neil J. Hennessy(1) | Trustee, | Trustee: | Mr. Hennessy has been employed by | 16 | Director of Hennessy |
| Age: 56 | President and | Indefinite, until | Hennessy Advisors, Inc., the Funds’ | Advisors, Inc. | |
| Address: | Chairman of | successor elected | investment advisor, since 1989. He | ||
| c/o Hennessy Advisors, Inc. | the Board | currently serves as President, Chairman, | |||
| 7250 Redwood Blvd. | Served since January | CEO, Portfolio Manager and CIO of | |||
| Suite 200 | 1996 HMFI and HFI; | Hennessy Advisors, Inc. | |||
| Novato, CA 94945 | since July 2005 HFT; | ||||
| and since September | |||||
| 2009 HSFT | |||||
| Officer: | |||||
| 1 year term | |||||
| Served since June 2008 | |||||
| HMFI, HFI and HFT; and | |||||
| since September 2009 HSFT | |||||
Joe Fahy(1) | Vice President | 1 year term | Mr. Fahy has been employed by | N/A | N/A |
| Age: 34 | and Chief | Hennessy Advisors, Inc., the Funds’ | |||
| Address: | Compliance | Since June 2010 HMFI, | investment advisor, since 2005. | ||
| c/o Hennessy Advisors, Inc. | Officer | HFI, HFT and HSFT | |||
| 7250 Redwood Blvd. | |||||
| Suite 200 | |||||
| Novato, CA 94945 | |||||
(1) All Officers of the Hennessy Funds and employees of the Manager are Interested Persons of the Fund.
HENNESSY FUNDS 1-800-966-4354
87
| Number of | |||||
| Portfolios | Other | ||||
| in the Fund | Directorships | ||||
| Position(s) | Term of Office | Complex | (During Past | ||
| Held with | and Length of | Principal Occupation(s) | Overseen | 5 Years) Held | |
| Name, Address, and Age | the Fund | Time Served | During Past 5 Years | by Trustee | by Trustee |
| Interested Persons | |||||
Teresa M. Nilsen(1) | Executive | 1 year term | Ms. Nilsen has been employed by | N/A | N/A |
| Age: 46 | Vice President | Hennessy Advisors, Inc., the Funds’ | |||
| Address: | and Treasurer | Since January 1996 | investment advisor, since 1989. She | ||
| c/o Hennessy Advisors, Inc. | HMFI and HFI; since | currently serves as Executive Vice | |||
| 7250 Redwood Blvd. | July 2005 HFT; and | President, Chief Operations Officer, | |||
| Suite 200 | since September | Chief Financial Officer and Secretary | |||
| Novato, CA 94945 | 2009 HSFT | of Hennessy Advisors, Inc. | |||
Daniel B. Steadman(1) | Executive | 1 year term | Mr. Steadman has been employed by | N/A | N/A |
| Age: 56 | Vice President | Hennessy Advisors, Inc., the Funds’ | |||
| Address: | and Secretary | Since March 2000 | investment advisor, since 2000. He | ||
| c/o Hennessy Advisors, Inc. | HMFI and HFI; since | currently serves as Executive Vice | |||
| 7250 Redwood Blvd. | July 2005 HFT; and | President and Chief Compliance Officer | |||
| Suite 200 | since September | of Hennessy Advisors, Inc. | |||
| Novato, CA 94945 | 2009 HSFT | ||||
David Ellison(1) | Senior | 1 year term | Mr. Ellison has served as Portfolio | N/A | N/A |
| Age: 54 | Vice President | Manager of the Hennessy Large Cap | |||
| Address: | & Chief | Since October 2012 | Financial Fund (formerly the FBR Large | ||
| 100 Federal Street | Investment | Cap Financial Fund), the Hennessy | |||
| 29th Floor | Officer | Small Cap Financial Fund (formerly the | |||
| Boston, MA 02110 | FBR Small Cap Financial Fund), and the | ||||
| Hennessy Technology Fund (formerly | |||||
| the FBR Technology Fund) since inception. | |||||
| Mr. Ellison previously served as Director, | |||||
| CIO & President of FBR Advisers, Inc. from | |||||
| December 1999 to October 2012. | |||||
Brian Peery(1) | Vice President | 1 year term | Mr. Peery has been employed by | N/A | N/A |
| Age: 43 | and | Hennessy Advisors, Inc., the Funds’ | |||
| Address: | Co-Portfolio | As Vice President, since | investment advisor, since 2002. | ||
| c/o Hennessy Advisors, Inc. | Manager | March 2003 HMFI and | |||
| 7250 Redwood Blvd. | HFI; since July 2005 | ||||
| Suite 200 | HFT; and since | ||||
| Novato, CA 94945 | September 2009 HSFT | ||||
| As Co-Portfolio Manager, | |||||
| since February 2011 | |||||
| HMFI, HFI, HFT and HSFT | |||||
Winsor (Skip) Aylesworth(1) | Vice President & | 1 year term | Mr. Aylesworth has been Portfolio | N/A | N/A |
| Age: 65 | Portfolio Manager | Manager of the Hennessy Gas Utility | |||
| Address: | Since October 2012 | Index Fund (formerly the FBR Gas Utility | |||
| 100 Federal Street | Index Fund) since 1998 and Portfolio | ||||
| 29th Floor | Manager of the Hennessy Technology | ||||
| Boston, MA 02110 | Fund (formerly the FBR Technology | ||||
| Fund) since inception. | |||||
| Mr. Aylesworth previously served as | |||||
| Executive Vice President of the FBR | |||||
| Funds from 1999 to October 2012. |
(1) All Officers of the Hennessy Funds and employees of the Manager are Interested Persons of the Fund.
Key:
HMFI = Hennessy Mutual Funds, Inc.
HFI = Hennessy Funds, Inc.
HFT = Hennessy Funds Trust
HSFT = Hennessy SPARX Funds Trust
WWW.HENNESSYFUNDS.COM
88
Expense Example (Unaudited)
October 31, 2012
As a shareholder of the Funds, you incur two types of costs: (1) transaction costs, including sales charges (loads) on purchase payments, reinvested dividends, or other distributions; redemption fees; and exchange fees; and (2) ongoing costs, including management fees; service fees; and other Fund expenses. This Example is intended to help you understand your ongoing costs (in dollars) of investing in each of the Funds and to compare these costs with the ongoing costs of investing in other mutual funds. The Example is based on an investment of $1,000 invested at the beginning of the period and held for the entire period from May 1, 2012 through October 31, 2012.
Actual Expenses
The first set of lines of the table below provide information about actual account values and actual expenses. Although the Funds charge no sales loads or transaction fees, you will be assessed fees for outgoing wire transfers, returned checks and stop payment orders at prevailing rates charged by U.S. Bancorp Fund Services, LLC, the Funds’ transfer agent. If you request that a redemption be made by wire transfer, currently a $15.00 fee is charged by the Funds’ transfer agent. IRA accounts will be charged a $15.00 annual maintenance fee. The example below includes, but is not limited to, management fees, shareholder servicing fees, fund accounting, custody and transfer agent fees. However, the example below does not include portfolio trading commissions and related expenses, and other extraordinary expenses as determined under generally accepted accounting principles. You may use the information within these lines, together with the amount you invested, to estimate the expenses that you paid over the six-month period. Simply divide your account value by $1,000 (for example, an $8,600 account value divided by $1,000 = 8.6), then multiply the result by the number in the first line under the heading entitled “Expenses Paid During Period” to estimate the expenses you paid on your account during this period.
Hypothetical Example for Comparison Purposes
The second set of lines within the table below provide information about hypothetical account values and hypothetical expenses based on the Funds’ actual expense ratios and an assumed rate of return of 5% per year before expenses, which is not the Funds’ actual return. The hypothetical account values and expenses may not be used to estimate the actual ending account balance or expenses you paid for the period. You may use this information to compare the ongoing costs of investing in the Funds and other funds. To do so, compare this 5% hypothetical example with the 5% hypothetical examples that appear in the shareholder reports of the other funds. Please note that the expenses shown in the table are meant to highlight your ongoing costs only and do not reflect any transactional costs, such as sales charges (loads), or exchange fees. Therefore, the second line of the table is useful in comparing ongoing costs only, and will not help you determine the relative total costs of owning different funds. In addition, if these transactional costs were included, your costs would have been higher.
HENNESSY FUNDS 1-800-966-4354
89
| Beginning | Ending | Expenses Paid | |
| Account Value | Account Value | During Period(1) | |
| Investor Class | 5/1/12 | 10/31/12 | 5/1/12 – 10/31/12 |
| Actual | |||
| Growth Fund – Investor Class | $1,000.00 | $1,047.40 | $ 6.84 |
| Mid Cap 30 Fund – Investor Class | $1,000.00 | $1,028.50 | $ 6.88 |
| Large Growth Fund – Investor Class | $1,000.00 | $986.30 | $ 6.34 |
| Value Fund – Investor Class | $1,000.00 | $1,036.20 | $ 6.40 |
| Large Value Fund – Investor Class | $1,000.00 | $1,026.60 | $ 7.13 |
| Total Return Fund – Investor Class | $1,000.00 | $1,028.60 | $ 6.78 |
| Balanced Fund – Investor Class | $1,000.00 | $1,016.90 | $ 8.16 |
| Japan Fund – Investor Class | $1,000.00 | $1,024.60 | $10.64 |
| Japan Small Cap Fund – Investor Class | $1,000.00 | $ 935.20 | $12.99 |
| Hypothetical (5% return before expenses) | |||
| Growth Fund – Investor Class | $1,000.00 | $1,018.45 | $6.75 |
| Mid Cap 30 Fund – Investor Class | $1,000.00 | $1,018.35 | $6.85 |
| Large Growth Fund – Investor Class | $1,000.00 | $1,018.75 | $6.44 |
| Value Fund – Investor Class | $1,000.00 | $1,018.85 | $6.34 |
| Large Value Fund – Investor Class | $1,000.00 | $1,018.10 | $7.10 |
| Total Return Fund – Investor Class | $1,000.00 | $1,018.45 | $6.75 |
| Balanced Fund – Investor Class | $1,000.00 | $1,017.04 | $8.16 |
| Japan Fund – Investor Class | $1,000.00 | $1,014.63 | $10.58 |
| Japan Small Cap Fund – Investor Class | $1,000.00 | $1,011.71 | $13.50 |
| (1) | Expenses are equal to the Growth Fund’s expense ratio of 1.33%, the Mid Cap 30 Fund’s expense ratio of 1.35%, the Large Growth Fund’s expense ratio of 1.27%, the Value Fund’s expense ratio of 1.25%, the Large Value Fund’s expense ratio of 1.40%, the Total Return Fund’s expense ratio of 1.33%, the Balanced Fund’s expense ratio of 1.61%, the Japan Fund’s expense ratio of 2.09%, and the Japan Small Cap Fund’s expense ratio of 2.67% multiplied by the average account value over the period, multiplied by 184/366 days (to reflect one-half year period). |
| Beginning | Ending | Expenses Paid | |
| Account Value | Account Value | During Period(2) | |
| Institutional Class | 5/1/12 | 10/31/12 | 5/1/12 – 10/31/12 |
| Actual | |||
| Growth Fund – Institutional Class | $1,000.00 | $1,048.40 | $5.05 |
| Mid Cap 30 Fund – Institutional Class | $1,000.00 | $1,030.20 | $5.00 |
| Large Growth Fund – Institutional Class | $1,000.00 | $ 987.30 | $4.90 |
| Value Fund – Institutional Class | $1,000.00 | $1,037.70 | $5.02 |
| Large Value Fund – Institutional Class | $1,000.00 | $1,028.60 | $5.00 |
| Japan Fund – Institutional Class | $1,000.00 | $1,025.60 | $9.52 |
| Hypothetical (5% return before expenses) | |||
| Growth Fund – Institutional Class | $1,000.00 | $1,020.21 | $4.98 |
| Mid Cap 30 Fund – Institutional Class | $1,000.00 | $1,020.21 | $4.98 |
| Large Growth Fund – Institutional Class | $1,000.00 | $1,020.21 | $4.98 |
| Value Fund – Institutional Class | $1,000.00 | $1,020.21 | $4.98 |
| Large Value Fund – Institutional Class | $1,000.00 | $1,020.21 | $4.98 |
| Japan Fund – Institutional Class | $1,000.00 | $1,015.74 | $9.48 |
| (2) | Expenses are equal to the Growth, Mid Cap 30, Large Growth, Value, and Large Value Fund’s expense ratio of 0.98%, and the Japan Fund’s expense ratio of 1.87%, multiplied by the average account value over the period, multiplied by 184/365 days (to reflect one-half year period). |
WWW.HENNESSYFUNDS.COM
90
How to Obtain a Copy of the Funds’ Proxy Voting Policy and Proxy Voting Records
A description of the policies and procedures that the Funds use to determine how to vote proxies relating to portfolio securities is available without charge: (1) by calling 1-800-966-4354; (2) on the Hennessy Funds website at www.hennessyfunds.com; or (3) on the U.S. Securities and Exchange Commission’s website at www.sec.gov. Hennessy Funds’ proxy voting record is available on the SEC’s website at www.sec.gov no later than August 31 for the prior 12 months ending June 30.
Quarterly Filings on Form N-Q
The Funds file their complete schedule of portfolio holdings with the SEC for the first and third quarters of each fiscal year on Form N-Q. The Funds’ Form N-Q will be available on the SEC’s website at www.sec.gov. The Funds’ Form N-Q may be reviewed and copied at the SEC’s Public Reference Room in Washington, DC and information on the operation of the Public Reference Room may be obtained by calling 1-800-SEC-0330. Information included in the Funds’ N-Q will also be available upon request by calling 1-800-966-4354.
Federal Tax Distribution Information (Unaudited)
For the fiscal year ended October 31, 2012, certain dividends paid by the Funds may be subject to a maximum tax rate of 15%, as provided for by the Jobs and Growth Tax Relief Reconciliation Act of 2003.
The percentage of dividends declared from ordinary income designated as qualified dividend income was as follows:
| Growth Fund | 0.00% | |
| Mid Cap 30 Fund | 0.00% | |
| Large Growth Fund | 100.00% | |
| Value Fund | 100.00% | |
| Large Value Fund | 100.00% | |
| Total Return Fund | 100.00% | |
| Balanced Fund | 100.00% | |
| Japan Fund | 0.00% | |
| Japan Small Cap Fund | 100.00% |
For corporate shareholders, the percent of ordinary income distributions qualifying for the corporate dividends received deduction for the fiscal year ended October 31, 2012 was as follows:
| Growth Fund | 0.00% | |
| Mid Cap 30 Fund | 0.00% | |
| Large Growth Fund | 100.00% | |
| Value Fund | 100.00% | |
| Large Value Fund | 100.00% | |
| Total Return Fund | 100.00% | |
| Balanced Fund | 100.00% | |
| Japan Fund | 0.00% | |
| Japan Small Cap Fund | 0.00% |
Householding
To help keep the Funds’ costs as low as possible, we generally deliver a single copy of most financial reports and prospectuses to shareholders who share an address, even if the accounts are registered under different names. This process, known as “householding,” does not apply to account statements. You may, of course, request an individual copy of a prospectus or financial report at any time. If you would like to receive separate mailings, please call the Transfer Agent at 1-800-261-6950 or 1-414-765-4124 and we will begin individual delivery within 30 days of your request. If your account is held through a financial institution or other intermediary, please contact them directly to request individual delivery.
HENNESSY FUNDS 1-800-966-4354
91
Privacy Policy
We collect the following non-public personal information about you:
| • | information we receive from you on or in applications or other forms, correspondence, or conversations, including, but not limited to, your name, address, phone number, social security number, assets, income and date of birth; |
| and |
| • | information about your transactions with us, our affiliates, or others, including, but not limited to, your account number and balance, payment history, parties to transactions, cost basis information and other financial information. |
We do not disclose any non-public personal information about our current or former shareholders to nonaffiliated third parties, except as permitted by law. For example, we are permitted by law to disclose all of the information we collect, as described above, to our Transfer Agent to process your transactions. Furthermore, we restrict access to your non-public personal information to those persons who require such information to provide products or services to you. We maintain physical, electronic and procedural safeguards that comply with federal standards to guard your non-public personal information.
In the event that you hold shares of the Fund through a financial intermediary, including, but not limited to, a broker-dealer, bank or trust company, the privacy policy of your financial intermediary would govern how your non-public personal information would be shared with nonaffiliated third parties.
WWW.HENNESSYFUNDS.COM
92
(This Page Intentionally Left Blank.)
HENNESSY FUNDS 1-800-966-4354
93
For information, questions
or assistance, please call
The Hennessy Funds
1-800-966-4354 or 1-415-899-1555
INVESTMENT ADVISOR
Hennessy Advisors, Inc.
7250 Redwood Blvd., Suite 200
Novato, California 94945
ADMINISTRATOR, TRANSFER
AGENT, DIVIDEND PAYING
AGENT & SHAREHOLDER
SERVICING AGENT
U.S. Bancorp Fund Services, LLC
P.O. Box 701
Milwaukee, Wisconsin 53201-0701
CUSTODIAN
U.S. Bank N.A.
Custody Operations
1555 North River Center Dr., Suite 302
Milwaukee, Wisconsin 53212
DIRECTORS/TRUSTEES
Neil J. Hennessy
Robert T. Doyle
J. Dennis DeSousa
Gerald P. Richardson
COUNSEL
Foley & Lardner LLP
777 East Wisconsin Avenue
Milwaukee, Wisconsin 53202-5306
INDEPENDENT REGISTERED
PUBLIC ACCOUNTING FIRM
KPMG LLP
777 East Wisconsin Avenue
Milwaukee, Wisconsin 53202-5306
DISTRIBUTOR
Quasar Distributors, LLC
615 East Michigan Street
Milwaukee, Wisconsin 53202
WWW.HENNESSYFUNDS.COM
This report has been prepared for shareholders and may be distributed to
others only if preceded or accompanied by a current prospectus.
Item 2. Code of Ethics.
The registrant has adopted a code of ethics that applies to the registrant’s principal executive officer and principal financial officer. The registrant has not made any amendments to its code of ethics during the period covered by this report. The registrant has not granted any waivers from any provisions of the code of ethics during the period covered by this report.
A copy of the registrant’s Code of Ethics is filed herewith.
Item 3. Audit Committee Financial Expert.
The registrant’s board of directors has determined that it does not have an audit committee financial expert serving on its audit committee. At this time, the registrant believes that the experience provided by each member of the audit committee together offers the registrant adequate oversight for the registrant’s level of financial complexity.
Item 4. Principal Accountant Fees and Services.
The registrant has engaged its principal accountant to perform audit services, audit-related services, tax services and other services during the past two fiscal years. “Audit services” refer to performing an audit of the registrant's annual financial statements or services that are normally provided by the accountant in connection with statutory and regulatory filings or engagements for those fiscal years. “Audit-related services” refer to the assurance and related services by the principal accountant that are reasonably related to the performance of the audit. “Tax services” refer to professional services rendered by the principal accountant for tax compliance, tax advice, and tax planning. The following table details the aggregate fees billed or expected to be billed for each of the last two fiscal years for audit fees, audit-related fees, tax fees and other fees by the principal accountant.
| FYE 10/31/2012 | FYE 10/31/2011 | |
| Audit Fees | $144,800 | $30,000 |
| Audit-Related Fees | - | - |
| Tax Fees | $29,600 | $7,000 |
| All Other Fees | - | - |
The audit committee has adopted pre-approval policies and procedures that require the audit committee to pre-approve all audit and non-audit services of the registrant, including services provided to any entity affiliated with the registrant.
The percentage of fees billed by KPMG, LLP applicable to non-audit services pursuant to waiver of pre-approval requirement were as follows:
| FYE 10/31/2012 | FYE 10/31/2011 | |
| Audit-Related Fees | 0% | 0% |
| Tax Fees | 0% | 0% |
| All Other Fees | 0% | 0% |
The percentage of fees billed by Tait, Weller & Baker, LLP applicable to non-audit services pursuant to waiver of pre-approval requirement were as follows:
| FYE 10/31/2012 | FYE 10/31/2011 | |
| Audit-Related Fees | 0% | 0% |
| Tax Fees | 0% | 0% |
| All Other Fees | 0% | 0% |
All of the principal accountant’s hours spent on auditing the registrant’s financial statements were attributed to work performed by full-time permanent employees of the principal accountant. (If more than 50 percent of the accountant’s hours were spent to audit the registrant's financial statements for the most recent fiscal year, state how many hours were attributed to work performed by persons other than the principal accountant's full-time, permanent employees.)
The following table indicates the non-audit fees billed or expected to be billed by the registrant’s accountant for services to the registrant and to the registrant’s investment adviser (and any other controlling entity, etc.—not sub-adviser) for the last two years. The audit committee of the board of trustees/directors has considered whether the provision of non-audit services that were rendered to the registrant's investment adviser is compatible with maintaining the principal accountant's independence and has concluded that the provision of such non-audit services by the accountant has not compromised the accountant’s independence.
| Non-Audit Related Fees | FYE 10/31/2012 | FYE 10/31/2011 |
| Registrant | - | - |
| Registrant’s Investment Adviser | - | - |
Item 5. Audit Committee of Listed Registrants.
Not applicable to registrants who are not listed issuers (as defined in Rule 10A-3 under the Securities Exchange Act of 1934).
Item 6. Investments.
Schedule of Investments is included as part of the report to shareholders filed under Item 1 of this Form.
Item 7. Disclosure of Proxy Voting Policies and Procedures for Closed-End Management Investment Companies.
Not applicable to open-end investment companies.
Item 8. Portfolio Managers of Closed-End Management Investment Companies.
Not applicable to open-end investment companies.
Item 9. Purchases of Equity Securities by Closed-End Management Investment Company and Affiliated Purchasers.
Not applicable to open-end investment companies.
Item 10. Submission of Matters to a Vote of Security Holders.
Not Applicable.
Item 11. Controls and Procedures.
| (a) | The Registrant’s President and Treasurer have reviewed the Registrant's disclosure controls and procedures (as defined in Rule 30a-3(c) under the Investment Company Act of 1940 (the “Act”)) as of a date within 90 days of the filing of this report, as required by Rule 30a-3(b) under the Act and Rules 13a-15(b) or 15d-15(b) under the Securities Exchange Act of 1934. Based on their review, such officers have concluded that the disclosure controls and procedures are effective in ensuring that information required to be disclosed in this report is appropriately recorded, processed, summarized and reported and made known to them by others within the Registrant and by the Registrant’s service provider. |
| (b) | There were no changes in the Registrant's internal control over financial reporting (as defined in Rule 30a-3(d) under the Act) that occurred during the second fiscal quarter of the period covered by this report that has materially affected, or is reasonably likely to materially affect, the Registrant's internal control over financial reporting. |
Item 12. Exhibits.
| (a) | (1) Any code of ethics or amendment thereto, that is the subject of the disclosure required by Item 2, to the extent that the registrant intends to satisfy Item 2 requirements through filing an exhibit. Filed herewith |
(2) A separate certification for each principal executive and principal financial officer pursuant to Section 302 of the Sarbanes-Oxley Act of 2002. Filed herewith.
(3) Any written solicitation to purchase securities under Rule 23c-1 under the Act sent or given during the period covered by the report by or on behalf of the registrant to 10 or more persons. Not applicable to open-end investment companies.
| (b) | Certifications pursuant to Section 906 of the Sarbanes-Oxley Act of 2002. Furnished herewith. |
SIGNATURES
Pursuant to the requirements of the Securities Exchange Act of 1934 and the Investment Company Act of 1940, the registrant has duly caused this report to be signed on its behalf by the undersigned, thereunto duly authorized.
(Registrant) Hennessy Funds Trust
By (Signature and Title)* /s/Neil J. Hennessy
Neil J. Hennessy, President
Date January 7, 2013
Pursuant to the requirements of the Securities Exchange Act of 1934 and the Investment Company Act of 1940, this report has been signed below by the following persons on behalf of the registrant and in the capacities and on the dates indicated.
By (Signature and Title)* /s/Neil J. Hennessy
Neil J. Hennessy, President
Date January 7, 2013
By (Signature and Title)* /s/Teresa M. Nilsen
Teresa M. Nilsen, Treasurer
Date January 7, 2013