As filed with the Securities and Exchange Commission on January 5, 2022
UNITED STATES
SECURITIES AND EXCHANGE COMMISSION
Washington, D.C. 20549
SECURITIES AND EXCHANGE COMMISSION
Washington, D.C. 20549
FORM N-CSR
CERTIFIED SHAREHOLDER REPORT OF REGISTERED
MANAGEMENT INVESTMENT COMPANIES
Investment Company Act file number (811-07168)
Hennessy Funds Trust
(Exact name of registrant as specified in charter)
(Exact name of registrant as specified in charter)
7250 Redwood Blvd., Suite 200
Novato, CA 94945
(Address of principal executive offices) (Zip code)
(Address of principal executive offices) (Zip code)
Teresa M. Nilsen
7250 Redwood Blvd., Suite 200
Novato, CA 94945
(Name and address of agent for service)
(Name and address of agent for service)
800-966-4354
(Registrant’s telephone number, including area code)
Date of fiscal year end: October 31, 2021
Date of reporting period: October 31, 2021
Item 1. Reports to Stockholders.
(a) |
ANNUAL REPORT
OCTOBER 31, 2021

HENNESSY CORNERSTONE GROWTH FUND
Investor Class HFCGX
Institutional Class HICGX

www.hennessyfunds.com | 1-800-966-4354
(This Page Intentionally Left Blank.)
Contents
| Letter to Shareholders | 2 |
| Performance Overview | 4 |
| Financial Statements | |
| Schedule of Investments | 7 |
| Statement of Assets and Liabilities | 11 |
| Statement of Operations | 12 |
| Statements of Changes in Net Assets | 13 |
| Financial Highlights | 14 |
| Notes to the Financial Statements | 18 |
| Report of Independent Registered Public Accounting Firm | 26 |
| Trustees and Officers of the Fund | 27 |
| Expense Example | 30 |
| Proxy Voting Policy and Proxy Voting Records | 32 |
| Availability of Quarterly Portfolio Schedule | 32 |
| Important Notice Regarding Delivery of Shareholder Documents | 32 |
| Electronic Delivery | 32 |
| Liquidity Risk Management Program | 33 |
| Privacy Policy | 33 |
| HENNESSY FUNDS | 1-800-966-4354 |
December 2021
Dear Hennessy Funds Shareholder:
What a year this has been. While it doesn’t feel that we are out of the “pandemic” phase of the coronavirus crisis, we look forward to a day when we will eventually see fewer cases and potentially less severe variants. We feel extremely grateful to the many healthcare workers who have continued to work tirelessly during the recent surge. As we move through the next year, we hope that new U.S. cases will decline and that many other parts of the world will see improvements as well.
What a year this has been! As measured by the total return of the S&P 500® Index, as of October 31, 2021, the market was up 24.04% calendar year to date. This comes in the wake of a tumultuous 2020 in which the market plunged in the beginning of the pandemic and recovered dramatically to end the year up 18.40%. Interestingly, 18% appears to be a repeating number in the past dozen years. From the low point of the Financial Crisis (March 9, 2009) to the high point reached just prior to the COVID-19 pandemic (February 12, 2020), the S&P 500® Index was up 18.27% per year. We are well aware that past results are not predictive of the future, and we find ourselves naturally skeptical of such strong returns. But, as shown in the chart below, we find that the most common annual total returns of the market over the past 102 years range between 20% and 30% with the second most common being between 10% and 20%:
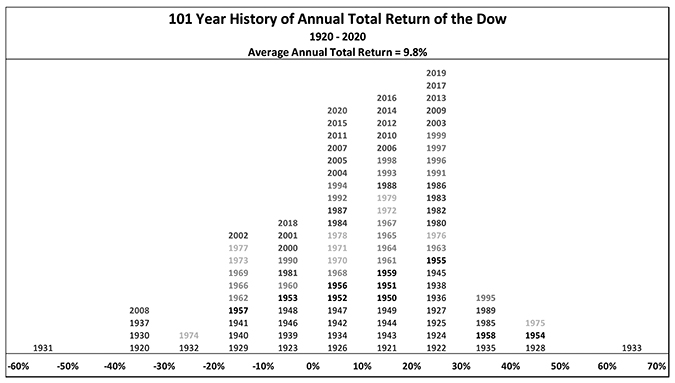
Source: Bloomberg L.P.
We will say it again, after showing a chart like the one above: Past results are not predictive of the future. Instead, we look at where we are right now – in the economy, in the market, in the business cycle – to reflect on where we have come from and where we may be going. U.S. GDP is strong and growing, interest rates remain low, and earnings growth and profitability remain robust. We believe stocks are trading at reasonable valuations when viewed as a whole, with the S&P 500® Index at 21.0x estimated earnings for 2022. Furthermore, we believe corporate balance sheets are healthy, with high levels of excess cash, which could support growth, increases in dividends, more share buybacks, and future acquisitions. Uncertainty and volatility can manifest at any time in the stock market, and the current market is no different. Investors have questions about inflation, worldwide supply chain issues, and what could drive the next boost in earnings. While these concerns are warranted, we continue to believe that overall the positives outweigh the negatives, and here at Hennessy we continue to see opportunity in the market and in our Funds.
| WWW.HENNESSYFUNDS.COM |
2
| LETTER TO SHAREHOLDERS |
What a (fiscal) year this has been!!! For our fiscal year ended October 31, 2021, the S&P 500® Index rose 42.91% on a total return basis, setting a new all-time high on the final day of the period. Except for a short 21-trading-day period that began on September 2 during which the market fell 5.13% only to rebound to new highs just 13 trading days later, the market has been on a continuous march higher. We saw a dramatic shift in market leadership as many of the sectors that underperformed during our last fiscal year soared in fiscal year 2021. Small-caps beat mid-caps, which in turn beat large-caps. The Energy and Financials sectors skyrocketed during the 12-month period, as reflected by the S&P 500® Energy Sector’s total return of 111.29% and the Russell 1000® Index Financials’ total return of 70.87%. Both of these sectors were among the worst performing in our fiscal year 2020, so a bounce back in our fiscal year 2021, while not a foregone conclusion, was a distinct possibility.
Overall, we are pleased with the performance of our mutual funds during the fiscal year. On an absolute basis, each of our 16 Funds achieved total returns greater than 10% and seven outperformed their primary benchmark. Ten of our 11 domestic equity-only Funds outperformed the S&P 500® Index and posted total returns of 45% or higher. Our four best-performing funds were concentrated in the Energy and Financials sectors. While some of our Funds certainly benefited from being in the “right” sector at the “right” time, we also believe this was a favorable period for our investment style of high-conviction investing and concentrated portfolio construction.
What will the coming year bring? As mentioned in our last shareholder letter (June 2021), we understand that even the greatest bull markets experience corrections along the way, and the last time the S&P 500® Index dropped over 10% was in February/March of 2020. Whether or not a correction occurs sooner or later, we believe the market as a whole has more room to run. We see many factors that could drive the market higher from here: strong GDP growth and increasing corporate earnings, a potentially lower-for-longer interest rate environment, accommodative fiscal and monetary policies, a healthy and robust financial system, low unemployment and solid wage growth, and strong corporate balance sheets with plenty of cash.
Thank you for your interest and for investing with us. We remain committed to managing our portfolios for long-term performance, ever mindful of downside risk. With so many investment options available to you, we are grateful for the trust you put in us and for your continued interest in our family of Funds. If you have any questions or would like to speak with us, please don’t hesitate to call us directly at (800) 966-4354.
Best regards,
 | |
 | |
| Ryan C. Kelley | |
| Chief Investment Officer |
Past performance does not guarantee future results. To obtain current standardized performance for the Hennessy Funds, visit https://www.hennessyfunds.com/funds/price-performance.
Mutual fund investing involves risk. Principal loss is possible.
Opinions expressed are those of Ryan C. Kelley and are subject to change, are not guaranteed, and should not be considered investment advice.
The Dow Jones Industrial Average and S&P 500® Index are commonly used to measure the performance of U.S. stocks. The S&P 500® Energy Index comprises those companies included in the S&P 500® Index that are classified in the Energy sector. The Russell 1000® Index Financials is a subset of the Russel 1000® Index that measures the performance of securities classified in the Financials sector of the large-capitalization U.S. equity market. The indices are used herein for comparative purposes in accordance with SEC regulations. One cannot invest directly in an index. All returns are shown on a total return basis.
| HENNESSY FUNDS | 1-800-966-4354 |
3
Performance Overview (Unaudited)
CHANGE IN VALUE OF $10,000 INVESTMENT

This graph illustrates the performance of an initial investment of $10,000 made in the Fund 10 years ago and assumes the reinvestment of dividends and capital gains.
AVERAGE ANNUAL TOTAL RETURN FOR PERIODS ENDED OCTOBER 31, 2021
| One | Five | Ten | |
Year | Years | Years | |
| Hennessy Cornerstone Growth Fund – | |||
| Investor Class (HFCGX) | 49.82% | 11.52% | 12.64% |
| Hennessy Cornerstone Growth Fund – | |||
| Institutional Class (HICGX) | 50.34% | 11.89% | 12.99% |
Russell 2000® Index | 50.80% | 15.52% | 13.50% |
S&P 500® Index | 42.91% | 18.93% | 16.21% |
Expense ratios: 1.36% (Investor Class); 1.05% (Institutional Class)
Performance data quoted represents past performance; past performance does not guarantee future results. The investment return and principal value of an investment will fluctuate so that an investor’s shares, when redeemed, may be worth more or less than their original cost. The performance table does not reflect the deduction of taxes that a shareholder would pay on Fund distributions or the redemption of Fund shares. Current performance of the Fund may be lower or higher than the performance quoted. Performance data current to the most recent month end may be obtained by visiting www.hennessyfunds.com.
The Russell 2000® Index comprises the smallest 2,000 companies in the Russell 3000® Index based on market capitalization, representing approximately 8% of the Russell 3000® Index in terms of total market capitalization. The S&P 500® Index is a capitalization-weighted index that is designed to represent the broad domestic economy through changes in the aggregate market value of 500 stocks across all major industries. One cannot invest directly in an index. These indices are used for comparative purposes in accordance with Securities and Exchange Commission regulations.
Frank Russell Company (“Russell”) is the source and owner of the trademarks, service marks, and copyrights related to the Russell Indexes. Russell® is a trademark of Frank Russell Company. Neither Russell nor its licensors accept any liability for any errors or omissions in the Russell Indexes or Russell ratings or underlying data and no party may rely on any Russell Indexes or Russell ratings or underlying data contained in this communication. No further distribution of Russell data is permitted without Russell’s express written consent. Russell does not promote, sponsor, or endorse the content of this communication.
| WWW.HENNESSYFUNDS.COM |
4
| PERFORMANCE OVERVIEW |
Standard & Poor’s Financial Services is the source and owner of the S&P® and S&P 500® trademarks.
The expense ratios presented are from the most recent prospectus. The expense ratios for the current reporting period are available in the Financial Highlights section of this report.
PERFORMANCE NARRATIVE
Portfolio Managers Neil J. Hennessy, Ryan C. Kelley, CFA, and L. Joshua Wein, CAIA
Performance:
For the one-year period ended October 31, 2021, the Investor Class of the Hennessy Cornerstone Growth Fund returned 49.82%, underperforming the Russell 2000® Index (the Fund’s primary benchmark), which returned 50.80% for the same period, but outperforming the S&P 500® Index, which returned 42.91% for the same period.
The Fund’s underperformance relative to its primary benchmark resulted from individual stock selection, while sector allocation contributed to relative returns. The Fund’s stock selection in the Information Technology, Consumer Discretionary, and Materials sectors detracted the most from relative performance. The largest detractors to performance in each of these sectors during the period were JinkoSolar Holding Company (ADR), VOXX International Corporation, and Rayonier Advanced Materials, Inc., respectively. Offsetting these losses somewhat were investments in the Health Care, Industrials, and Consumer Staples sectors. The largest contributors to performance within each of these sectors during the period were Community Health Systems, Inc., MYR Group, Inc., and United Natural Foods, Inc., respectively.
The Fund continues to hold all the companies mentioned except for JinkoSolar Holding.
Portfolio Strategy:
The Fund utilizes a formula-based approach designed to result in a portfolio of attractively valued, growing companies whose stock prices are exhibiting strong price momentum. In essence, the strategy seeks to combine elements of both value and momentum investing by selecting 50 stocks that have relatively low price-to-sales ratios, have generated increased earnings over the past year, and have positive stock price appreciation over the past three-month, six-month, and one-year periods.
Investment Commentary:
After a tumultuous 2020 and a strong 2021, we believe that the outlook for U.S. stocks remains positive. After a sharp contraction in economic activity as a result of the COVID-19 pandemic, the U.S. economy is growing steadily and demonstrating incredible resilience. We are benefiting from increased employment, rapid wage gains, and robust economic activity. Corporate earnings are on the rise, interest rates remain low, and Federal Reserve policies continue to accommodate a strong economy.
Sectors where the Fund currently maintains significant overweight positions include Consumer Discretionary, Consumer Staples, and Industrials. Representative holdings within the Consumer Discretionary sector include Hovnanian Enterprises, Inc. (Class A), Big 5 Sporting Goods Corporation, and AutoNation, Inc. Consumer Staples sector exposure includes companies such as United Natural Foods, BJ’s Wholesale Club Holdings, Inc., and Nu Skin Enterprises, Inc. (Class A). Within the Industrials sector, the Fund owns Danaos Corporation, Yellow Corporation, and MYR Group. We believe these
| HENNESSY FUNDS | 1-800-966-4354 |
5
companies should benefit from a continued rebound in economic growth in the United States and abroad.
_______________
Opinions expressed are those of the Portfolio Managers as of the date written and are subject to change, are not guaranteed, and should not be considered investment advice or an indication of trading intent.
The Fund invests in small-capitalization and medium-capitalization companies, which may have limited liquidity and greater price volatility than large-capitalization companies. Investments in foreign securities may involve political, economic, and currency risks, greater volatility, and differences in accounting methods. The Fund’s formula-based strategy may cause the Fund to buy or sell securities at times when it may not be advantageous. Please see the Fund’s prospectus for a more complete discussion of these and other risks.
References to specific securities should not be considered a recommendation to buy or sell any security. Fund holdings and sector allocations are subject to change. Please refer to the Schedule of Investments included in this report for additional portfolio information.
Earnings growth is not a measure of the Fund’s future performance.
Price-to-sales ratio is a valuation measure calculated by dividing a company’s market price per share by its revenue per share.
| WWW.HENNESSYFUNDS.COM |
6
| PERFORMANCE OVERVIEW/SCHEDULE OF INVESTMENTS |
Financial Statements
Schedule of Investments as of October 31, 2021 |
HENNESSY CORNERSTONE GROWTH FUND
(% of Net Assets)

| TOP TEN HOLDINGS (EXCLUDING MONEY MARKET FUNDS) | % NET ASSETS |
| Danaos Corp. | 4.68% |
| Centrus Energy Corp. | 4.38% |
| Signet Jewelers Ltd. | 3.51% |
| Hovnanian Enterprises, Inc. | 3.01% |
| MYR Group, Inc. | 2.92% |
| Big 5 Sporting Goods Corp. | 2.90% |
| United Natural Foods, Inc. | 2.87% |
| Yellow Corp. | 2.80% |
| AutoNation, Inc. | 2.77% |
| Quanta Services, Inc. | 2.69% |
Note: For presentation purposes, the Fund has grouped some of the industry categories. For purposes of categorizing securities for compliance with Section 8(b)(1) of the Investment Company Act of 1940, as amended, the Fund uses more specific industry classifications.
The Global Industry Classification Standard (GICS®) was developed by and is the exclusive property and a service mark of MSCI, Inc. and Standard & Poor’s Financial Services LLC. It has been licensed for use by the Hennessy Funds.
| HENNESSY FUNDS | 1-800-966-4354 |
7
| COMMON STOCKS – 98.97% | Number | % of | ||||||||||
| of Shares | Value | Net Assets | ||||||||||
| Communication Services – 2.87% | ||||||||||||
| Fluent, Inc. (a) | 473,400 | $ | 1,126,692 | 0.67 | % | |||||||
| Gogo, Inc. (a) | 226,500 | 3,682,890 | 2.20 | % | ||||||||
| 4,809,582 | 2.87 | % | ||||||||||
| Consumer Discretionary – 38.58% | ||||||||||||
| 1-800-Flowers.com, Inc. (a) | 95,600 | 3,070,672 | 1.83 | % | ||||||||
| AutoNation, Inc. (a) | 38,400 | 4,651,008 | 2.77 | % | ||||||||
| Bed Bath & Beyond, Inc. (a) | 108,600 | 1,524,744 | 0.91 | % | ||||||||
| Big 5 Sporting Goods Corp. | 201,300 | 4,867,434 | 2.90 | % | ||||||||
| Big Lots, Inc. | 54,700 | 2,420,475 | 1.44 | % | ||||||||
| Citi Trends, Inc. (a) | 47,800 | 3,697,808 | 2.21 | % | ||||||||
| GoPro, Inc. (a) | 273,800 | 2,357,418 | 1.41 | % | ||||||||
| Green Brick Partners, Inc. (a) | 135,200 | 3,521,960 | 2.10 | % | ||||||||
| Hibbett, Inc. | 50,700 | 3,926,208 | 2.34 | % | ||||||||
| Hovnanian Enterprises, Inc. (a) | 59,900 | 5,047,174 | 3.01 | % | ||||||||
| Kirkland’s, Inc. (a) | 109,100 | 2,452,568 | 1.46 | % | ||||||||
| Lands’ End, Inc. (a) | 101,100 | 2,656,908 | 1.58 | % | ||||||||
| Lithia Motors, Inc., Class A | 8,500 | 2,713,370 | 1.62 | % | ||||||||
| Lumber Liquidators Holdings, Inc. (a) | 97,145 | 1,756,381 | 1.05 | % | ||||||||
| MarineMax, Inc. (a) | 67,100 | 3,475,109 | 2.07 | % | ||||||||
| Qurate Retail Group, Inc. | 230,800 | 2,409,552 | 1.44 | % | ||||||||
| Signet Jewelers Ltd. (b) | 66,100 | 5,894,798 | 3.51 | % | ||||||||
| Sportsman’s Warehouse Holdings, Inc. (a) | 162,500 | 2,804,750 | 1.67 | % | ||||||||
| Vista Outdoor, Inc. (a) | 91,700 | 3,836,728 | 2.29 | % | ||||||||
| VOXX International Corp. (a) | 144,200 | 1,630,902 | 0.97 | % | ||||||||
| 64,715,967 | 38.58 | % | ||||||||||
| Consumer Staples – 7.19% | ||||||||||||
| BJ’s Wholesale Club Holdings, Inc. (a) | 66,800 | 3,903,792 | 2.33 | % | ||||||||
| Nu Skin Enterprises, Inc. | 48,000 | 1,927,200 | 1.15 | % | ||||||||
| SunOpta, Inc. (a)(b) | 182,200 | 1,413,872 | 0.84 | % | ||||||||
| United Natural Foods, Inc. (a) | 110,800 | 4,807,612 | 2.87 | % | ||||||||
| 12,052,476 | 7.19 | % | ||||||||||
| Energy – 5.52% | ||||||||||||
| Centrus Energy Corp. (a) | 129,700 | 7,350,099 | 4.38 | % | ||||||||
| Renewable Energy Group, Inc. (a) | 29,900 | 1,913,600 | 1.14 | % | ||||||||
| 9,263,699 | 5.52 | % | ||||||||||
The accompanying notes are an integral part of these financial statements.
| WWW.HENNESSYFUNDS.COM |
8
| SCHEDULE OF INVESTMENTS |
| COMMON STOCKS | Number | % of | ||||||||||
| of Shares | Value | Net Assets | ||||||||||
| Financials – 3.16% | ||||||||||||
| PennyMac Financial Services, Inc. | 45,300 | $ | 2,811,318 | 1.68 | % | |||||||
| Virtu Financial, Inc. | 99,900 | 2,485,512 | 1.48 | % | ||||||||
| 5,296,830 | 3.16 | % | ||||||||||
| Health Care – 9.57% | ||||||||||||
| Community Health Systems, Inc. (a) | 305,200 | 3,998,120 | 2.38 | % | ||||||||
| Covetrus, Inc. (a) | 82,500 | 1,665,675 | 0.99 | % | ||||||||
| Molina Healthcare, Inc. (a) | 13,300 | 3,933,076 | 2.34 | % | ||||||||
| Owens & Minor, Inc. | 97,000 | 3,480,360 | 2.08 | % | ||||||||
| Surgery Partners, Inc. (a) | 72,400 | 2,978,536 | 1.78 | % | ||||||||
| 16,055,767 | 9.57 | % | ||||||||||
| Industrials – 18.26% | ||||||||||||
| BlueLinx Holdings, Inc. (a) | 73,900 | 3,519,857 | 2.10 | % | ||||||||
| Danaos Corp. (b) | 105,303 | 7,855,604 | 4.68 | % | ||||||||
| Infrastructure and Energy Alternatives, Inc. (a) | 138,500 | 1,533,195 | 0.91 | % | ||||||||
| MYR Group, Inc. (a) | 47,900 | 4,892,985 | 2.92 | % | ||||||||
| Quanta Services, Inc. | 37,200 | 4,511,616 | 2.69 | % | ||||||||
| Titan Machinery, Inc. (a) | 127,400 | 3,620,708 | 2.16 | % | ||||||||
| Yellow Corp. (a) | 537,400 | 4,702,250 | 2.80 | % | ||||||||
| 30,636,215 | 18.26 | % | ||||||||||
| Information Technology – 7.84% | ||||||||||||
| Alpha & Omega Semiconductor Ltd. (a)(b) | 87,400 | 3,028,410 | 1.80 | % | ||||||||
| MoneyGram International, Inc. (a) | 353,600 | 2,110,992 | 1.26 | % | ||||||||
| Turtle Beach Corp. (a) | 99,100 | 2,850,116 | 1.70 | % | ||||||||
| Ultra Clean Holdings, Inc. (a) | 69,000 | 3,420,330 | 2.04 | % | ||||||||
| VirnetX Holding Corp. (a) | 451,300 | 1,737,505 | 1.04 | % | ||||||||
| 13,147,353 | 7.84 | % | ||||||||||
| Materials – 5.98% | ||||||||||||
| Century Aluminum Co. (a) | 273,100 | 3,607,651 | 2.15 | % | ||||||||
| Rayonier Advanced Materials, Inc. (a) | 356,259 | 2,557,940 | 1.52 | % | ||||||||
| Tronox Holdings PLC (b) | 165,900 | 3,868,788 | 2.31 | % | ||||||||
| 10,034,379 | 5.98 | % | ||||||||||
| Total Common Stocks | ||||||||||||
| (Cost $148,700,919) | 166,012,268 | 98.97 | % | |||||||||
The accompanying notes are an integral part of these financial statements.
| HENNESSY FUNDS | 1-800-966-4354 |
9
| SHORT-TERM INVESTMENTS – 1.21% | Number | % of | ||||||||||
| of Shares | Value | Net Assets | ||||||||||
| Money Market Funds – 1.21% | ||||||||||||
| First American Government Obligations Fund, | ||||||||||||
| Institutional Class, 0.03% (c) | 2,025,793 | $ | 2,025,793 | 1.21 | % | |||||||
| Total Short-Term Investments | ||||||||||||
| (Cost $2,025,793) | 2,025,793 | 1.21 | % | |||||||||
| Total Investments | ||||||||||||
| (Cost $150,726,712) – 100.18% | 168,038,061 | 100.18 | % | |||||||||
| Liabilities in Excess of Other Assets – (0.18)% | (297,268 | ) | (0.18 | )% | ||||||||
TOTAL NET ASSETS – 100.00% | $ | 167,740,793 | 100.00 | % | ||||||||
Percentages are stated as a percent of net assets.
| (a) | Non-income-producing security. |
| (b) | U.S.-traded security of a foreign corporation. |
| (c) | The rate listed is the fund’s seven-day yield as of October 31, 2021. |
Summary of Fair Value Exposure as of October 31, 2021
The following is a summary of the inputs used to value the Fund’s net assets as of October 31, 2021 (see Note 3 in the accompanying Notes to the Financial Statements):
| Common Stocks | Level 1 | Level 2 | Level 3 | Total | ||||||||||||
| Communication Services | $ | 4,809,582 | $ | — | $ | — | $ | 4,809,582 | ||||||||
| Consumer Discretionary | 64,715,967 | — | — | 64,715,967 | ||||||||||||
| Consumer Staples | 12,052,476 | — | — | 12,052,476 | ||||||||||||
| Energy | 9,263,699 | — | — | 9,263,699 | ||||||||||||
| Financials | 5,296,830 | — | — | 5,296,830 | ||||||||||||
| Health Care | 16,055,767 | — | — | 16,055,767 | ||||||||||||
| Industrials | 30,636,215 | — | — | 30,636,215 | ||||||||||||
| Information Technology | 13,147,353 | — | — | 13,147,353 | ||||||||||||
| Materials | 10,034,379 | — | — | 10,034,379 | ||||||||||||
| Total Common Stocks | $ | 166,012,268 | $ | — | $ | — | $ | 166,012,268 | ||||||||
| Short-Term Investments | ||||||||||||||||
| Money Market Funds | $ | 2,025,793 | $ | — | $ | — | $ | 2,025,793 | ||||||||
| Total Short-Term Investments | $ | 2,025,793 | $ | — | $ | — | $ | 2,025,793 | ||||||||
| Total Investments | $ | 168,038,061 | $ | — | $ | — | $ | 168,038,061 | ||||||||
The accompanying notes are an integral part of these financial statements.
| WWW.HENNESSYFUNDS.COM |
10
| SCHEDULE OF INVESTMENTS/STATEMENT OF ASSETS AND LIABILITIES |
Financial Statements
Statement of Assets and Liabilities as of October 31, 2021 |
| ASSETS: | ||||
| Investments in securities, at value (cost $150,726,712) | $ | 168,038,061 | ||
| Dividends and interest receivable | 12,983 | |||
| Receivable for fund shares sold | 1,464 | |||
| Prepaid expenses and other assets | 22,094 | |||
| Total assets | 168,074,602 | |||
| LIABILITIES: | ||||
| Payable for fund shares redeemed | 76,379 | |||
| Payable to advisor | 104,044 | |||
| Payable to administrator | 49,324 | |||
| Payable to auditor | 22,556 | |||
| Accrued distribution fees | 32,318 | |||
| Accrued service fees | 12,744 | |||
| Accrued trustees fees | 6,604 | |||
| Accrued expenses and other payables | 29,840 | |||
| Total liabilities | 333,809 | |||
| NET ASSETS | $ | 167,740,793 | ||
| NET ASSETS CONSISTS OF: | ||||
| Capital stock | $ | 114,390,019 | ||
| Total distributable earnings | 53,350,774 | |||
| Total net assets | $ | 167,740,793 | ||
| NET ASSETS: | ||||
| Investor Class | ||||
| Shares authorized (no par value) | Unlimited | |||
| Net assets applicable to outstanding shares | $ | 151,959,414 | ||
| Shares issued and outstanding | 5,093,733 | |||
| Net asset value, offering price, and redemption price per share | $ | 29.83 | ||
| Institutional Class | ||||
| Shares authorized (no par value) | Unlimited | |||
| Net assets applicable to outstanding shares | $ | 15,781,379 | ||
| Shares issued and outstanding | 507,650 | |||
| Net asset value, offering price, and redemption price per share | $ | 31.09 | ||
The accompanying notes are an integral part of these financial statements.
| HENNESSY FUNDS | 1-800-966-4354 |
11
Financial Statements
Statement of Operations for the year ended October 31, 2021 |
| INVESTMENT INCOME: | ||||
Dividend income(1) | $ | 1,378,824 | ||
| Interest income | 1,236 | |||
| Total investment income | 1,380,060 | |||
| EXPENSES: | ||||
| Investment advisory fees (See Note 5) | 1,220,726 | |||
| Sub-transfer agent expenses – Investor Class (See Note 5) | 226,054 | |||
| Sub-transfer agent expenses – Institutional Class (See Note 5) | 10,112 | |||
| Distribution fees – Investor Class (See Note 5) | 224,615 | |||
| Administration, accounting, custody, and transfer agent fees (See Note 5) | 192,483 | |||
| Service fees – Investor Class (See Note 5) | 149,743 | |||
| Federal and state registration fees | 32,104 | |||
| Compliance expense (See Note 5) | 27,448 | |||
| Audit fees | 22,556 | |||
| Trustees’ fees and expenses | 19,401 | |||
| Reports to shareholders | 13,505 | |||
| Legal fees | 2,876 | |||
| Interest expense (See Note 7) | 154 | |||
| Other expenses | 23,815 | |||
| Total expenses | 2,165,592 | |||
| NET INVESTMENT LOSS | $ | (785,532 | ) | |
| REALIZED AND UNREALIZED GAINS (LOSSES): | ||||
| Net realized gain on investments | $ | 41,914,519 | ||
| Net change in unrealized appreciation/depreciation on investments | 18,604,616 | |||
| Net gain on investments | 60,519,135 | |||
| NET INCREASE IN NET ASSETS RESULTING FROM OPERATIONS | $ | 59,733,603 | ||
(1) | Net of foreign taxes withheld and issuance fees of $2,958. |
The accompanying notes are an integral part of these financial statements.
| WWW.HENNESSYFUNDS.COM |
12
| STATEMENT OF OPERATIONS/STATEMENTS OF CHANGES IN NET ASSETS |
Financial Statements
| Statements of Changes in Net Assets |
| Year Ended | Year Ended | |||||||
| October 31, 2021 | October 31, 2020 | |||||||
| OPERATIONS: | ||||||||
| Net investment loss | $ | (785,532 | ) | $ | (510,935 | ) | ||
| Net realized gain on investments | 41,914,519 | 10,883,233 | ||||||
| Net change in unrealized | ||||||||
| appreciation/depreciation on investments | 18,604,616 | (7,115,920 | ) | |||||
| Net increase in net assets resulting from operations | 59,733,603 | 3,256,378 | ||||||
| CAPITAL SHARE TRANSACTIONS: | ||||||||
| Proceeds from shares subscribed – Investor Class | 7,853,848 | 1,531,765 | ||||||
| Proceeds from shares subscribed – Institutional Class | 1,438,342 | 413,552 | ||||||
| Cost of shares redeemed – Investor Class | (20,954,269 | ) | (18,630,110 | ) | ||||
| Cost of shares redeemed – Institutional Class | (2,945,640 | ) | (3,680,802 | ) | ||||
| Net decrease in net assets derived | ||||||||
| from capital share transactions | (14,607,719 | ) | (20,365,595 | ) | ||||
| TOTAL INCREASE (DECREASE) IN NET ASSETS | 45,125,884 | (17,109,217 | ) | |||||
| NET ASSETS: | ||||||||
| Beginning of year | 122,614,909 | 139,724,126 | ||||||
| End of year | $ | 167,740,793 | $ | 122,614,909 | ||||
| CHANGES IN SHARES OUTSTANDING: | ||||||||
| Shares sold – Investor Class | 276,838 | 86,853 | ||||||
| Shares sold – Institutional Class | 49,401 | 22,734 | ||||||
| Shares redeemed – Investor Class | (755,784 | ) | (1,047,908 | ) | ||||
| Shares redeemed – Institutional Class | (105,327 | ) | (196,584 | ) | ||||
| Net decrease in shares outstanding | (534,872 | ) | (1,134,905 | ) | ||||
The accompanying notes are an integral part of these financial statements.
| HENNESSY FUNDS | 1-800-966-4354 |
13
Financial Statements
| Financial Highlights |
For an Investor Class share outstanding throughout each year
PER SHARE DATA:
Net asset value, beginning of year
Income from investment operations:
Net investment loss
Net realized and unrealized gains (losses) on investments
Total from investment operations
Less distributions:
Dividends from net realized gains
Total distributions
Net asset value, end of year
TOTAL RETURN
SUPPLEMENTAL DATA AND RATIOS:
Net assets, end of year (millions)
Ratio of expenses to average net assets
Ratio of net investment loss to average net assets
Portfolio turnover rate(2)
(1) | Calculated using the average shares outstanding method. |
(2) | Calculated on the basis of the Fund as a whole. |
The accompanying notes are an integral part of these financial statements.
| WWW.HENNESSYFUNDS.COM |
14
| FINANCIAL HIGHLIGHTS — INVESTOR CLASS |
| Year Ended October 31, | ||||||||||||||||||
| 2021 | 2020 | 2019 | 2018 | 2017 | ||||||||||||||
| $ | 19.91 | $ | 19.15 | $ | 22.17 | $ | 24.16 | $ | 18.98 | |||||||||
| (0.14 | )(1) | (0.08 | )(1) | (0.01 | )(1) | (0.17 | ) | (0.09 | ) | |||||||||
| 10.06 | 0.84 | (1.19 | ) | (1.82 | ) | 5.27 | ||||||||||||
| 9.92 | 0.76 | (1.20 | ) | (1.99 | ) | 5.18 | ||||||||||||
| — | — | (1.82 | ) | — | — | |||||||||||||
| — | — | (1.82 | ) | — | — | |||||||||||||
| $ | 29.83 | $ | 19.91 | $ | 19.15 | $ | 22.17 | $ | 24.16 | |||||||||
| 49.82 | % | 3.97 | % | -5.19 | % | -8.24 | % | 27.29 | % | |||||||||
| $ | 151.96 | $ | 110.96 | $ | 125.10 | $ | 158.98 | $ | 197.22 | |||||||||
| 1.34 | % | 1.36 | % | 1.34 | % | 1.30 | % | 1.30 | % | |||||||||
| (0.51 | )% | (0.45 | )% | (0.07 | )% | (0.56 | )% | (0.33 | )% | |||||||||
| 98 | % | 98 | % | 95 | % | 133 | % | 98 | % | |||||||||
The accompanying notes are an integral part of these financial statements.
| HENNESSY FUNDS | 1-800-966-4354 |
15
Financial Statements
| Financial Highlights |
For an Institutional Class share outstanding throughout each year
PER SHARE DATA:
Net asset value, beginning of year
Income from investment operations:
Net investment income (loss)
Net realized and unrealized gains (losses) on investments
Total from investment operations
Less distributions:
Dividends from net realized gains
Total distributions
Net asset value, end of year
TOTAL RETURN
SUPPLEMENTAL DATA AND RATIOS:
Net assets, end of year (millions)
Ratio of expenses to average net assets
Ratio of net investment income (loss) to average net assets
Portfolio turnover rate(2)
(1) | Calculated using the average shares outstanding method. |
(2) | Calculated on the basis of the Fund as a whole. |
The accompanying notes are an integral part of these financial statements.
| WWW.HENNESSYFUNDS.COM |
16
| FINANCIAL HIGHLIGHTS — INSTITUTIONAL CLASS |
| Year Ended October 31, | ||||||||||||||||||
| 2021 | 2020 | 2019 | 2018 | 2017 | ||||||||||||||
| $ | 20.68 | $ | 19.83 | $ | 22.88 | $ | 24.85 | $ | 19.46 | |||||||||
| (0.05 | )(1) | (0.03 | )(1) | 0.05 | (1) | 0.11 | 0.01 | |||||||||||
| 10.46 | 0.88 | (1.22 | ) | (2.08 | ) | 5.38 | ||||||||||||
| 10.41 | 0.85 | (1.17 | ) | (1.97 | ) | 5.39 | ||||||||||||
| — | — | (1.88 | ) | — | — | |||||||||||||
| — | — | (1.88 | ) | — | — | |||||||||||||
| $ | 31.09 | $ | 20.68 | $ | 19.83 | $ | 22.88 | $ | 24.85 | |||||||||
| 50.34 | % | 4.29 | % | -4.86 | % | -7.93 | % | 27.70 | % | |||||||||
| $ | 15.78 | $ | 11.65 | $ | 14.62 | $ | 20.52 | $ | 31.65 | |||||||||
| 1.01 | % | 1.05 | % | 1.01 | % | 0.96 | % | 0.97 | % | |||||||||
| (0.17 | )% | (0.14 | )% | 0.27 | % | (0.23 | )% | (0.00 | )% | |||||||||
| 98 | % | 98 | % | 95 | % | 133 | % | 98 | % | |||||||||
The accompanying notes are an integral part of these financial statements.
| HENNESSY FUNDS | 1-800-966-4354 |
17
Financial Statements
Notes to the Financial Statements October 31, 2021 |
1). ORGANIZATION
The Hennessy Cornerstone Growth Fund (the “Fund”) is a series of Hennessy Funds Trust (the “Trust”), which was organized as a Delaware statutory trust on September 17, 1992. The Fund is an open-end management investment company registered under the Investment Company Act of 1940, as amended. The investment objective of the Fund is long-term growth of capital. The Fund is a diversified fund.
The Fund offers Investor Class and Institutional Class shares. Each class of shares differs principally in its respective 12b-1 distribution and service, shareholder servicing, and sub-transfer agent expenses. There are no sales charges. Each class has identical rights to earnings, assets, and voting privileges, except for class-specific expenses and exclusive rights to vote on matters affecting only one class.
As an investment company, the Fund follows the investment company accounting and reporting guidance of the Financial Accounting Standards Board (“FASB”) Accounting Standard Codification Topic 946 “Financial Services—Investment Companies.”
2). SIGNIFICANT ACCOUNTING POLICIES
The following is a summary of significant accounting policies consistently followed by the Fund in the preparation of the financial statements. These policies conform to U.S. generally accepted accounting principles (“GAAP”).
| a). | Securities Valuation – All investments in securities are valued in accordance with the Fund’s valuation policies and procedures, as described in Note 3. |
| b). | Federal Income Taxes – The Fund has elected to be taxed as a regulated investment company and intends to distribute substantially all of its taxable income to its shareholders and otherwise comply with the provisions of the Internal Revenue Code of 1986, as amended, applicable to regulated investment companies. As a result, the Fund has made no provision for federal income taxes or excise taxes. Net investment income/loss and realized gains/losses for federal income tax purposes may differ from those reported in the financial statements because of temporary book-basis and tax-basis differences. Temporary differences are primarily the result of the treatment of partnership income and wash sales for tax reporting purposes. The Fund recognizes interest and penalties related to income tax benefits, if any, in the Statement of Operations as an income tax expense. Distributions from net realized gains for book purposes may include short-term capital gains, which are included as ordinary income to shareholders for tax purposes. The Fund may utilize equalization accounting for tax purposes and designate earnings and profits, including net realized gains distributed to shareholders on redemption of shares, as part of the dividends paid deduction for income tax purposes. |
| Due to inherent differences in the recognition of income, expenses, and realized gains/losses under GAAP and federal income tax regulations, permanent differences between book and tax basis for reporting are identified and appropriately reclassified in the Statement of Assets and Liabilities, as needed. The adjustments for fiscal year 2021 are as follows: |
| Total | |||
| Distributable | |||
Earnings | Capital Stock | ||
| $(2,742,446) | $2,742,446 |
| WWW.HENNESSYFUNDS.COM |
18
| NOTES TO THE FINANCIAL STATEMENTS |
| c). | Accounting for Uncertainty in Income Taxes – The Fund has accounting policies regarding recognition and measurement of tax positions taken or expected to be taken on a tax return. The tax returns of the Fund for the prior three fiscal years are open for examination. The Fund has reviewed all open tax years in major tax jurisdictions and concluded that there is no impact on the Fund’s net assets and no tax liability resulting from unrecognized tax benefits relating to uncertain income tax positions taken or expected to be taken on a tax return. The Fund’s major tax jurisdictions are U.S. federal and Delaware. |
| d). | Income and Expenses – Dividend income is recognized on the ex-dividend date or as soon as information is available to the Fund. Interest income, which includes the amortization of premium and accretion of discount, is recognized on an accrual basis. Market discounts, original issue discounts, and market premiums on debt securities are accreted or amortized to interest income over the life of a security with a corresponding increase or decrease, as applicable, in the cost basis of such security using the yield-to-maturity method or, where applicable, the first call date of the security. Other non-cash dividends are recognized as investment income at the fair value of the property received. The Fund is charged for those expenses that are directly attributable to its portfolio, such as advisory, administration, and certain shareholder service fees. Income, expenses (other than expenses attributable to a specific class), and realized and unrealized gains/losses on investments are allocated to each class of shares based on such class’s net assets. |
| e). | Distributions to Shareholders – Dividends from net investment income for the Fund, if any, are declared and paid annually, usually in December. Distributions of net realized capital gains, if any, are declared and paid annually, usually in December. |
| f). | Security Transactions – Investment and shareholder transactions are recorded on the trade date. The Fund determines the realized gain/loss from an investment transaction by comparing the original cost of the security lot sold with the net sale proceeds. Discounts and premiums on securities purchased are accreted or amortized, respectively, over the life of each such security. |
| g). | Use of Estimates – Preparing financial statements in accordance with GAAP requires management to make estimates and assumptions that affect the reported amounts of assets and liabilities and disclosure of contingent assets and liabilities at the date of the financial statements, as well as the reported change in net assets during the reporting period. Actual results could differ from those estimates. |
| h). | Share Valuation – The net asset value (“NAV”) per share of the Fund is calculated by dividing (i) the total value of the securities held by the Fund, plus cash and other assets, minus all liabilities (including estimated accrued expenses) by (ii) the total number of Fund shares outstanding, rounded to the nearest $0.01. Fund shares are not priced on days the New York Stock Exchange is closed for trading. The offering and redemption price per share for the Fund is equal to the Fund’s NAV per share. |
| i). | Recent Accounting Pronouncements and Regulatory Updates – In October 2020, the Securities and Exchange Commission (“SEC”) adopted new regulations governing the use of derivatives by registered investment companies (“Rule 18f-4”). Rule 18f-4 imposes limits on the amount of derivatives a fund can enter into, eliminates the asset segregation framework currently used by funds to comply with Section 18 of the 1940 Act, and requires funds whose use of derivatives is greater than a limited specified amount to establish and maintain a comprehensive derivatives risk management program and appoint a derivatives risk manager. Funds are required to comply with Rule 18f-4 by August 19, 2022. The impact, if any, that Rule 18f-4 will |
| HENNESSY FUNDS | 1-800-966-4354 |
19
| have on the availability, liquidity, and performance of derivatives is unclear. Management is currently evaluating the potential impact of Rule 18f-4 on the Fund. When fully implemented, Rule 18f-4 may require changes in how the Fund uses derivatives, adversely affect the Fund’s performance, and increase costs related to the Fund’s use of derivatives. | |
| In December 2020, the SEC adopted a new rule providing a framework for fund valuation practices (“Rule 2a-5”). Rule 2a-5 establishes requirements for determining fair value in good faith for purposes of the 1940 Act. Rule 2a-5 permits fund boards to designate certain parties to perform fair value determinations, subject to board oversight and certain other conditions. Rule 2a-5 also defines when market quotations are “readily available” for purposes of the 1940 Act and the threshold for determining whether a fund must fair value a security. In connection with Rule 2a-5, the SEC also adopted related recordkeeping requirements and is rescinding previously issued guidance, including with respect to the role of a board in determining fair value and the accounting and auditing of fund investments. Funds must comply with the rules by September 8, 2022. Management is currently assessing the potential impact of the new rules on the Fund’s financial statements. |
3). SECURITIES VALUATION
The Fund follows its valuation policies and procedures in determining its net asset value and, in preparing these financial statements, the fair value accounting standards that establish an authoritative definition of fair value and set out a hierarchy for measuring fair value. These standards require additional disclosures about the various inputs and valuation techniques used to develop the measurements of fair value and a discussion of changes in valuation techniques and related inputs during the period. These inputs are summarized in the three broad levels listed below:
| Level 1 – | Unadjusted, quoted prices in active markets for identical instruments that the Fund has the ability to access at the date of measurement. | |
| Level 2 – | Other significant observable inputs (including, but not limited to, quoted prices in active markets for similar instruments, quoted prices in markets that are not active for identical or similar instruments, and model-derived valuations in which all significant inputs and significant value drivers are observable in active markets, such as interest rates, prepayment speeds, credit risk curves, default rates, and similar data). | |
| Level 3 – | Significant unobservable inputs (including the Fund’s own assumptions about what market participants would use to price the asset or liability based on the best available information) when observable inputs are unavailable. |
The following is a description of the valuation techniques applied to the Fund’s major categories of assets and liabilities on a recurring basis:
Equity Securities – Equity securities, including common stocks, preferred stocks, foreign-issued common stocks, exchange-traded funds, closed-end mutual funds, partnerships, rights, and real estate investment trusts, that are traded on a securities exchange for which a last-quoted sales price is readily available generally are valued at the last sales price as reported by the primary exchange on which the securities are listed. Securities listed on The NASDAQ Stock Market (“NASDAQ”) generally are valued at the NASDAQ Official Closing Price, which may differ from the last sales price reported. Securities traded on a securities exchange for which a last-quoted sales price is not readily available generally are valued at the mean between the bid |
| WWW.HENNESSYFUNDS.COM |
20
| NOTES TO THE FINANCIAL STATEMENTS |
| and ask prices. To the extent these securities are actively traded and valuation adjustments are not applied, they are classified in Level 1 of the fair value hierarchy. Securities traded on foreign exchanges generally are not valued at the same time the Fund calculates its NAV because most foreign markets close well before such time. The earlier close of most foreign markets gives rise to the possibility that significant events, including broad market moves, may have occurred in the interim. In certain circumstances, it may be determined that a foreign security needs to be fair valued because it appears that the value of the security might have been materially affected by events occurring after the close of the market in which the security is principally traded, but before the time the Fund calculates its NAV, such as by a development that affects an entire market or region (e.g., a weather-related event) or a potentially global development (e.g., a terrorist attack that may be expected to have an effect on investor expectations worldwide). | |
Registered Investment Companies – Investments in open-end registered investment companies, commonly referred to as mutual funds, generally are priced at the ending NAV provided by the applicable mutual fund’s service agent and are classified in Level 1 of the fair value hierarchy. | |
Debt Securities – Debt securities, including corporate bonds, asset-backed securities, mortgage-backed securities, municipal bonds, U.S. Treasuries, and U.S. government agency issues, are generally valued at market on the basis of valuations furnished by an independent pricing service that utilizes both dealer-supplied valuations and formula-based techniques. The pricing service may consider recently executed transactions in securities of the issuer or comparable issuers, market price quotations (where observable), bond spreads, and fundamental data relating to the issuer. In addition, the model may incorporate observable market data, such as reported sales of similar securities, broker quotes, yields, bids, offers, and reference data. Certain securities are valued primarily using dealer quotations. These securities are generally classified in Level 2 of the fair value hierarchy. | |
Short-Term Securities – Short-term equity investments, including money market funds, are valued in the manner specified above for equity securities. Short-term debt investments with an original term to maturity of 60 days or less are valued at amortized cost, which approximates fair market value. If the original term to maturity of a short-term debt investment exceeds 60 days, then the values as of the 61st day prior to maturity are amortized. Amortized cost is not used if its use would be inappropriate due to credit or other impairments of the issuer, in which case the security’s fair value would be determined as described below. Short-term securities are generally classified in Level 1 or Level 2 of the fair value hierarchy depending on the inputs used and market activity levels for specific securities. |
The Board of Trustees of the Fund (the “Board”) has adopted fair value pricing procedures that are followed when a price for a security is not readily available or if a significant event has occurred that indicates the closing price of a security no longer represents the true value of that security. Fair value pricing determinations are made in good faith in accordance with these procedures. There are numerous criteria considered in determining a fair value of a security, such as the trading volume of a security and markets, the values of other similar securities, and news events with direct bearing on a security or markets. Fair value pricing results in an estimated price for a security that reflects the amount the Fund might reasonably expect to receive in a current sale. Depending on the relative significance of the valuation inputs, these securities may be classified in either Level 2 or Level 3 of the fair value hierarchy.
| HENNESSY FUNDS | 1-800-966-4354 |
21
The fair value of foreign securities may be determined with the assistance of a pricing service using correlations between the movement of prices of such securities and indices of domestic securities and other appropriate indicators, such as closing market prices of relevant American Depositary Receipts or futures contracts. Using fair value pricing means that the Fund’s NAV reflects the affected portfolio securities’ values as determined by the Board or its designee, pursuant to the fair value pricing procedures adopted by the Board, instead of being determined by the market. Using a fair value pricing methodology to price a foreign security may result in a value that is different from such foreign security’s most recent closing price and from the value used by other investment companies to calculate their NAVs. Such securities are generally classified in Level 2 of the fair value hierarchy. Because the Fund may invest in foreign securities, the value of the Fund’s portfolio securities may change on days when a shareholder is unable to purchase or redeem Fund shares.
The Board has delegated day-to-day valuation matters to the Valuation and Liquidity Committee comprising representatives from Hennessy Advisors, Inc., the Fund’s investment advisor (the “Advisor”). The function of the Valuation and Liquidity Committee, among other things, is to value securities where current and reliable market quotations are not readily available. All actions taken by the Valuation and Liquidity Committee are reviewed by the Board.
The Fund has performed an analysis of all existing investments to determine the significance and character of all inputs to their fair value determinations. Various inputs are used to determine the value of the Fund’s investments. The inputs or methodology used for valuing securities are not necessarily an indication of the risk associated with investing in those securities. Details related to the fair value hierarchy of the Fund’s securities as of October 31, 2021, are included in the Schedule of Investments.
4). INVESTMENT TRANSACTIONS
Purchases and sales of investment securities (excluding government and short-term investments) for the Fund during fiscal year 2021 were $154,780,535 and $168,018,608, respectively.
There were no purchases or sales/maturities of long-term U.S. government securities for the Fund during fiscal year 2021.
5). INVESTMENT ADVISORY FEE AND OTHER TRANSACTIONS WITH AFFILIATES
The Advisor provides the Fund with investment advisory services under an Investment Advisory Agreement. The Advisor furnishes all investment advice, office space, and facilities and most of the personnel needed by the Fund. As compensation for its services, the Advisor is entitled to a monthly fee from the Fund. The fee is based on the average daily net assets of the Fund at an annual rate of 0.74%. The net investment advisory fees expensed by the Fund during fiscal year 2021 are included in the Statement of Operations.
The Board has approved a Shareholder Servicing Agreement for Investor Class shares of the Fund, which compensates the Advisor for the non-investment advisory services it provides to the Fund. The Shareholder Servicing Agreement provides for a monthly fee paid to the Advisor at an annual rate of 0.10% of the average daily net assets of the Fund attributable to Investor Class shares. The shareholder service fees expensed by the Fund during fiscal year 2021 are included in the Statement of Operations.
The Fund has adopted a plan pursuant to Rule 12b-1 under the Investment Company Act of 1940, as amended, that authorizes payments in connection with the distribution of Fund shares at an annual rate of up to 0.25% of the Fund’s average daily net assets attributable to Investor Class shares. Even though the authorized rate is up to
| WWW.HENNESSYFUNDS.COM |
22
| NOTES TO THE FINANCIAL STATEMENTS |
0.25%, the Fund is currently only using up to 0.15% of its average daily net assets attributable to Investor Class shares for such purpose. Amounts paid under the plan may be spent on any activities or expenses primarily intended to result in the sale of shares, including, but not limited to, advertising, shareholder account servicing, printing and mailing of prospectuses to other than current shareholders, printing and mailing of sales literature, and compensation for sales and marketing activities or to financial institutions and others, such as dealers and distributors. The distribution fees expensed by the Fund during fiscal year 2021 are included in the Statement of Operations.
The Fund has entered into agreements with various brokers, dealers, and financial intermediaries in connection with the sale of Fund shares. The agreements provide for periodic payments of sub-transfer agent expenses by the Fund to the brokers, dealers, and financial intermediaries for providing certain shareholder maintenance services. These shareholder services include the pre-processing and quality control of new accounts, shareholder correspondence, answering customer inquiries regarding account status, and facilitating shareholder telephone transactions. The sub-transfer agent fees expensed by the Fund during fiscal year 2021 are included in the Statement of Operations.
U.S. Bancorp Fund Services, LLC, d/b/a U.S. Bank Global Fund Services (“Fund Services”) provides the Fund with administrative, accounting, and transfer agent services. As administrator, Fund Services is responsible for activities such as (i) preparing various federal and state regulatory filings, reports, and returns for the Fund, (ii) preparing reports and materials to be supplied to the Board, (iii) monitoring the activities of the Fund’s custodian, transfer agent, and accountants, and (iv) coordinating the preparation and payment of the Fund’s expenses and reviewing the Fund’s expense accruals. U.S. Bank N.A., an affiliate of Fund Services, serves as the Fund’s custodian. The servicing agreements between the Trust, Fund Services, and U.S. Bank N.A. contain a fee schedule that is inclusive of administrative, accounting, custody, and transfer agent fees. The administrative, accounting, custody, and transfer agent fees expensed by the Fund during fiscal year 2021 are included in the Statement of Operations.
Quasar Distributors, LLC (“Quasar”), a wholly owned broker-dealer subsidiary of Foreside Financial Group, LLC (“Foreside”), acts as the Fund’s principal underwriter in a continuous public offering of Fund shares. Effective September 30, 2021, Genstar Capital, a private equity firm specializing in financial and related business service companies, acquired a majority interest in Foreside. The Board approved a new Distribution Agreement to enable Quasar to continue serving as the Fund’s distributor following the change in control of Foreside.
The officers of the Fund are affiliated with the Advisor. With the exception of the Chief Compliance Officer and the Senior Compliance Officer, such officers receive no compensation from the Fund for serving in their respective roles. The Fund, along with the other funds in the Hennessy Funds family (collectively, the “Hennessy Funds”), makes reimbursement payments on an equal basis to the Advisor for a portion of the salary and benefits associated with the office of the Chief Compliance Officer and for all of the salary and benefits associated with the office of the Senior Compliance Officer. The compliance fees expensed by the Fund during fiscal year 2021 are included in the Statement of Operations.
6). GUARANTEES AND INDEMNIFICATIONS
Under the Hennessy Funds’ organizational documents, their officers and trustees are indemnified by the Hennessy Funds against certain liabilities arising out of the performance of their duties to the Hennessy Funds. Additionally, in the normal course of business, the Hennessy Funds enter into contracts with service providers that contain
| HENNESSY FUNDS | 1-800-966-4354 |
23
general indemnification clauses. The Fund’s maximum exposure under these arrangements is unknown as this would involve future claims that may be made against the Fund that have not yet occurred. Currently, the Fund expects the risk of loss to be remote.
7). LINE OF CREDIT
The Fund has an uncommitted line of credit with the other Hennessy Funds in the amount of the lesser of (i) $100,000,000 or (ii) 33.33% of each Hennessy Fund’s net assets, or 30% for the Hennessy Gas Utility Fund and 10% for the Hennessy Balanced Fund. The line of credit is intended to provide any necessary short-term financing in connection with shareholder redemptions, subject to certain restrictions. The credit facility is with the Hennessy Funds’ custodian bank, U.S. Bank N.A. Borrowings under this arrangement bear interest at the bank’s prime rate and are secured by all of the Fund’s assets (as to its own borrowings only). During fiscal year 2021, the Fund had an outstanding average daily balance and a weighted average interest rate of $4,663 and 3.25%, respectively. The interest expensed by the Fund during fiscal year 2021 is included in the Statement of Operations. The maximum amount outstanding for the Fund during fiscal year 2021 was $738,000. As of October 31, 2021, the Fund did not have any borrowings outstanding under the line of credit.
8). FEDERAL TAX INFORMATION
As of October 31, 2021, the components of accumulated earnings (losses) for income tax purposes were as follows:
| Investments | |||||
| Cost of investments for tax purposes | $ | 150,726,712 | |||
| Gross tax unrealized appreciation | $ | 36,563,930 | |||
| Gross tax unrealized depreciation | (19,252,581 | ) | |||
| Net tax unrealized appreciation/(depreciation) | $ | 17,311,349 | |||
| Undistributed ordinary income | $ | — | |||
| Undistributed long-term capital gains | 37,030,068 | ||||
| Total distributable earnings | $ | 37,030,068 | |||
| Other accumulated gain/(loss) | $ | (990,643 | ) | ||
| Total accumulated gain/(loss) | $ | 53,350,774 | |||
As of October 31, 2021, the Fund had no tax-basis capital losses to offset future capital gains. During fiscal year 2021, the capital losses utilized by the Fund were $1,916,363.
Capital losses sustained in or after fiscal year 2012 can be carried forward indefinitely, but any such loss retains the character of the original loss and must be utilized prior to any loss incurred before fiscal year 2012. As a result of this ordering rule, capital loss carryforwards incurred prior to fiscal year 2012 may be more likely to expire unused. Capital losses sustained prior to fiscal year 2012 can be carried forward for eight years and can be carried forward as short-term capital losses regardless of the character of the original loss.
As of October 31, 2021, the Fund deferred, on a tax basis, a late-year ordinary loss of $990,643. Late-year ordinary losses are net ordinary losses incurred after December 31, 2020, but within the taxable year, that are deemed to arise on the first day of the Fund’s next taxable year.
During fiscal years 2021 and 2020, the Fund did not pay any distributions.
| WWW.HENNESSYFUNDS.COM |
24
| NOTES TO THE FINANCIAL STATEMENTS |
9). EVENTS SUBSEQUENT TO YEAR END
Management has evaluated the Fund’s related events and transactions that occurred subsequent to October 31, 2021, through the date of issuance of the Fund’s financial statements. Other than as disclosed below, management has determined that there were no subsequent events requiring recognition or disclosure in the financial statements.
On December 7, 2021, capital gains were declared and paid to shareholders of record on December 6, 2021, as follows:
Long-term | ||
| Investor Class | $6.64534 | |
| Institutional Class | $6.92698 |
| HENNESSY FUNDS | 1-800-966-4354 |
25
Report of Independent Registered Public
Accounting Firm
To the Board of Trustees of Hennessy Funds Trust
and the shareholders of the Hennessy Cornerstone Growth Fund
Novato, CA
Opinion on the Financial Statements
We have audited the accompanying statement of assets and liabilities of the Hennessy Cornerstone Growth Fund (the “Fund”), a series of Hennessy Funds Trust, including the schedule of investments, as of October 31, 2021, the related statement of operations for the year then ended, the statements of changes in net assets for each of the two years in the period then ended, the financial highlights for each of the five years in the period then ended, and the related notes (collectively referred to as the “financial statements”). In our opinion, the financial statements present fairly, in all material respects, the financial position of the Fund as of October 31, 2021, the results of its operations for the year then ended, the changes in its net assets for each of the two years in the period then ended, and the financial highlights for each of the five years in the period then ended in conformity with accounting principles generally accepted in the United States of America.
Basis for Opinion
These financial statements are the responsibility of the Fund’s management. Our responsibility is to express an opinion on the Fund’s financial statements based on our audits. We are a public accounting firm registered with the Public Company Accounting Oversight Board (United States) (“PCAOB”) and are required to be independent with respect to the Fund in accordance with the U.S. federal securities laws and the applicable rules and regulations of the Securities and Exchange Commission and the PCAOB. We have served as the auditor of one or more of the funds in the Trust since 2002.
We conducted our audits in accordance with the standards of the PCAOB. Those standards require that we plan and perform the audit to obtain reasonable assurance about whether the financial statements are free of material misstatement, whether due to error or fraud. The Fund is not required to have, nor were we engaged to perform, an audit of its internal control over financial reporting. As part of our audits we are required to obtain an understanding of internal control over financial reporting, but not for the purpose of expressing an opinion on the effectiveness of the Fund’s internal control over financial reporting. Accordingly, we express no such opinion.
Our audits included performing procedures to assess the risks of material misstatement of the financial statements, whether due to error or fraud, and performing procedures that respond to those risks. Such procedures included examining, on a test basis, evidence regarding the amounts and disclosures in the financial statements. Our audits also included evaluating the accounting principles used and significant estimates made by management, as well as evaluating the overall presentation of the financial statements. Our procedures included confirmation of securities owned as of October 31, 2021 by correspondence with the custodian. We believe that our audits provide a reasonable basis for our opinion.
 | |
| TAIT, WELLER & BAKER LLP |
Philadelphia, Pennsylvania
December 22, 2021
| WWW.HENNESSYFUNDS.COM |
26
| REPORT OF INDEPENDENT REGISTERED PUBLIC ACCOUNTING FIRM/TRUSTEES AND OFFICERS |
Trustees and Officers of the Fund (Unaudited)
The business and affairs of the Funds are managed under the direction of the Board of Trustees of the Trust, and the Board of Trustees elects the officers of the Trust. From time to time, the Board of Trustees also has appointed advisers to the Board of Trustees (“Advisers”) with the intention of having qualified individuals serve in an advisory capacity to garner experience in the mutual fund and asset management industry and be considered as potential Trustees in the future. There are currently two Advisers, Brian Alexander and Doug Franklin. As Advisers, Mr. Alexander and Mr. Franklin attend meetings of the Board of Trustees and act as non-voting participants. Information pertaining to the Trustees, Advisers, and the officers of the Trust is set forth below. The Trustees and officers serve until their successors are duly elected and qualified or until their earlier death, resignation, or removal. Each Trustee oversees all 16 Hennessy Funds. Unless otherwise indicated, the address of all persons listed below is 7250 Redwood Boulevard, Suite 200, Novato, CA 94945. The Fund’s Statement of Additional Information includes more information about the persons listed below and is available without charge by calling 1-800-966-4354 or by visiting www.hennessyfunds.com.
| Other | |||
| Directorships | |||
| Held Outside | |||
| Name, Age, | of Fund | ||
| and Position Held | Start Date | Principal Occupation(s) | Complex During |
with the Trust | of Service | During Past Five Years | Past Five Years |
| Disinterested Trustees and Advisers | |||
| J. Dennis DeSousa | January 1996 | Mr. DeSousa is a real estate investor. | None. |
| 85 | |||
| Trustee | |||
| Robert T. Doyle | January 1996 | Mr. Doyle has been the Sheriff of | None. |
| 74 | Marin County, California since 1996. | ||
| Trustee | |||
| Claire Garvie | December 2015 | Ms. Garvie is a founder of Kiosk and | None. |
| 47 | as an Adviser | has served as its Chief Operating | |
| Trustee | to the Board | Officer since 2004. Kiosk is a full- | |
| and | service marketing agency with | ||
| December 2021 | offices in the San Francisco Bay Area, | ||
| as a Trustee | Toronto, and Liverpool, UK. | ||
| Gerald P. Richardson | May 2004 | Mr. Richardson is an independent | None. |
| 76 | consultant in the securities industry. | ||
| Trustee | |||
| HENNESSY FUNDS | 1-800-966-4354 |
27
| Other | |||
| Directorships | |||
| Held Outside | |||
| Name, Age, | of Fund | ||
| and Position Held | Start Date | Principal Occupation(s) | Complex During |
with the Trust | of Service | During Past Five Years | Past Five Years |
| Brian Alexander | March 2015 | Mr. Alexander has worked for the | None. |
| 40 | Sutter Health organization since | ||
| Adviser to the Board | 2011 in various positions. He has | ||
| served as the Chief Executive Officer | |||
| of the Sutter Roseville Medical | |||
| Center since 2018. From 2016 through | |||
| 2018, he served as the Vice President | |||
| of Strategy for the Sutter Health Valley | |||
| Area, which includes 11 hospitals, | |||
| 13 ambulatory surgery centers, | |||
| 16,000 employees, and 1,900 physicians. | |||
| From 2013 through 2016, Mr. Alexander | |||
| served as Sutter Novato Community | |||
| Hospital’s Chief Administrative Officer. | |||
| Doug Franklin | March 2016 | Mr. Franklin is a retired insurance | None. |
| 57 | industry executive. From 1987 | ||
| Adviser to the Board | through 2015, he was employed | ||
| by the Allianz-Fireman’s Fund | |||
| Insurance Company in various | |||
| positions, including as its Chief | |||
| Actuary and Chief Risk Officer. | |||
Interested Trustee(1) | |||
| Neil J. Hennessy | January 1996 as | Mr. Hennessy has been employed | Hennessy |
| 65 | a Trustee and | by Hennessy Advisors, Inc. since | Advisors, Inc. |
| Chairman of the Board, | June 2008 as | 1989 and currently serves as its | |
| Chief Market Strategist, | an officer | Chairman and Chief Executive Officer. | |
| Portfolio Manager, | |||
| and President |
| Name, Age, | ||
| and Position Held | Start Date | Principal Occupation(s) |
with the Trust | of Service | During Past Five Years |
| Officers | ||
| Teresa M. Nilsen | January 1996 | Ms. Nilsen has been employed by Hennessy Advisors, Inc. |
| 55 | since 1989 and currently serves as its President and Chief | |
| Executive Vice President | Operating Officer. | |
| and Treasurer | ||
| Daniel B. Steadman | March 2000 | Mr. Steadman has been employed by Hennessy Advisors, Inc. |
| 65 | since 2000 and currently serves as its Executive Vice President. | |
| Executive Vice President | ||
| and Secretary | ||
| Brian Carlson | December 2013 | Mr. Carlson has been employed by Hennessy Advisors, Inc. |
| 49 | since December 2013 and currently serves as its Chief | |
| Senior Vice President | Compliance Officer and Senior Vice President. | |
| and Head of Distribution |
| WWW.HENNESSYFUNDS.COM |
28
| TRUSTEES AND OFFICERS OF THE FUND |
| Name, Age, | ||
| and Position Held | Start Date | Principal Occupation(s) |
with the Trust | of Service | During Past Five Years |
Jennifer Cheskiewicz(2) | June 2013 | Ms. Cheskiewicz has been employed by Hennessy Advisors, Inc. |
| 44 | as its General Counsel since June 2013. | |
| Senior Vice President and | ||
| Chief Compliance Officer | ||
David Ellison(3) | October 2012 | Mr. Ellison has been employed by Hennessy Advisors, Inc. since |
| 63 | October 2012. He has served as a Portfolio Manager of the | |
| Senior Vice President | Hennessy Large Cap Financial Fund and the Hennessy Small | |
| and Portfolio Manager | Cap Financial Fund since their inception. Mr. Ellison also served | |
| as a Portfolio Manager of the Hennessy Technology Fund from | ||
| its inception until February 2017. Mr. Ellison served as Director, | ||
| CIO, and President of FBR Fund Advisers, Inc. from December | ||
| 1999 to October 2012. | ||
Ryan Kelley(4) | March 2013 | Mr. Kelley has been employed by Hennessy Advisors, Inc. since |
| 49 | October 2012. He has served as Chief Investment Officer of the | |
| Chief Investment Officer, | Hennessy Funds since March 2021 and has served as a Portfolio | |
| Senior Vice President, | Manager of the Hennessy Gas Utility Fund, the Hennessy Large | |
| and Portfolio Manager | Cap Financial Fund, and the Hennessy Small Cap Financial Fund | |
| since October 2014. Mr. Kelley served as Co-Portfolio Manager | ||
| of these same funds from March 2013 through September | ||
| 2014 and as a Portfolio Analyst for the Hennessy Funds from | ||
| October 2012 through February 2013. He has also served as a | ||
| Portfolio Manager of the Hennessy Cornerstone Growth Fund, | ||
| the Hennessy Cornerstone Mid Cap 30 Fund, the Hennessy | ||
| Cornerstone Large Growth Fund, and the Hennessy | ||
| Cornerstone Value Fund since February 2017 and as a Portfolio | ||
| Manager of the Hennessy Total Return Fund, the Hennessy | ||
| Balanced Fund, and the Hennessy Technology Fund since May | ||
| 2018. He served as Co-Portfolio Manager of the Hennessy | ||
| Technology Fund from February 2017 until May 2018. Mr. Kelley | ||
| served as Portfolio Manager of FBR Fund Advisers, Inc. from | ||
| January 2008 to October 2012. | ||
L. Joshua Wein(4) | September 2018 | Mr. Wein has been employed by Hennessy Advisors, Inc. since |
| 48 | 2018. He has served as Co-Portfolio Manager of the Hennessy | |
| Vice President and | Cornerstone Growth Fund, the Hennessy Cornerstone | |
| Co-Portfolio Manager | Mid Cap 30 Fund, the Hennessy Cornerstone Large Growth | |
| Fund, the Hennessy Cornerstone Value Fund, Hennessy Total | ||
| Return Fund, the Hennessy Balanced Fund, the Hennessy Gas | ||
| Utility Fund, and the Hennessy Technology Fund since February | ||
| 2019. He served as a Senior Analyst of these same funds from | ||
| September 2018 through February 2019. Mr. Wein served as | ||
| Director of Alternative Investments and Co-Portfolio Manager | ||
| at Sterling Capital Management from 2008 to 2018. |
_______________
(1) | Mr. Hennessy is considered an “interested person,” as defined in the Investment Company Act of 1940, as amended, because he is an officer of the Trust. |
(2) | The address of this officer is 4800 Bee Caves Road, Suite 100, Austin, TX 78746. |
(3) | The address of this officer is 101 Federal Street, Suite 1615B, Boston, MA 02110. |
(4) | The address of this officer is 1340 Environ Way, Chapel Hill, NC 27517. |
| HENNESSY FUNDS | 1-800-966-4354 |
29
Expense Example (Unaudited)
October 31, 2021
As a shareholder of the Fund, you incur ongoing costs, including management fees, service fees, and other Fund expenses. This Example is intended to help you understand your ongoing costs (in dollars) of investing in the Fund and to compare these costs with the ongoing costs of investing in other mutual funds. The Example is based on an investment of $1,000 invested at the beginning of the period and held for the entire period from May 1, 2021, through October 31, 2021.
Actual Expenses
In the table below, the first line under each of the “Investor Class” and “Institutional Class” headings provides information about actual account values and actual expenses for each share class. You may use this information, together with the amount you invested, to estimate the expenses that you paid over the period. Simply divide your account value by $1,000 (for example, an $8,600 account value divided by $1,000 = 8.6), then multiply the result by the number in the first line under the heading “Expenses Paid During Period” to estimate the expenses you paid on your account during this period. Although the Fund charges no sales loads or transaction fees, you will be assessed fees for outgoing wire transfers, returned checks, and stop payment orders at prevailing rates charged by U.S. Bank Global Fund Services, the Fund’s transfer agent. If you request that a redemption be made by wire transfer, the Fund’s transfer agent charges a $15 fee. IRAs are charged a $15 annual maintenance fee (up to $30 maximum per shareholder for shareholders with multiple IRAs). The examples below include, but are not limited to, management, shareholder servicing, accounting, custody, and transfer agent fees. However, the examples below do not include portfolio trading commissions and related expenses.
Hypothetical Example for Comparison Purposes
In the table below, the second line under each of the “Investor Class” and “Institutional Class” headings provides information about hypothetical account values and hypothetical expenses based on the Fund’s actual expense ratio for each share class and an assumed rate of return of 5% per year before expenses, which is not the Fund’s actual return for such share class. The hypothetical account values and expenses may not be used to estimate the actual ending account balance or expenses you paid for the period. You may use this information to compare the ongoing costs of investing in the Fund and other funds. To do so, compare these 5% hypothetical examples with the 5% hypothetical examples that appear in the shareholder reports of the other funds. Please note that the expenses shown in the table are meant to highlight your ongoing costs only. Therefore, the second lines under “Investor Class” and “Institutional Class” are useful in comparing ongoing costs only and will not help you determine the relative total costs of owning different funds.
| WWW.HENNESSYFUNDS.COM |
30
EXPENSE EXAMPLE |
| Expenses Paid | |||
| Beginning | Ending | During Period(1) | |
| Account Value | Account Value | May 1, 2021 – | |
May 1, 2021 | October 31, 2021 | October 31, 2021 | |
| Investor Class | |||
| Actual | $1,000.00 | $1,005.40 | $6.77 |
| Hypothetical (5% return before expenses) | $1,000.00 | $1,018.45 | $6.82 |
| Institutional Class | |||
| Actual | $1,000.00 | $1,007.10 | $5.06 |
| Hypothetical (5% return before expenses) | $1,000.00 | $1,020.16 | $5.09 |
(1) | Expenses are equal to the Fund’s annualized expense ratio of 1.34% for Investor Class shares or 1.00% for Institutional Class shares, as applicable, multiplied by the average account value over the period, multiplied by 184/365 days (to reflect the half-year period). |
| HENNESSY FUNDS | 1-800-966-4354 |
31
How to Obtain a Copy of the Fund’s Proxy
Voting Policy and Proxy Voting Records
A description of the policies and procedures the Fund uses to determine how to vote proxies relating to portfolio securities is available without charge (1) by calling 1-800-966-4354, (2) on the Hennessy Funds’ website at www.hennessyfunds.com/proxy-voting/voting-policy, or (3) on the U.S. Securities and Exchange Commission’s (the “SEC”) website at www.sec.gov. The Fund’s proxy voting record is available without charge on both the Hennessy Funds’ website at www.hennessyfunds.com/proxy-voting/voting-record and the SEC’s website at www.sec.gov no later than August 31 for the prior 12 months ending June 30.
Availability of Quarterly Portfolio Schedule
The Fund files a complete schedule of portfolio holdings with the SEC for the first and third quarters of each fiscal year as an exhibit to its reports on Form N-PORT. The Fund’s Form N-PORT reports are available on the SEC’s website at www.sec.gov or on request by calling 1-800-966-4354.
Important Notice Regarding Delivery
of Shareholder Documents
To help keep the Fund’s costs as low as possible, we generally deliver a single copy of shareholder reports, proxy statements, and prospectuses to shareholders who share an address and have the same last name. This process does not apply to account statements. You may request an individual copy of a shareholder document at any time. If you would like to receive separate mailings of shareholder documents, please call U.S. Bank Global Fund Services at 1-800-261-6950 or 1-414-765-4124, and individual delivery will begin within 30 days of your request. If your account is held through a financial institution or other intermediary, please contact such intermediary directly to request individual delivery.
Electronic Delivery
As permitted by SEC regulations, the Fund’s shareholder reports are made available on a website, and unless you sign up for eDelivery or elect to receive paper copies as detailed below, you will be notified by mail each time a report is posted and provided with a website link to access the report.
The Fund also offers shareholders the option to receive all notices, account statements, prospectuses, tax forms, and shareholder reports online. To sign up for eDelivery or change your delivery preference, please visit www.hennessyfunds.com/account.
To elect to receive paper copies of all future reports free of charge, please call U.S. Bank Global Fund Services at 1-800-261-6950 or 1-414-765-4124.
Subscribe to receive our team’s unique market and sector insights delivered to your inbox
www.hennessyfunds.com/subscribe
Follow us on social media
| | |
| WWW.HENNESSYFUNDS.COM |
32
| PROXY VOTING — PRIVACY POLICY |
Liquidity Risk Management Program
In accordance with Rule 22e-4 under the Investment Company Act of 1940, as amended (the “Liquidity Rule”), we have adopted and implemented a liquidity risk management program (the “Liquidity Program”). The purpose of the Liquidity Program is to assess and manage the Fund’s liquidity risk, which is the risk that the Fund would not be able to meet requests to redeem Fund shares without significant dilution of the remaining shareholders’ interests in the Fund. The Board of Trustees of the Fund (the “Board”) designated a committee comprising representatives of Hennessy Advisors, Inc., the investment adviser to the Fund, as the administrator of the Liquidity Program (the “Program Administrator”).
The Program Administrator provided a written report regarding the Liquidity Program to the Board in advance of its meeting on June 2, 2021. The report covered the period from June 1, 2020, through May 31, 2021. The report addressed the operation of the Liquidity Program, assessed the adequacy and effectiveness of its implementation, and described any material changes to the Liquidity Program during the review period. The Trust’s chief compliance officer presented the report to the Board at the meeting and provided additional information regarding the Liquidity Program. The Board reviewed the Liquidity Program and considered, among other items, the following:
| 1. | The Program Administrator reviewed daily historical net redemption activity during the review period and during prior periods with higher-than-average redemption activity and concluded that the Fund has historically been able to meet requests to redeem Fund shares without significant dilution to the Fund’s remaining shareholders, and the Program Administrator expects the Fund to be able to continue to do so in the future during both normal and reasonably foreseeable stressed conditions. | |
| 2. | The Fund holds assets that are highly liquid investments and is therefore not required to establish a highly liquid investment minimum for the Fund or adopt policies and procedures for responding to a highly liquid investment minimum shortfall. | |
| 3. | The Program Administrator did not make any material changes to the Liquidity Program during the review period and did not recommend any changes to the Liquidity Program or the model inputs used to determine the liquidity classification of each security held by the Fund. | |
| 4. | The Program Administrator concluded that the Liquidity Program was reasonably designed to assess and manage the Fund’s liquidity risk, complies with the requirements of the Liquidity Rule, and was operating as intended during the review period. |
Privacy Policy
We collect the following personal information about you:
| 1. | Information we receive from you in applications or other forms, correspondence, or conversations, including, but not limited to, your name, address, phone number, social security number, assets, income, and date of birth; | |
| 2. | Information about your transactions with us, our affiliates, or others, including, but not limited to, your account number and balance, payments history, parties to transactions, cost basis information, and other financial information; and |
| HENNESSY FUNDS | 1-800-966-4354 |
33
| 3. | Other personal information we collect from various sources, even if you have not entered into a prior transaction with us, including the following: |
| • | Name, alias, address, unique personal identifier, online identifier, IP address, email address, telephone number, account name, and other similar identifiers; | |
| • | Age and marital status; | |
| • | Commercial information, including records of products purchased; | |
| • | Browsing history, search history, and information on interaction with our website; | |
| • | Geolocation data; | |
| • | Employment and employment history, educational history, financial information, and purchasing and consuming histories or tendencies; and | |
| • | Inferences drawn from the above-listed information to create a profile about your preferences, characteristics, predispositions, and behavior. |
We collect this information directly from you, indirectly in the course of providing services to you, directly and indirectly from your activity on our website, from broker dealers, marketing agencies, and other third parties that interact with us in connection with the services we perform and products we offer, and from anonymized and aggregated consumer information.
We use this information to fulfill the reason you provided the information to us, to provide you with other relevant products that you request from us, to provide you with information about products that may interest you, to improve our website or present our website’s contents to you, and as otherwise described to you when collecting your personal information.
We do not disclose any personal information to unaffiliated third parties, except as permitted by law. We may disclose your personal information to our affiliates, vendors, and service providers for a business purpose. For example, we are permitted by law to disclose all of the information we collect, as described above, to our transfer agent to process your transactions. When disclosing your personal information to third parties, we enter into a contract with each third party describing the purpose of such disclosure and requiring that such personal information be kept confidential and not used for any purpose except to perform the services contracted or respond to regulatory or law enforcement requests.
Furthermore, we restrict access to your personal information to those persons who require such information to provide products or services to you. As a result, we do not provide a means for opting out of our limited sharing of your information. We maintain physical, electronic, and procedural safeguards that comply with federal standards to guard your personal information.
If you hold shares of the Funds through a financial intermediary, including, but not limited to, a broker-dealer, bank, or trust company, the privacy policy of your financial intermediary governs how your personal information is shared with unaffiliated third parties.
Supplemental Privacy Notice for Residents of California
The California Consumer Privacy Act of 2018 (the “CCPA”) provides you, as a California resident, with certain additional rights relating to your personal information.
| WWW.HENNESSYFUNDS.COM |
34
| PRIVACY POLICY |
Under the CCPA, you have the right to request that we disclose to you the categories of personal information we have collected about you over the past 12 months, the categories of sources of such information, our business purpose for collecting the information, the categories of third parties, if any, with whom we shared the information, and the specific information we have collected about you. You also have the right to request that we delete any of your personal information, and, unless an exception applies, we will delete such information upon receiving and confirming your request. To make a request, call us at 1-800-966-4354, email us at privacy@hennessyfunds.com, or go to www.hennessyfunds.com/contact. We will not discriminate against you for exercising your rights under the CCPA. Further, we will not collect additional categories of your personal information or use the personal information we collected for materially different, unrelated, or incompatible purposes without providing you notice.
| HENNESSY FUNDS | 1-800-966-4354 |
35
(This Page Intentionally Left Blank.)
For information, questions, or assistance, please call
The Hennessy Funds
1-800-966-4354 or 1-415-899-1555
INVESTMENT ADVISOR
Hennessy Advisors, Inc.
7250 Redwood Boulevard, Suite 200
Novato, California 94945
ADMINISTRATOR,
TRANSFER AGENT,
DIVIDEND PAYING AGENT, &
SHAREHOLDER SERVICING AGENT
U.S. Bancorp Fund Services, LLC
d/b/a U.S. Bank Global Fund Services
P.O. Box 701
Milwaukee, Wisconsin 53201-0701
CUSTODIAN
U.S. Bank N.A.
Custody Operations
1555 North River Center Drive, Suite 302
Milwaukee, Wisconsin 53212
TRUSTEES
Neil J. Hennessy
Robert T. Doyle
J. Dennis DeSousa
Claire Garvie
Gerald P. Richardson
COUNSEL
Foley & Lardner LLP
777 East Wisconsin Avenue
Milwaukee, Wisconsin 53202-5306
INDEPENDENT REGISTERED
PUBLIC ACCOUNTING FIRM
Tait, Weller & Baker LLP
Two Liberty Place
50 South 16th Street, Suite 2900
Philadelphia, Pennsylvania 19102-2529
DISTRIBUTOR
Quasar Distributors, LLC
111 East Kilbourn Avenue, Suite 2200
Milwaukee, Wisconsin 53202
www.hennessyfunds.com | 1-800-966-4354
This report has been prepared for shareholders and may be distributed to
others only if preceded or accompanied by a current prospectus.
ANNUAL REPORT
OCTOBER 31, 2021

HENNESSY FOCUS FUND
Investor Class HFCSX
Institutional Class HFCIX
www.hennessyfunds.com | 1-800-966-4354
(This Page Intentionally Left Blank.)
Contents
| Letter to Shareholders | 2 |
| Performance Overview | 4 |
| Financial Statements | |
| Schedule of Investments | 7 |
| Statement of Assets and Liabilities | 11 |
| Statement of Operations | 12 |
| Statements of Changes in Net Assets | 13 |
| Financial Highlights | 14 |
| Notes to the Financial Statements | 18 |
| Report of Independent Registered Public Accounting Firm | 26 |
| Trustees and Officers of the Fund | 27 |
| Expense Example | 30 |
| Proxy Voting Policy and Proxy Voting Records | 32 |
| Availability of Quarterly Portfolio Schedule | 32 |
| Federal Tax Distribution Information | 32 |
| Important Notice Regarding Delivery of Shareholder Documents | 32 |
| Electronic Delivery | 32 |
| Liquidity Risk Management Program | 33 |
| Privacy Policy | 33 |
| HENNESSY FUNDS | 1-800-966-4354 |
December 2021
Dear Hennessy Funds Shareholder:
What a year this has been. While it doesn’t feel that we are out of the “pandemic” phase of the coronavirus crisis, we look forward to a day when we will eventually see fewer cases and potentially less severe variants. We feel extremely grateful to the many healthcare workers who have continued to work tirelessly during the recent surge. As we move through the next year, we hope that new U.S. cases will decline and that many other parts of the world will see improvements as well.
What a year this has been! As measured by the total return of the S&P 500® Index, as of October 31, 2021, the market was up 24.04% calendar year to date. This comes in the wake of a tumultuous 2020 in which the market plunged in the beginning of the pandemic and recovered dramatically to end the year up 18.40%. Interestingly, 18% appears to be a repeating number in the past dozen years. From the low point of the Financial Crisis (March 9, 2009) to the high point reached just prior to the COVID-19 pandemic (February 12, 2020), the S&P 500® Index was up 18.27% per year. We are well aware that past results are not predictive of the future, and we find ourselves naturally skeptical of such strong returns. But, as shown in the chart below, we find that the most common annual total returns of the market over the past 102 years range between 20% and 30% with the second most common being between 10% and 20%:
Source: Bloomberg L.P.
We will say it again, after showing a chart like the one above: Past results are not predictive of the future. Instead, we look at where we are right now – in the economy, in the market, in the business cycle – to reflect on where we have come from and where we may be going. U.S. GDP is strong and growing, interest rates remain low, and earnings growth and profitability remain robust. We believe stocks are trading at reasonable valuations when viewed as a whole, with the S&P 500® Index at 21.0x estimated earnings for 2022. Furthermore, we believe corporate balance sheets are healthy, with high levels of excess cash, which could support growth, increases in dividends, more share buybacks, and future acquisitions. Uncertainty and volatility can manifest at any time in the stock market, and the current market is no different. Investors have questions about inflation, worldwide supply chain issues, and what could drive the next boost in earnings. While these concerns are warranted, we continue to believe that overall the positives outweigh the negatives, and here at Hennessy we continue to see opportunity in the market and in our Funds.
| WWW.HENNESSYFUNDS.COM |
2
| LETTER TO SHAREHOLDERS |
What a (fiscal) year this has been!!! For our fiscal year ended October 31, 2021, the S&P 500® Index rose 42.91% on a total return basis, setting a new all-time high on the final day of the period. Except for a short 21-trading-day period that began on September 2 during which the market fell 5.13% only to rebound to new highs just 13 trading days later, the market has been on a continuous march higher. We saw a dramatic shift in market leadership as many of the sectors that underperformed during our last fiscal year soared in fiscal year 2021. Small-caps beat mid-caps, which in turn beat large-caps. The Energy and Financials sectors skyrocketed during the 12-month period, as reflected by the S&P 500® Energy Sector’s total return of 111.29% and the Russell 1000® Index Financials’ total return of 70.87%. Both of these sectors were among the worst performing in our fiscal year 2020, so a bounce back in our fiscal year 2021, while not a foregone conclusion, was a distinct possibility.
Overall, we are pleased with the performance of our mutual funds during the fiscal year. On an absolute basis, each of our 16 Funds achieved total returns greater than 10% and seven outperformed their primary benchmark. Ten of our 11 domestic equity-only Funds outperformed the S&P 500® Index and posted total returns of 45% or higher. Our four best-performing funds were concentrated in the Energy and Financials sectors. While some of our Funds certainly benefited from being in the “right” sector at the “right” time, we also believe this was a favorable period for our investment style of high-conviction investing and concentrated portfolio construction.
What will the coming year bring? As mentioned in our last shareholder letter (June 2021), we understand that even the greatest bull markets experience corrections along the way, and the last time the S&P 500® Index dropped over 10% was in February/March of 2020. Whether or not a correction occurs sooner or later, we believe the market as a whole has more room to run. We see many factors that could drive the market higher from here: strong GDP growth and increasing corporate earnings, a potentially lower-for-longer interest rate environment, accommodative fiscal and monetary policies, a healthy and robust financial system, low unemployment and solid wage growth, and strong corporate balance sheets with plenty of cash.
Thank you for your interest and for investing with us. We remain committed to managing our portfolios for long-term performance, ever mindful of downside risk. With so many investment options available to you, we are grateful for the trust you put in us and for your continued interest in our family of Funds. If you have any questions or would like to speak with us, please don’t hesitate to call us directly at (800) 966-4354.
Best regards,
| |
| |
| Ryan C. Kelley | |
| Chief Investment Officer |
Past performance does not guarantee future results. To obtain current standardized performance for the Hennessy Funds, visit https://www.hennessyfunds.com/funds/price-performance.
Mutual fund investing involves risk. Principal loss is possible.
Opinions expressed are those of Ryan C. Kelley and are subject to change, are not guaranteed, and should not be considered investment advice.
The Dow Jones Industrial Average and S&P 500® Index are commonly used to measure the performance of U.S. stocks. The S&P 500® Energy Index comprises those companies included in the S&P 500® Index that are classified in the Energy sector. The Russell 1000® Index Financials is a subset of the Russel 1000® Index that measures the performance of securities classified in the Financials sector of the large-capitalization U.S. equity market. The indices are used herein for comparative purposes in accordance with SEC regulations. One cannot invest directly in an index. All returns are shown on a total return basis.
| HENNESSY FUNDS | 1-800-966-4354 |
3
Performance Overview (Unaudited)
CHANGE IN VALUE OF $10,000 INVESTMENT

This graph illustrates the performance of an initial investment of $10,000 made in the Fund 10 years ago and assumes the reinvestment of dividends and capital gains.
AVERAGE ANNUAL TOTAL RETURN FOR PERIODS ENDED OCTOBER 31, 2021
| One | Five | Ten | ||
Year | Years | Years | ||
| Hennessy Focus Fund – | ||||
| Investor Class (HFCSX) | 52.87% | 15.82% | 14.73% | |
| Hennessy Focus Fund – | ||||
| Institutional Class (HFCIX) | 53.43% | 16.25% | 15.12% | |
Russell 3000® Index | 43.90% | 18.91% | 16.10% | |
Russell Mid Cap® Growth Index | 39.43% | 21.90% | 16.86% |
Expense ratios: 1.51% (Investor Class); 1.14% (Institutional Class)
Performance data quoted represents past performance; past performance does not guarantee future results. The investment return and principal value of an investment will fluctuate so that an investor’s shares, when redeemed, may be worth more or less than their original cost. The performance table does not reflect the deduction of taxes that a shareholder would pay on Fund distributions or the redemption of Fund shares. Current performance of the Fund may be lower or higher than the performance quoted. Performance data current to the most recent month end may be obtained by visiting www.hennessyfunds.com. Performance for periods including or prior to October 26, 2012, is that of the FBR Focus Fund.
The Russell 3000® Index comprises the 3,000 largest U.S. companies based on market capitalization, representing approximately 98% of the investable U.S. equities market. The Russell Midcap® Growth Index comprises approximately 65% of the total market value of the Russell Midcap® Index and includes companies with higher price-to-book ratios and higher forecasted growth values. One cannot invest directly in an index. These indices are used for comparative purposes in accordance with Securities and Exchange Commission regulations.
Frank Russell Company (“Russell”) is the source and owner of the trademarks, service marks, and copyrights related to the Russell Indexes. Russell® is a trademark of Frank Russell Company. Neither Russell nor its licensors accept any liability for any errors or omissions in the Russell Indexes or Russell ratings or underlying data and no party may rely on any Russell Indexes or Russell ratings or underlying data contained in this communication. No
| WWW.HENNESSYFUNDS.COM |
4
| PERFORMANCE OVERVIEW |
further distribution of Russell data is permitted without Russell’s express written consent. Russell does not promote, sponsor, or endorse the content of this communication.
The expense ratios presented are from the most recent prospectus. The expense ratios for the current reporting period are available in the Financial Highlights section of this report.
PERFORMANCE NARRATIVE
Portfolio Managers Brian E. Macauley, CFA, David S. Rainey, CFA, and Ira M. Rothberg, CFA
Broad Run Investment Management, LLC (sub-advisor)
Performance:
For the one-year period ended October 31, 2021, the Investor Class of the Hennessy Focus Fund returned 52.87%, outperforming both the Russell 3000® Index (the Fund’s primary index) and the Russell Midcap® Growth Index, which returned 43.90% and 39.43%, respectively, for the same period.
Leading contributors to the Fund’s performance were Brookfield Asset Management, Inc., CarMax, Inc., and Aon PLC. Each of these companies produced attractive financial results over the one-year period, which helped drive appreciation in their stock prices. The leading detractor from the Fund’s performance was American Woodmark Corporation.
The Fund continues to hold all the companies mentioned.
Portfolio Strategy:
We invest with a long-term time horizon and encourage shareholders to do the same. Despite the discussion of one-year results referenced above, we encourage fellow shareholders to also evaluate the Fund’s performance over five-year and ten-year periods, since shorter periods can be influenced by many transitory issues unrelated to the growth in the intrinsic value of the Fund’s holdings.
Investment Commentary:
As the world emerged from the darkest days of the early COVID-19 pandemic, we saw that well-positioned companies pivoted from defense to offense. Many of the Fund’s portfolio companies took advantage of the pandemic-induced economic distress to invest opportunistically, and we believe these investments will contribute meaningfully to value creation for years to come. In particular, we highlight CarMax’s increased omni-channel investment, Brookfield’s acquisition of its mall and office property affiliate, RH’s accelerated real estate procurement, and Allegiant Travel Company’s launch of new routes and acquisition of airplanes as notable examples.
We continue to have a positive long-term outlook for the Fund. The Fund’s holdings are predominately a collection of what we believe to be high-quality, secular growth businesses trading at reasonable valuations. Our expectation is that on average the Fund will own these businesses for five years or longer. Over this long-term time horizon, we expect that the Fund’s returns will likely be determined primarily by the growth in earnings power of these businesses.
To further your understanding of what the Fund owns and why, we will use the remainder of this letter to describe our investment in Applied Materials, Inc. (“Applied”) the most recent addition to the Fund’s equity holdings.
Applied is a semiconductor capital equipment (semicap) company providing wafer fabrication equipment (“WFE”) to semiconductor foundries – such as Taiwan Semiconductor Manufacturing Company, Intel, and Samsung – for use in the production of semiconductor chips. The semicap industry is an oligopoly characterized by high barriers to entry, significant customer switching costs, and rational competition.
| HENNESSY FUNDS | 1-800-966-4354 |
5
Manufacturing advanced semiconductors involves over 1,000 steps to create 10s of billions of transistors on a chip the size of a fingernail. Correspondingly, the equipment to manufacture these chips is incredibly sophisticated, continually pushing the boundaries of engineering and physics. Each new generation of WFE builds upon the research and development and proprietary knowhow developed on prior generations of equipment, making it very difficult for a challenger to dislodge a technology leader. For the semiconductor foundries, the risk of falling behind on the technology curve by partnering with a second-tier semicap provider is too great to bear, further cementing the position of the semicap leaders. These qualities are further evidenced by Applied’s 30% operating margin and 40% return on equity.
Over the next decade, we expect a continued approximate 7% annual growth rate for the semiconductor chip industry, driven by proliferation of mobile phones and data centers as well as emerging demand from 5G, artificial intelligence/machine learning, electric vehicles, and a wide range of “Internet of Things” and smart devices. We expect that semicap industry growth will closely approximate semiconductor chip industry growth, with Applied producing about 8% or 9% organic revenue growth. We expect this revenue growth, plus modest margin improvement, could drive low double-digit operating profit growth. We believe free cash flow from operations, plus sustained financial leverage on growing EBITDA, could drive earnings per share compounding in the mid-teens.
Applied is led by Gary Dickerson, who has been CEO of the company since 2013. Gary has spent almost 35 years in the semicap industry and was previously the CEO of Varian Semiconductor for seven years before Applied acquired it in 2011. We believe Gary has formulated an intelligent strategy to deepen Applied’s competitive moat and has committed to returning 85 to 100% of free cash flow to shareholders.
We paid approximately 16x our 2022 earnings estimate for Applied Materials. The semiconductor and semicap industries have been cyclical in the past, and we expect them to continue to be cyclical in the future. Nonetheless, we model very attractive expected returns from our purchase price and believe the Fund owns a business with a strong competitive position, admirable management, and compelling growth opportunity.
_______________
Opinions expressed are those of the Portfolio Managers as of the date written and are subject to change, are not guaranteed, and should not be considered investment advice or an indication of trading intent.
The Fund is non-diversified, meaning it may concentrate its assets in fewer individual holdings than a diversified fund, making it more exposed to individual stock volatility than a diversified fund. The Fund invests in small-capitalization and medium-capitalization companies, which involves additional risks such as limited liquidity and greater volatility. Investments in foreign securities involve greater volatility and political, economic, and currency risk and differences in accounting methods. Please see the Fund’s prospectus for a more complete discussion of these and other risks.
References to specific securities should not be considered a recommendation to buy or sell any security. Fund holdings and sector allocations are subject to change. Please refer to the Schedule of Investments included in this report for additional portfolio information.
Earnings growth is not representative of the Fund’s future performance.
Free Cash Flow is a measure of financial performance calculated as operating cash flow minus capital expenditures. EBITDA is the acronym for earnings before interest, taxes, depreciation, amortization, and it is a measure of a company’s operating performance.
| WWW.HENNESSYFUNDS.COM |
6
| PERFORMANCE OVERVIEW/SCHEDULE OF INVESTMENTS |
Financial Statements
Schedule of Investments as of October 31, 2021 |
HENNESSY FOCUS FUND
(% of Net Assets)

| TOP TEN HOLDINGS (EXCLUDING MONEY MARKET FUNDS) | % NET ASSETS |
| Brookfield Asset Management, Inc., Class A | 10.50% |
| American Tower Corp., Class A | 9.54% |
| Encore Capital Group, Inc. | 9.43% |
| Markel Corp. | 9.22% |
| Aon PLC | 8.80% |
| CarMax, Inc. | 8.68% |
| O’Reilly Automotive, Inc. | 6.22% |
| Ashtead Group PLC | 5.97% |
| Restoration Hardware Holdings, Inc. | 5.69% |
| NVR, Inc. | 5.00% |
Note: For presentation purposes, the Fund has grouped some of the industry categories. For purposes of categorizing securities for compliance with Section 8(b)(1) of the Investment Company Act of 1940, as amended, the Fund uses more specific industry classifications.
The Global Industry Classification Standard (GICS®) was developed by and is the exclusive property and a service mark of MSCI, Inc. and Standard & Poor’s Financial Services LLC. It has been licensed for use by the Hennessy Funds.
| HENNESSY FUNDS | 1-800-966-4354 |
7
| COMMON STOCKS – 87.71% | Number | % of | ||||||||||
| of Shares | Value | Net Assets | ||||||||||
| Communication Services – 1.16% | ||||||||||||
| AST SpaceMobile, Inc. (a) | 1,247,902 | $ | 13,964,023 | 1.16 | % | |||||||
| Consumer Discretionary – 25.59% | ||||||||||||
| CarMax, Inc. (a) | 766,122 | 104,897,424 | 8.68 | % | ||||||||
| NVR, Inc. (a) | 12,335 | 60,377,358 | 5.00 | % | ||||||||
| O’Reilly Automotive, Inc. (a) | 120,811 | 75,183,102 | 6.22 | % | ||||||||
| Restoration Hardware Holdings, Inc. (a) | 104,116 | 68,678,037 | 5.69 | % | ||||||||
| 309,135,921 | 25.59 | % | ||||||||||
| Financials – 39.85% | ||||||||||||
| Aon PLC (b) | 332,288 | 106,305,577 | 8.80 | % | ||||||||
| Brookfield Asset Management, Inc., Class A (b) | 2,100,442 | 126,845,692 | 10.50 | % | ||||||||
| Brookfield Asset Management Reinsurance Partners Ltd. (b) | 15,721 | 969,200 | 0.08 | % | ||||||||
| Encore Capital Group, Inc. (a)(d) | 2,108,336 | 113,892,311 | 9.43 | % | ||||||||
| Markel Corp. (a) | 84,804 | 111,358,677 | 9.22 | % | ||||||||
| Marlin Business Services Corp. (d) | 960,273 | 22,009,457 | 1.82 | % | ||||||||
| 481,380,914 | 39.85 | % | ||||||||||
| Industrials – 12.87% | ||||||||||||
| Allegiant Travel Co. (a) | 160,303 | 28,096,307 | 2.33 | % | ||||||||
| American Woodmark Corp. (a)(d) | 691,441 | 47,529,654 | 3.93 | % | ||||||||
| Ashtead Group PLC (b) | 860,196 | 72,093,066 | 5.97 | % | ||||||||
| Mistras Group, Inc. (a) | 785,984 | 7,718,363 | 0.64 | % | ||||||||
| 155,437,390 | 12.87 | % | ||||||||||
| Information Technology – 8.24% | ||||||||||||
| Applied Materials, Inc. | 44,215 | 6,041,980 | 0.50 | % | ||||||||
| CDW Corp. | 182,239 | 34,014,909 | 2.81 | % | ||||||||
| SS&C Technologies Holdings, Inc. | 749,303 | 59,547,109 | 4.93 | % | ||||||||
| 99,603,998 | 8.24 | % | ||||||||||
| Total Common Stocks | ||||||||||||
| (Cost $367,343,828) | 1,059,522,246 | 87.71 | % | |||||||||
| REITS – 9.54% | ||||||||||||
| Financials – 9.54% | ||||||||||||
| American Tower Corp., Class A | 408,606 | 115,214,634 | 9.54 | % | ||||||||
| Total REITS | ||||||||||||
| (Cost $648,119) | 115,214,634 | 9.54 | % | |||||||||
The accompanying notes are an integral part of these financial statements.
| WWW.HENNESSYFUNDS.COM |
8
| SCHEDULE OF INVESTMENTS |
| SHORT-TERM INVESTMENTS – 2.85% | Number | % of | ||||||||||
| of Shares | Value | Net Assets | ||||||||||
| Money Market Funds – 2.85% | ||||||||||||
| First American Government Obligations Fund, | ||||||||||||
| Institutional Class, 0.03% (c) | 34,442,226 | $ | 34,442,226 | 2.85 | % | |||||||
| Total Short-Term Investments | ||||||||||||
| (Cost $34,442,226) | 34,442,226 | 2.85 | % | |||||||||
| Total Investments | ||||||||||||
| (Cost $402,434,173) – 100.10% | 1,209,179,106 | 100.10 | % | |||||||||
| Liabilities in Excess of Other Assets – (0.10)% | (1,264,439 | ) | (0.10 | )% | ||||||||
TOTAL NET ASSETS – 100.00% | $ | 1,207,914,667 | 100.00 | % | ||||||||
Percentages are stated as a percent of net assets.
PLC – Public Limited Company
REIT – Real Estate Investment Trust
| (a) | Non-income-producing security. |
| (b) | U.S.-traded security of a foreign corporation. |
| (c) | The rate listed is the fund’s seven-day yield as of October 31, 2021. |
| (d) | Investment in affiliated security. Investment represents five percent or more of the outstanding voting securities of the issuer, making the issuer an affiliate of the Fund, as defined in the Investment Company Act of 1940, as amended. Details of transactions with affiliated companies for the year ended October 31, 2021, are as follows: |
| Value at | Sales | Realized | ||||||||||||||
Common Stocks | November 1, 2020 | Purchases | Proceeds | Gain/Loss | ||||||||||||
| Encore Capital Group, Inc. | $ | 86,299,318 | $ | — | $ | (23,540,794 | ) | $ | (1,803,089 | ) | ||||||
| Marlin Business Services Corp. | 7,374,993 | — | (1,147,994 | ) | 91,387 | |||||||||||
| Sub-total for affiliates | ||||||||||||||||
held as of 10/31/21(1) | 93,674,311 | — | (24,688,788 | ) | (1,711,702 | ) | ||||||||||
| American Woodmark Corp | 80,064,456 | — | (26,069,831 | ) | 11,299,526 | |||||||||||
| Sub-total for securities no | ||||||||||||||||
longer affiliates as of 10/31/21(2) | 80,064,456 | — | (26,069,831 | ) | 11,299,526 | |||||||||||
| $ | 173,738,767 | $ | — | $ | (50,758,619 | ) | $ | 9,587,824 | ||||||||
| Net Change | ||||||||||||||||
| in Unrealized | Value at October 31, 2021 | |||||||||||||||
| Appreciation / | ||||||||||||||||
Common Stocks | Depreciation | Dividends | Shares | |||||||||||||
| Encore Capital Group, Inc. | $ | 52,936,876 | $ | — | $ | 113,892,311 | 2,108,336 | |||||||||
| Marlin Business Services Corp. | 15,691,071 | 558,753 | 22,009,457 | 960,273 | ||||||||||||
| Sub-total for affiliates | ||||||||||||||||
held as of 10/31/21(1) | 68,627,947 | 558,753 | 135,901,768 | 3,068,609 | ||||||||||||
| American Woodmark Corp | (17,764,497 | ) | — | 47,529,654 | 691,441 | |||||||||||
| Sub-total for securities no | ||||||||||||||||
longer affiliates as of 10/31/21(2) | (17,764,497 | ) | — | 47,529,654 | 691,441 | |||||||||||
| $ | 50,863,450 | $ | 558,753 | $ | 183,431,422 | 3,760,050 | ||||||||||
| (1) | At October 31, 2021, these securities represented 11.25% of the Fund’s net assets. |
| (2) | At October 31, 2021, this security was no longer affiliated with the Fund. |
The accompanying notes are an integral part of these financial statements.
| HENNESSY FUNDS | 1-800-966-4354 |
9
Summary of Fair Value Exposure as of October 31, 2021
The following is a summary of the inputs used to value the Fund’s net assets as of October 31, 2021 (see Note 3 in the accompanying Notes to the Financial Statements):
| Common Stocks | Level 1 | Level 2 | Level 3 | Total | ||||||||||||
| Communication Services | $ | 13,964,023 | $ | — | $ | — | $ | 13,964,023 | ||||||||
| Consumer Discretionary | 309,135,921 | — | — | 309,135,921 | ||||||||||||
| Financials | 481,380,914 | — | — | 481,380,914 | ||||||||||||
| Industrials | 155,437,390 | — | — | 155,437,390 | ||||||||||||
| Information Technology | 99,603,998 | — | — | 99,603,998 | ||||||||||||
| Total Common Stocks | $ | 1,059,522,246 | $ | — | $ | — | $ | 1,059,522,246 | ||||||||
| REITS | ||||||||||||||||
| Financials | $ | 115,214,634 | $ | — | $ | — | $ | 115,214,634 | ||||||||
| Total REITS | $ | 115,214,634 | $ | — | $ | — | $ | 115,214,634 | ||||||||
| Short-Term Investments | ||||||||||||||||
| Money Market Funds | $ | 34,442,226 | $ | — | $ | — | $ | 34,442,226 | ||||||||
| Total Short-Term Investments | $ | 34,442,226 | $ | — | $ | — | $ | 34,442,226 | ||||||||
| Total Investments | $ | 1,209,179,106 | $ | — | $ | — | $ | 1,209,179,106 | ||||||||
The accompanying notes are an integral part of these financial statements.
| WWW.HENNESSYFUNDS.COM |
10
| SCHEDULE OF INVESTMENTS/STATEMENT OF ASSETS AND LIABILITIES |
Financial Statements
Statement of Assets and Liabilities as of October 31, 2021 |
| ASSETS: | ||||
| Investments in unaffiliated securities, at value (cost $326,026,734) | $ | 1,073,277,338 | ||
| Investments in affiliated securities, at value (cost $76,407,439) | 135,901,768 | |||
| Total investments in securities, at value (cost $402,434,173) | 1,209,179,106 | |||
| Dividends and interest receivable | 170,205 | |||
| Receivable for fund shares sold | 465,010 | |||
| Prepaid expenses and other assets | 70,786 | |||
| Total assets | 1,209,885,107 | |||
| LIABILITIES: | ||||
| Payable for fund shares redeemed | 374,115 | |||
| Payable to advisor | 903,163 | |||
| Payable to administrator | 331,538 | |||
| Payable to auditor | 22,551 | |||
| Accrued distribution fees | 175,874 | |||
| Accrued service fees | 59,084 | |||
| Accrued trustees fees | 6,600 | |||
| Accrued expenses and other payables | 97,515 | |||
| Total liabilities | 1,970,440 | |||
| NET ASSETS | $ | 1,207,914,667 | ||
| NET ASSETS CONSISTS OF: | ||||
| Capital stock | $ | 232,349,164 | ||
| Total distributable earnings | 975,565,503 | |||
| Total net assets | $ | 1,207,914,667 | ||
| NET ASSETS: | ||||
| Investor Class | ||||
| Shares authorized (no par value) | Unlimited | |||
| Net assets applicable to outstanding shares | $ | 709,402,629 | ||
| Shares issued and outstanding | 8,814,626 | |||
| Net asset value, offering price, and redemption price per share | $ | 80.48 | ||
| Institutional Class | ||||
| Shares authorized (no par value) | Unlimited | |||
| Net assets applicable to outstanding shares | $ | 498,512,038 | ||
| Shares issued and outstanding | 5,958,868 | |||
| Net asset value, offering price, and redemption price per share | $ | 83.66 | ||
The accompanying notes are an integral part of these financial statements.
| HENNESSY FUNDS | 1-800-966-4354 |
11
Financial Statements
Statement of Operations for the year ended October 31, 2021 |
| INVESTMENT INCOME: | ||||
Dividend income from unaffiliated securities(1) | $ | 6,516,776 | ||
| Dividend income from affiliated securities | 558,753 | |||
| Interest income | 7,689 | |||
| Total investment income | 7,083,218 | |||
| EXPENSES: | ||||
| Investment advisory fees (See Note 5) | 10,333,814 | |||
| Sub-transfer agent expenses – Investor Class (See Note 5) | 1,403,035 | |||
| Sub-transfer agent expenses – Institutional Class (See Note 5) | 346,336 | |||
| Administration, accounting, custody, and transfer agent fees (See Note 5) | 1,265,170 | |||
| Distribution fees – Investor Class (See Note 5) | 1,069,913 | |||
| Service fees – Investor Class (See Note 5) | 713,275 | |||
| Federal and state registration fees | 66,145 | |||
| Reports to shareholders | 49,586 | |||
| Compliance expense (See Note 5) | 27,464 | |||
| Trustees’ fees and expenses | 25,137 | |||
| Audit fees | 22,556 | |||
| Legal fees | 18,611 | |||
| Interest expense (See Note 7) | 2,057 | |||
| Other expenses | 173,469 | |||
| Total expenses | 15,516,568 | |||
| NET INVESTMENT LOSS | $ | (8,433,350 | ) | |
| REALIZED AND UNREALIZED GAINS (LOSSES): | ||||
| Net realized gain on investments: | ||||
| Unaffiliated investments | $ | 214,243,173 | ||
| Affiliated investments | 9,587,824 | |||
| Net change in unrealized appreciation/depreciation on investments: | ||||
| Unaffiliated investments | 211,376,660 | |||
| Affiliated investments | 50,863,450 | |||
| Net gain on investments | 486,071,107 | |||
| NET INCREASE IN NET ASSETS RESULTING FROM OPERATIONS | $ | 477,637,757 | ||
(1) | Net of foreign taxes withheld of $323,534. |
The accompanying notes are an integral part of these financial statements.
| WWW.HENNESSYFUNDS.COM |
12
| STATEMENT OF OPERATIONS/STATEMENTS OF CHANGES IN NET ASSETS |
Financial Statements
| Statements of Changes in Net Assets |
| Year Ended | Year Ended | |||||||
| October 31, 2021 | October 31, 2020 | |||||||
| OPERATIONS: | ||||||||
| Net investment loss | $ | (8,433,350 | ) | $ | (10,438,055 | ) | ||
| Net realized gain on investments | 223,830,997 | 398,622,166 | ||||||
| Net change in unrealized | ||||||||
| appreciation/depreciation on investments | 262,240,110 | (517,606,582 | ) | |||||
| Net increase (decrease) in net assets | ||||||||
| resulting from operations | 477,637,757 | (129,422,471 | ) | |||||
| DISTRIBUTIONS TO SHAREHOLDERS: | ||||||||
| Distributable earnings – Investor Class | (202,897,649 | ) | (124,333,581 | ) | ||||
| Distributable earnings – Institutional Class | (111,878,455 | ) | (60,331,162 | ) | ||||
| Total distributions | (314,776,104 | ) | (184,664,743 | ) | ||||
| CAPITAL SHARE TRANSACTIONS: | ||||||||
| Proceeds from shares subscribed – Investor Class | 38,949,266 | 81,768,827 | ||||||
| Proceeds from shares subscribed – Institutional Class | 214,555,313 | 104,509,456 | ||||||
| Dividends reinvested – Investor Class | 198,099,143 | 122,154,479 | ||||||
| Dividends reinvested – Institutional Class | 100,565,261 | 53,173,071 | ||||||
| Cost of shares redeemed – Investor Class | (305,916,863 | ) | (532,052,736 | ) | ||||
| Cost of shares redeemed – Institutional Class | (267,470,520 | ) | (248,641,138 | ) | ||||
| Net decrease in net assets derived | ||||||||
| from capital share transactions | (21,218,400 | ) | (419,088,041 | ) | ||||
| TOTAL INCREASE (DECREASE) IN NET ASSETS | 141,643,253 | (733,175,255 | ) | |||||
| NET ASSETS: | ||||||||
| Beginning of year | 1,066,271,414 | 1,799,446,669 | ||||||
| End of year | $ | 1,207,914,667 | $ | 1,066,271,414 | ||||
| CHANGES IN SHARES OUTSTANDING: | ||||||||
| Shares sold – Investor Class | 541,194 | 1,025,186 | ||||||
| Shares sold – Institutional Class | 2,870,484 | 1,368,275 | ||||||
| Shares issued to holders as reinvestment | ||||||||
| of dividends – Investor Class | 3,250,724 | 1,522,553 | ||||||
| Shares issued to holders as reinvestment | ||||||||
| of dividends – Institutional Class | 1,592,734 | 642,032 | ||||||
| Shares redeemed – Investor Class | (4,446,090 | ) | (7,333,258 | ) | ||||
| Shares redeemed – Institutional Class | (3,724,618 | ) | (3,465,044 | ) | ||||
| Net increase (decrease) in shares outstanding | 84,428 | (6,240,256 | ) | |||||
The accompanying notes are an integral part of these financial statements.
| HENNESSY FUNDS | 1-800-966-4354 |
13
Financial Statements
| Financial Highlights |
For an Investor Class share outstanding throughout each year
PER SHARE DATA:
Net asset value, beginning of year
Income from investment operations:
Net investment loss
Net realized and unrealized gains (losses) on investments
Total from investment operations
Less distributions:
Dividends from net realized gains
Total distributions
Net asset value, end of year
TOTAL RETURN
SUPPLEMENTAL DATA AND RATIOS:
Net assets, end of year (millions)
Ratio of expenses to average net assets
Ratio of net investment loss to average net assets
Portfolio turnover rate(2)
(1) | Calculated using the average shares outstanding method. |
(2) | Calculated on the basis of the Fund as a whole. |
The accompanying notes are an integral part of these financial statements.
| WWW.HENNESSYFUNDS.COM |
14
| FINANCIAL HIGHLIGHTS — INVESTOR CLASS |
| Year Ended October 31, | ||||||||||||||||||
| 2021 | 2020 | 2019 | 2018 | 2017 | ||||||||||||||
| $ | 71.68 | $ | 85.11 | $ | 83.20 | $ | 84.92 | $ | 70.63 | |||||||||
| (0.63 | )(1) | (0.66 | )(1) | (0.52 | )(1) | (0.86 | ) | (0.51 | ) | |||||||||
| 31.46 | (4.21 | ) | 16.90 | (0.85 | ) | 14.80 | ||||||||||||
| 30.83 | (4.87 | ) | 16.38 | (1.71 | ) | 14.29 | ||||||||||||
| (22.03 | ) | (8.56 | ) | (14.47 | ) | (0.01 | ) | — | ||||||||||
| (22.03 | ) | (8.56 | ) | (14.47 | ) | (0.01 | ) | — | ||||||||||
| $ | 80.48 | $ | 71.68 | $ | 85.11 | $ | 83.20 | $ | 84.92 | |||||||||
| 52.87 | % | -6.79 | % | 24.16 | % | -2.02 | % | 20.23 | % | |||||||||
| $ | 709.40 | $ | 678.72 | $ | 1,213.20 | $ | 1,339.45 | $ | 1,675.00 | |||||||||
| 1.49 | % | 1.51 | % | 1.47 | % | 1.47 | % | 1.48 | % | |||||||||
| (0.88 | )% | (0.88 | )% | (0.67 | )% | (0.72 | )% | (0.51 | )% | |||||||||
| 4 | % | 5 | % | 2 | % | 13 | % | 5 | % | |||||||||
The accompanying notes are an integral part of these financial statements.
| HENNESSY FUNDS | 1-800-966-4354 |
15
Financial Statements
| Financial Highlights |
For an Institutional Class share outstanding throughout each year
PER SHARE DATA:
Net asset value, beginning of year
Income from investment operations:
Net investment loss
Net realized and unrealized gains (losses) on investments
Total from investment operations
Less distributions:
Dividends from net realized gains
Total distributions
Net asset value, end of year
TOTAL RETURN
SUPPLEMENTAL DATA AND RATIOS:
Net assets, end of year (millions)
Ratio of expenses to average net assets
Ratio of net investment loss to average net assets
Portfolio turnover rate(2)
(1) | Calculated using the average shares outstanding method. |
(2) | Calculated on the basis of the Fund as a whole. |
The accompanying notes are an integral part of these financial statements.
| WWW.HENNESSYFUNDS.COM |
16
| FINANCIAL HIGHLIGHTS — INSTITUTIONAL CLASS |
| Year Ended October 31, | ||||||||||||||||||
| 2021 | 2020 | 2019 | 2018 | 2017 | ||||||||||||||
| $ | 74.24 | $ | 87.83 | $ | 85.66 | $ | 87.10 | $ | 72.17 | |||||||||
| (0.37 | )(1) | (0.39 | )(1) | (0.25 | )(1) | (0.28 | ) | (0.11 | ) | |||||||||
| 32.62 | (4.36 | ) | 17.41 | (1.15 | ) | 15.04 | ||||||||||||
| 32.25 | (4.75 | ) | 17.16 | (1.43 | ) | 14.93 | ||||||||||||
| (22.83 | ) | (8.84 | ) | (14.99 | ) | (0.01 | ) | — | ||||||||||
| (22.83 | ) | (8.84 | ) | (14.99 | ) | (0.01 | ) | — | ||||||||||
| $ | 83.66 | $ | 74.24 | $ | 87.83 | $ | 85.66 | $ | 87.10 | |||||||||
| 53.43 | % | -6.45 | % | 24.59 | % | -1.65 | % | 20.69 | % | |||||||||
| $ | 498.51 | $ | 387.55 | $ | 586.25 | $ | 811.96 | $ | 1,057.32 | |||||||||
| 1.12 | % | 1.14 | % | 1.12 | % | 1.09 | % | 1.10 | % | |||||||||
| (0.50 | )% | (0.51 | )% | (0.32 | )% | (0.34 | )% | (0.13 | )% | |||||||||
| 4 | % | 5 | % | 2 | % | 13 | % | 5 | % | |||||||||
The accompanying notes are an integral part of these financial statements.
| HENNESSY FUNDS | 1-800-966-4354 |
17
Financial Statements
Notes to the Financial Statements October 31, 2021 |
1). ORGANIZATION
The Hennessy Focus Fund (the “Fund”) is a series of Hennessy Funds Trust (the “Trust”), which was organized as a Delaware statutory trust on September 17, 1992. The Fund is an open-end management investment company registered under the Investment Company Act of 1940, as amended. The investment objective of the Fund is capital appreciation. The Fund is a non-diversified fund.
The Fund offers Investor Class and Institutional Class shares. Each class of shares differs principally in its respective 12b-1 distribution and service, shareholder servicing, and sub-transfer agent expenses. There are no sales charges. Each class has identical rights to earnings, assets, and voting privileges, except for class-specific expenses and exclusive rights to vote on matters affecting only one class.
As an investment company, the Fund follows the investment company accounting and reporting guidance of the Financial Accounting Standards Board (“FASB”) Accounting Standard Codification Topic 946 “Financial Services—Investment Companies.”
2). SIGNIFICANT ACCOUNTING POLICIES
The following is a summary of significant accounting policies consistently followed by the Fund in the preparation of the financial statements. These policies conform to U.S. generally accepted accounting principles (“GAAP”).
| a). | Securities Valuation – All investments in securities are valued in accordance with the Fund’s valuation policies and procedures, as described in Note 3. |
| b). | Federal Income Taxes – The Fund has elected to be taxed as a regulated investment company and intends to distribute substantially all of its taxable income to its shareholders and otherwise comply with the provisions of the Internal Revenue Code of 1986, as amended, applicable to regulated investment companies. As a result, the Fund has made no provision for federal income taxes or excise taxes. Net investment income/loss and realized gains/losses for federal income tax purposes may differ from those reported in the financial statements because of temporary book-basis and tax-basis differences. Temporary differences are primarily the result of the treatment of wash sales for tax reporting purposes. The Fund recognizes interest and penalties related to income tax benefits, if any, in the Statement of Operations as an income tax expense. Distributions from net realized gains for book purposes may include short-term capital gains, which are included as ordinary income to shareholders for tax purposes. The Fund may utilize equalization accounting for tax purposes and designate earnings and profits, including net realized gains distributed to shareholders on redemption of shares, as part of the dividends paid deduction for income tax purposes. |
| Due to inherent differences in the recognition of income, expenses, and realized gains/losses under GAAP and federal income tax regulations, permanent differences between book and tax basis for reporting are identified and appropriately reclassified in the Statement of Assets and Liabilities, as needed. The adjustments for fiscal year 2021 are as follows: |
| Total | |||
| Distributable | |||
Earnings | Capital Stock | ||
| $(39,338,009) | $39,338,009 |
| WWW.HENNESSYFUNDS.COM |
18
| NOTES TO THE FINANCIAL STATEMENTS |
| c). | Accounting for Uncertainty in Income Taxes – The Fund has accounting policies regarding recognition and measurement of tax positions taken or expected to be taken on a tax return. The tax returns of the Fund for the prior three fiscal years are open for examination. The Fund has reviewed all open tax years in major tax jurisdictions and concluded that there is no impact on the Fund’s net assets and no tax liability resulting from unrecognized tax benefits relating to uncertain income tax positions taken or expected to be taken on a tax return. The Fund’s major tax jurisdictions are U.S. federal and Delaware. |
| d). | Income and Expenses – Dividend income is recognized on the ex-dividend date or as soon as information is available to the Fund. Interest income, which includes the amortization of premium and accretion of discount, is recognized on an accrual basis. Market discounts, original issue discounts, and market premiums on debt securities are accreted or amortized to interest income over the life of a security with a corresponding increase or decrease, as applicable, in the cost basis of such security using the yield-to-maturity method or, where applicable, the first call date of the security. Other non-cash dividends are recognized as investment income at the fair value of the property received. The Fund is charged for those expenses that are directly attributable to its portfolio, such as advisory, administration, and certain shareholder service fees. Income, expenses (other than expenses attributable to a specific class), and realized and unrealized gains/losses on investments are allocated to each class of shares based on such class’s net assets. |
| e). | Distributions to Shareholders – Dividends from net investment income for the Fund, if any, are declared and paid annually, usually in December. Distributions of net realized capital gains, if any, are declared and paid annually, usually in December. |
| f). | Security Transactions – Investment and shareholder transactions are recorded on the trade date. The Fund determines the realized gain/loss from an investment transaction by comparing the original cost of the security lot sold with the net sale proceeds. Discounts and premiums on securities purchased are accreted or amortized, respectively, over the life of each such security. |
| g). | Use of Estimates – Preparing financial statements in accordance with GAAP requires management to make estimates and assumptions that affect the reported amounts of assets and liabilities and disclosure of contingent assets and liabilities at the date of the financial statements, as well as the reported change in net assets during the reporting period. Actual results could differ from those estimates. |
| h). | Share Valuation – The net asset value (“NAV”) per share of the Fund is calculated by dividing (i) the total value of the securities held by the Fund, plus cash and other assets, minus all liabilities (including estimated accrued expenses) by (ii) the total number of Fund shares outstanding, rounded to the nearest $0.01. Fund shares are not priced on days the New York Stock Exchange is closed for trading. The offering and redemption price per share for the Fund is equal to the Fund’s NAV per share. |
| i). | Foreign Currency – Values of investments denominated in foreign currencies are converted into U.S. dollars using the spot market exchange rate at the time of valuation. Purchases and sales of investments and income are translated into U.S. dollars using the spot market exchange rate prevailing on the respective dates of such transactions. The Fund does not isolate the portion of the results of operations resulting from fluctuations in foreign exchange rates on investments from fluctuations resulting from changes in the market prices of securities held. Such fluctuations are included with the net realized and unrealized gain/loss on investments. Foreign investments present additional risks due to currency |
| HENNESSY FUNDS | 1-800-966-4354 |
19
| fluctuations, economic and political factors, lower liquidity, government regulations, differences in accounting standards, and other factors. | |
| j). | REIT Equity Securities – Distributions received from real estate investment trusts (“REITs”) may be classified as dividends, capital gains, or return of capital. Investments in REITs may require the Fund to accrue and distribute income not yet received. To generate sufficient cash to make any required distributions, the Fund may be required to sell securities in its portfolio (including when it is not advantageous to do so) that it otherwise would have continued to hold. At other times, investments in a REIT may result in the Fund’s receipt of cash in excess of the REIT’s earnings. If the Fund distributes these amounts, these distributions could constitute a return of capital to Fund shareholders for U.S. federal income tax purposes. Dividends received by the Fund from a REIT generally do not constitute qualified dividend income and do not qualify for the dividends-received deduction. |
| k). | Recent Accounting Pronouncements and Regulatory Updates – In October 2020, the Securities and Exchange Commission (“SEC”) adopted new regulations governing the use of derivatives by registered investment companies (“Rule 18f-4”). Rule 18f-4 imposes limits on the amount of derivatives a fund can enter into, eliminates the asset segregation framework currently used by funds to comply with Section 18 of the 1940 Act, and requires funds whose use of derivatives is greater than a limited specified amount to establish and maintain a comprehensive derivatives risk management program and appoint a derivatives risk manager. Funds are required to comply with Rule 18f-4 by August 19, 2022. The impact, if any, that Rule 18f-4 will have on the availability, liquidity, and performance of derivatives is unclear. Management is currently evaluating the potential impact of Rule 18f-4 on the Fund. When fully implemented, Rule 18f-4 may require changes in how the Fund uses derivatives, adversely affect the Fund’s performance, and increase costs related to the Fund’s use of derivatives. |
| In December 2020, the SEC adopted a new rule providing a framework for fund valuation practices (“Rule 2a-5”). Rule 2a-5 establishes requirements for determining fair value in good faith for purposes of the 1940 Act. Rule 2a-5 permits fund boards to designate certain parties to perform fair value determinations, subject to board oversight and certain other conditions. Rule 2a-5 also defines when market quotations are “readily available” for purposes of the 1940 Act and the threshold for determining whether a fund must fair value a security. In connection with Rule 2a-5, the SEC also adopted related recordkeeping requirements and is rescinding previously issued guidance, including with respect to the role of a board in determining fair value and the accounting and auditing of fund investments. Funds must comply with the rules by September 8, 2022. Management is currently assessing the potential impact of the new rules on the Fund’s financial statements. |
3). SECURITIES VALUATION
The Fund follows its valuation policies and procedures in determining its net asset value and, in preparing these financial statements, the fair value accounting standards that establish an authoritative definition of fair value and set out a hierarchy for measuring fair value. These standards require additional disclosures about the various inputs and valuation techniques used to develop the measurements of fair value and a discussion of changes in valuation techniques and related inputs during the period. These inputs are summarized in the three broad levels listed below:
| Level 1 – | Unadjusted, quoted prices in active markets for identical instruments that the Fund has the ability to access at the date of measurement. |
| WWW.HENNESSYFUNDS.COM |
20
| NOTES TO THE FINANCIAL STATEMENTS |
| Level 2 – | Other significant observable inputs (including, but not limited to, quoted prices in active markets for similar instruments, quoted prices in markets that are not active for identical or similar instruments, and model-derived valuations in which all significant inputs and significant value drivers are observable in active markets, such as interest rates, prepayment speeds, credit risk curves, default rates, and similar data). | |
| Level 3 – | Significant unobservable inputs (including the Fund’s own assumptions about what market participants would use to price the asset or liability based on the best available information) when observable inputs are unavailable. |
The following is a description of the valuation techniques applied to the Fund’s major categories of assets and liabilities on a recurring basis:
Equity Securities – Equity securities, including common stocks, preferred stocks, foreign-issued common stocks, exchange-traded funds, closed-end mutual funds, partnerships, rights, and real estate investment trusts, that are traded on a securities exchange for which a last-quoted sales price is readily available generally are valued at the last sales price as reported by the primary exchange on which the securities are listed. Securities listed on The NASDAQ Stock Market (“NASDAQ”) generally are valued at the NASDAQ Official Closing Price, which may differ from the last sales price reported. Securities traded on a securities exchange for which a last-quoted sales price is not readily available generally are valued at the mean between the bid and ask prices. To the extent these securities are actively traded and valuation adjustments are not applied, they are classified in Level 1 of the fair value hierarchy. Securities traded on foreign exchanges generally are not valued at the same time the Fund calculates its NAV because most foreign markets close well before such time. The earlier close of most foreign markets gives rise to the possibility that significant events, including broad market moves, may have occurred in the interim. In certain circumstances, it may be determined that a foreign security needs to be fair valued because it appears that the value of the security might have been materially affected by events occurring after the close of the market in which the security is principally traded, but before the time the Fund calculates its NAV, such as by a development that affects an entire market or region (e.g., a weather-related event) or a potentially global development (e.g., a terrorist attack that may be expected to have an effect on investor expectations worldwide). | |
Registered Investment Companies – Investments in open-end registered investment companies, commonly referred to as mutual funds, generally are priced at the ending NAV provided by the applicable mutual fund’s service agent and are classified in Level 1 of the fair value hierarchy. | |
Debt Securities – Debt securities, including corporate bonds, asset-backed securities, mortgage-backed securities, municipal bonds, U.S. Treasuries, and U.S. government agency issues, are generally valued at market on the basis of valuations furnished by an independent pricing service that utilizes both dealer-supplied valuations and formula-based techniques. The pricing service may consider recently executed transactions in securities of the issuer or comparable issuers, market price quotations (where observable), bond spreads, and fundamental data relating to the issuer. In addition, the model may incorporate observable market data, such as reported sales of similar securities, broker quotes, yields, bids, offers, and reference data. Certain securities are valued primarily using dealer quotations. These securities are generally classified in Level 2 of the fair value hierarchy. |
| HENNESSY FUNDS | 1-800-966-4354 |
21
Short-Term Securities – Short-term equity investments, including money market funds, are valued in the manner specified above for equity securities. Short-term debt investments with an original term to maturity of 60 days or less are valued at amortized cost, which approximates fair market value. If the original term to maturity of a short-term debt investment exceeds 60 days, then the values as of the 61st day prior to maturity are amortized. Amortized cost is not used if its use would be inappropriate due to credit or other impairments of the issuer, in which case the security’s fair value would be determined as described below. Short-term securities are generally classified in Level 1 or Level 2 of the fair value hierarchy depending on the inputs used and market activity levels for specific securities. |
The Board of Trustees of the Fund (the “Board”) has adopted fair value pricing procedures that are followed when a price for a security is not readily available or if a significant event has occurred that indicates the closing price of a security no longer represents the true value of that security. Fair value pricing determinations are made in good faith in accordance with these procedures. There are numerous criteria considered in determining a fair value of a security, such as the trading volume of a security and markets, the values of other similar securities, and news events with direct bearing on a security or markets. Fair value pricing results in an estimated price for a security that reflects the amount the Fund might reasonably expect to receive in a current sale. Depending on the relative significance of the valuation inputs, these securities may be classified in either Level 2 or Level 3 of the fair value hierarchy.
The fair value of foreign securities may be determined with the assistance of a pricing service using correlations between the movement of prices of such securities and indices of domestic securities and other appropriate indicators, such as closing market prices of relevant American Depositary Receipts or futures contracts. Using fair value pricing means that the Fund’s NAV reflects the affected portfolio securities’ values as determined by the Board or its designee, pursuant to the fair value pricing procedures adopted by the Board, instead of being determined by the market. Using a fair value pricing methodology to price a foreign security may result in a value that is different from such foreign security’s most recent closing price and from the value used by other investment companies to calculate their NAVs. Such securities are generally classified in Level 2 of the fair value hierarchy. Because the Fund may invest in foreign securities, the value of the Fund’s portfolio securities may change on days when a shareholder is unable to purchase or redeem Fund shares.
The Board has delegated day-to-day valuation matters to the Valuation and Liquidity Committee comprising representatives from Hennessy Advisors, Inc., the Fund’s investment advisor (the “Advisor”). The function of the Valuation and Liquidity Committee, among other things, is to value securities where current and reliable market quotations are not readily available. All actions taken by the Valuation and Liquidity Committee are reviewed by the Board.
The Fund has performed an analysis of all existing investments to determine the significance and character of all inputs to their fair value determinations. Various inputs are used to determine the value of the Fund’s investments. The inputs or methodology used for valuing securities are not necessarily an indication of the risk associated with investing in those securities. Details related to the fair value hierarchy of the Fund’s securities as of October 31, 2021, are included in the Schedule of Investments.
4). INVESTMENT TRANSACTIONS
Purchases and sales of investment securities (excluding government and short-term investments) for the Fund during fiscal year 2021 were $47,563,499 and $405,013,771, respectively.
| WWW.HENNESSYFUNDS.COM |
22
| NOTES TO THE FINANCIAL STATEMENTS |
There were no purchases or sales/maturities of long-term U.S. government securities for the Fund during fiscal year 2021.
5). INVESTMENT ADVISORY FEE AND OTHER TRANSACTIONS WITH AFFILIATES
The Advisor provides the Fund with investment advisory services under an Investment Advisory Agreement. The Advisor oversees the provision of investment advice and furnishes office space, facilities, and most of the personnel needed by the Fund. As compensation for its services, the Advisor is entitled to a monthly fee from the Fund. The fee is based on the average daily net assets of the Fund at an annual rate of 0.90%. The net investment advisory fees expensed by the Fund during fiscal year 2021 are included in the Statement of Operations.
The Advisor has delegated the day-to-day management of the Fund to a sub-advisor, Broad Run Investment Management, LLC. The Advisor pays the sub-advisory fees from its own assets, and these fees are not an additional expense of the Fund. During fiscal year 2021, the Advisor (not the Fund) paid a sub-advisory fee at the rate of 0.29% of the daily net assets of the Fund.
The Board has approved a Shareholder Servicing Agreement for Investor Class shares of the Fund, which compensates the Advisor for the non-investment advisory services it provides to the Fund. The Shareholder Servicing Agreement provides for a monthly fee paid to the Advisor at an annual rate of 0.10% of the average daily net assets of the Fund attributable to Investor Class shares. The shareholder service fees expensed by the Fund during fiscal year 2021 are included in the Statement of Operations.
The Fund has adopted a plan pursuant to Rule 12b-1 under the Investment Company Act of 1940, as amended, that authorizes payments in connection with the distribution of Fund shares at an annual rate of up to 0.25% of the Fund’s average daily net assets attributable to Investor Class shares. Even though the authorized rate is up to 0.25%, the Fund is currently only using up to 0.15% of its average daily net assets attributable to Investor Class shares for such purpose. Amounts paid under the plan may be spent on any activities or expenses primarily intended to result in the sale of shares, including, but not limited to, advertising, shareholder account servicing, printing and mailing of prospectuses to other than current shareholders, printing and mailing of sales literature, and compensation for sales and marketing activities or to financial institutions and others, such as dealers and distributors. The distribution fees expensed by the Fund during fiscal year 2021 are included in the Statement of Operations.
The Fund has entered into agreements with various brokers, dealers, and financial intermediaries in connection with the sale of Fund shares. The agreements provide for periodic payments of sub-transfer agent expenses by the Fund to the brokers, dealers, and financial intermediaries for providing certain shareholder maintenance services. These shareholder services include the pre-processing and quality control of new accounts, shareholder correspondence, answering customer inquiries regarding account status, and facilitating shareholder telephone transactions. The sub-transfer agent fees expensed by the Fund during fiscal year 2021 are included in the Statement of Operations.
U.S. Bancorp Fund Services, LLC, d/b/a U.S. Bank Global Fund Services (“Fund Services”) provides the Fund with administrative, accounting, and transfer agent services. As administrator, Fund Services is responsible for activities such as (i) preparing various federal and state regulatory filings, reports, and returns for the Fund, (ii) preparing reports and materials to be supplied to the Board, (iii) monitoring the activities of the Fund’s custodian, transfer agent, and accountants, and (iv) coordinating the preparation and payment of the Fund’s expenses and reviewing the Fund’s expense accruals. U.S. Bank
| HENNESSY FUNDS | 1-800-966-4354 |
23
N.A., an affiliate of Fund Services, serves as the Fund’s custodian. The servicing agreements between the Trust, Fund Services, and U.S. Bank N.A. contain a fee schedule that is inclusive of administrative, accounting, custody, and transfer agent fees. The administrative, accounting, custody, and transfer agent fees expensed by the Fund during fiscal year 2021 are included in the Statement of Operations.
Quasar Distributors, LLC (“Quasar”), a wholly owned broker-dealer subsidiary of Foreside Financial Group, LLC (“Foreside”), acts as the Fund’s principal underwriter in a continuous public offering of Fund shares. Effective September 30, 2021, Genstar Capital, a private equity firm specializing in financial and related business service companies, acquired a majority interest in Foreside. The Board approved a new Distribution Agreement to enable Quasar to continue serving as the Fund’s distributor following the change in control of Foreside.
The officers of the Fund are affiliated with the Advisor. With the exception of the Chief Compliance Officer and the Senior Compliance Officer, such officers receive no compensation from the Fund for serving in their respective roles. The Fund, along with the other funds in the Hennessy Funds family (collectively, the “Hennessy Funds”), makes reimbursement payments on an equal basis to the Advisor for a portion of the salary and benefits associated with the office of the Chief Compliance Officer and for all of the salary and benefits associated with the office of the Senior Compliance Officer. The compliance fees expensed by the Fund during fiscal year 2021 are included in the Statement of Operations.
6). GUARANTEES AND INDEMNIFICATIONS
Under the Hennessy Funds’ organizational documents, their officers and trustees are indemnified by the Hennessy Funds against certain liabilities arising out of the performance of their duties to the Hennessy Funds. Additionally, in the normal course of business, the Hennessy Funds enter into contracts with service providers that contain general indemnification clauses. The Fund’s maximum exposure under these arrangements is unknown as this would involve future claims that may be made against the Fund that have not yet occurred. Currently, the Fund expects the risk of loss to be remote.
7). LINE OF CREDIT
The Fund has an uncommitted line of credit with the other Hennessy Funds in the amount of the lesser of (i) $100,000,000 or (ii) 33.33% of each Hennessy Fund’s net assets, or 30% for the Hennessy Gas Utility Fund and 10% for the Hennessy Balanced Fund. The line of credit is intended to provide any necessary short-term financing in connection with shareholder redemptions, subject to certain restrictions. The credit facility is with the Hennessy Funds’ custodian bank, U.S. Bank N.A. Borrowings under this arrangement bear interest at the bank’s prime rate and are secured by all of the Fund’s assets (as to its own borrowings only). During fiscal year 2021, the Fund had an outstanding average daily balance and a weighted average interest rate of $62,416 and 3.25%, respectively. The interest expensed by the Fund during fiscal year 2021 is included in the Statement of Operations. The maximum amount outstanding for the Fund during fiscal year 2021 was $5,641,000. As of October 31, 2021, the Fund did not have any borrowings outstanding under the line of credit.
| WWW.HENNESSYFUNDS.COM |
24
| NOTES TO THE FINANCIAL STATEMENTS |
8). FEDERAL TAX INFORMATION
As of October 31, 2021, the components of accumulated earnings (losses) for income tax purposes were as follows:
| Investments | ||||
| Cost of investments for tax purposes | $ | 402,434,173 | ||
| Gross tax unrealized appreciation | $ | 818,221,412 | ||
| Gross tax unrealized depreciation | (11,476,479 | ) | ||
| Net tax unrealized appreciation/(depreciation) | $ | 806,744,933 | ||
| Undistributed ordinary income | $ | — | ||
| Undistributed long-term capital gains | 177,256,695 | |||
| Total distributable earnings | $ | 177,256,695 | ||
| Other accumulated gain/(loss) | $ | (8,436,125 | ) | |
| Total accumulated gain/(loss) | $ | 975,565,503 | ||
As of October 31, 2021, the Fund had no tax-basis capital losses to offset future capital gains.
As of October 31, 2021, the Fund deferred, on a tax basis, a late-year ordinary loss of $8,436,125. Late-year ordinary losses are net ordinary losses incurred after December 31, 2020, but within the taxable year, that are deemed to arise on the first day of the Fund’s next taxable year.
During fiscal years 2021 and 2020, the tax character of distributions paid by the Fund was as follows:
| Year Ended | Year Ended | ||||||||
| October 31, 2021 | October 31, 2020 | ||||||||
Ordinary income(1) | $ | — | $ | — | |||||
| Long-term capital gains | 314,776,104 | 184,664,743 | |||||||
| Total distributions | $ | 314,776,104 | $ | 184,664,743 | |||||
(1) Ordinary income includes short-term capital gains. |
9). EVENTS SUBSEQUENT TO YEAR END
Management has evaluated the Fund’s related events and transactions that occurred subsequent to October 31, 2021, through the date of issuance of the Fund’s financial statements. Other than as disclosed below, management has determined that there were no subsequent events requiring recognition or disclosure in the financial statements.
On December 7, 2021, capital gains were declared and paid to shareholders of record on December 6, 2021, as follows:
Long-term | |||
| Investor Class | $11.87407 | ||
| Institutional Class | $12.34819 |
| HENNESSY FUNDS | 1-800-966-4354 |
25
Report of Independent Registered Public
Accounting Firm
To the Board of Trustees of Hennessy Funds Trust
and the shareholders of the Hennessy Focus Fund
Novato, CA
Opinion on the Financial Statements
We have audited the accompanying statement of assets and liabilities of the Hennessy Focus Fund (the “Fund”), a series of Hennessy Funds Trust, including the schedule of investments, as of October 31, 2021, the related statement of operations for the year then ended, the statements of changes in net assets for each of the two years in the period then ended, financial highlights for each of the five years in the period then ended, and the related notes (collectively referred to as the “financial statements”). In our opinion, the financial statements present fairly, in all material respects, the financial position of the Fund as of October 31, 2021, the results of its operations for the year then ended, the changes in its net assets for each of the two years in the period then ended, and the financial highlights for each of the five years in the period then ended, in conformity with accounting principles generally accepted in the United States of America.
Basis for Opinion
These financial statements are the responsibility of the Fund’s management. Our responsibility is to express an opinion on the Fund’s financial statements based on our audits. We are a public accounting firm registered with the Public Company Accounting Oversight Board (United States) (“PCAOB”) and are required to be independent with respect to the Fund in accordance with the U.S. federal securities laws and the applicable rules and regulations of the Securities and Exchange Commission and the PCAOB. We have served as the auditor of one or more of the funds in the Trust since 2002.
We conducted our audits in accordance with the standards of the PCAOB. Those standards require that we plan and perform the audit to obtain reasonable assurance about whether the financial statements are free of material misstatement, whether due to error or fraud. The Fund is not required to have, nor were we engaged to perform, an audit of its internal control over financial reporting. As part of our audits we are required to obtain an understanding of internal control over financial reporting, but not for the purpose of expressing an opinion on the effectiveness of the Fund’s internal control over financial reporting. Accordingly, we express no such opinion.
Our audits included performing procedures to assess the risks of material misstatement of the financial statements, whether due to error or fraud, and performing procedures that respond to those risks. Such procedures included examining, on a test basis, evidence regarding the amounts and disclosures in the financial statements. Our audits also included evaluating the accounting principles used and significant estimates made by management, as well as evaluating the overall presentation of the financial statements. Our procedures included confirmation of securities owned as of October 31, 2021 by correspondence with the custodian. We believe that our audits provide a reasonable basis for our opinion.
| |
| TAIT, WELLER & BAKER LLP |
Philadelphia, Pennsylvania
December 22, 2021
| WWW.HENNESSYFUNDS.COM |
26
REPORT OF INDEPENDENT REGISTERED PUBLIC ACCOUNTING FIRM/TRUSTEES AND OFFICERS |
Trustees and Officers of the Fund (Unaudited)
The business and affairs of the Funds are managed under the direction of the Board of Trustees of the Trust, and the Board of Trustees elects the officers of the Trust. From time to time, the Board of Trustees also has appointed advisers to the Board of Trustees (“Advisers”) with the intention of having qualified individuals serve in an advisory capacity to garner experience in the mutual fund and asset management industry and be considered as potential Trustees in the future. There are currently two Advisers, Brian Alexander and Doug Franklin. As Advisers, Mr. Alexander and Mr. Franklin attend meetings of the Board of Trustees and act as non-voting participants. Information pertaining to the Trustees, Advisers, and the officers of the Trust is set forth below. The Trustees and officers serve until their successors are duly elected and qualified or until their earlier death, resignation, or removal. Each Trustee oversees all 16 Hennessy Funds. Unless otherwise indicated, the address of all persons listed below is 7250 Redwood Boulevard, Suite 200, Novato, CA 94945. The Fund’s Statement of Additional Information includes more information about the persons listed below and is available without charge by calling 1-800-966-4354 or by visiting www.hennessyfunds.com.
| Other | |||
| Directorships | |||
| Held Outside | |||
| Name, Age, | of Fund | ||
| and Position Held | Start Date | Principal Occupation(s) | Complex During |
with the Trust | of Service | During Past Five Years | Past Five Years |
| Disinterested Trustees and Advisers | |||
| J. Dennis DeSousa | January 1996 | Mr. DeSousa is a real estate investor. | None. |
| 85 | |||
| Trustee | |||
| Robert T. Doyle | January 1996 | Mr. Doyle has been the Sheriff of | None. |
| 74 | Marin County, California since 1996. | ||
| Trustee | |||
| Claire Garvie | December 2015 | Ms. Garvie is a founder of Kiosk and | None. |
| 47 | as an Adviser | has served as its Chief Operating | |
| Trustee | to the Board | Officer since 2004. Kiosk is a full- | |
| and | service marketing agency with | ||
| December 2021 | offices in the San Francisco Bay Area, | ||
| as a Trustee | Toronto, and Liverpool, UK. | ||
| Gerald P. Richardson | May 2004 | Mr. Richardson is an independent | None. |
| 76 | consultant in the securities industry. | ||
| Trustee |
| HENNESSY FUNDS | 1-800-966-4354 |
27
| Other | |||
| Directorships | |||
| Held Outside | |||
| Name, Age, | of Fund | ||
| and Position Held | Start Date | Principal Occupation(s) | Complex During |
with the Trust | of Service | During Past Five Years | Past Five Years |
| Brian Alexander | March 2015 | Mr. Alexander has worked for the | None. |
| 40 | Sutter Health organization since | ||
| Adviser to the Board | 2011 in various positions. He has | ||
| served as the Chief Executive Officer | |||
| of the Sutter Roseville Medical | |||
| Center since 2018. From 2016 through | |||
| 2018, he served as the Vice President | |||
| of Strategy for the Sutter Health Valley | |||
| Area, which includes 11 hospitals, | |||
| 13 ambulatory surgery centers, | |||
| 16,000 employees, and 1,900 physicians. | |||
| From 2013 through 2016, Mr. Alexander | |||
| served as Sutter Novato Community | |||
| Hospital’s Chief Administrative Officer. | |||
| Doug Franklin | March 2016 | Mr. Franklin is a retired insurance | None. |
| 57 | industry executive. From 1987 | ||
| Adviser to the Board | through 2015, he was employed | ||
| by the Allianz-Fireman’s Fund | |||
| Insurance Company in various | |||
| positions, including as its Chief | |||
| Actuary and Chief Risk Officer. | |||
Interested Trustee(1) | |||
| Neil J. Hennessy | January 1996 as | Mr. Hennessy has been employed | Hennessy |
| 65 | a Trustee and | by Hennessy Advisors, Inc. since | Advisors, Inc. |
| Chairman of the Board, | June 2008 as | 1989 and currently serves as its | |
| Chief Market Strategist, | an officer | Chairman and Chief Executive Officer. | |
| Portfolio Manager, | |||
| and President |
| Name, Age, | ||
| and Position Held | Start Date | Principal Occupation(s) |
with the Trust | of Service | During Past Five Years |
| Officers | ||
| Teresa M. Nilsen | January 1996 | Ms. Nilsen has been employed by Hennessy Advisors, Inc. |
| 55 | since 1989 and currently serves as its President and Chief | |
| Executive Vice President | Operating Officer. | |
| and Treasurer | ||
| Daniel B. Steadman | March 2000 | Mr. Steadman has been employed by Hennessy Advisors, Inc. |
| 65 | since 2000 and currently serves as its Executive Vice President. | |
| Executive Vice President | ||
| and Secretary | ||
| Brian Carlson | December 2013 | Mr. Carlson has been employed by Hennessy Advisors, Inc. |
| 49 | since December 2013 and currently serves as its Chief | |
| Senior Vice President | Compliance Officer and Senior Vice President. | |
| and Head of Distribution |
| WWW.HENNESSYFUNDS.COM |
28
TRUSTEES AND OFFICERS OF THE FUND |
| Name, Age, | ||
| and Position Held | Start Date | Principal Occupation(s) |
with the Trust | of Service | During Past Five Years |
Jennifer Cheskiewicz(2) | June 2013 | Ms. Cheskiewicz has been employed by Hennessy Advisors, Inc. |
| 44 | as its General Counsel since June 2013. | |
| Senior Vice President and | ||
| Chief Compliance Officer | ||
David Ellison(3) | October 2012 | Mr. Ellison has been employed by Hennessy Advisors, Inc. since |
| 63 | October 2012. He has served as a Portfolio Manager of the | |
| Senior Vice President | Hennessy Large Cap Financial Fund and the Hennessy Small | |
| and Portfolio Manager | Cap Financial Fund since their inception. Mr. Ellison also served | |
| as a Portfolio Manager of the Hennessy Technology Fund from | ||
| its inception until February 2017. Mr. Ellison served as Director, | ||
| CIO, and President of FBR Fund Advisers, Inc. from December | ||
| 1999 to October 2012. | ||
Ryan Kelley(4) | March 2013 | Mr. Kelley has been employed by Hennessy Advisors, Inc. since |
| 49 | October 2012. He has served as Chief Investment Officer of the | |
| Chief Investment Officer, | Hennessy Funds since March 2021 and has served as a Portfolio | |
| Senior Vice President, | Manager of the Hennessy Gas Utility Fund, the Hennessy Large | |
| and Portfolio Manager | Cap Financial Fund, and the Hennessy Small Cap Financial Fund | |
| since October 2014. Mr. Kelley served as Co-Portfolio Manager | ||
| of these same funds from March 2013 through September | ||
| 2014 and as a Portfolio Analyst for the Hennessy Funds from | ||
| October 2012 through February 2013. He has also served as a | ||
| Portfolio Manager of the Hennessy Cornerstone Growth Fund, | ||
| the Hennessy Cornerstone Mid Cap 30 Fund, the Hennessy | ||
| Cornerstone Large Growth Fund, and the Hennessy | ||
| Cornerstone Value Fund since February 2017 and as a Portfolio | ||
| Manager of the Hennessy Total Return Fund, the Hennessy | ||
| Balanced Fund, and the Hennessy Technology Fund since May | ||
| 2018. He served as Co-Portfolio Manager of the Hennessy | ||
| Technology Fund from February 2017 until May 2018. Mr. Kelley | ||
| served as Portfolio Manager of FBR Fund Advisers, Inc. from | ||
| January 2008 to October 2012. | ||
L. Joshua Wein(4) | September 2018 | Mr. Wein has been employed by Hennessy Advisors, Inc. since |
| 48 | 2018. He has served as Co-Portfolio Manager of the Hennessy | |
| Vice President and | Cornerstone Growth Fund, the Hennessy Cornerstone | |
| Co-Portfolio Manager | Mid Cap 30 Fund, the Hennessy Cornerstone Large Growth | |
| Fund, the Hennessy Cornerstone Value Fund, Hennessy Total | ||
| Return Fund, the Hennessy Balanced Fund, the Hennessy Gas | ||
| Utility Fund, and the Hennessy Technology Fund since February | ||
| 2019. He served as a Senior Analyst of these same funds from | ||
| September 2018 through February 2019. Mr. Wein served as | ||
| Director of Alternative Investments and Co-Portfolio Manager | ||
| at Sterling Capital Management from 2008 to 2018. |
_______________
(1) | Mr. Hennessy is considered an “interested person,” as defined in the Investment Company Act of 1940, as amended, because he is an officer of the Trust. |
(2) | The address of this officer is 4800 Bee Caves Road, Suite 100, Austin, TX 78746. |
(3) | The address of this officer is 101 Federal Street, Suite 1615B, Boston, MA 02110. |
(4) | The address of this officer is 1340 Environ Way, Chapel Hill, NC 27517. |
| HENNESSY FUNDS | 1-800-966-4354 |
29
Expense Example (Unaudited)
October 31, 2021
As a shareholder of the Fund, you incur ongoing costs, including management fees, service fees, and other Fund expenses. This Example is intended to help you understand your ongoing costs (in dollars) of investing in the Fund and to compare these costs with the ongoing costs of investing in other mutual funds. The Example is based on an investment of $1,000 invested at the beginning of the period and held for the entire period from May 1, 2021, through October 31, 2021.
Actual Expenses
In the table below, the first line under each of the “Investor Class” and “Institutional Class” headings provides information about actual account values and actual expenses for each share class. You may use this information, together with the amount you invested, to estimate the expenses that you paid over the period. Simply divide your account value by $1,000 (for example, an $8,600 account value divided by $1,000 = 8.6), then multiply the result by the number in the first line under the heading “Expenses Paid During Period” to estimate the expenses you paid on your account during this period. Although the Fund charges no sales loads or transaction fees, you will be assessed fees for outgoing wire transfers, returned checks, and stop payment orders at prevailing rates charged by U.S. Bank Global Fund Services, the Fund’s transfer agent. If you request that a redemption be made by wire transfer, the Fund’s transfer agent charges a $15 fee. IRAs are charged a $15 annual maintenance fee (up to $30 maximum per shareholder for shareholders with multiple IRAs). The examples below include, but are not limited to, management, shareholder servicing, accounting, custody, and transfer agent fees. However, the examples below do not include portfolio trading commissions and related expenses.
Hypothetical Example for Comparison Purposes
In the table below, the second line under each of the “Investor Class” and “Institutional Class” headings provides information about hypothetical account values and hypothetical expenses based on the Fund’s actual expense ratio for each share class and an assumed rate of return of 5% per year before expenses, which is not the Fund’s actual return for such share class. The hypothetical account values and expenses may not be used to estimate the actual ending account balance or expenses you paid for the period. You may use this information to compare the ongoing costs of investing in the Fund and other funds. To do so, compare these 5% hypothetical examples with the 5% hypothetical examples that appear in the shareholder reports of the other funds. Please note that the expenses shown in the table are meant to highlight your ongoing costs only. Therefore, the second lines under “Investor Class” and “Institutional Class” are useful in comparing ongoing costs only and will not help you determine the relative total costs of owning different funds.
| WWW.HENNESSYFUNDS.COM |
30
| EXPENSE EXAMPLE |
| Expenses Paid | |||
| Beginning | Ending | During Period(1) | |
| Account Value | Account Value | May 1, 2021 – | |
May 1, 2021 | October 31, 2021 | October 31, 2021 | |
| Investor Class | |||
| Actual | $1,000.00 | $1,098.30 | $7.77 |
| Hypothetical (5% return before expenses) | $1,000.00 | $1,017.80 | $7.48 |
| Institutional Class | |||
| Actual | $1,000.00 | $1,100.20 | $5.88 |
| Hypothetical (5% return before expenses) | $1,000.00 | $1,019.61 | $5.65 |
(1) | Expenses are equal to the Fund’s annualized expense ratio of 1.47% for Investor Class shares or 1.11% for Institutional Class shares, as applicable, multiplied by the average account value over the period, multiplied by 184/365 days (to reflect the half-year period). |
| HENNESSY FUNDS | 1-800-966-4354 |
31
How to Obtain a Copy of the Fund’s Proxy
Voting Policy and Proxy Voting Records
A description of the policies and procedures the Fund uses to determine how to vote proxies relating to portfolio securities is available without charge (1) by calling 1-800-966-4354, (2) on the Hennessy Funds’ website at www.hennessyfunds.com/proxy-voting/voting-policy, or (3) on the U.S. Securities and Exchange Commission’s (the “SEC”) website at www.sec.gov. The Fund’s proxy voting record is available without charge on both the Hennessy Funds’ website at www.hennessyfunds.com/proxy-voting/voting-record and the SEC’s website at www.sec.gov no later than August 31 for the prior 12 months ending June 30.
Availability of Quarterly Portfolio Schedule
The Fund files a complete schedule of portfolio holdings with the SEC for the first and third quarters of each fiscal year as an exhibit to its reports on Form N-PORT. The Fund’s Form N-PORT reports are available on the SEC’s website at www.sec.gov or on request by calling 1-800-966-4354.
Federal Tax Distribution Information (Unaudited)
For fiscal year 2021, certain dividends paid by the Fund may be subject to a maximum tax rate of 23.8%, as provided for by the Jobs and Growth Tax Relief Reconciliation Act of 2003. The percentage of dividends declared from ordinary income designated as qualified dividend income was 0.00%.
For corporate shareholders, the percent of ordinary income distributions that qualified for the corporate dividends received deduction for fiscal year 2021 was 0.00%.
The percentage of taxable ordinary income distributions that were designated as short-term capital gain distributions under Section 871(k)(2)(C) of the Internal Revenue Code of 1986, as amended, for the Fund was 0.00%.
Important Notice Regarding Delivery
of Shareholder Documents
To help keep the Fund’s costs as low as possible, we generally deliver a single copy of shareholder reports, proxy statements, and prospectuses to shareholders who share an address and have the same last name. This process does not apply to account statements. You may request an individual copy of a shareholder document at any time. If you would like to receive separate mailings of shareholder documents, please call U.S. Bank Global Fund Services at 1-800-261-6950 or 1-414-765-4124, and individual delivery will begin within 30 days of your request. If your account is held through a financial institution or other intermediary, please contact such intermediary directly to request individual delivery.
Electronic Delivery
As permitted by SEC regulations, the Fund’s shareholder reports are made available on a website, and unless you sign up for eDelivery or elect to receive paper copies as detailed below, you will be notified by mail each time a report is posted and provided with a website link to access the report.
The Fund also offers shareholders the option to receive all notices, account statements, prospectuses, tax forms, and shareholder reports online. To sign up for eDelivery or change your delivery preference, please visit www.hennessyfunds.com/account.
To elect to receive paper copies of all future reports free of charge, please call U.S. Bank Global Fund Services at 1-800-261-6950 or 1-414-765-4124.
Subscribe to receive our team’s unique market and sector insights delivered to your inbox
www.hennessyfunds.com/subscribe
Follow us on social media
| | |
| WWW.HENNESSYFUNDS.COM |
32
| PROXY VOTING — PRIVACY POLICY |
Liquidity Risk Management Program
In accordance with Rule 22e-4 under the Investment Company Act of 1940, as amended (the “Liquidity Rule”), we have adopted and implemented a liquidity risk management program (the “Liquidity Program”). The purpose of the Liquidity Program is to assess and manage the Fund’s liquidity risk, which is the risk that the Fund would not be able to meet requests to redeem Fund shares without significant dilution of the remaining shareholders’ interests in the Fund. The Board of Trustees of the Fund (the “Board”) designated a committee comprising representatives of Hennessy Advisors, Inc., the investment adviser to the Fund, as the administrator of the Liquidity Program (the “Program Administrator”).
The Program Administrator provided a written report regarding the Liquidity Program to the Board in advance of its meeting on June 2, 2021. The report covered the period from June 1, 2020, through May 31, 2021. The report addressed the operation of the Liquidity Program, assessed the adequacy and effectiveness of its implementation, and described any material changes to the Liquidity Program during the review period. The Trust’s chief compliance officer presented the report to the Board at the meeting and provided additional information regarding the Liquidity Program. The Board reviewed the Liquidity Program and considered, among other items, the following:
| 1. | The Program Administrator reviewed daily historical net redemption activity during the review period and during prior periods with higher-than-average redemption activity and concluded that the Fund has historically been able to meet requests to redeem Fund shares without significant dilution to the Fund’s remaining shareholders, and the Program Administrator expects the Fund to be able to continue to do so in the future during both normal and reasonably foreseeable stressed conditions. | |
| 2. | The Fund holds assets that are highly liquid investments and is therefore not required to establish a highly liquid investment minimum for the Fund or adopt policies and procedures for responding to a highly liquid investment minimum shortfall. | |
| 3. | The Program Administrator did not make any material changes to the Liquidity Program during the review period and did not recommend any changes to the Liquidity Program. The Program Administrator did make adjustments to the model inputs used to determine the liquidity classification of each security held by the Fund. | |
| 4. | The Program Administrator concluded that the Liquidity Program was reasonably designed to assess and manage the Fund’s liquidity risk, complies with the requirements of the Liquidity Rule, and was operating as intended during the review period. |
Privacy Policy
We collect the following personal information about you:
| 1. | Information we receive from you in applications or other forms, correspondence, or conversations, including, but not limited to, your name, address, phone number, social security number, assets, income, and date of birth; | |
| 2. | Information about your transactions with us, our affiliates, or others, including, but not limited to, your account number and balance, payments history, parties to transactions, cost basis information, and other financial information; and |
| HENNESSY FUNDS | 1-800-966-4354 |
33
| 3. | Other personal information we collect from various sources, even if you have not entered into a prior transaction with us, including the following: |
| • | Name, alias, address, unique personal identifier, online identifier, IP address, email address, telephone number, account name, and other similar identifiers; | |
| • | Age and marital status; | |
| • | Commercial information, including records of products purchased; | |
| • | Browsing history, search history, and information on interaction with our website; | |
| • | Geolocation data; | |
| • | Employment and employment history, educational history, financial information, and purchasing and consuming histories or tendencies; and | |
| • | Inferences drawn from the above-listed information to create a profile about your preferences, characteristics, predispositions, and behavior. |
We collect this information directly from you, indirectly in the course of providing services to you, directly and indirectly from your activity on our website, from broker dealers, marketing agencies, and other third parties that interact with us in connection with the services we perform and products we offer, and from anonymized and aggregated consumer information.
We use this information to fulfill the reason you provided the information to us, to provide you with other relevant products that you request from us, to provide you with information about products that may interest you, to improve our website or present our website’s contents to you, and as otherwise described to you when collecting your personal information.
We do not disclose any personal information to unaffiliated third parties, except as permitted by law. We may disclose your personal information to our affiliates, vendors, and service providers for a business purpose. For example, we are permitted by law to disclose all of the information we collect, as described above, to our transfer agent to process your transactions. When disclosing your personal information to third parties, we enter into a contract with each third party describing the purpose of such disclosure and requiring that such personal information be kept confidential and not used for any purpose except to perform the services contracted or respond to regulatory or law enforcement requests.
Furthermore, we restrict access to your personal information to those persons who require such information to provide products or services to you. As a result, we do not provide a means for opting out of our limited sharing of your information. We maintain physical, electronic, and procedural safeguards that comply with federal standards to guard your personal information.
If you hold shares of the Funds through a financial intermediary, including, but not limited to, a broker-dealer, bank, or trust company, the privacy policy of your financial intermediary governs how your personal information is shared with unaffiliated third parties.
Supplemental Privacy Notice for Residents of California
The California Consumer Privacy Act of 2018 (the “CCPA”) provides you, as a California resident, with certain additional rights relating to your personal information.
| WWW.HENNESSYFUNDS.COM |
34
| PRIVACY POLICY |
Under the CCPA, you have the right to request that we disclose to you the categories of personal information we have collected about you over the past 12 months, the categories of sources of such information, our business purpose for collecting the information, the categories of third parties, if any, with whom we shared the information, and the specific information we have collected about you. You also have the right to request that we delete any of your personal information, and, unless an exception applies, we will delete such information upon receiving and confirming your request. To make a request, call us at 1-800-966-4354, email us at privacy@hennessyfunds.com, or go to www.hennessyfunds.com/contact. We will not discriminate against you for exercising your rights under the CCPA. Further, we will not collect additional categories of your personal information or use the personal information we collected for materially different, unrelated, or incompatible purposes without providing you notice.
| HENNESSY FUNDS | 1-800-966-4354 |
35
(This Page Intentionally Left Blank.)
For information, questions, or assistance, please call
The Hennessy Funds
1-800-966-4354 or 1-415-899-1555
INVESTMENT ADVISOR
Hennessy Advisors, Inc.
7250 Redwood Boulevard, Suite 200
Novato, California 94945
ADMINISTRATOR,
TRANSFER AGENT,
DIVIDEND PAYING AGENT, &
SHAREHOLDER SERVICING AGENT
U.S. Bancorp Fund Services, LLC
d/b/a U.S. Bank Global Fund Services
P.O. Box 701
Milwaukee, Wisconsin 53201-0701
CUSTODIAN
U.S. Bank N.A.
Custody Operations
1555 North River Center Drive, Suite 302
Milwaukee, Wisconsin 53212
TRUSTEES
Neil J. Hennessy
Robert T. Doyle
J. Dennis DeSousa
Claire Garvie
Gerald P. Richardson
COUNSEL
Foley & Lardner LLP
777 East Wisconsin Avenue
Milwaukee, Wisconsin 53202-5306
INDEPENDENT REGISTERED
PUBLIC ACCOUNTING FIRM
Tait, Weller & Baker LLP
Two Liberty Place
50 South 16th Street, Suite 2900
Philadelphia, Pennsylvania 19102-2529
DISTRIBUTOR
Quasar Distributors, LLC
111 East Kilbourn Avenue, Suite 2200
Milwaukee, Wisconsin 53202
www.hennessyfunds.com | 1-800-966-4354
This report has been prepared for shareholders and may be distributed to
others only if preceded or accompanied by a current prospectus.
ANNUAL REPORT
OCTOBER 31, 2021
HENNESSY CORNERSTONE MID CAP 30 FUND
Investor Class HFMDX
Institutional Class HIMDX
www.hennessyfunds.com | 1-800-966-4354
(This Page Intentionally Left Blank.)
Contents
| Letter to Shareholders | 2 |
| Performance Overview | 4 |
| Financial Statements | |
| Schedule of Investments | 7 |
| Statement of Assets and Liabilities | 11 |
| Statement of Operations | 12 |
| Statements of Changes in Net Assets | 13 |
| Financial Highlights | 14 |
| Notes to the Financial Statements | 18 |
| Report of Independent Registered Public Accounting Firm | 25 |
| Trustees and Officers of the Fund | 26 |
| Expense Example | 30 |
| Proxy Voting Policy and Proxy Voting Records | 32 |
| Availability of Quarterly Portfolio Schedule | 32 |
| Important Notice Regarding Delivery of Shareholder Documents | 32 |
| Electronic Delivery | 32 |
| Liquidity Risk Management Program | 33 |
| Privacy Policy | 33 |
| HENNESSY FUNDS | 1-800-966-4354 |
December 2021
Dear Hennessy Funds Shareholder:
What a year this has been. While it doesn’t feel that we are out of the “pandemic” phase of the coronavirus crisis, we look forward to a day when we will eventually see fewer cases and potentially less severe variants. We feel extremely grateful to the many healthcare workers who have continued to work tirelessly during the recent surge. As we move through the next year, we hope that new U.S. cases will decline and that many other parts of the world will see improvements as well.
What a year this has been! As measured by the total return of the S&P 500® Index, as of October 31, 2021, the market was up 24.04% calendar year to date. This comes in the wake of a tumultuous 2020 in which the market plunged in the beginning of the pandemic and recovered dramatically to end the year up 18.40%. Interestingly, 18% appears to be a repeating number in the past dozen years. From the low point of the Financial Crisis (March 9, 2009) to the high point reached just prior to the COVID-19 pandemic (February 12, 2020), the S&P 500® Index was up 18.27% per year. We are well aware that past results are not predictive of the future, and we find ourselves naturally skeptical of such strong returns. But, as shown in the chart below, we find that the most common annual total returns of the market over the past 102 years range between 20% and 30% with the second most common being between 10% and 20%:
Source: Bloomberg L.P.
We will say it again, after showing a chart like the one above: Past results are not predictive of the future. Instead, we look at where we are right now – in the economy, in the market, in the business cycle – to reflect on where we have come from and where we may be going. U.S. GDP is strong and growing, interest rates remain low, and earnings growth and profitability remain robust. We believe stocks are trading at reasonable valuations when viewed as a whole, with the S&P 500® Index at 21.0x estimated earnings for 2022. Furthermore, we believe corporate balance sheets are healthy, with high levels of excess cash, which could support growth, increases in dividends, more share buybacks, and future acquisitions. Uncertainty and volatility can manifest at any time in the stock market, and the current market is no different. Investors have questions about inflation, worldwide supply chain issues, and what could drive the next boost in earnings. While these concerns are warranted, we continue to believe that overall the positives outweigh the negatives, and here at Hennessy we continue to see opportunity in the market and in our Funds.
| WWW.HENNESSYFUNDS.COM |
2
| LETTER TO SHAREHOLDERS |
What a (fiscal) year this has been!!! For our fiscal year ended October 31, 2021, the S&P 500® Index rose 42.91% on a total return basis, setting a new all-time high on the final day of the period. Except for a short 21-trading-day period that began on September 2 during which the market fell 5.13% only to rebound to new highs just 13 trading days later, the market has been on a continuous march higher. We saw a dramatic shift in market leadership as many of the sectors that underperformed during our last fiscal year soared in fiscal year 2021. Small-caps beat mid-caps, which in turn beat large-caps. The Energy and Financials sectors skyrocketed during the 12-month period, as reflected by the S&P 500® Energy Sector’s total return of 111.29% and the Russell 1000® Index Financials’ total return of 70.87%. Both of these sectors were among the worst performing in our fiscal year 2020, so a bounce back in our fiscal year 2021, while not a foregone conclusion, was a distinct possibility.
Overall, we are pleased with the performance of our mutual funds during the fiscal year. On an absolute basis, each of our 16 Funds achieved total returns greater than 10% and seven outperformed their primary benchmark. Ten of our 11 domestic equity-only Funds outperformed the S&P 500® Index and posted total returns of 45% or higher. Our four best-performing funds were concentrated in the Energy and Financials sectors. While some of our Funds certainly benefited from being in the “right” sector at the “right” time, we also believe this was a favorable period for our investment style of high-conviction investing and concentrated portfolio construction.
What will the coming year bring? As mentioned in our last shareholder letter (June 2021), we understand that even the greatest bull markets experience corrections along the way, and the last time the S&P 500® Index dropped over 10% was in February/March of 2020. Whether or not a correction occurs sooner or later, we believe the market as a whole has more room to run. We see many factors that could drive the market higher from here: strong GDP growth and increasing corporate earnings, a potentially lower-for-longer interest rate environment, accommodative fiscal and monetary policies, a healthy and robust financial system, low unemployment and solid wage growth, and strong corporate balance sheets with plenty of cash.
Thank you for your interest and for investing with us. We remain committed to managing our portfolios for long-term performance, ever mindful of downside risk. With so many investment options available to you, we are grateful for the trust you put in us and for your continued interest in our family of Funds. If you have any questions or would like to speak with us, please don’t hesitate to call us directly at (800) 966-4354.
Best regards,
| |
| |
| Ryan C. Kelley | |
| Chief Investment Officer |
Past performance does not guarantee future results. To obtain current standardized performance for the Hennessy Funds, visit https://www.hennessyfunds.com/funds/price-performance.
Mutual fund investing involves risk. Principal loss is possible.
Opinions expressed are those of Ryan C. Kelley and are subject to change, are not guaranteed, and should not be considered investment advice.
The Dow Jones Industrial Average and S&P 500® Index are commonly used to measure the performance of U.S. stocks. The S&P 500® Energy Index comprises those companies included in the S&P 500® Index that are classified in the Energy sector. The Russell 1000® Index Financials is a subset of the Russel 1000® Index that measures the performance of securities classified in the Financials sector of the large-capitalization U.S. equity market. The indices are used herein for comparative purposes in accordance with SEC regulations. One cannot invest directly in an index. All returns are shown on a total return basis.
| HENNESSY FUNDS | 1-800-966-4354 |
3
Performance Overview (Unaudited)
CHANGE IN VALUE OF $10,000 INVESTMENT

This graph illustrates the performance of an initial investment of $10,000 made in the Fund 10 years ago and assumes the reinvestment of dividends and capital gains.
AVERAGE ANNUAL TOTAL RETURN FOR PERIODS ENDED OCTOBER 31, 2021
| One | Five | Ten | ||
Year | Years | Years | ||
| Hennessy Cornerstone Mid Cap 30 Fund – | ||||
| Investor Class (HFMDX) | 49.06% | 12.36% | 12.21% | |
| Hennessy Cornerstone Mid Cap 30 Fund – | ||||
| Institutional Class (HIMDX) | 49.60% | 12.76% | 12.58% | |
Russell Midcap® Index | 45.40% | 16.47% | 14.78% | |
S&P 500® Index | 42.91% | 18.93% | 16.21% |
Expense ratios: 1.37% (Investor Class); 1.01% (Institutional Class)
Performance data quoted represents past performance; past performance does not guarantee future results. The investment return and principal value of an investment will fluctuate so that an investor’s shares, when redeemed, may be worth more or less than their original cost. The performance table does not reflect the deduction of taxes that a shareholder would pay on Fund distributions or the redemption of Fund shares. Current performance of the Fund may be lower or higher than the performance quoted. Performance data current to the most recent month end may be obtained by visiting www.hennessyfunds.com.
The Russell Midcap® Index comprises approximately 800 of the smallest securities of the Russell 1000® Index based on a combination of market capitalization and current index membership. The S&P 500® Index is a capitalization- weighted index that is designed to represent the broad domestic economy through changes in the aggregate market value of 500 stocks across all major industries. One cannot invest directly in an index. These indices are used for comparative purposes in accordance with Securities and Exchange Commission regulations.
Frank Russell Company (“Russell”) is the source and owner of the trademarks, service marks, and copyrights related to the Russell Indexes. Russell® is a trademark of Frank Russell Company. Neither Russell nor its licensors accept any liability for any errors or omissions in the Russell Indexes or Russell ratings or underlying data and no party may rely on any Russell Indexes or Russell ratings or underlying data contained in this communication. No further distribution of Russell data is permitted without Russell’s express written consent. Russell does not promote, sponsor, or endorse the content of this communication.
| WWW.HENNESSYFUNDS.COM |
4
| PERFORMANCE OVERVIEW |
Standard & Poor’s Financial Services is the source and owner of the S&P® and S&P 500® trademarks.
The expense ratios presented are from the most recent prospectus. The expense ratios for the current reporting period are available in the Financial Highlights section of this report.
PERFORMANCE NARRATIVE
Portfolio Managers Neil J. Hennessy, Ryan C. Kelley, CFA, and L. Joshua Wein, CAIA
Performance:
For the one-year period ended October 31, 2021, the Investor Class of the Hennessy Cornerstone Mid Cap 30 Fund returned 49.06%, outperforming both the Russell Midcap® Index (the Fund’s primary benchmark) and the S&P 500® Index, which returned 45.40% and 42.91%, respectively, for the same period.
The Fund’s outperformance relative to its primary benchmark resulted primarily from stock selection within the Industrials, Financials, and Materials sectors. The largest contributors to performance within each of these sectors during the period were Quanta Services, Inc., Jefferies Financial Group, Inc., and Avient Corporation, respectively. Offsetting these gains somewhat were losses in holdings in the Energy and Consumer Staples sectors. The largest detractors to performance during the period within each of these sectors were Renewable Energy Group, Inc. and Grocery Outlet Holding Corporation, respectively.
The Fund held all of the names mentioned through October 31, 2021. Following the Fund’s annual rebalance, which occurred after the end of the fiscal year, the Fund no longer holds any of the names mentioned.
Portfolio Strategy:
The Fund utilizes a formula-based approach designed to construct a concentrated portfolio of attractively valued, growing mid-cap companies whose stock prices are exhibiting strong price momentum. In essence, the strategy seeks to combine elements of both value and momentum investing by selecting 30 stocks that have relatively low price-to-sales ratios, have generated increased earnings over the past year, and have positive stock price appreciation over the past three-month, six-month, and one-year periods.
Investment Commentary:
After a tumultuous 2020 and a strong 2021, we believe that the outlook for U.S. stocks remains positive. After a sharp contraction in economic activity as a result of the COVID-19 pandemic, the U.S. economy is growing steadily and demonstrating incredible resilience. We are benefiting from increased employment, rapid wage gains, and robust economic activity. Corporate earnings are on the rise, interest rates remain low, and Federal Reserve policies continue to accommodate a strong economy.
Subsequent to the end of the fiscal year and after the Fund’s annual rebalance, sectors in which the Fund currently maintains significant overweight positions include Consumer Discretionary, Consumer Staples, and Energy. Given the continued reopening of the economy, we would expect consumer spending to hold steady into next year as long as inflation does not significantly dampen demand, which would drive many of our consumer-related holdings higher. Additionally, increased energy demand coupled with
| HENNESSY FUNDS | 1-800-966-4354 |
5
sustained higher energy prices, if they hold, could be beneficial for many of our holdings in the Energy sector.
_______________
Opinions expressed are those of the Portfolio Managers as of the date written and are subject to change, are not guaranteed, and should not be considered investment advice or an indication of trading intent.
The Fund invests in small-capitalization and medium-capitalization companies, which may have limited liquidity and greater price volatility than large-capitalization companies. The Fund’s formula-based strategy may cause the Fund to buy or sell securities at times when it may not be advantageous. Please see the Fund’s prospectus for a more complete discussion of these and other risks.
References to specific securities should not be considered a recommendation to buy or sell any security. Fund holdings and sector allocations are subject to change. Please refer to the Schedule of Investments included in this report for additional portfolio information.
Earnings growth is not a measure of the Fund’s future performance.
Price-to-sales ratio is a valuation measure calculated by dividing a company’s market price per share by its revenue per share.
| WWW.HENNESSYFUNDS.COM |
6
| PERFORMANCE OVERVIEW/SCHEDULE OF INVESTMENTS |
Financial Statements
Schedule of Investments as of October 31, 2021 |
HENNESSY CORNERSTONE MID CAP 30 FUND
(% of Net Assets)

| TOP TEN HOLDINGS (EXCLUDING MONEY MARKET FUNDS) | % NET ASSETS |
| Jefferies Financial Group, Inc. | 5.23% |
| Vista Outdoor, Inc. | 4.91% |
| LPL Financial Holdings, Inc. | 4.77% |
| Quanta Services, Inc. | 4.72% |
| Williams-Sonoma, Inc. | 4.27% |
| Valmont Industries, Inc. | 4.24% |
| LKQ Corp. | 4.22% |
| Mattel, Inc. | 4.20% |
| Avient Corp. | 4.09% |
| Colfax Corp. | 3.97% |
Note: For presentation purposes, the Fund has grouped some of the industry categories. For purposes of categorizing securities for compliance with Section 8(b)(1) of the Investment Company Act of 1940, as amended, the Fund uses more specific industry classifications.
The Global Industry Classification Standard (GICS®) was developed by and is the exclusive property and a service mark of MSCI, Inc. and Standard & Poor’s Financial Services LLC. It has been licensed for use by the Hennessy Funds.
| HENNESSY FUNDS | 1-800-966-4354 |
7
| COMMON STOCKS – 98.63% | Number | % of | ||||||||||
| of Shares | Value | Net Assets | ||||||||||
| Consumer Discretionary – 31.78% | ||||||||||||
| Bed Bath & Beyond, Inc. (a) | 324,000 | $ | 4,548,960 | 1.17 | % | |||||||
| Big Lots, Inc. | 177,600 | 7,858,800 | 2.02 | % | ||||||||
| KB Home | 231,700 | 9,302,755 | 2.39 | % | ||||||||
| Lithia Motors, Inc., Class A | 35,100 | 11,204,622 | 2.88 | % | ||||||||
| LKQ Corp. (a) | 297,700 | 16,397,316 | 4.22 | % | ||||||||
| Mattel, Inc. (a) | 748,000 | 16,313,880 | 4.20 | % | ||||||||
| Meritage Homes Corp. (a) | 85,100 | 9,251,221 | 2.38 | % | ||||||||
| Sleep Number Corp. (a) | 146,800 | 12,968,312 | 3.34 | % | ||||||||
| Vista Outdoor, Inc. (a) | 456,600 | 19,104,144 | 4.91 | % | ||||||||
| Williams-Sonoma, Inc. | 89,300 | 16,585,689 | 4.27 | % | ||||||||
| 123,535,699 | 31.78 | % | ||||||||||
| Consumer Staples – 7.31% | ||||||||||||
| BJ’s Wholesale Club Holdings, Inc. (a) | 229,400 | 13,406,136 | 3.45 | % | ||||||||
| Casey’s General Stores, Inc. | 51,600 | 9,883,464 | 2.54 | % | ||||||||
| Grocery Outlet Holding Corp. (a) | 231,200 | 5,130,328 | 1.32 | % | ||||||||
| 28,419,928 | 7.31 | % | ||||||||||
| Energy – 2.78% | ||||||||||||
| Renewable Energy Group, Inc. (a) | 169,100 | 10,822,400 | 2.78 | % | ||||||||
| Financials – 10.00% | ||||||||||||
| Jefferies Financial Group, Inc. | 472,700 | 20,326,100 | 5.23 | % | ||||||||
| LPL Financial Holdings, Inc. | 113,000 | 18,534,260 | 4.77 | % | ||||||||
| 38,860,360 | 10.00 | % | ||||||||||
| Health Care – 6.59% | ||||||||||||
| Allscripts Healthcare Solutions, Inc. (a) | 890,600 | 12,272,468 | 3.16 | % | ||||||||
| Owens & Minor, Inc. | 372,100 | 13,350,948 | 3.43 | % | ||||||||
| 25,623,416 | 6.59 | % | ||||||||||
| Industrials – 17.87% | ||||||||||||
| Colfax Corp. (a) | 299,400 | 15,455,028 | 3.97 | % | ||||||||
| Maxar Technologies, Inc. | 301,300 | 7,999,515 | 2.06 | % | ||||||||
| Quanta Services, Inc. | 151,400 | 18,361,792 | 4.72 | % | ||||||||
| The Timken Co. | 157,700 | 11,188,815 | 2.88 | % | ||||||||
| Valmont Industries, Inc. | 69,003 | 16,488,957 | 4.24 | % | ||||||||
| 69,494,107 | 17.87 | % | ||||||||||
The accompanying notes are an integral part of these financial statements.
| WWW.HENNESSYFUNDS.COM |
8
| SCHEDULE OF INVESTMENTS |
| COMMON STOCKS | Number | % of | ||||||||||
| of Shares | Value | Net Assets | ||||||||||
| Information Technology – 7.90% | ||||||||||||
| Arrow Electronics, Inc. (a) | 111,900 | $ | 12,952,425 | 3.33 | % | |||||||
| Concentrix Corp. | 62,700 | 11,140,536 | 2.87 | % | ||||||||
| SYNNEX Corp. | 62,900 | 6,604,500 | 1.70 | % | ||||||||
| 30,697,461 | 7.90 | % | ||||||||||
| Materials – 14.40% | ||||||||||||
| Avient Corp. | 295,200 | 15,905,376 | 4.09 | % | ||||||||
| Berry Global Group, Inc. (a) | 189,000 | 12,387,060 | 3.19 | % | ||||||||
| Commercial Metals Co. | 443,800 | 14,281,484 | 3.67 | % | ||||||||
| Sealed Air Corp. | 226,400 | 13,430,048 | 3.45 | % | ||||||||
| 56,003,968 | 14.40 | % | ||||||||||
| Total Common Stocks | ||||||||||||
| (Cost $254,052,663) | 383,457,339 | 98.63 | % | |||||||||
| SHORT-TERM INVESTMENTS – 1.52% | ||||||||||||
| Money Market Funds – 1.52% | ||||||||||||
| First American Government Obligations Fund, | ||||||||||||
| Institutional Class, 0.03% (b) | 5,895,606 | 5,895,606 | 1.52 | % | ||||||||
| Total Short-Term Investments | ||||||||||||
| (Cost $5,895,606) | 5,895,606 | 1.52 | % | |||||||||
| Total Investments | ||||||||||||
| (Cost $259,948,269) – 100.15% | 389,352,945 | 100.15 | % | |||||||||
| Liabilities in Excess of Other Assets – (0.15)% | (585,694 | ) | (0.15 | )% | ||||||||
TOTAL NET ASSETS – 100.00% | $ | 388,767,251 | 100.00 | % | ||||||||
Percentages are stated as a percent of net assets.
| (a) | Non-income-producing security. |
| (b) | The rate listed is the fund’s seven-day yield as of October 31, 2021. |
The accompanying notes are an integral part of these financial statements.
| HENNESSY FUNDS | 1-800-966-4354 |
9
Summary of Fair Value Exposure as of October 31, 2021
The following is a summary of the inputs used to value the Fund’s net assets as of October 31, 2021 (see Note 3 in the accompanying Notes to the Financial Statements):
| Common Stocks | Level 1 | Level 2 | Level 3 | Total | ||||||||||||
| Consumer Discretionary | $ | 123,535,699 | $ | — | $ | — | $ | 123,535,699 | ||||||||
| Consumer Staples | 28,419,928 | — | — | 28,419,928 | ||||||||||||
| Energy | 10,822,400 | — | — | 10,822,400 | ||||||||||||
| Financials | 38,860,360 | — | — | 38,860,360 | ||||||||||||
| Health Care | 25,623,416 | — | — | 25,623,416 | ||||||||||||
| Industrials | 69,494,107 | — | — | 69,494,107 | ||||||||||||
| Information Technology | 30,697,461 | — | — | 30,697,461 | ||||||||||||
| Materials | 56,003,968 | — | — | 56,003,968 | ||||||||||||
| Total Common Stocks | $ | 383,457,339 | $ | — | $ | — | $ | 383,457,339 | ||||||||
| Short-Term Investments | ||||||||||||||||
| Money Market Funds | $ | 5,895,606 | $ | — | $ | — | $ | 5,895,606 | ||||||||
| Total Short-Term Investments | $ | 5,895,606 | $ | — | $ | — | $ | 5,895,606 | ||||||||
| Total Investments | $ | 389,352,945 | $ | — | $ | — | $ | 389,352,945 | ||||||||
The accompanying notes are an integral part of these financial statements.
| WWW.HENNESSYFUNDS.COM |
10
| SCHEDULE OF INVESTMENTS/STATEMENT OF ASSETS AND LIABILITIES |
Financial Statements
Statement of Assets and Liabilities as of October 31, 2021 |
| ASSETS: | ||||
| Investments in securities, at value (cost $259,948,269) | $ | 389,352,945 | ||
| Dividends and interest receivable | 159,441 | |||
| Receivable for fund shares sold | 52,057 | |||
| Prepaid expenses and other assets | 28,114 | |||
| Total assets | 389,592,557 | |||
| LIABILITIES: | ||||
| Payable for fund shares redeemed | 303,159 | |||
| Payable to advisor | 240,512 | |||
| Payable to administrator | 110,329 | |||
| Payable to auditor | 22,556 | |||
| Accrued distribution fees | 42,315 | |||
| Accrued service fees | 18,354 | |||
| Accrued trustees fees | 6,599 | |||
| Accrued expenses and other payables | 81,482 | |||
| Total liabilities | 825,306 | |||
| NET ASSETS | $ | 388,767,251 | ||
| NET ASSETS CONSISTS OF: | ||||
| Capital stock | $ | 292,682,136 | ||
| Total distributable earnings | 96,085,115 | |||
| Total net assets | $ | 388,767,251 | ||
| NET ASSETS: | ||||
| Investor Class | ||||
| Shares authorized (no par value) | Unlimited | |||
| Net assets applicable to outstanding shares | $ | 219,576,517 | ||
| Shares issued and outstanding | 11,099,676 | |||
| Net asset value, offering price, and redemption price per share | $ | 19.78 | ||
| Institutional Class | ||||
| Shares authorized (no par value) | Unlimited | |||
| Net assets applicable to outstanding shares | $ | 169,190,734 | ||
| Shares issued and outstanding | 8,188,985 | |||
| Net asset value, offering price, and redemption price per share | $ | 20.66 | ||
The accompanying notes are an integral part of these financial statements.
| HENNESSY FUNDS | 1-800-966-4354 |
11
Financial Statements
Statement of Operations for the year ended October 31, 2021 |
| INVESTMENT INCOME: | ||||
| Dividend income | $ | 2,424,075 | ||
| Interest income | 1,971 | |||
| Total investment income | 2,426,046 | |||
| EXPENSES: | ||||
| Investment advisory fees (See Note 5) | 2,912,632 | |||
| Sub-transfer agent expenses – Investor Class (See Note 5) | 469,391 | |||
| Sub-transfer agent expenses – Institutional Class (See Note 5) | 151,549 | |||
| Administration, accounting, custody, and transfer agent fees (See Note 5) | 441,039 | |||
| Distribution fees – Investor Class (See Note 5) | 337,186 | |||
| Service fees – Investor Class (See Note 5) | 224,790 | |||
| Federal and state registration fees | 39,738 | |||
| Reports to shareholders | 28,057 | |||
| Compliance expense (See Note 5) | 27,448 | |||
| Audit fees | 22,556 | |||
| Trustees’ fees and expenses | 20,784 | |||
| Legal fees | 6,999 | |||
| Interest expense (See Note 7) | 1,126 | |||
| Other expenses | 52,112 | |||
| Total expenses | 4,735,407 | |||
| NET INVESTMENT LOSS | $ | (2,309,361 | ) | |
| REALIZED AND UNREALIZED GAINS (LOSSES): | ||||
| Net realized gain on investments | $ | 20,131,190 | ||
| Net change in unrealized appreciation/depreciation on investments | 130,334,890 | |||
| Net gain on investments | 150,466,080 | |||
| NET INCREASE IN NET ASSETS RESULTING FROM OPERATIONS | $ | 148,156,719 | ||
The accompanying notes are an integral part of these financial statements.
| WWW.HENNESSYFUNDS.COM |
12
| STATEMENT OF OPERATIONS/STATEMENTS OF CHANGES IN NET ASSETS |
Financial Statements
| Statements of Changes in Net Assets |
| Year Ended | Year Ended | |||||||
| October 31, 2021 | October 31, 2020 | |||||||
| OPERATIONS: | ||||||||
| Net investment loss | $ | (2,309,361 | ) | $ | (355,618 | ) | ||
| Net realized gain on investments | 20,131,190 | 35,396,494 | ||||||
| Net change in unrealized | ||||||||
| appreciation/depreciation on investments | 130,334,890 | (10,356,279 | ) | |||||
| Net increase in net assets resulting from operations | 148,156,719 | 24,684,597 | ||||||
| CAPITAL SHARE TRANSACTIONS: | ||||||||
| Proceeds from shares subscribed – Investor Class | 27,799,744 | 36,649,372 | ||||||
| Proceeds from shares subscribed – Institutional Class | 11,595,887 | 10,233,461 | ||||||
| Cost of shares redeemed – Investor Class | (81,876,744 | ) | (67,490,215 | ) | ||||
| Cost of shares redeemed – Institutional Class | (41,705,014 | ) | (54,174,180 | ) | ||||
| Net decrease in net assets derived | ||||||||
| from capital share transactions | (84,186,127 | ) | (74,781,562 | ) | ||||
| TOTAL INCREASE (DECREASE) IN NET ASSETS | 63,970,592 | (50,096,965 | ) | |||||
| NET ASSETS: | ||||||||
| Beginning of year | 324,796,659 | 374,893,624 | ||||||
| End of year | $ | 388,767,251 | $ | 324,796,659 | ||||
| CHANGES IN SHARES OUTSTANDING: | ||||||||
| Shares sold – Investor Class | 1,537,236 | 2,924,072 | ||||||
| Shares sold – Institutional Class | 580,302 | 796,521 | ||||||
| Shares redeemed – Investor Class | (4,659,617 | ) | (5,859,484 | ) | ||||
| Shares redeemed – Institutional Class | (2,247,525 | ) | (4,490,843 | ) | ||||
| Net decrease in shares outstanding | (4,789,604 | ) | (6,629,734 | ) | ||||
The accompanying notes are an integral part of these financial statements.
| HENNESSY FUNDS | 1-800-966-4354 |
13
Financial Statements
| Financial Highlights |
For an Investor Class share outstanding throughout each year
PER SHARE DATA:
Net asset value, beginning of year
Income from investment operations:
Net investment loss
Net realized and unrealized gains (losses) on investments
Total from investment operations
Less distributions:
Dividends from net realized gains
Total distributions
Net asset value, end of year
TOTAL RETURN
SUPPLEMENTAL DATA AND RATIOS:
Net assets, end of year (millions)
Ratio of expenses to average net assets
Ratio of net investment loss to average net assets
Portfolio turnover rate(2)
(1) | Calculated using the average shares outstanding method. |
(2) | Calculated on the basis of the Fund as a whole. |
The accompanying notes are an integral part of these financial statements.
| WWW.HENNESSYFUNDS.COM |
14
| FINANCIAL HIGHLIGHTS — INVESTOR CLASS |
| Year Ended October 31, | ||||||||||||||||||
| 2021 | 2020 | 2019 | 2018 | 2017 | ||||||||||||||
| $ | 13.27 | $ | 12.01 | $ | 16.87 | $ | 22.46 | $ | 18.37 | |||||||||
| (0.14 | )(1) | (0.03 | )(1) | (0.02 | )(1) | (0.06 | ) | (0.15 | ) | |||||||||
| 6.65 | 1.29 | (0.34 | ) | (1.87 | ) | 4.36 | ||||||||||||
| 6.51 | 1.26 | (0.36 | ) | (1.93 | ) | 4.21 | ||||||||||||
| — | — | (4.50 | ) | (3.66 | ) | (0.12 | ) | |||||||||||
| — | — | (4.50 | ) | (3.66 | ) | (0.12 | ) | |||||||||||
| $ | 19.78 | $ | 13.27 | $ | 12.01 | $ | 16.87 | $ | 22.46 | |||||||||
| 49.06 | % | 10.49 | % | -1.22 | % | -10.54 | % | 23.02 | % | |||||||||
| $ | 219.58 | $ | 188.71 | $ | 206.11 | $ | 338.39 | $ | 351.16 | |||||||||
| 1.36 | % | 1.37 | % | 1.36 | % | 1.31 | % | 1.34 | % | |||||||||
| (0.74 | )% | (0.27 | )% | (0.15 | )% | (0.47 | )% | (0.33 | )% | |||||||||
| 0 | % | 94 | % | 70 | % | 181 | % | 106 | % | |||||||||
The accompanying notes are an integral part of these financial statements.
| HENNESSY FUNDS | 1-800-966-4354 |
15
Financial Statements
| Financial Highlights |
For an Institutional Class share outstanding throughout each year
PER SHARE DATA:
Net asset value, beginning of year
Income from investment operations:
Net investment income (loss)
Net realized and unrealized gains (losses) on investments
Total from investment operations
Less distributions:
Dividends from net realized gains
Total distributions
Net asset value, end of year
TOTAL RETURN
SUPPLEMENTAL DATA AND RATIOS:
Net assets, end of year (millions)
Ratio of expenses to average net assets
Ratio of net investment income (loss) to average net assets
Portfolio turnover rate(3)
(1) | Calculated using the average shares outstanding method. |
(2) | Amount is between $(0.005) and 0.005. |
(3) | Calculated on the basis of the Fund as a whole. |
The accompanying notes are an integral part of these financial statements.
| WWW.HENNESSYFUNDS.COM |
16
| FINANCIAL HIGHLIGHTS — INSTITUTIONAL CLASS |
| Year Ended October 31, | ||||||||||||||||||
| 2021 | 2020 | 2019 | 2018 | 2017 | ||||||||||||||
| $ | 13.81 | $ | 12.46 | $ | 17.38 | $ | 23.07 | $ | 18.80 | |||||||||
| (0.07 | )(1) | 0.01 | (1) | 0.03 | (1) | (0.00 | )(2) | 0.02 | ||||||||||
| 6.92 | 1.34 | (0.36 | ) | (1.92 | ) | 4.38 | ||||||||||||
| 6.85 | 1.35 | (0.33 | ) | (1.92 | ) | 4.40 | ||||||||||||
| — | — | (4.59 | ) | (3.77 | ) | (0.13 | ) | |||||||||||
| — | — | (4.59 | ) | (3.77 | ) | (0.13 | ) | |||||||||||
| $ | 20.66 | $ | 13.81 | $ | 12.46 | $ | 17.38 | $ | 23.07 | |||||||||
| 49.60 | % | 10.83 | % | -0.84 | % | -10.22 | % | 23.47 | % | |||||||||
| $ | 169.19 | $ | 136.09 | $ | 168.79 | $ | 329.30 | $ | 620.38 | |||||||||
| 0.99 | % | 1.01 | % | 1.00 | % | 0.95 | % | 0.97 | % | |||||||||
| (0.38 | )% | 0.09 | % | 0.20 | % | (0.12 | )% | 0.04 | % | |||||||||
| 0 | % | 94 | % | 70 | % | 181 | % | 106 | % | |||||||||
The accompanying notes are an integral part of these financial statements.
| HENNESSY FUNDS | 1-800-966-4354 |
17
Financial Statements
Notes to the Financial Statements October 31, 2021 |
1). ORGANIZATION
The Hennessy Cornerstone Mid Cap 30 Fund (the “Fund”) is a series of Hennessy Funds Trust (the “Trust”), which was organized as a Delaware statutory trust on September 17, 1992. The Fund is an open-end management investment company registered under the Investment Company Act of 1940, as amended. The investment objective of the Fund is long-term growth of capital. The Fund is a diversified fund.
The Fund offers Investor Class and Institutional Class shares. Each class of shares differs principally in its respective 12b-1 distribution and service, shareholder servicing, and sub-transfer agent expenses. There are no sales charges. Each class has identical rights to earnings, assets, and voting privileges, except for class-specific expenses and exclusive rights to vote on matters affecting only one class.
As an investment company, the Fund follows the investment company accounting and reporting guidance of the Financial Accounting Standards Board (“FASB”) Accounting Standard Codification Topic 946 “Financial Services—Investment Companies.”
2). SIGNIFICANT ACCOUNTING POLICIES
The following is a summary of significant accounting policies consistently followed by the Fund in the preparation of the financial statements. These policies conform to U.S. generally accepted accounting principles (“GAAP”).
| a). | Securities Valuation – All investments in securities are valued in accordance with the Fund’s valuation policies and procedures, as described in Note 3. |
| b). | Federal Income Taxes – The Fund has elected to be taxed as a regulated investment company and intends to distribute substantially all of its taxable income to its shareholders and otherwise comply with the provisions of the Internal Revenue Code of 1986, as amended, applicable to regulated investment companies. As a result, the Fund has made no provision for federal income taxes or excise taxes. Net investment income/loss and realized gains/losses for federal income tax purposes may differ from those reported in the financial statements because of temporary book-basis and tax-basis differences. Temporary differences are primarily the result of the treatment of wash sales for tax reporting purposes. The Fund recognizes interest and penalties related to income tax benefits, if any, in the Statement of Operations as an income tax expense. Distributions from net realized gains for book purposes may include short-term capital gains, which are included as ordinary income to shareholders for tax purposes. The Fund may utilize equalization accounting for tax purposes and designate earnings and profits, including net realized gains distributed to shareholders on redemption of shares, as part of the dividends paid deduction for income tax purposes. |
| Due to inherent differences in the recognition of income, expenses, and realized gains/losses under GAAP and federal income tax regulations, permanent differences between book and tax basis for reporting are identified and appropriately reclassified in the Statement of Assets and Liabilities, as needed. The adjustments for fiscal year 2021 are as follows: |
| Total | |||
| Distributable | |||
Earnings | Capital Stock | ||
| $849,956 | $(849,956) |
| WWW.HENNESSYFUNDS.COM |
18
| NOTES TO THE FINANCIAL STATEMENTS |
| c). | Accounting for Uncertainty in Income Taxes – The Fund has accounting policies regarding recognition and measurement of tax positions taken or expected to be taken on a tax return. The tax returns of the Fund for the prior three fiscal years are open for examination. The Fund has reviewed all open tax years in major tax jurisdictions and concluded that there is no impact on the Fund’s net assets and no tax liability resulting from unrecognized tax benefits relating to uncertain income tax positions taken or expected to be taken on a tax return. The Fund’s major tax jurisdictions are U.S. federal and Delaware. |
| d). | Income and Expenses – Dividend income is recognized on the ex-dividend date or as soon as information is available to the Fund. Interest income, which includes the amortization of premium and accretion of discount, is recognized on an accrual basis. Market discounts, original issue discounts, and market premiums on debt securities are accreted or amortized to interest income over the life of a security with a corresponding increase or decrease, as applicable, in the cost basis of such security using the yield-to-maturity method or, where applicable, the first call date of the security. Other non-cash dividends are recognized as investment income at the fair value of the property received. The Fund is charged for those expenses that are directly attributable to its portfolio, such as advisory, administration, and certain shareholder service fees. Income, expenses (other than expenses attributable to a specific class), and realized and unrealized gains/losses on investments are allocated to each class of shares based on such class’s net assets. |
| e). | Distributions to Shareholders – Dividends from net investment income for the Fund, if any, are declared and paid annually, usually in December. Distributions of net realized capital gains, if any, are declared and paid annually, usually in December. |
| f). | Security Transactions – Investment and shareholder transactions are recorded on the trade date. The Fund determines the realized gain/loss from an investment transaction by comparing the original cost of the security lot sold with the net sale proceeds. Discounts and premiums on securities purchased are accreted or amortized, respectively, over the life of each such security. |
| g). | Use of Estimates – Preparing financial statements in accordance with GAAP requires management to make estimates and assumptions that affect the reported amounts of assets and liabilities and disclosure of contingent assets and liabilities at the date of the financial statements, as well as the reported change in net assets during the reporting period. Actual results could differ from those estimates. |
| h). | Share Valuation – The net asset value (“NAV”) per share of the Fund is calculated by dividing (i) the total value of the securities held by the Fund, plus cash and other assets, minus all liabilities (including estimated accrued expenses) by (ii) the total number of Fund shares outstanding, rounded to the nearest $0.01. Fund shares are not priced on days the New York Stock Exchange is closed for trading. The offering and redemption price per share for the Fund is equal to the Fund’s NAV per share. |
| i). | Recent Accounting Pronouncements and Regulatory Updates – In October 2020, the Securities and Exchange Commission (“SEC”) adopted new regulations governing the use of derivatives by registered investment companies (“Rule 18f-4”). Rule 18f-4 imposes limits on the amount of derivatives a fund can enter into, eliminates the asset segregation framework currently used by funds to comply with Section 18 of the 1940 Act, and requires funds whose use of derivatives is greater than a limited specified amount to establish and maintain a comprehensive derivatives risk management program and appoint a derivatives risk manager. Funds are required to comply with Rule 18f-4 by August 19, 2022. The impact, if any, that Rule 18f-4 will |
| HENNESSY FUNDS | 1-800-966-4354 |
19
| have on the availability, liquidity, and performance of derivatives is unclear. Management is currently evaluating the potential impact of Rule 18f-4 on the Fund. When fully implemented, Rule 18f-4 may require changes in how the Fund uses derivatives, adversely affect the Fund’s performance, and increase costs related to the Fund’s use of derivatives. | |
| In December 2020, the SEC adopted a new rule providing a framework for fund valuation practices (“Rule 2a-5”). Rule 2a-5 establishes requirements for determining fair value in good faith for purposes of the 1940 Act. Rule 2a-5 permits fund boards to designate certain parties to perform fair value determinations, subject to board oversight and certain other conditions. Rule 2a-5 also defines when market quotations are “readily available” for purposes of the 1940 Act and the threshold for determining whether a fund must fair value a security. In connection with Rule 2a-5, the SEC also adopted related recordkeeping requirements and is rescinding previously issued guidance, including with respect to the role of a board in determining fair value and the accounting and auditing of fund investments. Funds must comply with the rules by September 8, 2022. Management is currently assessing the potential impact of the new rules on the Fund’s financial statements. |
3). SECURITIES VALUATION
The Fund follows its valuation policies and procedures in determining its net asset value and, in preparing these financial statements, the fair value accounting standards that establish an authoritative definition of fair value and set out a hierarchy for measuring fair value. These standards require additional disclosures about the various inputs and valuation techniques used to develop the measurements of fair value and a discussion of changes in valuation techniques and related inputs during the period. These inputs are summarized in the three broad levels listed below:
| Level 1 – | Unadjusted, quoted prices in active markets for identical instruments that the Fund has the ability to access at the date of measurement. | |
| Level 2 – | Other significant observable inputs (including, but not limited to, quoted prices in active markets for similar instruments, quoted prices in markets that are not active for identical or similar instruments, and model-derived valuations in which all significant inputs and significant value drivers are observable in active markets, such as interest rates, prepayment speeds, credit risk curves, default rates, and similar data). | |
| Level 3 – | Significant unobservable inputs (including the Fund’s own assumptions about what market participants would use to price the asset or liability based on the best available information) when observable inputs are unavailable. |
The following is a description of the valuation techniques applied to the Fund’s major categories of assets and liabilities on a recurring basis:
Equity Securities – Equity securities, including common stocks, preferred stocks, exchange-traded funds, closed-end mutual funds, partnerships, rights, and real estate investment trusts, that are traded on a securities exchange for which a last-quoted sales price is readily available generally are valued at the last sales price as reported by the primary exchange on which the securities are listed. Securities listed on The NASDAQ Stock Market (“NASDAQ”) generally are valued at the NASDAQ Official Closing Price, which may differ from the last sales price reported. Securities traded on a securities exchange for which a last-quoted sales price is not readily available generally are valued at the mean between the bid and ask prices. To the extent these securities are actively traded and valuation adjustments are not applied, they are classified in Level 1 of the fair value hierarchy. |
| WWW.HENNESSYFUNDS.COM |
20
| NOTES TO THE FINANCIAL STATEMENTS |
Registered Investment Companies – Investments in open-end registered investment companies, commonly referred to as mutual funds, generally are priced at the ending NAV provided by the applicable mutual fund’s service agent and are classified in Level 1 of the fair value hierarchy. | |
Debt Securities – Debt securities, including corporate bonds, asset-backed securities, mortgage-backed securities, municipal bonds, U.S. Treasuries, and U.S. government agency issues, are generally valued at market on the basis of valuations furnished by an independent pricing service that utilizes both dealer-supplied valuations and formula-based techniques. The pricing service may consider recently executed transactions in securities of the issuer or comparable issuers, market price quotations (where observable), bond spreads, and fundamental data relating to the issuer. In addition, the model may incorporate observable market data, such as reported sales of similar securities, broker quotes, yields, bids, offers, and reference data. Certain securities are valued primarily using dealer quotations. These securities are generally classified in Level 2 of the fair value hierarchy. | |
Short-Term Securities – Short-term equity investments, including money market funds, are valued in the manner specified above for equity securities. Short-term debt investments with an original term to maturity of 60 days or less are valued at amortized cost, which approximates fair market value. If the original term to maturity of a short-term debt investment exceeds 60 days, then the values as of the 61st day prior to maturity are amortized. Amortized cost is not used if its use would be inappropriate due to credit or other impairments of the issuer, in which case the security’s fair value would be determined as described below. Short-term securities are generally classified in Level 1 or Level 2 of the fair value hierarchy depending on the inputs used and market activity levels for specific securities. |
The Board of Trustees of the Fund (the “Board”) has adopted fair value pricing procedures that are followed when a price for a security is not readily available or if a significant event has occurred that indicates the closing price of a security no longer represents the true value of that security. Fair value pricing determinations are made in good faith in accordance with these procedures. There are numerous criteria considered in determining a fair value of a security, such as the trading volume of a security and markets, the values of other similar securities, and news events with direct bearing on a security or markets. Fair value pricing results in an estimated price for a security that reflects the amount the Fund might reasonably expect to receive in a current sale. Depending on the relative significance of the valuation inputs, these securities may be classified in either Level 2 or Level 3 of the fair value hierarchy.
The Board has delegated day-to-day valuation matters to the Valuation and Liquidity Committee comprising representatives from Hennessy Advisors, Inc., the Fund’s investment advisor (the “Advisor”). The function of the Valuation and Liquidity Committee, among other things, is to value securities where current and reliable market quotations are not readily available. All actions taken by the Valuation and Liquidity Committee are reviewed by the Board.
The Fund has performed an analysis of all existing investments to determine the significance and character of all inputs to their fair value determinations. Various inputs are used to determine the value of the Fund’s investments. The inputs or methodology used for valuing securities are not necessarily an indication of the risk associated with investing in those securities. Details related to the fair value hierarchy of the Fund’s securities as of October 31, 2021, are included in the Schedule of Investments.
| HENNESSY FUNDS | 1-800-966-4354 |
21
4). INVESTMENT TRANSACTIONS
Purchases and sales of investment securities (excluding government and short-term investments) for the Fund during fiscal year 2021 were $0 and $84,356,557, respectively.
There were no purchases or sales/maturities of long-term U.S. government securities for the Fund during fiscal year 2021.
5). INVESTMENT ADVISORY FEE AND OTHER TRANSACTIONS WITH AFFILIATES
The Advisor provides the Fund with investment advisory services under an Investment Advisory Agreement. The Advisor furnishes all investment advice, office space, and facilities and most of the personnel needed by the Fund. As compensation for its services, the Advisor is entitled to a monthly fee from the Fund. The fee is based on the average daily net assets of the Fund at an annual rate of 0.74%. The net investment advisory fees expensed by the Fund during fiscal year 2021 are included in the Statement of Operations.
The Board has approved a Shareholder Servicing Agreement for Investor Class shares of the Fund, which compensates the Advisor for the non-investment advisory services it provides to the Fund. The Shareholder Servicing Agreement provides for a monthly fee paid to the Advisor at an annual rate of 0.10% of the average daily net assets of the Fund attributable to Investor Class shares. The shareholder service fees expensed by the Fund during fiscal year 2021 are included in the Statement of Operations.
The Fund has adopted a plan pursuant to Rule 12b-1 under the Investment Company Act of 1940, as amended, that authorizes payments in connection with the distribution of Fund shares at an annual rate of up to 0.25% of the Fund’s average daily net assets attributable to Investor Class shares. Even though the authorized rate is up to 0.25%, the Fund is currently only using up to 0.15% of its average daily net assets attributable to Investor Class shares for such purpose. Amounts paid under the plan may be spent on any activities or expenses primarily intended to result in the sale of shares, including, but not limited to, advertising, shareholder account servicing, printing and mailing of prospectuses to other than current shareholders, printing and mailing of sales literature, and compensation for sales and marketing activities or to financial institutions and others, such as dealers and distributors. The distribution fees expensed by the Fund during fiscal year 2021 are included in the Statement of Operations.
The Fund has entered into agreements with various brokers, dealers, and financial intermediaries in connection with the sale of Fund shares. The agreements provide for periodic payments of sub-transfer agent expenses by the Fund to the brokers, dealers, and financial intermediaries for providing certain shareholder maintenance services. These shareholder services include the pre-processing and quality control of new accounts, shareholder correspondence, answering customer inquiries regarding account status, and facilitating shareholder telephone transactions. The sub-transfer agent fees expensed by the Fund during fiscal year 2021 are included in the Statement of Operations.
U.S. Bancorp Fund Services, LLC, d/b/a U.S. Bank Global Fund Services (“Fund Services”) provides the Fund with administrative, accounting, and transfer agent services. As administrator, Fund Services is responsible for activities such as (i) preparing various federal and state regulatory filings, reports, and returns for the Fund, (ii) preparing reports and materials to be supplied to the Board, (iii) monitoring the activities of the Fund’s custodian, transfer agent, and accountants, and (iv) coordinating the preparation and payment of the Fund’s expenses and reviewing the Fund’s expense accruals. U.S. Bank N.A., an affiliate of Fund Services, serves as the Fund’s custodian. The servicing agreements between the Trust, Fund Services, and U.S. Bank N.A. contain a fee schedule that is inclusive of administrative, accounting, custody, and transfer agent fees. The
| WWW.HENNESSYFUNDS.COM |
22
| NOTES TO THE FINANCIAL STATEMENTS |
administrative, accounting, custody, and transfer agent fees expensed by the Fund during fiscal year 2021 are included in the Statement of Operations.
Quasar Distributors, LLC (“Quasar”), a wholly owned broker-dealer subsidiary of Foreside Financial Group, LLC (“Foreside”), acts as the Fund’s principal underwriter in a continuous public offering of Fund shares. Effective September 30, 2021, Genstar Capital, a private equity firm specializing in financial and related business service companies, acquired a majority interest in Foreside. The Board approved a new Distribution Agreement to enable Quasar to continue serving as the Fund’s distributor following the change in control of Foreside.
The officers of the Fund are affiliated with the Advisor. With the exception of the Chief Compliance Officer and the Senior Compliance Officer, such officers receive no compensation from the Fund for serving in their respective roles. The Fund, along with the other funds in the Hennessy Funds family (collectively, the “Hennessy Funds”), makes reimbursement payments on an equal basis to the Advisor for a portion of the salary and benefits associated with the office of the Chief Compliance Officer and for all of the salary and benefits associated with the office of the Senior Compliance Officer. The compliance fees expensed by the Fund during fiscal year 2021 are included in the Statement of Operations.
6). GUARANTEES AND INDEMNIFICATIONS
Under the Hennessy Funds’ organizational documents, their officers and trustees are indemnified by the Hennessy Funds against certain liabilities arising out of the performance of their duties to the Hennessy Funds. Additionally, in the normal course of business, the Hennessy Funds enter into contracts with service providers that contain general indemnification clauses. The Fund’s maximum exposure under these arrangements is unknown as this would involve future claims that may be made against the Fund that have not yet occurred. Currently, the Fund expects the risk of loss to be remote.
7). LINE OF CREDIT
The Fund has an uncommitted line of credit with the other Hennessy Funds in the amount of the lesser of (i) $100,000,000 or (ii) 33.33% of each Hennessy Fund’s net assets, or 30% for the Hennessy Gas Utility Fund and 10% for the Hennessy Balanced Fund. The line of credit is intended to provide any necessary short-term financing in connection with shareholder redemptions, subject to certain restrictions. The credit facility is with the Hennessy Funds’ custodian bank, U.S. Bank N.A. Borrowings under this arrangement bear interest at the bank’s prime rate and are secured by all of the Fund’s assets (as to its own borrowings only). During fiscal year 2021, the Fund had an outstanding average daily balance and a weighted average interest rate of $34,178 and 3.25%, respectively. The interest expensed by the Fund during fiscal year 2021 is included in the Statement of Operations. The maximum amount outstanding for the Fund during fiscal year 2021 was $2,642,000. As of October 31, 2021, the Fund did not have any borrowings outstanding under the line of credit.
| HENNESSY FUNDS | 1-800-966-4354 |
23
8). FEDERAL TAX INFORMATION
As of October 31, 2021, the components of accumulated earnings (losses) for income tax purposes were as follows:
| Investments | ||||
| Cost of investments for tax purposes | $ | 259,999,096 | ||
| Gross tax unrealized appreciation | $ | 139,260,695 | ||
| Gross tax unrealized depreciation | (9,906,846 | ) | ||
| Net tax unrealized appreciation/(depreciation) | $ | 129,353,849 | ||
| Undistributed ordinary income | $ | — | ||
| Undistributed long-term capital gains | — | |||
| Total distributable earnings | $ | — | ||
| Other accumulated gain/(loss) | $ | (33,268,734 | ) | |
| Total accumulated gain/(loss) | $ | 96,085,115 | ||
The difference between book-basis unrealized appreciation/depreciation and tax-basis unrealized appreciation/depreciation (as shown above) is attributable primarily to wash sales.
As of October 31, 2021, the Fund had $1,788,004 in unlimited long-term and $29,422,950 in unlimited short-term capital loss carryforwards. During fiscal year 2021, the capital losses utilized by the Fund were $20,127,731.
Capital losses sustained in or after fiscal year 2012 can be carried forward indefinitely, but any such loss retains the character of the original loss and must be utilized prior to any loss incurred before fiscal year 2012. As a result of this ordering rule, capital loss carryforwards incurred prior to fiscal year 2012 may be more likely to expire unused. Capital losses sustained prior to fiscal year 2012 can be carried forward for eight years and can be carried forward as short-term capital losses regardless of the character of the original loss.
As of October 31, 2021, the Fund deferred, on a tax basis, a late-year ordinary loss of $2,057,780. Late-year ordinary losses are net ordinary losses incurred after December 31, 2020, but within the taxable year, that are deemed to arise on the first day of the Fund’s next taxable year.
During fiscal years 2021 and 2020, the Fund did not pay any distributions.
9). EVENTS SUBSEQUENT TO YEAR END
Management has evaluated the Fund’s related events and transactions that occurred subsequent to October 31, 2021, through the date of issuance of the Fund’s financial statements. Management has determined that there were no subsequent events requiring recognition or disclosure in the financial statements.
| WWW.HENNESSYFUNDS.COM |
24
| NOTES/REPORT OF INDEPENDENT REGISTERED PUBLIC ACCOUNTING FIRM |
Report of Independent Registered Public
Accounting Firm
To the Board of Trustees of Hennessy Funds Trust
and the shareholders of the Hennessy Cornerstone Mid Cap 30 Fund
Novato, CA
Opinion on the Financial Statements
We have audited the accompanying statement of assets and liabilities of the Hennessy Cornerstone Mid Cap 30 Fund (the “Fund”), a series of Hennessy Funds Trust, including the schedule of investments, as of October 31, 2021, the related statement of operations for the year then ended, the statements of changes in net assets for each of the two years in the period then ended, the financial highlights for each of the five years in the period then ended, and the related notes (collectively referred to as the “financial statements”). In our opinion, the financial statements present fairly, in all material respects, the financial position of the Fund as of October 31, 2021, the results of its operations for the year then ended, the changes in its net assets for each of the two years in the period then ended, and the financial highlights for each of the five years in the period then ended in conformity with accounting principles generally accepted in the United States of America.
Basis for Opinion
These financial statements are the responsibility of the Fund’s management. Our responsibility is to express an opinion on the Fund’s financial statements based on our audits. We are a public accounting firm registered with the Public Company Accounting Oversight Board (United States) (“PCAOB”) and are required to be independent with respect to the Fund in accordance with the U.S. federal securities laws and the applicable rules and regulations of the Securities and Exchange Commission and the PCAOB. We have served as the auditor of one or more of the funds in the Trust since 2002.
We conducted our audits in accordance with the standards of the PCAOB. Those standards require that we plan and perform the audit to obtain reasonable assurance about whether the financial statements are free of material misstatement, whether due to error or fraud. The Fund is not required to have, nor were we engaged to perform, an audit of its internal control over financial reporting. As part of our audits we are required to obtain an understanding of internal control over financial reporting, but not for the purpose of expressing an opinion on the effectiveness of the Fund’s internal control over financial reporting. Accordingly, we express no such opinion.
Our audits included performing procedures to assess the risks of material misstatement of the financial statements, whether due to error or fraud, and performing procedures that respond to those risks. Such procedures included examining, on a test basis, evidence regarding the amounts and disclosures in the financial statements. Our audits also included evaluating the accounting principles used and significant estimates made by management, as well as evaluating the overall presentation of the financial statements. Our procedures included confirmation of securities owned as of October 31, 2021 by correspondence with the custodian. We believe that our audits provide a reasonable basis for our opinion.
| |
| TAIT, WELLER & BAKER LLP |
Philadelphia, Pennsylvania
December 22, 2021
| HENNESSY FUNDS | 1-800-966-4354 |
25
Trustees and Officers of the Fund (Unaudited)
The business and affairs of the Funds are managed under the direction of the Board of Trustees of the Trust, and the Board of Trustees elects the officers of the Trust. From time to time, the Board of Trustees also has appointed advisers to the Board of Trustees (“Advisers”) with the intention of having qualified individuals serve in an advisory capacity to garner experience in the mutual fund and asset management industry and be considered as potential Trustees in the future. There are currently two Advisers, Brian Alexander and Doug Franklin. As Advisers, Mr. Alexander and Mr. Franklin attend meetings of the Board of Trustees and act as non-voting participants. Information pertaining to the Trustees, Advisers, and the officers of the Trust is set forth below. The Trustees and officers serve until their successors are duly elected and qualified or until their earlier death, resignation, or removal. Each Trustee oversees all 16 Hennessy Funds. Unless otherwise indicated, the address of all persons listed below is 7250 Redwood Boulevard, Suite 200, Novato, CA 94945. The Fund’s Statement of Additional Information includes more information about the persons listed below and is available without charge by calling 1-800-966-4354 or by visiting www.hennessyfunds.com.
| Other | |||
| Directorships | |||
| Held Outside | |||
| Name, Age, | of Fund | ||
| and Position Held | Start Date | Principal Occupation(s) | Complex During |
with the Trust | of Service | During Past Five Years | Past Five Years |
| Disinterested Trustees and Advisers | |||
| J. Dennis DeSousa | January 1996 | Mr. DeSousa is a real estate investor. | None. |
| 85 | |||
| Trustee | |||
| Robert T. Doyle | January 1996 | Mr. Doyle has been the Sheriff of | None. |
| 74 | Marin County, California since 1996. | ||
| Trustee | |||
| Claire Garvie | December 2015 | Ms. Garvie is a founder of Kiosk and | None. |
| 47 | as an Adviser | has served as its Chief Operating | |
| Trustee | to the Board | Officer since 2004. Kiosk is a full- | |
| and | service marketing agency with | ||
| December 2021 | offices in the San Francisco Bay Area, | ||
| as a Trustee | Toronto, and Liverpool, UK. | ||
| Gerald P. Richardson | May 2004 | Mr. Richardson is an independent | None. |
| 76 | consultant in the securities industry. | ||
| Trustee |
| WWW.HENNESSYFUNDS.COM |
26
| TRUSTEES AND OFFICERS OF THE FUND |
| Other | |||
| Directorships | |||
| Held Outside | |||
| Name, Age, | of Fund | ||
| and Position Held | Start Date | Principal Occupation(s) | Complex During |
with the Trust | of Service | During Past Five Years | Past Five Years |
| Brian Alexander | March 2015 | Mr. Alexander has worked for the | None. |
| 40 | Sutter Health organization since | ||
| Adviser to the Board | 2011 in various positions. He has | ||
| served as the Chief Executive Officer | |||
| of the Sutter Roseville Medical | |||
| Center since 2018. From 2016 through | |||
| 2018, he served as the Vice President | |||
| of Strategy for the Sutter Health Valley | |||
| Area, which includes 11 hospitals, | |||
| 13 ambulatory surgery centers, | |||
| 16,000 employees, and 1,900 physicians. | |||
| From 2013 through 2016, Mr. Alexander | |||
| served as Sutter Novato Community | |||
| Hospital’s Chief Administrative Officer. | |||
| Doug Franklin | March 2016 | Mr. Franklin is a retired insurance | None. |
| 57 | industry executive. From 1987 | ||
| Adviser to the Board | through 2015, he was employed | ||
| by the Allianz-Fireman’s Fund | |||
| Insurance Company in various | |||
| positions, including as its Chief | |||
| Actuary and Chief Risk Officer. | |||
Interested Trustee(1) | |||
| Neil J. Hennessy | January 1996 as | Mr. Hennessy has been employed | Hennessy |
| 65 | a Trustee and | by Hennessy Advisors, Inc. since | Advisors, Inc. |
| Chairman of the Board, | June 2008 as | 1989 and currently serves as its | |
| Chief Market Strategist, | an officer | Chairman and Chief Executive Officer. | |
| Portfolio Manager, | |||
| and President |
| Name, Age, | ||
| and Position Held | Start Date | Principal Occupation(s) |
with the Trust | of Service | During Past Five Years |
| Officers | ||
| Teresa M. Nilsen | January 1996 | Ms. Nilsen has been employed by Hennessy Advisors, Inc. |
| 55 | since 1989 and currently serves as its President and Chief | |
| Executive Vice President | Operating Officer. | |
| and Treasurer | ||
| Daniel B. Steadman | March 2000 | Mr. Steadman has been employed by Hennessy Advisors, Inc. |
| 65 | since 2000 and currently serves as its Executive Vice President. | |
| Executive Vice President | ||
| and Secretary | ||
| Brian Carlson | December 2013 | Mr. Carlson has been employed by Hennessy Advisors, Inc. |
| 49 | since December 2013 and currently serves as its Chief | |
| Senior Vice President | Compliance Officer and Senior Vice President. | |
| and Head of Distribution |
| HENNESSY FUNDS | 1-800-966-4354 |
27
| Name, Age, | ||
| and Position Held | Start Date | Principal Occupation(s) |
with the Trust | of Service | During Past Five Years |
Jennifer Cheskiewicz(2) | June 2013 | Ms. Cheskiewicz has been employed by Hennessy Advisors, Inc. |
| 44 | as its General Counsel since June 2013. | |
| Senior Vice President and | ||
| Chief Compliance Officer | ||
David Ellison(3) | October 2012 | Mr. Ellison has been employed by Hennessy Advisors, Inc. since |
| 63 | October 2012. He has served as a Portfolio Manager of the | |
| Senior Vice President | Hennessy Large Cap Financial Fund and the Hennessy Small | |
| and Portfolio Manager | Cap Financial Fund since their inception. Mr. Ellison also served | |
| as a Portfolio Manager of the Hennessy Technology Fund from | ||
| its inception until February 2017. Mr. Ellison served as Director, | ||
| CIO, and President of FBR Fund Advisers, Inc. from December | ||
| 1999 to October 2012. | ||
Ryan Kelley(4) | March 2013 | Mr. Kelley has been employed by Hennessy Advisors, Inc. since |
| 49 | October 2012. He has served as Chief Investment Officer of the | |
| Chief Investment Officer, | Hennessy Funds since March 2021 and has served as a Portfolio | |
| Senior Vice President, | Manager of the Hennessy Gas Utility Fund, the Hennessy Large | |
| and Portfolio Manager | Cap Financial Fund, and the Hennessy Small Cap Financial Fund | |
| since October 2014. Mr. Kelley served as Co-Portfolio Manager | ||
| of these same funds from March 2013 through September | ||
| 2014 and as a Portfolio Analyst for the Hennessy Funds from | ||
| October 2012 through February 2013. He has also served as a | ||
| Portfolio Manager of the Hennessy Cornerstone Growth Fund, | ||
| the Hennessy Cornerstone Mid Cap 30 Fund, the Hennessy | ||
| Cornerstone Large Growth Fund, and the Hennessy | ||
| Cornerstone Value Fund since February 2017 and as a Portfolio | ||
| Manager of the Hennessy Total Return Fund, the Hennessy | ||
| Balanced Fund, and the Hennessy Technology Fund since May | ||
| 2018. He served as Co-Portfolio Manager of the Hennessy | ||
| Technology Fund from February 2017 until May 2018. Mr. Kelley | ||
| served as Portfolio Manager of FBR Fund Advisers, Inc. from | ||
| January 2008 to October 2012. | ||
L. Joshua Wein(4) | September 2018 | Mr. Wein has been employed by Hennessy Advisors, Inc. since |
| 48 | 2018. He has served as Co-Portfolio Manager of the Hennessy | |
| Vice President and | Cornerstone Growth Fund, the Hennessy Cornerstone | |
| Co-Portfolio Manager | Mid Cap 30 Fund, the Hennessy Cornerstone Large Growth | |
| Fund, the Hennessy Cornerstone Value Fund, Hennessy Total | ||
| Return Fund, the Hennessy Balanced Fund, the Hennessy Gas | ||
| Utility Fund, and the Hennessy Technology Fund since February | ||
| 2019. He served as a Senior Analyst of these same funds from | ||
| September 2018 through February 2019. Mr. Wein served as | ||
| Director of Alternative Investments and Co-Portfolio Manager | ||
| at Sterling Capital Management from 2008 to 2018. |
_______________
(1) | Mr. Hennessy is considered an “interested person,” as defined in the Investment Company Act of 1940, as amended, because he is an officer of the Trust. |
(2) | The address of this officer is 4800 Bee Caves Road, Suite 100, Austin, TX 78746. |
(3) | The address of this officer is 101 Federal Street, Suite 1615B, Boston, MA 02110. |
(4) | The address of this officer is 1340 Environ Way, Chapel Hill, NC 27517. |
| WWW.HENNESSYFUNDS.COM |
28
| TRUSTEES AND OFFICERS OF THE FUND |
(This Page Intentionally Left Blank.)
| HENNESSY FUNDS | 1-800-966-4354 |
29
Expense Example (Unaudited)
October 31, 2021
As a shareholder of the Fund, you incur ongoing costs, including management fees, service fees, and other Fund expenses. This Example is intended to help you understand your ongoing costs (in dollars) of investing in the Fund and to compare these costs with the ongoing costs of investing in other mutual funds. The Example is based on an investment of $1,000 invested at the beginning of the period and held for the entire period from May 1, 2021, through October 31, 2021.
Actual Expenses
In the table below, the first line under each of the “Investor Class” and “Institutional Class” headings provides information about actual account values and actual expenses for each share class. You may use this information, together with the amount you invested, to estimate the expenses that you paid over the period. Simply divide your account value by $1,000 (for example, an $8,600 account value divided by $1,000 = 8.6), then multiply the result by the number in the first line under the heading “Expenses Paid During Period” to estimate the expenses you paid on your account during this period. Although the Fund charges no sales loads or transaction fees, you will be assessed fees for outgoing wire transfers, returned checks, and stop payment orders at prevailing rates charged by U.S. Bank Global Fund Services, the Fund’s transfer agent. If you request that a redemption be made by wire transfer, the Fund’s transfer agent charges a $15 fee. IRAs are charged a $15 annual maintenance fee (up to $30 maximum per shareholder for shareholders with multiple IRAs). The examples below include, but are not limited to, management, shareholder servicing, accounting, custody, and transfer agent fees. However, the examples below do not include portfolio trading commissions and related expenses.
Hypothetical Example for Comparison Purposes
In the table below, the second line under each of the “Investor Class” and “Institutional Class” headings provides information about hypothetical account values and hypothetical expenses based on the Fund’s actual expense ratio for each share class and an assumed rate of return of 5% per year before expenses, which is not the Fund’s actual return for such share class. The hypothetical account values and expenses may not be used to estimate the actual ending account balance or expenses you paid for the period. You may use this information to compare the ongoing costs of investing in the Fund and other funds. To do so, compare these 5% hypothetical examples with the 5% hypothetical examples that appear in the shareholder reports of the other funds. Please note that the expenses shown in the table are meant to highlight your ongoing costs only. Therefore, the second lines under “Investor Class” and “Institutional Class” are useful in comparing ongoing costs only and will not help you determine the relative total costs of owning different funds.
| WWW.HENNESSYFUNDS.COM |
30
| EXPENSE EXAMPLE |
| Expenses Paid | |||
| Beginning | Ending | During Period(1) | |
| Account Value | Account Value | May 1, 2021 – | |
May 1, 2021 | October 31, 2021 | October 31, 2021 | |
| Investor Class | |||
| Actual | $1,000.00 | $ 997.00 | $6.85 |
| Hypothetical (5% return before expenses) | $1,000.00 | $1,018.35 | $6.92 |
| Institutional Class | |||
| Actual | $1,000.00 | $ 998.60 | $4.99 |
| Hypothetical (5% return before expenses) | $1,000.00 | $1,020.21 | $5.04 |
(1) | Expenses are equal to the Fund’s annualized expense ratio of 1.36% for Investor Class shares or 0.99% for Institutional Class shares, as applicable, multiplied by the average account value over the period, multiplied by 184/365 days (to reflect the half-year period). |
| HENNESSY FUNDS | 1-800-966-4354 |
31
How to Obtain a Copy of the Fund’s Proxy
Voting Policy and Proxy Voting Records
A description of the policies and procedures the Fund uses to determine how to vote proxies relating to portfolio securities is available without charge (1) by calling 1-800-966-4354, (2) on the Hennessy Funds’ website at www.hennessyfunds.com/proxy-voting/voting-policy, or (3) on the U.S. Securities and Exchange Commission’s (the “SEC”) website at www.sec.gov. The Fund’s proxy voting record is available without charge on both the Hennessy Funds’ website at www.hennessyfunds.com/proxy-voting/voting-record and the SEC’s website at www.sec.gov no later than August 31 for the prior 12 months ending June 30.
Availability of Quarterly Portfolio Schedule
The Fund files a complete schedule of portfolio holdings with the SEC for the first and third quarters of each fiscal year as an exhibit to its reports on Form N-PORT. The Fund’s Form N-PORT reports are available on the SEC’s website at www.sec.gov or on request by calling 1-800-966-4354.
Important Notice Regarding Delivery
of Shareholder Documents
To help keep the Fund’s costs as low as possible, we generally deliver a single copy of shareholder reports, proxy statements, and prospectuses to shareholders who share an address and have the same last name. This process does not apply to account statements. You may request an individual copy of a shareholder document at any time. If you would like to receive separate mailings of shareholder documents, please call U.S. Bank Global Fund Services at 1-800-261-6950 or 1-414-765-4124, and individual delivery will begin within 30 days of your request. If your account is held through a financial institution or other intermediary, please contact such intermediary directly to request individual delivery.
Electronic Delivery
As permitted by SEC regulations, the Fund’s shareholder reports are made available on a website, and unless you sign up for eDelivery or elect to receive paper copies as detailed below, you will be notified by mail each time a report is posted and provided with a website link to access the report.
The Fund also offers shareholders the option to receive all notices, account statements, prospectuses, tax forms, and shareholder reports online. To sign up for eDelivery or change your delivery preference, please visit www.hennessyfunds.com/account.
To elect to receive paper copies of all future reports free of charge, please call U.S. Bank Global Fund Services at 1-800-261-6950 or 1-414-765-4124.
Subscribe to receive our team’s unique market and sector insights delivered to your inbox
www.hennessyfunds.com/subscribe
Follow us on social media
| | |
| WWW.HENNESSYFUNDS.COM |
32
| PROXY VOTING — PRIVACY POLICY |
Liquidity Risk Management Program
In accordance with Rule 22e-4 under the Investment Company Act of 1940, as amended (the “Liquidity Rule”), we have adopted and implemented a liquidity risk management program (the “Liquidity Program”). The purpose of the Liquidity Program is to assess and manage the Fund’s liquidity risk, which is the risk that the Fund would not be able to meet requests to redeem Fund shares without significant dilution of the remaining shareholders’ interests in the Fund. The Board of Trustees of the Fund (the “Board”) designated a committee comprising representatives of Hennessy Advisors, Inc., the investment adviser to the Fund, as the administrator of the Liquidity Program (the “Program Administrator”).
The Program Administrator provided a written report regarding the Liquidity Program to the Board in advance of its meeting on June 2, 2021. The report covered the period from June 1, 2020, through May 31, 2021. The report addressed the operation of the Liquidity Program, assessed the adequacy and effectiveness of its implementation, and described any material changes to the Liquidity Program during the review period. The Trust’s chief compliance officer presented the report to the Board at the meeting and provided additional information regarding the Liquidity Program. The Board reviewed the Liquidity Program and considered, among other items, the following:
| 1. | The Program Administrator reviewed daily historical net redemption activity during the review period and during prior periods with higher-than-average redemption activity and concluded that the Fund has historically been able to meet requests to redeem Fund shares without significant dilution to the Fund’s remaining shareholders, and the Program Administrator expects the Fund to be able to continue to do so in the future during both normal and reasonably foreseeable stressed conditions. | |
| 2. | The Fund holds assets that are highly liquid investments and is therefore not required to establish a highly liquid investment minimum for the Fund or adopt policies and procedures for responding to a highly liquid investment minimum shortfall. | |
| 3. | The Program Administrator did not make any material changes to the Liquidity Program during the review period and did not recommend any changes to the Liquidity Program or the model inputs used to determine the liquidity classification of each security held by the Fund. | |
| 4. | The Program Administrator concluded that the Liquidity Program was reasonably designed to assess and manage the Fund’s liquidity risk, complies with the requirements of the Liquidity Rule, and was operating as intended during the review period. |
Privacy Policy
We collect the following personal information about you:
| 1. | Information we receive from you in applications or other forms, correspondence, or conversations, including, but not limited to, your name, address, phone number, social security number, assets, income, and date of birth; | |
| 2. | Information about your transactions with us, our affiliates, or others, including, but not limited to, your account number and balance, payments history, parties to transactions, cost basis information, and other financial information; and |
| HENNESSY FUNDS | 1-800-966-4354 |
33
| 3. | Other personal information we collect from various sources, even if you have not entered into a prior transaction with us, including the following: |
| • | Name, alias, address, unique personal identifier, online identifier, IP address, email address, telephone number, account name, and other similar identifiers; | |
| • | Age and marital status; | |
| • | Commercial information, including records of products purchased; | |
| • | Browsing history, search history, and information on interaction with our website; | |
| • | Geolocation data; | |
| • | Employment and employment history, educational history, financial information, and purchasing and consuming histories or tendencies; and | |
| • | Inferences drawn from the above-listed information to create a profile about your preferences, characteristics, predispositions, and behavior. |
We collect this information directly from you, indirectly in the course of providing services to you, directly and indirectly from your activity on our website, from broker dealers, marketing agencies, and other third parties that interact with us in connection with the services we perform and products we offer, and from anonymized and aggregated consumer information.
We use this information to fulfill the reason you provided the information to us, to provide you with other relevant products that you request from us, to provide you with information about products that may interest you, to improve our website or present our website’s contents to you, and as otherwise described to you when collecting your personal information.
We do not disclose any personal information to unaffiliated third parties, except as permitted by law. We may disclose your personal information to our affiliates, vendors, and service providers for a business purpose. For example, we are permitted by law to disclose all of the information we collect, as described above, to our transfer agent to process your transactions. When disclosing your personal information to third parties, we enter into a contract with each third party describing the purpose of such disclosure and requiring that such personal information be kept confidential and not used for any purpose except to perform the services contracted or respond to regulatory or law enforcement requests.
Furthermore, we restrict access to your personal information to those persons who require such information to provide products or services to you. As a result, we do not provide a means for opting out of our limited sharing of your information. We maintain physical, electronic, and procedural safeguards that comply with federal standards to guard your personal information.
If you hold shares of the Funds through a financial intermediary, including, but not limited to, a broker-dealer, bank, or trust company, the privacy policy of your financial intermediary governs how your personal information is shared with unaffiliated third parties.
Supplemental Privacy Notice for Residents of California
The California Consumer Privacy Act of 2018 (the “CCPA”) provides you, as a California resident, with certain additional rights relating to your personal information.
| WWW.HENNESSYFUNDS.COM |
34
| PRIVACY POLICY |
Under the CCPA, you have the right to request that we disclose to you the categories of personal information we have collected about you over the past 12 months, the categories of sources of such information, our business purpose for collecting the information, the categories of third parties, if any, with whom we shared the information, and the specific information we have collected about you. You also have the right to request that we delete any of your personal information, and, unless an exception applies, we will delete such information upon receiving and confirming your request. To make a request, call us at 1-800-966-4354, email us at privacy@hennessyfunds.com, or go to www.hennessyfunds.com/contact. We will not discriminate against you for exercising your rights under the CCPA. Further, we will not collect additional categories of your personal information or use the personal information we collected for materially different, unrelated, or incompatible purposes without providing you notice.
| HENNESSY FUNDS | 1-800-966-4354 |
35
(This Page Intentionally Left Blank.)
For information, questions, or assistance, please call
The Hennessy Funds
1-800-966-4354 or 1-415-899-1555
INVESTMENT ADVISOR
Hennessy Advisors, Inc.
7250 Redwood Boulevard, Suite 200
Novato, California 94945
ADMINISTRATOR,
TRANSFER AGENT,
DIVIDEND PAYING AGENT, &
SHAREHOLDER SERVICING AGENT
U.S. Bancorp Fund Services, LLC
d/b/a U.S. Bank Global Fund Services
P.O. Box 701
Milwaukee, Wisconsin 53201-0701
CUSTODIAN
U.S. Bank N.A.
Custody Operations
1555 North River Center Drive, Suite 302
Milwaukee, Wisconsin 53212
TRUSTEES
Neil J. Hennessy
Robert T. Doyle
J. Dennis DeSousa
Claire Garvie
Gerald P. Richardson
COUNSEL
Foley & Lardner LLP
777 East Wisconsin Avenue
Milwaukee, Wisconsin 53202-5306
INDEPENDENT REGISTERED
PUBLIC ACCOUNTING FIRM
Tait, Weller & Baker LLP
Two Liberty Place
50 South 16th Street, Suite 2900
Philadelphia, Pennsylvania 19102-2529
DISTRIBUTOR
Quasar Distributors, LLC
111 East Kilbourn Avenue, Suite 2200
Milwaukee, Wisconsin 53202
www.hennessyfunds.com | 1-800-966-4354
This report has been prepared for shareholders and may be distributed to
others only if preceded or accompanied by a current prospectus.
ANNUAL REPORT
OCTOBER 31, 2021
HENNESSY CORNERSTONE LARGE GROWTH FUND
Investor Class HFLGX
Institutional Class HILGX
www.hennessyfunds.com | 1-800-966-4354
(This Page Intentionally Left Blank.)
Contents
| Letter to Shareholders | 2 |
| Performance Overview | 4 |
| Financial Statements | |
| Schedule of Investments | 7 |
| Statement of Assets and Liabilities | 11 |
| Statement of Operations | 12 |
| Statements of Changes in Net Assets | 13 |
| Financial Highlights | 14 |
| Notes to the Financial Statements | 18 |
| Report of Independent Registered Public Accounting Firm | 26 |
| Trustees and Officers of the Fund | 27 |
| Expense Example | 30 |
| Proxy Voting Policy and Proxy Voting Records | 32 |
| Availability of Quarterly Portfolio Schedule | 32 |
| Federal Tax Distribution Information | 32 |
| Important Notice Regarding Delivery of Shareholder Documents | 32 |
| Electronic Delivery | 32 |
| Liquidity Risk Management Program | 33 |
| Privacy Policy | 33 |
| HENNESSY FUNDS | 1-800-966-4354 |
December 2021
Dear Hennessy Funds Shareholder:
What a year this has been. While it doesn’t feel that we are out of the “pandemic” phase of the coronavirus crisis, we look forward to a day when we will eventually see fewer cases and potentially less severe variants. We feel extremely grateful to the many healthcare workers who have continued to work tirelessly during the recent surge. As we move through the next year, we hope that new U.S. cases will decline and that many other parts of the world will see improvements as well.
What a year this has been! As measured by the total return of the S&P 500® Index, as of October 31, 2021, the market was up 24.04% calendar year to date. This comes in the wake of a tumultuous 2020 in which the market plunged in the beginning of the pandemic and recovered dramatically to end the year up 18.40%. Interestingly, 18% appears to be a repeating number in the past dozen years. From the low point of the Financial Crisis (March 9, 2009) to the high point reached just prior to the COVID-19 pandemic (February 12, 2020), the S&P 500® Index was up 18.27% per year. We are well aware that past results are not predictive of the future, and we find ourselves naturally skeptical of such strong returns. But, as shown in the chart below, we find that the most common annual total returns of the market over the past 102 years range between 20% and 30% with the second most common being between 10% and 20%:
Source: Bloomberg L.P.
We will say it again, after showing a chart like the one above: Past results are not predictive of the future. Instead, we look at where we are right now – in the economy, in the market, in the business cycle – to reflect on where we have come from and where we may be going. U.S. GDP is strong and growing, interest rates remain low, and earnings growth and profitability remain robust. We believe stocks are trading at reasonable valuations when viewed as a whole, with the S&P 500® Index at 21.0x estimated earnings for 2022. Furthermore, we believe corporate balance sheets are healthy, with high levels of excess cash, which could support growth, increases in dividends, more share buybacks, and future acquisitions. Uncertainty and volatility can manifest at any time in the stock market, and the current market is no different. Investors have questions about inflation, worldwide supply chain issues, and what could drive the next boost in earnings. While these concerns are warranted, we continue to believe that overall the positives outweigh the negatives, and here at Hennessy we continue to see opportunity in the market and in our Funds.
| WWW.HENNESSYFUNDS.COM |
2
| LETTER TO SHAREHOLDERS |
What a (fiscal) year this has been!!! For our fiscal year ended October 31, 2021, the S&P 500® Index rose 42.91% on a total return basis, setting a new all-time high on the final day of the period. Except for a short 21-trading-day period that began on September 2 during which the market fell 5.13% only to rebound to new highs just 13 trading days later, the market has been on a continuous march higher. We saw a dramatic shift in market leadership as many of the sectors that underperformed during our last fiscal year soared in fiscal year 2021. Small-caps beat mid-caps, which in turn beat large-caps. The Energy and Financials sectors skyrocketed during the 12-month period, as reflected by the S&P 500® Energy Sector’s total return of 111.29% and the Russell 1000® Index Financials’ total return of 70.87%. Both of these sectors were among the worst performing in our fiscal year 2020, so a bounce back in our fiscal year 2021, while not a foregone conclusion, was a distinct possibility.
Overall, we are pleased with the performance of our mutual funds during the fiscal year. On an absolute basis, each of our 16 Funds achieved total returns greater than 10% and seven outperformed their primary benchmark. Ten of our 11 domestic equity-only Funds outperformed the S&P 500® Index and posted total returns of 45% or higher. Our four best-performing funds were concentrated in the Energy and Financials sectors. While some of our Funds certainly benefited from being in the “right” sector at the “right” time, we also believe this was a favorable period for our investment style of high-conviction investing and concentrated portfolio construction.
What will the coming year bring? As mentioned in our last shareholder letter (June 2021), we understand that even the greatest bull markets experience corrections along the way, and the last time the S&P 500® Index dropped over 10% was in February/March of 2020. Whether or not a correction occurs sooner or later, we believe the market as a whole has more room to run. We see many factors that could drive the market higher from here: strong GDP growth and increasing corporate earnings, a potentially lower-for-longer interest rate environment, accommodative fiscal and monetary policies, a healthy and robust financial system, low unemployment and solid wage growth, and strong corporate balance sheets with plenty of cash.
Thank you for your interest and for investing with us. We remain committed to managing our portfolios for long-term performance, ever mindful of downside risk. With so many investment options available to you, we are grateful for the trust you put in us and for your continued interest in our family of Funds. If you have any questions or would like to speak with us, please don’t hesitate to call us directly at (800) 966-4354.
Best regards,
| |
| |
| Ryan C. Kelley | |
| Chief Investment Officer |
Past performance does not guarantee future results. To obtain current standardized performance for the Hennessy Funds, visit https://www.hennessyfunds.com/funds/price-performance.
Mutual fund investing involves risk. Principal loss is possible.
Opinions expressed are those of Ryan C. Kelley and are subject to change, are not guaranteed, and should not be considered investment advice.
The Dow Jones Industrial Average and S&P 500® Index are commonly used to measure the performance of U.S. stocks. The S&P 500® Energy Index comprises those companies included in the S&P 500® Index that are classified in the Energy sector. The Russell 1000® Index Financials is a subset of the Russel 1000® Index that measures the performance of securities classified in the Financials sector of the large-capitalization U.S. equity market. The indices are used herein for comparative purposes in accordance with SEC regulations. One cannot invest directly in an index. All returns are shown on a total return basis.
| HENNESSY FUNDS | 1-800-966-4354 |
3
Performance Overview (Unaudited)
CHANGE IN VALUE OF $10,000 INVESTMENT
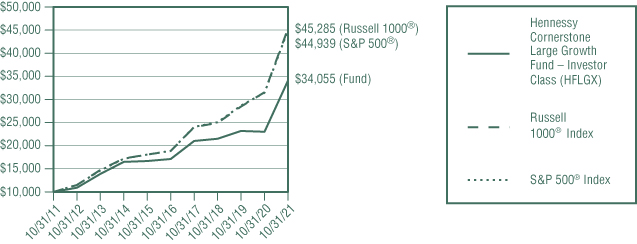
This graph illustrates the performance of an initial investment of $10,000 made in the Fund 10 years ago and assumes the reinvestment of dividends and capital gains.
AVERAGE ANNUAL TOTAL RETURN FOR PERIODS ENDED OCTOBER 31, 2021
| One | Five | Ten | ||
Year | Years | Years | ||
| Hennessy Cornerstone Large Growth Fund – | ||||
| Investor Class (HFLGX) | 48.00% | 14.75% | 13.04% | |
| Hennessy Cornerstone Large Growth Fund – | ||||
| Institutional Class (HILGX) | 48.30% | 15.05% | 13.31% | |
Russell 1000® Index | 43.51% | 19.16% | 16.30% | |
S&P 500® Index | 42.91% | 18.93% | 16.21% |
Expense ratios: 1.31% (Investor Class); 1.01% (Institutional Class)
Performance data quoted represents past performance; past performance does not guarantee future results. The investment return and principal value of an investment will fluctuate so that an investor’s shares, when redeemed, may be worth more or less than their original cost. The performance table does not reflect the deduction of taxes that a shareholder would pay on Fund distributions or the redemption of Fund shares. Current performance of the Fund may be lower or higher than the performance quoted. Performance data current to the most recent month end may be obtained by visiting www.hennessyfunds.com.
The Russell 1000® Index comprises the 1,000 largest companies in the Russell 3000® Index based on market capitalization. The S&P 500® Index is a capitalization-weighted index that is designed to represent the broad domestic economy through changes in the aggregate market value of 500 stocks across all major industries. One cannot invest directly in an index. These indices are used for comparative purposes in accordance with Securities and Exchange Commission regulations.
Frank Russell Company (“Russell”) is the source and owner of the trademarks, service marks, and copyrights related to the Russell Indexes. Russell® is a trademark of Frank Russell Company. Neither Russell nor its licensors accept any liability for any errors or omissions in the Russell Indexes or Russell ratings or underlying data and no party may rely on any Russell Indexes or Russell ratings or underlying data contained in this communication. No further distribution of Russell data is permitted without Russell’s express written consent. Russell does not promote, sponsor, or endorse the content of this communication.
| WWW.HENNESSYFUNDS.COM |
4
| PERFORMANCE OVERVIEW |
Standard & Poor’s Financial Services is the source and owner of the S&P® and S&P 500® trademarks.
The expense ratios presented are from the most recent prospectus. The expense ratios for the current reporting period are available in the Financial Highlights section of this report.
PERFORMANCE NARRATIVE
Portfolio Managers Neil J. Hennessy, Ryan C. Kelley, CFA, and L. Joshua Wein, CAIA
Performance:
For the one-year period ended October 31, 2021, the Investor Class of the Hennessy Cornerstone Large Growth Fund returned 48.00%, outperforming both the Russell 1000® Index (the Fund’s primary benchmark) and the S&P 500® Index, which returned 43.51% and 42.91%, respectively, for the same period.
The Fund’s outperformance relative to its primary benchmark resulted from both stock selection and sector allocation. Stock selection in the Communication Services, Consumer Discretionary, and Industrials sectors contributed to outperformance. The largest contributors to performance in each of these sectors during the period were ViacomCBS, Inc. (Class B), Darden Restaurants, Inc., and United Rentals, Inc., respectively. Offsetting these were investments in the Materials, Health Care, and Consumer Staples sectors. The largest detractors from performance within each of these sectors during the period were FMC Corp., Biogen, Inc., and Clorox Company, respectively. Sector selection contributed modestly to the Fund’s relative return. An underweight positions in the Utilities sector, an overweight position in the Industrials sector, and an underweight position in the Energy sector contributed to returns during the period on a relative basis.
The Fund continues to hold the companies mentioned except ViacomCBS, Darden Restaurants, and United Rentals.
Portfolio Strategy:
The Fund utilizes a formula-based approach designed to result in a portfolio of attractively valued, highly profitable, larger-cap companies. In essence, the strategy seeks high-quality, high-return companies that may be overlooked by other investors by selecting 50 larger-cap stocks that have relatively low price-to-cash-flow ratios and have generated high returns on capital over the past year.
Investment Commentary:
After a tumultuous 2020 and a strong 2021, we believe that the outlook for U.S. stocks remains positive. After a sharp contraction in economic activity as a result of the COVID-19 pandemic, the U.S. economy is growing steadily and demonstrating incredible resilience. We are benefiting from increased employment, rapid wage gains, and robust economic activity. Corporate earnings are on the rise, interest rates remain low, and Federal Reserve policies continue to accommodate a strong economy.
Sectors where the Fund currently maintains significant overweight positions include Consumer Discretionary, Health Care, and Consumer Staples. Representative holdings within the Consumer Discretionary sector include AutoZone, Inc., Williams-Sonoma, Inc., and O’Reilly Automotive, Inc. Health Care sector exposure includes companies such as HCA Healthcare, Inc., Regeneron Pharmaceuticals, and Quest Diagnostics, Inc. Within the Consumer Staples sector, the Fund owns Kroger Company, Kellogg Company, and
| HENNESSY FUNDS | 1-800-966-4354 |
5
Kimberly-Clark Corporation. We believe these companies should benefit from a rebound in economic growth in the United States and abroad.
_______________
Opinions expressed are those of the Portfolio Managers as of the date written and are subject to change, are not guaranteed, and should not be considered investment advice or an indication of trading intent.
The Fund may invest in medium-capitalization companies, which may have more limited liquidity and greater price volatility than large-capitalization companies. The Fund’s formula-based strategy may cause the Fund to buy or sell securities at times when it may not be advantageous. Please see the Fund’s prospectus for a more complete discussion of these and other risks.
References to specific securities should not be considered a recommendation to buy or sell any security. Fund holdings and sector allocations are subject to change. Please refer to the Schedule of Investments included in this report for additional portfolio information.
Earnings growth is not a measure of the Fund’s future performance.
Price-to-cash-flow ratio is a valuation measure calculated by dividing a company’s market price per share by its cash flow per share.
| WWW.HENNESSYFUNDS.COM |
6
| PERFORMANCE OVERVIEW/SCHEDULE OF INVESTMENTS |
Financial Statements
Schedule of Investments as of October 31, 2021 |
HENNESSY CORNERSTONE LARGE GROWTH FUND
(% of Net Assets)

| TOP TEN HOLDINGS (EXCLUDING MONEY MARKET FUNDS) | % NET ASSETS |
| KKR & Co., Inc. | 2.93% |
| AutoZone, Inc. | 2.54% |
| Oracle Corp. | 2.49% |
| Lowe’s Companies, Inc. | 2.45% |
| HCA Healthcare, Inc. | 2.43% |
| The Home Depot, Inc. | 2.42% |
| Regeneron Pharmaceuticals, Inc. | 2.38% |
| Williams-Sonoma, Inc. | 2.37% |
| Target Corp. | 2.36% |
| The Interpublic Group of Companies, Inc. | 2.34% |
Note: For presentation purposes, the Fund has grouped some of the industry categories. For purposes of categorizing securities for compliance with Section 8(b)(1) of the Investment Company Act of 1940, as amended, the Fund uses more specific industry classifications.
The Global Industry Classification Standard (GICS®) was developed by and is the exclusive property and a service mark of MSCI, Inc. and Standard & Poor’s Financial Services LLC. It has been licensed for use by the Hennessy Funds.
| HENNESSY FUNDS | 1-800-966-4354 |
7
| COMMON STOCKS – 99.59% | Number | % of | ||||||||||
| of Shares | Value | Net Assets | ||||||||||
| Communication Services – 5.60% | ||||||||||||
| Omnicom Group, Inc. | 39,300 | $ | 2,675,544 | 1.66 | % | |||||||
| The Interpublic Group of Companies, Inc. | 103,400 | 3,781,338 | 2.34 | % | ||||||||
| Verizon Communications, Inc. | 48,900 | 2,591,211 | 1.60 | % | ||||||||
| 9,048,093 | 5.60 | % | ||||||||||
| Consumer Discretionary – 28.13% | ||||||||||||
| AutoZone, Inc. (a) | 2,300 | 4,105,132 | 2.54 | % | ||||||||
| Best Buy Co., Inc. | 26,900 | 3,288,256 | 2.04 | % | ||||||||
| Dollar General Corp. | 14,300 | 3,167,736 | 1.96 | % | ||||||||
| Dollar Tree, Inc. (a) | 27,500 | 2,963,400 | 1.83 | % | ||||||||
| DR Horton, Inc. | 35,100 | 3,133,377 | 1.94 | % | ||||||||
| eBay, Inc. | 47,900 | 3,674,888 | 2.28 | % | ||||||||
| Lowe’s Companies, Inc. | 16,900 | 3,951,558 | 2.45 | % | ||||||||
| O’Reilly Automotive, Inc. (a) | 6,000 | 3,733,920 | 2.31 | % | ||||||||
| PulteGroup, Inc. | 59,900 | 2,879,992 | 1.78 | % | ||||||||
| Target Corp. | 14,700 | 3,816,414 | 2.36 | % | ||||||||
| The Home Depot, Inc. | 10,500 | 3,903,270 | 2.42 | % | ||||||||
| Whirlpool Corp. | 14,200 | 2,993,786 | 1.85 | % | ||||||||
| Williams-Sonoma, Inc. | 20,600 | 3,826,038 | 2.37 | % | ||||||||
| 45,437,767 | 28.13 | % | ||||||||||
| Consumer Staples – 10.86% | ||||||||||||
| Kellogg Co. | 46,800 | 2,868,840 | 1.78 | % | ||||||||
| Kimberly-Clark Corp. | 21,100 | 2,732,239 | 1.69 | % | ||||||||
| Philip Morris International, Inc. | 32,200 | 3,044,188 | 1.89 | % | ||||||||
| The Clorox Co. | 14,900 | 2,428,849 | 1.50 | % | ||||||||
| The Kroger Co. | 83,900 | 3,357,678 | 2.08 | % | ||||||||
| Walmart, Inc. | 20,800 | 3,107,936 | 1.92 | % | ||||||||
| 17,539,730 | 10.86 | % | ||||||||||
| Financials – 11.23% | ||||||||||||
| Ameriprise Financial, Inc. | 12,200 | 3,685,986 | 2.28 | % | ||||||||
| KKR & Co., Inc. | 59,300 | 4,724,431 | 2.93 | % | ||||||||
| T. Rowe Price Group, Inc. | 16,700 | 3,621,896 | 2.24 | % | ||||||||
| The Allstate Corp. | 25,300 | 3,128,851 | 1.94 | % | ||||||||
| The Progressive Corp. | 31,400 | 2,979,232 | 1.84 | % | ||||||||
| 18,140,396 | 11.23 | % | ||||||||||
The accompanying notes are an integral part of these financial statements.
| WWW.HENNESSYFUNDS.COM |
8
| SCHEDULE OF INVESTMENTS |
| COMMON STOCKS | Number | % of | ||||||||||
| of Shares | Value | Net Assets | ||||||||||
| Health Care – 21.61% | ||||||||||||
| AbbVie, Inc. | 25,100 | $ | 2,878,217 | 1.78 | % | |||||||
| Amgen, Inc. | 12,000 | 2,483,640 | 1.54 | % | ||||||||
| Biogen, Inc. (a) | 9,900 | 2,640,132 | 1.63 | % | ||||||||
| Cardinal Health, Inc. | 52,400 | 2,505,244 | 1.55 | % | ||||||||
| HCA Healthcare, Inc. | 15,700 | 3,932,222 | 2.43 | % | ||||||||
| Hologic, Inc. (a) | 37,500 | 2,749,125 | 1.70 | % | ||||||||
| Humana, Inc. | 7,100 | 3,288,436 | 2.04 | % | ||||||||
| Merck & Co., Inc. | 37,200 | 3,275,460 | 2.03 | % | ||||||||
| Organon & Co. | 4,020 | 147,735 | 0.09 | % | ||||||||
| Quest Diagnostics, Inc. | 23,400 | 3,434,652 | 2.13 | % | ||||||||
| Regeneron Pharmaceuticals, Inc. (a) | 6,000 | 3,839,640 | 2.38 | % | ||||||||
| UnitedHealth Group, Inc. | 8,100 | 3,729,807 | 2.31 | % | ||||||||
| 34,904,310 | 21.61 | % | ||||||||||
| Industrials – 10.80% | ||||||||||||
| 3M Co. | 15,400 | 2,751,672 | 1.71 | % | ||||||||
| Booz Allen Hamilton Holding Corp., Class A | 35,000 | 3,040,100 | 1.88 | % | ||||||||
| Emerson Electric Co. | 31,500 | 3,055,815 | 1.89 | % | ||||||||
| Lockheed Martin Corp. | 8,200 | 2,725,024 | 1.69 | % | ||||||||
| Snap-on, Inc. | 13,300 | 2,702,959 | 1.67 | % | ||||||||
| Union Pacific Corp. | 13,100 | 3,162,340 | 1.96 | % | ||||||||
| 17,437,910 | 10.80 | % | ||||||||||
| Information Technology – 9.86% | ||||||||||||
| Cisco Systems, Inc. | 60,200 | 3,369,394 | 2.09 | % | ||||||||
| HP, Inc. | 93,300 | 2,829,789 | 1.75 | % | ||||||||
| Intel Corp. | 44,450 | 2,178,050 | 1.35 | % | ||||||||
| NortonLifeLock, Inc. | 138,500 | 3,524,825 | 2.18 | % | ||||||||
| Oracle Corp. | 41,900 | 4,019,886 | 2.49 | % | ||||||||
| 15,921,944 | 9.86 | % | ||||||||||
| Materials – 1.50% | ||||||||||||
| FMC Corp. | 26,600 | 2,420,866 | 1.50 | % | ||||||||
| Total Common Stocks | ||||||||||||
| (Cost $125,653,592) | 160,851,016 | 99.59 | % | |||||||||
The accompanying notes are an integral part of these financial statements.
| HENNESSY FUNDS | 1-800-966-4354 |
9
| SHORT-TERM INVESTMENTS – 0.54% | Number | % of | ||||||||||
| of Shares | Value | Net Assets | ||||||||||
| Money Market Funds – 0.54% | ||||||||||||
| First American Government Obligations Fund, | ||||||||||||
| Institutional Class, 0.03% (b) | 865,750 | $ | 865,750 | 0.54 | % | |||||||
| Total Short-Term Investments | ||||||||||||
| (Cost $865,750) | 865,750 | 0.54 | % | |||||||||
| Total Investments | ||||||||||||
| (Cost $126,519,342) – 100.13% | 161,716,766 | 100.13 | % | |||||||||
| Liabilities in Excess of Other Assets – (0.13)% | (208,453 | ) | (0.13 | )% | ||||||||
TOTAL NET ASSETS – 100.00% | $ | 161,508,313 | 100.00 | % | ||||||||
Percentages are stated as a percent of net assets.
| (a) | Non-income-producing security. |
| (b) | The rate listed is the fund’s seven-day yield as of October 31, 2021. |
Summary of Fair Value Exposure as of October 31, 2021
The following is a summary of the inputs used to value the Fund’s net assets as of October 31, 2021 (see Note 3 in the accompanying Notes to the Financial Statements):
| Common Stocks | Level 1 | Level 2 | Level 3 | Total | ||||||||||||
| Communication Services | $ | 9,048,093 | $ | — | $ | — | $ | 9,048,093 | ||||||||
| Consumer Discretionary | 45,437,767 | — | — | 45,437,767 | ||||||||||||
| Consumer Staples | 17,539,730 | — | — | 17,539,730 | ||||||||||||
| Financials | 18,140,396 | — | — | 18,140,396 | ||||||||||||
| Health Care | 34,904,310 | — | — | 34,904,310 | ||||||||||||
| Industrials | 17,437,910 | — | — | 17,437,910 | ||||||||||||
| Information Technology | 15,921,944 | — | — | 15,921,944 | ||||||||||||
| Materials | 2,420,866 | — | — | 2,420,866 | ||||||||||||
| Total Common Stocks | $ | 160,851,016 | $ | — | $ | — | $ | 160,851,016 | ||||||||
| Short-Term Investments | ||||||||||||||||
| Money Market Funds | $ | 865,750 | $ | — | $ | — | $ | 865,750 | ||||||||
| Total Short-Term Investments | $ | 865,750 | $ | — | $ | — | $ | 865,750 | ||||||||
| Total Investments | $ | 161,716,766 | $ | — | $ | — | $ | 161,716,766 | ||||||||
The accompanying notes are an integral part of these financial statements.
| WWW.HENNESSYFUNDS.COM |
10
| SCHEDULE OF INVESTMENTS/STATEMENT OF ASSETS AND LIABILITIES |
Financial Statements
Statement of Assets and Liabilities as of October 31, 2021 |
| ASSETS: | ||||
| Investments in securities, at value (cost $126,519,342) | $ | 161,716,766 | ||
| Dividends and interest receivable | 109,384 | |||
| Receivable for fund shares sold | 6,430 | |||
| Prepaid expenses and other assets | 22,596 | |||
| Total assets | 161,855,176 | |||
| LIABILITIES: | ||||
| Payable for fund shares redeemed | 304 | |||
| Payable to advisor | 99,137 | |||
| Payable to administrator | 47,562 | |||
| Payable to auditor | 22,556 | |||
| Accrued distribution fees | 135,786 | |||
| Accrued service fees | 11,872 | |||
| Accrued trustees fees | 6,594 | |||
| Accrued expenses and other payables | 23,052 | |||
| Total liabilities | 346,863 | |||
| NET ASSETS | $ | 161,508,313 | ||
| NET ASSETS CONSISTS OF: | ||||
| Capital stock | $ | 105,310,912 | ||
| Total distributable earnings | 56,197,401 | |||
| Total net assets | $ | 161,508,313 | ||
| NET ASSETS: | ||||
| Investor Class | ||||
| Shares authorized (no par value) | Unlimited | |||
| Net assets applicable to outstanding shares | $ | 143,114,729 | ||
| Shares issued and outstanding | 9,974,111 | |||
| Net asset value, offering price, and redemption price per share | $ | 14.35 | ||
| Institutional Class | ||||
| Shares authorized (no par value) | Unlimited | |||
| Net assets applicable to outstanding shares | $ | 18,393,584 | ||
| Shares issued and outstanding | 1,267,647 | |||
| Net asset value, offering price, and redemption price per share | $ | 14.51 | ||
The accompanying notes are an integral part of these financial statements.
| HENNESSY FUNDS | 1-800-966-4354 |
11
Financial Statements
Statement of Operations for the year ended October 31, 2021 |
| INVESTMENT INCOME: | ||||
| Dividend income | $ | 2,985,536 | ||
| Interest income | 941 | |||
| Total investment income | 2,986,477 | |||
| EXPENSES: | ||||
| Investment advisory fees (See Note 5) | 1,120,334 | |||
| Distribution fees – Investor Class (See Note 5) | 199,081 | |||
| Administration, accounting, custody, and transfer agent fees (See Note 5) | 177,858 | |||
| Service fees – Investor Class (See Note 5) | 132,721 | |||
| Sub-transfer agent expenses – Investor Class (See Note 5) | 115,055 | |||
| Sub-transfer agent expenses – Institutional Class (See Note 5) | 16,780 | |||
| Federal and state registration fees | 36,898 | |||
| Compliance expense (See Note 5) | 27,448 | |||
| Audit fees | 22,556 | |||
| Trustees’ fees and expenses | 19,252 | |||
| Reports to shareholders | 10,125 | |||
| Legal fees | 2,541 | |||
| Interest expense (See Note 7) | 916 | |||
| Other expenses | 23,038 | |||
| Total expenses before recoupment by advisor | 1,904,603 | |||
| Expense recoupment by advisor – Investor Class (See Note 5) | 4,527 | |||
| Net expenses | 1,909,130 | |||
| NET INVESTMENT INCOME | $ | 1,077,347 | ||
| REALIZED AND UNREALIZED GAINS (LOSSES): | ||||
| Net realized gain on investments | $ | 23,137,704 | ||
| Net change in unrealized appreciation/depreciation on investments | 30,012,110 | |||
| Net gain on investments | 53,149,814 | |||
| NET INCREASE IN NET ASSETS RESULTING FROM OPERATIONS | $ | 54,227,161 | ||
The accompanying notes are an integral part of these financial statements.
| WWW.HENNESSYFUNDS.COM |
12
| STATEMENT OF OPERATIONS/STATEMENTS OF CHANGES IN NET ASSETS |
Financial Statements
| Statements of Changes in Net Assets |
| Year Ended | Year Ended | |||||||
| October 31, 2021 | October 31, 2020 | |||||||
| OPERATIONS: | ||||||||
| Net investment income | $ | 1,077,347 | $ | 1,164,145 | ||||
| Net realized gain on investments | 23,137,704 | 6,452,954 | ||||||
| Net change in unrealized | ||||||||
| appreciation/depreciation on investments | 30,012,110 | (8,936,589 | ) | |||||
| Net increase (decrease) in net | ||||||||
| assets resulting from operations | 54,227,161 | (1,319,490 | ) | |||||
| DISTRIBUTIONS TO SHAREHOLDERS: | ||||||||
| Distributable earnings – Investor Class | (5,878,284 | ) | (2,977,504 | ) | ||||
| Distributable earnings – Institutional Class | (758,549 | ) | (399,991 | ) | ||||
| Total distributions | (6,636,833 | ) | (3,377,495 | ) | ||||
| CAPITAL SHARE TRANSACTIONS: | ||||||||
| Proceeds from shares subscribed – Investor Class | 8,018,607 | 1,781,545 | ||||||
| Proceeds from shares subscribed – Institutional Class | 16,491,311 | 1,724,940 | ||||||
| Dividends reinvested – Investor Class | 5,574,991 | 2,817,178 | ||||||
| Dividends reinvested – Institutional Class | 740,220 | 392,293 | ||||||
| Cost of shares redeemed – Investor Class | (15,731,261 | ) | (14,850,308 | ) | ||||
| Cost of shares redeemed – Institutional Class | (16,883,651 | ) | (7,495,843 | ) | ||||
| Net decrease in net assets derived | ||||||||
| from capital share transactions | (1,789,783 | ) | (15,630,195 | ) | ||||
| TOTAL INCREASE (DECREASE) IN NET ASSETS | 45,800,545 | (20,327,180 | ) | |||||
| NET ASSETS: | ||||||||
| Beginning of year | 115,707,768 | 136,034,948 | ||||||
| End of year | $ | 161,508,313 | $ | 115,707,768 | ||||
| CHANGES IN SHARES OUTSTANDING: | ||||||||
| Shares sold – Investor Class | 592,099 | 182,762 | ||||||
| Shares sold – Institutional Class | 1,203,797 | 191,956 | ||||||
| Shares issued to holders as reinvestment | ||||||||
| of dividends – Investor Class | 501,827 | 255,706 | ||||||
| Shares issued to holders as reinvestment | ||||||||
| of dividends – Institutional Class | 65,913 | 35,229 | ||||||
| Shares redeemed – Investor Class | (1,214,696 | ) | (1,505,702 | ) | ||||
| Shares redeemed – Institutional Class | (1,221,754 | ) | (736,903 | ) | ||||
| Net decrease in shares outstanding | (72,814 | ) | (1,576,952 | ) | ||||
The accompanying notes are an integral part of these financial statements.
| HENNESSY FUNDS | 1-800-966-4354 |
13
Financial Statements
| Financial Highlights |
For an Investor Class share outstanding throughout each year
PER SHARE DATA:
Net asset value, beginning of year
Income from investment operations:
Net investment income
Net realized and unrealized gains (losses) on investments
Total from investment operations
Less distributions:
Dividends from net investment income
Dividends from net realized gains
Total distributions
Net asset value, end of year
TOTAL RETURN
SUPPLEMENTAL DATA AND RATIOS:
Net assets, end of year (millions)
Ratio of expenses to average net assets:
Before expense reimbursement/recoupment
After expense reimbursement/recoupment
Ratio of net investment income to average net assets:
Before expense reimbursement/recoupment
After expense reimbursement/recoupment
Portfolio turnover rate(3)
(1) | Calculated using the average shares outstanding method. |
(2) | The Fund had an expense limitation agreement in place through November 30, 2019. |
(3) | Calculated on the basis of the Fund as a whole. |
The accompanying notes are an integral part of these financial statements.
| WWW.HENNESSYFUNDS.COM |
14
| FINANCIAL HIGHLIGHTS — INVESTOR CLASS |
| Year Ended October 31, | ||||||||||||||||||
| 2021 | 2020 | 2019 | 2018 | 2017 | ||||||||||||||
| $ | 10.21 | $ | 10.54 | $ | 12.24 | $ | 11.75 | $ | 10.27 | |||||||||
| 0.09 | (1) | 0.09 | (1) | 0.13 | (1) | 0.06 | 0.11 | |||||||||||
| 4.64 | (0.15 | ) | 0.56 | 0.94 | 1.49 | |||||||||||||
| 4.73 | (0.06 | ) | 0.69 | 1.00 | 1.60 | |||||||||||||
| (0.10 | ) | (0.14 | ) | (0.09 | ) | (0.08 | ) | (0.12 | ) | |||||||||
| (0.49 | ) | (0.13 | ) | (2.30 | ) | (0.43 | ) | — | ||||||||||
| (0.59 | ) | (0.27 | ) | (2.39 | ) | (0.51 | ) | (0.12 | ) | |||||||||
| $ | 14.35 | $ | 10.21 | $ | 10.54 | $ | 12.24 | $ | 11.75 | |||||||||
| 48.00 | % | -0.75 | % | 7.84 | % | 8.53 | % | 15.70 | % | |||||||||
| $ | 143.11 | $ | 103.11 | $ | 117.62 | $ | 125.91 | $ | 91.74 | |||||||||
| 1.29 | % | 1.31 | % | 1.31 | % | 1.24 | % | 1.25 | % | |||||||||
| 1.29 | % | 1.31 | %(2) | 1.29 | % | 1.24 | % | 1.25 | % | |||||||||
| 0.69 | % | 0.93 | % | 1.24 | % | 0.81 | % | 0.95 | % | |||||||||
| 0.69 | % | 0.93 | % | 1.26 | % | 0.81 | % | 0.95 | % | |||||||||
| 68 | % | 62 | % | 57 | % | 70 | % | 65 | % | |||||||||
The accompanying notes are an integral part of these financial statements.
| HENNESSY FUNDS | 1-800-966-4354 |
15
Financial Statements
| Financial Highlights |
For an Institutional Class share outstanding throughout each year
PER SHARE DATA:
Net asset value, beginning of year
Income from investment operations:
Net investment income
Net realized and unrealized gains (losses) on investments
Total from investment operations
Less distributions:
Dividends from net investment income
Dividends from net realized gains
Total distributions
Net asset value, end of year
TOTAL RETURN
SUPPLEMENTAL DATA AND RATIOS:
Net assets, end of year (millions)
Ratio of expenses to average net assets:
Before expense reimbursement
After expense reimbursement
Ratio of net investment income to average net assets:
Before expense reimbursement
After expense reimbursement
Portfolio turnover rate(3)
(1) | Calculated using the average shares outstanding method. |
(2) | The Fund had an expense limitation agreement in place through November 30, 2019. |
(3) | Calculated on the basis of the Fund as a whole. |
The accompanying notes are an integral part of these financial statements.
| WWW.HENNESSYFUNDS.COM |
16
| FINANCIAL HIGHLIGHTS — INSTITUTIONAL CLASS |
| Year Ended October 31, | ||||||||||||||||||
| 2021 | 2020 | 2019 | 2018 | 2017 | ||||||||||||||
| $ | 10.33 | $ | 10.65 | $ | 12.38 | $ | 11.87 | $ | 10.37 | |||||||||
| 0.12 | (1) | 0.13 | (1) | 0.16 | (1) | 0.14 | 0.13 | |||||||||||
| 4.68 | (0.15 | ) | 0.56 | 0.90 | 1.52 | |||||||||||||
| 4.80 | (0.02 | ) | 0.72 | 1.04 | 1.65 | |||||||||||||
| (0.13 | ) | (0.17 | ) | (0.12 | ) | (0.10 | ) | (0.15 | ) | |||||||||
| (0.49 | ) | (0.13 | ) | (2.33 | ) | (0.43 | ) | — | ||||||||||
| (0.62 | ) | (0.30 | ) | (2.45 | ) | (0.53 | ) | (0.15 | ) | |||||||||
| $ | 14.51 | $ | 10.33 | $ | 10.65 | $ | 12.38 | $ | 11.87 | |||||||||
| 48.30 | % | -0.40 | % | 8.12 | % | 8.82 | % | 16.00 | % | |||||||||
| $ | 18.39 | $ | 12.60 | $ | 18.42 | $ | 19.25 | $ | 12.17 | |||||||||
| 1.04 | % | 1.01 | % | 1.00 | % | 0.96 | % | 1.00 | % | |||||||||
| 1.04 | % | 1.01 | %(2) | 0.98 | % | 0.96 | % | 1.00 | % | |||||||||
| 0.91 | % | 1.23 | % | 1.56 | % | 1.08 | % | 1.20 | % | |||||||||
| 0.91 | % | 1.23 | % | 1.58 | % | 1.08 | % | 1.20 | % | |||||||||
| 68 | % | 62 | % | 57 | % | 70 | % | 65 | % | |||||||||
The accompanying notes are an integral part of these financial statements.
| HENNESSY FUNDS | 1-800-966-4354 |
17
Financial Statements
Notes to the Financial Statements October 31, 2021 |
1). ORGANIZATION
The Hennessy Cornerstone Large Growth Fund (the “Fund”) is a series of Hennessy Funds Trust (the “Trust”), which was organized as a Delaware statutory trust on September 17, 1992. The Fund is an open-end management investment company registered under the Investment Company Act of 1940, as amended. The investment objective of the Fund is long-term growth of capital. The Fund is a diversified fund.
The Fund offers Investor Class and Institutional Class shares. Each class of shares differs principally in its respective 12b-1 distribution and service, shareholder servicing, and sub-transfer agent expenses. There are no sales charges. Each class has identical rights to earnings, assets, and voting privileges, except for class-specific expenses and exclusive rights to vote on matters affecting only one class.
As an investment company, the Fund follows the investment company accounting and reporting guidance of the Financial Accounting Standards Board (“FASB”) Accounting Standard Codification Topic 946 “Financial Services—Investment Companies.”
2). SIGNIFICANT ACCOUNTING POLICIES
The following is a summary of significant accounting policies consistently followed by the Fund in the preparation of the financial statements. These policies conform to U.S. generally accepted accounting principles (“GAAP”).
| a). | Securities Valuation – All investments in securities are valued in accordance with the Fund’s valuation policies and procedures, as described in Note 3. |
| b). | Federal Income Taxes – The Fund has elected to be taxed as a regulated investment company and intends to distribute substantially all of its taxable income to its shareholders and otherwise comply with the provisions of the Internal Revenue Code of 1986, as amended, applicable to regulated investment companies. As a result, the Fund has made no provision for federal income taxes or excise taxes. Net investment income/loss and realized gains/losses for federal income tax purposes may differ from those reported in the financial statements because of temporary book-basis and tax-basis differences. Temporary differences are primarily the result of the treatment of wash sales for tax reporting purposes. The Fund recognizes interest and penalties related to income tax benefits, if any, in the Statement of Operations as an income tax expense. Distributions from net realized gains for book purposes may include short-term capital gains, which are included as ordinary income to shareholders for tax purposes. The Fund may utilize equalization accounting for tax purposes and designate earnings and profits, including net realized gains distributed to shareholders on redemption of shares, as part of the dividends paid deduction for income tax purposes. |
| Due to inherent differences in the recognition of income, expenses, and realized gains/losses under GAAP and federal income tax regulations, permanent differences between book and tax basis for reporting are identified and appropriately reclassified in the Statement of Assets and Liabilities, as needed. The adjustments for fiscal year 2021 are as follows: |
| Total | |||
| Distributable | |||
Earnings | Capital Stock | ||
| $(3,159,353) | $3,159,353 |
| WWW.HENNESSYFUNDS.COM |
18
| NOTES TO THE FINANCIAL STATEMENTS |
| c). | Accounting for Uncertainty in Income Taxes – The Fund has accounting policies regarding recognition and measurement of tax positions taken or expected to be taken on a tax return. The tax returns of the Fund for the prior three fiscal years are open for examination. The Fund has reviewed all open tax years in major tax jurisdictions and concluded that there is no impact on the Fund’s net assets and no tax liability resulting from unrecognized tax benefits relating to uncertain income tax positions taken or expected to be taken on a tax return. The Fund’s major tax jurisdictions are U.S. federal and Delaware. |
| d). | Income and Expenses – Dividend income is recognized on the ex-dividend date or as soon as information is available to the Fund. Interest income, which includes the amortization of premium and accretion of discount, is recognized on an accrual basis. Market discounts, original issue discounts, and market premiums on debt securities are accreted or amortized to interest income over the life of a security with a corresponding increase or decrease, as applicable, in the cost basis of such security using the yield-to-maturity method or, where applicable, the first call date of the security. Other non-cash dividends are recognized as investment income at the fair value of the property received. The Fund is charged for those expenses that are directly attributable to its portfolio, such as advisory, administration, and certain shareholder service fees. Income, expenses (other than expenses attributable to a specific class), and realized and unrealized gains/losses on investments are allocated to each class of shares based on such class’s net assets. |
| e). | Distributions to Shareholders – Dividends from net investment income for the Fund, if any, are declared and paid annually, usually in December. Distributions of net realized capital gains, if any, are declared and paid annually, usually in December. |
| f). | Security Transactions – Investment and shareholder transactions are recorded on the trade date. The Fund determines the realized gain/loss from an investment transaction by comparing the original cost of the security lot sold with the net sale proceeds. Discounts and premiums on securities purchased are accreted or amortized, respectively, over the life of each such security. |
| g). | Use of Estimates – Preparing financial statements in accordance with GAAP requires management to make estimates and assumptions that affect the reported amounts of assets and liabilities and disclosure of contingent assets and liabilities at the date of the financial statements, as well as the reported change in net assets during the reporting period. Actual results could differ from those estimates. |
| h). | Share Valuation – The net asset value (“NAV”) per share of the Fund is calculated by dividing (i) the total value of the securities held by the Fund, plus cash and other assets, minus all liabilities (including estimated accrued expenses) by (ii) the total number of Fund shares outstanding, rounded to the nearest $0.01. Fund shares are not priced on days the New York Stock Exchange is closed for trading. The offering and redemption price per share for the Fund is equal to the Fund’s NAV per share. |
| i). | Recent Accounting Pronouncements and Regulatory Updates – In October 2020, the Securities and Exchange Commission (“SEC”) adopted new regulations governing the use of derivatives by registered investment companies (“Rule 18f-4”). Rule 18f-4 imposes limits on the amount of derivatives a fund can enter into, eliminates the asset segregation framework currently used by funds to comply with Section 18 of the 1940 Act, and requires funds whose use of derivatives is greater than a limited specified amount to establish and maintain a comprehensive derivatives risk management program and appoint a derivatives risk manager. Funds are required to comply with Rule 18f-4 by August 19, 2022. The impact, if any, that Rule 18f-4 will |
| HENNESSY FUNDS | 1-800-966-4354 |
19
| have on the availability, liquidity, and performance of derivatives is unclear. Management is currently evaluating the potential impact of Rule 18f-4 on the Fund. When fully implemented, Rule 18f-4 may require changes in how the Fund uses derivatives, adversely affect the Fund’s performance, and increase costs related to the Fund’s use of derivatives. | |
| In December 2020, the SEC adopted a new rule providing a framework for fund valuation practices (“Rule 2a-5”). Rule 2a-5 establishes requirements for determining fair value in good faith for purposes of the 1940 Act. Rule 2a-5 permits fund boards to designate certain parties to perform fair value determinations, subject to board oversight and certain other conditions. Rule 2a-5 also defines when market quotations are “readily available” for purposes of the 1940 Act and the threshold for determining whether a fund must fair value a security. In connection with Rule 2a-5, the SEC also adopted related recordkeeping requirements and is rescinding previously issued guidance, including with respect to the role of a board in determining fair value and the accounting and auditing of fund investments. Funds must comply with the rules by September 8, 2022. Management is currently assessing the potential impact of the new rules on the Fund’s financial statements. |
3). SECURITIES VALUATION
The Fund follows its valuation policies and procedures in determining its net asset value and, in preparing these financial statements, the fair value accounting standards that establish an authoritative definition of fair value and set out a hierarchy for measuring fair value. These standards require additional disclosures about the various inputs and valuation techniques used to develop the measurements of fair value and a discussion of changes in valuation techniques and related inputs during the period. These inputs are summarized in the three broad levels listed below:
| Level 1 – | Unadjusted, quoted prices in active markets for identical instruments that the Fund has the ability to access at the date of measurement. | |
| Level 2 – | Other significant observable inputs (including, but not limited to, quoted prices in active markets for similar instruments, quoted prices in markets that are not active for identical or similar instruments, and model-derived valuations in which all significant inputs and significant value drivers are observable in active markets, such as interest rates, prepayment speeds, credit risk curves, default rates, and similar data). | |
| Level 3 – | Significant unobservable inputs (including the Fund’s own assumptions about what market participants would use to price the asset or liability based on the best available information) when observable inputs are unavailable. |
The following is a description of the valuation techniques applied to the Fund’s major categories of assets and liabilities on a recurring basis:
Equity Securities – Equity securities, including common stocks, preferred stocks, exchange-traded funds, closed-end mutual funds, partnerships, rights, and real estate investment trusts, that are traded on a securities exchange for which a last-quoted sales price is readily available generally are valued at the last sales price as reported by the primary exchange on which the securities are listed. Securities listed on The NASDAQ Stock Market (“NASDAQ”) generally are valued at the NASDAQ Official Closing Price, which may differ from the last sales price reported. Securities traded on a securities exchange for which a last-quoted sales price is not readily available generally are valued at the mean between the bid and ask prices. To the extent these securities are actively traded and valuation adjustments are not applied, they are classified in Level 1 of the fair value hierarchy. |
| WWW.HENNESSYFUNDS.COM |
20
| NOTES TO THE FINANCIAL STATEMENTS |
Registered Investment Companies – Investments in open-end registered investment companies, commonly referred to as mutual funds, generally are priced at the ending NAV provided by the applicable mutual fund’s service agent and are classified in Level 1 of the fair value hierarchy. | |
Debt Securities – Debt securities, including corporate bonds, asset-backed securities, mortgage-backed securities, municipal bonds, U.S. Treasuries, and U.S. government agency issues, are generally valued at market on the basis of valuations furnished by an independent pricing service that utilizes both dealer-supplied valuations and formula-based techniques. The pricing service may consider recently executed transactions in securities of the issuer or comparable issuers, market price quotations (where observable), bond spreads, and fundamental data relating to the issuer. In addition, the model may incorporate observable market data, such as reported sales of similar securities, broker quotes, yields, bids, offers, and reference data. Certain securities are valued primarily using dealer quotations. These securities are generally classified in Level 2 of the fair value hierarchy. | |
Short-Term Securities – Short-term equity investments, including money market funds, are valued in the manner specified above for equity securities. Short-term debt investments with an original term to maturity of 60 days or less are valued at amortized cost, which approximates fair market value. If the original term to maturity of a short-term debt investment exceeds 60 days, then the values as of the 61st day prior to maturity are amortized. Amortized cost is not used if its use would be inappropriate due to credit or other impairments of the issuer, in which case the security’s fair value would be determined as described below. Short-term securities are generally classified in Level 1 or Level 2 of the fair value hierarchy depending on the inputs used and market activity levels for specific securities. |
The Board of Trustees of the Fund (the “Board”) has adopted fair value pricing procedures that are followed when a price for a security is not readily available or if a significant event has occurred that indicates the closing price of a security no longer represents the true value of that security. Fair value pricing determinations are made in good faith in accordance with these procedures. There are numerous criteria considered in determining a fair value of a security, such as the trading volume of a security and markets, the values of other similar securities, and news events with direct bearing on a security or markets. Fair value pricing results in an estimated price for a security that reflects the amount the Fund might reasonably expect to receive in a current sale. Depending on the relative significance of the valuation inputs, these securities may be classified in either Level 2 or Level 3 of the fair value hierarchy.
The Board has delegated day-to-day valuation matters to the Valuation and Liquidity Committee comprising representatives from Hennessy Advisors, Inc., the Fund’s investment advisor (the “Advisor”). The function of the Valuation and Liquidity Committee, among other things, is to value securities where current and reliable market quotations are not readily available. All actions taken by the Valuation and Liquidity Committee are reviewed by the Board.
The Fund has performed an analysis of all existing investments to determine the significance and character of all inputs to their fair value determinations. Various inputs are used to determine the value of the Fund’s investments. The inputs or methodology used for valuing securities are not necessarily an indication of the risk associated with investing in those securities. Details related to the fair value hierarchy of the Fund’s securities as of October 31, 2021, are included in the Schedule of Investments.
| HENNESSY FUNDS | 1-800-966-4354 |
21
4). INVESTMENT TRANSACTIONS
Purchases and sales of investment securities (excluding government and short-term investments) for the Fund during fiscal year 2021 were $99,929,209 and $105,241,302, respectively.
There were no purchases or sales/maturities of long-term U.S. government securities for the Fund during fiscal year 2021.
5). INVESTMENT ADVISORY FEE AND OTHER TRANSACTIONS WITH AFFILIATES
The Advisor provides the Fund with investment advisory services under an Investment Advisory Agreement. The Advisor furnishes all investment advice, office space, and facilities and most of the personnel needed by the Fund. As compensation for its services, the Advisor is entitled to a monthly fee from the Fund. The fee is based on the average daily net assets of the Fund at an annual rate of 0.74%. The net investment advisory fees expensed by the Fund during fiscal year 2021 are included in the Statement of Operations.
From December 1, 2017, through November 30, 2019, the Advisor contractually agreed to limit total annual operating expenses to 1.29% of the Fund’s net assets for Investor Class shares and 0.98% of the Fund’s net assets for Institutional Class shares (in each case, excluding all federal, state, and local taxes, interest, brokerage commissions, extraordinary items, and acquired fund fees and expenses and other costs incurred in connection with the purchase and sale of securities).
For three years following the date on which expenses were waived or incurred, the Advisor may recoup waived or reimbursed expenses from the Fund if total operating expenses, including such recoupment, does not exceed the expense limitation in effect (i) at the time the Advisor waived or reimbursed such expenses and (ii) at the time the Advisor recoups such expenses. As of October 31, 2021, expenses subject to potential recovery for Investor Class and Institutional Class shares and the fiscal years in which they expire were as follows:
| Fiscal Year | Fiscal Year | |||||||||||
| 2022 | 2023 | Total | ||||||||||
| Investor Class | $ | 15,594 | $ | — | $ | 15,594 | ||||||
| Institutional Class | $ | 2,872 | $ | 162 | $ | 3,034 | ||||||
During fiscal year 2021, the Advisor recouped previously waived expenses from the Fund as set forth in the Statement of Operations.
The Board has approved a Shareholder Servicing Agreement for Investor Class shares of the Fund, which compensates the Advisor for the non-investment advisory services it provides to the Fund. The Shareholder Servicing Agreement provides for a monthly fee paid to the Advisor at an annual rate of 0.10% of the average daily net assets of the Fund attributable to Investor Class shares. The shareholder service fees expensed by the Fund during fiscal year 2021 are included in the Statement of Operations.
The Fund has adopted a plan pursuant to Rule 12b-1 under the Investment Company Act of 1940, as amended, that authorizes payments in connection with the distribution of Fund shares at an annual rate of up to 0.25% of the Fund’s average daily net assets attributable to Investor Class shares. Even though the authorized rate is up to 0.25%, the Fund is currently only using up to 0.15% of its average daily net assets attributable to Investor Class shares for such purpose. Amounts paid under the plan may be spent on any activities or expenses primarily intended to result in the sale of shares, including, but not limited to, advertising, shareholder account servicing, printing and mailing of prospectuses to other than current shareholders, printing and mailing of sales literature, and compensation for sales and marketing activities or to financial institutions
| WWW.HENNESSYFUNDS.COM |
22
| NOTES TO THE FINANCIAL STATEMENTS |
and others, such as dealers and distributors. The distribution fees expensed by the Fund during fiscal year 2021 are included in the Statement of Operations.
The Fund has entered into agreements with various brokers, dealers, and financial intermediaries in connection with the sale of Fund shares. The agreements provide for periodic payments of sub-transfer agent expenses by the Fund to the brokers, dealers, and financial intermediaries for providing certain shareholder maintenance services. These shareholder services include the pre-processing and quality control of new accounts, shareholder correspondence, answering customer inquiries regarding account status, and facilitating shareholder telephone transactions. The sub-transfer agent fees expensed by the Fund during fiscal year 2021 are included in the Statement of Operations.
U.S. Bancorp Fund Services, LLC, d/b/a U.S. Bank Global Fund Services (“Fund Services”) provides the Fund with administrative, accounting, and transfer agent services. As administrator, Fund Services is responsible for activities such as (i) preparing various federal and state regulatory filings, reports, and returns for the Fund, (ii) preparing reports and materials to be supplied to the Board, (iii) monitoring the activities of the Fund’s custodian, transfer agent, and accountants, and (iv) coordinating the preparation and payment of the Fund’s expenses and reviewing the Fund’s expense accruals. U.S. Bank N.A., an affiliate of Fund Services, serves as the Fund’s custodian. The servicing agreements between the Trust, Fund Services, and U.S. Bank N.A. contain a fee schedule that is inclusive of administrative, accounting, custody, and transfer agent fees. The administrative, accounting, custody, and transfer agent fees expensed by the Fund during fiscal year 2021 are included in the Statement of Operations.
Quasar Distributors, LLC (“Quasar”), a wholly owned broker-dealer subsidiary of Foreside Financial Group, LLC (“Foreside”), acts as the Fund’s principal underwriter in a continuous public offering of Fund shares. Effective September 30, 2021, Genstar Capital, a private equity firm specializing in financial and related business service companies, acquired a majority interest in Foreside. The Board approved a new Distribution Agreement to enable Quasar to continue serving as the Fund’s distributor following the change in control of Foreside.
The officers of the Fund are affiliated with the Advisor. With the exception of the Chief Compliance Officer and the Senior Compliance Officer, such officers receive no compensation from the Fund for serving in their respective roles. The Fund, along with the other funds in the Hennessy Funds family (collectively, the “Hennessy Funds”), makes reimbursement payments on an equal basis to the Advisor for a portion of the salary and benefits associated with the office of the Chief Compliance Officer and for all of the salary and benefits associated with the office of the Senior Compliance Officer. The compliance fees expensed by the Fund during fiscal year 2021 are included in the Statement of Operations.
6). GUARANTEES AND INDEMNIFICATIONS
Under the Hennessy Funds’ organizational documents, their officers and trustees are indemnified by the Hennessy Funds against certain liabilities arising out of the performance of their duties to the Hennessy Funds. Additionally, in the normal course of business, the Hennessy Funds enter into contracts with service providers that contain general indemnification clauses. The Fund’s maximum exposure under these arrangements is unknown as this would involve future claims that may be made against the Fund that have not yet occurred. Currently, the Fund expects the risk of loss to be remote.
| HENNESSY FUNDS | 1-800-966-4354 |
23
7). LINE OF CREDIT
The Fund has an uncommitted line of credit with the other Hennessy Funds in the amount of the lesser of (i) $100,000,000 or (ii) 33.33% of each Hennessy Fund’s net assets, or 30% for the Hennessy Gas Utility Fund and 10% for the Hennessy Balanced Fund. The line of credit is intended to provide any necessary short-term financing in connection with shareholder redemptions, subject to certain restrictions. The credit facility is with the Hennessy Funds’ custodian bank, U.S. Bank N.A. Borrowings under this arrangement bear interest at the bank’s prime rate and are secured by all of the Fund’s assets (as to its own borrowings only). During fiscal year 2021, the Fund had an outstanding average daily balance and a weighted average interest rate of $27,800 and 3.25%, respectively. The interest expensed by the Fund during fiscal year 2021 is included in the Statement of Operations. The maximum amount outstanding for the Fund during fiscal year 2021 was $5,158,000. As of October 31, 2021, the Fund did not have any borrowings outstanding under the line of credit.
8). FEDERAL TAX INFORMATION
As of October 31, 2021, the components of accumulated earnings (losses) for income tax purposes were as follows:
| Investments | ||||
| Cost of investments for tax purposes | $ | 126,550,944 | ||
| Gross tax unrealized appreciation | $ | 37,333,974 | ||
| Gross tax unrealized depreciation | (2,168,152 | ) | ||
| Net tax unrealized appreciation/(depreciation) | $ | 35,165,822 | ||
| Undistributed ordinary income | $ | 1,496,191 | ||
| Undistributed long-term capital gains | 19,535,388 | |||
| Total distributable earnings | $ | 21,031,579 | ||
| Other accumulated gain/(loss) | $ | — | ||
| Total accumulated gain/(loss) | $ | 56,197,401 | ||
The difference between book-basis unrealized appreciation/depreciation and tax-basis unrealized appreciation/depreciation (as shown above) is attributable primarily to wash sales.
As of October 31, 2021, the Fund had no tax- basis capital losses to offset future capital gains.
As of October 31, 2021, the Fund did not defer, on a tax basis, any late-year ordinary losses. Late-year ordinary losses are net ordinary losses incurred after December 31, 2020, but within the taxable year, that are deemed to arise on the first day of the Fund’s next taxable year.
During fiscal years 2021 and 2020, the tax character of distributions paid by the Fund was as follows:
| Year Ended | Year Ended | |||||||
| October 31, 2021 | October 31, 2020 | |||||||
Ordinary income(1) | $ | 1,164,101 | $ | 3,097,827 | ||||
| Long-term capital gains | 5,472,732 | 279,668 | ||||||
| Total distributions | $ | 6,636,833 | $ | 3,377,495 | ||||
(1) Ordinary income includes short-term capital gains. |
| WWW.HENNESSYFUNDS.COM |
24
| NOTES TO THE FINANCIAL STATEMENTS |
9). EVENTS SUBSEQUENT TO YEAR END
Management has evaluated the Fund’s related events and transactions that occurred subsequent to October 31, 2021, through the date of issuance of the Fund’s financial statements. Other than as disclosed below, management has determined that there were no subsequent events requiring recognition or disclosure in the financial statements.
On December 7, 2021, capital gains were declared and paid to shareholders of record on December 6, 2021, as follows:
Long-term | Short-term | ||
| Investor Class | $1.74592 | $0.03744 | |
| Institutional Class | $1.76609 | $0.03787 |
| HENNESSY FUNDS | 1-800-966-4354 |
25
Report of Independent Registered Public
Accounting Firm
To the Board of Trustees of Hennessy Funds Trust
and the shareholders of the Hennessy Cornerstone Large Growth Fund
Novato, CA
Opinion on the Financial Statements
We have audited the accompanying statement of assets and liabilities of the Hennessy Cornerstone Large Growth Fund (the “Fund”), a series of Hennessy Funds Trust, including the schedule of investments, as of October 31, 2021, the related statement of operations for the year then ended, the statements of changes in net assets for each of the two years in the period then ended, the financial highlights for each of the five years in the period then ended, and the related notes (collectively referred to as the “financial statements”). In our opinion, the financial statements present fairly, in all material respects, the financial position of the Fund as of October 31, 2021, the results of its operations for the year then ended, the changes in its net assets for each of the two years in the period then ended, and the financial highlights for each of the five years in the period then ended in conformity with accounting principles generally accepted in the United States of America.
Basis for Opinion
These financial statements are the responsibility of the Fund’s management. Our responsibility is to express an opinion on the Fund’s financial statements based on our audits. We are a public accounting firm registered with the Public Company Accounting Oversight Board (United States) (“PCAOB”) and are required to be independent with respect to the Fund in accordance with the U.S. federal securities laws and the applicable rules and regulations of the Securities and Exchange Commission and the PCAOB. We have served as the auditor of one or more of the funds in the Trust since 2002.
We conducted our audits in accordance with the standards of the PCAOB. Those standards require that we plan and perform the audit to obtain reasonable assurance about whether the financial statements are free of material misstatement, whether due to error or fraud. The Fund is not required to have, nor were we engaged to perform, an audit of its internal control over financial reporting. As part of our audits we are required to obtain an understanding of internal control over financial reporting, but not for the purpose of expressing an opinion on the effectiveness of the Fund’s internal control over financial reporting. Accordingly, we express no such opinion.
Our audits included performing procedures to assess the risks of material misstatement of the financial statements, whether due to error or fraud, and performing procedures that respond to those risks. Such procedures included examining, on a test basis, evidence regarding the amounts and disclosures in the financial statements. Our audits also included evaluating the accounting principles used and significant estimates made by management, as well as evaluating the overall presentation of the financial statements. Our procedures included confirmation of securities owned as of October 31, 2021 by correspondence with the custodian. We believe that our audits provide a reasonable basis for our opinion.
| |
| TAIT, WELLER & BAKER LLP |
Philadelphia, Pennsylvania
December 22, 2021
| WWW.HENNESSYFUNDS.COM |
26
| REPORT OF INDEPENDENT REGISTERED PUBLIC ACCOUNTING FIRM/TRUSTEES AND OFFICERS |
Trustees and Officers of the Fund (Unaudited)
The business and affairs of the Funds are managed under the direction of the Board of Trustees of the Trust, and the Board of Trustees elects the officers of the Trust. From time to time, the Board of Trustees also has appointed advisers to the Board of Trustees (“Advisers”) with the intention of having qualified individuals serve in an advisory capacity to garner experience in the mutual fund and asset management industry and be considered as potential Trustees in the future. There are currently two Advisers, Brian Alexander and Doug Franklin. As Advisers, Mr. Alexander and Mr. Franklin attend meetings of the Board of Trustees and act as non-voting participants. Information pertaining to the Trustees, Advisers, and the officers of the Trust is set forth below. The Trustees and officers serve until their successors are duly elected and qualified or until their earlier death, resignation, or removal. Each Trustee oversees all 16 Hennessy Funds. Unless otherwise indicated, the address of all persons listed below is 7250 Redwood Boulevard, Suite 200, Novato, CA 94945. The Fund’s Statement of Additional Information includes more information about the persons listed below and is available without charge by calling 1-800-966-4354 or by visiting www.hennessyfunds.com.
| Other | |||
| Directorships | |||
| Held Outside | |||
| Name, Age, | of Fund | ||
| and Position Held | Start Date | Principal Occupation(s) | Complex During |
with the Trust | of Service | During Past Five Years | Past Five Years |
| Disinterested Trustees and Advisers | |||
| J. Dennis DeSousa | January 1996 | Mr. DeSousa is a real estate investor. | None. |
| 85 | |||
| Trustee | |||
| Robert T. Doyle | January 1996 | Mr. Doyle has been the Sheriff of | None. |
| 74 | Marin County, California since 1996. | ||
| Trustee | |||
| Claire Garvie | December 2015 | Ms. Garvie is a founder of Kiosk and | None. |
| 47 | as an Adviser | has served as its Chief Operating | |
| Trustee | to the Board | Officer since 2004. Kiosk is a full- | |
| and | service marketing agency with | ||
| December 2021 | offices in the San Francisco Bay Area, | ||
| as a Trustee | Toronto, and Liverpool, UK. | ||
| Gerald P. Richardson | May 2004 | Mr. Richardson is an independent | None. |
| 76 | consultant in the securities industry. | ||
| Trustee |
| HENNESSY FUNDS | 1-800-966-4354 |
27
| Other | |||
| Directorships | |||
| Held Outside | |||
| Name, Age, | of Fund | ||
| and Position Held | Start Date | Principal Occupation(s) | Complex During |
with the Trust | of Service | During Past Five Years | Past Five Years |
| Brian Alexander | March 2015 | Mr. Alexander has worked for the | None. |
| 40 | Sutter Health organization since | ||
| Adviser to the Board | 2011 in various positions. He has | ||
| served as the Chief Executive Officer | |||
| of the Sutter Roseville Medical | |||
| Center since 2018. From 2016 through | |||
| 2018, he served as the Vice President | |||
| of Strategy for the Sutter Health Valley | |||
| Area, which includes 11 hospitals, | |||
| 13 ambulatory surgery centers, | |||
| 16,000 employees, and 1,900 physicians. | |||
| From 2013 through 2016, Mr. Alexander | |||
| served as Sutter Novato Community | |||
| Hospital’s Chief Administrative Officer. | |||
| Doug Franklin | March 2016 | Mr. Franklin is a retired insurance | None. |
| 57 | industry executive. From 1987 | ||
| Adviser to the Board | through 2015, he was employed | ||
| by the Allianz-Fireman’s Fund | |||
| Insurance Company in various | |||
| positions, including as its Chief | |||
| Actuary and Chief Risk Officer. | |||
Interested Trustee(1) | |||
| Neil J. Hennessy | January 1996 as | Mr. Hennessy has been employed | Hennessy |
| 65 | a Trustee and | by Hennessy Advisors, Inc. since | Advisors, Inc. |
| Chairman of the Board, | June 2008 as | 1989 and currently serves as its | |
| Chief Market Strategist, | an officer | Chairman and Chief Executive Officer. | |
| Portfolio Manager, | |||
| and President |
| Name, Age, | ||
| and Position Held | Start Date | Principal Occupation(s) |
with the Trust | of Service | During Past Five Years |
| Officers | ||
| Teresa M. Nilsen | January 1996 | Ms. Nilsen has been employed by Hennessy Advisors, Inc. |
| 55 | since 1989 and currently serves as its President and Chief | |
| Executive Vice President | Operating Officer. | |
| and Treasurer | ||
| Daniel B. Steadman | March 2000 | Mr. Steadman has been employed by Hennessy Advisors, Inc. |
| 65 | since 2000 and currently serves as its Executive Vice President. | |
| Executive Vice President | ||
| and Secretary | ||
| Brian Carlson | December 2013 | Mr. Carlson has been employed by Hennessy Advisors, Inc. |
| 49 | since December 2013 and currently serves as its Chief | |
| Senior Vice President | Compliance Officer and Senior Vice President. | |
| and Head of Distribution |
| WWW.HENNESSYFUNDS.COM |
28
| TRUSTEES AND OFFICERS OF THE FUND |
| Name, Age, | ||
| and Position Held | Start Date | Principal Occupation(s) |
with the Trust | of Service | During Past Five Years |
Jennifer Cheskiewicz(2) | June 2013 | Ms. Cheskiewicz has been employed by Hennessy Advisors, Inc. |
| 44 | as its General Counsel since June 2013. | |
| Senior Vice President and | ||
| Chief Compliance Officer | ||
David Ellison(3) | October 2012 | Mr. Ellison has been employed by Hennessy Advisors, Inc. since |
| 63 | October 2012. He has served as a Portfolio Manager of the | |
| Senior Vice President | Hennessy Large Cap Financial Fund and the Hennessy Small | |
| and Portfolio Manager | Cap Financial Fund since their inception. Mr. Ellison also served | |
| as a Portfolio Manager of the Hennessy Technology Fund from | ||
| its inception until February 2017. Mr. Ellison served as Director, | ||
| CIO, and President of FBR Fund Advisers, Inc. from December | ||
| 1999 to October 2012. | ||
Ryan Kelley(4) | March 2013 | Mr. Kelley has been employed by Hennessy Advisors, Inc. since |
| 49 | October 2012. He has served as Chief Investment Officer of the | |
| Chief Investment Officer, | Hennessy Funds since March 2021 and has served as a Portfolio | |
| Senior Vice President, | Manager of the Hennessy Gas Utility Fund, the Hennessy Large | |
| and Portfolio Manager | Cap Financial Fund, and the Hennessy Small Cap Financial Fund | |
| since October 2014. Mr. Kelley served as Co-Portfolio Manager | ||
| of these same funds from March 2013 through September | ||
| 2014 and as a Portfolio Analyst for the Hennessy Funds from | ||
| October 2012 through February 2013. He has also served as a | ||
| Portfolio Manager of the Hennessy Cornerstone Growth Fund, | ||
| the Hennessy Cornerstone Mid Cap 30 Fund, the Hennessy | ||
| Cornerstone Large Growth Fund, and the Hennessy | ||
| Cornerstone Value Fund since February 2017 and as a Portfolio | ||
| Manager of the Hennessy Total Return Fund, the Hennessy | ||
| Balanced Fund, and the Hennessy Technology Fund since May | ||
| 2018. He served as Co-Portfolio Manager of the Hennessy | ||
| Technology Fund from February 2017 until May 2018. Mr. Kelley | ||
| served as Portfolio Manager of FBR Fund Advisers, Inc. from | ||
| January 2008 to October 2012. | ||
L. Joshua Wein(4) | September 2018 | Mr. Wein has been employed by Hennessy Advisors, Inc. since |
| 48 | 2018. He has served as Co-Portfolio Manager of the Hennessy | |
| Vice President and | Cornerstone Growth Fund, the Hennessy Cornerstone | |
| Co-Portfolio Manager | Mid Cap 30 Fund, the Hennessy Cornerstone Large Growth | |
| Fund, the Hennessy Cornerstone Value Fund, Hennessy Total | ||
| Return Fund, the Hennessy Balanced Fund, the Hennessy Gas | ||
| Utility Fund, and the Hennessy Technology Fund since February | ||
| 2019. He served as a Senior Analyst of these same funds from | ||
| September 2018 through February 2019. Mr. Wein served as | ||
| Director of Alternative Investments and Co-Portfolio Manager | ||
| at Sterling Capital Management from 2008 to 2018. |
_______________
(1) | Mr. Hennessy is considered an “interested person,” as defined in the Investment Company Act of 1940, as amended, because he is an officer of the Trust. |
(2) | The address of this officer is 4800 Bee Caves Road, Suite 100, Austin, TX 78746. |
(3) | The address of this officer is 101 Federal Street, Suite 1615B, Boston, MA 02110. |
(4) | The address of this officer is 1340 Environ Way, Chapel Hill, NC 27517. |
| HENNESSY FUNDS | 1-800-966-4354 |
29
Expense Example (Unaudited)
October 31, 2021
As a shareholder of the Fund, you incur ongoing costs, including management fees, service fees, and other Fund expenses. This Example is intended to help you understand your ongoing costs (in dollars) of investing in the Fund and to compare these costs with the ongoing costs of investing in other mutual funds. The Example is based on an investment of $1,000 invested at the beginning of the period and held for the entire period from May 1, 2021, through October 31, 2021.
Actual Expenses
In the table below, the first line under each of the “Investor Class” and “Institutional Class” headings provides information about actual account values and actual expenses for each share class. You may use this information, together with the amount you invested, to estimate the expenses that you paid over the period. Simply divide your account value by $1,000 (for example, an $8,600 account value divided by $1,000 = 8.6), then multiply the result by the number in the first line under the heading “Expenses Paid During Period” to estimate the expenses you paid on your account during this period. Although the Fund charges no sales loads or transaction fees, you will be assessed fees for outgoing wire transfers, returned checks, and stop payment orders at prevailing rates charged by U.S. Bank Global Fund Services, the Fund’s transfer agent. If you request that a redemption be made by wire transfer, the Fund’s transfer agent charges a $15 fee. IRAs are charged a $15 annual maintenance fee (up to $30 maximum per shareholder for shareholders with multiple IRAs). The examples below include, but are not limited to, management, shareholder servicing, accounting, custody, and transfer agent fees. However, the examples below do not include portfolio trading commissions and related expenses.
Hypothetical Example for Comparison Purposes
In the table below, the second line under each of the “Investor Class” and “Institutional Class” headings provides information about hypothetical account values and hypothetical expenses based on the Fund’s actual expense ratio for each share class and an assumed rate of return of 5% per year before expenses, which is not the Fund’s actual return for such share class. The hypothetical account values and expenses may not be used to estimate the actual ending account balance or expenses you paid for the period. You may use this information to compare the ongoing costs of investing in the Fund and other funds. To do so, compare these 5% hypothetical examples with the 5% hypothetical examples that appear in the shareholder reports of the other funds. Please note that the expenses shown in the table are meant to highlight your ongoing costs only. Therefore, the second lines under “Investor Class” and “Institutional Class” are useful in comparing ongoing costs only and will not help you determine the relative total costs of owning different funds.
| WWW.HENNESSYFUNDS.COM |
30
| EXPENSE EXAMPLE |
| Expenses Paid | |||
| Beginning | Ending | During Period(1) | |
| Account Value | Account Value | May 1, 2021 – | |
May 1, 2021 | October 31, 2021 | October 31, 2021 | |
| Investor Class | |||
| Actual | $1,000.00 | $1,052.10 | $6.67 |
| Hypothetical (5% return before expenses) | $1,000.00 | $1,018.70 | $6.56 |
| Institutional Class | |||
| Actual | $1,000.00 | $1,053.00 | $5.49 |
| Hypothetical (5% return before expenses) | $1,000.00 | $1,019.86 | $5.40 |
(1) | Expenses are equal to the Fund’s annualized expense ratio of 1.29% for Investor Class shares or 1.06% for Institutional Class shares, as applicable, multiplied by the average account value over the period, multiplied by 184/365 days (to reflect the half-year period). |
| HENNESSY FUNDS | 1-800-966-4354 |
31
How to Obtain a Copy of the Fund’s Proxy
Voting Policy and Proxy Voting Records
A description of the policies and procedures the Fund uses to determine how to vote proxies relating to portfolio securities is available without charge (1) by calling 1-800-966-4354, (2) on the Hennessy Funds’ website at www.hennessyfunds.com/proxy-voting/voting-policy, or (3) on the U.S. Securities and Exchange Commission’s (the “SEC”) website at www.sec.gov. The Fund’s proxy voting record is available without charge on both the Hennessy Funds’ website at www.hennessyfunds.com/proxy-voting/voting-record and the SEC’s website at www.sec.gov no later than August 31 for the prior 12 months ending June 30.
Availability of Quarterly Portfolio Schedule
The Fund files a complete schedule of portfolio holdings with the SEC for the first and third quarters of each fiscal year as an exhibit to its reports on Form N-PORT. The Fund’s Form N-PORT reports are available on the SEC’s website at www.sec.gov or on request by calling 1-800-966-4354.
Federal Tax Distribution Information (Unaudited)
For fiscal year 2021, certain dividends paid by the Fund may be subject to a maximum tax rate of 23.8%, as provided for by the Jobs and Growth Tax Relief Reconciliation Act of 2003. The percentage of dividends declared from ordinary income designated as qualified dividend income was 100.00%.
For corporate shareholders, the percent of ordinary income distributions that qualified for the corporate dividends received deduction for fiscal year 2021 was 100.00%.
The percentage of taxable ordinary income distributions that were designated as short-term capital gain distributions under Section 871(k)(2)(C) of the Internal Revenue Code of 1986, as amended, for the Fund was 0.00%.
Important Notice Regarding Delivery
of Shareholder Documents
To help keep the Fund’s costs as low as possible, we generally deliver a single copy of shareholder reports, proxy statements, and prospectuses to shareholders who share an address and have the same last name. This process does not apply to account statements. You may request an individual copy of a shareholder document at any time. If you would like to receive separate mailings of shareholder documents, please call U.S. Bank Global Fund Services at 1-800-261-6950 or 1-414-765-4124, and individual delivery will begin within 30 days of your request. If your account is held through a financial institution or other intermediary, please contact such intermediary directly to request individual delivery.
Electronic Delivery
As permitted by SEC regulations, the Fund’s shareholder reports are made available on a website, and unless you sign up for eDelivery or elect to receive paper copies as detailed below, you will be notified by mail each time a report is posted and provided with a website link to access the report.
The Fund also offers shareholders the option to receive all notices, account statements, prospectuses, tax forms, and shareholder reports online. To sign up for eDelivery or change your delivery preference, please visit www.hennessyfunds.com/account.
To elect to receive paper copies of all future reports free of charge, please call U.S. Bank Global Fund Services at 1-800-261-6950 or 1-414-765-4124.
Subscribe to receive our team’s unique market and sector insights delivered to your inbox
www.hennessyfunds.com/subscribe
Follow us on social media
| | |
| WWW.HENNESSYFUNDS.COM |
32
| PROXY VOTING — PRIVACY POLICY |
Liquidity Risk Management Program
In accordance with Rule 22e-4 under the Investment Company Act of 1940, as amended (the “Liquidity Rule”), we have adopted and implemented a liquidity risk management program (the “Liquidity Program”). The purpose of the Liquidity Program is to assess and manage the Fund’s liquidity risk, which is the risk that the Fund would not be able to meet requests to redeem Fund shares without significant dilution of the remaining shareholders’ interests in the Fund. The Board of Trustees of the Fund (the “Board”) designated a committee comprising representatives of Hennessy Advisors, Inc., the investment adviser to the Fund, as the administrator of the Liquidity Program (the “Program Administrator”).
The Program Administrator provided a written report regarding the Liquidity Program to the Board in advance of its meeting on June 2, 2021. The report covered the period from June 1, 2020, through May 31, 2021. The report addressed the operation of the Liquidity Program, assessed the adequacy and effectiveness of its implementation, and described any material changes to the Liquidity Program during the review period. The Trust’s chief compliance officer presented the report to the Board at the meeting and provided additional information regarding the Liquidity Program. The Board reviewed the Liquidity Program and considered, among other items, the following:
| 1. | The Program Administrator reviewed daily historical net redemption activity during the review period and during prior periods with higher-than-average redemption activity and concluded that the Fund has historically been able to meet requests to redeem Fund shares without significant dilution to the Fund’s remaining shareholders, and the Program Administrator expects the Fund to be able to continue to do so in the future during both normal and reasonably foreseeable stressed conditions. | |
| 2. | The Fund holds assets that are highly liquid investments and is therefore not required to establish a highly liquid investment minimum for the Fund or adopt policies and procedures for responding to a highly liquid investment minimum shortfall. | |
| 3. | The Program Administrator did not make any material changes to the Liquidity Program during the review period and did not recommend any changes to the Liquidity Program or the model inputs used to determine the liquidity classification of each security held by the Fund. | |
| 4. | The Program Administrator concluded that the Liquidity Program was reasonably designed to assess and manage the Fund’s liquidity risk, complies with the requirements of the Liquidity Rule, and was operating as intended during the review period. |
Privacy Policy
We collect the following personal information about you:
| 1. | Information we receive from you in applications or other forms, correspondence, or conversations, including, but not limited to, your name, address, phone number, social security number, assets, income, and date of birth; | |
| 2. | Information about your transactions with us, our affiliates, or others, including, but not limited to, your account number and balance, payments history, parties to transactions, cost basis information, and other financial information; and |
| HENNESSY FUNDS | 1-800-966-4354 |
33
| 3. | Other personal information we collect from various sources, even if you have not entered into a prior transaction with us, including the following: |
| • | Name, alias, address, unique personal identifier, online identifier, IP address, email address, telephone number, account name, and other similar identifiers; | |
| • | Age and marital status; | |
| • | Commercial information, including records of products purchased; | |
| • | Browsing history, search history, and information on interaction with our website; | |
| • | Geolocation data; | |
| • | Employment and employment history, educational history, financial information, and purchasing and consuming histories or tendencies; and | |
| • | Inferences drawn from the above-listed information to create a profile about your preferences, characteristics, predispositions, and behavior. |
We collect this information directly from you, indirectly in the course of providing services to you, directly and indirectly from your activity on our website, from broker dealers, marketing agencies, and other third parties that interact with us in connection with the services we perform and products we offer, and from anonymized and aggregated consumer information.
We use this information to fulfill the reason you provided the information to us, to provide you with other relevant products that you request from us, to provide you with information about products that may interest you, to improve our website or present our website’s contents to you, and as otherwise described to you when collecting your personal information.
We do not disclose any personal information to unaffiliated third parties, except as permitted by law. We may disclose your personal information to our affiliates, vendors, and service providers for a business purpose. For example, we are permitted by law to disclose all of the information we collect, as described above, to our transfer agent to process your transactions. When disclosing your personal information to third parties, we enter into a contract with each third party describing the purpose of such disclosure and requiring that such personal information be kept confidential and not used for any purpose except to perform the services contracted or respond to regulatory or law enforcement requests.
Furthermore, we restrict access to your personal information to those persons who require such information to provide products or services to you. As a result, we do not provide a means for opting out of our limited sharing of your information. We maintain physical, electronic, and procedural safeguards that comply with federal standards to guard your personal information.
If you hold shares of the Funds through a financial intermediary, including, but not limited to, a broker-dealer, bank, or trust company, the privacy policy of your financial intermediary governs how your personal information is shared with unaffiliated third parties.
Supplemental Privacy Notice for Residents of California
The California Consumer Privacy Act of 2018 (the “CCPA”) provides you, as a California resident, with certain additional rights relating to your personal information.
| WWW.HENNESSYFUNDS.COM |
34
| PRIVACY POLICY |
Under the CCPA, you have the right to request that we disclose to you the categories of personal information we have collected about you over the past 12 months, the categories of sources of such information, our business purpose for collecting the information, the categories of third parties, if any, with whom we shared the information, and the specific information we have collected about you. You also have the right to request that we delete any of your personal information, and, unless an exception applies, we will delete such information upon receiving and confirming your request. To make a request, call us at 1-800-966-4354, email us at privacy@hennessyfunds.com, or go to www.hennessyfunds.com/contact. We will not discriminate against you for exercising your rights under the CCPA. Further, we will not collect additional categories of your personal information or use the personal information we collected for materially different, unrelated, or incompatible purposes without providing you notice.
| HENNESSY FUNDS | 1-800-966-4354 |
35
(This Page Intentionally Left Blank.)
For information, questions, or assistance, please call
The Hennessy Funds
1-800-966-4354 or 1-415-899-1555
INVESTMENT ADVISOR
Hennessy Advisors, Inc.
7250 Redwood Boulevard, Suite 200
Novato, California 94945
ADMINISTRATOR,
TRANSFER AGENT,
DIVIDEND PAYING AGENT, &
SHAREHOLDER SERVICING AGENT
U.S. Bancorp Fund Services, LLC
d/b/a U.S. Bank Global Fund Services
P.O. Box 701
Milwaukee, Wisconsin 53201-0701
CUSTODIAN
U.S. Bank N.A.
Custody Operations
1555 North River Center Drive, Suite 302
Milwaukee, Wisconsin 53212
TRUSTEES
Neil J. Hennessy
Robert T. Doyle
J. Dennis DeSousa
Claire Garvie
Gerald P. Richardson
COUNSEL
Foley & Lardner LLP
777 East Wisconsin Avenue
Milwaukee, Wisconsin 53202-5306
INDEPENDENT REGISTERED
PUBLIC ACCOUNTING FIRM
Tait, Weller & Baker LLP
Two Liberty Place
50 South 16th Street, Suite 2900
Philadelphia, Pennsylvania 19102-2529
DISTRIBUTOR
Quasar Distributors, LLC
111 East Kilbourn Avenue, Suite 2200
Milwaukee, Wisconsin 53202
www.hennessyfunds.com | 1-800-966-4354
This report has been prepared for shareholders and may be distributed to
others only if preceded or accompanied by a current prospectus.
ANNUAL REPORT
OCTOBER 31, 2021

HENNESSY CORNERSTONE VALUE FUND
Investor Class HFCVX
Institutional Class HICVX
www.hennessyfunds.com | 1-800-966-4354
(This Page Intentionally Left Blank.)
Contents
| Letter to Shareholders | 2 |
| Performance Overview | 4 |
| Financial Statements | |
| Schedule of Investments | 7 |
| Statement of Assets and Liabilities | 11 |
| Statement of Operations | 12 |
| Statements of Changes in Net Assets | 13 |
| Financial Highlights | 14 |
| Notes to the Financial Statements | 18 |
| Report of Independent Registered Public Accounting Firm | 26 |
| Trustees and Officers of the Fund | 27 |
| Expense Example | 30 |
| Proxy Voting Policy and Proxy Voting Records | 32 |
| Availability of Quarterly Portfolio Schedule | 32 |
| Federal Tax Distribution Information | 32 |
| Important Notice Regarding Delivery of Shareholder Documents | 32 |
| Electronic Delivery | 32 |
| Liquidity Risk Management Program | 33 |
| Privacy Policy | 33 |
| HENNESSY FUNDS | 1-800-966-4354 |
December 2021
Dear Hennessy Funds Shareholder:
What a year this has been. While it doesn’t feel that we are out of the “pandemic” phase of the coronavirus crisis, we look forward to a day when we will eventually see fewer cases and potentially less severe variants. We feel extremely grateful to the many healthcare workers who have continued to work tirelessly during the recent surge. As we move through the next year, we hope that new U.S. cases will decline and that many other parts of the world will see improvements as well.
What a year this has been! As measured by the total return of the S&P 500® Index, as of October 31, 2021, the market was up 24.04% calendar year to date. This comes in the wake of a tumultuous 2020 in which the market plunged in the beginning of the pandemic and recovered dramatically to end the year up 18.40%. Interestingly, 18% appears to be a repeating number in the past dozen years. From the low point of the Financial Crisis (March 9, 2009) to the high point reached just prior to the COVID-19 pandemic (February 12, 2020), the S&P 500® Index was up 18.27% per year. We are well aware that past results are not predictive of the future, and we find ourselves naturally skeptical of such strong returns. But, as shown in the chart below, we find that the most common annual total returns of the market over the past 102 years range between 20% and 30% with the second most common being between 10% and 20%:
Source: Bloomberg L.P.
We will say it again, after showing a chart like the one above: Past results are not predictive of the future. Instead, we look at where we are right now – in the economy, in the market, in the business cycle – to reflect on where we have come from and where we may be going. U.S. GDP is strong and growing, interest rates remain low, and earnings growth and profitability remain robust. We believe stocks are trading at reasonable valuations when viewed as a whole, with the S&P 500® Index at 21.0x estimated earnings for 2022. Furthermore, we believe corporate balance sheets are healthy, with high levels of excess cash, which could support growth, increases in dividends, more share buybacks, and future acquisitions. Uncertainty and volatility can manifest at any time in the stock market, and the current market is no different. Investors have questions about inflation, worldwide supply chain issues, and what could drive the next boost in earnings. While these concerns are warranted, we continue to believe that overall the positives outweigh the negatives, and here at Hennessy we continue to see opportunity in the market and in our Funds.
| WWW.HENNESSYFUNDS.COM |
2
| LETTER TO SHAREHOLDERS |
What a (fiscal) year this has been!!! For our fiscal year ended October 31, 2021, the S&P 500® Index rose 42.91% on a total return basis, setting a new all-time high on the final day of the period. Except for a short 21-trading-day period that began on September 2 during which the market fell 5.13% only to rebound to new highs just 13 trading days later, the market has been on a continuous march higher. We saw a dramatic shift in market leadership as many of the sectors that underperformed during our last fiscal year soared in fiscal year 2021. Small-caps beat mid-caps, which in turn beat large-caps. The Energy and Financials sectors skyrocketed during the 12-month period, as reflected by the S&P 500® Energy Sector’s total return of 111.29% and the Russell 1000® Index Financials’ total return of 70.87%. Both of these sectors were among the worst performing in our fiscal year 2020, so a bounce back in our fiscal year 2021, while not a foregone conclusion, was a distinct possibility.
Overall, we are pleased with the performance of our mutual funds during the fiscal year. On an absolute basis, each of our 16 Funds achieved total returns greater than 10% and seven outperformed their primary benchmark. Ten of our 11 domestic equity-only Funds outperformed the S&P 500® Index and posted total returns of 45% or higher. Our four best-performing funds were concentrated in the Energy and Financials sectors. While some of our Funds certainly benefited from being in the “right” sector at the “right” time, we also believe this was a favorable period for our investment style of high-conviction investing and concentrated portfolio construction.
What will the coming year bring? As mentioned in our last shareholder letter (June 2021), we understand that even the greatest bull markets experience corrections along the way, and the last time the S&P 500® Index dropped over 10% was in February/March of 2020. Whether or not a correction occurs sooner or later, we believe the market as a whole has more room to run. We see many factors that could drive the market higher from here: strong GDP growth and increasing corporate earnings, a potentially lower-for-longer interest rate environment, accommodative fiscal and monetary policies, a healthy and robust financial system, low unemployment and solid wage growth, and strong corporate balance sheets with plenty of cash.
Thank you for your interest and for investing with us. We remain committed to managing our portfolios for long-term performance, ever mindful of downside risk. With so many investment options available to you, we are grateful for the trust you put in us and for your continued interest in our family of Funds. If you have any questions or would like to speak with us, please don’t hesitate to call us directly at (800) 966-4354.
Best regards,
| |
| |
| Ryan C. Kelley | |
| Chief Investment Officer |
Past performance does not guarantee future results. To obtain current standardized performance for the Hennessy Funds, visit https://www.hennessyfunds.com/funds/price-performance.
Mutual fund investing involves risk. Principal loss is possible.
Opinions expressed are those of Ryan C. Kelley and are subject to change, are not guaranteed, and should not be considered investment advice.
The Dow Jones Industrial Average and S&P 500® Index are commonly used to measure the performance of U.S. stocks. The S&P 500® Energy Index comprises those companies included in the S&P 500® Index that are classified in the Energy sector. The Russell 1000® Index Financials is a subset of the Russel 1000® Index that measures the performance of securities classified in the Financials sector of the large-capitalization U.S. equity market. The indices are used herein for comparative purposes in accordance with SEC regulations. One cannot invest directly in an index. All returns are shown on a total return basis.
| HENNESSY FUNDS | 1-800-966-4354 |
3
Performance Overview (Unaudited)
CHANGE IN VALUE OF $10,000 INVESTMENT
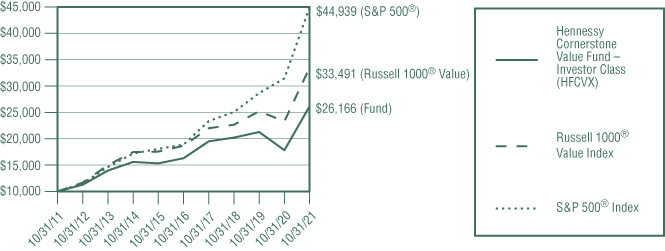
This graph illustrates the performance of an initial investment of $10,000 made in the Fund 10 years ago and assumes the reinvestment of dividends and capital gains.
AVERAGE ANNUAL TOTAL RETURN FOR PERIODS ENDED OCTOBER 31, 2021
| One | Five | Ten | ||
Year | Years | Years | ||
| Hennessy Cornerstone Value Fund – | ||||
| Investor Class (HFCVX) | 46.82% | 9.92% | 10.10% | |
| Hennessy Cornerstone Value Fund – | ||||
| Institutional Class (HICVX) | 47.19% | 10.16% | 10.33% | |
Russell 1000® Value Index | 43.76% | 12.39% | 12.85% | |
S&P 500® Index | 42.91% | 18.93% | 16.21% |
Expense ratios: 1.30% (Investor Class); 1.08% (Institutional Class)
Performance data quoted represents past performance; past performance does not guarantee future results. The investment return and principal value of an investment will fluctuate so that an investor’s shares, when redeemed, may be worth more or less than their original cost. The performance table does not reflect the deduction of taxes that a shareholder would pay on Fund distributions or the redemption of Fund shares. Current performance of the Fund may be lower or higher than the performance quoted. Performance data current to the most recent month end may be obtained by visiting www.hennessyfunds.com.
The Russell 1000® Value Index comprises those Russell 1000® companies with lower price-to-book ratios and lower forecasted growth value. The S&P 500® Index is a capitalization-weighted index that is designed to represent the broad domestic economy through changes in the aggregate market value of 500 stocks across all major industries. One cannot invest directly in an index. These indices are used for comparative purposes in accordance with Securities and Exchange Commission regulations.
Frank Russell Company (“Russell”) is the source and owner of the trademarks, service marks, and copyrights related to the Russell Indexes. Russell® is a trademark of Frank Russell Company. Neither Russell nor its licensors accept any liability for any errors or omissions in the Russell Indexes or Russell ratings or underlying data and no party may rely on any Russell Indexes or Russell ratings or underlying data contained in this communication. No further distribution of Russell data is permitted without Russell’s express written consent. Russell does not promote, sponsor, or endorse the content of this communication.
| WWW.HENNESSYFUNDS.COM |
4
| PERFORMANCE OVERVIEW |
Standard & Poor’s Financial Services is the source and owner of the S&P® and S&P 500® trademarks.
The expense ratios presented are from the most recent prospectus. The expense ratios for the current reporting period are available in the Financial Highlights section of this report.
PERFORMANCE NARRATIVE
Portfolio Managers Neil J. Hennessy, Ryan C. Kelley, CFA, and L. Joshua Wein, CAIA
Performance:
For the one-year period ended October 31, 2021, the Investor Class of the Hennessy Cornerstone Value Fund returned 46.82%, outperforming both the Russell 1000® Value Index (the Fund’s primary benchmark) and the S&P 500® Index, which returned 43.76% and 42.91%, respectively, for the same period.
The Fund’s outperformance relative to its primary benchmark resulted from both stock selection and sector allocation. Stock selection in the Consumer Discretionary, Consumer Staples, and Energy sectors contributed to outperformance. The largest contributors to performance within each of these sectors during the period were Home Depot, Inc., Walgreens Boots Alliance, Inc., and Canadian Natural Resources, Ltd., respectively. During the period, all sectors contributed to Fund gains. The Fund’s overweight position in the Energy sector and underweight position in the Utilities sector most significantly contributed to the Fund’s relative performance.
The Fund continues to hold the companies mentioned with the exception of Walgreens Boots Alliance.
Portfolio Strategy:
The Fund utilizes a formula-based approach designed to result in a portfolio of potentially undervalued, profitable, large-cap companies with high dividend yields. In essence, the strategy seeks 50 established companies that are generating sufficient cash flows to pay generous dividends but that may be overlooked by other investors.
Investment Commentary:
After a tumultuous 2020 and a strong 2021, we believe that the outlook for U.S. stocks remains positive. After a sharp contraction in economic activity as a result of the COVID-19 pandemic, the U.S. economy is growing steadily and demonstrating incredible resilience. We are benefiting from increased employment, rapid wage gains, and robust economic activity. Corporate earnings are on the rise, interest rates remain low, and Federal Reserve policies continue to accommodate a strong economy.
Sectors where the Fund currently maintains significant overweight positions relative to its benchmark include Energy and Consumer Staples. Representative holdings within the Energy sector include Canadian Natural Resources, Suncor Energy, Inc., and ConocoPhillips. Consumer Staples exposure includes companies such as The Kroger Company, PepsiCo, Inc., and The Proctor & Gamble Company. We believe these companies should benefit from continued growth in the economy in the United States and abroad.
_______________
Opinions expressed are those of the Portfolio Managers as of the date written and are subject to change, are not guaranteed, and should not be considered investment advice or an indication of trading intent.
| HENNESSY FUNDS | 1-800-966-4354 |
5
The Fund may invest in medium-capitalization companies, which may have more limited liquidity and greater price volatility than large-capitalization companies.The Fund’s formula-based strategy may cause the Fund to buy or sell securities at times when it may not be advantageous. Please see the Fund’s prospectus for a more complete discussion of these and other risks.
References to specific securities should not be considered a recommendation to buy or sell any security. Fund holdings and sector allocations are subject to change. Please refer to the Schedule of Investments included in this report for additional portfolio information.
Earnings growth is not a measure of the Fund’s future performance.
Cash flow refers to the net amount of cash and cash equivalents transferred into and out of a company. Dividend yield is calculated by dividing a company’s dividends per share by its market price per share.
| WWW.HENNESSYFUNDS.COM |
6
| PERFORMANCE OVERVIEW/SCHEDULE OF INVESTMENTS |
Financial Statements
Schedule of Investments as of October 31, 2021 |
HENNESSY CORNERSTONE VALUE FUND
(% of Net Assets)
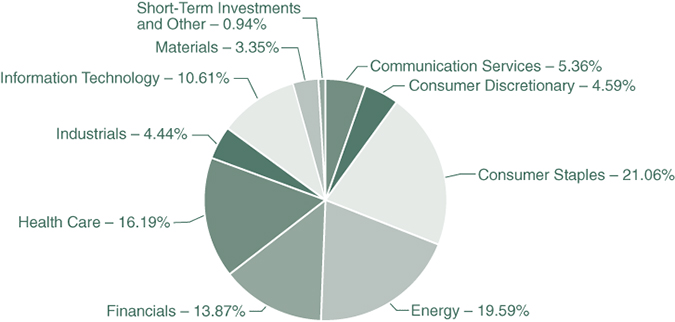
| TOP TEN HOLDINGS (EXCLUDING MONEY MARKET FUNDS) | % NET ASSETS |
| Canadian Natural Resources Ltd. | 2.63% |
| The Home Depot, Inc. | 2.51% |
| ConocoPhillips | 2.50% |
| The Bank of New York Mellon Corp. | 2.39% |
| United Parcel Service, Inc., Class B | 2.33% |
| Suncor Energy, Inc. | 2.29% |
| Pfizer, Inc. | 2.29% |
| CVS Health Corp. | 2.27% |
| Petroleo Brasileiro SA – ADR | 2.22% |
| GlaxoSmithKline PLC – ADR | 2.21% |
Note: For presentation purposes, the Fund has grouped some of the industry categories. For purposes of categorizing securities for compliance with Section 8(b)(1) of the Investment Company Act of 1940, as amended, the Fund uses more specific industry classifications.
The Global Industry Classification Standard (GICS®) was developed by and is the exclusive property and a service mark of MSCI, Inc. and Standard & Poor’s Financial Services LLC. It has been licensed for use by the Hennessy Funds.
| HENNESSY FUNDS | 1-800-966-4354 |
7
| COMMON STOCKS – 99.06% | Number | % of | ||||||||||
| of Shares | Value | Net Assets | ||||||||||
| Communication Services – 5.36% | ||||||||||||
| AT&T, Inc. | 163,060 | $ | 4,118,896 | 1.58 | % | |||||||
| BCE, Inc. (a) | 105,400 | 5,424,938 | 2.09 | % | ||||||||
| Verizon Communications, Inc. | 82,800 | 4,387,572 | 1.69 | % | ||||||||
| 13,931,406 | 5.36 | % | ||||||||||
| Consumer Discretionary – 4.59% | ||||||||||||
| McDonald’s Corp. | 22,000 | 5,402,100 | 2.08 | % | ||||||||
| The Home Depot, Inc. | 17,500 | 6,505,450 | 2.51 | % | ||||||||
| 11,907,550 | 4.59 | % | ||||||||||
| Consumer Staples – 21.06% | ||||||||||||
| Altria Group, Inc. | 102,900 | 4,538,919 | 1.75 | % | ||||||||
| British American Tobacco PLC – ADR (a) | 127,900 | 4,466,268 | 1.72 | % | ||||||||
| Colgate-Palmolive Co. | 60,600 | 4,617,114 | 1.78 | % | ||||||||
| Mondelez International, Inc. | 85,400 | 5,187,196 | 2.00 | % | ||||||||
| PepsiCo, Inc. | 35,100 | 5,672,160 | 2.18 | % | ||||||||
| Philip Morris International, Inc. | 53,900 | 5,095,706 | 1.96 | % | ||||||||
| The Coca-Cola Co. | 91,800 | 5,174,766 | 1.99 | % | ||||||||
| The Kraft Heinz Co. | 123,500 | 4,432,415 | 1.71 | % | ||||||||
| The Kroger Co. | 139,300 | 5,574,786 | 2.15 | % | ||||||||
| The Procter & Gamble Co. | 36,900 | 5,276,331 | 2.03 | % | ||||||||
| Unilever PLC – ADR (a) | 87,000 | 4,661,460 | 1.79 | % | ||||||||
| 54,697,121 | 21.06 | % | ||||||||||
| Energy – 19.59% | ||||||||||||
| BP PLC – ADR (a) | 186,400 | 5,366,456 | 2.07 | % | ||||||||
| Canadian Natural Resources Ltd. (a) | 160,600 | 6,827,106 | 2.63 | % | ||||||||
| Chevron Corp. | 44,875 | 5,137,739 | 1.98 | % | ||||||||
| ConocoPhillips | 87,100 | 6,488,079 | 2.50 | % | ||||||||
| Exxon Mobil Corp. | 81,210 | 5,235,608 | 2.01 | % | ||||||||
| Petroleo Brasileiro SA – ADR (a) | 586,600 | 5,760,412 | 2.22 | % | ||||||||
| Royal Dutch Shell PLC – ADR (a) | 111,700 | 5,129,264 | 1.97 | % | ||||||||
| Suncor Energy, Inc. (a) | 226,400 | 5,954,320 | 2.29 | % | ||||||||
| TotalEnergies SE – ADR (a) | 99,500 | 4,985,945 | 1.92 | % | ||||||||
| 50,884,929 | 19.59 | % | ||||||||||
| Financials – 13.87% | ||||||||||||
| Citigroup, Inc. | 65,900 | 4,557,644 | 1.76 | % | ||||||||
| JPMorgan Chase & Co. | 30,400 | 5,164,656 | 1.99 | % | ||||||||
The accompanying notes are an integral part of these financial statements.
| WWW.HENNESSYFUNDS.COM |
8
| SCHEDULE OF INVESTMENTS |
| COMMON STOCKS | Number | % of | ||||||||||
| of Shares | Value | Net Assets | ||||||||||
| Financials (Continued) | ||||||||||||
| Manulife Financial Corp. (a) | 222,700 | $ | 4,340,423 | 1.67 | % | |||||||
| MetLife, Inc. | 77,100 | 4,841,880 | 1.86 | % | ||||||||
| Royal Bank of Canada (a) | 52,800 | 5,491,728 | 2.12 | % | ||||||||
| The Bank of New York Mellon Corp. | 104,900 | 6,210,080 | 2.39 | % | ||||||||
| Toronto-Dominion Bank (a) | 74,600 | 5,409,246 | 2.08 | % | ||||||||
| 36,015,657 | 13.87 | % | ||||||||||
| Health Care – 16.19% | ||||||||||||
| AbbVie, Inc. | 42,300 | 4,850,541 | 1.87 | % | ||||||||
| Bristol-Myers Squibb Co. | 74,300 | 4,339,120 | 1.67 | % | ||||||||
| CVS Health Corp. | 66,100 | 5,901,408 | 2.27 | % | ||||||||
| Gilead Sciences, Inc. | 73,400 | 4,762,192 | 1.83 | % | ||||||||
| GlaxoSmithKline PLC – ADR (a) | 135,800 | 5,748,414 | 2.21 | % | ||||||||
| Johnson & Johnson | 28,800 | 4,690,944 | 1.81 | % | ||||||||
| Merck & Co., Inc. | 63,300 | 5,573,565 | 2.15 | % | ||||||||
| Organon & Co. | 6,430 | 236,303 | 0.09 | % | ||||||||
| Pfizer, Inc. | 136,000 | 5,948,640 | 2.29 | % | ||||||||
| 42,051,127 | 16.19 | % | ||||||||||
| Industrials – 4.44% | ||||||||||||
| Raytheon Technologies Corp. | 61,600 | 5,473,776 | 2.11 | % | ||||||||
| United Parcel Service, Inc., Class B | 28,400 | 6,062,548 | 2.33 | % | ||||||||
| 11,536,324 | 4.44 | % | ||||||||||
| Information Technology – 10.61% | ||||||||||||
| Cisco Systems, Inc. | 99,800 | 5,585,806 | 2.15 | % | ||||||||
| Corning, Inc. | 116,100 | 4,129,677 | 1.59 | % | ||||||||
| HP, Inc. | 154,900 | 4,698,117 | 1.81 | % | ||||||||
| Intel Corp. | 72,900 | 3,572,100 | 1.37 | % | ||||||||
| International Business Machines Corp. | 37,900 | 4,741,290 | 1.83 | % | ||||||||
| Texas Instruments, Inc. | 25,800 | 4,836,984 | 1.86 | % | ||||||||
| 27,563,974 | 10.61 | % | ||||||||||
| Materials – 3.35% | ||||||||||||
| Dow, Inc. | 74,400 | 4,164,168 | 1.61 | % | ||||||||
| Newmont Corp. | 83,800 | 4,525,200 | 1.74 | % | ||||||||
| 8,689,368 | 3.35 | % | ||||||||||
| Total Common Stocks | ||||||||||||
| (Cost $223,777,260) | 257,277,456 | 99.06 | % | |||||||||
The accompanying notes are an integral part of these financial statements.
| HENNESSY FUNDS | 1-800-966-4354 |
9
| SHORT-TERM INVESTMENTS – 0.89% | Number | % of | ||||||||||
| of Shares | Value | Net Assets | ||||||||||
| Money Market Funds – 0.89% | ||||||||||||
| First American Government Obligations Fund, | ||||||||||||
| Institutional Class, 0.03% (b) | 2,306,252 | $ | 2,306,252 | 0.89 | % | |||||||
| Total Short-Term Investments | ||||||||||||
| (Cost $2,306,252) | 2,306,252 | 0.89 | % | |||||||||
| Total Investments | ||||||||||||
| (Cost $226,083,512) – 99.95% | 259,583,708 | 99.95 | % | |||||||||
| Other Assets in Excess of Liabilities – 0.05% | 137,478 | 0.05 | % | |||||||||
TOTAL NET ASSETS – 100.00% | $ | 259,721,186 | 100.00 | % | ||||||||
Percentages are stated as a percent of net assets.
ADR – American Depositary Receipt
PLC – Public Limited Company
| (a) | U.S.-traded security of a foreign corporation. |
| (b) | The rate listed is the fund’s seven-day yield as of October 31, 2021. |
Summary of Fair Value Exposure as of October 31, 2021
The following is a summary of the inputs used to value the Fund’s net assets as of October 31, 2021 (see Note 3 in the accompanying Notes to the Financial Statements):
| Common Stocks | Level 1 | Level 2 | Level 3 | Total | ||||||||||||
| Communication Services | $ | 13,931,406 | $ | — | $ | — | $ | 13,931,406 | ||||||||
| Consumer Discretionary | 11,907,550 | — | — | 11,907,550 | ||||||||||||
| Consumer Staples | 54,697,121 | — | — | 54,697,121 | ||||||||||||
| Energy | 50,884,929 | — | — | 50,884,929 | ||||||||||||
| Financials | 36,015,657 | — | — | 36,015,657 | ||||||||||||
| Health Care | 42,051,127 | — | — | 42,051,127 | ||||||||||||
| Industrials | 11,536,324 | — | — | 11,536,324 | ||||||||||||
| Information Technology | 27,563,974 | — | — | 27,563,974 | ||||||||||||
| Materials | 8,689,368 | — | — | 8,689,368 | ||||||||||||
| Total Common Stocks | $ | 257,277,456 | $ | — | $ | — | $ | 257,277,456 | ||||||||
| Short-Term Investments | ||||||||||||||||
| Money Market Funds | $ | 2,306,252 | $ | — | $ | — | $ | 2,306,252 | ||||||||
| Total Short-Term Investments | $ | 2,306,252 | $ | — | $ | — | $ | 2,306,252 | ||||||||
| Total Investments | $ | 259,583,708 | $ | — | $ | — | $ | 259,583,708 | ||||||||
The accompanying notes are an integral part of these financial statements.
| WWW.HENNESSYFUNDS.COM |
10
| SCHEDULE OF INVESTMENTS/STATEMENT OF ASSETS AND LIABILITIES |
Financial Statements
Statement of Assets and Liabilities as of October 31, 2021 |
| ASSETS: | ||||
| Investments in securities, at value (cost $226,083,512) | $ | 259,583,708 | ||
| Dividends and interest receivable | 694,746 | |||
| Receivable for fund shares sold | 5,321 | |||
| Prepaid expenses and other assets | 25,694 | |||
| Total assets | 260,309,469 | |||
| LIABILITIES: | ||||
| Payable for fund shares redeemed | 106,479 | |||
| Payable to advisor | 162,399 | |||
| Payable to administrator | 73,113 | |||
| Payable to auditor | 22,556 | |||
| Accrued distribution fees | 175,835 | |||
| Accrued service fees | 21,479 | |||
| Accrued trustees fees | 6,604 | |||
| Accrued expenses and other payables | 19,818 | |||
| Total liabilities | 588,283 | |||
| NET ASSETS | $ | 259,721,186 | ||
| NET ASSETS CONSISTS OF: | ||||
| Capital stock | $ | 216,100,531 | ||
| Total distributable earnings | 43,620,655 | |||
| Total net assets | $ | 259,721,186 | ||
| NET ASSETS: | ||||
| Investor Class | ||||
| Shares authorized (no par value) | Unlimited | |||
| Net assets applicable to outstanding shares | $ | 254,225,270 | ||
| Shares issued and outstanding | 12,979,888 | |||
| Net asset value, offering price, and redemption price per share | $ | 19.59 | ||
| Institutional Class | ||||
| Shares authorized (no par value) | Unlimited | |||
| Net assets applicable to outstanding shares | $ | 5,495,916 | ||
| Shares issued and outstanding | 280,017 | |||
| Net asset value, offering price, and redemption price per share | $ | 19.63 | ||
The accompanying notes are an integral part of these financial statements.
| HENNESSY FUNDS | 1-800-966-4354 |
11
Financial Statements
Statement of Operations for the year ended October 31, 2021 |
| INVESTMENT INCOME: | ||||
Dividend income(1) | $ | 9,003,221 | ||
| Interest income | 831 | |||
| Total investment income | 9,004,052 | |||
| EXPENSES: | ||||
| Investment advisory fees (See Note 5) | 1,820,137 | |||
| Distribution fees – Investor Class (See Note 5) | 361,063 | |||
| Administration, accounting, custody, and transfer agent fees (See Note 5) | 280,217 | |||
| Service fees – Investor Class (See Note 5) | 240,709 | |||
| Sub-transfer agent expenses – Investor Class (See Note 5) | 153,250 | |||
| Sub-transfer agent expenses – Institutional Class (See Note 5) | 3,750 | |||
| Federal and state registration fees | 32,217 | |||
| Compliance expense (See Note 5) | 27,448 | |||
| Audit fees | 22,556 | |||
| Trustees’ fees and expenses | 19,875 | |||
| Reports to shareholders | 13,249 | |||
| Legal fees | 3,314 | |||
| Other expenses | 36,524 | |||
| Total expenses | 3,014,309 | |||
| NET INVESTMENT INCOME | $ | 5,989,743 | ||
| REALIZED AND UNREALIZED GAINS (LOSSES): | ||||
| Net realized gain on investments | $ | 5,839,377 | ||
| Net change in unrealized appreciation/depreciation on investments | 75,931,568 | |||
| Net gain on investments | 81,770,945 | |||
| NET INCREASE IN NET ASSETS RESULTING FROM OPERATIONS | $ | 87,760,688 | ||
(1) | Net of foreign taxes withheld and issuance fees of 260,264. |
The accompanying notes are an integral part of these financial statements.
| WWW.HENNESSYFUNDS.COM |
12
| STATEMENT OF OPERATIONS/STATEMENTS OF CHANGES IN NET ASSETS |
Financial Statements
| Statements of Changes in Net Assets |
| Year Ended | Year Ended | |||||||
| October 31, 2021 | October 31, 2020 | |||||||
| OPERATIONS: | ||||||||
| Net investment income | $ | 5,989,743 | $ | 6,083,189 | ||||
| Net realized gain (loss) on investments | 5,839,377 | (133,331 | ) | |||||
| Net change in unrealized | ||||||||
| appreciation/depreciation on investments | 75,931,568 | (46,256,323 | ) | |||||
| Net increase (decrease) in net | ||||||||
| assets resulting from operations | 87,760,688 | (40,306,465 | ) | |||||
| DISTRIBUTIONS TO SHAREHOLDERS: | ||||||||
| Distributable earnings – Investor Class | (5,556,028 | ) | (16,696,863 | ) | ||||
| Distributable earnings – Institutional Class | (127,258 | ) | (434,493 | ) | ||||
| Total distributions | (5,683,286 | ) | (17,131,356 | ) | ||||
| CAPITAL SHARE TRANSACTIONS: | ||||||||
| Proceeds from shares subscribed – Investor Class | 1,114,552 | 1,453,188 | ||||||
| Proceeds from shares subscribed – Institutional Class | 578,755 | 669,886 | ||||||
| Dividends reinvested – Investor Class | 5,201,166 | 15,770,353 | ||||||
| Dividends reinvested – Institutional Class | 108,613 | 399,784 | ||||||
| Cost of shares redeemed – Investor Class | (21,989,301 | ) | (25,597,692 | ) | ||||
| Cost of shares redeemed – Institutional Class | (1,257,956 | ) | (1,759,353 | ) | ||||
| Net decrease in net assets derived | ||||||||
| from capital share transactions | (16,244,171 | ) | (9,063,834 | ) | ||||
| TOTAL INCREASE (DECREASE) IN NET ASSETS | 65,833,231 | (66,501,655 | ) | |||||
| NET ASSETS: | ||||||||
| Beginning of year | 193,887,955 | 260,389,610 | ||||||
| End of year | $ | 259,721,186 | $ | 193,887,955 | ||||
| CHANGES IN SHARES OUTSTANDING: | ||||||||
| Shares sold – Investor Class | 62,162 | 95,023 | ||||||
| Shares sold – Institutional Class | 32,026 | 42,187 | ||||||
| Shares issued to holders as reinvestment | ||||||||
| of dividends – Investor Class | 331,073 | 906,647 | ||||||
| Shares issued to holders as reinvestment | ||||||||
| of dividends – Institutional Class | 6,909 | 22,969 | ||||||
| Shares redeemed – Investor Class | (1,262,841 | ) | (1,724,299 | ) | ||||
| Shares redeemed – Institutional Class | (71,863 | ) | (121,134 | ) | ||||
| Net decrease in shares outstanding | (902,534 | ) | (778,607 | ) | ||||
The accompanying notes are an integral part of these financial statements.
| HENNESSY FUNDS | 1-800-966-4354 |
13
Financial Statements
| Financial Highlights |
For an Investor Class share outstanding throughout each year
PER SHARE DATA:
Net asset value, beginning of year
Income from investment operations:
Net investment income
Net realized and unrealized gains (losses) on investments
Total from investment operations
Less distributions:
Dividends from net investment income
Dividends from net realized gains
Total distributions
Net asset value, end of year
TOTAL RETURN
SUPPLEMENTAL DATA AND RATIOS:
Net assets, end of year (millions)
Ratio of expenses to average net assets
Ratio of net investment income to average net assets
Portfolio turnover rate(2)
(1) | Calculated using the average shares outstanding method. |
(2) | Calculated on the basis of the Fund as a whole. |
The accompanying notes are an integral part of these financial statements.
| WWW.HENNESSYFUNDS.COM |
14
| FINANCIAL HIGHLIGHTS — INVESTOR CLASS |
| Year Ended October 31, | ||||||||||||||||||
| 2021 | 2020 | 2019 | 2018 | 2017 | ||||||||||||||
| $ | 13.69 | $ | 17.43 | $ | 19.29 | $ | 21.48 | $ | 18.36 | |||||||||
| 0.44 | (1) | 0.41 | (1) | 0.47 | (1) | 0.41 | 0.45 | |||||||||||
| 5.87 | (3.01 | ) | 0.30 | 0.35 | 3.10 | |||||||||||||
| 6.31 | (2.60 | ) | 0.77 | 0.76 | 3.55 | |||||||||||||
| (0.41 | ) | (0.47 | ) | (0.41 | ) | (0.42 | ) | (0.43 | ) | |||||||||
| — | (0.67 | ) | (2.22 | ) | (2.53 | ) | — | |||||||||||
| (0.41 | ) | (1.14 | ) | (2.63 | ) | (2.95 | ) | (0.43 | ) | |||||||||
| $ | 19.59 | $ | 13.69 | $ | 17.43 | $ | 19.29 | $ | 21.48 | |||||||||
| 46.82 | % | -16.22 | % | 5.22 | % | 3.64 | % | 19.63 | % | |||||||||
| $ | 254.23 | $ | 189.60 | $ | 253.95 | $ | 266.76 | $ | 281.07 | |||||||||
| 1.23 | % | 1.30 | % | 1.23 | % | 1.21 | % | 1.22 | % | |||||||||
| 2.43 | % | 2.71 | % | 2.75 | % | 2.21 | % | 2.36 | % | |||||||||
| 41 | % | 32 | % | 27 | % | 41 | % | 72 | % | |||||||||
The accompanying notes are an integral part of these financial statements.
| HENNESSY FUNDS | 1-800-966-4354 |
15
Financial Statements
| Financial Highlights |
For an Institutional Class share outstanding throughout each year
PER SHARE DATA:
Net asset value, beginning of year
Income from investment operations:
Net investment income
Net realized and unrealized gains (losses) on investments
Total from investment operations
Less distributions:
Dividends from net investment income
Dividends from net realized gains
Total distributions
Net asset value, end of year
TOTAL RETURN
SUPPLEMENTAL DATA AND RATIOS:
Net assets, end of year (millions)
Ratio of expenses to average net assets
Ratio of net investment income to average net assets
Portfolio turnover rate(2)
(1) | Calculated using the average shares outstanding method. |
(2) | Calculated on the basis of the Fund as a whole. |
The accompanying notes are an integral part of these financial statements.
| WWW.HENNESSYFUNDS.COM |
16
| FINANCIAL HIGHLIGHTS — INSTITUTIONAL CLASS |
| Year Ended October 31, | ||||||||||||||||||
| 2021 | 2020 | 2019 | 2018 | 2017 | ||||||||||||||
| $ | 13.71 | $ | 17.45 | $ | 19.33 | $ | 21.52 | $ | 18.40 | |||||||||
| 0.48 | (1) | 0.44 | (1) | 0.50 | (1) | 0.45 | 0.43 | |||||||||||
| 5.88 | (3.01 | ) | 0.29 | 0.35 | 3.18 | |||||||||||||
| 6.36 | (2.57 | ) | 0.79 | 0.80 | 3.61 | |||||||||||||
| (0.44 | ) | (0.49 | ) | (0.45 | ) | (0.46 | ) | (0.49 | ) | |||||||||
| — | (0.68 | ) | (2.22 | ) | (2.53 | ) | — | |||||||||||
| (0.44 | ) | (1.17 | ) | (2.67 | ) | (2.99 | ) | (0.49 | ) | |||||||||
| $ | 19.63 | $ | 13.71 | $ | 17.45 | $ | 19.33 | $ | 21.52 | |||||||||
| 47.19 | % | -16.06 | % | 5.37 | % | 3.88 | % | 19.95 | % | |||||||||
| $ | 5.50 | $ | 4.29 | $ | 6.44 | $ | 7.22 | $ | 7.40 | |||||||||
| 0.99 | % | 1.08 | % | 1.08 | % | 0.98 | % | 0.97 | % | |||||||||
| 2.67 | % | 2.94 | % | 2.92 | % | 2.43 | % | 2.60 | % | |||||||||
| 41 | % | 32 | % | 27 | % | 41 | % | 72 | % | |||||||||
The accompanying notes are an integral part of these financial statements.
| HENNESSY FUNDS | 1-800-966-4354 |
17
Financial Statements
Notes to the Financial Statements October 31, 2021 |
1). ORGANIZATION
The Hennessy Cornerstone Value Fund (the “Fund”) is a series of Hennessy Funds Trust (the “Trust”), which was organized as a Delaware statutory trust on September 17, 1992. The Fund is an open-end management investment company registered under the Investment Company Act of 1940, as amended. The investment objective of the Fund is total return, consisting of capital appreciation and current income. The Fund is a diversified fund.
The Fund offers Investor Class and Institutional Class shares. Each class of shares differs principally in its respective 12b-1 distribution and service, shareholder servicing, and sub-transfer agent expenses. There are no sales charges. Each class has identical rights to earnings, assets, and voting privileges, except for class-specific expenses and exclusive rights to vote on matters affecting only one class.
As an investment company, the Fund follows the investment company accounting and reporting guidance of the Financial Accounting Standards Board (“FASB”) Accounting Standard Codification Topic 946 “Financial Services—Investment Companies.”
2). SIGNIFICANT ACCOUNTING POLICIES
The following is a summary of significant accounting policies consistently followed by the Fund in the preparation of the financial statements. These policies conform to U.S. generally accepted accounting principles (“GAAP”).
| a). | Securities Valuation – All investments in securities are valued in accordance with the Fund’s valuation policies and procedures, as described in Note 3. |
| b). | Federal Income Taxes – The Fund has elected to be taxed as a regulated investment company and intends to distribute substantially all of its taxable income to its shareholders and otherwise comply with the provisions of the Internal Revenue Code of 1986, as amended, applicable to regulated investment companies. As a result, the Fund has made no provision for federal income taxes or excise taxes. Net investment income/loss and realized gains/losses for federal income tax purposes may differ from those reported in the financial statements because of temporary book-basis and tax-basis differences. Temporary differences are primarily the result of the treatment of wash sales for tax reporting purposes. The Fund recognizes interest and penalties related to income tax benefits, if any, in the Statement of Operations as an income tax expense. Distributions from net realized gains for book purposes may include short-term capital gains, which are included as ordinary income to shareholders for tax purposes. The Fund may utilize equalization accounting for tax purposes and designate earnings and profits, including net realized gains distributed to shareholders on redemption of shares, as part of the dividends paid deduction for income tax purposes. |
| Due to inherent differences in the recognition of income, expenses, and realized gains/losses under GAAP and federal income tax regulations, permanent differences between book and tax basis for reporting are identified and appropriately reclassified in the Statement of Assets and Liabilities, as needed. The adjustments for fiscal year 2021 are as follows: |
| Total | |||
| Distributable | |||
Earnings �� | Capital Stock | ||
| $(432,109) | $432,109 |
| WWW.HENNESSYFUNDS.COM |
18
| NOTES TO THE FINANCIAL STATEMENTS |
| c). | Accounting for Uncertainty in Income Taxes – The Fund has accounting policies regarding recognition and measurement of tax positions taken or expected to be taken on a tax return. The tax returns of the Fund for the prior three fiscal years are open for examination. The Fund has reviewed all open tax years in major tax jurisdictions and concluded that there is no impact on the Fund’s net assets and no tax liability resulting from unrecognized tax benefits relating to uncertain income tax positions taken or expected to be taken on a tax return. The Fund’s major tax jurisdictions are U.S. federal and Delaware. |
| d). | Income and Expenses – Dividend income is recognized on the ex-dividend date or as soon as information is available to the Fund. Interest income, which includes the amortization of premium and accretion of discount, is recognized on an accrual basis. Market discounts, original issue discounts, and market premiums on debt securities are accreted or amortized to interest income over the life of a security with a corresponding increase or decrease, as applicable, in the cost basis of such security using the yield-to-maturity method or, where applicable, the first call date of the security. Other non-cash dividends are recognized as investment income at the fair value of the property received. The Fund is charged for those expenses that are directly attributable to its portfolio, such as advisory, administration, and certain shareholder service fees. Income, expenses (other than expenses attributable to a specific class), and realized and unrealized gains/losses on investments are allocated to each class of shares based on such class’s net assets. |
| e). | Distributions to Shareholders – Dividends from net investment income for the Fund, if any, are declared and paid annually, usually in December. Distributions of net realized capital gains, if any, are declared and paid annually, usually in December. |
| f). | Security Transactions – Investment and shareholder transactions are recorded on the trade date. The Fund determines the realized gain/loss from an investment transaction by comparing the original cost of the security lot sold with the net sale proceeds. Discounts and premiums on securities purchased are accreted or amortized, respectively, over the life of each such security. |
| g). | Use of Estimates – Preparing financial statements in accordance with GAAP requires management to make estimates and assumptions that affect the reported amounts of assets and liabilities and disclosure of contingent assets and liabilities at the date of the financial statements, as well as the reported change in net assets during the reporting period. Actual results could differ from those estimates. |
| h). | Share Valuation – The net asset value (“NAV”) per share of the Fund is calculated by dividing (i) the total value of the securities held by the Fund, plus cash and other assets, minus all liabilities (including estimated accrued expenses) by (ii) the total number of Fund shares outstanding, rounded to the nearest $0.01. Fund shares are not priced on days the New York Stock Exchange is closed for trading. The offering and redemption price per share for the Fund is equal to the Fund’s NAV per share. |
| i). | Recent Accounting Pronouncements and Regulatory Updates – In October 2020, the Securities and Exchange Commission (“SEC”) adopted new regulations governing the use of derivatives by registered investment companies (“Rule 18f-4”). Rule 18f-4 imposes limits on the amount of derivatives a fund can enter into, eliminates the asset segregation framework currently used by funds to comply with Section 18 of the 1940 Act, and requires funds whose use of derivatives is greater than a limited specified amount to establish and maintain a comprehensive derivatives risk management program and appoint a derivatives risk manager. Funds are required to comply with Rule 18f-4 by August 19, 2022. The impact, if any, that Rule 18f-4 will |
| HENNESSY FUNDS | 1-800-966-4354 |
19
| have on the availability, liquidity, and performance of derivatives is unclear. Management is currently evaluating the potential impact of Rule 18f-4 on the Fund. When fully implemented, Rule 18f-4 may require changes in how the Fund uses derivatives, adversely affect the Fund’s performance, and increase costs related to the Fund’s use of derivatives. | |
| In December 2020, the SEC adopted a new rule providing a framework for fund valuation practices (“Rule 2a-5”). Rule 2a-5 establishes requirements for determining fair value in good faith for purposes of the 1940 Act. Rule 2a-5 permits fund boards to designate certain parties to perform fair value determinations, subject to board oversight and certain other conditions. Rule 2a-5 also defines when market quotations are “readily available” for purposes of the 1940 Act and the threshold for determining whether a fund must fair value a security. In connection with Rule 2a-5, the SEC also adopted related recordkeeping requirements and is rescinding previously issued guidance, including with respect to the role of a board in determining fair value and the accounting and auditing of fund investments. Funds must comply with the rules by September 8, 2022. Management is currently assessing the potential impact of the new rules on the Fund’s financial statements. |
3). SECURITIES VALUATION
The Fund follows its valuation policies and procedures in determining its net asset value and, in preparing these financial statements, the fair value accounting standards that establish an authoritative definition of fair value and set out a hierarchy for measuring fair value. These standards require additional disclosures about the various inputs and valuation techniques used to develop the measurements of fair value and a discussion of changes in valuation techniques and related inputs during the period. These inputs are summarized in the three broad levels listed below:
| Level 1 – | Unadjusted, quoted prices in active markets for identical instruments that the Fund has the ability to access at the date of measurement. | |
| Level 2 – | Other significant observable inputs (including, but not limited to, quoted prices in active markets for similar instruments, quoted prices in markets that are not active for identical or similar instruments, and model-derived valuations in which all significant inputs and significant value drivers are observable in active markets, such as interest rates, prepayment speeds, credit risk curves, default rates, and similar data). | |
| Level 3 – | Significant unobservable inputs (including the Fund’s own assumptions about what market participants would use to price the asset or liability based on the best available information) when observable inputs are unavailable. |
The following is a description of the valuation techniques applied to the Fund’s major categories of assets and liabilities on a recurring basis:
Equity Securities – Equity securities, including common stocks, preferred stocks, foreign-issued common stocks, exchange-traded funds, closed-end mutual funds, partnerships, rights, and real estate investment trusts, that are traded on a securities exchange for which a last-quoted sales price is readily available generally are valued at the last sales price as reported by the primary exchange on which the securities are listed. Securities listed on The NASDAQ Stock Market (“NASDAQ”) generally are valued at the NASDAQ Official Closing Price, which may differ from the last sales price reported. Securities traded on a securities exchange for which a last-quoted sales price is not readily available generally are valued at the mean between the bid |
| WWW.HENNESSYFUNDS.COM |
20
| NOTES TO THE FINANCIAL STATEMENTS |
| and ask prices. To the extent these securities are actively traded and valuation adjustments are not applied, they are classified in Level 1 of the fair value hierarchy. Securities traded on foreign exchanges generally are not valued at the same time the Fund calculates its NAV because most foreign markets close well before such time. The earlier close of most foreign markets gives rise to the possibility that significant events, including broad market moves, may have occurred in the interim. In certain circumstances, it may be determined that a foreign security needs to be fair valued because it appears that the value of the security might have been materially affected by events occurring after the close of the market in which the security is principally traded, but before the time the Fund calculates its NAV, such as by a development that affects an entire market or region (e.g., a weather-related event) or a potentially global development (e.g., a terrorist attack that may be expected to have an effect on investor expectations worldwide). | |
Registered Investment Companies – Investments in open-end registered investment companies, commonly referred to as mutual funds, generally are priced at the ending NAV provided by the applicable mutual fund’s service agent and are classified in Level 1 of the fair value hierarchy. | |
Debt Securities – Debt securities, including corporate bonds, asset-backed securities, mortgage-backed securities, municipal bonds, U.S. Treasuries, and U.S. government agency issues, are generally valued at market on the basis of valuations furnished by an independent pricing service that utilizes both dealer-supplied valuations and formula-based techniques. The pricing service may consider recently executed transactions in securities of the issuer or comparable issuers, market price quotations (where observable), bond spreads, and fundamental data relating to the issuer. In addition, the model may incorporate observable market data, such as reported sales of similar securities, broker quotes, yields, bids, offers, and reference data. Certain securities are valued primarily using dealer quotations. These securities are generally classified in Level 2 of the fair value hierarchy. | |
Short-Term Securities – Short-term equity investments, including money market funds, are valued in the manner specified above for equity securities. Short-term debt investments with an original term to maturity of 60 days or less are valued at amortized cost, which approximates fair market value. If the original term to maturity of a short-term debt investment exceeds 60 days, then the values as of the 61st day prior to maturity are amortized. Amortized cost is not used if its use would be inappropriate due to credit or other impairments of the issuer, in which case the security’s fair value would be determined as described below. Short-term securities are generally classified in Level 1 or Level 2 of the fair value hierarchy depending on the inputs used and market activity levels for specific securities. |
The Board of Trustees of the Fund (the “Board”) has adopted fair value pricing procedures that are followed when a price for a security is not readily available or if a significant event has occurred that indicates the closing price of a security no longer represents the true value of that security. Fair value pricing determinations are made in good faith in accordance with these procedures. There are numerous criteria considered in determining a fair value of a security, such as the trading volume of a security and markets, the values of other similar securities, and news events with direct bearing on a security or markets. Fair value pricing results in an estimated price for a security that reflects the amount the Fund might reasonably expect to receive in a current sale. Depending on the relative significance of the valuation inputs, these securities may be classified in either Level 2 or Level 3 of the fair value hierarchy.
| HENNESSY FUNDS | 1-800-966-4354 |
21
The fair value of foreign securities may be determined with the assistance of a pricing service using correlations between the movement of prices of such securities and indices of domestic securities and other appropriate indicators, such as closing market prices of relevant American Depositary Receipts or futures contracts. Using fair value pricing means that the Fund’s NAV reflects the affected portfolio securities’ values as determined by the Board or its designee, pursuant to the fair value pricing procedures adopted by the Board, instead of being determined by the market. Using a fair value pricing methodology to price a foreign security may result in a value that is different from such foreign security’s most recent closing price and from the value used by other investment companies to calculate their NAVs. Such securities are generally classified in Level 2 of the fair value hierarchy. Because the Fund may invest in foreign securities, the value of the Fund’s portfolio securities may change on days when a shareholder is unable to purchase or redeem Fund shares.
The Board has delegated day-to-day valuation matters to the Valuation and Liquidity Committee comprising representatives from Hennessy Advisors, Inc., the Fund’s investment advisor (the “Advisor”). The function of the Valuation and Liquidity Committee, among other things, is to value securities where current and reliable market quotations are not readily available. All actions taken by the Valuation and Liquidity Committee are reviewed by the Board.
The Fund has performed an analysis of all existing investments to determine the significance and character of all inputs to their fair value determinations. Various inputs are used to determine the value of the Fund’s investments. The inputs or methodology used for valuing securities are not necessarily an indication of the risk associated with investing in those securities. Details related to the fair value hierarchy of the Fund’s securities as of October 31, 2021, are included in the Schedule of Investments.
4). INVESTMENT TRANSACTIONS
Purchases and sales of investment securities (excluding government and short-term investments) for the Fund during fiscal year 2021 were $97,431,123 and $112,045,969, respectively.
There were no purchases or sales/maturities of long-term U.S. government securities for the Fund during fiscal year 2021.
5). INVESTMENT ADVISORY FEE AND OTHER TRANSACTIONS WITH AFFILIATES
The Advisor provides the Fund with investment advisory services under an Investment Advisory Agreement. The Advisor furnishes all investment advice, office space, and facilities and most of the personnel needed by the Fund. As compensation for its services, the Advisor is entitled to a monthly fee from the Fund. The fee is based on the average daily net assets of the Fund at an annual rate of 0.74%. The net investment advisory fees expensed by the Fund during fiscal year 2021 are included in the Statement of Operations.
The Board has approved a Shareholder Servicing Agreement for Investor Class shares of the Fund, which compensates the Advisor for the non-investment advisory services it provides to the Fund. The Shareholder Servicing Agreement provides for a monthly fee paid to the Advisor at an annual rate of 0.10% of the average daily net assets of the Fund attributable to Investor Class shares. The shareholder service fees expensed by the Fund during fiscal year 2021 are included in the Statement of Operations.
The Fund has adopted a plan pursuant to Rule 12b-1 under the Investment Company Act of 1940, as amended, that authorizes payments in connection with the distribution of Fund shares at an annual rate of up to 0.25% of the Fund’s average daily net assets attributable to Investor Class shares. Even though the authorized rate is up to 0.25%, the Fund is currently only using up to 0.15% of its average daily net assets attributable to Investor Class shares for such purpose. Amounts paid under the plan may
| WWW.HENNESSYFUNDS.COM |
22
| NOTES TO THE FINANCIAL STATEMENTS |
be spent on any activities or expenses primarily intended to result in the sale of shares, including, but not limited to, advertising, shareholder account servicing, printing and mailing of prospectuses to other than current shareholders, printing and mailing of sales literature, and compensation for sales and marketing activities or to financial institutions and others, such as dealers and distributors. The distribution fees expensed by the Fund during fiscal year 2021 are included in the Statement of Operations.
The Fund has entered into agreements with various brokers, dealers, and financial intermediaries in connection with the sale of Fund shares. The agreements provide for periodic payments of sub-transfer agent expenses by the Fund to the brokers, dealers, and financial intermediaries for providing certain shareholder maintenance services. These shareholder services include the pre-processing and quality control of new accounts, shareholder correspondence, answering customer inquiries regarding account status, and facilitating shareholder telephone transactions. The sub-transfer agent fees expensed by the Fund during fiscal year 2021 are included in the Statement of Operations.
U.S. Bancorp Fund Services, LLC, d/b/a U.S. Bank Global Fund Services (“Fund Services”) provides the Fund with administrative, accounting, and transfer agent services. As administrator, Fund Services is responsible for activities such as (i) preparing various federal and state regulatory filings, reports, and returns for the Fund, (ii) preparing reports and materials to be supplied to the Board, (iii) monitoring the activities of the Fund’s custodian, transfer agent, and accountants, and (iv) coordinating the preparation and payment of the Fund’s expenses and reviewing the Fund’s expense accruals. U.S. Bank N.A., an affiliate of Fund Services, serves as the Fund’s custodian. The servicing agreements between the Trust, Fund Services, and U.S. Bank N.A. contain a fee schedule that is inclusive of administrative, accounting, custody, and transfer agent fees. The administrative, accounting, custody, and transfer agent fees expensed by the Fund during fiscal year 2021 are included in the Statement of Operations.
Quasar Distributors, LLC (“Quasar”), a wholly owned broker-dealer subsidiary of Foreside Financial Group, LLC (“Foreside”), acts as the Fund’s principal underwriter in a continuous public offering of Fund shares. Effective September 30, 2021, Genstar Capital, a private equity firm specializing in financial and related business service companies, acquired a majority interest in Foreside. The Board approved a new Distribution Agreement to enable Quasar to continue serving as the Fund’s distributor following the change in control of Foreside.
The officers of the Fund are affiliated with the Advisor. With the exception of the Chief Compliance Officer and the Senior Compliance Officer, such officers receive no compensation from the Fund for serving in their respective roles. The Fund, along with the other funds in the Hennessy Funds family (collectively, the “Hennessy Funds”), makes reimbursement payments on an equal basis to the Advisor for a portion of the salary and benefits associated with the office of the Chief Compliance Officer and for all of the salary and benefits associated with the office of the Senior Compliance Officer. The compliance fees expensed by the Fund during fiscal year 2021 are included in the Statement of Operations.
6). GUARANTEES AND INDEMNIFICATIONS
Under the Hennessy Funds’ organizational documents, their officers and trustees are indemnified by the Hennessy Funds against certain liabilities arising out of the performance of their duties to the Hennessy Funds. Additionally, in the normal course of business, the Hennessy Funds enter into contracts with service providers that contain general indemnification clauses. The Fund’s maximum exposure under these arrangements is unknown as this would involve future claims that may be made against the Fund that have not yet occurred. Currently, the Fund expects the risk of loss to be remote.
| HENNESSY FUNDS | 1-800-966-4354 |
23
7). LINE OF CREDIT
The Fund has an uncommitted line of credit with the other Hennessy Funds in the amount of the lesser of (i) $100,000,000 or (ii) 33.33% of each Hennessy Fund’s net assets, or 30% for the Hennessy Gas Utility Fund and 10% for the Hennessy Balanced Fund. The line of credit is intended to provide any necessary short-term financing in connection with shareholder redemptions, subject to certain restrictions. The credit facility is with the Hennessy Funds’ custodian bank, U.S. Bank N.A. Borrowings under this arrangement bear interest at the bank’s prime rate and are secured by all of the Fund’s assets (as to its own borrowings only). During fiscal year 2021, the Fund did not have any borrowings outstanding under the line of credit.
8). FEDERAL TAX INFORMATION
As of October 31, 2021, the components of accumulated earnings (losses) for income tax purposes were as follows:
| Investments | ||||
| Cost of investments for tax purposes | $ | 226,781,886 | ||
| Gross tax unrealized appreciation | $ | 43,586,393 | ||
| Gross tax unrealized depreciation | (10,784,596 | ) | ||
| Net tax unrealized appreciation/(depreciation) | $ | 32,801,797 | ||
| Undistributed ordinary income | $ | 5,163,173 | ||
| Undistributed long-term capital gains | 5,655,685 | |||
| Total distributable earnings | $ | 10,818,858 | ||
| Other accumulated gain/(loss) | $ | — | ||
| Total accumulated gain/(loss) | $ | 43,620,655 | ||
The difference between book-basis unrealized appreciation/depreciation and tax-basis unrealized appreciation/depreciation (as shown above) is attributable primarily to wash sales.
As of October 31, 2021, the Fund had no tax-basis capital losses to offset future capital gains. During fiscal year 2021, the capital losses utilized by the Fund were $115,751.
Capital losses sustained in or after fiscal year 2012 can be carried forward indefinitely, but any such loss retains the character of the original loss and must be utilized prior to any loss incurred before fiscal year 2012. As a result of this ordering rule, capital loss carryforwards incurred prior to fiscal year 2012 may be more likely to expire unused. Capital losses sustained prior to fiscal year 2012 can be carried forward for eight years and can be carried forward as short-term capital losses regardless of the character of the original loss.
As of October 31, 2021, the Fund did not defer, on a tax basis, any late-year ordinary losses. Late-year ordinary losses are net ordinary losses incurred after December 31, 2020, but within the taxable year, that are deemed to arise on the first day of the Fund’s next taxable year.
During fiscal years 2021 and 2020, the tax character of distributions paid by the Fund was as follows:
| Year Ended | Year Ended | ||||||||
| October 31, 2021 | October 31, 2020 | ||||||||
Ordinary income(1) | $ | 5,683,286 | $ | 7,147,381 | |||||
| Long-term capital gains | — | 9,983,975 | |||||||
| Total distributions | $ | 5,683,286 | $ | 17,131,356 | |||||
(1) Ordinary income includes short-term capital gains. |
| WWW.HENNESSYFUNDS.COM |
24
| NOTES TO THE FINANCIAL STATEMENTS |
9). EVENTS SUBSEQUENT TO YEAR END
Management has evaluated the Fund’s related events and transactions that occurred subsequent to October 31, 2021, through the date of issuance of the Fund’s financial statements. Other than as disclosed below, management has determined that there were no subsequent events requiring recognition or disclosure in the financial statements.
On December 7, 2021, capital gains were declared and paid to shareholders of record on December 6, 2021, as follows:
Long-term | ||
| Investor Class | $0.42879 | |
| Institutional Class | $0.42980 |
| HENNESSY FUNDS | 1-800-966-4354 |
25
Report of Independent Registered Public
Accounting Firm
To the Board of Trustees of Hennessy Funds Trust
and the shareholders of the Hennessy Cornerstone Value Fund
Novato, CA
Opinion on the Financial Statements
We have audited the accompanying statement of assets and liabilities of the Hennessy Cornerstone Value Fund (the “Fund”), a series of Hennessy Funds Trust, including the schedule of investments, as of October 31, 2021, the related statement of operations for the year then ended, the statements of changes in net assets for each of the two years in the period then ended, the financial highlights for each of the five years in the period then ended, and the related notes (collectively referred to as the “financial statements”). In our opinion, the financial statements present fairly, in all material respects, the financial position of the Fund as of October 31, 2021, the results of its operations for the year then ended, the changes in its net assets for each of the two years in the period then ended, and the financial highlights for each of the five years in the period then ended in conformity with accounting principles generally accepted in the United States of America.
Basis for Opinion
These financial statements are the responsibility of the Fund’s management. Our responsibility is to express an opinion on the Fund’s financial statements based on our audits. We are a public accounting firm registered with the Public Company Accounting Oversight Board (United States) (“PCAOB”) and are required to be independent with respect to the Fund in accordance with the U.S. federal securities laws and the applicable rules and regulations of the Securities and Exchange Commission and the PCAOB. We have served as the auditor of one or more of the funds in the Trust since 2002.
We conducted our audits in accordance with the standards of the PCAOB. Those standards require that we plan and perform the audit to obtain reasonable assurance about whether the financial statements are free of material misstatement, whether due to error or fraud. The Fund is not required to have, nor were we engaged to perform, an audit of its internal control over financial reporting. As part of our audits we are required to obtain an understanding of internal control over financial reporting, but not for the purpose of expressing an opinion on the effectiveness of the Fund’s internal control over financial reporting. Accordingly, we express no such opinion.
Our audits included performing procedures to assess the risks of material misstatement of the financial statements, whether due to error or fraud, and performing procedures that respond to those risks. Such procedures included examining, on a test basis, evidence regarding the amounts and disclosures in the financial statements. Our audits also included evaluating the accounting principles used and significant estimates made by management, as well as evaluating the overall presentation of the financial statements. Our procedures included confirmation of securities owned as of October 31, 2021 by correspondence with the custodian. We believe that our audits provide a reasonable basis for our opinion.
| |
| TAIT, WELLER & BAKER LLP |
Philadelphia, Pennsylvania
December 22, 2021
| WWW.HENNESSYFUNDS.COM |
26
| REPORT OF INDEPENDENT REGISTERED PUBLIC ACCOUNTING FIRM/TRUSTEES AND OFFICERS |
Trustees and Officers of the Fund (Unaudited)
The business and affairs of the Funds are managed under the direction of the Board of Trustees of the Trust, and the Board of Trustees elects the officers of the Trust. From time to time, the Board of Trustees also has appointed advisers to the Board of Trustees (“Advisers”) with the intention of having qualified individuals serve in an advisory capacity to garner experience in the mutual fund and asset management industry and be considered as potential Trustees in the future. There are currently two Advisers, Brian Alexander and Doug Franklin. As Advisers, Mr. Alexander and Mr. Franklin attend meetings of the Board of Trustees and act as non-voting participants. Information pertaining to the Trustees, Advisers, and the officers of the Trust is set forth below. The Trustees and officers serve until their successors are duly elected and qualified or until their earlier death, resignation, or removal. Each Trustee oversees all 16 Hennessy Funds. Unless otherwise indicated, the address of all persons listed below is 7250 Redwood Boulevard, Suite 200, Novato, CA 94945. The Fund’s Statement of Additional Information includes more information about the persons listed below and is available without charge by calling 1-800-966-4354 or by visiting www.hennessyfunds.com.
| Other | |||
| Directorships | |||
| Held Outside | |||
| Name, Age, | of Fund | ||
| and Position Held | Start Date | Principal Occupation(s) | Complex During |
with the Trust | of Service | During Past Five Years | Past Five Years |
| Disinterested Trustees and Advisers | |||
| J. Dennis DeSousa | January 1996 | Mr. DeSousa is a real estate investor. | None. |
| 85 | |||
| Trustee | |||
| Robert T. Doyle | January 1996 | Mr. Doyle has been the Sheriff of | None. |
| 74 | Marin County, California since 1996. | ||
| Trustee | |||
| Claire Garvie | December 2015 | Ms. Garvie is a founder of Kiosk and | None. |
| 47 | as an Adviser | has served as its Chief Operating | |
| Trustee | to the Board | Officer since 2004. Kiosk is a full- | |
| and | service marketing agency with | ||
| December 2021 | offices in the San Francisco Bay Area, | ||
| as a Trustee | Toronto, and Liverpool, UK. | ||
| Gerald P. Richardson | May 2004 | Mr. Richardson is an independent | None. |
| 76 | consultant in the securities industry. | ||
| Trustee |
| HENNESSY FUNDS | 1-800-966-4354 |
27
| Other | |||
| Directorships | |||
| Held Outside | |||
| Name, Age, | of Fund | ||
| and Position Held | Start Date | Principal Occupation(s) | Complex During |
with the Trust | of Service | During Past Five Years | Past Five Years |
| Brian Alexander | March 2015 | Mr. Alexander has worked for the | None. |
| 40 | Sutter Health organization since | ||
| Adviser to the Board | 2011 in various positions. He has | ||
| served as the Chief Executive Officer | |||
| of the Sutter Roseville Medical | |||
| Center since 2018. From 2016 through | |||
| 2018, he served as the Vice President | |||
| of Strategy for the Sutter Health Valley | |||
| Area, which includes 11 hospitals, | |||
| 13 ambulatory surgery centers, | |||
| 16,000 employees, and 1,900 physicians. | |||
| From 2013 through 2016, Mr. Alexander | |||
| served as Sutter Novato Community | |||
| Hospital’s Chief Administrative Officer. | |||
| Doug Franklin | March 2016 | Mr. Franklin is a retired insurance | None. |
| 57 | industry executive. From 1987 | ||
| Adviser to the Board | through 2015, he was employed | ||
| by the Allianz-Fireman’s Fund | |||
| Insurance Company in various | |||
| positions, including as its Chief | |||
| Actuary and Chief Risk Officer. | |||
Interested Trustee(1) | |||
| Neil J. Hennessy | January 1996 as | Mr. Hennessy has been employed | Hennessy |
| 65 | a Trustee and | by Hennessy Advisors, Inc. since | Advisors, Inc. |
| Chairman of the Board, | June 2008 as | 1989 and currently serves as its | |
| Chief Market Strategist, | an officer | Chairman and Chief Executive Officer. | |
| Portfolio Manager, | |||
| and President |
| Name, Age, | ||
| and Position Held | Start Date | Principal Occupation(s) |
with the Trust | of Service | During Past Five Years |
| Officers | ||
| Teresa M. Nilsen | January 1996 | Ms. Nilsen has been employed by Hennessy Advisors, Inc. |
| 55 | since 1989 and currently serves as its President and Chief | |
| Executive Vice President | Operating Officer. | |
| and Treasurer | ||
| Daniel B. Steadman | March 2000 | Mr. Steadman has been employed by Hennessy Advisors, Inc. |
| 65 | since 2000 and currently serves as its Executive Vice President. | |
| Executive Vice President | ||
| and Secretary | ||
| Brian Carlson | December 2013 | Mr. Carlson has been employed by Hennessy Advisors, Inc. |
| 49 | since December 2013 and currently serves as its Chief | |
| Senior Vice President | Compliance Officer and Senior Vice President. | |
| and Head of Distribution |
| WWW.HENNESSYFUNDS.COM |
28
| TRUSTEES AND OFFICERS OF THE FUND |
| Name, Age, | ||
| and Position Held | Start Date | Principal Occupation(s) |
with the Trust | of Service | During Past Five Years |
Jennifer Cheskiewicz(2) | June 2013 | Ms. Cheskiewicz has been employed by Hennessy Advisors, Inc. |
| 44 | as its General Counsel since June 2013. | |
| Senior Vice President and | ||
| Chief Compliance Officer | ||
David Ellison(3) | October 2012 | Mr. Ellison has been employed by Hennessy Advisors, Inc. since |
| 63 | October 2012. He has served as a Portfolio Manager of the | |
| Senior Vice President | Hennessy Large Cap Financial Fund and the Hennessy Small | |
| and Portfolio Manager | Cap Financial Fund since their inception. Mr. Ellison also served | |
| as a Portfolio Manager of the Hennessy Technology Fund from | ||
| its inception until February 2017. Mr. Ellison served as Director, | ||
| CIO, and President of FBR Fund Advisers, Inc. from December | ||
| 1999 to October 2012. | ||
Ryan Kelley(4) | March 2013 | Mr. Kelley has been employed by Hennessy Advisors, Inc. since |
| 49 | October 2012. He has served as Chief Investment Officer of the | |
| Chief Investment Officer, | Hennessy Funds since March 2021 and has served as a Portfolio | |
| Senior Vice President, | Manager of the Hennessy Gas Utility Fund, the Hennessy Large | |
| and Portfolio Manager | Cap Financial Fund, and the Hennessy Small Cap Financial Fund | |
| since October 2014. Mr. Kelley served as Co-Portfolio Manager | ||
| of these same funds from March 2013 through September | ||
| 2014 and as a Portfolio Analyst for the Hennessy Funds from | ||
| October 2012 through February 2013. He has also served as a | ||
| Portfolio Manager of the Hennessy Cornerstone Growth Fund, | ||
| the Hennessy Cornerstone Mid Cap 30 Fund, the Hennessy | ||
| Cornerstone Large Growth Fund, and the Hennessy | ||
| Cornerstone Value Fund since February 2017 and as a Portfolio | ||
| Manager of the Hennessy Total Return Fund, the Hennessy | ||
| Balanced Fund, and the Hennessy Technology Fund since May | ||
| 2018. He served as Co-Portfolio Manager of the Hennessy | ||
| Technology Fund from February 2017 until May 2018. Mr. Kelley | ||
| served as Portfolio Manager of FBR Fund Advisers, Inc. from | ||
| January 2008 to October 2012. | ||
L. Joshua Wein(4) | September 2018 | Mr. Wein has been employed by Hennessy Advisors, Inc. since |
| 48 | 2018. He has served as Co-Portfolio Manager of the Hennessy | |
| Vice President and | Cornerstone Growth Fund, the Hennessy Cornerstone | |
| Co-Portfolio Manager | Mid Cap 30 Fund, the Hennessy Cornerstone Large Growth | |
| Fund, the Hennessy Cornerstone Value Fund, Hennessy Total | ||
| Return Fund, the Hennessy Balanced Fund, the Hennessy Gas | ||
| Utility Fund, and the Hennessy Technology Fund since February | ||
| 2019. He served as a Senior Analyst of these same funds from | ||
| September 2018 through February 2019. Mr. Wein served as | ||
| Director of Alternative Investments and Co-Portfolio Manager | ||
| at Sterling Capital Management from 2008 to 2018. |
_______________
(1) | Mr. Hennessy is considered an “interested person,” as defined in the Investment Company Act of 1940, as amended, because he is an officer of the Trust. |
(2) | The address of this officer is 4800 Bee Caves Road, Suite 100, Austin, TX 78746. |
(3) | The address of this officer is 101 Federal Street, Suite 1615B, Boston, MA 02110. |
(4) | The address of this officer is 1340 Environ Way, Chapel Hill, NC 27517. |
| HENNESSY FUNDS | 1-800-966-4354 |
29
Expense Example (Unaudited)
October 31, 2021
As a shareholder of the Fund, you incur ongoing costs, including management fees, service fees, and other Fund expenses. This Example is intended to help you understand your ongoing costs (in dollars) of investing in the Fund and to compare these costs with the ongoing costs of investing in other mutual funds. The Example is based on an investment of $1,000 invested at the beginning of the period and held for the entire period from May 1, 2021, through October 31, 2021.
Actual Expenses
In the table below, the first line under each of the “Investor Class” and “Institutional Class” headings provides information about actual account values and actual expenses for each share class. You may use this information, together with the amount you invested, to estimate the expenses that you paid over the period. Simply divide your account value by $1,000 (for example, an $8,600 account value divided by $1,000 = 8.6), then multiply the result by the number in the first line under the heading “Expenses Paid During Period” to estimate the expenses you paid on your account during this period. Although the Fund charges no sales loads or transaction fees, you will be assessed fees for outgoing wire transfers, returned checks, and stop payment orders at prevailing rates charged by U.S. Bank Global Fund Services, the Fund’s transfer agent. If you request that a redemption be made by wire transfer, the Fund’s transfer agent charges a $15 fee. IRAs are charged a $15 annual maintenance fee (up to $30 maximum per shareholder for shareholders with multiple IRAs). The examples below include, but are not limited to, management, shareholder servicing, accounting, custody, and transfer agent fees. However, the examples below do not include portfolio trading commissions and related expenses.
Hypothetical Example for Comparison Purposes
In the table below, the second line under each of the “Investor Class” and “Institutional Class” headings provides information about hypothetical account values and hypothetical expenses based on the Fund’s actual expense ratio for each share class and an assumed rate of return of 5% per year before expenses, which is not the Fund’s actual return for such share class. The hypothetical account values and expenses may not be used to estimate the actual ending account balance or expenses you paid for the period. You may use this information to compare the ongoing costs of investing in the Fund and other funds. To do so, compare these 5% hypothetical examples with the 5% hypothetical examples that appear in the shareholder reports of the other funds. Please note that the expenses shown in the table are meant to highlight your ongoing costs only. Therefore, the second lines under “Investor Class” and “Institutional Class” are useful in comparing ongoing costs only and will not help you determine the relative total costs of owning different funds.
| WWW.HENNESSYFUNDS.COM |
30
| EXPENSE EXAMPLE |
| Expenses Paid | |||
| Beginning | Ending | During Period(1) | |
| Account Value | Account Value | May 1, 2021 – | |
May 1, 2021 | October 31, 2021 | October 31, 2021 | |
| Investor Class | |||
| Actual | $1,000.00 | $1,056.60 | $6.32 |
| Hypothetical (5% return before expenses) | $1,000.00 | $1,019.06 | $6.21 |
| Institutional Class | |||
| Actual | $1,000.00 | $1,057.70 | $5.13 |
| Hypothetical (5% return before expenses) | $1,000.00 | $1,020.21 | $5.04 |
(1) | Expenses are equal to the Fund’s annualized expense ratio of 1.22% for Investor Class shares or 0.99% for Institutional Class shares, as applicable, multiplied by the average account value over the period, multiplied by 184/365 days (to reflect the half-year period). |
| HENNESSY FUNDS | 1-800-966-4354 |
31
How to Obtain a Copy of the Fund’s Proxy
Voting Policy and Proxy Voting Records
A description of the policies and procedures the Fund uses to determine how to vote proxies relating to portfolio securities is available without charge (1) by calling 1-800-966-4354, (2) on the Hennessy Funds’ website at www.hennessyfunds.com/proxy-voting/voting-policy, or (3) on the U.S. Securities and Exchange Commission’s (the “SEC”) website at www.sec.gov. The Fund’s proxy voting record is available without charge on both the Hennessy Funds’ website at www.hennessyfunds.com/proxy-voting/voting-record and the SEC’s website at www.sec.gov no later than August 31 for the prior 12 months ending June 30.
Availability of Quarterly Portfolio Schedule
The Fund files a complete schedule of portfolio holdings with the SEC for the first and third quarters of each fiscal year as an exhibit to its reports on Form N-PORT. The Fund’s Form N-PORT reports are available on the SEC’s website at www.sec.gov or on request by calling 1-800-966-4354.
Federal Tax Distribution Information (Unaudited)
For fiscal year 2021, certain dividends paid by the Fund may be subject to a maximum tax rate of 23.8%, as provided for by the Jobs and Growth Tax Relief Reconciliation Act of 2003. The percentage of dividends declared from ordinary income designated as qualified dividend income was 100.00%.
For corporate shareholders, the percent of ordinary income distributions that qualified for the corporate dividends received deduction for fiscal year 2021 was 99.50%.
The percentage of taxable ordinary income distributions that were designated as short-term capital gain distributions under Section 871(k)(2)(C) of the Internal Revenue Code of 1986, as amended, for the Fund was 0.00%.
Important Notice Regarding Delivery
of Shareholder Documents
To help keep the Fund’s costs as low as possible, we generally deliver a single copy of shareholder reports, proxy statements, and prospectuses to shareholders who share an address and have the same last name. This process does not apply to account statements. You may request an individual copy of a shareholder document at any time. If you would like to receive separate mailings of shareholder documents, please call U.S. Bank Global Fund Services at 1-800-261-6950 or 1-414-765-4124, and individual delivery will begin within 30 days of your request. If your account is held through a financial institution or other intermediary, please contact such intermediary directly to request individual delivery.
Electronic Delivery
As permitted by SEC regulations, the Fund’s shareholder reports are made available on a website, and unless you sign up for eDelivery or elect to receive paper copies as detailed below, you will be notified by mail each time a report is posted and provided with a website link to access the report.
The Fund also offers shareholders the option to receive all notices, account statements, prospectuses, tax forms, and shareholder reports online. To sign up for eDelivery or change your delivery preference, please visit www.hennessyfunds.com/account.
To elect to receive paper copies of all future reports free of charge, please call U.S. Bank Global Fund Services at 1-800-261-6950 or 1-414-765-4124.
Subscribe to receive our team’s unique market and sector insights delivered to your inbox
www.hennessyfunds.com/subscribe
Follow us on social media
| WWW.HENNESSYFUNDS.COM |
32
| PROXY VOTING — PRIVACY POLICY |
Liquidity Risk Management Program
In accordance with Rule 22e-4 under the Investment Company Act of 1940, as amended (the “Liquidity Rule”), we have adopted and implemented a liquidity risk management program (the “Liquidity Program”). The purpose of the Liquidity Program is to assess and manage the Fund’s liquidity risk, which is the risk that the Fund would not be able to meet requests to redeem Fund shares without significant dilution of the remaining shareholders’ interests in the Fund. The Board of Trustees of the Fund (the “Board”) designated a committee comprising representatives of Hennessy Advisors, Inc., the investment adviser to the Fund, as the administrator of the Liquidity Program (the “Program Administrator”).
The Program Administrator provided a written report regarding the Liquidity Program to the Board in advance of its meeting on June 2, 2021. The report covered the period from June 1, 2020, through May 31, 2021. The report addressed the operation of the Liquidity Program, assessed the adequacy and effectiveness of its implementation, and described any material changes to the Liquidity Program during the review period. The Trust’s chief compliance officer presented the report to the Board at the meeting and provided additional information regarding the Liquidity Program. The Board reviewed the Liquidity Program and considered, among other items, the following:
| 1. | The Program Administrator reviewed daily historical net redemption activity during the review period and during prior periods with higher-than-average redemption activity and concluded that the Fund has historically been able to meet requests to redeem Fund shares without significant dilution to the Fund’s remaining shareholders, and the Program Administrator expects the Fund to be able to continue to do so in the future during both normal and reasonably foreseeable stressed conditions. | |
| 2. | The Fund holds assets that are highly liquid investments and is therefore not required to establish a highly liquid investment minimum for the Fund or adopt policies and procedures for responding to a highly liquid investment minimum shortfall. | |
| 3. | The Program Administrator did not make any material changes to the Liquidity Program during the review period and did not recommend any changes to the Liquidity Program or the model inputs used to determine the liquidity classification of each security held by the Fund. | |
| 4. | The Program Administrator concluded that the Liquidity Program was reasonably designed to assess and manage the Fund’s liquidity risk, complies with the requirements of the Liquidity Rule, and was operating as intended during the review period. |
Privacy Policy
We collect the following personal information about you:
| 1. | Information we receive from you in applications or other forms, correspondence, or conversations, including, but not limited to, your name, address, phone number, social security number, assets, income, and date of birth; | |
| 2. | Information about your transactions with us, our affiliates, or others, including, but not limited to, your account number and balance, payments history, parties to transactions, cost basis information, and other financial information; and |
| HENNESSY FUNDS | 1-800-966-4354 |
33
| 3. | Other personal information we collect from various sources, even if you have not entered into a prior transaction with us, including the following: |
| • | Name, alias, address, unique personal identifier, online identifier, IP address, email address, telephone number, account name, and other similar identifiers; | |
| • | Age and marital status; | |
| • | Commercial information, including records of products purchased; | |
| • | Browsing history, search history, and information on interaction with our website; | |
| • | Geolocation data; | |
| • | Employment and employment history, educational history, financial information, and purchasing and consuming histories or tendencies; and | |
| • | Inferences drawn from the above-listed information to create a profile about your preferences, characteristics, predispositions, and behavior. |
We collect this information directly from you, indirectly in the course of providing services to you, directly and indirectly from your activity on our website, from broker dealers, marketing agencies, and other third parties that interact with us in connection with the services we perform and products we offer, and from anonymized and aggregated consumer information.
We use this information to fulfill the reason you provided the information to us, to provide you with other relevant products that you request from us, to provide you with information about products that may interest you, to improve our website or present our website’s contents to you, and as otherwise described to you when collecting your personal information.
We do not disclose any personal information to unaffiliated third parties, except as permitted by law. We may disclose your personal information to our affiliates, vendors, and service providers for a business purpose. For example, we are permitted by law to disclose all of the information we collect, as described above, to our transfer agent to process your transactions. When disclosing your personal information to third parties, we enter into a contract with each third party describing the purpose of such disclosure and requiring that such personal information be kept confidential and not used for any purpose except to perform the services contracted or respond to regulatory or law enforcement requests.
Furthermore, we restrict access to your personal information to those persons who require such information to provide products or services to you. As a result, we do not provide a means for opting out of our limited sharing of your information. We maintain physical, electronic, and procedural safeguards that comply with federal standards to guard your personal information.
If you hold shares of the Funds through a financial intermediary, including, but not limited to, a broker-dealer, bank, or trust company, the privacy policy of your financial intermediary governs how your personal information is shared with unaffiliated third parties.
Supplemental Privacy Notice for Residents of California
The California Consumer Privacy Act of 2018 (the “CCPA”) provides you, as a California resident, with certain additional rights relating to your personal information.
| WWW.HENNESSYFUNDS.COM |
34
| PRIVACY POLICY |
Under the CCPA, you have the right to request that we disclose to you the categories of personal information we have collected about you over the past 12 months, the categories of sources of such information, our business purpose for collecting the information, the categories of third parties, if any, with whom we shared the information, and the specific information we have collected about you. You also have the right to request that we delete any of your personal information, and, unless an exception applies, we will delete such information upon receiving and confirming your request. To make a request, call us at 1-800-966-4354, email us at privacy@hennessyfunds.com, or go to www.hennessyfunds.com/contact. We will not discriminate against you for exercising your rights under the CCPA. Further, we will not collect additional categories of your personal information or use the personal information we collected for materially different, unrelated, or incompatible purposes without providing you notice.
| HENNESSY FUNDS | 1-800-966-4354 |
35
(This Page Intentionally Left Blank.)
For information, questions, or assistance, please call
The Hennessy Funds
1-800-966-4354 or 1-415-899-1555
INVESTMENT ADVISOR
Hennessy Advisors, Inc.
7250 Redwood Boulevard, Suite 200
Novato, California 94945
ADMINISTRATOR,
TRANSFER AGENT,
DIVIDEND PAYING AGENT, &
SHAREHOLDER SERVICING AGENT
U.S. Bancorp Fund Services, LLC
d/b/a U.S. Bank Global Fund Services
P.O. Box 701
Milwaukee, Wisconsin 53201-0701
CUSTODIAN
U.S. Bank N.A.
Custody Operations
1555 North River Center Drive, Suite 302
Milwaukee, Wisconsin 53212
TRUSTEES
Neil J. Hennessy
Robert T. Doyle
J. Dennis DeSousa
Claire Garvie
Gerald P. Richardson
COUNSEL
Foley & Lardner LLP
777 East Wisconsin Avenue
Milwaukee, Wisconsin 53202-5306
INDEPENDENT REGISTERED
PUBLIC ACCOUNTING FIRM
Tait, Weller & Baker LLP
Two Liberty Place
50 South 16th Street, Suite 2900
Philadelphia, Pennsylvania 19102-2529
DISTRIBUTOR
Quasar Distributors, LLC
111 East Kilbourn Avenue, Suite 2200
Milwaukee, Wisconsin 53202
www.hennessyfunds.com | 1-800-966-4354
This report has been prepared for shareholders and may be distributed to
others only if preceded or accompanied by a current prospectus.
ANNUAL REPORT
OCTOBER 31, 2021
HENNESSY TOTAL RETURN FUND
Investor Class HDOGX
www.hennessyfunds.com | 1-800-966-4354
(This Page Intentionally Left Blank.)
Contents
| Letter to Shareholders | 2 |
| Performance Overview | 4 |
| Financial Statements | |
| Schedule of Investments | 7 |
| Statement of Assets and Liabilities | 11 |
| Statement of Operations | 12 |
| Statements of Changes in Net Assets | 13 |
| Statement of Cash Flows | 14 |
| Financial Highlights | 16 |
| Notes to the Financial Statements | 18 |
| Report of Independent Registered Public Accounting Firm | 26 |
| Trustees and Officers of the Fund | 27 |
| Expense Example | 30 |
| Proxy Voting Policy and Proxy Voting Records | 31 |
| Availability of Quarterly Portfolio Schedule | 31 |
| Federal Tax Distribution Information | 31 |
| Important Notice Regarding Delivery of Shareholder Documents | 31 |
| Electronic Delivery | 31 |
| Liquidity Risk Management Program | 32 |
| Privacy Policy | 32 |
| HENNESSY FUNDS | 1-800-966-4354 |
December 2021
Dear Hennessy Funds Shareholder:
What a year this has been. While it doesn’t feel that we are out of the “pandemic” phase of the coronavirus crisis, we look forward to a day when we will eventually see fewer cases and potentially less severe variants. We feel extremely grateful to the many healthcare workers who have continued to work tirelessly during the recent surge. As we move through the next year, we hope that new U.S. cases will decline and that many other parts of the world will see improvements as well.
What a year this has been! As measured by the total return of the S&P 500® Index, as of October 31, 2021, the market was up 24.04% calendar year to date. This comes in the wake of a tumultuous 2020 in which the market plunged in the beginning of the pandemic and recovered dramatically to end the year up 18.40%. Interestingly, 18% appears to be a repeating number in the past dozen years. From the low point of the Financial Crisis (March 9, 2009) to the high point reached just prior to the COVID-19 pandemic (February 12, 2020), the S&P 500® Index was up 18.27% per year. We are well aware that past results are not predictive of the future, and we find ourselves naturally skeptical of such strong returns. But, as shown in the chart below, we find that the most common annual total returns of the market over the past 102 years range between 20% and 30% with the second most common being between 10% and 20%:
Source: Bloomberg L.P.
We will say it again, after showing a chart like the one above: Past results are not predictive of the future. Instead, we look at where we are right now – in the economy, in the market, in the business cycle – to reflect on where we have come from and where we may be going. U.S. GDP is strong and growing, interest rates remain low, and earnings growth and profitability remain robust. We believe stocks are trading at reasonable valuations when viewed as a whole, with the S&P 500® Index at 21.0x estimated earnings for 2022. Furthermore, we believe corporate balance sheets are healthy, with high levels of excess cash, which could support growth, increases in dividends, more share buybacks, and future acquisitions. Uncertainty and volatility can manifest at any time in the stock market, and the current market is no different. Investors have questions about inflation, worldwide supply chain issues, and what could drive the next boost in earnings. While these concerns are warranted, we continue to believe that overall the positives outweigh the negatives, and here at Hennessy we continue to see opportunity in the market and in our Funds.
| WWW.HENNESSYFUNDS.COM |
2
| LETTER TO SHAREHOLDERS |
What a (fiscal) year this has been!!! For our fiscal year ended October 31, 2021, the S&P 500® Index rose 42.91% on a total return basis, setting a new all-time high on the final day of the period. Except for a short 21-trading-day period that began on September 2 during which the market fell 5.13% only to rebound to new highs just 13 trading days later, the market has been on a continuous march higher. We saw a dramatic shift in market leadership as many of the sectors that underperformed during our last fiscal year soared in fiscal year 2021. Small-caps beat mid-caps, which in turn beat large-caps. The Energy and Financials sectors skyrocketed during the 12-month period, as reflected by the S&P 500® Energy Sector’s total return of 111.29% and the Russell 1000® Index Financials’ total return of 70.87%. Both of these sectors were among the worst performing in our fiscal year 2020, so a bounce back in our fiscal year 2021, while not a foregone conclusion, was a distinct possibility.
Overall, we are pleased with the performance of our mutual funds during the fiscal year. On an absolute basis, each of our 16 Funds achieved total returns greater than 10% and seven outperformed their primary benchmark. Ten of our 11 domestic equity-only Funds outperformed the S&P 500® Index and posted total returns of 45% or higher. Our four best-performing funds were concentrated in the Energy and Financials sectors. While some of our Funds certainly benefited from being in the “right” sector at the “right” time, we also believe this was a favorable period for our investment style of high-conviction investing and concentrated portfolio construction.
What will the coming year bring? As mentioned in our last shareholder letter (June 2021), we understand that even the greatest bull markets experience corrections along the way, and the last time the S&P 500® Index dropped over 10% was in February/March of 2020. Whether or not a correction occurs sooner or later, we believe the market as a whole has more room to run. We see many factors that could drive the market higher from here: strong GDP growth and increasing corporate earnings, a potentially lower-for-longer interest rate environment, accommodative fiscal and monetary policies, a healthy and robust financial system, low unemployment and solid wage growth, and strong corporate balance sheets with plenty of cash.
Thank you for your interest and for investing with us. We remain committed to managing our portfolios for long-term performance, ever mindful of downside risk. With so many investment options available to you, we are grateful for the trust you put in us and for your continued interest in our family of Funds. If you have any questions or would like to speak with us, please don’t hesitate to call us directly at (800) 966-4354.
Best regards,
| |
| |
| Ryan C. Kelley | |
| Chief Investment Officer |
Past performance does not guarantee future results. To obtain current standardized performance for the Hennessy Funds, visit https://www.hennessyfunds.com/funds/price-performance.
Mutual fund investing involves risk. Principal loss is possible.
Opinions expressed are those of Ryan C. Kelley and are subject to change, are not guaranteed, and should not be considered investment advice.
The Dow Jones Industrial Average and S&P 500® Index are commonly used to measure the performance of U.S. stocks. The S&P 500® Energy Index comprises those companies included in the S&P 500® Index that are classified in the Energy sector. The Russell 1000® Index Financials is a subset of the Russel 1000® Index that measures the performance of securities classified in the Financials sector of the large-capitalization U.S. equity market. The indices are used herein for comparative purposes in accordance with SEC regulations. One cannot invest directly in an index. All returns are shown on a total return basis.
| HENNESSY FUNDS | 1-800-966-4354 |
3
Performance Overview (Unaudited)
CHANGE IN VALUE OF $10,000 INVESTMENT

This graph illustrates the performance of an initial investment of $10,000 made in the Fund 10 years ago and assumes the reinvestment of dividends and capital gains.
AVERAGE ANNUAL TOTAL RETURN FOR PERIODS ENDED OCTOBER 31, 2021
| One | Five | Ten | ||
Year | Years | Years | ||
| Hennessy Total Return Fund (HDOGX) | 21.72% | 6.34% | 7.50% | |
| 75/25 Blended DJIA/Treasury Index | 27.47% | 13.26% | 10.93% | |
| Dow Jones Industrial Average | 37.73% | 17.21% | 14.32% |
Expense ratio: 1.73%
Performance data quoted represents past performance; past performance does not guarantee future results. The investment return and principal value of an investment will fluctuate so that an investor’s shares, when redeemed, may be worth more or less than their original cost. The performance table does not reflect the deduction of taxes that a shareholder would pay on Fund distributions or the redemption of Fund shares. Current performance of the Fund may be lower or higher than the performance quoted. Performance data current to the most recent month end may be obtained by visiting www.hennessyfunds.com.
The 75/25 Blended DJIA/Treasury Index consists of 75% common stocks represented by the Dow Jones Industrial Average and 25% short-duration Treasury securities represented by the ICE BofAML U.S. 3-Month Treasury Bill Index, which comprises U.S. Treasury securities maturing in three months. The Dow Jones Industrial Average is a price-weighted average of 30 significant stocks traded on the New York Stock Exchange or The Nasdaq Stock Market LLC. One cannot invest directly in an index. These indices are used for comparative purposes in accordance with Securities and Exchange Commission regulations.
The expense ratio presented is from the most recent prospectus. The expense ratio for the current reporting period is available in the Financial Highlights section of this report.
| WWW.HENNESSYFUNDS.COM |
4
| PERFORMANCE OVERVIEW |
PERFORMANCE NARRATIVE
Portfolio Managers Neil J. Hennessy, Ryan C. Kelley, CFA, and L. Joshua Wein, CAIA
Performance:
For the one-year period ended October 31, 2021, the Hennessy Total Return Fund returned 21.72%, underperforming both the 75/25 Blended DJIA/Treasury Index (the Fund’s primary benchmark) and the Dow Jones Industrial Average, which returned 27.47% and 37.73%, respectively, for the same period.
The Fund underperformed its primary benchmark predominantly as a result of its underweight position in the Financials sector as well as stock selection in the Communication Services and Industrials sectors, with investments in Verizon Communications, Inc. and 3M Company detracting the most from relative performance. Investments that contributed most to relative performance included an Energy sector, a Technology sector, and a Consumer Staples sector company, namely Chevron Corporation, Cisco Systems, Inc., and Walgreens Boots Alliance, Inc., respectively.
The Fund continues to hold all the companies mentioned.
Portfolio Strategy:
The Fund invests approximately 75% of its assets in the “Dogs of the Dow,” the 10 highest dividend-yielding Dow stocks, and 25% of its assets in U.S. Treasuries. As a result of this “blended” strategy, we expect the Fund to underperform equities in periods when equity markets rise and outperform in periods when equity markets fall. The Fund is designed to allow its investors to gain exposure to the equity market while maintaining a significant percentage of its investment in fixed income securities. We believe the Fund is well positioned for the more conservative investor because the equity portion of the portfolio is invested in what we deem to be high-quality companies, each of which pays a quarterly dividend, while the balance of the Fund is invested in lower-risk, short-duration U.S. Treasuries.
Investment Commentary:
After a tumultuous 2020 and a strong 2021, we believe that the outlook for U.S. stocks remains positive. After a sharp contraction in economic activity as a result of the COVID-19 pandemic, the U.S. economy is growing steadily and demonstrating incredible resilience. We are benefiting from increased employment, rapid wage gains, and robust economic activity. Corporate earnings are on the rise, interest rates remain low, and Federal Reserve policies continue to accommodate a strong economy.
If the market experiences a correction, we would expect our more defensive holdings to perform well relative to the market. The relatively short duration of the 25% weighting of U.S. Treasuries in the portfolio (all less than three months) may allow us the ability to roll into higher-yielding Treasuries in the event interest rates rise.
_______________
Opinions expressed are those of the Portfolio Managers as of the date written and are subject to change, are not guaranteed, and should not be considered investment advice or an indication of trading intent.
The Fund is non-diversified, meaning it may concentrate its assets in fewer individual holdings than a diversified fund, making it more exposed to individual stock volatility than a diversified fund. The Fund’s formula-based strategy may cause the Fund to buy or sell securities at times when it may not be advantageous. Please see the Fund’s prospectus for a more complete discussion of these and other risks.
| HENNESSY FUNDS | 1-800-966-4354 |
5
References to specific securities should not be considered a recommendation to buy or sell any security. Fund holdings and sector allocations are subject to change. Please refer to the Schedule of Investments included in this report for additional portfolio information.
Earnings growth is not a measure of the Fund’s future performance.
Dividend yield is calculated by dividing a company’s dividends per share by its market price per share.
| WWW.HENNESSYFUNDS.COM |
6
| PERFORMANCE OVERVIEW/SCHEDULE OF INVESTMENTS |
Financial Statements
Schedule of Investments as of October 31, 2021 |
HENNESSY TOTAL RETURN FUND
(% of Net Assets)
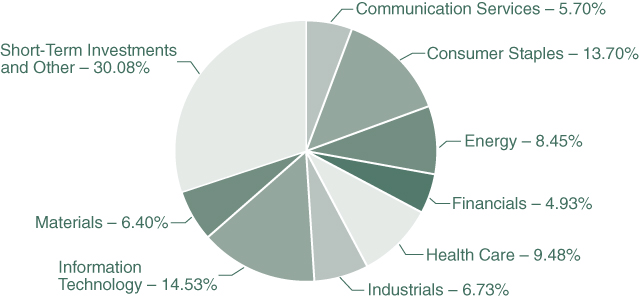
| TOP TEN HOLDINGS (EXCLUDING MONEY MARKET FUNDS) | % NET ASSETS |
| U.S. Treasury Bill, 0.050%, 01/13/2022 | 27.54% |
| U.S. Treasury Bill, 0.050%, 12/16/2021 | 22.04% |
| U.S. Treasury Bill, 0.050%, 11/12/2021 | 16.53% |
| Chevron Corp. | 8.45% |
| Cisco Systems, Inc. | 8.30% |
| The Coca-Cola Co. | 6.97% |
| Merck & Co., Inc. | 6.74% |
| 3M Co. | 6.73% |
| Walgreens Boots Alliance, Inc. | 6.73% |
| Dow, Inc. | 6.40% |
Note: For presentation purposes, the Fund has grouped some of the industry categories. For purposes of categorizing securities for compliance with Section 8(b)(1) of the Investment Company Act of 1940, as amended, the Fund uses more specific industry classifications.
The Global Industry Classification Standard (GICS®) was developed by and is the exclusive property and a service mark of MSCI, Inc. and Standard & Poor’s Financial Services LLC. It has been licensed for use by the Hennessy Funds.
| HENNESSY FUNDS | 1-800-966-4354 |
7
| COMMON STOCKS – 69.92% | Number | % of | ||||||||||
| of Shares | Value | Net Assets | ||||||||||
| Communication Services – 5.70% | ||||||||||||
| Verizon Communications, Inc. | 58,600 | $ | 3,105,214 | 5.70 | % | |||||||
| Consumer Staples – 13.70% | ||||||||||||
| The Coca-Cola Co. | 67,300 | 3,793,701 | 6.97 | % | ||||||||
| Walgreens Boots Alliance, Inc. | 77,900 | 3,662,858 | 6.73 | % | ||||||||
| 7,456,559 | 13.70 | % | ||||||||||
| Energy – 8.45% | ||||||||||||
| Chevron Corp. | 40,200 | 4,602,498 | 8.45 | % | ||||||||
| Financials – 4.93% | ||||||||||||
| JPMorgan Chase & Co. | 15,800 | 2,684,262 | 4.93 | % | ||||||||
| Health Care – 9.48% | ||||||||||||
| Amgen, Inc. | 7,200 | 1,490,184 | 2.74 | % | ||||||||
| Merck & Co., Inc. | 41,700 | 3,671,685 | 6.74 | % | ||||||||
| 5,161,869 | 9.48 | % | ||||||||||
| Industrials – 6.73% | ||||||||||||
| 3M Co. | 20,500 | 3,662,940 | 6.73 | % | ||||||||
| Information Technology – 14.53% | ||||||||||||
| Cisco Systems, Inc. | 80,800 | 4,522,376 | 8.30 | % | ||||||||
| International Business Machines Corp. | 27,100 | 3,390,210 | 6.23 | % | ||||||||
| 7,912,586 | 14.53 | % | ||||||||||
| Materials – 6.40% | ||||||||||||
| Dow, Inc. | 62,300 | 3,486,931 | 6.40 | % | ||||||||
| Total Common Stocks | ||||||||||||
| (Cost $32,373,830) | 38,072,859 | 69.92 | % | |||||||||
The accompanying notes are an integral part of these financial statements.
| WWW.HENNESSYFUNDS.COM |
8
| SCHEDULE OF INVESTMENTS |
| SHORT-TERM INVESTMENTS – 69.84% | Number of Shares/ | % of | ||||||||||
| Par Amount | Value | Net Assets | ||||||||||
| Money Market Funds – 3.73% | ||||||||||||
| First American Government Obligations Fund, | ||||||||||||
| Institutional Class, 0.03% (a) | 2,032,877 | $ | 2,032,877 | 3.73 | % | |||||||
| U.S. Treasury Bills – 66.11% | ||||||||||||
| 0.050%, 11/12/2021 (b)(c) | 9,000,000 | 8,999,890 | 16.53 | % | ||||||||
| 0.050%, 12/16/2021 (b)(c) | 12,000,000 | 11,999,550 | 22.04 | % | ||||||||
| 0.050%, 01/13/2022 (b)(c) | 15,000,000 | 14,998,322 | 27.54 | % | ||||||||
| 35,997,762 | 66.11 | % | ||||||||||
| Total Short-Term Investments | ||||||||||||
| (Cost $38,031,101) | 38,030,639 | 69.84 | % | |||||||||
| Total Investments | ||||||||||||
| (Cost $70,404,931) – 139.76% | 76,103,498 | 139.76 | % | |||||||||
| Liabilities in Excess of Other Assets – (39.76)% | (21,650,932 | ) | (39.76 | )% | ||||||||
TOTAL NET ASSETS – 100.00% | $ | 54,452,566 | 100.00 | % | ||||||||
Percentages are stated as a percent of net assets.
| (a) | The rate listed is the fund’s seven-day yield as of October 31, 2021. |
| (b) | The rate listed is the discount rate at issue. |
| (c) | All or a portion of this security is pledged as collateral for securities sold subject to repurchase. The aggregate fair value of the collateral is $23,998,512. |
Summary of Fair Value Exposure as of October 31, 2021
The following is a summary of the inputs used to value the Fund’s net assets as of October 31, 2021 (see Note 3 in the accompanying Notes to the Financial Statements):
| Common Stocks | Level 1 | Level 2 | Level 3 | Total | ||||||||||||
| Communication Services | $ | 3,105,214 | $ | — | $ | — | $ | 3,105,214 | ||||||||
| Consumer Staples | 7,456,559 | — | — | 7,456,559 | ||||||||||||
| Energy | 4,602,498 | — | — | 4,602,498 | ||||||||||||
| Financials | 2,684,262 | — | — | 2,684,262 | ||||||||||||
| Health Care | 5,161,869 | — | — | 5,161,869 | ||||||||||||
| Industrials | 3,662,940 | — | — | 3,662,940 | ||||||||||||
| Information Technology | 7,912,586 | — | — | 7,912,586 | ||||||||||||
| Materials | 3,486,931 | — | — | 3,486,931 | ||||||||||||
| Total Common Stocks | $ | 38,072,859 | $ | — | $ | — | $ | 38,072,859 | ||||||||
| Short-Term Investments | ||||||||||||||||
| Money Market Funds | $ | 2,032,877 | $ | — | $ | — | $ | 2,032,877 | ||||||||
| U.S. Treasury Bills | — | 35,997,762 | — | 35,997,762 | ||||||||||||
| Total Short-Term Investments | $ | 2,032,877 | $ | 35,997,762 | $ | — | $ | 38,030,639 | ||||||||
| Total Investments | $ | 40,105,736 | $ | 35,997,762 | $ | — | $ | 76,103,498 | ||||||||
The accompanying notes are an integral part of these financial statements.
| HENNESSY FUNDS | 1-800-966-4354 |
9
Schedule of Reverse Repurchase Agreements
| Principal | Maturity | Maturity | |||||||||||
| Face Value | Counterparty | Rate | Trade Date | Date | Amount | ||||||||
| $ | 5,397,000 | Jefferies LLC | 0.20% | 08/12/21 | 11/12/21 | $ | 5,399,728 | ||||||
| 7,196,000 | Jefferies LLC | 0.20% | 09/16/21 | 12/16/21 | 7,199,598 | ||||||||
| 8,995,000 | Jefferies LLC | 0.20% | 10/14/21 | 01/13/22 | 8,999,498 | ||||||||
| $ | 21,588,000 | $ | 21,598,824 | ||||||||||
As of October 31, 2021, the fair value of securities held as collateral for reverse repurchase agreements was $23,998,512, as noted on the Schedule of Investments.
Reverse repurchase agreements are not included in the fair value hierarchy because they are carried at face value. Due to the short-term nature of the reverse repurchase agreements, face value approximates fair value. The face value of the reverse repurchase agreements as of October 31, 2021, was $21,588,000. The face value plus interest due at maturity is equal to $21,598,824.
The accompanying notes are an integral part of these financial statements.
| WWW.HENNESSYFUNDS.COM |
10
| SCHEDULE OF INVESTMENTS/STATEMENT OF ASSETS AND LIABILITIES |
Financial Statements
Statement of Assets and Liabilities as of October 31, 2021 |
| ASSETS: | ||||
| Investments in securities, at value (cost $70,404,931) | $ | 76,103,498 | ||
| Dividends and interest receivable | 53,346 | |||
| Receivable for fund shares sold | 36 | |||
| Prepaid expenses and other assets | 11,115 | |||
| Total assets | 76,167,995 | |||
| LIABILITIES: | ||||
| Payable for fund shares redeemed | 50 | |||
| Payable to advisor | 27,844 | |||
| Payable to administrator | 18,170 | |||
| Payable to auditor | 22,556 | |||
| Accrued distribution fees | 32,635 | |||
| Accrued service fees | 4,640 | |||
| Reverse repurchase agreements | 21,588,000 | |||
| Accrued interest payable | 5,047 | |||
| Accrued trustees fees | 6,603 | |||
| Accrued expenses and other payables | 9,884 | |||
| Total liabilities | 21,715,429 | |||
| NET ASSETS | $ | 54,452,566 | ||
| NET ASSETS CONSISTS OF: | ||||
| Capital stock | $ | 49,037,517 | ||
| Total distributable earnings | 5,415,049 | |||
| Total net assets | $ | 54,452,566 | ||
| NET ASSETS: | ||||
| Investor Class | ||||
| Shares authorized (no par value) | Unlimited | |||
| Net assets applicable to outstanding shares | $ | 54,452,566 | ||
| Shares issued and outstanding | 4,022,436 | |||
| Net asset value, offering price, and redemption price per share | $ | 13.54 | ||
The accompanying notes are an integral part of these financial statements.
| HENNESSY FUNDS | 1-800-966-4354 |
11
Financial Statements
Statement of Operations for the year ended October 31, 2021 |
| INVESTMENT INCOME: | ||||
| Dividend income | $ | 1,580,238 | ||
| Interest income | 17,511 | |||
| Total investment income | 1,597,749 | |||
| EXPENSES: | ||||
| Investment advisory fees (See Note 5) | 334,063 | |||
| Distribution fees – Investor Class (See Note 5) | 83,516 | |||
| Administration, accounting, custody, and transfer agent fees (See Note 5) | 72,976 | |||
| Interest expense (See Notes 7 and 9) | 57,632 | |||
| Service fees – Investor Class (See Note 5) | 55,677 | |||
| Sub-transfer agent expenses – Investor Class (See Note 5) | 40,345 | |||
| Compliance expense (See Note 5) | 27,448 | |||
| Audit fees | 22,556 | |||
| Federal and state registration fees | 21,069 | |||
| Trustees’ fees and expenses | 18,764 | |||
| Reports to shareholders | 7,951 | |||
| Legal fees | 956 | |||
| Other expenses | 10,874 | |||
| Total expenses | 753,827 | |||
| NET INVESTMENT INCOME | $ | 843,922 | ||
| REALIZED AND UNREALIZED GAINS (LOSSES): | ||||
| Net realized loss on investments | $ | (185,169 | ) | |
| Net change in unrealized appreciation/depreciation on investments | 9,981,646 | |||
| Net gain on investments | 9,796,477 | |||
| NET INCREASE IN NET ASSETS RESULTING FROM OPERATIONS | $ | 10,640,399 | ||
The accompanying notes are an integral part of these financial statements.
| WWW.HENNESSYFUNDS.COM |
12
| STATEMENT OF OPERATIONS/STATEMENTS OF CHANGES IN NET ASSETS |
Financial Statements
| Statements of Changes in Net Assets |
| Year Ended | Year Ended | |||||||
| October 31, 2021 | October 31, 2020 | |||||||
| OPERATIONS: | ||||||||
| Net investment income | $ | 843,922 | $ | 1,229,563 | ||||
| Net realized gain (loss) on investments | (185,169 | ) | 4,113,416 | |||||
| Net change in unrealized | ||||||||
| appreciation/depreciation on investments | 9,981,646 | (13,243,536 | ) | |||||
| Net increase (decrease) in net | ||||||||
| assets resulting from operations | 10,640,399 | (7,900,557 | ) | |||||
| DISTRIBUTIONS TO SHAREHOLDERS: | ||||||||
| Distributable earnings – Investor Class | (3,994,715 | ) | (1,304,402 | ) | ||||
| Total distributions | (3,994,715 | ) | (1,304,402 | ) | ||||
| CAPITAL SHARE TRANSACTIONS: | ||||||||
| Proceeds from shares subscribed – Investor Class | 575,745 | 1,734,947 | ||||||
| Dividends reinvested – Investor Class | 3,786,662 | 1,234,664 | ||||||
| Cost of shares redeemed – Investor Class | (7,221,451 | ) | (16,040,005 | ) | ||||
| Net decrease in net assets derived | ||||||||
| from capital share transactions | (2,859,044 | ) | (13,070,394 | ) | ||||
| TOTAL INCREASE (DECREASE) IN NET ASSETS | 3,786,640 | (22,275,353 | ) | |||||
| NET ASSETS: | ||||||||
| Beginning of year | 50,665,926 | 72,941,279 | ||||||
| End of year | $ | 54,452,566 | $ | 50,665,926 | ||||
| CHANGES IN SHARES OUTSTANDING: | ||||||||
| Shares sold – Investor Class | 43,131 | 133,453 | ||||||
| Shares issued to holders as reinvestment | ||||||||
| of dividends – Investor Class | 294,662 | 99,796 | ||||||
| Shares redeemed – Investor Class | (548,584 | ) | (1,218,266 | ) | ||||
| Net decrease in shares outstanding | (210,791 | ) | (985,017 | ) | ||||
The accompanying notes are an integral part of these financial statements.
| HENNESSY FUNDS | 1-800-966-4354 |
13
Financial Statements
Statement of Cash Flows for the year ended October 31, 2021 |
| Cash flows from operating activities: | ||||
| Net increase in net assets from operations | $ | 10,640,399 | ||
| Adjustments to reconcile net increase in net assets resulting from | ||||
| operations to net cash used in operating activities: | ||||
| Payments to purchase securities | (7,485,906 | ) | ||
| Proceeds from sale of securities | 14,049,457 | |||
| Proceeds from securities litigation | 1,493 | |||
| Net sale of short term investments | (540,964 | ) | ||
| Realized loss on investments in securities | 185,169 | |||
| Net accretion of discount on securities | (17,150 | ) | ||
| Change in unrealized appreciation/depreciation | ||||
| on investments in securities | (9,981,646 | ) | ||
| (Increases) decreases in operating assets: | ||||
| Increase in dividends and interest receivable | (5,643 | ) | ||
| Decrease in prepaid expenses and other assets | 81 | |||
| Increases (decreases) in operating liabilities: | ||||
| Increase in payable to advisor | 1,026 | |||
| Increase in payable to administrator | 6,020 | |||
| Increase in payable for distribution fees | 3,487 | |||
| Increase in payable for service fees | 170 | |||
| Decrease in accrued interest payable | (1,924 | ) | ||
| Decrease in accrued audit fees | (544 | ) | ||
| Increase in accrued trustee fees | 2,666 | |||
| Decrease in other accrued expenses and payables | (2,591 | ) | ||
| Net cash provided by operating securities | 6,853,600 | |||
| Cash flows from financing activities: | ||||
| Proceeds on shares sold | 575,854 | |||
| Payment on shares redeemed | (7,221,401 | ) | ||
| Distributions paid in cash, net of reinvestments | (208,053 | ) | ||
| Net cash provided by financing activities | (6,853,600 | ) | ||
| Net increase in cash | — | |||
| Cash: | ||||
| Beginning balance | — | |||
| Ending balance | $ | — | ||
| Supplemental information: | ||||
| Non-cash financing activities not included herein, consisting | ||||
| of dividend reinvestment of dividends and distributions | $ | 3,786,662 | ||
| Cash paid for interest | $ | 59,556 | ||
The accompanying notes are an integral part of these financial statements.
| WWW.HENNESSYFUNDS.COM |
14
| STATEMENT OF CASH FLOWS |
(This Page Intentionally Left Blank.)
| HENNESSY FUNDS | 1-800-966-4354 |
15
Financial Statements
| Financial Highlights |
For an Investor Class share outstanding throughout each year
PER SHARE DATA:
Net asset value, beginning of year
Income from investment operations:
Net investment income
Net realized and unrealized gains (losses) on investments
Total from investment operations
Less distributions:
Dividends from net investment income
Dividends from net realized gains
Total distributions
Net asset value, end of year
TOTAL RETURN
SUPPLEMENTAL DATA AND RATIOS:
Net assets, end of year (millions)
Ratio of expenses, including interest expense, to average net assets
Ratio of net investment income to average net assets
Portfolio turnover rate
(1) | Calculated using the average shares outstanding method. |
The accompanying notes are an integral part of these financial statements.
| WWW.HENNESSYFUNDS.COM |
16
| FINANCIAL HIGHLIGHTS — INVESTOR CLASS |
| Year Ended October 31, | ||||||||||||||||||
| 2021 | 2020 | 2019 | 2018 | 2017 | ||||||||||||||
| $ | 11.97 | $ | 13.98 | $ | 13.57 | $ | 14.66 | $ | 13.84 | |||||||||
| 0.20 | (1) | 0.27 | (1) | 0.24 | (1) | 0.23 | 0.20 | |||||||||||
| 2.33 | (1.99 | ) | 0.81 | 0.43 | 1.48 | |||||||||||||
| 2.53 | (1.72 | ) | 1.05 | 0.66 | 1.68 | |||||||||||||
| (0.20 | ) | (0.29 | ) | (0.24 | ) | (0.23 | ) | (0.20 | ) | |||||||||
| (0.76 | ) | — | (0.40 | ) | (1.52 | ) | (0.66 | ) | ||||||||||
| (0.96 | ) | (0.29 | ) | (0.64 | ) | (1.75 | ) | (0.86 | ) | |||||||||
| $ | 13.54 | $ | 11.97 | $ | 13.98 | $ | 13.57 | $ | 14.66 | |||||||||
| 21.72 | % | -12.36 | % | 7.93 | % | 4.92 | % | 12.56 | % | |||||||||
| $ | 54.45 | $ | 50.67 | $ | 72.94 | $ | 71.60 | $ | 77.75 | |||||||||
| 1.35 | % | 1.73 | % | 2.31 | % | 1.95 | % | 1.57 | % | |||||||||
| 1.52 | % | 2.05 | % | 1.74 | % | 1.67 | % | 1.38 | % | |||||||||
| 19 | % | 39 | % | 30 | % | 10 | % | 36 | % | |||||||||
The accompanying notes are an integral part of these financial statements.
| HENNESSY FUNDS | 1-800-966-4354 |
17
Financial Statements
Notes to the Financial Statements October 31, 2021 |
1). ORGANIZATION
The Hennessy Total Return Fund (the “Fund”) is a series of Hennessy Funds Trust (the “Trust”), which was organized as a Delaware statutory trust on September 17, 1992. The Fund is an open-end management investment company registered under the Investment Company Act of 1940, as amended. The investment objective of the Fund is total return, consisting of capital appreciation and current income. The Fund is a non-diversified fund and offers Investor Class shares.
As an investment company, the Fund follows the investment company accounting and reporting guidance of the Financial Accounting Standards Board (“FASB”) Accounting Standard Codification Topic 946 “Financial Services—Investment Companies.”
2). SIGNIFICANT ACCOUNTING POLICIES
The following is a summary of significant accounting policies consistently followed by the Fund in the preparation of the financial statements. These policies conform to U.S. generally accepted accounting principles (“GAAP”).
| a). | Securities Valuation – All investments in securities are valued in accordance with the Fund’s valuation policies and procedures, as described in Note 3. |
| b). | Federal Income Taxes – The Fund has elected to be taxed as a regulated investment company and intends to distribute substantially all of its taxable income to its shareholders and otherwise comply with the provisions of the Internal Revenue Code of 1986, as amended, applicable to regulated investment companies. As a result, the Fund has made no provision for federal income taxes or excise taxes. Net investment income/loss and realized gains/losses for federal income tax purposes may differ from those reported in the financial statements because of temporary book-basis and tax-basis differences. Temporary differences are primarily the result of the treatment of wash sales for tax reporting purposes. The Fund recognizes interest and penalties related to income tax benefits, if any, in the Statement of Operations as an income tax expense. Distributions from net realized gains for book purposes may include short-term capital gains, which are included as ordinary income to shareholders for tax purposes. The Fund may utilize equalization accounting for tax purposes and designate earnings and profits, including net realized gains distributed to shareholders on redemption of shares, as part of the dividends paid deduction for income tax purposes. |
| Due to inherent differences in the recognition of income, expenses, and realized gains/losses under GAAP and federal income tax regulations, permanent differences between book and tax basis for reporting are identified and appropriately reclassified in the Statement of Assets and Liabilities, as needed. As of October 31, 2021, no such reclassifications were required for fiscal year 2021. | |
| c). | Accounting for Uncertainty in Income Taxes – The Fund has accounting policies regarding recognition and measurement of tax positions taken or expected to be taken on a tax return. The tax returns of the Fund for the prior three fiscal years are open for examination. The Fund has reviewed all open tax years in major tax |
| WWW.HENNESSYFUNDS.COM |
18
| NOTES TO THE FINANCIAL STATEMENTS |
| jurisdictions and concluded that there is no impact on the Fund’s net assets and no tax liability resulting from unrecognized tax benefits relating to uncertain income tax positions taken or expected to be taken on a tax return. The Fund’s major tax jurisdictions are U.S. federal and Delaware. | |
| d). | Income and Expenses – Dividend income is recognized on the ex-dividend date or as soon as information is available to the Fund. Interest income, which includes the amortization of premium and accretion of discount, is recognized on an accrual basis. Market discounts, original issue discounts, and market premiums on debt securities are accreted or amortized to interest income over the life of a security with a corresponding increase or decrease, as applicable, in the cost basis of such security using the yield-to-maturity method or, where applicable, the first call date of the security. Other non-cash dividends are recognized as investment income at the fair value of the property received. The Fund is charged for those expenses that are directly attributable to its portfolio, such as advisory, administration, and certain shareholder service fees. |
| e). | Distributions to Shareholders – Dividends from net investment income for the Fund, if any, are declared and paid at the end of each calendar quarter. Distributions of net realized capital gains, if any, are declared and paid annually, usually in December. |
| f). | Security Transactions – Investment and shareholder transactions are recorded on the trade date. The Fund determines the realized gain/loss from an investment transaction by comparing the original cost of the security lot sold with the net sale proceeds. Discounts and premiums on securities purchased are accreted or amortized, respectively, over the life of each such security. |
| g). | Use of Estimates – Preparing financial statements in accordance with GAAP requires management to make estimates and assumptions that affect the reported amounts of assets and liabilities and disclosure of contingent assets and liabilities at the date of the financial statements, as well as the reported change in net assets during the reporting period. Actual results could differ from those estimates. |
| h). | Share Valuation – The net asset value (“NAV”) per share of the Fund is calculated by dividing (i) the total value of the securities held by the Fund, plus cash and other assets, minus all liabilities (including estimated accrued expenses) by (ii) the total number of Fund shares outstanding, rounded to the nearest $0.01. Fund shares are not priced on days the New York Stock Exchange is closed for trading. The offering and redemption price per share for the Fund is equal to the Fund’s NAV per share. |
| i). | Reverse Repurchase Agreements – Transactions involving reverse repurchase agreements are treated as collateralized financing transactions and are recorded at their contracted resell or repurchase amounts, which approximates fair value. Upon entering into a reverse repurchase agreement transaction, the Fund establishes a segregated account in which it maintains liquid assets in an amount at least equal to the repurchase price marked to market daily (including accrued interest), and the Fund subsequently monitors the account to ensure that it maintains such equivalent value. Interest on reverse repurchase agreements is included in interest payable. |
| As of October 31, 2021, securities with a fair value of $23,998,512, which are included in investments in securities in the Statement of Assets and Liabilities, were pledged to collateralize reverse repurchase agreements. | |
| j). | Offsetting Assets and Liabilities – The Fund follows the financial reporting rules regarding offsetting assets and liabilities and related netting arrangements to enable |
| HENNESSY FUNDS | 1-800-966-4354 |
19
| users of its financial statements to understand the effect of those arrangements on its financial position. Reverse repurchase transactions are entered into by the Fund under Master Repurchase Agreements (“MRAs”) that permit the Fund, under certain circumstances, including an event of default (such as bankruptcy or insolvency), to offset payables under the MRA with collateral held with the counterparty and create one single net payment from the Fund. Upon a bankruptcy or insolvency of the MRA counterparty, the Fund is considered an unsecured creditor with respect to excess collateral and, as such, the return of excess collateral may be delayed. In the event the buyer of securities under an MRA files for bankruptcy or becomes insolvent, the Fund’s use of the proceeds of the MRA may be restricted while the other party, or its trustee or receiver, determines whether or not to enforce the Fund’s obligation to repurchase the securities. For additional information regarding the offsetting of assets and liabilities as of October 31, 2021, please refer to the table in Note 9. | |
| k). | Recent Accounting Pronouncements and Regulatory Updates – In October 2020, the Securities and Exchange Commission (“SEC”) adopted new regulations governing the use of derivatives by registered investment companies (“Rule 18f-4”). Rule 18f-4 imposes limits on the amount of derivatives a fund can enter into, eliminates the asset segregation framework currently used by funds to comply with Section 18 of the 1940 Act, and requires funds whose use of derivatives is greater than a limited specified amount to establish and maintain a comprehensive derivatives risk management program and appoint a derivatives risk manager. Funds are required to comply with Rule 18f-4 by August 19, 2022. The impact, if any, that Rule 18f-4 will have on the availability, liquidity, and performance of derivatives is unclear. Management is currently evaluating the potential impact of Rule 18f-4 on the Fund. When fully implemented, Rule 18f-4 may require changes in how the Fund uses derivatives, adversely affect the Fund’s performance, and increase costs related to the Fund’s use of derivatives. |
| In December 2020, the SEC adopted a new rule providing a framework for fund valuation practices (“Rule 2a-5”). Rule 2a-5 establishes requirements for determining fair value in good faith for purposes of the 1940 Act. Rule 2a-5 permits fund boards to designate certain parties to perform fair value determinations, subject to board oversight and certain other conditions. Rule 2a-5 also defines when market quotations are “readily available” for purposes of the 1940 Act and the threshold for determining whether a fund must fair value a security. In connection with Rule 2a-5, the SEC also adopted related recordkeeping requirements and is rescinding previously issued guidance, including with respect to the role of a board in determining fair value and the accounting and auditing of fund investments. Funds must comply with the rules by September 8, 2022. Management is currently assessing the potential impact of the new rules on the Fund’s financial statements. |
3). SECURITIES VALUATION
The Fund follows its valuation policies and procedures in determining its net asset value and, in preparing these financial statements, the fair value accounting standards that establish an authoritative definition of fair value and set out a hierarchy for measuring fair value. These standards require additional disclosures about the various inputs and valuation techniques used to develop the measurements of fair value and a discussion of changes in valuation techniques and related inputs during the period. These inputs are summarized in the three broad levels listed below:
| Level 1 – | Unadjusted, quoted prices in active markets for identical instruments that the Fund has the ability to access at the date of measurement. |
| WWW.HENNESSYFUNDS.COM |
20
| NOTES TO THE FINANCIAL STATEMENTS |
| Level 2 – | Other significant observable inputs (including, but not limited to, quoted prices in active markets for similar instruments, quoted prices in markets that are not active for identical or similar instruments, and model-derived valuations in which all significant inputs and significant value drivers are observable in active markets, such as interest rates, prepayment speeds, credit risk curves, default rates, and similar data). | |
| Level 3 – | Significant unobservable inputs (including the Fund’s own assumptions about what market participants would use to price the asset or liability based on the best available information) when observable inputs are unavailable. |
The following is a description of the valuation techniques applied to the Fund’s major categories of assets and liabilities on a recurring basis:
Equity Securities – Equity securities, including common stocks, preferred stocks, exchange-traded funds, closed-end mutual funds, partnerships, rights, and real estate investment trusts, that are traded on a securities exchange for which a last-quoted sales price is readily available generally are valued at the last sales price as reported by the primary exchange on which the securities are listed. Securities listed on The NASDAQ Stock Market (“NASDAQ”) generally are valued at the NASDAQ Official Closing Price, which may differ from the last sales price reported. Securities traded on a securities exchange for which a last-quoted sales price is not readily available generally are valued at the mean between the bid and ask prices. To the extent these securities are actively traded and valuation adjustments are not applied, they are classified in Level 1 of the fair value hierarchy. | |
Registered Investment Companies – Investments in open-end registered investment companies, commonly referred to as mutual funds, generally are priced at the ending NAV provided by the applicable mutual fund’s service agent and are classified in Level 1 of the fair value hierarchy. | |
Debt Securities – Debt securities, including corporate bonds, asset-backed securities, mortgage-backed securities, municipal bonds, U.S. Treasuries, and U.S. government agency issues, are generally valued at market on the basis of valuations furnished by an independent pricing service that utilizes both dealer-supplied valuations and formula-based techniques. The pricing service may consider recently executed transactions in securities of the issuer or comparable issuers, market price quotations (where observable), bond spreads, and fundamental data relating to the issuer. In addition, the model may incorporate observable market data, such as reported sales of similar securities, broker quotes, yields, bids, offers, and reference data. Certain securities are valued primarily using dealer quotations. These securities are generally classified in Level 2 of the fair value hierarchy. | |
Short-Term Securities – Short-term equity investments, including money market funds, are valued in the manner specified above for equity securities. Short-term debt investments with an original term to maturity of 60 days or less are valued at amortized cost, which approximates fair market value. If the original term to maturity of a short-term debt investment exceeds 60 days, then the values as of the 61st day prior to maturity are amortized. Amortized cost is not used if its use would be inappropriate due to credit or other impairments of the issuer, in which case the security’s fair value would be determined as described below. Short-term securities are generally classified in Level 1 or Level 2 of the fair value hierarchy depending on the inputs used and market activity levels for specific securities. |
| HENNESSY FUNDS | 1-800-966-4354 |
21
The Board of Trustees of the Fund (the “Board”) has adopted fair value pricing procedures that are followed when a price for a security is not readily available or if a significant event has occurred that indicates the closing price of a security no longer represents the true value of that security. Fair value pricing determinations are made in good faith in accordance with these procedures. There are numerous criteria considered in determining a fair value of a security, such as the trading volume of a security and markets, the values of other similar securities, and news events with direct bearing on a security or markets. Fair value pricing results in an estimated price for a security that reflects the amount the Fund might reasonably expect to receive in a current sale. Depending on the relative significance of the valuation inputs, these securities may be classified in either Level 2 or Level 3 of the fair value hierarchy.
The Board has delegated day-to-day valuation matters to the Valuation and Liquidity Committee comprising representatives from Hennessy Advisors, Inc., the Fund’s investment advisor (the “Advisor”). The function of the Valuation and Liquidity Committee, among other things, is to value securities where current and reliable market quotations are not readily available. All actions taken by the Valuation and Liquidity Committee are reviewed by the Board.
The Fund has performed an analysis of all existing investments to determine the significance and character of all inputs to their fair value determinations. Various inputs are used to determine the value of the Fund’s investments. The inputs or methodology used for valuing securities are not necessarily an indication of the risk associated with investing in those securities. Details related to the fair value hierarchy of the Fund’s securities as of October 31, 2021, are included in the Schedule of Investments.
4). INVESTMENT TRANSACTIONS
Purchases and sales of investment securities (excluding government and short-term investments) for the Fund during fiscal year 2021 were $7,485,906 and $14,049,457, respectively.
There were no purchases or sales/maturities of long-term U.S. government securities for the Fund during fiscal year 2021.
5). INVESTMENT ADVISORY FEE AND OTHER TRANSACTIONS WITH AFFILIATES
The Advisor provides the Fund with investment advisory services under an Investment Advisory Agreement. The Advisor furnishes all investment advice, office space, and facilities and most of the personnel needed by the Fund. As compensation for its services, the Advisor is entitled to a monthly fee from the Fund. The fee is based on the average daily net assets of the Fund at an annual rate of 0.60%. The net investment advisory fees expensed by the Fund during fiscal year 2021 are included in the Statement of Operations.
The Board has approved a Shareholder Servicing Agreement for the Fund, which compensates the Advisor for the non-investment advisory services it provides to the Fund. The Shareholder Servicing Agreement provides for a monthly fee paid to the Advisor at an annual rate of 0.10% of the average daily net assets of the Fund. The shareholder service fees expensed by the Fund during fiscal year 2021 are included in the Statement of Operations.
The Fund has adopted a plan pursuant to Rule 12b-1 under the Investment Company Act of 1940, as amended, that authorizes payments in connection with the distribution of Fund shares at an annual rate of up to 0.25% of the Fund’s average daily net assets. Even though the authorized rate is up to 0.25%, the Fund is currently only using up to 0.15% of its average daily net assets for such purpose. Amounts paid under the plan may be spent on any activities or expenses primarily intended to result in the sale of shares, including,
| WWW.HENNESSYFUNDS.COM |
22
| NOTES TO THE FINANCIAL STATEMENTS |
but not limited to, advertising, shareholder account servicing, printing and mailing of prospectuses to other than current shareholders, printing and mailing of sales literature, and compensation for sales and marketing activities or to financial institutions and others, such as dealers and distributors. The distribution fees expensed by the Fund during fiscal year 2021 are included in the Statement of Operations.
The Fund has entered into agreements with various brokers, dealers, and financial intermediaries in connection with the sale of Fund shares. The agreements provide for periodic payments of sub-transfer agent expenses by the Fund to the brokers, dealers, and financial intermediaries for providing certain shareholder maintenance services. These shareholder services include the pre-processing and quality control of new accounts, shareholder correspondence, answering customer inquiries regarding account status, and facilitating shareholder telephone transactions. The sub-transfer agent fees expensed by the Fund during fiscal year 2021 are included in the Statement of Operations.
U.S. Bancorp Fund Services, LLC, d/b/a U.S. Bank Global Fund Services (“Fund Services”) provides the Fund with administrative, accounting, and transfer agent services. As administrator, Fund Services is responsible for activities such as (i) preparing various federal and state regulatory filings, reports, and returns for the Fund, (ii) preparing reports and materials to be supplied to the Board, (iii) monitoring the activities of the Fund’s custodian, transfer agent, and accountants, and (iv) coordinating the preparation and payment of the Fund’s expenses and reviewing the Fund’s expense accruals. U.S. Bank N.A., an affiliate of Fund Services, serves as the Fund’s custodian. The servicing agreements between the Trust, Fund Services, and U.S. Bank N.A. contain a fee schedule that is inclusive of administrative, accounting, custody, and transfer agent fees. The administrative, accounting, custody, and transfer agent fees expensed by the Fund during fiscal year 2021 are included in the Statement of Operations.
Quasar Distributors, LLC (“Quasar”), a wholly owned broker-dealer subsidiary of Foreside Financial Group, LLC (“Foreside”), acts as the Fund’s principal underwriter in a continuous public offering of Fund shares. Effective September 30, 2021, Genstar Capital, a private equity firm specializing in financial and related business service companies, acquired a majority interest in Foreside. The Board approved a new Distribution Agreement to enable Quasar to continue serving as the Fund’s distributor following the change in control of Foreside.
The officers of the Fund are affiliated with the Advisor. With the exception of the Chief Compliance Officer and the Senior Compliance Officer, such officers receive no compensation from the Fund for serving in their respective roles. The Fund, along with the other funds in the Hennessy Funds family (collectively, the “Hennessy Funds”), makes reimbursement payments on an equal basis to the Advisor for a portion of the salary and benefits associated with the office of the Chief Compliance Officer and for all of the salary and benefits associated with the office of the Senior Compliance Officer. The compliance fees expensed by the Fund during fiscal year 2021 are included in the Statement of Operations.
6). GUARANTEES AND INDEMNIFICATIONS
Under the Hennessy Funds’ organizational documents, their officers and trustees are indemnified by the Hennessy Funds against certain liabilities arising out of the performance of their duties to the Hennessy Funds. Additionally, in the normal course of business, the Hennessy Funds enter into contracts with service providers that contain general indemnification clauses. The Fund’s maximum exposure under these arrangements is unknown as this would involve future claims that may be made against the Fund that have not yet occurred. Currently, the Fund expects the risk of loss to be remote.
| HENNESSY FUNDS | 1-800-966-4354 |
23
7). LINE OF CREDIT
The Fund has an uncommitted line of credit with the other Hennessy Funds in the amount of the lesser of (i) $100,000,000 or (ii) 33.33% of each Hennessy Fund’s net assets, or 30% for the Hennessy Gas Utility Fund and 10% for the Hennessy Balanced Fund. The line of credit is intended to provide any necessary short-term financing in connection with shareholder redemptions, subject to certain restrictions. The credit facility is with the Hennessy Funds’ custodian bank, U.S. Bank N.A. Borrowings under this arrangement bear interest at the bank’s prime rate and are secured by all of the Fund’s assets (as to its own borrowings only). During fiscal year 2021, the Fund had an outstanding average daily balance and a weighted average interest rate of $5,745 and 3.25%, respectively. The interest expensed by the Fund under the line of credit during fiscal year 2021 is included as a component of interest expense in the Statement of Operations. The maximum amount outstanding for the Fund during fiscal year 2021 was $699,000. As of October 31, 2021, the Fund did not have any borrowings outstanding under the line of credit.
8). FEDERAL TAX INFORMATION
As of October 31, 2021, the components of accumulated earnings (losses) for income tax purposes were as follows:
| Investments | ||||
| Cost of investments for tax purposes | $ | 70,431,450 | ||
| Gross tax unrealized appreciation | $ | 6,894,601 | ||
| Gross tax unrealized depreciation | (1,222,553 | ) | ||
| Net tax unrealized appreciation/(depreciation) | $ | 5,672,048 | ||
| Undistributed ordinary income | $ | 20,834 | ||
| Undistributed long-term capital gains | — | |||
| Total distributable earnings | $ | 20,834 | ||
| Other accumulated gain/(loss) | $ | (277,833 | ) | |
| Total accumulated gain/(loss) | $ | 5,415,049 | ||
The difference between book-basis unrealized appreciation/depreciation and tax-basis unrealized appreciation/depreciation (as shown above) is attributable primarily to wash sales.
As of October 31, 2021, the Fund had $277,833 in unlimited long-term capital loss carryforwards.
Capital losses sustained in or after fiscal year 2012 can be carried forward indefinitely, but any such loss retains the character of the original loss and must be utilized prior to any loss incurred before fiscal year 2012. As a result of this ordering rule, capital loss carryforwards incurred prior to fiscal year 2012 may be more likely to expire unused. Capital losses sustained prior to fiscal year 2012 can be carried forward for eight years and can be carried forward as short-term capital losses regardless of the character of the original loss.
As of October 31, 2021, the Fund did not defer, on a tax basis, any late-year ordinary losses. Late-year ordinary losses are net ordinary losses incurred after December 31, 2020, but within the taxable year, that are deemed to arise on the first day of the Fund’s next taxable year.
| WWW.HENNESSYFUNDS.COM |
24
| NOTES TO THE FINANCIAL STATEMENTS |
During fiscal years 2021 and 2020, the tax character of distributions paid by the Fund was as follows:
| Year Ended | Year Ended | ||||||||
| October 31, 2021 | October 31, 2020 | ||||||||
Ordinary income(1) | $ | 844,427 | $ | 1,304,402 | |||||
| Long-term capital gains | 3,150,288 | — | |||||||
| Total distributions | $ | 3,994,715 | $ | 1,304,402 | |||||
(1) Ordinary income includes short-term capital gains. |
9). REVERSE REPURCHASE AGREEMENTS
Under a reverse repurchase agreement, the Fund sells securities and agrees to repurchase them at a mutually agreed date and price. Reverse repurchase agreements are regarded as a form of secured borrowing by the Fund. Securities sold under reverse repurchase agreements are reflected as a liability in the Statement of Assets and Liabilities. Interest payments made under reverse repurchase agreements during fiscal year 2021 totaled $57,443 and are recorded as a component of interest expense in the Statement of Operations.
During fiscal year 2021, the average daily balance and average interest rate in effect for reverse repurchase agreements were $22,376,603 and 0.25%, respectively. Below is information about the scheduled maturity date, amount, and interest rate for outstanding reverse repurchase agreements as of October 31, 2021:
Maturity Date | Amount | Interest Rate | ||
| November 12, 2021 | $5,397,000 | 0.20% | ||
| December 16, 2021 | $7,196,000 | 0.20% | ||
| January 13, 2022 | $8,995,000 | 0.20% |
Outstanding reverse repurchase agreements as of October 31, 2021, comprised 39.65% of the Fund’s net assets.
Below is information about reverse repurchase agreements eligible for offset in the Statement of Assets and Liabilities, on both a gross and net basis:
| Gross | Net | Gross Amounts Not Offset in the Statement of Assets and Liabilities | ||||||||||||||||||||
| Amounts | Amounts | |||||||||||||||||||||
| Offset | Presented | |||||||||||||||||||||
| Gross | in the | in the | ||||||||||||||||||||
| Amounts of | Statement of | Statement of | Collateral | |||||||||||||||||||
| Recognized | Assets and | Assets and | Financial | Pledged | Net | |||||||||||||||||
| Liabilities | Liabilities | Liabilities | Instruments | (Received) | Amount | |||||||||||||||||
| $ | 21,588,000 | $ | — | $ | 21,588,000 | $ | 21,588,000 | $ | — | $ | — | |||||||||||
| $ | 21,588,000 | $ | — | $ | 21,588,000 | $ | 21,588,000 | $ | — | $ | — | |||||||||||
For additional information, please refer to the “Offsetting Assets and Liabilities” section in Note 2.
10). EVENTS SUBSEQUENT TO YEAR END
Management has evaluated the Fund’s related events and transactions that occurred subsequent to October 31, 2021, through the date of issuance of the Fund’s financial statements. Management has determined that there were no subsequent events requiring recognition or disclosure in the financial statements.
| HENNESSY FUNDS | 1-800-966-4354 |
25
Report of Independent Registered Public
Accounting Firm
To the Board of Trustees of Hennessy Funds Trust
and the shareholders of the Hennessy Total Return Fund
Novato, CA
Opinion on the Financial Statements
We have audited the accompanying statement of assets and liabilities of the Hennessy Total Return Fund (the “Fund”), a series of Hennessy Funds Trust, including the schedule of investments, as of October 31, 2021, the related statement of operations for the year then ended, the statements of changes in net assets for each of the two years in the period then ended, the financial highlights for each of the five years in the period then ended, and the related notes (collectively referred to as the “financial statements”). In our opinion, the financial statements present fairly, in all material respects, the financial position of the Fund as of October 31, 2021, the results of its operations for the year then ended, the changes in its net assets for each of the two years in the period then ended, and the financial highlights for each of the five years in the period then ended in conformity with accounting principles generally accepted in the United States of America.
Basis for Opinion
These financial statements are the responsibility of the Fund’s management. Our responsibility is to express an opinion on the Fund’s financial statements based on our audits. We are a public accounting firm registered with the Public Company Accounting Oversight Board (United States) (“PCAOB”) and are required to be independent with respect to the Fund in accordance with the U.S. federal securities laws and the applicable rules and regulations of the Securities and Exchange Commission and the PCAOB. We have served as the auditor of one or more of the funds in the Trust since 2002.
We conducted our audits in accordance with the standards of the PCAOB. Those standards require that we plan and perform the audit to obtain reasonable assurance about whether the financial statements are free of material misstatement, whether due to error or fraud. The Fund is not required to have, nor were we engaged to perform, an audit of its internal control over financial reporting. As part of our audits we are required to obtain an understanding of internal control over financial reporting, but not for the purpose of expressing an opinion on the effectiveness of the Fund’s internal control over financial reporting. Accordingly, we express no such opinion.
Our audits included performing procedures to assess the risks of material misstatement of the financial statements, whether due to error or fraud, and performing procedures that respond to those risks. Such procedures included examining, on a test basis, evidence regarding the amounts and disclosures in the financial statements. Our audits also included evaluating the accounting principles used and significant estimates made by management, as well as evaluating the overall presentation of the financial statements. Our procedures included confirmation of securities owned as of October 31, 2021 by correspondence with the custodian. We believe that our audits provide a reasonable basis for our opinion.
| |
| TAIT, WELLER & BAKER LLP |
Philadelphia, Pennsylvania
December 22, 2021
| WWW.HENNESSYFUNDS.COM |
26
| REPORT OF INDEPENDENT REGISTERED PUBLIC ACCOUNTING FIRM/TRUSTEES AND OFFICERS |
Trustees and Officers of the Fund (Unaudited)
The business and affairs of the Funds are managed under the direction of the Board of Trustees of the Trust, and the Board of Trustees elects the officers of the Trust. From time to time, the Board of Trustees also has appointed advisers to the Board of Trustees (“Advisers”) with the intention of having qualified individuals serve in an advisory capacity to garner experience in the mutual fund and asset management industry and be considered as potential Trustees in the future. There are currently two Advisers, Brian Alexander and Doug Franklin. As Advisers, Mr. Alexander and Mr. Franklin attend meetings of the Board of Trustees and act as non-voting participants. Information pertaining to the Trustees, Advisers, and the officers of the Trust is set forth below. The Trustees and officers serve until their successors are duly elected and qualified or until their earlier death, resignation, or removal. Each Trustee oversees all 16 Hennessy Funds. Unless otherwise indicated, the address of all persons listed below is 7250 Redwood Boulevard, Suite 200, Novato, CA 94945. The Fund’s Statement of Additional Information includes more information about the persons listed below and is available without charge by calling 1-800-966-4354 or by visiting www.hennessyfunds.com.
| Other | |||
| Directorships | |||
| Held Outside | |||
| Name, Age, | of Fund | ||
| and Position Held | Start Date | Principal Occupation(s) | Complex During |
with the Trust | of Service | During Past Five Years | Past Five Years |
| Disinterested Trustees and Advisers | |||
| J. Dennis DeSousa | January 1996 | Mr. DeSousa is a real estate investor. | None. |
| 85 | |||
| Trustee | |||
| Robert T. Doyle | January 1996 | Mr. Doyle has been the Sheriff of | None. |
| 74 | Marin County, California since 1996. | ||
| Trustee | |||
| Claire Garvie | December 2015 | Ms. Garvie is a founder of Kiosk and | None. |
| 47 | as an Adviser | has served as its Chief Operating | |
| Trustee | to the Board | Officer since 2004. Kiosk is a full- | |
| and | service marketing agency with | ||
| December 2021 | offices in the San Francisco Bay Area, | ||
| as a Trustee | Toronto, and Liverpool, UK. | ||
| Gerald P. Richardson | May 2004 | Mr. Richardson is an independent | None. |
| 76 | consultant in the securities industry. | ||
| Trustee |
| HENNESSY FUNDS | 1-800-966-4354 |
27
| Other | |||
| Directorships | |||
| Held Outside | |||
| Name, Age, | of Fund | ||
| and Position Held | Start Date | Principal Occupation(s) | Complex During |
with the Trust | of Service | During Past Five Years | Past Five Years |
| Brian Alexander | March 2015 | Mr. Alexander has worked for the | None. |
| 40 | Sutter Health organization since | ||
| Adviser to the Board | 2011 in various positions. He has | ||
| served as the Chief Executive Officer | |||
| of the Sutter Roseville Medical | |||
| Center since 2018. From 2016 through | |||
| 2018, he served as the Vice President | |||
| of Strategy for the Sutter Health Valley | |||
| Area, which includes 11 hospitals, | |||
| 13 ambulatory surgery centers, | |||
| 16,000 employees, and 1,900 physicians. | |||
| From 2013 through 2016, Mr. Alexander | |||
| served as Sutter Novato Community | |||
| Hospital’s Chief Administrative Officer. | |||
| Doug Franklin | March 2016 | Mr. Franklin is a retired insurance | None. |
| 57 | industry executive. From 1987 | ||
| Adviser to the Board | through 2015, he was employed | ||
| by the Allianz-Fireman’s Fund | |||
| Insurance Company in various | |||
| positions, including as its Chief | |||
| Actuary and Chief Risk Officer. | |||
Interested Trustee(1) | |||
| Neil J. Hennessy | January 1996 as | Mr. Hennessy has been employed | Hennessy |
| 65 | a Trustee and | by Hennessy Advisors, Inc. since | Advisors, Inc. |
| Chairman of the Board, | June 2008 as | 1989 and currently serves as its | |
| Chief Market Strategist, | an officer | Chairman and Chief Executive Officer. | |
| Portfolio Manager, | |||
| and President |
| Name, Age, | ||
| and Position Held | Start Date | Principal Occupation(s) |
with the Trust | of Service | During Past Five Years |
| Officers | ||
| Teresa M. Nilsen | January 1996 | Ms. Nilsen has been employed by Hennessy Advisors, Inc. |
| 55 | since 1989 and currently serves as its President and Chief | |
| Executive Vice President | Operating Officer. | |
| and Treasurer | ||
| Daniel B. Steadman | March 2000 | Mr. Steadman has been employed by Hennessy Advisors, Inc. |
| 65 | since 2000 and currently serves as its Executive Vice President. | |
| Executive Vice President | ||
| and Secretary | ||
| Brian Carlson | December 2013 | Mr. Carlson has been employed by Hennessy Advisors, Inc. |
| 49 | since December 2013 and currently serves as its Chief | |
| Senior Vice President | Compliance Officer and Senior Vice President. | |
| and Head of Distribution |
| WWW.HENNESSYFUNDS.COM |
28
| TRUSTEES AND OFFICERS OF THE FUND |
| Name, Age, | ||
| and Position Held | Start Date | Principal Occupation(s) |
with the Trust�� | of Service | During Past Five Years |
Jennifer Cheskiewicz(2) | June 2013 | Ms. Cheskiewicz has been employed by Hennessy Advisors, Inc. |
| 44 | as its General Counsel since June 2013. | |
| Senior Vice President and | ||
| Chief Compliance Officer | ||
David Ellison(3) | October 2012 | Mr. Ellison has been employed by Hennessy Advisors, Inc. since |
| 63 | October 2012. He has served as a Portfolio Manager of the | |
| Senior Vice President | Hennessy Large Cap Financial Fund and the Hennessy Small | |
| and Portfolio Manager | Cap Financial Fund since their inception. Mr. Ellison also served | |
| as a Portfolio Manager of the Hennessy Technology Fund from | ||
| its inception until February 2017. Mr. Ellison served as Director, | ||
| CIO, and President of FBR Fund Advisers, Inc. from December | ||
| 1999 to October 2012. | ||
Ryan Kelley(4) | March 2013 | Mr. Kelley has been employed by Hennessy Advisors, Inc. since |
| 49 | October 2012. He has served as Chief Investment Officer of the | |
| Chief Investment Officer, | Hennessy Funds since March 2021 and has served as a Portfolio | |
| Senior Vice President, | Manager of the Hennessy Gas Utility Fund, the Hennessy Large | |
| and Portfolio Manager | Cap Financial Fund, and the Hennessy Small Cap Financial Fund | |
| since October 2014. Mr. Kelley served as Co-Portfolio Manager | ||
| of these same funds from March 2013 through September | ||
| 2014 and as a Portfolio Analyst for the Hennessy Funds from | ||
| October 2012 through February 2013. He has also served as a | ||
| Portfolio Manager of the Hennessy Cornerstone Growth Fund, | ||
| the Hennessy Cornerstone Mid Cap 30 Fund, the Hennessy | ||
| Cornerstone Large Growth Fund, and the Hennessy | ||
| Cornerstone Value Fund since February 2017 and as a Portfolio | ||
| Manager of the Hennessy Total Return Fund, the Hennessy | ||
| Balanced Fund, and the Hennessy Technology Fund since May | ||
| 2018. He served as Co-Portfolio Manager of the Hennessy | ||
| Technology Fund from February 2017 until May 2018. Mr. Kelley | ||
| served as Portfolio Manager of FBR Fund Advisers, Inc. from | ||
| January 2008 to October 2012. | ||
L. Joshua Wein(4) | September 2018 | Mr. Wein has been employed by Hennessy Advisors, Inc. since |
| 48 | 2018. He has served as Co-Portfolio Manager of the Hennessy | |
| Vice President and | Cornerstone Growth Fund, the Hennessy Cornerstone | |
| Co-Portfolio Manager | Mid Cap 30 Fund, the Hennessy Cornerstone Large Growth | |
| Fund, the Hennessy Cornerstone Value Fund, Hennessy Total | ||
| Return Fund, the Hennessy Balanced Fund, the Hennessy Gas | ||
| Utility Fund, and the Hennessy Technology Fund since February | ||
| 2019. He served as a Senior Analyst of these same funds from | ||
| September 2018 through February 2019. Mr. Wein served as | ||
| Director of Alternative Investments and Co-Portfolio Manager | ||
| at Sterling Capital Management from 2008 to 2018. |
_______________
(1) | Mr. Hennessy is considered an “interested person,” as defined in the Investment Company Act of 1940, as amended, because he is an officer of the Trust. |
(2) | The address of this officer is 4800 Bee Caves Road, Suite 100, Austin, TX 78746. |
(3) | The address of this officer is 101 Federal Street, Suite 1615B, Boston, MA 02110. |
(4) | The address of this officer is 1340 Environ Way, Chapel Hill, NC 27517. |
| HENNESSY FUNDS | 1-800-966-4354 |
29
Expense Example (Unaudited)
October 31, 2021
As a shareholder of the Fund, you incur ongoing costs, including management fees, service fees, and other Fund expenses. This Example is intended to help you understand your ongoing costs (in dollars) of investing in the Fund and to compare these costs with the ongoing costs of investing in other mutual funds. The Example is based on an investment of $1,000 invested at the beginning of the period and held for the entire period from May 1, 2021, through October 31, 2021.
Actual Expenses
The first line of the table below provides information about actual account values and actual expenses. You may use this information, together with the amount you invested, to estimate the expenses that you paid over the period. Simply divide your account value by $1,000 (for example, an $8,600 account value divided by $1,000 = 8.6), then multiply the result by the number in the first line under the heading “Expenses Paid During Period” to estimate the expenses you paid on your account during this period. Although the Fund charges no sales loads or transaction fees, you will be assessed fees for outgoing wire transfers, returned checks, and stop payment orders at prevailing rates charged by U.S. Bank Global Fund Services, the Fund’s transfer agent. If you request that a redemption be made by wire transfer, the Fund’s transfer agent charges a $15 fee. IRAs are charged a $15 annual maintenance fee (up to $30 maximum per shareholder for shareholders with multiple IRAs). The example below includes, but is not limited to, management, shareholder servicing, accounting, custody, and transfer agent fees. However, the example below does not include portfolio trading commissions and related expenses.
Hypothetical Example for Comparison Purposes
The second line of the table below provides information about hypothetical account values and hypothetical expenses based on the Fund’s actual expense ratio and an assumed rate of return of 5% per year before expenses, which is not the Fund’s actual return. The hypothetical account values and expenses may not be used to estimate the actual ending account balance or expenses you paid for the period. You may use this information to compare the ongoing costs of investing in the Fund and other funds. To do so, compare this 5% hypothetical example with the 5% hypothetical examples that appear in the shareholder reports of the other funds. Please note that the expenses shown in the table are meant to highlight your ongoing costs only. Therefore, the second line is useful in comparing ongoing costs only and will not help you determine the relative total costs of owning different funds.
| Expenses Paid | |||
| Beginning | Ending | During Period(1) | |
| Account Value | Account Value | May 1, 2021 – | |
May 1, 2021 | October 31, 2021 | October 31, 2021 | |
| Investor Class | |||
| Actual | $1,000.00 | $1,002.20 | $6.71 |
| Hypothetical (5% return before expenses) | $1,000.00 | $1,018.50 | $6.77 |
(1) | Expenses are equal to the Fund’s annualized expense ratio of 1.33%, multiplied by the average account value over the period, multiplied by 184/365 days (to reflect the half-year period). |
| WWW.HENNESSYFUNDS.COM |
30
| EXPENSE EXAMPLE — ELECTRONIC DELIVERY |
How to Obtain a Copy of the Fund’s Proxy
Voting Policy and Proxy Voting Records
A description of the policies and procedures the Fund uses to determine how to vote proxies relating to portfolio securities is available without charge (1) by calling 1-800-966-4354, (2) on the Hennessy Funds’ website at www.hennessyfunds.com/proxy-voting/voting-policy, or (3) on the U.S. Securities and Exchange Commission’s (the “SEC”) website at www.sec.gov. The Fund’s proxy voting record is available without charge on both the Hennessy Funds’ website at www.hennessyfunds.com/proxy-voting/voting-record and the SEC’s website at www.sec.gov no later than August 31 for the prior 12 months ending June 30.
Availability of Quarterly Portfolio Schedule
The Fund files a complete schedule of portfolio holdings with the SEC for the first and third quarters of each fiscal year as an exhibit to its reports on Form N-PORT. The Fund’s Form N-PORT reports are available on the SEC’s website at www.sec.gov or on request by calling 1-800-966-4354.
Federal Tax Distribution Information (Unaudited)
For fiscal year 2021, certain dividends paid by the Fund may be subject to a maximum tax rate of 23.8%, as provided for by the Jobs and Growth Tax Relief Reconciliation Act of 2003. The percentage of dividends declared from ordinary income designated as qualified dividend income was 100.00%.
For corporate shareholders, the percent of ordinary income distributions that qualified for the corporate dividends received deduction for fiscal year 2021 was 100.00%.
The percentage of taxable ordinary income distributions that were designated as short-term capital gain distributions under Section 871(k)(2)(C) of the Internal Revenue Code of 1986, as amended, for the Fund was 0.00%.
Important Notice Regarding Delivery
of Shareholder Documents
To help keep the Fund’s costs as low as possible, we generally deliver a single copy of shareholder reports, proxy statements, and prospectuses to shareholders who share an address and have the same last name. This process does not apply to account statements. You may request an individual copy of a shareholder document at any time. If you would like to receive separate mailings of shareholder documents, please call U.S. Bank Global Fund Services at 1-800-261-6950 or 1-414-765-4124, and individual delivery will begin within 30 days of your request. If your account is held through a financial institution or other intermediary, please contact such intermediary directly to request individual delivery.
Electronic Delivery
As permitted by SEC regulations, the Fund’s shareholder reports are made available on a website, and unless you sign up for eDelivery or elect to receive paper copies as detailed below, you will be notified by mail each time a report is posted and provided with a website link to access the report.
The Fund also offers shareholders the option to receive all notices, account statements, prospectuses, tax forms, and shareholder reports online. To sign up for eDelivery or change your delivery preference, please visit www.hennessyfunds.com/account.
To elect to receive paper copies of all future reports free of charge, please call U.S. Bank Global Fund Services at 1-800-261-6950 or 1-414-765-4124.
Subscribe to receive our team’s unique market and sector insights delivered to your inbox
www.hennessyfunds.com/subscribe
Follow us on social media
| | |
| HENNESSY FUNDS | 1-800-966-4354 |
31
Liquidity Risk Management Program
In accordance with Rule 22e-4 under the Investment Company Act of 1940, as amended (the “Liquidity Rule”), we have adopted and implemented a liquidity risk management program (the “Liquidity Program”). The purpose of the Liquidity Program is to assess and manage the Fund’s liquidity risk, which is the risk that the Fund would not be able to meet requests to redeem Fund shares without significant dilution of the remaining shareholders’ interests in the Fund. The Board of Trustees of the Fund (the “Board”) designated a committee comprising representatives of Hennessy Advisors, Inc., the investment adviser to the Fund, as the administrator of the Liquidity Program (the “Program Administrator”).
The Program Administrator provided a written report regarding the Liquidity Program to the Board in advance of its meeting on June 2, 2021. The report covered the period from June 1, 2020, through May 31, 2021. The report addressed the operation of the Liquidity Program, assessed the adequacy and effectiveness of its implementation, and described any material changes to the Liquidity Program during the review period. The Trust’s chief compliance officer presented the report to the Board at the meeting and provided additional information regarding the Liquidity Program. The Board reviewed the Liquidity Program and considered, among other items, the following:
| 1. | The Program Administrator reviewed daily historical net redemption activity during the review period and during prior periods with higher-than-average redemption activity and concluded that the Fund has historically been able to meet requests to redeem Fund shares without significant dilution to the Fund’s remaining shareholders, and the Program Administrator expects the Fund to be able to continue to do so in the future during both normal and reasonably foreseeable stressed conditions. | |
| 2. | The Fund holds assets that are highly liquid investments and is therefore not required to establish a highly liquid investment minimum for the Fund or adopt policies and procedures for responding to a highly liquid investment minimum shortfall. | |
| 3. | The Program Administrator did not make any material changes to the Liquidity Program during the review period and did not recommend any changes to the Liquidity Program. The Program Administrator did make adjustments to the model inputs used to determine the liquidity classification of each security held by the Fund. | |
| 4. | The Program Administrator concluded that the Liquidity Program was reasonably designed to assess and manage the Fund’s liquidity risk, complies with the requirements of the Liquidity Rule, and was operating as intended during the review period. |
Privacy Policy
We collect the following personal information about you:
| 1. | Information we receive from you in applications or other forms, correspondence, or conversations, including, but not limited to, your name, address, phone number, social security number, assets, income, and date of birth; | |
| 2. | Information about your transactions with us, our affiliates, or others, including, but not limited to, your account number and balance, payments history, parties to transactions, cost basis information, and other financial information; and |
| WWW.HENNESSYFUNDS.COM |
32
| LIQUIDITY RISK MANAGEMENT PROGRAM — PRIVACY POLICY |
| 3. | Other personal information we collect from various sources, even if you have not entered into a prior transaction with us, including the following: |
| • | Name, alias, address, unique personal identifier, online identifier, IP address, email address, telephone number, account name, and other similar identifiers; | |
| • | Age and marital status; | |
| • | Commercial information, including records of products purchased; | |
| • | Browsing history, search history, and information on interaction with our website; | |
| • | Geolocation data; | |
| • | Employment and employment history, educational history, financial information, and purchasing and consuming histories or tendencies; and | |
| • | Inferences drawn from the above-listed information to create a profile about your preferences, characteristics, predispositions, and behavior. |
We collect this information directly from you, indirectly in the course of providing services to you, directly and indirectly from your activity on our website, from broker dealers, marketing agencies, and other third parties that interact with us in connection with the services we perform and products we offer, and from anonymized and aggregated consumer information.
We use this information to fulfill the reason you provided the information to us, to provide you with other relevant products that you request from us, to provide you with information about products that may interest you, to improve our website or present our website’s contents to you, and as otherwise described to you when collecting your personal information.
We do not disclose any personal information to unaffiliated third parties, except as permitted by law. We may disclose your personal information to our affiliates, vendors, and service providers for a business purpose. For example, we are permitted by law to disclose all of the information we collect, as described above, to our transfer agent to process your transactions. When disclosing your personal information to third parties, we enter into a contract with each third party describing the purpose of such disclosure and requiring that such personal information be kept confidential and not used for any purpose except to perform the services contracted or respond to regulatory or law enforcement requests.
Furthermore, we restrict access to your personal information to those persons who require such information to provide products or services to you. As a result, we do not provide a means for opting out of our limited sharing of your information. We maintain physical, electronic, and procedural safeguards that comply with federal standards to guard your personal information.
If you hold shares of the Funds through a financial intermediary, including, but not limited to, a broker-dealer, bank, or trust company, the privacy policy of your financial intermediary governs how your personal information is shared with unaffiliated third parties.
Supplemental Privacy Notice for Residents of California
The California Consumer Privacy Act of 2018 (the “CCPA”) provides you, as a California resident, with certain additional rights relating to your personal information.
| HENNESSY FUNDS | 1-800-966-4354 |
33
Under the CCPA, you have the right to request that we disclose to you the categories of personal information we have collected about you over the past 12 months, the categories of sources of such information, our business purpose for collecting the information, the categories of third parties, if any, with whom we shared the information, and the specific information we have collected about you. You also have the right to request that we delete any of your personal information, and, unless an exception applies, we will delete such information upon receiving and confirming your request. To make a request, call us at 1-800-966-4354, email us at privacy@hennessyfunds.com, or go to www.hennessyfunds.com/contact. We will not discriminate against you for exercising your rights under the CCPA. Further, we will not collect additional categories of your personal information or use the personal information we collected for materially different, unrelated, or incompatible purposes without providing you notice.
| WWW.HENNESSYFUNDS.COM |
34
| PRIVACY POLICY |
(This Page Intentionally Left Blank.)
For information, questions, or assistance, please call
The Hennessy Funds
1-800-966-4354 or 1-415-899-1555
INVESTMENT ADVISOR
Hennessy Advisors, Inc.
7250 Redwood Boulevard, Suite 200
Novato, California 94945
ADMINISTRATOR,
TRANSFER AGENT,
DIVIDEND PAYING AGENT, &
SHAREHOLDER SERVICING AGENT
U.S. Bancorp Fund Services, LLC
d/b/a U.S. Bank Global Fund Services
P.O. Box 701
Milwaukee, Wisconsin 53201-0701
CUSTODIAN
U.S. Bank N.A.
Custody Operations
1555 North River Center Drive, Suite 302
Milwaukee, Wisconsin 53212
TRUSTEES
Neil J. Hennessy
Robert T. Doyle
J. Dennis DeSousa
Claire Garvie
Gerald P. Richardson
COUNSEL
Foley & Lardner LLP
777 East Wisconsin Avenue
Milwaukee, Wisconsin 53202-5306
INDEPENDENT REGISTERED
PUBLIC ACCOUNTING FIRM
Tait, Weller & Baker LLP
Two Liberty Place
50 South 16th Street, Suite 2900
Philadelphia, Pennsylvania 19102-2529
DISTRIBUTOR
Quasar Distributors, LLC
111 East Kilbourn Avenue, Suite 2200
Milwaukee, Wisconsin 53202
www.hennessyfunds.com | 1-800-966-4354
This report has been prepared for shareholders and may be distributed to
others only if preceded or accompanied by a current prospectus.
ANNUAL REPORT
OCTOBER 31, 2021

HENNESSY EQUITY AND INCOME FUND
Investor Class HEIFX
Institutional Class HEIIX
www.hennessyfunds.com | 1-800-966-4354
(This Page Intentionally Left Blank.)
Contents
| Letter to Shareholders | 2 |
| Performance Overview | 4 |
| Financial Statements | |
| Schedule of Investments | 8 |
| Statement of Assets and Liabilities | 18 |
| Statement of Operations | 19 |
| Statements of Changes in Net Assets | 21 |
| Financial Highlights | 22 |
| Notes to the Financial Statements | 26 |
| Report of Independent Registered Public Accounting Firm | 34 |
| Trustees and Officers of the Fund | 35 |
| Expense Example | 38 |
| Proxy Voting Policy and Proxy Voting Records | 40 |
| Availability of Quarterly Portfolio Schedule | 40 |
| Federal Tax Distribution Information | 40 |
| Important Notice Regarding Delivery of Shareholder Documents | 40 |
| Electronic Delivery | 40 |
| Liquidity Risk Management Program | 41 |
| Privacy Policy | 41 |
| HENNESSY FUNDS | 1-800-966-4354 |
December 2021
Dear Hennessy Funds Shareholder:
What a year this has been. While it doesn’t feel that we are out of the “pandemic” phase of the coronavirus crisis, we look forward to a day when we will eventually see fewer cases and potentially less severe variants. We feel extremely grateful to the many healthcare workers who have continued to work tirelessly during the recent surge. As we move through the next year, we hope that new U.S. cases will decline and that many other parts of the world will see improvements as well.
What a year this has been! As measured by the total return of the S&P 500® Index, as of October 31, 2021, the market was up 24.04% calendar year to date. This comes in the wake of a tumultuous 2020 in which the market plunged in the beginning of the pandemic and recovered dramatically to end the year up 18.40%. Interestingly, 18% appears to be a repeating number in the past dozen years. From the low point of the Financial Crisis (March 9, 2009) to the high point reached just prior to the COVID-19 pandemic (February 12, 2020), the S&P 500® Index was up 18.27% per year. We are well aware that past results are not predictive of the future, and we find ourselves naturally skeptical of such strong returns. But, as shown in the chart below, we find that the most common annual total returns of the market over the past 102 years range between 20% and 30% with the second most common being between 10% and 20%:
Source: Bloomberg L.P.
We will say it again, after showing a chart like the one above: Past results are not predictive of the future. Instead, we look at where we are right now – in the economy, in the market, in the business cycle – to reflect on where we have come from and where we may be going. U.S. GDP is strong and growing, interest rates remain low, and earnings growth and profitability remain robust. We believe stocks are trading at reasonable valuations when viewed as a whole, with the S&P 500® Index at 21.0x estimated earnings for 2022. Furthermore, we believe corporate balance sheets are healthy, with high levels of excess cash, which could support growth, increases in dividends, more share buybacks, and future acquisitions. Uncertainty and volatility can manifest at any time in the stock market, and the current market is no different. Investors have questions about inflation, worldwide supply chain issues, and what could drive the next boost in earnings. While these concerns are warranted, we continue to believe that overall the positives outweigh the negatives, and here at Hennessy we continue to see opportunity in the market and in our Funds.
| WWW.HENNESSYFUNDS.COM |
2
| LETTER TO SHAREHOLDERS |
What a (fiscal) year this has been!!! For our fiscal year ended October 31, 2021, the S&P 500® Index rose 42.91% on a total return basis, setting a new all-time high on the final day of the period. Except for a short 21-trading-day period that began on September 2 during which the market fell 5.13% only to rebound to new highs just 13 trading days later, the market has been on a continuous march higher. We saw a dramatic shift in market leadership as many of the sectors that underperformed during our last fiscal year soared in fiscal year 2021. Small-caps beat mid-caps, which in turn beat large-caps. The Energy and Financials sectors skyrocketed during the 12-month period, as reflected by the S&P 500® Energy Sector’s total return of 111.29% and the Russell 1000® Index Financials’ total return of 70.87%. Both of these sectors were among the worst performing in our fiscal year 2020, so a bounce back in our fiscal year 2021, while not a foregone conclusion, was a distinct possibility.
Overall, we are pleased with the performance of our mutual funds during the fiscal year. On an absolute basis, each of our 16 Funds achieved total returns greater than 10% and seven outperformed their primary benchmark. Ten of our 11 domestic equity-only Funds outperformed the S&P 500® Index and posted total returns of 45% or higher. Our four best-performing funds were concentrated in the Energy and Financials sectors. While some of our Funds certainly benefited from being in the “right” sector at the “right” time, we also believe this was a favorable period for our investment style of high-conviction investing and concentrated portfolio construction.
What will the coming year bring? As mentioned in our last shareholder letter (June 2021), we understand that even the greatest bull markets experience corrections along the way, and the last time the S&P 500® Index dropped over 10% was in February/March of 2020. Whether or not a correction occurs sooner or later, we believe the market as a whole has more room to run. We see many factors that could drive the market higher from here: strong GDP growth and increasing corporate earnings, a potentially lower-for-longer interest rate environment, accommodative fiscal and monetary policies, a healthy and robust financial system, low unemployment and solid wage growth, and strong corporate balance sheets with plenty of cash.
Thank you for your interest and for investing with us. We remain committed to managing our portfolios for long-term performance, ever mindful of downside risk. With so many investment options available to you, we are grateful for the trust you put in us and for your continued interest in our family of Funds. If you have any questions or would like to speak with us, please don’t hesitate to call us directly at (800) 966-4354.
Best regards,
| |
| |
| Ryan C. Kelley | |
| Chief Investment Officer |
Past performance does not guarantee future results. To obtain current standardized performance for the Hennessy Funds, visit https://www.hennessyfunds.com/funds/price-performance.
Mutual fund investing involves risk. Principal loss is possible.
Opinions expressed are those of Ryan C. Kelley and are subject to change, are not guaranteed, and should not be considered investment advice.
The Dow Jones Industrial Average and S&P 500® Index are commonly used to measure the performance of U.S. stocks. The S&P 500® Energy Index comprises those companies included in the S&P 500® Index that are classified in the Energy sector. The Russell 1000® Index Financials is a subset of the Russel 1000® Index that measures the performance of securities classified in the Financials sector of the large-capitalization U.S. equity market. The indices are used herein for comparative purposes in accordance with SEC regulations. One cannot invest directly in an index. All returns are shown on a total return basis.
| HENNESSY FUNDS | 1-800-966-4354 |
3
Performance Overview (Unaudited)
CHANGE IN VALUE OF $10,000 INVESTMENT
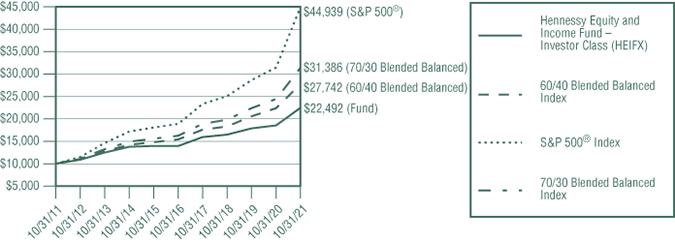
This graph illustrates the performance of an initial investment of $10,000 made in the Fund 10 years ago and assumes the reinvestment of dividends and capital gains.
AVERAGE ANNUAL TOTAL RETURN FOR PERIODS ENDED OCTOBER 31, 2021
| One | Five | Ten | ||
Year | Years | Years | ||
| Hennessy Equity and Income Fund – | ||||
| Investor Class (HEIFX) | 21.24% | 9.99% | 8.44% | |
| Hennessy Equity and Income Fund – | ||||
| Institutional Class (HEIIX) | 21.68% | 10.41% | 8.81% | |
| 70/30 Blended Balanced Index | 28.46% | 14.07% | 12.12% | |
| 60/40 Blended Balanced Index | 23.91% | 12.44% | 10.74% | |
S&P 500® Index | 42.91% | 18.93% | 16.21% |
Expense ratios: 1.56% (Investor Class); 1.19% (Institutional Class)
Performance data quoted represents past performance; past performance does not guarantee future results. The investment return and principal value of an investment will fluctuate so that an investor’s shares, when redeemed, may be worth more or less than their original cost. The performance table does not reflect the deduction of taxes that a shareholder would pay on Fund distributions or the redemption of Fund shares. Current performance of the Fund may be lower or higher than the performance quoted. Performance data current to the most recent month end may be obtained by visiting www.hennessyfunds.com. Performance for periods including or prior to October 26, 2012, is that of the FBR Balanced Fund.
The 70/30 Blended Balanced Index and the 60/40 Blended Balanced Index comprise a mix of common stocks and bonds, with (i) 70% or 60%, respectively, common stocks represented by the S&P 500® Index and (ii) 30% or 40%, respectively, bonds represented by the Bloomberg Intermediate U.S. Government/Credit Index. The Bloomberg Intermediate U.S. Government/Credit Index measures the performance of U.S. dollar-denominated Treasury securities and government-related and investment-grade corporate securities that have $250 million or more of outstanding face value, are fixed rate and non-convertible, and have remaining maturities of greater than or equal to one year and less than 10 years. The S&P 500® Index is a capitalization-weighted index that is designed to represent the broad domestic economy through changes in the aggregate market value of 500 stocks across all major industries. One cannot invest directly in an index. These indices are used for comparative purposes in accordance with Securities and Exchange Commission regulations.
| WWW.HENNESSYFUNDS.COM |
4
| PERFORMANCE OVERVIEW |
Standard & Poor’s Financial Services is the source and owner of the S&P® and S&P 500® trademarks.
The expense ratios presented are from the most recent prospectus. The expense ratios for the current reporting period are available in the Financial Highlights section of this report.
PERFORMANCE NARRATIVE
Portfolio Managers for Equity Allocation: Stephen M. Goddard, CFA, Jonathan T. Moody, CFA, J. Brian Campbell, CFA, Mark E. DeVaul, CFA, CPA, and Samuel D. Hutchings, CFA
The London Company of Virginia, LLC (sub-advisor)
Portfolio Managers for Fixed Income Allocation: Gary B. Cloud, CFA, and Peter G. Greig, CFA
FCI Advisors (sub-advisor)
Performance:
For the one-year period ended October 31, 2021, the Investor Class of the Hennessy Equity and Income Fund returned 21.24%, underperforming the 70/30 Blended Balanced Index (the Fund’s primary benchmark), the 60/40 Blended Balanced Index, and the S&P 500® Index, which returned 28.46%, 23.91%, and 42.91%, respectively, for the same period.
Equities: U.S. stocks posted strong gains over the one year period ended October 31, 2021. The market rallied in late 2020 as the COVID-19 vaccines arrived earlier than expected. This led to a reopening of the economy and higher expectations for near-term economic growth. The Federal Reserve maintained its accommodative policies over the year, and the federal government continued to provide fiscal stimulus. Economic data was generally positive, including solid spending on housing and an improving labor market. Oil prices spiked to over $80 per barrel, and core inflation was higher than levels experienced in recent years. Stocks moved higher each month until finally taking a breather in September, reflecting concerns about potential changes in monetary policy as well as fears of higher taxes on individuals and corporations. The downdraft was short lived, though, as U.S. equities posted strong gains in October.
Looking to factors that impacted stocks over the one year period, there was little difference in the returns of growth and value stocks in the large-cap space, but value stocks outperformed growth in the small cap arena. Higher beta stocks outperformed the broader market, and quality factors had little impact on relative returns. These factors were headwinds to the relative performance of the equity portion of the Fund, reflecting its more defensive positioning and focus on downside protection.
Both stock selection and sector allocation were headwinds to the Fund’s relative performance. The weakest names over the one-year period included FedEx Corporation, Citrix Systems, Inc., NewMarket Corporation, Verizon Communications, Inc., and Air Products and Chemicals, Inc. The best performing stocks included Charles Schwab Corporation, Alphabet, Inc. (Class C), Meta Platforms, Inc. (Class A) (formerly Facebook, Inc.), Old Dominion Freight Line, Inc., and CarMax, Inc. The Fund no longer owns Citrix Systems, Inc., but continues to hold the other companies mentioned.
Sector allocation had a slightly negative impact on the Fund’s relative performance. The Fund’s underweight position in Energy and overweight position in Consumer Staples had a negative impact on relative performance, partially offset by the positive impact of the Fund’s overweight position in Financials and underweight position in Utilities.
| HENNESSY FUNDS | 1-800-966-4354 |
5
Fixed Income: The largest source of outperformance in the fixed income allocation for the one-year period came from the “core plus” securities, which comprise mainly preferred stocks and higher yielding credit-sensitive instruments. Overall, the year was a credit-friendly period that saw corporate credit spreads continue tightening in the wake of the post COVID 19 lockdowns that took place earlier in 2020. This spread tightening led to the returns of the individual investment grade corporate bonds and high yield exposure within the Fund outpacing the fixed income benchmark (the Bloomberg Intermediate U.S. Government/Credit Index). U.S. Treasuries had the largest absolute losses in performance, largely due to a “bear steepener,” meaning the widening of the yield curve caused by long-term interest rates increasing at a faster rate than short-term rates, which provided a substantial increase in rates, particularly throughout the intermediate maturity bonds in the belly of the curve. However, an underweighted allocation in U.S. Treasuries compared to the benchmark led to a less negative return for the Fund. Overall, portfolio duration, convexity, and nonparallel yield curve factors detracted moderately from performance, while sector allocation accounted for the majority of the outperformance.
Portfolio Strategy:
The Fund seeks a balanced portfolio with the goal of maintaining broad market exposure with lower volatility. Our bottom-up equity selection strategy seeks companies with strong returns on capital and the flexibility to enhance shareholder value by using their balance sheets. The Fund’s fixed income allocation focuses on high-quality domestic corporate, agency, and government bonds.
Investment Commentary:
Equities: Looking ahead, we maintain a positive view on the U.S. economy but expect GDP to decelerate to roughly 2 to 3% real growth. The Delta variant of COVID-19 remains a potential risk, but we do not expect large scale shutdowns like those we experienced in 2020. We believe consumer spending will continue to be the primary driver of GDP as the labor market improves along with moderate wage inflation, and excess savings built up during the pandemic should aid consumer spending in the near term. Furthermore, the manufacturing and services segments of the economy are firmly in expansionary territory. Fiscal stimulus will likely start to wane, and we expect that the Federal Reserve should begin to reverse some of its more accommodative monetary policies later this year and into 2022. Longer term, we remain optimistic about the prospects for the U.S. economy.
In terms of the equity market, we recognize that valuations are on the rich side while interest rates will likely remain low compared to historical rates. At current valuations, along with various short term risks to the economic outlook (such as rising inflation and potential tax increases), we expect greater volatility in share prices and possibly more muted returns in the near term. Longer term, we continue to believe that quality attributes and solid company fundamentals will lead to strong risk-adjusted returns. Compared to the broader market, we believe that the companies held in the Fund generate much higher returns on capital, have stronger balance sheets, and trade at reasonable valuations.
Fixed Income: It has been another rollercoaster year in the fixed income markets with the “economic reopening” trade being sidelined multiple times due to the Delta variant and fears of further lockdowns. Moreover, general price level increases in the economy have proven to be more persistent than transitory, with important items such as housing, food, energy, and transportation showing few signs of imminent retreat. All of this has led to
| WWW.HENNESSYFUNDS.COM |
6
| PERFORMANCE OVERVIEW |
some weakening in bond prices over the prior year, but not nearly as much as many investors may have surmised.
The Federal Reserve recently announced its anticipated reduction in monthly bond purchases, but the timing coincided with the U.S. Treasury’s forecast for lower monthly debt auction sizing, resulting in limited market impact from these two new developments. Additionally, we note that the Biden administration has nominated for reappointment Federal Reserve Chairman Jerome Powell. There will be three other open positions at the Federal Reserve by early 2022, which means that the Biden administration will have a significant opportunity to reshape the contour of policymakers to its liking.
Putting all of these developments into a market context leads us to anticipate a balanced outlook for fixed income securities. We believe it is difficult to be either overly pessimistic or overly optimistic on the outlook for Treasury yields over the next six months. A very dovish Federal Reserve will be in no hurry to hike rates aggressively, even with inflation well above the Federal Reserve’s comfort zone. However, as market participants peer into the second half of 2022, we believe economic statistics on the rate of GDP growth, strength of the labor market, and inflation will loom large. There are plenty of reasons to assume many of the bottlenecks associated with sourcing goods and services globally will improve over the intermediate term. The credit markets seem to agree with this assessment, as investment grade and riskier credit securities continue to enjoy robust sponsorship. Given all of these factors, we feel confident in our long standing investment strategy of owning high quality fixed income securities through various business cycles.
_______________
Opinions expressed are those of the Portfolio Managers as of the date written and are subject to change, are not guaranteed, and should not be considered investment advice or an indication of trading intent.
Investments in debt securities typically decrease in value when interest rates rise. The risk is greater for longer-term debt securities. Investments by the Fund in lower-rated and non-rated securities presents a greater risk of loss to principal and interest than higher-rated securities. Investments in asset-backed and mortgage-backed securities include additional risks that investors should be aware of including credit risk, prepayment risk, possible illiquidity, and default, as well as increased susceptibility to adverse economic developments. Investments in foreign securities may involve political, economic, and currency risks, greater volatility, and differences in accounting methods. The Fund may experience higher fees due to investments in pooled investment vehicles (including exchange-traded funds). Please see the Fund’s prospectus for a more complete discussion of these and other risks.
References to specific securities should not be considered a recommendation to buy or sell any security. Fund holdings and sector allocations are subject to change. Please refer to the Schedule of Investments included in this report for additional portfolio information.
Duration is a measure of the sensitivity of the price (the value of the principal) of a fixed-income investment to a change in interest rates and is expressed as a number of years. Yield curve is a line that plots the interest rates, at a set point in time, of bonds having equal credit quality, but differing maturity dates. Investment grade is a rating that indicates that a municipal or corporate bond has a relatively low risk of default. Return on capital is a ratio measuring the profitability of a firm expressed as a percentage of funds acquired from investors and lenders.
| HENNESSY FUNDS | 1-800-966-4354 |
7
Financial Statements
Schedule of Investments as of October 31, 2021 |
HENNESSY EQUITY AND INCOME FUND
(% of Net Assets)

| TOP TEN HOLDINGS (EXCLUDING MONEY MARKET FUNDS) | % NET ASSETS |
| Alphabet, Inc., Class C | 4.70% |
| Berkshire Hathaway, Inc., Class B | 4.68% |
| Apple, Inc. | 4.10% |
| The Charles Schwab Corp. | 3.15% |
| The Home Depot, Inc. | 2.90% |
| Norfolk Southern Corp. | 2.72% |
| Martin Marietta Materials, Inc. | 2.67% |
| Texas Instruments, Inc. | 2.64% |
| Altria Group, Inc. | 2.60% |
| O'Reilly Automotive, Inc. | 2.59% |
Note: For presentation purposes, the Fund has grouped some of the industry categories. For purposes of categorizing securities for compliance with Section 8(b)(1) of the Investment Company Act of 1940, as amended, the Fund uses more specific industry classifications.
The Global Industry Classification Standard (GICS®) was developed by and is the exclusive property and a service mark of MSCI, Inc. and Standard & Poor’s Financial Services LLC. It has been licensed for use by the Hennessy Funds.
| WWW.HENNESSYFUNDS.COM |
8
| SCHEDULE OF INVESTMENTS |
| COMMON STOCKS – 66.78% | Number | % of | ||||||||||
| of Shares | Value | Net Assets | ||||||||||
| Communication Services – 8.43% | ||||||||||||
| Alphabet, Inc., Class C (a) | 1,902 | $ | 5,640,210 | 4.70 | % | |||||||
| Meta Platforms, Inc. (a) | 8,034 | 2,599,561 | 2.17 | % | ||||||||
| Verizon Communications, Inc. | 35,453 | 1,878,655 | 1.56 | % | ||||||||
| 10,118,426 | 8.43 | % | ||||||||||
| Consumer Discretionary – 9.31% | ||||||||||||
| CarMax, Inc. (a) | 19,696 | 2,696,776 | 2.25 | % | ||||||||
| Lowe’s Companies, Inc. | 8,034 | 1,878,510 | 1.57 | % | ||||||||
| O’Reilly Automotive, Inc. (a) | 4,999 | 3,110,978 | 2.59 | % | ||||||||
| The Home Depot, Inc. | 9,376 | 3,485,434 | 2.90 | % | ||||||||
| 11,171,698 | 9.31 | % | ||||||||||
| Consumer Staples – 6.81% | ||||||||||||
| Altria Group, Inc. | 70,812 | 3,123,517 | 2.60 | % | ||||||||
| Church & Dwight Co., Inc. | 26,154 | 2,284,813 | 1.90 | % | ||||||||
| Nestlé S.A. – ADR (b) | 21,019 | 2,770,725 | 2.31 | % | ||||||||
| 8,179,055 | 6.81 | % | ||||||||||
| Energy – 0.29% | ||||||||||||
| Enbridge, Inc. (b) | 1,575 | 65,930 | 0.06 | % | ||||||||
| Kinder Morgan, Inc. | 3,300 | 55,275 | 0.05 | % | ||||||||
| Targa Resources Corp. | 2,500 | 136,675 | 0.11 | % | ||||||||
| The Williams Companies, Inc. | 3,100 | 87,079 | 0.07 | % | ||||||||
| 344,959 | 0.29 | % | ||||||||||
| Financials – 11.72% | ||||||||||||
| Berkshire Hathaway, Inc., Class B (a) | 19,568 | 5,616,212 | 4.68 | % | ||||||||
| BlackRock, Inc. | 2,802 | 2,643,575 | 2.20 | % | ||||||||
| The Charles Schwab Corp. | 46,110 | 3,782,403 | 3.15 | % | ||||||||
| The Progressive Corp. | 21,295 | 2,020,470 | 1.69 | % | ||||||||
| 14,062,660 | 11.72 | % | ||||||||||
| Health Care – 3.21% | ||||||||||||
| Johnson & Johnson | 12,982 | 2,114,508 | 1.76 | % | ||||||||
| Pfizer, Inc. | 39,881 | 1,744,395 | 1.45 | % | ||||||||
| 3,858,903 | 3.21 | % | ||||||||||
| Industrials – 6.77% | ||||||||||||
| FedEx Corp. | 11,135 | 2,622,626 | 2.18 | % | ||||||||
| Norfolk Southern Corp. | 11,131 | 3,261,940 | 2.72 | % | ||||||||
| Old Dominion Freight Line, Inc. | 6,578 | 2,245,400 | 1.87 | % | ||||||||
| 8,129,966 | 6.77 | % | ||||||||||
The accompanying notes are an integral part of these financial statements.
| HENNESSY FUNDS | 1-800-966-4354 |
9
| COMMON STOCKS | Number | % of | ||||||||||
| of Shares | Value | Net Assets | ||||||||||
| Information Technology – 13.94% | ||||||||||||
| Apple, Inc. | 32,884 | $ | 4,926,023 | 4.10 | % | |||||||
| Cisco Systems, Inc. | 36,807 | 2,060,088 | 1.72 | % | ||||||||
| Citrix Systems, Inc. | 14,724 | 1,394,804 | 1.16 | % | ||||||||
| Fiserv, Inc. (a) | 22,777 | 2,243,307 | 1.87 | % | ||||||||
| Texas Instruments, Inc. | 16,894 | 3,167,287 | 2.64 | % | ||||||||
| Visa, Inc., Class A | 13,913 | 2,946,356 | 2.45 | % | ||||||||
| 16,737,865 | 13.94 | % | ||||||||||
| Materials – 6.30% | ||||||||||||
| Air Products and Chemicals, Inc. | 8,115 | 2,432,958 | 2.03 | % | ||||||||
| Martin Marietta Materials, Inc. | 8,154 | 3,203,217 | 2.67 | % | ||||||||
| NewMarket Corp. | 5,658 | 1,923,777 | 1.60 | % | ||||||||
| 7,559,952 | 6.30 | % | ||||||||||
| Total Common Stocks | ||||||||||||
| (Cost $47,214,838) | 80,163,484 | 66.78 | % | |||||||||
| PREFERRED STOCKS – 1.86% | ||||||||||||
| Communication Services – 0.04% | ||||||||||||
| AT&T, Inc., Series C, 4.750%, Perpetual | 1,935 | 50,387 | 0.04 | % | ||||||||
| Consumer Discretionary – 0.01% | ||||||||||||
| Ford Motor Co., 6.000%, 12/01/2059 | 625 | 17,050 | 0.01 | % | ||||||||
| Consumer Staples – 0.08% | ||||||||||||
| CHS, Inc., Series 3, 6.750% to 09/30/2024 then | ||||||||||||
| 3 Month LIBOR USD + 4.155%, Perpetual (c) | 415 | 11,670 | 0.01 | % | ||||||||
| CHS, Inc., Series 4, 7.500%, Perpetual | 2,985 | 86,535 | 0.07 | % | ||||||||
| 98,205 | 0.08 | % | ||||||||||
| Energy – 0.04% | ||||||||||||
| Enbridge, Inc., Series B, 6.375% to 04/15/2023 then | ||||||||||||
| 3 Month LIBOR USD + 3.593%, 04/15/2078 (b)(c) | 1,930 | 51,840 | 0.04 | % | ||||||||
| Financials – 1.69% | ||||||||||||
| AEGON Funding Co. LLC, 5.100%, 12/15/2049 | 880 | 23,707 | 0.02 | % | ||||||||
| American International Group, Inc., Series A, 5.850%, Perpetual | 1,720 | 46,853 | 0.04 | % | ||||||||
| Arch Capital Group Ltd. | ||||||||||||
| Series G, 4.550%, Perpetual (b) | 1,055 | 27,377 | 0.02 | % | ||||||||
| Series F, 5.450%, Perpetual (b) | 446 | 11,610 | 0.01 | % | ||||||||
| Axis Capital Holdings Ltd., Series E, 5.500%, Perpetual (b) | 1,060 | 26,733 | 0.02 | % | ||||||||
The accompanying notes are an integral part of these financial statements.
| WWW.HENNESSYFUNDS.COM |
10
| SCHEDULE OF INVESTMENTS |
| PREFERRED STOCKS | Number | % of | ||||||||||
| of Shares | Value | Net Assets | ||||||||||
| Financials (Continued) | ||||||||||||
| Bank of America Corp. | ||||||||||||
| Series QQ, 4.250%, Perpetual | 690 | $ | 17,284 | 0.02 | % | |||||||
| Series KK, 5.375%, Perpetual | 975 | 26,452 | 0.02 | % | ||||||||
| Series GG, 6.000%, Perpetual | 1,460 | 38,865 | 0.03 | % | ||||||||
| Cadence Bank, Series A, 5.500%, Perpetual | 655 | 17,194 | 0.02 | % | ||||||||
| Capital One Financial Corp. | ||||||||||||
| Series J, 4.800%, Perpetual | 2,110 | 55,261 | 0.05 | % | ||||||||
| Series I, 5.000%, Perpetual | 1,985 | 52,860 | 0.04 | % | ||||||||
| Citigroup, Inc. | ||||||||||||
| Series K, 6.875% to 11/15/2023 then | ||||||||||||
| 3 Month LIBOR USD + 4.130%, Perpetual (c) | 930 | 26,375 | 0.02 | % | ||||||||
| Series J, 7.125% to 09/30/2023 then | ||||||||||||
| 3 Month LIBOR USD + 4.040%, Perpetual (c) | 1,425 | 40,028 | 0.04 | % | ||||||||
| Citizens Financial Group, Inc., Series D, 6.350% to 04/06/2024 then | ||||||||||||
| 3 Month LIBOR USD + 3.642%, Perpetual (c) | 1,220 | 34,111 | 0.03 | % | ||||||||
| ConnectOne Bancorp, Inc., Series A, 5.250% to 09/01/2026 then | ||||||||||||
| 5 Year CMT Rate + 4.420%, Perpetual (c) | 790 | 21,030 | 0.02 | % | ||||||||
| Cullen/Frost Bankers, Inc., Series B, 4.450%, Perpetual | 860 | 22,833 | 0.02 | % | ||||||||
| Equitable Holdings, Inc., Series A, 5.250%, Perpetual | 1,380 | 36,680 | 0.03 | % | ||||||||
| Federal Agricultural Mortgage Corp., Series F, 5.250%, Perpetual | 800 | 21,272 | 0.02 | % | ||||||||
| Fifth Third Bancorp. | ||||||||||||
| Series K, 4.950%, Perpetual | 2,205 | 58,521 | 0.05 | % | ||||||||
| Series I, 6.625% to 12/31/2023 then | ||||||||||||
| 3 Month LIBOR USD + 3.710%, Perpetual (c) | 1,165 | 33,494 | 0.03 | % | ||||||||
| First Citizens BancShares, Inc., Series A, 5.375%, Perpetual | 2,155 | 59,262 | 0.05 | % | ||||||||
| First Horizon Corp. | ||||||||||||
| Series D, 6.100% to 05/01/2024 then | ||||||||||||
| 3 Month LIBOR USD + 3.859%, Perpetual (c) | 650 | 17,264 | 0.01 | % | ||||||||
| Series B, 6.625% to 08/01/2025 then | ||||||||||||
| 3 Month LIBOR USD + 4.262%, Perpetual (c) | 830 | 23,197 | 0.02 | % | ||||||||
| First Republic Bank, Series J, 4.700%, Perpetual | 1,355 | 36,328 | 0.03 | % | ||||||||
| Hartford Financial Services Group, Inc., Series G, 6.000%, Perpetual | 1,905 | 52,826 | 0.04 | % | ||||||||
| Huntington Bancshares, Inc, | ||||||||||||
| Series H, 4.500%, Perpetual | 1,915 | 48,737 | 0.04 | % | ||||||||
| Series C, 5.700%, Perpetual | 865 | 22,619 | 0.02 | % | ||||||||
| JPMorgan Chase & Co. | ||||||||||||
| Series JJ, 4.550%, Perpetual | 2,050 | 53,526 | 0.05 | % | ||||||||
| Series LL, 4.625%, Perpetual | 1,950 | 50,973 | 0.04 | % | ||||||||
| KeyCorp | ||||||||||||
| Series F, 5.650%, Perpetual | 895 | 24,326 | 0.02 | % | ||||||||
| Series E, 6.125% to 12/15/2026 then | ||||||||||||
| 3 Month LIBOR USD + 3.892%, Perpetual (c) | 1,680 | 51,492 | 0.04 | % | ||||||||
The accompanying notes are an integral part of these financial statements.
| HENNESSY FUNDS | 1-800-966-4354 |
11
| PREFERRED STOCKS | Number | % of | ||||||||||
| of Shares | Value | Net Assets | ||||||||||
| Financials (Continued) | ||||||||||||
| MetLife, Inc., Series F, 4.750%, Perpetual | 1,895 | $ | 50,862 | 0.04 | % | |||||||
| Morgan Stanley | ||||||||||||
| Series K, 5.850% to 04/15/2027 then | ||||||||||||
| 3 Month LIBOR USD + 3.491%, Perpetual (c) | 820 | 24,157 | 0.02 | % | ||||||||
| Series I, 6.375% to 10/15/2024 then | ||||||||||||
| 3 Month LIBOR USD + 3.708%, Perpetual (c) | 3,090 | 88,436 | 0.07 | % | ||||||||
| Regions Financial Corp. | ||||||||||||
| Series E, 4.450%, Perpetual | 2,100 | 53,550 | 0.04 | % | ||||||||
| Series C, 5.700% to 05/15/2029 then | ||||||||||||
| 3 Month LIBOR USD + 3.148%, Perpetual (c) | 1,210 | 34,896 | 0.03 | % | ||||||||
| State Street Corp., Series D, 5.900% to 03/15/2024 then | ||||||||||||
| 3 Month LIBOR USD + 3.108%, Perpetual (c) | 2,335 | 66,524 | 0.06 | % | ||||||||
| SVB Financial Group, Series A, 5.250%, Perpetual | 1,250 | 32,988 | 0.03 | % | ||||||||
| Synchrony Financial, Series A, 5.625%, Perpetual | 1,945 | 51,873 | 0.04 | % | ||||||||
| Synovus Financial Corp. | ||||||||||||
| Series E, 5.875% to 07/01/2024 then | ||||||||||||
| 5 Year CMT Rate + 4.127%, Perpetual (c) | 845 | 22,714 | 0.02 | % | ||||||||
| Series D, 6.300% to 06/21/2023 then | ||||||||||||
| 3 Month LIBOR USD + 3.352%, Perpetual (c) | 850 | 22,270 | 0.02 | % | ||||||||
| Texas Capital Bancshares, Inc., Series B, 5.750%, Perpetual | 730 | 19,389 | 0.02 | % | ||||||||
| The Allstate Corp. | ||||||||||||
| Series H, 5.100%, Perpetual | 1,330 | 36,043 | 0.03 | % | ||||||||
| Series G, 5.625%, Perpetual | 2,115 | 57,634 | 0.05 | % | ||||||||
| The Goldman Sachs Group, Inc. | ||||||||||||
| Series K, 6.375% to 05/10/2024 then | ||||||||||||
| 3 Month LIBOR USD + 3.550%, Perpetual (c) | 1,070 | 30,345 | 0.03 | % | ||||||||
| Series J, 5.500% to 05/10/2023 then | ||||||||||||
| 3 Month LIBOR USD + 3.640%, Perpetual (c) | 1,165 | 31,315 | 0.03 | % | ||||||||
| Truist Financial Corp. | ||||||||||||
| Series R, 4.750%, Perpetual | 1,835 | 48,903 | 0.04 | % | ||||||||
| Series O, 5.250%, Perpetual | 1,880 | 52,790 | 0.04 | % | ||||||||
| US Bancorp, Series B, 3.500% to 11/29/2021 then | ||||||||||||
| 3 Month LIBOR USD + 0.600%, Perpetual (c) | 2,095 | 51,747 | 0.04 | % | ||||||||
| Washington Federal, Inc., Series A, 4.875%, Perpetual | 1,860 | 48,992 | 0.04 | % | ||||||||
| Wells Fargo & Co. | ||||||||||||
| Series Z, 4.750%, Perpetual | 1,930 | 49,987 | 0.04 | % | ||||||||
| Series R, 6.625% to 03/15/2024 then | ||||||||||||
| 3 Month LIBOR USD + 3.690%, Perpetual (c) | 1,840 | 51,796 | 0.04 | % | ||||||||
| Western Alliance Bancorp, Series A, 4.250% to 09/30/2026 then | ||||||||||||
| 5 Year CMT Rate + 3.452%, Perpetual (c) | 345 | 9,060 | 0.01 | % | ||||||||
| 2,015,361 | 1.69 | % | ||||||||||
| Total Preferred Stocks | ||||||||||||
| (Cost $2,073,789) | 2,232,843 | 1.86 | % | |||||||||
The accompanying notes are an integral part of these financial statements.
| WWW.HENNESSYFUNDS.COM |
12
| SCHEDULE OF INVESTMENTS |
| REITS – 2.75% | Number of Shares/ | % of | ||||||||||
| Par Amount | Value | Net Assets | ||||||||||
| Financials – 2.75% | ||||||||||||
| Annaly Capital Management, Inc., Series I, 6.750% to 06/30/2024 | ||||||||||||
| then 3 Month LIBOR USD + 4.989%, Perpetual (c) | 1,360 | $ | 35,755 | 0.03 | % | |||||||
| Apollo Commercial Real Estate Finance, Inc. | 4,130 | 62,528 | 0.05 | % | ||||||||
| Chimera Investment Corp. | 2,930 | 45,737 | 0.04 | % | ||||||||
| Chimera Investment Corp. | ||||||||||||
| Series C, 7.750% to 09/30/2025 then | ||||||||||||
| 3 Month LIBOR USD + 4.743%, Perpetual (c) | 1,540 | 39,532 | 0.03 | % | ||||||||
| Series B, 8.000% to 03/30/2024 then | ||||||||||||
| 3 Month LIBOR USD + 5.791%, Perpetual (c) | 695 | 17,924 | 0.01 | % | ||||||||
| Kimco Realty Corp., Series M, 5.250%, Perpetual | 1,150 | 30,694 | 0.03 | % | ||||||||
| Monmouth Real Estate Investment Corp., Series C, 6.125%, Perpetual | 1,745 | 44,515 | 0.04 | % | ||||||||
| Starwood Property Trust, Inc. | 2,730 | 69,533 | 0.06 | % | ||||||||
| STORE Capital Corp. | 85,968 | 2,951,281 | 2.46 | % | ||||||||
| Total REITS | ||||||||||||
| (Cost $2,460,571) | 3,297,499 | 2.75 | % | |||||||||
| CORPORATE BONDS – 14.46% | ||||||||||||
| Communication Services – 0.91% | ||||||||||||
| AT&T, Inc., 4.250%, 03/01/2027 | 980,000 | 1,094,562 | 0.91 | % | ||||||||
| Consumer Discretionary – 1.06% | ||||||||||||
| Alibaba Group Holding Ltd., 3.600%, 11/28/2024 (b) | 1,000,000 | 1,063,921 | 0.89 | % | ||||||||
| Dollar Tree, Inc., 3.700%, 05/15/2023 | 200,000 | 208,562 | 0.17 | % | ||||||||
| 1,272,483 | 1.06 | % | ||||||||||
| Energy – 0.89% | ||||||||||||
| Canadian Natural Resources Ltd., 3.900%, 02/01/2025 (b) | 1,000,000 | 1,070,009 | 0.89 | % | ||||||||
| Financials – 7.81% | ||||||||||||
| Aflac, Inc., 3.600%, 04/01/2030 | 300,000 | 333,494 | 0.28 | % | ||||||||
| Bank of America Corp., 2.299% to 07/21/2031 | ||||||||||||
| then SOFR + 1.220%, 07/21/2032 (c) | 575,000 | 563,344 | 0.47 | % | ||||||||
| Dell International LLC / EMC Corp., 5.450%, 06/15/2023 | 1,220,000 | 1,299,690 | 1.08 | % | ||||||||
| Discover Financial Services, 5.200%, 04/27/2022 | 650,000 | 665,031 | 0.55 | % | ||||||||
| Fifth Third Bancorp, 3.650%, 01/25/2024 | 225,000 | 238,126 | 0.20 | % | ||||||||
| General Motors Financial Co, Inc., 3.700%, 05/09/2023 | 1,075,000 | 1,116,430 | 0.93 | % | ||||||||
| Huntington Bancshares, Inc. | ||||||||||||
| 2.550%, 02/04/2030 | 525,000 | 539,142 | 0.45 | % | ||||||||
| 4.000%, 05/15/2025 | 365,000 | 396,859 | 0.33 | % | ||||||||
The accompanying notes are an integral part of these financial statements.
| HENNESSY FUNDS | 1-800-966-4354 |
13
| CORPORATE BONDS | % of | |||||||||||
| Par Amount | Value | Net Assets | ||||||||||
| Financials (Continued) | ||||||||||||
| Intercontinental Exchange, Inc., 0.700%, 06/15/2023 | 165,000 | $ | 165,046 | 0.14 | % | |||||||
| Morgan Stanley | ||||||||||||
| 1.593% to 05/04/2026 then SOFR + 0.879%, 05/04/2027 (c) | 295,000 | 292,381 | 0.24 | % | ||||||||
| 2.239% to 07/21/2031 then SOFR + 1.178%, 07/21/2032 (c) | 330,000 | 322,468 | 0.27 | % | ||||||||
| Prudential Financial, Inc., 3.878%, 03/27/2028 | 260,000 | 292,010 | 0.24 | % | ||||||||
| Regions Financial Corp., 1.800%, 08/12/2028 | 325,000 | 318,288 | 0.27 | % | ||||||||
| Synchrony Financial, 3.950%, 12/01/2027 | 650,000 | 711,509 | 0.59 | % | ||||||||
| Synovus Financial Corp., 3.125%, 11/01/2022 | 1,300,000 | 1,326,358 | 1.11 | % | ||||||||
| Willis North America, Inc., 3.600%, 05/15/2024 | 750,000 | 793,959 | 0.66 | % | ||||||||
| 9,374,135 | 7.81 | % | ||||||||||
| Health Care – 1.62% | ||||||||||||
| Edwards Lifesciences Corp., 4.300%, 06/15/2028 | 700,000 | 801,652 | 0.67 | % | ||||||||
| Evernorth Health, Inc., 3.500%, 06/15/2024 | 700,000 | 740,615 | 0.62 | % | ||||||||
| Regeneron Pharmaceuticals, Inc., 1.750%, 09/15/2030 | 425,000 | 402,304 | 0.33 | % | ||||||||
| 1,944,571 | 1.62 | % | ||||||||||
| Industrials – 0.36% | ||||||||||||
| General Electric Co., 3.625%, 05/01/2030 | 380,000 | 426,169 | 0.36 | % | ||||||||
| Information Technology – 1.81% | ||||||||||||
| Autodesk, Inc., 2.850%, 01/15/2030 | 675,000 | 701,156 | 0.59 | % | ||||||||
| Broadcom, Inc., 4.110%, 09/15/2028 | 425,000 | 469,633 | 0.39 | % | ||||||||
| Micron Technology, Inc., 2.497%, 04/24/2023 | 200,000 | 205,760 | 0.17 | % | ||||||||
| PayPal Holdings, Inc., 2.850%, 10/01/2029 | 750,000 | 792,990 | 0.66 | % | ||||||||
| 2,169,539 | 1.81 | % | ||||||||||
| Total Corporate Bonds | ||||||||||||
| (Cost $16,618,116) | 17,351,468 | 14.46 | % | |||||||||
| MORTGAGE-BACKED SECURITIES – 2.84% | ||||||||||||
| Fannie Mae Pool | ||||||||||||
| 3.000%, 10/01/2043 | 1,169,658 | 1,244,712 | 1.04 | % | ||||||||
| 3.500%, 01/01/2042 | 196,800 | 212,805 | 0.18 | % | ||||||||
| 6.000%, 10/01/2037 | 79,337 | 91,100 | 0.07 | % | ||||||||
| Fannie Mae REMICS | ||||||||||||
| Series 2013-52, 1.250%, 06/25/2043 | 57,582 | 56,878 | 0.05 | % | ||||||||
| Series 2012-22, 2.000%, 11/25/2040 | 7,721 | 7,751 | 0.00 | % | ||||||||
| Series 2012-16, 2.000%, 11/25/2041 | 55,552 | 56,861 | 0.05 | % | ||||||||
| Series 2010-134, 2.250%, 03/25/2039 | 20,970 | 21,148 | 0.02 | % | ||||||||
The accompanying notes are an integral part of these financial statements.
| WWW.HENNESSYFUNDS.COM |
14
| SCHEDULE OF INVESTMENTS |
| MORTGAGE-BACKED SECURITIES | Par Amount/ | % of | ||||||||||
| Number of Shares | Value | Net Assets | ||||||||||
| Freddie Mac Gold Pool | ||||||||||||
| 3.000%, 05/01/2042 | 512,241 | $ | 545,527 | 0.46 | % | |||||||
| 3.000%, 09/01/2042 | 766,532 | 816,424 | 0.68 | % | ||||||||
| 5.500%, 04/01/2037 | 44,433 | 51,953 | 0.04 | % | ||||||||
| Freddie Mac REMICS | ||||||||||||
| Series 4146, 1.500%, 10/15/2042 | 20,673 | 20,994 | 0.02 | % | ||||||||
| Series 4309, 2.000%, 10/15/2043 | 47,860 | 48,787 | 0.04 | % | ||||||||
| Series 3928, 2.500%, 08/15/2040 | 9,091 | 9,115 | 0.01 | % | ||||||||
| Series 3870, 2.750%, 01/15/2041 | 20,723 | 21,221 | 0.02 | % | ||||||||
| Series 4322, 3.000%, 05/15/2043 | 87,994 | 90,381 | 0.07 | % | ||||||||
| Government National Mortgage Association, | ||||||||||||
| Series 2013-24, 1.750%, 02/16/2043 | 114,837 | 116,323 | 0.09 | % | ||||||||
| Total Mortgage-Backed Securities | ||||||||||||
| (Cost $3,222,774) | 3,411,980 | 2.84 | % | |||||||||
| U.S. TREASURY OBLIGATIONS – 8.59% | ||||||||||||
| U.S. Treasury Notes – 8.59% | ||||||||||||
| 0.250%, 08/31/2025 | 1,250,000 | 1,214,795 | 1.01 | % | ||||||||
| 0.500%, 02/28/2026 | 1,500,000 | 1,462,031 | 1.22 | % | ||||||||
| 0.625%, 03/31/2027 | 1,250,000 | 1,209,058 | 1.01 | % | ||||||||
| 0.750%, 04/30/2026 | 1,500,000 | 1,474,980 | 1.23 | % | ||||||||
| 1.000%, 07/31/2028 | 1,000,000 | 971,680 | 0.81 | % | ||||||||
| 1.250%, 04/30/2028 | 425,000 | 420,858 | 0.35 | % | ||||||||
| 1.625%, 05/15/2031 | 300,000 | 302,320 | 0.25 | % | ||||||||
| 1.875%, 07/31/2026 | 1,775,000 | 1,834,698 | 1.53 | % | ||||||||
| 2.750%, 02/15/2024 | 575,000 | 603,357 | 0.50 | % | ||||||||
| 3.000%, 10/31/2025 | 450,000 | 484,928 | 0.41 | % | ||||||||
| 3.125%, 11/15/2028 | 295,000 | 328,326 | 0.27 | % | ||||||||
| Total U.S. Treasury Obligations | ||||||||||||
| (Cost $10,360,624) | 10,307,031 | 8.59 | % | |||||||||
| INVESTMENT COMPANIES (EXCLUDING | ||||||||||||
| MONEY MARKET FUNDS) – 1.06% | ||||||||||||
| Financials – 0.75% | ||||||||||||
| Apollo Investment Corp. | 4,375 | 58,756 | 0.05 | % | ||||||||
| Ares Capital Corp. | 3,345 | 71,717 | 0.06 | % | ||||||||
| Bain Capital Specialty Finance, Inc. | 3,380 | 52,694 | 0.04 | % | ||||||||
| BlackRock TCP Capital Corp. | 4,790 | 68,784 | 0.06 | % | ||||||||
| FS KKR Capital Corp. | 3,013 | 66,165 | 0.06 | % | ||||||||
| Golub Capital BDC, Inc. | 3,200 | 50,816 | 0.04 | % | ||||||||
| Hercules Capital, Inc. | 4,625 | 81,724 | 0.07 | % | ||||||||
The accompanying notes are an integral part of these financial statements.
| HENNESSY FUNDS | 1-800-966-4354 |
15
| INVESTMENT COMPANIES (EXCLUDING | Number | % of | ||||||||||
| MONEY MARKET FUNDS) | of Shares | Value | Net Assets | |||||||||
| Financials (Continued) | ||||||||||||
| Monroe Capital Corp. | 6,150 | $ | 63,468 | 0.05 | % | |||||||
| New Mountain Finance Corp. | 4,755 | 66,855 | 0.05 | % | ||||||||
| Oaktree Specialty Lending Corp. | 11,905 | 87,740 | 0.07 | % | ||||||||
| Sixth Street Specialty Lending, Inc. | 2,650 | 63,176 | 0.05 | % | ||||||||
| TCG BDC, Inc. | 5,235 | 73,866 | 0.06 | % | ||||||||
| TriplePoint Venture Growth BDC Corp. | 5,675 | 101,015 | 0.09 | % | ||||||||
| 906,776 | 0.75 | % | ||||||||||
| Other Investment Companies – 0.31% | ||||||||||||
| Vanguard High-Yield Corporate Fund | 62,348 | 370,345 | 0.31 | % | ||||||||
| Total Investment Companies | ||||||||||||
| (Excluding Money Market Funds) | ||||||||||||
| (Cost $1,247,696) | 1,277,121 | 1.06 | % | |||||||||
| SHORT-TERM INVESTMENTS – 1.47% | ||||||||||||
| Money Market Funds – 1.47% | ||||||||||||
| First American Government Obligations Fund, | ||||||||||||
| Institutional Class, 0.03% (d) | 1,760,611 | 1,760,611 | 1.47 | % | ||||||||
| Total Short-Term Investments | ||||||||||||
| (Cost $1,760,611) | 1,760,611 | 1.47 | % | |||||||||
| Total Investments | ||||||||||||
| (Cost $84,959,019) – 99.81% | 119,802,037 | 99.81 | % | |||||||||
| Other Assets in Excess of Liabilities – 0.19% | 229,967 | 0.19 | % | |||||||||
TOTAL NET ASSETS – 100.00% | $ | 120,032,004 | 100.00 | % | ||||||||
Percentages are stated as a percent of net assets.
ADR – American Depositary Receipt
PLC – Public Limited Company
REIT – Real Estate Investment Trust
| (a) | Non-income-producing security. |
| (b) | U.S.-traded security of a foreign corporation. |
| (c) | Variable rate security; rate disclosed is the rate as of October 31, 2021. |
| (d) | The rate listed is the fund’s seven-day yield as of October 31, 2021. |
The accompanying notes are an integral part of these financial statements.
| WWW.HENNESSYFUNDS.COM |
16
| SCHEDULE OF INVESTMENTS |
Summary of Fair Value Exposure as of October 31, 2021
The following is a summary of the inputs used to value the Fund’s net assets as of October 31, 2021 (see Note 3 in the accompanying Notes to the Financial Statements):
| Common Stocks | Level 1 | Level 2 | Level 3 | Total | ||||||||||||
| Communication Services | $ | 10,118,426 | $ | — | $ | — | $ | 10,118,426 | ||||||||
| Consumer Discretionary | 11,171,698 | — | — | 11,171,698 | ||||||||||||
| Consumer Staples | 8,179,055 | — | — | 8,179,055 | ||||||||||||
| Energy | 344,959 | — | — | 344,959 | ||||||||||||
| Financials | 14,062,660 | — | — | 14,062,660 | ||||||||||||
| Health Care | 3,858,903 | — | — | 3,858,903 | ||||||||||||
| Industrials | 8,129,966 | — | — | 8,129,966 | ||||||||||||
| Information Technology | 16,737,865 | — | — | 16,737,865 | ||||||||||||
| Materials | 7,559,952 | — | — | 7,559,952 | ||||||||||||
| Total Common Stocks | $ | 80,163,484 | $ | — | $ | — | $ | 80,163,484 | ||||||||
| Preferred Stocks | ||||||||||||||||
| Communication Services | $ | 50,387 | $ | — | $ | — | $ | 50,387 | ||||||||
| Consumer Discretionary | 17,050 | — | — | 17,050 | ||||||||||||
| Consumer Staples | 98,205 | — | — | 98,205 | ||||||||||||
| Energy | 51,840 | — | — | 51,840 | ||||||||||||
| Financials | 2,015,361 | — | — | 2,015,361 | ||||||||||||
| Total Preferred Stocks | $ | 2,232,843 | $ | — | $ | — | $ | 2,232,843 | ||||||||
| REITS | ||||||||||||||||
| Financials | $ | 3,297,499 | $ | — | $ | — | $ | 3,297,499 | ||||||||
| Total REITS | $ | 3,297,499 | $ | — | $ | — | $ | 3,297,499 | ||||||||
| Corporate Bonds | ||||||||||||||||
| Communication Services | $ | — | $ | 1,094,562 | $ | — | $ | 1,094,562 | ||||||||
| Consumer Discretionary | — | 1,272,483 | — | 1,272,483 | ||||||||||||
| Energy | — | 1,070,009 | — | 1,070,009 | ||||||||||||
| Financials | — | 9,374,135 | — | 9,374,135 | ||||||||||||
| Health Care | — | 1,944,571 | — | 1,944,571 | ||||||||||||
| Industrials | — | 426,169 | — | 426,169 | ||||||||||||
| Information Technology | — | 2,169,539 | — | 2,169,539 | ||||||||||||
| Total Corporate Bonds | $ | — | $ | 17,351,468 | $ | — | $ | 17,351,468 | ||||||||
| Mortgage-Backed Securities | $ | — | $ | 3,411,980 | $ | — | $ | 3,411,980 | ||||||||
| U.S. Treasury Obligations | ||||||||||||||||
| U.S. Treasury Notes | $ | — | $ | 10,307,031 | $ | — | $ | 10,307,031 | ||||||||
| Total U.S. Treasury Obligations | $ | — | $ | 10,307,031 | $ | — | $ | 10,307,031 | ||||||||
| Investment Companies (Excluding | ||||||||||||||||
| Money Market Funds) | ||||||||||||||||
| Financials | $ | 906,776 | $ | — | $ | — | $ | 906,776 | ||||||||
| Other Investment Companies | 370,345 | — | — | 370,345 | ||||||||||||
| Total Investment Companies | ||||||||||||||||
| (Excluding Money Market Funds) | $ | 1,277,121 | $ | — | $ | — | $ | 1,277,121 | ||||||||
| Short-Term Investments | ||||||||||||||||
| Money Market Funds | $ | 1,760,611 | $ | — | $ | — | $ | 1,760,611 | ||||||||
| Total Short-Term Investments | $ | 1,760,611 | $ | — | $ | — | $ | 1,760,611 | ||||||||
| Total Investments | $ | 88,731,558 | $ | 31,070,479 | $ | — | $ | 119,802,037 | ||||||||
The accompanying notes are an integral part of these financial statements.
| HENNESSY FUNDS | 1-800-966-4354 |
17
Financial Statements
Statement of Assets and Liabilities as of October 31, 2021 |
| ASSETS: | ||||
| Investments in securities, at value (cost $84,959,019) | $ | 119,802,037 | ||
| Dividends and interest receivable | 320,597 | |||
| Receivable for fund shares sold | 89,790 | |||
| Return of capital receivable | 1,141 | |||
| Prepaid expenses and other assets | 20,018 | |||
| Total assets | 120,233,583 | |||
| LIABILITIES: | ||||
| Payable for fund shares redeemed | 22,793 | |||
| Payable to advisor | 80,870 | |||
| Payable to administrator | 36,095 | |||
| Payable to auditor | 22,544 | |||
| Accrued distribution fees | 7,669 | |||
| Accrued service fees | 4,548 | |||
| Accrued trustees fees | 6,594 | |||
| Accrued expenses and other payables | 20,466 | |||
| Total liabilities | 201,579 | |||
| NET ASSETS | $ | 120,032,004 | ||
| NET ASSETS CONSISTS OF: | ||||
| Capital stock | $ | 77,838,792 | ||
| Total distributable earnings | 42,193,212 | |||
| Total net assets | $ | 120,032,004 | ||
| NET ASSETS: | ||||
| Investor Class | ||||
| Shares authorized (no par value) | Unlimited | |||
| Net assets applicable to outstanding shares | $ | 53,967,285 | ||
| Shares issued and outstanding | 3,126,398 | |||
| Net asset value, offering price, and redemption price per share | $ | 17.26 | ||
| Institutional Class | ||||
| Shares authorized (no par value) | Unlimited | |||
| Net assets applicable to outstanding shares | $ | 66,064,719 | ||
| Shares issued and outstanding | 4,073,612 | |||
| Net asset value, offering price, and redemption price per share | $ | 16.22 | ||
The accompanying notes are an integral part of these financial statements.
| WWW.HENNESSYFUNDS.COM |
18
| STATEMENT OF ASSETS AND LIABILITIES/STATEMENT OF OPERATIONS |
Financial Statements
Statement of Operations for the year ended October 31, 2021 |
| INVESTMENT INCOME: | ||||
Dividend income(1) | $ | 1,603,444 | ||
| Interest income | 829,206 | |||
| Total investment income | 2,432,650 | |||
| EXPENSES: | ||||
| Investment advisory fees (See Note 5) | 959,345 | |||
| Sub-transfer agent expenses – Investor Class (See Note 5) | 106,615 | |||
| Sub-transfer agent expenses – Institutional Class (See Note 5) | 54,916 | |||
| Administration, accounting, custody, and transfer agent fees (See Note 5) | 144,351 | |||
| Distribution fees – Investor Class (See Note 5) | 81,138 | |||
| Service fees – Investor Class (See Note 5) | 54,092 | |||
| Federal and state registration fees | 33,174 | |||
| Compliance expense (See Note 5) | 27,464 | |||
| Audit fees | 22,540 | |||
| Trustees’ fees and expenses | 19,160 | |||
| Reports to shareholders | 12,464 | |||
| Legal fees | 10,248 | |||
| Other expenses | 16,429 | |||
| Total expenses | 1,541,936 | |||
| NET INVESTMENT INCOME | $ | 890,714 | ||
| REALIZED AND UNREALIZED GAINS (LOSSES): | ||||
| Net realized gain on investments: | $ | 8,268,323 | ||
| Net change in unrealized appreciation/depreciation on investments: | 13,894,367 | |||
| Net gain on investments | 22,162,690 | |||
| NET INCREASE IN NET ASSETS RESULTING FROM OPERATIONS | $ | 23,053,404 | ||
(1) | Net of foreign taxes withheld and issuance fees of $12,543. |
The accompanying notes are an integral part of these financial statements.
| HENNESSY FUNDS | 1-800-966-4354 |
19
(This Page Intentionally Left Blank.)
| WWW.HENNESSYFUNDS.COM |
20
| STATEMENTS OF CHANGES IN NET ASSETS |
Financial Statements
| Statements of Changes in Net Assets |
| Year Ended | Year Ended | |||||||
| October 31, 2021 | October 31, 2020 | |||||||
| OPERATIONS: | ||||||||
| Net investment income | $ | 890,714 | $ | 1,658,298 | ||||
| Net realized gain on investments | 8,268,323 | 8,393,939 | ||||||
| Net change in unrealized | ||||||||
| appreciation/depreciation on investments | 13,894,367 | (5,503,698 | ) | |||||
| Net increase in net assets resulting from operations | 23,053,404 | 4,548,539 | ||||||
| DISTRIBUTIONS TO SHAREHOLDERS: | ||||||||
| Distributable earnings – Investor Class | (3,200,223 | ) | (5,790,228 | ) | ||||
| Distributable earnings – Institutional Class | (4,139,573 | ) | (6,055,327 | ) | ||||
| Total distributions | (7,339,796 | ) | (11,845,555 | ) | ||||
| CAPITAL SHARE TRANSACTIONS: | ||||||||
| Proceeds from shares subscribed – Investor Class | 1,376,547 | 1,170,684 | ||||||
| Proceeds from shares subscribed – Institutional Class | 3,724,722 | 6,516,349 | ||||||
| Dividends reinvested – Investor Class | 3,106,285 | 5,588,214 | ||||||
| Dividends reinvested – Institutional Class | 3,180,592 | 4,764,063 | ||||||
| Cost of shares redeemed – Investor Class | (8,925,766 | ) | (45,400,919 | ) | ||||
| Cost of shares redeemed – Institutional Class | (11,189,372 | ) | (26,206,237 | ) | ||||
| Net decrease in net assets derived | ||||||||
| from capital share transactions | (8,726,992 | ) | (53,567,846 | ) | ||||
| TOTAL INCREASE (DECREASE) IN NET ASSETS | 6,986,616 | (60,864,862 | ) | |||||
| NET ASSETS: | ||||||||
| Beginning of year | 113,045,388 | 173,910,250 | ||||||
| End of year | $ | 120,032,004 | $ | 113,045,388 | ||||
| CHANGES IN SHARES OUTSTANDING: | ||||||||
| Shares sold – Investor Class | 83,494 | 79,272 | ||||||
| Shares sold – Institutional Class | 245,309 | 471,407 | ||||||
| Shares issued to holders as reinvestment | ||||||||
| of dividends – Investor Class | 200,751 | 374,820 | ||||||
| Shares issued to holders as reinvestment | ||||||||
| of dividends – Institutional Class | 217,790 | 340,132 | ||||||
| Shares redeemed – Investor Class | (549,400 | ) | (3,009,794 | ) | ||||
| Shares redeemed – Institutional Class | (732,371 | ) | (1,899,718 | ) | ||||
| Net decrease in shares outstanding | (534,427 | ) | (3,643,881 | ) | ||||
The accompanying notes are an integral part of these financial statements.
| HENNESSY FUNDS | 1-800-966-4354 |
21
Financial Statements
| Financial Highlights |
For an Investor Class share outstanding throughout each year
PER SHARE DATA:
Net asset value, beginning of year
Income from investment operations:
Net investment income
Net realized and unrealized gains on investments
Total from investment operations
Less distributions:
Dividends from net investment income
Dividends from net realized gains
Total distributions
Net asset value, end of year
TOTAL RETURN
SUPPLEMENTAL DATA AND RATIOS:
Net assets, end of year (millions)
Ratio of expenses to average net assets
Ratio of net investment income to average net assets
Portfolio turnover rate(2)
(1) | Calculated using the average shares outstanding method. |
(2) | Calculated on the basis of the Fund as a whole. |
The accompanying notes are an integral part of these financial statements.
| WWW.HENNESSYFUNDS.COM |
22
| FINANCIAL HIGHLIGHTS — INVESTOR CLASS |
| Year Ended October 31, | ||||||||||||||||||
| 2021 | 2020 | 2019 | 2018 | 2017 | ||||||||||||||
| $ | 15.12 | $ | 15.72 | $ | 15.82 | $ | 16.24 | $ | 15.61 | |||||||||
| 0.09 | (1) | 0.16 | (1) | 0.18 | (1) | 0.16 | 0.14 | |||||||||||
| 3.01 | 0.40 | 1.02 | 0.40 | 1.95 | ||||||||||||||
| 3.10 | 0.56 | 1.20 | 0.56 | 2.09 | ||||||||||||||
| (0.10 | ) | (0.16 | ) | (0.17 | ) | (0.14 | ) | (0.12 | ) | |||||||||
| (0.86 | ) | (1.00 | ) | (1.13 | ) | (0.84 | ) | (1.34 | ) | |||||||||
| (0.96 | ) | (1.16 | ) | (1.30 | ) | (0.98 | ) | (1.46 | ) | |||||||||
| $ | 17.26 | $ | 15.12 | $ | 15.72 | $ | 15.82 | $ | 16.24 | |||||||||
| 21.24 | % | 3.74 | % | 8.39 | % | 3.44 | % | 14.16 | % | |||||||||
| $ | 53.97 | $ | 51.29 | $ | 93.51 | $ | 121.32 | $ | 155.33 | |||||||||
| 1.49 | % | 1.49 | % | 1.46 | % | 1.42 | % | 1.43 | % | |||||||||
| 0.54 | % | 1.08 | % | 1.16 | % | 0.89 | % | 0.78 | % | |||||||||
| 26 | % | 22 | % | 16 | % | 18 | % | 15 | % | |||||||||
The accompanying notes are an integral part of these financial statements.
| HENNESSY FUNDS | 1-800-966-4354 |
23
Financial Statements
| Financial Highlights |
For an Institutional Class share outstanding throughout each year
PER SHARE DATA:
Net asset value, beginning of year
Income from investment operations:
Net investment income
Net realized and unrealized gains on investments
Total from investment operations
Less distributions:
Dividends from net investment income
Dividends from net realized gains
Total distributions
Net asset value, end of year
TOTAL RETURN
SUPPLEMENTAL DATA AND RATIOS:
Net assets, end of year (millions)
Ratio of expenses to average net assets
Ratio of net investment income to average net assets
Portfolio turnover rate(2)
(1) | Calculated using the average shares outstanding method. |
(2) | Calculated on the basis of the Fund as a whole. |
The accompanying notes are an integral part of these financial statements.
| WWW.HENNESSYFUNDS.COM |
24
| FINANCIAL HIGHLIGHTS — INSTITUTIONAL CLASS |
| Year Ended October 31, | ||||||||||||||||||
| 2021 | 2020 | 2019 | 2018 | 2017 | ||||||||||||||
| $ | 14.22 | $ | 14.80 | $ | 14.93 | $ | 15.34 | $ | 14.76 | |||||||||
| 0.14 | (1) | 0.20 | (1) | 0.22 | (1) | 0.19 | 0.16 | |||||||||||
| 2.83 | 0.38 | 0.96 | 0.39 | 1.87 | ||||||||||||||
| 2.97 | 0.58 | 1.18 | 0.58 | 2.03 | ||||||||||||||
| (0.16 | ) | (0.22 | ) | (0.24 | ) | (0.20 | ) | (0.18 | ) | |||||||||
| (0.81 | ) | (0.94 | ) | (1.07 | ) | (0.79 | ) | (1.27 | ) | |||||||||
| (0.97 | ) | (1.16 | ) | (1.31 | ) | (0.99 | ) | (1.45 | ) | |||||||||
| $ | 16.22 | $ | 14.22 | $ | 14.80 | $ | 14.93 | $ | 15.34 | |||||||||
| 21.68 | % | 4.16 | % | 8.76 | % | 3.86 | % | 14.60 | % | |||||||||
| $ | 66.06 | $ | 61.75 | $ | 80.40 | $ | 97.86 | $ | 110.74 | |||||||||
| 1.12 | % | 1.12 | % | 1.09 | % | 1.02 | % | 1.05 | % | |||||||||
| 0.91 | % | 1.44 | % | 1.53 | % | 1.28 | % | 1.16 | % | |||||||||
| 26 | % | 22 | % | 16 | % | 18 | % | 15 | % | |||||||||
The accompanying notes are an integral part of these financial statements.
| HENNESSY FUNDS | 1-800-966-4354 |
25
Financial Statements
Notes to the Financial Statements October 31, 2021 |
1). ORGANIZATION
The Hennessy Equity and Income Fund (the “Fund”) is a series of Hennessy Funds Trust (the “Trust”), which was organized as a Delaware statutory trust on September 17, 1992. The Fund is an open-end management investment company registered under the Investment Company Act of 1940, as amended. The investment objective of the Fund is long-term capital growth and current income. The Fund is a diversified fund.
The Fund offers Investor Class and Institutional Class shares. Each class of shares differs principally in its respective 12b-1 distribution and service, shareholder servicing, and sub-transfer agent expenses. There are no sales charges. Each class has identical rights to earnings, assets, and voting privileges, except for class-specific expenses and exclusive rights to vote on matters affecting only one class.
As an investment company, the Fund follows the investment company accounting and reporting guidance of the Financial Accounting Standards Board (“FASB”) Accounting Standard Codification Topic 946 “Financial Services—Investment Companies.”
2). SIGNIFICANT ACCOUNTING POLICIES
The following is a summary of significant accounting policies consistently followed by the Fund in the preparation of the financial statements. These policies conform to U.S. generally accepted accounting principles (“GAAP”).
| a). | Securities Valuation – All investments in securities are valued in accordance with the Fund’s valuation policies and procedures, as described in Note 3. |
| b). | Federal Income Taxes – The Fund has elected to be taxed as a regulated investment company and intends to distribute substantially all of its taxable income to its shareholders and otherwise comply with the provisions of the Internal Revenue Code of 1986, as amended, applicable to regulated investment companies. As a result, the Fund has made no provision for federal income taxes or excise taxes. Net investment income/loss and realized gains/losses for federal income tax purposes may differ from those reported in the financial statements because of temporary book-basis and tax-basis differences. Temporary differences are primarily the result of the treatment of wash sales for tax reporting purposes. The Fund recognizes interest and penalties related to income tax benefits, if any, in the Statement of Operations as an income tax expense. Distributions from net realized gains for book purposes may include short-term capital gains, which are included as ordinary income to shareholders for tax purposes. The Fund may utilize equalization accounting for tax purposes and designate earnings and profits, including net realized gains distributed to shareholders on redemption of shares, as part of the dividends paid deduction for income tax purposes. |
| Due to inherent differences in the recognition of income, expenses, and realized gains/losses under GAAP and federal income tax regulations, permanent differences between book and tax basis for reporting are identified and appropriately reclassified in the Statement of Assets and Liabilities, as needed. The adjustments for fiscal year 2021 are as follows: |
| Total | |||
| Distributable | |||
Earnings | Capital Stock | ||
| $(584,661) | $584,661 |
| WWW.HENNESSYFUNDS.COM |
26
| NOTES TO THE FINANCIAL STATEMENTS |
| c). | Accounting for Uncertainty in Income Taxes – The Fund has accounting policies regarding recognition and measurement of tax positions taken or expected to be taken on a tax return. The tax returns of the Fund for the prior three fiscal years are open for examination. The Fund has reviewed all open tax years in major tax jurisdictions and concluded that there is no impact on the Fund’s net assets and no tax liability resulting from unrecognized tax benefits relating to uncertain income tax positions taken or expected to be taken on a tax return. The Fund’s major tax jurisdictions are U.S. federal and Delaware. |
| d). | Income and Expenses – Dividend income is recognized on the ex-dividend date or as soon as information is available to the Fund. Interest income, which includes the amortization of premium and accretion of discount, is recognized on an accrual basis. Market discounts, original issue discounts, and market premiums on debt securities are accreted or amortized to interest income over the life of a security with a corresponding increase or decrease, as applicable, in the cost basis of such security using the yield-to-maturity method or, where applicable, the first call date of the security. Other non-cash dividends are recognized as investment income at the fair value of the property received. The Fund is charged for those expenses that are directly attributable to its portfolio, such as advisory, administration, and certain shareholder service fees. Income, expenses (other than expenses attributable to a specific class), and realized and unrealized gains/losses on investments are allocated to each class of shares based on such class’s net assets. |
| e). | Distributions to Shareholders – Dividends from net investment income for the Fund, if any, are declared and paid at the end of each calendar quarter. Distributions of net realized capital gains, if any, are declared and paid annually, usually in December. |
| f). | Security Transactions – Investment and shareholder transactions are recorded on the trade date. The Fund determines the realized gain/loss from an investment transaction by comparing the original cost of the security lot sold with the net sale proceeds. Discounts and premiums on securities purchased are accreted or amortized, respectively, over the life of each such security. |
| g). | Use of Estimates – Preparing financial statements in accordance with GAAP requires management to make estimates and assumptions that affect the reported amounts of assets and liabilities and disclosure of contingent assets and liabilities at the date of the financial statements, as well as the reported change in net assets during the reporting period. Actual results could differ from those estimates. |
| h). | Share Valuation – The net asset value (“NAV”) per share of the Fund is calculated by dividing (i) the total value of the securities held by the Fund, plus cash and other assets, minus all liabilities (including estimated accrued expenses) by (ii) the total number of Fund shares outstanding, rounded to the nearest $0.01. Fund shares are not priced on days the New York Stock Exchange is closed for trading. The offering and redemption price per share for the Fund is equal to the Fund’s NAV per share. |
| i). | REIT Equity Securities – Distributions received from real estate investment trusts (“REITs”) may be classified as dividends, capital gains, or return of capital. Investments in REITs may require the Fund to accrue and distribute income not yet received. To generate sufficient cash to make any required distributions, the Fund may be required to sell securities in its portfolio (including when it is not advantageous to do so) that it otherwise would have continued to hold. At other times, investments in a REIT may result in the Fund’s receipt of cash in excess of the REIT’s earnings. If the Fund distributes these amounts, these distributions could constitute a return of capital to Fund shareholders for U.S. federal income tax |
| HENNESSY FUNDS | 1-800-966-4354 |
27
| purposes. Dividends received by the Fund from a REIT generally do not constitute qualified dividend income and do not qualify for the dividends-received deduction. | |
| j). | Recent Accounting Pronouncements and Regulatory Updates – In October 2020, the Securities and Exchange Commission (“SEC”) adopted new regulations governing the use of derivatives by registered investment companies (“Rule 18f-4”). Rule 18f-4 imposes limits on the amount of derivatives a fund can enter into, eliminates the asset segregation framework currently used by funds to comply with Section 18 of the 1940 Act, and requires funds whose use of derivatives is greater than a limited specified amount to establish and maintain a comprehensive derivatives risk management program and appoint a derivatives risk manager. Funds are required to comply with Rule 18f-4 by August 19, 2022. The impact, if any, that Rule 18f-4 will have on the availability, liquidity, and performance of derivatives is unclear. Management is currently evaluating the potential impact of Rule 18f-4 on the Fund. When fully implemented, Rule 18f-4 may require changes in how the Fund uses derivatives, adversely affect the Fund’s performance, and increase costs related to the Fund’s use of derivatives. |
| In December 2020, the SEC adopted a new rule providing a framework for fund valuation practices (“Rule 2a-5”). Rule 2a-5 establishes requirements for determining fair value in good faith for purposes of the 1940 Act. Rule 2a-5 permits fund boards to designate certain parties to perform fair value determinations, subject to board oversight and certain other conditions. Rule 2a-5 also defines when market quotations are “readily available” for purposes of the 1940 Act and the threshold for determining whether a fund must fair value a security. In connection with Rule 2a-5, the SEC also adopted related recordkeeping requirements and is rescinding previously issued guidance, including with respect to the role of a board in determining fair value and the accounting and auditing of fund investments. Funds must comply with the rules by September 8, 2022. Management is currently assessing the potential impact of the new rules on the Fund’s financial statements. |
3). SECURITIES VALUATION
The Fund follows its valuation policies and procedures in determining its net asset value and, in preparing these financial statements, the fair value accounting standards that establish an authoritative definition of fair value and set out a hierarchy for measuring fair value. These standards require additional disclosures about the various inputs and valuation techniques used to develop the measurements of fair value and a discussion of changes in valuation techniques and related inputs during the period. These inputs are summarized in the three broad levels listed below:
| Level 1 – | Unadjusted, quoted prices in active markets for identical instruments that the Fund has the ability to access at the date of measurement. | |
| Level 2 – | Other significant observable inputs (including, but not limited to, quoted prices in active markets for similar instruments, quoted prices in markets that are not active for identical or similar instruments, and model-derived valuations in which all significant inputs and significant value drivers are observable in active markets, such as interest rates, prepayment speeds, credit risk curves, default rates, and similar data). | |
| Level 3 – | Significant unobservable inputs (including the Fund’s own assumptions about what market participants would use to price the asset or liability based on the best available information) when observable inputs are unavailable. |
| WWW.HENNESSYFUNDS.COM |
28
| NOTES TO THE FINANCIAL STATEMENTS |
The following is a description of the valuation techniques applied to the Fund’s major categories of assets and liabilities on a recurring basis:
Equity Securities – Equity securities, including common stocks, preferred stocks, foreign-issued common stocks, exchange-traded funds, closed-end mutual funds, partnerships, rights, and real estate investment trusts, that are traded on a securities exchange for which a last-quoted sales price is readily available generally are valued at the last sales price as reported by the primary exchange on which the securities are listed. Securities listed on The NASDAQ Stock Market (“NASDAQ”) generally are valued at the NASDAQ Official Closing Price, which may differ from the last sales price reported. Securities traded on a securities exchange for which a last-quoted sales price is not readily available generally are valued at the mean between the bid and ask prices. To the extent these securities are actively traded and valuation adjustments are not applied, they are classified in Level 1 of the fair value hierarchy. Securities traded on foreign exchanges generally are not valued at the same time the Fund calculates its NAV because most foreign markets close well before such time. The earlier close of most foreign markets gives rise to the possibility that significant events, including broad market moves, may have occurred in the interim. In certain circumstances, it may be determined that a foreign security needs to be fair valued because it appears that the value of the security might have been materially affected by events occurring after the close of the market in which the security is principally traded, but before the time the Fund calculates its NAV, such as by a development that affects an entire market or region (e.g., a weather-related event) or a potentially global development (e.g., a terrorist attack that may be expected to have an effect on investor expectations worldwide). | |
Registered Investment Companies – Investments in open-end registered investment companies, commonly referred to as mutual funds, generally are priced at the ending NAV provided by the applicable mutual fund’s service agent and are classified in Level 1 of the fair value hierarchy. | |
Debt Securities – Debt securities, including corporate bonds, asset-backed securities, mortgage-backed securities, municipal bonds, U.S. Treasuries, and U.S. government agency issues, are generally valued at market on the basis of valuations furnished by an independent pricing service that utilizes both dealer-supplied valuations and formula-based techniques. The pricing service may consider recently executed transactions in securities of the issuer or comparable issuers, market price quotations (where observable), bond spreads, and fundamental data relating to the issuer. In addition, the model may incorporate observable market data, such as reported sales of similar securities, broker quotes, yields, bids, offers, and reference data. Certain securities are valued primarily using dealer quotations. These securities are generally classified in Level 2 of the fair value hierarchy. | |
Short-Term Securities – Short-term equity investments, including money market funds, are valued in the manner specified above for equity securities. Short-term debt investments with an original term to maturity of 60 days or less are valued at amortized cost, which approximates fair market value. If the original term to maturity of a short-term debt investment exceeds 60 days, then the values as of the 61st day prior to maturity are amortized. Amortized cost is not used if its use would be inappropriate due to credit or other impairments of the issuer, in which case the security’s fair value would be determined as described below. Short-term securities are generally classified in Level 1 or Level 2 of the fair value hierarchy depending on the inputs used and market activity levels for specific securities. |
| HENNESSY FUNDS | 1-800-966-4354 |
29
The Board of Trustees of the Fund (the “Board”) has adopted fair value pricing procedures that are followed when a price for a security is not readily available or if a significant event has occurred that indicates the closing price of a security no longer represents the true value of that security. Fair value pricing determinations are made in good faith in accordance with these procedures. There are numerous criteria considered in determining a fair value of a security, such as the trading volume of a security and markets, the values of other similar securities, and news events with direct bearing on a security or markets. Fair value pricing results in an estimated price for a security that reflects the amount the Fund might reasonably expect to receive in a current sale. Depending on the relative significance of the valuation inputs, these securities may be classified in either Level 2 or Level 3 of the fair value hierarchy.
The fair value of foreign securities may be determined with the assistance of a pricing service using correlations between the movement of prices of such securities and indices of domestic securities and other appropriate indicators, such as closing market prices of relevant American Depositary Receipts or futures contracts. Using fair value pricing means that the Fund’s NAV reflects the affected portfolio securities’ values as determined by the Board or its designee, pursuant to the fair value pricing procedures adopted by the Board, instead of being determined by the market. Using a fair value pricing methodology to price a foreign security may result in a value that is different from such foreign security’s most recent closing price and from the value used by other investment companies to calculate their NAVs. Such securities are generally classified in Level 2 of the fair value hierarchy. Because the Fund may invest in foreign securities, the value of the Fund’s portfolio securities may change on days when a shareholder is unable to purchase or redeem Fund shares.
The Board has delegated day-to-day valuation matters to the Valuation and Liquidity Committee comprising representatives from Hennessy Advisors, Inc., the Fund’s investment advisor (the “Advisor”). The function of the Valuation and Liquidity Committee, among other things, is to value securities where current and reliable market quotations are not readily available. All actions taken by the Valuation and Liquidity Committee are reviewed by the Board.
The Fund has performed an analysis of all existing investments to determine the significance and character of all inputs to their fair value determinations. Various inputs are used to determine the value of the Fund’s investments. The inputs or methodology used for valuing securities are not necessarily an indication of the risk associated with investing in those securities. Details related to the fair value hierarchy of the Fund’s securities as of October 31, 2021, are included in the Schedule of Investments.
4). INVESTMENT TRANSACTIONS
Purchases and sales of investment securities (excluding government and short-term investments) for the Fund during fiscal year 2021 were $20,600,374 and $34,330,172, respectively.
Purchases and sales/maturities of long-term U.S. government securities for the Fund during fiscal year 2021 were $9,310,066 and $10,031,993, respectively.
5). INVESTMENT ADVISORY FEE AND OTHER TRANSACTIONS WITH AFFILIATES
The Advisor provides the Fund with investment advisory services under an Investment Advisory Agreement. The Advisor oversees the provision of investment advice and furnishes office space, facilities, and most of the personnel needed by the Fund. As compensation for its services, the Advisor is entitled to a monthly fee from the Fund. The fee is based on the average daily net assets of the Fund at an annual rate of 0.80%. The net investment advisory fees expensed by the Fund during fiscal year 2021 are included in the Statement of Operations.
| WWW.HENNESSYFUNDS.COM |
30
| NOTES TO THE FINANCIAL STATEMENTS |
The Advisor has delegated the day-to-day management of the equity allocation of the Fund to a sub-advisor, The London Company of Virginia, LLC, and has delegated the day-to-day management of the fixed income allocation of the Fund to a sub-advisor, FCI Advisors. The Advisor pays the sub-advisory fees from its own assets, and these fees are not an additional expense of the Fund. During fiscal year 2021, the Advisor (not the Fund) paid a sub-advisory fee at the rate of 0.33% of the daily net assets of the equity allocation of the Fund and 0.27% of the daily net assets of the fixed income allocation of the Fund.
The Board has approved a Shareholder Servicing Agreement for Investor Class shares of the Fund, which compensates the Advisor for the non-investment advisory services it provides to the Fund. The Shareholder Servicing Agreement provides for a monthly fee paid to the Advisor at an annual rate of 0.10% of the average daily net assets of the Fund attributable to Investor Class shares. The shareholder service fees expensed by the Fund during fiscal year 2021 are included in the Statement of Operations.
The Fund has adopted a plan pursuant to Rule 12b-1 under the Investment Company Act of 1940, as amended, that authorizes payments in connection with the distribution of Fund shares at an annual rate of up to 0.25% of the Fund’s average daily net assets attributable to Investor Class shares. Even though the authorized rate is up to 0.25%, the Fund is currently only using up to 0.15% of its average daily net assets attributable to Investor Class shares for such purpose. Amounts paid under the plan may be spent on any activities or expenses primarily intended to result in the sale of shares, including, but not limited to, advertising, shareholder account servicing, printing and mailing of prospectuses to other than current shareholders, printing and mailing of sales literature, and compensation for sales and marketing activities or to financial institutions and others, such as dealers and distributors. The distribution fees expensed by the Fund during fiscal year 2021 are included in the Statement of Operations.
The Fund has entered into agreements with various brokers, dealers, and financial intermediaries in connection with the sale of Fund shares. The agreements provide for periodic payments of sub-transfer agent expenses by the Fund to the brokers, dealers, and financial intermediaries for providing certain shareholder maintenance services. These shareholder services include the pre-processing and quality control of new accounts, shareholder correspondence, answering customer inquiries regarding account status, and facilitating shareholder telephone transactions. The sub-transfer agent fees expensed by the Fund during fiscal year 2021 are included in the Statement of Operations.
U.S. Bancorp Fund Services, LLC, d/b/a U.S. Bank Global Fund Services (“Fund Services”) provides the Fund with administrative, accounting, and transfer agent services. As administrator, Fund Services is responsible for activities such as (i) preparing various federal and state regulatory filings, reports, and returns for the Fund, (ii) preparing reports and materials to be supplied to the Board, (iii) monitoring the activities of the Fund’s custodian, transfer agent, and accountants, and (iv) coordinating the preparation and payment of the Fund’s expenses and reviewing the Fund’s expense accruals. U.S. Bank N.A., an affiliate of Fund Services, serves as the Fund’s custodian. The servicing agreements between the Trust, Fund Services, and U.S. Bank N.A. contain a fee schedule that is inclusive of administrative, accounting, custody, and transfer agent fees. The administrative, accounting, custody, and transfer agent fees expensed by the Fund during fiscal year 2021 are included in the Statement of Operations.
Quasar Distributors, LLC (“Quasar”), a wholly owned broker-dealer subsidiary of Foreside Financial Group, LLC (“Foreside”), acts as the Fund’s principal underwriter in a continuous public offering of Fund shares. Effective September 30, 2021, Genstar Capital, a private equity firm specializing in financial and related business service companies,
| HENNESSY FUNDS | 1-800-966-4354 |
31
acquired a majority interest in Foreside. The Board approved a new Distribution Agreement to enable Quasar to continue serving as the Fund’s distributor following the change in control of Foreside.
The officers of the Fund are affiliated with the Advisor. With the exception of the Chief Compliance Officer and the Senior Compliance Officer, such officers receive no compensation from the Fund for serving in their respective roles. The Fund, along with the other funds in the Hennessy Funds family (collectively, the “Hennessy Funds”), makes reimbursement payments on an equal basis to the Advisor for a portion of the salary and benefits associated with the office of the Chief Compliance Officer and for all of the salary and benefits associated with the office of the Senior Compliance Officer. The compliance fees expensed by the Fund during fiscal year 2021 are included in the Statement of Operations.
6). GUARANTEES AND INDEMNIFICATIONS
Under the Hennessy Funds’ organizational documents, their officers and trustees are indemnified by the Hennessy Funds against certain liabilities arising out of the performance of their duties to the Hennessy Funds. Additionally, in the normal course of business, the Hennessy Funds enter into contracts with service providers that contain general indemnification clauses. The Fund’s maximum exposure under these arrangements is unknown as this would involve future claims that may be made against the Fund that have not yet occurred. Currently, the Fund expects the risk of loss to be remote.
7). LINE OF CREDIT
The Fund has an uncommitted line of credit with the other Hennessy Funds in the amount of the lesser of (i) $100,000,000 or (ii) 33.33% of each Hennessy Fund’s net assets, or 30% for the Hennessy Gas Utility Fund and 10% for the Hennessy Balanced Fund. The line of credit is intended to provide any necessary short-term financing in connection with shareholder redemptions, subject to certain restrictions. The credit facility is with the Hennessy Funds’ custodian bank, U.S. Bank N.A. Borrowings under this arrangement bear interest at the bank’s prime rate and are secured by all of the Fund’s assets (as to its own borrowings only). During fiscal year 2021, the Fund did not have any borrowings outstanding under the line of credit.
8). FEDERAL TAX INFORMATION
As of October 31, 2021, the components of accumulated earnings (losses) for income tax purposes were as follows:
| Investments | ||||
| Cost of investments for tax purposes | $ | 85,235,039 | ||
| Gross tax unrealized appreciation | $ | 36,289,007 | ||
| Gross tax unrealized depreciation | (1,722,007 | ) | ||
| Net tax unrealized appreciation/(depreciation) | $ | 34,567,000 | ||
| Undistributed ordinary income | $ | 35,920 | ||
| Undistributed long-term capital gains | 7,590,292 | |||
| Total distributable earnings | $ | 7,626,212 | ||
| Other accumulated gain/(loss) | $ | — | ||
| Total accumulated gain/(loss) | $ | 42,193,212 | ||
The difference between book-basis unrealized appreciation/depreciation and tax-basis unrealized appreciation/depreciation (as shown above) is attributable primarily to wash sales.
As of October 31, 2021, the Fund had no tax-basis capital losses to offset future capital gains.
| WWW.HENNESSYFUNDS.COM |
32
| NOTES TO THE FINANCIAL STATEMENTS |
As of October 31, 2021, the Fund did not defer, on a tax basis, any late-year ordinary losses. Late-year ordinary losses are net ordinary losses incurred after December 31, 2020, but within the taxable year, that are deemed to arise on the first day of the Fund’s next taxable year.
During fiscal years 2021 and 2020, the tax character of distributions paid by the Fund was as follows:
| Year Ended | Year Ended | ||||||||
| October 31, 2021 | October 31, 2020 | ||||||||
Ordinary income(1) | $ | 990,650 | $ | 1,715,695 | |||||
| Long-term capital gains | 6,349,146 | 10,129,860 | |||||||
| Total distributions | $ | 7,339,796 | $ | 11,845,555 | |||||
(1) Ordinary income includes short-term capital gains. |
9). LIBOR TRANSITION
The Fund invests in financial instruments with payment obligations, financing terms, hedging strategies, or investment values based on, among other floating rates, the London Interbank Offered Rate (“LIBOR”). Determined by the ICE Benchmark Administration, LIBOR is an average interest rate that banks charge one another for the use of short-term money. In 2017, the United Kingdom’s Financial Conduct Authority (the “FCA”), which regulates LIBOR, announced plans to phase out the use of LIBOR by the end of 2021. The FCA and ICE Benchmark Administrator have since announced that most LIBOR settings will no longer be published after December 31, 2021, and a majority of U.S. dollar LIBOR settings will cease publication after June 30, 2023. The U.S. Federal Reserve has begun publishing the Secured Overnight Financing Rate (SOFR), which is intended to replace the U.S. dollar LIBOR. Other regulators and industry groups around the world have announced or begun publishing proposed alternative reference rates for other currencies, but global consensus is lacking, and the process for amending many existing contracts or instruments to transition away from LIBOR remains unclear. Uncertainty related to the liquidity impact of the change in reference rates and how to appropriately adjust these rates at the time of transition may lead to increased volatility and illiquidity in markets tied to LIBOR, reduce the value of LIBOR-related instruments, and reduce the effectiveness of hedging strategies, which could adversely affect the Fund’s performance. Moreover, the risks associated with this discontinuation and transition could be exacerbated if the work necessary to effect an orderly transition to an alternative reference rate is not completed in a timely manner. Accordingly, it is difficult to predict the full impact of the transition away from LIBOR on the Fund until new reference rates and fallbacks for both legacy and new instruments and contracts are commercially accepted and market practices become settled.
10). EVENTS SUBSEQUENT TO YEAR END
Management has evaluated the Fund’s related events and transactions that occurred subsequent to October 31, 2021, through the date of issuance of the Fund’s financial statements. Other than as disclosed below, management has determined that there were no subsequent events requiring recognition or disclosure in the financial statements.
On December 7, 2021, capital gains were declared and paid to shareholders of record on December 6, 2021, as follows:
Long-term | Short-term | ||
| Investor Class | $1.10487 | $0.00524 | |
| Institutional Class | $1.03848 | $0.00491 |
| HENNESSY FUNDS | 1-800-966-4354 |
33
Report of Independent Registered Public
Accounting Firm
To the Board of Trustees of Hennessy Funds Trust
and the shareholders of the Hennessy Equity and Income Fund
Novato, CA
Opinion on the Financial Statements
We have audited the accompanying statement of assets and liabilities of the Hennessy Equity and Income Fund (the “Fund”), a series of Hennessy Funds Trust, including the schedule of investments, as of October 31, 2021, the related statement of operations for the year then ended, the statements of changes in net assets for each of the two years in the period then ended, financial highlights for each of the five years in the period then ended, and the related notes (collectively referred to as the “financial statements”). In our opinion, the financial statements present fairly, in all material respects, the financial position of the Fund as of October 31, 2021, the results of its operations for the year then ended, the changes in its net assets for each of the two years in the period then ended, and the financial highlights for each of the five years in the period then ended, in conformity with accounting principles generally accepted in the United States of America.
Basis for Opinion
These financial statements are the responsibility of the Fund’s management. Our responsibility is to express an opinion on the Fund’s financial statements based on our audits. We are a public accounting firm registered with the Public Company Accounting Oversight Board (United States) (“PCAOB”) and are required to be independent with respect to the Fund in accordance with the U.S. federal securities laws and the applicable rules and regulations of the Securities and Exchange Commission and the PCAOB. We have served as the auditor of one or more of the funds in the Trust since 2002.
We conducted our audits in accordance with the standards of the PCAOB. Those standards require that we plan and perform the audit to obtain reasonable assurance about whether the financial statements are free of material misstatement, whether due to error or fraud. The Fund is not required to have, nor were we engaged to perform, an audit of its internal control over financial reporting. As part of our audits we are required to obtain an understanding of internal control over financial reporting, but not for the purpose of expressing an opinion on the effectiveness of the Fund’s internal control over financial reporting. Accordingly, we express no such opinion.
Our audits included performing procedures to assess the risks of material misstatement of the financial statements, whether due to error or fraud, and performing procedures that respond to those risks. Such procedures included examining, on a test basis, evidence regarding the amounts and disclosures in the financial statements. Our audits also included evaluating the accounting principles used and significant estimates made by management, as well as evaluating the overall presentation of the financial statements. Our procedures included confirmation of securities owned as of October 31, 2021 by correspondence with the custodian. We believe that our audits provide a reasonable basis for our opinion.
| |
| TAIT, WELLER & BAKER LLP |
Philadelphia, Pennsylvania
December 22, 2021
| WWW.HENNESSYFUNDS.COM |
34
| REPORT OF INDEPENDENT REGISTERED PUBLIC ACCOUNTING FIRM/TRUSTEES AND OFFICERS |
Trustees and Officers of the Fund (Unaudited)
The business and affairs of the Funds are managed under the direction of the Board of Trustees of the Trust, and the Board of Trustees elects the officers of the Trust. From time to time, the Board of Trustees also has appointed advisers to the Board of Trustees (“Advisers”) with the intention of having qualified individuals serve in an advisory capacity to garner experience in the mutual fund and asset management industry and be considered as potential Trustees in the future. There are currently two Advisers, Brian Alexander and Doug Franklin. As Advisers, Mr. Alexander and Mr. Franklin attend meetings of the Board of Trustees and act as non-voting participants. Information pertaining to the Trustees, Advisers, and the officers of the Trust is set forth below. The Trustees and officers serve until their successors are duly elected and qualified or until their earlier death, resignation, or removal. Each Trustee oversees all 16 Hennessy Funds. Unless otherwise indicated, the address of all persons listed below is 7250 Redwood Boulevard, Suite 200, Novato, CA 94945. The Fund’s Statement of Additional Information includes more information about the persons listed below and is available without charge by calling 1-800-966-4354 or by visiting www.hennessyfunds.com.
| Other | |||
| Directorships | |||
| Held Outside | |||
| Name, Age, | of Fund | ||
| and Position Held | Start Date | Principal Occupation(s) | Complex During |
with the Trust | of Service | During Past Five Years | Past Five Years |
| Disinterested Trustees and Advisers | |||
| J. Dennis DeSousa | January 1996 | Mr. DeSousa is a real estate investor. | None. |
| 85 | |||
| Trustee | |||
| Robert T. Doyle | January 1996 | Mr. Doyle has been the Sheriff of | None. |
| 74 | Marin County, California since 1996. | ||
| Trustee | |||
| Claire Garvie | December 2015 | Ms. Garvie is a founder of Kiosk and | None. |
| 47 | as an Adviser | has served as its Chief Operating | |
| Trustee | to the Board | Officer since 2004. Kiosk is a full- | |
| and | service marketing agency with | ||
| December 2021 | offices in the San Francisco Bay Area, | ||
| as a Trustee | Toronto, and Liverpool, UK. | ||
| Gerald P. Richardson | May 2004 | Mr. Richardson is an independent | None. |
| 76 | consultant in the securities industry. | ||
| Trustee |
| HENNESSY FUNDS | 1-800-966-4354 |
35
| Other | |||
| Directorships | |||
| Held Outside | |||
| Name, Age, | of Fund | ||
| and Position Held | Start Date | Principal Occupation(s) | Complex During |
with the Trust | of Service | During Past Five Years | Past Five Years |
| Brian Alexander | March 2015 | Mr. Alexander has worked for the | None. |
| 40 | Sutter Health organization since | ||
| Adviser to the Board | 2011 in various positions. He has | ||
| served as the Chief Executive Officer | |||
| of the Sutter Roseville Medical | |||
| Center since 2018. From 2016 through | |||
| 2018, he served as the Vice President | |||
| of Strategy for the Sutter Health Valley | |||
| Area, which includes 11 hospitals, | |||
| 13 ambulatory surgery centers, | |||
| 16,000 employees, and 1,900 physicians. | |||
| From 2013 through 2016, Mr. Alexander | |||
| served as Sutter Novato Community | |||
| Hospital’s Chief Administrative Officer. | |||
| Doug Franklin | March 2016 | Mr. Franklin is a retired insurance | None. |
| 57 | industry executive. From 1987 | ||
| Adviser to the Board | through 2015, he was employed | ||
| by the Allianz-Fireman’s Fund | |||
| Insurance Company in various | |||
| positions, including as its Chief | |||
| Actuary and Chief Risk Officer. | |||
Interested Trustee(1) | |||
| Neil J. Hennessy | January 1996 as | Mr. Hennessy has been employed | Hennessy |
| 65 | a Trustee and | by Hennessy Advisors, Inc. since | Advisors, Inc. |
| Chairman of the Board, | June 2008 as | 1989 and currently serves as its | |
| Chief Market Strategist, | an officer | Chairman and Chief Executive Officer. | |
| Portfolio Manager, | |||
| and President |
| Name, Age, | ||
| and Position Held | Start Date | Principal Occupation(s) |
with the Trust | of Service | During Past Five Years |
| Officers | ||
| Teresa M. Nilsen | January 1996 | Ms. Nilsen has been employed by Hennessy Advisors, Inc. |
| 55 | since 1989 and currently serves as its President and Chief | |
| Executive Vice President | Operating Officer. | |
| and Treasurer | ||
| Daniel B. Steadman | March 2000 | Mr. Steadman has been employed by Hennessy Advisors, Inc. |
| 65 | since 2000 and currently serves as its Executive Vice President. | |
| Executive Vice President | ||
| and Secretary | ||
| Brian Carlson | December 2013 | Mr. Carlson has been employed by Hennessy Advisors, Inc. |
| 49 | since December 2013 and currently serves as its Chief | |
| Senior Vice President | Compliance Officer and Senior Vice President. | |
| and Head of Distribution |
| WWW.HENNESSYFUNDS.COM |
36
| TRUSTEES AND OFFICERS OF THE FUND |
| Name, Age, | ||
| and Position Held | Start Date | Principal Occupation(s) |
with the Trust | of Service | During Past Five Years |
Jennifer Cheskiewicz(2) | June 2013 | Ms. Cheskiewicz has been employed by Hennessy Advisors, Inc. |
| 44 | as its General Counsel since June 2013. | |
| Senior Vice President and | ||
| Chief Compliance Officer | ||
David Ellison(3) | October 2012 | Mr. Ellison has been employed by Hennessy Advisors, Inc. since |
| 63 | October 2012. He has served as a Portfolio Manager of the | |
| Senior Vice President | Hennessy Large Cap Financial Fund and the Hennessy Small | |
| and Portfolio Manager | Cap Financial Fund since their inception. Mr. Ellison also served | |
| as a Portfolio Manager of the Hennessy Technology Fund from | ||
| its inception until February 2017. Mr. Ellison served as Director, | ||
| CIO, and President of FBR Fund Advisers, Inc. from December | ||
| 1999 to October 2012. | ||
Ryan Kelley(4) | March 2013 | Mr. Kelley has been employed by Hennessy Advisors, Inc. since |
| 49 | October 2012. He has served as Chief Investment Officer of the | |
| Chief Investment Officer, | Hennessy Funds since March 2021 and has served as a Portfolio | |
| Senior Vice President, | Manager of the Hennessy Gas Utility Fund, the Hennessy Large | |
| and Portfolio Manager | Cap Financial Fund, and the Hennessy Small Cap Financial Fund | |
| since October 2014. Mr. Kelley served as Co-Portfolio Manager | ||
| of these same funds from March 2013 through September | ||
| 2014 and as a Portfolio Analyst for the Hennessy Funds from | ||
| October 2012 through February 2013. He has also served as a | ||
| Portfolio Manager of the Hennessy Cornerstone Growth Fund, | ||
| the Hennessy Cornerstone Mid Cap 30 Fund, the Hennessy | ||
| Cornerstone Large Growth Fund, and the Hennessy | ||
| Cornerstone Value Fund since February 2017 and as a Portfolio | ||
| Manager of the Hennessy Total Return Fund, the Hennessy | ||
| Balanced Fund, and the Hennessy Technology Fund since May | ||
| 2018. He served as Co-Portfolio Manager of the Hennessy | ||
| Technology Fund from February 2017 until May 2018. Mr. Kelley | ||
| served as Portfolio Manager of FBR Fund Advisers, Inc. from | ||
| January 2008 to October 2012. | ||
L. Joshua Wein(4) | September 2018 | Mr. Wein has been employed by Hennessy Advisors, Inc. since |
| 48 | 2018. He has served as Co-Portfolio Manager of the Hennessy | |
| Vice President and | Cornerstone Growth Fund, the Hennessy Cornerstone | |
| Co-Portfolio Manager | Mid Cap 30 Fund, the Hennessy Cornerstone Large Growth | |
| Fund, the Hennessy Cornerstone Value Fund, Hennessy Total | ||
| Return Fund, the Hennessy Balanced Fund, the Hennessy Gas | ||
| Utility Fund, and the Hennessy Technology Fund since February | ||
| 2019. He served as a Senior Analyst of these same funds from | ||
| September 2018 through February 2019. Mr. Wein served as | ||
| Director of Alternative Investments and Co-Portfolio Manager | ||
| at Sterling Capital Management from 2008 to 2018. |
_______________
(1) | Mr. Hennessy is considered an “interested person,” as defined in the Investment Company Act of 1940, as amended, because he is an officer of the Trust. |
(2) | The address of this officer is 4800 Bee Caves Road, Suite 100, Austin, TX 78746. |
(3) | The address of this officer is 101 Federal Street, Suite 1615B, Boston, MA 02110. |
(4) | The address of this officer is 1340 Environ Way, Chapel Hill, NC 27517. |
| HENNESSY FUNDS | 1-800-966-4354 |
37
Expense Example (Unaudited)
October 31, 2021
As a shareholder of the Fund, you incur ongoing costs, including management fees, service fees, and other Fund expenses. This Example is intended to help you understand your ongoing costs (in dollars) of investing in the Fund and to compare these costs with the ongoing costs of investing in other mutual funds. The Example is based on an investment of $1,000 invested at the beginning of the period and held for the entire period from May 1, 2021, through October 31, 2021.
Actual Expenses
In the table below, the first line under each of the “Investor Class” and “Institutional Class” headings provides information about actual account values and actual expenses for each share class. You may use this information, together with the amount you invested, to estimate the expenses that you paid over the period. Simply divide your account value by $1,000 (for example, an $8,600 account value divided by $1,000 = 8.6), then multiply the result by the number in the first line under the heading “Expenses Paid During Period” to estimate the expenses you paid on your account during this period. Although the Fund charges no sales loads or transaction fees, you will be assessed fees for outgoing wire transfers, returned checks, and stop payment orders at prevailing rates charged by U.S. Bank Global Fund Services, the Fund’s transfer agent. If you request that a redemption be made by wire transfer, the Fund’s transfer agent charges a $15 fee. IRAs are charged a $15 annual maintenance fee (up to $30 maximum per shareholder for shareholders with multiple IRAs). The examples below include, but are not limited to, management, shareholder servicing, accounting, custody, and transfer agent fees. However, the examples below do not include portfolio trading commissions and related expenses.
Hypothetical Example for Comparison Purposes
In the table below, the second line under each of the “Investor Class” and “Institutional Class” headings provides information about hypothetical account values and hypothetical expenses based on the Fund’s actual expense ratio for each share class and an assumed rate of return of 5% per year before expenses, which is not the Fund’s actual return for such share class. The hypothetical account values and expenses may not be used to estimate the actual ending account balance or expenses you paid for the period. You may use this information to compare the ongoing costs of investing in the Fund and other funds. To do so, compare these 5% hypothetical examples with the 5% hypothetical examples that appear in the shareholder reports of the other funds. Please note that the expenses shown in the table are meant to highlight your ongoing costs only. Therefore, the second lines under “Investor Class” and “Institutional Class” are useful in comparing ongoing costs only and will not help you determine the relative total costs of owning different funds.
| WWW.HENNESSYFUNDS.COM |
38
| EXPENSE EXAMPLE |
| Expenses Paid | |||
| Beginning | Ending | During Period(1) | |
| Account Value | Account Value | May 1, 2021 – | |
May 1, 2021 | October 31, 2021 | October 31, 2021 | |
| Investor Class | |||
| Actual | $1,000.00 | $1,030.80 | $7.52 |
| Hypothetical (5% return before expenses) | $1,000.00 | $1,017.80 | $7.48 |
| Institutional Class | |||
| Actual | $1,000.00 | $1,032.80 | $5.74 |
| Hypothetical (5% return before expenses) | $1,000.00 | $1,019.56 | $5.70 |
(1) | Expenses are equal to the Fund’s annualized expense ratio of 1.47% for Investor Class shares or 1.12% for Institutional Class shares, as applicable, multiplied by the average account value over the period, multiplied by 184/365 days (to reflect the half-year period). |
| HENNESSY FUNDS | 1-800-966-4354 |
39
How to Obtain a Copy of the Fund’s Proxy
Voting Policy and Proxy Voting Records
A description of the policies and procedures the Fund uses to determine how to vote proxies relating to portfolio securities is available without charge (1) by calling 1-800-966-4354, (2) on the Hennessy Funds’ website at www.hennessyfunds.com/proxy-voting/voting-policy, or (3) on the U.S. Securities and Exchange Commission’s (the “SEC”) website at www.sec.gov. The Fund’s proxy voting record is available without charge on both the Hennessy Funds’ website at www.hennessyfunds.com/proxy-voting/voting-record and the SEC’s website at www.sec.gov no later than August 31 for the prior 12 months ending June 30.
Availability of Quarterly Portfolio Schedule
The Fund files a complete schedule of portfolio holdings with the SEC for the first and third quarters of each fiscal year as an exhibit to its reports on Form N-PORT. The Fund’s Form N-PORT reports are available on the SEC’s website at www.sec.gov or on request by calling 1-800-966-4354.
Federal Tax Distribution Information (Unaudited)
For fiscal year 2021, certain dividends paid by the Fund may be subject to a maximum tax rate of 23.8%, as provided for by the Jobs and Growth Tax Relief Reconciliation Act of 2003. The percentage of dividends declared from ordinary income designated as qualified dividend income was 100.00%.
For corporate shareholders, the percent of ordinary income distributions that qualified for the corporate dividends received deduction for fiscal year 2021 was 100.00%.
The percentage of taxable ordinary income distributions that were designated as short-term capital gain distributions under Section 871(k)(2)(C) of the Internal Revenue Code of 1986, as amended, for the Fund was 0.00%.
Important Notice Regarding Delivery
of Shareholder Documents
To help keep the Fund’s costs as low as possible, we generally deliver a single copy of shareholder reports, proxy statements, and prospectuses to shareholders who share an address and have the same last name. This process does not apply to account statements. You may request an individual copy of a shareholder document at any time. If you would like to receive separate mailings of shareholder documents, please call U.S. Bank Global Fund Services at 1-800-261-6950 or 1-414-765-4124, and individual delivery will begin within 30 days of your request. If your account is held through a financial institution or other intermediary, please contact such intermediary directly to request individual delivery.
Electronic Delivery
As permitted by SEC regulations, the Fund’s shareholder reports are made available on a website, and unless you sign up for eDelivery or elect to receive paper copies as detailed below, you will be notified by mail each time a report is posted and provided with a website link to access the report.
The Fund also offers shareholders the option to receive all notices, account statements, prospectuses, tax forms, and shareholder reports online. To sign up for eDelivery or change your delivery preference, please visit www.hennessyfunds.com/account.
To elect to receive paper copies of all future reports free of charge, please call U.S. Bank Global Fund Services at 1-800-261-6950 or 1-414-765-4124.
Subscribe to receive our team’s unique market and sector insights delivered to your inbox
www.hennessyfunds.com/subscribe
Follow us on social media
| | |
| WWW.HENNESSYFUNDS.COM |
40
| PROXY VOTING — PRIVACY POLICY |
Liquidity Risk Management Program
In accordance with Rule 22e-4 under the Investment Company Act of 1940, as amended (the “Liquidity Rule”), we have adopted and implemented a liquidity risk management program (the “Liquidity Program”). The purpose of the Liquidity Program is to assess and manage the Fund’s liquidity risk, which is the risk that the Fund would not be able to meet requests to redeem Fund shares without significant dilution of the remaining shareholders’ interests in the Fund. The Board of Trustees of the Fund (the “Board”) designated a committee comprising representatives of Hennessy Advisors, Inc., the investment adviser to the Fund, as the administrator of the Liquidity Program (the “Program Administrator”).
The Program Administrator provided a written report regarding the Liquidity Program to the Board in advance of its meeting on June 2, 2021. The report covered the period from June 1, 2020, through May 31, 2021. The report addressed the operation of the Liquidity Program, assessed the adequacy and effectiveness of its implementation, and described any material changes to the Liquidity Program during the review period. The Trust’s chief compliance officer presented the report to the Board at the meeting and provided additional information regarding the Liquidity Program. The Board reviewed the Liquidity Program and considered, among other items, the following:
| 1. | The Program Administrator reviewed daily historical net redemption activity during the review period and during prior periods with higher-than-average redemption activity and concluded that the Fund has historically been able to meet requests to redeem Fund shares without significant dilution to the Fund’s remaining shareholders, and the Program Administrator expects the Fund to be able to continue to do so in the future during both normal and reasonably foreseeable stressed conditions. | |
| 2. | The Fund holds assets that are highly liquid investments and is therefore not required to establish a highly liquid investment minimum for the Fund or adopt policies and procedures for responding to a highly liquid investment minimum shortfall. | |
| 3. | The Program Administrator did not make any material changes to the Liquidity Program during the review period and did not recommend any changes to the Liquidity Program or the model inputs used to determine the liquidity classification of each security held by the Fund. | |
| 4. | The Program Administrator concluded that the Liquidity Program was reasonably designed to assess and manage the Fund’s liquidity risk, complies with the requirements of the Liquidity Rule, and was operating as intended during the review period. |
Privacy Policy
We collect the following personal information about you:
| 1. | Information we receive from you in applications or other forms, correspondence, or conversations, including, but not limited to, your name, address, phone number, social security number, assets, income, and date of birth; | |
| 2. | Information about your transactions with us, our affiliates, or others, including, but not limited to, your account number and balance, payments history, parties to transactions, cost basis information, and other financial information; and |
| HENNESSY FUNDS | 1-800-966-4354 |
41
| 3. | Other personal information we collect from various sources, even if you have not entered into a prior transaction with us, including the following: |
| • | Name, alias, address, unique personal identifier, online identifier, IP address, email address, telephone number, account name, and other similar identifiers; | |
| • | Age and marital status; | |
| • | Commercial information, including records of products purchased; | |
| • | Browsing history, search history, and information on interaction with our website; | |
| • | Geolocation data; | |
| • | Employment and employment history, educational history, financial information, and purchasing and consuming histories or tendencies; and | |
| • | Inferences drawn from the above-listed information to create a profile about your preferences, characteristics, predispositions, and behavior. |
We collect this information directly from you, indirectly in the course of providing services to you, directly and indirectly from your activity on our website, from broker dealers, marketing agencies, and other third parties that interact with us in connection with the services we perform and products we offer, and from anonymized and aggregated consumer information.
We use this information to fulfill the reason you provided the information to us, to provide you with other relevant products that you request from us, to provide you with information about products that may interest you, to improve our website or present our website’s contents to you, and as otherwise described to you when collecting your personal information.
We do not disclose any personal information to unaffiliated third parties, except as permitted by law. We may disclose your personal information to our affiliates, vendors, and service providers for a business purpose. For example, we are permitted by law to disclose all of the information we collect, as described above, to our transfer agent to process your transactions. When disclosing your personal information to third parties, we enter into a contract with each third party describing the purpose of such disclosure and requiring that such personal information be kept confidential and not used for any purpose except to perform the services contracted or respond to regulatory or law enforcement requests.
Furthermore, we restrict access to your personal information to those persons who require such information to provide products or services to you. As a result, we do not provide a means for opting out of our limited sharing of your information. We maintain physical, electronic, and procedural safeguards that comply with federal standards to guard your personal information.
If you hold shares of the Funds through a financial intermediary, including, but not limited to, a broker-dealer, bank, or trust company, the privacy policy of your financial intermediary governs how your personal information is shared with unaffiliated third parties.
Supplemental Privacy Notice for Residents of California
The California Consumer Privacy Act of 2018 (the “CCPA”) provides you, as a California resident, with certain additional rights relating to your personal information.
| WWW.HENNESSYFUNDS.COM |
42
| PRIVACY POLICY |
Under the CCPA, you have the right to request that we disclose to you the categories of personal information we have collected about you over the past 12 months, the categories of sources of such information, our business purpose for collecting the information, the categories of third parties, if any, with whom we shared the information, and the specific information we have collected about you. You also have the right to request that we delete any of your personal information, and, unless an exception applies, we will delete such information upon receiving and confirming your request. To make a request, call us at 1-800-966-4354, email us at privacy@hennessyfunds.com, or go to www.hennessyfunds.com/contact. We will not discriminate against you for exercising your rights under the CCPA. Further, we will not collect additional categories of your personal information or use the personal information we collected for materially different, unrelated, or incompatible purposes without providing you notice.
| HENNESSY FUNDS | 1-800-966-4354 |
43
(This Page Intentionally Left Blank.)
For information, questions, or assistance, please call
The Hennessy Funds
1-800-966-4354 or 1-415-899-1555
INVESTMENT ADVISOR
Hennessy Advisors, Inc.
7250 Redwood Boulevard, Suite 200
Novato, California 94945
ADMINISTRATOR,
TRANSFER AGENT,
DIVIDEND PAYING AGENT, &
SHAREHOLDER SERVICING AGENT
U.S. Bancorp Fund Services, LLC
d/b/a U.S. Bank Global Fund Services
P.O. Box 701
Milwaukee, Wisconsin 53201-0701
CUSTODIAN
U.S. Bank N.A.
Custody Operations
1555 North River Center Drive, Suite 302
Milwaukee, Wisconsin 53212
TRUSTEES
Neil J. Hennessy
Robert T. Doyle
J. Dennis DeSousa
Claire Garvie
Gerald P. Richardson
COUNSEL
Foley & Lardner LLP
777 East Wisconsin Avenue
Milwaukee, Wisconsin 53202-5306
INDEPENDENT REGISTERED
PUBLIC ACCOUNTING FIRM
Tait, Weller & Baker LLP
Two Liberty Place
50 South 16th Street, Suite 2900
Philadelphia, Pennsylvania 19102-2529
DISTRIBUTOR
Quasar Distributors, LLC
111 East Kilbourn Avenue, Suite 2200
Milwaukee, Wisconsin 53202
www.hennessyfunds.com | 1-800-966-4354
This report has been prepared for shareholders and may be distributed to
others only if preceded or accompanied by a current prospectus.
ANNUAL REPORT
OCTOBER 31, 2021
HENNESSY BALANCED FUND
Investor Class HBFBX
www.hennessyfunds.com | 1-800-966-4354
(This Page Intentionally Left Blank.)
Contents
| Letter to Shareholders | 2 |
| Performance Overview | 4 |
| Financial Statements | |
| Schedule of Investments | 6 |
| Statement of Assets and Liabilities | 9 |
| Statement of Operations | 10 |
| Statements of Changes in Net Assets | 11 |
| Financial Highlights | 12 |
| Notes to the Financial Statements | 14 |
| Report of Independent Registered Public Accounting Firm | 21 |
| Trustees and Officers of the Fund | 22 |
| Expense Example | 25 |
| Proxy Voting Policy and Proxy Voting Records | 26 |
| Availability of Quarterly Portfolio Schedule | 26 |
| Federal Tax Distribution Information | 26 |
| Important Notice Regarding Delivery of Shareholder Documents | 26 |
| Electronic Delivery | 26 |
| Liquidity Risk Management Program | 27 |
| Privacy Policy | 27 |
| HENNESSY FUNDS | 1-800-966-4354 |
December 2021
Dear Hennessy Funds Shareholder:
What a year this has been. While it doesn’t feel that we are out of the “pandemic” phase of the coronavirus crisis, we look forward to a day when we will eventually see fewer cases and potentially less severe variants. We feel extremely grateful to the many healthcare workers who have continued to work tirelessly during the recent surge. As we move through the next year, we hope that new U.S. cases will decline and that many other parts of the world will see improvements as well.
What a year this has been! As measured by the total return of the S&P 500® Index, as of October 31, 2021, the market was up 24.04% calendar year to date. This comes in the wake of a tumultuous 2020 in which the market plunged in the beginning of the pandemic and recovered dramatically to end the year up 18.40%. Interestingly, 18% appears to be a repeating number in the past dozen years. From the low point of the Financial Crisis (March 9, 2009) to the high point reached just prior to the COVID-19 pandemic (February 12, 2020), the S&P 500® Index was up 18.27% per year. We are well aware that past results are not predictive of the future, and we find ourselves naturally skeptical of such strong returns. But, as shown in the chart below, we find that the most common annual total returns of the market over the past 102 years range between 20% and 30% with the second most common being between 10% and 20%:
Source: Bloomberg L.P.
We will say it again, after showing a chart like the one above: Past results are not predictive of the future. Instead, we look at where we are right now – in the economy, in the market, in the business cycle – to reflect on where we have come from and where we may be going. U.S. GDP is strong and growing, interest rates remain low, and earnings growth and profitability remain robust. We believe stocks are trading at reasonable valuations when viewed as a whole, with the S&P 500® Index at 21.0x estimated earnings for 2022. Furthermore, we believe corporate balance sheets are healthy, with high levels of excess cash, which could support growth, increases in dividends, more share buybacks, and future acquisitions. Uncertainty and volatility can manifest at any time in the stock market, and the current market is no different. Investors have questions about inflation, worldwide supply chain issues, and what could drive the next boost in earnings. While these concerns are warranted, we continue to believe that overall the positives outweigh the negatives, and here at Hennessy we continue to see opportunity in the market and in our Funds.
| WWW.HENNESSYFUNDS.COM |
2
| LETTER TO SHAREHOLDERS |
What a (fiscal) year this has been!!! For our fiscal year ended October 31, 2021, the S&P 500® Index rose 42.91% on a total return basis, setting a new all-time high on the final day of the period. Except for a short 21-trading-day period that began on September 2 during which the market fell 5.13% only to rebound to new highs just 13 trading days later, the market has been on a continuous march higher. We saw a dramatic shift in market leadership as many of the sectors that underperformed during our last fiscal year soared in fiscal year 2021. Small-caps beat mid-caps, which in turn beat large-caps. The Energy and Financials sectors skyrocketed during the 12-month period, as reflected by the S&P 500® Energy Sector’s total return of 111.29% and the Russell 1000® Index Financials’ total return of 70.87%. Both of these sectors were among the worst performing in our fiscal year 2020, so a bounce back in our fiscal year 2021, while not a foregone conclusion, was a distinct possibility.
Overall, we are pleased with the performance of our mutual funds during the fiscal year. On an absolute basis, each of our 16 Funds achieved total returns greater than 10% and seven outperformed their primary benchmark. Ten of our 11 domestic equity-only Funds outperformed the S&P 500® Index and posted total returns of 45% or higher. Our four best-performing funds were concentrated in the Energy and Financials sectors. While some of our Funds certainly benefited from being in the “right” sector at the “right” time, we also believe this was a favorable period for our investment style of high-conviction investing and concentrated portfolio construction.
What will the coming year bring? As mentioned in our last shareholder letter (June 2021), we understand that even the greatest bull markets experience corrections along the way, and the last time the S&P 500® Index dropped over 10% was in February/March of 2020. Whether or not a correction occurs sooner or later, we believe the market as a whole has more room to run. We see many factors that could drive the market higher from here: strong GDP growth and increasing corporate earnings, a potentially lower-for-longer interest rate environment, accommodative fiscal and monetary policies, a healthy and robust financial system, low unemployment and solid wage growth, and strong corporate balance sheets with plenty of cash.
Thank you for your interest and for investing with us. We remain committed to managing our portfolios for long-term performance, ever mindful of downside risk. With so many investment options available to you, we are grateful for the trust you put in us and for your continued interest in our family of Funds. If you have any questions or would like to speak with us, please don’t hesitate to call us directly at (800) 966-4354.
Best regards,
| |
| |
| Ryan C. Kelley | |
| Chief Investment Officer |
Past performance does not guarantee future results. To obtain current standardized performance for the Hennessy Funds, visit https://www.hennessyfunds.com/funds/price-performance.
Mutual fund investing involves risk. Principal loss is possible.
Opinions expressed are those of Ryan C. Kelley and are subject to change, are not guaranteed, and should not be considered investment advice.
The Dow Jones Industrial Average and S&P 500® Index are commonly used to measure the performance of U.S. stocks. The S&P 500® Energy Index comprises those companies included in the S&P 500® Index that are classified in the Energy sector. The Russell 1000® Index Financials is a subset of the Russel 1000® Index that measures the performance of securities classified in the Financials sector of the large-capitalization U.S. equity market. The indices are used herein for comparative purposes in accordance with SEC regulations. One cannot invest directly in an index. All returns are shown on a total return basis.
| HENNESSY FUNDS | 1-800-966-4354 |
3
Performance Overview (Unaudited)
CHANGE IN VALUE OF $10,000 INVESTMENT
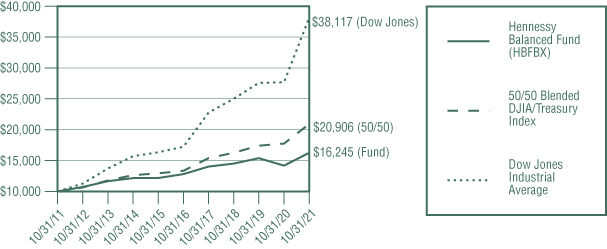
This graph illustrates the performance of an initial investment of $10,000 made in the Fund 10 years ago and assumes the reinvestment of dividends and capital gains.
AVERAGE ANNUAL TOTAL RETURN FOR PERIODS ENDED OCTOBER 31, 2021
| One | Five | Ten | ||
Year | Years | Years | ||
| Hennessy Balanced Fund (HBFBX) | 14.62% | 4.89% | 4.97% | |
| 50/50 Blended DJIA/Treasury Index | 17.83% | 9.42% | 7.65% | |
| Dow Jones Industrial Average | 37.73% | 17.21% | 14.32% |
Expense ratio: 1.89%
Performance data quoted represents past performance; past performance does not guarantee future results. The investment return and principal value of an investment will fluctuate so that an investor’s shares, when redeemed, may be worth more or less than their original cost. The performance table does not reflect the deduction of taxes that a shareholder would pay on Fund distributions or the redemption of Fund shares. Current performance of the Fund may be lower or higher than the performance quoted. Performance data current to the most recent month end may be obtained by visiting www.hennessyfunds.com.
The 50/50 Blended DJIA/Treasury Index consists of 50% common stocks represented by the Dow Jones Industrial Average and 50% short-duration Treasury securities represented by the ICE BofAML 1-Year U.S. Treasury Note Index, which comprises U.S. Treasury securities maturing in approximately one year. The Dow Jones Industrial Average is a price-weighted average of 30 significant stocks traded on the New York Stock Exchange or The Nasdaq Stock Market LLC. One cannot invest directly in an index. These indices are used for comparative purposes in accordance with Securities and Exchange Commission regulations.
The expense ratio presented is from the most recent prospectus. The expense ratio for the current reporting period is available in the Financial Highlights section of this report.
PERFORMANCE NARRATIVE
Portfolio Managers Neil J. Hennessy, Ryan C. Kelley, CFA, and L. Joshua Wein, CAIA
Performance:
For the one-year period ended October 31, 2021, the Hennessy Balanced Fund returned 14.62%, underperforming both the 50/50 Blended DJIA/Treasury Index (the Fund’s
| WWW.HENNESSYFUNDS.COM |
4
| PERFORMANCE OVERVIEW |
primary benchmark) and the Dow Jones Industrial Average, which returned 17.83% and 37.73%, respectively, for the same period.
The Fund underperformed its primary benchmark predominantly as a result of stock selection in the Communication Services and Industrials sectors, with investments in Verizon Communications, Inc. and 3M Company detracting the most from relative performance. In addition, relative fund performance was negatively affected by not owning certain companies in the Financials sector that contributed strongly to the benchmark’s performance, namely The Goldman Sachs Group, Inc. Investments that contributed most to Fund performance included a financial, an energy, and a consumer staples company, namely JPMorgan Chase & Company, Chevron Corporation, and Walgreens Boots Alliance, Inc.
The Fund owns the companies mentioned except Goldman Sachs and JPMorgan.
Portfolio Strategy:
The Fund invests approximately 50% of its assets in the “Dogs of the Dow,” the 10 highest dividend-yielding Dow stocks, and 50% of its assets in U.S. Treasuries. As a result of this “blended” strategy, we expect the Fund to underperform equities in periods when equity markets rise and outperform in periods when equity markets fall. The Fund is designed to allow its investors to gain exposure to the equity market while maintaining a significant percentage of its investment in fixed income securities. We believe the Fund is well positioned for the more conservative investor because the equity portion of the portfolio is invested in what we deem to be high-quality companies, each of which pays a quarterly dividend, while the balance of the Fund is invested in lower-risk, short-duration U.S. Treasuries.
Investment Commentary:
After a tumultuous 2020 and a strong 2021, we believe that the outlook for U.S. stocks remains positive. After a sharp contraction in economic activity as a result of the COVID-19 pandemic, the U.S. economy is growing steadily and demonstrating incredible resilience. We are benefiting from increased employment, rapid wage gains, and robust economic activity. Corporate earnings are on the rise, interest rates remain low, and Federal Reserve policies continue to accommodate a strong economy.
If the market experiences a correction, we would expect our more defensive holdings to perform well relative to the market. The relatively short duration of the 50% weighting of U.S. Treasuries in the portfolio (all less than one year) may allow us the ability to roll into higher-yielding Treasuries in the event interest-rates rise.
_______________
Opinions expressed are those of the Portfolio Managers as of the date written and are subject to change, are not guaranteed, and should not be considered investment advice or an indication of trading intent.
The Fund is non-diversified, meaning it may concentrate its assets in fewer individual holdings than a diversified fund, making it more exposed to individual stock volatility than a diversified fund. The Fund’s formula-based strategy may cause the Fund to buy or sell securities at times when it may not be advantageous. Please see the Fund’s prospectus for a more complete discussion of these and other risks.
References to specific securities should not be considered a recommendation to buy or sell any security. Fund holdings and sector allocations are subject to change. Please refer to the Schedule of Investments included in this report for additional portfolio information.
Earnings growth is not a measure of the Fund’s future performance.
Dividend yield is calculated by dividing a company’s dividends per share by its market price per share.
| HENNESSY FUNDS | 1-800-966-4354 |
5
Financial Statements
Schedule of Investments as of October 31, 2021 |
HENNESSY BALANCED FUND
(% of Net Assets)
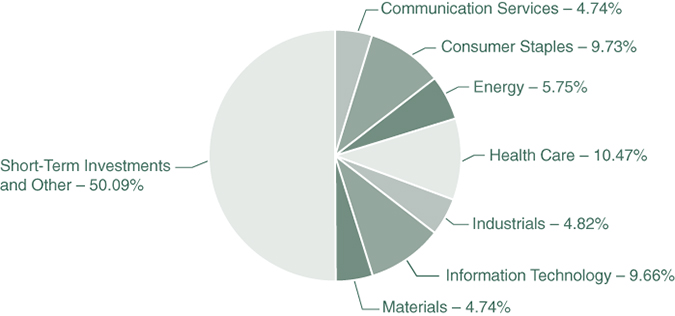
| TOP TEN HOLDINGS (EXCLUDING MONEY MARKET FUNDS) | % NET ASSETS |
| U.S. Treasury Bill, 0.055%, 01/27/2022 | 19.21% |
| U.S. Treasury Bill, 0.070%, 06/16/2022 | 9.60% |
| U.S. Treasury Bill, 0.045%, 12/02/2021 | 7.39% |
| Merck & Co., Inc. | 5.96% |
| Chevron Corp. | 5.75% |
| U.S. Treasury Bill, 0.050%, 11/04/2021 | 5.17% |
| U.S. Treasury Bill, 0.055%, 05/19/2022 | 5.17% |
| Cisco Systems, Inc. | 5.09% |
| The Coca-Cola Co. | 5.02% |
| 3M Co. | 4.82% |
Note: For presentation purposes, the Fund has grouped some of the industry categories. For purposes of categorizing securities for compliance with Section 8(b)(1) of the Investment Company Act of 1940, as amended, the Fund uses more specific industry classifications.
The Global Industry Classification Standard (GICS®) was developed by and is the exclusive property and a service mark of MSCI, Inc. and Standard & Poor’s Financial Services LLC. It has been licensed for use by the Hennessy Funds.
| WWW.HENNESSYFUNDS.COM |
6
| SCHEDULE OF INVESTMENTS |
| COMMON STOCKS – 49.91% | Number | % of | ||||||||||
| of Shares | Value | Net Assets | ||||||||||
| Communication Services – 4.74% | ||||||||||||
| Verizon Communications, Inc. | 12,100 | $ | 641,179 | 4.74 | % | |||||||
| Consumer Staples – 9.73% | ||||||||||||
| The Coca-Cola Co. | 12,050 | 679,258 | 5.02 | % | ||||||||
| Walgreens Boots Alliance, Inc. | 13,550 | 637,121 | 4.71 | % | ||||||||
| 1,316,379 | 9.73 | % | ||||||||||
| Energy – 5.75% | ||||||||||||
| Chevron Corp. | 6,800 | 778,532 | 5.75 | % | ||||||||
| Health Care – 10.47% | ||||||||||||
| Amgen, Inc. | 2,950 | 610,561 | 4.51 | % | ||||||||
| Merck & Co., Inc. | 9,150 | 805,658 | 5.96 | % | ||||||||
| 1,416,219 | 10.47 | % | ||||||||||
| Industrials – 4.82% | ||||||||||||
| 3M Co. | 3,650 | 652,182 | 4.82 | % | ||||||||
| Information Technology – 9.66% | ||||||||||||
| Cisco Systems, Inc. | 12,300 | 688,431 | 5.09 | % | ||||||||
| International Business Machines Corp. | 4,950 | 619,245 | 4.57 | % | ||||||||
| 1,307,676 | 9.66 | % | ||||||||||
| Materials – 4.74% | ||||||||||||
| Dow, Inc. | 11,450 | 640,857 | 4.74 | % | ||||||||
| Total Common Stocks | ||||||||||||
| (Cost $6,031,694) | 6,753,024 | 49.91 | % | |||||||||
The accompanying notes are an integral part of these financial statements.
| HENNESSY FUNDS | 1-800-966-4354 |
7
| SHORT-TERM INVESTMENTS – 50.36% | Number of Shares/ | % of | ||||||||||
| Par Amount | Value | Net Assets | ||||||||||
| Money Market Funds – 1.60% | ||||||||||||
| First American Government Obligations | ||||||||||||
| Fund, Institutional Class, 0.03% (a) | 216,062 | $ | 216,062 | 1.60 | % | |||||||
| U.S. Treasury Bills – 48.76% | ||||||||||||
| 0.050%, 11/04/2021 (b) | 700,000 | 699,994 | 5.17 | % | ||||||||
| 0.045%, 12/02/2021 (b) | 1,000,000 | 999,914 | 7.39 | % | ||||||||
| 0.055%, 01/27/2022 (b) | 2,600,000 | 2,599,670 | 19.21 | % | ||||||||
| 0.055%, 05/19/2022 (b) | 700,000 | 699,739 | 5.17 | % | ||||||||
| 0.070%, 06/16/2022 (b) | 1,300,000 | 1,299,344 | 9.60 | % | ||||||||
| 0.075%, 07/14/2022 (b) | 300,000 | 299,808 | 2.22 | % | ||||||||
| 6,598,469 | 48.76 | % | ||||||||||
| Total Short-Term Investments | ||||||||||||
| (Cost $6,814,666) | 6,814,531 | 50.36 | % | |||||||||
| Total Investments | ||||||||||||
| (Cost $12,846,360) – 100.27% | 13,567,555 | 100.27 | % | |||||||||
| Liabilities in Excess of Other Assets – (0.27)% | (36,359 | ) | (0.27 | )% | ||||||||
TOTAL NET ASSETS – 100.00% | $ | 13,531,196 | 100.00 | % | ||||||||
Percentages are stated as a percent of net assets.
| (a) | The rate listed is the fund’s seven-day yield as of October 31, 2021. |
| (b) | The rate listed is the discount rate at issue. |
Summary of Fair Value Exposure as of October 31, 2021
The following is a summary of the inputs used to value the Fund’s net assets as of October 31, 2021 (see Note 3 in the accompanying Notes to the Financial Statements):
| Common Stocks | Level 1 | Level 2 | Level 3 | Total | ||||||||||||
| Communication Services | $ | 641,179 | $ | — | $ | — | $ | 641,179 | ||||||||
| Consumer Staples | 1,316,379 | — | — | 1,316,379 | ||||||||||||
| Energy | 778,532 | — | — | 778,532 | ||||||||||||
| Health Care | 1,416,219 | — | — | 1,416,219 | ||||||||||||
| Industrials | 652,182 | — | — | 652,182 | ||||||||||||
| Information Technology | 1,307,676 | — | — | 1,307,676 | ||||||||||||
| Materials | 640,857 | — | — | 640,857 | ||||||||||||
| Total Common Stocks | $ | 6,753,024 | $ | — | $ | — | $ | 6,753,024 | ||||||||
| Short-Term Investments | ||||||||||||||||
| Money Market Funds | $ | 216,062 | $ | — | $ | — | $ | 216,062 | ||||||||
| U.S. Treasury Bills | — | 6,598,469 | — | 6,598,469 | ||||||||||||
| Total Short-Term Investments | $ | 216,062 | $ | 6,598,469 | $ | — | $ | 6,814,531 | ||||||||
| Total Investments | $ | 6,969,086 | $ | 6,598,469 | $ | — | $ | 13,567,555 | ||||||||
The accompanying notes are an integral part of these financial statements.
| WWW.HENNESSYFUNDS.COM |
8
| SCHEDULE OF INVESTMENTS/STATEMENT OF ASSETS AND LIABILITIES |
Financial Statements
Statement of Assets and Liabilities as of October 31, 2021 |
| ASSETS: | ||||
| Investments in securities, at value (cost $12,846,360) | $ | 13,567,555 | ||
| Dividends and interest receivable | 7,749 | |||
| Prepaid expenses and other assets | 7,609 | |||
| Total assets | 13,582,913 | |||
| LIABILITIES: | ||||
| Payable to advisor | 6,898 | |||
| Payable to administrator | 6,751 | |||
| Payable to auditor | 22,556 | |||
| Accrued distribution fees | 2,002 | |||
| Accrued service fees | 1,149 | |||
| Accrued trustees fees | 6,600 | |||
| Accrued expenses and other payables | 5,761 | |||
| Total liabilities | 51,717 | |||
| NET ASSETS | $ | 13,531,196 | ||
| NET ASSETS CONSISTS OF: | ||||
| Capital stock | $ | 12,350,877 | ||
| Total distributable earnings | 1,180,319 | |||
| Total net assets | $ | 13,531,196 | ||
| NET ASSETS: | ||||
| Investor Class | ||||
| Shares authorized (no par value) | Unlimited | |||
| Net assets applicable to outstanding shares | $ | 13,531,196 | ||
| Shares issued and outstanding | 1,092,005 | |||
| Net asset value, offering price, and redemption price per share | $ | 12.39 | ||
The accompanying notes are an integral part of these financial statements.
| HENNESSY FUNDS | 1-800-966-4354 |
9
Financial Statements
Statement of Operations for the year ended October 31, 2021 |
| INVESTMENT INCOME: | ||||
| Dividend income | $ | 252,659 | ||
| Interest income | 16,036 | |||
| Total investment income | 268,695 | |||
| EXPENSES: | ||||
| Investment advisory fees (See Note 5) | 79,894 | |||
| Compliance expense (See Note 5) | 27,448 | |||
| Administration, accounting, custody, and transfer agent fees (See Note 5) | 26,789 | |||
| Audit fees | 22,556 | |||
| Distribution fees – Investor Class (See Note 5) | 19,973 | |||
| Federal and state registration fees | 19,764 | |||
| Trustees’ fees and expenses | 18,494 | |||
| Service fees – Investor Class (See Note 5) | 13,316 | |||
| Sub-transfer agent expenses – Investor Class (See Note 5) | 7,299 | |||
| Reports to shareholders | 5,687 | |||
| Legal fees | 256 | |||
| Interest expense (See Note 7) | 29 | |||
| Other expenses | 4,559 | |||
| Total expenses | 246,064 | |||
| NET INVESTMENT INCOME | $ | 22,631 | ||
| REALIZED AND UNREALIZED GAINS (LOSSES): | ||||
| Net realized gain on investments | $ | 528,693 | ||
| Net change in unrealized appreciation/depreciation on investments | 1,167,646 | |||
| Net gain on investments | 1,696,339 | |||
| NET INCREASE IN NET ASSETS RESULTING FROM OPERATIONS | $ | 1,718,970 | ||
The accompanying notes are an integral part of these financial statements.
| WWW.HENNESSYFUNDS.COM |
10
| STATEMENT OF OPERATIONS/STATEMENTS OF CHANGES IN NET ASSETS |
Financial Statements
| Statements of Changes in Net Assets |
| Year Ended | Year Ended | |||||||
| October 31, 2021 | October 31, 2020 | |||||||
| OPERATIONS: | ||||||||
| Net investment income | $ | 22,631 | $ | 128,595 | ||||
| Net realized gain (loss) on investments | 528,693 | (37,345 | ) | |||||
| Net change in unrealized | ||||||||
| appreciation/depreciation on investments | 1,167,646 | (1,068,334 | ) | |||||
| Net increase (decrease) in net | ||||||||
| assets resulting from operations | 1,718,970 | (977,084 | ) | |||||
| DISTRIBUTIONS TO SHAREHOLDERS: | ||||||||
| Distributable earnings – Investor Class | (35,846 | ) | (623,540 | ) | ||||
| Total distributions | (35,846 | ) | (623,540 | ) | ||||
| CAPITAL SHARE TRANSACTIONS: | ||||||||
| Proceeds from shares subscribed – Investor Class | 1,324,997 | 1,953,092 | ||||||
| Dividends reinvested – Investor Class | 35,297 | 613,858 | ||||||
| Cost of shares redeemed – Investor Class | (1,500,429 | ) | (1,281,653 | ) | ||||
| Net increase (decrease) in net assets derived | ||||||||
| from capital share transactions | (140,135 | ) | 1,285,297 | |||||
| TOTAL INCREASE (DECREASE) IN NET ASSETS | 1,542,989 | (315,327 | ) | |||||
| NET ASSETS: | ||||||||
| Beginning of year | 11,988,207 | 12,303,534 | ||||||
| End of year | $ | 13,531,196 | $ | 11,988,207 | ||||
| CHANGES IN SHARES OUTSTANDING: | ||||||||
| Shares sold – Investor Class | 107,079 | 173,324 | ||||||
| Shares issued to holders as reinvestment | ||||||||
| of dividends – Investor Class | 2,986 | 51,675 | ||||||
| Shares redeemed – Investor Class | (124,203 | ) | (112,932 | ) | ||||
| Net increase (decrease) in shares outstanding | (14,138 | ) | 112,067 | |||||
The accompanying notes are an integral part of these financial statements.
| HENNESSY FUNDS | 1-800-966-4354 |
11
Financial Statements
| Financial Highlights |
For an Investor Class share outstanding throughout each year
PER SHARE DATA:
Net asset value, beginning of year
Income from investment operations:
Net investment income
Net realized and unrealized gains (losses) on investments
Total from investment operations
Less distributions:
Dividends from net investment income
Dividends from net realized gains
Total distributions
Net asset value, end of year
TOTAL RETURN
SUPPLEMENTAL DATA AND RATIOS:
Net assets, end of year (millions)
Ratio of expenses to average net assets
Ratio of net investment income to average net assets
Portfolio turnover rate
(1) | Calculated using the average shares outstanding method. |
The accompanying notes are an integral part of these financial statements.
| WWW.HENNESSYFUNDS.COM |
12
| FINANCIAL HIGHLIGHTS — INVESTOR CLASS |
| Year Ended October 31, | ||||||||||||||||||
| 2021 | 2020 | 2019 | 2018 | 2017 | ||||||||||||||
| $ | 10.84 | $ | 12.38 | $ | 12.34 | $ | 12.88 | $ | 12.68 | |||||||||
| 0.02 | (1) | 0.12 | (1) | 0.13 | (1) | 0.09 | 0.06 | |||||||||||
| 1.56 | (1.04 | ) | 0.59 | 0.33 | 1.09 | |||||||||||||
| 1.58 | (0.92 | ) | 0.72 | 0.42 | 1.15 | |||||||||||||
| (0.03 | ) | (0.12 | ) | (0.13 | ) | (0.08 | ) | (0.05 | ) | |||||||||
| — | (0.50 | ) | (0.55 | ) | (0.88 | ) | (0.90 | ) | ||||||||||
| (0.03 | ) | (0.62 | ) | (0.68 | ) | (0.96 | ) | (0.95 | ) | |||||||||
| $ | 12.39 | $ | 10.84 | $ | 12.38 | $ | 12.34 | $ | 12.88 | |||||||||
| 14.62 | % | -7.84 | % | 6.05 | % | 3.46 | % | 9.56 | % | |||||||||
| $ | 13.53 | $ | 11.99 | $ | 12.30 | $ | 11.62 | $ | 12.24 | |||||||||
| 1.85 | % | 1.89 | % | 1.88 | % | 1.84 | % | 1.82 | % | |||||||||
| 0.17 | % | 1.05 | % | 1.04 | % | 0.70 | % | 0.45 | % | |||||||||
| 31 | % | 42 | % | 52 | % | 21 | % | 31 | % | |||||||||
The accompanying notes are an integral part of these financial statements.
| HENNESSY FUNDS | 1-800-966-4354 |
13
Financial Statements
Notes to the Financial Statements October 31, 2021 |
1). ORGANIZATION
The Hennessy Balanced Fund (the “Fund”) is a series of Hennessy Funds Trust (the “Trust”), which was organized as a Delaware statutory trust on September 17, 1992. The Fund is an open-end management investment company registered under the Investment Company Act of 1940, as amended. The investment objective of the Fund is a combination of capital appreciation and current income. The Fund is a non-diversified fund and offers Investor Class shares.
As an investment company, the Fund follows the investment company accounting and reporting guidance of the Financial Accounting Standards Board (“FASB”) Accounting Standard Codification Topic 946 “Financial Services—Investment Companies.”
2). SIGNIFICANT ACCOUNTING POLICIES
The following is a summary of significant accounting policies consistently followed by the Fund in the preparation of the financial statements. These policies conform to U.S. generally accepted accounting principles (“GAAP”).
| a). | Securities Valuation – All investments in securities are valued in accordance with the Fund’s valuation policies and procedures, as described in Note 3. |
| b). | Federal Income Taxes – The Fund has elected to be taxed as a regulated investment company and intends to distribute substantially all of its taxable income to its shareholders and otherwise comply with the provisions of the Internal Revenue Code of 1986, as amended, applicable to regulated investment companies. As a result, the Fund has made no provision for federal income taxes or excise taxes. Net investment income/loss and realized gains/losses for federal income tax purposes may differ from those reported in the financial statements because of temporary book-basis and tax-basis differences. Temporary differences are primarily the result of the treatment of wash sales for tax reporting purposes. The Fund recognizes interest and penalties related to income tax benefits, if any, in the Statement of Operations as an income tax expense. Distributions from net realized gains for book purposes may include short-term capital gains, which are included as ordinary income to shareholders for tax purposes. The Fund may utilize equalization accounting for tax purposes and designate earnings and profits, including net realized gains distributed to shareholders on redemption of shares, as part of the dividends paid deduction for income tax purposes. |
| Due to inherent differences in the recognition of income, expenses, and realized gains/losses under GAAP and federal income tax regulations, permanent differences between book and tax basis for reporting are identified and appropriately reclassified in the Statement of Assets and Liabilities, as needed. The adjustments for fiscal year 2021 are as follows: |
| Total | |||
| Distributable | |||
Earnings | Capital Stock | ||
| $(12,724) | $12,724 |
| WWW.HENNESSYFUNDS.COM |
14
| NOTES TO THE FINANCIAL STATEMENTS |
| c). | Accounting for Uncertainty in Income Taxes – The Fund has accounting policies regarding recognition and measurement of tax positions taken or expected to be taken on a tax return. The tax returns of the Fund for the prior three fiscal years are open for examination. The Fund has reviewed all open tax years in major tax jurisdictions and concluded that there is no impact on the Fund’s net assets and no tax liability resulting from unrecognized tax benefits relating to uncertain income tax positions taken or expected to be taken on a tax return. The Fund’s major tax jurisdictions are U.S. federal and Delaware. |
| d). | Income and Expenses – Dividend income is recognized on the ex-dividend date or as soon as information is available to the Fund. Interest income, which includes the amortization of premium and accretion of discount, is recognized on an accrual basis. Market discounts, original issue discounts, and market premiums on debt securities are accreted or amortized to interest income over the life of a security with a corresponding increase or decrease, as applicable, in the cost basis of such security using the yield-to-maturity method or, where applicable, the first call date of the security. Other non-cash dividends are recognized as investment income at the fair value of the property received. The Fund is charged for those expenses that are directly attributable to its portfolio, such as advisory, administration, and certain shareholder service fees. |
| e). | Distributions to Shareholders – Dividends from net investment income for the Fund, if any, are declared and paid at the end of each calendar quarter. Distributions of net realized capital gains, if any, are declared and paid annually, usually in December. |
| f). | Security Transactions – Investment and shareholder transactions are recorded on the trade date. The Fund determines the realized gain/loss from an investment transaction by comparing the original cost of the security lot sold with the net sale proceeds. Discounts and premiums on securities purchased are accreted or amortized, respectively, over the life of each such security. |
| g). | Use of Estimates – Preparing financial statements in accordance with GAAP requires management to make estimates and assumptions that affect the reported amounts of assets and liabilities and disclosure of contingent assets and liabilities at the date of the financial statements, as well as the reported change in net assets during the reporting period. Actual results could differ from those estimates. |
| h). | Share Valuation – The net asset value (“NAV”) per share of the Fund is calculated by dividing (i) the total value of the securities held by the Fund, plus cash and other assets, minus all liabilities (including estimated accrued expenses) by (ii) the total number of Fund shares outstanding, rounded to the nearest $0.01. Fund shares are not priced on days the New York Stock Exchange is closed for trading. The offering and redemption price per share for the Fund is equal to the Fund’s NAV per share. |
| i). | Recent Accounting Pronouncements and Regulatory Updates – In October 2020, the Securities and Exchange Commission (“SEC”) adopted new regulations governing the use of derivatives by registered investment companies (“Rule 18f-4”). Rule 18f-4 imposes limits on the amount of derivatives a fund can enter into, eliminates the asset segregation framework currently used by funds to comply with Section 18 of the 1940 Act, and requires funds whose use of derivatives is greater than a limited specified amount to establish and maintain a comprehensive derivatives risk management program and appoint a derivatives risk manager. Funds are required to comply with Rule 18f-4 by August 19, 2022. The impact, if any, that Rule 18f-4 will have on the availability, liquidity, and performance of derivatives is unclear. Management is currently evaluating the potential impact of Rule 18f-4 on the Fund. |
| HENNESSY FUNDS | 1-800-966-4354 |
15
| When fully implemented, Rule 18f-4 may require changes in how the Fund uses derivatives, adversely affect the Fund’s performance, and increase costs related to the Fund’s use of derivatives. | |
| In December 2020, the SEC adopted a new rule providing a framework for fund valuation practices (“Rule 2a-5”). Rule 2a-5 establishes requirements for determining fair value in good faith for purposes of the 1940 Act. Rule 2a-5 permits fund boards to designate certain parties to perform fair value determinations, subject to board oversight and certain other conditions. Rule 2a-5 also defines when market quotations are “readily available” for purposes of the 1940 Act and the threshold for determining whether a fund must fair value a security. In connection with Rule 2a-5, the SEC also adopted related recordkeeping requirements and is rescinding previously issued guidance, including with respect to the role of a board in determining fair value and the accounting and auditing of fund investments. Funds must comply with the rules by September 8, 2022. Management is currently assessing the potential impact of the new rules on the Fund’s financial statements. |
3). SECURITIES VALUATION
The Fund follows its valuation policies and procedures in determining its net asset value and, in preparing these financial statements, the fair value accounting standards that establish an authoritative definition of fair value and set out a hierarchy for measuring fair value. These standards require additional disclosures about the various inputs and valuation techniques used to develop the measurements of fair value and a discussion of changes in valuation techniques and related inputs during the period. These inputs are summarized in the three broad levels listed below:
| Level 1 – | Unadjusted, quoted prices in active markets for identical instruments that the Fund has the ability to access at the date of measurement. | |
| Level 2 – | Other significant observable inputs (including, but not limited to, quoted prices in active markets for similar instruments, quoted prices in markets that are not active for identical or similar instruments, and model-derived valuations in which all significant inputs and significant value drivers are observable in active markets, such as interest rates, prepayment speeds, credit risk curves, default rates, and similar data). | |
| Level 3 – | Significant unobservable inputs (including the Fund’s own assumptions about what market participants would use to price the asset or liability based on the best available information) when observable inputs are unavailable. |
The following is a description of the valuation techniques applied to the Fund’s major categories of assets and liabilities on a recurring basis:
Equity Securities – Equity securities, including common stocks, preferred stocks, exchange-traded funds, closed-end mutual funds, partnerships, rights, and real estate investment trusts, that are traded on a securities exchange for which a last-quoted sales price is readily available generally are valued at the last sales price as reported by the primary exchange on which the securities are listed. Securities listed on The NASDAQ Stock Market (“NASDAQ”) generally are valued at the NASDAQ Official Closing Price, which may differ from the last sales price reported. Securities traded on a securities exchange for which a last-quoted sales price is not readily available generally are valued at the mean between the bid and ask prices. To the extent these securities are actively traded and valuation adjustments are not applied, they are classified in Level 1 of the fair value hierarchy. |
| WWW.HENNESSYFUNDS.COM |
16
| NOTES TO THE FINANCIAL STATEMENTS |
Registered Investment Companies – Investments in open-end registered investment companies, commonly referred to as mutual funds, generally are priced at the ending NAV provided by the applicable mutual fund’s service agent and are classified in Level 1 of the fair value hierarchy. | |
Debt Securities – Debt securities, including corporate bonds, asset-backed securities, mortgage-backed securities, municipal bonds, U.S. Treasuries, and U.S. government agency issues, are generally valued at market on the basis of valuations furnished by an independent pricing service that utilizes both dealer-supplied valuations and formula-based techniques. The pricing service may consider recently executed transactions in securities of the issuer or comparable issuers, market price quotations (where observable), bond spreads, and fundamental data relating to the issuer. In addition, the model may incorporate observable market data, such as reported sales of similar securities, broker quotes, yields, bids, offers, and reference data. Certain securities are valued primarily using dealer quotations. These securities are generally classified in Level 2 of the fair value hierarchy. | |
Short-Term Securities – Short-term equity investments, including money market funds, are valued in the manner specified above for equity securities. Short-term debt investments with an original term to maturity of 60 days or less are valued at amortized cost, which approximates fair market value. If the original term to maturity of a short-term debt investment exceeds 60 days, then the values as of the 61st day prior to maturity are amortized. Amortized cost is not used if its use would be inappropriate due to credit or other impairments of the issuer, in which case the security’s fair value would be determined as described below. Short-term securities are generally classified in Level 1 or Level 2 of the fair value hierarchy depending on the inputs used and market activity levels for specific securities. |
The Board of Trustees of the Fund (the “Board”) has adopted fair value pricing procedures that are followed when a price for a security is not readily available or if a significant event has occurred that indicates the closing price of a security no longer represents the true value of that security. Fair value pricing determinations are made in good faith in accordance with these procedures. There are numerous criteria considered in determining a fair value of a security, such as the trading volume of a security and markets, the values of other similar securities, and news events with direct bearing on a security or markets. Fair value pricing results in an estimated price for a security that reflects the amount the Fund might reasonably expect to receive in a current sale. Depending on the relative significance of the valuation inputs, these securities may be classified in either Level 2 or Level 3 of the fair value hierarchy.
The Board has delegated day-to-day valuation matters to the Valuation and Liquidity Committee comprising representatives from Hennessy Advisors, Inc., the Fund’s investment advisor (the “Advisor”). The function of the Valuation and Liquidity Committee, among other things, is to value securities where current and reliable market quotations are not readily available. All actions taken by the Valuation and Liquidity Committee are reviewed by the Board.
The Fund has performed an analysis of all existing investments to determine the significance and character of all inputs to their fair value determinations. Various inputs are used to determine the value of the Fund’s investments. The inputs or methodology used for valuing securities are not necessarily an indication of the risk associated with investing in those securities. Details related to the fair value hierarchy of the Fund’s securities as of October 31, 2021, are included in the Schedule of Investments.
| HENNESSY FUNDS | 1-800-966-4354 |
17
4). INVESTMENT TRANSACTIONS
Purchases and sales of investment securities (excluding government and short-term investments) for the Fund during fiscal year 2021 were $2,002,249 and $2,594,038, respectively.
There were no purchases or sales/maturities of long-term U.S. government securities for the Fund during fiscal year 2021.
5). INVESTMENT ADVISORY FEE AND OTHER TRANSACTIONS WITH AFFILIATES
The Advisor provides the Fund with investment advisory services under an Investment Advisory Agreement. The Advisor furnishes all investment advice, office space, and facilities and most of the personnel needed by the Fund. As compensation for its services, the Advisor is entitled to a monthly fee from the Fund. The fee is based on the average daily net assets of the Fund at an annual rate of 0.60%. The net investment advisory fees expensed by the Fund during fiscal year 2021 are included in the Statement of Operations.
The Board has approved a Shareholder Servicing Agreement for the Fund, which compensates the Advisor for the non-investment advisory services it provides to the Fund. The Shareholder Servicing Agreement provides for a monthly fee paid to the Advisor at an annual rate of 0.10% of the average daily net assets of the Fund. The shareholder service fees expensed by the Fund during fiscal year 2021 are included in the Statement of Operations.
The Fund has adopted a plan pursuant to Rule 12b-1 under the Investment Company Act of 1940, as amended, that authorizes payments in connection with the distribution of Fund shares at an annual rate of up to 0.25% of the Fund’s average daily net assets. Even though the authorized rate is up to 0.25%, the Fund is currently only using up to 0.15% of its average daily net assets for such purpose. Amounts paid under the plan may be spent on any activities or expenses primarily intended to result in the sale of shares, including, but not limited to, advertising, shareholder account servicing, printing and mailing of prospectuses to other than current shareholders, printing and mailing of sales literature, and compensation for sales and marketing activities or to financial institutions and others, such as dealers and distributors. The distribution fees expensed by the Fund during fiscal year 2021 are included in the Statement of Operations.
The Fund has entered into agreements with various brokers, dealers, and financial intermediaries in connection with the sale of Fund shares. The agreements provide for periodic payments of sub-transfer agent expenses by the Fund to the brokers, dealers, and financial intermediaries for providing certain shareholder maintenance services. These shareholder services include the pre-processing and quality control of new accounts, shareholder correspondence, answering customer inquiries regarding account status, and facilitating shareholder telephone transactions. The sub-transfer agent fees expensed by the Fund during fiscal year 2021 are included in the Statement of Operations.
U.S. Bancorp Fund Services, LLC, d/b/a U.S. Bank Global Fund Services (“Fund Services”) provides the Fund with administrative, accounting, and transfer agent services. As administrator, Fund Services is responsible for activities such as (i) preparing various federal and state regulatory filings, reports, and returns for the Fund, (ii) preparing reports and materials to be supplied to the Board, (iii) monitoring the activities of the Fund’s custodian, transfer agent, and accountants, and (iv) coordinating the preparation and payment of the Fund’s expenses and reviewing the Fund’s expense accruals. U.S. Bank N.A., an affiliate of Fund Services, serves as the Fund’s custodian. The servicing agreements between the Trust, Fund Services, and U.S. Bank N.A. contain a fee schedule that is inclusive of administrative, accounting, custody, and transfer agent fees. The administrative, accounting, custody, and transfer agent fees expensed by the Fund during fiscal year 2021 are included in the Statement of Operations.
| WWW.HENNESSYFUNDS.COM |
18
| NOTES TO THE FINANCIAL STATEMENTS |
Quasar Distributors, LLC (“Quasar”), a wholly owned broker-dealer subsidiary of Foreside Financial Group, LLC (“Foreside”), acts as the Fund’s principal underwriter in a continuous public offering of Fund shares. Effective September 30, 2021, Genstar Capital, a private equity firm specializing in financial and related business service companies, acquired a majority interest in Foreside. The Board approved a new Distribution Agreement to enable Quasar to continue serving as the Fund’s distributor following the change in control of Foreside.
The officers of the Fund are affiliated with the Advisor. With the exception of the Chief Compliance Officer and the Senior Compliance Officer, such officers receive no compensation from the Fund for serving in their respective roles. The Fund, along with the other funds in the Hennessy Funds family (collectively, the “Hennessy Funds”), makes reimbursement payments on an equal basis to the Advisor for a portion of the salary and benefits associated with the office of the Chief Compliance Officer and for all of the salary and benefits associated with the office of the Senior Compliance Officer. The compliance fees expensed by the Fund during fiscal year 2021 are included in the Statement of Operations.
6). GUARANTEES AND INDEMNIFICATIONS
Under the Hennessy Funds’ organizational documents, their officers and trustees are indemnified by the Hennessy Funds against certain liabilities arising out of the performance of their duties to the Hennessy Funds. Additionally, in the normal course of business, the Hennessy Funds enter into contracts with service providers that contain general indemnification clauses. The Fund’s maximum exposure under these arrangements is unknown as this would involve future claims that may be made against the Fund that have not yet occurred. Currently, the Fund expects the risk of loss to be remote.
7). LINE OF CREDIT
The Fund has an uncommitted line of credit with the other Hennessy Funds in the amount of the lesser of (i) $100,000,000 or (ii) 33.33% of each Hennessy Fund’s net assets, or 30% for the Hennessy Gas Utility Fund and 10% for the Fund. The line of credit is intended to provide any necessary short-term financing in connection with shareholder redemptions, subject to certain restrictions. The credit facility is with the Hennessy Funds’ custodian bank, U.S. Bank N.A. Borrowings under this arrangement bear interest at the bank’s prime rate and are secured by all of the Fund’s assets (as to its own borrowings only). During fiscal year 2021, the Fund had an outstanding average daily balance and a weighted average interest rate of $868 and 3.25%, respectively. The interest expensed by the Fund during fiscal year 2021 is included in the Statement of Operations. The maximum amount outstanding for the Fund during fiscal year 2021 was $53,000. As of October 31, 2021, the Fund did not have any borrowings outstanding under the line of credit.
| HENNESSY FUNDS | 1-800-966-4354 |
19
8). FEDERAL TAX INFORMATION
As of October 31, 2021, the components of accumulated earnings (losses) for income tax purposes were as follows:
| Investments | ||||
| Cost of investments for tax purposes | $ | 12,851,955 | ||
| Gross tax unrealized appreciation | $ | 873,298 | ||
| Gross tax unrealized depreciation | (157,698 | ) | ||
| Net tax unrealized appreciation/(depreciation) | $ | 715,600 | ||
| Undistributed ordinary income | $ | 10,636 | ||
| Undistributed long-term capital gains | 454,083 | |||
| Total distributable earnings | $ | 464,719 | ||
| Other accumulated gain/(loss) | $ | — | ||
| Total accumulated gain/(loss) | $ | 1,180,319 | ||
The difference between book-basis unrealized appreciation/depreciation and tax-basis unrealized appreciation/depreciation (as shown above) is attributable primarily to wash sales.
As of October 31, 2021, the Fund had no tax-basis capital losses to offset future capital gains. During fiscal year 2021, the capital losses utilized by the Fund were $27,785.
Capital losses sustained in or after fiscal year 2012 can be carried forward indefinitely, but any such loss retains the character of the original loss and must be utilized prior to any loss incurred before fiscal year 2012. As a result of this ordering rule, capital loss carryforwards incurred prior to fiscal year 2012 may be more likely to expire unused. Capital losses sustained prior to fiscal year 2012 can be carried forward for eight years and can be carried forward as short-term capital losses regardless of the character of the original loss.
As of October 31, 2021, the Fund did not defer, on a tax basis, any late-year ordinary losses. Late-year ordinary losses are net ordinary losses incurred after December 31, 2020, but within the taxable year, that are deemed to arise on the first day of the Fund’s next taxable year.
During fiscal years 2021 and 2020, the tax character of distributions paid by the Fund was as follows:
| Year Ended | Year Ended | ||||||||
| October 31, 2021 | October 31, 2020 | ||||||||
Ordinary income(1) | $ | 35,846 | $ | 154,117 | |||||
| Long-term capital gains | — | 469,423 | |||||||
| Total distributions | $ | 35,846 | $ | 623,540 | |||||
(1) Ordinary income includes short-term capital gains. |
9). EVENTS SUBSEQUENT TO YEAR END
Management has evaluated the Fund’s related events and transactions that occurred subsequent to October 31, 2021, through the date of issuance of the Fund’s financial statements. Other than as disclosed below, management has determined that there were no subsequent events requiring recognition or disclosure in the financial statements.
On December 7, 2021, capital gains were declared and paid to shareholders of record on December 6, 2021, as follows:
Long-term | Short-term | ||
| Investor Class | $0.41852 | $0.00981 |
| WWW.HENNESSYFUNDS.COM |
20
| NOTES/REPORT OF INDEPENDENT REGISTERED PUBLIC ACCOUNTING FIRM |
Report of Independent Registered Public
Accounting Firm
To the Board of Trustees of Hennessy Funds Trust
and the shareholders of the Hennessy Balanced Fund
Novato, CA
Opinion on the Financial Statements
We have audited the accompanying statement of assets and liabilities of the Hennessy Balanced Fund (the “Fund”), a series of Hennessy Funds Trust, including the schedule of investments, as of October 31, 2021, the related statement of operations for the year then ended, the statements of changes in net assets for each of the two years in the period then ended, the financial highlights for each of the five years in the period then ended, and the related notes (collectively referred to as the “financial statements”). In our opinion, the financial statements present fairly, in all material respects, the financial position of the Fund as of October 31, 2021, the results of its operations for the year then ended, the changes in its net assets for each of the two years in the period then ended, and the financial highlights for each of the five years in the period then ended in conformity with accounting principles generally accepted in the United States of America.
Basis for Opinion
These financial statements are the responsibility of the Fund’s management. Our responsibility is to express an opinion on the Fund’s financial statements based on our audits. We are a public accounting firm registered with the Public Company Accounting Oversight Board (United States) (“PCAOB”) and are required to be independent with respect to the Fund in accordance with the U.S. federal securities laws and the applicable rules and regulations of the Securities and Exchange Commission and the PCAOB. We have served as the auditor of one or more of the funds in the Trust since 2002.
We conducted our audits in accordance with the standards of the PCAOB. Those standards require that we plan and perform the audit to obtain reasonable assurance about whether the financial statements are free of material misstatement, whether due to error or fraud. The Fund is not required to have, nor were we engaged to perform, an audit of its internal control over financial reporting. As part of our audits we are required to obtain an understanding of internal control over financial reporting, but not for the purpose of expressing an opinion on the effectiveness of the Fund’s internal control over financial reporting. Accordingly, we express no such opinion.
Our audits included performing procedures to assess the risks of material misstatement of the financial statements, whether due to error or fraud, and performing procedures that respond to those risks. Such procedures included examining, on a test basis, evidence regarding the amounts and disclosures in the financial statements. Our audits also included evaluating the accounting principles used and significant estimates made by management, as well as evaluating the overall presentation of the financial statements. Our procedures included confirmation of securities owned as of October 31, 2021 by correspondence with the custodian. We believe that our audits provide a reasonable basis for our opinion.
| |
| TAIT, WELLER & BAKER LLP |
Philadelphia, Pennsylvania
December 22, 2021
| HENNESSY FUNDS | 1-800-966-4354 |
21
Trustees and Officers of the Fund (Unaudited)
The business and affairs of the Funds are managed under the direction of the Board of Trustees of the Trust, and the Board of Trustees elects the officers of the Trust. From time to time, the Board of Trustees also has appointed advisers to the Board of Trustees (“Advisers”) with the intention of having qualified individuals serve in an advisory capacity to garner experience in the mutual fund and asset management industry and be considered as potential Trustees in the future. There are currently two Advisers, Brian Alexander and Doug Franklin. As Advisers, Mr. Alexander and Mr. Franklin attend meetings of the Board of Trustees and act as non-voting participants. Information pertaining to the Trustees, Advisers, and the officers of the Trust is set forth below. The Trustees and officers serve until their successors are duly elected and qualified or until their earlier death, resignation, or removal. Each Trustee oversees all 16 Hennessy Funds. Unless otherwise indicated, the address of all persons listed below is 7250 Redwood Boulevard, Suite 200, Novato, CA 94945. The Fund’s Statement of Additional Information includes more information about the persons listed below and is available without charge by calling 1-800-966-4354 or by visiting www.hennessyfunds.com.
| Other | |||
| Directorships | |||
| Held Outside | |||
| Name, Age, | of Fund | ||
| and Position Held | Start Date | Principal Occupation(s) | Complex During |
with the Trust | of Service | During Past Five Years | Past Five Years |
| Disinterested Trustees and Advisers | |||
| J. Dennis DeSousa | January 1996 | Mr. DeSousa is a real estate investor. | None. |
| 85 | |||
| Trustee | |||
| Robert T. Doyle | January 1996 | Mr. Doyle has been the Sheriff of | None. |
| 74 | Marin County, California since 1996. | ||
| Trustee | |||
| Claire Garvie | December 2015 | Ms. Garvie is a founder of Kiosk and | None. |
| 47 | as an Adviser | has served as its Chief Operating | |
| Trustee | to the Board | Officer since 2004. Kiosk is a full- | |
| and | service marketing agency with | ||
| December 2021 | offices in the San Francisco Bay Area, | ||
| as a Trustee | Toronto, and Liverpool, UK. | ||
| Gerald P. Richardson | May 2004 | Mr. Richardson is an independent | None. |
| 76 | consultant in the securities industry. | ||
| Trustee |
| WWW.HENNESSYFUNDS.COM |
22
| TRUSTEES AND OFFICERS OF THE FUND |
| Other | |||
| Directorships | |||
| Held Outside | |||
| Name, Age, | of Fund | ||
| and Position Held | Start Date | Principal Occupation(s) | Complex During |
with the Trust | of Service | During Past Five Years | Past Five Years |
| Brian Alexander | March 2015 | Mr. Alexander has worked for the | None. |
| 40 | Sutter Health organization since | ||
| Adviser to the Board | 2011 in various positions. He has | ||
| served as the Chief Executive Officer | |||
| of the Sutter Roseville Medical | |||
| Center since 2018. From 2016 through | |||
| 2018, he served as the Vice President | |||
| of Strategy for the Sutter Health Valley | |||
| Area, which includes 11 hospitals, | |||
| 13 ambulatory surgery centers, | |||
| 16,000 employees, and 1,900 physicians. | |||
| From 2013 through 2016, Mr. Alexander | |||
| served as Sutter Novato Community | |||
| Hospital’s Chief Administrative Officer. | |||
| Doug Franklin | March 2016 | Mr. Franklin is a retired insurance | None. |
| 57 | industry executive. From 1987 | ||
| Adviser to the Board | through 2015, he was employed | ||
| by the Allianz-Fireman’s Fund | |||
| Insurance Company in various | |||
| positions, including as its Chief | |||
| Actuary and Chief Risk Officer. | |||
Interested Trustee(1) | |||
| Neil J. Hennessy | January 1996 as | Mr. Hennessy has been employed | Hennessy |
| 65 | a Trustee and | by Hennessy Advisors, Inc. since | Advisors, Inc. |
| Chairman of the Board, | June 2008 as | 1989 and currently serves as its | |
| Chief Market Strategist, | an officer | Chairman and Chief Executive Officer. | |
| Portfolio Manager, | |||
| and President |
| Name, Age, | ||
| and Position Held | Start Date | Principal Occupation(s) |
with the Trust | of Service | During Past Five Years |
| Officers | ||
| Teresa M. Nilsen | January 1996 | Ms. Nilsen has been employed by Hennessy Advisors, Inc. |
| 55 | since 1989 and currently serves as its President and Chief | |
| Executive Vice President | Operating Officer. | |
| and Treasurer | ||
| Daniel B. Steadman | March 2000 | Mr. Steadman has been employed by Hennessy Advisors, Inc. |
| 65 | since 2000 and currently serves as its Executive Vice President. | |
| Executive Vice President | ||
| and Secretary | ||
| Brian Carlson | December 2013 | Mr. Carlson has been employed by Hennessy Advisors, Inc. |
| 49 | since December 2013 and currently serves as its Chief | |
| Senior Vice President | Compliance Officer and Senior Vice President. | |
| and Head of Distribution |
| HENNESSY FUNDS | 1-800-966-4354 |
23
| Name, Age, | ||
| and Position Held | Start Date | Principal Occupation(s) |
with the Trust | of Service | During Past Five Years |
Jennifer Cheskiewicz(2) | June 2013 | Ms. Cheskiewicz has been employed by Hennessy Advisors, Inc. |
| 44 | as its General Counsel since June 2013. | |
| Senior Vice President and | ||
| Chief Compliance Officer | ||
David Ellison(3) | October 2012 | Mr. Ellison has been employed by Hennessy Advisors, Inc. since |
| 63 | October 2012. He has served as a Portfolio Manager of the | |
| Senior Vice President | Hennessy Large Cap Financial Fund and the Hennessy Small | |
| and Portfolio Manager | Cap Financial Fund since their inception. Mr. Ellison also served | |
| as a Portfolio Manager of the Hennessy Technology Fund from | ||
| its inception until February 2017. Mr. Ellison served as Director, | ||
| CIO, and President of FBR Fund Advisers, Inc. from December | ||
| 1999 to October 2012. | ||
Ryan Kelley(4) | March 2013 | Mr. Kelley has been employed by Hennessy Advisors, Inc. since |
| 49 | October 2012. He has served as Chief Investment Officer of the | |
| Chief Investment Officer, | Hennessy Funds since March 2021 and has served as a Portfolio | |
| Senior Vice President, | Manager of the Hennessy Gas Utility Fund, the Hennessy Large | |
| and Portfolio Manager | Cap Financial Fund, and the Hennessy Small Cap Financial Fund | |
| since October 2014. Mr. Kelley served as Co-Portfolio Manager | ||
| of these same funds from March 2013 through September | ||
| 2014 and as a Portfolio Analyst for the Hennessy Funds from | ||
| October 2012 through February 2013. He has also served as a | ||
| Portfolio Manager of the Hennessy Cornerstone Growth Fund, | ||
| the Hennessy Cornerstone Mid Cap 30 Fund, the Hennessy | ||
| Cornerstone Large Growth Fund, and the Hennessy | ||
| Cornerstone Value Fund since February 2017 and as a Portfolio | ||
| Manager of the Hennessy Total Return Fund, the Hennessy | ||
| Balanced Fund, and the Hennessy Technology Fund since May | ||
| 2018. He served as Co-Portfolio Manager of the Hennessy | ||
| Technology Fund from February 2017 until May 2018. Mr. Kelley | ||
| served as Portfolio Manager of FBR Fund Advisers, Inc. from | ||
| January 2008 to October 2012. | ||
L. Joshua Wein(4) | September 2018 | Mr. Wein has been employed by Hennessy Advisors, Inc. since |
| 48 | 2018. He has served as Co-Portfolio Manager of the Hennessy | |
| Vice President and | Cornerstone Growth Fund, the Hennessy Cornerstone | |
| Co-Portfolio Manager | Mid Cap 30 Fund, the Hennessy Cornerstone Large Growth | |
| Fund, the Hennessy Cornerstone Value Fund, Hennessy Total | ||
| Return Fund, the Hennessy Balanced Fund, the Hennessy Gas | ||
| Utility Fund, and the Hennessy Technology Fund since February | ||
| 2019. He served as a Senior Analyst of these same funds from | ||
| September 2018 through February 2019. Mr. Wein served as | ||
| Director of Alternative Investments and Co-Portfolio Manager | ||
| at Sterling Capital Management from 2008 to 2018. |
_______________
(1) | Mr. Hennessy is considered an “interested person,” as defined in the Investment Company Act of 1940, as amended, because he is an officer of the Trust. |
(2) | The address of this officer is 4800 Bee Caves Road, Suite 100, Austin, TX 78746. |
(3) | The address of this officer is 101 Federal Street, Suite 1615B, Boston, MA 02110. |
(4) | The address of this officer is 1340 Environ Way, Chapel Hill, NC 27517. |
| WWW.HENNESSYFUNDS.COM |
24
| TRUSTEES AND OFFICERS OF THE FUND/EXPENSE EXAMPLE |
Expense Example (Unaudited)
October 31, 2021
As a shareholder of the Fund, you incur ongoing costs, including management fees, service fees, and other Fund expenses. This Example is intended to help you understand your ongoing costs (in dollars) of investing in the Fund and to compare these costs with the ongoing costs of investing in other mutual funds. The Example is based on an investment of $1,000 invested at the beginning of the period and held for the entire period from May 1, 2021, through October 31, 2021.
Actual Expenses
The first line of the table below provides information about actual account values and actual expenses. You may use this information, together with the amount you invested, to estimate the expenses that you paid over the period. Simply divide your account value by $1,000 (for example, an $8,600 account value divided by $1,000 = 8.6), then multiply the result by the number in the first line under the heading “Expenses Paid During Period” to estimate the expenses you paid on your account during this period. Although the Fund charges no sales loads or transaction fees, you will be assessed fees for outgoing wire transfers, returned checks, and stop payment orders at prevailing rates charged by U.S. Bank Global Fund Services, the Fund’s transfer agent. If you request that a redemption be made by wire transfer, the Fund’s transfer agent charges a $15 fee. IRAs are charged a $15 annual maintenance fee (up to $30 maximum per shareholder for shareholders with multiple IRAs). The example below includes, but is not limited to, management, shareholder servicing, accounting, custody, and transfer agent fees. However, the example below does not include portfolio trading commissions and related expenses.
Hypothetical Example for Comparison Purposes
The second line of the table below provides information about hypothetical account values and hypothetical expenses based on the Fund’s actual expense ratio and an assumed rate of return of 5% per year before expenses, which is not the Fund’s actual return. The hypothetical account values and expenses may not be used to estimate the actual ending account balance or expenses you paid for the period. You may use this information to compare the ongoing costs of investing in the Fund and other funds. To do so, compare this 5% hypothetical example with the 5% hypothetical examples that appear in the shareholder reports of the other funds. Please note that the expenses shown in the table are meant to highlight your ongoing costs only. Therefore, the second line is useful in comparing ongoing costs only and will not help you determine the relative total costs of owning different funds.
| Expenses Paid | |||
| Beginning | Ending | During Period(1) | |
| Account Value | Account Value | May 1, 2021 – | |
May 1, 2021 | October 31, 2021 | October 31, 2021 | |
| Investor Class | |||
| Actual | $1,000.00 | $ 995.30 | $9.15 |
| Hypothetical (5% return before expenses) | $1,000.00 | $1,016.03 | $9.25 |
(1) | Expenses are equal to the Fund’s annualized expense ratio of 1.82%, multiplied by the average account value over the period, multiplied by 184/365 days (to reflect the half-year period). |
| HENNESSY FUNDS | 1-800-966-4354 |
25
How to Obtain a Copy of the Fund’s Proxy
Voting Policy and Proxy Voting Records
A description of the policies and procedures the Fund uses to determine how to vote proxies relating to portfolio securities is available without charge (1) by calling 1-800-966-4354, (2) on the Hennessy Funds’ website at www.hennessyfunds.com/proxy-voting/voting-policy, or (3) on the U.S. Securities and Exchange Commission’s (the “SEC”) website at www.sec.gov. The Fund’s proxy voting record is available without charge on both the Hennessy Funds’ website at www.hennessyfunds.com/proxy-voting/voting-record and the SEC’s website at www.sec.gov no later than August 31 for the prior 12 months ending June 30.
Availability of Quarterly Portfolio Schedule
The Fund files a complete schedule of portfolio holdings with the SEC for the first and third quarters of each fiscal year as an exhibit to its reports on Form N-PORT. The Fund’s Form N-PORT reports are available on the SEC’s website at www.sec.gov or on request by calling 1-800-966-4354.
Federal Tax Distribution Information (Unaudited)
For fiscal year 2021, certain dividends paid by the Fund may be subject to a maximum tax rate of 23.8%, as provided for by the Jobs and Growth Tax Relief Reconciliation Act of 2003. The percentage of dividends declared from ordinary income designated as qualified dividend income was 100.00%.
For corporate shareholders, the percent of ordinary income distributions that qualified for the corporate dividends received deduction for fiscal year 2021 was 100.00%.
The percentage of taxable ordinary income distributions that were designated as short-term capital gain distributions under Section 871(k)(2)(C) of the Internal Revenue Code of 1986, as amended, for the Fund was 28.96%.
Important Notice Regarding Delivery
of Shareholder Documents
To help keep the Fund’s costs as low as possible, we generally deliver a single copy of shareholder reports, proxy statements, and prospectuses to shareholders who share an address and have the same last name. This process does not apply to account statements. You may request an individual copy of a shareholder document at any time. If you would like to receive separate mailings of shareholder documents, please call U.S. Bank Global Fund Services at 1-800-261-6950 or 1-414-765-4124, and individual delivery will begin within 30 days of your request. If your account is held through a financial institution or other intermediary, please contact such intermediary directly to request individual delivery.
Electronic Delivery
As permitted by SEC regulations, the Fund’s shareholder reports are made available on a website, and unless you sign up for eDelivery or elect to receive paper copies as detailed below, you will be notified by mail each time a report is posted and provided with a website link to access the report.
The Fund also offers shareholders the option to receive all notices, account statements, prospectuses, tax forms, and shareholder reports online. To sign up for eDelivery or change your delivery preference, please visit www.hennessyfunds.com/account.
To elect to receive paper copies of all future reports free of charge, please call U.S. Bank Global Fund Services at 1-800-261-6950 or 1-414-765-4124.
Subscribe to receive our team’s unique market and sector insights delivered to your inbox
www.hennessyfunds.com/subscribe
Follow us on social media
| | |
| WWW.HENNESSYFUNDS.COM |
26
| PROXY VOTING — PRIVACY POLICY |
Liquidity Risk Management Program
In accordance with Rule 22e-4 under the Investment Company Act of 1940, as amended (the “Liquidity Rule”), we have adopted and implemented a liquidity risk management program (the “Liquidity Program”). The purpose of the Liquidity Program is to assess and manage the Fund’s liquidity risk, which is the risk that the Fund would not be able to meet requests to redeem Fund shares without significant dilution of the remaining shareholders’ interests in the Fund. The Board of Trustees of the Fund (the “Board”) designated a committee comprising representatives of Hennessy Advisors, Inc., the investment adviser to the Fund, as the administrator of the Liquidity Program (the “Program Administrator”).
The Program Administrator provided a written report regarding the Liquidity Program to the Board in advance of its meeting on June 2, 2021. The report covered the period from June 1, 2020, through May 31, 2021. The report addressed the operation of the Liquidity Program, assessed the adequacy and effectiveness of its implementation, and described any material changes to the Liquidity Program during the review period. The Trust’s chief compliance officer presented the report to the Board at the meeting and provided additional information regarding the Liquidity Program. The Board reviewed the Liquidity Program and considered, among other items, the following:
| 1. | The Program Administrator reviewed daily historical net redemption activity during the review period and during prior periods with higher-than-average redemption activity and concluded that the Fund has historically been able to meet requests to redeem Fund shares without significant dilution to the Fund’s remaining shareholders, and the Program Administrator expects the Fund to be able to continue to do so in the future during both normal and reasonably foreseeable stressed conditions. | |
| 2. | The Fund holds assets that are highly liquid investments and is therefore not required to establish a highly liquid investment minimum for the Fund or adopt policies and procedures for responding to a highly liquid investment minimum shortfall. | |
| 3. | The Program Administrator did not make any material changes to the Liquidity Program during the review period and did not recommend any changes to the Liquidity Program or the model inputs used to determine the liquidity classification of each security held by the Fund. | |
| 4. | The Program Administrator concluded that the Liquidity Program was reasonably designed to assess and manage the Fund’s liquidity risk, complies with the requirements of the Liquidity Rule, and was operating as intended during the review period. |
Privacy Policy
We collect the following personal information about you:
| 1. | Information we receive from you in applications or other forms, correspondence, or conversations, including, but not limited to, your name, address, phone number, social security number, assets, income, and date of birth; | |
| 2. | Information about your transactions with us, our affiliates, or others, including, but not limited to, your account number and balance, payments history, parties to transactions, cost basis information, and other financial information; and |
| HENNESSY FUNDS | 1-800-966-4354 |
27
| 3. | Other personal information we collect from various sources, even if you have not entered into a prior transaction with us, including the following: |
| • | Name, alias, address, unique personal identifier, online identifier, IP address, email address, telephone number, account name, and other similar identifiers; | |
| • | Age and marital status; | |
| • | Commercial information, including records of products purchased; | |
| • | Browsing history, search history, and information on interaction with our website; | |
| • | Geolocation data; | |
| • | Employment and employment history, educational history, financial information, and purchasing and consuming histories or tendencies; and | |
| • | Inferences drawn from the above-listed information to create a profile about your preferences, characteristics, predispositions, and behavior. |
We collect this information directly from you, indirectly in the course of providing services to you, directly and indirectly from your activity on our website, from broker dealers, marketing agencies, and other third parties that interact with us in connection with the services we perform and products we offer, and from anonymized and aggregated consumer information.
We use this information to fulfill the reason you provided the information to us, to provide you with other relevant products that you request from us, to provide you with information about products that may interest you, to improve our website or present our website’s contents to you, and as otherwise described to you when collecting your personal information.
We do not disclose any personal information to unaffiliated third parties, except as permitted by law. We may disclose your personal information to our affiliates, vendors, and service providers for a business purpose. For example, we are permitted by law to disclose all of the information we collect, as described above, to our transfer agent to process your transactions. When disclosing your personal information to third parties, we enter into a contract with each third party describing the purpose of such disclosure and requiring that such personal information be kept confidential and not used for any purpose except to perform the services contracted or respond to regulatory or law enforcement requests.
Furthermore, we restrict access to your personal information to those persons who require such information to provide products or services to you. As a result, we do not provide a means for opting out of our limited sharing of your information. We maintain physical, electronic, and procedural safeguards that comply with federal standards to guard your personal information.
If you hold shares of the Funds through a financial intermediary, including, but not limited to, a broker-dealer, bank, or trust company, the privacy policy of your financial intermediary governs how your personal information is shared with unaffiliated third parties.
Supplemental Privacy Notice for Residents of California
The California Consumer Privacy Act of 2018 (the “CCPA”) provides you, as a California resident, with certain additional rights relating to your personal information.
| WWW.HENNESSYFUNDS.COM |
28
| PRIVACY POLICY |
Under the CCPA, you have the right to request that we disclose to you the categories of personal information we have collected about you over the past 12 months, the categories of sources of such information, our business purpose for collecting the information, the categories of third parties, if any, with whom we shared the information, and the specific information we have collected about you. You also have the right to request that we delete any of your personal information, and, unless an exception applies, we will delete such information upon receiving and confirming your request. To make a request, call us at 1-800-966-4354, email us at privacy@hennessyfunds.com, or go to www.hennessyfunds.com/contact. We will not discriminate against you for exercising your rights under the CCPA. Further, we will not collect additional categories of your personal information or use the personal information we collected for materially different, unrelated, or incompatible purposes without providing you notice.
| HENNESSY FUNDS | 1-800-966-4354 |
29
For information, questions, or assistance, please call
The Hennessy Funds
1-800-966-4354 or 1-415-899-1555
INVESTMENT ADVISOR
Hennessy Advisors, Inc.
7250 Redwood Boulevard, Suite 200
Novato, California 94945
ADMINISTRATOR,
TRANSFER AGENT,
DIVIDEND PAYING AGENT, &
SHAREHOLDER SERVICING AGENT
U.S. Bancorp Fund Services, LLC
d/b/a U.S. Bank Global Fund Services
P.O. Box 701
Milwaukee, Wisconsin 53201-0701
CUSTODIAN
U.S. Bank N.A.
Custody Operations
1555 North River Center Drive, Suite 302
Milwaukee, Wisconsin 53212
TRUSTEES
Neil J. Hennessy
Robert T. Doyle
J. Dennis DeSousa
Claire Garvie
Gerald P. Richardson
COUNSEL
Foley & Lardner LLP
777 East Wisconsin Avenue
Milwaukee, Wisconsin 53202-5306
INDEPENDENT REGISTERED
PUBLIC ACCOUNTING FIRM
Tait, Weller & Baker LLP
Two Liberty Place
50 South 16th Street, Suite 2900
Philadelphia, Pennsylvania 19102-2529
DISTRIBUTOR
Quasar Distributors, LLC
111 East Kilbourn Avenue, Suite 2200
Milwaukee, Wisconsin 53202
www.hennessyfunds.com | 1-800-966-4354
This report has been prepared for shareholders and may be distributed to
others only if preceded or accompanied by a current prospectus.
ANNUAL REPORT
OCTOBER 31, 2021

HENNESSY BP ENERGY TRANSITION FUND
Investor Class HNRGX
Institutional Class HNRIX
www.hennessyfunds.com | 1-800-966-4354
(This Page Intentionally Left Blank.)
Contents
| Letter to Shareholders | 2 |
| Performance Overview | 4 |
| Financial Statements | |
| Schedule of Investments | 8 |
| Statement of Assets and Liabilities | 12 |
| Statement of Operations | 13 |
| Statements of Changes in Net Assets | 15 |
| Financial Highlights | 16 |
| Notes to the Financial Statements | 20 |
| Report of Independent Registered Public Accounting Firm | 28 |
| Trustees and Officers of the Fund | 29 |
| Expense Example | 32 |
| Proxy Voting Policy and Proxy Voting Records | 34 |
| Availability of Quarterly Portfolio Schedule | 34 |
| Important Notice Regarding Delivery of Shareholder Documents | 34 |
| Electronic Delivery | 34 |
| Liquidity Risk Management Program | 35 |
| Privacy Policy | 35 |
| HENNESSY FUNDS | 1-800-966-4354 |
December 2021
Dear Hennessy Funds Shareholder:
What a year this has been. While it doesn’t feel that we are out of the “pandemic” phase of the coronavirus crisis, we look forward to a day when we will eventually see fewer cases and potentially less severe variants. We feel extremely grateful to the many healthcare workers who have continued to work tirelessly during the recent surge. As we move through the next year, we hope that new U.S. cases will decline and that many other parts of the world will see improvements as well.
What a year this has been! As measured by the total return of the S&P 500® Index, as of October 31, 2021, the market was up 24.04% calendar year to date. This comes in the wake of a tumultuous 2020 in which the market plunged in the beginning of the pandemic and recovered dramatically to end the year up 18.40%. Interestingly, 18% appears to be a repeating number in the past dozen years. From the low point of the Financial Crisis (March 9, 2009) to the high point reached just prior to the COVID-19 pandemic (February 12, 2020), the S&P 500® Index was up 18.27% per year. We are well aware that past results are not predictive of the future, and we find ourselves naturally skeptical of such strong returns. But, as shown in the chart below, we find that the most common annual total returns of the market over the past 102 years range between 20% and 30% with the second most common being between 10% and 20%:
Source: Bloomberg L.P.
We will say it again, after showing a chart like the one above: Past results are not predictive of the future. Instead, we look at where we are right now – in the economy, in the market, in the business cycle – to reflect on where we have come from and where we may be going. U.S. GDP is strong and growing, interest rates remain low, and earnings growth and profitability remain robust. We believe stocks are trading at reasonable valuations when viewed as a whole, with the S&P 500® Index at 21.0x estimated earnings for 2022. Furthermore, we believe corporate balance sheets are healthy, with high levels of excess cash, which could support growth, increases in dividends, more share buybacks, and future acquisitions. Uncertainty and volatility can manifest at any time in the stock market, and the current market is no different. Investors have questions about inflation, worldwide supply chain issues, and what could drive the next boost in earnings. While these concerns are warranted, we continue to believe that overall the positives outweigh the negatives, and here at Hennessy we continue to see opportunity in the market and in our Funds.
| WWW.HENNESSYFUNDS.COM |
2
| LETTER TO SHAREHOLDERS |
What a (fiscal) year this has been!!! For our fiscal year ended October 31, 2021, the S&P 500® Index rose 42.91% on a total return basis, setting a new all-time high on the final day of the period. Except for a short 21-trading-day period that began on September 2 during which the market fell 5.13% only to rebound to new highs just 13 trading days later, the market has been on a continuous march higher. We saw a dramatic shift in market leadership as many of the sectors that underperformed during our last fiscal year soared in fiscal year 2021. Small-caps beat mid-caps, which in turn beat large-caps. The Energy and Financials sectors skyrocketed during the 12-month period, as reflected by the S&P 500® Energy Sector’s total return of 111.29% and the Russell 1000® Index Financials’ total return of 70.87%. Both of these sectors were among the worst performing in our fiscal year 2020, so a bounce back in our fiscal year 2021, while not a foregone conclusion, was a distinct possibility.
Overall, we are pleased with the performance of our mutual funds during the fiscal year. On an absolute basis, each of our 16 Funds achieved total returns greater than 10% and seven outperformed their primary benchmark. Ten of our 11 domestic equity-only Funds outperformed the S&P 500® Index and posted total returns of 45% or higher. Our four best-performing funds were concentrated in the Energy and Financials sectors. While some of our Funds certainly benefited from being in the “right” sector at the “right” time, we also believe this was a favorable period for our investment style of high-conviction investing and concentrated portfolio construction.
What will the coming year bring? As mentioned in our last shareholder letter (June 2021), we understand that even the greatest bull markets experience corrections along the way, and the last time the S&P 500® Index dropped over 10% was in February/March of 2020. Whether or not a correction occurs sooner or later, we believe the market as a whole has more room to run. We see many factors that could drive the market higher from here: strong GDP growth and increasing corporate earnings, a potentially lower-for-longer interest rate environment, accommodative fiscal and monetary policies, a healthy and robust financial system, low unemployment and solid wage growth, and strong corporate balance sheets with plenty of cash.
Thank you for your interest and for investing with us. We remain committed to managing our portfolios for long-term performance, ever mindful of downside risk. With so many investment options available to you, we are grateful for the trust you put in us and for your continued interest in our family of Funds. If you have any questions or would like to speak with us, please don’t hesitate to call us directly at (800) 966-4354.
Best regards,
| |
| |
| Ryan C. Kelley | |
| Chief Investment Officer |
Past performance does not guarantee future results. To obtain current standardized performance for the Hennessy Funds, visit https://www.hennessyfunds.com/funds/price-performance.
Mutual fund investing involves risk. Principal loss is possible.
Opinions expressed are those of Ryan C. Kelley and are subject to change, are not guaranteed, and should not be considered investment advice.
The Dow Jones Industrial Average and S&P 500® Index are commonly used to measure the performance of U.S. stocks. The S&P 500® Energy Index comprises those companies included in the S&P 500® Index that are classified in the Energy sector. The Russell 1000® Index Financials is a subset of the Russel 1000® Index that measures the performance of securities classified in the Financials sector of the large-capitalization U.S. equity market. The indices are used herein for comparative purposes in accordance with SEC regulations. One cannot invest directly in an index. All returns are shown on a total return basis.
| HENNESSY FUNDS | 1-800-966-4354 |
3
Performance Overview (Unaudited)
CHANGE IN VALUE OF $10,000 INVESTMENT
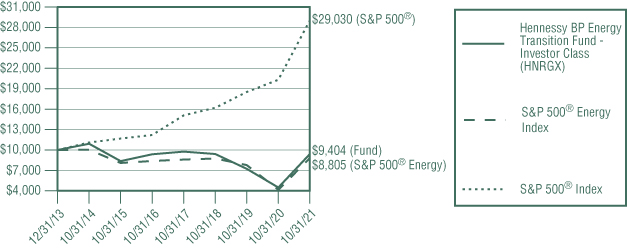
This graph illustrates the performance of an initial investment of $10,000 made in the Fund on its inception date and assumes the reinvestment of dividends and capital gains.
AVERAGE ANNUAL TOTAL RETURN FOR PERIODS ENDED OCTOBER 31, 2021
| One | Five | Since Inception | ||
Year | Years | (12/31/13) | ||
| Hennessy BP Energy Transition Fund – | ||||
| Investor Class (HNRGX) | 109.50% | 0.08% | -0.78% | |
| Hennessy BP Energy Transition Fund – | ||||
| Institutional Class (HNRIX) | 110.17% | 0.36% | -0.53% | |
S&P 500® Energy Index | 111.29% | 0.98% | -1.61% | |
S&P 500® Index | 42.91% | 18.93% | 14.57% |
Expense ratios: 2.59% (Investor Class); 2.01% (Institutional Class)
Performance data quoted represents past performance; past performance does not guarantee future results. The investment return and principal value of an investment will fluctuate so that an investor’s shares, when redeemed, may be worth more or less than their original cost. The performance table does not reflect the deduction of taxes that a shareholder would pay on Fund distributions or the redemption of Fund shares. Current performance of the Fund may be lower or higher than the performance quoted. Performance data current to the most recent month end may be obtained by visiting www.hennessyfunds.com. Performance for periods including or prior to October 26, 2018, is that of the BP Capital TwinLine Energy Fund.
The S&P 500® Energy Index comprises those companies included in the S&P 500® that are classified in the Energy sector. The S&P 500® Index is a capitalization-weighted index that is designed to represent the broad domestic economy through changes in the aggregate market value of 500 stocks across all major industries. One cannot invest directly in an index. These indices are used for comparative purposes in accordance with Securities and Exchange Commission regulations.
Standard & Poor’s Financial Services is the source and owner of the S&P® and S&P 500® trademarks.
The expense ratios presented are from the most recent prospectus. The expense ratios for the current reporting period are available in the Financial Highlights section of this report.
| WWW.HENNESSYFUNDS.COM |
4
| PERFORMANCE OVERVIEW |
PERFORMANCE NARRATIVE
Portfolio Managers Ben Cook, CFA, and Kevin Gallagher, CFA
BP Capital Fund Advisors, LLC (sub-advisor)
Performance:
For the one-year period ended October 31, 2021, the Investor Class of the Hennessy BP Energy Transition Fund returned 109.50%, underperforming the S&P 500® Energy Index (the Fund’s primary benchmark), which returned 111.29% for the same period, but outperforming the S&P 500® Index, which returned 42.91% for the same period.
The Fund’s strong performance was primarily due to its overweight position in traditional hydrocarbon energy equities. Additionally, Fund performance benefited from holding companies in the end user category, namely materials, which performed well as improving prospects for global economic recovery provided support to economically sensitive sectors. The Fund’s holdings in renewable energy-oriented companies detracted from relative performance during the period, as operating issues in key supply chain markets presented headwinds for many companies to achieve operating and financial targets.
Portfolio Strategy:
The Fund seeks to invest in companies across the energy value chain, including both hydrocarbons and renewable energy sources. This investible universe includes crude oil and natural gas exploration and production companies, oilfield service providers, midstream companies, refiners, and energy end users. The renewable energy value chain comprises materials producers, machinery and equipment manufacturers, service providers, and utilities. We believe the inclusion of energy end users, such as industrials and transportation companies, differentiates the Fund from traditional energy funds that do not include such companies. We believe including such companies in the investment universe enables the Fund to benefit from a broader range of energy-related themes and provides greater flexibility to adjust sub-sector weightings based on our investment outlook. The Fund typically owns 25 to 40 securities and historically has had little overlap with the top holdings of commonly used energy and commodity equity benchmarks.
Investment Commentary:
Energy market conditions improved dramatically at the beginning of the one-year period as certainty afforded by the U.S. Presidential election outcome and promising results from Pfizer’s COVID-19 vaccine trial, These events signaled an encouraging outlook for rising energy demand on the expectation for accommodative fiscal stimulus as well the gradual easing of pandemic related economic headwinds. At the same time, coordinated restraint by OPEC+ member countries and spending discipline by U.S. shale producers kept crude oil supplies limited, which caused global inventories of crude oil to fall to pre-pandemic levels by summer’s end. Storm disruption during the month of August added further support to crude oil price gains during the period, as damage to offshore Gulf of Mexico facilities hampered the restart of both crude oil and natural gas production. The price of NYMEX WTI crude oil more than doubled over the period, finishing at $83.28 per barrel (bbl).
Natural gas markets also strengthened considerably on tightening global supplies following an historic bout of cold weather in the southcentral U.S. during February and an extended period of cooler than normal winter temperatures in western Europe that ultimately left inventories of natural gas in both markets well below historical seasonal norms. By early fall, natural gas pricing in both southeast Asia and northwestern Europe spiked to multi-year highs as storage operators raced to secure liquefied natural gas (“LNG”) cargos required to refill regional storage facilities ahead of the upcoming winter
| HENNESSY FUNDS | 1-800-966-4354 |
5
heating season. In the United States, a key source of global LNG supply, natural gas prices remained firm through period-end reflecting healthy market demand for LNG export cargo as well as the volume necessary for domestic storage fill ahead of the coming winter. During the period, NYMEX Henry Hub natural gas prices rose considerably from a range of $2.50 to $3.00 per thousand cubic feet (mcf) to over $5.00 per mcf at the end of October 2021.
Relative energy equity performance during the period generally tracked the directional influence of commodity prices, but also reflected a comparative investor preference for companies in hydrocarbon-oriented energy businesses. Companies engaged in the production, transportation, refining, and export of hydrocarbons of all sorts enjoyed meaningful outperformance relative to renewables-oriented peers.
Following President Biden’s election victory in November 2020, investor enthusiasm for renewable-energy-oriented equities pushed valuations across the sector to very high levels into year end. In contrast, hydrocarbon-oriented equity valuations reflected little potential associated with a rebounding economy and newly embraced shareholder friendly management practices that, in our opinion, offered meaningful upside. Accordingly, we pivoted renewable energy equity exposure toward hydrocarbon-oriented equities by adding U.S. exploration and production companies and oil field service providers. By period end, portfolio exposure to hydrocarbon-oriented equities remained high relative to historical levels.
We have been encouraged by the U.S. energy industry’s resiliency during the COVID-19 pandemic-related contraction. Hydrocarbon-oriented companies have reduced capital spending and emphasized cost efficiency in order to preserve financial flexibility. Across the sector, corporate behavior continues to reflect an alignment with shareholders that is increasingly shifting the rewards of surplus free cash flow away from growth reinvestment and back to investors in the form of accelerated debt repayment, dividend hikes, and share repurchases. Though the need for hydrocarbon supply growth will eventually return, we are optimistic that the industry will continue to operate in the interest of investors, emphasizing capital efficiency, productivity improvement, and continued prudent focus on shareholder return.
As the world pursues greenhouse gas emission reduction targets, we believe policy, technology, and consumer and investor preference will continue to drive change in the world’s primary fuel mix. In this environment, we believe that wind, solar, hydrogen, and other renewable technologies will expand at the expense of more carbon intensive fuels, namely coal and heavy fuel oil. Despite this, we expect critical impediments in the form of policy gaps, reliability issues, and simple cost disadvantages will continue to hamper the pace of the transition toward renewables, and we see these drivers prolonging the dependence upon hydrocarbons. As a consequence, we envision a landscape that reflects the coexistence and need of both hydrocarbons and renewables, which should provide investment opportunity for investors for decades to come.
_______________
Opinions expressed are those of the Portfolio Managers as of the date written and are subject to change, are not guaranteed, and should not be considered investment advice or an indication of trading intent.
The Fund’s triple digit performance was attributable to unusually favorable market conditions resulting from the COVID-19 pandemic and to supply declines. Such conditions may not continue to exist and the Fund’s performance may not be repeated in the future.
| WWW.HENNESSYFUNDS.COM |
6
| PERFORMANCE OVERVIEW |
The Fund invests in small-capitalization and medium-capitalization companies, which involves additional risks such as limited liquidity and greater volatility. Funds that concentrate in a single sector may be subject to a higher degree of risk. Energy-related companies are subject to specific risks, including fluctuations in commodity prices and consumer demand, substantial government regulation, and depletion of reserves. Investments in lower-rated and non-rated securities present a greater risk of loss to principal and interest than higher-rated securities. Use of derivatives can increase the volatility of the Fund.
MLPs and MLP investments have unique characteristics. The Fund does not receive the same tax benefits as a direct investment in an MLP.
The prices of MLP units may fluctuate abruptly and trading volume may be low, making it difficult for the Fund to sell its units at a favorable price. MLP general partners have the power to take actions that adversely affect the interests of unit holders. Most MLPs do not pay U.S. federal income tax at the partnership level, but an adverse change in tax laws could result in MLPs being treated as corporations for federal income tax purposes, which could reduce or eliminate distributions paid by MLPs to the Fund. If the Fund’s MLP investments exceed 25% of its assets, the Fund may not qualify for treatment as a regulated investment company under the Internal Revenue Code. The Fund would be taxed as an ordinary corporation, which could substantially reduce the Fund’s net assets and its distributions to shareholders. Please see the Fund’s prospectus for a more complete discussion of these and other risks.
References to specific securities should not be considered a recommendation to buy or sell any security. Fund holdings and sector allocations are subject to change. Please refer to the Schedule of Investments included in this report for additional portfolio information.
Free cash flow is a measure of financial performance calculated as operating cash flow minus capital expenditures.
| HENNESSY FUNDS | 1-800-966-4354 |
7
Financial Statements
Schedule of Investments as of October 31, 2021 |
HENNESSY BP ENERGY TRANSITION FUND
(% of Total Assets)
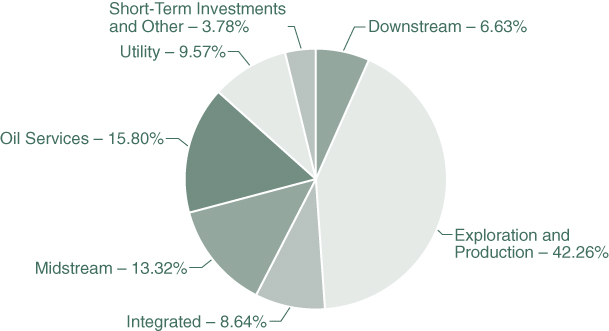
| TOP TEN HOLDINGS (EXCLUDING MONEY MARKET FUNDS) | % TOTAL ASSETS |
| Diamondback Energy, Inc. | 4.98% |
| EOG Resources, Inc. | 4.90% |
| PDC Energy, Inc. | 4.88% |
| Plains All American Pipeline LP | 4.86% |
| Cheniere Energy, Inc. | 4.48% |
| Exxon Mobil Corp. | 4.44% |
| Suncor Energy, Inc. | 4.33% |
| Chevron Corp. | 4.19% |
| ConocoPhillips | 4.16% |
| Pioneer Natural Resources Co. | 4.16% |
Note: The Fund concentrates its investments in the Energy industry. For presentation purposes, the Fund uses custom categories.
| WWW.HENNESSYFUNDS.COM |
8
| SCHEDULE OF INVESTMENTS |
| COMMON STOCKS – 88.13% | Number | % of | ||||||||||
| of Shares | Value | Net Assets | ||||||||||
| Downstream – 6.69% | ||||||||||||
| Marathon Petroleum Corp. | 6,900 | $ | 454,917 | 2.80 | % | |||||||
| Valero Energy Corp. | 8,170 | 631,786 | 3.89 | % | ||||||||
| 1,086,703 | 6.69 | % | ||||||||||
| Exploration & Production – 42.62% | ||||||||||||
| Antero Resources Corp. (a) | 32,000 | 635,840 | 3.91 | % | ||||||||
| Comstock Resources, Inc. (a) | 39,640 | 391,247 | 2.41 | % | ||||||||
| ConocoPhillips | 9,145 | 681,211 | 4.19 | % | ||||||||
| Coterra Energy, Inc. | 26,510 | 565,193 | 3.48 | % | ||||||||
| Diamondback Energy, Inc. | 7,620 | 816,788 | 5.03 | % | ||||||||
| EOG Resources, Inc. | 8,680 | 802,553 | 4.94 | % | ||||||||
| EQT Corp. (a) | 24,500 | 487,795 | 3.00 | % | ||||||||
| Magnolia Oil & Gas Corp. | 17,000 | 354,960 | 2.18 | % | ||||||||
| PDC Energy, Inc. | 15,290 | 799,820 | 4.92 | % | ||||||||
| Pioneer Natural Resources Co. | 3,650 | 682,477 | 4.20 | % | ||||||||
| Suncor Energy, Inc. (b) | 26,960 | 709,048 | 4.36 | % | ||||||||
| 6,926,932 | 42.62 | % | ||||||||||
| Integrated – 8.71% | ||||||||||||
| Chevron Corp. | 6,000 | 686,940 | 4.23 | % | ||||||||
| Exxon Mobil Corp. | 11,300 | 728,511 | 4.48 | % | ||||||||
| 1,415,451 | 8.71 | % | ||||||||||
| Midstream – 4.52% | ||||||||||||
| Cheniere Energy, Inc. (a) | 7,100 | 734,140 | 4.52 | % | ||||||||
| Oil Services – 15.93% | ||||||||||||
| Halliburton Co. | 20,250 | 506,047 | 3.11 | % | ||||||||
| Newpark Resources, Inc. (a) | 125,950 | 428,230 | 2.63 | % | ||||||||
| Schlumberger Ltd. (b) | 17,810 | 574,550 | 3.54 | % | ||||||||
| Select Energy Services, Inc. (a) | 52,660 | 316,487 | 1.95 | % | ||||||||
| Solaris Oilfield Infrastructure, Inc. | 37,320 | 283,259 | 1.74 | % | ||||||||
| TechnipFMC PLC (a)(b) | 65,240 | 480,819 | 2.96 | % | ||||||||
| 2,589,392 | 15.93 | % | ||||||||||
The accompanying notes are an integral part of these financial statements.
| HENNESSY FUNDS | 1-800-966-4354 |
9
| COMMON STOCKS | Number | % of | ||||||||||
| of Shares | Value | Net Assets | ||||||||||
| Utility – 9.66% | ||||||||||||
| Freeport-McMoRan, Inc. | 14,820 | $ | 559,011 | 3.44 | % | |||||||
| NextEra Energy, Inc. | 5,970 | 509,420 | 3.14 | % | ||||||||
| OGE Energy Corp. | 14,700 | 500,829 | 3.08 | % | ||||||||
| 1,569,260 | 9.66 | % | ||||||||||
| Total Common Stocks | ||||||||||||
| (Cost $11,629,182) | 14,321,878 | 88.13 | % | |||||||||
| PARTNERSHIPS & TRUSTS – 8.92% | ||||||||||||
| Midstream – 8.92% | ||||||||||||
| Enterprise Products Partners LP | 8,729 | 197,974 | 1.22 | % | ||||||||
| MPLX LP | 15,104 | 454,932 | 2.80 | % | ||||||||
| Plains All American Pipeline LP | 78,710 | 796,545 | 4.90 | % | ||||||||
| Total Partnerships & Trusts | ||||||||||||
| (Cost $1,681,920) | 1,449,451 | 8.92 | % | |||||||||
| SHORT-TERM INVESTMENTS – 3.51% | ||||||||||||
| Money Market Funds – 3.51% | ||||||||||||
| First American Government Obligations Fund, | ||||||||||||
| Institutional Class, 0.03% (c) | 570,411 | 570,411 | 3.51 | % | ||||||||
| Total Short-Term Investments | ||||||||||||
| (Cost $570,411) | 570,411 | 3.51 | % | |||||||||
| Total Investments | ||||||||||||
| (Cost $13,881,513) – 100.56% | 16,341,740 | 100.56 | % | |||||||||
| Liabilities in Excess of Other Assets – (0.56)% | (90,966 | ) | (0.56 | )% | ||||||||
TOTAL NET ASSETS – 100.00% | $ | 16,250,774 | 100.00 | % | ||||||||
Percentages are stated as a percent of net assets.
| (a) | Non-income-producing security. |
| (b) | U.S.-traded security of a foreign corporation. |
| (c) | The rate listed is the fund’s seven-day yield as of October 31, 2021. |
The accompanying notes are an integral part of these financial statements.
| WWW.HENNESSYFUNDS.COM |
10
| SCHEDULE OF INVESTMENTS |
Summary of Fair Value Exposure as of October 31, 2021
The following is a summary of the inputs used to value the Fund’s net assets as of October 31, 2021 (see Note 3 in the accompanying Notes to the Financial Statements):
| Common Stocks | Level 1 | Level 2 | Level 3 | Total | ||||||||||||
| Downstream | $ | 1,086,703 | $ | — | $ | — | $ | 1,086,703 | ||||||||
| Exploration & Production | 6,926,932 | — | — | 6,926,932 | ||||||||||||
| Integrated | 1,415,451 | — | — | 1,415,451 | ||||||||||||
| Midstream | 734,140 | — | — | 734,140 | ||||||||||||
| Oil Services | 2,589,392 | — | — | 2,589,392 | ||||||||||||
| Utility | 1,569,260 | — | — | 1,569,260 | ||||||||||||
| Total Common Stocks | $ | 14,321,878 | $ | — | $ | — | $ | 14,321,878 | ||||||||
| Partnerships & Trusts | ||||||||||||||||
| Midstream | $ | 1,449,451 | $ | — | $ | — | $ | 1,449,451 | ||||||||
| Total Partnerships & Trusts | $ | 1,449,451 | $ | — | $ | — | $ | 1,449,451 | ||||||||
| Short-Term Investments | ||||||||||||||||
| Money Market Funds | $ | 570,411 | $ | — | $ | — | $ | 570,411 | ||||||||
| Total Short-Term Investments | $ | 570,411 | $ | — | $ | — | $ | 570,411 | ||||||||
| Total Investments | $ | 16,341,740 | $ | — | $ | — | $ | 16,341,740 | ||||||||
The accompanying notes are an integral part of these financial statements.
| HENNESSY FUNDS | 1-800-966-4354 |
11
Financial Statements
Statement of Assets and Liabilities as of October 31, 2021 |
| ASSETS: | ||||
| Investments in securities, at value (cost $13,881,513) | $ | 16,341,740 | ||
| Dividends and interest receivable | 5,327 | |||
| Receivable for fund shares sold | 16,425 | |||
| Return of capital receivable | 18,096 | |||
| Prepaid expenses and other assets | 8,363 | |||
| Total assets | 16,389,951 | |||
| LIABILITIES: | ||||
| Payable for fund shares redeemed | 81,355 | |||
| Payable to advisor | 16,461 | |||
| Payable to auditor | 23,108 | |||
| Accrued distribution fees | 1,557 | |||
| Accrued service fees | 545 | |||
| Accrued trustees fees | 6,596 | |||
| Accrued expenses and other payables | 9,555 | |||
| Total liabilities | 139,177 | |||
| NET ASSETS | $ | 16,250,774 | ||
| NET ASSETS CONSISTS OF: | ||||
| Capital stock | $ | 54,597,413 | ||
| Accumulated deficit | (38,346,639 | ) | ||
| Total net assets | $ | 16,250,774 | ||
| NET ASSETS: | ||||
| Investor Class | ||||
| Shares authorized (no par value) | Unlimited | |||
| Net assets applicable to outstanding shares | $ | 6,802,285 | ||
| Shares issued and outstanding | 371,536 | |||
| Net asset value, offering price, and redemption price per share | $ | 18.31 | ||
| Institutional Class | ||||
| Shares authorized (no par value) | Unlimited | |||
| Net assets applicable to outstanding shares | $ | 9,448,489 | ||
| Shares issued and outstanding | 508,093 | |||
| Net asset value, offering price, and redemption price per share | $ | 18.60 | ||
The accompanying notes are an integral part of these financial statements.
| WWW.HENNESSYFUNDS.COM |
12
| STATEMENT OF ASSETS AND LIABILITIES/STATEMENT OF OPERATIONS |
Financial Statements
Statement of Operations for the year ended October 31, 2021 |
| INVESTMENT INCOME: | ||||
| Distributions received from master limited partnerships | $ | 107,506 | ||
| Return of capital on distributions received | (107,506 | ) | ||
Dividend income from common stock(1) | 320,838 | |||
| Interest income | 42 | |||
| Total investment income | 320,880 | |||
| EXPENSES: | ||||
| Investment advisory fees (See Note 5) | 135,718 | |||
| Federal and state registration fees | 30,632 | |||
| Compliance expense (See Note 5) | 27,445 | |||
| Administration, accounting, custody, and transfer agent fees (See Note 5) | 24,086 | |||
| Audit fees | 23,108 | |||
| Trustees’ fees and expenses | 18,463 | |||
| Sub-transfer agent expenses – Investor Class (See Note 5) | 8,551 | |||
| Sub-transfer agent expenses – Institutional Class (See Note 5) | 5,423 | |||
| Reports to shareholders | 7,999 | |||
| Distribution fees – Investor Class (See Note 5) | 7,146 | |||
| Service fees – Investor Class (See Note 5) | 4,764 | |||
| Interest expense (See Note 7) | 1,193 | |||
| Legal fees | 192 | |||
| Other expenses | 5,163 | |||
| Total expenses before waivers | 299,883 | |||
| Service provider expense waiver (See Note 5) | (24,086 | ) | ||
| Net expenses | 275,797 | |||
| NET INVESTMENT INCOME | $ | 45,083 | ||
| REALIZED AND UNREALIZED GAINS (LOSSES): | ||||
| Net realized gain on investments | $ | 1,234,155 | ||
| Net change in unrealized appreciation/depreciation on investments | 5,107,361 | |||
| Net gain on investments | 6,341,516 | |||
| NET INCREASE IN NET ASSETS RESULTING FROM OPERATIONS | $ | 6,386,599 | ||
(1) | Net of foreign taxes withheld and issuance fees of $1,955. |
The accompanying notes are an integral part of these financial statements.
| HENNESSY FUNDS | 1-800-966-4354 |
13
(This Page Intentionally Left Blank.)
| WWW.HENNESSYFUNDS.COM |
14
| STATEMENTS OF CHANGES IN NET ASSETS |
Financial Statements
| Statements of Changes in Net Assets |
| Year Ended | Year Ended | |||||||
| October 31, 2021 | October 31, 2020 | |||||||
| OPERATIONS: | ||||||||
| Net investment income | $ | 45,083 | $ | 195,908 | ||||
| Net realized gain (loss) on investments | 1,234,155 | (19,552,986 | ) | |||||
| Net change in unrealized | ||||||||
| appreciation/depreciation on investments | 5,107,361 | 3,844,502 | ||||||
| Net increase (decrease) in net | ||||||||
| assets resulting from operations | 6,386,599 | (15,512,576 | ) | |||||
| DISTRIBUTIONS TO SHAREHOLDERS: | ||||||||
| Distributable earnings – Institutional Class | — | (79,003 | ) | |||||
| Total distributions | — | (79,003 | ) | |||||
| CAPITAL SHARE TRANSACTIONS: | ||||||||
| Proceeds from shares subscribed – Investor Class | 7,710,426 | 2,364,355 | ||||||
| Proceeds from shares subscribed – Institutional Class | 5,598,042 | 2,010,096 | ||||||
| Dividends reinvested – Institutional Class | — | 77,299 | ||||||
| Cost of shares redeemed – Investor Class | (6,158,757 | ) | (4,505,031 | ) | ||||
| Cost of shares redeemed – Institutional Class | (3,599,017 | ) | (29,242,373 | ) | ||||
| Net increase (decrease) in net assets | ||||||||
| derived from capital share transactions | 3,550,694 | (29,295,654 | ) | |||||
| TOTAL INCREASE (DECREASE) IN NET ASSETS | 9,937,293 | (44,887,233 | ) | |||||
| NET ASSETS: | ||||||||
| Beginning of year | 6,313,481 | 51,200,714 | ||||||
| End of year | $ | 16,250,774 | $ | 6,313,481 | ||||
| CHANGES IN SHARES OUTSTANDING: | ||||||||
| Shares sold – Investor Class | 521,054 | 265,356 | ||||||
| Shares sold – Institutional Class | 329,240 | 207,448 | ||||||
| Shares issued to holders as reinvestment | ||||||||
| of dividends – Institutional Class | — | 5,019 | ||||||
| Shares redeemed – Investor Class | (435,171 | ) | (464,633 | ) | ||||
| Shares redeemed – Institutional Class | (252,362 | ) | (2,892,945 | ) | ||||
| Net increase (decrease) in shares outstanding | 162,761 | (2,879,755 | ) | |||||
The accompanying notes are an integral part of these financial statements.
| HENNESSY FUNDS | 1-800-966-4354 |
15
Financial Statements
| Financial Highlights |
For an Investor Class share outstanding throughout each period
PER SHARE DATA:
Net asset value, beginning of period
Income from investment operations:
Net investment income (loss)(2)
Net realized and unrealized gains (losses) on investments
Total from investment operations
Net asset value, end of period
TOTAL RETURN
SUPPLEMENTAL DATA AND RATIOS:
Net assets, end of period (millions)
Ratio of expenses to average net assets:
Before expense reimbursement
After expense reimbursement
Ratio of net investment income (loss) to average net assets:
Before expense reimbursement
After expense reimbursement
Portfolio turnover rate(7)
(1) | The period ended October 31, 2018, consists of 11 months due to the Fund’s fiscal year end change from November 30 to October 31, effective October 26, 2018. |
(2) | Calculated using the average shares outstanding method. |
(3) | Not annualized. |
(4) | Annualized. |
(5) | The Fund had an expense limitation agreement in place through October 25, 2020. |
(6) | Certain service provider expenses were voluntarily waived during the fiscal year. |
(7) | Calculated on the basis of the Fund as a whole. |
The accompanying notes are an integral part of these financial statements.
| WWW.HENNESSYFUNDS.COM |
16
| FINANCIAL HIGHLIGHTS — INVESTOR CLASS |
| Year Ended October 31, | Period Ended | Year Ended November 30, | ||||||||||||||||||||
| October 31, | ||||||||||||||||||||||
| 2021 | 2020 | 2019 | 2018(1) | 2017 | 2016 | |||||||||||||||||
| $ | 8.74 | $ | 14.08 | $ | 18.32 | $ | 19.47 | $ | 20.54 | $ | 16.41 | |||||||||||
| 0.06 | 0.04 | (0.07 | ) | (0.20 | ) | (0.23 | ) | (0.15 | ) | |||||||||||||
| 9.51 | (5.38 | ) | (4.17 | ) | (0.95 | ) | (0.84 | ) | 4.28 | |||||||||||||
| 9.57 | (5.34 | ) | (4.24 | ) | (1.15 | ) | (1.07 | ) | 4.13 | |||||||||||||
| $ | 18.31 | $ | 8.74 | $ | 14.08 | $ | 18.32 | $ | 19.47 | $ | 20.54 | |||||||||||
| 109.50 | % | -37.93 | % | -23.14 | % | -5.91 | %(3) | -5.21 | % | 25.17 | % | |||||||||||
| $ | 6.80 | $ | 2.50 | $ | 6.83 | $ | 18.16 | $ | 22.66 | $ | 19.64 | |||||||||||
| 2.96 | % | 2.59 | % | 1.97 | % | 1.82 | %(4) | 1.87 | % | 1.89 | % | |||||||||||
| 2.74 | %(6) | 2.03 | %(5)(6) | 1.97 | % | 1.82 | %(4) | 1.87 | % | 1.89 | % | |||||||||||
| 0.16 | % | (0.18 | )% | (0.46 | )% | (1.05 | )%(4) | (1.21 | )% | (0.92 | )% | |||||||||||
| 0.38 | % | 0.38 | % | (0.46 | )% | (1.05 | )%(4) | (1.21 | )% | (0.92 | )% | |||||||||||
| 74 | % | 73 | % | 87 | % | 72 | %(3) | 84 | % | 83 | % | |||||||||||
The accompanying notes are an integral part of these financial statements.
| HENNESSY FUNDS | 1-800-966-4354 |
17
Financial Statements
| Financial Highlights |
For an Institutional Class share outstanding throughout each period
PER SHARE DATA:
Net asset value, beginning of period
Income from investment operations:
Net investment income (loss)(2)
Net realized and unrealized gains (losses) on investments
Total from investment operations
Less distributions:
Dividends from net investment income
Total distributions
Net asset value, end of period
TOTAL RETURN
SUPPLEMENTAL DATA AND RATIOS:
Net assets, end of period (millions)
Ratio of expenses to average net assets:
Before expense reimbursement
After expense reimbursement
Ratio of net investment income (loss) to average net assets:
Before expense reimbursement
After expense reimbursement
Portfolio turnover rate(7)
(1) | The period ended October 31, 2018, consists of 11 months due to the Fund’s fiscal year end change from November 30 to October 31, effective October 26, 2018. |
(2) | Calculated using the average shares outstanding method. |
(3) | Not annualized. |
(4) | Annualized. |
(5) | The Fund had an expense limitation agreement in place through October 25, 2020. |
(6) | Certain service provider expenses were voluntarily waived during the fiscal year. |
(7) | Calculated on the basis of the Fund as a whole. |
The accompanying notes are an integral part of these financial statements.
| WWW.HENNESSYFUNDS.COM |
18
| FINANCIAL HIGHLIGHTS — INSTITUTIONAL CLASS |
| Year Ended October 31, | Period Ended | Year Ended November 30, | ||||||||||||||||||||
| October 31, | ||||||||||||||||||||||
| 2021 | 2020 | 2019 | 2018(1) | 2017 | 2016 | |||||||||||||||||
| $ | 8.85 | $ | 14.26 | $ | 18.50 | $ | 19.61 | $ | 20.64 | $ | 16.46 | |||||||||||
| 0.07 | 0.12 | (0.02 | ) | (0.15 | ) | (0.19 | ) | (0.11 | ) | |||||||||||||
| 9.68 | (5.50 | ) | (4.22 | ) | (0.96 | ) | (0.84 | ) | 4.32 | |||||||||||||
| 9.75 | (5.38 | ) | (4.24 | ) | (1.11 | ) | (1.03 | ) | 4.21 | |||||||||||||
| — | (0.03 | ) | — | — | — | (0.03 | ) | |||||||||||||||
| — | (0.03 | ) | — | — | — | (0.03 | ) | |||||||||||||||
| $ | 18.60 | $ | 8.85 | $ | 14.26 | $ | 18.50 | $ | 19.61 | $ | 20.64 | |||||||||||
| 110.17 | % | -37.80 | % | -22.92 | % | -5.66 | %(3) | -4.99 | % | 25.61 | % | |||||||||||
| $ | 9.45 | $ | 3.82 | $ | 44.37 | $ | 78.81 | $ | 122.45 | $ | 126.92 | |||||||||||
| 2.61 | % | 2.01 | % | 1.66 | % | 1.57 | %(4) | 1.62 | % | 1.60 | % | |||||||||||
| 2.39 | %(6) | 1.77 | %(5)(6) | 1.66 | % | 1.57 | %(4) | 1.62 | % | 1.60 | % | |||||||||||
| 0.22 | % | 0.79 | % | (0.12 | )% | (0.79 | )%(4) | (0.98 | )% | (0.65 | )% | |||||||||||
| 0.44 | % | 1.03 | % | (0.12 | )% | (0.79 | )%(4) | (0.98 | )% | (0.65 | )% | |||||||||||
| 74 | % | 73 | % | 87 | % | 72 | %(3) | 84 | % | 83 | % | |||||||||||
The accompanying notes are an integral part of these financial statements.
| HENNESSY FUNDS | 1-800-966-4354 |
19
Financial Statements
Notes to the Financial Statements October 31, 2021 |
1). ORGANIZATION
The Hennessy BP Energy Transition Fund (the “Fund”) is a series of Hennessy Funds Trust (the “Trust”), which was organized as a Delaware statutory trust on September 17, 1992. The Fund is an open-end management investment company registered under the Investment Company Act of 1940, as amended. The investment objective of the Fund is to seek total return. The Fund is a diversified fund.
The Fund offers Investor Class and Institutional Class shares. Each class of shares differs principally in its respective 12b-1 distribution and service, shareholder servicing, and sub-transfer agent expenses. There are no sales charges. Each class has identical rights to earnings, assets, and voting privileges, except for class-specific expenses and exclusive rights to vote on matters affecting only one class.
As an investment company, the Fund follows the investment company accounting and reporting guidance of the Financial Accounting Standards Board (“FASB”) Accounting Standard Codification Topic 946 “Financial Services—Investment Companies.”
2). SIGNIFICANT ACCOUNTING POLICIES
The following is a summary of significant accounting policies consistently followed by the Fund in the preparation of the financial statements. These policies conform to U.S. generally accepted accounting principles (“GAAP”).
| a). | Securities Valuation – All investments in securities are valued in accordance with the Fund’s valuation policies and procedures, as described in Note 3. |
| b). | Federal Income Taxes – The Fund has elected to be taxed as a regulated investment company and intends to distribute substantially all of its taxable income to its shareholders and otherwise comply with the provisions of the Internal Revenue Code of 1986, as amended, applicable to regulated investment companies. As a result, the Fund has made no provision for federal income taxes or excise taxes. Net investment income/loss and realized gains/losses for federal income tax purposes may differ from those reported in the financial statements because of temporary book-basis and tax-basis differences. Temporary differences are primarily the result of the treatment of wash sales for tax reporting purposes and investments in companies organized as partnerships for tax purposes. The Fund recognizes interest and penalties related to income tax benefits, if any, in the Statement of Operations as an income tax expense. Distributions from net realized gains for book purposes may include short-term capital gains, which are included as ordinary income to shareholders for tax purposes. The Fund may utilize equalization accounting for tax purposes and designate earnings and profits, including net realized gains distributed to shareholders on redemption of shares, as part of the dividends paid deduction for income tax purposes. |
| Due to inherent differences in the recognition of income, expenses, and realized gains/losses under GAAP and federal income tax regulations, permanent differences between book and tax basis for reporting are identified and appropriately reclassified in the Statement of Assets and Liabilities, as needed. The adjustments for fiscal year 2021 are as follows: |
| Total | |||
| Distributable | |||
Earnings | Capital Stock | ||
| $229 | $(229) |
| WWW.HENNESSYFUNDS.COM |
20
| NOTES TO THE FINANCIAL STATEMENTS |
| c). | Accounting for Uncertainty in Income Taxes – The Fund has accounting policies regarding recognition and measurement of tax positions taken or expected to be taken on a tax return. The tax returns of the Fund for the prior three fiscal years are open for examination. The Fund has reviewed all open tax years in major tax jurisdictions and concluded that there is no impact on the Fund’s net assets and no tax liability resulting from unrecognized tax benefits relating to uncertain income tax positions taken or expected to be taken on a tax return. The Fund’s major tax jurisdictions are U.S. federal and Delaware. |
| d). | Income and Expenses – Dividend income is recognized on the ex-dividend date or as soon as information is available to the Fund. Interest income, which includes the amortization of premium and accretion of discount, is recognized on an accrual basis. Market discounts, original issue discounts, and market premiums on debt securities are accreted or amortized to interest income over the life of a security with a corresponding increase or decrease, as applicable, in the cost basis of such security using the yield-to-maturity method or, where applicable, the first call date of the security. Other non-cash dividends are recognized as investment income at the fair value of the property received. The Fund is charged for those expenses that are directly attributable to its portfolio, such as advisory, administration, and certain shareholder service fees. Income, expenses (other than expenses attributable to a specific class), and realized and unrealized gains/losses on investments are allocated to each class of shares based on such class’s net assets. Distributions received from the Fund’s investments in master limited partnerships (“MLPs”) generally consist of ordinary income, capital gains, and return of capital. The Fund records investment income on the ex-date of the distributions. For financial statement purposes, the Fund uses return of capital and income estimates to allocate the dividend income received. Such estimates are based on historical information available from the MLPs and other industry sources. These estimates may subsequently be revised based on information received from the MLPs after their tax reporting periods are concluded, as the actual character of these distributions is not known until after the fiscal year end of the Fund. |
| e). | Distributions to Shareholders – Dividends from net investment income for the Fund, if any, are declared and paid annually, usually in December. Distributions of net realized capital gains, if any, are declared and paid annually, usually in December. |
| f). | Security Transactions – Investment and shareholder transactions are recorded on the trade date. The Fund determines the realized gain/loss from an investment transaction by comparing the original cost of the security lot sold with the net sale proceeds. Discounts and premiums on securities purchased are accreted or amortized, respectively, over the life of each such security. |
| g). | Use of Estimates – Preparing financial statements in accordance with GAAP requires management to make estimates and assumptions that affect the reported amounts of assets and liabilities and disclosure of contingent assets and liabilities at the date of the financial statements, as well as the reported change in net assets during the reporting period. Actual results could differ from those estimates. |
| h). | Share Valuation – The net asset value (“NAV”) per share of the Fund is calculated by dividing (i) the total value of the securities held by the Fund, plus cash and other assets, minus all liabilities (including estimated accrued expenses) by (ii) the total number of Fund shares outstanding, rounded to the nearest $0.01. Fund shares are not priced on days the New York Stock Exchange is closed for trading. The offering and redemption price per share for the Fund is equal to the Fund’s NAV per share. |
| HENNESSY FUNDS | 1-800-966-4354 |
21
| i). | Partnership Accounting Policy – To the extent the Fund receives distributions from underlying partnerships in which it invests, the Fund records its pro rata share of income/loss and capital gains/losses and accordingly adjusts the cost basis of the underlying partnerships for return of capital. |
| j). | Recent Accounting Pronouncements and Regulatory Updates – In October 2020, the Securities and Exchange Commission (“SEC”) adopted new regulations governing the use of derivatives by registered investment companies (“Rule 18f-4”). Rule 18f-4 imposes limits on the amount of derivatives a fund can enter into, eliminates the asset segregation framework currently used by funds to comply with Section 18 of the 1940 Act, and requires funds whose use of derivatives is greater than a limited specified amount to establish and maintain a comprehensive derivatives risk management program and appoint a derivatives risk manager. Funds are required to comply with Rule 18f-4 by August 19, 2022. The impact, if any, that Rule 18f-4 will have on the availability, liquidity, and performance of derivatives is unclear. Management is currently evaluating the potential impact of Rule 18f-4 on the Fund. When fully implemented, Rule 18f-4 may require changes in how the Fund uses derivatives, adversely affect the Fund’s performance, and increase costs related to the Fund’s use of derivatives. |
| In December 2020, the SEC adopted a new rule providing a framework for fund valuation practices (“Rule 2a-5”). Rule 2a-5 establishes requirements for determining fair value in good faith for purposes of the 1940 Act. Rule 2a-5 permits fund boards to designate certain parties to perform fair value determinations, subject to board oversight and certain other conditions. Rule 2a-5 also defines when market quotations are “readily available” for purposes of the 1940 Act and the threshold for determining whether a fund must fair value a security. In connection with Rule 2a-5, the SEC also adopted related recordkeeping requirements and is rescinding previously issued guidance, including with respect to the role of a board in determining fair value and the accounting and auditing of fund investments. Funds must comply with the rules by September 8, 2022. Management is currently assessing the potential impact of the new rules on the Fund’s financial statements. |
3). SECURITIES VALUATION
The Fund follows its valuation policies and procedures in determining its net asset value and, in preparing these financial statements, the fair value accounting standards that establish an authoritative definition of fair value and set out a hierarchy for measuring fair value. These standards require additional disclosures about the various inputs and valuation techniques used to develop the measurements of fair value and a discussion of changes in valuation techniques and related inputs during the period. These inputs are summarized in the three broad levels listed below:
| Level 1 – | Unadjusted, quoted prices in active markets for identical instruments that the Fund has the ability to access at the date of measurement. | |
| Level 2 – | Other significant observable inputs (including, but not limited to, quoted prices in active markets for similar instruments, quoted prices in markets that are not active for identical or similar instruments, and model-derived valuations in which all significant inputs and significant value drivers are observable in active markets, such as interest rates, prepayment speeds, credit risk curves, default rates, and similar data). | |
| Level 3 – | Significant unobservable inputs (including the Fund’s own assumptions about what market participants would use to price the asset or liability based on the best available information) when observable inputs are unavailable. |
| WWW.HENNESSYFUNDS.COM |
22
| NOTES TO THE FINANCIAL STATEMENTS |
The following is a description of the valuation techniques applied to the Fund’s major categories of assets and liabilities on a recurring basis:
Equity Securities – Equity securities, including common stocks, preferred stocks, foreign-issued common stocks, exchange-traded funds, closed-end mutual funds, partnerships, rights, MLPs, and real estate investment trusts, that are traded on a securities exchange for which a last-quoted sales price is readily available generally are valued at the last sales price as reported by the primary exchange on which the securities are listed. Securities listed on The NASDAQ Stock Market (“NASDAQ”) generally are valued at the NASDAQ Official Closing Price, which may differ from the last sales price reported. Securities traded on a securities exchange for which a last-quoted sales price is not readily available generally are valued at the mean between the bid and ask prices. To the extent these securities are actively traded and valuation adjustments are not applied, they are classified in Level 1 of the fair value hierarchy. Securities traded on foreign exchanges generally are not valued at the same time the Fund calculates its NAV because most foreign markets close well before such time. The earlier close of most foreign markets gives rise to the possibility that significant events, including broad market moves, may have occurred in the interim. In certain circumstances, it may be determined that a foreign security needs to be fair valued because it appears that the value of the security might have been materially affected by events occurring after the close of the market in which the security is principally traded, but before the time the Fund calculates its NAV, such as by a development that affects an entire market or region (e.g., a weather-related event) or a potentially global development (e.g., a terrorist attack that may be expected to have an effect on investor expectations worldwide). | |
Registered Investment Companies – Investments in open-end registered investment companies, commonly referred to as mutual funds, generally are priced at the ending NAV provided by the applicable mutual fund’s service agent and are classified in Level 1 of the fair value hierarchy. | |
Debt Securities – Debt securities, including corporate bonds, asset-backed securities, mortgage-backed securities, municipal bonds, U.S. Treasuries, and U.S. government agency issues, are generally valued at market on the basis of valuations furnished by an independent pricing service that utilizes both dealer-supplied valuations and formula-based techniques. The pricing service may consider recently executed transactions in securities of the issuer or comparable issuers, market price quotations (where observable), bond spreads, and fundamental data relating to the issuer. In addition, the model may incorporate observable market data, such as reported sales of similar securities, broker quotes, yields, bids, offers, and reference data. Certain securities are valued primarily using dealer quotations. These securities are generally classified in Level 2 of the fair value hierarchy. | |
Short-Term Securities – Short-term equity investments, including money market funds, are valued in the manner specified above for equity securities. Short-term debt investments with an original term to maturity of 60 days or less are valued at amortized cost, which approximates fair market value. If the original term to maturity of a short-term debt investment exceeds 60 days, then the values as of the 61st day prior to maturity are amortized. Amortized cost is not used if its use would be inappropriate due to credit or other impairments of the issuer, in which case the security’s fair value would be determined as described below. Short-term securities are generally classified in Level 1 or Level 2 of the fair value hierarchy depending on the inputs used and market activity levels for specific securities. |
| HENNESSY FUNDS | 1-800-966-4354 |
23
The Board of Trustees of the Fund (the “Board”) has adopted fair value pricing procedures that are followed when a price for a security is not readily available or if a significant event has occurred that indicates the closing price of a security no longer represents the true value of that security. Fair value pricing determinations are made in good faith in accordance with these procedures. There are numerous criteria considered in determining a fair value of a security, such as the trading volume of a security and markets, the values of other similar securities, and news events with direct bearing on a security or markets. Fair value pricing results in an estimated price for a security that reflects the amount the Fund might reasonably expect to receive in a current sale. Depending on the relative significance of the valuation inputs, these securities may be classified in either Level 2 or Level 3 of the fair value hierarchy.
The fair value of foreign securities may be determined with the assistance of a pricing service using correlations between the movement of prices of such securities and indices of domestic securities and other appropriate indicators, such as closing market prices of relevant American Depositary Receipts or futures contracts. Using fair value pricing means that the Fund’s NAV reflects the affected portfolio securities’ values as determined by the Board or its designee, pursuant to the fair value pricing procedures adopted by the Board, instead of being determined by the market. Using a fair value pricing methodology to price a foreign security may result in a value that is different from such foreign security’s most recent closing price and from the value used by other investment companies to calculate their NAVs. Such securities are generally classified in Level 2 of the fair value hierarchy. Because the Fund may invest in foreign securities, the value of the Fund’s portfolio securities may change on days when a shareholder is unable to purchase or redeem Fund shares.
The Board has delegated day-to-day valuation matters to the Valuation and Liquidity Committee comprising representatives from Hennessy Advisors, Inc., the Fund’s investment advisor (the “Advisor”). The function of the Valuation and Liquidity Committee, among other things, is to value securities where current and reliable market quotations are not readily available. All actions taken by the Valuation and Liquidity Committee are reviewed by the Board.
The Fund has performed an analysis of all existing investments to determine the significance and character of all inputs to their fair value determinations. Various inputs are used to determine the value of the Fund’s investments. The inputs or methodology used for valuing securities are not necessarily an indication of the risk associated with investing in those securities. Details related to the fair value hierarchy of the Fund’s securities as of October 31, 2021, are included in the Schedule of Investments.
4). INVESTMENT TRANSACTIONS
Purchases and sales of investment securities (excluding government and short-term investments) for the Fund during fiscal year 2021 were $10,971,013 and $7,744,563, respectively.
There were no purchases or sales/maturities of long-term U.S. government securities for the Fund during fiscal year 2021.
5). INVESTMENT ADVISORY FEE AND OTHER TRANSACTIONS WITH AFFILIATES
The Advisor provides the Fund with investment advisory services under an Investment Advisory Agreement. The Advisor oversees the provision of investment advice and furnishes office space, facilities, and most of the personnel needed by the Fund. As compensation for its services, the Advisor is entitled to a monthly fee from the Fund. The fee is based on the average daily net assets of the Fund at an annual rate of 1.25 %. The net investment advisory fees expensed by the Fund during fiscal year 2021 are included in the Statement of Operations.
| WWW.HENNESSYFUNDS.COM |
24
| NOTES TO THE FINANCIAL STATEMENTS |
The Advisor has delegated the day-to-day management of the Fund to a sub-advisor, BP Capital Fund Advisors, LLC. The Advisor pays the sub-advisory fees from its own assets, and these fees are not an additional expense of the Fund. During fiscal year 2021, the Advisor (not the Fund) paid a sub-advisory fee at the rate of 0.40% of the daily net assets of the Fund.
From October 26, 2018, through October 25, 2020, the Advisor contractually agreed to limit total annual operating expenses to 2.00% of the Fund’s net assets for Investor Class shares and 1.75% of the Fund’s net assets for Institutional Class shares (in each case, excluding all federal, state, and local taxes, interest, brokerage commissions, dividend and interest expenses on short sales, extraordinary items, and acquired fund fees and expenses and other costs incurred in connection with the purchase and sale of securities).
For three years following the date on which expenses were waived or incurred, the Advisor may recoup waived or reimbursed expenses from the Fund if total operating expenses, including such recoupment, does not exceed the expense limitation in effect (i) at the time the Advisor waived or reimbursed such expenses and (ii) at the time the Advisor recoups such expenses. As of October 31, 2021, expenses subject to potential recovery were $22,749 for Investor Class shares and $38,580 for Institutional Class shares, both of which expire in fiscal year 2023. The Advisor did not recoup expenses from the Fund during fiscal year 2021.
The Board has approved a Shareholder Servicing Agreement for Investor Class shares of the Fund, which compensates the Advisor for the non-investment advisory services it provides to the Fund. The Shareholder Servicing Agreement provides for a monthly fee paid to the Advisor at an annual rate of 0.10% of the average daily net assets of the Fund attributable to Investor Class shares. The shareholder service fees expensed by the Fund during fiscal year 2021 are included in the Statement of Operations.
The Fund has adopted a plan pursuant to Rule 12b-1 under the Investment Company Act of 1940, as amended, that authorizes payments in connection with the distribution of Fund shares at an annual rate of up to 0.25% of the Fund’s average daily net assets attributable to Investor Class shares. Even though the authorized rate is up to 0.25%, the Fund is currently only using up to 0.15% of its average daily net assets attributable to Investor Class shares for such purpose. Amounts paid under the plan may be spent on any activities or expenses primarily intended to result in the sale of shares, including, but not limited to, advertising, shareholder account servicing, printing and mailing of prospectuses to other than current shareholders, printing and mailing of sales literature, and compensation for sales and marketing activities or to financial institutions and others, such as dealers and distributors. The distribution fees expensed by the Fund during fiscal year 2021 are included in the Statement of Operations.
The Fund has entered into agreements with various brokers, dealers, and financial intermediaries in connection with the sale of Fund shares. The agreements provide for periodic payments of sub-transfer agent expenses by the Fund to the brokers, dealers, and financial intermediaries for providing certain shareholder maintenance services. These shareholder services include the pre-processing and quality control of new accounts, shareholder correspondence, answering customer inquiries regarding account status, and facilitating shareholder telephone transactions. The sub-transfer agent fees expensed by the Fund during fiscal year 2021 are included in the Statement of Operations.
U.S. Bancorp Fund Services, LLC, d/b/a U.S. Bank Global Fund Services (“Fund Services”) provides the Fund with administrative, accounting, and transfer agent services. As administrator, Fund Services is responsible for activities such as (i) preparing various federal and state regulatory filings, reports, and returns for the Fund, (ii) preparing
| HENNESSY FUNDS | 1-800-966-4354 |
25
reports and materials to be supplied to the Board, (iii) monitoring the activities of the Fund’s custodian, transfer agent, and accountants, and (iv) coordinating the preparation and payment of the Fund’s expenses and reviewing the Fund’s expense accruals. U.S. Bank N.A., an affiliate of Fund Services, serves as the Fund’s custodian. The servicing agreements between the Trust, Fund Services, and U.S. Bank N.A. contain a fee schedule that is inclusive of administrative, accounting, custody, and transfer agent fees. The administrative, accounting, custody, and transfer agent fees expensed by the Fund during fiscal year 2021 are included in the Statement of Operations. Fund Services has voluntarily waived all or a portion of its fees for the Fund. The fees voluntarily waived by Fund Services during fiscal year 2021 are included in the Statement of Operations.
Quasar Distributors, LLC (“Quasar”), a wholly owned broker-dealer subsidiary of Foreside Financial Group, LLC (“Foreside”), acts as the Fund’s principal underwriter in a continuous public offering of Fund shares. Effective September 30, 2021, Genstar Capital, a private equity firm specializing in financial and related business service companies, acquired a majority interest in Foreside. The Board approved a new Distribution Agreement to enable Quasar to continue serving as the Fund’s distributor following the change in control of Foreside.
The officers of the Fund are affiliated with the Advisor. With the exception of the Chief Compliance Officer and the Senior Compliance Officer, such officers receive no compensation from the Fund for serving in their respective roles. The Fund, along with the other funds in the Hennessy Funds family (collectively, the “Hennessy Funds”), makes reimbursement payments on an equal basis to the Advisor for a portion of the salary and benefits associated with the office of the Chief Compliance Officer and for all of the salary and benefits associated with the office of the Senior Compliance Officer. The compliance fees expensed by the Fund during fiscal year 2021 are included in the Statement of Operations.
6). GUARANTEES AND INDEMNIFICATIONS
Under the Hennessy Funds’ organizational documents, their officers and trustees are indemnified by the Hennessy Funds against certain liabilities arising out of the performance of their duties to the Hennessy Funds. Additionally, in the normal course of business, the Hennessy Funds enter into contracts with service providers that contain general indemnification clauses. The Fund’s maximum exposure under these arrangements is unknown as this would involve future claims that may be made against the Fund that have not yet occurred. Currently, the Fund expects the risk of loss to be remote.
7). LINE OF CREDIT
The Fund has an uncommitted line of credit with the other Hennessy Funds in the amount of the lesser of (i) $100,000,000 or (ii) 33.33% of each Hennessy Fund’s net assets, or 30% for the Hennessy Gas Utility Fund and 10% for the Hennessy Balanced Fund. The line of credit is intended to provide any necessary short-term financing in connection with shareholder redemptions, subject to certain restrictions. The credit facility is with the Hennessy Funds’ custodian bank, U.S. Bank N.A. Borrowings under this arrangement bear interest at the bank’s prime rate and are secured by all of the Fund’s assets (as to its own borrowings only). During fiscal year 2021, the Fund had an outstanding average daily balance and a weighted average interest rate of $36,214 and 3.25%, respectively. The interest expensed by the Fund during fiscal year 2021 is included in the Statement of Operations. The maximum amount outstanding for the Fund during fiscal year 2021 was $632,000. As of October 31, 2021, the Fund did not have any borrowings outstanding under the line of credit.
| WWW.HENNESSYFUNDS.COM |
26
| NOTES TO THE FINANCIAL STATEMENTS |
8). FEDERAL TAX INFORMATION
As of October 31, 2021, the components of accumulated earnings (losses) for income tax purposes were as follows:
| Investments | ||||
| Cost of investments for tax purposes | $ | 14,993,677 | ||
| Gross tax unrealized appreciation | $ | 3,082,255 | ||
| Gross tax unrealized depreciation | (1,734,192 | ) | ||
| Net tax unrealized appreciation/(depreciation) | $ | 1,348,063 | ||
| Undistributed ordinary income | $ | 1,939,323 | ||
| Undistributed long-term capital gains | — | |||
| Total distributable earnings | $ | 1,939,323 | ||
| Other accumulated gain/(loss) | $ | (41,634,025 | ) | |
| Total accumulated gain/(loss) | $ | (38,346,639 | ) | |
The difference between book-basis unrealized appreciation/depreciation and tax-basis unrealized appreciation/depreciation (as shown above) is attributable primarily to wash sales and partnership adjustments.
As of October 31, 2021, the Fund had $22,971,925 in unlimited long-term and $18,662,100 in unlimited short-term capital loss carryforwards.
Capital losses sustained in or after fiscal year 2012 can be carried forward indefinitely, but any such loss retains the character of the original loss and must be utilized prior to any loss incurred before fiscal year 2012. As a result of this ordering rule, capital loss carryforwards incurred prior to fiscal year 2012 may be more likely to expire unused. Capital losses sustained prior to fiscal year 2012 can be carried forward for eight years and can be carried forward as short-term capital losses regardless of the character of the original loss.
As of October 31, 2021, the Fund did not defer, on a tax basis, any late-year ordinary losses. Late-year ordinary losses are net ordinary losses incurred after December 31, 2020, but within the taxable year, that are deemed to arise on the first day of the Fund’s next taxable year.
During fiscal years 2021 and 2020, the tax character of distributions paid by the Fund was as follows:
| Year Ended | Year Ended | ||||||||
| October 31, 2021 | October 31, 2020 | ||||||||
Ordinary income(1) | $ | — | $ | 79,003 | |||||
| Long-term capital gains | — | — | |||||||
| Total distributions | $ | — | $ | 79,003 | |||||
(1) Ordinary income includes short-term capital gains. |
9). EVENTS SUBSEQUENT TO YEAR END
Management has evaluated the Fund’s related events and transactions that occurred subsequent to October 31, 2021, through the date of issuance of the Fund’s financial statements. Management has determined that there were no subsequent events requiring recognition or disclosure in the financial statements.
| HENNESSY FUNDS | 1-800-966-4354 |
27
Report of Independent Registered Public
Accounting Firm
To the Board of Trustees of Hennessy Funds Trust
and the shareholders of the Hennessy BP Energy Transition Fund
Novato, CA
Opinion on the Financial Statements
We have audited the accompanying statement of assets and liabilities of the Hennessy BP Energy Transition Fund (the “Fund”), a series of Hennessy Funds Trust, including the schedule of investments, as of October 31, 2021, the related statement of operations for the year then ended, the statements of changes in net assets for each of the two years in the period then ended, the financial highlights for each of the three years in the period then ended, for the eleven months ended October 31, 2018, and each of the two years in the period ended November 30, 2017, and the related notes (collectively referred to as the “financial statements”). In our opinion, the financial statements present fairly, in all material respects, the financial position of the Fund as of October 31, 2021, the results of its operations for the year then ended, the changes in its net assets for each of the two years in the period then ended and the financial highlights for each of the three years in the period then ended, for the eleven months ended October 31, 2018, and each of the two years in the period ended November 30, 2017, in conformity with accounting principles generally accepted in the United States of America.
Basis for Opinion
These financial statements are the responsibility of the Fund’s management. Our responsibility is to express an opinion on the Fund’s financial statements based on our audits. We are a public accounting firm registered with the Public Company Accounting Oversight Board (United States) (“PCAOB”) and are required to be independent with respect to the Fund in accordance with the U.S. federal securities laws and the applicable rules and regulations of the Securities and Exchange Commission and the PCAOB. We have served as the auditor of one or more of the funds in the Trust since 2002.
We conducted our audits in accordance with the standards of the PCAOB. Those standards require that we plan and perform the audit to obtain reasonable assurance about whether the financial statements are free of material misstatement, whether due to error or fraud. The Fund is not required to have, nor were we engaged to perform, an audit of its internal control over financial reporting. As part of our audits we are required to obtain an understanding of internal control over financial reporting, but not for the purpose of expressing an opinion on the effectiveness of the Fund’s internal control over financial reporting. Accordingly, we express no such opinion.
Our audits included performing procedures to assess the risks of material misstatement of the financial statements, whether due to error or fraud, and performing procedures that respond to those risks. Such procedures included examining, on a test basis, evidence regarding the amounts and disclosures in the financial statements. Our audits also included evaluating the accounting principles used and significant estimates made by management, as well as evaluating the overall presentation of the financial statements. Our procedures included confirmation of securities owned as of October 31, 2021, by correspondence with the custodian. We believe that our audits provide a reasonable basis for our opinion.
| |
| TAIT, WELLER & BAKER LLP |
Philadelphia, Pennsylvania
December 22, 2021
| WWW.HENNESSYFUNDS.COM |
28
| REPORT OF INDEPENDENT REGISTERED PUBLIC ACCOUNTING FIRM/TRUSTEES AND OFFICERS |
Trustees and Officers of the Fund (Unaudited)
The business and affairs of the Funds are managed under the direction of the Board of Trustees of the Trust, and the Board of Trustees elects the officers of the Trust. From time to time, the Board of Trustees also has appointed advisers to the Board of Trustees (“Advisers”) with the intention of having qualified individuals serve in an advisory capacity to garner experience in the mutual fund and asset management industry and be considered as potential Trustees in the future. There are currently two Advisers, Brian Alexander and Doug Franklin. As Advisers, Mr. Alexander and Mr. Franklin attend meetings of the Board of Trustees and act as non-voting participants. Information pertaining to the Trustees, Advisers, and the officers of the Trust is set forth below. The Trustees and officers serve until their successors are duly elected and qualified or until their earlier death, resignation, or removal. Each Trustee oversees all 16 Hennessy Funds. Unless otherwise indicated, the address of all persons listed below is 7250 Redwood Boulevard, Suite 200, Novato, CA 94945. The Fund’s Statement of Additional Information includes more information about the persons listed below and is available without charge by calling 1-800-966-4354 or by visiting www.hennessyfunds.com.
| Other | |||
| Directorships | |||
| Held Outside | |||
| Name, Age, | of Fund | ||
| and Position Held | Start Date | Principal Occupation(s) | Complex During |
with the Trust | of Service | During Past Five Years | Past Five Years |
| Disinterested Trustees and Advisers | |||
| J. Dennis DeSousa | January 1996 | Mr. DeSousa is a real estate investor. | None. |
| 85 | |||
| Trustee | |||
| Robert T. Doyle | January 1996 | Mr. Doyle has been the Sheriff of | None. |
| 74 | Marin County, California since 1996. | ||
| Trustee | |||
| Claire Garvie | December 2015 | Ms. Garvie is a founder of Kiosk and | None. |
| 47 | as an Adviser | has served as its Chief Operating | |
| Trustee | to the Board | Officer since 2004. Kiosk is a full- | |
| and | service marketing agency with | ||
| December 2021 | offices in the San Francisco Bay Area, | ||
| as a Trustee | Toronto, and Liverpool, UK. | ||
| Gerald P. Richardson | May 2004 | Mr. Richardson is an independent | None. |
| 76 | consultant in the securities industry. | ||
| Trustee |
| HENNESSY FUNDS | 1-800-966-4354 |
29
| Other | |||
| Directorships | |||
| Held Outside | |||
| Name, Age, | of Fund | ||
| and Position Held | Start Date | Principal Occupation(s) | Complex During |
with the Trust | of Service | During Past Five Years | Past Five Years |
| Brian Alexander | March 2015 | Mr. Alexander has worked for the | None. |
| 40 | Sutter Health organization since | ||
| Adviser to the Board | 2011 in various positions. He has | ||
| served as the Chief Executive Officer | |||
| of the Sutter Roseville Medical | |||
| Center since 2018. From 2016 through | |||
| 2018, he served as the Vice President | |||
| of Strategy for the Sutter Health Valley | |||
| Area, which includes 11 hospitals, | |||
| 13 ambulatory surgery centers, | |||
| 16,000 employees, and 1,900 physicians. | |||
| From 2013 through 2016, Mr. Alexander | |||
| served as Sutter Novato Community | |||
| Hospital’s Chief Administrative Officer. | |||
| Doug Franklin | March 2016 | Mr. Franklin is a retired insurance | None. |
| 57 | industry executive. From 1987 | ||
| Adviser to the Board | through 2015, he was employed | ||
| by the Allianz-Fireman’s Fund | |||
| Insurance Company in various | |||
| positions, including as its Chief | |||
| Actuary and Chief Risk Officer. | |||
Interested Trustee(1) | |||
| Neil J. Hennessy | January 1996 as | Mr. Hennessy has been employed | Hennessy |
| 65 | a Trustee and | by Hennessy Advisors, Inc. since | Advisors, Inc. |
| Chairman of the Board, | June 2008 as | 1989 and currently serves as its | |
| Chief Market Strategist, | an officer | Chairman and Chief Executive Officer. | |
| Portfolio Manager, | |||
| and President |
| Name, Age, | ||
| and Position Held | Start Date | Principal Occupation(s) |
with the Trust | of Service | During Past Five Years |
| Officers | ||
| Teresa M. Nilsen | January 1996 | Ms. Nilsen has been employed by Hennessy Advisors, Inc. |
| 55 | since 1989 and currently serves as its President and Chief | |
| Executive Vice President | Operating Officer. | |
| and Treasurer | ||
| Daniel B. Steadman | March 2000 | Mr. Steadman has been employed by Hennessy Advisors, Inc. |
| 65 | since 2000 and currently serves as its Executive Vice President. | |
| Executive Vice President | ||
| and Secretary | ||
| Brian Carlson | December 2013 | Mr. Carlson has been employed by Hennessy Advisors, Inc. |
| 49 | since December 2013 and currently serves as its Chief | |
| Senior Vice President | Compliance Officer and Senior Vice President. | |
| and Head of Distribution |
| WWW.HENNESSYFUNDS.COM |
30
| TRUSTEES AND OFFICERS OF THE FUND |
| Name, Age, | ||
| and Position Held | Start Date | Principal Occupation(s) |
with the Trust | of Service | During Past Five Years |
Jennifer Cheskiewicz(2) | June 2013 | Ms. Cheskiewicz has been employed by Hennessy Advisors, Inc. |
| 44 | as its General Counsel since June 2013. | |
| Senior Vice President and | ||
| Chief Compliance Officer | ||
David Ellison(3) | October 2012 | Mr. Ellison has been employed by Hennessy Advisors, Inc. since |
| 63 | October 2012. He has served as a Portfolio Manager of the | |
| Senior Vice President | Hennessy Large Cap Financial Fund and the Hennessy Small | |
| and Portfolio Manager | Cap Financial Fund since their inception. Mr. Ellison also served | |
| as a Portfolio Manager of the Hennessy Technology Fund from | ||
| its inception until February 2017. Mr. Ellison served as Director, | ||
| CIO, and President of FBR Fund Advisers, Inc. from December | ||
| 1999 to October 2012. | ||
Ryan Kelley(4) | March 2013 | Mr. Kelley has been employed by Hennessy Advisors, Inc. since |
| 49 | October 2012. He has served as Chief Investment Officer of the | |
| Chief Investment Officer, | Hennessy Funds since March 2021 and has served as a Portfolio | |
| Senior Vice President, | Manager of the Hennessy Gas Utility Fund, the Hennessy Large | |
| and Portfolio Manager | Cap Financial Fund, and the Hennessy Small Cap Financial Fund | |
| since October 2014. Mr. Kelley served as Co-Portfolio Manager | ||
| of these same funds from March 2013 through September | ||
| 2014 and as a Portfolio Analyst for the Hennessy Funds from | ||
| October 2012 through February 2013. He has also served as a | ||
| Portfolio Manager of the Hennessy Cornerstone Growth Fund, | ||
| the Hennessy Cornerstone Mid Cap 30 Fund, the Hennessy | ||
| Cornerstone Large Growth Fund, and the Hennessy | ||
| Cornerstone Value Fund since February 2017 and as a Portfolio | ||
| Manager of the Hennessy Total Return Fund, the Hennessy | ||
| Balanced Fund, and the Hennessy Technology Fund since May | ||
| 2018. He served as Co-Portfolio Manager of the Hennessy | ||
| Technology Fund from February 2017 until May 2018. Mr. Kelley | ||
| served as Portfolio Manager of FBR Fund Advisers, Inc. from | ||
| January 2008 to October 2012. | ||
L. Joshua Wein(4) | September 2018 | Mr. Wein has been employed by Hennessy Advisors, Inc. since |
| 48 | 2018. He has served as Co-Portfolio Manager of the Hennessy | |
| Vice President and | Cornerstone Growth Fund, the Hennessy Cornerstone | |
| Co-Portfolio Manager | Mid Cap 30 Fund, the Hennessy Cornerstone Large Growth | |
| Fund, the Hennessy Cornerstone Value Fund, Hennessy Total | ||
| Return Fund, the Hennessy Balanced Fund, the Hennessy Gas | ||
| Utility Fund, and the Hennessy Technology Fund since February | ||
| 2019. He served as a Senior Analyst of these same funds from | ||
| September 2018 through February 2019. Mr. Wein served as | ||
| Director of Alternative Investments and Co-Portfolio Manager | ||
| at Sterling Capital Management from 2008 to 2018. |
_______________
(1) | Mr. Hennessy is considered an “interested person,” as defined in the Investment Company Act of 1940, as amended, because he is an officer of the Trust. |
(2) | The address of this officer is 4800 Bee Caves Road, Suite 100, Austin, TX 78746. |
(3) | The address of this officer is 101 Federal Street, Suite 1615B, Boston, MA 02110. |
(4) | The address of this officer is 1340 Environ Way, Chapel Hill, NC 27517. |
| HENNESSY FUNDS | 1-800-966-4354 |
31
Expense Example (Unaudited)
October 31, 2021
As a shareholder of the Fund, you incur ongoing costs, including management fees, service fees, and other Fund expenses. This Example is intended to help you understand your ongoing costs (in dollars) of investing in the Fund and to compare these costs with the ongoing costs of investing in other mutual funds. The Example is based on an investment of $1,000 invested at the beginning of the period and held for the entire period from May 1, 2021, through October 31, 2021.
Actual Expenses
In the table below, the first line under each of the “Investor Class” and “Institutional Class” headings provides information about actual account values and actual expenses for each share class. You may use this information, together with the amount you invested, to estimate the expenses that you paid over the period. Simply divide your account value by $1,000 (for example, an $8,600 account value divided by $1,000 = 8.6), then multiply the result by the number in the first line under the heading “Expenses Paid During Period” to estimate the expenses you paid on your account during this period. Although the Fund charges no sales loads or transaction fees, you will be assessed fees for outgoing wire transfers, returned checks, and stop payment orders at prevailing rates charged by U.S. Bank Global Fund Services, the Fund’s transfer agent. If you request that a redemption be made by wire transfer, the Fund’s transfer agent charges a $15 fee. IRAs are charged a $15 annual maintenance fee (up to $30 maximum per shareholder for shareholders with multiple IRAs). The examples below include, but are not limited to, management, shareholder servicing, accounting, custody, and transfer agent fees. However, the examples below do not include portfolio trading commissions and related expenses.
Hypothetical Example for Comparison Purposes
In the table below, the second line under each of the “Investor Class” and “Institutional Class” headings provides information about hypothetical account values and hypothetical expenses based on the Fund’s actual expense ratio for each share class and an assumed rate of return of 5% per year before expenses, which is not the Fund’s actual return for such share class. The hypothetical account values and expenses may not be used to estimate the actual ending account balance or expenses you paid for the period. You may use this information to compare the ongoing costs of investing in the Fund and other funds. To do so, compare these 5% hypothetical examples with the 5% hypothetical examples that appear in the shareholder reports of the other funds. Please note that the expenses shown in the table are meant to highlight your ongoing costs only. Therefore, the second lines under “Investor Class” and “Institutional Class” are useful in comparing ongoing costs only and will not help you determine the relative total costs of owning different funds.
| WWW.HENNESSYFUNDS.COM |
32
| EXPENSE EXAMPLE |
| Expenses Paid | |||
| Beginning | Ending | During Period(1) | |
| Account Value | Account Value | May 1, 2021 – | |
May 1, 2021 | October 31, 2021 | October 31, 2021 | |
| Investor Class | |||
| Actual | $1,000.00 | $1,228.90 | $14.49 |
| Hypothetical (5% return before expenses) | $1,000.00 | $1,012.20 | $13.09 |
| Institutional Class | |||
| Actual | $1,000.00 | $1,231.80 | $12.71 |
| Hypothetical (5% return before expenses) | $1,000.00 | $1,013.81 | $11.47 |
(1) | Expenses are equal to the Fund’s annualized expense ratio of 2.58% for Investor Class shares or 2.26% for Institutional Class shares, as applicable, multiplied by the average account value over the period, multiplied by 184/365 days (to reflect the half-year period). |
| HENNESSY FUNDS | 1-800-966-4354 |
33
How to Obtain a Copy of the Fund’s Proxy
Voting Policy and Proxy Voting Records
A description of the policies and procedures the Fund uses to determine how to vote proxies relating to portfolio securities is available without charge (1) by calling 1-800-966-4354, (2) on the Hennessy Funds’ website at www.hennessyfunds.com/proxy-voting/voting-policy, or (3) on the U.S. Securities and Exchange Commission’s (the “SEC”) website at www.sec.gov. The Fund’s proxy voting record is available without charge on both the Hennessy Funds’ website at www.hennessyfunds.com/proxy-voting/voting-record and the SEC’s website at www.sec.gov no later than August 31 for the prior 12 months ending June 30.
Availability of Quarterly Portfolio Schedule
The Fund files a complete schedule of portfolio holdings with the SEC for the first and third quarters of each fiscal year as an exhibit to its reports on Form N-PORT. The Fund’s Form N-PORT reports are available on the SEC’s website at www.sec.gov or on request by calling 1-800-966-4354.
Important Notice Regarding Delivery
of Shareholder Documents
To help keep the Fund’s costs as low as possible, we generally deliver a single copy of shareholder reports, proxy statements, and prospectuses to shareholders who share an address and have the same last name. This process does not apply to account statements. You may request an individual copy of a shareholder document at any time. If you would like to receive separate mailings of shareholder documents, please call U.S. Bank Global Fund Services at 1-800-261-6950 or 1-414-765-4124, and individual delivery will begin within 30 days of your request. If your account is held through a financial institution or other intermediary, please contact such intermediary directly to request individual delivery.
Electronic Delivery
As permitted by SEC regulations, the Fund’s shareholder reports are made available on a website, and unless you sign up for eDelivery or elect to receive paper copies as detailed below, you will be notified by mail each time a report is posted and provided with a website link to access the report.
The Fund also offers shareholders the option to receive all notices, account statements, prospectuses, tax forms, and shareholder reports online. To sign up for eDelivery or change your delivery preference, please visit www.hennessyfunds.com/account.
To elect to receive paper copies of all future reports free of charge, please call U.S. Bank Global Fund Services at 1-800-261-6950 or 1-414-765-4124.
Subscribe to receive our team’s unique market and sector insights delivered to your inbox
www.hennessyfunds.com/subscribe
Follow us on social media
| | |
| WWW.HENNESSYFUNDS.COM |
34
| PROXY VOTING — PRIVACY POLICY |
Liquidity Risk Management Program
In accordance with Rule 22e-4 under the Investment Company Act of 1940, as amended (the “Liquidity Rule”), we have adopted and implemented a liquidity risk management program (the “Liquidity Program”). The purpose of the Liquidity Program is to assess and manage the Fund’s liquidity risk, which is the risk that the Fund would not be able to meet requests to redeem Fund shares without significant dilution of the remaining shareholders’ interests in the Fund. The Board of Trustees of the Fund (the “Board”) designated a committee comprising representatives of Hennessy Advisors, Inc., the investment adviser to the Fund, as the administrator of the Liquidity Program (the “Program Administrator”).
The Program Administrator provided a written report regarding the Liquidity Program to the Board in advance of its meeting on June 2, 2021. The report covered the period from June 1, 2020, through May 31, 2021. The report addressed the operation of the Liquidity Program, assessed the adequacy and effectiveness of its implementation, and described any material changes to the Liquidity Program during the review period. The Trust’s chief compliance officer presented the report to the Board at the meeting and provided additional information regarding the Liquidity Program. The Board reviewed the Liquidity Program and considered, among other items, the following:
| 1. | The Program Administrator reviewed daily historical net redemption activity during the review period and during prior periods with higher-than-average redemption activity and concluded that the Fund has historically been able to meet requests to redeem Fund shares without significant dilution to the Fund’s remaining shareholders, and the Program Administrator expects the Fund to be able to continue to do so in the future during both normal and reasonably foreseeable stressed conditions. | |
| 2. | The Fund holds assets that are highly liquid investments and is therefore not required to establish a highly liquid investment minimum for the Fund or adopt policies and procedures for responding to a highly liquid investment minimum shortfall. | |
| 3. | The Program Administrator did not make any material changes to the Liquidity Program during the review period and did not recommend any changes to the Liquidity Program. The Program Administrator did make adjustments to the model inputs used to determine the liquidity classification of each security held by the Fund. | |
| 4. | The Program Administrator concluded that the Liquidity Program was reasonably designed to assess and manage the Fund’s liquidity risk, complies with the requirements of the Liquidity Rule, and was operating as intended during the review period. |
Privacy Policy
We collect the following personal information about you:
| 1. | Information we receive from you in applications or other forms, correspondence, or conversations, including, but not limited to, your name, address, phone number, social security number, assets, income, and date of birth; | |
| 2. | Information about your transactions with us, our affiliates, or others, including, but not limited to, your account number and balance, payments history, parties to transactions, cost basis information, and other financial information; and |
| HENNESSY FUNDS | 1-800-966-4354 |
35
| 3. | Other personal information we collect from various sources, even if you have not entered into a prior transaction with us, including the following: |
| • | Name, alias, address, unique personal identifier, online identifier, IP address, email address, telephone number, account name, and other similar identifiers; | |
| • | Age and marital status; | |
| • | Commercial information, including records of products purchased; | |
| • | Browsing history, search history, and information on interaction with our website; | |
| • | Geolocation data; | |
| • | Employment and employment history, educational history, financial information, and purchasing and consuming histories or tendencies; and | |
| • | Inferences drawn from the above-listed information to create a profile about your preferences, characteristics, predispositions, and behavior. |
We collect this information directly from you, indirectly in the course of providing services to you, directly and indirectly from your activity on our website, from broker dealers, marketing agencies, and other third parties that interact with us in connection with the services we perform and products we offer, and from anonymized and aggregated consumer information.
We use this information to fulfill the reason you provided the information to us, to provide you with other relevant products that you request from us, to provide you with information about products that may interest you, to improve our website or present our website’s contents to you, and as otherwise described to you when collecting your personal information.
We do not disclose any personal information to unaffiliated third parties, except as permitted by law. We may disclose your personal information to our affiliates, vendors, and service providers for a business purpose. For example, we are permitted by law to disclose all of the information we collect, as described above, to our transfer agent to process your transactions. When disclosing your personal information to third parties, we enter into a contract with each third party describing the purpose of such disclosure and requiring that such personal information be kept confidential and not used for any purpose except to perform the services contracted or respond to regulatory or law enforcement requests.
Furthermore, we restrict access to your personal information to those persons who require such information to provide products or services to you. As a result, we do not provide a means for opting out of our limited sharing of your information. We maintain physical, electronic, and procedural safeguards that comply with federal standards to guard your personal information.
If you hold shares of the Funds through a financial intermediary, including, but not limited to, a broker-dealer, bank, or trust company, the privacy policy of your financial intermediary governs how your personal information is shared with unaffiliated third parties.
Supplemental Privacy Notice for Residents of California
The California Consumer Privacy Act of 2018 (the “CCPA”) provides you, as a California resident, with certain additional rights relating to your personal information.
| WWW.HENNESSYFUNDS.COM |
36
| PRIVACY POLICY |
Under the CCPA, you have the right to request that we disclose to you the categories of personal information we have collected about you over the past 12 months, the categories of sources of such information, our business purpose for collecting the information, the categories of third parties, if any, with whom we shared the information, and the specific information we have collected about you. You also have the right to request that we delete any of your personal information, and, unless an exception applies, we will delete such information upon receiving and confirming your request. To make a request, call us at 1-800-966-4354, email us at privacy@hennessyfunds.com, or go to www.hennessyfunds.com/contact. We will not discriminate against you for exercising your rights under the CCPA. Further, we will not collect additional categories of your personal information or use the personal information we collected for materially different, unrelated, or incompatible purposes without providing you notice.
| HENNESSY FUNDS | 1-800-966-4354 |
37
For information, questions, or assistance, please call
The Hennessy Funds
1-800-966-4354 or 1-415-899-1555
INVESTMENT ADVISOR
Hennessy Advisors, Inc.
7250 Redwood Boulevard, Suite 200
Novato, California 94945
ADMINISTRATOR,
TRANSFER AGENT,
DIVIDEND PAYING AGENT, &
SHAREHOLDER SERVICING AGENT
U.S. Bancorp Fund Services, LLC
d/b/a U.S. Bank Global Fund Services
P.O. Box 701
Milwaukee, Wisconsin 53201-0701
CUSTODIAN
U.S. Bank N.A.
Custody Operations
1555 North River Center Drive, Suite 302
Milwaukee, Wisconsin 53212
TRUSTEES
Neil J. Hennessy
Robert T. Doyle
J. Dennis DeSousa
Claire Garvie
Gerald P. Richardson
COUNSEL
Foley & Lardner LLP
777 East Wisconsin Avenue
Milwaukee, Wisconsin 53202-5306
INDEPENDENT REGISTERED
PUBLIC ACCOUNTING FIRM
Tait, Weller & Baker LLP
Two Liberty Place
50 South 16th Street, Suite 2900
Philadelphia, Pennsylvania 19102-2529
DISTRIBUTOR
Quasar Distributors, LLC
111 East Kilbourn Avenue, Suite 2200
Milwaukee, Wisconsin 53202
www.hennessyfunds.com | 1-800-966-4354
This report has been prepared for shareholders and may be distributed to
others only if preceded or accompanied by a current prospectus.
ANNUAL REPORT
OCTOBER 31, 2021
HENNESSY BP MIDSTREAM FUND
Investor Class HMSFX
Institutional Class HMSIX
www.hennessyfunds.com | 1-800-966-4354
(This Page Intentionally Left Blank.)
Contents
| Letter to Shareholders | 2 |
| Performance Overview | 4 |
| Financial Statements | |
| Schedule of Investments | 8 |
| Statement of Assets and Liabilities | 11 |
| Statement of Operations | 12 |
| Statements of Changes in Net Assets | 13 |
| Financial Highlights | 14 |
| Notes to the Financial Statements | 18 |
| Report of Independent Registered Public Accounting Firm | 28 |
| Trustees and Officers of the Fund | 29 |
| Expense Example | 32 |
| Proxy Voting Policy and Proxy Voting Records | 34 |
| Availability of Quarterly Portfolio Schedule | 34 |
| Federal Tax Distribution Information | 34 |
| Important Notice Regarding Delivery of Shareholder Documents | 34 |
| Electronic Delivery | 34 |
| Liquidity Risk Management Program | 35 |
| Privacy Policy | 35 |
| HENNESSY FUNDS | 1-800-966-4354 |
December 2021
Dear Hennessy Funds Shareholder:
What a year this has been. While it doesn’t feel that we are out of the “pandemic” phase of the coronavirus crisis, we look forward to a day when we will eventually see fewer cases and potentially less severe variants. We feel extremely grateful to the many healthcare workers who have continued to work tirelessly during the recent surge. As we move through the next year, we hope that new U.S. cases will decline and that many other parts of the world will see improvements as well.
What a year this has been! As measured by the total return of the S&P 500® Index, as of October 31, 2021, the market was up 24.04% calendar year to date. This comes in the wake of a tumultuous 2020 in which the market plunged in the beginning of the pandemic and recovered dramatically to end the year up 18.40%. Interestingly, 18% appears to be a repeating number in the past dozen years. From the low point of the Financial Crisis (March 9, 2009) to the high point reached just prior to the COVID-19 pandemic (February 12, 2020), the S&P 500® Index was up 18.27% per year. We are well aware that past results are not predictive of the future, and we find ourselves naturally skeptical of such strong returns. But, as shown in the chart below, we find that the most common annual total returns of the market over the past 102 years range between 20% and 30% with the second most common being between 10% and 20%:
Source: Bloomberg L.P.
We will say it again, after showing a chart like the one above: Past results are not predictive of the future. Instead, we look at where we are right now – in the economy, in the market, in the business cycle – to reflect on where we have come from and where we may be going. U.S. GDP is strong and growing, interest rates remain low, and earnings growth and profitability remain robust. We believe stocks are trading at reasonable valuations when viewed as a whole, with the S&P 500® Index at 21.0x estimated earnings for 2022. Furthermore, we believe corporate balance sheets are healthy, with high levels of excess cash, which could support growth, increases in dividends, more share buybacks, and future acquisitions. Uncertainty and volatility can manifest at any time in the stock market, and the current market is no different. Investors have questions about inflation, worldwide supply chain issues, and what could drive the next boost in earnings. While these concerns are warranted, we continue to believe that overall the positives outweigh the negatives, and here at Hennessy we continue to see opportunity in the market and in our Funds.
| WWW.HENNESSYFUNDS.COM |
2
| LETTER TO SHAREHOLDERS |
What a (fiscal) year this has been!!! For our fiscal year ended October 31, 2021, the S&P 500® Index rose 42.91% on a total return basis, setting a new all-time high on the final day of the period. Except for a short 21-trading-day period that began on September 2 during which the market fell 5.13% only to rebound to new highs just 13 trading days later, the market has been on a continuous march higher. We saw a dramatic shift in market leadership as many of the sectors that underperformed during our last fiscal year soared in fiscal year 2021. Small-caps beat mid-caps, which in turn beat large-caps. The Energy and Financials sectors skyrocketed during the 12-month period, as reflected by the S&P 500® Energy Sector’s total return of 111.29% and the Russell 1000® Index Financials’ total return of 70.87%. Both of these sectors were among the worst performing in our fiscal year 2020, so a bounce back in our fiscal year 2021, while not a foregone conclusion, was a distinct possibility.
Overall, we are pleased with the performance of our mutual funds during the fiscal year. On an absolute basis, each of our 16 Funds achieved total returns greater than 10% and seven outperformed their primary benchmark. Ten of our 11 domestic equity-only Funds outperformed the S&P 500® Index and posted total returns of 45% or higher. Our four best-performing funds were concentrated in the Energy and Financials sectors. While some of our Funds certainly benefited from being in the “right” sector at the “right” time, we also believe this was a favorable period for our investment style of high-conviction investing and concentrated portfolio construction.
What will the coming year bring? As mentioned in our last shareholder letter (June 2021), we understand that even the greatest bull markets experience corrections along the way, and the last time the S&P 500® Index dropped over 10% was in February/March of 2020. Whether or not a correction occurs sooner or later, we believe the market as a whole has more room to run. We see many factors that could drive the market higher from here: strong GDP growth and increasing corporate earnings, a potentially lower-for-longer interest rate environment, accommodative fiscal and monetary policies, a healthy and robust financial system, low unemployment and solid wage growth, and strong corporate balance sheets with plenty of cash.
Thank you for your interest and for investing with us. We remain committed to managing our portfolios for long-term performance, ever mindful of downside risk. With so many investment options available to you, we are grateful for the trust you put in us and for your continued interest in our family of Funds. If you have any questions or would like to speak with us, please don’t hesitate to call us directly at (800) 966-4354.
Best regards,
| |
| |
| Ryan C. Kelley | |
| Chief Investment Officer |
Past performance does not guarantee future results. To obtain current standardized performance for the Hennessy Funds, visit https://www.hennessyfunds.com/funds/price-performance.
Mutual fund investing involves risk. Principal loss is possible.
Opinions expressed are those of Ryan C. Kelley and are subject to change, are not guaranteed, and should not be considered investment advice.
The Dow Jones Industrial Average and S&P 500® Index are commonly used to measure the performance of U.S. stocks. The S&P 500® Energy Index comprises those companies included in the S&P 500® Index that are classified in the Energy sector. The Russell 1000® Index Financials is a subset of the Russel 1000® Index that measures the performance of securities classified in the Financials sector of the large-capitalization U.S. equity market. The indices are used herein for comparative purposes in accordance with SEC regulations. One cannot invest directly in an index. All returns are shown on a total return basis.
| HENNESSY FUNDS | 1-800-966-4354 |
3
Performance Overview (Unaudited)
CHANGE IN VALUE OF $10,000 INVESTMENT

This graph illustrates the performance of an initial investment of $10,000 made in the Fund on its inception date and assumes the reinvestment of dividends.
AVERAGE ANNUAL TOTAL RETURN FOR PERIODS ENDED OCTOBER 31, 2021
| One | Five | Since Inception | ||
Year | Years | (12/31/13) | ||
| Hennessy BP Midstream Fund – | ||||
| Investor Class (HMSFX) | 78.41% | -2.61% | -2.74% | |
| Hennessy BP Midstream Fund – | ||||
| Institutional Class (HMSIX) | 78.57% | -2.39% | -2.50% | |
| Alerian US Midstream Energy Index | 89.98% | 3.64% | 0.90% | |
S&P 500® Index | 42.91% | 18.93% | 14.57% |
| Expense ratios: | Gross 2.12%, Net 1.78%(1) (Investor Class); |
Gross 1.79%, Net 1.53%(1) (Institutional Class) |
(1) | The Fund’s investment advisor has contractually agreed to limit expenses until February 28, 2022. |
Performance data quoted represents past performance; past performance does not guarantee future results. The investment return and principal value of an investment will fluctuate so that an investor’s shares, when redeemed, may be worth more or less than their original cost. The performance table does not reflect the deduction of taxes that a shareholder would pay on Fund distributions or the redemption of Fund shares. Current performance of the Fund may be lower or higher than the performance quoted. Performance data current to the most recent month end may be obtained by visiting www.hennessyfunds.com. Performance for periods including or prior to October 26, 2018, is that of the BP Capital TwinLine MLP Fund.
The Alerian US Midstream Energy Index comprises companies that earn a majority of their cash flows from midstream activities involving energy commodities. The S&P 500® Index is a capitalization-weighted index that is designed to represent the broad domestic economy through changes in the aggregate market value of 500 stocks across all major industries. One cannot invest directly in an index. These indices are used for comparative purposes in accordance with Securities and Exchange Commission regulations.
| WWW.HENNESSYFUNDS.COM |
4
| PERFORMANCE OVERVIEW |
Standard & Poor’s Financial Services is the source and owner of the S&P® and S&P 500® trademarks.
The Alerian US Midstream Energy Index is a servicemark of GKD Index Partners, LLC d/b/a Alerian (“Alerian”), and its use is granted under a license from Alerian. Alerian makes no express or implied warranties, representations, or promises regarding the originality, merchantability, suitability, or fitness for a particular purpose or use with respect to the Alerian indices. No party may rely on, and Alerian does not accept any liability for any errors, omissions, interruptions, or defects in, the Alerian indices or underlying data. In no event shall Alerian have any liability for any direct, indirect, special, incidental, punitive, consequential, or other damages (including lost profits), even if notified of the possibility of such damages.
The expense ratios presented are from the most recent prospectus. The expense ratios for the current reporting period are available in the Financial Highlights section of this report.
PERFORMANCE NARRATIVE
Portfolio Managers Ben Cook, CFA, and Kevin Gallagher, CFA
BP Capital Fund Advisors, LLC (sub-advisor)
Performance:
For the one-year period ended October 31, 2021, the Investor Class of the Hennessy BP Midstream Fund returned 78.41%, underperforming the Alerian US Midstream Energy Index (the Fund’s primary benchmark), which returned 89.98%, but outperforming the S&P 500® Index, which returned 42.91% for the same period.
While the onset of the COVID-19 pandemic resulted in economic and market shock during much of the one-year period ended October 31, 2020, a strong reversal ensued in late calendar year 2020 resulting in large part from the announcement and initial deployment of effective vaccinations and treatments for the disease. This reversal positively affected energy supply and demand fundamentals and led to strong absolute and relative performance of traditional hydrocarbon-based energy equities, including midstream equities held by the Fund. With demand for energy increasing during the one-year period ending October 31, 2021, the increases in upstream sector activity and corresponding increases in domestic crude/liquids and natural gas production volumes, along with increasing commodity prices, drove significantly improved operating company financial results for many midstream businesses.
In stark contrast to the prior period and despite ongoing market uncertainties, including those related to the COVID-19 Delta variant, “risk” investments outperformed “safety” investments for midstream equities during the one-year period ended October 31, 2021. Accordingly, the only traditional subsector of midstream equities to outperform the Fund’s primary benchmark was the natural gas gathering and processing (“G&P”) subsector. This subsector generally comprises “supply-push,” commodity-sensitive, less-diversified businesses with, in certain recent historical cases, elevated financial leverage. During the period, the Fund had increasing exposure to this subsector, and top contributors to Fund performance have G&P businesses. Nevertheless, we often consider G&P assets to be greater risk given their dependence on drilling activity, which tends to track upstream capital spending, which in turn is influenced by commodity price direction and increasingly by investor preferences related to capital allocation. Midstream equities that underperformed during this period included Diversified Midstream, which we continue to consider generally attractive based on discounted valuations. These
| HENNESSY FUNDS | 1-800-966-4354 |
5
companies tend to have large, diversified businesses with integrated value chains, contracted fee-based cash flows with strong counterparties, exposure to better positioned assets and basins/markets, and strong balance sheets. In addition to Diversified Midstream, the Fund has held, and continues to hold, natural-gas-focused midstream companies, particularly those in better-positioned dry gas basins like the Marcellus shale and Haynesville shale. While this subsector also underperformed in the “risk-on” market environment, the Fund had exposure to this subsector as a result of the favorable natural gas demand/commodity price environment and attractive characteristics of these companies, including long-term “take-or-pay” contracts, healthy financial metrics, and expected energy-transition-related opportunities. Finally, of note is Cheniere Energy, Inc. is a top member of and materially outperformed the Alerian US Midstream Energy Index, the Fund did not hold this stock due to the absence of a dividend during the period. This company’s absence from Fund holdings was a key driver of benchmark variance.
Portfolio Strategy:
The Fund generally seeks to build a concentrated portfolio of midstream energy companies with the following characteristics: (i) large and strategically protected integrated businesses, linking economic basins to strong demand centers; (ii) contracted and visible cash flows with strong counterparties such as utilities or power consumers; and (iii) strong balance sheets. However, given the current strong macroeconomic conditions, as well as favorable commodity prices and midstream energy company fundamentals, we expect that the Fund’s portfolio will continue to include “quality beta” companies, including those with direct commodity sensitivity. We believe our industry experience and intensive, fundamental, “boots-on-the-ground” research process allows us to uncover potential equity mispricings that can meaningfully drive performance.
Investment Commentary:
Barring an economic or political-related shock, we remain optimistic about the investment return potential for midstream equities for many reasons, including favorable energy supply/demand and commodity price trends in the midst of a strong and continuing global economic recovery. We expect crude/liquids and natural gas throughput to generally improve in the coming period at a moderate pace, depending on large public producers’ willingness to maintain capital discipline. As such, with greatly reduced capital expenditures and underutilized midstream assets in some areas, we also expect benefits related to operating leverage. While equities have improved from the market lows in 2020, yields remain well-supported and attractive in a very low-rate environment, and valuations generally remain discounted. One of the most important current investment themes is that many midstream companies are generating positive and increasing free cash flow after paying dividends and will be in position to further pay down debt, increase distributions or dividends, and/or buy back stock. Inflation also remains topical for the investment community, but energy commodities and equities should be net beneficiaries of this trend. Further, many midstream energy companies are focused on the growing and long-dated opportunity set related to the theme of energy transition. In total, we believe these and other drivers should continue to benefit energy fundamentals and equities.
_______________
Opinions expressed are those of the Portfolio Managers as of the date written and are subject to change, are not guaranteed, and should not be considered investment advice or an indication of trading intent.
The Fund is non-diversified, meaning it may concentrate its assets in fewer individual holdings than a diversified fund, making it more exposed to individual stock volatility than a diversified fund. The Fund invests in small-capitalization and medium-capitalization companies, which
| WWW.HENNESSYFUNDS.COM |
6
| PERFORMANCE OVERVIEW |
involves additional risks such as limited liquidity and greater volatility. Funds that concentrate in a single sector may be subject to a higher degree of risk. Energy-related companies are subject to specific risks, including fluctuations in commodity prices and consumer demand, substantial government regulation, and depletion of reserves. Investments in lower-rated and non-rated securities present a greater risk of loss to principal and interest than higher-rated securities. Use of derivatives can increase the volatility of the Fund.
MLPs and MLP investments have unique characteristics. The Fund does not receive the same tax benefits as a direct investment in an MLP.
The prices of MLP units may fluctuate abruptly and trading volume may be low, making it difficult for the Fund to sell its units at a favorable price. MLP general partners have the power to take actions that adversely affect the interests of unit holders. Most MLPs do not pay U.S. federal income tax at the partnership level, but an adverse change in tax laws could result in MLPs being treated as corporations for federal income tax purposes, which could reduce or eliminate distributions paid by MLPs to the Fund. The Fund is treated as a regular corporation, or “C” corporation, for U.S. federal income tax purposes, and therefore, is subject to U.S. federal income tax on its taxable income at the graduated rates applicable to corporations (currently a maximum rate of 21%), as well as state and local income taxes. The Fund will not benefit from current favorable federal income tax rates on long-term capital gains, and Fund income and losses will not be passed on to shareholders. The Fund accrues deferred income taxes for future tax liabilities associated with the portion of MLP distributions considered to be a tax-deferred return of capital and for any net operating gains as well as capital appreciation of its investments. This deferred tax liability is reflected in the daily net asset value of the Fund and as a result the Fund’s after-tax performance could differ significantly from the underlying assets even if the pre-tax performance is closely tracked. Please see the Fund’s prospectus for a more complete discussion of these and other risks.
References to specific securities should not be considered a recommendation to buy or sell any security. Fund holdings and sector allocations are subject to change. Please refer to the Schedule of Investments included in this report for additional portfolio information.
Free cash flow is a measure of financial performance calculated as operating cash flow minus capital expenditures.
| HENNESSY FUNDS | 1-800-966-4354 |
7
Financial Statements
Schedule of Investments as of October 31, 2021 |
HENNESSY BP MIDSTREAM FUND
(% of Total Assets)

| TOP TEN HOLDINGS (EXCLUDING MONEY MARKET FUNDS) | % TOTAL ASSETS |
| MPLX LP | 12.05% |
| Energy Transfer LP | 11.82% |
| Enterprise Products Partners LP | 8.82% |
| ONEOK, Inc. | 8.53% |
| The Williams Companies, Inc. | 8.33% |
| Kinder Morgan, Inc. | 8.00% |
| Plains All American Pipeline LP | 7.72% |
| Targa Resources Corp. | 6.89% |
| Western Midstream Partners LP | 4.96% |
| DCP Midstream LP | 3.92% |
Note: The Fund concentrates its investments in the Energy industry. For presentation purposes, the Fund uses custom categories.
| WWW.HENNESSYFUNDS.COM |
8
| SCHEDULE OF INVESTMENTS |
| COMMON STOCKS – 42.07% | Number | % of | ||||||||||
| of Shares | Value | Net Assets | ||||||||||
| Crude Oil & Refined Products – 3.10% | ||||||||||||
| Enbridge, Inc. (a) | 27,500 | $ | 1,151,150 | 3.10 | % | |||||||
| Gathering & Processing – 10.92% | ||||||||||||
| Antero Midstream Corp. | 70,000 | 744,800 | 2.00 | % | ||||||||
| EnLink Midstream LLC | 95,000 | 745,750 | 2.01 | % | ||||||||
| Targa Resources Corp. | 47,000 | 2,569,490 | 6.91 | % | ||||||||
| 4,060,040 | 10.92 | % | ||||||||||
| Natural Gas/NGL Transportation – 28.05% | ||||||||||||
| DT Midstream, Inc. | 24,000 | 1,151,040 | 3.10 | % | ||||||||
| Kinder Morgan, Inc. | 178,090 | 2,983,007 | 8.03 | % | ||||||||
| ONEOK, Inc. | 50,026 | 3,182,654 | 8.56 | % | ||||||||
| The Williams Companies, Inc. | 110,652 | 3,108,215 | 8.36 | % | ||||||||
| 10,424,916 | 28.05 | % | ||||||||||
| Total Common Stocks | ||||||||||||
| (Cost $10,207,144) | 15,636,106 | 42.07 | % | |||||||||
| PARTNERSHIPS & TRUSTS – 55.65% | ||||||||||||
| Crude Oil & Refined Products – 26.03% | ||||||||||||
| Genesis Energy LP | 90,000 | 981,000 | 2.64 | % | ||||||||
| Magellan Midstream Partners LP | 26,900 | 1,318,100 | 3.55 | % | ||||||||
| MPLX LP | 149,249 | 4,495,380 | 12.09 | % | ||||||||
| Plains All American Pipeline LP | 284,526 | 2,879,403 | 7.75 | % | ||||||||
| 9,673,883 | 26.03 | % | ||||||||||
| Gathering & Processing – 4.97% | ||||||||||||
| Western Midstream Partners LP | 87,000 | 1,848,750 | 4.97 | % | ||||||||
| Natural Gas/NGL Transportation – 24.65% | ||||||||||||
| DCP Midstream LP | 47,000 | 1,461,700 | 3.93 | % | ||||||||
| Energy Transfer LP | 463,700 | 4,409,787 | 11.87 | % | ||||||||
| Enterprise Products Partners LP | 145,100 | 3,290,868 | 8.85 | % | ||||||||
| 9,162,355 | 24.65 | % | ||||||||||
| Total Partnerships & Trusts | ||||||||||||
| (Cost $15,629,521) | 20,684,988 | 55.65 | % | |||||||||
The accompanying notes are an integral part of these financial statements.
| HENNESSY FUNDS | 1-800-966-4354 |
9
| SHORT-TERM INVESTMENTS – 1.69% | Number | % of | ||||||||||
| of Shares | Value | Net Assets | ||||||||||
| Money Market Funds – 1.69% | ||||||||||||
| First American Government Obligations Fund, | ||||||||||||
| Institutional Class, 0.03% (b) | 627,647 | $ | 627,647 | 1.69 | % | |||||||
| Total Short-Term Investments | ||||||||||||
| (Cost $627,647) | 627,647 | 1.69 | % | |||||||||
| Total Investments | ||||||||||||
| (Cost $26,464,312) – 99.41% | 36,948,741 | 99.41 | % | |||||||||
| Other Assets in Excess of Liabilities – 0.59% | 218,372 | 0.59 | % | |||||||||
TOTAL NET ASSETS – 100.00% | $ | 37,167,113 | 100.00 | % | ||||||||
Percentages are stated as a percent of net assets.
| (a) | U.S.-traded security of a foreign corporation. |
| (b) | The rate listed is the fund’s seven-day yield as of October 31, 2021. |
Summary of Fair Value Exposure as of October 31, 2021
The following is a summary of the inputs used to value the Fund’s net assets as of October 31, 2021 (see Note 3 in the accompanying Notes to the Financial Statements):
| Common Stocks | Level 1 | Level 2 | Level 3 | Total | ||||||||||||
| Crude Oil & Refined Products | $ | 1,151,150 | $ | — | $ | — | $ | 1,151,150 | ||||||||
| Gathering & Processing | 4,060,040 | — | — | 4,060,040 | ||||||||||||
| Natural Gas/NGL Transportation | 10,424,916 | — | — | 10,424,916 | ||||||||||||
| Total Common Stocks | $ | 15,636,106 | $ | — | $ | — | $ | 15,636,106 | ||||||||
| Partnerships & Trusts | ||||||||||||||||
| Crude Oil & Refined Products | $ | 9,673,883 | $ | — | $ | — | $ | 9,673,883 | ||||||||
| Gathering & Processing | 1,848,750 | — | — | 1,848,750 | ||||||||||||
| Natural Gas/NGL Transportation | 9,162,355 | — | — | 9,162,355 | ||||||||||||
| Total Partnerships & Trusts | $ | 20,684,988 | $ | — | $ | — | $ | 20,684,988 | ||||||||
| Short-Term Investments | ||||||||||||||||
| Money Market Funds | $ | 627,647 | $ | — | $ | — | $ | 627,647 | ||||||||
| Total Short-Term Investments | $ | 627,647 | $ | — | $ | — | $ | 627,647 | ||||||||
| Total Investments | $ | 36,948,741 | $ | — | $ | — | $ | 36,948,741 | ||||||||
The accompanying notes are an integral part of these financial statements.
| WWW.HENNESSYFUNDS.COM |
10
| SCHEDULE OF INVESTMENTS/STATEMENT OF ASSETS AND LIABILITIES |
Financial Statements
Statement of Assets and Liabilities as of October 31, 2021 |
| ASSETS: | ||||
| Investments in securities, at value (cost $26,464,312) | $ | 36,948,741 | ||
| Dividends and interest receivable | 16,719 | |||
| Receivable for fund shares sold | 44,875 | |||
| Return of capital receivable | 283,946 | |||
| Deferred income tax | — | |||
| Prepaid expenses and other assets | 8,237 | |||
| Total assets | 37,302,518 | |||
| LIABILITIES: | ||||
| Payable for fund shares redeemed | 35,906 | |||
| Payable to advisor | 37,630 | |||
| Payable to auditor | 41,007 | |||
| Accrued distribution fees | 1,544 | |||
| Accrued service fees | 592 | |||
| Accrued interest payable | 11 | |||
| Accrued trustees fees | 6,599 | |||
| Accrued expenses and other payables | 12,116 | |||
| Total liabilities | 135,405 | |||
| NET ASSETS | $ | 37,167,113 | ||
| NET ASSETS CONSISTS OF: | ||||
| Capital stock | $ | 52,348,705 | ||
| Accumulated deficit | (15,181,592 | ) | ||
| Total net assets | $ | 37,167,113 | ||
| NET ASSETS: | ||||
| Investor Class | ||||
| Shares authorized (no par value) | Unlimited | |||
| Net assets applicable to outstanding shares | $ | 6,720,058 | ||
| Shares issued and outstanding | 775,917 | |||
| Net asset value, offering price, and redemption price per share | $ | 8.66 | ||
| Institutional Class | ||||
| Shares authorized (no par value) | Unlimited | |||
| Net assets applicable to outstanding shares | $ | 30,447,055 | ||
| Shares issued and outstanding | 3,419,605 | |||
| Net asset value, offering price, and redemption price per share | $ | 8.90 | ||
The accompanying notes are an integral part of these financial statements.
| HENNESSY FUNDS | 1-800-966-4354 |
11
Financial Statements
Statement of Operations for the year ended October 31, 2021 |
| INVESTMENT INCOME: | ||||
| Distributions received from master limited partnerships | $ | 1,575,250 | ||
| Return of capital on distributions received | (1,575,250 | ) | ||
Dividend income(1) | 277,629 | |||
| Interest income | 158 | |||
| Total investment income | 277,787 | |||
| EXPENSES: | ||||
| Investment advisory fees (See Note 5) | 361,154 | |||
| Administration, accounting, custody, and transfer agent fees (See Note 5) | 48,071 | |||
| Audit fees | 41,013 | |||
| Sub-transfer agent expenses – Investor Class (See Note 5) | 12,612 | |||
| Sub-transfer agent expenses – Institutional Class (See Note 5) | 24,156 | |||
| Compliance expense (See Note 5) | 27,457 | |||
| Federal and state registration fees | 25,990 | |||
| Trustees’ fees and expenses | 18,593 | |||
| Distribution fees – Investor Class (See Note 5) | 8,858 | |||
| Reports to shareholders | 6,599 | |||
| Service fees – Investor Class (See Note 5) | 5,905 | |||
| Income tax expense | 1,520 | |||
| Legal fees | 344 | |||
| Interest expense (See Note 7) | 18 | |||
| Other expenses | 10,633 | |||
| Total expenses before waivers and reimbursements | 592,923 | |||
| Service provider expense waiver (See Note 5) | (48,071 | ) | ||
| Expense reimbursement by advisor – Investor Class (See Note 5) | (12,376 | ) | ||
| Expense reimbursement by advisor – Institutional Class (See Note 5) | (23,693 | ) | ||
| Net expenses | 508,783 | |||
| NET INVESTMENT LOSS | $ | (230,996 | ) | |
| REALIZED AND UNREALIZED GAINS (LOSSES): | ||||
| Net realized gain on investments | $ | 357,263 | ||
| Net change in unrealized appreciation/depreciation on investments | 17,111,950 | |||
| Income tax expense | — | |||
| Net gain on investments | 17,469,213 | |||
| NET INCREASE IN NET ASSETS RESULTING FROM OPERATIONS | $ | 17,238,217 | ||
(1) | Net of foreign taxes withheld of $14,622. |
The accompanying notes are an integral part of these financial statements.
| WWW.HENNESSYFUNDS.COM |
12
| STATEMENT OF OPERATIONS/STATEMENTS OF CHANGES IN NET ASSETS |
Financial Statements
| Statements of Changes in Net Assets |
| Year Ended | Year Ended | |||||||
| October 31, 2021 | October 31, 2020 | |||||||
| OPERATIONS: | ||||||||
| Net investment loss | $ | (230,996 | ) | $ | (398,916 | ) | ||
| Net realized gain (loss) on investments | 357,263 | (7,697,287 | ) | |||||
| Net change in unrealized | ||||||||
| appreciation/deprecation on investments | 17,111,950 | (5,793,719 | ) | |||||
| Net increase (decrease) in net | ||||||||
| assets resulting from operations | 17,238,217 | (13,889,922 | ) | |||||
| DISTRIBUTIONS TO SHAREHOLDERS FROM: | ||||||||
| Return of capital – Investor Class | (756,323 | ) | (901,142 | ) | ||||
| Return of capital – Institutional Class | (3,420,217 | ) | (3,075,804 | ) | ||||
| Total distributions | (4,176,540 | ) | (3,976,946 | ) | ||||
| CAPITAL SHARE TRANSACTIONS: | ||||||||
| Proceeds from shares subscribed – Investor Class | 2,502,132 | 1,902,264 | ||||||
| Proceeds from shares subscribed – Institutional Class | 3,761,293 | 9,560,813 | ||||||
| Dividends reinvested – Investor Class | 677,429 | 876,530 | ||||||
| Dividends reinvested – Institutional Class | 3,185,818 | 2,999,051 | ||||||
| Cost of shares redeemed – Investor Class | (2,532,516 | ) | (3,867,332 | ) | ||||
| Cost of shares redeemed – Institutional Class | (5,635,003 | ) | (12,434,812 | ) | ||||
| Net increase (decrease) in net assets derived | ||||||||
| from capital share transactions | 1,959,153 | (963,486 | ) | |||||
| TOTAL INCREASE (DECREASE) IN NET ASSETS | 15,020,830 | (18,830,354 | ) | |||||
| NET ASSETS: | ||||||||
| Beginning of year | 22,146,283 | 40,976,637 | ||||||
| End of year | $ | 37,167,113 | $ | 22,146,283 | ||||
| CHANGES IN SHARES OUTSTANDING: | ||||||||
| Shares sold – Investor Class | 321,069 | 312,671 | ||||||
| Shares sold – Institutional Class | 490,595 | 1,568,094 | ||||||
| Shares issued to holders as reinvestment | ||||||||
| of dividends – Investor Class | 89,396 | 112,216 | ||||||
| Shares issued to holders as reinvestment | ||||||||
| of dividends – Institutional Class | 410,703 | 380,829 | ||||||
| Shares redeemed – Investor Class | (320,846 | ) | (582,063 | ) | ||||
| Shares redeemed – Institutional Class | (711,400 | ) | (1,585,605 | ) | ||||
| Net increase in shares outstanding | 279,517 | 206,142 | ||||||
The accompanying notes are an integral part of these financial statements.
| HENNESSY FUNDS | 1-800-966-4354 |
13
Financial Statements
| Financial Highlights |
For an Investor Class share outstanding throughout each period
PER SHARE DATA:
Net asset value, beginning of period
Income from investment operations:
Net investment loss(2)(3)
Net realized and unrealized gains (losses) on investments
Total from investment operations
Less distributions:
Dividends from return of capital
Total distributions
Net asset value, end of period
TOTAL RETURN
SUPPLEMENTAL DATA AND RATIOS:
Net assets, end of period (millions)
Ratio of expenses to average net assets:
Before expense reimbursement
After expense reimbursement
Ratio of net investment loss to average net assets:
Before expense reimbursement(3)
After expense reimbursement(3)
Portfolio turnover rate(7)
(1) | The period ended October 31, 2018, consists of 11 months due to the Fund’s fiscal year end change from November 30 to October 31, effective October 26, 2018. |
(2) | Calculated using the average shares outstanding method. |
(3) | Includes current and deferred tax benefit/expense from net investment income/loss only. |
(4) | Not annualized. |
(5) | Annualized. |
(6) | Certain service provider expenses were voluntarily waived during the fiscal year. |
(7) | Calculated on the basis of the Fund as a whole. |
The accompanying notes are an integral part of these financial statements.
| WWW.HENNESSYFUNDS.COM |
14
| FINANCIAL HIGHLIGHTS — INVESTOR CLASS |
| Year Ended October 31, | Period Ended | Year Ended November 30, | ||||||||||||||||||||
| October 31, | ||||||||||||||||||||||
| 2021 | 2020 | 2019 | 2018(1) | 2017 | 2016 | |||||||||||||||||
| $ | 5.55 | $ | 10.90 | $ | 12.66 | $ | 14.51 | $ | 16.54 | $ | 15.45 | |||||||||||
| (0.07 | ) | (0.10 | ) | (0.10 | ) | (0.16 | ) | (0.22 | ) | (0.17 | ) | |||||||||||
| 4.21 | (4.22 | ) | (0.63 | ) | (0.66 | ) | (0.78 | ) | 2.29 | |||||||||||||
| 4.14 | (4.32 | ) | (0.73 | ) | (0.82 | ) | (1.00 | ) | 2.12 | |||||||||||||
| (1.03 | ) | (1.03 | ) | (1.03 | ) | (1.03 | ) | (1.03 | ) | (1.03 | ) | |||||||||||
| (1.03 | ) | (1.03 | ) | (1.03 | ) | (1.03 | ) | (1.03 | ) | (1.03 | ) | |||||||||||
| $ | 8.66 | $ | 5.55 | $ | 10.90 | $ | 12.66 | $ | 14.51 | $ | 16.54 | |||||||||||
| 78.41 | % | -42.13 | % | -6.28 | % | -6.15 | %(4) | -6.49 | % | 14.78 | % | |||||||||||
| $ | 6.72 | $ | 3.81 | $ | 9.20 | $ | 20.07 | $ | 16.86 | $ | 13.43 | |||||||||||
| 2.11 | % | 2.12 | % | 1.89 | % | 1.86 | %(5) | 1.91 | % | 2.21 | % | |||||||||||
| 1.76 | %(6) | 1.76 | %(6) | 1.76 | % | 1.78 | %(5) | 1.77 | % | 1.74 | % | |||||||||||
| (1.26 | )% | (1.63 | )% | (0.92 | )% | (1.34 | )%(5) | (1.50 | )% | (1.60 | )% | |||||||||||
| (0.91 | )% | (1.27 | )% | (0.79 | )% | (1.26 | )%(5) | (1.36 | )% | (1.13 | )% | |||||||||||
| 40 | % | 53 | % | 41 | % | 64 | %(4) | 63 | % | 139 | % | |||||||||||
The accompanying notes are an integral part of these financial statements.
| HENNESSY FUNDS | 1-800-966-4354 |
15
Financial Statements
| Financial Highlights |
For an Institutional Class share outstanding throughout each period
PER SHARE DATA:
Net asset value, beginning of period
Income from investment operations:
Net investment loss(2)(3)
Net realized and unrealized gains (losses) on investments
Total from investment operations
Less distributions:
Dividends from return of capital
Total distributions
Net asset value, end of period
TOTAL RETURN
SUPPLEMENTAL DATA AND RATIOS:
Net assets, end of period (millions)
Ratio of expenses to average net assets:
Before expense reimbursement
After expense reimbursement
Ratio of net investment loss to average net assets:
Before expense reimbursement(3)
After expense reimbursement(3)
Portfolio turnover rate(7)
(1) | The period ended October 31, 2018, consists of 11 months due to the Fund’s fiscal year end change from November 30 to October 31, effective October 26, 2018. |
(2) | Calculated using the average shares outstanding method. |
(3) | Includes current and deferred tax benefit/expense from net investment income/loss only. |
(4) | Not annualized. |
(5) | Annualized. |
(6) | Certain service provider expenses were voluntarily waived during the fiscal year. |
(7) | Calculated on the basis of the Fund as a whole. |
The accompanying notes are an integral part of these financial statements.
| WWW.HENNESSYFUNDS.COM |
16
| FINANCIAL HIGHLIGHTS — INSTITUTIONAL CLASS |
| Year Ended October 31, | Period Ended | Year Ended November 30, | ||||||||||||||||||||
| October 31, | ||||||||||||||||||||||
| 2021 | 2020 | 2019 | 2018(1) | 2017 | 2016 | |||||||||||||||||
| $ | 5.68 | $ | 11.09 | $ | 12.83 | $ | 14.66 | $ | 16.66 | $ | 15.53 | |||||||||||
| (0.05 | ) | (0.10 | ) | (0.09 | ) | (0.14 | ) | (0.18 | ) | (0.12 | ) | |||||||||||
| 4.30 | (4.28 | ) | (0.62 | ) | (0.66 | ) | (0.79 | ) | 2.28 | |||||||||||||
| 4.25 | (4.38 | ) | (0.71 | ) | (0.80 | ) | (0.97 | ) | 2.16 | |||||||||||||
| (1.03 | ) | (1.03 | ) | (1.03 | ) | (1.03 | ) | (1.03 | ) | (1.03 | ) | |||||||||||
| (1.03 | ) | (1.03 | ) | (1.03 | ) | (1.03 | ) | (1.03 | ) | (1.03 | ) | |||||||||||
| $ | 8.90 | $ | 5.68 | $ | 11.09 | $ | 12.83 | $ | 14.66 | $ | 16.66 | |||||||||||
| 78.57 | % | -41.93 | % | -6.10 | % | -5.94 | %(4) | -6.25 | % | 14.97 | % | |||||||||||
| $ | 30.45 | $ | 18.33 | $ | 31.78 | $ | 61.92 | $ | 82.59 | $ | 33.22 | |||||||||||
| 1.74 | % | 1.79 | % | 1.56 | % | 1.58 | %(5) | 1.66 | % | 1.95 | % | |||||||||||
| 1.51 | %(6) | 1.51 | %(6) | 1.51 | % | 1.52 | %(5) | 1.52 | % | 1.48 | % | |||||||||||
| (0.89 | )% | (1.55 | )% | (0.76 | )% | (1.15 | )%(5) | (1.28 | )% | (1.28 | )% | |||||||||||
| (0.66 | )% | (1.27 | )% | (0.71 | )% | (1.09 | )%(5) | (1.14 | )% | (0.81 | )% | |||||||||||
| 40 | % | 53 | % | 41 | % | 64 | %(4) | 63 | % | 139 | % | |||||||||||
The accompanying notes are an integral part of these financial statements.
| HENNESSY FUNDS | 1-800-966-4354 |
17
Financial Statements
Notes to the Financial Statements October 31, 2021 |
1). ORGANIZATION
The Hennessy BP Midstream Fund (the “Fund”) is a series of Hennessy Funds Trust (the “Trust”), which was organized as a Delaware statutory trust on September 17, 1992. The Fund is an open-end management investment company registered under the Investment Company Act of 1940, as amended. The investment objective of the Fund is to seek capital appreciation through distribution growth along with current income. The Fund is treated as a regular corporation, or “C” corporation, for U.S. federal income tax purposes. Because the Fund is treated as a “C” corporation, it is not taxed as a regulated investment company under Subchapter M of the Code and is not required to comply with the diversification requirements applicable to regulated investment companies. The Fund is a non-diversified fund.
The Fund offers Investor Class and Institutional Class shares. Each class of shares differs principally in its respective 12b-1 distribution and service, shareholder servicing, and sub-transfer agent expenses. There are no sales charges. Each class has identical rights to earnings, assets, and voting privileges, except for class-specific expenses and exclusive rights to vote on matters affecting only one class.
As an investment company, the Fund follows the investment company accounting and reporting guidance of the Financial Accounting Standards Board (“FASB”) Accounting Standard Codification Topic 946 “Financial Services—Investment Companies.”
2). SIGNIFICANT ACCOUNTING POLICIES
The following is a summary of significant accounting policies consistently followed by the Fund in the preparation of the financial statements. These policies conform to U.S. generally accepted accounting principles (“GAAP”).
| a). | Securities Valuation – All investments in securities are valued in accordance with the Fund’s valuation policies and procedures, as described in Note 3. |
| b). | Federal Income Taxes – The Fund is taxed as a corporation and is obligated to pay U.S. federal and state income tax on its taxable income. Currently, the maximum marginal regular federal income tax rate for a corporation is 21%. The Fund invests a substantial portion of its assets in master limited partnerships (“MLPs”), which are treated as partnerships for federal income tax purposes. As a limited partner in MLPs, the Fund reports its allocable share of each MLP’s taxable income in computing its own taxable income. |
| The Fund includes any tax expense or benefit in the Statement of Operations based on the component of income or gains/losses to which such expense or benefit relates. Deferred income taxes reflect the net tax effects of temporary differences between the carrying amount of assets and liabilities for financial reporting purposes and the carrying amount of assets and liabilities for income tax purposes. The Fund recognizes a valuation allowance if, based on the weight of available evidence, it is more likely than not that the Fund will not realize some portion or all of the deferred income tax assets. As of October 31, 2021, the Fund has placed a full valuation allowance on its deferred tax assets. | |
| c). | Accounting for Uncertainty in Income Taxes – The Fund has accounting policies regarding recognition and measurement of tax positions taken or expected to be taken on a tax return. The tax returns of the Fund for the prior three fiscal years are |
| WWW.HENNESSYFUNDS.COM |
18
| NOTES TO THE FINANCIAL STATEMENTS |
| open for examination. The Fund has reviewed all open tax years in major tax jurisdictions and concluded that there is no impact on the Fund’s net assets and no tax liability resulting from unrecognized tax benefits relating to uncertain income tax positions taken or expected to be taken on a tax return. The Fund files U.S. federal income tax returns and various state income tax returns. | |
| d). | Income and Expenses – Dividend income is recognized on the ex-dividend date or as soon as information is available to the Fund. Interest income, which includes the amortization of premium and accretion of discount, is recognized on an accrual basis. Market discounts, original issue discounts, and market premiums on debt securities are accreted or amortized to interest income over the life of a security with a corresponding increase or decrease, as applicable, in the cost basis of such security using the yield-to-maturity method or, where applicable, the first call date of the security. Other non-cash dividends are recognized as investment income at the fair value of the property received. The Fund is charged for those expenses that are directly attributable to its portfolio, such as advisory, administration, and certain shareholder service fees. Income, expenses (other than expenses attributable to a specific class), and realized and unrealized gains/losses on investments are allocated to each class of shares based on such class’s net assets. Distributions received from the Fund’s investments in MLPs generally consist of ordinary income, capital gains, and return of capital. The Fund records investment income on the ex-date of the distributions. For financial statement purposes, the Fund uses return of capital and income estimates to allocate the dividend income received. Such estimates are based on historical information available from the MLPs and other industry sources. These estimates may subsequently be revised based on information received from the MLPs after their tax reporting periods are concluded, as the actual character of these distributions is not known until after the fiscal year end of the Fund. |
| e). | Distributions to Shareholders – The Fund typically makes cash distributions to its shareholders quarterly at the beginning of the months of March, June, September, and December. Due to the tax treatment of the Fund’s allocations and distributions from MLPs, a significant portion of the Fund’s distributions to shareholders typically is treated as return of capital to shareholders for U.S. federal income tax purposes (i.e., as distributions in excess of the Fund’s current and accumulated earnings and profits as described below). However, no assurance can be given in this regard; just as the Fund’s corporate income tax liability can fluctuate materially from year to year, the extent to which the Fund is able to make return-of-capital distributions also can vary materially from year to year depending on a number of different factors, including the composition of the Fund’s portfolio, the level of allocations of net income and other tax items for the Fund from its underlying MLP investments, the length of time the Fund has owned the MLP equity securities in its portfolio, and the extent to which the Fund disposes of MLP equity securities during a particular year, including to meet Fund shareholder redemption requests as necessary. |
| In general, a distribution constitutes a return of capital to a shareholder rather than a dividend to the extent such distribution exceeds the Fund’s current and accumulated earnings and profits. The portion of any distribution treated as a return of capital constitutes a tax-free return of capital to the extent of a shareholder’s cost basis in Fund shares and thereafter generally is taxable to the shareholder as a capital gain. A return-of-capital distribution also reduces the shareholder’s cost basis in Fund shares (but not below zero). A lower cost basis means that a shareholder recognizes more gain or less loss when the shareholder eventually sells Fund shares, which increases the shareholder’s tax liability. |
| HENNESSY FUNDS | 1-800-966-4354 |
19
| The Fund attempts to maintain a stable distribution rate and therefore may distribute more or less than the actual amount of cash it receives from its investments in a particular period. Any undistributed cash would be available to supplement future distributions, and until distributed would increase the Fund’s net asset value (“NAV”). Correspondingly, such amounts, once distributed, decrease the Fund’s NAV. In addition, the Fund may opt not to make distributions in quarters in which the Fund believes that a distribution could cause adverse tax consequences to shareholders, including when the Fund believes that a distribution may not constitute a tax-free return of capital as described above. | |
| f). | Security Transactions – Investment and shareholder transactions are recorded on the trade date. The Fund determines the realized gain/loss from an investment transaction by comparing the original cost of the security lot sold with the net sale proceeds. Discounts and premiums on securities purchased are accreted or amortized, respectively, over the life of each such security. |
| g). | Use of Estimates – Preparing financial statements in accordance with GAAP requires management to make estimates and assumptions that affect the reported amounts of assets and liabilities and disclosure of contingent assets and liabilities at the date of the financial statements, as well as the reported change in net assets during the reporting period. Actual results could differ from those estimates. |
| h). | Share Valuation – The NAV per share of the Fund is calculated by dividing (i) the total value of the securities held by the Fund, plus cash and other assets, minus all liabilities (including estimated accrued expenses) by (ii) the total number of Fund shares outstanding, rounded to the nearest $0.01. Fund shares are not priced on days the New York Stock Exchange is closed for trading. The offering and redemption price per share for the Fund is equal to the Fund’s NAV per share. |
| i). | Partnership Accounting Policy – To the extent the Fund receives distributions from underlying partnerships in which it invests, the Fund records its pro rata share of income/loss and capital gains/losses and accordingly adjusts the cost basis of the underlying partnerships for return of capital. |
| j). | Recent Accounting Pronouncements and Regulatory Updates – In October 2020, the Securities and Exchange Commission (“SEC”) adopted new regulations governing the use of derivatives by registered investment companies (“Rule 18f-4”). Rule 18f-4 imposes limits on the amount of derivatives a fund can enter into, eliminates the asset segregation framework currently used by funds to comply with Section 18 of the 1940 Act, and requires funds whose use of derivatives is greater than a limited specified amount to establish and maintain a comprehensive derivatives risk management program and appoint a derivatives risk manager. Funds are required to comply with Rule 18f-4 by August 19, 2022. The impact, if any, that Rule 18f-4 will have on the availability, liquidity, and performance of derivatives is unclear. Management is currently evaluating the potential impact of Rule 18f-4 on the Fund. When fully implemented, Rule 18f-4 may require changes in how the Fund uses derivatives, adversely affect the Fund’s performance, and increase costs related to the Fund’s use of derivatives. |
| In December 2020, the SEC adopted a new rule providing a framework for fund valuation practices (“Rule 2a-5”). Rule 2a-5 establishes requirements for determining fair value in good faith for purposes of the 1940 Act. Rule 2a-5 permits fund boards to designate certain parties to perform fair value determinations, subject to board oversight and certain other conditions. Rule 2a-5 also defines when market quotations are “readily available” for purposes of the 1940 Act and the threshold for |
| WWW.HENNESSYFUNDS.COM |
20
| NOTES TO THE FINANCIAL STATEMENTS |
| determining whether a fund must fair value a security. In connection with Rule 2a-5, the SEC also adopted related recordkeeping requirements and is rescinding previously issued guidance, including with respect to the role of a board in determining fair value and the accounting and auditing of fund investments. Funds must comply with the rules by September 8, 2022. Management is currently assessing the potential impact of the new rules on the Fund’s financial statements. |
3). SECURITIES VALUATION
The Fund follows its valuation policies and procedures in determining its net asset value and, in preparing these financial statements, the fair value accounting standards that establish an authoritative definition of fair value and set out a hierarchy for measuring fair value. These standards require additional disclosures about the various inputs and valuation techniques used to develop the measurements of fair value and a discussion of changes in valuation techniques and related inputs during the period. These inputs are summarized in the three broad levels listed below:
| Level 1 – | Unadjusted, quoted prices in active markets for identical instruments that the Fund has the ability to access at the date of measurement. | |
| Level 2 – | Other significant observable inputs (including, but not limited to, quoted prices in active markets for similar instruments, quoted prices in markets that are not active for identical or similar instruments, and model-derived valuations in which all significant inputs and significant value drivers are observable in active markets, such as interest rates, prepayment speeds, credit risk curves, default rates, and similar data). | |
| Level 3 – | Significant unobservable inputs (including the Fund’s own assumptions about what market participants would use to price the asset or liability based on the best available information) when observable inputs are unavailable. |
The following is a description of the valuation techniques applied to the Fund’s major categories of assets and liabilities on a recurring basis:
Equity Securities – Equity securities, including common stocks, preferred stocks, foreign-issued common stocks, exchange-traded funds, closed-end mutual funds, partnerships, rights, MLPs, and real estate investment trusts, that are traded on a securities exchange for which a last-quoted sales price is readily available generally are valued at the last sales price as reported by the primary exchange on which the securities are listed. Securities listed on The NASDAQ Stock Market (“NASDAQ”) generally are valued at the NASDAQ Official Closing Price, which may differ from the last sales price reported. Securities traded on a securities exchange for which a last-quoted sales price is not readily available generally are valued at the mean between the bid and ask prices. To the extent these securities are actively traded and valuation adjustments are not applied, they are classified in Level 1 of the fair value hierarchy. Securities traded on foreign exchanges generally are not valued at the same time the Fund calculates its NAV because most foreign markets close well before such time. The earlier close of most foreign markets gives rise to the possibility that significant events, including broad market moves, may have occurred in the interim. In certain circumstances, it may be determined that a foreign security needs to be fair valued because it appears that the value of the security might have been materially affected by events occurring after the close of the market in which the security is principally traded, but before the time the Fund calculates its NAV, such as by a development that affects an entire market or region (e.g., a weather-related event) or a potentially global development (e.g., a terrorist attack that may be expected to have an effect on investor expectations worldwide). |
| HENNESSY FUNDS | 1-800-966-4354 |
21
Registered Investment Companies – Investments in open-end registered investment companies, commonly referred to as mutual funds, generally are priced at the ending NAV provided by the applicable mutual fund’s service agent and are classified in Level 1 of the fair value hierarchy. | |
Debt Securities – Debt securities, including corporate bonds, asset-backed securities, mortgage-backed securities, municipal bonds, U.S. Treasuries, and U.S. government agency issues, are generally valued at market on the basis of valuations furnished by an independent pricing service that utilizes both dealer-supplied valuations and formula-based techniques. The pricing service may consider recently executed transactions in securities of the issuer or comparable issuers, market price quotations (where observable), bond spreads, and fundamental data relating to the issuer. In addition, the model may incorporate observable market data, such as reported sales of similar securities, broker quotes, yields, bids, offers, and reference data. Certain securities are valued primarily using dealer quotations. These securities are generally classified in Level 2 of the fair value hierarchy. | |
Short-Term Securities – Short-term equity investments, including money market funds, are valued in the manner specified above for equity securities. Short-term debt investments with an original term to maturity of 60 days or less are valued at amortized cost, which approximates fair market value. If the original term to maturity of a short-term debt investment exceeds 60 days, then the values as of the 61st day prior to maturity are amortized. Amortized cost is not used if its use would be inappropriate due to credit or other impairments of the issuer, in which case the security’s fair value would be determined as described below. Short-term securities are generally classified in Level 1 or Level 2 of the fair value hierarchy depending on the inputs used and market activity levels for specific securities. |
The Board of Trustees of the Fund (the “Board”) has adopted fair value pricing procedures that are followed when a price for a security is not readily available or if a significant event has occurred that indicates the closing price of a security no longer represents the true value of that security. Fair value pricing determinations are made in good faith in accordance with these procedures. There are numerous criteria considered in determining a fair value of a security, such as the trading volume of a security and markets, the values of other similar securities, and news events with direct bearing on a security or markets. Fair value pricing results in an estimated price for a security that reflects the amount the Fund might reasonably expect to receive in a current sale. Depending on the relative significance of the valuation inputs, these securities may be classified in either Level 2 or Level 3 of the fair value hierarchy.
The fair value of foreign securities may be determined with the assistance of a pricing service using correlations between the movement of prices of such securities and indices of domestic securities and other appropriate indicators, such as closing market prices of relevant American Depositary Receipts or futures contracts. Using fair value pricing means that the Fund’s NAV reflects the affected portfolio securities’ values as determined by the Board or its designee, pursuant to the fair value pricing procedures adopted by the Board, instead of being determined by the market. Using a fair value pricing methodology to price a foreign security may result in a value that is different from such foreign security’s most recent closing price and from the value used by other investment companies to calculate their NAVs. Such securities are generally classified in Level 2 of the fair value hierarchy. Because the Fund may invest in foreign securities, the value of the Fund’s portfolio securities may change on days when a shareholder is unable to purchase or redeem Fund shares.
| WWW.HENNESSYFUNDS.COM |
22
| NOTES TO THE FINANCIAL STATEMENTS |
The Board has delegated day-to-day valuation matters to the Valuation and Liquidity Committee comprising representatives from Hennessy Advisors, Inc., the Fund’s investment advisor (the “Advisor”). The function of the Valuation and Liquidity Committee, among other things, is to value securities where current and reliable market quotations are not readily available. All actions taken by the Valuation and Liquidity Committee are reviewed by the Board.
The Fund has performed an analysis of all existing investments to determine the significance and character of all inputs to their fair value determinations. Various inputs are used to determine the value of the Fund’s investments. The inputs or methodology used for valuing securities are not necessarily an indication of the risk associated with investing in those securities. Details related to the fair value hierarchy of the Fund’s securities as of October 31, 2021, are included in the Schedule of Investments.
4). INVESTMENT TRANSACTIONS
Purchases and sales of investment securities (excluding government and short-term investments) for the Fund during fiscal year 2021 were $12,566,765 and $13,226,685, respectively.
There were no purchases or sales/maturities of long-term U.S. government securities for the Fund during fiscal year 2021.
5). INVESTMENT ADVISORY FEE AND OTHER TRANSACTIONS WITH AFFILIATES
The Advisor provides the Fund with investment advisory services under an Investment Advisory Agreement. The Advisor oversees the provision of investment advice and furnishes office space, facilities, and most of the personnel needed by the Fund. As compensation for its services, the Advisor is entitled to a monthly fee from the Fund. The fee is based on the average daily net assets of the Fund at an annual rate of 1.10%. The net investment advisory fees expensed by the Fund during fiscal year 2021 are included in the Statement of Operations.
The Advisor has delegated the day-to-day management of the Fund to a sub-advisor, BP Capital Fund Advisors, LLC. The Advisor pays the sub-advisory fees from its own assets, and these fees are not an additional expense of the Fund. During fiscal year 2021, the Advisor (not the Fund) paid a sub-advisory fee at the rate of 0.40% of the daily net assets of the Fund.
The Advisor has contractually agreed to limit total annual operating expenses to 1.75% of the Fund’s net assets for Investor Class shares and 1.50% of the Fund’s net assets for Institutional Class shares (in each case, excluding all federal, state, and local taxes, interest, brokerage commissions, dividend and interest expenses on short sales, extraordinary items, and acquired fund fees and expenses and other costs incurred in connection with the purchase and sale of securities) through February 28, 2022.
For three years following the date on which expenses were waived or incurred, the Advisor may recoup waived or reimbursed expenses from the Fund if total operating expenses, including such recoupment, does not exceed the expense limitation in effect (i) at the time the Advisor waived or reimbursed such expenses and (ii) at the time the Advisor recoups such expenses. As of October 31, 2021, expenses subject to potential recovery for Investor Class and Institutional Class shares and the fiscal years in which they expire were as follows:
| Fiscal Year | Fiscal Year | Fiscal Year | |||
2022 | 2023 | 2024 | Total | ||
| Investor Class | $22,275 | $22,658 | $12,376 | $ 57,309 | |
| Institutional Class | $19,981 | $60,422 | $26,693 | $107,096 |
| HENNESSY FUNDS | 1-800-966-4354 |
23
The amount of the expense reimbursement by the Advisor for Institutional Class shares set forth in the Statement of Operations is net of $3,000 that the Advisor recouped from the Fund during fiscal year 2021.
The Board has approved a Shareholder Servicing Agreement for Investor Class shares of the Fund, which compensates the Advisor for the non-investment advisory services it provides to the Fund. The Shareholder Servicing Agreement provides for a monthly fee paid to the Advisor at an annual rate of 0.10% of the average daily net assets of the Fund attributable to Investor Class shares. The shareholder service fees expensed by the Fund during fiscal year 2021 are included in the Statement of Operations.
The Fund has adopted a plan pursuant to Rule 12b-1 under the Investment Company Act of 1940, as amended, that authorizes payments in connection with the distribution of Fund shares at an annual rate of up to 0.25% of the Fund’s average daily net assets attributable to Investor Class shares. Even though the authorized rate is up to 0.25%, the Fund is currently only using up to 0.15% of its average daily net assets attributable to Investor Class shares for such purpose. Amounts paid under the plan may be spent on any activities or expenses primarily intended to result in the sale of shares, including, but not limited to, advertising, shareholder account servicing, printing and mailing of prospectuses to other than current shareholders, printing and mailing of sales literature, and compensation for sales and marketing activities or to financial institutions and others, such as dealers and distributors. The distribution fees expensed by the Fund during fiscal year 2021 are included in the Statement of Operations.
The Fund has entered into agreements with various brokers, dealers, and financial intermediaries in connection with the sale of Fund shares. The agreements provide for periodic payments of sub-transfer agent expenses by the Fund to the brokers, dealers, and financial intermediaries for providing certain shareholder maintenance services. These shareholder services include the pre-processing and quality control of new accounts, shareholder correspondence, answering customer inquiries regarding account status, and facilitating shareholder telephone transactions. The sub-transfer agent fees expensed by the Fund during fiscal year 2021 are included in the Statement of Operations.
U.S. Bancorp Fund Services, LLC, d/b/a U.S. Bank Global Fund Services (“Fund Services”) provides the Fund with administrative, accounting, and transfer agent services. As administrator, Fund Services is responsible for activities such as (i) preparing various federal and state regulatory filings, reports, and returns for the Fund, (ii) preparing reports and materials to be supplied to the Board, (iii) monitoring the activities of the Fund’s custodian, transfer agent, and accountants, and (iv) coordinating the preparation and payment of the Fund’s expenses and reviewing the Fund’s expense accruals. U.S. Bank N.A., an affiliate of Fund Services, serves as the Fund’s custodian. The servicing agreements between the Trust, Fund Services, and U.S. Bank N.A. contain a fee schedule that is inclusive of administrative, accounting, custody, and transfer agent fees. The administrative, accounting, custody, and transfer agent fees expensed by the Fund during fiscal year 2021 are included in the Statement of Operations. Fund Services has voluntarily waived all or a portion of its fees for the Fund. The fees voluntarily waived by Fund Services during fiscal year 2021 are included in the Statement of Operations.
Quasar Distributors, LLC (“Quasar”), a wholly owned broker-dealer subsidiary of Foreside Financial Group, LLC (“Foreside”), acts as the Fund’s principal underwriter in a continuous public offering of Fund shares. Effective September 30, 2021, Genstar Capital, a private equity firm specializing in financial and related business service companies, acquired a majority interest in Foreside. The Board approved a new Distribution Agreement to enable Quasar to continue serving as the Fund’s distributor following the change in control of Foreside.
| WWW.HENNESSYFUNDS.COM |
24
| NOTES TO THE FINANCIAL STATEMENTS |
The officers of the Fund are affiliated with the Advisor. With the exception of the Chief Compliance Officer and the Senior Compliance Officer, such officers receive no compensation from the Fund for serving in their respective roles. The Fund, along with the other funds in the Hennessy Funds family (collectively, the “Hennessy Funds”), makes reimbursement payments on an equal basis to the Advisor for a portion of the salary and benefits associated with the office of the Chief Compliance Officer and for all of the salary and benefits associated with the office of the Senior Compliance Officer. The compliance fees expensed by the Fund during fiscal year 2021 are included in the Statement of Operations.
6). GUARANTEES AND INDEMNIFICATIONS
Under the Hennessy Funds’ organizational documents, their officers and trustees are indemnified by the Hennessy Funds against certain liabilities arising out of the performance of their duties to the Hennessy Funds. Additionally, in the normal course of business, the Hennessy Funds enter into contracts with service providers that contain general indemnification clauses. The Fund’s maximum exposure under these arrangements is unknown as this would involve future claims that may be made against the Fund that have not yet occurred. Currently, the Fund expects the risk of loss to be remote.
7). LINE OF CREDIT
The Fund has an uncommitted line of credit with the other Hennessy Funds in the amount of the lesser of (i) $100,000,000 or (ii) 33.33% of each Hennessy Fund’s net assets, or 30% for the Hennessy Gas Utility Fund and 10% for the Hennessy Balanced Fund. The line of credit is intended to provide any necessary short-term financing in connection with shareholder redemptions, subject to certain restrictions. The credit facility is with the Hennessy Funds’ custodian bank, U.S. Bank N.A. Borrowings under this arrangement bear interest at the bank’s prime rate and are secured by all of the Fund’s assets (as to its own borrowings only). During fiscal year 2021, the Fund had an outstanding average daily balance and a weighted average interest rate of $559 and 3.25%, respectively. The interest expensed by the Fund during fiscal year 2021 is included in the Statement of Operations. The maximum amount outstanding for the Fund during fiscal year 2021 was $117,000. As of October 31, 2021, the Fund did not have any borrowings outstanding under the line of credit.
8). FEDERAL TAX INFORMATION
As of October 31, 2021, the components of accumulated earnings (losses) for income tax purposes were as follows:
| Investments | |||||
| Cost of investments for tax purposes | $ | 23,165,795 | |||
| Gross tax unrealized appreciation | $ | 13,845,441 | |||
| Gross tax unrealized depreciation | (62,495 | ) | |||
| Net tax unrealized appreciation/(depreciation) | $ | 13,782,946 | |||
| As of October 31, 2021, deferred tax assets consisted of the following: | |||||
| Deferred tax assets (liabilities): | |||||
| Net operating losses | $ | 653,315 | |||
| Capital loss | 4,983,402 | ||||
| Unrealized (gain) loss on investments | (1,903,038 | ) | |||
| Total deferred tax assets, net | 3,733,679 | ||||
| Valuation allowance | (3,733,679 | ) | |||
| Net | $ | — | |||
| HENNESSY FUNDS | 1-800-966-4354 |
25
For fiscal year 2021, the Fund had an effective tax rate of 0% and a federal statutory rate of 21%, with the difference resulting from a change in the valuation allowance of the deferred tax assets.
Deferred income tax assets and liabilities are recorded for differences between the financial statement and tax basis of the assets and liabilities that will result in taxable or deductible amounts in the future based on enacted laws and rates applicable to the periods in which the differences are expected to affect taxable income. Valuation allowances are established when necessary to reduce deferred tax assets to the amount expected to be realized. The Fund has evaluated the available evidence supporting the realization of its gross deferred tax assets, including the amount and timing of future taxable income, and has determined that, based on net losses to date, it may not utilize all of its deferred tax assets in the future. As of October 31, 2021, the Fund established a valuation allowance in the amount of $3,733,679 against its deferred tax assets.
The Fund may carry forward any net capital loss five years to offset any future realized capital gains. The Fund may carry forward indefinitely any net operating loss arising in a tax year ending after December 31, 2017. As of October 31, 2021, the Fund had $21,961,713 in capital loss carryforwards that expire as follows:
Amount | Expiration | ||
| $5,811,427 | 10/31/2023 | ||
| 8,971,423 | 10/31/2024 | ||
| 7,178,863 | 10/31/2025 |
As of October 31, 2021, the Fund had $2,909,272 in net operating loss carryforwards that expire as follows:
Amount | Expiration | ||
| $ 360,753 | 11/30/2037 | ||
| 2,548,519 | Indefinite |
Total income taxes have been computed by applying the federal statutory income tax rate of 21% plus a blended state income tax rate. The Fund applied this effective rate to net investment income and realized and unrealized gains on investments before taxes in computing its total income taxes.
| Tax expense (benefit) at statutory rates | $ | 3,620,026 | |||
| State income tax expense, net of federal benefit | 278,358 | ||||
Tax expense (benefit) on permanent items(1) | (18,889 | ) | |||
| Tax expense (benefit) on expired carryforwards | — | ||||
| Tax expense (benefit) due to change in effective state rates | — | ||||
| Total current tax expense (benefit) | — | ||||
| Change in valuation allowance | (3,879,495 | ) | |||
| Total tax expense | $ | — | |||
(1) Permanent items consist of dividends-received deductions. |
The Fund recognizes the tax benefits of uncertain tax positions only where the position is “more likely than not” to be sustained assuming examination by tax authorities. Management has analyzed the Fund’s tax positions in all open tax years and has concluded that no liability for unrecognized tax benefits should be recorded related to uncertain tax positions taken on U.S. federal tax returns and state tax returns filed or expected to be filed. No income tax returns are currently under examination. Generally, the tax returns of the Fund for the prior three fiscal years are open for examination. Due to the nature of the Fund’s investments, the Fund may be required to file income tax returns in several states. The Fund is not aware of any tax positions for which it is reasonably possible that the total amounts of unrecognized tax benefits will change materially.
| WWW.HENNESSYFUNDS.COM |
26
| NOTES TO THE FINANCIAL STATEMENTS |
During fiscal years 2021 and 2020, the tax character of distributions paid by the Fund was as follows:
| Year Ended | Year Ended | ||||||||
| October 31, 2021 | October 31, 2020 | ||||||||
Ordinary income(1) | $ | — | $ | — | |||||
| Long-term capital gains | — | — | |||||||
| Return of capital | 4,176,540 | 3,976,946 | |||||||
| Total distributions | $ | 4,176,540 | $ | 3,976,946 | |||||
(1) Ordinary income includes short-term capital gains. | |||||||||
9). EVENTS SUBSEQUENT TO YEAR END
Management has evaluated the Fund’s related events and transactions that occurred subsequent to October 31, 2021, through the date of issuance of the Fund’s financial statements. Other than as disclosed below, management has determined that there were no subsequent events requiring recognition or disclosure in the financial statements.
On December 1, 2021, distributions were declared and paid to shareholders of record on November 30, 2021, as follows:
Return of Capital | ||
| Investor Class | $0.2575 | |
| Institutional Class | $0.2575 |
| HENNESSY FUNDS | 1-800-966-4354 |
27
Report of Independent Registered Public
Accounting Firm
To the Board of Trustees of Hennessy Funds Trust
and the shareholders of the Hennessy BP Midstream Fund
Novato, CA
Opinion on the Financial Statements
We have audited the accompanying statement of assets and liabilities of the Hennessy BP Midstream Fund (the “Fund”), a series of Hennessy Funds Trust, including the schedule of investments, as of October 31, 2021, the related statement of operations for the year then ended, the statements of changes in net assets for each of the two years in the period then ended, financial highlights for each of the three years in the period then ended, for the eleven months ended October 31, 2018, and each of the two years in the period ended November 30, 2017, and the related notes (collectively referred to as the “financial statements”). In our opinion, the financial statements present fairly, in all material respects, the financial position of the Fund as of October 31, 2021, the results of its operations for the year then ended, the changes in its net assets for each of the two years in the period then ended and the financial highlights for each of the three years in the period then ended, for the eleven months ended October 31, 2018, and each of the two years in the period ended November 30, 2017, in conformity with accounting principles generally accepted in the United States of America.
Basis for Opinion
These financial statements are the responsibility of the Fund’s management. Our responsibility is to express an opinion on the Fund’s financial statements based on our audits. We are a public accounting firm registered with the Public Company Accounting Oversight Board (United States) (“PCAOB”) and are required to be independent with respect to the Fund in accordance with the U.S. federal securities laws and the applicable rules and regulations of the Securities and Exchange Commission and the PCAOB. We have served as the auditor of one or more of the funds in the Trust since 2002.
We conducted our audits in accordance with the standards of the PCAOB. Those standards require that we plan and perform the audit to obtain reasonable assurance about whether the financial statements are free of material misstatement, whether due to error or fraud. The Fund is not required to have, nor were we engaged to perform, an audit of its internal control over financial reporting. As part of our audits we are required to obtain an understanding of internal control over financial reporting, but not for the purpose of expressing an opinion on the effectiveness of the Fund’s internal control over financial reporting. Accordingly, we express no such opinion.
Our audits included performing procedures to assess the risks of material misstatement of the financial statements, whether due to error or fraud, and performing procedures that respond to those risks. Such procedures included examining, on a test basis, evidence regarding the amounts and disclosures in the financial statements. Our audits also included evaluating the accounting principles used and significant estimates made by management, as well as evaluating the overall presentation of the financial statements. Our procedures included confirmation of securities owned as of October 31, 2021, by correspondence with the custodian. We believe that our audits provide a reasonable basis for our opinion.
| |
| TAIT, WELLER & BAKER LLP |
Philadelphia, Pennsylvania
December 22, 2021
| WWW.HENNESSYFUNDS.COM |
28
| REPORT OF INDEPENDENT REGISTERED PUBLIC ACCOUNTING FIRM/TRUSTEES AND OFFICERS |
Trustees and Officers of the Fund (Unaudited)
The business and affairs of the Funds are managed under the direction of the Board of Trustees of the Trust, and the Board of Trustees elects the officers of the Trust. From time to time, the Board of Trustees also has appointed advisers to the Board of Trustees (“Advisers”) with the intention of having qualified individuals serve in an advisory capacity to garner experience in the mutual fund and asset management industry and be considered as potential Trustees in the future. There are currently two Advisers, Brian Alexander and Doug Franklin. As Advisers, Mr. Alexander and Mr. Franklin attend meetings of the Board of Trustees and act as non-voting participants. Information pertaining to the Trustees, Advisers, and the officers of the Trust is set forth below. The Trustees and officers serve until their successors are duly elected and qualified or until their earlier death, resignation, or removal. Each Trustee oversees all 16 Hennessy Funds. Unless otherwise indicated, the address of all persons listed below is 7250 Redwood Boulevard, Suite 200, Novato, CA 94945. The Fund’s Statement of Additional Information includes more information about the persons listed below and is available without charge by calling 1-800-966-4354 or by visiting www.hennessyfunds.com.
| Other | |||
| Directorships | |||
| Held Outside | |||
| Name, Age, | of Fund | ||
| and Position Held | Start Date | Principal Occupation(s) | Complex During |
with the Trust | of Service | During Past Five Years | Past Five Years |
| Disinterested Trustees and Advisers | |||
| J. Dennis DeSousa | January 1996 | Mr. DeSousa is a real estate investor. | None. |
| 85 | |||
| Trustee | |||
| Robert T. Doyle | January 1996 | Mr. Doyle has been the Sheriff of | None. |
| 74 | Marin County, California since 1996. | ||
| Trustee | |||
| Claire Garvie | December 2015 | Ms. Garvie is a founder of Kiosk and | None. |
| 47 | as an Adviser | has served as its Chief Operating | |
| Trustee | to the Board | Officer since 2004. Kiosk is a full- | |
| and | service marketing agency with | ||
| December 2021 | offices in the San Francisco Bay Area, | ||
| as a Trustee | Toronto, and Liverpool, UK. | ||
| Gerald P. Richardson | May 2004 | Mr. Richardson is an independent | None. |
| 76 | consultant in the securities industry. | ||
| Trustee |
| HENNESSY FUNDS | 1-800-966-4354 |
29
| Other | |||
| Directorships | |||
| Held Outside | |||
| Name, Age, | of Fund | ||
| and Position Held | Start Date | Principal Occupation(s) | Complex During |
with the Trust | of Service | During Past Five Years | Past Five Years |
| Brian Alexander | March 2015 | Mr. Alexander has worked for the | None. |
| 40 | Sutter Health organization since | ||
| Adviser to the Board | 2011 in various positions. He has | ||
| served as the Chief Executive Officer | |||
| of the Sutter Roseville Medical | |||
| Center since 2018. From 2016 through | |||
| 2018, he served as the Vice President | |||
| of Strategy for the Sutter Health Valley | |||
| Area, which includes 11 hospitals, | |||
| 13 ambulatory surgery centers, | |||
| 16,000 employees, and 1,900 physicians. | |||
| From 2013 through 2016, Mr. Alexander | |||
| served as Sutter Novato Community | |||
| Hospital’s Chief Administrative Officer. | |||
| Doug Franklin | March 2016 | Mr. Franklin is a retired insurance | None. |
| 57 | industry executive. From 1987 | ||
| Adviser to the Board | through 2015, he was employed | ||
| by the Allianz-Fireman’s Fund | |||
| Insurance Company in various | |||
| positions, including as its Chief | |||
| Actuary and Chief Risk Officer. | |||
Interested Trustee(1) | |||
| Neil J. Hennessy | January 1996 as | Mr. Hennessy has been employed | Hennessy |
| 65 | a Trustee and | by Hennessy Advisors, Inc. since | Advisors, Inc. |
| Chairman of the Board, | June 2008 as | 1989 and currently serves as its | |
| Chief Market Strategist, | an officer | Chairman and Chief Executive Officer. | |
| Portfolio Manager, | |||
| and President |
| Name, Age, | ||
| and Position Held | Start Date | Principal Occupation(s) |
with the Trust | of Service | During Past Five Years |
| Officers | ||
| Teresa M. Nilsen | January 1996 | Ms. Nilsen has been employed by Hennessy Advisors, Inc. |
| 55 | since 1989 and currently serves as its President and Chief | |
| Executive Vice President | Operating Officer. | |
| and Treasurer | ||
| Daniel B. Steadman | March 2000 | Mr. Steadman has been employed by Hennessy Advisors, Inc. |
| 65 | since 2000 and currently serves as its Executive Vice President. | |
| Executive Vice President | ||
| and Secretary | ||
| Brian Carlson | December 2013 | Mr. Carlson has been employed by Hennessy Advisors, Inc. |
| 49 | since December 2013 and currently serves as its Chief | |
| Senior Vice President | Compliance Officer and Senior Vice President. | |
| and Head of Distribution |
| WWW.HENNESSYFUNDS.COM |
30
| TRUSTEES AND OFFICERS OF THE FUND |
| Name, Age, | ||
| and Position Held | Start Date | Principal Occupation(s) |
with the Trust | of Service | During Past Five Years |
Jennifer Cheskiewicz(2) | June 2013 | Ms. Cheskiewicz has been employed by Hennessy Advisors, Inc. |
| 44 | as its General Counsel since June 2013. | |
| Senior Vice President and | ||
| Chief Compliance Officer | ||
David Ellison(3) | October 2012 | Mr. Ellison has been employed by Hennessy Advisors, Inc. since |
| 63 | October 2012. He has served as a Portfolio Manager of the | |
| Senior Vice President | Hennessy Large Cap Financial Fund and the Hennessy Small | |
| and Portfolio Manager | Cap Financial Fund since their inception. Mr. Ellison also served | |
| as a Portfolio Manager of the Hennessy Technology Fund from | ||
| its inception until February 2017. Mr. Ellison served as Director, | ||
| CIO, and President of FBR Fund Advisers, Inc. from December | ||
| 1999 to October 2012. | ||
Ryan Kelley(4) | March 2013 | Mr. Kelley has been employed by Hennessy Advisors, Inc. since |
| 49 | October 2012. He has served as Chief Investment Officer of the | |
| Chief Investment Officer, | Hennessy Funds since March 2021 and has served as a Portfolio | |
| Senior Vice President, | Manager of the Hennessy Gas Utility Fund, the Hennessy Large | |
| and Portfolio Manager | Cap Financial Fund, and the Hennessy Small Cap Financial Fund | |
| since October 2014. Mr. Kelley served as Co-Portfolio Manager | ||
| of these same funds from March 2013 through September | ||
| 2014 and as a Portfolio Analyst for the Hennessy Funds from | ||
| October 2012 through February 2013. He has also served as a | ||
| Portfolio Manager of the Hennessy Cornerstone Growth Fund, | ||
| the Hennessy Cornerstone Mid Cap 30 Fund, the Hennessy | ||
| Cornerstone Large Growth Fund, and the Hennessy | ||
| Cornerstone Value Fund since February 2017 and as a Portfolio | ||
| Manager of the Hennessy Total Return Fund, the Hennessy | ||
| Balanced Fund, and the Hennessy Technology Fund since May | ||
| 2018. He served as Co-Portfolio Manager of the Hennessy | ||
| Technology Fund from February 2017 until May 2018. Mr. Kelley | ||
| served as Portfolio Manager of FBR Fund Advisers, Inc. from | ||
| January 2008 to October 2012. | ||
L. Joshua Wein(4) | September 2018 | Mr. Wein has been employed by Hennessy Advisors, Inc. since |
| 48 | 2018. He has served as Co-Portfolio Manager of the Hennessy | |
| Vice President and | Cornerstone Growth Fund, the Hennessy Cornerstone | |
| Co-Portfolio Manager | Mid Cap 30 Fund, the Hennessy Cornerstone Large Growth | |
| Fund, the Hennessy Cornerstone Value Fund, Hennessy Total | ||
| Return Fund, the Hennessy Balanced Fund, the Hennessy Gas | ||
| Utility Fund, and the Hennessy Technology Fund since February | ||
| 2019. He served as a Senior Analyst of these same funds from | ||
| September 2018 through February 2019. Mr. Wein served as | ||
| Director of Alternative Investments and Co-Portfolio Manager | ||
| at Sterling Capital Management from 2008 to 2018. |
_______________
(1) | Mr. Hennessy is considered an “interested person,” as defined in the Investment Company Act of 1940, as amended, because he is an officer of the Trust. |
(2) | The address of this officer is 4800 Bee Caves Road, Suite 100, Austin, TX 78746. |
(3) | The address of this officer is 101 Federal Street, Suite 1615B, Boston, MA 02110. |
(4) | The address of this officer is 1340 Environ Way, Chapel Hill, NC 27517. |
| HENNESSY FUNDS | 1-800-966-4354 |
31
Expense Example (Unaudited)
October 31, 2021
As a shareholder of the Fund, you incur ongoing costs, including management fees, service fees, and other Fund expenses. This Example is intended to help you understand your ongoing costs (in dollars) of investing in the Fund and to compare these costs with the ongoing costs of investing in other mutual funds. The Example is based on an investment of $1,000 invested at the beginning of the period and held for the entire period from May 1, 2021, through October 31, 2021.
Actual Expenses
In the table below, the first line under each of the “Investor Class” and “Institutional Class” headings provides information about actual account values and actual expenses for each share class. You may use this information, together with the amount you invested, to estimate the expenses that you paid over the period. Simply divide your account value by $1,000 (for example, an $8,600 account value divided by $1,000 = 8.6), then multiply the result by the number in the first line under the heading “Expenses Paid During Period” to estimate the expenses you paid on your account during this period. Although the Fund charges no sales loads or transaction fees, you will be assessed fees for outgoing wire transfers, returned checks, and stop payment orders at prevailing rates charged by U.S. Bank Global Fund Services, the Fund’s transfer agent. If you request that a redemption be made by wire transfer, the Fund’s transfer agent charges a $15 fee. IRAs are charged a $15 annual maintenance fee (up to $30 maximum per shareholder for shareholders with multiple IRAs). The examples below include, but are not limited to, management, shareholder servicing, accounting, custody, and transfer agent fees. However, the examples below do not include portfolio trading commissions and related expenses.
Hypothetical Example for Comparison Purposes
In the table below, the second line under each of the “Investor Class” and “Institutional Class” headings provides information about hypothetical account values and hypothetical expenses based on the Fund’s actual expense ratio for each share class and an assumed rate of return of 5% per year before expenses, which is not the Fund’s actual return for such share class. The hypothetical account values and expenses may not be used to estimate the actual ending account balance or expenses you paid for the period. You may use this information to compare the ongoing costs of investing in the Fund and other funds. To do so, compare these 5% hypothetical examples with the 5% hypothetical examples that appear in the shareholder reports of the other funds. Please note that the expenses shown in the table are meant to highlight your ongoing costs only. Therefore, the second lines under “Investor Class” and “Institutional Class” are useful in comparing ongoing costs only and will not help you determine the relative total costs of owning different funds.
| WWW.HENNESSYFUNDS.COM |
32
| EXPENSE EXAMPLE |
| Expenses Paid | |||
| Beginning | Ending | During Period(1) | |
| Account Value | Account Value | May 1, 2021 – | |
May 1, 2021 | October 31, 2021 | October 31, 2021 | |
| Investor Class | |||
| Actual | $1,000.00 | $1,149.60 | $9.48 |
| Hypothetical (5% return before expenses) | $1,000.00 | $1,016.38 | $8.89 |
| Institutional Class | |||
| Actual | $1,000.00 | $1,150.80 | $8.13 |
| Hypothetical (5% return before expenses) | $1,000.00 | $1,017.64 | $7.63 |
(1) | Expenses are equal to the Fund’s annualized expense ratio of 1.75% for Investor Class shares or 1.50% for Institutional Class shares, as applicable, multiplied by the average account value over the period, multiplied by 184/365 days (to reflect the half-year period). |
| HENNESSY FUNDS | 1-800-966-4354 |
33
How to Obtain a Copy of the Fund’s Proxy
Voting Policy and Proxy Voting Records
A description of the policies and procedures the Fund uses to determine how to vote proxies relating to portfolio securities is available without charge (1) by calling 1-800-966-4354, (2) on the Hennessy Funds’ website at www.hennessyfunds.com/proxy-voting/voting-policy, or (3) on the U.S. Securities and Exchange Commission’s (the “SEC”) website at www.sec.gov. The Fund’s proxy voting record is available without charge on both the Hennessy Funds’ website at www.hennessyfunds.com/proxy-voting/voting-record and the SEC’s website at www.sec.gov no later than August 31 for the prior 12 months ending June 30.
Availability of Quarterly Portfolio Schedule
The Fund files a complete schedule of portfolio holdings with the SEC for the first and third quarters of each fiscal year as an exhibit to its reports on Form N-PORT. The Fund’s Form N-PORT reports are available on the SEC’s website at www.sec.gov or on request by calling 1-800-966-4354.
Federal Tax Distribution Information (Unaudited)
For fiscal year 2021, certain dividends paid by the Fund may be subject to a maximum tax rate of 23.8%, as provided for by the Jobs and Growth Tax Relief Reconciliation Act of 2003. The percentage of dividends declared from ordinary income designated as qualified dividend income was 0.00%.
For corporate shareholders, the percent of ordinary income distributions that qualified for the corporate dividends received deduction for fiscal year 2021 was 0.00%.
The percentage of taxable ordinary income distributions that were designated as short-term capital gain distributions under Section 871(k)(2)(C) of the Internal Revenue Code of 1986, as amended, for the Fund was 0.00%.
Important Notice Regarding Delivery
of Shareholder Documents
To help keep the Fund’s costs as low as possible, we generally deliver a single copy of shareholder reports, proxy statements, and prospectuses to shareholders who share an address and have the same last name. This process does not apply to account statements. You may request an individual copy of a shareholder document at any time. If you would like to receive separate mailings of shareholder documents, please call U.S. Bank Global Fund Services at 1-800-261-6950 or 1-414-765-4124, and individual delivery will begin within 30 days of your request. If your account is held through a financial institution or other intermediary, please contact such intermediary directly to request individual delivery.
Electronic Delivery
As permitted by SEC regulations, the Fund’s shareholder reports are made available on a website, and unless you sign up for eDelivery or elect to receive paper copies as detailed below, you will be notified by mail each time a report is posted and provided with a website link to access the report.
The Fund also offers shareholders the option to receive all notices, account statements, prospectuses, tax forms, and shareholder reports online. To sign up for eDelivery or change your delivery preference, please visit www.hennessyfunds.com/account.
To elect to receive paper copies of all future reports free of charge, please call U.S. Bank Global Fund Services at 1-800-261-6950 or 1-414-765-4124.
Subscribe to receive our team’s unique market and sector insights delivered to your inbox
www.hennessyfunds.com/subscribe
Follow us on social media
| | |
| WWW.HENNESSYFUNDS.COM |
34
| PROXY VOTING — PRIVACY POLICY |
Liquidity Risk Management Program
In accordance with Rule 22e-4 under the Investment Company Act of 1940, as amended (the “Liquidity Rule”), we have adopted and implemented a liquidity risk management program (the “Liquidity Program”). The purpose of the Liquidity Program is to assess and manage the Fund’s liquidity risk, which is the risk that the Fund would not be able to meet requests to redeem Fund shares without significant dilution of the remaining shareholders’ interests in the Fund. The Board of Trustees of the Fund (the “Board”) designated a committee comprising representatives of Hennessy Advisors, Inc., the investment adviser to the Fund, as the administrator of the Liquidity Program (the “Program Administrator”).
The Program Administrator provided a written report regarding the Liquidity Program to the Board in advance of its meeting on June 2, 2021. The report covered the period from June 1, 2020, through May 31, 2021. The report addressed the operation of the Liquidity Program, assessed the adequacy and effectiveness of its implementation, and described any material changes to the Liquidity Program during the review period. The Trust’s chief compliance officer presented the report to the Board at the meeting and provided additional information regarding the Liquidity Program. The Board reviewed the Liquidity Program and considered, among other items, the following:
| 1. | The Program Administrator reviewed daily historical net redemption activity during the review period and during prior periods with higher-than-average redemption activity and concluded that the Fund has historically been able to meet requests to redeem Fund shares without significant dilution to the Fund’s remaining shareholders, and the Program Administrator expects the Fund to be able to continue to do so in the future during both normal and reasonably foreseeable stressed conditions. | |
| 2. | The Fund holds assets that are highly liquid investments and is therefore not required to establish a highly liquid investment minimum for the Fund or adopt policies and procedures for responding to a highly liquid investment minimum shortfall. | |
| 3. | The Program Administrator did not make any material changes to the Liquidity Program during the review period and did not recommend any changes to the Liquidity Program. The Program Administrator did make adjustments to the model inputs used to determine the liquidity classification of each security held by the Fund. | |
| 4. | The Program Administrator concluded that the Liquidity Program was reasonably designed to assess and manage the Fund’s liquidity risk, complies with the requirements of the Liquidity Rule, and was operating as intended during the review period. |
Privacy Policy
We collect the following personal information about you:
| 1. | Information we receive from you in applications or other forms, correspondence, or conversations, including, but not limited to, your name, address, phone number, social security number, assets, income, and date of birth; | |
| 2. | Information about your transactions with us, our affiliates, or others, including, but not limited to, your account number and balance, payments history, parties to transactions, cost basis information, and other financial information; and |
| HENNESSY FUNDS | 1-800-966-4354 |
35
| 3. | Other personal information we collect from various sources, even if you have not entered into a prior transaction with us, including the following: |
| • | Name, alias, address, unique personal identifier, online identifier, IP address, email address, telephone number, account name, and other similar identifiers; | |
| • | Age and marital status; | |
| • | Commercial information, including records of products purchased; | |
| • | Browsing history, search history, and information on interaction with our website; | |
| • | Geolocation data; | |
| • | Employment and employment history, educational history, financial information, and purchasing and consuming histories or tendencies; and | |
| • | Inferences drawn from the above-listed information to create a profile about your preferences, characteristics, predispositions, and behavior. |
We collect this information directly from you, indirectly in the course of providing services to you, directly and indirectly from your activity on our website, from broker dealers, marketing agencies, and other third parties that interact with us in connection with the services we perform and products we offer, and from anonymized and aggregated consumer information.
We use this information to fulfill the reason you provided the information to us, to provide you with other relevant products that you request from us, to provide you with information about products that may interest you, to improve our website or present our website’s contents to you, and as otherwise described to you when collecting your personal information.
We do not disclose any personal information to unaffiliated third parties, except as permitted by law. We may disclose your personal information to our affiliates, vendors, and service providers for a business purpose. For example, we are permitted by law to disclose all of the information we collect, as described above, to our transfer agent to process your transactions. When disclosing your personal information to third parties, we enter into a contract with each third party describing the purpose of such disclosure and requiring that such personal information be kept confidential and not used for any purpose except to perform the services contracted or respond to regulatory or law enforcement requests.
Furthermore, we restrict access to your personal information to those persons who require such information to provide products or services to you. As a result, we do not provide a means for opting out of our limited sharing of your information. We maintain physical, electronic, and procedural safeguards that comply with federal standards to guard your personal information.
If you hold shares of the Funds through a financial intermediary, including, but not limited to, a broker-dealer, bank, or trust company, the privacy policy of your financial intermediary governs how your personal information is shared with unaffiliated third parties.
Supplemental Privacy Notice for Residents of California
The California Consumer Privacy Act of 2018 (the “CCPA”) provides you, as a California resident, with certain additional rights relating to your personal information.
| WWW.HENNESSYFUNDS.COM |
36
| PRIVACY POLICY |
Under the CCPA, you have the right to request that we disclose to you the categories of personal information we have collected about you over the past 12 months, the categories of sources of such information, our business purpose for collecting the information, the categories of third parties, if any, with whom we shared the information, and the specific information we have collected about you. You also have the right to request that we delete any of your personal information, and, unless an exception applies, we will delete such information upon receiving and confirming your request. To make a request, call us at 1-800-966-4354, email us at privacy@hennessyfunds.com, or go to www.hennessyfunds.com/contact. We will not discriminate against you for exercising your rights under the CCPA. Further, we will not collect additional categories of your personal information or use the personal information we collected for materially different, unrelated, or incompatible purposes without providing you notice.
| HENNESSY FUNDS | 1-800-966-4354 |
37
For information, questions, or assistance, please call
The Hennessy Funds
1-800-966-4354 or 1-415-899-1555
INVESTMENT ADVISOR
Hennessy Advisors, Inc.
7250 Redwood Boulevard, Suite 200
Novato, California 94945
ADMINISTRATOR,
TRANSFER AGENT,
DIVIDEND PAYING AGENT, &
SHAREHOLDER SERVICING AGENT
U.S. Bancorp Fund Services, LLC
d/b/a U.S. Bank Global Fund Services
P.O. Box 701
Milwaukee, Wisconsin 53201-0701
CUSTODIAN
U.S. Bank N.A.
Custody Operations
1555 North River Center Drive, Suite 302
Milwaukee, Wisconsin 53212
TRUSTEES
Neil J. Hennessy
Robert T. Doyle
J. Dennis DeSousa
Claire Garvie
Gerald P. Richardson
COUNSEL
Foley & Lardner LLP
777 East Wisconsin Avenue
Milwaukee, Wisconsin 53202-5306
INDEPENDENT REGISTERED
PUBLIC ACCOUNTING FIRM
Tait, Weller & Baker LLP
Two Liberty Place
50 South 16th Street, Suite 2900
Philadelphia, Pennsylvania 19102-2529
DISTRIBUTOR
Quasar Distributors, LLC
111 East Kilbourn Avenue, Suite 2200
Milwaukee, Wisconsin 53202
www.hennessyfunds.com | 1-800-966-4354
This report has been prepared for shareholders and may be distributed to
others only if preceded or accompanied by a current prospectus.
ANNUAL REPORT
OCTOBER 31, 2021

HENNESSY GAS UTILITY FUND
Investor Class GASFX
Institutional Class HGASX
www.hennessyfunds.com | 1-800-966-4354
(This Page Intentionally Left Blank.)
Contents
| Letter to Shareholders | 2 |
| Performance Overview | 4 |
| Financial Statements | |
| Schedule of Investments | 7 |
| Statement of Assets and Liabilities | 11 |
| Statement of Operations | 12 |
| Statements of Changes in Net Assets | 13 |
| Financial Highlights | 14 |
| Notes to the Financial Statements | 18 |
| Report of Independent Registered Public Accounting Firm | 26 |
| Trustees and Officers of the Fund | 27 |
| Expense Example | 30 |
| Proxy Voting Policy and Proxy Voting Records | 32 |
| Availability of Quarterly Portfolio Schedule | 32 |
| Federal Tax Distribution Information | 32 |
| Important Notice Regarding Delivery of Shareholder Documents | 32 |
| Electronic Delivery | 32 |
| Liquidity Risk Management Program | 33 |
| Privacy Policy | 33 |
| HENNESSY FUNDS | 1-800-966-4354 |
December 2021
Dear Hennessy Funds Shareholder:
What a year this has been. While it doesn’t feel that we are out of the “pandemic” phase of the coronavirus crisis, we look forward to a day when we will eventually see fewer cases and potentially less severe variants. We feel extremely grateful to the many healthcare workers who have continued to work tirelessly during the recent surge. As we move through the next year, we hope that new U.S. cases will decline and that many other parts of the world will see improvements as well.
What a year this has been! As measured by the total return of the S&P 500® Index, as of October 31, 2021, the market was up 24.04% calendar year to date. This comes in the wake of a tumultuous 2020 in which the market plunged in the beginning of the pandemic and recovered dramatically to end the year up 18.40%. Interestingly, 18% appears to be a repeating number in the past dozen years. From the low point of the Financial Crisis (March 9, 2009) to the high point reached just prior to the COVID-19 pandemic (February 12, 2020), the S&P 500® Index was up 18.27% per year. We are well aware that past results are not predictive of the future, and we find ourselves naturally skeptical of such strong returns. But, as shown in the chart below, we find that the most common annual total returns of the market over the past 102 years range between 20% and 30% with the second most common being between 10% and 20%:
Source: Bloomberg L.P.
We will say it again, after showing a chart like the one above: Past results are not predictive of the future. Instead, we look at where we are right now – in the economy, in the market, in the business cycle – to reflect on where we have come from and where we may be going. U.S. GDP is strong and growing, interest rates remain low, and earnings growth and profitability remain robust. We believe stocks are trading at reasonable valuations when viewed as a whole, with the S&P 500® Index at 21.0x estimated earnings for 2022. Furthermore, we believe corporate balance sheets are healthy, with high levels of excess cash, which could support growth, increases in dividends, more share buybacks, and future acquisitions. Uncertainty and volatility can manifest at any time in the stock market, and the current market is no different. Investors have questions about inflation, worldwide supply chain issues, and what could drive the next boost in earnings. While these concerns are warranted, we continue to believe that overall the positives outweigh the negatives, and here at Hennessy we continue to see opportunity in the market and in our Funds.
| WWW.HENNESSYFUNDS.COM |
2
| LETTER TO SHAREHOLDERS |
What a (fiscal) year this has been!!! For our fiscal year ended October 31, 2021, the S&P 500® Index rose 42.91% on a total return basis, setting a new all-time high on the final day of the period. Except for a short 21-trading-day period that began on September 2 during which the market fell 5.13% only to rebound to new highs just 13 trading days later, the market has been on a continuous march higher. We saw a dramatic shift in market leadership as many of the sectors that underperformed during our last fiscal year soared in fiscal year 2021. Small-caps beat mid-caps, which in turn beat large-caps. The Energy and Financials sectors skyrocketed during the 12-month period, as reflected by the S&P 500® Energy Sector’s total return of 111.29% and the Russell 1000® Index Financials’ total return of 70.87%. Both of these sectors were among the worst performing in our fiscal year 2020, so a bounce back in our fiscal year 2021, while not a foregone conclusion, was a distinct possibility.
Overall, we are pleased with the performance of our mutual funds during the fiscal year. On an absolute basis, each of our 16 Funds achieved total returns greater than 10% and seven outperformed their primary benchmark. Ten of our 11 domestic equity-only Funds outperformed the S&P 500® Index and posted total returns of 45% or higher. Our four best-performing funds were concentrated in the Energy and Financials sectors. While some of our Funds certainly benefited from being in the “right” sector at the “right” time, we also believe this was a favorable period for our investment style of high-conviction investing and concentrated portfolio construction.
What will the coming year bring? As mentioned in our last shareholder letter (June 2021), we understand that even the greatest bull markets experience corrections along the way, and the last time the S&P 500® Index dropped over 10% was in February/March of 2020. Whether or not a correction occurs sooner or later, we believe the market as a whole has more room to run. We see many factors that could drive the market higher from here: strong GDP growth and increasing corporate earnings, a potentially lower-for-longer interest rate environment, accommodative fiscal and monetary policies, a healthy and robust financial system, low unemployment and solid wage growth, and strong corporate balance sheets with plenty of cash.
Thank you for your interest and for investing with us. We remain committed to managing our portfolios for long-term performance, ever mindful of downside risk. With so many investment options available to you, we are grateful for the trust you put in us and for your continued interest in our family of Funds. If you have any questions or would like to speak with us, please don’t hesitate to call us directly at (800) 966-4354.
Best regards,
| |
| |
| Ryan C. Kelley | |
| Chief Investment Officer |
Past performance does not guarantee future results. To obtain current standardized performance for the Hennessy Funds, visit https://www.hennessyfunds.com/funds/price-performance.
Mutual fund investing involves risk. Principal loss is possible.
Opinions expressed are those of Ryan C. Kelley and are subject to change, are not guaranteed, and should not be considered investment advice.
The Dow Jones Industrial Average and S&P 500® Index are commonly used to measure the performance of U.S. stocks. The S&P 500® Energy Index comprises those companies included in the S&P 500® Index that are classified in the Energy sector. The Russell 1000® Index Financials is a subset of the Russel 1000® Index that measures the performance of securities classified in the Financials sector of the large-capitalization U.S. equity market. The indices are used herein for comparative purposes in accordance with SEC regulations. One cannot invest directly in an index. All returns are shown on a total return basis.
| HENNESSY FUNDS | 1-800-966-4354 |
3
Performance Overview (Unaudited)
CHANGE IN VALUE OF $10,000 INVESTMENT
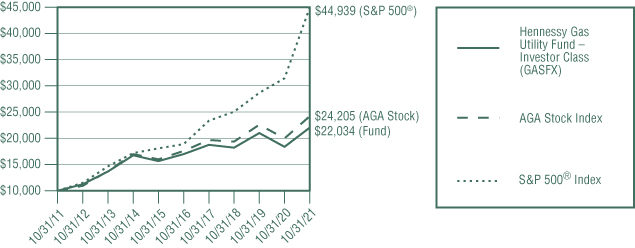
This graph illustrates the performance of an initial investment of $10,000 made in the Fund 10 years ago and assumes the reinvestment of dividends and capital gains.
AVERAGE ANNUAL TOTAL RETURN FOR PERIODS ENDED OCTOBER 31, 2021
| One | Five | Ten | ||
Year | Years | Years | ||
| Hennessy Gas Utility Fund – | ||||
| Investor Class (GASFX) | 19.91% | 5.34% | 8.22% | |
| Hennessy Gas Utility Fund – | ||||
Institutional Class (HGASX)(1) | 20.29% | 5.66% | 8.38% | |
| AGA Stock Index | 21.13% | 6.59% | 9.24% | |
S&P 500® Index | 42.91% | 18.93% | 16.21% |
Expense ratios: 1.02% (Investor Class); 0.70% (Institutional Class)
(1) | The inception date of Institutional Class shares is March 1, 2017. Performance shown prior to the inception of Institutional Class shares reflects the performance of Investor Class shares and includes expenses that are not applicable to, and are higher than, those of Institutional Class shares. |
Performance data quoted represents past performance; past performance does not guarantee future results. The investment return and principal value of an investment will fluctuate so that an investor’s shares, when redeemed, may be worth more or less than their original cost. The performance table does not reflect the deduction of taxes that a shareholder would pay on Fund distributions or the redemption of Fund shares. Current performance of the Fund may be lower or higher than the performance quoted. Performance data current to the most recent month end may be obtained by visiting www.hennessyfunds.com. Performance for periods including or prior to October 26, 2012, is that of the FBR Gas Utility Index Fund.
The AGA Stock Index is a capitalization-weighted index that consists of members of the American Gas Association whose securities are traded on a U.S. Stock Exchange. The S&P 500® Index is a capitalization-weighted index that is designed to represent the broad domestic economy through changes in the aggregate market value of 500 stocks across all major industries. One cannot invest directly in an index. These indices are used for comparative purposes in accordance with Securities and Exchange Commission regulations.
Standard & Poor’s Financial Services is the source and owner of the S&P® and S&P 500® trademarks.
| WWW.HENNESSYFUNDS.COM |
4
| PERFORMANCE OVERVIEW |
The expense ratios presented are from the most recent prospectus. The expense ratios for the current reporting period are available in the Financial Highlights section of this report.
PERFORMANCE NARRATIVE
Portfolio Managers Ryan C. Kelley, CFA, and L. Joshua Wein, CAIA
Performance:
For the one-year period ended October 31, 2021, the Investor Class of the Hennessy Gas Utility Fund returned 19.91%, underperforming both the AGA Stock Index (the Fund’s primary benchmark) and the S&P 500® Index, which returned 21.13% and 42.91%, respectively, for the same period.
The Fund slightly underperformed its primary benchmark due to Fund expenses, the timing of cash flows, trading costs, and the impact of holding cash. The Fund underperformed the broader domestic equity market, as represented by the S&P 500® Index, in part due to a continued investor preference for higher- growth companies as well as those most impacted by the rapid recovery in the economy at the expense of yield-oriented stocks such as those in the Utilities sector. A recent rise in interest rates coupled with the prospect of Federal Reserve interest rate hikes in 2022 has proven to be a challenge for the sector. Among the holdings that contributed the most to Fund performance were liquefied natural gas exporter Cheniere Energy, Inc. and pipeline operators Enbridge, Inc. and Kinder Morgan, Inc. Among the holdings that detracted the most from performance over the period were multi-utility WEC Energy Group, Inc., electric utility Xcel Energy, Inc. and multi-utility Dominion Energy, Inc.
The Fund continues to hold all the companies mentioned.
Portfolio Strategy:
The Fund’s objective is to maintain a high correlation with its primary benchmark, the AGA Stock Index. The Fund seeks to achieve this goal by owning all of the companies in the AGA Stock Index in substantially the same proportion as their weightings in the AGA Stock Index. The Fund seeks total returns by investing in natural gas distribution companies with the potential for both income and long-term capital appreciation.
The investment thesis of the Fund is that competitive pricing, abundant domestic supply, and new sources and uses of natural gas should lead to long-term, steady growth in demand that should drive growth in natural gas distribution. In turn, this should drive long-term growth in earnings of the companies held by the Fund. In addition, we believe that natural gas’s position as the cleanest of the fossil fuels should lead to additional increased demand, particularly from the electricity generation industry.
Investment Commentary:
We believe the strategy of the Fund remains compelling. The production of natural gas in the United States, in particular from shale producers, continues to grow steadily. Demand for natural gas from domestic sources, especially the power industry, also continues to trend upwards, despite softness due to the COVID-19 pandemic. In addition, exports of natural gas via pipelines to Mexico and in the form of liquid natural gas to the rest of the world remains a key demand component.
_______________
Opinions expressed are those of the Portfolio Manager as of the date written and are subject to change, are not guaranteed, and should not be considered investment advice or an indication of trading intent.
| HENNESSY FUNDS | 1-800-966-4354 |
5
Investments in foreign securities may involve political, economic, and currency risks, greater volatility, and differences in accounting methods. Investments are focused in the natural gas distribution and transmission industry; sector funds may be subject to a higher degree of market risk. Please see the Fund’s prospectus for a more complete discussion of these and other risks.
References to specific securities should not be considered a recommendation to buy or sell any security. Fund holdings and sector allocations are subject to change. Please refer to the Schedule of Investments included in this report for additional portfolio information.
| WWW.HENNESSYFUNDS.COM |
6
| PERFORMANCE OVERVIEW/SCHEDULE OF INVESTMENTS |
Financial Statements
Schedule of Investments as of October 31, 2021 |
HENNESSY GAS UTILITY FUND
(% of Net Assets)

| TOP TEN HOLDINGS (EXCLUDING MONEY MARKET FUNDS) | % NET ASSETS |
| Cheniere Energy, Inc. | 5.08% |
| Enbridge, Inc. | 5.08% |
| Berkshire Hathaway, Inc., Class A | 5.07% |
| Atmos Energy Corp. | 5.05% |
| Dominion Energy, Inc. | 5.05% |
| WEC Energy Group, Inc. | 4.94% |
| Sempra Energy | 4.89% |
| Kinder Morgan, Inc. | 4.85% |
| The Southern Co. | 4.82% |
| National Grid PLC – ADR | 4.32% |
Note: For presentation purposes, the Fund has grouped some of the industry categories. For purposes of categorizing securities for compliance with Section 8(b)(1) of the Investment Company Act of 1940, as amended, the Fund uses more specific industry classifications.
The Global Industry Classification Standard (GICS®) was developed by and is the exclusive property and a service mark of MSCI, Inc. and Standard & Poor’s Financial Services LLC. It has been licensed for use by the Hennessy Funds.
| HENNESSY FUNDS | 1-800-966-4354 |
7
| COMMON STOCKS – 98.96% | Number | % of | ||||||||||
| of Shares | Value | Net Assets | ||||||||||
| Energy – 15.69% | ||||||||||||
| Cheniere Energy, Inc. (a) | 255,417 | $ | 26,410,118 | 5.08 | % | |||||||
| Enbridge, Inc. (b) | 631,765 | 26,445,683 | 5.08 | % | ||||||||
| Kinder Morgan, Inc. | 1,507,101 | 25,243,941 | 4.85 | % | ||||||||
| Tellurian, Inc. (a) | 908,690 | 3,562,065 | 0.68 | % | ||||||||
| 81,661,807 | 15.69 | % | ||||||||||
| Financials – 5.07% | ||||||||||||
| Berkshire Hathaway, Inc., Class A (a) | 61 | 26,407,022 | 5.07 | % | ||||||||
| Utilities – 78.20% | ||||||||||||
| Algonquin Power & Utilities Corp. (b) | 170,764 | 2,464,125 | 0.47 | % | ||||||||
| ALLETE, Inc. | 525 | 32,309 | 0.01 | % | ||||||||
| Ameren Corp. | 62,840 | 5,296,784 | 1.02 | % | ||||||||
| Atmos Energy Corp. | 285,286 | 26,280,546 | 5.05 | % | ||||||||
| Avangrid, Inc. | 131,000 | 6,903,700 | 1.33 | % | ||||||||
| Avista Corp. | 34,972 | 1,392,235 | 0.27 | % | ||||||||
| Black Hills Corp. | 85,247 | 5,658,696 | 1.09 | % | ||||||||
| Centerpoint Energy, Inc. | 661,628 | 17,228,793 | 3.31 | % | ||||||||
| Chesapeake Utilities Corp. | 30,958 | 4,057,665 | 0.78 | % | ||||||||
| CMS Energy Corp. | 228,098 | 13,765,714 | 2.65 | % | ||||||||
| Consolidated Edison, Inc. | 192,536 | 14,517,214 | 2.79 | % | ||||||||
| Corning Natural Gas Holding Corp. | 5,399 | 131,682 | 0.02 | % | ||||||||
| Dominion Energy, Inc. | 346,077 | 26,277,627 | 5.05 | % | ||||||||
| DTE Energy Co. | 77,504 | 8,785,078 | 1.69 | % | ||||||||
| Duke Energy Corp. | 162,487 | 16,575,299 | 3.18 | % | ||||||||
| Entergy Corp. | 4,960 | 510,979 | 0.10 | % | ||||||||
| Essential Utilities, Inc. | 238,300 | 11,216,781 | 2.16 | % | ||||||||
| Eversource Energy | 82,675 | 7,019,108 | 1.35 | % | ||||||||
| Exelon Corp. | 149,031 | 7,926,959 | 1.52 | % | ||||||||
| Fortis, Inc. (b) | 186,876 | 8,317,851 | 1.60 | % | ||||||||
| MDU Resources Group, Inc. | 191,207 | 5,875,791 | 1.13 | % | ||||||||
| MGE Energy, Inc. | 15,129 | 1,148,140 | 0.22 | % | ||||||||
| National Fuel Gas Co. | 131,924 | 7,576,395 | 1.46 | % | ||||||||
| National Grid PLC – ADR (b) | 350,444 | 22,456,452 | 4.32 | % | ||||||||
| New Jersey Resources Corp. | 180,934 | 6,841,115 | 1.31 | % | ||||||||
| NiSource, Inc. | 592,581 | 14,618,973 | 2.81 | % | ||||||||
The accompanying notes are an integral part of these financial statements.
| WWW.HENNESSYFUNDS.COM |
8
| SCHEDULE OF INVESTMENTS |
| COMMON STOCKS | Number | % of | ||||||||||
| of Shares | Value | Net Assets | ||||||||||
| Utilities (Continued) | ||||||||||||
| Northwest Natural Holding Co. | 72,703 | $ | 3,278,178 | 0.63 | % | |||||||
| NorthWestern Corp. | 34,698 | 1,972,928 | 0.38 | % | ||||||||
| ONE Gas, Inc. | 133,375 | 8,976,138 | 1.72 | % | ||||||||
| PG&E Corp. (a) | 1,591,649 | 18,463,128 | 3.55 | % | ||||||||
| PPL Corp. | 85,719 | 2,468,707 | 0.47 | % | ||||||||
| Public Service Enterprise Group, Inc. | 234,190 | 14,941,322 | 2.87 | % | ||||||||
| RGC Resources, Inc. | 22,254 | 492,259 | 0.09 | % | ||||||||
| Sempra Energy | 199,240 | 25,429,001 | 4.89 | % | ||||||||
| South Jersey Industries, Inc. | 251,771 | 5,730,308 | 1.10 | % | ||||||||
| Southwest Gas Holdings, Inc. | 121,217 | 8,394,277 | 1.61 | % | ||||||||
| Spire, Inc. | 91,991 | 5,773,355 | 1.11 | % | ||||||||
| The Southern Co. | 402,200 | 25,065,104 | 4.82 | % | ||||||||
| UGI Corp. | 138,152 | 5,997,178 | 1.15 | % | ||||||||
| Unitil Corp. | 23,598 | 985,217 | 0.19 | % | ||||||||
| WEC Energy Group, Inc. | 285,440 | 25,706,726 | 4.94 | % | ||||||||
| Xcel Energy, Inc. | 160,399 | 10,360,171 | 1.99 | % | ||||||||
| 406,910,008 | 78.20 | % | ||||||||||
| Total Common Stocks | ||||||||||||
| (Cost $263,122,249) | 514,978,837 | 98.96 | % | |||||||||
| PARTNERSHIPS – 0.61% | ||||||||||||
| Energy – 0.61% | ||||||||||||
| Plains GP Holdings LP, Class A | 291,255 | 3,174,679 | 0.61 | % | ||||||||
| Total Partnerships | ||||||||||||
| (Cost $4,756,186) | 3,174,679 | 0.61 | % | |||||||||
The accompanying notes are an integral part of these financial statements.
| HENNESSY FUNDS | 1-800-966-4354 |
9
| SHORT-TERM INVESTMENTS – 0.42% | Number | % of | ||||||||||
| of Shares | Value | Net Assets | ||||||||||
| Money Market Funds – 0.42% | ||||||||||||
| First American Government Obligations Fund, | ||||||||||||
| Institutional Class, 0.03% (c) | 2,169,988 | $ | 2,169,988 | 0.42 | % | |||||||
| Total Short-Term Investments | ||||||||||||
| (Cost $2,169,988) | 2,169,988 | 0.42 | % | |||||||||
| Total Investments | ||||||||||||
| (Cost $270,048,423) – 99.99% | 520,323,504 | 99.99 | % | |||||||||
| Other Assets in Excess of Liabilities – 0.01% | 51,618 | 0.01 | % | |||||||||
TOTAL NET ASSETS – 100.00% | $ | 520,375,122 | 100.00 | % | ||||||||
Percentages are stated as a percent of net assets.
ADR – American Depositary Receipt
PLC – Public Limited Company
| (a) | Non-income-producing security. |
| (b) | U.S.-traded security of a foreign corporation. |
| (c) | The rate listed is the fund’s seven-day yield as of October 31, 2021. |
Summary of Fair Value Exposure as of October 31, 2021
The following is a summary of the inputs used to value the Fund’s net assets as of October 31, 2021 (see Note 3 in the accompanying Notes to the Financial Statements):
| Common Stocks | Level 1 | Level 2 | Level 3 | Total | ||||||||||||
| Energy | $ | 81,661,807 | $ | — | $ | — | $ | 81,661,807 | ||||||||
| Financials | 26,407,022 | — | — | 26,407,022 | ||||||||||||
| Utilities | 406,778,326 | 131,682 | — | 406,910,008 | ||||||||||||
| Total Common Stocks | $ | 514,847,155 | $ | 131,682 | $ | — | $ | 514,978,837 | ||||||||
| Partnerships | ||||||||||||||||
| Energy | $ | 3,174,679 | $ | — | $ | — | $ | 3,174,679 | ||||||||
| Total Partnerships | $ | 3,174,679 | $ | — | $ | — | $ | 3,174,679 | ||||||||
| Short-Term Investments | ||||||||||||||||
| Money Market Funds | $ | 2,169,988 | $ | — | $ | — | $ | 2,169,988 | ||||||||
| Total Short-Term Investments | $ | 2,169,988 | $ | — | $ | — | $ | 2,169,988 | ||||||||
| Total Investments | $ | 520,191,822 | $ | 131,682 | $ | — | $ | 520,323,504 | ||||||||
The accompanying notes are an integral part of these financial statements.
| WWW.HENNESSYFUNDS.COM |
10
| SCHEDULE OF INVESTMENTS/STATEMENT OF ASSETS AND LIABILITIES |
Financial Statements
Statement of Assets and Liabilities as of October 31, 2021 |
| ASSETS: | ||||
| Investments in securities, at value (cost $270,048,423) | $ | 520,323,504 | ||
| Dividends and interest receivable | 169,665 | |||
| Receivable for fund shares sold | 145,451 | |||
| Return of capital receivable | 459,343 | |||
| Prepaid expenses and other assets | 35,729 | |||
| Total assets | 521,133,692 | |||
| LIABILITIES: | ||||
| Payable for fund shares redeemed | 182,878 | |||
| Payable to advisor | 176,543 | |||
| Payable to administrator | 147,069 | |||
| Payable to auditor | 22,556 | |||
| Accrued distribution fees | 92,715 | |||
| Accrued service fees | 38,767 | |||
| Accrued trustees fees | 6,605 | |||
| Accrued expenses and other payables | 91,437 | |||
| Total liabilities | 758,570 | |||
| NET ASSETS | $ | 520,375,122 | ||
| NET ASSETS CONSISTS OF: | ||||
| Capital stock | $ | 262,552,864 | ||
| Total distributable earnings | 257,822,258 | |||
| Total net assets | $ | 520,375,122 | ||
| NET ASSETS: | ||||
| Investor Class | ||||
| Shares authorized (no par value) | Unlimited | |||
| Net assets applicable to outstanding shares | $ | 457,312,854 | ||
| Shares issued and outstanding | 17,530,835 | |||
| Net asset value, offering price, and redemption price per share | $ | 26.09 | ||
| Institutional Class | ||||
| Shares authorized (no par value) | Unlimited | |||
| Net assets applicable to outstanding shares | $ | 63,062,268 | ||
| Shares issued and outstanding | 2,424,377 | |||
| Net asset value, offering price, and redemption price per share | $ | 26.01 | ||
The accompanying notes are an integral part of these financial statements.
| HENNESSY FUNDS | 1-800-966-4354 |
11
Financial Statements
Statement of Operations for the year ended October 31, 2021 |
| INVESTMENT INCOME: | ||||
Dividend income(1) | $ | 16,407,393 | ||
| Interest income | 945 | |||
| Total investment income | 16,408,338 | |||
| EXPENSES: | ||||
| Investment advisory fees (See Note 5) | 2,144,490 | |||
| Sub-transfer agent expenses – Investor Class (See Note 5) | 758,503 | |||
| Sub-transfer agent expenses – Institutional Class (See Note 5) | 56,139 | |||
| Distribution fees – Investor Class (See Note 5) | 712,549 | |||
| Administration, accounting, custody, and transfer agent fees (See Note 5) | 596,226 | |||
| Service fees – Investor Class (See Note 5) | 475,033 | |||
| Federal and state registration fees | 41,219 | |||
| Reports to shareholders | 34,038 | |||
| Compliance expense (See Note 5) | 27,464 | |||
| Audit fees | 22,556 | |||
| Trustees’ fees and expenses | 21,770 | |||
| Legal fees | 8,886 | |||
| Interest expense (See Note 7) | 4,378 | |||
| Other expenses | 279,755 | |||
| Total expenses | 5,183,006 | |||
| NET INVESTMENT INCOME | $ | 11,225,332 | ||
| REALIZED AND UNREALIZED GAINS (LOSSES): | ||||
| Net realized gain on investments | $ | 69,474,485 | ||
| Net change in unrealized appreciation/depreciation on investments | 17,334,029 | |||
| Net gain on investments | 86,808,514 | |||
| NET INCREASE IN NET ASSETS RESULTING FROM OPERATIONS | $ | 98,033,846 | ||
(1) | Net of foreign taxes withheld and issuance fees of $444,688. |
The accompanying notes are an integral part of these financial statements.
| WWW.HENNESSYFUNDS.COM |
12
| STATEMENT OF OPERATIONS/STATEMENTS OF CHANGES IN NET ASSETS |
Financial Statements
| Statements of Changes in Net Assets |
| Year Ended | Year Ended | |||||||
| October 31, 2021 | October 31, 2020 | |||||||
| OPERATIONS: | ||||||||
| Net investment income | $ | 11,225,332 | $ | 15,702,984 | ||||
| Net realized gain on investments | 69,474,485 | 54,725,195 | ||||||
| Net change in unrealized | ||||||||
| appreciation/depreciation on investments | 17,334,029 | (171,354,296 | ) | |||||
| Net increase (decrease) in net | ||||||||
| assets resulting from operations | 98,033,846 | (100,926,117 | ) | |||||
| DISTRIBUTIONS TO SHAREHOLDERS: | ||||||||
| Distributable earnings – Investor Class | (48,578,658 | ) | (49,160,002 | ) | ||||
| Distributable earnings – Institutional Class | (6,556,181 | ) | (7,345,698 | ) | ||||
| Total distributions | (55,134,839 | ) | (56,505,700 | ) | ||||
| CAPITAL SHARE TRANSACTIONS: | ||||||||
| Proceeds from shares subscribed – Investor Class | 10,282,767 | 14,476,846 | ||||||
| Proceeds from shares subscribed – Institutional Class | 16,158,873 | 14,135,940 | ||||||
| Dividends reinvested – Investor Class | 46,063,257 | 46,815,183 | ||||||
| Dividends reinvested – Institutional Class | 5,933,451 | 6,501,998 | ||||||
| Cost of shares redeemed – Investor Class | (121,059,136 | ) | (204,352,983 | ) | ||||
| Cost of shares redeemed – Institutional Class | (29,927,336 | ) | (41,410,617 | ) | ||||
| Net decrease in net assets derived | ||||||||
| from capital share transactions | (72,548,124 | ) | (163,833,633 | ) | ||||
| TOTAL DECREASE IN NET ASSETS | (29,649,117 | ) | (321,265,450 | ) | ||||
| NET ASSETS: | ||||||||
| Beginning of year | 550,024,239 | 871,289,689 | ||||||
| End of year | $ | 520,375,122 | $ | 550,024,239 | ||||
| CHANGES IN SHARES OUTSTANDING: | ||||||||
| Shares sold – Investor Class | 412,697 | 561,691 | ||||||
| Shares sold – Institutional Class | 624,642 | 539,370 | ||||||
| Shares issued to holders as reinvestment | ||||||||
| of dividends – Investor Class | 1,920,697 | 1,761,437 | ||||||
| Shares issued to holders as reinvestment | ||||||||
| of dividends – Institutional Class | 247,846 | 245,860 | ||||||
| Shares redeemed – Investor Class | (4,884,070 | ) | (8,021,029 | ) | ||||
| Shares redeemed – Institutional Class | (1,215,733 | ) | (1,643,216 | ) | ||||
| Net decrease in shares outstanding | (2,893,921 | ) | (6,555,887 | ) | ||||
The accompanying notes are an integral part of these financial statements.
| HENNESSY FUNDS | 1-800-966-4354 |
13
Financial Statements
| Financial Highlights |
For an Investor Class share outstanding throughout each year
PER SHARE DATA:
Net asset value, beginning of year
Income from investment operations:
Net investment income
Net realized and unrealized gains (losses) on investments
Total from investment operations
Less distributions:
Dividends from net investment income
Dividends from net realized gains
Total distributions
Net asset value, end of year
TOTAL RETURN
SUPPLEMENTAL DATA AND RATIOS:
Net assets, end of year (millions)
Ratio of expenses to average net assets
Ratio of net investment income to average net assets
Portfolio turnover rate(2)
(1) | Calculated using the average shares outstanding method. |
(2) | Calculated on the basis of the Fund as a whole. |
The accompanying notes are an integral part of these financial statements.
| WWW.HENNESSYFUNDS.COM |
14
| FINANCIAL HIGHLIGHTS — INVESTOR CLASS |
| Year Ended October 31, | ||||||||||||||||||
| 2021 | 2020 | 2019 | 2018 | 2017 | ||||||||||||||
| $ | 24.08 | $ | 29.64 | $ | 28.68 | $ | 30.35 | $ | 28.57 | |||||||||
| 0.52 | (1) | 0.58 | (1) | 0.56 | (1) | 0.65 | 0.70 | |||||||||||
| 4.00 | (4.14 | ) | 3.50 | (1.52 | ) | 2.20 | ||||||||||||
| 4.52 | (3.56 | ) | 4.06 | (0.87 | ) | 2.90 | ||||||||||||
| (0.57 | ) | (0.56 | ) | (0.62 | ) | (0.64 | ) | (0.72 | ) | |||||||||
| (1.94 | ) | (1.44 | ) | (2.48 | ) | (0.16 | ) | (0.40 | ) | |||||||||
| (2.51 | ) | (2.00 | ) | (3.10 | ) | (0.80 | ) | (1.12 | ) | |||||||||
| $ | 26.09 | $ | 24.08 | $ | 29.64 | $ | 28.68 | $ | 30.35 | |||||||||
| 19.91 | % | -12.49 | % | 15.28 | % | -2.86 | % | 10.39 | % | |||||||||
| $ | 457.31 | $ | 483.56 | $ | 764.10 | $ | 825.18 | $ | 1,306.70 | |||||||||
| 1.00 | % | 1.02 | % | 1.00 | % | 1.01 | % | 1.01 | % | |||||||||
| 2.06 | % | 2.24 | % | 1.98 | % | 2.18 | % | 2.34 | % | |||||||||
| 15 | % | 16 | % | 12 | % | 14 | % | 18 | % | |||||||||
The accompanying notes are an integral part of these financial statements.
| HENNESSY FUNDS | 1-800-966-4354 |
15
Financial Statements
| Financial Highlights |
For an Institutional Class share outstanding throughout each period
PER SHARE DATA:
Net asset value, beginning of period
Income from investment operations:
Net investment income
Net realized and unrealized gains (losses) on investments
Total from investment operations
Less distributions:
Dividends from net investment income
Dividends from net realized gains
Total distributions
Net asset value, end of period
TOTAL RETURN
SUPPLEMENTAL DATA AND RATIOS:
Net assets, end of period (millions)
Ratio of expenses to average net assets
Ratio of net investment income to average net assets
Portfolio turnover rate(6)
(1) | Institutional Class shares commenced operations on March 1, 2017. |
(2) | Calculated using the average shares outstanding method. |
(3) | Actual return from inception date of March 1, 2017, to the year end of October 31, 2017. |
(4) | Not annualized. |
(5) | Annualized. |
(6) | Calculated on the basis of the Fund as a whole. |
The accompanying notes are an integral part of these financial statements.
| WWW.HENNESSYFUNDS.COM |
16
| FINANCIAL HIGHLIGHTS — INSTITUTIONAL CLASS |
| Year Ended October 31, | Period Ended | |||||||||||||||||
| October 31, | ||||||||||||||||||
| 2021 | 2020 | 2019 | 2018 | 2017(1) | ||||||||||||||
| $ | 24.01 | $ | 29.56 | $ | 28.65 | $ | 30.32 | $ | 29.68 | |||||||||
| 0.59 | (2) | 0.66 | (2) | 0.64 | (2) | 0.71 | 0.62 | |||||||||||
| 3.99 | (4.13 | ) | 3.50 | (1.47 | ) | 0.72 | ||||||||||||
| 4.58 | (3.47 | ) | 4.14 | (0.76 | ) | 1.34 | ||||||||||||
| (0.65 | ) | (0.64 | ) | (0.73 | ) | (0.75 | ) | (0.70 | ) | |||||||||
| (1.93 | ) | (1.44 | ) | (2.50 | ) | (0.16 | ) | — | ||||||||||
| (2.58 | ) | (2.08 | ) | (3.23 | ) | (0.91 | ) | (0.70 | ) | |||||||||
| $ | 26.01 | $ | 24.01 | $ | 29.56 | $ | 28.65 | $ | 30.32 | |||||||||
| 20.29 | % | -12.22 | % | 15.63 | % | -2.51 | % | 4.56 | %(3)(4) | |||||||||
| $ | 63.06 | $ | 66.46 | $ | 107.18 | $ | 107.75 | $ | 84.62 | |||||||||
| 0.69 | % | 0.70 | % | 0.69 | % | 0.65 | % | 0.64 | %(5) | |||||||||
| 2.35 | % | 2.57 | % | 2.25 | % | 2.47 | % | 1.23 | %(5) | |||||||||
| 15 | % | 16 | % | 12 | % | 14 | % | 18 | %(4) | |||||||||
The accompanying notes are an integral part of these financial statements.
| HENNESSY FUNDS | 1-800-966-4354 |
17
Financial Statements
Notes to the Financial Statements October 31, 2021 |
1). ORGANIZATION
The Hennessy Gas Utility Fund (the “Fund”) is a series of Hennessy Funds Trust (the “Trust”), which was organized as a Delaware statutory trust on September 17, 1992. The Fund is an open-end management investment company registered under the Investment Company Act of 1940, as amended. The investment objective of the Fund is income and capital appreciation. The Fund is a diversified fund.
The Fund offers Investor Class and Institutional Class shares. Each class of shares differs principally in its respective 12b-1 distribution and service, shareholder servicing, and sub-transfer agent expenses. There are no sales charges. Each class has identical rights to earnings, assets, and voting privileges, except for class-specific expenses and exclusive rights to vote on matters affecting only one class.
As an investment company, the Fund follows the investment company accounting and reporting guidance of the Financial Accounting Standards Board (“FASB”) Accounting Standard Codification Topic 946 “Financial Services—Investment Companies.”
2). SIGNIFICANT ACCOUNTING POLICIES
The following is a summary of significant accounting policies consistently followed by the Fund in the preparation of the financial statements. These policies conform to U.S. generally accepted accounting principles (“GAAP”).
| a). | Securities Valuation – All investments in securities are valued in accordance with the Fund’s valuation policies and procedures, as described in Note 3. |
| b). | Federal Income Taxes – The Fund has elected to be taxed as a regulated investment company and intends to distribute substantially all of its taxable income to its shareholders and otherwise comply with the provisions of the Internal Revenue Code of 1986, as amended, applicable to regulated investment companies. As a result, the Fund has made no provision for federal income taxes or excise taxes. Net investment income/loss and realized gains/losses for federal income tax purposes may differ from those reported in the financial statements because of temporary book-basis and tax-basis differences. Temporary differences are primarily the result of the treatment of wash sales for tax reporting purposes. The Fund recognizes interest and penalties related to income tax benefits, if any, in the Statement of Operations as an income tax expense. Distributions from net realized gains for book purposes may include short-term capital gains, which are included as ordinary income to shareholders for tax purposes. The Fund may utilize equalization accounting for tax purposes and designate earnings and profits, including net realized gains distributed to shareholders on redemption of shares, as part of the dividends paid deduction for income tax purposes. |
| Due to inherent differences in the recognition of income, expenses, and realized gains/losses under GAAP and federal income tax regulations, permanent differences between book and tax basis for reporting are identified and appropriately reclassified in the Statement of Assets and Liabilities, as needed. The adjustments for fiscal year 2021 are as follows: |
| Total | |||
| Distributable | |||
Earnings | Capital Stock | ||
| $(7,891,773) | $7,891,773 |
| WWW.HENNESSYFUNDS.COM |
18
| NOTES TO THE FINANCIAL STATEMENTS |
| c). | Accounting for Uncertainty in Income Taxes – The Fund has accounting policies regarding recognition and measurement of tax positions taken or expected to be taken on a tax return. The tax returns of the Fund for the prior three fiscal years are open for examination. The Fund has reviewed all open tax years in major tax jurisdictions and concluded that there is no impact on the Fund’s net assets and no tax liability resulting from unrecognized tax benefits relating to uncertain income tax positions taken or expected to be taken on a tax return. The Fund’s major tax jurisdictions are U.S. federal and Delaware. |
| d). | Income and Expenses – Dividend income is recognized on the ex-dividend date or as soon as information is available to the Fund. Interest income, which includes the amortization of premium and accretion of discount, is recognized on an accrual basis. Market discounts, original issue discounts, and market premiums on debt securities are accreted or amortized to interest income over the life of a security with a corresponding increase or decrease, as applicable, in the cost basis of such security using the yield-to-maturity method or, where applicable, the first call date of the security. Other non-cash dividends are recognized as investment income at the fair value of the property received. The Fund is charged for those expenses that are directly attributable to its portfolio, such as advisory, administration, and certain shareholder service fees. Income, expenses (other than expenses attributable to a specific class), and realized and unrealized gains/losses on investments are allocated to each class of shares based on such class’s net assets. |
| e). | Distributions to Shareholders – Dividends from net investment income for the Fund, if any, are declared and paid at the end of each calendar quarter. Distributions of net realized capital gains, if any, are declared and paid annually, usually in December. |
| f). | Security Transactions – Investment and shareholder transactions are recorded on the trade date. The Fund determines the realized gain/loss from an investment transaction by comparing the original cost of the security lot sold with the net sale proceeds. Discounts and premiums on securities purchased are accreted or amortized, respectively, over the life of each such security. |
| g). | Use of Estimates – Preparing financial statements in accordance with GAAP requires management to make estimates and assumptions that affect the reported amounts of assets and liabilities and disclosure of contingent assets and liabilities at the date of the financial statements, as well as the reported change in net assets during the reporting period. Actual results could differ from those estimates. |
| h). | Share Valuation – The net asset value (“NAV”) per share of the Fund is calculated by dividing (i) the total value of the securities held by the Fund, plus cash and other assets, minus all liabilities (including estimated accrued expenses) by (ii) the total number of Fund shares outstanding, rounded to the nearest $0.01. Fund shares are not priced on days the New York Stock Exchange is closed for trading. The offering and redemption price per share for the Fund is equal to the Fund’s NAV per share. |
| i). | Recent Accounting Pronouncements and Regulatory Updates – In October 2020, the Securities and Exchange Commission (“SEC”) adopted new regulations governing the use of derivatives by registered investment companies (“Rule 18f-4”). Rule 18f-4 imposes limits on the amount of derivatives a fund can enter into, eliminates the asset segregation framework currently used by funds to comply with Section 18 of the 1940 Act, and requires funds whose use of derivatives is greater than a limited specified amount to establish and maintain a comprehensive derivatives risk management program and appoint a derivatives risk manager. Funds are required to comply with Rule 18f-4 by August 19, 2022. The impact, if any, that Rule 18f-4 will |
| HENNESSY FUNDS | 1-800-966-4354 |
19
| have on the availability, liquidity, and performance of derivatives is unclear. Management is currently evaluating the potential impact of Rule 18f-4 on the Fund. When fully implemented, Rule 18f-4 may require changes in how the Fund uses derivatives, adversely affect the Fund’s performance, and increase costs related to the Fund’s use of derivatives. | |
| In December 2020, the SEC adopted a new rule providing a framework for fund valuation practices (“Rule 2a-5”). Rule 2a-5 establishes requirements for determining fair value in good faith for purposes of the 1940 Act. Rule 2a-5 permits fund boards to designate certain parties to perform fair value determinations, subject to board oversight and certain other conditions. Rule 2a-5 also defines when market quotations are “readily available” for purposes of the 1940 Act and the threshold for determining whether a fund must fair value a security. In connection with Rule 2a-5, the SEC also adopted related recordkeeping requirements and is rescinding previously issued guidance, including with respect to the role of a board in determining fair value and the accounting and auditing of fund investments. Funds must comply with the rules by September 8, 2022. Management is currently assessing the potential impact of the new rules on the Fund’s financial statements. |
3). SECURITIES VALUATION
The Fund follows its valuation policies and procedures in determining its net asset value and, in preparing these financial statements, the fair value accounting standards that establish an authoritative definition of fair value and set out a hierarchy for measuring fair value. These standards require additional disclosures about the various inputs and valuation techniques used to develop the measurements of fair value and a discussion of changes in valuation techniques and related inputs during the period. These inputs are summarized in the three broad levels listed below:
| Level 1 – | Unadjusted, quoted prices in active markets for identical instruments that the Fund has the ability to access at the date of measurement. | |
| Level 2 – | Other significant observable inputs (including, but not limited to, quoted prices in active markets for similar instruments, quoted prices in markets that are not active for identical or similar instruments, and model-derived valuations in which all significant inputs and significant value drivers are observable in active markets, such as interest rates, prepayment speeds, credit risk curves, default rates, and similar data). | |
| Level 3 – | Significant unobservable inputs (including the Fund’s own assumptions about what market participants would use to price the asset or liability based on the best available information) when observable inputs are unavailable. |
The following is a description of the valuation techniques applied to the Fund’s major categories of assets and liabilities on a recurring basis:
Equity Securities – Equity securities, including common stocks, preferred stocks, foreign-issued common stocks, exchange-traded funds, closed-end mutual funds, partnerships, rights, and real estate investment trusts, that are traded on a securities exchange for which a last-quoted sales price is readily available generally are valued at the last sales price as reported by the primary exchange on which the securities are listed. Securities listed on The NASDAQ Stock Market (“NASDAQ”) generally are valued at the NASDAQ Official Closing Price, which may differ from the last sales price reported. Securities traded on a securities exchange for which a last-quoted sales price is not readily available generally are valued at the mean between the bid |
| WWW.HENNESSYFUNDS.COM |
20
| NOTES TO THE FINANCIAL STATEMENTS |
| and ask prices. To the extent these securities are actively traded and valuation adjustments are not applied, they are classified in Level 1 of the fair value hierarchy. Securities traded on foreign exchanges generally are not valued at the same time the Fund calculates its NAV because most foreign markets close well before such time. The earlier close of most foreign markets gives rise to the possibility that significant events, including broad market moves, may have occurred in the interim. In certain circumstances, it may be determined that a foreign security needs to be fair valued because it appears that the value of the security might have been materially affected by events occurring after the close of the market in which the security is principally traded, but before the time the Fund calculates its NAV, such as by a development that affects an entire market or region (e.g., a weather-related event) or a potentially global development (e.g., a terrorist attack that may be expected to have an effect on investor expectations worldwide). | |
Registered Investment Companies – Investments in open-end registered investment companies, commonly referred to as mutual funds, generally are priced at the ending NAV provided by the applicable mutual fund’s service agent and are classified in Level 1 of the fair value hierarchy. | |
Debt Securities – Debt securities, including corporate bonds, asset-backed securities, mortgage-backed securities, municipal bonds, U.S. Treasuries, and U.S. government agency issues, are generally valued at market on the basis of valuations furnished by an independent pricing service that utilizes both dealer-supplied valuations and formula-based techniques. The pricing service may consider recently executed transactions in securities of the issuer or comparable issuers, market price quotations (where observable), bond spreads, and fundamental data relating to the issuer. In addition, the model may incorporate observable market data, such as reported sales of similar securities, broker quotes, yields, bids, offers, and reference data. Certain securities are valued primarily using dealer quotations. These securities are generally classified in Level 2 of the fair value hierarchy. | |
Short-Term Securities – Short-term equity investments, including money market funds, are valued in the manner specified above for equity securities. Short-term debt investments with an original term to maturity of 60 days or less are valued at amortized cost, which approximates fair market value. If the original term to maturity of a short-term debt investment exceeds 60 days, then the values as of the 61st day prior to maturity are amortized. Amortized cost is not used if its use would be inappropriate due to credit or other impairments of the issuer, in which case the security’s fair value would be determined as described below. Short-term securities are generally classified in Level 1 or Level 2 of the fair value hierarchy depending on the inputs used and market activity levels for specific securities. |
The Board of Trustees of the Fund (the “Board”) has adopted fair value pricing procedures that are followed when a price for a security is not readily available or if a significant event has occurred that indicates the closing price of a security no longer represents the true value of that security. Fair value pricing determinations are made in good faith in accordance with these procedures. There are numerous criteria considered in determining a fair value of a security, such as the trading volume of a security and markets, the values of other similar securities, and news events with direct bearing on a security or markets. Fair value pricing results in an estimated price for a security that reflects the amount the Fund might reasonably expect to receive in a current sale. Depending on the relative significance of the valuation inputs, these securities may be classified in either Level 2 or Level 3 of the fair value hierarchy.
| HENNESSY FUNDS | 1-800-966-4354 |
21
The fair value of foreign securities may be determined with the assistance of a pricing service using correlations between the movement of prices of such securities and indices of domestic securities and other appropriate indicators, such as closing market prices of relevant American Depositary Receipts or futures contracts. Using fair value pricing means that the Fund’s NAV reflects the affected portfolio securities’ values as determined by the Board or its designee, pursuant to the fair value pricing procedures adopted by the Board, instead of being determined by the market. Using a fair value pricing methodology to price a foreign security may result in a value that is different from such foreign security’s most recent closing price and from the value used by other investment companies to calculate their NAVs. Such securities are generally classified in Level 2 of the fair value hierarchy. Because the Fund may invest in foreign securities, the value of the Fund’s portfolio securities may change on days when a shareholder is unable to purchase or redeem Fund shares.
The Board has delegated day-to-day valuation matters to the Valuation and Liquidity Committee comprising representatives from Hennessy Advisors, Inc., the Fund’s investment advisor (the “Advisor”). The function of the Valuation and Liquidity Committee, among other things, is to value securities where current and reliable market quotations are not readily available. All actions taken by the Valuation and Liquidity Committee are reviewed by the Board.
The Fund has performed an analysis of all existing investments to determine the significance and character of all inputs to their fair value determinations. Various inputs are used to determine the value of the Fund’s investments. The inputs or methodology used for valuing securities are not necessarily an indication of the risk associated with investing in those securities. Details related to the fair value hierarchy of the Fund’s securities as of October 31, 2021, are included in the Schedule of Investments.
4). INVESTMENT TRANSACTIONS
Purchases and sales of investment securities (excluding government and short-term investments) for the Fund during fiscal year 2021 were $80,312,904 and $193,860,417, respectively.
There were no purchases or sales/maturities of long-term U.S. government securities for the Fund during fiscal year 2021.
5). INVESTMENT ADVISORY FEE AND OTHER TRANSACTIONS WITH AFFILIATES
The Advisor provides the Fund with investment advisory services under an Investment Advisory Agreement. The Advisor furnishes all investment advice, office space, and facilities and most of the personnel needed by the Fund. As compensation for its services, the Advisor is entitled to a monthly fee from the Fund. The fee is based on the average daily net assets of the Fund at an annual rate of 0.40%. The net investment advisory fees expensed by the Fund during fiscal year 2021 are included in the Statement of Operations.
The Board has approved a Shareholder Servicing Agreement for Investor Class shares of the Fund, which compensates the Advisor for the non-investment advisory services it provides to the Fund. The Shareholder Servicing Agreement provides for a monthly fee paid to the Advisor at an annual rate of 0.10% of the average daily net assets of the Fund attributable to Investor Class shares. The shareholder service fees expensed by the Fund during fiscal year 2021 are included in the Statement of Operations.
The Fund has adopted a plan pursuant to Rule 12b-1 under the Investment Company Act of 1940, as amended, that authorizes payments in connection with the distribution of Fund shares at an annual rate of up to 0.25% of the Fund’s average daily net assets attributable to Investor Class shares. Even though the authorized rate is up to
| WWW.HENNESSYFUNDS.COM |
22
| NOTES TO THE FINANCIAL STATEMENTS |
0.25%, the Fund is currently only using up to 0.15% of its average daily net assets attributable to Investor Class shares for such purpose. Amounts paid under the plan may be spent on any activities or expenses primarily intended to result in the sale of shares, including, but not limited to, advertising, shareholder account servicing, printing and mailing of prospectuses to other than current shareholders, printing and mailing of sales literature, and compensation for sales and marketing activities or to financial institutions and others, such as dealers and distributors. The distribution fees expensed by the Fund during fiscal year 2021 are included in the Statement of Operations.
The Fund has entered into agreements with various brokers, dealers, and financial intermediaries in connection with the sale of Fund shares. The agreements provide for periodic payments of sub-transfer agent expenses by the Fund to the brokers, dealers, and financial intermediaries for providing certain shareholder maintenance services. These shareholder services include the pre-processing and quality control of new accounts, shareholder correspondence, answering customer inquiries regarding account status, and facilitating shareholder telephone transactions. The sub-transfer agent fees expensed by the Fund during fiscal year 2021 are included in the Statement of Operations.
The Fund has entered into an Administrative Services Agreement among the Fund, the Advisor, and the American Gas Association (“AGA”), pursuant to which the AGA provides administrative services to the Fund, including overseeing the calculation of the AGA Stock Index. ScottMadden, Inc. performs the actual computations required to produce the AGA Stock Index and receives a fee for such calculations pursuant to a contractual arrangement with AGA. AGA does not furnish other securities advice to the Fund or the Advisor or make recommendations regarding the purchase or sale of securities by the Fund. Under the terms of the Administrative Services Agreement, which has been approved by the Board, AGA provides the Fund with current information regarding the common stock composition of the AGA Stock Index at least monthly. In addition, on request, AGA provides the Fund and the Advisor with information on the natural gas industry. The Fund pays AGA a fee at an annual rate of 0.04% of the average daily net assets of the Fund.
U.S. Bancorp Fund Services, LLC, d/b/a U.S. Bank Global Fund Services (“Fund Services”) provides the Fund with administrative, accounting, and transfer agent services. As administrator, Fund Services is responsible for activities such as (i) preparing various federal and state regulatory filings, reports, and returns for the Fund, (ii) preparing reports and materials to be supplied to the Board, (iii) monitoring the activities of the Fund’s custodian, transfer agent, and accountants, and (iv) coordinating the preparation and payment of the Fund’s expenses and reviewing the Fund’s expense accruals. U.S. Bank N.A., an affiliate of Fund Services, serves as the Fund’s custodian. The servicing agreements between the Trust, Fund Services, and U.S. Bank N.A. contain a fee schedule that is inclusive of administrative, accounting, custody, and transfer agent fees. The administrative, accounting, custody, and transfer agent fees expensed by the Fund during fiscal year 2021 are included in the Statement of Operations.
Quasar Distributors, LLC (“Quasar”), a wholly owned broker-dealer subsidiary of Foreside Financial Group, LLC (“Foreside”), acts as the Fund’s principal underwriter in a continuous public offering of Fund shares. Effective September 30, 2021, Genstar Capital, a private equity firm specializing in financial and related business service companies, acquired a majority interest in Foreside. The Board approved a new Distribution Agreement to enable Quasar to continue serving as the Fund’s distributor following the change in control of Foreside.
| HENNESSY FUNDS | 1-800-966-4354 |
23
The officers of the Fund are affiliated with the Advisor. With the exception of the Chief Compliance Officer and the Senior Compliance Officer, such officers receive no compensation from the Fund for serving in their respective roles. The Fund, along with the other funds in the Hennessy Funds family (collectively, the “Hennessy Funds”), makes reimbursement payments on an equal basis to the Advisor for a portion of the salary and benefits associated with the office of the Chief Compliance Officer and for all of the salary and benefits associated with the office of the Senior Compliance Officer. The compliance fees expensed by the Fund during fiscal year 2021 are included in the Statement of Operations.
6). GUARANTEES AND INDEMNIFICATIONS
Under the Hennessy Funds’ organizational documents, their officers and trustees are indemnified by the Hennessy Funds against certain liabilities arising out of the performance of their duties to the Hennessy Funds. Additionally, in the normal course of business, the Hennessy Funds enter into contracts with service providers that contain general indemnification clauses. The Fund’s maximum exposure under these arrangements is unknown as this would involve future claims that may be made against the Fund that have not yet occurred. Currently, the Fund expects the risk of loss to be remote.
7). LINE OF CREDIT
The Fund has an uncommitted line of credit with the other Hennessy Funds in the amount of the lesser of (i) $100,000,000 or (ii) 33.33% of each Hennessy Fund’s net assets, or 30% for the Fund and 10% for the Hennessy Balanced Fund. The line of credit is intended to provide any necessary short-term financing in connection with shareholder redemptions, subject to certain restrictions. The credit facility is with the Hennessy Funds’ custodian bank, U.S. Bank N.A. Borrowings under this arrangement bear interest at the bank’s prime rate and are secured by all of the Fund’s assets (as to its own borrowings only). During fiscal year 2021, the Fund had an outstanding average daily balance and a weighted average interest rate of $132,852 and 3.25%, respectively. The interest expensed by the Fund during fiscal year 2021 is included in the Statement of Operations. The maximum amount outstanding for the Fund during fiscal year 2021 was $2,833,000. As of October 31, 2021, the Fund did not have any borrowings outstanding under the line of credit.
8). FEDERAL TAX INFORMATION
As of October 31, 2021, the components of accumulated earnings (losses) for income tax purposes were as follows:
| Investments | |||||
| Cost of investments for tax purposes | $ | 304,865,782 | |||
| Gross tax unrealized appreciation | $ | 256,658,348 | |||
| Gross tax unrealized depreciation | (41,200,626 | ) | |||
| Net tax unrealized appreciation/(depreciation) | $ | 215,457,722 | |||
| Undistributed ordinary income | $ | — | |||
| Undistributed long-term capital gains | 42,364,536 | ||||
| Total distributable earnings | $ | 42,364,536 | |||
| Other accumulated gain/(loss) | $ | — | |||
| Total accumulated gain/(loss) | $ | 257,822,258 | |||
The difference between book-basis unrealized appreciation/depreciation and tax-basis unrealized appreciation/depreciation (as shown above) is attributable primarily to wash sales.
| WWW.HENNESSYFUNDS.COM |
24
| NOTES TO THE FINANCIAL STATEMENTS |
As of October 31, 2021, the Fund had no tax-basis capital losses to offset future capital gains.
As of October 31, 2021, the Fund did not defer, on a tax basis, any late-year ordinary losses. Late-year ordinary losses are net ordinary losses incurred after December 31, 2020, but within the taxable year, that are deemed to arise on the first day of the Fund’s next taxable year.
During fiscal years 2021 and 2020, the tax character of distributions paid by the Fund was as follows:
| Year Ended | Year Ended | ||||||||
| October 31, 2021 | October 31, 2020 | ||||||||
Ordinary income(1) | $ | 12,094,090 | $ | 14,868,613 | |||||
| Long-term capital gains | 43,040,749 | 41,637,087 | |||||||
| Total distributions | $ | 55,134,839 | $ | 56,505,700 | |||||
(1) Ordinary income includes short-term capital gains. |
9). EVENTS SUBSEQUENT TO YEAR END
Management has evaluated the Fund’s related events and transactions that occurred subsequent to October 31, 2021, through the date of issuance of the Fund’s financial statements. Other than as disclosed below, management has determined that there were no subsequent events requiring recognition or disclosure in the financial statements.
On December 7, 2021, capital gains were declared and paid to shareholders of record on December 6, 2021, as follows:
Long-term | ||
| Investor Class | $2.15667 | |
| Institutional Class | $2.15128 |
| HENNESSY FUNDS | 1-800-966-4354 |
25
Report of Independent Registered Public
Accounting Firm
To the Board of Trustees of Hennessy Funds Trust
and the shareholders of the Hennessy Gas Utility Fund
Novato, CA
Opinion on the Financial Statements
We have audited the accompanying statement of assets and liabilities of the Hennessy Gas Utility Fund (the “Fund”), a series of Hennessy Funds Trust, including the schedule of investments, as of October 31, 2021, the related statement of operations for the year then ended, the statements of changes in net assets for each of the two years in the period then ended, the financial highlights for each of the five years in the period then ended, and the related notes (collectively referred to as the “financial statements”). In our opinion, the financial statements present fairly, in all material respects, the financial position of the Fund as of October 31, 2021, the results of its operations for the year then ended, the changes in its net assets for each of the two years in the period then ended, and the financial highlights for each of the five years in the period then ended in conformity with accounting principles generally accepted in the United States of America.
Basis for Opinion
These financial statements are the responsibility of the Fund’s management. Our responsibility is to express an opinion on the Fund’s financial statements based on our audits. We are a public accounting firm registered with the Public Company Accounting Oversight Board (United States) (“PCAOB”) and are required to be independent with respect to the Fund in accordance with the U.S. federal securities laws and the applicable rules and regulations of the Securities and Exchange Commission and the PCAOB. We have served as the auditor of one or more of the funds in the Trust since 2002.
We conducted our audits in accordance with the standards of the PCAOB. Those standards require that we plan and perform the audit to obtain reasonable assurance about whether the financial statements are free of material misstatement, whether due to error or fraud. The Fund is not required to have, nor were we engaged to perform, an audit of its internal control over financial reporting. As part of our audits we are required to obtain an understanding of internal control over financial reporting, but not for the purpose of expressing an opinion on the effectiveness of the Fund’s internal control over financial reporting. Accordingly, we express no such opinion.
Our audits included performing procedures to assess the risks of material misstatement of the financial statements, whether due to error or fraud, and performing procedures that respond to those risks. Such procedures included examining, on a test basis, evidence regarding the amounts and disclosures in the financial statements. Our audits also included evaluating the accounting principles used and significant estimates made by management, as well as evaluating the overall presentation of the financial statements. Our procedures included confirmation of securities owned as of October 31, 2021 by correspondence with the custodian. We believe that our audits provide a reasonable basis for our opinion.
| |
| TAIT, WELLER & BAKER LLP |
Philadelphia, Pennsylvania
December 22, 2021
| WWW.HENNESSYFUNDS.COM |
26
| REPORT OF INDEPENDENT REGISTERED PUBLIC ACCOUNTING FIRM/TRUSTEES AND OFFICERS |
Trustees and Officers of the Fund (Unaudited)
The business and affairs of the Funds are managed under the direction of the Board of Trustees of the Trust, and the Board of Trustees elects the officers of the Trust. From time to time, the Board of Trustees also has appointed advisers to the Board of Trustees (“Advisers”) with the intention of having qualified individuals serve in an advisory capacity to garner experience in the mutual fund and asset management industry and be considered as potential Trustees in the future. There are currently two Advisers, Brian Alexander and Doug Franklin. As Advisers, Mr. Alexander and Mr. Franklin attend meetings of the Board of Trustees and act as non-voting participants. Information pertaining to the Trustees, Advisers, and the officers of the Trust is set forth below. The Trustees and officers serve until their successors are duly elected and qualified or until their earlier death, resignation, or removal. Each Trustee oversees all 16 Hennessy Funds. Unless otherwise indicated, the address of all persons listed below is 7250 Redwood Boulevard, Suite 200, Novato, CA 94945. The Fund’s Statement of Additional Information includes more information about the persons listed below and is available without charge by calling 1-800-966-4354 or by visiting www.hennessyfunds.com.
| Other | |||
| Directorships | |||
| Held Outside | |||
| Name, Age, | of Fund | ||
| and Position Held | Start Date | Principal Occupation(s) | Complex During |
with the Trust | of Service | During Past Five Years | Past Five Years |
| Disinterested Trustees and Advisers | |||
| J. Dennis DeSousa | January 1996 | Mr. DeSousa is a real estate investor. | None. |
| 85 | |||
| Trustee | |||
| Robert T. Doyle | January 1996 | Mr. Doyle has been the Sheriff of | None. |
| 74 | Marin County, California since 1996. | ||
| Trustee | |||
| Claire Garvie | December 2015 | Ms. Garvie is a founder of Kiosk and | None. |
| 47 | as an Adviser | has served as its Chief Operating | |
| Trustee | to the Board | Officer since 2004. Kiosk is a full- | |
| and | service marketing agency with | ||
| December 2021 | offices in the San Francisco Bay Area, | ||
| as a Trustee | Toronto, and Liverpool, UK. | ||
| Gerald P. Richardson | May 2004 | Mr. Richardson is an independent | None. |
| 76 | consultant in the securities industry. | ||
| Trustee |
| HENNESSY FUNDS | 1-800-966-4354 |
27
| Other | |||
| Directorships | |||
| Held Outside | |||
| Name, Age, | of Fund | ||
| and Position Held | Start Date | Principal Occupation(s) | Complex During |
with the Trust | of Service | During Past Five Years | Past Five Years |
| Brian Alexander | March 2015 | Mr. Alexander has worked for the | None. |
| 40 | Sutter Health organization since | ||
| Adviser to the Board | 2011 in various positions. He has | ||
| served as the Chief Executive Officer | |||
| of the Sutter Roseville Medical | |||
| Center since 2018. From 2016 through | |||
| 2018, he served as the Vice President | |||
| of Strategy for the Sutter Health Valley | |||
| Area, which includes 11 hospitals, | |||
| 13 ambulatory surgery centers, | |||
| 16,000 employees, and 1,900 physicians. | |||
| From 2013 through 2016, Mr. Alexander | |||
| served as Sutter Novato Community | |||
| Hospital’s Chief Administrative Officer. | |||
| Doug Franklin | March 2016 | Mr. Franklin is a retired insurance | None. |
| 57 | industry executive. From 1987 | ||
| Adviser to the Board | through 2015, he was employed | ||
| by the Allianz-Fireman’s Fund | |||
| Insurance Company in various | |||
| positions, including as its Chief | |||
| Actuary and Chief Risk Officer. | |||
Interested Trustee(1) | |||
| Neil J. Hennessy | January 1996 as | Mr. Hennessy has been employed | Hennessy |
| 65 | a Trustee and | by Hennessy Advisors, Inc. since | Advisors, Inc. |
| Chairman of the Board, | June 2008 as | 1989 and currently serves as its | |
| Chief Market Strategist, | an officer | Chairman and Chief Executive Officer. | |
| Portfolio Manager, | |||
| and President |
| Name, Age, | ||
| and Position Held | Start Date | Principal Occupation(s) |
with the Trust | of Service | During Past Five Years |
| Officers | ||
| Teresa M. Nilsen | January 1996 | Ms. Nilsen has been employed by Hennessy Advisors, Inc. |
| 55 | since 1989 and currently serves as its President and Chief | |
| Executive Vice President | Operating Officer. | |
| and Treasurer | ||
| Daniel B. Steadman | March 2000 | Mr. Steadman has been employed by Hennessy Advisors, Inc. |
| 65 | since 2000 and currently serves as its Executive Vice President. | |
| Executive Vice President | ||
| and Secretary | ||
| Brian Carlson | December 2013 | Mr. Carlson has been employed by Hennessy Advisors, Inc. |
| 49 | since December 2013 and currently serves as its Chief | |
| Senior Vice President | Compliance Officer and Senior Vice President. | |
| and Head of Distribution |
| WWW.HENNESSYFUNDS.COM |
28
| TRUSTEES AND OFFICERS OF THE FUND |
| Name, Age, | ||
| and Position Held | Start Date | Principal Occupation(s) |
with the Trust | of Service | During Past Five Years |
Jennifer Cheskiewicz(2) | June 2013 | Ms. Cheskiewicz has been employed by Hennessy Advisors, Inc. |
| 44 | as its General Counsel since June 2013. | |
| Senior Vice President and | ||
| Chief Compliance Officer | ||
David Ellison(3) | October 2012 | Mr. Ellison has been employed by Hennessy Advisors, Inc. since |
| 63 | October 2012. He has served as a Portfolio Manager of the | |
| Senior Vice President | Hennessy Large Cap Financial Fund and the Hennessy Small | |
| and Portfolio Manager | Cap Financial Fund since their inception. Mr. Ellison also served | |
| as a Portfolio Manager of the Hennessy Technology Fund from | ||
| its inception until February 2017. Mr. Ellison served as Director, | ||
| CIO, and President of FBR Fund Advisers, Inc. from December | ||
| 1999 to October 2012. | ||
Ryan Kelley(4) | March 2013 | Mr. Kelley has been employed by Hennessy Advisors, Inc. since |
| 49 | October 2012. He has served as Chief Investment Officer of the | |
| Chief Investment Officer, | Hennessy Funds since March 2021 and has served as a Portfolio | |
| Senior Vice President, | Manager of the Hennessy Gas Utility Fund, the Hennessy Large | |
| and Portfolio Manager | Cap Financial Fund, and the Hennessy Small Cap Financial Fund | |
| since October 2014. Mr. Kelley served as Co-Portfolio Manager | ||
| of these same funds from March 2013 through September | ||
| 2014 and as a Portfolio Analyst for the Hennessy Funds from | ||
| October 2012 through February 2013. He has also served as a | ||
| Portfolio Manager of the Hennessy Cornerstone Growth Fund, | ||
| the Hennessy Cornerstone Mid Cap 30 Fund, the Hennessy | ||
| Cornerstone Large Growth Fund, and the Hennessy | ||
| Cornerstone Value Fund since February 2017 and as a Portfolio | ||
| Manager of the Hennessy Total Return Fund, the Hennessy | ||
| Balanced Fund, and the Hennessy Technology Fund since May | ||
| 2018. He served as Co-Portfolio Manager of the Hennessy | ||
| Technology Fund from February 2017 until May 2018. Mr. Kelley | ||
| served as Portfolio Manager of FBR Fund Advisers, Inc. from | ||
| January 2008 to October 2012. | ||
L. Joshua Wein(4) | September 2018 | Mr. Wein has been employed by Hennessy Advisors, Inc. since |
| 48 | 2018. He has served as Co-Portfolio Manager of the Hennessy | |
| Vice President and | Cornerstone Growth Fund, the Hennessy Cornerstone | |
| Co-Portfolio Manager | Mid Cap 30 Fund, the Hennessy Cornerstone Large Growth | |
| Fund, the Hennessy Cornerstone Value Fund, Hennessy Total | ||
| Return Fund, the Hennessy Balanced Fund, the Hennessy Gas | ||
| Utility Fund, and the Hennessy Technology Fund since February | ||
| 2019. He served as a Senior Analyst of these same funds from | ||
| September 2018 through February 2019. Mr. Wein served as | ||
| Director of Alternative Investments and Co-Portfolio Manager | ||
| at Sterling Capital Management from 2008 to 2018. |
_______________
(1) | Mr. Hennessy is considered an “interested person,” as defined in the Investment Company Act of 1940, as amended, because he is an officer of the Trust. |
(2) | The address of this officer is 4800 Bee Caves Road, Suite 100, Austin, TX 78746. |
(3) | The address of this officer is 101 Federal Street, Suite 1615B, Boston, MA 02110. |
(4) | The address of this officer is 1340 Environ Way, Chapel Hill, NC 27517. |
| HENNESSY FUNDS | 1-800-966-4354 |
29
Expense Example (Unaudited)
October 31, 2021
As a shareholder of the Fund, you incur ongoing costs, including management fees, service fees, and other Fund expenses. This Example is intended to help you understand your ongoing costs (in dollars) of investing in the Fund and to compare these costs with the ongoing costs of investing in other mutual funds. The Example is based on an investment of $1,000 invested at the beginning of the period and held for the entire period from May 1, 2021, through October 31, 2021.
Actual Expenses
In the table below, the first line under each of the “Investor Class” and “Institutional Class” headings provides information about actual account values and actual expenses for each share class. You may use this information, together with the amount you invested, to estimate the expenses that you paid over the period. Simply divide your account value by $1,000 (for example, an $8,600 account value divided by $1,000 = 8.6), then multiply the result by the number in the first line under the heading “Expenses Paid During Period” to estimate the expenses you paid on your account during this period. Although the Fund charges no sales loads or transaction fees, you will be assessed fees for outgoing wire transfers, returned checks, and stop payment orders at prevailing rates charged by U.S. Bank Global Fund Services, the Fund’s transfer agent. If you request that a redemption be made by wire transfer, the Fund’s transfer agent charges a $15 fee. IRAs are charged a $15 annual maintenance fee (up to $30 maximum per shareholder for shareholders with multiple IRAs). The examples below include, but are not limited to, management, shareholder servicing, accounting, custody, and transfer agent fees. However, the examples below do not include portfolio trading commissions and related expenses.
Hypothetical Example for Comparison Purposes
In the table below, the second line under each of the “Investor Class” and “Institutional Class” headings provides information about hypothetical account values and hypothetical expenses based on the Fund’s actual expense ratio for each share class and an assumed rate of return of 5% per year before expenses, which is not the Fund’s actual return for such share class. The hypothetical account values and expenses may not be used to estimate the actual ending account balance or expenses you paid for the period. You may use this information to compare the ongoing costs of investing in the Fund and other funds. To do so, compare these 5% hypothetical examples with the 5% hypothetical examples that appear in the shareholder reports of the other funds. Please note that the expenses shown in the table are meant to highlight your ongoing costs only. Therefore, the second lines under “Investor Class” and “Institutional Class” are useful in comparing ongoing costs only and will not help you determine the relative total costs of owning different funds.
| WWW.HENNESSYFUNDS.COM |
30
| EXPENSE EXAMPLE |
| Expenses Paid | |||
| Beginning | Ending | During Period(1) | |
| Account Value | Account Value | May 1, 2021 – | |
May 1, 2021 | October 31, 2021 | October 31, 2021 | |
| Investor Class | |||
| Actual | $1,000.00 | $1,008.30 | $5.01 |
| Hypothetical (5% return before expenses) | $1,000.00 | $1,020.21 | $5.04 |
| Institutional Class | |||
| Actual | $1,000.00 | $1,009.50 | $3.39 |
| Hypothetical (5% return before expenses) | $1,000.00 | $1,021.83 | $3.41 |
(1) | Expenses are equal to the Fund’s annualized expense ratio of 0.99% for Investor Class shares or 0.67% for Institutional Class shares, as applicable, multiplied by the average account value over the period, multiplied by 184/365 days (to reflect the half-year period). |
| HENNESSY FUNDS | 1-800-966-4354 |
31
How to Obtain a Copy of the Fund’s Proxy
Voting Policy and Proxy Voting Records
A description of the policies and procedures the Fund uses to determine how to vote proxies relating to portfolio securities is available without charge (1) by calling 1-800-966-4354, (2) on the Hennessy Funds’ website at www.hennessyfunds.com/proxy-voting/voting-policy, or (3) on the U.S. Securities and Exchange Commission’s (the “SEC”) website at www.sec.gov. The Fund’s proxy voting record is available without charge on both the Hennessy Funds’ website at www.hennessyfunds.com/proxy-voting/voting-record and the SEC’s website at www.sec.gov no later than August 31 for the prior 12 months ending June 30.
Availability of Quarterly Portfolio Schedule
The Fund files a complete schedule of portfolio holdings with the SEC for the first and third quarters of each fiscal year as an exhibit to its reports on Form N-PORT. The Fund’s Form N-PORT reports are available on the SEC’s website at www.sec.gov or on request by calling 1-800-966-4354.
Federal Tax Distribution Information (Unaudited)
For fiscal year 2021, certain dividends paid by the Fund may be subject to a maximum tax rate of 23.8%, as provided for by the Jobs and Growth Tax Relief Reconciliation Act of 2003. The percentage of dividends declared from ordinary income designated as qualified dividend income was 100.00%.
For corporate shareholders, the percent of ordinary income distributions that qualified for the corporate dividends received deduction for fiscal year 2021 was 100.00%.
The percentage of taxable ordinary income distributions that were designated as short-term capital gain distributions under Section 871(k)(2)(C) of the Internal Revenue Code of 1986, as amended, for the Fund was 0.00%.
Important Notice Regarding Delivery
of Shareholder Documents
To help keep the Fund’s costs as low as possible, we generally deliver a single copy of shareholder reports, proxy statements, and prospectuses to shareholders who share an address and have the same last name. This process does not apply to account statements. You may request an individual copy of a shareholder document at any time. If you would like to receive separate mailings of shareholder documents, please call U.S. Bank Global Fund Services at 1-800-261-6950 or 1-414-765-4124, and individual delivery will begin within 30 days of your request. If your account is held through a financial institution or other intermediary, please contact such intermediary directly to request individual delivery.
Electronic Delivery
As permitted by SEC regulations, the Fund’s shareholder reports are made available on a website, and unless you sign up for eDelivery or elect to receive paper copies as detailed below, you will be notified by mail each time a report is posted and provided with a website link to access the report.
The Fund also offers shareholders the option to receive all notices, account statements, prospectuses, tax forms, and shareholder reports online. To sign up for eDelivery or change your delivery preference, please visit www.hennessyfunds.com/account.
To elect to receive paper copies of all future reports free of charge, please call U.S. Bank Global Fund Services at 1-800-261-6950 or 1-414-765-4124.
Subscribe to receive our team’s unique market and sector insights delivered to your inbox
www.hennessyfunds.com/subscribe
Follow us on social media
| | |
| WWW.HENNESSYFUNDS.COM |
32
| PROXY VOTING — PRIVACY POLICY |
Liquidity Risk Management Program
In accordance with Rule 22e-4 under the Investment Company Act of 1940, as amended (the “Liquidity Rule”), we have adopted and implemented a liquidity risk management program (the “Liquidity Program”). The purpose of the Liquidity Program is to assess and manage the Fund’s liquidity risk, which is the risk that the Fund would not be able to meet requests to redeem Fund shares without significant dilution of the remaining shareholders’ interests in the Fund. The Board of Trustees of the Fund (the “Board”) designated a committee comprising representatives of Hennessy Advisors, Inc., the investment adviser to the Fund, as the administrator of the Liquidity Program (the “Program Administrator”).
The Program Administrator provided a written report regarding the Liquidity Program to the Board in advance of its meeting on June 2, 2021. The report covered the period from June 1, 2020, through May 31, 2021. The report addressed the operation of the Liquidity Program, assessed the adequacy and effectiveness of its implementation, and described any material changes to the Liquidity Program during the review period. The Trust’s chief compliance officer presented the report to the Board at the meeting and provided additional information regarding the Liquidity Program. The Board reviewed the Liquidity Program and considered, among other items, the following:
| 1. | The Program Administrator reviewed daily historical net redemption activity during the review period and during prior periods with higher-than-average redemption activity and concluded that the Fund has historically been able to meet requests to redeem Fund shares without significant dilution to the Fund’s remaining shareholders, and the Program Administrator expects the Fund to be able to continue to do so in the future during both normal and reasonably foreseeable stressed conditions. | |
| 2. | The Fund holds assets that are highly liquid investments and is therefore not required to establish a highly liquid investment minimum for the Fund or adopt policies and procedures for responding to a highly liquid investment minimum shortfall. | |
| 3. | The Program Administrator did not make any material changes to the Liquidity Program during the review period and did not recommend any changes to the Liquidity Program or the model inputs used to determine the liquidity classification of each security held by the Fund. | |
| 4. | The Program Administrator concluded that the Liquidity Program was reasonably designed to assess and manage the Fund’s liquidity risk, complies with the requirements of the Liquidity Rule, and was operating as intended during the review period. |
Privacy Policy
We collect the following personal information about you:
| 1. | Information we receive from you in applications or other forms, correspondence, or conversations, including, but not limited to, your name, address, phone number, social security number, assets, income, and date of birth; | |
| 2. | Information about your transactions with us, our affiliates, or others, including, but not limited to, your account number and balance, payments history, parties to transactions, cost basis information, and other financial information; and |
| HENNESSY FUNDS | 1-800-966-4354 |
33
| 3. | Other personal information we collect from various sources, even if you have not entered into a prior transaction with us, including the following: |
| • | Name, alias, address, unique personal identifier, online identifier, IP address, email address, telephone number, account name, and other similar identifiers; | |
| • | Age and marital status; | |
| • | Commercial information, including records of products purchased; | |
| • | Browsing history, search history, and information on interaction with our website; | |
| • | Geolocation data; | |
| • | Employment and employment history, educational history, financial information, and purchasing and consuming histories or tendencies; and | |
| • | Inferences drawn from the above-listed information to create a profile about your preferences, characteristics, predispositions, and behavior. |
We collect this information directly from you, indirectly in the course of providing services to you, directly and indirectly from your activity on our website, from broker dealers, marketing agencies, and other third parties that interact with us in connection with the services we perform and products we offer, and from anonymized and aggregated consumer information.
We use this information to fulfill the reason you provided the information to us, to provide you with other relevant products that you request from us, to provide you with information about products that may interest you, to improve our website or present our website’s contents to you, and as otherwise described to you when collecting your personal information.
We do not disclose any personal information to unaffiliated third parties, except as permitted by law. We may disclose your personal information to our affiliates, vendors, and service providers for a business purpose. For example, we are permitted by law to disclose all of the information we collect, as described above, to our transfer agent to process your transactions. When disclosing your personal information to third parties, we enter into a contract with each third party describing the purpose of such disclosure and requiring that such personal information be kept confidential and not used for any purpose except to perform the services contracted or respond to regulatory or law enforcement requests.
Furthermore, we restrict access to your personal information to those persons who require such information to provide products or services to you. As a result, we do not provide a means for opting out of our limited sharing of your information. We maintain physical, electronic, and procedural safeguards that comply with federal standards to guard your personal information.
If you hold shares of the Funds through a financial intermediary, including, but not limited to, a broker-dealer, bank, or trust company, the privacy policy of your financial intermediary governs how your personal information is shared with unaffiliated third parties.
Supplemental Privacy Notice for Residents of California
The California Consumer Privacy Act of 2018 (the “CCPA”) provides you, as a California resident, with certain additional rights relating to your personal information.
| WWW.HENNESSYFUNDS.COM |
34
| PRIVACY POLICY |
Under the CCPA, you have the right to request that we disclose to you the categories of personal information we have collected about you over the past 12 months, the categories of sources of such information, our business purpose for collecting the information, the categories of third parties, if any, with whom we shared the information, and the specific information we have collected about you. You also have the right to request that we delete any of your personal information, and, unless an exception applies, we will delete such information upon receiving and confirming your request. To make a request, call us at 1-800-966-4354, email us at privacy@hennessyfunds.com, or go to www.hennessyfunds.com/contact. We will not discriminate against you for exercising your rights under the CCPA. Further, we will not collect additional categories of your personal information or use the personal information we collected for materially different, unrelated, or incompatible purposes without providing you notice.
| HENNESSY FUNDS | 1-800-966-4354 |
35
(This Page Intentionally Left Blank.)
For information, questions, or assistance, please call
The Hennessy Funds
1-800-966-4354 or 1-415-899-1555
INVESTMENT ADVISOR
Hennessy Advisors, Inc.
7250 Redwood Boulevard, Suite 200
Novato, California 94945
ADMINISTRATOR,
TRANSFER AGENT,
DIVIDEND PAYING AGENT, &
SHAREHOLDER SERVICING AGENT
U.S. Bancorp Fund Services, LLC
d/b/a U.S. Bank Global Fund Services
P.O. Box 701
Milwaukee, Wisconsin 53201-0701
CUSTODIAN
U.S. Bank N.A.
Custody Operations
1555 North River Center Drive, Suite 302
Milwaukee, Wisconsin 53212
TRUSTEES
Neil J. Hennessy
Robert T. Doyle
J. Dennis DeSousa
Claire Garvie
Gerald P. Richardson
COUNSEL
Foley & Lardner LLP
777 East Wisconsin Avenue
Milwaukee, Wisconsin 53202-5306
INDEPENDENT REGISTERED
PUBLIC ACCOUNTING FIRM
Tait, Weller & Baker LLP
Two Liberty Place
50 South 16th Street, Suite 2900
Philadelphia, Pennsylvania 19102-2529
DISTRIBUTOR
Quasar Distributors, LLC
111 East Kilbourn Avenue, Suite 2200
Milwaukee, Wisconsin 53202
www.hennessyfunds.com | 1-800-966-4354
This report has been prepared for shareholders and may be distributed to
others only if preceded or accompanied by a current prospectus.
ANNUAL REPORT
OCTOBER 31, 2021

HENNESSY JAPAN FUND
Investor Class HJPNX
Institutional Class HJPIX
www.hennessyfunds.com | 1-800-966-4354
(This Page Intentionally Left Blank.)
Contents
| Letter to Shareholders | 2 |
| Performance Overview | 4 |
| Financial Statements | |
| Schedule of Investments | 7 |
| Statement of Assets and Liabilities | 11 |
| Statement of Operations | 12 |
| Statements of Changes in Net Assets | 13 |
| Financial Highlights | 14 |
| Notes to the Financial Statements | 18 |
| Report of Independent Registered Public Accounting Firm | 26 |
| Trustees and Officers of the Fund | 27 |
| Expense Example | 30 |
| Proxy Voting Policy and Proxy Voting Records | 32 |
| Availability of Quarterly Portfolio Schedule | 32 |
| Federal Tax Distribution Information | 32 |
| Important Notice Regarding Delivery of Shareholder Documents | 32 |
| Electronic Delivery | 33 |
| Liquidity Risk Management Program | 33 |
| Privacy Policy | 34 |
| HENNESSY FUNDS | 1-800-966-4354 |
November 2021
Dear Hennessy Funds Shareholder:
The Japanese stock market gained 18.62% as measured by the Tokyo Stock Price Index (TOPIX) over the 12-month period ended October 31, 2021 (in U.S. dollar terms).
While progress in vaccine administration and the broader global economic recovery supported the Japanese stock market throughout the period, concerns about rising interest rates in line with global inflation and waves of COVID-19 infections weighed down the market. Overall, small-cap and mid-cap stocks underperformed large-cap stocks, with large-cap stocks continuing to drive market performance partly due to the slower recovery of domestic demand in Japan compared to other countries.
Inflation has been a buzzword since the start of 2021. In our April 2021 shareholder letter, we commented that it was hard to imagine inflation taking hold in our domestic economy at that point in time. However, over the past several months, various supply issues have been compounding like never before, including supply chain disruptions, semiconductor shortages, energy and commodity price increases, labor inflation triggered by worker shortages, sharply increased employee safety costs to protect against COVID-19, and wage pressure due to workers’ strikes. Of these factors, wage pressure is a particularly concerning trend. If history is any guide, once inflation starts to accelerate, real wages erode, giving rise to worker protests in the hope of higher pay. These costs, in turn, get passed on to the prices of final products and services, further curbing real wage growth. Workers are left dissatisfied and demand additional pay increases, continuing the vicious cycle.
We also believe that the ongoing trend towards Environmental, Social, and Governance investing along with various environmental protection initiatives on a global scale adds to long-term inflationary pressure, as these activities inevitably increase the costs of doing business. At the same time as companies are becoming increasingly concerned about the environment and human rights, supply constraints are occurring, raising material prices and electricity and gas prices. Consequently, even as prices rise, market mechanisms struggle to encourage suppliers to increase their capacity, which could mean that the supply shortage may persist for some time.
While we do not make investment decisions based solely on economic forecasts, price trends significantly impact corporate fundamentals. As a result, we remain mindful of long-term inflation scenarios when conducting our research. For example, we look to invest in companies that we believe are capable of adequately coping with changing conditions and to avoid investing in companies where we believe a sharp rise in prices might lead to significant deterioration in business performance. Specifically, we focus on whether a company has a high profit margin, whether a rise in procurement prices will immediately lead to a loss, and whether the company can pass on a rise in procurement prices to sales prices through its strength in price negotiations.
With the vaccination progress so far, the number of people testing positive for COVID-19 has plummeted, leading to the lifting of the state of emergency and fueling expectations for future economic recovery in Japan. The end of the Japanese House of Representatives election, which previously was a source of uncertainty, and the Liberal Democratic Party (LDP) maintaining a stable majority have brought a sense of stability back to the stock market. We believe that the market will continue to perform well
| WWW.HENNESSYFUNDS.COM |
2
| LETTER TO SHAREHOLDERS |
through the end of calendar year 2021. On the one hand, risks include concerns about a failing Chinese economy, the continued rise in oil and other commodity prices, and rising overseas interest rates. On the other hand, the high savings rate over the past two years suggests that there is much room for recovery, especially in domestic consumption. We remain optimistic about the long-term prospects for Japan and its stock market.
Thank you for your continued confidence and investment in the Hennessy Funds.
Sincerely,

 |  |
| Tadahiro Fujimura | Masakazu Takeda |
| Portfolio Manager, | Portfolio Manager, |
| Hennessy Japan Small Cap Fund; | Hennessy Japan Fund; |
| Chief Investment Officer | Fund Manager |
| SPARX Asset Management Co., Ltd. | SPARX Asset Management Co., Ltd. |
SPARX Asset Management Co., Ltd., located in Tokyo, Japan, is the sub-advisor to the Hennessy Japan Fund and the Hennessy Japan Small Cap Fund.
Past performance does not guarantee future results.
Mutual fund investing involves risk. Principal loss is possible.
Opinions expressed are those of Tadahiro Fujimura and Masakazu Takeda and are subject to change, are not guaranteed, and should not be considered investment advice.
The Tokyo Stock Price Index (TOPIX) is a capitalization-weighted index of all of the companies listed on the First Section of the Tokyo Stock Exchange. The index is used herein for comparative purposes in accordance with SEC regulations. One cannot invest directly in an index.
| HENNESSY FUNDS | 1-800-966-4354 |
3
Performance Overview (Unaudited)
CHANGE IN VALUE OF $10,000 INVESTMENT
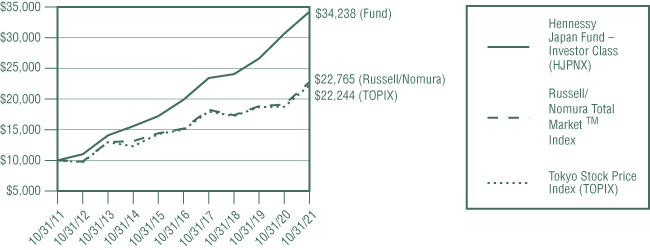
This graph illustrates the performance of an initial investment of $10,000 made in the Fund 10 years ago and assumes the reinvestment of dividends and capital gains.
AVERAGE ANNUAL TOTAL RETURN FOR PERIODS ENDED OCTOBER 31, 2021
| One | Five | Ten | ||
Year | Years | Years | ||
| Hennessy Japan Fund – | ||||
| Investor Class (HJPNX) | 11.66% | 11.47% | 13.10% | |
| Hennessy Japan Fund – | ||||
| Institutional Class (HJPIX) | 12.11% | 11.93% | 13.47% | |
Russell/Nomura Total MarketTM Index | 19.16% | 8.43% | 8.57% | |
| Tokyo Stock Price Index (TOPIX) | 18.62% | 8.18% | 8.32% |
Expense ratios: 1.43% (Investor Class); 1.04% (Institutional Class)
Performance data quoted represents past performance; past performance does not guarantee future results. The investment return and principal value of an investment will fluctuate so that an investor’s shares, when redeemed, may be worth more or less than their original cost. The performance table does not reflect the deduction of taxes that a shareholder would pay on Fund distributions or the redemption of Fund shares. Current performance of the Fund may be lower or higher than the performance quoted. Performance data current to the most recent month end may be obtained by visiting www.hennessyfunds.com.
The Russell/Nomura Total Market™ Index contains the top 98% of all stocks listed on Japan’s stock exchanges and registered on Japan’s over-the-counter market based on market capitalization. The Tokyo Stock Price Index (TOPIX) is a capitalization-weighted index of all of the companies listed on the First Section of the Tokyo Stock Exchange. One cannot invest directly in an index. These indices are used for comparative purposes in accordance with Securities and Exchange Commission regulations.
Frank Russell Company (“Russell”) is the source and owner of the trademarks, service marks, and copyrights related to the Russell Indexes. Russell® is a trademark of Frank Russell Company. Neither Russell nor its licensors accept any liability for any errors or omissions in the Russell Indexes or Russell ratings or underlying data and no party may rely on any Russell Indexes or Russell ratings or underlying data contained in this communication. No further distribution of Russell data is permitted without Russell’s express written consent. Russell does not promote, sponsor, or endorse the content of this communication.
| WWW.HENNESSYFUNDS.COM |
4
| PERFORMANCE OVERVIEW |
The expense ratios presented are from the most recent prospectus. The expense ratios for the current reporting period are available in the Financial Highlights section of this report.
PERFORMANCE NARRATIVE
Portfolio Managers Masakazu Takeda, CFA and CMA*, and Yu Shimizu, CMA*
SPARX Asset Management Co., Ltd. (sub-advisor)
Performance:
For the one-year period ended October 31, 2021, the Investor Class of the Hennessy Japan Fund returned 11.66%, underperforming both the Russell/Nomura Total Market™ Index (the Fund’s primary benchmark) and the Tokyo Stock Price Index (TOPIX), which returned 19.16% and 18.62%, respectively, for the same period in U.S. dollar terms.
Among positive contributors to the Fund’s performance during the period were (i) Recruit Holdings Co., Ltd., Japan’s unique print and online media giant specializing in classified ads and providing human resources services, (ii) Sony Group Corporation, a diversified consumer and professional electronics, gaming, entertainment, and financial services conglomerate, and (iii) Keyence Corporation, the supplier of factory-automation-related sensors. Recruit was hit hard amid the COVID-19 pandemic, as most of its businesses are economically sensitive, but the company saw a dramatic rebound on the back of a strong labor market. Sony, which makes PlayStation game consoles, has suffered from a chip shortage because of the supply chain effects of the pandemic, but other business lines such as games, movies, and streaming music were beneficiaries. Keyence experienced a boom in business thanks to strong demand for factory automation sensors worldwide.
The main detractors from the Fund’s performance included Anicom Holdings, Inc., Japan’s leading pet insurance company, Kao Corporation, Japan’s largest manufacturer of home care and personal care goods, and SoftBank Group Corporation, the telecom, internet, and investment conglomerate. Anicom’s shares declined due to profit taking, as the company’s business was among the beneficiaries of the pandemic. Kao suffered from a decline in business due to the pandemic as well as fiercer competition from Asian rivals. SoftBank Group marginally detracted from Fund performance due to excessive volatility in its investment portfolio and headline risks related to the company.
The Fund continues to hold all the companies mentioned.
Portfolio Strategy:
The Fund seeks long-term capital appreciation by investing in equity securities of Japanese companies regardless of market capitalization. We screen for companies that we believe have strong businesses and management and are trading at an attractive price. Through in-depth and rigorous analysis and on-site research, we identify stocks with a potential “value gap.” The portfolio is limited to our best ideas and maintains a concentrated number of holdings.
Investment Commentary:
Our portfolio approach is to construct a concentrated portfolio of what we believe are great global companies based in Japan, and we hold these companies for the long term to capture the potential capital compounding effect. Seeking out great companies means looking not just for businesses with sustainably high returns on invested capital, but also for those that can grow consistently regardless of macroeconomic conditions. We think of such businesses as “safe and sound.” In our portfolio, you will find consumer stocks that
| HENNESSY FUNDS | 1-800-966-4354 |
5
we consider defensive, economically-sensitive but high-quality industrials, and recession-resistant healthcare and internet stocks, as well as companies with diversified business portfolios. We aim to blend these types of businesses to pursue our goal of a portfolio that we believe can perform better than average in both strong and weak markets. This strategy serves as our first line of defense against downside risk to the Fund’s performance in both absolute and relative terms.
Despite our selective stock selection, our portfolio can be impacted by unexpected macroeconomic events. For example, a health crisis like the COVID-19 pandemic hits not just economically-sensitive companies but also more defensive consumer businesses because consumers curtail their spending even for small-ticket essentials. When this happens, we turn to another line of defense to attempt to limit the downside risk of the portfolio: the ability of our portfolio companies to overcome external headwinds. Our experience managing portfolios during prior economic challenges is helpful to us in managing through the current environment. Revisiting how businesses fared during and after the 2008 financial crisis, the Asian Currency Crisis of the late 1990s, or the 2001 dot-com bubble crash are very helpful exercises because they gives us insight into how businesses will likely perform in the future when another crisis emerges. Through this, we find comfort in maintaining the existing holdings even when the stock price is under pressure for a prolonged period.
______________
* Chartered Member of the Security Analysts Association of Japan
Opinions expressed are those of the Portfolio Managers as of the date written and are subject to change, are not guaranteed, and should not be considered investment advice or an indication of trading intent.
The Fund invests in small-capitalization and medium-capitalization companies, which may have more limited liquidity and greater price volatility than large-capitalization companies. The Fund invests in the stocks of companies operating in Japan; single-country funds may be subject to a higher degree of risk. The Fund may experience higher fees due to investments in pooled investment vehicles (including ETFs). Please see the Fund’s prospectus for a more complete discussion of these and other risks.
References to specific securities should not be considered a recommendation to buy or sell any security. Fund holdings and sector allocations are subject to change. Please refer to the Schedule of Investments included in this report for additional portfolio information.
| WWW.HENNESSYFUNDS.COM |
6
| PERFORMANCE OVERVIEW/SCHEDULE OF INVESTMENTS |
Financial Statements
Schedule of Investments as of October 31, 2021 |
HENNESSY JAPAN FUND
(% of Net Assets)
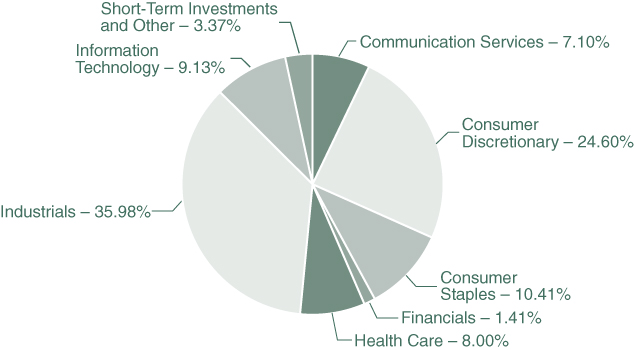
| TOP TEN HOLDINGS (EXCLUDING MONEY MARKET FUNDS) | % NET ASSETS |
| Recruit Holdings Co., Ltd. | 7.29% |
| Sony Group Corp. | 7.06% |
| Keyence Corp. | 6.27% |
| MISUMI Group, Inc. | 5.51% |
| Terumo Corp. | 5.31% |
| Daikin Industries, Ltd. | 5.13% |
| Mercari, Inc. | 5.05% |
| Nidec Corp. | 5.04% |
| Shimano, Inc. | 4.90% |
| Hitachi Ltd. | 4.67% |
Note: For presentation purposes, the Fund has grouped some of the industry categories. For purposes of categorizing securities for compliance with Section 8(b)(1) of the Investment Company Act of 1940, as amended, the Fund uses more specific industry classifications.
The Global Industry Classification Standard (GICS®) was developed by and is the exclusive property and a service mark of MSCI, Inc. and Standard & Poor’s Financial Services LLC. It has been licensed for use by the Hennessy Funds.
| HENNESSY FUNDS | 1-800-966-4354 |
7
| COMMON STOCKS – 96.63% | Number | % of | ||||||||||
| of Shares | Value | Net Assets | ||||||||||
| Communication Services – 7.10% | ||||||||||||
| SoftBank Group Corp. | 630,600 | $ | 34,139,047 | 4.20 | % | |||||||
| Z Holdings Corp. | 3,801,600 | 23,600,413 | 2.90 | % | ||||||||
| 57,739,460 | 7.10 | % | ||||||||||
| Consumer Discretionary – 24.60% | ||||||||||||
| Asics Corp. | 426,100 | 10,619,022 | 1.31 | % | ||||||||
| Fast Retailing Co., Ltd. | 41,700 | 27,681,199 | 3.40 | % | ||||||||
| Mercari, Inc. (a) | 759,400 | 41,090,697 | 5.05 | % | ||||||||
| Nitori Holdings Co., Ltd. | 127,600 | 23,441,461 | 2.88 | % | ||||||||
| Shimano, Inc. | 142,900 | 39,871,046 | 4.90 | % | ||||||||
| Sony Group Corp. | 496,100 | 57,446,583 | 7.06 | % | ||||||||
| 200,150,008 | 24.60 | % | ||||||||||
| Consumer Staples – 10.41% | ||||||||||||
| Ariake Japan Co., Ltd. | 166,400 | 10,833,968 | 1.33 | % | ||||||||
| Kao Corp. | 338,500 | 19,148,291 | 2.35 | % | ||||||||
| Rohto Pharmaceutical Co., Ltd. | 906,400 | 27,693,871 | 3.41 | % | ||||||||
| Unicharm Corp. | 666,800 | 26,967,269 | 3.32 | % | ||||||||
| 84,643,399 | 10.41 | % | ||||||||||
| Financials – 1.41% | ||||||||||||
| Anicom Holdings, Inc. | 1,471,500 | 11,472,556 | 1.41 | % | ||||||||
| Health Care – 8.00% | ||||||||||||
| Asahi Intecc Co., Ltd. | 139,600 | 3,679,767 | 0.45 | % | ||||||||
| Olympus Corp. | 715,500 | 15,499,909 | 1.91 | % | ||||||||
| PeptiDream, Inc. (a) | 110,500 | 2,671,028 | 0.33 | % | ||||||||
| Terumo Corp. | 979,600 | 43,215,846 | 5.31 | % | ||||||||
| 65,066,550 | 8.00 | % | ||||||||||
| Industrials – 35.98% | ||||||||||||
| Daikin Industries, Ltd. | 190,700 | 41,766,129 | 5.13 | % | ||||||||
| Hitachi Ltd. | 659,100 | 37,980,349 | 4.67 | % | ||||||||
| Kubota Corp. | 1,416,200 | 30,169,328 | 3.71 | % | ||||||||
| MISUMI Group, Inc. | 1,072,000 | 44,835,074 | 5.51 | % | ||||||||
| Mitsubishi Corp. | 1,184,900 | 37,677,421 | 4.63 | % | ||||||||
| Nidec Corp. | 370,400 | 41,024,700 | 5.04 | % | ||||||||
| Recruit Holdings Co., Ltd. | 891,300 | 59,288,401 | 7.29 | % | ||||||||
| 292,741,402 | 35.98 | % | ||||||||||
The accompanying notes are an integral part of these financial statements.
| WWW.HENNESSYFUNDS.COM |
8
| SCHEDULE OF INVESTMENTS |
| COMMON STOCKS | Number | % of | ||||||||||
| of Shares | Value | Net Assets | ||||||||||
| Information Technology – 9.13% | ||||||||||||
| Keyence Corp. | 84,500 | $ | 51,005,450 | 6.27 | % | |||||||
| Murata Manufacturing Co., Ltd. | 314,100 | 23,299,494 | 2.86 | % | ||||||||
| 74,304,944 | 9.13 | % | ||||||||||
| Total Common Stocks | ||||||||||||
| (Cost $476,831,050) | 786,118,319 | 96.63 | % | |||||||||
| SHORT-TERM INVESTMENTS – 2.97% | ||||||||||||
| Money Market Funds – 2.97% | ||||||||||||
| First American Government Obligations Fund, | ||||||||||||
| Institutional Class, 0.03% (b) | 24,197,282 | 24,197,282 | 2.97 | % | ||||||||
| Total Short-Term Investments | ||||||||||||
| (Cost $24,197,282) | 24,197,282 | 2.97 | % | |||||||||
| Total Investments | ||||||||||||
| (Cost $501,028,332) – 99.60% | 810,315,601 | 99.60 | % | |||||||||
| Other Assets in Excess of Liabilities – 0.40% | 3,268,911 | 0.40 | % | |||||||||
TOTAL NET ASSETS – 100.00% | $ | 813,584,512 | 100.00 | % | ||||||||
Percentages are stated as a percent of net assets.
| (a) | Non-income-producing security. |
| (b) | The rate listed is the fund’s seven-day yield as of October 31, 2021. |
The accompanying notes are an integral part of these financial statements.
| HENNESSY FUNDS | 1-800-966-4354 |
9
Summary of Fair Value Exposure as of October 31, 2021
The following is a summary of the inputs used to value the Fund’s net assets as of October 31, 2021 (see Note 3 in the accompanying Notes to the Financial Statements):
| Common Stocks | Level 1 | Level 2 | Level 3 | Total | ||||||||||||
| Communication Services | $ | — | $ | 57,739,460 | $ | — | $ | 57,739,460 | ||||||||
| Consumer Discretionary | — | 200,150,008 | — | 200,150,008 | ||||||||||||
| Consumer Staples | — | 84,643,399 | — | 84,643,399 | ||||||||||||
| Financials | — | 11,472,556 | — | 11,472,556 | ||||||||||||
| Health Care | — | 65,066,550 | — | 65,066,550 | ||||||||||||
| Industrials | — | 292,741,402 | — | 292,741,402 | ||||||||||||
| Information Technology | — | 74,304,944 | — | 74,304,944 | ||||||||||||
| Total Common Stocks | $ | — | $ | 786,118,319 | $ | — | $ | 786,118,319 | ||||||||
| Short-Term Investments | ||||||||||||||||
| Money Market Funds | $ | 24,197,282 | $ | — | $ | — | $ | 24,197,282 | ||||||||
| Total Short-Term Investments | $ | 24,197,282 | $ | — | $ | — | $ | 24,197,282 | ||||||||
| Total Investments | $ | 24,197,282 | $ | 786,118,319 | $ | — | $ | 810,315,601 | ||||||||
The accompanying notes are an integral part of these financial statements.
| WWW.HENNESSYFUNDS.COM |
10
| SCHEDULE OF INVESTMENTS/STATEMENT OF ASSETS AND LIABILITIES |
Financial Statements
Statement of Assets and Liabilities as of October 31, 2021 |
| ASSETS: | ||||
| Investments in securities, at value (cost $501,028,332) | $ | 810,315,601 | ||
| Dividends and interest receivable | 2,757,358 | |||
| Receivable for fund shares sold | 641,728 | |||
| Receivable for securities sold | 1,012,500 | |||
| Prepaid expenses and other assets | 62,636 | |||
| Total assets | 814,789,823 | |||
| LIABILITIES: | ||||
| Payable for fund shares redeemed | 257,996 | |||
| Payable to advisor | 554,490 | |||
| Payable to administrator | 232,121 | |||
| Payable to auditor | 22,551 | |||
| Accrued distribution fees | 9,809 | |||
| Accrued service fees | 7,541 | |||
| Accrued trustees fees | 6,604 | |||
| Accrued expenses and other payables | 114,199 | |||
| Total liabilities | 1,205,311 | |||
| NET ASSETS | $ | 813,584,512 | ||
| NET ASSETS CONSISTS OF: | ||||
| Capital stock | $ | 513,189,734 | ||
| Total distributable earnings | 300,394,778 | |||
| Total net assets | $ | 813,584,512 | ||
| NET ASSETS: | ||||
| Investor Class | ||||
| Shares authorized (no par value) | Unlimited | |||
| Net assets applicable to outstanding shares | $ | 86,112,733 | ||
| Shares issued and outstanding | 1,802,401 | |||
| Net asset value, offering price, and redemption price per share | $ | 47.78 | ||
| Institutional Class | ||||
| Shares authorized (no par value) | Unlimited | |||
| Net assets applicable to outstanding shares | $ | 727,471,779 | ||
| Shares issued and outstanding | 14,683,687 | |||
| Net asset value, offering price, and redemption price per share | $ | 49.54 | ||
The accompanying notes are an integral part of these financial statements.
| HENNESSY FUNDS | 1-800-966-4354 |
11
Financial Statements
Statement of Operations for the year ended October 31, 2021 |
| INVESTMENT INCOME: | ||||
Dividend income(1) | $ | 8,188,142 | ||
| Interest income | 5,760 | |||
| Total investment income | 8,193,902 | |||
| EXPENSES: | ||||
| Investment advisory fees (See Note 5) | 6,809,086 | |||
| Sub-transfer agent expenses – Investor Class (See Note 5) | 319,334 | |||
| Sub-transfer agent expenses – Institutional Class (See Note 5) | 629,689 | |||
| Administration, accounting, custody, and transfer agent fees (See Note 5) | 942,421 | |||
| Distribution fees – Investor Class (See Note 5) | 205,713 | |||
| Service fees – Investor Class (See Note 5) | 137,142 | |||
| Federal and state registration fees | 86,523 | |||
| Reports to shareholders | 37,344 | |||
| Compliance expense (See Note 5) | 27,448 | |||
| Trustees’ fees and expenses | 24,198 | |||
| Audit fees | 22,551 | |||
| Legal fees | 15,809 | |||
| Interest expense (See Note 7) | 9,048 | |||
| Other expenses | 76,793 | |||
| Total expenses | 9,343,099 | |||
| NET INVESTMENT LOSS | $ | (1,149,197 | ) | |
| REALIZED AND UNREALIZED GAINS (LOSSES): | ||||
| Net realized gain on investments | $ | 19,086,546 | ||
| Net change in unrealized appreciation/depreciation on investments | 68,905,761 | |||
| Net gain on investments | 87,992,307 | |||
| NET INCREASE IN NET ASSETS RESULTING FROM OPERATIONS | $ | 86,843,110 | ||
(1) | Net of foreign taxes withheld of $909,789. |
The accompanying notes are an integral part of these financial statements.
| WWW.HENNESSYFUNDS.COM |
12
| STATEMENT OF OPERATIONS/STATEMENTS OF CHANGES IN NET ASSETS |
Financial Statements
| Statements of Changes in Net Assets |
| Year Ended | Year Ended | |||||||
| October 31, 2021 | October 31, 2020 | |||||||
| OPERATIONS: | ||||||||
| Net investment loss | $ | (1,149,197 | ) | $ | (48,348 | ) | ||
| Net realized gain (loss) on investments | 19,086,546 | (26,459,008 | ) | |||||
| Net change in unrealized | ||||||||
| appreciation/depreciation on investments | 68,905,761 | 106,104,850 | ||||||
| Net increase in net assets resulting from operations | 86,843,110 | 79,597,494 | ||||||
| DISTRIBUTIONS TO SHAREHOLDERS: | ||||||||
| Distributable earnings – Investor Class | — | (117,483 | ) | |||||
| Distributable earnings – Institutional Class | (48,044 | ) | (3,035,473 | ) | ||||
| Total distributions | (48,044 | ) | (3,152,956 | ) | ||||
| CAPITAL SHARE TRANSACTIONS: | ||||||||
| Proceeds from shares subscribed – Investor Class | 61,092,843 | 83,467,464 | ||||||
| Proceeds from shares subscribed – Institutional Class | 227,381,324 | 203,244,073 | ||||||
| Dividends reinvested – Investor Class | — | 113,374 | ||||||
| Dividends reinvested – Institutional Class | 47,024 | 2,957,410 | ||||||
| Cost of shares redeemed – Investor Class | (129,927,285 | ) | (37,788,252 | ) | ||||
| Cost of shares redeemed – Institutional Class | (182,214,241 | ) | (276,664,005 | ) | ||||
| Net decrease in net assets derived | ||||||||
| from capital share transactions | (23,620,335 | ) | (24,669,936 | ) | ||||
| TOTAL INCREASE IN NET ASSETS | 63,174,731 | 51,774,602 | ||||||
| NET ASSETS: | ||||||||
| Beginning of year | 750,409,781 | 698,635,179 | ||||||
| End of year | $ | 813,584,512 | $ | 750,409,781 | ||||
| CHANGES IN SHARES OUTSTANDING: | ||||||||
| Shares sold – Investor Class | 1,302,489 | 2,016,527 | ||||||
| Shares sold – Institutional Class | 4,688,665 | 5,338,605 | ||||||
| Shares issued to holders as reinvestment | ||||||||
| of dividends – Investor Class | — | 2,962 | ||||||
| Shares issued to holders as reinvestment | ||||||||
| of dividends – Institutional Class | 944 | 75,037 | ||||||
| Shares redeemed – Investor Class | (2,825,915 | ) | (1,040,377 | ) | ||||
| Shares redeemed – Institutional Class | (3,765,795 | ) | (7,587,792 | ) | ||||
| Net decrease in shares outstanding | (599,612 | ) | (1,195,038 | ) | ||||
The accompanying notes are an integral part of these financial statements.
| HENNESSY FUNDS | 1-800-966-4354 |
13
Financial Statements
| Financial Highlights |
For an Investor Class share outstanding throughout each year
PER SHARE DATA:
Net asset value, beginning of year
Income from investment operations:
Net investment income (loss)
Net realized and unrealized gains on investments
Total from investment operations
Less distributions:
Dividends from net investment income
Dividends from net realized gains
Total distributions
Net asset value, end of year
TOTAL RETURN
SUPPLEMENTAL DATA AND RATIOS:
Net assets, end of year (millions)
Ratio of expenses to average net assets
Ratio of net investment income (loss) to average net assets
Portfolio turnover rate(3)
(1) | Calculated using the average shares outstanding method. |
(2) | Amount is between $(0.005) and $0.005. |
(3) | Calculated on the basis of the Fund as a whole. |
The accompanying notes are an integral part of these financial statements.
| WWW.HENNESSYFUNDS.COM |
14
| FINANCIAL HIGHLIGHTS — INVESTOR CLASS |
| Year Ended October 31, | ||||||||||||||||||
| 2021 | 2020 | 2019 | 2018 | 2017 | ||||||||||||||
| $ | 42.79 | $ | 37.17 | $ | 33.63 | $ | 32.75 | $ | 27.81 | |||||||||
| (0.23 | )(1) | (0.14 | )(1) | 0.05 | (1) | (0.00 | )(2) | (0.03 | ) | |||||||||
| 5.22 | 5.81 | 3.50 | 0.89 | 4.97 | ||||||||||||||
| 4.99 | 5.67 | 3.55 | 0.89 | 4.94 | ||||||||||||||
| — | (0.02 | ) | (0.01 | ) | (0.01 | ) | — | |||||||||||
| — | (0.03 | ) | — | — | — | |||||||||||||
| — | (0.05 | ) | (0.01 | ) | (0.01 | ) | — | |||||||||||
| $ | 47.78 | $ | 42.79 | $ | 37.17 | $ | 33.63 | $ | 32.75 | |||||||||
| 11.66 | % | 15.27 | % | 10.60 | % | 2.70 | % | 17.76 | % | |||||||||
| $ | 86.11 | $ | 142.30 | $ | 87.22 | $ | 103.33 | $ | 84.44 | |||||||||
| 1.43 | % | 1.43 | % | 1.43 | % | 1.43 | % | 1.46 | % | |||||||||
| (0.49 | )% | (0.37 | )% | 0.14 | % | (0.02 | )% | (0.15 | )% | |||||||||
| 16 | % | 23 | % | 9 | % | 1 | % | 0 | % | |||||||||
The accompanying notes are an integral part of these financial statements.
| HENNESSY FUNDS | 1-800-966-4354 |
15
Financial Statements
| Financial Highlights |
For an Institutional Class share outstanding throughout each year
PER SHARE DATA:
Net asset value, beginning of year
Income from investment operations:
Net investment income (loss)
Net realized and unrealized gains on investments
Total from investment operations
Less distributions:
Dividends from net investment income
Dividends from net realized gains
Total distributions
Net asset value, end of year
TOTAL RETURN
SUPPLEMENTAL DATA AND RATIOS:
Net assets, end of year (millions)
Ratio of expenses to average net assets
Ratio of net investment income (loss) to average net assets
Portfolio turnover rate(3)
(1) | Calculated using the average shares outstanding method. |
(2) | Amount is between $(0.005) and $0.005. |
(3) | Calculated on the basis of the Fund as a whole. |
The accompanying notes are an integral part of these financial statements.
| WWW.HENNESSYFUNDS.COM |
16
| FINANCIAL HIGHLIGHTS — INSTITUTIONAL CLASS |
| Year Ended October 31, | ||||||||||||||||||
| 2021 | 2020 | 2019 | 2018 | 2017 | ||||||||||||||
| $ | 44.19 | $ | 38.37 | $ | 34.67 | $ | 33.64 | $ | 28.45 | |||||||||
| (0.03 | )(1) | 0.02 | (1) | 0.21 | (1) | 0.15 | 0.03 | |||||||||||
| 5.38 | 5.99 | 3.60 | 0.91 | 5.16 | ||||||||||||||
| 5.35 | 6.01 | 3.81 | 1.06 | 5.19 | ||||||||||||||
| (0.00 | )(2) | (0.16 | ) | (0.11 | ) | (0.03 | ) | — | ||||||||||
| — | (0.03 | ) | — | — | — | |||||||||||||
| (0.00 | )(2) | (0.19 | ) | (0.11 | ) | (0.03 | ) | — | ||||||||||
| $ | 49.54 | $ | 44.19 | $ | 38.37 | $ | 34.67 | $ | 33.64 | |||||||||
| 12.11 | % | 15.72 | % | 11.02 | % | 3.14 | % | 18.24 | % | |||||||||
| $ | 727.47 | $ | 608.11 | $ | 611.41 | $ | 399.76 | $ | 177.42 | |||||||||
| 1.04 | % | 1.04 | % | 1.03 | % | 1.01 | % | 1.05 | % | |||||||||
| (0.07 | )% | 0.04 | % | 0.59 | % | 0.49 | % | 0.30 | % | |||||||||
| 16 | % | 23 | % | 9 | % | 1 | % | 0 | % | |||||||||
The accompanying notes are an integral part of these financial statements.
| HENNESSY FUNDS | 1-800-966-4354 |
17
Financial Statements
Notes to the Financial Statements October 31, 2021 |
1). ORGANIZATION
The Hennessy Japan Fund (the “Fund”) is a series of Hennessy Funds Trust (the “Trust”), which was organized as a Delaware statutory trust on September 17, 1992. The Fund is an open-end management investment company registered under the Investment Company Act of 1940, as amended. The investment objective of the Fund is long-term capital appreciation. The Fund is a diversified fund, but employs a relatively concentrated investment strategy and may hold securities of fewer issuers than other diversified funds.
The Fund offers Investor Class and Institutional Class shares. Each class of shares differs principally in its respective 12b-1 distribution and service, shareholder servicing, and sub-transfer agent expenses. There are no sales charges. Each class has identical rights to earnings, assets, and voting privileges, except for class-specific expenses and exclusive rights to vote on matters affecting only one class.
As an investment company, the Fund follows the investment company accounting and reporting guidance of the Financial Accounting Standards Board (“FASB”) Accounting Standard Codification Topic 946 “Financial Services—Investment Companies.”
2). SIGNIFICANT ACCOUNTING POLICIES
The following is a summary of significant accounting policies consistently followed by the Fund in the preparation of the financial statements. These policies conform to U.S. generally accepted accounting principles (“GAAP”).
| a). | Securities Valuation – All investments in securities are valued in accordance with the Fund’s valuation policies and procedures, as described in Note 3. |
| b). | Federal Income Taxes – The Fund has elected to be taxed as a regulated investment company and intends to distribute substantially all of its taxable income to its shareholders and otherwise comply with the provisions of the Internal Revenue Code of 1986, as amended, applicable to regulated investment companies. As a result, the Fund has made no provision for federal income taxes or excise taxes. Net investment income/loss and realized gains/losses for federal income tax purposes may differ from those reported in the financial statements because of temporary book-basis and tax-basis differences. Temporary differences are primarily the result of the treatment of wash sales for tax reporting purposes. The Fund recognizes interest and penalties related to income tax benefits, if any, in the Statement of Operations as an income tax expense. Distributions from net realized gains for book purposes may include short-term capital gains, which are included as ordinary income to shareholders for tax purposes. The Fund may utilize equalization accounting for tax purposes and designate earnings and profits, including net realized gains distributed to shareholders on redemption of shares, as part of the dividends paid deduction for income tax purposes. |
| Due to inherent differences in the recognition of income, expenses, and realized gains/losses under GAAP and federal income tax regulations, permanent differences between book and tax basis for reporting are identified and appropriately reclassified in the Statement of Assets and Liabilities, as needed. As of October 31, 2021, no such reclassifications were required for fiscal year 2021. |
| WWW.HENNESSYFUNDS.COM |
18
| NOTES TO THE FINANCIAL STATEMENTS |
| c). | Accounting for Uncertainty in Income Taxes – The Fund has accounting policies regarding recognition and measurement of tax positions taken or expected to be taken on a tax return. The tax returns of the Fund for the prior three fiscal years are open for examination. The Fund has reviewed all open tax years in major tax jurisdictions and concluded that there is no impact on the Fund’s net assets and no tax liability resulting from unrecognized tax benefits relating to uncertain income tax positions taken or expected to be taken on a tax return. The Fund’s major tax jurisdictions are U.S. federal and Delaware. |
| d). | Income and Expenses – Dividend income is recognized on the ex-dividend date or as soon as information is available to the Fund. Interest income, which includes the amortization of premium and accretion of discount, is recognized on an accrual basis. Market discounts, original issue discounts, and market premiums on debt securities are accreted or amortized to interest income over the life of a security with a corresponding increase or decrease, as applicable, in the cost basis of such security using the yield-to-maturity method or, where applicable, the first call date of the security. Other non-cash dividends are recognized as investment income at the fair value of the property received. The Fund is charged for those expenses that are directly attributable to its portfolio, such as advisory, administration, and certain shareholder service fees. Income, expenses (other than expenses attributable to a specific class), and realized and unrealized gains/losses on investments are allocated to each class of shares based on such class’s net assets. |
| e). | Distributions to Shareholders – Dividends from net investment income for the Fund, if any, are declared and paid annually, usually in December. Distributions of net realized capital gains, if any, are declared and paid annually, usually in December. |
| f). | Security Transactions – Investment and shareholder transactions are recorded on the trade date. The Fund determines the realized gain/loss from an investment transaction by comparing the original cost of the security lot sold with the net sale proceeds. Discounts and premiums on securities purchased are accreted or amortized, respectively, over the life of each such security. |
| g). | Use of Estimates – Preparing financial statements in accordance with GAAP requires management to make estimates and assumptions that affect the reported amounts of assets and liabilities and disclosure of contingent assets and liabilities at the date of the financial statements, as well as the reported change in net assets during the reporting period. Actual results could differ from those estimates. |
| h). | Share Valuation – The net asset value (“NAV”) per share of the Fund is calculated by dividing (i) the total value of the securities held by the Fund, plus cash and other assets, minus all liabilities (including estimated accrued expenses) by (ii) the total number of Fund shares outstanding, rounded to the nearest $0.01. Fund shares are not priced on days the New York Stock Exchange is closed for trading. The offering and redemption price per share for the Fund is equal to the Fund’s NAV per share. |
| i). | Foreign Currency – Values of investments denominated in foreign currencies are converted into U.S. dollars using the spot market exchange rate at the time of valuation. Purchases and sales of investments and income are translated into U.S. dollars using the spot market exchange rate prevailing on the respective dates of such transactions. The Fund does not isolate the portion of the results of operations resulting from fluctuations in foreign exchange rates on investments from fluctuations resulting from changes in the market prices of securities held. Such fluctuations are included with the net realized and unrealized gain/loss on investments. Foreign investments present additional risks due to currency |
| HENNESSY FUNDS | 1-800-966-4354 |
19
| fluctuations, economic and political factors, lower liquidity, government regulations, differences in accounting standards, and other factors. | |
| j). | REIT Equity Securities – Distributions received from real estate investment trusts (“REITs”) may be classified as dividends, capital gains, or return of capital. Investments in REITs may require the Fund to accrue and distribute income not yet received. To generate sufficient cash to make any required distributions, the Fund may be required to sell securities in its portfolio (including when it is not advantageous to do so) that it otherwise would have continued to hold. At other times, investments in a REIT may result in the Fund’s receipt of cash in excess of the REIT’s earnings. If the Fund distributes these amounts, these distributions could constitute a return of capital to Fund shareholders for U.S. federal income tax purposes. Dividends received by the Fund from a REIT generally do not constitute qualified dividend income and do not qualify for the dividends-received deduction. |
| k). | Recent Accounting Pronouncements and Regulatory Updates – In October 2020, the Securities and Exchange Commission (“SEC”) adopted new regulations governing the use of derivatives by registered investment companies (“Rule 18f-4”). Rule 18f-4 imposes limits on the amount of derivatives a fund can enter into, eliminates the asset segregation framework currently used by funds to comply with Section 18 of the 1940 Act, and requires funds whose use of derivatives is greater than a limited specified amount to establish and maintain a comprehensive derivatives risk management program and appoint a derivatives risk manager. Funds are required to comply with Rule 18f-4 by August 19, 2022. The impact, if any, that Rule 18f-4 will have on the availability, liquidity, and performance of derivatives is unclear. Management is currently evaluating the potential impact of Rule 18f-4 on the Fund. When fully implemented, Rule 18f-4 may require changes in how the Fund uses derivatives, adversely affect the Fund’s performance, and increase costs related to the Fund’s use of derivatives. |
| In December 2020, the SEC adopted a new rule providing a framework for fund valuation practices (“Rule 2a-5”). Rule 2a-5 establishes requirements for determining fair value in good faith for purposes of the 1940 Act. Rule 2a-5 permits fund boards to designate certain parties to perform fair value determinations, subject to board oversight and certain other conditions. Rule 2a-5 also defines when market quotations are “readily available” for purposes of the 1940 Act and the threshold for determining whether a fund must fair value a security. In connection with Rule 2a-5, the SEC also adopted related recordkeeping requirements and is rescinding previously issued guidance, including with respect to the role of a board in determining fair value and the accounting and auditing of fund investments. Funds must comply with the rules by September 8, 2022. Management is currently assessing the potential impact of the new rules on the Fund’s financial statements. |
3). SECURITIES VALUATION
The Fund follows its valuation policies and procedures in determining its net asset value and, in preparing these financial statements, the fair value accounting standards that establish an authoritative definition of fair value and set out a hierarchy for measuring fair value. These standards require additional disclosures about the various inputs and valuation techniques used to develop the measurements of fair value and a discussion of changes in valuation techniques and related inputs during the period. These inputs are summarized in the three broad levels listed below:
| Level 1 – | Unadjusted, quoted prices in active markets for identical instruments that the Fund has the ability to access at the date of measurement. |
| WWW.HENNESSYFUNDS.COM |
20
| NOTES TO THE FINANCIAL STATEMENTS |
| Level 2 – | Other significant observable inputs (including, but not limited to, quoted prices in active markets for similar instruments, quoted prices in markets that are not active for identical or similar instruments, and model-derived valuations in which all significant inputs and significant value drivers are observable in active markets, such as interest rates, prepayment speeds, credit risk curves, default rates, and similar data). | |
| Level 3 – | Significant unobservable inputs (including the Fund’s own assumptions about what market participants would use to price the asset or liability based on the best available information) when observable inputs are unavailable. |
The following is a description of the valuation techniques applied to the Fund’s major categories of assets and liabilities on a recurring basis:
Equity Securities – Equity securities, including common stocks, preferred stocks, foreign-issued common stocks, exchange-traded funds, closed-end mutual funds, partnerships, rights, and real estate investment trusts, that are traded on a securities exchange for which a last-quoted sales price is readily available generally are valued at the last sales price as reported by the primary exchange on which the securities are listed. Securities listed on The NASDAQ Stock Market (“NASDAQ”) generally are valued at the NASDAQ Official Closing Price, which may differ from the last sales price reported. Securities traded on a securities exchange for which a last-quoted sales price is not readily available generally are valued at the mean between the bid and ask prices. To the extent these securities are actively traded and valuation adjustments are not applied, they are classified in Level 1 of the fair value hierarchy. Securities traded on foreign exchanges generally are not valued at the same time the Fund calculates its NAV because most foreign markets close well before such time. The earlier close of most foreign markets gives rise to the possibility that significant events, including broad market moves, may have occurred in the interim. In certain circumstances, it may be determined that a foreign security needs to be fair valued because it appears that the value of the security might have been materially affected by events occurring after the close of the market in which the security is principally traded, but before the time the Fund calculates its NAV, such as by a development that affects an entire market or region (e.g., a weather-related event) or a potentially global development (e.g., a terrorist attack that may be expected to have an effect on investor expectations worldwide). | |
Registered Investment Companies – Investments in open-end registered investment companies, commonly referred to as mutual funds, generally are priced at the ending NAV provided by the applicable mutual fund’s service agent and are classified in Level 1 of the fair value hierarchy. | |
Debt Securities – Debt securities, including corporate bonds, asset-backed securities, mortgage-backed securities, municipal bonds, U.S. Treasuries, and U.S. government agency issues, are generally valued at market on the basis of valuations furnished by an independent pricing service that utilizes both dealer-supplied valuations and formula-based techniques. The pricing service may consider recently executed transactions in securities of the issuer or comparable issuers, market price quotations (where observable), bond spreads, and fundamental data relating to the issuer. In addition, the model may incorporate observable market data, such as reported sales of similar securities, broker quotes, yields, bids, offers, and reference data. Certain securities are valued primarily using dealer quotations. These securities are generally classified in Level 2 of the fair value hierarchy. |
| HENNESSY FUNDS | 1-800-966-4354 |
21
Short-Term Securities – Short-term equity investments, including money market funds, are valued in the manner specified above for equity securities. Short-term debt investments with an original term to maturity of 60 days or less are valued at amortized cost, which approximates fair market value. If the original term to maturity of a short-term debt investment exceeds 60 days, then the values as of the 61st day prior to maturity are amortized. Amortized cost is not used if its use would be inappropriate due to credit or other impairments of the issuer, in which case the security’s fair value would be determined as described below. Short-term securities are generally classified in Level 1 or Level 2 of the fair value hierarchy depending on the inputs used and market activity levels for specific securities. |
The Board of Trustees of the Fund (the “Board”) has adopted fair value pricing procedures that are followed when a price for a security is not readily available or if a significant event has occurred that indicates the closing price of a security no longer represents the true value of that security. Fair value pricing determinations are made in good faith in accordance with these procedures. There are numerous criteria considered in determining a fair value of a security, such as the trading volume of a security and markets, the values of other similar securities, and news events with direct bearing on a security or markets. Fair value pricing results in an estimated price for a security that reflects the amount the Fund might reasonably expect to receive in a current sale. Depending on the relative significance of the valuation inputs, these securities may be classified in either Level 2 or Level 3 of the fair value hierarchy.
The fair value of foreign securities may be determined with the assistance of a pricing service using correlations between the movement of prices of such securities and indices of domestic securities and other appropriate indicators, such as closing market prices of relevant American Depositary Receipts or futures contracts. Using fair value pricing means that the Fund’s NAV reflects the affected portfolio securities’ values as determined by the Board or its designee, pursuant to the fair value pricing procedures adopted by the Board, instead of being determined by the market. Using a fair value pricing methodology to price a foreign security may result in a value that is different from such foreign security’s most recent closing price and from the value used by other investment companies to calculate their NAVs. Such securities are generally classified in Level 2 of the fair value hierarchy. Because the Fund invests in foreign securities, the value of the Fund’s portfolio securities may change on days when a shareholder is unable to purchase or redeem Fund shares.
The Board has delegated day-to-day valuation matters to the Valuation and Liquidity Committee comprising representatives from Hennessy Advisors, Inc., the Fund’s investment advisor (the “Advisor”). The function of the Valuation and Liquidity Committee, among other things, is to value securities where current and reliable market quotations are not readily available. All actions taken by the Valuation and Liquidity Committee are reviewed by the Board.
The Fund has performed an analysis of all existing investments to determine the significance and character of all inputs to their fair value determinations. Various inputs are used to determine the value of the Fund’s investments. The inputs or methodology used for valuing securities are not necessarily an indication of the risk associated with investing in those securities. Details related to the fair value hierarchy of the Fund’s securities as of October 31, 2021, are included in the Schedule of Investments.
4). INVESTMENT TRANSACTIONS
Purchases and sales of investment securities (excluding government and short-term investments) for the Fund during fiscal year 2021 were $127,767,752 and $163,746,213, respectively.
| WWW.HENNESSYFUNDS.COM |
22
| NOTES TO THE FINANCIAL STATEMENTS |
There were no purchases or sales/maturities of long-term U.S. government securities for the Fund during fiscal year 2021.
5). INVESTMENT ADVISORY FEE AND OTHER TRANSACTIONS WITH AFFILIATES
The Advisor provides the Fund with investment advisory services under an Investment Advisory Agreement. The Advisor oversees the provision of investment advice and furnishes office space, facilities, and most of the personnel needed by the Fund. As compensation for its services, the Advisor is entitled to a monthly fee from the Fund. The fee is based on the average daily net assets of the Fund at an annual rate of 0.80%. The net investment advisory fees expensed by the Fund during fiscal year 2021 are included in the Statement of Operations.
The Advisor has delegated the day-to-day management of the Fund to a sub-advisor, SPARX Asset Management Co., Ltd. The Advisor pays the sub-advisory fees from its own assets, and these fees are not an additional expense of the Fund. During fiscal year 2021, the Advisor (not the Fund) paid a sub-advisory fee at the average rate of 0.37% of the daily net assets of the Fund. Pursuant to the sub-advisory agreement, the Advisor pays sub-advisory fees at the rate of 0.35% of the first $500 million of daily net assets, 0.40% of daily net assets between $500 million and $1 billion, and 0.42% of daily net assets over $1 billion.
The Board has approved a Shareholder Servicing Agreement for Investor Class shares of the Fund, which compensates the Advisor for the non-investment advisory services it provides to the Fund. The Shareholder Servicing Agreement provides for a monthly fee paid to the Advisor at an annual rate of 0.10% of the average daily net assets of the Fund attributable to Investor Class shares. The shareholder service fees expensed by the Fund during fiscal year 2021 are included in the Statement of Operations.
The Fund has adopted a plan pursuant to Rule 12b-1 under the Investment Company Act of 1940, as amended, that authorizes payments in connection with the distribution of Fund shares at an annual rate of up to 0.25% of the Fund’s average daily net assets attributable to Investor Class shares. Even though the authorized rate is up to 0.25%, the Fund is currently only using up to 0.15% of its average daily net assets attributable to Investor Class shares for such purpose. Amounts paid under the plan may be spent on any activities or expenses primarily intended to result in the sale of shares, including, but not limited to, advertising, shareholder account servicing, printing and mailing of prospectuses to other than current shareholders, printing and mailing of sales literature, and compensation for sales and marketing activities or to financial institutions and others, such as dealers and distributors. The distribution fees expensed by the Fund during fiscal year 2021 are included in the Statement of Operations.
The Fund has entered into agreements with various brokers, dealers, and financial intermediaries in connection with the sale of Fund shares. The agreements provide for periodic payments of sub-transfer agent expenses by the Fund to the brokers, dealers, and financial intermediaries for providing certain shareholder maintenance services. These shareholder services include the pre-processing and quality control of new accounts, shareholder correspondence, answering customer inquiries regarding account status, and facilitating shareholder telephone transactions. The sub-transfer agent fees expensed by the Fund during fiscal year 2021 are included in the Statement of Operations.
U.S. Bancorp Fund Services, LLC, d/b/a U.S. Bank Global Fund Services (“Fund Services”) provides the Fund with administrative, accounting, and transfer agent services. As administrator, Fund Services is responsible for activities such as (i) preparing various federal and state regulatory filings, reports, and returns for the Fund, (ii) preparing reports and materials to be supplied to the Board, (iii) monitoring the activities of the
| HENNESSY FUNDS | 1-800-966-4354 |
23
Fund’s custodian, transfer agent, and accountants, and (iv) coordinating the preparation and payment of the Fund’s expenses and reviewing the Fund’s expense accruals. U.S. Bank N.A., an affiliate of Fund Services, serves as the Fund’s custodian. The servicing agreements between the Trust, Fund Services, and U.S. Bank N.A. contain a fee schedule that is inclusive of administrative, accounting, custody, and transfer agent fees. The administrative, accounting, custody, and transfer agent fees expensed by the Fund during fiscal year 2021 are included in the Statement of Operations.
Quasar Distributors, LLC (“Quasar”), a wholly owned broker-dealer subsidiary of Foreside Financial Group, LLC (“Foreside”), acts as the Fund’s principal underwriter in a continuous public offering of Fund shares. Effective September 30, 2021, Genstar Capital, a private equity firm specializing in financial and related business service companies, acquired a majority interest in Foreside. The Board approved a new Distribution Agreement to enable Quasar to continue serving as the Fund’s distributor following the change in control of Foreside.
The officers of the Fund are affiliated with the Advisor. With the exception of the Chief Compliance Officer and the Senior Compliance Officer, such officers receive no compensation from the Fund for serving in their respective roles. The Fund, along with the other funds in the Hennessy Funds family (collectively, the “Hennessy Funds”), makes reimbursement payments on an equal basis to the Advisor for a portion of the salary and benefits associated with the office of the Chief Compliance Officer and for all of the salary and benefits associated with the office of the Senior Compliance Officer. The compliance fees expensed by the Fund during fiscal year 2021 are included in the Statement of Operations.
6). GUARANTEES AND INDEMNIFICATIONS
Under the Hennessy Funds’ organizational documents, their officers and trustees are indemnified by the Hennessy Funds against certain liabilities arising out of the performance of their duties to the Hennessy Funds. Additionally, in the normal course of business, the Hennessy Funds enter into contracts with service providers that contain general indemnification clauses. The Fund’s maximum exposure under these arrangements is unknown as this would involve future claims that may be made against the Fund that have not yet occurred. Currently, the Fund expects the risk of loss to be remote.
7). LINE OF CREDIT
The Fund has an uncommitted line of credit with the other Hennessy Funds in the amount of the lesser of (i) $100,000,000 or (ii) 33.33% of each Hennessy Fund’s net assets, or 30% for the Hennessy Gas Utility Fund and 10% for the Hennessy Balanced Fund. The line of credit is intended to provide any necessary short-term financing in connection with shareholder redemptions, subject to certain restrictions. The credit facility is with the Hennessy Funds’ custodian bank, U.S. Bank N.A. Borrowings under this arrangement bear interest at the bank’s prime rate and are secured by all of the Fund’s assets (as to its own borrowings only). During fiscal year 2021, the Fund had an outstanding average daily balance and a weighted average interest rate of $274,575 and 3.25%, respectively. The interest expensed by the Fund during fiscal year 2021 is included in the Statement of Operations. The maximum amount outstanding for the Fund during fiscal year 2021 was $23,213,000. As of October 31, 2021, the Fund did not have any borrowings outstanding under the line of credit.
| WWW.HENNESSYFUNDS.COM |
24
| NOTES TO THE FINANCIAL STATEMENTS |
8). FEDERAL TAX INFORMATION
As of October 31, 2021, the components of accumulated earnings (losses) for income tax purposes were as follows:
| Investments | ||||
| Cost of investments for tax purposes | $ | 514,098,328 | ||
| Gross tax unrealized appreciation | $ | 319,634,787 | ||
| Gross tax unrealized depreciation | (23,480,253 | ) | ||
| Net tax unrealized appreciation/(depreciation) | $ | 296,154,534 | ||
| Undistributed ordinary income | $ | 11,762,697 | ||
| Undistributed long-term capital gains | — | |||
| Total distributable earnings | $ | 11,762,697 | ||
| Other accumulated gain/(loss) | $ | (7,522,453 | ) | |
| Total accumulated gain/(loss) | $ | 300,394,778 | ||
The difference between book-basis unrealized appreciation/depreciation and tax-basis unrealized appreciation/depreciation (as shown above) is attributable primarily to wash sales and investments in passive foreign investment companies.
As of October 31, 2021, the Fund had $7,522,453 in unlimited short-term capital loss carryforwards. During fiscal year 2021, the capital losses utilized by the Fund were $18,252,798.
Capital losses sustained in or after fiscal year 2012 can be carried forward indefinitely, but any such loss retains the character of the original loss and must be utilized prior to any loss incurred before fiscal year 2012. As a result of this ordering rule, capital loss carryforwards incurred prior to fiscal year 2012 may be more likely to expire unused. Capital losses sustained prior to fiscal year 2012 can be carried forward for eight years and can be carried forward as short-term capital losses regardless of the character of the original loss.
As of October 31, 2021, the Fund did not defer, on a tax basis, any late-year ordinary losses. Late-year ordinary losses are net ordinary losses incurred after December 31, 2020, but within the taxable year, that are deemed to arise on the first day of the Fund’s next taxable year.
During fiscal years 2021 and 2020, the tax character of distributions paid by the Fund was as follows:
| Year Ended | Year Ended | ||||||||
| October 31, 2021 | October 31, 2020 | ||||||||
Ordinary income(1) | $ | 48,044 | $ | 2,630,335 | |||||
| Long-term capital gains | — | 522,621 | |||||||
| Total distributions | $ | 48,044 | $ | 3,152,956 | |||||
(1) Ordinary income includes short-term capital gains. |
9). EVENTS SUBSEQUENT TO YEAR END
Management has evaluated the Fund’s related events and transactions that occurred subsequent to October 31, 2021, through the date of issuance of the Fund’s financial statements. Management has determined that there were no subsequent events requiring recognition or disclosure in the financial statements.
| HENNESSY FUNDS | 1-800-966-4354 |
25
Report of Independent Registered Public
Accounting Firm
To the Board of Trustees of Hennessy Funds Trust
and the shareholders of the Hennessy Japan Fund
Novato, CA
Opinion on the Financial Statements
We have audited the accompanying statement of assets and liabilities of the Hennessy Japan Fund (the “Fund”), a series of Hennessy Funds Trust, including the schedule of investments, as of October 31, 2021, the related statement of operations for the year then ended, the statements of changes in net assets for each of the two years in the period then ended, the financial highlights for each of the five years in the period then ended, and the related notes (collectively referred to as the “financial statements”). In our opinion, the financial statements present fairly, in all material respects, the financial position of the Fund as of October 31, 2021, the results of its operations for the year then ended, the changes in its net assets for each of the two years in the period then ended, and the financial highlights for each of the five years in the period then ended in conformity with accounting principles generally accepted in the United States of America.
Basis for Opinion
These financial statements are the responsibility of the Fund’s management. Our responsibility is to express an opinion on the Fund’s financial statements based on our audits. We are a public accounting firm registered with the Public Company Accounting Oversight Board (United States) (“PCAOB”) and are required to be independent with respect to the Fund in accordance with the U.S. federal securities laws and the applicable rules and regulations of the Securities and Exchange Commission and the PCAOB. We have served as the auditor of one or more of the funds in the Trust since 2002.
We conducted our audits in accordance with the standards of the PCAOB. Those standards require that we plan and perform the audit to obtain reasonable assurance about whether the financial statements are free of material misstatement, whether due to error or fraud. The Fund is not required to have, nor were we engaged to perform, an audit of its internal control over financial reporting. As part of our audits we are required to obtain an understanding of internal control over financial reporting, but not for the purpose of expressing an opinion on the effectiveness of the Fund’s internal control over financial reporting. Accordingly, we express no such opinion.
Our audits included performing procedures to assess the risks of material misstatement of the financial statements, whether due to error or fraud, and performing procedures that respond to those risks. Such procedures included examining, on a test basis, evidence regarding the amounts and disclosures in the financial statements. Our audits also included evaluating the accounting principles used and significant estimates made by management, as well as evaluating the overall presentation of the financial statements. Our procedures included confirmation of securities owned as of October 31, 2021 by correspondence with the custodian. We believe that our audits provide a reasonable basis for our opinion.
| |
| TAIT, WELLER & BAKER LLP |
Philadelphia, Pennsylvania
December 22, 2021
| WWW.HENNESSYFUNDS.COM |
26
| REPORT OF INDEPENDENT REGISTERED PUBLIC ACCOUNTING FIRM/TRUSTEES AND OFFICERS |
Trustees and Officers of the Fund (Unaudited)
The business and affairs of the Funds are managed under the direction of the Board of Trustees of the Trust, and the Board of Trustees elects the officers of the Trust. From time to time, the Board of Trustees also has appointed advisers to the Board of Trustees (“Advisers”) with the intention of having qualified individuals serve in an advisory capacity to garner experience in the mutual fund and asset management industry and be considered as potential Trustees in the future. There are currently two Advisers, Brian Alexander and Doug Franklin. As Advisers, Mr. Alexander and Mr. Franklin attend meetings of the Board of Trustees and act as non-voting participants. Information pertaining to the Trustees, Advisers, and the officers of the Trust is set forth below. The Trustees and officers serve until their successors are duly elected and qualified or until their earlier death, resignation, or removal. Each Trustee oversees all 16 Hennessy Funds. Unless otherwise indicated, the address of all persons listed below is 7250 Redwood Boulevard, Suite 200, Novato, CA 94945. The Fund’s Statement of Additional Information includes more information about the persons listed below and is available without charge by calling 1-800-966-4354 or by visiting www.hennessyfunds.com.
| Other | |||
| Directorships | |||
| Held Outside | |||
| Name, Age, | of Fund | ||
| and Position Held | Start Date | Principal Occupation(s) | Complex During |
with the Trust | of Service | During Past Five Years | Past Five Years |
| Disinterested Trustees and Advisers | |||
| J. Dennis DeSousa | January 1996 | Mr. DeSousa is a real estate investor. | None. |
| 85 | |||
| Trustee | |||
| Robert T. Doyle | January 1996 | Mr. Doyle has been the Sheriff of | None. |
| 74 | Marin County, California since 1996. | ||
| Trustee | |||
| Claire Garvie | December 2015 | Ms. Garvie is a founder of Kiosk and | None. |
| 47 | as an Adviser | has served as its Chief Operating | |
| Trustee | to the Board | Officer since 2004. Kiosk is a full- | |
| and | service marketing agency with | ||
| December 2021 | offices in the San Francisco Bay Area, | ||
| as a Trustee | Toronto, and Liverpool, UK. | ||
| Gerald P. Richardson | May 2004 | Mr. Richardson is an independent | None. |
| 76 | consultant in the securities industry. | ||
| Trustee |
| HENNESSY FUNDS | 1-800-966-4354 |
27
| Other | |||
| Directorships | |||
| Held Outside | |||
| Name, Age, | of Fund | ||
| and Position Held | Start Date | Principal Occupation(s) | Complex During |
with the Trust | of Service | During Past Five Years | Past Five Years |
| Brian Alexander | March 2015 | Mr. Alexander has worked for the | None. |
| 40 | Sutter Health organization since | ||
| Adviser to the Board | 2011 in various positions. He has | ||
| served as the Chief Executive Officer | |||
| of the Sutter Roseville Medical | |||
| Center since 2018. From 2016 through | |||
| 2018, he served as the Vice President | |||
| of Strategy for the Sutter Health Valley | |||
| Area, which includes 11 hospitals, | |||
| 13 ambulatory surgery centers, | |||
| 16,000 employees, and 1,900 physicians. | |||
| From 2013 through 2016, Mr. Alexander | |||
| served as Sutter Novato Community | |||
| Hospital’s Chief Administrative Officer. | |||
| Doug Franklin | March 2016 | Mr. Franklin is a retired insurance | None. |
| 57 | industry executive. From 1987 | ||
| Adviser to the Board | through 2015, he was employed | ||
| by the Allianz-Fireman’s Fund | |||
| Insurance Company in various | |||
| positions, including as its Chief | |||
| Actuary and Chief Risk Officer. | |||
Interested Trustee(1) | |||
| Neil J. Hennessy | January 1996 as | Mr. Hennessy has been employed | Hennessy |
| 65 | a Trustee and | by Hennessy Advisors, Inc. since | Advisors, Inc. |
| Chairman of the Board, | June 2008 as | 1989 and currently serves as its | |
| Chief Market Strategist, | an officer | Chairman and Chief Executive Officer. | |
| Portfolio Manager, | |||
| and President |
| Name, Age, | ||
| and Position Held | Start Date | Principal Occupation(s) |
with the Trust | of Service | During Past Five Years |
| Officers | ||
| Teresa M. Nilsen | January 1996 | Ms. Nilsen has been employed by Hennessy Advisors, Inc. |
| 55 | since 1989 and currently serves as its President and Chief | |
| Executive Vice President | Operating Officer. | |
| and Treasurer | ||
| Daniel B. Steadman | March 2000 | Mr. Steadman has been employed by Hennessy Advisors, Inc. |
| 65 | since 2000 and currently serves as its Executive Vice President. | |
| Executive Vice President | ||
| and Secretary | ||
| Brian Carlson | December 2013 | Mr. Carlson has been employed by Hennessy Advisors, Inc. |
| 49 | since December 2013 and currently serves as its Chief | |
| Senior Vice President | Compliance Officer and Senior Vice President. | |
| and Head of Distribution |
| WWW.HENNESSYFUNDS.COM |
28
| TRUSTEES AND OFFICERS OF THE FUND |
| Name, Age, | ||
| and Position Held | Start Date | Principal Occupation(s) |
with the Trust | of Service | During Past Five Years |
Jennifer Cheskiewicz(2) | June 2013 | Ms. Cheskiewicz has been employed by Hennessy Advisors, Inc. |
| 44 | as its General Counsel since June 2013. | |
| Senior Vice President and | ||
| Chief Compliance Officer | ||
David Ellison(3) | October 2012 | Mr. Ellison has been employed by Hennessy Advisors, Inc. since |
| 63 | October 2012. He has served as a Portfolio Manager of the | |
| Senior Vice President | Hennessy Large Cap Financial Fund and the Hennessy Small | |
| and Portfolio Manager | Cap Financial Fund since their inception. Mr. Ellison also served | |
| as a Portfolio Manager of the Hennessy Technology Fund from | ||
| its inception until February 2017. Mr. Ellison served as Director, | ||
| CIO, and President of FBR Fund Advisers, Inc. from December | ||
| 1999 to October 2012. | ||
Ryan Kelley(4) | March 2013 | Mr. Kelley has been employed by Hennessy Advisors, Inc. since |
| 49 | October 2012. He has served as Chief Investment Officer of the | |
| Chief Investment Officer, | Hennessy Funds since March 2021 and has served as a Portfolio | |
| Senior Vice President, | Manager of the Hennessy Gas Utility Fund, the Hennessy Large | |
| and Portfolio Manager | Cap Financial Fund, and the Hennessy Small Cap Financial Fund | |
| since October 2014. Mr. Kelley served as Co-Portfolio Manager | ||
| of these same funds from March 2013 through September | ||
| 2014 and as a Portfolio Analyst for the Hennessy Funds from | ||
| October 2012 through February 2013. He has also served as a | ||
| Portfolio Manager of the Hennessy Cornerstone Growth Fund, | ||
| the Hennessy Cornerstone Mid Cap 30 Fund, the Hennessy | ||
| Cornerstone Large Growth Fund, and the Hennessy | ||
| Cornerstone Value Fund since February 2017 and as a Portfolio | ||
| Manager of the Hennessy Total Return Fund, the Hennessy | ||
| Balanced Fund, and the Hennessy Technology Fund since May | ||
| 2018. He served as Co-Portfolio Manager of the Hennessy | ||
| Technology Fund from February 2017 until May 2018. Mr. Kelley | ||
| served as Portfolio Manager of FBR Fund Advisers, Inc. from | ||
| January 2008 to October 2012. | ||
L. Joshua Wein(4) | September 2018 | Mr. Wein has been employed by Hennessy Advisors, Inc. since |
| 48 | 2018. He has served as Co-Portfolio Manager of the Hennessy | |
| Vice President and | Cornerstone Growth Fund, the Hennessy Cornerstone | |
| Co-Portfolio Manager | Mid Cap 30 Fund, the Hennessy Cornerstone Large Growth | |
| Fund, the Hennessy Cornerstone Value Fund, Hennessy Total | ||
| Return Fund, the Hennessy Balanced Fund, the Hennessy Gas | ||
| Utility Fund, and the Hennessy Technology Fund since February | ||
| 2019. He served as a Senior Analyst of these same funds from | ||
| September 2018 through February 2019. Mr. Wein served as | ||
| Director of Alternative Investments and Co-Portfolio Manager | ||
| at Sterling Capital Management from 2008 to 2018. |
_______________
(1) | Mr. Hennessy is considered an “interested person,” as defined in the Investment Company Act of 1940, as amended, because he is an officer of the Trust. |
(2) | The address of this officer is 4800 Bee Caves Road, Suite 100, Austin, TX 78746. |
(3) | The address of this officer is 101 Federal Street, Suite 1615B, Boston, MA 02110. |
(4) | The address of this officer is 1340 Environ Way, Chapel Hill, NC 27517. |
| HENNESSY FUNDS | 1-800-966-4354 |
29
Expense Example (Unaudited)
October 31, 2021
As a shareholder of the Fund, you incur ongoing costs, including management fees, service fees, and other Fund expenses. This Example is intended to help you understand your ongoing costs (in dollars) of investing in the Fund and to compare these costs with the ongoing costs of investing in other mutual funds. The Example is based on an investment of $1,000 invested at the beginning of the period and held for the entire period from May 1, 2021, through October 31, 2021.
Actual Expenses
In the table below, the first line under each of the “Investor Class” and “Institutional Class” headings provides information about actual account values and actual expenses for each share class. You may use this information, together with the amount you invested, to estimate the expenses that you paid over the period. Simply divide your account value by $1,000 (for example, an $8,600 account value divided by $1,000 = 8.6), then multiply the result by the number in the first line under the heading “Expenses Paid During Period” to estimate the expenses you paid on your account during this period. Although the Fund charges no sales loads or transaction fees, you will be assessed fees for outgoing wire transfers, returned checks, and stop payment orders at prevailing rates charged by U.S. Bank Global Fund Services, the Fund’s transfer agent. If you request that a redemption be made by wire transfer, the Fund’s transfer agent charges a $15 fee. IRAs are charged a $15 annual maintenance fee (up to $30 maximum per shareholder for shareholders with multiple IRAs). The examples below include, but are not limited to, management, shareholder servicing, accounting, custody, and transfer agent fees. However, the examples below do not include portfolio trading commissions and related expenses.
Hypothetical Example for Comparison Purposes
In the table below, the second line under each of the “Investor Class” and “Institutional Class” headings provides information about hypothetical account values and hypothetical expenses based on the Fund’s actual expense ratio for each share class and an assumed rate of return of 5% per year before expenses, which is not the Fund’s actual return for such share class. The hypothetical account values and expenses may not be used to estimate the actual ending account balance or expenses you paid for the period. You may use this information to compare the ongoing costs of investing in the Fund and other funds. To do so, compare these 5% hypothetical examples with the 5% hypothetical examples that appear in the shareholder reports of the other funds. Please note that the expenses shown in the table are meant to highlight your ongoing costs only. Therefore, the second lines under “Investor Class” and “Institutional Class” are useful in comparing ongoing costs only and will not help you determine the relative total costs of owning different funds.
| WWW.HENNESSYFUNDS.COM |
30
| EXPENSE EXAMPLE |
| Expenses Paid | |||
| Beginning | Ending | During Period(1) | |
| Account Value | Account Value | May 1, 2021 – | |
May 1, 2021 | October 31, 2021 | October 31, 2021 | |
| Investor Class | |||
| Actual | $1,000.00 | $1,061.30 | $7.48 |
| Hypothetical (5% return before expenses) | $1,000.00 | $1,017.95 | $7.32 |
| Institutional Class | |||
| Actual | $1,000.00 | $1,063.50 | $5.41 |
| Hypothetical (5% return before expenses) | $1,000.00 | $1,019.96 | $5.30 |
(1) | Expenses are equal to the Fund’s annualized expense ratio of 1.44% for Investor Class shares or 1.04% for Institutional Class shares, as applicable, multiplied by the average account value over the period, multiplied by 184/365 days (to reflect the half-year period). |
| HENNESSY FUNDS | 1-800-966-4354 |
31
How to Obtain a Copy of the Fund’s Proxy
Voting Policy and Proxy Voting Records
A description of the policies and procedures the Fund uses to determine how to vote proxies relating to portfolio securities is available without charge (1) by calling 1-800-966-4354, (2) on the Hennessy Funds’ website at www.hennessyfunds.com/proxy-voting/voting-policy, or (3) on the U.S. Securities and Exchange Commission’s (the “SEC”) website at www.sec.gov. The Fund’s proxy voting record is available without charge on both the Hennessy Funds’ website at www.hennessyfunds.com/proxy-voting/voting-record and the SEC’s website at www.sec.gov no later than August 31 for the prior 12 months ending June 30.
Availability of Quarterly Portfolio Schedule
The Fund files a complete schedule of portfolio holdings with the SEC for the first and third quarters of each fiscal year as an exhibit to its reports on Form N-PORT. The Fund’s Form N-PORT reports are available on the SEC’s website at www.sec.gov or on request by calling 1-800-966-4354.
Federal Tax Distribution Information (Unaudited)
For fiscal year 2021, certain dividends paid by the Fund may be subject to a maximum tax rate of 23.8%, as provided for by the Jobs and Growth Tax Relief Reconciliation Act of 2003. The percentage of dividends declared from ordinary income designated as qualified dividend income was 69.62%.
For corporate shareholders, the percent of ordinary income distributions that qualified for the corporate dividends received deduction for fiscal year 2021 was 0.00%.
The percentage of taxable ordinary income distributions that were designated as short-term capital gain distributions under Section 871(k)(2)(C) of the Internal Revenue Code of 1986, as amended, for the Fund was 0.00%.
For the year ended October 31, 2021, the Fund earned foreign-source income and paid foreign taxes as noted below, which it intends to pass through to its shareholders pursuant to Section 853 of the Internal Revenue Code.
Gross Foreign Income | Foreign Tax Paid | ||
| Japan | $9,097,931 | $909,789 |
Important Notice Regarding Delivery of
Shareholder Documents
To help keep the Fund’s costs as low as possible, we generally deliver a single copy of shareholder reports, proxy statements, and prospectuses to shareholders who share an address and have the same last name. This process does not apply to account statements. You may request an individual copy of a shareholder document at any time. If you would like to receive separate mailings of shareholder documents, please call U.S. Bank Global Fund Services at 1-800-261-6950 or 1-414-765-4124, and individual delivery will begin within 30 days of your request. If your account is held through a financial institution or other intermediary, please contact such intermediary directly to request individual delivery.
| WWW.HENNESSYFUNDS.COM |
32
| PROXY VOTING — LIQUIDITY RISK MANAGEMENT PROGRAM |
Electronic Delivery
As permitted by SEC regulations, the Fund’s shareholder reports are made available on a website, and unless you sign up for eDelivery or elect to receive paper copies as detailed below, you will be notified by mail each time a report is posted and provided with a website link to access the report.
The Fund also offers shareholders the option to receive all notices, account statements, prospectuses, tax forms, and shareholder reports online. To sign up for eDelivery or change your delivery preference, please visit www.hennessyfunds.com/account.
To elect to receive paper copies of all future reports free of charge, please call U.S. Bank Global Fund Services at 1-800-261-6950 or 1-414-765-4124.
Subscribe to receive our team’s unique market and sector insights delivered to your inbox
www.hennessyfunds.com/subscribe
Follow us on social media
| | |
Liquidity Risk Management Program
In accordance with Rule 22e-4 under the Investment Company Act of 1940, as amended (the “Liquidity Rule”), we have adopted and implemented a liquidity risk management program (the “Liquidity Program”). The purpose of the Liquidity Program is to assess and manage the Fund’s liquidity risk, which is the risk that the Fund would not be able to meet requests to redeem Fund shares without significant dilution of the remaining shareholders’ interests in the Fund. The Board of Trustees of the Fund (the “Board”) designated a committee comprising representatives of Hennessy Advisors, Inc., the investment adviser to the Fund, as the administrator of the Liquidity Program (the “Program Administrator”).
The Program Administrator provided a written report regarding the Liquidity Program to the Board in advance of its meeting on June 2, 2021. The report covered the period from June 1, 2020, through May 31, 2021. The report addressed the operation of the Liquidity Program, assessed the adequacy and effectiveness of its implementation, and described any material changes to the Liquidity Program during the review period. The Trust’s chief compliance officer presented the report to the Board at the meeting and provided additional information regarding the Liquidity Program. The Board reviewed the Liquidity Program and considered, among other items, the following:
| 1. | The Program Administrator reviewed daily historical net redemption activity during the review period and during prior periods with higher-than-average redemption activity and concluded that the Fund has historically been able to meet requests to redeem Fund shares without significant dilution to the Fund’s remaining shareholders, and the Program Administrator expects the Fund to be able to continue to do so in the future during both normal and reasonably foreseeable stressed conditions. | |
| 2. | The Fund holds assets that are highly liquid investments and is therefore not required to establish a highly liquid investment minimum for the Fund or adopt policies and procedures for responding to a highly liquid investment minimum shortfall. |
| HENNESSY FUNDS | 1-800-966-4354 |
33
| 3. | The Program Administrator did not make any material changes to the Liquidity Program during the review period and did not recommend any changes to the Liquidity Program or the model inputs used to determine the liquidity classification of each security held by the Fund. | |
| 4. | The Program Administrator concluded that the Liquidity Program was reasonably designed to assess and manage the Fund’s liquidity risk, complies with the requirements of the Liquidity Rule, and was operating as intended during the review period. |
Privacy Policy
We collect the following personal information about you:
| 1. | Information we receive from you in applications or other forms, correspondence, or conversations, including, but not limited to, your name, address, phone number, social security number, assets, income, and date of birth; | |
| 2. | Information about your transactions with us, our affiliates, or others, including, but not limited to, your account number and balance, payments history, parties to transactions, cost basis information, and other financial information; and | |
| 3. | Other personal information we collect from various sources, even if you have not entered into a prior transaction with us, including the following: |
| • | Name, alias, address, unique personal identifier, online identifier, IP address, email address, telephone number, account name, and other similar identifiers; | |
| • | Age and marital status; | |
| • | Commercial information, including records of products purchased; | |
| • | Browsing history, search history, and information on interaction with our website; | |
| • | Geolocation data; | |
| • | Employment and employment history, educational history, financial information, and purchasing and consuming histories or tendencies; and | |
| • | Inferences drawn from the above-listed information to create a profile about your preferences, characteristics, predispositions, and behavior. |
We collect this information directly from you, indirectly in the course of providing services to you, directly and indirectly from your activity on our website, from broker dealers, marketing agencies, and other third parties that interact with us in connection with the services we perform and products we offer, and from anonymized and aggregated consumer information.
We use this information to fulfill the reason you provided the information to us, to provide you with other relevant products that you request from us, to provide you with information about products that may interest you, to improve our website or present our website’s contents to you, and as otherwise described to you when collecting your personal information.
We do not disclose any personal information to unaffiliated third parties, except as permitted by law. We may disclose your personal information to our affiliates, vendors, and service providers for a business purpose. For example, we are permitted by law to disclose all of the information we collect, as described above, to our transfer agent to process your transactions. When disclosing your personal information to third parties,
| WWW.HENNESSYFUNDS.COM |
34
| LIQUIDITY RISK MANAGEMENT PROGRAM — PRIVACY POLICY |
we enter into a contract with each third party describing the purpose of such disclosure and requiring that such personal information be kept confidential and not used for any purpose except to perform the services contracted or respond to regulatory or law enforcement requests.
Furthermore, we restrict access to your personal information to those persons who require such information to provide products or services to you. As a result, we do not provide a means for opting out of our limited sharing of your information. We maintain physical, electronic, and procedural safeguards that comply with federal standards to guard your personal information.
If you hold shares of the Funds through a financial intermediary, including, but not limited to, a broker-dealer, bank, or trust company, the privacy policy of your financial intermediary governs how your personal information is shared with unaffiliated third parties.
Supplemental Privacy Notice for Residents of California
The California Consumer Privacy Act of 2018 (the “CCPA”) provides you, as a California resident, with certain additional rights relating to your personal information.
Under the CCPA, you have the right to request that we disclose to you the categories of personal information we have collected about you over the past 12 months, the categories of sources of such information, our business purpose for collecting the information, the categories of third parties, if any, with whom we shared the information, and the specific information we have collected about you. You also have the right to request that we delete any of your personal information, and, unless an exception applies, we will delete such information upon receiving and confirming your request. To make a request, call us at 1-800-966-4354, email us at privacy@hennessyfunds.com, or go to www.hennessyfunds.com/contact. We will not discriminate against you for exercising your rights under the CCPA. Further, we will not collect additional categories of your personal information or use the personal information we collected for materially different, unrelated, or incompatible purposes without providing you notice.
| HENNESSY FUNDS | 1-800-966-4354 |
35
(This Page Intentionally Left Blank.)
For information, questions, or assistance, please call
The Hennessy Funds
1-800-966-4354 or 1-415-899-1555
INVESTMENT ADVISOR
Hennessy Advisors, Inc.
7250 Redwood Boulevard, Suite 200
Novato, California 94945
ADMINISTRATOR,
TRANSFER AGENT,
DIVIDEND PAYING AGENT, &
SHAREHOLDER SERVICING AGENT
U.S. Bancorp Fund Services, LLC
d/b/a U.S. Bank Global Fund Services
P.O. Box 701
Milwaukee, Wisconsin 53201-0701
CUSTODIAN
U.S. Bank N.A.
Custody Operations
1555 North River Center Drive, Suite 302
Milwaukee, Wisconsin 53212
TRUSTEES
Neil J. Hennessy
Robert T. Doyle
J. Dennis DeSousa
Claire Garvie
Gerald P. Richardson
COUNSEL
Foley & Lardner LLP
777 East Wisconsin Avenue
Milwaukee, Wisconsin 53202-5306
INDEPENDENT REGISTERED
PUBLIC ACCOUNTING FIRM
Tait, Weller & Baker LLP
Two Liberty Place
50 South 16th Street, Suite 2900
Philadelphia, Pennsylvania 19102-2529
DISTRIBUTOR
Quasar Distributors, LLC
111 East Kilbourn Avenue, Suite 2200
Milwaukee, Wisconsin 53202
www.hennessyfunds.com | 1-800-966-4354
This report has been prepared for shareholders and may be distributed to
others only if preceded or accompanied by a current prospectus.
ANNUAL REPORT
OCTOBER 31, 2021

HENNESSY JAPAN SMALL CAP FUND
Investor Class HJPSX
Institutional Class HJSIX
(This Page Intentionally Left Blank.)
Contents
| Letter to Shareholders | 2 |
| Performance Overview | 4 |
| Financial Statements | |
| Schedule of Investments | 7 |
| Statement of Assets and Liabilities | 12 |
| Statement of Operations | 13 |
| Statements of Changes in Net Assets | 15 |
| Financial Highlights | 16 |
| Notes to the Financial Statements | 20 |
| Report of Independent Registered Public Accounting Firm | 28 |
| Trustees and Officers of the Fund | 29 |
| Expense Example | 32 |
| Proxy Voting Policy and Proxy Voting Records | 34 |
| Availability of Quarterly Portfolio Schedule | 34 |
| Federal Tax Distribution Information | 34 |
| Important Notice Regarding Delivery of Shareholder Documents | 34 |
| Electronic Delivery | 35 |
| Liquidity Risk Management Program | 35 |
| Privacy Policy | 36 |
| HENNESSY FUNDS | 1-800-966-4354 |
November 2021
Dear Hennessy Funds Shareholder:
The Japanese stock market gained 18.62% as measured by the Tokyo Stock Price Index (TOPIX) over the 12-month period ended October 31, 2021 (in U.S. dollar terms).
While progress in vaccine administration and the broader global economic recovery supported the Japanese stock market throughout the period, concerns about rising interest rates in line with global inflation and waves of COVID-19 infections weighed down the market. Overall, small-cap and mid-cap stocks underperformed large-cap stocks, with large-cap stocks continuing to drive market performance partly due to the slower recovery of domestic demand in Japan compared to other countries.
Inflation has been a buzzword since the start of 2021. In our April 2021 shareholder letter, we commented that it was hard to imagine inflation taking hold in our domestic economy at that point in time. However, over the past several months, various supply issues have been compounding like never before, including supply chain disruptions, semiconductor shortages, energy and commodity price increases, labor inflation triggered by worker shortages, sharply increased employee safety costs to protect against COVID-19, and wage pressure due to workers’ strikes. Of these factors, wage pressure is a particularly concerning trend. If history is any guide, once inflation starts to accelerate, real wages erode, giving rise to worker protests in the hope of higher pay. These costs, in turn, get passed on to the prices of final products and services, further curbing real wage growth. Workers are left dissatisfied and demand additional pay increases, continuing the vicious cycle.
We also believe that the ongoing trend towards Environmental, Social, and Governance investing along with various environmental protection initiatives on a global scale adds to long-term inflationary pressure, as these activities inevitably increase the costs of doing business. At the same time as companies are becoming increasingly concerned about the environment and human rights, supply constraints are occurring, raising material prices and electricity and gas prices. Consequently, even as prices rise, market mechanisms struggle to encourage suppliers to increase their capacity, which could mean that the supply shortage may persist for some time.
While we do not make investment decisions based solely on economic forecasts, price trends significantly impact corporate fundamentals. As a result, we remain mindful of long-term inflation scenarios when conducting our research. For example, we look to invest in companies that we believe are capable of adequately coping with changing conditions and to avoid investing in companies where we believe a sharp rise in prices might lead to significant deterioration in business performance. Specifically, we focus on whether a company has a high profit margin, whether a rise in procurement prices will immediately lead to a loss, and whether the company can pass on a rise in procurement prices to sales prices through its strength in price negotiations.
With the vaccination progress so far, the number of people testing positive for COVID-19 has plummeted, leading to the lifting of the state of emergency and fueling expectations for future economic recovery in Japan. The end of the Japanese House of Representatives election, which previously was a source of uncertainty, and the Liberal Democratic Party (LDP) maintaining a stable majority have brought a sense of stability back to the stock market. We believe that the market will continue to perform well
| WWW.HENNESSYFUNDS.COM |
2
| LETTER TO SHAREHOLDERS |
through the end of calendar year 2021. On the one hand, risks include concerns about a failing Chinese economy, the continued rise in oil and other commodity prices, and rising overseas interest rates. On the other hand, the high savings rate over the past two years suggests that there is much room for recovery, especially in domestic consumption. We remain optimistic about the long-term prospects for Japan and its stock market.
Thank you for your continued confidence and investment in the Hennessy Funds.
Sincerely,
| |
| Tadahiro Fujimura | Masakazu Takeda |
| Portfolio Manager, | Portfolio Manager, |
| Hennessy Japan Small Cap Fund; | Hennessy Japan Fund; |
| Chief Investment Officer | Fund Manager |
| SPARX Asset Management Co., Ltd. | SPARX Asset Management Co., Ltd. |
SPARX Asset Management Co., Ltd., located in Tokyo, Japan, is the sub-advisor to the Hennessy Japan Fund and the Hennessy Japan Small Cap Fund.
Past performance does not guarantee future results.
Mutual fund investing involves risk. Principal loss is possible.
Opinions expressed are those of Tadahiro Fujimura and Masakazu Takeda and are subject to change, are not guaranteed, and should not be considered investment advice.
The Tokyo Stock Price Index (TOPIX) is a capitalization-weighted index of all of the companies listed on the First Section of the Tokyo Stock Exchange. The index is used herein for comparative purposes in accordance with SEC regulations. One cannot invest directly in an index.
| HENNESSY FUNDS | 1-800-966-4354 |
3
Performance Overview (Unaudited)
CHANGE IN VALUE OF $10,000 INVESTMENT
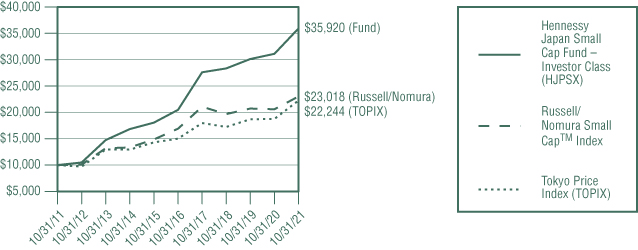
This graph illustrates the performance of an initial investment of $10,000 made in the Fund 10 years ago and assumes the reinvestment of dividends and capital gains.
AVERAGE ANNUAL TOTAL RETURN FOR PERIODS ENDED OCTOBER 31, 2021
| One | Five | Ten | ||
Year | Years | Years | ||
| Hennessy Japan Small Cap Fund – | ||||
| Investor Class (HJPSX) | 15.46% | 11.89% | 13.64% | |
| Hennessy Japan Small Cap Fund – | ||||
Institutional Class (HJSIX)(1) | 15.90% | 12.32% | 13.90% | |
Russell/Nomura Small CapTM Index | 11.80% | 6.37% | 8.69% | |
| Tokyo Stock Price Index (TOPIX) | 18.62% | 8.18% | 8.32% |
Expense ratios: 1.55% (Investor Class); 1.13% (Institutional Class)
(1) | The inception date of Institutional Class shares is June 15, 2015. Performance shown prior to the inception of Institutional Class shares reflects the performance of Investor Class shares and includes expenses that are not applicable to, and are higher than, those of Institutional Class shares. |
Performance data quoted represents past performance; past performance does not guarantee future results. The investment return and principal value of an investment will fluctuate so that an investor’s shares, when redeemed, may be worth more or less than their original cost. The performance table does not reflect the deduction of taxes that a shareholder would pay on Fund distributions or the redemption of Fund shares. Current performance of the Fund may be lower or higher than the performance quoted. Performance data current to the most recent month end may be obtained by visiting www.hennessyfunds.com.
The Russell/Nomura Small Cap™ Index contains the bottom 15% of the Russell/Nomura Total Market™ Index based on market capitalization. The Tokyo Stock Price Index (TOPIX) is a capitalization- weighted index of all of the companies listed on the First Section of the Tokyo Stock Exchange. One cannot invest directly in an index. These indices are used for comparative purposes in accordance with Securities and Exchange Commission regulations.
Frank Russell Company (“Russell”) is the source and owner of the trademarks, service marks, and copyrights related to the Russell Indexes. Russell® is a trademark of Frank Russell Company. Neither Russell nor its licensors accept any liability for any errors or omissions in the Russell Indexes or Russell ratings or underlying data and no party may rely on any
| WWW.HENNESSYFUNDS.COM |
4
| PERFORMANCE OVERVIEW |
Russell Indexes or Russell ratings or underlying data contained in this communication. No further distribution of Russell data is permitted without Russell’s express written consent. Russell does not promote, sponsor, or endorse the content of this communication.
The expense ratios presented are from the most recent prospectus. The expense ratios for the current reporting period are available in the Financial Highlights section of this report.
PERFORMANCE NARRATIVE
Portfolio Managers Tadahiro Fujimura, CFA and CMA*, and Takenari Okumura, CMA*
SPARX Asset Management Co., Ltd. (sub-advisor)
Performance:
For the one-year period ended October 31, 2021, the Investor Class of the Hennessy Japan Small Cap Fund returned 15.46%, outperforming the Russell/Nomura Small Cap™ Index (the Fund’s primary benchmark), which returned 11.80%, but underperforming the Tokyo Stock Price Index (TOPIX), which returned 18.62%, for the same period in U.S. dollar terms.
While progress in vaccine administration and economic recovery supported the Japanese stock market throughout the one-year period ended October 31, 2021, concerns about rising interest rates in line with global inflation and waves of COVID-19 infections also weighed down the overall market. The market rallied in September based on the expectation of favorable governmental policy following Prime Minister Suga’s resignation. Small-cap and mid-cap stocks underperformed large-cap stocks, as large-cap stocks continued to be dragged down due to slower recovery of domestic demand in Japan compared to other countries.
In terms of individual stocks, the share price of Benefit One, Inc., an employee benefits outsourcing contractor, rose due to additional revenue from vaccinations and other services, driving robust performance and increased growth expectations from new services. Automotive parts manufacturer Musashi Seimitsu Industry Co., Ltd. saw its share price rise due to expectations for future growth in the electric vehicle parts business. Additionally, recycler and biomass power plant operator Takeei Corporation (predecessor in interest to TRE Holdings Corp.) also saw its share price rise based on market expectations of synergistic effects from the firm’s merger with a competitor.
One of the stocks that detracted most from Fund performance was personal computer and smartphone accessory seller Elecom Co., Ltd. The company’s share price dropped due to concerns about its ability to build on the significant growth it experienced under last year’s telecommuting boom. Internet-based life insurance provider Lifenet Insurance Company also saw its share price decline in response to profit taking following significant gains due to robust internet sales amid the COVID-19 pandemic. Housing loan service provider Aruhi Corporation performed poorly in reaction to slowing growth expectations.
The Fund continues to hold all the companies mentioned.
Portfolio Strategy and Investment Commentary:
Concerns about rising interest rates, which had been on an uptick, have calmed as tapering efforts have come into play. Inflationary pressures hitting a peak has also had a positive impact on the market. Nevertheless, the slow economic recovery from COVID-19 in China and the United States has added new fuel to stoke market fears. Meanwhile, domestic demand in Japan is on track to recover after suffering from new waves of COVID-19 infections and delays in construction due to hosting the Olympics. However, Japan’s room
| HENNESSY FUNDS | 1-800-966-4354 |
5
for recovery appears higher than that of other countries. Under these circumstances, the Japanese stock market could very well undergo a partial correction toward the end of the calendar year, triggered by the establishment of a new administration, and due to sentiments that the market is undervalued and offers more stability compared to other countries. We believe that many small-cap and mid-cap domestic-demand stocks and cyclicals are undervalued and have plenty of room for share price increases.
_______________
* Chartered Member of the Security Analysts Association of Japan
Opinions expressed are those of the Portfolio Managers as of the date written and are subject to change, are not guaranteed, and should not be considered investment advice or an indication of trading intent.
The Fund invests in small-capitalization and medium-capitalization companies, which may have more limited liquidity and greater price volatility than large-capitalization companies. The Fund invests in the stocks of companies operating in Japan; single-country funds may be subject to a higher degree of risk. The Fund may experience higher fees due to investments in pooled investment vehicles (including ETFs). Please see the Fund’s prospectus for a more complete discussion of these and other risks.
References to specific securities should not be considered a recommendation to buy or sell any security. Fund holdings and sector allocations are subject to change. Please refer to the Schedule of Investments included in this report for additional portfolio information.
| WWW.HENNESSYFUNDS.COM |
6
| PERFORMANCE OVERVIEW/SCHEDULE OF INVESTMENTS |
Financial Statements
Schedule of Investments as of October 31, 2021 |
HENNESSY JAPAN SMALL CAP FUND
(% of Net Assets)
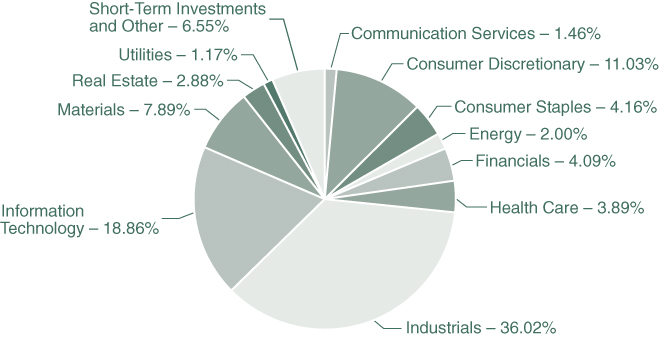
| TOP TEN HOLDINGS (EXCLUDING MONEY MARKET FUNDS) | % NET ASSETS |
| TRE Holdings Corp. | 2.58% |
| Benefit One, Inc. | 2.27% |
| SBS Holdings, Inc. | 2.14% |
| Nippon Koei Co., Ltd. | 2.11% |
| MIRAIT Holdings Corp. | 2.09% |
| Saizeriya Co., Ltd. | 2.08% |
| Digital Garage, Inc. | 2.06% |
| Nishimoto Co., Ltd. | 2.05% |
| Iwatani Corp. | 2.00% |
| Hito Communications Holdings, Inc. | 1.99% |
Note: For presentation purposes, the Fund has grouped some of the industry categories. For purposes of categorizing securities for compliance with Section 8(b)(1) of the Investment Company Act of 1940, as amended, the Fund uses more specific industry classifications.
The Global Industry Classification Standard (GICS®) was developed by and is the exclusive property and a service mark of MSCI, Inc. and Standard & Poor’s Financial Services LLC. It has been licensed for use by the Hennessy Funds.
| HENNESSY FUNDS | 1-800-966-4354 |
7
| COMMON STOCKS – 93.45% | Number | % of | ||||||||||
| of Shares | Value | Net Assets | ||||||||||
| Communication Services – 1.46% | ||||||||||||
| Septeni Holdings Co., Ltd. | 390,200 | $ | 1,646,823 | 1.46 | % | |||||||
| Consumer Discretionary – 11.03% | ||||||||||||
| Benesse Holdings, Inc. | 70,000 | 1,601,473 | 1.42 | % | ||||||||
| Matsuoka Corp. | 57,900 | 695,296 | 0.62 | % | ||||||||
| Musashi Seimitsu Industry Co., Ltd. | 112,700 | 2,121,139 | 1.88 | % | ||||||||
| NGK Spark Plug Co., Ltd. | 98,500 | 1,573,538 | 1.40 | % | ||||||||
| Nojima Corp. | 52,300 | 1,146,993 | 1.02 | % | ||||||||
| Sac’s Bar Holdings, Inc. | 165,700 | 801,805 | 0.71 | % | ||||||||
| Saizeriya Co., Ltd. | 87,000 | 2,348,444 | 2.08 | % | ||||||||
| Seiren Co., Ltd. | 106,400 | 2,147,396 | 1.90 | % | ||||||||
| 12,436,084 | 11.03 | % | ||||||||||
| Consumer Staples – 4.16% | ||||||||||||
| Cosmos Pharmaceutical Corp. | 10,200 | 1,558,735 | 1.38 | % | ||||||||
| Nishimoto Co., Ltd. | 61,700 | 2,304,415 | 2.05 | % | ||||||||
| Yoshimura Food Holdings KK (a) | 118,900 | 822,530 | 0.73 | % | ||||||||
| 4,685,680 | 4.16 | % | ||||||||||
| Energy – 2.00% | ||||||||||||
| Iwatani Corp. | 38,100 | 2,250,393 | 2.00 | % | ||||||||
| Financials – 4.09% | ||||||||||||
| AEON Financial Service Co., Ltd. | 110,500 | 1,403,917 | 1.25 | % | ||||||||
| Aruhi Corp. | 60,600 | 702,575 | 0.62 | % | ||||||||
| Lifenet Insurance Co. (a) | 82,200 | 818,845 | 0.73 | % | ||||||||
| Musashino Bank Ltd. | 107,000 | 1,680,733 | 1.49 | % | ||||||||
| 4,606,070 | 4.09 | % | ||||||||||
| Health Care – 3.89% | ||||||||||||
| Nihon Kohden Corp. | 69,700 | 2,217,803 | 1.97 | % | ||||||||
| Ship Healthcare Holdings, Inc. | 82,500 | 2,166,975 | 1.92 | % | ||||||||
| 4,384,778 | 3.89 | % | ||||||||||
| Industrials – 36.02% | ||||||||||||
| Benefit One, Inc. | 50,800 | 2,563,702 | 2.27 | % | ||||||||
| Creek & River Co., Ltd. | 117,100 | 2,022,318 | 1.79 | % | ||||||||
| Daihen Corp. | 40,900 | 1,707,224 | 1.52 | % | ||||||||
| Fugi Corp. | 70,700 | 1,649,153 | 1.46 | % | ||||||||
| Glory Ltd. | 52,400 | 1,127,924 | 1.00 | % | ||||||||
The accompanying notes are an integral part of these financial statements.
| WWW.HENNESSYFUNDS.COM |
8
| SCHEDULE OF INVESTMENTS |
| COMMON STOCKS | Number | % of | ||||||||||
| of Shares | Value | Net Assets | ||||||||||
| Industrials (Continued) | ||||||||||||
| Hanwa Co., Ltd. | 74,200 | $ | 2,228,860 | 1.98 | % | |||||||
| Hito Communications Holdings, Inc. | 116,000 | 2,241,773 | 1.99 | % | ||||||||
| Kawada Technologies, Inc. | 15,000 | 518,623 | 0.46 | % | ||||||||
| Kito Corp. | 131,700 | 1,824,979 | 1.62 | % | ||||||||
| METAWATER Co., Ltd. | 1,100 | 18,613 | 0.02 | % | ||||||||
| MIRAIT Holdings Corp. | 122,700 | 2,359,856 | 2.09 | % | ||||||||
| Mitsubishi Logisnext Co., Ltd. | 200,900 | 1,847,539 | 1.64 | % | ||||||||
| Nichiha Corp. | 52,700 | 1,514,954 | 1.34 | % | ||||||||
| Nihon Flush Co., Ltd. | 59,900 | 568,398 | 0.50 | % | ||||||||
| Nippon Koei Co., Ltd. | 78,200 | 2,375,077 | 2.11 | % | ||||||||
| Sato Holdings Corp. | 96,600 | 2,226,601 | 1.98 | % | ||||||||
| SBS Holdings, Inc. | 67,900 | 2,415,773 | 2.14 | % | ||||||||
| Senko Group Holdings Co., Ltd. | 211,200 | 1,878,547 | 1.67 | % | ||||||||
| Tadano Ltd. | 100,000 | 1,092,007 | 0.97 | % | ||||||||
| Tanseisha Co., Ltd. | 203,900 | 1,672,087 | 1.48 | % | ||||||||
| Tocalo Co., Ltd. | 150,700 | 1,848,011 | 1.64 | % | ||||||||
| TRE Holdings Corp. (a) | 184,900 | 2,907,136 | 2.58 | % | ||||||||
| Tsubakimoto Chain Co. | 32,400 | 957,334 | 0.85 | % | ||||||||
| Ushio, Inc. | 58,000 | 1,037,643 | 0.92 | % | ||||||||
| 40,604,132 | 36.02 | % | ||||||||||
| Information Technology – 18.86% | ||||||||||||
| Bell System24 Holdings, Inc. | 94,000 | 1,207,669 | 1.07 | % | ||||||||
| Digital Garage, Inc. | 49,600 | 2,317,015 | 2.06 | % | ||||||||
| Elecom Co., Ltd. | 108,900 | 1,665,689 | 1.48 | % | ||||||||
| Macnica Fuji Electronics Holdings, Inc. | 77,200 | 1,814,947 | 1.61 | % | ||||||||
| Mimaki Engineering Co., Ltd. | 271,500 | 2,220,428 | 1.97 | % | ||||||||
| Nihon Unisys Ltd. | 70,800 | 1,989,252 | 1.76 | % | ||||||||
| Nippon Signal Company, Ltd. | 155,000 | 1,340,355 | 1.19 | % | ||||||||
| Poletowin Pitcrew Holdings, Inc. | 140,300 | 1,265,044 | 1.12 | % | ||||||||
| SIIX Corp. | 128,500 | 1,423,516 | 1.26 | % | ||||||||
| Towa Corp. | 82,800 | 1,803,397 | 1.60 | % | ||||||||
| Transcosmos, Inc. | 71,100 | 2,143,816 | 1.90 | % | ||||||||
| Yamaichi Electronics Co., Ltd. | 135,000 | 2,072,641 | 1.84 | % | ||||||||
| 21,263,769 | 18.86 | % | ||||||||||
The accompanying notes are an integral part of these financial statements.
| HENNESSY FUNDS | 1-800-966-4354 |
9
| COMMON STOCKS | Number | % of | ||||||||||
| of Shares | Value | Net Assets | ||||||||||
| Materials – 7.89% | ||||||||||||
| Asia Pile Holdings Corp. | 400,700 | $ | 1,630,524 | 1.44 | % | |||||||
| Kyoei Steel Ltd. | 133,200 | 1,643,545 | 1.46 | % | ||||||||
| Rengo Co., Ltd. | 224,100 | 1,699,379 | 1.51 | % | ||||||||
| Sanyo Chemical Industries Ltd. | 45,000 | 2,228,164 | 1.98 | % | ||||||||
| Tokyo Ohka Kogyo Co., Ltd. | 26,700 | 1,697,437 | 1.50 | % | ||||||||
| 8,899,049 | 7.89 | % | ||||||||||
| Real Estate – 2.88% | ||||||||||||
| Star Mica Holdings Co., Ltd. | 144,100 | 1,907,299 | 1.69 | % | ||||||||
| Tosei Corp. | 138,700 | 1,333,294 | 1.19 | % | ||||||||
| 3,240,593 | 2.88 | % | ||||||||||
| Utilities – 1.17% | ||||||||||||
| EF-ON, Inc. | 179,900 | 1,316,670 | 1.17 | % | ||||||||
| Total Common Stocks | ||||||||||||
| (Cost $87,615,398) | 105,334,041 | 93.45 | % | |||||||||
| SHORT-TERM INVESTMENTS – 9.29% | ||||||||||||
| Money Market Funds – 9.29% | ||||||||||||
| First American Government Obligations Fund, | ||||||||||||
| Institutional Class, 0.03% (b) | 5,586,000 | 5,586,000 | 4.95 | % | ||||||||
| First American Treasury Obligations Fund, | ||||||||||||
| Institutional Class, 0.01% (b) | 4,890,808 | 4,890,808 | 4.34 | % | ||||||||
| 10,476,808 | 9.29 | % | ||||||||||
| Total Short-Term Investments | ||||||||||||
| (Cost $10,476,808) | 10,476,808 | 9.29 | % | |||||||||
| Total Investments | ||||||||||||
| (Cost $98,092,206) – 102.74% | 115,810,849 | 102.74 | % | |||||||||
| Liabilities in Excess of Other Assets – (2.74)% | (3,083,709 | ) | (2.74 | )% | ||||||||
TOTAL NET ASSETS – 100.00% | $ | 112,727,140 | 100.00 | % | ||||||||
Percentages are stated as a percent of net assets.
| (a) | Non-income-producing security. |
| (b) | The rate listed is the fund’s seven-day yield as of October 31, 2021. |
The accompanying notes are an integral part of these financial statements.
| WWW.HENNESSYFUNDS.COM |
10
| SCHEDULE OF INVESTMENTS |
Summary of Fair Value Exposure as of October 31, 2021
The following is a summary of the inputs used to value the Fund’s net assets as of October 31, 2021 (see Note 3 in the accompanying Notes to the Financial Statements):
| Common Stocks | Level 1 | Level 2 | Level 3 | Total | ||||||||||||
| Communication Services | $ | — | $ | 1,646,823 | $ | — | $ | 1,646,823 | ||||||||
| Consumer Discretionary | — | 12,436,084 | — | 12,436,084 | ||||||||||||
| Consumer Staples | — | 4,685,680 | — | 4,685,680 | ||||||||||||
| Energy | — | 2,250,393 | — | 2,250,393 | ||||||||||||
| Financials | — | 4,606,070 | — | 4,606,070 | ||||||||||||
| Health Care | — | 4,384,778 | — | 4,384,778 | ||||||||||||
| Industrials | 2,907,136 | 37,696,996 | — | 40,604,132 | ||||||||||||
| Information Technology | — | 21,263,769 | — | 21,263,769 | ||||||||||||
| Materials | — | 8,899,049 | — | 8,899,049 | ||||||||||||
| Real Estate | — | 3,240,593 | — | 3,240,593 | ||||||||||||
| Utilities | — | 1,316,670 | — | 1,316,670 | ||||||||||||
| Total Common Stocks | $ | 2,907,136 | $ | 102,426,905 | $ | — | $ | 105,334,041 | ||||||||
| Short-Term Investments | ||||||||||||||||
| Money Market Funds | $ | 10,476,808 | $ | — | $ | — | $ | 10,476,808 | ||||||||
| Total Short-Term Investments | $ | 10,476,808 | $ | — | $ | — | $ | 10,476,808 | ||||||||
| Total Investments | $ | 13,383,944 | $ | 102,426,905 | $ | — | $ | 115,810,849 | ||||||||
The accompanying notes are an integral part of these financial statements.
| HENNESSY FUNDS | 1-800-966-4354 |
11
Financial Statements
Statement of Assets and Liabilities as of October 31, 2021 |
| ASSETS: | ||||
| Investments in securities, at value (cost $98,092,206) | $ | 115,810,849 | ||
| Dividends and interest receivable | 635,534 | |||
| Receivable for fund shares sold | 1,020,763 | |||
| Receivable for securities sold | 346,149 | |||
| Prepaid expenses and other assets | 2,005 | |||
| Total assets | 117,815,300 | |||
| LIABILITIES: | ||||
| Payable for securities purchased | 4,884,542 | |||
| Payable for fund shares redeemed | 36,215 | |||
| Payable to advisor | 73,182 | |||
| Payable to administrator | 31,919 | |||
| Payable to auditor | 22,556 | |||
| Accrued distribution fees | 10,426 | |||
| Accrued service fees | 3,915 | |||
| Accrued trustees fees | 6,593 | |||
| Accrued expenses and other payables | 18,812 | |||
| Total liabilities | 5,088,160 | |||
| NET ASSETS | $ | 112,727,140 | ||
| NET ASSETS CONSISTS OF: | ||||
| Capital stock | $ | 94,337,513 | ||
| Total distributable earnings | 18,389,627 | |||
| Total net assets | $ | 112,727,140 | ||
| NET ASSETS: | ||||
| Investor Class | ||||
| Shares authorized (no par value) | Unlimited | |||
| Net assets applicable to outstanding shares | $ | 46,145,878 | ||
| Shares issued and outstanding | 2,547,196 | |||
| Net asset value, offering price, and redemption price per share | $ | 18.12 | ||
| Institutional Class | ||||
| Shares authorized (no par value) | Unlimited | |||
| Net assets applicable to outstanding shares | $ | 66,581,262 | ||
| Shares issued and outstanding | 3,710,895 | |||
| Net asset value, offering price, and redemption price per share | $ | 17.94 | ||
The accompanying notes are an integral part of these financial statements.
| WWW.HENNESSYFUNDS.COM |
12
| STATEMENT OF ASSETS AND LIABILITIES/STATEMENT OF OPERATIONS |
Financial Statements
Statement of Operations for the year ended October 31, 2021 |
| INVESTMENT INCOME: | ||||
Dividend income(1) | $ | 1,707,157 | ||
| Interest income | 1,692 | |||
| Total investment income | 1,708,849 | |||
| EXPENSES: | ||||
| Investment advisory fees (See Note 5) | 792,514 | |||
| Sub-transfer agent expenses – Investor Class (See Note 5) | 113,419 | |||
| Sub-transfer agent expenses – Institutional Class (See Note 5) | 39,512 | |||
| Administration, accounting, custody, and transfer agent fees (See Note 5) | 119,757 | |||
| Distribution fees – Investor Class (See Note 5) | 74,773 | |||
| Service fees – Investor Class (See Note 5) | 49,849 | |||
| Federal and state registration fees | 29,498 | |||
| Compliance expense (See Note 5) | 27,448 | |||
| Audit fees | 22,556 | |||
| Trustees’ fees and expenses | 19,012 | |||
| Reports to shareholders | 12,824 | |||
| Legal fees | 1,624 | |||
| Other expenses | 13,375 | |||
| Total expenses | 1,316,161 | |||
| NET INVESTMENT INCOME | $ | 392,688 | ||
| REALIZED AND UNREALIZED GAINS (LOSSES): | ||||
| Net realized gain on investments | $ | 1,288,362 | ||
| Net change in unrealized appreciation/depreciation on investments | 10,917,876 | |||
| Net gain on investments | 12,206,238 | |||
| NET INCREASE IN NET ASSETS RESULTING FROM OPERATIONS | $ | 12,598,926 | ||
(1) | Net of foreign taxes withheld of $189,684. |
The accompanying notes are an integral part of these financial statements.
| HENNESSY FUNDS | 1-800-966-4354 |
13
(This Page Intentionally Left Blank.)
| WWW.HENNESSYFUNDS.COM |
14
| STATEMENTS OF CHANGES IN NET ASSETS |
Financial Statements
| Statements of Changes in Net Assets |
| Year Ended | Year Ended | |||||||
| October 31, 2021 | October 31, 2020 | |||||||
| OPERATIONS: | ||||||||
| Net investment income | $ | 392,688 | $ | 250,103 | ||||
| Net realized gain on investments | 1,288,362 | 4,449,101 | ||||||
| Net change in unrealized | ||||||||
| appreciation/depreciation on investments | 10,917,876 | (6,227,200 | ) | |||||
| Net increase (decrease) in net | ||||||||
| assets resulting from operations | 12,598,926 | �� | (1,527,996 | ) | ||||
| DISTRIBUTIONS TO SHAREHOLDERS: | ||||||||
| Distributable earnings – Investor Class | (121,856 | ) | (876,351 | ) | ||||
| Distributable earnings – Institutional Class | (260,753 | ) | (1,083,137 | ) | ||||
| Total distributions | (382,609 | ) | (1,959,488 | ) | ||||
| CAPITAL SHARE TRANSACTIONS: | ||||||||
| Proceeds from shares subscribed – Investor Class | 10,823,523 | 10,928,761 | ||||||
| Proceeds from shares subscribed – Institutional Class | 45,926,109 | 17,157,226 | ||||||
| Dividends reinvested – Investor Class | 116,988 | 843,742 | ||||||
| Dividends reinvested – Institutional Class | 246,865 | 990,566 | ||||||
| Cost of shares redeemed – Investor Class | (18,166,242 | ) | (30,850,983 | ) | ||||
| Cost of shares redeemed – Institutional Class | (19,434,438 | ) | (44,670,336 | ) | ||||
| Net increase (decrease) in net assets | ||||||||
| derived from capital share transactions | 19,512,805 | (45,601,024 | ) | |||||
| TOTAL INCREASE (DECREASE) IN NET ASSETS | 31,729,122 | (49,088,508 | ) | |||||
| NET ASSETS: | ||||||||
| Beginning of year | 80,998,018 | 130,086,526 | ||||||
| End of year | $ | 112,727,140 | $ | 80,998,018 | ||||
| CHANGES IN SHARES OUTSTANDING: | ||||||||
| Shares sold – Investor Class | 607,997 | 740,416 | ||||||
| Shares sold – Institutional Class | 2,575,700 | 1,237,542 | ||||||
| Shares issued to holders as reinvestment | ||||||||
| of dividends – Investor Class | 6,496 | 52,999 | ||||||
| Shares issued to holders as reinvestment | ||||||||
| of dividends – Institutional Class | 13,885 | 63,013 | ||||||
| Shares redeemed – Investor Class | (1,018,588 | ) | (2,138,457 | ) | ||||
| Shares redeemed – Institutional Class | (1,098,633 | ) | (3,253,564 | ) | ||||
| Net increase (decrease) in shares outstanding | 1,086,857 | (3,298,051 | ) | |||||
The accompanying notes are an integral part of these financial statements.
| HENNESSY FUNDS | 1-800-966-4354 |
15
Financial Statements
| Financial Highlights |
For an Investor Class share outstanding throughout each year
PER SHARE DATA:
Net asset value, beginning of year
Income from investment operations:
Net investment income
Net realized and unrealized gains on investments
Total from investment operations
Less distributions:
Dividends from net investment income
Dividends from net realized gains
Total distributions
Net asset value, end of year
TOTAL RETURN
SUPPLEMENTAL DATA AND RATIOS:
Net assets, end of year (millions)
Ratio of expenses to average net assets
Ratio of net investment income to average net assets
Portfolio turnover rate(2)
(1) | Calculated using the average shares outstanding method. |
(2) | Calculated on the basis of the Fund as a whole. |
The accompanying notes are an integral part of these financial statements.
| WWW.HENNESSYFUNDS.COM |
16
| FINANCIAL HIGHLIGHTS — INVESTOR CLASS |
| Year Ended October 31, | ||||||||||||||||||
| 2021 | 2020 | 2019 | 2018 | 2017 | ||||||||||||||
| $ | 15.73 | $ | 15.43 | $ | 14.99 | $ | 14.92 | $ | 11.29 | |||||||||
| 0.03 | (1) | 0.01 | (1) | 0.03 | (1) | 0.05 | 0.08 | |||||||||||
| 2.40 | 0.50 | 0.88 | 0.35 | 3.77 | ||||||||||||||
| 2.43 | 0.51 | 0.91 | 0.40 | 3.85 | ||||||||||||||
| (0.04 | ) | (0.21 | ) | — | (0.05 | ) | (0.12 | ) | ||||||||||
| — | — | (0.47 | ) | (0.28 | ) | (0.10 | ) | |||||||||||
| (0.04 | ) | (0.21 | ) | (0.47 | ) | (0.33 | ) | (0.22 | ) | |||||||||
| $ | 18.12 | $ | 15.73 | $ | 15.43 | $ | 14.99 | $ | 14.92 | |||||||||
| 15.46 | % | 3.27 | % | 6.30 | % | 2.64 | % | 34.82 | % | |||||||||
| $ | 46.15 | $ | 46.41 | $ | 66.30 | $ | 100.93 | $ | 69.86 | |||||||||
| 1.53 | % | 1.55 | % | 1.52 | % | 1.46 | % | 1.60 | % | |||||||||
| 0.16 | % | 0.09 | % | 0.23 | % | 0.21 | % | 0.26 | % | |||||||||
| 24 | % | 17 | % | 21 | % | 35 | % | 41 | % | |||||||||
The accompanying notes are an integral part of these financial statements.
| HENNESSY FUNDS | 1-800-966-4354 |
17
Financial Statements
| Financial Highlights |
For an Institutional Class share outstanding throughout each year
PER SHARE DATA:
Net asset value, beginning of year
Income from investment operations:
Net investment income
Net realized and unrealized gains on investments
Total from investment operations
Less distributions:
Dividends from net investment income
Dividends from net realized gains
Total distributions
Net asset value, end of year
TOTAL RETURN
SUPPLEMENTAL DATA AND RATIOS:
Net assets, end of year (millions)
Ratio of expenses to average net assets
Ratio of net investment income to average net assets
Portfolio turnover rate(2)
(1) | Calculated using the average shares outstanding method. |
(2) | Calculated on the basis of the Fund as a whole. |
The accompanying notes are an integral part of these financial statements.
| WWW.HENNESSYFUNDS.COM |
18
| FINANCIAL HIGHLIGHTS — INSTITUTIONAL CLASS |
| Year Ended October 31, | ||||||||||||||||||
| 2021 | 2020 | 2019 | 2018 | 2017 | ||||||||||||||
| $ | 15.58 | $ | 15.28 | $ | 14.83 | $ | 14.72 | $ | 11.33 | |||||||||
| 0.11 | (1) | 0.07 | (1) | 0.09 | (1) | 0.11 | 0.05 | |||||||||||
| 2.37 | 0.50 | 0.86 | 0.36 | 3.78 | ||||||||||||||
| 2.48 | 0.57 | 0.95 | 0.47 | 3.83 | ||||||||||||||
| (0.12 | ) | (0.27 | ) | (0.04 | ) | (0.08 | ) | (0.10 | ) | |||||||||
| — | — | (0.46 | ) | (0.28 | ) | (0.34 | ) | |||||||||||
| (0.12 | ) | (0.27 | ) | (0.50 | ) | (0.36 | ) | (0.44 | ) | |||||||||
| $ | 17.94 | $ | 15.58 | $ | 15.28 | $ | 14.83 | $ | 14.72 | |||||||||
| 15.90 | % | 3.69 | % | 6.73 | % | 3.12 | % | 35.17 | % | |||||||||
| $ | 66.58 | $ | 34.58 | $ | 63.78 | $ | 98.42 | $ | 28.71 | |||||||||
| 1.13 | % | 1.13 | % | 1.12 | % | 1.04 | % | 1.19 | % | |||||||||
| 0.63 | % | 0.45 | % | 0.61 | % | 0.77 | % | 0.80 | % | |||||||||
| 24 | % | 17 | % | 21 | % | 35 | % | 41 | % | |||||||||
The accompanying notes are an integral part of these financial statements.
| HENNESSY FUNDS | 1-800-966-4354 |
19
Financial Statements
Notes to the Financial Statements October 31, 2021 |
1). ORGANIZATION
The Hennessy Japan Small Cap Fund (the “Fund”) is a series of Hennessy Funds Trust (the “Trust”), which was organized as a Delaware statutory trust on September 17, 1992. The Fund is an open-end management investment company registered under the Investment Company Act of 1940, as amended. The investment objective of the Fund is long-term capital appreciation. The Fund is a diversified fund.
The Fund offers Investor Class and Institutional Class shares. Each class of shares differs principally in its respective 12b-1 distribution and service, shareholder servicing, and sub-transfer agent expenses. There are no sales charges. Each class has identical rights to earnings, assets, and voting privileges, except for class-specific expenses and exclusive rights to vote on matters affecting only one class.
As an investment company, the Fund follows the investment company accounting and reporting guidance of the Financial Accounting Standards Board (“FASB”) Accounting Standard Codification Topic 946 “Financial Services—Investment Companies.”
2). SIGNIFICANT ACCOUNTING POLICIES
The following is a summary of significant accounting policies consistently followed by the Fund in the preparation of the financial statements. These policies conform to U.S. generally accepted accounting principles (“GAAP”).
| a). | Securities Valuation – All investments in securities are valued in accordance with the Fund’s valuation policies and procedures, as described in Note 3. |
| b). | Federal Income Taxes – The Fund has elected to be taxed as a regulated investment company and intends to distribute substantially all of its taxable income to its shareholders and otherwise comply with the provisions of the Internal Revenue Code of 1986, as amended, applicable to regulated investment companies. As a result, the Fund has made no provision for federal income taxes or excise taxes. Net investment income/loss and realized gains/losses for federal income tax purposes may differ from those reported in the financial statements because of temporary book-basis and tax-basis differences. Temporary differences are primarily the result of the treatment of wash sales for tax reporting purposes. The Fund recognizes interest and penalties related to income tax benefits, if any, in the Statement of Operations as an income tax expense. Distributions from net realized gains for book purposes may include short-term capital gains, which are included as ordinary income to shareholders for tax purposes. The Fund may utilize equalization accounting for tax purposes and designate earnings and profits, including net realized gains distributed to shareholders on redemption of shares, as part of the dividends paid deduction for income tax purposes. |
| Due to inherent differences in the recognition of income, expenses, and realized gains/losses under GAAP and federal income tax regulations, permanent differences between book and tax basis for reporting are identified and appropriately reclassified in the Statement of Assets and Liabilities, as needed. The adjustments for fiscal year 2021 are as follows: |
| Total | |||
| Distributable | |||
Earnings | Capital Stock | ||
| $(32,865) | $32,865 |
| WWW.HENNESSYFUNDS.COM |
20
| NOTES TO THE FINANCIAL STATEMENTS |
| c). | Accounting for Uncertainty in Income Taxes – The Fund has accounting policies regarding recognition and measurement of tax positions taken or expected to be taken on a tax return. The tax returns of the Fund for the prior three fiscal years are open for examination. The Fund has reviewed all open tax years in major tax jurisdictions and concluded that there is no impact on the Fund’s net assets and no tax liability resulting from unrecognized tax benefits relating to uncertain income tax positions taken or expected to be taken on a tax return. The Fund’s major tax jurisdictions are U.S. federal and Delaware. |
| d). | Income and Expenses – Dividend income is recognized on the ex-dividend date or as soon as information is available to the Fund. Interest income, which includes the amortization of premium and accretion of discount, is recognized on an accrual basis. Market discounts, original issue discounts, and market premiums on debt securities are accreted or amortized to interest income over the life of a security with a corresponding increase or decrease, as applicable, in the cost basis of such security using the yield-to-maturity method or, where applicable, the first call date of the security. Other non-cash dividends are recognized as investment income at the fair value of the property received. The Fund is charged for those expenses that are directly attributable to its portfolio, such as advisory, administration, and certain shareholder service fees. Income, expenses (other than expenses attributable to a specific class), and realized and unrealized gains/losses on investments are allocated to each class of shares based on such class’s net assets. |
| e). | Distributions to Shareholders – Dividends from net investment income for the Fund, if any, are declared and paid annually, usually in December. Distributions of net realized capital gains, if any, are declared and paid annually, usually in December. |
| f). | Security Transactions – Investment and shareholder transactions are recorded on the trade date. The Fund determines the realized gain/loss from an investment transaction by comparing the original cost of the security lot sold with the net sale proceeds. Discounts and premiums on securities purchased are accreted or amortized, respectively, over the life of each such security. |
| g). | Use of Estimates – Preparing financial statements in accordance with GAAP requires management to make estimates and assumptions that affect the reported amounts of assets and liabilities and disclosure of contingent assets and liabilities at the date of the financial statements, as well as the reported change in net assets during the reporting period. Actual results could differ from those estimates. |
| h). | Share Valuation – The net asset value (“NAV”) per share of the Fund is calculated by dividing (i) the total value of the securities held by the Fund, plus cash and other assets, minus all liabilities (including estimated accrued expenses) by (ii) the total number of Fund shares outstanding, rounded to the nearest $0.01. Fund shares are not priced on days the New York Stock Exchange is closed for trading. The offering and redemption price per share for the Fund is equal to the Fund’s NAV per share. |
| i). | Foreign Currency – Values of investments denominated in foreign currencies are converted into U.S. dollars using the spot market exchange rate at the time of valuation. Purchases and sales of investments and income are translated into U.S. dollars using the spot market exchange rate prevailing on the respective dates of such transactions. The Fund does not isolate the portion of the results of operations resulting from fluctuations in foreign exchange rates on investments from fluctuations resulting from changes in the market prices of securities held. Such fluctuations are included with the net realized and unrealized gain/loss on investments. Foreign investments present additional risks due to currency |
| HENNESSY FUNDS | 1-800-966-4354 |
21
| fluctuations, economic and political factors, lower liquidity, government regulations, differences in accounting standards, and other factors. | |
| j). | REIT Equity Securities – Distributions received from real estate investment trusts (“REITs”) may be classified as dividends, capital gains, or return of capital. Investments in REITs may require the Fund to accrue and distribute income not yet received. To generate sufficient cash to make any required distributions, the Fund may be required to sell securities in its portfolio (including when it is not advantageous to do so) that it otherwise would have continued to hold. At other times, investments in a REIT may result in the Fund’s receipt of cash in excess of the REIT’s earnings. If the Fund distributes these amounts, these distributions could constitute a return of capital to Fund shareholders for U.S. federal income tax purposes. Dividends received by the Fund from a REIT generally do not constitute qualified dividend income and do not qualify for the dividends-received deduction. |
| k). | Recent Accounting Pronouncements and Regulatory Updates – In October 2020, the Securities and Exchange Commission (“SEC”) adopted new regulations governing the use of derivatives by registered investment companies (“Rule 18f-4”). Rule 18f-4 imposes limits on the amount of derivatives a fund can enter into, eliminates the asset segregation framework currently used by funds to comply with Section 18 of the 1940 Act, and requires funds whose use of derivatives is greater than a limited specified amount to establish and maintain a comprehensive derivatives risk management program and appoint a derivatives risk manager. Funds are required to comply with Rule 18f-4 by August 19, 2022. The impact, if any, that Rule 18f-4 will have on the availability, liquidity, and performance of derivatives is unclear. Management is currently evaluating the potential impact of Rule 18f-4 on the Fund. When fully implemented, Rule 18f-4 may require changes in how the Fund uses derivatives, adversely affect the Fund’s performance, and increase costs related to the Fund’s use of derivatives. |
| In December 2020, the SEC adopted a new rule providing a framework for fund valuation practices (“Rule 2a-5”). Rule 2a-5 establishes requirements for determining fair value in good faith for purposes of the 1940 Act. Rule 2a-5 permits fund boards to designate certain parties to perform fair value determinations, subject to board oversight and certain other conditions. Rule 2a-5 also defines when market quotations are “readily available” for purposes of the 1940 Act and the threshold for determining whether a fund must fair value a security. In connection with Rule 2a-5, the SEC also adopted related recordkeeping requirements and is rescinding previously issued guidance, including with respect to the role of a board in determining fair value and the accounting and auditing of fund investments. Funds must comply with the rules by September 8, 2022. Management is currently assessing the potential impact of the new rules on the Fund’s financial statements. |
3). SECURITIES VALUATION
The Fund follows its valuation policies and procedures in determining its net asset value and, in preparing these financial statements, the fair value accounting standards that establish an authoritative definition of fair value and set out a hierarchy for measuring fair value. These standards require additional disclosures about the various inputs and valuation techniques used to develop the measurements of fair value and a discussion of changes in valuation techniques and related inputs during the period. These inputs are summarized in the three broad levels listed below:
| Level 1 – | Unadjusted, quoted prices in active markets for identical instruments that the Fund has the ability to access at the date of measurement. |
| WWW.HENNESSYFUNDS.COM |
22
| NOTES TO THE FINANCIAL STATEMENTS |
| Level 2 – | Other significant observable inputs (including, but not limited to, quoted prices in active markets for similar instruments, quoted prices in markets that are not active for identical or similar instruments, and model-derived valuations in which all significant inputs and significant value drivers are observable in active markets, such as interest rates, prepayment speeds, credit risk curves, default rates, and similar data). | |
| Level 3 – | Significant unobservable inputs (including the Fund’s own assumptions about what market participants would use to price the asset or liability based on the best available information) when observable inputs are unavailable. |
The following is a description of the valuation techniques applied to the Fund’s major categories of assets and liabilities on a recurring basis:
Equity Securities – Equity securities, including common stocks, preferred stocks, foreign-issued common stocks, exchange-traded funds, closed-end mutual funds, partnerships, rights, and real estate investment trusts, that are traded on a securities exchange for which a last-quoted sales price is readily available generally are valued at the last sales price as reported by the primary exchange on which the securities are listed. Securities listed on The NASDAQ Stock Market (“NASDAQ”) generally are valued at the NASDAQ Official Closing Price, which may differ from the last sales price reported. Securities traded on a securities exchange for which a last-quoted sales price is not readily available generally are valued at the mean between the bid and ask prices. To the extent these securities are actively traded and valuation adjustments are not applied, they are classified in Level 1 of the fair value hierarchy. Securities traded on foreign exchanges generally are not valued at the same time the Fund calculates its NAV because most foreign markets close well before such time. The earlier close of most foreign markets gives rise to the possibility that significant events, including broad market moves, may have occurred in the interim. In certain circumstances, it may be determined that a foreign security needs to be fair valued because it appears that the value of the security might have been materially affected by events occurring after the close of the market in which the security is principally traded, but before the time the Fund calculates its NAV, such as by a development that affects an entire market or region (e.g., a weather-related event) or a potentially global development (e.g., a terrorist attack that may be expected to have an effect on investor expectations worldwide). | |
Registered Investment Companies – Investments in open-end registered investment companies, commonly referred to as mutual funds, generally are priced at the ending NAV provided by the applicable mutual fund’s service agent and are classified in Level 1 of the fair value hierarchy. | |
Debt Securities – Debt securities, including corporate bonds, asset-backed securities, mortgage-backed securities, municipal bonds, U.S. Treasuries, and U.S. government agency issues, are generally valued at market on the basis of valuations furnished by an independent pricing service that utilizes both dealer-supplied valuations and formula-based techniques. The pricing service may consider recently executed transactions in securities of the issuer or comparable issuers, market price quotations (where observable), bond spreads, and fundamental data relating to the issuer. In addition, the model may incorporate observable market data, such as reported sales of similar securities, broker quotes, yields, bids, offers, and reference data. Certain securities are valued primarily using dealer quotations. These securities are generally classified in Level 2 of the fair value hierarchy. |
| HENNESSY FUNDS | 1-800-966-4354 |
23
Short-Term Securities – Short-term equity investments, including money market funds, are valued in the manner specified above for equity securities. Short-term debt investments with an original term to maturity of 60 days or less are valued at amortized cost, which approximates fair market value. If the original term to maturity of a short-term debt investment exceeds 60 days, then the values as of the 61st day prior to maturity are amortized. Amortized cost is not used if its use would be inappropriate due to credit or other impairments of the issuer, in which case the security’s fair value would be determined as described below. Short-term securities are generally classified in Level 1 or Level 2 of the fair value hierarchy depending on the inputs used and market activity levels for specific securities. |
The Board of Trustees of the Fund (the “Board”) has adopted fair value pricing procedures that are followed when a price for a security is not readily available or if a significant event has occurred that indicates the closing price of a security no longer represents the true value of that security. Fair value pricing determinations are made in good faith in accordance with these procedures. There are numerous criteria considered in determining a fair value of a security, such as the trading volume of a security and markets, the values of other similar securities, and news events with direct bearing on a security or markets. Fair value pricing results in an estimated price for a security that reflects the amount the Fund might reasonably expect to receive in a current sale. Depending on the relative significance of the valuation inputs, these securities may be classified in either Level 2 or Level 3 of the fair value hierarchy.
The fair value of foreign securities may be determined with the assistance of a pricing service using correlations between the movement of prices of such securities and indices of domestic securities and other appropriate indicators, such as closing market prices of relevant American Depositary Receipts or futures contracts. Using fair value pricing means that the Fund’s NAV reflects the affected portfolio securities’ values as determined by the Board or its designee, pursuant to the fair value pricing procedures adopted by the Board, instead of being determined by the market. Using a fair value pricing methodology to price a foreign security may result in a value that is different from such foreign security’s most recent closing price and from the value used by other investment companies to calculate their NAVs. Such securities are generally classified in Level 2 of the fair value hierarchy. Because the Fund invests in foreign securities, the value of the Fund’s portfolio securities may change on days when a shareholder is unable to purchase or redeem Fund shares.
The Board has delegated day-to-day valuation matters to the Valuation and Liquidity Committee comprising representatives from Hennessy Advisors, Inc., the Fund’s investment advisor (the “Advisor”). The function of the Valuation and Liquidity Committee, among other things, is to value securities where current and reliable market quotations are not readily available. All actions taken by the Valuation and Liquidity Committee are reviewed by the Board.
The Fund has performed an analysis of all existing investments to determine the significance and character of all inputs to their fair value determinations. Various inputs are used to determine the value of the Fund’s investments. The inputs or methodology used for valuing securities are not necessarily an indication of the risk associated with investing in those securities. Details related to the fair value hierarchy of the Fund’s securities as of October 31, 2021, are included in the Schedule of Investments.
4). INVESTMENT TRANSACTIONS
Purchases and sales of investment securities (excluding government and short-term investments) for the Fund during fiscal year 2021 were $35,461,189 and $21,652,979, respectively.
| WWW.HENNESSYFUNDS.COM |
24
| NOTES TO THE FINANCIAL STATEMENTS |
There were no purchases or sales/maturities of long-term U.S. government securities for the Fund during fiscal year 2021.
5). INVESTMENT ADVISORY FEE AND OTHER TRANSACTIONS WITH AFFILIATES
The Advisor provides the Fund with investment advisory services under an Investment Advisory Agreement. The Advisor oversees the provision of investment advice and furnishes office space, facilities, and most of the personnel needed by the Fund. As compensation for its services, the Advisor is entitled to a monthly fee from the Fund. The fee is based on the average daily net assets of the Fund at an annual rate of 0.80%. The net investment advisory fees expensed by the Fund during fiscal year 2021 are included in the Statement of Operations.
The Advisor has delegated the day-to-day management of the Fund to a sub-advisor, SPARX Asset Management Co., Ltd. The Advisor pays the sub-advisory fees from its own assets, and these fees are not an additional expense of the Fund. During fiscal year 2021, the Advisor (not the Fund) paid a sub-advisory fee at the average rate of 0.35% of the daily net assets of the Fund. Pursuant to the sub-advisory agreement, the Advisor pays sub-advisory fees at the rate of 0.35% of the first $500 million of daily net assets, 0.40% of daily net assets between $500 million and $1 billion, and 0.42% of daily net assets over $1 billion.
The Board has approved a Shareholder Servicing Agreement for Investor Class shares of the Fund, which compensates the Advisor for the non-investment advisory services it provides to the Fund. The Shareholder Servicing Agreement provides for a monthly fee paid to the Advisor at an annual rate of 0.10% of the average daily net assets of the Fund attributable to Investor Class shares. The shareholder service fees expensed by the Fund during fiscal year 2021 are included in the Statement of Operations.
The Fund has adopted a plan pursuant to Rule 12b-1 under the Investment Company Act of 1940, as amended, that authorizes payments in connection with the distribution of Fund shares at an annual rate of up to 0.25% of the Fund’s average daily net assets attributable to Investor Class shares. Even though the authorized rate is up to 0.25%, the Fund is currently only using up to 0.15% of its average daily net assets attributable to Investor Class shares for such purpose. Amounts paid under the plan may be spent on any activities or expenses primarily intended to result in the sale of shares, including, but not limited to, advertising, shareholder account servicing, printing and mailing of prospectuses to other than current shareholders, printing and mailing of sales literature, and compensation for sales and marketing activities or to financial institutions and others, such as dealers and distributors. The distribution fees expensed by the Fund during fiscal year 2021 are included in the Statement of Operations.
The Fund has entered into agreements with various brokers, dealers, and financial intermediaries in connection with the sale of Fund shares. The agreements provide for periodic payments of sub-transfer agent expenses by the Fund to the brokers, dealers, and financial intermediaries for providing certain shareholder maintenance services. These shareholder services include the pre-processing and quality control of new accounts, shareholder correspondence, answering customer inquiries regarding account status, and facilitating shareholder telephone transactions. The sub-transfer agent fees expensed by the Fund during fiscal year 2021 are included in the Statement of Operations.
U.S. Bancorp Fund Services, LLC, d/b/a U.S. Bank Global Fund Services (“Fund Services”) provides the Fund with administrative, accounting, and transfer agent services. As administrator, Fund Services is responsible for activities such as (i) preparing various federal and state regulatory filings, reports, and returns for the Fund, (ii) preparing reports and materials to be supplied to the Board, (iii) monitoring the activities of the
| HENNESSY FUNDS | 1-800-966-4354 |
25
Fund’s custodian, transfer agent, and accountants, and (iv) coordinating the preparation and payment of the Fund’s expenses and reviewing the Fund’s expense accruals. U.S. Bank N.A., an affiliate of Fund Services, serves as the Fund’s custodian. The servicing agreements between the Trust, Fund Services, and U.S. Bank N.A. contain a fee schedule that is inclusive of administrative, accounting, custody, and transfer agent fees. The administrative, accounting, custody, and transfer agent fees expensed by the Fund during fiscal year 2021 are included in the Statement of Operations.
Quasar Distributors, LLC (“Quasar”), a wholly owned broker-dealer subsidiary of Foreside Financial Group, LLC (“Foreside”), acts as the Fund’s principal underwriter in a continuous public offering of Fund shares. Effective September 30, 2021, Genstar Capital, a private equity firm specializing in financial and related business service companies, acquired a majority interest in Foreside. The Board approved a new Distribution Agreement to enable Quasar to continue serving as the Fund’s distributor following the change in control of Foreside.
The officers of the Fund are affiliated with the Advisor. With the exception of the Chief Compliance Officer and the Senior Compliance Officer, such officers receive no compensation from the Fund for serving in their respective roles. The Fund, along with the other funds in the Hennessy Funds family (collectively, the “Hennessy Funds”), makes reimbursement payments on an equal basis to the Advisor for a portion of the salary and benefits associated with the office of the Chief Compliance Officer and for all of the salary and benefits associated with the office of the Senior Compliance Officer. The compliance fees expensed by the Fund during fiscal year 2021 are included in the Statement of Operations.
6). GUARANTEES AND INDEMNIFICATIONS
Under the Hennessy Funds’ organizational documents, their officers and trustees are indemnified by the Hennessy Funds against certain liabilities arising out of the performance of their duties to the Hennessy Funds. Additionally, in the normal course of business, the Hennessy Funds enter into contracts with service providers that contain general indemnification clauses. The Fund’s maximum exposure under these arrangements is unknown as this would involve future claims that may be made against the Fund that have not yet occurred. Currently, the Fund expects the risk of loss to be remote.
7). LINE OF CREDIT
The Fund has an uncommitted line of credit with the other Hennessy Funds in the amount of the lesser of (i) $100,000,000 or (ii) 33.33% of each Hennessy Fund’s net assets, or 30% for the Hennessy Gas Utility Fund and 10% for the Hennessy Balanced Fund. The line of credit is intended to provide any necessary short-term financing in connection with shareholder redemptions, subject to certain restrictions. The credit facility is with the Hennessy Funds’ custodian bank, U.S. Bank N.A. Borrowings under this arrangement bear interest at the bank’s prime rate and are secured by all of the Fund’s assets (as to its own borrowings only). During fiscal year 2021, the Fund did not have any borrowings outstanding under the line of credit.
| WWW.HENNESSYFUNDS.COM |
26
| NOTES TO THE FINANCIAL STATEMENTS |
8). FEDERAL TAX INFORMATION
As of October 31, 2021, the components of accumulated earnings (losses) for income tax purposes were as follows:
| Investments | ||||
| Cost of investments for tax purposes | $ | 98,174,058 | ||
| Gross tax unrealized appreciation | $ | 23,765,642 | ||
| Gross tax unrealized depreciation | (6,151,489 | ) | ||
| Net tax unrealized appreciation/(depreciation) | $ | 17,614,153 | ||
| Undistributed ordinary income | $ | 327,681 | ||
| Undistributed long-term capital gains | 447,793 | |||
| Total distributable earnings | $ | 775,474 | ||
| Other accumulated gain/(loss) | $ | — | ||
| Total accumulated gain/(loss) | $ | 18,389,627 | ||
The difference between book-basis unrealized appreciation/depreciation and tax-basis unrealized appreciation/depreciation (as shown above) is attributable primarily to wash sales.
As of October 31, 2021, the Fund had no tax-basis capital losses to offset future capital gains. During fiscal year 2021, the capital losses utilized by the Fund were $871,567.
Capital losses sustained in or after fiscal year 2012 can be carried forward indefinitely, but any such loss retains the character of the original loss and must be utilized prior to any loss incurred before fiscal year 2012. As a result of this ordering rule, capital loss carryforwards incurred prior to fiscal year 2012 may be more likely to expire unused. Capital losses sustained prior to fiscal year 2012 can be carried forward for eight years and can be carried forward as short-term capital losses regardless of the character of the original loss.
As of October 31, 2021, the Fund did not defer, on a tax basis, any late-year ordinary losses. Late-year ordinary losses are net ordinary losses incurred after December 31, 2020, but within the taxable year, that are deemed to arise on the first day of the Fund’s next taxable year.
During fiscal years 2021 and 2020, the tax character of distributions paid by the Fund was as follows:
| Year Ended | Year Ended | ||||||||
| October 31, 2021 | October 31, 2020 | ||||||||
Ordinary income(1) | $ | 382,609 | $ | 1,959,488 | |||||
| Long-term capital gains | — | — | |||||||
| Total distributions | $ | 382,609 | $ | 1,959,488 | |||||
(1) Ordinary income includes short-term capital gains. |
9). EVENTS SUBSEQUENT TO YEAR END
Management has evaluated the Fund’s related events and transactions that occurred subsequent to October 31, 2021, through the date of issuance of the Fund’s financial statements. Other than as disclosed below, management has determined that there were no subsequent events requiring recognition or disclosure in the financial statements.
On December 7, 2021, capital gains were declared and paid to shareholders of record on December 6, 2021, as follows:
Long-term | ||
| Investor Class | 0.07094 | |
| Institutional Class | 0.07028 |
| HENNESSY FUNDS | 1-800-966-4354 |
27
Report of Independent Registered Public
Accounting Firm
To the Board of Trustees of Hennessy Funds Trust
and the shareholders of the Hennessy Japan Small Cap Fund
Novato, CA
Opinion on the Financial Statements
We have audited the accompanying statement of assets and liabilities of the Hennessy Japan Small Cap Fund (the “Fund”), a series of Hennessy Funds Trust, including the schedule of investments, as of October 31, 2021, the related statement of operations for the year then ended, the statements of changes in net assets for each of the two years in the period then ended, the financial highlights for each of the five years in the period then ended, and the related notes (collectively referred to as the “financial statements”). In our opinion, the financial statements present fairly, in all material respects, the financial position of the Fund as of October 31, 2021, the results of its operations for the year then ended, the changes in its net assets for each of the two years in the period then ended, and the financial highlights for each of the five years in the period then ended in conformity with accounting principles generally accepted in the United States of America.
Basis for Opinion
These financial statements are the responsibility of the Fund’s management. Our responsibility is to express an opinion on the Fund’s financial statements based on our audits. We are a public accounting firm registered with the Public Company Accounting Oversight Board (United States) (“PCAOB”) and are required to be independent with respect to the Fund in accordance with the U.S. federal securities laws and the applicable rules and regulations of the Securities and Exchange Commission and the PCAOB. We have served as the auditor of one or more of the funds in the Trust since 2002.
We conducted our audits in accordance with the standards of the PCAOB. Those standards require that we plan and perform the audit to obtain reasonable assurance about whether the financial statements are free of material misstatement, whether due to error or fraud. The Fund is not required to have, nor were we engaged to perform, an audit of its internal control over financial reporting. As part of our audits we are required to obtain an understanding of internal control over financial reporting, but not for the purpose of expressing an opinion on the effectiveness of the Fund’s internal control over financial reporting. Accordingly, we express no such opinion.
Our audits included performing procedures to assess the risks of material misstatement of the financial statements, whether due to error or fraud, and performing procedures that respond to those risks. Such procedures included examining, on a test basis, evidence regarding the amounts and disclosures in the financial statements. Our audits also included evaluating the accounting principles used and significant estimates made by management, as well as evaluating the overall presentation of the financial statements. Our procedures included confirmation of securities owned as of October 31, 2021 by correspondence with the custodian and brokers; when replies were not received from brokers, we performed other auditing procedures. We believe that our audits provide a reasonable basis for our opinion.
| |
| TAIT, WELLER & BAKER LLP |
Philadelphia, Pennsylvania
December 22, 2021
| WWW.HENNESSYFUNDS.COM |
28
| REPORT OF INDEPENDENT REGISTERED PUBLIC ACCOUNTING FIRM/TRUSTEES AND OFFICERS |
Trustees and Officers of the Fund (Unaudited)
The business and affairs of the Funds are managed under the direction of the Board of Trustees of the Trust, and the Board of Trustees elects the officers of the Trust. From time to time, the Board of Trustees also has appointed advisers to the Board of Trustees (“Advisers”) with the intention of having qualified individuals serve in an advisory capacity to garner experience in the mutual fund and asset management industry and be considered as potential Trustees in the future. There are currently two Advisers, Brian Alexander and Doug Franklin. As Advisers, Mr. Alexander and Mr. Franklin attend meetings of the Board of Trustees and act as non-voting participants. Information pertaining to the Trustees, Advisers, and the officers of the Trust is set forth below. The Trustees and officers serve until their successors are duly elected and qualified or until their earlier death, resignation, or removal. Each Trustee oversees all 16 Hennessy Funds. Unless otherwise indicated, the address of all persons listed below is 7250 Redwood Boulevard, Suite 200, Novato, CA 94945. The Fund’s Statement of Additional Information includes more information about the persons listed below and is available without charge by calling 1-800-966-4354 or by visiting www.hennessyfunds.com.
| Other | |||
| Directorships | |||
| Held Outside | |||
| Name, Age, | of Fund | ||
| and Position Held | Start Date | Principal Occupation(s) | Complex During |
with the Trust | of Service | During Past Five Years | Past Five Years |
| Disinterested Trustees and Advisers | |||
| J. Dennis DeSousa | January 1996 | Mr. DeSousa is a real estate investor. | None. |
| 85 | |||
| Trustee | |||
| Robert T. Doyle | January 1996 | Mr. Doyle has been the Sheriff of | None. |
| 74 | Marin County, California since 1996. | ||
| Trustee | |||
| Claire Garvie | December 2015 | Ms. Garvie is a founder of Kiosk and | None. |
| 47 | as an Adviser | has served as its Chief Operating | |
| Trustee | to the Board | Officer since 2004. Kiosk is a full- | |
| and | service marketing agency with | ||
| December 2021 | offices in the San Francisco Bay Area, | ||
| as a Trustee | Toronto, and Liverpool, UK. | ||
| Gerald P. Richardson | May 2004 | Mr. Richardson is an independent | None. |
| 76 | consultant in the securities industry. | ||
| Trustee |
| HENNESSY FUNDS | 1-800-966-4354 |
29
| Other | |||
| Directorships | |||
| Held Outside | |||
| Name, Age, | of Fund | ||
| and Position Held | Start Date | Principal Occupation(s) | Complex During |
with the Trust | of Service | During Past Five Years | Past Five Years |
| Brian Alexander | March 2015 | Mr. Alexander has worked for the | None. |
| 40 | Sutter Health organization since | ||
| Adviser to the Board | 2011 in various positions. He has | ||
| served as the Chief Executive Officer | |||
| of the Sutter Roseville Medical | |||
| Center since 2018. From 2016 through | |||
| 2018, he served as the Vice President | |||
| of Strategy for the Sutter Health Valley | |||
| Area, which includes 11 hospitals, | |||
| 13 ambulatory surgery centers, | |||
| 16,000 employees, and 1,900 physicians. | |||
| From 2013 through 2016, Mr. Alexander | |||
| served as Sutter Novato Community | |||
| Hospital’s Chief Administrative Officer. | |||
| Doug Franklin | March 2016 | Mr. Franklin is a retired insurance | None. |
| 57 | industry executive. From 1987 | ||
| Adviser to the Board | through 2015, he was employed | ||
| by the Allianz-Fireman’s Fund | |||
| Insurance Company in various | |||
| positions, including as its Chief | |||
| Actuary and Chief Risk Officer. | |||
Interested Trustee(1) | |||
| Neil J. Hennessy | January 1996 as | Mr. Hennessy has been employed | Hennessy |
| 65 | a Trustee and | by Hennessy Advisors, Inc. since | Advisors, Inc. |
| Chairman of the Board, | June 2008 as | 1989 and currently serves as its | |
| Chief Market Strategist, | an officer | Chairman and Chief Executive Officer. | |
| Portfolio Manager, | |||
| and President |
| Name, Age, | ||
| and Position Held | Start Date | Principal Occupation(s) |
with the Trust | of Service | During Past Five Years |
| Officers | ||
| Teresa M. Nilsen | January 1996 | Ms. Nilsen has been employed by Hennessy Advisors, Inc. |
| 55 | since 1989 and currently serves as its President and Chief | |
| Executive Vice President | Operating Officer. | |
| and Treasurer | ||
| Daniel B. Steadman | March 2000 | Mr. Steadman has been employed by Hennessy Advisors, Inc. |
| 65 | since 2000 and currently serves as its Executive Vice President. | |
| Executive Vice President | ||
| and Secretary | ||
| Brian Carlson | December 2013 | Mr. Carlson has been employed by Hennessy Advisors, Inc. |
| 49 | since December 2013 and currently serves as its Chief | |
| Senior Vice President | Compliance Officer and Senior Vice President. | |
| and Head of Distribution |
| WWW.HENNESSYFUNDS.COM |
30
| TRUSTEES AND OFFICERS OF THE FUND |
| Name, Age, | ||
| and Position Held | Start Date | Principal Occupation(s) |
with the Trust | of Service | During Past Five Years |
Jennifer Cheskiewicz(2) | June 2013 | Ms. Cheskiewicz has been employed by Hennessy Advisors, Inc. |
| 44 | as its General Counsel since June 2013. | |
| Senior Vice President and | ||
| Chief Compliance Officer | ||
David Ellison(3) | October 2012 | Mr. Ellison has been employed by Hennessy Advisors, Inc. since |
| 63 | October 2012. He has served as a Portfolio Manager of the | |
| Senior Vice President | Hennessy Large Cap Financial Fund and the Hennessy Small | |
| and Portfolio Manager | Cap Financial Fund since their inception. Mr. Ellison also served | |
| as a Portfolio Manager of the Hennessy Technology Fund from | ||
| its inception until February 2017. Mr. Ellison served as Director, | ||
| CIO, and President of FBR Fund Advisers, Inc. from December | ||
| 1999 to October 2012. | ||
Ryan Kelley(4) | March 2013 | Mr. Kelley has been employed by Hennessy Advisors, Inc. since |
| 49 | October 2012. He has served as Chief Investment Officer of the | |
| Chief Investment Officer, | Hennessy Funds since March 2021 and has served as a Portfolio | |
| Senior Vice President, | Manager of the Hennessy Gas Utility Fund, the Hennessy Large | |
| and Portfolio Manager | Cap Financial Fund, and the Hennessy Small Cap Financial Fund | |
| since October 2014. Mr. Kelley served as Co-Portfolio Manager | ||
| of these same funds from March 2013 through September | ||
| 2014 and as a Portfolio Analyst for the Hennessy Funds from | ||
| October 2012 through February 2013. He has also served as a | ||
| Portfolio Manager of the Hennessy Cornerstone Growth Fund, | ||
| the Hennessy Cornerstone Mid Cap 30 Fund, the Hennessy | ||
| Cornerstone Large Growth Fund, and the Hennessy | ||
| Cornerstone Value Fund since February 2017 and as a Portfolio | ||
| Manager of the Hennessy Total Return Fund, the Hennessy | ||
| Balanced Fund, and the Hennessy Technology Fund since May | ||
| 2018. He served as Co-Portfolio Manager of the Hennessy | ||
| Technology Fund from February 2017 until May 2018. Mr. Kelley | ||
| served as Portfolio Manager of FBR Fund Advisers, Inc. from | ||
| January 2008 to October 2012. | ||
L. Joshua Wein(4) | September 2018 | Mr. Wein has been employed by Hennessy Advisors, Inc. since |
| 48 | 2018. He has served as Co-Portfolio Manager of the Hennessy | |
| Vice President and | Cornerstone Growth Fund, the Hennessy Cornerstone | |
| Co-Portfolio Manager | Mid Cap 30 Fund, the Hennessy Cornerstone Large Growth | |
| Fund, the Hennessy Cornerstone Value Fund, Hennessy Total | ||
| Return Fund, the Hennessy Balanced Fund, the Hennessy Gas | ||
| Utility Fund, and the Hennessy Technology Fund since February | ||
| 2019. He served as a Senior Analyst of these same funds from | ||
| September 2018 through February 2019. Mr. Wein served as | ||
| Director of Alternative Investments and Co-Portfolio Manager | ||
| at Sterling Capital Management from 2008 to 2018. |
_______________
(1) | Mr. Hennessy is considered an “interested person,” as defined in the Investment Company Act of 1940, as amended, because he is an officer of the Trust. |
(2) | The address of this officer is 4800 Bee Caves Road, Suite 100, Austin, TX 78746. |
(3) | The address of this officer is 101 Federal Street, Suite 1615B, Boston, MA 02110. |
(4) | The address of this officer is 1340 Environ Way, Chapel Hill, NC 27517. |
| HENNESSY FUNDS | 1-800-966-4354 |
31
Expense Example (Unaudited)
October 31, 2021
As a shareholder of the Fund, you incur ongoing costs, including management fees, service fees, and other Fund expenses. This Example is intended to help you understand your ongoing costs (in dollars) of investing in the Fund and to compare these costs with the ongoing costs of investing in other mutual funds. The Example is based on an investment of $1,000 invested at the beginning of the period and held for the entire period from May 1, 2021, through October 31, 2021.
Actual Expenses
In the table below, the first line under each of the “Investor Class” and “Institutional Class” headings provides information about actual account values and actual expenses for each share class. You may use this information, together with the amount you invested, to estimate the expenses that you paid over the period. Simply divide your account value by $1,000 (for example, an $8,600 account value divided by $1,000 = 8.6), then multiply the result by the number in the first line under the heading “Expenses Paid During Period” to estimate the expenses you paid on your account during this period. Although the Fund charges no sales loads or transaction fees, you will be assessed fees for outgoing wire transfers, returned checks, and stop payment orders at prevailing rates charged by U.S. Bank Global Fund Services, the Fund’s transfer agent. If you request that a redemption be made by wire transfer, the Fund’s transfer agent charges a $15 fee. IRAs are charged a $15 annual maintenance fee (up to $30 maximum per shareholder for shareholders with multiple IRAs). The examples below include, but are not limited to, management, shareholder servicing, accounting, custody, and transfer agent fees. However, the examples below do not include portfolio trading commissions and related expenses.
Hypothetical Example for Comparison Purposes
In the table below, the second line under each of the “Investor Class” and “Institutional Class” headings provides information about hypothetical account values and hypothetical expenses based on the Fund’s actual expense ratio for each share class and an assumed rate of return of 5% per year before expenses, which is not the Fund’s actual return for such share class. The hypothetical account values and expenses may not be used to estimate the actual ending account balance or expenses you paid for the period. You may use this information to compare the ongoing costs of investing in the Fund and other funds. To do so, compare these 5% hypothetical examples with the 5% hypothetical examples that appear in the shareholder reports of the other funds. Please note that the expenses shown in the table are meant to highlight your ongoing costs only. Therefore, the second lines under “Investor Class” and “Institutional Class” are useful in comparing ongoing costs only and will not help you determine the relative total costs of owning different funds.
| WWW.HENNESSYFUNDS.COM |
32
| EXPENSE EXAMPLE |
| Expenses Paid | |||
| Beginning | Ending | During Period(1) | |
| Account Value | Account Value | May 1, 2021 – | |
May 1, 2021 | October 31, 2021 | October 31, 2021 | |
| Investor Class | |||
| Actual | $1,000.00 | $1,023.70 | $7.75 |
| Hypothetical (5% return before expenses) | $1,000.00 | $1,017.54 | $7.73 |
| Institutional Class | |||
| Actual | $1,000.00 | $1,025.70 | $5.72 |
| Hypothetical (5% return before expenses) | $1,000.00 | $1,019.56 | $5.70 |
(1) | Expenses are equal to the Fund’s annualized expense ratio of 1.52% for Investor Class shares or 1.12% for Institutional Class shares, as applicable, multiplied by the average account value over the period, multiplied by 184/365 days (to reflect the half-year period). |
| HENNESSY FUNDS | 1-800-966-4354 |
33
How to Obtain a Copy of the Fund’s Proxy
Voting Policy and Proxy Voting Records
A description of the policies and procedures the Fund uses to determine how to vote proxies relating to portfolio securities is available without charge (1) by calling 1-800-966-4354, (2) on the Hennessy Funds’ website at www.hennessyfunds.com/proxy-voting/voting-policy, or (3) on the U.S. Securities and Exchange Commission’s (the “SEC”) website at www.sec.gov. The Fund’s proxy voting record is available without charge on both the Hennessy Funds’ website at www.hennessyfunds.com/proxy-voting/voting-record and the SEC’s website at www.sec.gov no later than August 31 for the prior 12 months ending June 30.
Availability of Quarterly Portfolio Schedule
The Fund files a complete schedule of portfolio holdings with the SEC for the first and third quarters of each fiscal year as an exhibit to its reports on Form N-PORT. The Fund’s Form N-PORT reports are available on the SEC’s website at www.sec.gov or on request by calling 1-800-966-4354.
Federal Tax Distribution Information (Unaudited)
For fiscal year 2021, certain dividends paid by the Fund may be subject to a maximum tax rate of 23.8%, as provided for by the Jobs and Growth Tax Relief Reconciliation Act of 2003. The percentage of dividends declared from ordinary income designated as qualified dividend income was 100.00%.
For corporate shareholders, the percent of ordinary income distributions that qualified for the corporate dividends received deduction for fiscal year 2021 was 0.00%.
The percentage of taxable ordinary income distributions that were designated as short-term capital gain distributions under Section 871(k)(2)(C) of the Internal Revenue Code of 1986, as amended, for the Fund was 0.00%.
For the year ended October 31, 2021, the Fund earned foreign-source income and paid foreign taxes as noted below, which it intends to pass through to its shareholders pursuant to Section 853 of the Internal Revenue Code.
Gross Foreign Income | Foreign Tax Paid | ||
| Japan | $1,896,845 | $189,684 |
Important Notice Regarding Delivery of
Shareholder Documents
To help keep the Fund’s costs as low as possible, we generally deliver a single copy of shareholder reports, proxy statements, and prospectuses to shareholders who share an address and have the same last name. This process does not apply to account statements. You may request an individual copy of a shareholder document at any time. If you would like to receive separate mailings of shareholder documents, please call U.S. Bank Global Fund Services at 1-800-261-6950 or 1-414-765-4124, and individual delivery will begin within 30 days of your request. If your account is held through a financial institution or other intermediary, please contact such intermediary directly to request individual delivery.
| WWW.HENNESSYFUNDS.COM |
34
| PROXY VOTING — LIQUIDITY RISK MANAGEMENT PROGRAM |
Electronic Delivery
As permitted by SEC regulations, the Fund’s shareholder reports are made available on a website, and unless you sign up for eDelivery or elect to receive paper copies as detailed below, you will be notified by mail each time a report is posted and provided with a website link to access the report.
The Fund also offers shareholders the option to receive all notices, account statements, prospectuses, tax forms, and shareholder reports online. To sign up for eDelivery or change your delivery preference, please visit www.hennessyfunds.com/account.
To elect to receive paper copies of all future reports free of charge, please call U.S. Bank Global Fund Services at 1-800-261-6950 or 1-414-765-4124.
Subscribe to receive our team’s unique market and sector insights delivered to your inbox
www.hennessyfunds.com/subscribe
Follow us on social media
| | |
Liquidity Risk Management Program
In accordance with Rule 22e-4 under the Investment Company Act of 1940, as amended (the “Liquidity Rule”), we have adopted and implemented a liquidity risk management program (the “Liquidity Program”). The purpose of the Liquidity Program is to assess and manage the Fund’s liquidity risk, which is the risk that the Fund would not be able to meet requests to redeem Fund shares without significant dilution of the remaining shareholders’ interests in the Fund. The Board of Trustees of the Fund (the “Board”) designated a committee comprising representatives of Hennessy Advisors, Inc., the investment adviser to the Fund, as the administrator of the Liquidity Program (the “Program Administrator”).
The Program Administrator provided a written report regarding the Liquidity Program to the Board in advance of its meeting on June 2, 2021. The report covered the period from June 1, 2020, through May 31, 2021. The report addressed the operation of the Liquidity Program, assessed the adequacy and effectiveness of its implementation, and described any material changes to the Liquidity Program during the review period. The Trust’s chief compliance officer presented the report to the Board at the meeting and provided additional information regarding the Liquidity Program. The Board reviewed the Liquidity Program and considered, among other items, the following:
| 1. | The Program Administrator reviewed daily historical net redemption activity during the review period and during prior periods with higher-than-average redemption activity and concluded that the Fund has historically been able to meet requests to redeem Fund shares without significant dilution to the Fund’s remaining shareholders, and the Program Administrator expects the Fund to be able to continue to do so in the future during both normal and reasonably foreseeable stressed conditions. | |
| 2. | The Fund holds assets that are highly liquid investments and is therefore not required to establish a highly liquid investment minimum for the Fund or adopt policies and procedures for responding to a highly liquid investment minimum shortfall. |
| HENNESSY FUNDS | 1-800-966-4354 |
35
| 3. | The Program Administrator did not make any material changes to the Liquidity Program during the review period and did not recommend any changes to the Liquidity Program or the model inputs used to determine the liquidity classification of each security held by the Fund. | |
| 4. | The Program Administrator concluded that the Liquidity Program was reasonably designed to assess and manage the Fund’s liquidity risk, complies with the requirements of the Liquidity Rule, and was operating as intended during the review period. |
Privacy Policy
We collect the following personal information about you:
| 1. | Information we receive from you in applications or other forms, correspondence, or conversations, including, but not limited to, your name, address, phone number, social security number, assets, income, and date of birth; | |
| 2. | Information about your transactions with us, our affiliates, or others, including, but not limited to, your account number and balance, payments history, parties to transactions, cost basis information, and other financial information; and | |
| 3. | Other personal information we collect from various sources, even if you have not entered into a prior transaction with us, including the following: |
| • | Name, alias, address, unique personal identifier, online identifier, IP address, email address, telephone number, account name, and other similar identifiers; | |
| • | Age and marital status; | |
| • | Commercial information, including records of products purchased; | |
| • | Browsing history, search history, and information on interaction with our website; | |
| • | Geolocation data; | |
| • | Employment and employment history, educational history, financial information, and purchasing and consuming histories or tendencies; and | |
| • | Inferences drawn from the above-listed information to create a profile about your preferences, characteristics, predispositions, and behavior. |
We collect this information directly from you, indirectly in the course of providing services to you, directly and indirectly from your activity on our website, from broker dealers, marketing agencies, and other third parties that interact with us in connection with the services we perform and products we offer, and from anonymized and aggregated consumer information.
We use this information to fulfill the reason you provided the information to us, to provide you with other relevant products that you request from us, to provide you with information about products that may interest you, to improve our website or present our website’s contents to you, and as otherwise described to you when collecting your personal information.
We do not disclose any personal information to unaffiliated third parties, except as permitted by law. We may disclose your personal information to our affiliates, vendors, and service providers for a business purpose. For example, we are permitted by law to disclose all of the information we collect, as described above, to our transfer agent to process your transactions. When disclosing your personal information to third parties,
| WWW.HENNESSYFUNDS.COM |
36
| LIQUIDITY RISK MANAGEMENT PROGRAM — PRIVACY POLICY |
we enter into a contract with each third party describing the purpose of such disclosure and requiring that such personal information be kept confidential and not used for any purpose except to perform the services contracted or respond to regulatory or law enforcement requests.
Furthermore, we restrict access to your personal information to those persons who require such information to provide products or services to you. As a result, we do not provide a means for opting out of our limited sharing of your information. We maintain physical, electronic, and procedural safeguards that comply with federal standards to guard your personal information.
If you hold shares of the Funds through a financial intermediary, including, but not limited to, a broker-dealer, bank, or trust company, the privacy policy of your financial intermediary governs how your personal information is shared with unaffiliated third parties.
Supplemental Privacy Notice for Residents of California
The California Consumer Privacy Act of 2018 (the “CCPA”) provides you, as a California resident, with certain additional rights relating to your personal information.
Under the CCPA, you have the right to request that we disclose to you the categories of personal information we have collected about you over the past 12 months, the categories of sources of such information, our business purpose for collecting the information, the categories of third parties, if any, with whom we shared the information, and the specific information we have collected about you. You also have the right to request that we delete any of your personal information, and, unless an exception applies, we will delete such information upon receiving and confirming your request. To make a request, call us at 1-800-966-4354, email us at privacy@hennessyfunds.com, or go to www.hennessyfunds.com/contact. We will not discriminate against you for exercising your rights under the CCPA. Further, we will not collect additional categories of your personal information or use the personal information we collected for materially different, unrelated, or incompatible purposes without providing you notice.
| HENNESSY FUNDS | 1-800-966-4354 |
37
For information, questions, or assistance, please call
The Hennessy Funds
1-800-966-4354 or 1-415-899-1555
INVESTMENT ADVISOR
Hennessy Advisors, Inc.
7250 Redwood Boulevard, Suite 200
Novato, California 94945
ADMINISTRATOR,
TRANSFER AGENT,
DIVIDEND PAYING AGENT, &
SHAREHOLDER SERVICING AGENT
U.S. Bancorp Fund Services, LLC
d/b/a U.S. Bank Global Fund Services
P.O. Box 701
Milwaukee, Wisconsin 53201-0701
CUSTODIAN
U.S. Bank N.A.
Custody Operations
1555 North River Center Drive, Suite 302
Milwaukee, Wisconsin 53212
TRUSTEES
Neil J. Hennessy
Robert T. Doyle
J. Dennis DeSousa
Claire Garvie
Gerald P. Richardson
COUNSEL
Foley & Lardner LLP
777 East Wisconsin Avenue
Milwaukee, Wisconsin 53202-5306
INDEPENDENT REGISTERED
PUBLIC ACCOUNTING FIRM
Tait, Weller & Baker LLP
Two Liberty Place
50 South 16th Street, Suite 2900
Philadelphia, Pennsylvania 19102-2529
DISTRIBUTOR
Quasar Distributors, LLC
111 East Kilbourn Avenue, Suite 2200
Milwaukee, Wisconsin 53202
www.hennessyfunds.com | 1-800-966-4354
This report has been prepared for shareholders and may be distributed to
others only if preceded or accompanied by a current prospectus.
ANNUAL REPORT
OCTOBER 31, 2021

HENNESSY LARGE CAP FINANCIAL FUND
Investor Class HLFNX
Institutional Class HILFX
www.hennessyfunds.com | 1-800-966-4354
(This Page Intentionally Left Blank.)
Contents
| Letter to Shareholders | 2 |
| Performance Overview | 4 |
| Financial Statements | |
| Schedule of Investments | 7 |
| Statement of Assets and Liabilities | 10 |
| Statement of Operations | 11 |
| Statements of Changes in Net Assets | 13 |
| Financial Highlights | 14 |
| Notes to the Financial Statements | 18 |
| Report of Independent Registered Public Accounting Firm | 26 |
| Trustees and Officers of the Fund | 27 |
| Expense Example | 30 |
| Proxy Voting Policy and Proxy Voting Records | 32 |
| Availability of Quarterly Portfolio Schedule | 32 |
| Important Notice Regarding Delivery of Shareholder Documents | 32 |
| Electronic Delivery | 32 |
| Liquidity Risk Management Program | 33 |
| Privacy Policy | 33 |
| HENNESSY FUNDS | 1-800-966-4354 |
December 2021
Dear Hennessy Funds Shareholder:
What a year this has been. While it doesn’t feel that we are out of the “pandemic” phase of the coronavirus crisis, we look forward to a day when we will eventually see fewer cases and potentially less severe variants. We feel extremely grateful to the many healthcare workers who have continued to work tirelessly during the recent surge. As we move through the next year, we hope that new U.S. cases will decline and that many other parts of the world will see improvements as well.
What a year this has been! As measured by the total return of the S&P 500® Index, as of October 31, 2021, the market was up 24.04% calendar year to date. This comes in the wake of a tumultuous 2020 in which the market plunged in the beginning of the pandemic and recovered dramatically to end the year up 18.40%. Interestingly, 18% appears to be a repeating number in the past dozen years. From the low point of the Financial Crisis (March 9, 2009) to the high point reached just prior to the COVID-19 pandemic (February 12, 2020), the S&P 500® Index was up 18.27% per year. We are well aware that past results are not predictive of the future, and we find ourselves naturally skeptical of such strong returns. But, as shown in the chart below, we find that the most common annual total returns of the market over the past 102 years range between 20% and 30% with the second most common being between 10% and 20%:
Source: Bloomberg L.P.
We will say it again, after showing a chart like the one above: Past results are not predictive of the future. Instead, we look at where we are right now – in the economy, in the market, in the business cycle – to reflect on where we have come from and where we may be going. U.S. GDP is strong and growing, interest rates remain low, and earnings growth and profitability remain robust. We believe stocks are trading at reasonable valuations when viewed as a whole, with the S&P 500® Index at 21.0x estimated earnings for 2022. Furthermore, we believe corporate balance sheets are healthy, with high levels of excess cash, which could support growth, increases in dividends, more share buybacks, and future acquisitions. Uncertainty and volatility can manifest at any time in the stock market, and the current market is no different. Investors have questions about inflation, worldwide supply chain issues, and what could drive the next boost in earnings. While these concerns are warranted, we continue to believe that overall the positives outweigh the negatives, and here at Hennessy we continue to see opportunity in the market and in our Funds.
| WWW.HENNESSYFUNDS.COM |
2
| LETTER TO SHAREHOLDERS |
What a (fiscal) year this has been!!! For our fiscal year ended October 31, 2021, the S&P 500® Index rose 42.91% on a total return basis, setting a new all-time high on the final day of the period. Except for a short 21-trading-day period that began on September 2 during which the market fell 5.13% only to rebound to new highs just 13 trading days later, the market has been on a continuous march higher. We saw a dramatic shift in market leadership as many of the sectors that underperformed during our last fiscal year soared in fiscal year 2021. Small-caps beat mid-caps, which in turn beat large-caps. The Energy and Financials sectors skyrocketed during the 12-month period, as reflected by the S&P 500® Energy Sector’s total return of 111.29% and the Russell 1000® Index Financials’ total return of 70.87%. Both of these sectors were among the worst performing in our fiscal year 2020, so a bounce back in our fiscal year 2021, while not a foregone conclusion, was a distinct possibility.
Overall, we are pleased with the performance of our mutual funds during the fiscal year. On an absolute basis, each of our 16 Funds achieved total returns greater than 10% and seven outperformed their primary benchmark. Ten of our 11 domestic equity-only Funds outperformed the S&P 500® Index and posted total returns of 45% or higher. Our four best-performing funds were concentrated in the Energy and Financials sectors. While some of our Funds certainly benefited from being in the “right” sector at the “right” time, we also believe this was a favorable period for our investment style of high-conviction investing and concentrated portfolio construction.
What will the coming year bring? As mentioned in our last shareholder letter (June 2021), we understand that even the greatest bull markets experience corrections along the way, and the last time the S&P 500® Index dropped over 10% was in February/March of 2020. Whether or not a correction occurs sooner or later, we believe the market as a whole has more room to run. We see many factors that could drive the market higher from here: strong GDP growth and increasing corporate earnings, a potentially lower-for-longer interest rate environment, accommodative fiscal and monetary policies, a healthy and robust financial system, low unemployment and solid wage growth, and strong corporate balance sheets with plenty of cash.
Thank you for your interest and for investing with us. We remain committed to managing our portfolios for long-term performance, ever mindful of downside risk. With so many investment options available to you, we are grateful for the trust you put in us and for your continued interest in our family of Funds. If you have any questions or would like to speak with us, please don’t hesitate to call us directly at (800) 966-4354.
Best regards,
| |
| |
| Ryan C. Kelley | |
| Chief Investment Officer |
Past performance does not guarantee future results. To obtain current standardized performance for the Hennessy Funds, visit https://www.hennessyfunds.com/funds/price-performance.
Mutual fund investing involves risk. Principal loss is possible.
Opinions expressed are those of Ryan C. Kelley and are subject to change, are not guaranteed, and should not be considered investment advice.
The Dow Jones Industrial Average and S&P 500® Index are commonly used to measure the performance of U.S. stocks. The S&P 500® Energy Index comprises those companies included in the S&P 500® Index that are classified in the Energy sector. The Russell 1000® Index Financials is a subset of the Russel 1000® Index that measures the performance of securities classified in the Financials sector of the large-capitalization U.S. equity market. The indices are used herein for comparative purposes in accordance with SEC regulations. One cannot invest directly in an index. All returns are shown on a total return basis.
| HENNESSY FUNDS | 1-800-966-4354 |
3
Performance Overview (Unaudited)
CHANGE IN VALUE OF $10,000 INVESTMENT
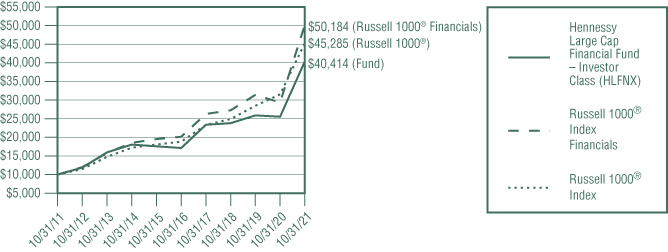
This graph illustrates the performance of an initial investment of $10,000 made in the Fund 10 years ago and assumes the reinvestment of dividends and capital gains.
AVERAGE ANNUAL TOTAL RETURN FOR PERIODS ENDED OCTOBER 31, 2021
| One | Five | Ten | ||
Year | Years | Years | ||
| Hennessy Large Cap Financial Fund – | ||||
| Investor Class (HLFNX) | 58.17% | 18.71% | 14.99% | |
| Hennessy Large Cap Financial Fund – | ||||
Institutional Class (HILFX)(1) | 58.78% | 19.13% | 15.26% | |
Russell 1000® Index Financials | 70.87% | 20.01% | 17.51% | |
Russell 1000® Index | 43.51% | 19.16% | 16.30% |
Expense ratios: 1.75% (Investor Class); 1.45% (Institutional Class)
(1) | The inception date of Institutional Class shares is June 15, 2015. Performance shown prior to the inception of Institutional Class shares reflects the performance of Investor Class shares and includes expenses that are not applicable to, and are higher than, those of Institutional Class shares. |
Performance data quoted represents past performance; past performance does not guarantee future results. The investment return and principal value of an investment will fluctuate so that an investor’s shares, when redeemed, may be worth more or less than their original cost. The performance table does not reflect the deduction of taxes that a shareholder would pay on Fund distributions or the redemption of Fund shares. Current performance of the Fund may be lower or higher than the performance quoted. Performance data current to the most recent month end may be obtained by visiting www.hennessyfunds.com. Performance for periods including or prior to October 26, 2012, is that of the FBR Large Cap Financial Fund.
The Russell 1000® Index Financials is a subset of the Russell 1000® Index that measures the performance of the securities classified in the Financials sector of the large- cap U.S. equity market. The Russell 1000® Index comprises the 1,000 largest companies in the Russell 3000® Index based on market capitalization. One cannot invest directly in an index. These indices are used for comparative purposes in accordance with Securities and Exchange Commission regulations.
Frank Russell Company (“Russell”) is the source and owner of the trademarks, service marks, and copyrights related to the Russell Indexes. Russell® is a trademark of Frank Russell Company. Neither Russell nor its licensors accept any liability for any errors or omissions in
| WWW.HENNESSYFUNDS.COM |
4
| PERFORMANCE OVERVIEW |
the Russell Indexes or Russell ratings or underlying data and no party may rely on any Russell Indexes or Russell ratings or underlying data contained in this communication. No further distribution of Russell data is permitted without Russell’s express written consent. Russell does not promote, sponsor, or endorse the content of this communication.
The expense ratios presented are from the most recent prospectus. The expense ratios for the current reporting period are available in the Financial Highlights section of this report.
PERFORMANCE NARRATIVE
Portfolio Managers David H. Ellison and Ryan C. Kelley, CFA
Performance:
For the one-year period ended October 31, 2021, the Investor Class of the Hennessy Large Cap Financial Fund returned 58.17%, underperforming the Russell 1000® Index Financials (the Fund’s primary benchmark), which returned 70.87%, but outperforming the Russell 1000® Index, which returned 43.51%, for the same period.
In a year when large-cap banks drove the overall Financials sector significantly higher, the Fund’s underperformance relative to its primary benchmark predominantly stemmed from its overweight allocation to financial technology companies, specifically those in the software and services industry. Top positive contributors included Blackstone, Inc., Wells Fargo & Company, and The Goldman Sachs Group, Inc. Among the biggest detractors from Fund performance during the period were Paysafe, Ltd., Alibaba Group Holding Limited, and Ally Financial, Inc.
The Fund continues to hold the companies mentioned except Paysafe and Alibaba Group.
Portfolio Strategy:
Historically, the Fund has been invested primarily in large-cap banks and, to a lesser degree, insurance, real estate, and asset managers. However, we have increased our exposure to electronic payment companies and other financial technology companies over the last few years. We believe that growth in the electronic payment industry will continue as the use of mobile payment methods continues to proliferate.
In general, we seek companies that we believe have high-quality management teams, less complex business models, and the prospect of sustainable earnings growth over time. We also try to identify companies that we expect will do better relative to peers in the current environment, which is characterized by low interest rates, competitive loan markets, evolving electronic payment platforms, growing attention to costs, and business model repositioning. We are less interested in focusing solely on traditional banks that appear to promise an increase in profitability when interest rates rise, loan demand increases, or product pricing becomes more favorable. We believe the timing of these macro industry dynamics is difficult to predict and believe greater opportunity in the short-term and medium-term exists elsewhere in financially related large-cap companies.
Investment Commentary:
Given compelling relative valuations compared to the broader stock market, we believe that attractive long-term opportunities exist within large-cap financial companies despite a somewhat challenging business environment characterized by low interest rates, slow-to no-loan growth, and compressed margins. Despite the Fund benefiting significantly from our positions in traditional large-cap banks this year, we continue to favor those companies with more diverse business models that are less dependent solely on interest
| HENNESSY FUNDS | 1-800-966-4354 |
5
rates. The macroeconomic environment in the United States has improved after a tumultuous 2020, but we believe that there are still many potential challenges in the months to come related to economic growth, loan demand, and the direction of interest rates. However, we are encouraged that banks have amassed sufficient levels of reserves and capital in anticipation of any potential loan charge-offs, and we believe that the current uptick in bank mergers will continue and could benefit certain regional banks looking to grow via acquisitions.
The Fund remains overweight in fee-based electronic service providers and other financial technology companies. We believe these companies will continue to grow their revenues and earnings, driven in part by the global shift towards cashless forms of payment.
_______________
Opinions expressed are those of the Portfolio Managers as of the date written and are subject to change, are not guaranteed, and should not be considered investment advice or an indication of trading intent.
The Fund is non-diversified, meaning it may concentrate its assets in fewer individual holdings than a diversified fund, making it more exposed to individual stock volatility than a diversified fund. Investments are focused in the financial services industry; sector funds may be subject to a higher degree of market risk. The Fund invests in medium-sized companies, which may have limited liquidity and greater volatility compared to larger companies. Please see the Fund’s prospectus for a more complete discussion of these and other risks.
References to specific securities should not be considered a recommendation to buy or sell any security. Fund holdings and sector allocations are subject to change. Please refer to the Schedule of Investments included in this report for additional portfolio information.
Earnings growth is not a measure of the Fund’s future performance.
| WWW.HENNESSYFUNDS.COM |
6
| PERFORMANCE OVERVIEW/SCHEDULE OF INVESTMENTS |
Financial Statements
Schedule of Investments as of October 31, 2021 |
HENNESSY LARGE CAP FINANCIAL FUND
(% of Net Assets)
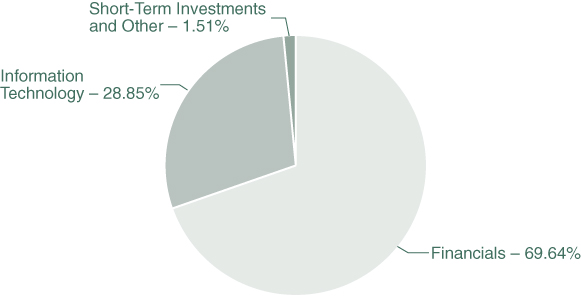
| TOP TEN HOLDINGS (EXCLUDING MONEY MARKET FUNDS) | % NET ASSETS |
| Bank of America Corp. | 5.48% |
| The Goldman Sachs Group, Inc. | 5.15% |
| Blackstone, Inc. | 5.13% |
| Wells Fargo & Co. | 4.94% |
| Morgan Stanley | 4.89% |
| BlackRock, Inc. | 4.75% |
| SoFi Technologies, Inc. | 4.67% |
| JPMorgan Chase & Co. | 4.52% |
| Moody’s Corp. | 4.52% |
| Apple, Inc. | 4.50% |
Note: For presentation purposes, the Fund has grouped some of the industry categories. For purposes of categorizing securities for compliance with Section 8(b)(1) of the Investment Company Act of 1940, as amended, the Fund uses more specific industry classifications.
The Global Industry Classification Standard (GICS®) was developed by and is the exclusive property and a service mark of MSCI, Inc. and Standard & Poor’s Financial Services LLC. It has been licensed for use by the Hennessy Funds.
| HENNESSY FUNDS | 1-800-966-4354 |
7
| COMMON STOCKS – 98.49% | Number | % of | ||||||||||
| of Shares | Value | Net Assets | ||||||||||
| Financials – 69.64% | ||||||||||||
| Ally Financial, Inc. | 60,000 | $ | 2,864,400 | 4.01 | % | |||||||
| Bank of America Corp. | 82,000 | 3,917,960 | 5.48 | % | ||||||||
| BlackRock, Inc. | 3,600 | 3,396,456 | 4.75 | % | ||||||||
| Blackstone, Inc. | 26,500 | 3,668,130 | 5.13 | % | ||||||||
| Capital One Financial Corp. | 21,000 | 3,171,630 | 4.44 | % | ||||||||
| Citigroup, Inc. | 45,500 | 3,146,780 | 4.40 | % | ||||||||
| Huntington Bancshares, Inc. | 187,000 | 2,943,380 | 4.12 | % | ||||||||
| JPMorgan Chase & Co. | 19,000 | 3,227,910 | 4.52 | % | ||||||||
| KeyCorp | 130,000 | 3,025,100 | 4.23 | % | ||||||||
| Moody’s Corp. | 8,000 | 3,233,200 | 4.52 | % | ||||||||
| Morgan Stanley | 34,000 | 3,494,520 | 4.89 | % | ||||||||
| Signature Bank | 5,000 | 1,489,100 | 2.08 | % | ||||||||
| State Street Corp. | 19,000 | 1,872,450 | 2.62 | % | ||||||||
| The Goldman Sachs Group, Inc. | 8,900 | 3,678,815 | 5.15 | % | ||||||||
| Tradeweb Markets, Inc. | 35,000 | 3,118,500 | 4.36 | % | ||||||||
| Wells Fargo & Co. | 69,000 | 3,530,040 | 4.94 | % | ||||||||
| 49,778,371 | 69.64 | % | ||||||||||
| Information Technology – 28.85% | ||||||||||||
| Adyen NV – ADR (a)(b) | 97,000 | 2,945,890 | 4.12 | % | ||||||||
| Apple, Inc. | 21,500 | 3,220,700 | 4.50 | % | ||||||||
| Mastercard, Inc., Class A | 9,500 | 3,187,440 | 4.46 | % | ||||||||
| PayPal Holdings, Inc. (a) | 11,700 | 2,721,303 | 3.81 | % | ||||||||
| SoFi Technologies, Inc. (a) | 166,000 | 3,334,940 | 4.67 | % | ||||||||
| Square, Inc., Class A (a) | 8,500 | 2,163,250 | 3.03 | % | ||||||||
| Visa, Inc., Class A | 14,400 | 3,049,488 | 4.26 | % | ||||||||
| 20,623,011 | 28.85 | % | ||||||||||
| Total Common Stocks | ||||||||||||
| (Cost $41,473,378) | 70,401,382 | 98.49 | % | |||||||||
The accompanying notes are an integral part of these financial statements.
| WWW.HENNESSYFUNDS.COM |
8
| SCHEDULE OF INVESTMENTS |
| SHORT-TERM INVESTMENTS – 1.70% | Number | % of | ||||||||||
| of Shares | Value | Net Assets | ||||||||||
| Money Market Funds – 1.70% | ||||||||||||
| First American Government Obligations Fund, | ||||||||||||
| Institutional Class, 0.03% (c) | 1,215,572 | $ | 1,215,572 | 1.70 | % | |||||||
| Total Short-Term Investments | ||||||||||||
| (Cost $1,215,572) | 1,215,572 | 1.70 | % | |||||||||
| Total Investments | ||||||||||||
| (Cost $42,688,950) – 100.19% | 71,616,954 | 100.19 | % | |||||||||
| Liabilities in Excess of Other Assets – (0.19)% | (133,024 | ) | (0.19 | )% | ||||||||
TOTAL NET ASSETS – 100.00% | $ | 71,483,930 | 100.00 | % | ||||||||
Percentages are stated as a percent of net assets.
ADR – American Depositary Receipt
NV – Naamloze Vennootschap is a Dutch term for publicly traded companies.
| (a) | Non-income-producing security. |
| (b) | U.S.-traded security of a foreign corporation. |
| (c) | The rate listed is the fund’s seven-day yield as of October 31, 2021. |
Summary of Fair Value Exposure as of October 31, 2021
The following is a summary of the inputs used to value the Fund’s net assets as of October 31, 2021 (see Note 3 in the accompanying Notes to the Financial Statements):
| Common Stocks | Level 1 | Level 2 | Level 3 | Total | ||||||||||||
| Financials | $ | 49,778,371 | $ | — | $ | — | $ | 49,778,371 | ||||||||
| Information Technology | 20,623,011 | — | — | 20,623,011 | ||||||||||||
| Total Common Stocks | $ | 70,401,382 | $ | — | $ | — | $ | 70,401,382 | ||||||||
| Short-Term Investments | ||||||||||||||||
| Money Market Funds | $ | 1,215,572 | $ | — | $ | — | $ | 1,215,572 | ||||||||
| Total Short-Term Investments | $ | 1,215,572 | $ | — | $ | — | $ | 1,215,572 | ||||||||
| Total Investments | $ | 71,616,954 | $ | — | $ | — | $ | 71,616,954 | ||||||||
The accompanying notes are an integral part of these financial statements.
| HENNESSY FUNDS | 1-800-966-4354 |
9
Financial Statements
Statement of Assets and Liabilities as of October 31, 2021 |
| ASSETS: | ||||
| Investments in securities, at value (cost $42,688,950) | $ | 71,616,954 | ||
| Dividends and interest receivable | 103,753 | |||
| Receivable for fund shares sold | 146,119 | |||
| Return of capital receivable | 12,709 | |||
| Prepaid expenses and other assets | 16,603 | |||
| Total assets | 71,896,138 | |||
| LIABILITIES: | ||||
| Payable for securities purchased | 176,179 | |||
| Payable for fund shares redeemed | 104,375 | |||
| Payable to advisor | 53,594 | |||
| Payable to administrator | 21,304 | |||
| Payable to auditor | 22,556 | |||
| Accrued distribution fees | 5,238 | |||
| Accrued service fees | 3,070 | |||
| Accrued trustees fees | 6,604 | |||
| Accrued expenses and other payables | 19,288 | |||
| Total liabilities | 412,208 | |||
| NET ASSETS | $ | 71,483,930 | ||
| NET ASSETS CONSISTS OF: | ||||
| Capital stock | $ | 40,323,813 | ||
| Total distributable earnings | 31,160,117 | |||
| Total net assets | $ | 71,483,930 | ||
| NET ASSETS: | ||||
| Investor Class | ||||
| Shares authorized (no par value) | Unlimited | |||
| Net assets applicable to outstanding shares | $ | 36,423,628 | ||
| Shares issued and outstanding | 1,031,172 | |||
| Net asset value, offering price, and redemption price per share | $ | 35.32 | ||
| Institutional Class | ||||
| Shares authorized (no par value) | Unlimited | |||
| Net assets applicable to outstanding shares | $ | 35,060,302 | ||
| Shares issued and outstanding | 984,023 | |||
| Net asset value, offering price, and redemption price per share | $ | 35.63 | ||
The accompanying notes are an integral part of these financial statements.
| WWW.HENNESSYFUNDS.COM |
10
| STATEMENT OF ASSETS AND LIABILITIES/STATEMENT OF OPERATIONS |
Financial Statements
Statement of Operations for the year ended October 31, 2021 |
| INVESTMENT INCOME: | ||||
| Dividend income | $ | 763,575 | ||
| Interest income | 367 | |||
| Total investment income | 763,942 | |||
| EXPENSES: | ||||
| Investment advisory fees (See Note 5) | 568,729 | |||
| Sub-transfer agent expenses – Investor Class (See Note 5) | 64,620 | |||
| Sub-transfer agent expenses – Institutional Class (See Note 5) | 24,956 | |||
| Administration, accounting, custody, and transfer agent fees (See Note 5) | 80,947 | |||
| Distribution fees – Investor Class (See Note 5) | 50,106 | |||
| Federal and state registration fees | 37,144 | |||
| Service fees – Investor Class (See Note 5) | 33,404 | |||
| Compliance expense (See Note 5) | 27,448 | |||
| Audit fees | 22,556 | |||
| Trustees’ fees and expenses | 18,811 | |||
| Reports to shareholders | 10,509 | |||
| Interest expense (See Note 7) | 3,290 | |||
| Legal fees | 1,140 | |||
| Other expenses | 11,249 | |||
| Total expenses | 954,909 | |||
| NET INVESTMENT LOSS | $ | (190,967 | ) | |
| REALIZED AND UNREALIZED GAINS (LOSSES): | ||||
| Net realized gain on investments | $ | 4,934,331 | ||
| Net change in unrealized appreciation/deprecation on investments | 21,198,437 | |||
| Net gain on investments | 26,132,768 | |||
| NET INCREASE IN NET ASSETS RESULTING FROM OPERATIONS | $ | 25,941,801 | ||
The accompanying notes are an integral part of these financial statements.
| HENNESSY FUNDS | 1-800-966-4354 |
11
(This Page Intentionally Left Blank.)
| WWW.HENNESSYFUNDS.COM |
12
| STATEMENTS OF CHANGES IN NET ASSETS |
Financial Statements
| Statements of Changes in Net Assets |
| Year Ended | Year Ended | |||||||
| October 31, 2021 | October 31, 2020 | |||||||
| OPERATIONS: | ||||||||
| Net investment loss | $ | (190,967 | ) | $ | (32,857 | ) | ||
| Net realized gain on investments | 4,934,331 | 885,211 | ||||||
| Net change in unrealized | ||||||||
| appreciation/depreciation on investments | 21,198,437 | (1,457,375 | ) | |||||
| Net increase (decrease) in net | ||||||||
| assets resulting from operations | 25,941,801 | (605,021 | ) | |||||
| CAPITAL SHARE TRANSACTIONS: | ||||||||
| Proceeds from shares subscribed – Investor Class | 10,760,638 | 5,673,827 | ||||||
| Proceeds from shares subscribed – Institutional Class | 24,725,649 | 11,305,560 | ||||||
| Cost of shares redeemed – Investor Class | (10,552,763 | ) | (6,851,490 | ) | ||||
| Cost of shares redeemed – Institutional Class | (23,051,103 | ) | (11,461,893 | ) | ||||
| Net increase (decrease) in net assets | ||||||||
| derived from capital share transactions | 1,882,421 | (1,333,996 | ) | |||||
| TOTAL INCREASE (DECREASE) IN NET ASSETS | 27,824,222 | (1,939,017 | ) | |||||
| NET ASSETS: | ||||||||
| Beginning of year | 43,659,708 | 45,598,725 | ||||||
| End of year | $ | 71,483,930 | $ | 43,659,708 | ||||
| CHANGES IN SHARES OUTSTANDING: | ||||||||
| Shares sold – Investor Class | 356,674 | 276,712 | ||||||
| Shares sold – Institutional Class | 786,529 | 544,138 | ||||||
| Shares redeemed – Investor Class | (333,681 | ) | (312,507 | ) | ||||
| Shares redeemed – Institutional Class | (744,960 | ) | (570,423 | ) | ||||
| Net increase (decrease) in shares outstanding | 64,562 | (62,080 | ) | |||||
The accompanying notes are an integral part of these financial statements.
| HENNESSY FUNDS | 1-800-966-4354 |
13
Financial Statements
| Financial Highlights |
For an Investor Class share outstanding throughout each year
PER SHARE DATA:
Net asset value, beginning of year
Income from investment operations:
Net investment loss
Net realized and unrealized gains (losses) on investments
Total from investment operations
Less distributions:
Dividends from net investment income
Dividends from net realized gains
Total distributions
Net asset value, end of year
TOTAL RETURN
SUPPLEMENTAL DATA AND RATIOS:
Net assets, end of year (millions)
Ratio of expenses to average net assets
Ratio of net investment loss to average net assets
Portfolio turnover rate(2)
(1) | Calculated using the average shares outstanding method. |
(2) | Calculated on the basis of the Fund as a whole. |
The accompanying notes are an integral part of these financial statements.
| WWW.HENNESSYFUNDS.COM |
14
| FINANCIAL HIGHLIGHTS — INVESTOR CLASS |
| Year Ended October 31, | ||||||||||||||||||
| 2021 | 2020 | 2019 | 2018 | 2017 | ||||||||||||||
| $ | 22.33 | $ | 22.63 | $ | 21.43 | $ | 22.02 | $ | 16.23 | |||||||||
| (0.15 | )(1) | (0.05 | )(1) | (0.05 | )(1) | (0.07 | ) | (0.08 | ) | |||||||||
| 13.14 | (0.25 | ) | 1.84 | 0.48 | 5.97 | |||||||||||||
| 12.99 | (0.30 | ) | 1.79 | 0.41 | 5.89 | |||||||||||||
| — | — | — | — | (0.10 | ) | |||||||||||||
| — | — | (0.59 | ) | (1.00 | ) | — | ||||||||||||
| — | — | (0.59 | ) | (1.00 | ) | (0.10 | ) | |||||||||||
| $ | 35.32 | $ | 22.33 | $ | 22.63 | $ | 21.43 | $ | 22.02 | |||||||||
| 58.17 | % | -1.33 | % | 8.75 | % | 1.82 | % | 36.41 | % | |||||||||
| $ | 36.42 | $ | 22.51 | $ | 23.63 | $ | 40.99 | $ | 26.33 | |||||||||
| 1.68 | % | 1.75 | % | 1.82 | % | 1.69 | % | 1.81 | % | |||||||||
| (0.47 | )% | (0.21 | )% | (0.23 | )% | (0.44 | )% | (0.41 | )% | |||||||||
| 62 | % | 88 | % | 83 | % | 64 | % | 76 | % | |||||||||
The accompanying notes are an integral part of these financial statements.
| HENNESSY FUNDS | 1-800-966-4354 |
15
Financial Statements
| Financial Highlights |
For an Institutional Class share outstanding throughout each year
PER SHARE DATA:
Net asset value, beginning of year
Income from investment operations:
Net investment income (loss)
Net realized and unrealized gains (losses) on investments
Total from investment operations
Less distributions:
Dividends from net investment income
Dividends from net realized gains
Total distributions
Net asset value, end of year
TOTAL RETURN
SUPPLEMENTAL DATA AND RATIOS:
Net assets, end of year (millions)
Ratio of expenses to average net assets
Ratio of net investment income (loss) to average net assets
Portfolio turnover rate(2)
(1) | Calculated using the average shares outstanding method. |
(2) | Calculated on the basis of the Fund as a whole. |
The accompanying notes are an integral part of these financial statements.
| WWW.HENNESSYFUNDS.COM |
16
| FINANCIAL HIGHLIGHTS — INSTITUTIONAL CLASS |
| Year Ended October 31, | ||||||||||||||||||
| 2021 | 2020 | 2019 | 2018 | 2017 | ||||||||||||||
| $ | 22.44 | $ | 22.68 | $ | 21.39 | $ | 21.91 | $ | 16.26 | |||||||||
| (0.03 | )(1) | 0.02 | (1) | 0.01 | (1) | 0.03 | 0.18 | |||||||||||
| 13.22 | (0.26 | ) | 1.87 | 0.45 | 5.78 | |||||||||||||
| 13.19 | (0.24 | ) | 1.88 | 0.48 | 5.96 | |||||||||||||
| — | — | — | — | (0.31 | ) | |||||||||||||
| — | — | (0.59 | ) | (1.00 | ) | — | ||||||||||||
| — | — | (0.59 | ) | (1.00 | ) | (0.31 | ) | |||||||||||
| $ | 35.63 | $ | 22.44 | $ | 22.68 | $ | 21.39 | $ | 21.91 | |||||||||
| 58.78 | % | -1.06 | % | 9.16 | % | 2.16 | % | 36.92 | % | |||||||||
| $ | 35.06 | $ | 21.15 | $ | 21.97 | $ | 8.85 | $ | 5.83 | |||||||||
| 1.32 | % | 1.45 | % | 1.43 | % | 1.34 | % | 1.50 | % | |||||||||
| (0.11 | )% | 0.08 | % | 0.05 | % | (0.07 | )% | (0.17 | )% | |||||||||
| 62 | % | 88 | % | 83 | % | 64 | % | 76 | % | |||||||||
The accompanying notes are an integral part of these financial statements.
| HENNESSY FUNDS | 1-800-966-4354 |
17
Financial Statements
Notes to the Financial Statements October 31, 2021 |
1). ORGANIZATION
The Hennessy Large Cap Financial Fund (the “Fund”) is a series of Hennessy Funds Trust (the “Trust”), which was organized as a Delaware statutory trust on September 17, 1992. The Fund is an open-end management investment company registered under the Investment Company Act of 1940, as amended. The investment objective of the Fund is capital appreciation. The Fund is a non-diversified fund.
The Fund offers Investor Class and Institutional Class shares. Each class of shares differs principally in its respective 12b-1 distribution and service, shareholder servicing, and sub-transfer agent expenses. There are no sales charges. Each class has identical rights to earnings, assets, and voting privileges, except for class-specific expenses and exclusive rights to vote on matters affecting only one class.
As an investment company, the Fund follows the investment company accounting and reporting guidance of the Financial Accounting Standards Board (“FASB”) Accounting Standard Codification Topic 946 “Financial Services—Investment Companies.”
2). SIGNIFICANT ACCOUNTING POLICIES
The following is a summary of significant accounting policies consistently followed by the Fund in the preparation of the financial statements. These policies conform to U.S. generally accepted accounting principles (“GAAP”).
| a). | Securities Valuation – All investments in securities are valued in accordance with the Fund’s valuation policies and procedures, as described in Note 3. |
| b). | Federal Income Taxes – The Fund has elected to be taxed as a regulated investment company and intends to distribute substantially all of its taxable income to its shareholders and otherwise comply with the provisions of the Internal Revenue Code of 1986, as amended, applicable to regulated investment companies. As a result, the Fund has made no provision for federal income taxes or excise taxes. Net investment income/loss and realized gains/losses for federal income tax purposes may differ from those reported in the financial statements because of temporary book-basis and tax-basis differences. Temporary differences are primarily the result of the treatment of wash sales for tax reporting purposes. The Fund recognizes interest and penalties related to income tax benefits, if any, in the Statement of Operations as an income tax expense. Distributions from net realized gains for book purposes may include short-term capital gains, which are included as ordinary income to shareholders for tax purposes. The Fund may utilize equalization accounting for tax purposes and designate earnings and profits, including net realized gains distributed to shareholders on redemption of shares, as part of the dividends paid deduction for income tax purposes. |
| Due to inherent differences in the recognition of income, expenses, and realized gains/losses under GAAP and federal income tax regulations, permanent differences between book and tax basis for reporting are identified and appropriately reclassified in the Statement of Assets and Liabilities, as needed. The adjustments for fiscal year 2021 are as follows: |
| Total | |||
| Distributable | |||
Earnings | Capital Stock | ||
| $(419,094) | $419,094 |
| WWW.HENNESSYFUNDS.COM |
18
| NOTES TO THE FINANCIAL STATEMENTS |
| c). | Accounting for Uncertainty in Income Taxes – The Fund has accounting policies regarding recognition and measurement of tax positions taken or expected to be taken on a tax return. The tax returns of the Fund for the prior three fiscal years are open for examination. The Fund has reviewed all open tax years in major tax jurisdictions and concluded that there is no impact on the Fund’s net assets and no tax liability resulting from unrecognized tax benefits relating to uncertain income tax positions taken or expected to be taken on a tax return. The Fund’s major tax jurisdictions are U.S. federal and Delaware. |
| d). | Income and Expenses – Dividend income is recognized on the ex-dividend date or as soon as information is available to the Fund. Interest income, which includes the amortization of premium and accretion of discount, is recognized on an accrual basis. Market discounts, original issue discounts, and market premiums on debt securities are accreted or amortized to interest income over the life of a security with a corresponding increase or decrease, as applicable, in the cost basis of such security using the yield-to-maturity method or, where applicable, the first call date of the security. Other non-cash dividends are recognized as investment income at the fair value of the property received. The Fund is charged for those expenses that are directly attributable to its portfolio, such as advisory, administration, and certain shareholder service fees. Income, expenses (other than expenses attributable to a specific class), and realized and unrealized gains/losses on investments are allocated to each class of shares based on such class’s net assets. |
| e). | Distributions to Shareholders – Dividends from net investment income for the Fund, if any, are declared and paid annually, usually in December. Distributions of net realized capital gains, if any, are declared and paid annually, usually in December. |
| f). | Security Transactions – Investment and shareholder transactions are recorded on the trade date. The Fund determines the realized gain/loss from an investment transaction by comparing the original cost of the security lot sold with the net sale proceeds. Discounts and premiums on securities purchased are accreted or amortized, respectively, over the life of each such security. |
| g). | Use of Estimates – Preparing financial statements in accordance with GAAP requires management to make estimates and assumptions that affect the reported amounts of assets and liabilities and disclosure of contingent assets and liabilities at the date of the financial statements, as well as the reported change in net assets during the reporting period. Actual results could differ from those estimates. |
| h). | Share Valuation – The net asset value (“NAV”) per share of the Fund is calculated by dividing (i) the total value of the securities held by the Fund, plus cash and other assets, minus all liabilities (including estimated accrued expenses) by (ii) the total number of Fund shares outstanding, rounded to the nearest $0.01. Fund shares are not priced on days the New York Stock Exchange is closed for trading. The offering and redemption price per share for the Fund is equal to the Fund’s NAV per share. |
| i). | Recent Accounting Pronouncements and Regulatory Updates – In October 2020, the Securities and Exchange Commission (“SEC”) adopted new regulations governing the use of derivatives by registered investment companies (“Rule 18f-4”). Rule 18f-4 imposes limits on the amount of derivatives a fund can enter into, eliminates the asset segregation framework currently used by funds to comply with Section 18 of the 1940 Act, and requires funds whose use of derivatives is greater than a limited specified amount to establish and maintain a comprehensive derivatives risk management program and appoint a derivatives risk manager. Funds are required to comply with Rule 18f-4 by August 19, 2022. The impact, if any, that Rule 18f-4 will |
| HENNESSY FUNDS | 1-800-966-4354 |
19
| have on the availability, liquidity, and performance of derivatives is unclear. Management is currently evaluating the potential impact of Rule 18f-4 on the Fund. When fully implemented, Rule 18f-4 may require changes in how the Fund uses derivatives, adversely affect the Fund’s performance, and increase costs related to the Fund’s use of derivatives. | |
| In December 2020, the SEC adopted a new rule providing a framework for fund valuation practices (“Rule 2a-5”). Rule 2a-5 establishes requirements for determining fair value in good faith for purposes of the 1940 Act. Rule 2a-5 permits fund boards to designate certain parties to perform fair value determinations, subject to board oversight and certain other conditions. Rule 2a-5 also defines when market quotations are “readily available” for purposes of the 1940 Act and the threshold for determining whether a fund must fair value a security. In connection with Rule 2a-5, the SEC also adopted related recordkeeping requirements and is rescinding previously issued guidance, including with respect to the role of a board in determining fair value and the accounting and auditing of fund investments. Funds must comply with the rules by September 8, 2022. Management is currently assessing the potential impact of the new rules on the Fund’s financial statements. |
3). SECURITIES VALUATION
The Fund follows its valuation policies and procedures in determining its net asset value and, in preparing these financial statements, the fair value accounting standards that establish an authoritative definition of fair value and set out a hierarchy for measuring fair value. These standards require additional disclosures about the various inputs and valuation techniques used to develop the measurements of fair value and a discussion of changes in valuation techniques and related inputs during the period. These inputs are summarized in the three broad levels listed below:
| Level 1 – | Unadjusted, quoted prices in active markets for identical instruments that the Fund has the ability to access at the date of measurement. | |
| Level 2 – | Other significant observable inputs (including, but not limited to, quoted prices in active markets for similar instruments, quoted prices in markets that are not active for identical or similar instruments, and model-derived valuations in which all significant inputs and significant value drivers are observable in active markets, such as interest rates, prepayment speeds, credit risk curves, default rates, and similar data). | |
| Level 3 – | Significant unobservable inputs (including the Fund’s own assumptions about what market participants would use to price the asset or liability based on the best available information) when observable inputs are unavailable. |
The following is a description of the valuation techniques applied to the Fund’s major categories of assets and liabilities on a recurring basis:
Equity Securities – Equity securities, including common stocks, preferred stocks, foreign-issued common stocks, exchange-traded funds, closed-end mutual funds, partnerships, rights, and real estate investment trusts, that are traded on a securities exchange for which a last-quoted sales price is readily available generally are valued at the last sales price as reported by the primary exchange on which the securities are listed. Securities listed on The NASDAQ Stock Market (“NASDAQ”) generally are valued at the NASDAQ Official Closing Price, which may differ from the last sales price reported. Securities traded on a securities exchange for which a last-quoted sales price is not readily available generally are valued at the mean between the bid |
| WWW.HENNESSYFUNDS.COM |
20
| NOTES TO THE FINANCIAL STATEMENTS |
| and ask prices. To the extent these securities are actively traded and valuation adjustments are not applied, they are classified in Level 1 of the fair value hierarchy. Securities traded on foreign exchanges generally are not valued at the same time the Fund calculates its NAV because most foreign markets close well before such time. The earlier close of most foreign markets gives rise to the possibility that significant events, including broad market moves, may have occurred in the interim. In certain circumstances, it may be determined that a foreign security needs to be fair valued because it appears that the value of the security might have been materially affected by events occurring after the close of the market in which the security is principally traded, but before the time the Fund calculates its NAV, such as by a development that affects an entire market or region (e.g., a weather-related event) or a potentially global development (e.g., a terrorist attack that may be expected to have an effect on investor expectations worldwide). | |
Registered Investment Companies – Investments in open-end registered investment companies, commonly referred to as mutual funds, generally are priced at the ending NAV provided by the applicable mutual fund’s service agent and are classified in Level 1 of the fair value hierarchy. | |
Debt Securities – Debt securities, including corporate bonds, asset-backed securities, mortgage-backed securities, municipal bonds, U.S. Treasuries, and U.S. government agency issues, are generally valued at market on the basis of valuations furnished by an independent pricing service that utilizes both dealer-supplied valuations and formula-based techniques. The pricing service may consider recently executed transactions in securities of the issuer or comparable issuers, market price quotations (where observable), bond spreads, and fundamental data relating to the issuer. In addition, the model may incorporate observable market data, such as reported sales of similar securities, broker quotes, yields, bids, offers, and reference data. Certain securities are valued primarily using dealer quotations. These securities are generally classified in Level 2 of the fair value hierarchy. | |
Short-Term Securities – Short-term equity investments, including money market funds, are valued in the manner specified above for equity securities. Short-term debt investments with an original term to maturity of 60 days or less are valued at amortized cost, which approximates fair market value. If the original term to maturity of a short-term debt investment exceeds 60 days, then the values as of the 61st day prior to maturity are amortized. Amortized cost is not used if its use would be inappropriate due to credit or other impairments of the issuer, in which case the security’s fair value would be determined as described below. Short-term securities are generally classified in Level 1 or Level 2 of the fair value hierarchy depending on the inputs used and market activity levels for specific securities. |
The Board of Trustees of the Fund (the “Board”) has adopted fair value pricing procedures that are followed when a price for a security is not readily available or if a significant event has occurred that indicates the closing price of a security no longer represents the true value of that security. Fair value pricing determinations are made in good faith in accordance with these procedures. There are numerous criteria considered in determining a fair value of a security, such as the trading volume of a security and markets, the values of other similar securities, and news events with direct bearing on a security or markets. Fair value pricing results in an estimated price for a security that reflects the amount the Fund might reasonably expect to receive in a current sale. Depending on the relative significance of the valuation inputs, these securities may be classified in either Level 2 or Level 3 of the fair value hierarchy.
| HENNESSY FUNDS | 1-800-966-4354 |
21
The fair value of foreign securities may be determined with the assistance of a pricing service using correlations between the movement of prices of such securities and indices of domestic securities and other appropriate indicators, such as closing market prices of relevant American Depositary Receipts or futures contracts. Using fair value pricing means that the Fund’s NAV reflects the affected portfolio securities’ values as determined by the Board or its designee, pursuant to the fair value pricing procedures adopted by the Board, instead of being determined by the market. Using a fair value pricing methodology to price a foreign security may result in a value that is different from such foreign security’s most recent closing price and from the value used by other investment companies to calculate their NAVs. Such securities are generally classified in Level 2 of the fair value hierarchy. Because the Fund may invest in foreign securities, the value of the Fund’s portfolio securities may change on days when a shareholder is unable to purchase or redeem Fund shares.
The Board has delegated day-to-day valuation matters to the Valuation and Liquidity Committee comprising representatives from Hennessy Advisors, Inc., the Fund’s investment advisor (the “Advisor”). The function of the Valuation and Liquidity Committee, among other things, is to value securities where current and reliable market quotations are not readily available. All actions taken by the Valuation and Liquidity Committee are reviewed by the Board.
The Fund has performed an analysis of all existing investments to determine the significance and character of all inputs to their fair value determinations. Various inputs are used to determine the value of the Fund’s investments. The inputs or methodology used for valuing securities are not necessarily an indication of the risk associated with investing in those securities. Details related to the fair value hierarchy of the Fund’s securities as of October 31, 2021, are included in the Schedule of Investments.
4). INVESTMENT TRANSACTIONS
Purchases and sales of investment securities (excluding government and short-term investments) for the Fund during fiscal year 2021 were $39,953,019 and $38,111,130, respectively.
There were no purchases or sales/maturities of long-term U.S. government securities for the Fund during fiscal year 2021.
5). INVESTMENT ADVISORY FEE AND OTHER TRANSACTIONS WITH AFFILIATES
The Advisor provides the Fund with investment advisory services under an Investment Advisory Agreement. The Advisor furnishes all investment advice, office space, and facilities and most of the personnel needed by the Fund. As compensation for its services, the Advisor is entitled to a monthly fee from the Fund. The fee is based on the average daily net assets of the Fund at an annual rate of 0.90%. The net investment advisory fees expensed by the Fund during fiscal year 2021 are included in the Statement of Operations.
The Board has approved a Shareholder Servicing Agreement for Investor Class shares of the Fund, which compensates the Advisor for the non-investment advisory services it provides to the Fund. The Shareholder Servicing Agreement provides for a monthly fee paid to the Advisor at an annual rate of 0.10% of the average daily net assets of the Fund attributable to Investor Class shares. The shareholder service fees expensed by the Fund during fiscal year 2021 are included in the Statement of Operations.
The Fund has adopted a plan pursuant to Rule 12b-1 under the Investment Company Act of 1940, as amended, that authorizes payments in connection with the distribution of Fund shares at an annual rate of up to 0.25% of the Fund’s average daily net assets attributable to Investor Class shares. Even though the authorized rate is up to
| WWW.HENNESSYFUNDS.COM |
22
| NOTES TO THE FINANCIAL STATEMENTS |
0.25%, the Fund is currently only using up to 0.15% of its average daily net assets attributable to Investor Class shares for such purpose. Amounts paid under the plan may be spent on any activities or expenses primarily intended to result in the sale of shares, including, but not limited to, advertising, shareholder account servicing, printing and mailing of prospectuses to other than current shareholders, printing and mailing of sales literature, and compensation for sales and marketing activities or to financial institutions and others, such as dealers and distributors. The distribution fees expensed by the Fund during fiscal year 2021 are included in the Statement of Operations.
The Fund has entered into agreements with various brokers, dealers, and financial intermediaries in connection with the sale of Fund shares. The agreements provide for periodic payments of sub-transfer agent expenses by the Fund to the brokers, dealers, and financial intermediaries for providing certain shareholder maintenance services. These shareholder services include the pre-processing and quality control of new accounts, shareholder correspondence, answering customer inquiries regarding account status, and facilitating shareholder telephone transactions. The sub-transfer agent fees expensed by the Fund during fiscal year 2021 are included in the Statement of Operations.
��
U.S. Bancorp Fund Services, LLC, d/b/a U.S. Bank Global Fund Services (“Fund Services”) provides the Fund with administrative, accounting, and transfer agent services. As administrator, Fund Services is responsible for activities such as (i) preparing various federal and state regulatory filings, reports, and returns for the Fund, (ii) preparing reports and materials to be supplied to the Board, (iii) monitoring the activities of the Fund’s custodian, transfer agent, and accountants, and (iv) coordinating the preparation and payment of the Fund’s expenses and reviewing the Fund’s expense accruals. U.S. Bank N.A., an affiliate of Fund Services, serves as the Fund’s custodian. The servicing agreements between the Trust, Fund Services, and U.S. Bank N.A. contain a fee schedule that is inclusive of administrative, accounting, custody, and transfer agent fees. The administrative, accounting, custody, and transfer agent fees expensed by the Fund during fiscal year 2021 are included in the Statement of Operations.
Quasar Distributors, LLC (“Quasar”), a wholly owned broker-dealer subsidiary of Foreside Financial Group, LLC (“Foreside”), acts as the Fund’s principal underwriter in a continuous public offering of Fund shares. Effective September 30, 2021, Genstar Capital, a private equity firm specializing in financial and related business service companies, acquired a majority interest in Foreside. The Board approved a new Distribution Agreement to enable Quasar to continue serving as the Fund’s distributor following the change in control of Foreside.
The officers of the Fund are affiliated with the Advisor. With the exception of the Chief Compliance Officer and the Senior Compliance Officer, such officers receive no compensation from the Fund for serving in their respective roles. The Fund, along with the other funds in the Hennessy Funds family (collectively, the “Hennessy Funds”), makes reimbursement payments on an equal basis to the Advisor for a portion of the salary and benefits associated with the office of the Chief Compliance Officer and for all of the salary and benefits associated with the office of the Senior Compliance Officer. The compliance fees expensed by the Fund during fiscal year 2021 are included in the Statement of Operations.
6). GUARANTEES AND INDEMNIFICATIONS
Under the Hennessy Funds’ organizational documents, their officers and trustees are indemnified by the Hennessy Funds against certain liabilities arising out of the performance of their duties to the Hennessy Funds. Additionally, in the normal course of business, the Hennessy Funds enter into contracts with service providers that contain
| HENNESSY FUNDS | 1-800-966-4354 |
23
general indemnification clauses. The Fund’s maximum exposure under these arrangements is unknown as this would involve future claims that may be made against the Fund that have not yet occurred. Currently, the Fund expects the risk of loss to be remote.
7). LINE OF CREDIT
The Fund has an uncommitted line of credit with the other Hennessy Funds in the amount of the lesser of (i) $100,000,000 or (ii) 33.33% of each Hennessy Fund’s net assets, or 30% for the Hennessy Gas Utility Fund and 10% for the Hennessy Balanced Fund. The line of credit is intended to provide any necessary short-term financing in connection with shareholder redemptions, subject to certain restrictions. The credit facility is with the Hennessy Funds’ custodian bank, U.S. Bank N.A. Borrowings under this arrangement bear interest at the bank’s prime rate and are secured by all of the Fund’s assets (as to its own borrowings only). During fiscal year 2021, the Fund had an outstanding average daily balance and a weighted average interest rate of $99,847 and 3.25%, respectively. The interest expensed by the Fund during fiscal year 2021 is included in the Statement of Operations. The maximum amount outstanding for the Fund during fiscal year 2021 was $14,784,000. As of October 31, 2021, the Fund did not have any borrowings outstanding under the line of credit.
8). FEDERAL TAX INFORMATION
As of October 31, 2021, the components of accumulated earnings (losses) for income tax purposes were as follows:
| Investments | ||||
| Cost of investments for tax purposes | $ | 43,654,396 | ||
| Gross tax unrealized appreciation | $ | 29,210,202 | ||
| Gross tax unrealized depreciation | (1,247,644 | ) | ||
| Net tax unrealized appreciation/(depreciation) | $ | 27,962,558 | ||
| Undistributed ordinary income | $ | — | ||
| Undistributed long-term capital gains | 3,485,637 | |||
| Total distributable earnings | $ | 3,485,637 | ||
| Other accumulated gain/(loss) | $ | (288,078 | ) | |
| Total accumulated gain/(loss) | $ | 31,160,117 | ||
The difference between book-basis unrealized appreciation/depreciation and tax-basis unrealized appreciation/depreciation (as shown above) is attributable primarily to wash sales.
As of October 31, 2021, the Fund had no tax-basis capital losses to offset future capital gains. During fiscal year 2021, the capital losses utilized by the Fund were $914,697.
Capital losses sustained in or after fiscal year 2012 can be carried forward indefinitely, but any such loss retains the character of the original loss and must be utilized prior to any loss incurred before fiscal year 2012. As a result of this ordering rule, capital loss carryforwards incurred prior to fiscal year 2012 may be more likely to expire unused. Capital losses sustained prior to fiscal year 2012 can be carried forward for eight years and can be carried forward as short-term capital losses regardless of the character of the original loss.
As of October 31, 2021, the Fund deferred, on a tax basis, a late-year ordinary loss of $288,078. Late-year ordinary losses are net ordinary losses incurred after December 31, 2020, but within the taxable year, that are deemed to arise on the first day of the Fund’s next taxable year.
During fiscal years 2021 and 2020, the Fund did not pay any distributions.
| WWW.HENNESSYFUNDS.COM |
24
| NOTES TO THE FINANCIAL STATEMENTS |
9). LIBOR TRANSITION
The Fund invests in financial instruments with payment obligations, financing terms, hedging strategies, or investment values based on, among other floating rates, the London Interbank Offered Rate (“LIBOR”). Determined by the ICE Benchmark Administration, LIBOR is an average interest rate that banks charge one another for the use of short- term money. In 2017, the United Kingdom’s Financial Conduct Authority (the “FCA”), which regulates LIBOR, announced plans to phase out the use of LIBOR by the end of 2021. The FCA and ICE Benchmark Administrator have since announced that most LIBOR settings will no longer be published after December 31, 2021, and a majority of U.S. dollar LIBOR settings will cease publication after June 30, 2023. The U.S. Federal Reserve has begun publishing the Secured Overnight Financing Rate (SOFR), which is intended to replace the U.S. dollar LIBOR. Other regulators and industry groups around the world have announced or begun publishing proposed alternative reference rates for other currencies, but global consensus is lacking, and the process for amending many existing contracts or instruments to transition away from LIBOR remains unclear. Uncertainty related to the liquidity impact of the change in reference rates and how to appropriately adjust these rates at the time of transition may lead to increased volatility and illiquidity in markets tied to LIBOR, reduce the value of LIBOR-related instruments, and reduce the effectiveness of hedging strategies, which could adversely affect the Fund’s performance. Moreover, the risks associated with this discontinuation and transition could be exacerbated if the work necessary to effect an orderly transition to an alternative reference rate is not completed in a timely manner. Accordingly, it is difficult to predict the full impact of the transition away from LIBOR on the Fund until new reference rates and fallbacks for both legacy and new instruments and contracts are commercially accepted and market practices become settled.
10). EVENTS SUBSEQUENT TO YEAR END
Management has evaluated the Fund’s related events and transactions that occurred subsequent to October 31, 2021, through the date of issuance of the Fund’s financial statements. Other than as disclosed below, management has determined that there were no subsequent events requiring recognition or disclosure in the financial statements.
On December 7, 2021, capital gains were declared and paid to shareholders of record on December 6, 2021, as follows:
Long-term | ||
| Investor Class | $1.65118 | |
| Institutional Class | $1.66621 |
| HENNESSY FUNDS | 1-800-966-4354 |
25
Report of Independent Registered Public
Accounting Firm
To the Board of Trustees of Hennessy Funds Trust
and the shareholders of the Hennessy Large Cap Financial Fund
Novato, CA
Opinion on the Financial Statements
We have audited the accompanying statement of assets and liabilities of the Hennessy Large Cap Financial Fund (the “Fund”), a series of Hennessy Funds Trust, including the schedule of investments, as of October 31, 2021, the related statement of operations for the year then ended, the statements of changes in net assets for each of the two years in the period then ended, financial highlights for each of the five years in the period then ended, and the related notes (collectively referred to as the “financial statements”). In our opinion, the financial statements present fairly, in all material respects, the financial position of the Fund as of October 31, 2021, the results of its operations for the year then ended, the changes in its net assets for each of the two years in the period then ended, and the financial highlights for each of the five years in the period then ended, in conformity with accounting principles generally accepted in the United States of America.
Basis for Opinion
These financial statements are the responsibility of the Fund’s management. Our responsibility is to express an opinion on the Fund’s financial statements based on our audits. We are a public accounting firm registered with the Public Company Accounting Oversight Board (United States) (“PCAOB”) and are required to be independent with respect to the Fund in accordance with the U.S. federal securities laws and the applicable rules and regulations of the Securities and Exchange Commission and the PCAOB. We have served as the auditor of one or more of the funds in the Trust since 2002.
We conducted our audits in accordance with the standards of the PCAOB. Those standards require that we plan and perform the audit to obtain reasonable assurance about whether the financial statements are free of material misstatement, whether due to error or fraud. The Fund is not required to have, nor were we engaged to perform, an audit of its internal control over financial reporting. As part of our audits we are required to obtain an understanding of internal control over financial reporting, but not for the purpose of expressing an opinion on the effectiveness of the Fund’s internal control over financial reporting. Accordingly, we express no such opinion.
Our audits included performing procedures to assess the risks of material misstatement of the financial statements, whether due to error or fraud, and performing procedures that respond to those risks. Such procedures included examining, on a test basis, evidence regarding the amounts and disclosures in the financial statements. Our audits also included evaluating the accounting principles used and significant estimates made by management, as well as evaluating the overall presentation of the financial statements. Our procedures included confirmation of securities owned as of October 31, 2021 by correspondence with the custodian and brokers; when replies were not received from brokers, we performed other auditing procedures. We believe that our audits provide a reasonable basis for our opinion.
| |
| TAIT, WELLER & BAKER LLP |
Philadelphia, Pennsylvania
December 22, 2021
| WWW.HENNESSYFUNDS.COM |
26
| REPORT OF INDEPENDENT REGISTERED PUBLIC ACCOUNTING FIRM/TRUSTEES AND OFFICERS |
Trustees and Officers of the Fund (Unaudited)
The business and affairs of the Funds are managed under the direction of the Board of Trustees of the Trust, and the Board of Trustees elects the officers of the Trust. From time to time, the Board of Trustees also has appointed advisers to the Board of Trustees (“Advisers”) with the intention of having qualified individuals serve in an advisory capacity to garner experience in the mutual fund and asset management industry and be considered as potential Trustees in the future. There are currently two Advisers, Brian Alexander and Doug Franklin. As Advisers, Mr. Alexander and Mr. Franklin attend meetings of the Board of Trustees and act as non-voting participants. Information pertaining to the Trustees, Advisers, and the officers of the Trust is set forth below. The Trustees and officers serve until their successors are duly elected and qualified or until their earlier death, resignation, or removal. Each Trustee oversees all 16 Hennessy Funds. Unless otherwise indicated, the address of all persons listed below is 7250 Redwood Boulevard, Suite 200, Novato, CA 94945. The Fund’s Statement of Additional Information includes more information about the persons listed below and is available without charge by calling 1-800-966-4354 or by visiting www.hennessyfunds.com.
| Other | |||
| Directorships | |||
| Held Outside | |||
| Name, Age, | of Fund | ||
| and Position Held | Start Date | Principal Occupation(s) | Complex During |
with the Trust | of Service | During Past Five Years | Past Five Years |
| Disinterested Trustees and Advisers | |||
| J. Dennis DeSousa | January 1996 | Mr. DeSousa is a real estate investor. | None. |
| 85 | |||
| Trustee | |||
| Robert T. Doyle | January 1996 | Mr. Doyle has been the Sheriff of | None. |
| 74 | Marin County, California since 1996. | ||
| Trustee | |||
| Claire Garvie | December 2015 | Ms. Garvie is a founder of Kiosk and | None. |
| 47 | as an Adviser | has served as its Chief Operating | |
| Trustee | to the Board | Officer since 2004. Kiosk is a full- | |
| and | service marketing agency with | ||
| December 2021 | offices in the San Francisco Bay Area, | ||
| as a Trustee | Toronto, and Liverpool, UK. | ||
| Gerald P. Richardson | May 2004 | Mr. Richardson is an independent | None. |
| 76 | consultant in the securities industry. | ||
| Trustee |
| HENNESSY FUNDS | 1-800-966-4354 |
27
| Other | |||
| Directorships | |||
| Held Outside | |||
| Name, Age, | of Fund | ||
| and Position Held | Start Date | Principal Occupation(s) | Complex During |
with the Trust | of Service | During Past Five Years | Past Five Years |
| Brian Alexander | March 2015 | Mr. Alexander has worked for the | None. |
| 40 | Sutter Health organization since | ||
| Adviser to the Board | 2011 in various positions. He has | ||
| served as the Chief Executive Officer | |||
| of the Sutter Roseville Medical | |||
| Center since 2018. From 2016 through | |||
| 2018, he served as the Vice President | |||
| of Strategy for the Sutter Health Valley | |||
| Area, which includes 11 hospitals, | |||
| 13 ambulatory surgery centers, | |||
| 16,000 employees, and 1,900 physicians. | |||
| From 2013 through 2016, Mr. Alexander | |||
| served as Sutter Novato Community | |||
| Hospital’s Chief Administrative Officer. | |||
| Doug Franklin | March 2016 | Mr. Franklin is a retired insurance | None. |
| 57 | industry executive. From 1987 | ||
| Adviser to the Board | through 2015, he was employed | ||
| by the Allianz-Fireman’s Fund | |||
| Insurance Company in various | |||
| positions, including as its Chief | |||
| Actuary and Chief Risk Officer. | |||
Interested Trustee(1) | |||
| Neil J. Hennessy | January 1996 as | Mr. Hennessy has been employed | Hennessy |
| 65 | a Trustee and | by Hennessy Advisors, Inc. since | Advisors, Inc. |
| Chairman of the Board, | June 2008 as | 1989 and currently serves as its | |
| Chief Market Strategist, | an officer | Chairman and Chief Executive Officer. | |
| Portfolio Manager, | |||
| and President |
| Name, Age, | ||
| and Position Held | Start Date | Principal Occupation(s) |
with the Trust | of Service | During Past Five Years |
| Officers | ||
| Teresa M. Nilsen | January 1996 | Ms. Nilsen has been employed by Hennessy Advisors, Inc. |
| 55 | since 1989 and currently serves as its President and Chief | |
| Executive Vice President | Operating Officer. | |
| and Treasurer | ||
| Daniel B. Steadman | March 2000 | Mr. Steadman has been employed by Hennessy Advisors, Inc. |
| 65 | since 2000 and currently serves as its Executive Vice President. | |
| Executive Vice President | ||
| and Secretary | ||
| Brian Carlson | December 2013 | Mr. Carlson has been employed by Hennessy Advisors, Inc. |
| 49 | since December 2013 and currently serves as its Chief | |
| Senior Vice President | Compliance Officer and Senior Vice President. | |
| and Head of Distribution |
| WWW.HENNESSYFUNDS.COM |
28
| TRUSTEES AND OFFICERS OF THE FUND |
| Name, Age, | ||
| and Position Held | Start Date | Principal Occupation(s) |
with the Trust | of Service | During Past Five Years |
Jennifer Cheskiewicz(2) | June 2013 | Ms. Cheskiewicz has been employed by Hennessy Advisors, Inc. |
| 44 | as its General Counsel since June 2013. | |
| Senior Vice President and | ||
| Chief Compliance Officer | ||
David Ellison(3) | October 2012 | Mr. Ellison has been employed by Hennessy Advisors, Inc. since |
| 63 | October 2012. He has served as a Portfolio Manager of the | |
| Senior Vice President | Hennessy Large Cap Financial Fund and the Hennessy Small | |
| and Portfolio Manager | Cap Financial Fund since their inception. Mr. Ellison also served | |
| as a Portfolio Manager of the Hennessy Technology Fund from | ||
| its inception until February 2017. Mr. Ellison served as Director, | ||
| CIO, and President of FBR Fund Advisers, Inc. from December | ||
| 1999 to October 2012. | ||
Ryan Kelley(4) | March 2013 | Mr. Kelley has been employed by Hennessy Advisors, Inc. since |
| 49 | October 2012. He has served as Chief Investment Officer of the | |
| Chief Investment Officer, | Hennessy Funds since March 2021 and has served as a Portfolio | |
| Senior Vice President, | Manager of the Hennessy Gas Utility Fund, the Hennessy Large | |
| and Portfolio Manager | Cap Financial Fund, and the Hennessy Small Cap Financial Fund | |
| since October 2014. Mr. Kelley served as Co-Portfolio Manager | ||
| of these same funds from March 2013 through September | ||
| 2014 and as a Portfolio Analyst for the Hennessy Funds from | ||
| October 2012 through February 2013. He has also served as a | ||
| Portfolio Manager of the Hennessy Cornerstone Growth Fund, | ||
| the Hennessy Cornerstone Mid Cap 30 Fund, the Hennessy | ||
| Cornerstone Large Growth Fund, and the Hennessy | ||
| Cornerstone Value Fund since February 2017 and as a Portfolio | ||
| Manager of the Hennessy Total Return Fund, the Hennessy | ||
| Balanced Fund, and the Hennessy Technology Fund since May | ||
| 2018. He served as Co-Portfolio Manager of the Hennessy | ||
| Technology Fund from February 2017 until May 2018. Mr. Kelley | ||
| served as Portfolio Manager of FBR Fund Advisers, Inc. from | ||
| January 2008 to October 2012. | ||
L. Joshua Wein(4) | September 2018 | Mr. Wein has been employed by Hennessy Advisors, Inc. since |
| 48 | 2018. He has served as Co-Portfolio Manager of the Hennessy | |
| Vice President and | Cornerstone Growth Fund, the Hennessy Cornerstone | |
| Co-Portfolio Manager | Mid Cap 30 Fund, the Hennessy Cornerstone Large Growth | |
| Fund, the Hennessy Cornerstone Value Fund, Hennessy Total | ||
| Return Fund, the Hennessy Balanced Fund, the Hennessy Gas | ||
| Utility Fund, and the Hennessy Technology Fund since February | ||
| 2019. He served as a Senior Analyst of these same funds from | ||
| September 2018 through February 2019. Mr. Wein served as | ||
| Director of Alternative Investments and Co-Portfolio Manager | ||
| at Sterling Capital Management from 2008 to 2018. |
_______________
(1) | Mr. Hennessy is considered an “interested person,” as defined in the Investment Company Act of 1940, as amended, because he is an officer of the Trust. |
(2) | The address of this officer is 4800 Bee Caves Road, Suite 100, Austin, TX 78746. |
(3) | The address of this officer is 101 Federal Street, Suite 1615B, Boston, MA 02110. |
(4) | The address of this officer is 1340 Environ Way, Chapel Hill, NC 27517. |
| HENNESSY FUNDS | 1-800-966-4354 |
29
Expense Example (Unaudited)
October 31, 2021
As a shareholder of the Fund, you incur ongoing costs, including management fees, service fees, and other Fund expenses. This Example is intended to help you understand your ongoing costs (in dollars) of investing in the Fund and to compare these costs with the ongoing costs of investing in other mutual funds. The Example is based on an investment of $1,000 invested at the beginning of the period and held for the entire period from May 1, 2021, through October 31, 2021.
Actual Expenses
In the table below, the first line under each of the “Investor Class” and “Institutional Class” headings provides information about actual account values and actual expenses for each share class. You may use this information, together with the amount you invested, to estimate the expenses that you paid over the period. Simply divide your account value by $1,000 (for example, an $8,600 account value divided by $1,000 = 8.6), then multiply the result by the number in the first line under the heading “Expenses Paid During Period” to estimate the expenses you paid on your account during this period. Although the Fund charges no sales loads or transaction fees, you will be assessed fees for outgoing wire transfers, returned checks, and stop payment orders at prevailing rates charged by U.S. Bank Global Fund Services, the Fund’s transfer agent. If you request that a redemption be made by wire transfer, the Fund’s transfer agent charges a $15 fee. IRAs are charged a $15 annual maintenance fee (up to $30 maximum per shareholder for shareholders with multiple IRAs). The examples below include, but are not limited to, management, shareholder servicing, accounting, custody, and transfer agent fees. However, the examples below do not include portfolio trading commissions and related expenses.
Hypothetical Example for Comparison Purposes
In the table below, the second line under each of the “Investor Class” and “Institutional Class” headings provides information about hypothetical account values and hypothetical expenses based on the Fund’s actual expense ratio for each share class and an assumed rate of return of 5% per year before expenses, which is not the Fund’s actual return for such share class. The hypothetical account values and expenses may not be used to estimate the actual ending account balance or expenses you paid for the period. You may use this information to compare the ongoing costs of investing in the Fund and other funds. To do so, compare these 5% hypothetical examples with the 5% hypothetical examples that appear in the shareholder reports of the other funds. Please note that the expenses shown in the table are meant to highlight your ongoing costs only. Therefore, the second lines under “Investor Class” and “Institutional Class” are useful in comparing ongoing costs only and will not help you determine the relative total costs of owning different funds.
| WWW.HENNESSYFUNDS.COM |
30
| EXPENSE EXAMPLE |
| Expenses Paid | |||
| Beginning | Ending | During Period(1) | |
| Account Value | Account Value | May 1, 2021 – | |
May 1, 2021 | October 31, 2021 | October 31, 2021 | |
| Investor Class | |||
| Actual | $1,000.00 | $1,077.20 | $8.74 |
| Hypothetical (5% return before expenses) | $1,000.00 | $1,016.79 | $8.49 |
| Institutional Class | |||
| Actual | $1,000.00 | $1,079.00 | $7.13 |
| Hypothetical (5% return before expenses) | $1,000.00 | $1,018.35 | $6.92 |
(1) | Expenses are equal to the Fund’s annualized expense ratio of 1.67% for Investor Class shares or 1.36% for Institutional Class shares, as applicable, multiplied by the average account value over the period, multiplied by 184/365 days (to reflect the half-year period). |
| HENNESSY FUNDS | 1-800-966-4354 |
31
How to Obtain a Copy of the Fund’s Proxy
Voting Policy and Proxy Voting Records
A description of the policies and procedures the Fund uses to determine how to vote proxies relating to portfolio securities is available without charge (1) by calling 1-800-966-4354, (2) on the Hennessy Funds’ website at www.hennessyfunds.com/proxy-voting/voting-policy, or (3) on the U.S. Securities and Exchange Commission’s (the “SEC”) website at www.sec.gov. The Fund’s proxy voting record is available without charge on both the Hennessy Funds’ website at www.hennessyfunds.com/proxy-voting/voting-record and the SEC’s website at www.sec.gov no later than August 31 for the prior 12 months ending June 30.
Availability of Quarterly Portfolio Schedule
The Fund files a complete schedule of portfolio holdings with the SEC for the first and third quarters of each fiscal year as an exhibit to its reports on Form N-PORT. The Fund’s Form N-PORT reports are available on the SEC’s website at www.sec.gov or on request by calling 1-800-966-4354.
Important Notice Regarding Delivery
of Shareholder Documents
To help keep the Fund’s costs as low as possible, we generally deliver a single copy of shareholder reports, proxy statements, and prospectuses to shareholders who share an address and have the same last name. This process does not apply to account statements. You may request an individual copy of a shareholder document at any time. If you would like to receive separate mailings of shareholder documents, please call U.S. Bank Global Fund Services at 1-800-261-6950 or 1-414-765-4124, and individual delivery will begin within 30 days of your request. If your account is held through a financial institution or other intermediary, please contact such intermediary directly to request individual delivery.
Electronic Delivery
As permitted by SEC regulations, the Fund’s shareholder reports are made available on a website, and unless you sign up for eDelivery or elect to receive paper copies as detailed below, you will be notified by mail each time a report is posted and provided with a website link to access the report.
The Fund also offers shareholders the option to receive all notices, account statements, prospectuses, tax forms, and shareholder reports online. To sign up for eDelivery or change your delivery preference, please visit www.hennessyfunds.com/account.
To elect to receive paper copies of all future reports free of charge, please call U.S. Bank Global Fund Services at 1-800-261-6950 or 1-414-765-4124.
Subscribe to receive our team’s unique market and sector insights delivered to your inbox
www.hennessyfunds.com/subscribe
Follow us on social media
| | |
| WWW.HENNESSYFUNDS.COM |
32
| PROXY VOTING — PRIVACY POLICY |
Liquidity Risk Management Program
In accordance with Rule 22e-4 under the Investment Company Act of 1940, as amended (the “Liquidity Rule”), we have adopted and implemented a liquidity risk management program (the “Liquidity Program”). The purpose of the Liquidity Program is to assess and manage the Fund’s liquidity risk, which is the risk that the Fund would not be able to meet requests to redeem Fund shares without significant dilution of the remaining shareholders’ interests in the Fund. The Board of Trustees of the Fund (the “Board”) designated a committee comprising representatives of Hennessy Advisors, Inc., the investment adviser to the Fund, as the administrator of the Liquidity Program (the “Program Administrator”).
The Program Administrator provided a written report regarding the Liquidity Program to the Board in advance of its meeting on June 2, 2021. The report covered the period from June 1, 2020, through May 31, 2021. The report addressed the operation of the Liquidity Program, assessed the adequacy and effectiveness of its implementation, and described any material changes to the Liquidity Program during the review period. The Trust’s chief compliance officer presented the report to the Board at the meeting and provided additional information regarding the Liquidity Program. The Board reviewed the Liquidity Program and considered, among other items, the following:
| 1. | The Program Administrator reviewed daily historical net redemption activity during the review period and during prior periods with higher-than-average redemption activity and concluded that the Fund has historically been able to meet requests to redeem Fund shares without significant dilution to the Fund’s remaining shareholders, and the Program Administrator expects the Fund to be able to continue to do so in the future during both normal and reasonably foreseeable stressed conditions. | |
| 2. | The Fund holds assets that are highly liquid investments and is therefore not required to establish a highly liquid investment minimum for the Fund or adopt policies and procedures for responding to a highly liquid investment minimum shortfall. | |
| 3. | The Program Administrator did not make any material changes to the Liquidity Program during the review period and did not recommend any changes to the Liquidity Program. The Program Administrator did make adjustments to the model inputs used to determine the liquidity classification of each security held by the Fund. | |
| 4. | The Program Administrator concluded that the Liquidity Program was reasonably designed to assess and manage the Fund’s liquidity risk, complies with the requirements of the Liquidity Rule, and was operating as intended during the review period. |
Privacy Policy
We collect the following personal information about you:
| 1. | Information we receive from you in applications or other forms, correspondence, or conversations, including, but not limited to, your name, address, phone number, social security number, assets, income, and date of birth; | |
| 2. | Information about your transactions with us, our affiliates, or others, including, but not limited to, your account number and balance, payments history, parties to transactions, cost basis information, and other financial information; and |
| HENNESSY FUNDS | 1-800-966-4354 |
33
| 3. | Other personal information we collect from various sources, even if you have not entered into a prior transaction with us, including the following: |
| • | Name, alias, address, unique personal identifier, online identifier, IP address, email address, telephone number, account name, and other similar identifiers; | |
| • | Age and marital status; | |
| • | Commercial information, including records of products purchased; | |
| • | Browsing history, search history, and information on interaction with our website; | |
| • | Geolocation data; | |
| • | Employment and employment history, educational history, financial information, and purchasing and consuming histories or tendencies; and | |
| • | Inferences drawn from the above-listed information to create a profile about your preferences, characteristics, predispositions, and behavior. |
We collect this information directly from you, indirectly in the course of providing services to you, directly and indirectly from your activity on our website, from broker dealers, marketing agencies, and other third parties that interact with us in connection with the services we perform and products we offer, and from anonymized and aggregated consumer information.
We use this information to fulfill the reason you provided the information to us, to provide you with other relevant products that you request from us, to provide you with information about products that may interest you, to improve our website or present our website’s contents to you, and as otherwise described to you when collecting your personal information.
We do not disclose any personal information to unaffiliated third parties, except as permitted by law. We may disclose your personal information to our affiliates, vendors, and service providers for a business purpose. For example, we are permitted by law to disclose all of the information we collect, as described above, to our transfer agent to process your transactions. When disclosing your personal information to third parties, we enter into a contract with each third party describing the purpose of such disclosure and requiring that such personal information be kept confidential and not used for any purpose except to perform the services contracted or respond to regulatory or law enforcement requests.
Furthermore, we restrict access to your personal information to those persons who require such information to provide products or services to you. As a result, we do not provide a means for opting out of our limited sharing of your information. We maintain physical, electronic, and procedural safeguards that comply with federal standards to guard your personal information.
If you hold shares of the Funds through a financial intermediary, including, but not limited to, a broker-dealer, bank, or trust company, the privacy policy of your financial intermediary governs how your personal information is shared with unaffiliated third parties.
Supplemental Privacy Notice for Residents of California
The California Consumer Privacy Act of 2018 (the “CCPA”) provides you, as a California resident, with certain additional rights relating to your personal information.
| WWW.HENNESSYFUNDS.COM |
34
| PRIVACY POLICY |
Under the CCPA, you have the right to request that we disclose to you the categories of personal information we have collected about you over the past 12 months, the categories of sources of such information, our business purpose for collecting the information, the categories of third parties, if any, with whom we shared the information, and the specific information we have collected about you. You also have the right to request that we delete any of your personal information, and, unless an exception applies, we will delete such information upon receiving and confirming your request. To make a request, call us at 1-800-966-4354, email us at privacy@hennessyfunds.com, or go to www.hennessyfunds.com/contact. We will not discriminate against you for exercising your rights under the CCPA. Further, we will not collect additional categories of your personal information or use the personal information we collected for materially different, unrelated, or incompatible purposes without providing you notice.
| HENNESSY FUNDS | 1-800-966-4354 |
35
(This Page Intentionally Left Blank.)
For information, questions, or assistance, please call
The Hennessy Funds
1-800-966-4354 or 1-415-899-1555
INVESTMENT ADVISOR
Hennessy Advisors, Inc.
7250 Redwood Boulevard, Suite 200
Novato, California 94945
ADMINISTRATOR,
TRANSFER AGENT,
DIVIDEND PAYING AGENT, &
SHAREHOLDER SERVICING AGENT
U.S. Bancorp Fund Services, LLC
d/b/a U.S. Bank Global Fund Services
P.O. Box 701
Milwaukee, Wisconsin 53201-0701
CUSTODIAN
U.S. Bank N.A.
Custody Operations
1555 North River Center Drive, Suite 302
Milwaukee, Wisconsin 53212
TRUSTEES
Neil J. Hennessy
Robert T. Doyle
J. Dennis DeSousa
Claire Garvie
Gerald P. Richardson
COUNSEL
Foley & Lardner LLP
777 East Wisconsin Avenue
Milwaukee, Wisconsin 53202-5306
INDEPENDENT REGISTERED
PUBLIC ACCOUNTING FIRM
Tait, Weller & Baker LLP
Two Liberty Place
50 South 16th Street, Suite 2900
Philadelphia, Pennsylvania 19102-2529
DISTRIBUTOR
Quasar Distributors, LLC
111 East Kilbourn Avenue, Suite 2200
Milwaukee, Wisconsin 53202
www.hennessyfunds.com | 1-800-966-4354
This report has been prepared for shareholders and may be distributed to
others only if preceded or accompanied by a current prospectus.
ANNUAL REPORT
OCTOBER 31, 2021
HENNESSY SMALL CAP FINANCIAL FUND
Investor Class HSFNX
Institutional Class HISFX
www.hennessyfunds.com | 1-800-966-4354
(This Page Intentionally Left Blank.)
Contents
| Letter to Shareholders | 2 |
| Performance Overview | 4 |
| Financial Statements | |
| Schedule of Investments | 7 |
| Statement of Assets and Liabilities | 10 |
| Statement of Operations | 11 |
| Statements of Changes in Net Assets | 13 |
| Financial Highlights | 14 |
| Notes to the Financial Statements | 18 |
| Report of Independent Registered Public Accounting Firm | 26 |
| Trustees and Officers of the Fund | 27 |
| Expense Example | 30 |
| Proxy Voting Policy and Proxy Voting Records | 32 |
| Availability of Quarterly Portfolio Schedule | 32 |
| Federal Tax Distribution Information | 32 |
| Important Notice Regarding Delivery of Shareholder Documents | 32 |
| Electronic Delivery | 32 |
| Liquidity Risk Management Program | 33 |
| Privacy Policy | 33 |
| HENNESSY FUNDS | 1-800-966-4354 |
December 2021
Dear Hennessy Funds Shareholder:
What a year this has been. While it doesn’t feel that we are out of the “pandemic” phase of the coronavirus crisis, we look forward to a day when we will eventually see fewer cases and potentially less severe variants. We feel extremely grateful to the many healthcare workers who have continued to work tirelessly during the recent surge. As we move through the next year, we hope that new U.S. cases will decline and that many other parts of the world will see improvements as well.
What a year this has been! As measured by the total return of the S&P 500® Index, as of October 31, 2021, the market was up 24.04% calendar year to date. This comes in the wake of a tumultuous 2020 in which the market plunged in the beginning of the pandemic and recovered dramatically to end the year up 18.40%. Interestingly, 18% appears to be a repeating number in the past dozen years. From the low point of the Financial Crisis (March 9, 2009) to the high point reached just prior to the COVID-19 pandemic (February 12, 2020), the S&P 500® Index was up 18.27% per year. We are well aware that past results are not predictive of the future, and we find ourselves naturally skeptical of such strong returns. But, as shown in the chart below, we find that the most common annual total returns of the market over the past 102 years range between 20% and 30% with the second most common being between 10% and 20%:
Source: Bloomberg L.P.
We will say it again, after showing a chart like the one above: Past results are not predictive of the future. Instead, we look at where we are right now – in the economy, in the market, in the business cycle – to reflect on where we have come from and where we may be going. U.S. GDP is strong and growing, interest rates remain low, and earnings growth and profitability remain robust. We believe stocks are trading at reasonable valuations when viewed as a whole, with the S&P 500® Index at 21.0x estimated earnings for 2022. Furthermore, we believe corporate balance sheets are healthy, with high levels of excess cash, which could support growth, increases in dividends, more share buybacks, and future acquisitions. Uncertainty and volatility can manifest at any time in the stock market, and the current market is no different. Investors have questions about inflation, worldwide supply chain issues, and what could drive the next boost in earnings. While these concerns are warranted, we continue to believe that overall the positives outweigh the negatives, and here at Hennessy we continue to see opportunity in the market and in our Funds.
| WWW.HENNESSYFUNDS.COM |
2
| LETTER TO SHAREHOLDERS |
What a (fiscal) year this has been!!! For our fiscal year ended October 31, 2021, the S&P 500® Index rose 42.91% on a total return basis, setting a new all-time high on the final day of the period. Except for a short 21-trading-day period that began on September 2 during which the market fell 5.13% only to rebound to new highs just 13 trading days later, the market has been on a continuous march higher. We saw a dramatic shift in market leadership as many of the sectors that underperformed during our last fiscal year soared in fiscal year 2021. Small-caps beat mid-caps, which in turn beat large-caps. The Energy and Financials sectors skyrocketed during the 12-month period, as reflected by the S&P 500® Energy Sector’s total return of 111.29% and the Russell 1000® Index Financials’ total return of 70.87%. Both of these sectors were among the worst performing in our fiscal year 2020, so a bounce back in our fiscal year 2021, while not a foregone conclusion, was a distinct possibility.
Overall, we are pleased with the performance of our mutual funds during the fiscal year. On an absolute basis, each of our 16 Funds achieved total returns greater than 10% and seven outperformed their primary benchmark. Ten of our 11 domestic equity-only Funds outperformed the S&P 500® Index and posted total returns of 45% or higher. Our four best-performing funds were concentrated in the Energy and Financials sectors. While some of our Funds certainly benefited from being in the “right” sector at the “right” time, we also believe this was a favorable period for our investment style of high-conviction investing and concentrated portfolio construction.
What will the coming year bring? As mentioned in our last shareholder letter (June 2021), we understand that even the greatest bull markets experience corrections along the way, and the last time the S&P 500® Index dropped over 10% was in February/March of 2020. Whether or not a correction occurs sooner or later, we believe the market as a whole has more room to run. We see many factors that could drive the market higher from here: strong GDP growth and increasing corporate earnings, a potentially lower-for-longer interest rate environment, accommodative fiscal and monetary policies, a healthy and robust financial system, low unemployment and solid wage growth, and strong corporate balance sheets with plenty of cash.
Thank you for your interest and for investing with us. We remain committed to managing our portfolios for long-term performance, ever mindful of downside risk. With so many investment options available to you, we are grateful for the trust you put in us and for your continued interest in our family of Funds. If you have any questions or would like to speak with us, please don’t hesitate to call us directly at (800) 966-4354.
Best regards,
| |
| |
| Ryan C. Kelley | |
| Chief Investment Officer |
Past performance does not guarantee future results. To obtain current standardized performance for the Hennessy Funds, visit https://www.hennessyfunds.com/funds/price-performance.
Mutual fund investing involves risk. Principal loss is possible.
Opinions expressed are those of Ryan C. Kelley and are subject to change, are not guaranteed, and should not be considered investment advice.
The Dow Jones Industrial Average and S&P 500® Index are commonly used to measure the performance of U.S. stocks. The S&P 500® Energy Index comprises those companies included in the S&P 500® Index that are classified in the Energy sector. The Russell 1000® Index Financials is a subset of the Russel 1000® Index that measures the performance of securities classified in the Financials sector of the large-capitalization U.S. equity market. The indices are used herein for comparative purposes in accordance with SEC regulations. One cannot invest directly in an index. All returns are shown on a total return basis.
| HENNESSY FUNDS | 1-800-966-4354 |
3
Performance Overview (Unaudited)
CHANGE IN VALUE OF $10,000 INVESTMENT
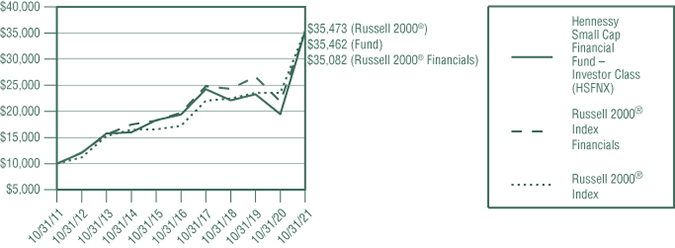
This graph illustrates the performance of an initial investment of $10,000 made in the Fund 10 years ago and assumes the reinvestment of dividends and capital gains.
AVERAGE ANNUAL TOTAL RETURN FOR PERIODS ENDED OCTOBER 31, 2021
| One | Five | Ten | ||
Year | Years | Years | ||
| Hennessy Small Cap Financial Fund – | ||||
| Investor Class (HSFNX) | 82.20% | 12.84% | 13.49% | |
| Hennessy Small Cap Financial Fund – | ||||
| Institutional Class (HISFX) | 82.88% | 13.26% | 13.89% | |
Russell 2000® Index Financials | 60.29% | 12.18% | 13.37% | |
Russell 2000® Index | 50.80% | 15.52% | 13.50% |
Expense ratios: 1.66% (Investor Class); 1.30% (Institutional Class)
Performance data quoted represents past performance; past performance does not guarantee future results. The investment return and principal value of an investment will fluctuate so that an investor’s shares, when redeemed, may be worth more or less than their original cost. The performance table does not reflect the deduction of taxes that a shareholder would pay on Fund distributions or the redemption of Fund shares. Current performance of the Fund may be lower or higher than the performance quoted. Performance data current to the most recent month end may be obtained by visiting www.hennessyfunds.com. Performance for periods including or prior to October 26, 2012, is that of the FBR Small Cap Financial Fund.
The Russell 2000® Index Financials is a subset of the Russell 2000® Index that measures the performance of the securities classified in the Financials sector of the small-cap U.S. equity market. The Russell 2000® Index comprises the smallest 2,000 companies in the Russell 3000® Index based on market capitalization, representing approximately 8% of the Russell 3000® Index in terms of total market capitalization. One cannot invest directly in an index. These indices are used for comparative purposes in accordance with Securities and Exchange Commission regulations.
Frank Russell Company (“Russell”) is the source and owner of the trademarks, service marks, and copyrights related to the Russell Indexes. Russell® is a trademark of Frank Russell Company. Neither Russell nor its licensors accept any liability for any errors or omissions in the Russell Indexes or Russell ratings or underlying data and no party may rely on any Russell Indexes or Russell ratings or underlying data contained in this communication. No
| WWW.HENNESSYFUNDS.COM |
4
| PERFORMANCE OVERVIEW |
further distribution of Russell data is permitted without Russell’s express written consent. Russell does not promote, sponsor, or endorse the content of this communication.
The expense ratios presented are from the most recent prospectus. The expense ratios for the current reporting period are available in the Financial Highlights section of this report.
PERFORMANCE NARRATIVE
Portfolio Managers David H. Ellison and Ryan C. Kelley, CFA
Performance:
For the one-year period ended October 31, 2021, the Investor Class of the Hennessy Small Cap Financial Fund returned 82.20%, outperforming both the Russell 2000® Index Financials (the Fund’s primary benchmark) and the Russell 2000® Index, which returned 60.29% and 50.80%, respectively, for the same period.
The Fund’s outperformance relative to its primary benchmark resulted predominantly from favorable stock selection within small and regional banks. Top contributors to Fund performance included PacWest Bancorp, ConnectOne Bancorp, Inc., and Hancock Whitney Corporation. Conversely, the largest detractors from performance were PCSB Financial Corporation, Silvergate Capital Corporation, and Northeast Community Bancorp, Inc. In general, small-cap financials performed exceptionally well in 2021, both on an absolute basis and when compared to the broader stock market.
The Fund continues to hold the companies mentioned except PCSB Financial.
Portfolio Strategy:
Generally, the Fund tilts its investments more heavily toward regional banks, thrifts, and, at times, mortgage finance companies. Within these preferred sub-industries, we seek companies that we believe have high-quality management teams, uncomplicated business models, strong balance sheets, and sustainable earnings growth opportunities. Moreover, we identify companies that we expect will do better than peers in challenging environments, which are characterized by low interest rates, slow loan growth, and potential for increased loan charge-offs. We are less interested in focusing solely on companies that appear to promise an increase in profitability when interest rates rise, loan demand increases, or product pricing becomes more favorable. We believe these industry dynamics are difficult to predict, and we prefer to focus on companies that are working to remain competitive in the long term.
Investment Commentary:
Following this past year of strong price appreciation, we continue to believe that attractive long-term opportunities exist within our investable universe of small-cap financials, despite a somewhat challenging environment. Challenges include low interest rates, slow-to-no loan growth, and compressed margins. However, we are encouraged that the industry has not experienced significant asset quality problems due to the COVID-19 pandemic and that the industry as a whole continues to have high levels of reserves and capital. This year we have seen a significant increase in merger activity, a trend we believe should continue to drive performance in the Fund. Finally, we continue to believe that valuations are attractive, given that banks are trading at a steep discount to the broader market, despite the significant outperformance in the past year.
_______________
Opinions expressed are those of the Portfolio Managers as of the date written and are subject to change, are not guaranteed, and should not be considered investment advice or an indication of trading intent.
| HENNESSY FUNDS | 1-800-966-4354 |
5
The Fund is non-diversified, meaning it may concentrate its assets in fewer individual holdings than a diversified fund, making it more exposed to individual stock volatility than a diversified fund. Investments are focused in the financial services industry; sector funds may be subject to a higher degree of market risk. The Fund invests in smaller companies, which may have more limited liquidity and greater volatility compared to larger companies. Please see the Fund’s prospectus for a more complete discussion of these and other risks.
References to specific securities should not be considered a recommendation to buy or sell any security. Fund holdings and sector allocations are subject to change. Please refer to the Schedule of Investments included in this report for additional portfolio information.
Earnings growth is not a measure of the Fund’s future performance.
| WWW.HENNESSYFUNDS.COM |
6
| PERFORMANCE OVERVIEW/SCHEDULE OF INVESTMENTS |
Financial Statements
Schedule of Investments as of October 31, 2021 |
HENNESSY SMALL CAP FINANCIAL FUND
(% of Net Assets)
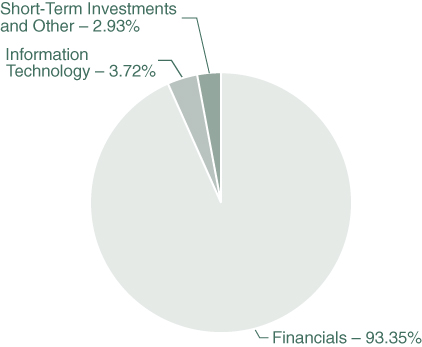
| TOP TEN HOLDINGS (EXCLUDING MONEY MARKET FUNDS) | % NET ASSETS |
| ConnectOne Bancorp, Inc. | 4.70% |
| Hingham Institution for Savings | 4.68% |
| Flushing Financial Corp. | 4.47% |
| Banner Corp. | 4.30% |
| Lakeland Bancorp, Inc. | 4.28% |
| WSFS Financial Corp. | 4.27% |
| HomeTrust Bancshares, Inc. | 4.24% |
| First Midwest Bancorp, Inc. | 4.19% |
| Texas Capital Bancshares, Inc. | 4.05% |
| First BanCorp. | 4.04% |
Note: For presentation purposes, the Fund has grouped some of the industry categories. For purposes of categorizing securities for compliance with Section 8(b)(1) of the Investment Company Act of 1940, as amended, the Fund uses more specific industry classifications.
The Global Industry Classification Standard (GICS®) was developed by and is the exclusive property and a service mark of MSCI, Inc. and Standard & Poor’s Financial Services LLC. It has been licensed for use by the Hennessy Funds.
| HENNESSY FUNDS | 1-800-966-4354 |
7
| COMMON STOCKS – 97.07% | Number | % of | ||||||||||
| of Shares | Value | Net Assets | ||||||||||
| Financials – 93.35% | ||||||||||||
| Associated Banc-Corp. | 200,000 | $ | 4,456,000 | 2.59 | % | |||||||
| BankUnited, Inc. | 75,000 | 3,042,000 | 1.77 | % | ||||||||
| Banner Corp. | 128,000 | 7,393,280 | 4.30 | % | ||||||||
| Berkshire Hills Bancorp, Inc. | 121,000 | 3,285,150 | 1.91 | % | ||||||||
| Cadence Bank | 154,000 | 4,469,080 | 2.60 | % | ||||||||
| CIT Group, Inc. | 126,000 | 6,240,780 | 3.63 | % | ||||||||
| ConnectOne Bancorp, Inc. | 240,000 | 8,095,200 | 4.70 | % | ||||||||
| Eastern Bankshares, Inc. | 175,000 | 3,634,750 | 2.11 | % | ||||||||
| First BanCorp. (a) | 510,000 | 6,961,500 | 4.04 | % | ||||||||
| First Midwest Bancorp, Inc. | 375,000 | 7,218,750 | 4.19 | % | ||||||||
| Flushing Financial Corp. | 320,000 | 7,686,400 | 4.47 | % | ||||||||
| Hancock Whitney Corp. | 140,000 | 6,927,200 | 4.02 | % | ||||||||
| HarborOne Bancorp, Inc. | 175,000 | 2,514,750 | 1.46 | % | ||||||||
| Hingham Institution for Savings | 22,300 | 8,055,652 | 4.68 | % | ||||||||
| HomeTrust Bancshares, Inc. | 240,000 | 7,296,000 | 4.24 | % | ||||||||
| Independent Bank Corp. | 57,500 | 4,858,750 | 2.82 | % | ||||||||
| Investors Bancorp, Inc. | 148,000 | 2,264,400 | 1.32 | % | ||||||||
| Kearny Financial Corp. of Maryland | 400,000 | 5,368,000 | 3.12 | % | ||||||||
| Lakeland Bancorp, Inc. | 410,000 | 7,371,800 | 4.28 | % | ||||||||
| Meridian Bancorp, Inc. | 158,000 | 3,665,600 | 2.13 | % | ||||||||
| New York Community Bancorp, Inc. | 425,000 | 5,282,750 | 3.07 | % | ||||||||
| Northeast Community Bancorp, Inc. | 95,000 | 1,041,200 | 0.61 | % | ||||||||
| Pacific Premier Bancorp, Inc. | 57,500 | 2,414,425 | 1.40 | % | ||||||||
| PacWest Bancorp | 112,000 | 5,316,640 | 3.09 | % | ||||||||
| Shore Bancshares, Inc. | 95,000 | 1,755,600 | 1.02 | % | ||||||||
| Silvergate Capital Corp. (b) | 20,000 | 3,132,400 | 1.82 | % | ||||||||
| Sterling Bancorp | 103,000 | 2,621,350 | 1.52 | % | ||||||||
| Synovus Financial Corp. | 90,000 | 4,193,100 | 2.44 | % | ||||||||
| Texas Capital Bancshares, Inc. (b) | 115,000 | 6,969,000 | 4.05 | % | ||||||||
| Webster Financial Corp. | 30,000 | 1,678,800 | 0.98 | % | ||||||||
| Western New England Bancorp, Inc. | 195,000 | 1,897,350 | 1.10 | % | ||||||||
| Wintrust Financial Corp. | 70,000 | 6,195,000 | 3.60 | % | ||||||||
| WSFS Financial Corp. | 142,000 | 7,357,020 | 4.27 | % | ||||||||
| 160,659,677 | 93.35 | % | ||||||||||
The accompanying notes are an integral part of these financial statements.
| WWW.HENNESSYFUNDS.COM |
8
| SCHEDULE OF INVESTMENTS |
| COMMON STOCKS | Number | % of | ||||||||||
| of Shares | Value | Net Assets | ||||||||||
| Information Technology – 3.72% | ||||||||||||
| Alliance Data Systems Corp. | 75,000 | $ | 6,393,750 | 3.72 | % | |||||||
| Total Common Stocks | ||||||||||||
| (Cost $116,473,036) | 167,053,427 | 97.07 | % | |||||||||
| SHORT-TERM INVESTMENTS – 4.43% | ||||||||||||
| Money Market Funds – 4.43% | ||||||||||||
| First American Government Obligations Fund, | ||||||||||||
| Institutional Class, 0.03% (c) | 7,627,764 | 7,627,764 | 4.43 | % | ||||||||
| Total Short-Term Investments | ||||||||||||
| (Cost $7,627,764) | 7,627,764 | 4.43 | % | |||||||||
| Total Investments | ||||||||||||
| (Cost $124,100,800) – 101.50% | 174,681,191 | 101.50 | % | |||||||||
| Liabilities in Excess of Other Assets – (1.50)% | (2,573,808 | ) | (1.50 | )% | ||||||||
TOTAL NET ASSETS – 100.00% | $ | 172,107,383 | 100.00 | % | ||||||||
Percentages are stated as a percent of net assets.
| (a) | U.S.-traded security of a foreign corporation. |
| (b) | Non-income-producing security. |
| (c) | The rate listed is the fund’s seven-day yield as of October 31, 2021. |
Summary of Fair Value Exposure as of October 31, 2021
The following is a summary of the inputs used to value the Fund’s net assets as of October 31, 2021 (see Note 3 in the accompanying Notes to the Financial Statements):
| Common Stocks | Level 1 | Level 2 | Level 3 | Total | ||||||||||||
| Financials | $ | 160,659,677 | $ | — | $ | — | $ | 160,659,677 | ||||||||
| Information Technology | 6,393,750 | — | — | 6,393,750 | ||||||||||||
| Total Common Stocks | $ | 167,053,427 | $ | — | $ | — | $ | 167,053,427 | ||||||||
| Short-Term Investments | ||||||||||||||||
| Money Market Funds | $ | 7,627,764 | $ | — | $ | — | $ | 7,627,764 | ||||||||
| Total Short-Term Investments | $ | 7,627,764 | $ | — | $ | — | $ | 7,627,764 | ||||||||
| Total Investments | $ | 174,681,191 | $ | — | $ | — | $ | 174,681,191 | ||||||||
The accompanying notes are an integral part of these financial statements.
| HENNESSY FUNDS | 1-800-966-4354 |
9
Financial Statements
Statement of Assets and Liabilities as of October 31, 2021 |
| ASSETS: | ||||
| Investments in securities, at value (cost $124,100,800) | $ | 174,681,191 | ||
| Dividends and interest receivable | 85,193 | |||
| Receivable for fund shares sold | 273,080 | |||
| Prepaid expenses and other assets | 27,465 | |||
| Total assets | 175,066,929 | |||
| LIABILITIES: | ||||
| Payable for securities purchased | 2,630,875 | |||
| Payable for fund shares redeemed | 60,200 | |||
| Payable to advisor | 124,135 | |||
| Payable to administrator | 44,348 | |||
| Payable to auditor | 22,556 | |||
| Accrued distribution fees | 20,402 | |||
| Accrued service fees | 11,638 | |||
| Accrued trustees fees | 6,601 | |||
| Accrued expenses and other payables | 38,791 | |||
| Total liabilities | 2,959,546 | |||
| NET ASSETS | $ | 172,107,383 | ||
| NET ASSETS CONSISTS OF: | ||||
| Capital stock | $ | 122,637,694 | ||
| Total distributable earnings | 49,469,689 | |||
| Total net assets | $ | 172,107,383 | ||
| NET ASSETS: | ||||
| Investor Class | ||||
| Shares authorized (no par value) | Unlimited | |||
| Net assets applicable to outstanding shares | $ | 140,026,141 | ||
| Shares issued and outstanding | 4,442,634 | |||
| Net asset value, offering price, and redemption price per share | $ | 31.52 | ||
| Institutional Class | ||||
| Shares authorized (no par value) | Unlimited | |||
| Net assets applicable to outstanding shares | $ | 32,081,242 | ||
| Shares issued and outstanding | 1,727,333 | |||
| Net asset value, offering price, and redemption price per share | $ | 18.57 | ||
The accompanying notes are an integral part of these financial statements.
| WWW.HENNESSYFUNDS.COM |
10
| STATEMENT OF ASSETS AND LIABILITIES/STATEMENT OF OPERATIONS |
Financial Statements
Statement of Operations for the year ended October 31, 2021 |
| INVESTMENT INCOME: | ||||
Dividend income(1) | $ | 3,178,534 | ||
| Interest income | 775 | |||
| Total investment income | 3,179,309 | |||
| EXPENSES: | ||||
| Investment advisory fees (See Note 5) | 1,150,465 | |||
| Sub-transfer agent expenses – Investor Class (See Note 5) | 219,938 | |||
| Sub-transfer agent expenses – Institutional Class (See Note 5) | 13,860 | |||
| Distribution fees – Investor Class (See Note 5) | 161,462 | |||
| Administration, accounting, custody, and transfer agent fees (See Note 5) | 151,103 | |||
| Service fees – Investor Class (See Note 5) | 107,642 | |||
| Federal and state registration fees | 35,497 | |||
| Compliance expense (See Note 5) | 27,448 | |||
| Audit fees | 22,556 | |||
| Trustees’ fees and expenses | 18,996 | |||
| Reports to shareholders | 13,131 | |||
| Legal fees | 1,959 | |||
| Interest expense (See Note 7) | 414 | |||
| Other expenses | 17,208 | |||
| Total expenses | 1,941,679 | |||
| NET INVESTMENT INCOME | $ | 1,237,630 | ||
| REALIZED AND UNREALIZED GAINS (LOSSES): | ||||
| Net realized gain on investments | $ | 7,181,600 | ||
| Net change in unrealized appreciation/depreciation on investments | 46,273,638 | |||
| Net gain on investments | 53,455,238 | |||
| NET INCREASE IN NET ASSETS RESULTING FROM OPERATIONS | $ | 54,692,868 | ||
(1) | Net of foreign taxes withheld of $12,155. |
The accompanying notes are an integral part of these financial statements.
| HENNESSY FUNDS | 1-800-966-4354 |
11
(This Page Intentionally Left Blank.)
| WWW.HENNESSYFUNDS.COM |
12
| STATEMENTS OF CHANGES IN NET ASSETS |
Financial Statements
| Statements of Changes in Net Assets |
| Year Ended | Year Ended | |||||||
| October 31, 2021 | October 31, 2020 | |||||||
| OPERATIONS: | ||||||||
| Net investment income | $ | 1,237,630 | $ | 774,849 | ||||
| Net realized gain (loss) on investments | 7,181,600 | (8,317,125 | ) | |||||
| Net change in unrealized | ||||||||
| appreciation/depreciation on investments | 46,273,638 | (9,544,740 | ) | |||||
| Net increase (decrease) in net | ||||||||
| assets resulting from operations | 54,692,868 | (17,087,016 | ) | |||||
| DISTRIBUTIONS TO SHAREHOLDERS: | ||||||||
| Distributable earnings – Investor Class | (640,077 | ) | (3,014,018 | ) | ||||
| Distributable earnings – Institutional Class | (266,480 | ) | (963,722 | ) | ||||
| Total distributions | (906,557 | ) | (3,977,740 | ) | ||||
| CAPITAL SHARE TRANSACTIONS: | ||||||||
| Proceeds from shares subscribed – Investor Class | 89,150,331 | 1,461,277 | ||||||
| Proceeds from shares subscribed – Institutional Class | 23,725,263 | 4,656,510 | ||||||
| Dividends reinvested – Investor Class | 621,958 | 2,952,871 | ||||||
| Dividends reinvested – Institutional Class | 237,659 | 935,074 | ||||||
| Cost of shares redeemed – Investor Class | (49,466,414 | ) | (21,427,965 | ) | ||||
| Cost of shares redeemed – Institutional Class | (11,517,594 | ) | (12,043,139 | ) | ||||
| Net increase (decrease) in net assets | ||||||||
| derived from capital share transactions | 52,751,203 | (23,465,372 | ) | |||||
| TOTAL INCREASE (DECREASE) IN NET ASSETS | 106,537,514 | (44,530,128 | ) | |||||
| NET ASSETS: | ||||||||
| Beginning of year | 65,569,869 | 110,099,997 | ||||||
| End of year | $ | 172,107,383 | $ | 65,569,869 | ||||
| CHANGES IN SHARES OUTSTANDING: | ||||||||
| Shares sold – Investor Class | 3,020,767 | 90,621 | ||||||
| Shares sold – Institutional Class | 1,373,793 | 483,086 | ||||||
| Shares issued to holders as reinvestment | ||||||||
| of dividends – Investor Class | 28,361 | 136,924 | ||||||
| Shares issued to holders as reinvestment | ||||||||
| of dividends – Institutional Class | 18,452 | 72,426 | ||||||
| Shares redeemed – Investor Class | (1,754,093 | ) | (1,216,466 | ) | ||||
| Shares redeemed – Institutional Class | (688,529 | ) | (1,136,528 | ) | ||||
| Net increase (decrease) in shares outstanding | 1,998,751 | (1,569,937 | ) | |||||
The accompanying notes are an integral part of these financial statements.
| HENNESSY FUNDS | 1-800-966-4354 |
13
Financial Statements
| Financial Highlights |
For an Investor Class share outstanding throughout each year
PER SHARE DATA:
Net asset value, beginning of year
Income from investment operations:
Net investment income (loss)
Net realized and unrealized gains (losses) on investments
Total from investment operations
Less distributions:
Dividends from net investment income
Dividends from net realized gains
Total distributions
Net asset value, end of year
TOTAL RETURN
SUPPLEMENTAL DATA AND RATIOS:
Net assets, end of year (millions)
Ratio of expenses to average net assets
Ratio of net investment income (loss) to average net assets
Portfolio turnover rate(3)
(1) | Calculated using the average shares outstanding method. |
(2) | Amount is between $(0.005) and $0.005. |
(3) | Calculated on the basis of the Fund as a whole. |
The accompanying notes are an integral part of these financial statements.
| WWW.HENNESSYFUNDS.COM |
14
| FINANCIAL HIGHLIGHTS — INVESTOR CLASS |
| Year Ended October 31, | ||||||||||||||||||
| 2021 | 2020 | 2019 | 2018 | 2017 | ||||||||||||||
| $ | 17.46 | $ | 21.60 | $ | 21.96 | $ | 26.02 | $ | 23.48 | |||||||||
| 0.25 | (1) | 0.16 | (1) | 0.10 | (1) | 0.03 | (0.04 | ) | ||||||||||
| 14.01 | (3.55 | ) | 0.93 | (2.12 | ) | 5.83 | ||||||||||||
| 14.26 | (3.39 | ) | 1.03 | (2.09 | ) | 5.79 | ||||||||||||
| (0.20 | ) | (0.09 | ) | (0.07 | ) | 0.00 | (2) | (0.06 | ) | |||||||||
| — | (0.66 | ) | (1.32 | ) | (1.97 | ) | (3.19 | ) | ||||||||||
| (0.20 | ) | (0.75 | ) | (1.39 | ) | (1.97 | ) | (3.25 | ) | |||||||||
| $ | 31.52 | $ | 17.46 | $ | 21.60 | $ | 21.96 | $ | 26.02 | |||||||||
| 82.20 | % | -16.37 | % | 5.27 | % | -8.79 | % | 25.03 | % | |||||||||
| $ | 140.03 | $ | 54.96 | $ | 89.36 | $ | 122.00 | $ | 174.01 | |||||||||
| 1.58 | % | 1.65 | % | 1.58 | % | 1.54 | % | 1.52 | % | |||||||||
| 0.90 | % | 0.96 | % | 0.47 | % | 0.11 | % | (0.06 | )% | |||||||||
| 28 | % | 75 | % | 46 | % | 28 | % | 46 | % | |||||||||
The accompanying notes are an integral part of these financial statements.
| HENNESSY FUNDS | 1-800-966-4354 |
15
Financial Statements
| Financial Highlights |
For an Institutional Class share outstanding throughout each year
PER SHARE DATA:
Net asset value, beginning of year
Income from investment operations:
Net investment income
Net realized and unrealized gains (losses) on investments
Total from investment operations
Less distributions:
Dividends from net investment income
Dividends from net realized gains
Total distributions
Net asset value, end of year
TOTAL RETURN
SUPPLEMENTAL DATA AND RATIOS:
Net assets, end of year (millions)
Ratio of expenses to average net assets
Ratio of net investment income to average net assets
Portfolio turnover rate(2)
(1) | Calculated using the average shares outstanding method. |
(2) | Calculated on the basis of the Fund as a whole. |
The accompanying notes are an integral part of these financial statements.
| WWW.HENNESSYFUNDS.COM |
16
| FINANCIAL HIGHLIGHTS — INSTITUTIONAL CLASS |
| Year Ended October 31, | ||||||||||||||||||
| 2021 | 2020 | 2019 | 2018 | 2017 | ||||||||||||||
| $ | 10.37 | $ | 12.92 | $ | 13.28 | $ | 15.69 | $ | 14.23 | |||||||||
| 0.21 | (1) | 0.13 | (1) | 0.10 | (1) | 0.07 | 0.02 | |||||||||||
| 8.26 | (2.10 | ) | 0.54 | (1.27 | ) | 3.56 | ||||||||||||
| 8.47 | (1.97 | ) | 0.64 | (1.20 | ) | 3.58 | ||||||||||||
| (0.27 | ) | (0.19 | ) | (0.18 | ) | (0.02 | ) | (0.17 | ) | |||||||||
| — | (0.39 | ) | (0.82 | ) | (1.19 | ) | (1.95 | ) | ||||||||||
| (0.27 | ) | (0.58 | ) | (1.00 | ) | (1.21 | ) | (2.12 | ) | |||||||||
| $ | 18.57 | $ | 10.37 | $ | 12.92 | $ | 13.28 | $ | 15.69 | |||||||||
| 82.88 | % | -16.05 | % | 5.57 | % | -8.42 | % | 25.56 | % | |||||||||
| $ | 32.08 | $ | 10.61 | $ | 20.74 | $ | 35.66 | $ | 37.92 | |||||||||
| 1.20 | % | 1.29 | % | 1.23 | % | 1.15 | % | 1.15 | % | |||||||||
| 1.31 | % | 1.27 | % | 0.84 | % | 0.51 | % | 0.30 | % | |||||||||
| 28 | % | 75 | % | 46 | % | 28 | % | 46 | % | |||||||||
The accompanying notes are an integral part of these financial statements.
| HENNESSY FUNDS | 1-800-966-4354 |
17
Financial Statements
Notes to the Financial Statements October 31, 2021 |
1). ORGANIZATION
The Hennessy Small Cap Financial Fund (the “Fund”) is a series of Hennessy Funds Trust (the “Trust”), which was organized as a Delaware statutory trust on September 17, 1992. The Fund is an open-end management investment company registered under the Investment Company Act of 1940, as amended. The investment objective of the Fund is capital appreciation. The Fund is a non-diversified fund.
The Fund offers Investor Class and Institutional Class shares. Each class of shares differs principally in its respective 12b-1 distribution and service, shareholder servicing, and sub-transfer agent expenses. There are no sales charges. Each class has identical rights to earnings, assets, and voting privileges, except for class-specific expenses and exclusive rights to vote on matters affecting only one class.
As an investment company, the Fund follows the investment company accounting and reporting guidance of the Financial Accounting Standards Board (“FASB”) Accounting Standard Codification Topic 946 “Financial Services—Investment Companies.”
2). SIGNIFICANT ACCOUNTING POLICIES
The following is a summary of significant accounting policies consistently followed by the Fund in the preparation of the financial statements. These policies conform to U.S. generally accepted accounting principles (“GAAP”).
| a). | Securities Valuation – All investments in securities are valued in accordance with the Fund’s valuation policies and procedures, as described in Note 3. |
| b). | Federal Income Taxes – The Fund has elected to be taxed as a regulated investment company and intends to distribute substantially all of its taxable income to its shareholders and otherwise comply with the provisions of the Internal Revenue Code of 1986, as amended, applicable to regulated investment companies. As a result, the Fund has made no provision for federal income taxes or excise taxes. Net investment income/loss and realized gains/losses for federal income tax purposes may differ from those reported in the financial statements because of temporary book-basis and tax-basis differences. Temporary differences are primarily the result of the treatment of wash sales for tax reporting purposes. The Fund recognizes interest and penalties related to income tax benefits, if any, in the Statement of Operations as an income tax expense. Distributions from net realized gains for book purposes may include short-term capital gains, which are included as ordinary income to shareholders for tax purposes. The Fund may utilize equalization accounting for tax purposes and designate earnings and profits, including net realized gains distributed to shareholders on redemption of shares, as part of the dividends paid deduction for income tax purposes. |
| Due to inherent differences in the recognition of income, expenses, and realized gains/losses under GAAP and federal income tax regulations, permanent differences between book and tax basis for reporting are identified and appropriately reclassified in the Statement of Assets and Liabilities, as needed. The adjustments for fiscal year 2021 are as follows: |
| Total | |||
| Distributable | |||
Earnings | Capital Stock | ||
| $(12,940) | $12,940 |
| WWW.HENNESSYFUNDS.COM |
18
| NOTES TO THE FINANCIAL STATEMENTS |
| c). | Accounting for Uncertainty in Income Taxes – The Fund has accounting policies regarding recognition and measurement of tax positions taken or expected to be taken on a tax return. The tax returns of the Fund for the prior three fiscal years are open for examination. The Fund has reviewed all open tax years in major tax jurisdictions and concluded that there is no impact on the Fund’s net assets and no tax liability resulting from unrecognized tax benefits relating to uncertain income tax positions taken or expected to be taken on a tax return. The Fund’s major tax jurisdictions are U.S. federal and Delaware. |
| d). | Income and Expenses – Dividend income is recognized on the ex-dividend date or as soon as information is available to the Fund. Interest income, which includes the amortization of premium and accretion of discount, is recognized on an accrual basis. Market discounts, original issue discounts, and market premiums on debt securities are accreted or amortized to interest income over the life of a security with a corresponding increase or decrease, as applicable, in the cost basis of such security using the yield-to-maturity method or, where applicable, the first call date of the security. Other non-cash dividends are recognized as investment income at the fair value of the property received. The Fund is charged for those expenses that are directly attributable to its portfolio, such as advisory, administration, and certain shareholder service fees. Income, expenses (other than expenses attributable to a specific class), and realized and unrealized gains/losses on investments are allocated to each class of shares based on such class’s net assets. |
| e). | Distributions to Shareholders – Dividends from net investment income for the Fund, if any, are declared and paid annually, usually in December. Distributions of net realized capital gains, if any, are declared and paid annually, usually in December. |
| f). | Security Transactions – Investment and shareholder transactions are recorded on the trade date. The Fund determines the realized gain/loss from an investment transaction by comparing the original cost of the security lot sold with the net sale proceeds. Discounts and premiums on securities purchased are accreted or amortized, respectively, over the life of each such security. |
| g). | Use of Estimates – Preparing financial statements in accordance with GAAP requires management to make estimates and assumptions that affect the reported amounts of assets and liabilities and disclosure of contingent assets and liabilities at the date of the financial statements, as well as the reported change in net assets during the reporting period. Actual results could differ from those estimates. |
| h). | Share Valuation – The net asset value (“NAV”) per share of the Fund is calculated by dividing (i) the total value of the securities held by the Fund, plus cash and other assets, minus all liabilities (including estimated accrued expenses) by (ii) the total number of Fund shares outstanding, rounded to the nearest $0.01. Fund shares are not priced on days the New York Stock Exchange is closed for trading. The offering and redemption price per share for the Fund is equal to the Fund’s NAV per share. |
| i). | Recent Accounting Pronouncements and Regulatory Updates – In October 2020, the Securities and Exchange Commission (“SEC”) adopted new regulations governing the use of derivatives by registered investment companies (“Rule 18f-4”). Rule 18f-4 imposes limits on the amount of derivatives a fund can enter into, eliminates the asset segregation framework currently used by funds to comply with Section 18 of the 1940 Act, and requires funds whose use of derivatives is greater than a limited specified amount to establish and maintain a comprehensive derivatives risk management program and appoint a derivatives risk manager. Funds are required to comply with Rule 18f-4 by August 19, 2022. The impact, if any, that Rule 18f-4 will |
| HENNESSY FUNDS | 1-800-966-4354 |
19
| have on the availability, liquidity, and performance of derivatives is unclear. Management is currently evaluating the potential impact of Rule 18f-4 on the Fund. When fully implemented, Rule 18f-4 may require changes in how the Fund uses derivatives, adversely affect the Fund’s performance, and increase costs related to the Fund’s use of derivatives. | |
| In December 2020, the SEC adopted a new rule providing a framework for fund valuation practices (“Rule 2a-5”). Rule 2a-5 establishes requirements for determining fair value in good faith for purposes of the 1940 Act. Rule 2a-5 permits fund boards to designate certain parties to perform fair value determinations, subject to board oversight and certain other conditions. Rule 2a-5 also defines when market quotations are “readily available” for purposes of the 1940 Act and the threshold for determining whether a fund must fair value a security. In connection with Rule 2a-5, the SEC also adopted related recordkeeping requirements and is rescinding previously issued guidance, including with respect to the role of a board in determining fair value and the accounting and auditing of fund investments. Funds must comply with the rules by September 8, 2022. Management is currently assessing the potential impact of the new rules on the Fund’s financial statements. |
3). SECURITIES VALUATION
The Fund follows its valuation policies and procedures in determining its net asset value and, in preparing these financial statements, the fair value accounting standards that establish an authoritative definition of fair value and set out a hierarchy for measuring fair value. These standards require additional disclosures about the various inputs and valuation techniques used to develop the measurements of fair value and a discussion of changes in valuation techniques and related inputs during the period. These inputs are summarized in the three broad levels listed below:
| Level 1 – | Unadjusted, quoted prices in active markets for identical instruments that the Fund has the ability to access at the date of measurement. | |
| Level 2 – | Other significant observable inputs (including, but not limited to, quoted prices in active markets for similar instruments, quoted prices in markets that are not active for identical or similar instruments, and model-derived valuations in which all significant inputs and significant value drivers are observable in active markets, such as interest rates, prepayment speeds, credit risk curves, default rates, and similar data). | |
| Level 3 – | Significant unobservable inputs (including the Fund’s own assumptions about what market participants would use to price the asset or liability based on the best available information) when observable inputs are unavailable. |
The following is a description of the valuation techniques applied to the Fund’s major categories of assets and liabilities on a recurring basis:
Equity Securities – Equity securities, including common stocks, preferred stocks, foreign-issued common stocks, exchange-traded funds, closed-end mutual funds, partnerships, rights, and real estate investment trusts, that are traded on a securities exchange for which a last-quoted sales price is readily available generally are valued at the last sales price as reported by the primary exchange on which the securities are listed. Securities listed on The NASDAQ Stock Market (“NASDAQ”) generally are valued at the NASDAQ Official Closing Price, which may differ from the last sales price reported. Securities traded on a securities exchange for which a last-quoted sales price is not readily available generally are valued at the mean between the bid |
| WWW.HENNESSYFUNDS.COM |
20
| NOTES TO THE FINANCIAL STATEMENTS |
| and ask prices. To the extent these securities are actively traded and valuation adjustments are not applied, they are classified in Level 1 of the fair value hierarchy. Securities traded on foreign exchanges generally are not valued at the same time the Fund calculates its NAV because most foreign markets close well before such time. The earlier close of most foreign markets gives rise to the possibility that significant events, including broad market moves, may have occurred in the interim. In certain circumstances, it may be determined that a foreign security needs to be fair valued because it appears that the value of the security might have been materially affected by events occurring after the close of the market in which the security is principally traded, but before the time the Fund calculates its NAV, such as by a development that affects an entire market or region (e.g., a weather-related event) or a potentially global development (e.g., a terrorist attack that may be expected to have an effect on investor expectations worldwide). | |
Registered Investment Companies – Investments in open-end registered investment companies, commonly referred to as mutual funds, generally are priced at the ending NAV provided by the applicable mutual fund’s service agent and are classified in Level 1 of the fair value hierarchy. | |
Debt Securities – Debt securities, including corporate bonds, asset-backed securities, mortgage-backed securities, municipal bonds, U.S. Treasuries, and U.S. government agency issues, are generally valued at market on the basis of valuations furnished by an independent pricing service that utilizes both dealer-supplied valuations and formula-based techniques. The pricing service may consider recently executed transactions in securities of the issuer or comparable issuers, market price quotations (where observable), bond spreads, and fundamental data relating to the issuer. In addition, the model may incorporate observable market data, such as reported sales of similar securities, broker quotes, yields, bids, offers, and reference data. Certain securities are valued primarily using dealer quotations. These securities are generally classified in Level 2 of the fair value hierarchy. | |
Short-Term Securities – Short-term equity investments, including money market funds, are valued in the manner specified above for equity securities. Short-term debt investments with an original term to maturity of 60 days or less are valued at amortized cost, which approximates fair market value. If the original term to maturity of a short-term debt investment exceeds 60 days, then the values as of the 61st day prior to maturity are amortized. Amortized cost is not used if its use would be inappropriate due to credit or other impairments of the issuer, in which case the security’s fair value would be determined as described below. Short-term securities are generally classified in Level 1 or Level 2 of the fair value hierarchy depending on the inputs used and market activity levels for specific securities. |
The Board of Trustees of the Fund (the “Board”) has adopted fair value pricing procedures that are followed when a price for a security is not readily available or if a significant event has occurred that indicates the closing price of a security no longer represents the true value of that security. Fair value pricing determinations are made in good faith in accordance with these procedures. There are numerous criteria considered in determining a fair value of a security, such as the trading volume of a security and markets, the values of other similar securities, and news events with direct bearing on a security or markets. Fair value pricing results in an estimated price for a security that reflects the amount the Fund might reasonably expect to receive in a current sale. Depending on the relative significance of the valuation inputs, these securities may be classified in either Level 2 or Level 3 of the fair value hierarchy.
| HENNESSY FUNDS | 1-800-966-4354 |
21
The fair value of foreign securities may be determined with the assistance of a pricing service using correlations between the movement of prices of such securities and indices of domestic securities and other appropriate indicators, such as closing market prices of relevant American Depositary Receipts or futures contracts. Using fair value pricing means that the Fund’s NAV reflects the affected portfolio securities’ values as determined by the Board or its designee, pursuant to the fair value pricing procedures adopted by the Board, instead of being determined by the market. Using a fair value pricing methodology to price a foreign security may result in a value that is different from such foreign security’s most recent closing price and from the value used by other investment companies to calculate their NAVs. Such securities are generally classified in Level 2 of the fair value hierarchy. Because the Fund may invest in foreign securities, the value of the Fund’s portfolio securities may change on days when a shareholder is unable to purchase or redeem Fund shares.
The Board has delegated day-to-day valuation matters to the Valuation and Liquidity Committee comprising representatives from Hennessy Advisors, Inc., the Fund’s investment advisor (the “Advisor”). The function of the Valuation and Liquidity Committee, among other things, is to value securities where current and reliable market quotations are not readily available. All actions taken by the Valuation and Liquidity Committee are reviewed by the Board.
The Fund has performed an analysis of all existing investments to determine the significance and character of all inputs to their fair value determinations. Various inputs are used to determine the value of the Fund’s investments. The inputs or methodology used for valuing securities are not necessarily an indication of the risk associated with investing in those securities. Details related to the fair value hierarchy of the Fund’s securities as of October 31, 2021, are included in the Schedule of Investments.
4). INVESTMENT TRANSACTIONS
Purchases and sales of investment securities (excluding government and short-term investments) for the Fund during fiscal year 2021 were $83,305,079 and $34,599,028, respectively.
There were no purchases or sales/maturities of long-term U.S. government securities for the Fund during fiscal year 2021.
5). INVESTMENT ADVISORY FEE AND OTHER TRANSACTIONS WITH AFFILIATES
The Advisor provides the Fund with investment advisory services under an Investment Advisory Agreement. The Advisor furnishes all investment advice, office space, and facilities and most of the personnel needed by the Fund. As compensation for its services, the Advisor is entitled to a monthly fee from the Fund. The fee is based on the average daily net assets of the Fund at an annual rate of 0.90%. The net investment advisory fees expensed by the Fund during fiscal year 2021 are included in the Statement of Operations.
The Board has approved a Shareholder Servicing Agreement for Investor Class shares of the Fund, which compensates the Advisor for the non-investment advisory services it provides to the Fund. The Shareholder Servicing Agreement provides for a monthly fee paid to the Advisor at an annual rate of 0.10% of the average daily net assets of the Fund attributable to Investor Class shares. The shareholder service fees expensed by the Fund during fiscal year 2021 are included in the Statement of Operations.
The Fund has adopted a plan pursuant to Rule 12b-1 under the Investment Company Act of 1940, as amended, that authorizes payments in connection with the distribution of Fund shares at an annual rate of up to 0.25% of the Fund’s average daily net assets attributable to Investor Class shares. Even though the authorized rate is up to
| WWW.HENNESSYFUNDS.COM |
22
| NOTES TO THE FINANCIAL STATEMENTS |
0.25%, the Fund is currently only using up to 0.15% of its average daily net assets attributable to Investor Class shares for such purpose. Amounts paid under the plan may be spent on any activities or expenses primarily intended to result in the sale of shares, including, but not limited to, advertising, shareholder account servicing, printing and mailing of prospectuses to other than current shareholders, printing and mailing of sales literature, and compensation for sales and marketing activities or to financial institutions and others, such as dealers and distributors. The distribution fees expensed by the Fund during fiscal year 2021 are included in the Statement of Operations.
The Fund has entered into agreements with various brokers, dealers, and financial intermediaries in connection with the sale of Fund shares. The agreements provide for periodic payments of sub-transfer agent expenses by the Fund to the brokers, dealers, and financial intermediaries for providing certain shareholder maintenance services. These shareholder services include the pre-processing and quality control of new accounts, shareholder correspondence, answering customer inquiries regarding account status, and facilitating shareholder telephone transactions. The sub-transfer agent fees expensed by the Fund during fiscal year 2021 are included in the Statement of Operations.
U.S. Bancorp Fund Services, LLC, d/b/a U.S. Bank Global Fund Services (“Fund Services”) provides the Fund with administrative, accounting, and transfer agent services. As administrator, Fund Services is responsible for activities such as (i) preparing various federal and state regulatory filings, reports, and returns for the Fund, (ii) preparing reports and materials to be supplied to the Board, (iii) monitoring the activities of the Fund’s custodian, transfer agent, and accountants, and (iv) coordinating the preparation and payment of the Fund’s expenses and reviewing the Fund’s expense accruals. U.S. Bank N.A., an affiliate of Fund Services, serves as the Fund’s custodian. The servicing agreements between the Trust, Fund Services, and U.S. Bank N.A. contain a fee schedule that is inclusive of administrative, accounting, custody, and transfer agent fees. The administrative, accounting, custody, and transfer agent fees expensed by the Fund during fiscal year 2021 are included in the Statement of Operations.
Quasar Distributors, LLC (“Quasar”), a wholly owned broker-dealer subsidiary of Foreside Financial Group, LLC (“Foreside”), acts as the Fund’s principal underwriter in a continuous public offering of Fund shares. Effective September 30, 2021, Genstar Capital, a private equity firm specializing in financial and related business service companies, acquired a majority interest in Foreside. The Board approved a new Distribution Agreement to enable Quasar to continue serving as the Fund’s distributor following the change in control of Foreside.
The officers of the Fund are affiliated with the Advisor. With the exception of the Chief Compliance Officer and the Senior Compliance Officer, such officers receive no compensation from the Fund for serving in their respective roles. The Fund, along with the other funds in the Hennessy Funds family (collectively, the “Hennessy Funds”), makes reimbursement payments on an equal basis to the Advisor for a portion of the salary and benefits associated with the office of the Chief Compliance Officer and for all of the salary and benefits associated with the office of the Senior Compliance Officer. The compliance fees expensed by the Fund during fiscal year 2021 are included in the Statement of Operations.
6). GUARANTEES AND INDEMNIFICATIONS
Under the Hennessy Funds’ organizational documents, their officers and trustees are indemnified by the Hennessy Funds against certain liabilities arising out of the performance of their duties to the Hennessy Funds. Additionally, in the normal course of business, the Hennessy Funds enter into contracts with service providers that contain
| HENNESSY FUNDS | 1-800-966-4354 |
23
general indemnification clauses. The Fund’s maximum exposure under these arrangements is unknown as this would involve future claims that may be made against the Fund that have not yet occurred. Currently, the Fund expects the risk of loss to be remote.
7). LINE OF CREDIT
The Fund has an uncommitted line of credit with the other Hennessy Funds in the amount of the lesser of (i) $100,000,000 or (ii) 33.33% of each Hennessy Fund’s net assets, or 30% for the Hennessy Gas Utility Fund and 10% for the Hennessy Balanced Fund. The line of credit is intended to provide any necessary short-term financing in connection with shareholder redemptions, subject to certain restrictions. The credit facility is with the Hennessy Funds’ custodian bank, U.S. Bank N.A. Borrowings under this arrangement bear interest at the bank’s prime rate and are secured by all of the Fund’s assets (as to its own borrowings only). During fiscal year 2021, the Fund had an outstanding average daily balance and a weighted average interest rate of $12,562 and 3.25%, respectively. The interest expensed by the Fund during fiscal year 2021 is included in the Statement of Operations. The maximum amount outstanding for the Fund during fiscal year 2021 was $1,399,000. As of October 31, 2021, the Fund did not have any borrowings outstanding under the line of credit.
8). FEDERAL TAX INFORMATION
As of October 31, 2021, the components of accumulated earnings (losses) for income tax purposes were as follows:
| Investments | ||||
| Cost of investments for tax purposes | $ | 126,270,823 | ||
| Gross tax unrealized appreciation | $ | 51,915,639 | ||
| Gross tax unrealized depreciation | (3,505,271 | ) | ||
| Net tax unrealized appreciation/(depreciation) | $ | 48,410,368 | ||
| Undistributed ordinary income | $ | 573,969 | ||
| Undistributed long-term capital gains | 485,352 | |||
| Total distributable earnings | $ | 1,059,321 | ||
| Other accumulated gain/(loss) | $ | — | ||
| Total accumulated gain/(loss) | $ | 49,469,689 | ||
The difference between book-basis unrealized appreciation/depreciation and tax-basis unrealized appreciation/depreciation (as shown above) is attributable primarily to wash sales.
As of October 31, 2021, the Fund had no tax-basis capital losses to offset future capital gains. During fiscal year 2021, the capital losses utilized by the fund were $6,639,295.
Capital losses sustained in or after fiscal year 2012 can be carried forward indefinitely, but any such loss retains the character of the original loss and must be utilized prior to any loss incurred before fiscal year 2012. As a result of this ordering rule, capital loss carryforwards incurred prior to fiscal year 2012 may be more likely to expire unused. Capital losses sustained prior to fiscal year 2012 can be carried forward for eight years and can be carried forward as short-term capital losses regardless of the character of the original loss.
As of October 31, 2021, the Fund did not defer, on a tax basis, any late-year ordinary losses. Late-year ordinary losses are net ordinary losses incurred after December 31, 2020, but within the taxable year, that are deemed to arise on the first day of the Fund’s next taxable year.
| WWW.HENNESSYFUNDS.COM |
24
| NOTES TO THE FINANCIAL STATEMENTS |
During fiscal years 2021 and 2020, the tax character of distributions paid by the Fund was as follows:
| Year Ended | Year Ended | ||||||||
| October 31, 2021 | October 31, 2020 | ||||||||
Ordinary income(1) | $ | 906,557 | $ | 698,496 | |||||
| Long-term capital gains | — | 3,279,244 | |||||||
| Total distributions | $ | 906,557 | $ | 3,977,740 | |||||
(1) Ordinary income includes short-term capital gains. |
9). LIBOR TRANSITION
The Fund invests in financial instruments with payment obligations, financing terms, hedging strategies, or investment values based on, among other floating rates, the London Interbank Offered Rate (“LIBOR”). Determined by the ICE Benchmark Administration, LIBOR is an average interest rate that banks charge one another for the use of short-term money. In 2017, the United Kingdom’s Financial Conduct Authority (the “FCA”), which regulates LIBOR, announced plans to phase out the use of LIBOR by the end of 2021. The FCA and ICE Benchmark Administrator have since announced that most LIBOR settings will no longer be published after December 31, 2021, and a majority of U.S. dollar LIBOR settings will cease publication after June 30, 2023. The U.S. Federal Reserve has begun publishing the Secured Overnight Financing Rate (SOFR), which is intended to replace the U.S. dollar LIBOR. Other regulators and industry groups around the world have announced or begun publishing proposed alternative reference rates for other currencies, but global consensus is lacking, and the process for amending many existing contracts or instruments to transition away from LIBOR remains unclear. Uncertainty related to the liquidity impact of the change in reference rates and how to appropriately adjust these rates at the time of transition may lead to increased volatility and illiquidity in markets tied to LIBOR, reduce the value of LIBOR-related instruments, and reduce the effectiveness of hedging strategies, which could adversely affect the Fund’s performance. Moreover, the risks associated with this discontinuation and transition could be exacerbated if the work necessary to effect an orderly transition to an alternative reference rate is not completed in a timely manner. Accordingly, it is difficult to predict the full impact of the transition away from LIBOR on the Fund until new reference rates and fallbacks for both legacy and new instruments and contracts are commercially accepted and market practices become settled.
10). EVENTS SUBSEQUENT TO YEAR END
Management has evaluated the Fund’s related events and transactions that occurred subsequent to October 31, 2021, through the date of issuance of the Fund’s financial statements. Other than as disclosed below, management has determined that there were no subsequent events requiring recognition or disclosure in the financial statements.
On December 7, 2021, capital gains were declared and paid to shareholders of record on December 6, 2021, as follows:
Long-term | ||
| Investor Class | $0.09117 | |
| Institutional Class | $0.05374 |
| HENNESSY FUNDS | 1-800-966-4354 |
25
Report of Independent Registered Public
Accounting Firm
To the Board of Trustees of Hennessy Funds Trust
and the shareholders of the Hennessy Small Cap Financial Fund
Novato, CA
Opinion on the Financial Statements
We have audited the accompanying statement of assets and liabilities of the Hennessy Small Cap Financial Fund (the “Fund”), a series of Hennessy Funds Trust, including the schedule of investments, as of October 31, 2021, the related statement of operations for the year then ended, the statements of changes in net assets for each of the two years in the period then ended, financial highlights for each of the five years in the period then ended, and the related notes (collectively referred to as the “financial statements”). In our opinion, the financial statements present fairly, in all material respects, the financial position of the Fund as of October 31, 2021, the results of its operations for the year then ended, the changes in its net assets for each of the two years in the period then ended, and the financial highlights for each of the five years in the period then ended, in conformity with accounting principles generally accepted in the United States of America.
Basis for Opinion
These financial statements are the responsibility of the Fund’s management. Our responsibility is to express an opinion on the Fund’s financial statements based on our audits. We are a public accounting firm registered with the Public Company Accounting Oversight Board (United States) (“PCAOB”) and are required to be independent with respect to the Fund in accordance with the U.S. federal securities laws and the applicable rules and regulations of the Securities and Exchange Commission and the PCAOB. We have served as the auditor of one or more of the funds in the Trust since 2002.
We conducted our audits in accordance with the standards of the PCAOB. Those standards require that we plan and perform the audit to obtain reasonable assurance about whether the financial statements are free of material misstatement, whether due to error or fraud. The Fund is not required to have, nor were we engaged to perform, an audit of its internal control over financial reporting. As part of our audits we are required to obtain an understanding of internal control over financial reporting, but not for the purpose of expressing an opinion on the effectiveness of the Fund’s internal control over financial reporting. Accordingly, we express no such opinion.
Our audits included performing procedures to assess the risks of material misstatement of the financial statements, whether due to error or fraud, and performing procedures that respond to those risks. Such procedures included examining, on a test basis, evidence regarding the amounts and disclosures in the financial statements. Our audits also included evaluating the accounting principles used and significant estimates made by management, as well as evaluating the overall presentation of the financial statements. Our procedures included confirmation of securities owned as of October 31, 2021 by correspondence with the custodian and brokers; when replies were not received from brokers, we performed other auditing procedures. We believe that our audits provide a reasonable basis for our opinion.
| |
| TAIT, WELLER & BAKER LLP |
Philadelphia, Pennsylvania
December 22, 2021
| WWW.HENNESSYFUNDS.COM |
26
| REPORT OF INDEPENDENT REGISTERED PUBLIC ACCOUNTING FIRM/TRUSTEES AND OFFICERS |
Trustees and Officers of the Fund (Unaudited)
The business and affairs of the Funds are managed under the direction of the Board of Trustees of the Trust, and the Board of Trustees elects the officers of the Trust. From time to time, the Board of Trustees also has appointed advisers to the Board of Trustees (“Advisers”) with the intention of having qualified individuals serve in an advisory capacity to garner experience in the mutual fund and asset management industry and be considered as potential Trustees in the future. There are currently two Advisers, Brian Alexander and Doug Franklin. As Advisers, Mr. Alexander and Mr. Franklin attend meetings of the Board of Trustees and act as non-voting participants. Information pertaining to the Trustees, Advisers, and the officers of the Trust is set forth below. The Trustees and officers serve until their successors are duly elected and qualified or until their earlier death, resignation, or removal. Each Trustee oversees all 16 Hennessy Funds. Unless otherwise indicated, the address of all persons listed below is 7250 Redwood Boulevard, Suite 200, Novato, CA 94945. The Fund’s Statement of Additional Information includes more information about the persons listed below and is available without charge by calling 1-800-966-4354 or by visiting www.hennessyfunds.com.
| Other | |||
| Directorships | |||
| Held Outside | |||
| Name, Age, | of Fund | ||
| and Position Held | Start Date | Principal Occupation(s) | Complex During |
with the Trust | of Service | During Past Five Years | Past Five Years |
| Disinterested Trustees and Advisers | |||
| J. Dennis DeSousa | January 1996 | Mr. DeSousa is a real estate investor. | None. |
| 85 | |||
| Trustee | |||
| Robert T. Doyle | January 1996 | Mr. Doyle has been the Sheriff of | None. |
| 74 | Marin County, California since 1996. | ||
| Trustee | |||
| Claire Garvie | December 2015 | Ms. Garvie is a founder of Kiosk and | None. |
| 47 | as an Adviser | has served as its Chief Operating | |
| Trustee | to the Board | Officer since 2004. Kiosk is a full- | |
| and | service marketing agency with | ||
| December 2021 | offices in the San Francisco Bay Area, | ||
| as a Trustee | Toronto, and Liverpool, UK. | ||
| Gerald P. Richardson | May 2004 | Mr. Richardson is an independent | None. |
| 76 | consultant in the securities industry. | ||
| Trustee |
| HENNESSY FUNDS | 1-800-966-4354 |
27
| Other | |||
| Directorships | |||
| Held Outside | |||
| Name, Age, | of Fund | ||
| and Position Held | Start Date | Principal Occupation(s) | Complex During |
with the Trust | of Service | During Past Five Years | Past Five Years |
| Brian Alexander | March 2015 | Mr. Alexander has worked for the | None. |
| 40 | Sutter Health organization since | ||
| Adviser to the Board | 2011 in various positions. He has | ||
| served as the Chief Executive Officer | |||
| of the Sutter Roseville Medical | |||
| Center since 2018. From 2016 through | |||
| 2018, he served as the Vice President | |||
| of Strategy for the Sutter Health Valley | |||
| Area, which includes 11 hospitals, | |||
| 13 ambulatory surgery centers, | |||
| 16,000 employees, and 1,900 physicians. | |||
| From 2013 through 2016, Mr. Alexander | |||
| served as Sutter Novato Community | |||
| Hospital’s Chief Administrative Officer. | |||
| Doug Franklin | March 2016 | Mr. Franklin is a retired insurance | None. |
| 57 | industry executive. From 1987 | ||
| Adviser to the Board | through 2015, he was employed | ||
| by the Allianz-Fireman’s Fund | |||
| Insurance Company in various | |||
| positions, including as its Chief | |||
| Actuary and Chief Risk Officer. | |||
Interested Trustee(1) | |||
| Neil J. Hennessy | January 1996 as | Mr. Hennessy has been employed | Hennessy |
| 65 | a Trustee and | by Hennessy Advisors, Inc. since | Advisors, Inc. |
| Chairman of the Board, | June 2008 as | 1989 and currently serves as its | |
| Chief Market Strategist, | an officer | Chairman and Chief Executive Officer. | |
| Portfolio Manager, | |||
| and President |
| Name, Age, | ||
| and Position Held | Start Date | Principal Occupation(s) |
with the Trust | of Service | During Past Five Years |
| Officers | ||
| Teresa M. Nilsen | January 1996 | Ms. Nilsen has been employed by Hennessy Advisors, Inc. |
| 55 | since 1989 and currently serves as its President and Chief | |
| Executive Vice President | Operating Officer. | |
| and Treasurer | ||
| Daniel B. Steadman | March 2000 | Mr. Steadman has been employed by Hennessy Advisors, Inc. |
| 65 | since 2000 and currently serves as its Executive Vice President. | |
| Executive Vice President | ||
| and Secretary | ||
| Brian Carlson | December 2013 | Mr. Carlson has been employed by Hennessy Advisors, Inc. |
| 49 | since December 2013 and currently serves as its Chief | |
| Senior Vice President | Compliance Officer and Senior Vice President. | |
| and Head of Distribution |
| WWW.HENNESSYFUNDS.COM |
28
| TRUSTEES AND OFFICERS OF THE FUND |
| Name, Age, | ||
| and Position Held | Start Date | Principal Occupation(s) |
with the Trust | of Service | During Past Five Years |
Jennifer Cheskiewicz(2) | June 2013 | Ms. Cheskiewicz has been employed by Hennessy Advisors, Inc. |
| 44 | as its General Counsel since June 2013. | |
| Senior Vice President and | ||
| Chief Compliance Officer | ||
David Ellison(3) | October 2012 | Mr. Ellison has been employed by Hennessy Advisors, Inc. since |
| 63 | October 2012. He has served as a Portfolio Manager of the | |
| Senior Vice President | Hennessy Large Cap Financial Fund and the Hennessy Small | |
| and Portfolio Manager | Cap Financial Fund since their inception. Mr. Ellison also served | |
| as a Portfolio Manager of the Hennessy Technology Fund from | ||
| its inception until February 2017. Mr. Ellison served as Director, | ||
| CIO, and President of FBR Fund Advisers, Inc. from December | ||
| 1999 to October 2012. | ||
Ryan Kelley(4) | March 2013 | Mr. Kelley has been employed by Hennessy Advisors, Inc. since |
| 49 | October 2012. He has served as Chief Investment Officer of the | |
| Chief Investment Officer, | Hennessy Funds since March 2021 and has served as a Portfolio | |
| Senior Vice President, | Manager of the Hennessy Gas Utility Fund, the Hennessy Large | |
| and Portfolio Manager | Cap Financial Fund, and the Hennessy Small Cap Financial Fund | |
| since October 2014. Mr. Kelley served as Co-Portfolio Manager | ||
| of these same funds from March 2013 through September | ||
| 2014 and as a Portfolio Analyst for the Hennessy Funds from | ||
| October 2012 through February 2013. He has also served as a | ||
| Portfolio Manager of the Hennessy Cornerstone Growth Fund, | ||
| the Hennessy Cornerstone Mid Cap 30 Fund, the Hennessy | ||
| Cornerstone Large Growth Fund, and the Hennessy | ||
| Cornerstone Value Fund since February 2017 and as a Portfolio | ||
| Manager of the Hennessy Total Return Fund, the Hennessy | ||
| Balanced Fund, and the Hennessy Technology Fund since May | ||
| 2018. He served as Co-Portfolio Manager of the Hennessy | ||
| Technology Fund from February 2017 until May 2018. Mr. Kelley | ||
| served as Portfolio Manager of FBR Fund Advisers, Inc. from | ||
| January 2008 to October 2012. | ||
L. Joshua Wein(4) | September 2018 | Mr. Wein has been employed by Hennessy Advisors, Inc. since |
| 48 | 2018. He has served as Co-Portfolio Manager of the Hennessy | |
| Vice President and | Cornerstone Growth Fund, the Hennessy Cornerstone | |
| Co-Portfolio Manager | Mid Cap 30 Fund, the Hennessy Cornerstone Large Growth | |
| Fund, the Hennessy Cornerstone Value Fund, Hennessy Total | ||
| Return Fund, the Hennessy Balanced Fund, the Hennessy Gas | ||
| Utility Fund, and the Hennessy Technology Fund since February | ||
| 2019. He served as a Senior Analyst of these same funds from | ||
| September 2018 through February 2019. Mr. Wein served as | ||
| Director of Alternative Investments and Co-Portfolio Manager | ||
| at Sterling Capital Management from 2008 to 2018. |
_______________
(1) | Mr. Hennessy is considered an “interested person,” as defined in the Investment Company Act of 1940, as amended, because he is an officer of the Trust. |
(2) | The address of this officer is 4800 Bee Caves Road, Suite 100, Austin, TX 78746. |
(3) | The address of this officer is 101 Federal Street, Suite 1615B, Boston, MA 02110. |
(4) | The address of this officer is 1340 Environ Way, Chapel Hill, NC 27517. |
| HENNESSY FUNDS | 1-800-966-4354 |
29
Expense Example (Unaudited)
October 31, 2021
As a shareholder of the Fund, you incur ongoing costs, including management fees, service fees, and other Fund expenses. This Example is intended to help you understand your ongoing costs (in dollars) of investing in the Fund and to compare these costs with the ongoing costs of investing in other mutual funds. The Example is based on an investment of $1,000 invested at the beginning of the period and held for the entire period from May 1, 2021, through October 31, 2021.
Actual Expenses
In the table below, the first line under each of the “Investor Class” and “Institutional Class” headings provides information about actual account values and actual expenses for each share class. You may use this information, together with the amount you invested, to estimate the expenses that you paid over the period. Simply divide your account value by $1,000 (for example, an $8,600 account value divided by $1,000 = 8.6), then multiply the result by the number in the first line under the heading “Expenses Paid During Period” to estimate the expenses you paid on your account during this period. Although the Fund charges no sales loads or transaction fees, you will be assessed fees for outgoing wire transfers, returned checks, and stop payment orders at prevailing rates charged by U.S. Bank Global Fund Services, the Fund’s transfer agent. If you request that a redemption be made by wire transfer, the Fund’s transfer agent charges a $15 fee. IRAs are charged a $15 annual maintenance fee (up to $30 maximum per shareholder for shareholders with multiple IRAs). The examples below include, but are not limited to, management, shareholder servicing, accounting, custody, and transfer agent fees. However, the examples below do not include portfolio trading commissions and related expenses.
Hypothetical Example for Comparison Purposes
In the table below, the second line under each of the “Investor Class” and “Institutional Class” headings provides information about hypothetical account values and hypothetical expenses based on the Fund’s actual expense ratio for each share class and an assumed rate of return of 5% per year before expenses, which is not the Fund’s actual return for such share class. The hypothetical account values and expenses may not be used to estimate the actual ending account balance or expenses you paid for the period. You may use this information to compare the ongoing costs of investing in the Fund and other funds. To do so, compare these 5% hypothetical examples with the 5% hypothetical examples that appear in the shareholder reports of the other funds. Please note that the expenses shown in the table are meant to highlight your ongoing costs only. Therefore, the second lines under “Investor Class” and “Institutional Class” are useful in comparing ongoing costs only and will not help you determine the relative total costs of owning different funds.
| WWW.HENNESSYFUNDS.COM |
30
| EXPENSE EXAMPLE |
| Expenses Paid | |||
| Beginning | Ending | During Period(1) | |
| Account Value | Account Value | May 1, 2021 – | |
May 1, 2021 | October 31, 2021 | October 31, 2021 | |
| Investor Class | |||
| Actual | $1,000.00 | $1,038.60 | $8.12 |
| Hypothetical (5% return before expenses) | $1,000.00 | $1,017.24 | $8.03 |
| Institutional Class | |||
| Actual | $1,000.00 | $1,040.30 | $6.17 |
| Hypothetical (5% return before expenses) | $1,000.00 | $1,019.16 | $6.11 |
(1) | Expenses are equal to the Fund’s annualized expense ratio of 1.58% for Investor Class shares or 1.20% for Institutional Class shares, as applicable, multiplied by the average account value over the period, multiplied by 184/365 days (to reflect the half-year period). |
| HENNESSY FUNDS | 1-800-966-4354 |
31
How to Obtain a Copy of the Fund’s Proxy
Voting Policy and Proxy Voting Records
A description of the policies and procedures the Fund uses to determine how to vote proxies relating to portfolio securities is available without charge (1) by calling 1-800-966-4354, (2) on the Hennessy Funds’ website at www.hennessyfunds.com/proxy-voting/voting-policy, or (3) on the U.S. Securities and Exchange Commission’s (the “SEC”) website at www.sec.gov. The Fund’s proxy voting record is available without charge on both the Hennessy Funds’ website at www.hennessyfunds.com/proxy-voting/voting-record and the SEC’s website at www.sec.gov no later than August 31 for the prior 12 months ending June 30.
Availability of Quarterly Portfolio Schedule
The Fund files a complete schedule of portfolio holdings with the SEC for the first and third quarters of each fiscal year as an exhibit to its reports on Form N-PORT. The Fund’s Form N-PORT reports are available on the SEC’s website at www.sec.gov or on request by calling 1-800-966-4354.
Federal Tax Distribution Information (Unaudited)
For fiscal year 2021, certain dividends paid by the Fund may be subject to a maximum tax rate of 23.8%, as provided for by the Jobs and Growth Tax Relief Reconciliation Act of 2003. The percentage of dividends declared from ordinary income designated as qualified dividend income was 100.00%.
For corporate shareholders, the percent of ordinary income distributions that qualified for the corporate dividends received deduction for fiscal year 2021 was 100.00%.
The percentage of taxable ordinary income distributions that were designated as short-term capital gain distributions under Section 871(k)(2)(C) of the Internal Revenue Code of 1986, as amended, for the Fund was 0.00%.
Important Notice Regarding Delivery
of Shareholder Documents
To help keep the Fund’s costs as low as possible, we generally deliver a single copy of shareholder reports, proxy statements, and prospectuses to shareholders who share an address and have the same last name. This process does not apply to account statements. You may request an individual copy of a shareholder document at any time. If you would like to receive separate mailings of shareholder documents, please call U.S. Bank Global Fund Services at 1-800-261-6950 or 1-414-765-4124, and individual delivery will begin within 30 days of your request. If your account is held through a financial institution or other intermediary, please contact such intermediary directly to request individual delivery.
Electronic Delivery
As permitted by SEC regulations, the Fund’s shareholder reports are made available on a website, and unless you sign up for eDelivery or elect to receive paper copies as detailed below, you will be notified by mail each time a report is posted and provided with a website link to access the report.
The Fund also offers shareholders the option to receive all notices, account statements, prospectuses, tax forms, and shareholder reports online. To sign up for eDelivery or change your delivery preference, please visit www.hennessyfunds.com/account.
To elect to receive paper copies of all future reports free of charge, please call U.S. Bank Global Fund Services at 1-800-261-6950 or 1-414-765-4124.
Subscribe to receive our team’s unique market and sector insights delivered to your inbox
www.hennessyfunds.com/subscribe
Follow us on social media
| | |
| WWW.HENNESSYFUNDS.COM |
32
| PROXY VOTING — PRIVACY POLICY |
Liquidity Risk Management Program
In accordance with Rule 22e-4 under the Investment Company Act of 1940, as amended (the “Liquidity Rule”), we have adopted and implemented a liquidity risk management program (the “Liquidity Program”). The purpose of the Liquidity Program is to assess and manage the Fund’s liquidity risk, which is the risk that the Fund would not be able to meet requests to redeem Fund shares without significant dilution of the remaining shareholders’ interests in the Fund. The Board of Trustees of the Fund (the “Board”) designated a committee comprising representatives of Hennessy Advisors, Inc., the investment adviser to the Fund, as the administrator of the Liquidity Program (the “Program Administrator”).
The Program Administrator provided a written report regarding the Liquidity Program to the Board in advance of its meeting on June 2, 2021. The report covered the period from June 1, 2020, through May 31, 2021. The report addressed the operation of the Liquidity Program, assessed the adequacy and effectiveness of its implementation, and described any material changes to the Liquidity Program during the review period. The Trust’s chief compliance officer presented the report to the Board at the meeting and provided additional information regarding the Liquidity Program. The Board reviewed the Liquidity Program and considered, among other items, the following:
| 1. | The Program Administrator reviewed daily historical net redemption activity during the review period and during prior periods with higher-than-average redemption activity and concluded that the Fund has historically been able to meet requests to redeem Fund shares without significant dilution to the Fund’s remaining shareholders, and the Program Administrator expects the Fund to be able to continue to do so in the future during both normal and reasonably foreseeable stressed conditions. | |
| 2. | The Fund holds assets that are highly liquid investments and is therefore not required to establish a highly liquid investment minimum for the Fund or adopt policies and procedures for responding to a highly liquid investment minimum shortfall. | |
| 3. | The Program Administrator did not make any material changes to the Liquidity Program during the review period and did not recommend any changes to the Liquidity Program. The Program Administrator did make adjustments to the model inputs used to determine the liquidity classification of each security held by the Fund. | |
| 4. | The Program Administrator concluded that the Liquidity Program was reasonably designed to assess and manage the Fund’s liquidity risk, complies with the requirements of the Liquidity Rule, and was operating as intended during the review period. |
Privacy Policy
We collect the following personal information about you:
| 1. | Information we receive from you in applications or other forms, correspondence, or conversations, including, but not limited to, your name, address, phone number, social security number, assets, income, and date of birth; | |
| 2. | Information about your transactions with us, our affiliates, or others, including, but not limited to, your account number and balance, payments history, parties to transactions, cost basis information, and other financial information; and |
| HENNESSY FUNDS | 1-800-966-4354 |
33
| 3. | Other personal information we collect from various sources, even if you have not entered into a prior transaction with us, including the following: |
| • | Name, alias, address, unique personal identifier, online identifier, IP address, email address, telephone number, account name, and other similar identifiers; | |
| • | Age and marital status; | |
| • | Commercial information, including records of products purchased; | |
| • | Browsing history, search history, and information on interaction with our website; | |
| • | Geolocation data; | |
| • | Employment and employment history, educational history, financial information, and purchasing and consuming histories or tendencies; and | |
| • | Inferences drawn from the above-listed information to create a profile about your preferences, characteristics, predispositions, and behavior. |
We collect this information directly from you, indirectly in the course of providing services to you, directly and indirectly from your activity on our website, from broker dealers, marketing agencies, and other third parties that interact with us in connection with the services we perform and products we offer, and from anonymized and aggregated consumer information.
We use this information to fulfill the reason you provided the information to us, to provide you with other relevant products that you request from us, to provide you with information about products that may interest you, to improve our website or present our website’s contents to you, and as otherwise described to you when collecting your personal information.
We do not disclose any personal information to unaffiliated third parties, except as permitted by law. We may disclose your personal information to our affiliates, vendors, and service providers for a business purpose. For example, we are permitted by law to disclose all of the information we collect, as described above, to our transfer agent to process your transactions. When disclosing your personal information to third parties, we enter into a contract with each third party describing the purpose of such disclosure and requiring that such personal information be kept confidential and not used for any purpose except to perform the services contracted or respond to regulatory or law enforcement requests.
Furthermore, we restrict access to your personal information to those persons who require such information to provide products or services to you. As a result, we do not provide a means for opting out of our limited sharing of your information. We maintain physical, electronic, and procedural safeguards that comply with federal standards to guard your personal information.
If you hold shares of the Funds through a financial intermediary, including, but not limited to, a broker-dealer, bank, or trust company, the privacy policy of your financial intermediary governs how your personal information is shared with unaffiliated third parties.
Supplemental Privacy Notice for Residents of California
The California Consumer Privacy Act of 2018 (the “CCPA”) provides you, as a California resident, with certain additional rights relating to your personal information.
| WWW.HENNESSYFUNDS.COM |
34
| PRIVACY POLICY |
Under the CCPA, you have the right to request that we disclose to you the categories of personal information we have collected about you over the past 12 months, the categories of sources of such information, our business purpose for collecting the information, the categories of third parties, if any, with whom we shared the information, and the specific information we have collected about you. You also have the right to request that we delete any of your personal information, and, unless an exception applies, we will delete such information upon receiving and confirming your request. To make a request, call us at 1-800-966-4354, email us at privacy@hennessyfunds.com, or go to www.hennessyfunds.com/contact. We will not discriminate against you for exercising your rights under the CCPA. Further, we will not collect additional categories of your personal information or use the personal information we collected for materially different, unrelated, or incompatible purposes without providing you notice.
| HENNESSY FUNDS | 1-800-966-4354 |
35
(This Page Intentionally Left Blank.)
For information, questions, or assistance, please call
The Hennessy Funds
1-800-966-4354 or 1-415-899-1555
INVESTMENT ADVISOR
Hennessy Advisors, Inc.
7250 Redwood Boulevard, Suite 200
Novato, California 94945
ADMINISTRATOR,
TRANSFER AGENT,
DIVIDEND PAYING AGENT, &
SHAREHOLDER SERVICING AGENT
U.S. Bancorp Fund Services, LLC
d/b/a U.S. Bank Global Fund Services
P.O. Box 701
Milwaukee, Wisconsin 53201-0701
CUSTODIAN
U.S. Bank N.A.
Custody Operations
1555 North River Center Drive, Suite 302
Milwaukee, Wisconsin 53212
TRUSTEES
Neil J. Hennessy
Robert T. Doyle
J. Dennis DeSousa
Claire Garvie
Gerald P. Richardson
COUNSEL
Foley & Lardner LLP
777 East Wisconsin Avenue
Milwaukee, Wisconsin 53202-5306
INDEPENDENT REGISTERED
PUBLIC ACCOUNTING FIRM
Tait, Weller & Baker LLP
Two Liberty Place
50 South 16th Street, Suite 2900
Philadelphia, Pennsylvania 19102-2529
DISTRIBUTOR
Quasar Distributors, LLC
111 East Kilbourn Avenue, Suite 2200
Milwaukee, Wisconsin 53202
www.hennessyfunds.com | 1-800-966-4354
This report has been prepared for shareholders and may be distributed to
others only if preceded or accompanied by a current prospectus.
ANNUAL REPORT
OCTOBER 31, 2021

HENNESSY TECHNOLOGY FUND
Investor Class HTECX
Institutional Class HTCIX
www.hennessyfunds.com | 1-800-966-4354
(This Page Intentionally Left Blank.)
Contents
| Letter to Shareholders | 2 |
| Performance Overview | 4 |
| Financial Statements | |
| Schedule of Investments | 7 |
| Statement of Assets and Liabilities | 11 |
| Statement of Operations | 12 |
| Statements of Changes in Net Assets | 13 |
| Financial Highlights | 14 |
| Notes to the Financial Statements | 18 |
| Report of Independent Registered Public Accounting Firm | 26 |
| Trustees and Officers of the Fund | 27 |
| Expense Example | 30 |
| Proxy Voting Policy and Proxy Voting Records | 32 |
| Availability of Quarterly Portfolio Schedule | 32 |
| Federal Tax Distribution Information | 32 |
| Important Notice Regarding Delivery of Shareholder Documents | 32 |
| Electronic Delivery | 32 |
| Liquidity Risk Management Program | 33 |
| Privacy Policy | 33 |
| HENNESSY FUNDS | 1-800-966-4354 |
December 2021
Dear Hennessy Funds Shareholder:
What a year this has been. While it doesn’t feel that we are out of the “pandemic” phase of the coronavirus crisis, we look forward to a day when we will eventually see fewer cases and potentially less severe variants. We feel extremely grateful to the many healthcare workers who have continued to work tirelessly during the recent surge. As we move through the next year, we hope that new U.S. cases will decline and that many other parts of the world will see improvements as well.
What a year this has been! As measured by the total return of the S&P 500® Index, as of October 31, 2021, the market was up 24.04% calendar year to date. This comes in the wake of a tumultuous 2020 in which the market plunged in the beginning of the pandemic and recovered dramatically to end the year up 18.40%. Interestingly, 18% appears to be a repeating number in the past dozen years. From the low point of the Financial Crisis (March 9, 2009) to the high point reached just prior to the COVID-19 pandemic (February 12, 2020), the S&P 500® Index was up 18.27% per year. We are well aware that past results are not predictive of the future, and we find ourselves naturally skeptical of such strong returns. But, as shown in the chart below, we find that the most common annual total returns of the market over the past 102 years range between 20% and 30% with the second most common being between 10% and 20%:
Source: Bloomberg L.P.
We will say it again, after showing a chart like the one above: Past results are not predictive of the future. Instead, we look at where we are right now – in the economy, in the market, in the business cycle – to reflect on where we have come from and where we may be going. U.S. GDP is strong and growing, interest rates remain low, and earnings growth and profitability remain robust. We believe stocks are trading at reasonable valuations when viewed as a whole, with the S&P 500® Index at 21.0x estimated earnings for 2022. Furthermore, we believe corporate balance sheets are healthy, with high levels of excess cash, which could support growth, increases in dividends, more share buybacks, and future acquisitions. Uncertainty and volatility can manifest at any time in the stock market, and the current market is no different. Investors have questions about inflation, worldwide supply chain issues, and what could drive the next boost in earnings. While these concerns are warranted, we continue to believe that overall the positives outweigh the negatives, and here at Hennessy we continue to see opportunity in the market and in our Funds.
| WWW.HENNESSYFUNDS.COM |
2
| LETTER TO SHAREHOLDERS |
What a (fiscal) year this has been!!! For our fiscal year ended October 31, 2021, the S&P 500® Index rose 42.91% on a total return basis, setting a new all-time high on the final day of the period. Except for a short 21-trading-day period that began on September 2 during which the market fell 5.13% only to rebound to new highs just 13 trading days later, the market has been on a continuous march higher. We saw a dramatic shift in market leadership as many of the sectors that underperformed during our last fiscal year soared in fiscal year 2021. Small-caps beat mid-caps, which in turn beat large-caps. The Energy and Financials sectors skyrocketed during the 12-month period, as reflected by the S&P 500® Energy Sector’s total return of 111.29% and the Russell 1000® Index Financials’ total return of 70.87%. Both of these sectors were among the worst performing in our fiscal year 2020, so a bounce back in our fiscal year 2021, while not a foregone conclusion, was a distinct possibility.
Overall, we are pleased with the performance of our mutual funds during the fiscal year. On an absolute basis, each of our 16 Funds achieved total returns greater than 10% and seven outperformed their primary benchmark. Ten of our 11 domestic equity-only Funds outperformed the S&P 500® Index and posted total returns of 45% or higher. Our four best-performing funds were concentrated in the Energy and Financials sectors. While some of our Funds certainly benefited from being in the “right” sector at the “right” time, we also believe this was a favorable period for our investment style of high-conviction investing and concentrated portfolio construction.
What will the coming year bring? As mentioned in our last shareholder letter (June 2021), we understand that even the greatest bull markets experience corrections along the way, and the last time the S&P 500® Index dropped over 10% was in February/March of 2020. Whether or not a correction occurs sooner or later, we believe the market as a whole has more room to run. We see many factors that could drive the market higher from here: strong GDP growth and increasing corporate earnings, a potentially lower-for-longer interest rate environment, accommodative fiscal and monetary policies, a healthy and robust financial system, low unemployment and solid wage growth, and strong corporate balance sheets with plenty of cash.
Thank you for your interest and for investing with us. We remain committed to managing our portfolios for long-term performance, ever mindful of downside risk. With so many investment options available to you, we are grateful for the trust you put in us and for your continued interest in our family of Funds. If you have any questions or would like to speak with us, please don’t hesitate to call us directly at (800) 966-4354.
Best regards,
| |
| |
| Ryan C. Kelley | |
| Chief Investment Officer |
Past performance does not guarantee future results. To obtain current standardized performance for the Hennessy Funds, visit https://www.hennessyfunds.com/funds/price-performance.
Mutual fund investing involves risk. Principal loss is possible.
Opinions expressed are those of Ryan C. Kelley and are subject to change, are not guaranteed, and should not be considered investment advice.
The Dow Jones Industrial Average and S&P 500® Index are commonly used to measure the performance of U.S. stocks. The S&P 500® Energy Index comprises those companies included in the S&P 500® Index that are classified in the Energy sector. The Russell 1000® Index Financials is a subset of the Russel 1000® Index that measures the performance of securities classified in the Financials sector of the large-capitalization U.S. equity market. The indices are used herein for comparative purposes in accordance with SEC regulations. One cannot invest directly in an index. All returns are shown on a total return basis.
| HENNESSY FUNDS | 1-800-966-4354 |
3
Performance Overview (Unaudited)
CHANGE IN VALUE OF $10,000 INVESTMENT

This graph illustrates the performance of an initial investment of $10,000 made in the Fund 10 years ago and assumes the reinvestment of dividends and capital gains.
AVERAGE ANNUAL TOTAL RETURN FOR PERIODS ENDED OCTOBER 31, 2021
| One | Five | Ten | ||
Year | Years | Years | ||
| Hennessy Technology Fund – | ||||
| Investor Class (HTECX) | 45.11% | 19.51% | 13.51% | |
| Hennessy Technology Fund – | ||||
| Institutional Class (HTCIX) | 45.49% | 19.81% | 13.83% | |
| NASDAQ Composite Index | 42.99% | 25.69% | 20.53% | |
S&P 500® Index | 42.91% | 18.93% | 16.21% |
| Expense ratios: | Gross 3.45%, Net 1.23%(1) (Investor Class); |
Gross 3.08%, Net 0.98%(1) (Institutional Class) |
(1) | The Fund’s investment advisor has contractually agreed to limit expenses until February 28, 2022. |
Performance data quoted represents past performance; past performance does not guarantee future results. The investment return and principal value of an investment will fluctuate so that an investor’s shares, when redeemed, may be worth more or less than their original cost. The performance table does not reflect the deduction of taxes that a shareholder would pay on Fund distributions or the redemption of Fund shares. Current performance of the Fund may be lower or higher than the performance quoted. Performance data current to the most recent month end may be obtained by visiting www.hennessyfunds.com. Performance for periods including or prior to October 26, 2012, is that of the FBR Technology Fund.
The NASDAQ Composite Index is a broad-based capitalization-weighted index of all common stocks listed on The NASDAQ Stock Market LLC. The S&P 500® Index is a capitalization-weighted index that is designed to represent the broad domestic economy through changes in the aggregate market value of 500 stocks across all major industries. One cannot invest directly in an index. These indices are used for comparative purposes in accordance with Securities and Exchange Commission regulations.
Standard & Poor’s Financial Services is the source and owner of the S&P® and S&P 500® trademarks.
The expense ratios presented are from the most recent prospectus. The expense ratios for the current reporting period are available in the Financial Highlights section of this report.
| WWW.HENNESSYFUNDS.COM |
4
| PERFORMANCE OVERVIEW |
PERFORMANCE NARRATIVE
Portfolio Managers Ryan C. Kelley, CFA, and L. Joshua Wein, CAIA
Performance:
For the one-year period ended October 31, 2021, the Investor Class of the Hennessy Technology Fund returned 45.11%, outperforming both the Nasdaq Composite Index (the Fund’s primary benchmark) and the S&P 500® Index, which returned 42.99% and 42.91%, respectively, for the same period.
The Fund’s outperformance relative to its primary benchmark resulted predominantly from stock selection within the Information Technology sector. Among the holdings that contributed the most to Fund performance were Fortinet, Inc., a leading network security provider, Digital Turbine, Inc., a mobile services platform provider, and NeoPhotonics Corporation, a semiconductor company. Among the holdings that detracted the most from Fund performance were QIWI, plc, a payment processor, ON24, Inc., a cloud-based virtual communications provider, and Zoom Video Communications, Inc., a worldwide web-based meeting platform provider.
The Fund continues to hold the companies mentioned except Digital Turbine and NeoPhotonics.
Portfolio Strategy:
The Fund utilizes a formula-based investment strategy designed to identify technology-related stocks that (1) exhibit strong cash flows and profits, (2) demonstrate the ability to sustain profitability, (3) have historically delivered returns in excess of their cost of capital, (4) have attractive balance sheet risk profiles, and (5) trade at attractive relative valuations.
Investment Commentary:
After a tumultuous 2020 and a strong 2021, we believe that the outlook for U.S. stocks remains positive. After a sharp contraction in economic activity as a result of the COVID-19 pandemic, the U.S. economy is growing steadily and demonstrating incredible resilience. We are benefiting from increased employment, rapid wage gains, and robust economic activity. Corporate earnings are on the rise, interest rates remain low, and Federal Reserve policies continue to accommodate a strong economy.
We believe that the outlook for technology-related stocks is also positive. Earnings growth for technology companies, as measured by the technology-heavy Nasdaq Composite Index, has been outpacing earnings growth for the market as a whole by a significant margin, which has led to premium valuations versus the broader market. We believe that many technology stocks still represent value in the context of the broader stock market, given investors’ continued preference for growth-oriented companies as well as high earnings per share growth rates.
_______________
Opinions expressed are those of the Portfolio Manager as of the date written and are subject to change, are not guaranteed, and should not be considered investment advice or an indication of trading intent.
Investments are focused in the Technology sector as well as the following sub-industries: Internet & Direct Marketing Retail, Interactive Home Entertainment, and Interactive Media Services. Sector funds may be subject to a higher degree of market risk. Investments in foreign securities may involve political, economic, and currency risks, greater volatility, and differences in accounting methods. The Fund invests in small-sized and medium-sized companies, which may have more limited liquidity and greater volatility compared to larger companies. Please see the Fund’s prospectus for a more complete discussion of these and other risks.
| HENNESSY FUNDS | 1-800-966-4354 |
5
References to specific securities should not be considered a recommendation to buy or sell any security. Fund holdings and sector allocations are subject to change. Please refer to the Schedule of Investments included in this report for additional portfolio information.
Earnings growth is not a measure of the Fund’s future performance.
| WWW.HENNESSYFUNDS.COM |
6
| PERFORMANCE OVERVIEW/SCHEDULE OF INVESTMENTS |
Financial Statements
Schedule of Investments as of October 31, 2021 |
HENNESSY TECHNOLOGY FUND
(% of Net Assets)
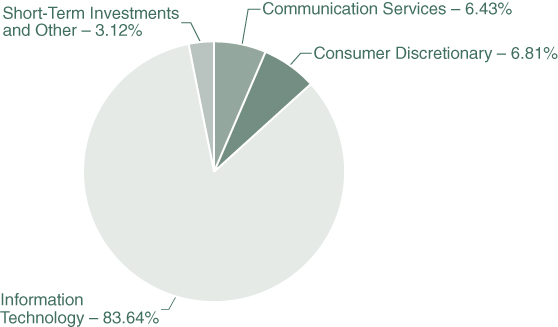
| TOP TEN HOLDINGS (EXCLUDING MONEY MARKET FUNDS) | % NET ASSETS |
| Aspen Technology, Inc. | 1.98% |
| Etsy, Inc. | 1.94% |
| Hello Group, Inc. – ADR | 1.89% |
| Advanced Micro Devices, Inc. | 1.87% |
| Atlassian Corp. PLC | 1.87% |
| Microsoft Corp. | 1.86% |
| Fortinet, Inc. | 1.81% |
| Autodesk, Inc. | 1.80% |
| Accenture PLC, Class A | 1.78% |
| KLA-Tencor Corp. | 1.77% |
Note: For presentation purposes, the Fund has grouped some of the industry categories. For purposes of categorizing securities for compliance with Section 8(b)(1) of the Investment Company Act of 1940, as amended, the Fund uses more specific industry classifications.
The Global Industry Classification Standard (GICS®) was developed by and is the exclusive property and a service mark of MSCI, Inc. and Standard & Poor’s Financial Services LLC. It has been licensed for use by the Hennessy Funds.
| HENNESSY FUNDS | 1-800-966-4354 |
7
| COMMON STOCKS – 96.88% | Number | % of | ||||||||||
| of Shares | Value | Net Assets | ||||||||||
| Communication Services – 6.43% | ||||||||||||
| Autohome, Inc. – ADR (b) | 2,804 | $ | 110,337 | 1.36 | % | |||||||
| Hello Group, Inc. – ADR (b) | 12,376 | 154,081 | 1.89 | % | ||||||||
| HUYA, Inc. – ADR (a)(b) | 16,645 | 136,822 | 1.68 | % | ||||||||
| SciPlay Corp. (a) | 6,024 | 121,745 | 1.50 | % | ||||||||
| 522,985 | 6.43 | % | ||||||||||
| Consumer Discretionary – 6.81% | ||||||||||||
| Etsy, Inc. (a) | 630 | 157,935 | 1.94 | % | ||||||||
| Qurate Retail Group, Inc. | 12,023 | 125,520 | 1.55 | % | ||||||||
| Shutterstock, Inc. | 1,123 | 136,051 | 1.67 | % | ||||||||
| Vipshop Holdings Ltd. – ADR (a)(b) | 12,025 | 134,199 | 1.65 | % | ||||||||
| 553,705 | 6.81 | % | ||||||||||
| Information Technology – 83.64% | ||||||||||||
| Accenture PLC, Class A (b) | 404 | 144,951 | 1.78 | % | ||||||||
| Advanced Micro Devices, Inc. (a) | 1,262 | 151,730 | 1.87 | % | ||||||||
| Apple, Inc. | 897 | 134,371 | 1.65 | % | ||||||||
| Applied Materials, Inc. | 1,012 | 138,290 | 1.70 | % | ||||||||
| Arrow Electronics, Inc. (a) | 1,092 | 126,399 | 1.56 | % | ||||||||
| ASE Technology Holding Co. Ltd. – ADR (b) | 16,895 | 120,292 | 1.48 | % | ||||||||
| ASML Holding NV – ADR (b) | 176 | 143,067 | 1.76 | % | ||||||||
| Aspen Technology, Inc. (a) | 1,025 | 160,607 | 1.98 | % | ||||||||
| Atlassian Corp. PLC (a)(b) | 331 | 151,641 | 1.87 | % | ||||||||
| Autodesk, Inc. (a) | 460 | 146,101 | 1.80 | % | ||||||||
| Bentley Systems, Inc. | 2,092 | 123,742 | 1.52 | % | ||||||||
| Cambium Networks Corp. (a)(b) | 3,481 | 98,234 | 1.21 | % | ||||||||
| CDW Corp. | 686 | 128,042 | 1.58 | % | ||||||||
| Citrix Systems, Inc. | 1,179 | 111,687 | 1.37 | % | ||||||||
| Conduent, Inc. (a) | 18,839 | 127,163 | 1.56 | % | ||||||||
| Daktronics, Inc. (a) | 23,008 | 127,694 | 1.57 | % | ||||||||
| Dell Technologies, Inc. (a) | 1,189 | 130,778 | 1.61 | % | ||||||||
| Fair Isaac Corp. (a) | 316 | 125,831 | 1.55 | % | ||||||||
| Flex Ltd. (a)(b) | 6,984 | 118,030 | 1.45 | % | ||||||||
| Fortinet, Inc. (a) | 437 | 146,981 | 1.81 | % | ||||||||
| Gartner, Inc. (a) | 412 | 136,747 | 1.68 | % | ||||||||
| Hewlett Packard Enterprise Co. | 8,453 | 123,836 | 1.52 | % | ||||||||
The accompanying notes are an integral part of these financial statements.
| WWW.HENNESSYFUNDS.COM |
8
| SCHEDULE OF INVESTMENTS |
| COMMON STOCKS | Number | % of | ||||||||||
| of Shares | Value | Net Assets | ||||||||||
| Information Technology (Continued) | ||||||||||||
| Intel Corp. | 2,341 | $ | 114,709 | 1.41 | % | |||||||
| Jabil, Inc. | 2,130 | 127,715 | 1.57 | % | ||||||||
| Kimball Electronics, Inc. (a) | 4,793 | 137,799 | 1.70 | % | ||||||||
| KLA-Tencor Corp. | 385 | 143,513 | 1.77 | % | ||||||||
| Lam Research Corp. | 229 | 129,058 | 1.59 | % | ||||||||
| Mastercard, Inc., Class A | 364 | 122,129 | 1.50 | % | ||||||||
| Microsoft Corp. | 456 | 151,219 | 1.86 | % | ||||||||
| NetApp, Inc. | 1,398 | 124,841 | 1.54 | % | ||||||||
| Nokia Corp. – ADR (a)(b) | 22,230 | 126,266 | 1.55 | % | ||||||||
| ON24, Inc. (a) | 6,560 | 125,493 | 1.54 | % | ||||||||
| Oracle Corp. | 1,407 | 134,988 | 1.66 | % | ||||||||
| Palo Alto Networks, Inc. (a) | 268 | 136,436 | 1.68 | % | ||||||||
| Paymentus Holdings, Inc. (a) | 5,365 | 137,344 | 1.69 | % | ||||||||
| QIWI PLC – ADR (b) | 14,850 | 129,938 | 1.60 | % | ||||||||
| QUALCOMM, Inc. | 995 | 132,375 | 1.63 | % | ||||||||
| Sanmina Corp. (a) | 3,226 | 121,782 | 1.50 | % | ||||||||
| Seagate Technology Holdings PLC (b) | 1,482 | 132,002 | 1.62 | % | ||||||||
| ServiceNow, Inc. (a) | 203 | 141,645 | 1.74 | % | ||||||||
| SYNNEX Corp. | 1,191 | 125,055 | 1.54 | % | ||||||||
| Taiwan Semiconductor Manufacturing Co. Ltd. – ADR (b) | 1,142 | 129,845 | 1.60 | % | ||||||||
| Telefonaktiebolaget LM Ericsson – ADR (b) | 11,427 | 124,211 | 1.53 | % | ||||||||
| Teradata Corp. (a) | 2,229 | 126,072 | 1.55 | % | ||||||||
| Texas Instruments, Inc. | 661 | 123,924 | 1.53 | % | ||||||||
| The Western Union Co. | 6,152 | 112,089 | 1.38 | % | ||||||||
| Tower Semiconductor Ltd. (a)(b) | 4,370 | 139,272 | 1.71 | % | ||||||||
| TTM Technologies, Inc. (a) | 9,930 | 131,473 | 1.62 | % | ||||||||
| Turtle Beach Corp. (a) | 4,563 | 131,232 | 1.62 | % | ||||||||
| Vontier Corp. | 3,774 | 127,674 | 1.57 | % | ||||||||
| Xerox Holdings Corp. | 5,991 | 106,640 | 1.31 | % | ||||||||
| Zoom Video Communications, Inc. (a) | 489 | 134,304 | 1.65 | % | ||||||||
| 6,797,257 | 83.64 | % | ||||||||||
| Total Common Stocks | ||||||||||||
| (Cost $6,822,774) | 7,873,947 | 96.88 | % | |||||||||
The accompanying notes are an integral part of these financial statements.
| HENNESSY FUNDS | 1-800-966-4354 |
9
| SHORT-TERM INVESTMENTS – 3.40% | Number | % of | ||||||||||
| of Shares | Value | Net Assets | ||||||||||
| Money Market Funds – 3.40% | ||||||||||||
| First American Government Obligations Fund, | ||||||||||||
| Institutional Class, 0.03% (c) | 276,197 | $ | 276,197 | 3.40 | % | |||||||
| Total Short-Term Investments | ||||||||||||
| (Cost $276,197) | 276,197 | 3.40 | % | |||||||||
| Total Investments | ||||||||||||
| (Cost $7,098,971) – 100.28% | 8,150,144 | 100.28 | % | |||||||||
| Liabilities in Excess of Other Assets – (0.28)% | (23,086 | ) | (0.28 | )% | ||||||||
TOTAL NET ASSETS – 100.00% | $ | 8,127,058 | 100.00 | % | ||||||||
Percentages are stated as a percent of net assets.
ADR – American Depositary Receipt
NV – Naamloze Vennootschap is a Dutch term for publicly traded companies.
PLC – Public Limited Company
| (a) | Non-income-producing security. |
| (b) | U.S.-traded security of a foreign corporation. |
| (c) | The rate listed is the fund’s seven-day yield as of October 31, 2021. |
Summary of Fair Value Exposure as of October 31, 2021
The following is a summary of the inputs used to value the Fund’s net assets as of October 31, 2021 (see Note 3 in the accompanying Notes to the Financial Statements):
| Common Stocks | Level 1 | Level 2 | Level 3 | Total | ||||||||||||
| Communication Services | $ | 522,985 | $ | — | $ | — | $ | 522,985 | ||||||||
| Consumer Discretionary | 553,705 | — | — | 553,705 | ||||||||||||
| Information Technology | 6,797,257 | — | — | 6,797,257 | ||||||||||||
| Total Common Stocks | $ | 7,873,947 | $ | — | $ | — | $ | 7,873,947 | ||||||||
| Short-Term Investments | ||||||||||||||||
| Money Market Funds | $ | 276,197 | $ | — | $ | — | $ | 276,197 | ||||||||
| Total Short-Term Investments | $ | 276,197 | $ | — | $ | — | $ | 276,197 | ||||||||
| Total Investments | $ | 8,150,144 | $ | — | $ | — | $ | 8,150,144 | ||||||||
The accompanying notes are an integral part of these financial statements.
| WWW.HENNESSYFUNDS.COM |
10
| SCHEDULE OF INVESTMENTS/STATEMENT OF ASSETS AND LIABILITIES |
Financial Statements
Statement of Assets and Liabilities as of October 31, 2021 |
| ASSETS: | ||||
| Investments in securities, at value (cost $7,098,971) | $ | 8,150,144 | ||
| Dividends and interest receivable | 3,293 | |||
| Prepaid expenses and other assets | 14,949 | |||
| Due from advisor | 384 | |||
| Total assets | 8,168,770 | |||
| LIABILITIES: | ||||
| Payable for fund shares redeemed | 4,051 | |||
| Payable to auditor | 22,554 | |||
| Accrued distribution fees | 1,221 | |||
| Accrued service fees | 510 | |||
| Accrued trustees fees | 6,602 | |||
| Accrued expenses and other payables | 6,774 | |||
| Total liabilities | 41,712 | |||
| NET ASSETS | $ | 8,127,058 | ||
| NET ASSETS CONSISTS OF: | ||||
| Capital stock | $ | 5,095,688 | ||
| Total distributable earnings | 3,031,370 | |||
| Total net assets | $ | 8,127,058 | ||
| NET ASSETS: | ||||
| Investor Class | ||||
| Shares authorized (no par value) | Unlimited | |||
| Net assets applicable to outstanding shares | $ | 6,063,393 | ||
| Shares issued and outstanding | 225,474 | |||
| Net asset value, offering price, and redemption price per share | $ | 26.89 | ||
| Institutional Class | ||||
| Shares authorized (no par value) | Unlimited | |||
| Net assets applicable to outstanding shares | $ | 2,063,665 | ||
| Shares issued and outstanding | 74,646 | |||
| Net asset value, offering price, and redemption price per share | $ | 27.65 | ||
The accompanying notes are an integral part of these financial statements.
| HENNESSY FUNDS | 1-800-966-4354 |
11
Financial Statements
Statement of Operations for the year ended October 31, 2021 |
| INVESTMENT INCOME: | ||||
Dividend income(1) | $ | 90,405 | ||
| Interest income | 66 | |||
| Total investment income | 90,471 | |||
| EXPENSES: | ||||
| Investment advisory fees (See Note 5) | 58,160 | |||
| Federal and state registration fees | 29,028 | |||
| Compliance expense (See Note 5) | 27,452 | |||
| Audit fees | 22,554 | |||
| Administration, accounting, custody, and transfer agent fees (See Note 5) | 20,834 | |||
| Trustees’ fees and expenses | 18,460 | |||
| Sub-transfer agent expenses – Investor Class (See Note 5) | 8,534 | |||
| Sub-transfer agent expenses – Institutional Class (See Note 5) | 1,089 | |||
| Distribution fees – Investor Class (See Note 5) | 8,804 | |||
| Reports to shareholders | 6,736 | |||
| Service fees – Investor Class (See Note 5) | 5,869 | |||
| Legal fees | 140 | |||
| Other expenses | 4,624 | |||
| Total expenses before waivers and reimbursements | 212,284 | |||
| Service provider expense waiver (See Note 5) | (20,834 | ) | ||
| Expense reimbursement by advisor – Investor Class (See Note 5) | (75,956 | ) | ||
| Expense reimbursement by advisor – Institutional Class (See Note 5) | (23,799 | ) | ||
| Net expenses | 91,695 | |||
| NET INVESTMENT LOSS | $ | (1,224 | ) | |
| REALIZED AND UNREALIZED GAINS (LOSSES): | ||||
| Net realized gain on investments | $ | 2,211,486 | ||
| Net change in unrealized appreciation/depreciation on investments | 358,442 | |||
| Net gain on investments | 2,569,928 | |||
| NET INCREASE IN NET ASSETS RESULTING FROM OPERATIONS | $ | 2,568,704 | ||
(1) | Net of foreign taxes withheld and issuance fees of $3,071. |
The accompanying notes are an integral part of these financial statements.
| WWW.HENNESSYFUNDS.COM |
12
| STATEMENT OF OPERATIONS/STATEMENTS OF CHANGES IN NET ASSETS |
Financial Statements
| Statements of Changes in Net Assets |
| Year Ended | Year Ended | |||||||
| October 31, 2021 | October 31, 2020 | |||||||
| OPERATIONS: | ||||||||
| Net investment income (loss) | $ | (1,224 | ) | $ | 9,137 | |||
| Net realized gain on investments | 2,211,486 | 677,479 | ||||||
| Net change in unrealized | ||||||||
| appreciation/depreciation on investments | 358,442 | (84,382 | ) | |||||
| Net increase in net assets resulting from operations | 2,568,704 | 602,234 | ||||||
| DISTRIBUTIONS TO SHAREHOLDERS: | ||||||||
| Distributable earnings – Investor Class | (493,580 | ) | (108,418 | ) | ||||
| Distributable earnings – Institutional Class | (175,930 | ) | (37,553 | ) | ||||
| Total distributions | (669,510 | ) | (145,971 | ) | ||||
| CAPITAL SHARE TRANSACTIONS: | ||||||||
| Proceeds from shares subscribed – Investor Class | 917,272 | 731,750 | ||||||
| Proceeds from shares subscribed – Institutional Class | 57,969 | 67,473 | ||||||
| Dividends reinvested – Investor Class | 482,162 | 106,748 | ||||||
| Dividends reinvested – Institutional Class | 175,930 | 37,105 | ||||||
| Cost of shares redeemed – Investor Class | (1,006,346 | ) | (811,778 | ) | ||||
| Cost of shares redeemed – Institutional Class | (125,590 | ) | (92,300 | ) | ||||
| Net increase in net assets derived | ||||||||
| from capital share transactions | 501,397 | 38,998 | ||||||
| TOTAL INCREASE IN NET ASSETS | 2,400,591 | 495,261 | ||||||
| NET ASSETS: | ||||||||
| Beginning of year | 5,726,467 | 5,231,206 | ||||||
| End of year | $ | 8,127,058 | $ | 5,726,467 | ||||
| CHANGES IN SHARES OUTSTANDING: | ||||||||
| Shares sold – Investor Class | 35,433 | 39,530 | ||||||
| Shares sold – Institutional Class | 2,256 | 3,356 | ||||||
| Shares issued to holders as reinvestment | ||||||||
| of dividends – Investor Class | 21,237 | 5,574 | ||||||
| Shares issued to holders as reinvestment | ||||||||
| of dividends – Institutional Class | 7,528 | 1,887 | ||||||
| Shares redeemed – Investor Class | (38,822 | ) | (43,369 | ) | ||||
| Shares redeemed – Institutional Class | (4,863 | ) | (4,535 | ) | ||||
| Net increase in shares outstanding | 22,769 | 2,443 | ||||||
The accompanying notes are an integral part of these financial statements.
| HENNESSY FUNDS | 1-800-966-4354 |
13
Financial Statements
| Financial Highlights |
For an Investor Class share outstanding throughout each year
PER SHARE DATA:
Net asset value, beginning of year
Income from investment operations:
Net investment income (loss)
Net realized and unrealized gains on investments
Total from investment operations
Less distributions:
Dividends from net investment income
Dividends from net realized gains
Total distributions
Net asset value, end of year
TOTAL RETURN
SUPPLEMENTAL DATA AND RATIOS:
Net assets, end of year (millions)
Ratio of expenses to average net assets:
Before expense reimbursement
After expense reimbursement
Ratio of net investment income (loss) to average net assets:
Before expense reimbursement
After expense reimbursement
Portfolio turnover rate(4)
(1) | Calculated using the average shares outstanding method. |
(2) | The Fund’s current expense limitation agreement, which became effective on February 28, 2017, was in effect for eight months of the year ended October 31, 2017. |
(3) | Certain service provider expenses were voluntarily waived during the fiscal year. |
(4) | Calculated on the basis of the Fund as a whole. |
The accompanying notes are an integral part of these financial statements.
| WWW.HENNESSYFUNDS.COM |
14
| FINANCIAL HIGHLIGHTS — INVESTOR CLASS |
| Year Ended October 31, | ||||||||||||||||||
| 2021 | 2020 | 2019 | 2018 | 2017 | ||||||||||||||
| $ | 20.50 | $ | 18.90 | $ | 18.04 | $ | 18.46 | $ | 15.82 | |||||||||
| (0.02 | )(1) | 0.02 | (1) | (0.03 | )(1) | (0.05 | ) | (0.23 | ) | |||||||||
| 8.82 | 2.10 | 3.15 | 1.26 | 2.87 | ||||||||||||||
| 8.80 | 2.12 | 3.12 | 1.21 | 2.64 | ||||||||||||||
| (0.04 | ) | — | — | — | — | |||||||||||||
| (2.37 | ) | (0.52 | ) | (2.26 | ) | (1.63 | ) | — | ||||||||||
| (2.41 | ) | (0.52 | ) | (2.26 | ) | (1.63 | ) | — | ||||||||||
| $ | 26.89 | $ | 20.50 | $ | 18.90 | $ | 18.04 | $ | 18.46 | |||||||||
| 45.11 | % | 11.42 | % | 20.47 | % | 7.25 | % | 16.69 | % | |||||||||
| $ | 6.06 | $ | 4.26 | $ | 3.89 | $ | 3.31 | $ | 3.20 | |||||||||
| 2.79 | % | 3.45 | % | 3.84 | % | 3.70 | % | 4.16 | % | |||||||||
| 1.23 | %(3) | 1.23 | %(3) | 1.23 | % | 1.23 | % | 2.15 | %(2) | |||||||||
| (1.64 | )% | (2.12 | )% | (2.80 | )% | (2.83 | )% | (3.16 | )% | |||||||||
| (0.08 | )% | 0.10 | % | (0.19 | )% | (0.36 | )% | (1.15 | )%(2) | |||||||||
| 200 | % | 192 | % | 185 | % | 225 | % | 267 | % | |||||||||
The accompanying notes are an integral part of these financial statements.
| HENNESSY FUNDS | 1-800-966-4354 |
15
Financial Statements
| Financial Highlights |
For an Institutional Class share outstanding throughout each year
PER SHARE DATA:
Net asset value, beginning of year
Income from investment operations:
Net investment income (loss)
Net realized and unrealized gains on investments
Total from investment operations
Less distributions:
Dividends from net investment income
Dividends from net realized gains
Total distributions
Net asset value, end of year
TOTAL RETURN
SUPPLEMENTAL DATA AND RATIOS:
Net assets, end of year (millions)
Ratio of expenses to average net assets:
Before expense reimbursement
After expense reimbursement
Ratio of net investment income (loss) to average net assets:
Before expense reimbursement
After expense reimbursement
Portfolio turnover rate(4)
(1) | Calculated using the average shares outstanding method. |
(2) | The Fund’s current expense limitation agreement, which became effective on February 28, 2017, was in effect for eight months of the year ended October 31, 2017. |
(3) | Certain service provider expenses were voluntarily waived during the fiscal year. |
(4) | Calculated on the basis of the Fund as a whole. |
The accompanying notes are an integral part of these financial statements.
| WWW.HENNESSYFUNDS.COM |
16
| FINANCIAL HIGHLIGHTS — INSTITUTIONAL CLASS |
| Year Ended October 31, | ||||||||||||||||||
| 2021 | 2020 | 2019 | 2018 | 2017 | ||||||||||||||
| $ | 21.08 | $ | 19.40 | $ | 18.47 | $ | 18.85 | $ | 16.11 | |||||||||
| 0.05 | (1) | 0.07 | (1) | 0.01 | (1) | 0.01 | (0.12 | ) | ||||||||||
| 9.06 | 2.15 | 3.23 | 1.28 | 2.86 | ||||||||||||||
| 9.11 | 2.22 | 3.24 | 1.29 | 2.74 | ||||||||||||||
| (0.11 | ) | (0.01 | ) | — | — | — | ||||||||||||
| (2.43 | ) | (0.53 | ) | (2.31 | ) | (1.67 | ) | — | ||||||||||
| (2.54 | ) | (0.54 | ) | (2.31 | ) | (1.67 | ) | — | ||||||||||
| $ | 27.65 | $ | 21.08 | $ | 19.40 | $ | 18.47 | $ | 18.85 | |||||||||
| 45.49 | % | 11.67 | % | 20.77 | % | 7.54 | % | 17.01 | % | |||||||||
| $ | 2.06 | $ | 1.47 | $ | 1.34 | $ | 1.09 | $ | 1.22 | |||||||||
| 2.44 | % | 3.08 | % | 3.47 | % | 3.27 | % | 3.74 | % | |||||||||
| 0.98 | %(3) | 0.98 | %(3) | 0.98 | % | 0.98 | % | 1.77 | %(2) | |||||||||
| (1.29 | )% | (1.74 | )% | (2.43 | )% | (2.41 | )% | (2.74 | )% | |||||||||
| 0.17 | % | 0.36 | % | 0.06 | % | (0.12 | )% | (0.77 | )%(2) | |||||||||
| 200 | % | 192 | % | 185 | % | 225 | % | 267 | % | |||||||||
The accompanying notes are an integral part of these financial statements.
| HENNESSY FUNDS | 1-800-966-4354 |
17
Financial Statements
Notes to the Financial Statements October 31, 2021 |
1). ORGANIZATION
The Hennessy Technology Fund (the “Fund”) is a series of Hennessy Funds Trust (the “Trust”), which was organized as a Delaware statutory trust on September 17, 1992. The Fund is an open-end management investment company registered under the Investment Company Act of 1940, as amended. The investment objective of the Fund is long-term capital appreciation. The Fund is a diversified fund.
The Fund offers Investor Class and Institutional Class shares. Each class of shares differs principally in its respective 12b-1 distribution and service, shareholder servicing, and sub-transfer agent expenses. There are no sales charges. Each class has identical rights to earnings, assets, and voting privileges, except for class-specific expenses and exclusive rights to vote on matters affecting only one class.
As an investment company, the Fund follows the investment company accounting and reporting guidance of the Financial Accounting Standards Board (“FASB”) Accounting Standard Codification Topic 946 “Financial Services—Investment Companies.”
2). SIGNIFICANT ACCOUNTING POLICIES
The following is a summary of significant accounting policies consistently followed by the Fund in the preparation of the financial statements. These policies conform to U.S. generally accepted accounting principles (“GAAP”).
| a). | Securities Valuation – All investments in securities are valued in accordance with the Fund’s valuation policies and procedures, as described in Note 3. |
| b). | Federal Income Taxes – The Fund has elected to be taxed as a regulated investment company and intends to distribute substantially all of its taxable income to its shareholders and otherwise comply with the provisions of the Internal Revenue Code of 1986, as amended, applicable to regulated investment companies. As a result, the Fund has made no provision for federal income taxes or excise taxes. Net investment income/loss and realized gains/losses for federal income tax purposes may differ from those reported in the financial statements because of temporary book-basis and tax-basis differences. Temporary differences are primarily the result of the treatment of wash sales for tax reporting purposes. The Fund recognizes interest and penalties related to income tax benefits, if any, in the Statement of Operations as an income tax expense. Distributions from net realized gains for book purposes may include short-term capital gains, which are included as ordinary income to shareholders for tax purposes. The Fund may utilize equalization accounting for tax purposes and designate earnings and profits, including net realized gains distributed to shareholders on redemption of shares, as part of the dividends paid deduction for income tax purposes. |
| Due to inherent differences in the recognition of income, expenses, and realized gains/losses under GAAP and federal income tax regulations, permanent differences between book and tax basis for reporting are identified and appropriately reclassified in the Statement of Assets and Liabilities, as needed. The adjustments for fiscal year 2021 are as follows: |
| Total | |||
| Distributable | |||
Earnings | Capital Stock | ||
| $(168,501) | $168,501 |
| WWW.HENNESSYFUNDS.COM |
18
| NOTES TO THE FINANCIAL STATEMENTS |
| c). | Accounting for Uncertainty in Income Taxes – The Fund has accounting policies regarding recognition and measurement of tax positions taken or expected to be taken on a tax return. The tax returns of the Fund for the prior three fiscal years are open for examination. The Fund has reviewed all open tax years in major tax jurisdictions and concluded that there is no impact on the Fund’s net assets and no tax liability resulting from unrecognized tax benefits relating to uncertain income tax positions taken or expected to be taken on a tax return. The Fund’s major tax jurisdictions are U.S. federal and Delaware. |
| d). | Income and Expenses – Dividend income is recognized on the ex-dividend date or as soon as information is available to the Fund. Interest income, which includes the amortization of premium and accretion of discount, is recognized on an accrual basis. Market discounts, original issue discounts, and market premiums on debt securities are accreted or amortized to interest income over the life of a security with a corresponding increase or decrease, as applicable, in the cost basis of such security using the yield-to-maturity method or, where applicable, the first call date of the security. Other non-cash dividends are recognized as investment income at the fair value of the property received. The Fund is charged for those expenses that are directly attributable to its portfolio, such as advisory, administration, and certain shareholder service fees. Income, expenses (other than expenses attributable to a specific class), and realized and unrealized gains/losses on investments are allocated to each class of shares based on such class’s net assets. |
| e). | Distributions to Shareholders – Dividends from net investment income for the Fund, if any, are declared and paid annually, usually in December. Distributions of net realized capital gains, if any, are declared and paid annually, usually in December. |
| f). | Security Transactions – Investment and shareholder transactions are recorded on the trade date. The Fund determines the realized gain/loss from an investment transaction by comparing the original cost of the security lot sold with the net sale proceeds. Discounts and premiums on securities purchased are accreted or amortized, respectively, over the life of each such security. |
| g). | Use of Estimates – Preparing financial statements in accordance with GAAP requires management to make estimates and assumptions that affect the reported amounts of assets and liabilities and disclosure of contingent assets and liabilities at the date of the financial statements, as well as the reported change in net assets during the reporting period. Actual results could differ from those estimates. |
| h). | Share Valuation – The net asset value (“NAV”) per share of the Fund is calculated by dividing (i) the total value of the securities held by the Fund, plus cash and other assets, minus all liabilities (including estimated accrued expenses) by (ii) the total number of Fund shares outstanding, rounded to the nearest $0.01. Fund shares are not priced on days the New York Stock Exchange is closed for trading. The offering and redemption price per share for the Fund is equal to the Fund’s NAV per share. |
| i). | Recent Accounting Pronouncements and Regulatory Updates – In October 2020, the Securities and Exchange Commission (“SEC”) adopted new regulations governing the use of derivatives by registered investment companies (“Rule 18f-4”). Rule 18f-4 imposes limits on the amount of derivatives a fund can enter into, eliminates the asset segregation framework currently used by funds to comply with Section 18 of the 1940 Act, and requires funds whose use of derivatives is greater than a limited specified amount to establish and maintain a comprehensive derivatives risk management program and appoint a derivatives risk manager. Funds are required to comply with Rule 18f-4 by August 19, 2022. The impact, if any, that Rule 18f-4 will |
| HENNESSY FUNDS | 1-800-966-4354 |
19
| have on the availability, liquidity, and performance of derivatives is unclear. Management is currently evaluating the potential impact of Rule 18f-4 on the Fund. When fully implemented, Rule 18f-4 may require changes in how the Fund uses derivatives, adversely affect the Fund’s performance, and increase costs related to the Fund’s use of derivatives. | |
| In December 2020, the SEC adopted a new rule providing a framework for fund valuation practices (“Rule 2a-5”). Rule 2a-5 establishes requirements for determining fair value in good faith for purposes of the 1940 Act. Rule 2a-5 permits fund boards to designate certain parties to perform fair value determinations, subject to board oversight and certain other conditions. Rule 2a-5 also defines when market quotations are “readily available” for purposes of the 1940 Act and the threshold for determining whether a fund must fair value a security. In connection with Rule 2a-5, the SEC also adopted related recordkeeping requirements and is rescinding previously issued guidance, including with respect to the role of a board in determining fair value and the accounting and auditing of fund investments. Funds must comply with the rules by September 8, 2022. Management is currently assessing the potential impact of the new rules on the Fund’s financial statements. |
3). SECURITIES VALUATION
The Fund follows its valuation policies and procedures in determining its net asset value and, in preparing these financial statements, the fair value accounting standards that establish an authoritative definition of fair value and set out a hierarchy for measuring fair value. These standards require additional disclosures about the various inputs and valuation techniques used to develop the measurements of fair value and a discussion of changes in valuation techniques and related inputs during the period. These inputs are summarized in the three broad levels listed below:
| Level 1 – | Unadjusted, quoted prices in active markets for identical instruments that the Fund has the ability to access at the date of measurement. | |
| Level 2 – | Other significant observable inputs (including, but not limited to, quoted prices in active markets for similar instruments, quoted prices in markets that are not active for identical or similar instruments, and model-derived valuations in which all significant inputs and significant value drivers are observable in active markets, such as interest rates, prepayment speeds, credit risk curves, default rates, and similar data). | |
| Level 3 – | Significant unobservable inputs (including the Fund’s own assumptions about what market participants would use to price the asset or liability based on the best available information) when observable inputs are unavailable. |
The following is a description of the valuation techniques applied to the Fund’s major categories of assets and liabilities on a recurring basis:
Equity Securities – Equity securities, including common stocks, preferred stocks, foreign-issued common stocks, exchange-traded funds, closed-end mutual funds, partnerships, rights, and real estate investment trusts, that are traded on a securities exchange for which a last-quoted sales price is readily available generally are valued at the last sales price as reported by the primary exchange on which the securities are listed. Securities listed on The NASDAQ Stock Market (“NASDAQ”) generally are valued at the NASDAQ Official Closing Price, which may differ from the last sales price reported. Securities traded on a securities exchange for which a last-quoted sales price is not readily available generally are valued at the mean between the bid |
| WWW.HENNESSYFUNDS.COM |
20
| NOTES TO THE FINANCIAL STATEMENTS |
| and ask prices. To the extent these securities are actively traded and valuation adjustments are not applied, they are classified in Level 1 of the fair value hierarchy. Securities traded on foreign exchanges generally are not valued at the same time the Fund calculates its NAV because most foreign markets close well before such time. The earlier close of most foreign markets gives rise to the possibility that significant events, including broad market moves, may have occurred in the interim. In certain circumstances, it may be determined that a foreign security needs to be fair valued because it appears that the value of the security might have been materially affected by events occurring after the close of the market in which the security is principally traded, but before the time the Fund calculates its NAV, such as by a development that affects an entire market or region (e.g., a weather-related event) or a potentially global development (e.g., a terrorist attack that may be expected to have an effect on investor expectations worldwide). | |
Registered Investment Companies – Investments in open-end registered investment companies, commonly referred to as mutual funds, generally are priced at the ending NAV provided by the applicable mutual fund’s service agent and are classified in Level 1 of the fair value hierarchy. | |
Debt Securities – Debt securities, including corporate bonds, asset-backed securities, mortgage-backed securities, municipal bonds, U.S. Treasuries, and U.S. government agency issues, are generally valued at market on the basis of valuations furnished by an independent pricing service that utilizes both dealer-supplied valuations and formula-based techniques. The pricing service may consider recently executed transactions in securities of the issuer or comparable issuers, market price quotations (where observable), bond spreads, and fundamental data relating to the issuer. In addition, the model may incorporate observable market data, such as reported sales of similar securities, broker quotes, yields, bids, offers, and reference data. Certain securities are valued primarily using dealer quotations. These securities are generally classified in Level 2 of the fair value hierarchy. | |
Short-Term Securities – Short-term equity investments, including money market funds, are valued in the manner specified above for equity securities. Short-term debt investments with an original term to maturity of 60 days or less are valued at amortized cost, which approximates fair market value. If the original term to maturity of a short-term debt investment exceeds 60 days, then the values as of the 61st day prior to maturity are amortized. Amortized cost is not used if its use would be inappropriate due to credit or other impairments of the issuer, in which case the security’s fair value would be determined as described below. Short-term securities are generally classified in Level 1 or Level 2 of the fair value hierarchy depending on the inputs used and market activity levels for specific securities. |
The Board of Trustees of the Fund (the “Board”) has adopted fair value pricing procedures that are followed when a price for a security is not readily available or if a significant event has occurred that indicates the closing price of a security no longer represents the true value of that security. Fair value pricing determinations are made in good faith in accordance with these procedures. There are numerous criteria considered in determining a fair value of a security, such as the trading volume of a security and markets, the values of other similar securities, and news events with direct bearing on a security or markets. Fair value pricing results in an estimated price for a security that reflects the amount the Fund might reasonably expect to receive in a current sale. Depending on the relative significance of the valuation inputs, these securities may be classified in either Level 2 or Level 3 of the fair value hierarchy.
| HENNESSY FUNDS | 1-800-966-4354 |
21
The fair value of foreign securities may be determined with the assistance of a pricing service using correlations between the movement of prices of such securities and indices of domestic securities and other appropriate indicators, such as closing market prices of relevant American Depositary Receipts or futures contracts. Using fair value pricing means that the Fund’s NAV reflects the affected portfolio securities’ values as determined by the Board or its designee, pursuant to the fair value pricing procedures adopted by the Board, instead of being determined by the market. Using a fair value pricing methodology to price a foreign security may result in a value that is different from such foreign security’s most recent closing price and from the value used by other investment companies to calculate their NAVs. Such securities are generally classified in Level 2 of the fair value hierarchy. Because the Fund may invest in foreign securities, the value of the Fund’s portfolio securities may change on days when a shareholder is unable to purchase or redeem Fund shares.
The Board has delegated day-to-day valuation matters to the Valuation and Liquidity Committee comprising representatives from Hennessy Advisors, Inc., the Fund’s investment advisor (the “Advisor”). The function of the Valuation and Liquidity Committee, among other things, is to value securities where current and reliable market quotations are not readily available. All actions taken by the Valuation and Liquidity Committee are reviewed by the Board.
The Fund has performed an analysis of all existing investments to determine the significance and character of all inputs to their fair value determinations. Various inputs are used to determine the value of the Fund’s investments. The inputs or methodology used for valuing securities are not necessarily an indication of the risk associated with investing in those securities. Details related to the fair value hierarchy of the Fund’s securities as of October 31, 2021, are included in the Schedule of Investments.
4). INVESTMENT TRANSACTIONS
Purchases and sales of investment securities (excluding government and short-term investments) for the Fund during fiscal year 2021 were $15,038,079 and $15,236,562, respectively.
There were no purchases or sales/maturities of long-term U.S. government securities for the Fund during fiscal year 2021.
5). INVESTMENT ADVISORY FEE AND OTHER TRANSACTIONS WITH AFFILIATES
The Advisor provides the Fund with investment advisory services under an Investment Advisory Agreement. The Advisor furnishes all investment advice, office space, and facilities and most of the personnel needed by the Fund. As compensation for its services, the Advisor is entitled to a monthly fee from the Fund. The fee is based on the average daily net assets of the Fund at an annual rate of 0.74%. The net investment advisory fees expensed by the Fund during fiscal year 2021 are included in the Statement of Operations.
The Advisor has contractually agreed to limit total annual operating expenses to 0.98% of the Fund’s net assets for both Investor Class shares and Institutional Class shares (excluding all federal, state and local taxes, interest, brokerage commissions, 12b-1 fees, shareholder servicing fees payable to the Advisor, extraordinary items, and acquired fund fees and expenses and other costs incurred in connection with the purchase and sale of securities) through February 28, 2022.
For three years following the date on which expenses were waived or incurred, the Advisor may recoup waived or reimbursed expenses from the Fund if total operating expenses, including such recoupment, does not exceed the expense limitation in effect (i) at the time the Advisor waived or reimbursed such expenses and (ii) at the time the
| WWW.HENNESSYFUNDS.COM |
22
| NOTES TO THE FINANCIAL STATEMENTS |
Advisor recoups such expenses. As of October 31, 2021, expenses subject to potential recovery for Investor Class and Institutional Class shares and the fiscal years in which they expire were as follows:
| Fiscal Year | Fiscal Year | Fiscal Year | |||
2022 | 2023 | 2024 | Total | ||
| Investor Class | $92,255 | $86,892 | $75,956 | $255,103 | |
| Institutional Class | $29,447 | $27,643 | $23,799 | $ 80,889 |
The Advisor did not recoup expenses from the Fund during fiscal year 2021.
The Board has approved a Shareholder Servicing Agreement for Investor Class shares of the Fund, which compensates the Advisor for the non-investment advisory services it provides to the Fund. The Shareholder Servicing Agreement provides for a monthly fee paid to the Advisor at an annual rate of 0.10% of the average daily net assets of the Fund attributable to Investor Class shares. The shareholder service fees expensed by the Fund during fiscal year 2021 are included in the Statement of Operations.
The Fund has adopted a plan pursuant to Rule 12b-1 under the Investment Company Act of 1940, as amended, that authorizes payments in connection with the distribution of Fund shares at an annual rate of up to 0.25% of the Fund’s average daily net assets attributable to Investor Class shares. Even though the authorized rate is up to 0.25%, the Fund is currently only using up to 0.15% of its average daily net assets attributable to Investor Class shares for such purpose. Amounts paid under the plan may be spent on any activities or expenses primarily intended to result in the sale of shares, including, but not limited to, advertising, shareholder account servicing, printing and mailing of prospectuses to other than current shareholders, printing and mailing of sales literature, and compensation for sales and marketing activities or to financial institutions and others, such as dealers and distributors. The distribution fees expensed by the Fund during fiscal year 2021 are included in the Statement of Operations.
The Fund has entered into agreements with various brokers, dealers, and financial intermediaries in connection with the sale of Fund shares. The agreements provide for periodic payments of sub-transfer agent expenses by the Fund to the brokers, dealers, and financial intermediaries for providing certain shareholder maintenance services. These shareholder services include the pre-processing and quality control of new accounts, shareholder correspondence, answering customer inquiries regarding account status, and facilitating shareholder telephone transactions. The sub-transfer agent fees expensed by the Fund during fiscal year 2021 are included in the Statement of Operations.
U.S. Bancorp Fund Services, LLC, d/b/a U.S. Bank Global Fund Services (“Fund Services”) provides the Fund with administrative, accounting, and transfer agent services. As administrator, Fund Services is responsible for activities such as (i) preparing various federal and state regulatory filings, reports, and returns for the Fund, (ii) preparing reports and materials to be supplied to the Board, (iii) monitoring the activities of the Fund’s custodian, transfer agent, and accountants, and (iv) coordinating the preparation and payment of the Fund’s expenses and reviewing the Fund’s expense accruals. U.S. Bank N.A., an affiliate of Fund Services, serves as the Fund’s custodian. The servicing agreements between the Trust, Fund Services, and U.S. Bank N.A. contain a fee schedule that is inclusive of administrative, accounting, custody, and transfer agent fees. The administrative, accounting, custody, and transfer agent fees expensed by the Fund during fiscal year 2021 are included in the Statement of Operations. Fund Services has voluntarily waived all or a portion of its fees for the Fund. The fees voluntarily waived by Fund Services during fiscal year 2021 are included in the Statement of Operations.
| HENNESSY FUNDS | 1-800-966-4354 |
23
Quasar Distributors, LLC (“Quasar”), a wholly owned broker-dealer subsidiary of Foreside Financial Group, LLC (“Foreside”), acts as the Fund’s principal underwriter in a continuous public offering of Fund shares. Effective September 30, 2021, Genstar Capital, a private equity firm specializing in financial and related business service companies, acquired a majority interest in Foreside. The Board approved a new Distribution Agreement to enable Quasar to continue serving as the Fund’s distributor following the change in control of Foreside.
The officers of the Fund are affiliated with the Advisor. With the exception of the Chief Compliance Officer and the Senior Compliance Officer, such officers receive no compensation from the Fund for serving in their respective roles. The Fund, along with the other funds in the Hennessy Funds family (collectively, the “Hennessy Funds”), makes reimbursement payments on an equal basis to the Advisor for a portion of the salary and benefits associated with the office of the Chief Compliance Officer and for all of the salary and benefits associated with the office of the Senior Compliance Officer. The compliance fees expensed by the Fund during fiscal year 2021 are included in the Statement of Operations.
6). GUARANTEES AND INDEMNIFICATIONS
Under the Hennessy Funds’ organizational documents, their officers and trustees are indemnified by the Hennessy Funds against certain liabilities arising out of the performance of their duties to the Hennessy Funds. Additionally, in the normal course of business, the Hennessy Funds enter into contracts with service providers that contain general indemnification clauses. The Fund’s maximum exposure under these arrangements is unknown as this would involve future claims that may be made against the Fund that have not yet occurred. Currently, the Fund expects the risk of loss to be remote.
7). LINE OF CREDIT
The Fund has an uncommitted line of credit with the other Hennessy Funds in the amount of the lesser of (i) $100,000,000 or (ii) 33.33% of each Hennessy Fund’s net assets, or 30% for the Hennessy Gas Utility Fund and 10% for the Hennessy Balanced Fund. The line of credit is intended to provide any necessary short-term financing in connection with shareholder redemptions, subject to certain restrictions. The credit facility is with the Hennessy Funds’ custodian bank, U.S. Bank N.A. Borrowings under this arrangement bear interest at the bank’s prime rate and are secured by all of the Fund’s assets (as to its own borrowings only). During fiscal year 2021, the Fund did not have any borrowings outstanding under the line of credit.
8). FEDERAL TAX INFORMATION
As of October 31, 2021, the components of accumulated earnings (losses) for income tax purposes were as follows:
| Investments | ||||
| Cost of investments for tax purposes | $ | 7,125,370 | ||
| Gross tax unrealized appreciation | $ | 1,538,881 | ||
| Gross tax unrealized depreciation | (514,095 | ) | ||
| Net tax unrealized appreciation/(depreciation) | $ | 1,024,786 | ||
| Undistributed ordinary income | $ | 1,178,003 | ||
| Undistributed long-term capital gains | 828,581 | |||
| Total distributable earnings | $ | 2,006,584 | ||
| Other accumulated gain/(loss) | $ | — | ||
| Total accumulated gain/(loss) | $ | 3,031,370 | ||
| WWW.HENNESSYFUNDS.COM |
24
| NOTES TO THE FINANCIAL STATEMENTS |
The difference between book-basis unrealized appreciation/depreciation and tax-basis unrealized appreciation/depreciation (as shown above) is attributable primarily to wash sales.
As of October 31, 2021, the Fund had no tax-basis capital losses to offset future capital gains.
As of October 31, 2021, the Fund did not defer, on a tax basis, any late-year ordinary losses. Late-year ordinary losses are net ordinary losses incurred after December 31, 2020, but within the taxable year, that are deemed to arise on the first day of the Fund’s next taxable year.
During fiscal years 2021 and 2020, the tax character of distributions paid by the Fund was as follows:
| Year Ended | Year Ended | ||||||||
| October 31, 2021 | October 31, 2020 | ||||||||
Ordinary income(1) | $ | 239,745 | $ | 61,675 | |||||
| Long-term capital gains | 429,765 | 84,296 | |||||||
| Total distributions | $ | 669,510 | $ | 145,971 | |||||
(1) Ordinary income includes short-term capital gains. |
9). EVENTS SUBSEQUENT TO YEAR END
Management has evaluated the Fund’s related events and transactions that occurred subsequent to October 31, 2021, through the date of issuance of the Fund’s financial statements. Other than as disclosed below, management has determined that there were no subsequent events requiring recognition or disclosure in the financial statements.
On December 7, 2021 capital gains were declared and paid to shareholders of record on December 6, 2021, as follows:
Long-term | Short-term | ||
| Investor Class | $2.76132 | $3.94213 | |
| Institutional Class | $2.83948 | $4.05369 |
| HENNESSY FUNDS | 1-800-966-4354 |
25
Report of Independent Registered Public
Accounting Firm
To the Board of Trustees of Hennessy Funds Trust
and the shareholders of the Hennessy Technology Fund
Novato, CA
Opinion on the Financial Statements
We have audited the accompanying statement of assets and liabilities of the Hennessy Technology Fund (the “Fund”), a series of Hennessy Funds Trust, including the schedule of investments, as of October 31, 2021, the related statement of operations for the year then ended, the statements of changes in net assets for each of the two years in the period then ended, financial highlights for each of the five years in the period then ended, and the related notes (collectively referred to as the “financial statements”). In our opinion, the financial statements present fairly, in all material respects, the financial position of the Fund as of October 31, 2021, the results of its operations for the year then ended, the changes in its net assets for each of the two years in the period then ended, and the financial highlights for each of the five years in the period then ended, in conformity with accounting principles generally accepted in the United States of America.
Basis for Opinion
These financial statements are the responsibility of the Fund’s management. Our responsibility is to express an opinion on the Fund’s financial statements based on our audits. We are a public accounting firm registered with the Public Company Accounting Oversight Board (United States) (“PCAOB”) and are required to be independent with respect to the Fund in accordance with the U.S. federal securities laws and the applicable rules and regulations of the Securities and Exchange Commission and the PCAOB. We have served as the auditor of one or more of the funds in the Trust since 2002.
We conducted our audits in accordance with the standards of the PCAOB. Those standards require that we plan and perform the audit to obtain reasonable assurance about whether the financial statements are free of material misstatement, whether due to error or fraud. The Fund is not required to have, nor were we engaged to perform, an audit of its internal control over financial reporting. As part of our audits we are required to obtain an understanding of internal control over financial reporting, but not for the purpose of expressing an opinion on the effectiveness of the Fund’s internal control over financial reporting. Accordingly, we express no such opinion.
Our audits included performing procedures to assess the risks of material misstatement of the financial statements, whether due to error or fraud, and performing procedures that respond to those risks. Such procedures included examining, on a test basis, evidence regarding the amounts and disclosures in the financial statements. Our audits also included evaluating the accounting principles used and significant estimates made by management, as well as evaluating the overall presentation of the financial statements. Our procedures included confirmation of securities owned as of October 31, 2021 by correspondence with the custodian. We believe that our audits provide a reasonable basis for our opinion.
| |
| TAIT, WELLER & BAKER LLP |
Philadelphia, Pennsylvania
December 22, 2021
| WWW.HENNESSYFUNDS.COM |
26
| REPORT OF INDEPENDENT REGISTERED PUBLIC ACCOUNTING FIRM/TRUSTEES AND OFFICERS |
Trustees and Officers of the Fund (Unaudited)
The business and affairs of the Funds are managed under the direction of the Board of Trustees of the Trust, and the Board of Trustees elects the officers of the Trust. From time to time, the Board of Trustees also has appointed advisers to the Board of Trustees (“Advisers”) with the intention of having qualified individuals serve in an advisory capacity to garner experience in the mutual fund and asset management industry and be considered as potential Trustees in the future. There are currently two Advisers, Brian Alexander and Doug Franklin. As Advisers, Mr. Alexander and Mr. Franklin attend meetings of the Board of Trustees and act as non-voting participants. Information pertaining to the Trustees, Advisers, and the officers of the Trust is set forth below. The Trustees and officers serve until their successors are duly elected and qualified or until their earlier death, resignation, or removal. Each Trustee oversees all 16 Hennessy Funds. Unless otherwise indicated, the address of all persons listed below is 7250 Redwood Boulevard, Suite 200, Novato, CA 94945. The Fund’s Statement of Additional Information includes more information about the persons listed below and is available without charge by calling 1-800-966-4354 or by visiting www.hennessyfunds.com.
| Other | |||
| Directorships | |||
| Held Outside | |||
| Name, Age, | of Fund | ||
| and Position Held | Start Date | Principal Occupation(s) | Complex During |
with the Trust | of Service | During Past Five Years | Past Five Years |
| Disinterested Trustees and Advisers | |||
| J. Dennis DeSousa | January 1996 | Mr. DeSousa is a real estate investor. | None. |
| 85 | |||
| Trustee | |||
| Robert T. Doyle | January 1996 | Mr. Doyle has been the Sheriff of | None. |
| 74 | Marin County, California since 1996. | ||
| Trustee | |||
| Claire Garvie | December 2015 | Ms. Garvie is a founder of Kiosk and | None. |
| 47 | as an Adviser | has served as its Chief Operating | |
| Trustee | to the Board | Officer since 2004. Kiosk is a full- | |
| and | service marketing agency with | ||
| December 2021 | offices in the San Francisco Bay Area, | ||
| as a Trustee | Toronto, and Liverpool, UK. | ||
| Gerald P. Richardson | May 2004 | Mr. Richardson is an independent | None. |
| 76 | consultant in the securities industry. | ||
| Trustee |
| HENNESSY FUNDS | 1-800-966-4354 |
27
| Other | |||
| Directorships | |||
| Held Outside | |||
| Name, Age, | of Fund | ||
| and Position Held | Start Date | Principal Occupation(s) | Complex During |
with the Trust | of Service | During Past Five Years | Past Five Years |
| Brian Alexander | March 2015 | Mr. Alexander has worked for the | None. |
| 40 | Sutter Health organization since | ||
| Adviser to the Board | 2011 in various positions. He has | ||
| served as the Chief Executive Officer | |||
| of the Sutter Roseville Medical | |||
| Center since 2018. From 2016 through | |||
| 2018, he served as the Vice President | |||
| of Strategy for the Sutter Health Valley | |||
| Area, which includes 11 hospitals, | |||
| 13 ambulatory surgery centers, | |||
| 16,000 employees, and 1,900 physicians. | |||
| From 2013 through 2016, Mr. Alexander | |||
| served as Sutter Novato Community | |||
| Hospital’s Chief Administrative Officer. | |||
| Doug Franklin | March 2016 | Mr. Franklin is a retired insurance | None. |
| 57 | industry executive. From 1987 | ||
| Adviser to the Board | through 2015, he was employed | ||
| by the Allianz-Fireman’s Fund | |||
| Insurance Company in various | |||
| positions, including as its Chief | |||
| Actuary and Chief Risk Officer. | |||
Interested Trustee(1) | |||
| Neil J. Hennessy | January 1996 as | Mr. Hennessy has been employed | Hennessy |
| 65 | a Trustee and | by Hennessy Advisors, Inc. since | Advisors, Inc. |
| Chairman of the Board, | June 2008 as | 1989 and currently serves as its | |
| Chief Market Strategist, | an officer | Chairman and Chief Executive Officer. | |
| Portfolio Manager, | |||
| and President |
| Name, Age, | ||
| and Position Held | Start Date | Principal Occupation(s) |
with the Trust | of Service | During Past Five Years |
| Officers | ||
| Teresa M. Nilsen | January 1996 | Ms. Nilsen has been employed by Hennessy Advisors, Inc. |
| 55 | since 1989 and currently serves as its President and Chief | |
| Executive Vice President | Operating Officer. | |
| and Treasurer | ||
| Daniel B. Steadman | March 2000 | Mr. Steadman has been employed by Hennessy Advisors, Inc. |
| 65 | since 2000 and currently serves as its Executive Vice President. | |
| Executive Vice President | ||
| and Secretary | ||
| Brian Carlson | December 2013 | Mr. Carlson has been employed by Hennessy Advisors, Inc. |
| 49 | since December 2013 and currently serves as its Chief | |
| Senior Vice President | Compliance Officer and Senior Vice President. | |
| and Head of Distribution |
| WWW.HENNESSYFUNDS.COM |
28
| TRUSTEES AND OFFICERS OF THE FUND |
| Name, Age, | ||
| and Position Held | Start Date | Principal Occupation(s) |
with the Trust | of Service | During Past Five Years |
Jennifer Cheskiewicz(2) | June 2013 | Ms. Cheskiewicz has been employed by Hennessy Advisors, Inc. |
| 44 | as its General Counsel since June 2013. | |
| Senior Vice President and | ||
| Chief Compliance Officer | ||
David Ellison(3) | October 2012 | Mr. Ellison has been employed by Hennessy Advisors, Inc. since |
| 63 | October 2012. He has served as a Portfolio Manager of the | |
| Senior Vice President | Hennessy Large Cap Financial Fund and the Hennessy Small | |
| and Portfolio Manager | Cap Financial Fund since their inception. Mr. Ellison also served | |
| as a Portfolio Manager of the Hennessy Technology Fund from | ||
| its inception until February 2017. Mr. Ellison served as Director, | ||
| CIO, and President of FBR Fund Advisers, Inc. from December | ||
| 1999 to October 2012. | ||
Ryan Kelley(4) | March 2013 | Mr. Kelley has been employed by Hennessy Advisors, Inc. since |
| 49 | October 2012. He has served as Chief Investment Officer of the | |
| Chief Investment Officer, | Hennessy Funds since March 2021 and has served as a Portfolio | |
| Senior Vice President, | Manager of the Hennessy Gas Utility Fund, the Hennessy Large | |
| and Portfolio Manager | Cap Financial Fund, and the Hennessy Small Cap Financial Fund | |
| since October 2014. Mr. Kelley served as Co-Portfolio Manager | ||
| of these same funds from March 2013 through September | ||
| 2014 and as a Portfolio Analyst for the Hennessy Funds from | ||
| October 2012 through February 2013. He has also served as a | ||
| Portfolio Manager of the Hennessy Cornerstone Growth Fund, | ||
| the Hennessy Cornerstone Mid Cap 30 Fund, the Hennessy | ||
| Cornerstone Large Growth Fund, and the Hennessy | ||
| Cornerstone Value Fund since February 2017 and as a Portfolio | ||
| Manager of the Hennessy Total Return Fund, the Hennessy | ||
| Balanced Fund, and the Hennessy Technology Fund since May | ||
| 2018. He served as Co-Portfolio Manager of the Hennessy | ||
| Technology Fund from February 2017 until May 2018. Mr. Kelley | ||
| served as Portfolio Manager of FBR Fund Advisers, Inc. from | ||
| January 2008 to October 2012. | ||
L. Joshua Wein(4) | September 2018 | Mr. Wein has been employed by Hennessy Advisors, Inc. since |
| 48 | 2018. He has served as Co-Portfolio Manager of the Hennessy | |
| Vice President and | Cornerstone Growth Fund, the Hennessy Cornerstone | |
| Co-Portfolio Manager | Mid Cap 30 Fund, the Hennessy Cornerstone Large Growth | |
| Fund, the Hennessy Cornerstone Value Fund, Hennessy Total | ||
| Return Fund, the Hennessy Balanced Fund, the Hennessy Gas | ||
| Utility Fund, and the Hennessy Technology Fund since February | ||
| 2019. He served as a Senior Analyst of these same funds from | ||
| September 2018 through February 2019. Mr. Wein served as | ||
| Director of Alternative Investments and Co-Portfolio Manager | ||
| at Sterling Capital Management from 2008 to 2018. |
_______________
(1) | Mr. Hennessy is considered an “interested person,” as defined in the Investment Company Act of 1940, as amended, because he is an officer of the Trust. |
(2) | The address of this officer is 4800 Bee Caves Road, Suite 100, Austin, TX 78746. |
(3) | The address of this officer is 101 Federal Street, Suite 1615B, Boston, MA 02110. |
(4) | The address of this officer is 1340 Environ Way, Chapel Hill, NC 27517. |
| HENNESSY FUNDS | 1-800-966-4354 |
29
Expense Example (Unaudited)
October 31, 2021
As a shareholder of the Fund, you incur ongoing costs, including management fees, service fees, and other Fund expenses. This Example is intended to help you understand your ongoing costs (in dollars) of investing in the Fund and to compare these costs with the ongoing costs of investing in other mutual funds. The Example is based on an investment of $1,000 invested at the beginning of the period and held for the entire period from May 1, 2021, through October 31, 2021.
Actual Expenses
In the table below, the first line under each of the “Investor Class” and “Institutional Class” headings provides information about actual account values and actual expenses for each share class. You may use this information, together with the amount you invested, to estimate the expenses that you paid over the period. Simply divide your account value by $1,000 (for example, an $8,600 account value divided by $1,000 = 8.6), then multiply the result by the number in the first line under the heading “Expenses Paid During Period” to estimate the expenses you paid on your account during this period. Although the Fund charges no sales loads or transaction fees, you will be assessed fees for outgoing wire transfers, returned checks, and stop payment orders at prevailing rates charged by U.S. Bank Global Fund Services, the Fund’s transfer agent. If you request that a redemption be made by wire transfer, the Fund’s transfer agent charges a $15 fee. IRAs are charged a $15 annual maintenance fee (up to $30 maximum per shareholder for shareholders with multiple IRAs). The examples below include, but are not limited to, management, shareholder servicing, accounting, custody, and transfer agent fees. However, the examples below do not include portfolio trading commissions and related expenses.
Hypothetical Example for Comparison Purposes
In the table below, the second line under each of the “Investor Class” and “Institutional Class” headings provides information about hypothetical account values and hypothetical expenses based on the Fund’s actual expense ratio for each share class and an assumed rate of return of 5% per year before expenses, which is not the Fund’s actual return for such share class. The hypothetical account values and expenses may not be used to estimate the actual ending account balance or expenses you paid for the period. You may use this information to compare the ongoing costs of investing in the Fund and other funds. To do so, compare these 5% hypothetical examples with the 5% hypothetical examples that appear in the shareholder reports of the other funds. Please note that the expenses shown in the table are meant to highlight your ongoing costs only. Therefore, the second lines under “Investor Class” and “Institutional Class” are useful in comparing ongoing costs only and will not help you determine the relative total costs of owning different funds.
| WWW.HENNESSYFUNDS.COM |
30
| EXPENSE EXAMPLE |
| Expenses Paid | |||
| Beginning | Ending | During Period(1) | |
| Account Value | Account Value | May 1, 2021 – | |
May 1, 2021 | October 31, 2021 | October 31, 2021 | |
| Investor Class | |||
| Actual | $1,000.00 | $1,022.00 | $6.27 |
| Hypothetical (5% return before expenses) | $1,000.00 | $1,019.00 | $6.26 |
| Institutional Class | |||
| Actual | $1,000.00 | $1,023.70 | $5.00 |
| Hypothetical (5% return before expenses) | $1,000.00 | $1,020.27 | $4.99 |
(1) | Expenses are equal to the Fund’s annualized expense ratio of 1.23% for Investor Class shares or 0.98% for Institutional Class shares, as applicable, multiplied by the average account value over the period, multiplied by 184/365 days (to reflect the half-year period). |
| HENNESSY FUNDS | 1-800-966-4354 |
31
How to Obtain a Copy of the Fund’s Proxy
Voting Policy and Proxy Voting Records
A description of the policies and procedures the Fund uses to determine how to vote proxies relating to portfolio securities is available without charge (1) by calling 1-800-966-4354, (2) on the Hennessy Funds’ website at www.hennessyfunds.com/proxy-voting/voting-policy, or (3) on the U.S. Securities and Exchange Commission’s (the “SEC”) website at www.sec.gov. The Fund’s proxy voting record is available without charge on both the Hennessy Funds’ website at www.hennessyfunds.com/proxy-voting/voting-record and the SEC’s website at www.sec.gov no later than August 31 for the prior 12 months ending June 30.
Availability of Quarterly Portfolio Schedule
The Fund files a complete schedule of portfolio holdings with the SEC for the first and third quarters of each fiscal year as an exhibit to its reports on Form N-PORT. The Fund’s Form N-PORT reports are available on the SEC’s website at www.sec.gov or on request by calling 1-800-966-4354.
Federal Tax Distribution Information (Unaudited)
For fiscal year 2021, certain dividends paid by the Fund may be subject to a maximum tax rate of 23.8%, as provided for by the Jobs and Growth Tax Relief Reconciliation Act of 2003. The percentage of dividends declared from ordinary income designated as qualified dividend income was 28.32%.
For corporate shareholders, the percent of ordinary income distributions that qualified for the corporate dividends received deduction for fiscal year 2021 was 25.39%.
The percentage of taxable ordinary income distributions that were designated as short-term capital gain distributions under Section 871(k)(2)(C) of the Internal Revenue Code of 1986, as amended, for the Fund was 92.49%.
Important Notice Regarding Delivery
of Shareholder Documents
To help keep the Fund’s costs as low as possible, we generally deliver a single copy of shareholder reports, proxy statements, and prospectuses to shareholders who share an address and have the same last name. This process does not apply to account statements. You may request an individual copy of a shareholder document at any time. If you would like to receive separate mailings of shareholder documents, please call U.S. Bank Global Fund Services at 1-800-261-6950 or 1-414-765-4124, and individual delivery will begin within 30 days of your request. If your account is held through a financial institution or other intermediary, please contact such intermediary directly to request individual delivery.
Electronic Delivery
As permitted by SEC regulations, the Fund’s shareholder reports are made available on a website, and unless you sign up for eDelivery or elect to receive paper copies as detailed below, you will be notified by mail each time a report is posted and provided with a website link to access the report.
The Fund also offers shareholders the option to receive all notices, account statements, prospectuses, tax forms, and shareholder reports online. To sign up for eDelivery or change your delivery preference, please visit www.hennessyfunds.com/account.
To elect to receive paper copies of all future reports free of charge, please call U.S. Bank Global Fund Services at 1-800-261-6950 or 1-414-765-4124.
Subscribe to receive our team’s unique market and sector insights delivered to your inbox
www.hennessyfunds.com/subscribe
Follow us on social media
| | |
| WWW.HENNESSYFUNDS.COM |
32
| PROXY VOTING — PRIVACY POLICY |
Liquidity Risk Management Program
In accordance with Rule 22e-4 under the Investment Company Act of 1940, as amended (the “Liquidity Rule”), we have adopted and implemented a liquidity risk management program (the “Liquidity Program”). The purpose of the Liquidity Program is to assess and manage the Fund’s liquidity risk, which is the risk that the Fund would not be able to meet requests to redeem Fund shares without significant dilution of the remaining shareholders’ interests in the Fund. The Board of Trustees of the Fund (the “Board”) designated a committee comprising representatives of Hennessy Advisors, Inc., the investment adviser to the Fund, as the administrator of the Liquidity Program (the “Program Administrator”).
The Program Administrator provided a written report regarding the Liquidity Program to the Board in advance of its meeting on June 2, 2021. The report covered the period from June 1, 2020, through May 31, 2021. The report addressed the operation of the Liquidity Program, assessed the adequacy and effectiveness of its implementation, and described any material changes to the Liquidity Program during the review period. The Trust’s chief compliance officer presented the report to the Board at the meeting and provided additional information regarding the Liquidity Program. The Board reviewed the Liquidity Program and considered, among other items, the following:
| 1. | The Program Administrator reviewed daily historical net redemption activity during the review period and during prior periods with higher-than-average redemption activity and concluded that the Fund has historically been able to meet requests to redeem Fund shares without significant dilution to the Fund’s remaining shareholders, and the Program Administrator expects the Fund to be able to continue to do so in the future during both normal and reasonably foreseeable stressed conditions. | |
| 2. | The Fund holds assets that are highly liquid investments and is therefore not required to establish a highly liquid investment minimum for the Fund or adopt policies and procedures for responding to a highly liquid investment minimum shortfall. | |
| 3. | The Program Administrator did not make any material changes to the Liquidity Program during the review period and did not recommend any changes to the Liquidity Program or the model inputs used to determine the liquidity classification of each security held by the Fund. | |
| 4. | The Program Administrator concluded that the Liquidity Program was reasonably designed to assess and manage the Fund’s liquidity risk, complies with the requirements of the Liquidity Rule, and was operating as intended during the review period. |
Privacy Policy
We collect the following personal information about you:
| 1. | Information we receive from you in applications or other forms, correspondence, or conversations, including, but not limited to, your name, address, phone number, social security number, assets, income, and date of birth; | |
| 2. | Information about your transactions with us, our affiliates, or others, including, but not limited to, your account number and balance, payments history, parties to transactions, cost basis information, and other financial information; and |
| HENNESSY FUNDS | 1-800-966-4354 |
33
| 3. | Other personal information we collect from various sources, even if you have not entered into a prior transaction with us, including the following: |
| • | Name, alias, address, unique personal identifier, online identifier, IP address, email address, telephone number, account name, and other similar identifiers; | |
| • | Age and marital status; | |
| • | Commercial information, including records of products purchased; | |
| • | Browsing history, search history, and information on interaction with our website; | |
| • | Geolocation data; | |
| • | Employment and employment history, educational history, financial information, and purchasing and consuming histories or tendencies; and | |
| • | Inferences drawn from the above-listed information to create a profile about your preferences, characteristics, predispositions, and behavior. |
We collect this information directly from you, indirectly in the course of providing services to you, directly and indirectly from your activity on our website, from broker dealers, marketing agencies, and other third parties that interact with us in connection with the services we perform and products we offer, and from anonymized and aggregated consumer information.
We use this information to fulfill the reason you provided the information to us, to provide you with other relevant products that you request from us, to provide you with information about products that may interest you, to improve our website or present our website’s contents to you, and as otherwise described to you when collecting your personal information.
We do not disclose any personal information to unaffiliated third parties, except as permitted by law. We may disclose your personal information to our affiliates, vendors, and service providers for a business purpose. For example, we are permitted by law to disclose all of the information we collect, as described above, to our transfer agent to process your transactions. When disclosing your personal information to third parties, we enter into a contract with each third party describing the purpose of such disclosure and requiring that such personal information be kept confidential and not used for any purpose except to perform the services contracted or respond to regulatory or law enforcement requests.
Furthermore, we restrict access to your personal information to those persons who require such information to provide products or services to you. As a result, we do not provide a means for opting out of our limited sharing of your information. We maintain physical, electronic, and procedural safeguards that comply with federal standards to guard your personal information.
If you hold shares of the Funds through a financial intermediary, including, but not limited to, a broker-dealer, bank, or trust company, the privacy policy of your financial intermediary governs how your personal information is shared with unaffiliated third parties.
Supplemental Privacy Notice for Residents of California
The California Consumer Privacy Act of 2018 (the “CCPA”) provides you, as a California resident, with certain additional rights relating to your personal information.
| WWW.HENNESSYFUNDS.COM |
34
| PRIVACY POLICY |
Under the CCPA, you have the right to request that we disclose to you the categories of personal information we have collected about you over the past 12 months, the categories of sources of such information, our business purpose for collecting the information, the categories of third parties, if any, with whom we shared the information, and the specific information we have collected about you. You also have the right to request that we delete any of your personal information, and, unless an exception applies, we will delete such information upon receiving and confirming your request. To make a request, call us at 1-800-966-4354, email us at privacy@hennessyfunds.com, or go to www.hennessyfunds.com/contact. We will not discriminate against you for exercising your rights under the CCPA. Further, we will not collect additional categories of your personal information or use the personal information we collected for materially different, unrelated, or incompatible purposes without providing you notice.
| HENNESSY FUNDS | 1-800-966-4354 |
35
(This Page Intentionally Left Blank.)
For information, questions, or assistance, please call
The Hennessy Funds
1-800-966-4354 or 1-415-899-1555
INVESTMENT ADVISOR
Hennessy Advisors, Inc.
7250 Redwood Boulevard, Suite 200
Novato, California 94945
ADMINISTRATOR,
TRANSFER AGENT,
DIVIDEND PAYING AGENT, &
SHAREHOLDER SERVICING AGENT
U.S. Bancorp Fund Services, LLC
d/b/a U.S. Bank Global Fund Services
P.O. Box 701
Milwaukee, Wisconsin 53201-0701
CUSTODIAN
U.S. Bank N.A.
Custody Operations
1555 North River Center Drive, Suite 302
Milwaukee, Wisconsin 53212
TRUSTEES
Neil J. Hennessy
Robert T. Doyle
J. Dennis DeSousa
Claire Garvie
Gerald P. Richardson
COUNSEL
Foley & Lardner LLP
777 East Wisconsin Avenue
Milwaukee, Wisconsin 53202-5306
INDEPENDENT REGISTERED
PUBLIC ACCOUNTING FIRM
Tait, Weller & Baker LLP
Two Liberty Place
50 South 16th Street, Suite 2900
Philadelphia, Pennsylvania 19102-2529
DISTRIBUTOR
Quasar Distributors, LLC
111 East Kilbourn Avenue, Suite 2200
Milwaukee, Wisconsin 53202
www.hennessyfunds.com | 1-800-966-4354
This report has been prepared for shareholders and may be distributed to
others only if preceded or accompanied by a current prospectus.
(b) | Not applicable. |
Item 2. Code of Ethics.
The registrant has adopted a code of ethics that applies to the registrant’s principal executive officer and principal financial officer. The registrant amended its code of ethics in June 2021 to (1) revise the blackout period in the personal securities trading policy to one trading day, (2) revise the short-swing prohibition period in the personal securities trading policy to 14 days, and (3) make general readability revisions. The registrant has not granted any waivers from any provisions of the code of ethics during the period covered by this report.
A copy of the registrant’s Code of Ethics is filed herewith, along with an exhibit that shows the portions of the Code of Ethics that were updated, as discussed above.
Item 3. Audit Committee Financial Expert.
The registrant’s board of directors has determined that it does not have an audit committee financial expert serving on its audit committee. At this time, the registrant believes that the financial and business experience provided by each member of the audit committee together offers the registrant adequate oversight for the registrant’s level of financial complexity.
Item 4. Principal Accountant Fees and Services.
The registrant has engaged the principal accountant to the Hennessy Funds, Tait, Weller & Baker LLP, to perform audit services, audit-related services, tax services, and other services during the past two fiscal years. “Audit services” refer to performing an audit of the registrant's annual financial statements or services that are normally provided by the accountant in connection with statutory and regulatory filings or engagements for those fiscal years. “Audit‑related services” refer to the assurance and related services by the principal accountant that are reasonably related to the performance of the audit. “Tax services” refer to professional services rendered by the principal accountant for tax compliance, tax advice, tax planning, and review of federal and state tax returns. The following table details the aggregate fees billed or expected to be billed for each of the last two fiscal years for audit fees, audit-related fees, tax fees, and other fees by the principal accountant to the Hennessy Funds.
| FYE 10/31/2021 | FYE 10/31/2020 | |
(a) Audit Fees | $313,200 | $320,900 |
(b) Audit-Related Fees | - | - |
(c) Tax Fees | $66,600 | $66,600 |
(d) All Other Fees | - | - |
(e)(1) The audit committee has adopted pre-approval procedures for audit and non-audit services provided to the registrant. Under the procedures, at any regularly scheduled audit committee meeting, the audit committee may pre-approve any audit, audit-related, tax, and other non-audit services to be rendered or that may be rendered by a principal accountant to the registrant and certain non-audit services to be rendered by a principal accountant to the investment advisor to the registrant’s series or such advisor’s affiliates that provide ongoing services to the registrant. The audit committee either specifically pre-approves the services or pre-approves a type of a service. No pre-approval is required for non-audit services that meet the following criteria: (1) the aggregate amount of fees to be paid for all such non-audit services is not more than 5% of the total revenues paid by the registrant to the principal accountant in the fiscal year in which the non-audit services are provided; (2) such services were not recognized by the registrant at the time of the engagement to be non-audit services; and (3) such services are promptly brought to the attention of the audit committee and approved prior to the completion of the audit.
The audit committee must pre-approve a principal accountant’s engagements for non-audit services with the investment advisor to the registrant’s series and such advisor’s affiliates that provide ongoing services to the registrant, if the engagement relates directly to the operations and financial reporting of the registrant, unless the aggregate amount of fees to be paid for all such services provided constitutes no more than 5% of the aggregate revenues paid to the principal accountant by the registrant, the investment advisor and such advisor’s affiliates that provide ongoing services to the registrant, during the fiscal year in which the services are to be provided.
If a service has not been pre-approved at a regularly scheduled audit committee meeting, and if, in the opinion of the Chief Compliance Officer of the registrant, a proposed engagement must commence before the next regularly scheduled audit committee meeting, any member of the audit committee is authorized under the procedures to pre-approve the engagement. The Chief Compliance Officer of the registrant will arrange for this interim review, coordinate with the designated member of the audit committee and provide, with the assistance of the principal accountant, information about the service to be pre-approved for the interim period. Any interim pre-approval decisions are reported (for informational purposes) to the audit committee at its next regularly scheduled meeting.
All of the tax services referenced above were pre-approved in accordance with the pre-approval procedures for audit and non-audit services.
(e)(2) The percentage of fees billed by Tait, Weller & Baker LLP applicable to non-audit services pursuant to waiver of pre-approval requirement were as follows:
| FYE 10/31/2020 | FYE 10/31/2019 | |
Audit-Related Fees | 0% | 0% |
Tax Fees | 0% | 0% |
All Other Fees | 0% | 0% |
(f) All of the principal accountant’s hours spent on auditing the registrant’s financial statements were attributed to work performed by full‑time permanent employees of the principal accountant.
(g) The principal accountant has not provided any non-audit services in the last two fiscal years to the registrant, to the investment advisor to the registrant’s series, Hennessy Advisors, Inc., or to any entity controlling, controlled by, or under common control with Hennessy Advisors, Inc.
(h) In assessing the independence of the registrant’s principal accountant, the board of trustees noted that the principal accountant has not provided any non-audit services to the investment advisor to the registrant’s series, Hennessy Advisors, Inc., or to any entity controlling, controlled by, or under common control with Hennessy Advisors, Inc.
(i) Not applicable.
(j) Not applicable.
Item 5. Audit Committee of Listed Registrants.
Not applicable to registrants who are not listed issuers (as defined in Rule 10A-3 under the Securities Exchange Act of 1934 (the “Exchange Act”)).
Item 6. Investments.
(a) The Schedules of Investments are included as part of the reports to shareholders filed under Item 1 of this Form.
(b) Not Applicable.
Item 7. Disclosure of Proxy Voting Policies and Procedures for Closed-End Management Investment Companies.
Not applicable to open-end investment companies.
Item 8. Portfolio Managers of Closed-End Management Investment Companies.
Not applicable to open-end investment companies.
Item 9. Purchases of Equity Securities by Closed‑End Management Investment Company and Affiliated Purchasers.
Not applicable to open-end investment companies.
Item 10. Submission of Matters to a Vote of Security Holders.
Not applicable.
Item 11. Controls and Procedures.
(a) | The registrant’s principal executive officer and principal financial officer have reviewed the registrant's disclosure controls and procedures (as defined in Rule 30a-3(c) under the Investment Company Act of 1940 (the “Act”)) as of a date within 90 days of the filing of this report, as required by Rule 30a‑3(b) under the Act and Rules 13a-15(b) or 15d‑15(b) under the Exchange Act. Based on their review, such officers have concluded that the disclosure controls and procedures are effective in ensuring that information required to be disclosed in this report is appropriately recorded, processed, summarized and reported and made known to them by others within the registrant and by the registrant’s service providers. |
(b) | There were no changes in the registrant's internal control over financial reporting (as defined in Rule 30a-3(d) under the Act) that occurred during the period covered by this report that has materially affected, or is reasonably likely to materially affect, the registrant's internal control over financial reporting. |
Item 12. Disclosure of Securities Lending Activities for Closed-End Management Investment Companies.
Not applicable to open-end investment companies.
Item 13. Exhibits.
| (a) | (1) Code of ethics, or amendments thereto, that is the subject of the disclosure required by Item 2, to the extent that the registrant intends to satisfy Item 2 requirements through filing of an exhibit. Filed herewith. |
(2) A separate certification for each principal executive and principal financial officer pursuant to Rule 30a‑2(a) under the Act and Section 302 of the Sarbanes-Oxley Act of 2002. Filed herewith.
(3) Any written solicitation to purchase securities under Rule 23c‑1 under the Act sent or given during the period covered by the report by or on behalf of the registrant to 10 or more persons. Not applicable to open-end investment companies.
(4) Change in the registrant’s independent public accountant. Provide the information called for by Item 4 of Form 8-K under the Exchange Act. Unless otherwise specified by Item 4, or related to and necessary for a complete understanding of information not previously disclosed, the information should relate to events occurring during the reporting period. There was no change in the registrant's independent public accountant for the period covered by this report.
| (b) | Certifications pursuant to Rule 30a‑2(b) under the Act and Section 906 of the Sarbanes‑Oxley Act of 2002. Furnished herewith. |
SIGNATURES
Pursuant to the requirements of the Securities Exchange Act of 1934 and the Investment Company Act of 1940, the registrant has duly caused this report to be signed on its behalf by the undersigned, thereunto duly authorized.
HENNESSY FUNDS TRUST
(Registrant)
By: /s/Neil J. Hennessy
Neil J. Hennessy
President
Date: January 5, 2022
Pursuant to the requirements of the Securities Exchange Act of 1934 and the Investment Company Act of 1940, this report has been signed below by the following persons on behalf of the registrant and in the capacities and on the dates indicated.
By: /s/Neil J. Hennessy Neil J. Hennessy, President and Principal Executive Officer |
Date: January 5, 2022 |
By: /s/Teresa M. Nilsen Teresa M. Nilsen, Treasurer and Principal Financial Officer |
Date: January 5, 2022 |