SECURITIES AND EXCHANGE COMMISSION
Washington, D.C. 20549
Form 6-K
REPORT OF FOREIGN PRIVATE ISSUER
PURSUANT TO RULE 13a-16 OR 15d-16
OF THE SECURITIES EXCHANGE ACT OF 1934
For the month of January 2014
Commission File Number 1-14926
KT Corporation
(Translation of registrant’s name into English)
1692-1 Seocho-dong
Seocho-gu, Seoul
137-882
Korea
(Address of principal executive offices)
Indicate by check mark whether the registrant files or will file annual reports under cover of Form 20-F or Form 40-F:
Form 20-F x Form 40-F ¨
Indicate by check mark if the registrant is submitting the Form 6-K in paper as permitted by Regulation S-T Rule 101(b)(1): ¨
Indicate by check mark if the registrant is submitting the Form 6-K in paper as permitted by Regulation S-T Rule 101(b)(7): ¨
Indicate by check mark whether by furnishing the information contained in this Form, the registrant is also thereby furnishing the information to the Commission pursuant to Rule 12g3-2(b) under the Securities Exchange Act of 1934.
Yes ¨ No x
If “Yes” is marked, indicate below the file number assigned to the registrant in connection with Rule 12g3-2(b): 82-
SIGNATURES
Pursuant to the requirements of the Securities Exchange Act of 1934, the registrant has duly caused this report to be signed on its behalf by the undersigned, thereunto duly authorized.
| Dated: January 28, 2014 | ||
| KT Corporation | ||
| By: | /s/ Youngwoo Kim | |
| Name: | Youngwoo Kim | |
| Title: | Vice President | |
| By: | /s/ Tony Yongrae Jung | |
| Name: | Tony Yongrae Jung | |
| Title: | Team Leader | |

2013 Earnings Release
Investor Relations | 2014. 1. 28
kt
kt, global ICT convergence leader
Disclaimer
This presentation has been prepared by KT Corp. (“the Company”). This presentation contains forward-looking statements, which are subject to risks, uncertainties, and assumptions. This presentation is being presented solely for your information and is subject to change without notice. No representation or warranty, expressed or implied, is made and no reliance should be placed on the accuracy, actuality, fairness, or completeness of the information presented.
Please be informed that items included in our operating income have been prepared in accordance with K-IFRS 1001 released on October 17, 2012, which was revised to coincide with the Korean Accounting Standards for Non-Public Entities (“KAS-NPEs”). As such, our disposal gains from real estates and others have been excluded from our operating income.
The Company, its affiliates or representatives accept no liability whatsoever for any losses arising from any information contained in the presentation. This presentation does not constitute an offer or invitation to purchase or subscribe for any shares of the Company, and no part of this presentation shall form the Basis of or be relied upon in connection with any contract or commitment.
Any decision to purchase shares of the Company should be made solely on the Basis of information, which has been publicly filed with the Securities and Exchange Commission or the Korea Stock Exchange and distributed to all investors.
The contents of this presentation may not be reproduced, redistributed or passed on, directly or indirectly, to any other person or published, in whole or in part, for any purpose.
1
Contents
1 Financial Highlights
2 Business Overview
3 Q&A
4 Appendix
2
K-IFRS / Consolidated
1-1 Financial Highlights
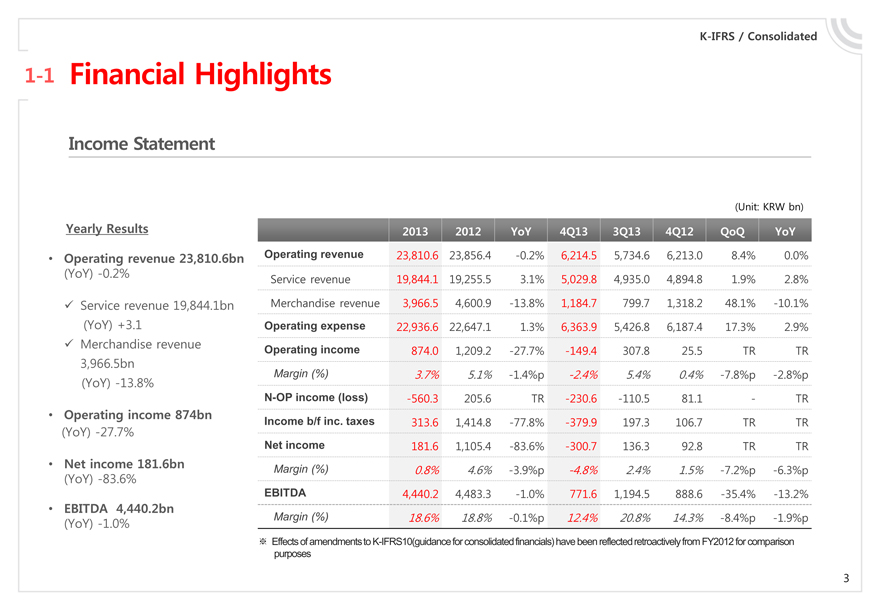
Income Statement
(Unit: KRW bn)
Yearly Results 2013 2012 YoY 4Q13 3Q13 4Q12 QoQ YoY
Operating revenue 23,810.6bn Operating revenue 23,810.6 23,856.4 -0.2% 6,214.5 5,734.6 6,213.0 8.4% 0.0%
(YoY) -0.2% Service revenue 19,844.1 19,255.5 3.1% 5,029.8 4,935.0 4,894.8 1.9% 2.8%
Service revenue 19,844.1bn Merchandise revenue 3,966.5 4,600.9 -13.8% 1,184.7 799.7 1,318.2 48.1% -10.1%
(YoY) +3.1 Operating expense 22,936.6 22,647.1 1.3% 6,363.9 5,426.8 6,187.4 17.3% 2.9%
Merchandise revenue Operating income 874.0 1,209.2 -27.7% -149.4 307.8 25.5 TR TR
3,966.5bn
(YoY) -13.8% Margin (%) 3.7% 5.1% -1.4%p -2.4% 5.4% 0.4% -7.8%p -2.8%p
N-OP income (loss) -560.3 205.6 TR -230.6 -110.5 81.1 - TR
Operating income 874bn Income b/f inc. taxes 313.6 1,414.8 -77.8% -379.9 197.3 106.7 TR TR
(YoY) -27.7% Net income 181.6 1,105.4 -83.6% -300.7 136.3 92.8 TR TR
Net income 181.6bn Margin (%) 0.8% 4.6% -3.9%p -4.8% 2.4% 1.5% -7.2%p -6.3%p
(YoY) -83.6% EBITDA 4,440.2 4,483.3 -1.0% 771.6 1,194.5 888.6 -35.4% -13.2%
EBITDA 4,440.2bn
(YoY) -1.0% Margin (%) 18.6% 18.8% -0.1%p 12.4% 20.8% 14.3% -8.4%p -1.9%p
Effects of amendments to K-IFRS10 (guidance for consolidated financials) have been reflected retroactively from FY2012 for comparison purposes
3
K-IFRS / Consolidated
1-2 Financial Highlights
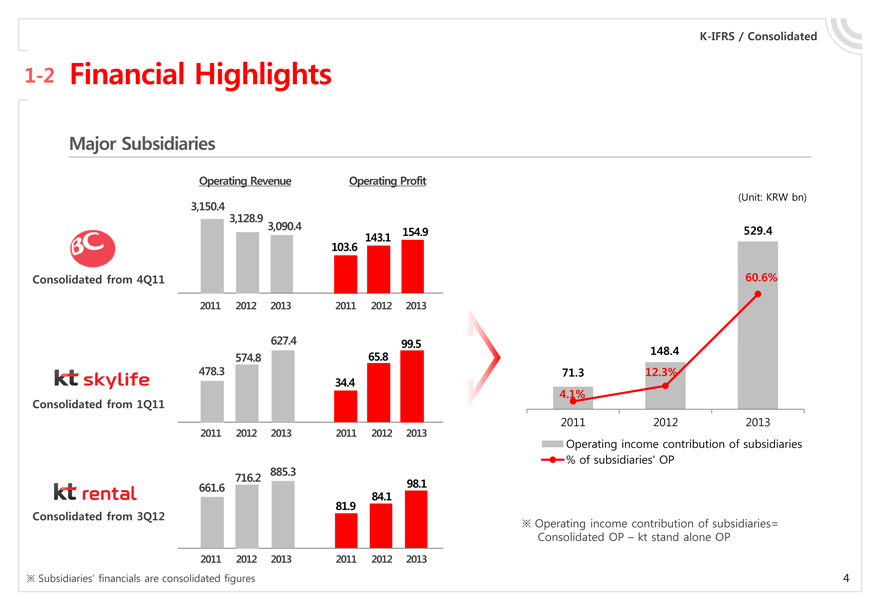
Major Subsidiaries
BC
Consolidated from 4Q11
Operating Revenue
3,150.4 3,128.9 3,090.4
2011 2012 2013
Operating Profit
103.6 143.1 154.9
2011 2012 2013
kt skylife
Consolidated from 1Q11
478.3 574.8 627.4
2011 2012 2013
34.4 65.8 99.5
2011 2012 2013
kt rental
Consolidated from 3Q12
661.6 716.2 885.3
2011 2012 2013
81.9 84.1 98.1
2011 2012 2013
Subsidiaries’ financials are consolidated figures
(Unit: KRW bn)
71.3 148.4 529.4
4.1% 12.3% 60.6%
2011 2012 2013
Operating income contribution of subsidiaries
% of subsidiaries’ OP
Operating income contribution of subsidiaries= Consolidated OP – kt stand alone OP
4
K-IFRS / Consolidated
1-3 Financial Highlights
Operating Revenue
(Unit: KRW bn)
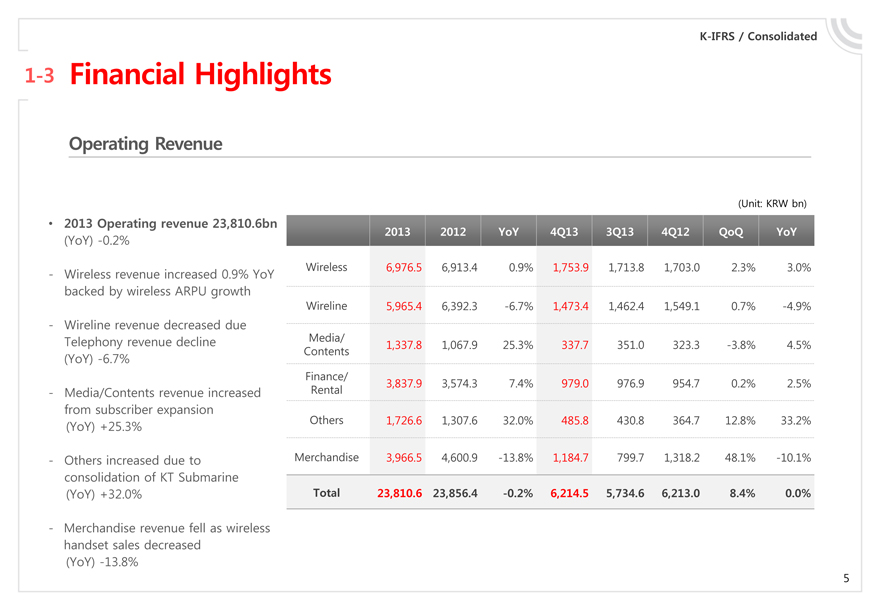
2013 Operating revenue 23,810.6bn
(YoY) -0.2% 2013 2012 YoY 4Q13 3Q13 4Q12 QoQ YoY
- Wireless revenue increased 0.9% YoY backed by wireless ARPU growth
Wireless 6,976.5 6,913.4 0.9% 1,753.9 1,713.8 1,703.0 2.3% 3.0%
Wireline 5,965.4 6,392.3 -6.7% 1,473.4 1,462.4 1,549.1 0.7% -4.9%
- Wireline revenue decreased due Telephony revenue decline (YoY) -6.7%
Media/Contents 1,337.8 1,067.9 25.3% 337.7 351.0 323.3 -3.8% 4.5%
- Media/Contents revenue increased from subscriber expansion (YoY) +25.3%
Finance/Rental 3,837.9 3,574.3 7.4% 979.0 976.9 954.7 0.2% 2.5%
Others 1,726.6 1,307.6 32.0% 485.8 430.8 364.7 12.8% 33.2%
- Others increased due to consolidation of KT Submarine (YoY) +32.0%
Merchandise 3,966.5 4,600.9 -13.8% 1,184.7 799.7 1,318.2 48.1% -10.1%
Total 23,810.6 23,856.4 -0.2% 6,214.5 5,734.6 6,213.0 8.4% 0.0%
- Merchandise revenue fell as wireless handset sales decreased (YoY) -13.8%
5
K-IFRS / Consolidated
1-4 Financial Highlights
Operating Expenses
(Unit: KRW bn)
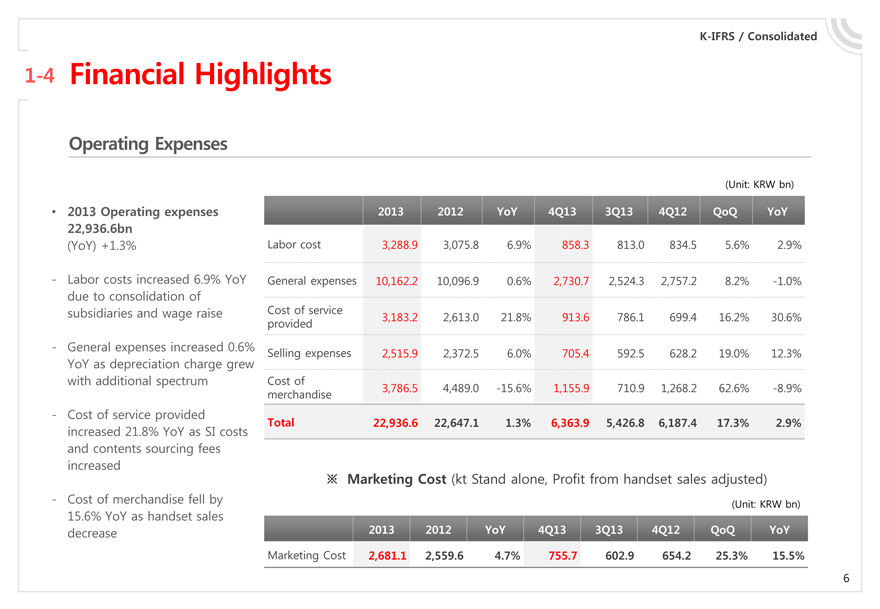
2013 Operating expenses 22,936.6bn (YoY) +1.3%
Labor cost 2013 3,288.9 2012 3,075.8 YoY 6.9% 4Q13 858.3 3Q13 813.0 4Q12 834.5 QoQ 5.6% YoY 2.9%
- Labor costs increased 6.9% YoY due to consolidation of subsidiaries and wage raise
General expenses 10,162.2 10,096.9 0.6% 2,730.7 2,524.3 2,757.2 8.2% -1.0%
Cost of service provided 3,183.2 2,613.0 21.8% 913.6 786.1 699.4 16.2% 30.6%
- General expenses increased 0.6% YoY as depreciation charge grew with additional spectrum
Selling expenses 2,515.9 2,372.5 6.0% 705.4 592.5 628.2 19.0% 12.3%
Cost of merchandise 3,786.5 4,489.0 -15.6% 1,155.9 710.9 1,268.2 62.6% -8.9%
- Cost of service provided increased 21.8% YoY as SI costs and contents sourcing fees increased
Total 22,936.6 22,647.1 1.3% 6,363.9 5,426.8 6,187.4 17.3% 2.9%
Marketing Cost (kt Stand alone, Profit from handset sales adjusted)
(Unit: KRW bn)
- Cost of merchandise fell by 15.6% YoY as handset sales decrease
2013 2012 YoY 4Q13 3Q13 4Q12 QoQ YoY
Marketing Cost 2,681.1 2,559.6 4.7% 755.7 602.9 654.2 25.3% 15.5%
6
K-IFRS / Consolidated
1-5 Financial Highlights
Non-Operating Income(Loss)
(Unit: KRW bn)
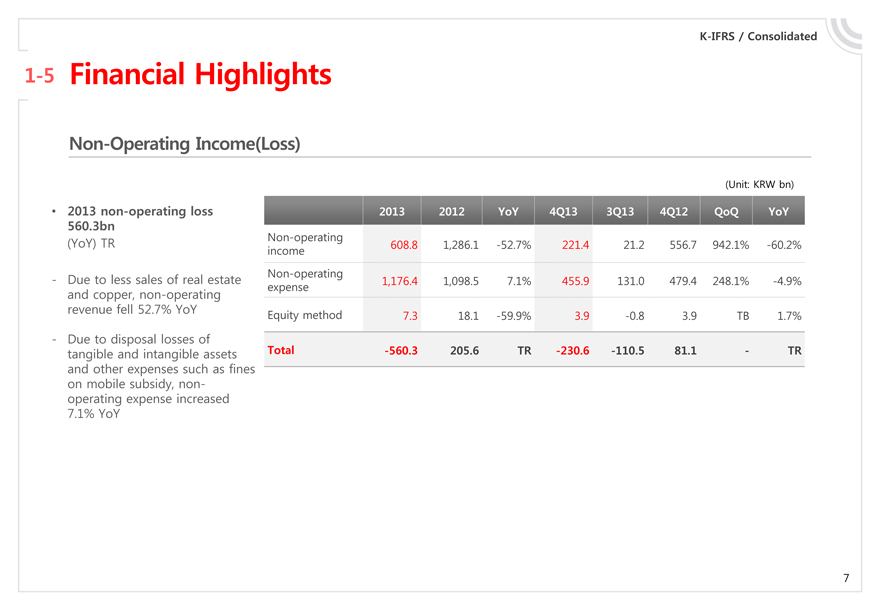
2013 non-operating loss
2013 2012 YoY 4Q13 3Q13 4Q12 QoQ YoY
560.3bn (YoY) TR
Non-operating income 608.8 1,286.1 -52.7% 221.4 21.2 556.7 942.1% -60.2%
- Due to less sales of real estate and copper, non-operating revenue fell 52.7% YoY
Non-operating expense 1,176.4 1,098.5 7.1% 455.9 131.0 479.4 248.1% -4.9%
Equity method 7.3 18.1 -59.9% 3.9 -0.8 3.9 TB 1.7%
- Due to disposal losses of tangible and intangible assets and other expenses such as fines on mobile subsidy, non-operating expense increased 7.1% YoY
Total -560.3 205.6 TR -230.6 -110.5 81.1 - TR
7
K-IFRS / Consolidated
1-6 Financial Highlights
Financial Position
(Unit: KRW bn)
Debt Position 4Q13 3Q13 4Q12 QoQ YoY
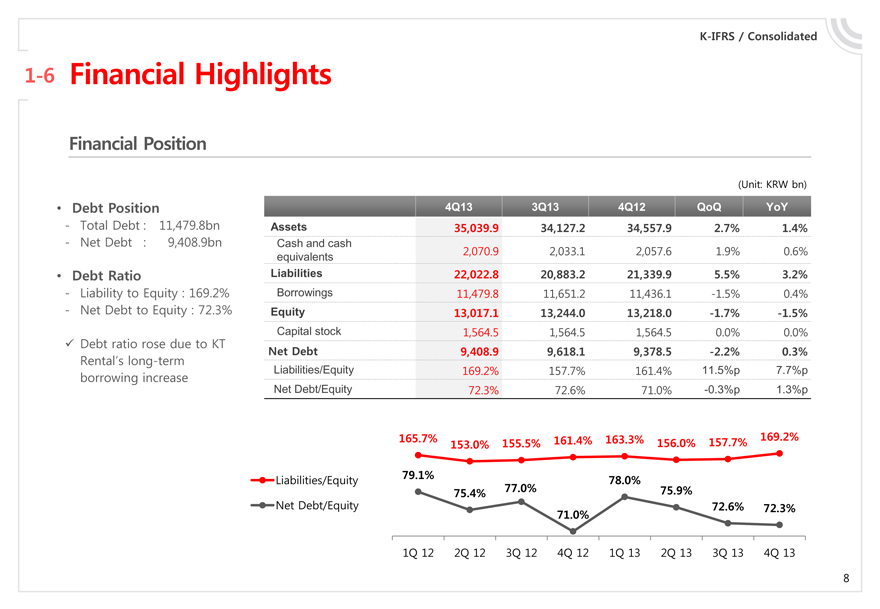
- Total Debt : 11,479.8bn
Assets 35,039.9 34,127.2 34,557.9 2.7% 1.4%
- Net Debt : 9,408.9bn
Cash and cash equivalents 2,070.9 2,033.1 2,057.6 1.9% 0.6%
Debt Ratio
Liabilities 22,022.8 20,883.2 21,339.9 5.5% 3.2%
- Liability to Equity : 169.2%
Borrowings 11,479.8 11,651.2 11,436.1 -1.5% 0.4%
- Net Debt to Equity : 72.3%
Equity 13,017.1 13,244.0 13,218.0 -1.7% -1.5%
Capital stock 1,564.5 1,564.5 1,564.5 0.0% 0.0%
Debt ratio rose due to KT
Net Debt 9,408.9 9,618.1 9,378.5 -2.2% 0.3%
Rental’s long-term borrowing increase
Liabilities/Equity 169.2% 157.7% 161.4% 11.5%p 7.7%p
Net Debt/Equity 72.3% 72.6% 71.0% -0.3%p 1.3%p
Liabilities/Equity
Net Debt/Equity
165.7% 153.0% 155.5% 161.4% 163.3% 156.0% 157.7% 169.2%
79.1% 75.4% 77.0% 71.0% 78.0% 75.9% 72.6% 72.3%
1Q 12 2Q 12 3Q 12 4Q 12 1Q 13 2Q 13 3Q 13 4Q 13
8
K-IFRS / kt Separate
1-7 Financial Highlights
CAPEX
(Unit: KRW bn)
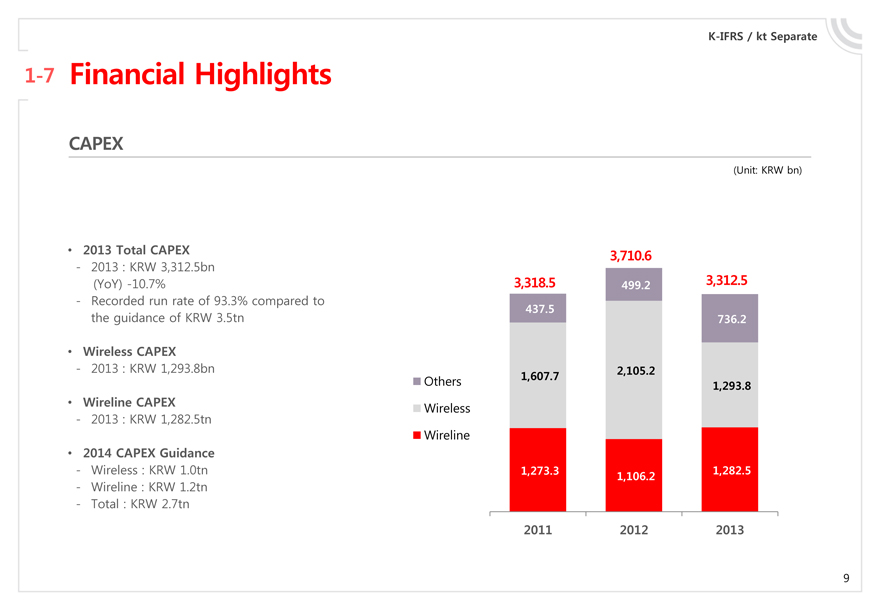
2013 Total CAPEX
- 2013 : KRW 3,312.5bn
(YoY) -10.7%
- Recorded run rate of 93.3% compared to the guidance of KRW 3.5tn
Wireless CAPEX
- 2013 : KRW 1,293.8bn
Wireline CAPEX
- 2013 : KRW 1,282.5tn
2014 CAPEX Guidance
- Wireless : KRW 1.0tn
- Wireline : KRW 1.2tn
- Total : KRW 2.7tn
Others
Wireless
Wireline
3,318.5 3,710.6 3,312.5
437.5 499.2 736.2
1,607.7 2,105.2 1,293.8
1,273.3 1,106.2 1,282.5
2011 2012 2013
9
1 Financial Highlights
2 Business Overview
3 Q&A
4 Appendix
10
K-IFRS / Consolidated
2-1 Business Overview
Wireless
(Unit: KRW bn)
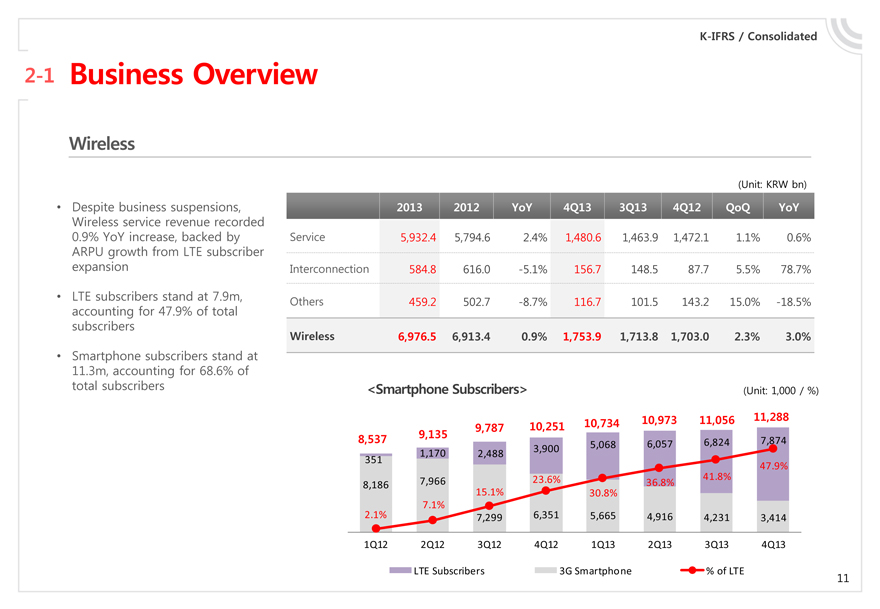
Despite business suspensions, Wireless service revenue recorded 0.9% YoY increase, backed by ARPU growth from LTE subscriber expansion
2013 2012 YoY 4Q13 3Q13 4Q12 QoQ YoY
Service 5,932.4 5,794.6 2.4% 1,480.6 1,463.9 1,472.1 1.1% 0.6%
Interconnection 584.8 616.0 -5.1% 156.7 148.5 87.7 5.5% 78.7%
LTE subscribers stand at 7.9m, accounting for 47.9% of total subscribers
Others 459.2 502.7 -8.7% 116.7 101.5 143.2 15.0% -18.5%
Wireless 6,976.5 6,913.4 0.9% 1,753.9 1,713.8 1,703.0 2.3% 3.0%
Smartphone subscribers stand at 11.3m, accounting for 68.6% of total subscribers
<Smartphone Subscribers>
(Unit: 1,000 / %)
8,537 9,135 9,787 10,251 10,734 10,973 11,056 11,288
351 1,170 2,488 3,900 5,068 6,057 6,824 7,874
8,186 7,966 2.1% 7.1% 15.1% 23.6% 30.8% 36.8% 41.8% 47.9%
7,299 6,351 5,665 4,916 4,231 3,414
1Q12 2Q12 3Q12 4Q12 1Q13 2Q13 3Q13 4Q13
LTE Subscribers 3G Smartphone % of LTE
11
K-IFRS / Consolidated
2-2 Business Overview
Wireline
(Unit: KRW bn)
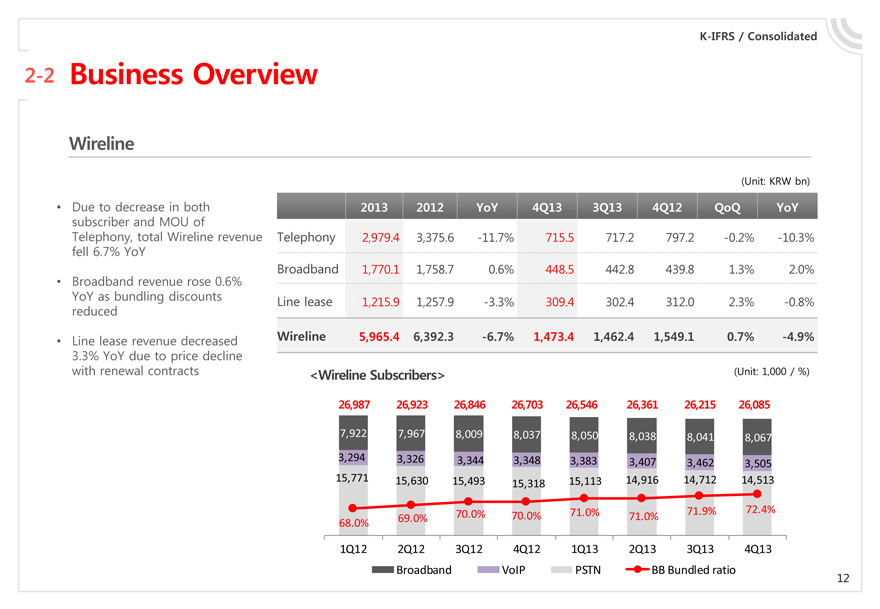
Due to decrease in both subscriber and MOU of Telephony, total Wireline revenue fell 6.7% YoY
2013 2012 YoY 4Q13 3Q13 4Q12 QoQ YoY
Telephony 2,979.4 3,375.6 -11.7% 715.5 717.2 797.2 -0.2% -10.3%
Broadband 1,770.1 1,758.7 0.6% 448.5 442.8 439.8 1.3% 2.0%
Broadband revenue rose 0.6% YoY as bundling discounts reduced
Line lease 1,215.9 1,257.9 -3.3% 309.4 302.4 312.0 2.3% -0.8%
Line lease revenue decreased 3.3% YoY due to price decline with renewal contracts
Wireline 5,965.4 6,392.3 -6.7% 1,473.4 1,462.4 1,549.1 0.7% -4.9%
<Wireline Subscribers>
(Unit: 1,000 / %)
26,987 26,923 26,846 26,703 26,546 26,361 26,215 26,085
7,922 7,967 8,009 8,037 8,050 8,038 8,041 8,067
3,294 3,326 3,344 3,348 3,383 3,407 3,462 3,505
15,771 15,630 15,493 15,318 15,113 14,916 14,712 14,513
68.0% 69.0% 70.0% 70.0% 71.0% 71.0% 71.9% 72.4%
1Q12 2Q12 3Q12 4Q12 1Q13 2Q13 3Q13 4Q13
Broadband VoIP PSTN BB Bundled ratio
12
K-IFRS / Consolidated
2-3 Business Overview
Media / Contents
(Unit: KRW bn)
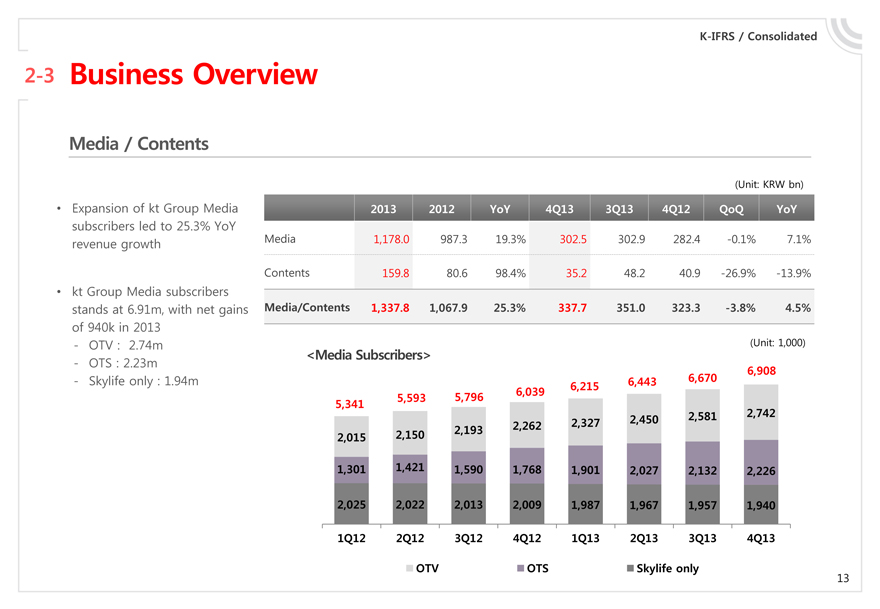
Expansion of kt Group Media subscribers led to 25.3% YoY revenue growth
2013 2012 YoY 4Q13 3Q13 4Q12 QoQ YoY
Media 1,178.0 987.3 19.3% 302.5 302.9 282.4 -0.1% 7.1%
Contents 159.8 80.6 98.4% 35.2 48.2 40.9 -26.9% -13.9%
kt Group Media subscribers stands at 6.91m, with net gains of 940k in 2013
Media/Contents 1,337.8 1,067.9 25.3% 337.7 351.0 323.3 -3.8% 4.5%
- OTV : 2.74m
(Unit: 1,000)
- OTS : 2.23m <Media Subscribers>
- Skylife only : 1.94m
5,341 5,593 5,796 6,039 6,215 6,443 6,670 6,908
2,015 2,150 2,193 2,262 2,327 2,450 2,581 2,742
1,301 1,421 1,590 1,768 1,901 2,027 2,132 2,226
2,025 2,022 2,013 2,009 1,987 1,967 1,957 1,940
1Q12 2Q12 3Q12 4Q12 1Q13 2Q13 3Q13 4Q13
OTV OTS Skylife only
13
K-IFRS / Consolidated
2-4 Business Overview
Finance / Rental
(Unit: KRW bn)
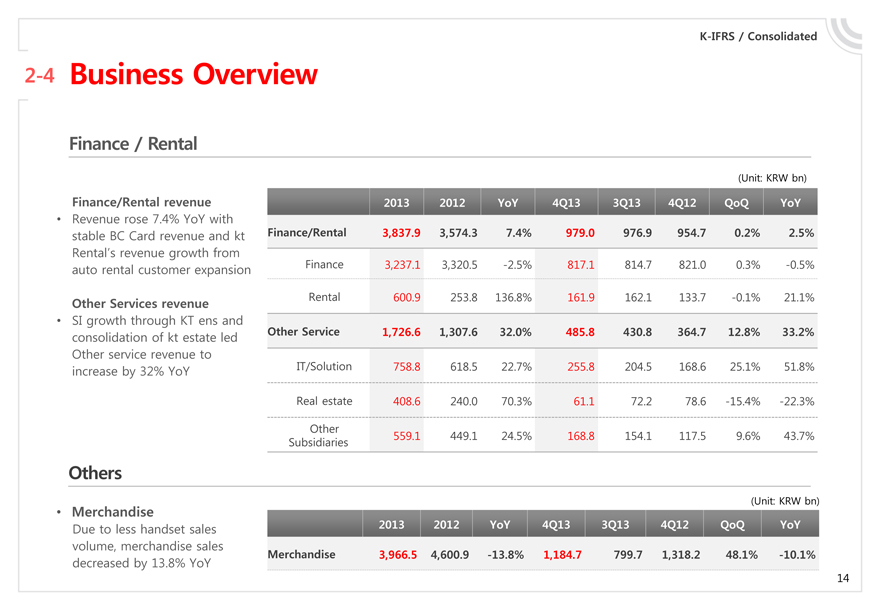
Finance/Rental revenue
Revenue rose 7.4% YoY with stable BC Card revenue and kt Rental’s revenue growth from auto rental customer expansion
Other Services revenue
SI growth through KT ens and consolidation of kt estate led Other service revenue to increase by 32% YoY
Finance/Rental Finance Rental Other Service IT/Solution Real estate Other Subsidiaries
2013 3,837.9 3,237.1 600.9 1,726.6 758.8 408.6 559.1
2012 3,574.3 3,320.5 253.8 1,307.6 618.5 240.0 449.1
YoY 7.4% -2.5% 136.8% 32.0% 22.7% 70.3% 24.5%
4Q13 979.0 817.1 161.9 485.8 255.8 61.1 168.8
3Q13 976.9 814.7 162.1 430.8 204.5 72.2 154.1
4Q12 954.7 821.0 133.7 364.7 168.6 78.6 117.5
QoQ YoY 0.2% 2.5% 0.3% -0.5% -0.1% 21.1% 12.8% 33.2% 25.1% 51.8% -15.4% -22.3% 9.6% 43.7%
Others
(Unit: KRW bn)
Merchandise
Due to less handset sales volume, merchandise sales decreased by 13.8% YoY
Merchandise
2013
3,966.5
2012
YoY
4Q13
3Q13
4Q12
QoQ
YoY
4,600.9
-13.8%
1,184.7
799.7
1,318.2
48.1%
-10.1%
14
Q&A
1 Financial Highlights
2 Business Overview
3 Q&A
4 Appendix
15
1 Financial Highlights
2 Business Overview
3 Q&A
4 Appendix
16

4-1 K-IFRS Quarterly Income Statements
(Unit: KRW bn)
Consolidated I/S 1Q12 2Q12 3Q12 4Q12 1Q13 2Q13 3Q13 4Q13
Operating revenue 5,723 5,732 6,188 6,213 6,104 5,757 5,735 6,214
Service Revenue 4,725 4,760 4,876 4,895 4,941 4,938 4,935 5,030
Wireless 1,716 1,740 1,754 1,703 1,757 1,752 1,714 1,754
Fixed line 1,664 1,611 1,568 1,549 1,522 1,508 1,462 1,473
Media/Contents 231 248 266 323 314 335 351 338
Finance/Rental 836 844 939 955 917 965 977 979
Other service 279 316 348 365 432 378 431 486
Merchandise rev. 998 973 1,312 1,318 1,163 819 800 1,185
Operating expense 5,144 5,379 5,937 6,187 5,737 5,409 5,427 6,364
Service expense 4,146 4,412 4,680 4,919 4,590 4,636 4,716 5,208
Labor expense 737 744 760 835 804 813 813 858
General expense 2,382 2,457 2,501 2,757 2,404 2,503 2,524 2,731
Depreciation 764 773 874 863 879 880 887 921
Commissions 333 346 333 406 262 298 335 365
Advertising 24 40 40 47 32 38 45 46
Financial biz exp 693 701 675 703 632 675 689 707
Other general exp 568 596 580 739 599 612 569 692
Cost of svc provided 596 633 685 699 744 740 786 914
Cost of service 254 324 341 449 394 434 499 609
Interconnection fees 259 239 247 156 203 209 210 230
Other cost of service 83 69 97 94 147 98 78 75
Selling expense 431 579 734 628 638 580 593 705
Sales expense 399 549 694 588 592 530 544 649
Bad debt expense 33 30 40 40 46 50 48 56
Cost of merch sold 998 966 1,257 1,268 1,147 772 711 1,156
Operating income 579 354 251 26 367 348 308 -149
EBITDA 1,343 1,127 1,125 889 1,246 1,228 1,194 772
N-OP income(loss) -58 -49 231 81 -72 -147 -111 -231
N-operating income 192 74 463 557 223 143 21 221
N-operating expense 254 129 236 479 296 293 131 456
Equity Method (G/L) 4 7 4 4 1 3 -1 4
Income bf taxes 521 305 482 107 295 201 197 -380
Income tax 117 64 98 -1 83 68 61 -79
Income from con op 404 241 384 108 213 133 136 -301
Income from discon. op 2 -3 -15 -15 0 0 0 0
Net income 406 237 370 93 213 133 136 -301
NI contributable to kt 384 217 356 89 182 109 106 -316
kt Separate I/S 1Q12 2Q12 3Q12 4Q12 1Q13 2Q13 3Q13 4Q13
Operating revenue 4,601 4,575 4,941 4,747 4,791 4,359 4,151 4,636
Service Revenue 3,640 3,622 3,639 3,562 3,679 3,560 3,471 3,549
Wireless 1,691 1,715 1,731 1,678 1,734 1,731 1,693 1,735
Fixed line 1,682 1,616 1,590 1,554 1,507 1,485 1,440 1,448
Media/Contents 102 110 122 132 130 132 147 160
Finance/Rental
Other service 164 180 196 198 307 212 191 206
Merchandise rev. 961 953 1,302 1,184 1,112 799 680 1,087
Operating expense 4,078 4,285 4,722 4,718 4,555 4,166 4,004 4,868
Service expense 3,085 3,320 3,480 3,559 3,438 3,389 3,314 3,710
Labor expense 606 605 599 691 641 635 627 654
General expense 1,517 1,594 1,573 1,751 1,563 1,607 1,583 1,790
Depreciation 725 734 736 731 732 723 725 751
Commissions 333 347 346 405 325 346 328 405
Advertising 22 38 36 41 30 39 44 48
Financial biz exp
Other general exp 438 476 455 573 476 500 485 586
Cost of svc provided 506 493 524 464 541 511 496 549
Cost of service 165 184 181 214 192 203 207 243
Interconnection fees 259 239 246 155 202 209 210 230
Other cost of service 83 70 97 95 147 98 79 76
Selling expense 457 627 784 653 693 637 608 718
Sales expense 437 607 758 629 657 597 566 693
Bad debt expense 20 21 26 24 36 39 42 25
Cost of merch sold 993 965 1,241 1,159 1,116 776 690 1,157
Operating income 523 290 219 29 236 193 147 -232
EBITDA 1,247 1,024 955 760 968 916 872 520
N-OP income(loss) -64 -59 116 97 -70 -150 -100 -223
N-operating income 178 62 338 538 245 127 9 184
N-operating expense 243 122 222 441 316 277 110 407
Income bf taxes 458 231 335 126 166 44 47 -454
Income tax 98 44 71 228 26 9 6 -95
Net income 361 187 263 -102 140 35 41 -360
Effects of amendments to K-IFRS10(guidance for consolidated financials) have been reflected retroactively from FY2012 for comparison purposes
17
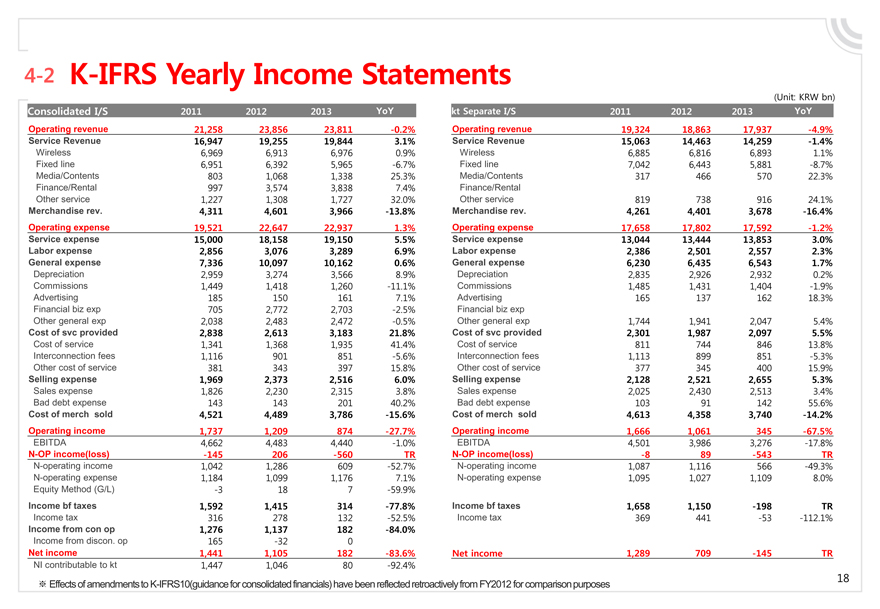
4-2 K-IFRS Yearly Income Statements
(Unit: KRW bn)
Consolidated I/S 2011 2012 2013 YoY
Operating revenue 21,258 23,856 23,811 -0.2%
Service Revenue 16,947 19,255 19,844 3.1%
Wireless 6,969 6,913 6,976 0.9%
Fixed line 6,951 6,392 5,965 -6.7%
Media/Contents 803 1,068 1,338 25.3%
Finance/Rental 997 3,574 3,838 7.4%
Other service 1,227 1,308 1,727 32.0%
Merchandise rev. 4,311 4,601 3,966 -13.8%
Operating expense 19,521 22,647 22,937 1.3%
Service expense 15,000 18,158 19,150 5.5%
Labor expense 2,856 3,076 3,289 6.9%
General expense 7,336 10,097 10,162 0.6%
Depreciation 2,959 3,274 3,566 8.9%
Commissions 1,449 1,418 1,260 -11.1%
Advertising 185 150 161 7.1%
Financial biz exp 705 2,772 2,703 -2.5%
Other general exp 2,038 2,483 2,472 -0.5%
Cost of svc provided 2,838 2,613 3,183 21.8%
Cost of service 1,341 1,368 1,935 41.4%
Interconnection fees 1,116 901 851 -5.6%
Other cost of service 381 343 397 15.8%
Selling expense 1,969 2,373 2,516 6.0%
Sales expense 1,826 2,230 2,315 3.8%
Bad debt expense 143 143 201 40.2%
Cost of merch sold 4,521 4,489 3,786 -15.6%
Operating income 1,737 1,209 874 -27.7%
EBITDA 4,662 4,483 4,440 -1.0%
N-OP income(loss) -145 206 -560 TR
N-operating income 1,042 1,286 609 -52.7%
N-operating expense 1,184 1,099 1,176 7.1%
Equity Method (G/L) -3 18 7 -59.9%
Income bf taxes 1,592 1,415 314 -77.8%
Income tax 316 278 132 -52.5%
Income from con op 1,276 1,137 182 -84.0%
Income from discon. op 165 -32 0
Net income 1,441 1,105 182 -83.6%
NI contributable to kt 1,447 1,046 80 -92.4%
kt Separate I/S 2011 2012 2013 YoY
Operating revenue 19,324 18,863 17,937 -4.9%
Service Revenue 15,063 14,463 14,259 -1.4%
Wireless 6,885 6,816 6,893 1.1%
Fixed line 7,042 6,443 5,881 -8.7%
Media/Contents 317 466 570 22.3%
Finance/Rental
Other service 819 738 916 24.1%
Merchandise rev. 4,261 4,401 3,678 -16.4%
Operating expense 17,658 17,802 17,592 -1.2%
Service expense 13,044 13,444 13,853 3.0%
Labor expense 2,386 2,501 2,557 2.3%
General expense 6,230 6,435 6,543 1.7%
Depreciation 2,835 2,926 2,932 0.2%
Commissions 1,485 1,431 1,404 -1.9%
Advertising 165 137 162 18.3%
Financial biz exp
Other general exp 1,744 1,941 2,047 5.4%
Cost of svc provided 2,301 1,987 2,097 5.5%
Cost of service 811 744 846 13.8%
Interconnection fees 1,113 899 851 -5.3%
Other cost of service 377 345 400 15.9%
Selling expense 2,128 2,521 2,655 5.3%
Sales expense 2,025 2,430 2,513 3.4%
Bad debt expense 103 91 142 55.6%
Cost of merch sold 4,613 4,358 3,740 -14.2%
Operating income 1,666 1,061 345 -67.5%
EBITDA 4,501 3,986 3,276 -17.8%
N-OP income(loss) -8 89 -543 TR
N-operating income 1,087 1,116 566 -49.3%
N-operating expense 1,095 1,027 1,109 8.0%
Income bf taxes 1,658 1,150 -198 TR
Income tax 369 441 -53 -112.1%
Net income 1,289 709 -145 TR
Effects of amendments to K-IFRS10(guidance for consolidated financials) have been reflected retroactively from FY2012 for comparison purposes
18

4-3 K-IFRS Statement of Financial Position
(Unit: KRW bn)
Consolidated 1Q12 2Q12 3Q12 4Q12 1Q13 2Q13 3Q13 4Q13
Asset 33,209 32,253 33,871 34,558 34,075 33,490 34,127 35,040
Current assets 10,967 9,872 10,582 10,517 10,546 10,108 10,057 9,967
Cash &cash equivalents 1,590 1,411 1,279 2,058 1,493 1,882 2,033 2,071
Trade & other rec 5,228 4,947 4,817 4,564 4,214 4,080 3,660 3,737
Inventories 897 944 802 935 1,215 866 776 614
Other current assets 3,253 2,569 3,685 2,961 3,625 3,280 3,588 3,545
Non-current assets 22,242 22,382 23,289 24,040 23,529 23,382 24,070 25,072
Trade & other rec 1,514 1,212 929 1,073 751 805 648 815
P.P.E 14,265 14,562 15,431 15,806 15,739 15,714 15,816 16,659
Other non-cur assets 6,462 6,607 6,929 7,161 7,039 6,864 7,606 7,599
Liabilities 20,710 19,506 20,613 21,340 21,135 20,409 20,883 22,023
Current liabilities 10,602 9,609 10,318 11,267 11,184 10,640 9,829 11,135
Trade & other payables 6,616 5,914 6,450 7,221 6,964 6,046 6,084 7,368
Short-term borrowings 3,086 2,844 3,043 3,197 3,356 3,798 2,982 3,014
Other current liabilities 901 851 826 848 864 796 764 753
Non-current liabilities 10,108 9,897 10,294 10,073 9,951 9,770 11,054 10,888
Trade & other payables 658 585 738 701 605 603 1,136 1,059
Long-term borrowings 8,386 8,172 8,449 8,239 8,231 8,012 8,669 8,466
Other non-cur liabilities 1,064 1,140 1,107 1,133 1,115 1,154 1,248 1,363
Equity 12,498 12,747 13,259 13,218 12,939 13,081 13,244 13,017
Net debt 9,882 9,605 10,213 9,379 10,095 9,929 9,618 9,409
kt Separate 1Q12 2Q12 3Q12 4Q12 1Q13 2Q13 3Q13 4Q13
Asset 27,126 26,412 25,978 26,509 25,766 24,876 25,318 25,892
Current assets 7,072 6,310 6,093 6,090 5,899 5,107 4,992 4,712
Cash &cash equivalents 809 791 501 1,173 531 794 901 1,024
Trade & other rec 4,740 4,500 4,264 3,951 3,608 3,352 2,910 3,007
Inventories 723 764 613 809 1,082 713 634 478
Other current assets 800 254 715 156 677 249 549 202
Non-current assets 20,054 20,103 19,885 20,419 19,867 19,768 20,326 21,180
Trade & other rec 1,396 1,099 788 926 600 648 485 675
P.P.E 13,464 13,744 13,604 13,009 12,854 12,723 12,713 13,365
Other non-cur assets 5,194 5,260 5,493 6,484 6,412 6,398 7,128 7,141
Liabilities 15,503 14,592 13,884 14,638 14,241 13,331 13,716 14,600
Current liabilities 7,347 6,582 6,181 7,338 7,294 6,752 5,995 6,992
Trade & other payables 4,824 4,322 4,059 4,966 4,542 3,701 3,683 5,002
Short-term borrowings 1,877 1,657 1,568 1,781 2,183 2,539 1,897 1,583
Other current liabilities 646 603 554 591 569 512 415 407
Non-current liabilities 8,155 8,010 7,703 7,300 6,947 6,579 7,721 7,609
Trade & other payables 611 543 697 676 577 568 1,081 1,049
Long-term borrowings 6,811 6,658 6,168 5,785 5,568 5,176 5,758 5,703
Other non-cur liabilities 734 809 838 838 802 835 881 857
Equity 11,623 11,821 12,094 11,871 11,525 11,545 11,603 11,292
Net debt 8,291 7,871 7,745 6,851 7,586 7,279 7,644 7,096
Effects of amendments to K-IFRS10(guidance for consolidated financials) have been reflected retroactively from FY2012 for comparison purposes
19
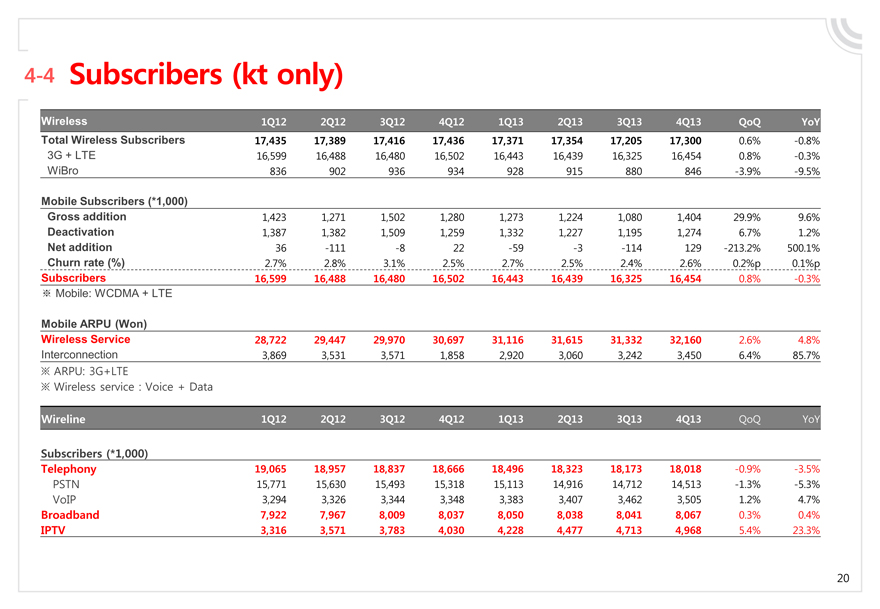
4-4 Subscribers (kt only)
Wireless 1Q12 2Q12 3Q12 4Q12 1Q13 2Q13 3Q13 4Q13 QoQ YoY
Total Wireless Subscribers 17,435 17,389 17,416 17,436 17,371 17,354 17,205 17,300 0.6% -0.8%
3G + LTE 16,599 16,488 16,480 16,502 16,443 16,439 16,325 16,454 0.8% -0.3%
WiBro 836 902 936 934 928 915 880 846 -3.9% -9.5%
Mobile Subscribers (*1,000)
Gross addition 1,423 1,271 1,502 1,280 1,273 1,224 1,080 1,404 29.9% 9.6%
Deactivation 1,387 1,382 1,509 1,259 1,332 1,227 1,195 1,274 6.7% 1.2%
Net addition 36 -111 -8 22 -59 -3 -114 129 -213.2% 500.1%
Churn rate (%) 2.7% 2.8% 3.1% 2.5% 2.7% 2.5% 2.4% 2.6% 0.2%p 0.1%p
Subscribers 16,599 16,488 16,480 16,502 16,443 16,439 16,325 16,454 0.8% -0.3%
Mobile: WCDMA + LTE
Mobile ARPU (Won)
Wireless Service 28,722 29,447 29,970 30,697 31,116 31,615 31,332 32,160 2.6% 4.8%
Interconnection 3,869 3,531 3,571 1,858 2,920 3,060 3,242 3,450 6.4% 85.7%
ARPU: 3G+LTE
Wireless service : Voice + Data
Wireline 1Q12 2Q12 3Q12 4Q12 1Q13 2Q13 3Q13 4Q13 QoQ YoY
Subscribers (*1,000)
Telephony 19,065 18,957 18,837 18,666 18,496 18,323 18,173 18,018 -0.9% -3.5%
PSTN 15,771 15,630 15,493 15,318 15,113 14,916 14,712 14,513 -1.3% -5.3%
VoIP 3,294 3,326 3,344 3,348 3,383 3,407 3,462 3,505 1.2% 4.7%
Broadband 7,922 7,967 8,009 8,037 8,050 8,038 8,041 8,067 0.3% 0.4%
IPTV 3,316 3,571 3,783 4,030 4,228 4,477 4,713 4,968 5.4% 23.3%
20

Thank you | kt