Table of Contents
UNITED STATES
SECURITIES AND EXCHANGE COMMISSION
Washington, D.C. 20549
FORM N-CSR
CERTIFIED SHAREHOLDER REPORT OF REGISTERED
MANAGEMENT INVESTMENT COMPANIES
Investment Company Act file number 811-07238
SUNAMERICA SERIES TRUST
(Exact name of registrant as specified in charter)
21650 Oxnard Street, Woodlands Hills, CA 91367
(Address of principal executive offices) (Zip code)
John T. Genoy
Senior Vice President
SunAmerica Asset Management, LLC
Harborside 5, 185 Hudson Street, Suite 3300
Jersey City, NJ 07311
(Name and address of agent for service)
Registrant’s telephone number, including area code: (201) 324-6414
Date of fiscal year end: December 31
Date of reporting period: December 31, 2020
Table of Contents
Item 1. Reports to Stockholders
This filing is on behalf of five of the sixty-one Investment Company Series of SunAmerica Series Trust. Also, attached to this filing are the financial statements with regard to the five Master Funds of the American Funds Insurance Series®.
Table of Contents
SUNAMERICA SERIES TRUST
ANNUAL REPORT
DECEMBER 31, 2020
Table of Contents
Table of Contents
SUNAMERICA SERIES TRUST
Dear SunAmerica Series Trust Investor
We are pleased to present the SunAmerica Series Trust annual report, which contains the investment portfolio information and the financial statements of the Trust portfolios that invest exclusively in shares of corresponding funds (“Master Funds”) of the American Funds Insurance Series (“AFIS”) for the reporting period ended December 31, 2020.
If you have any questions, please contact your investment representative, or you may contact us directly at 1-800-445-7862.
Thank you for the confidence you place in us with your financial future, and we look forward to reporting to you once again in six months.
Sincerely,

John T. Genoy
President
SunAmerica Series Trust
Note: All performance figures quoted are for the SunAmerica Series Trust. They do not reflect fees and charges associated with the variable annuity. Past performance is no guarantee of future results. Annuities are long-term investment vehicles designed for retirement purposes. Early withdrawal may be subject to withdrawal charges and if taken prior to age 59 1/2, a 10% federal tax penalty may apply. An investment in a variable annuity involves investment risk, including possible loss of principal. The contract, when redeemed, may be worth more or less than the total amount invested.
Investments in stocks and bonds are subject to risks. The Portfolios are indirectly exposed to these risks through their investments in the master funds. Investments in growth stocks may be subject to volatile price swings and therefore present a greater potential for loss than other investments. Income seeking investment strategies may not be realized due to changes in dividend policies or the availability of capital resources. Investments in non-U.S. stocks and bonds may be subject to additional risks such as fluctuations in foreign currencies, political and economic instability, differences in securities regulation and accounting standards, foreign tax laws, and limited availability of public information. Investments in lower rated bonds and “junk bonds“ are considered speculative due to the heightened risk of default and are subject to unpredictable losses as a result of changes in the issuer’s creditworthiness.
There can be no assurance that the Portfolios will meet their investment objectives. The master funds’ asset allocation may result in underperformance relative to benchmarks and other funds with similar objectives.
A full description of the investment goals, principal strategies, and risks for each Portfolio are provided in the prospectus.
For a full description of the master funds, please consult the prospectus for the relevant underlying master fund.
Investments are not guaranteed or endorsed by any bank, are not a deposit or obligation of any bank, and are not federally insured by Federal Deposit Corporation (FDIC), the Federal Reserve Board or any other federal government agency.
• Not FDIC or NCUA/NCUSIF Insured
• May Lose Value • No Bank of Credit Union Guarantee
• Not a Deposit • Not insured by any Federal Government Agency
| ||
| 1 |
Table of Contents
SUNAMERICA SERIES TRUST
EXPENSE EXAMPLE December 31, 2020 |
(unaudited)
Disclosure of Portfolio Expenses in Shareholder Reports
As a shareholder of a separate series (a “Portfolio”) in the SunAmerica Series Trust (the “Trust”), you incur ongoing costs, including management fees; service (12b-1) fees; and other Portfolio expenses. The Example is intended to help you understand your ongoing costs (in dollars) of investing in the Portfolios and to compare these costs with the ongoing costs of investing in other mutual funds. The example is based on an investment of $1,000 invested at July 1, 2020 and held until December 31, 2020. Shares of the Trust are not offered directly to the public. Instead, shares are currently issued and redeemed only in connection with investments in and payments under variable annuity contracts and variable life insurance policies (“Variable Contracts”) offered by life insurance companies affiliated with SunAmerica Asset Management, LLC, the Trust‘s investment adviser and manager. The fees and expenses associated with the Variable Contracts are not included in these Examples, and had such fees and expenses been included your costs would have been higher. Please see your variable contract prospectus for more details on the fees associated with the variable contract.
Actual Expenses
The “Actual” section of the table provides information about your actual account values and actual expenses. You may use the information in these columns, together with the amount you invested, to estimate the expenses that you paid over the period. Simply divide your account value by $1,000 (for example, an $8,600 account value divided by $1,000 = 8.6), then multiply the result by the number in the column under the heading entitled “Expenses Paid During the Six Months Ended December 31, 2020”, to estimate the expenses you paid on your account during this period. The “Expenses Paid During the Six Months Ended December 31, 2020” column and the “Annualized Expense Ratio” column do not include fees and expenses that may be charged by the Variable Contracts, in which the Portfolios are offered. Had these fees and expenses been included, the “Expenses Paid During the Six Months Ended December 31, 2020” column would have been higher and the “Ending Account Value” column would have been lower.
Hypothetical Example for Comparison Purposes
The “Hypothetical” section of the table provides information about hypothetical account values and hypothetical expenses based on the Portfolio‘s actual expense ratio and an annual rate of return of 5% before expenses, which is not the Portfolio‘s actual return. The hypothetical account values and expenses may not be used to estimate the actual ending account balance or expenses you paid for the period. You may use this information to compare the ongoing costs of investing in the Portfolios and other funds. To do so, compare this 5% hypothetical example with the 5% hypothetical examples that appear in the shareholder reports of other funds. The “Expenses Paid During the Six Months Ended December 31, 2020” column and the “Annualized Expense Ratio” column do not include fees and expenses that may be charged by the Variable Contracts, in which the Portfolios are offered. Had these fees and expenses been included, the “Expenses Paid During the Six Months Ended December 31, 2020” would have been higher and the “Ending Account Value” would have been lower.
Please note that the expenses shown in the table are meant to highlight your ongoing costs only and do not reflect any fees and expenses that may be charged by the Variable Contracts. Please refer to your variable contract prospectus for more information. Therefore the “Hypothetical” example is useful in comparing ongoing costs and will not help you determine the relative total costs of owning different funds. In addition, if these fees and expenses were included, your costs would have been higher.
| ||
| 2 |
Table of Contents
SUNAMERICA SERIES TRUST
EXPENSE EXAMPLE (continued) December 31, 2020 |
(unaudited)
| Actual | Hypothetical | |||||||||||||||||||||||||||
| Portfolio | Beginning Account Value at July 1, 2020 | Ending Account Value Using Actual Return at December 31, 2020 | Expenses Paid During the Six Months Ended December 31, 2020* | Beginning Account Value at July 1, 2020 | Ending Account Value Using a Hypothetical 5% Assumed Return at December 31, 2020 | Expenses Paid During the Six Months Ended December 31, 2020* | Annualized Expense Ratio* | |||||||||||||||||||||
SA American Funds Asset Allocation | ||||||||||||||||||||||||||||
Class 1 #@ | $ | 1,000.00 | $1,141.80 | $ | 1.45 | $ | 1,000.00 | $ | 1,023.78 | $ | 1.37 | 0.27 | % | |||||||||||||||
Class 3 #@ | $ | 1,000.00 | $1,140.81 | $ | 2.80 | $ | 1,000.00 | $ | 1,022.52 | $ | 2.64 | 0.52 | % | |||||||||||||||
SA American Funds Global Growth | ||||||||||||||||||||||||||||
Class 1 #@ | $ | 1,000.00 | $1,254.39 | $ | 1.64 | $ | 1,000.00 | $ | 1,023.68 | $ | 1.48 | 0.29 | % | |||||||||||||||
Class 3 #@ | $ | 1,000.00 | $1,251.72 | $ | 3.06 | $ | 1,000.00 | $ | 1,022.42 | $ | 2.75 | 0.54 | % | |||||||||||||||
SA American Funds Growth | ||||||||||||||||||||||||||||
Class 1 #@ | $ | 1,000.00 | $1,359.08 | $ | 1.66 | $ | 1,000.00 | $ | 1,023.73 | $ | 1.42 | 0.28 | % | |||||||||||||||
Class 3 #@ | $ | 1,000.00 | $1,356.51 | $ | 3.14 | $ | 1,000.00 | $ | 1,022.47 | $ | 2.69 | 0.53 | % | |||||||||||||||
SA American Funds Growth-Income | ||||||||||||||||||||||||||||
Class 1 #@ | $ | 1,000.00 | $1,178.97 | $ | 1.59 | $ | 1,000.00 | $ | 1,023.68 | $ | 1.48 | 0.29 | % | |||||||||||||||
Class 3 #@ | $ | 1,000.00 | $1,177.86 | $ | 2.96 | $ | 1,000.00 | $ | 1,022.42 | $ | 2.75 | 0.54 | % | |||||||||||||||
SA American Funds VCP Managed Allocation | ||||||||||||||||||||||||||||
Class 1 #@ | $ | 1,000.00 | $1,089.86 | $ | 1.42 | $ | 1,000.00 | $ | 1,023.78 | $ | 1.37 | 0.27 | % | |||||||||||||||
Class 3 #@ | $ | 1,000.00 | $1,088.75 | $ | 2.73 | $ | 1,000.00 | $ | 1,022.52 | $ | 2.64 | 0.52 | % | |||||||||||||||
| * | Expenses are equal to the Portfolio’s annualized expense ratio multiplied by the average account value over the period, multiplied by 184 days divided by 366 (to reflect the one-half year period). These ratios do not reflect expenses associated with the Variable Contracts. If such fees and expenses had been included, the expenses would have been higher. Please refer to your Variable Contract prospectus for details on the expenses that apply to the Variable Contracts of the insurance companies. |
| # | During the stated period, the investment adviser either waived fees and assumed expenses for the Portfolios. As a result, if these fees and expenses had not been waived, the “Actual/Hypothetical Ending Account Value” would have been lower and the “Actual/Hypothetical Expenses Paid During the Six Months Ended December 31, 2020” and “Annualized Expense Ratios” would have been higher. |
| @ | Does not include the expenses of the underlying Funds of the American Funds Insurance Series (“Master Funds”) that the Portfolios bear indirectly. If these indirect expenses had been included, the “Actual/Hypothetical Expenses Paid During the Six Months Ended December 31, 2020 and the “Annualized Expense Ratios” would have been higher and the “Actual/Hypothetical Ending Account Value” would have been lower. |
| ||
| 3 |
Table of Contents
SunAmerica Series Trust SA American Funds Asset Allocation Portfolio
PORTFOLIO PROFILE — December 31, 2020 — (unaudited)
Industry Allocation*
Asset Allocation Investment Companies | 100.0 | % | ||
|
|
| * | Calculated as a percentage of net assets. |
| ||
| 4 |
Table of Contents
SunAmerica Series Trust SA American Funds Asset Allocation Portfolio
PORTFOLIO OF INVESTMENTS — December 31, 2020
| Shares | Value (Note 2) | |||||||
REGISTERED INVESTMENT COMPANIES — 100.0% | ||||||||
Asset Allocation Investment Companies — 100.0% | ||||||||
American Funds Insurance Series® — Asset Allocation Fund, Class 1 | 55,890,704 | $ | 1,481,103,645 | |||||
|
| |||||||
TOTAL INVESTMENTS | 100.0 | % | 1,481,103,645 | |||||
Liabilities in excess of other assets | (0.0 | ) | (718,918 | ) | ||||
|
|
|
| |||||
NET ASSETS | 100.0 | % | $ | 1,480,384,727 | ||||
|
|
|
| |||||
| @ | See Note 3 for cost of investments on a tax basis. |
The following is a summary of the inputs used to value the Portfolio’s net assets as of December 31, 2020 (see Note 2):
| Level 1 - Unadjusted Quoted Prices | Level 2 - Other Observable Inputs | Level 3 - Significant Unobservable Inputs | Total | |||||||||||||
ASSETS: | ||||||||||||||||
Investments at Value:* | ||||||||||||||||
| Registered Investment Companies | $ | 1,481,103,645 | $ | — | $ | — | $ | 1,481,103,645 | ||||||||
|
|
|
|
|
|
|
| |||||||||
| * | For a detailed presentation of investments, please refer to the Portfolio of Investments. |
See Notes to Financial Statements
| ||
| 5 |
Table of Contents
SunAmerica Series Trust SA American Funds Global Growth Portfolio
PORTFOLIO PROFILE — December 31, 2020 — (unaudited)
Industry Allocation*
International Equity Investment Companies | 100.1 | % | ||
|
|
| * | Calculated as a percentage of net assets. |
| ||
| 6 |
Table of Contents
SunAmerica Series Trust SA American Funds Global Growth Portfolio
PORTFOLIO OF INVESTMENTS — December 31, 2020
| Shares | Value (Note 2) | |||||||
REGISTERED INVESTMENT COMPANIES — 100.1% | ||||||||
International Equity Investment Companies — 100.1% | ||||||||
American Funds Insurance Series® — Global Growth Fund, Class 1 | 10,260,879 | $ | 422,337,792 | |||||
|
| |||||||
TOTAL INVESTMENTS | 100.1 | % | 422,337,792 | |||||
Liabilities in excess of other assets | (0.1 | ) | (244,921 | ) | ||||
|
|
|
| |||||
NET ASSETS | 100.0 | % | $ | 422,092,871 | ||||
|
|
|
| |||||
| @ | See Note 3 for cost of investments on a tax basis. |
The following is a summary of the inputs used to value the Portfolio’s net assets as of December 31, 2020 (see Note 2):
| Level 1 - Unadjusted Quoted Prices | Level 2 - Other Observable Inputs | Level 3 - Significant Unobservable Inputs | Total | |||||||||||||
ASSETS: | ||||||||||||||||
Investments at Value:* | ||||||||||||||||
| Registered Investment Companies | $ | 422,337,792 | $ | — | $ | — | $ | 422,337,792 | ||||||||
|
|
|
|
|
|
|
| |||||||||
| * | For a detailed presentation of investments, please refer to the Portfolio of Investments. |
See Notes to Financial Statements
| ||
| 7 |
Table of Contents
SunAmerica Series Trust SA American Funds Growth Portfolio
PORTFOLIO PROFILE — December 31, 2020 — (unaudited)
Industry Allocation*
Domestic Equity Investment Companies | 100.1 | % | ||
|
|
| * | Calculated as a percentage of net assets. |
| ||
| 8 |
Table of Contents
SunAmerica Series Trust SA American Funds Growth Portfolio
PORTFOLIO OF INVESTMENTS — December 31, 2020
| Shares | Value (Note 2) | |||||||
REGISTERED INVESTMENT COMPANIES — 100.1% | ||||||||
Domestic Equity Investment Companies — 100.1% | ||||||||
American Funds Insurance Series ® — Growth Fund, Class 1 | 4,541,219 | $ | 545,899,879 | |||||
|
| |||||||
TOTAL INVESTMENTS | 100.1 | % | 545,899,879 | |||||
Liabilities in excess of other assets | (0.1 | ) | (289,216 | ) | ||||
|
|
|
| |||||
NET ASSETS | 100.0 | % | $ | 545,610,663 | ||||
|
|
|
| |||||
| @ | See Note 3 for cost of investments on a tax basis. |
The following is a summary of the inputs used to value the Portfolio’s net assets as of December 31, 2020 (see Note 2):
| Level 1 - Unadjusted Quoted Prices | Level 2 - Other Observable Inputs | Level 3 - Significant Unobservable Inputs | Total | |||||||||||||
ASSETS: | ||||||||||||||||
Investments at Value:* | ||||||||||||||||
| Registered Investment Companies | $ | 545,899,879 | $ | — | $ | — | $ | 545,899,879 | ||||||||
|
|
|
|
|
|
|
| |||||||||
| * | For a detailed presentation of investments, please refer to the Portfolio of Investments. |
See Notes to Financial Statements
| ||
| 9 |
Table of Contents
SunAmerica Series Trust SA American Funds Growth-Income Portfolio
PORTFOLIO PROFILE — December 31, 2020 — (unaudited)
Industry Allocation*
Domestic Equity Investment Companies | 100.1 | % | ||
|
|
| * | Calculated as a percentage of net assets. |
| ||
| 10 |
Table of Contents
SunAmerica Series Trust SA American Funds Growth-Income Portfolio
PORTFOLIO OF INVESTMENTS — December 31, 2020
| Shares | Value (Note 2) | |||||||
REGISTERED INVESTMENT COMPANIES — 100.1% | ||||||||
Domestic Equity Investment Companies — 100.1% | ||||||||
American Funds Insurance Series® — Growth-Income Fund, Class 1 | 5,889,417 | $ | 326,155,910 | |||||
|
| |||||||
TOTAL INVESTMENTS | 100.1 | % | 326,155,910 | |||||
Liabilities in excess of other assets | (0.1 | ) | (185,198 | ) | ||||
|
|
|
| |||||
NET ASSETS | 100.0 | % | $ | 325,970,712 | ||||
|
|
|
| |||||
| @ | See Note 3 for cost of investments on a tax basis. |
The following is a summary of the inputs used to value the Portfolio’s net assets as of December 31, 2020 (see Note 2):
| Level 1 - Unadjusted Quoted Prices | Level 2 - Other Observable Inputs | Level 3 - Significant Unobservable Inputs | Total | |||||||||||||
ASSETS: | ||||||||||||||||
Investments at Value:* | ||||||||||||||||
| Registered Investment Companies | $ | 326,155,910 | $ | — | $ | — | $ | 326,155,910 | ||||||||
|
|
|
|
|
|
|
| |||||||||
| * | For a detailed presentation of investments, please refer to the Portfolio of Investments. |
See Notes to Financial Statements
| ||
| 11 |
Table of Contents
SunAmerica Series Trust SA American Funds VCP Managed Allocation Portfolio
PORTFOLIO PROFILE — December 31, 2020 — (unaudited)
Industry Allocation*
Asset Allocation Investment Companies | 100.0 | % | ||
|
|
| * | Calculated as a percentage of net assets. |
| ||
| 12 |
Table of Contents
SunAmerica Series Trust SA American Funds VCP Managed Allocation Portfolio
PORTFOLIO OF INVESTMENTS — December 31, 2020
| Shares | Value (Note 2) | |||||||
REGISTERED INVESTMENT COMPANIES — 100.0% | ||||||||
Asset Allocation Investment Companies — 100.0% | ||||||||
American Funds Insurance Series® — Managed Risk Growth-Income Fund, Class P1 | 150,979,868 | $ | 2,115,227,957 | |||||
|
| |||||||
TOTAL INVESTMENTS | 100.0 | % | 2,115,227,957 | |||||
Liabilities in excess of other assets | (0.0 | ) | (994,266 | ) | ||||
|
|
|
| |||||
NET ASSETS | 100.0 | % | $ | 2,114,233,691 | ||||
|
|
|
| |||||
| @ | See Note 3 for cost of investments on a tax basis. |
The following is a summary of the inputs used to value the Portfolio’s net assets as of December 31, 2020 (see Note 2):
| Level 1 - Unadjusted Quoted Prices | Level 2 - Other Observable Inputs | Level 3 - Significant Unobservable Inputs | Total | |||||||||||||
ASSETS: | ||||||||||||||||
Investments at Value:* | ||||||||||||||||
| Registered Investment Companies | $ | 2,115,227,957 | $ | — | $ | — | $ | 2,115,227,957 | ||||||||
|
|
|
|
|
|
|
| |||||||||
| * | For a detailed presentation of investments, please refer to the Portfolio of Investments. |
See Notes to Financial Statements
| ||
| 13 |
Table of Contents
SUNAMERICA SERIES TRUST
STATEMENT OF ASSETS AND LIABILITIES
December 31, 2020
| SA American Funds Asset Allocation Portfolio | SA American Funds Global Growth Portfolio | SA American Funds Growth Portfolio | SA American Funds Growth- Income Portfolio | SA American Funds VCP Managed Allocation Portfolio | ||||||||||||||||
ASSETS: | ||||||||||||||||||||
Investment at value (unaffiliated)* | $ | 1,481,103,645 | $ | 422,337,792 | $ | 545,899,879 | $ | 326,155,910 | $ | 2,115,227,957 | ||||||||||
Receivable for: | ||||||||||||||||||||
Fund shares sold | 4,002,837 | — | — | 1,693,476 | 16,847,814 | |||||||||||||||
Investments sold | — | 5,756,639 | 21,966,527 | — | — | |||||||||||||||
Prepaid expenses and other assets | 7,477 | 6,101 | 5,965 | 5,758 | 9,837 | |||||||||||||||
Due from investment adviser for expense reimbursements/fee waivers | 739,754 | 248,832 | 277,432 | 161,554 | 1,227,047 | |||||||||||||||
|
|
|
|
|
|
|
|
|
| |||||||||||
Total assets | 1,485,853,713 | 428,349,364 | 568,149,803 | 328,016,698 | 2,133,312,655 | |||||||||||||||
|
|
|
|
|
|
|
|
|
| |||||||||||
LIABILITIES: | ||||||||||||||||||||
Payable for: | ||||||||||||||||||||
Fund shares redeemed | — | 5,756,639 | 21,966,527 | 606 | — | |||||||||||||||
Investments purchased | 4,002,837 | — | — | 1,692,870 | 16,847,814 | |||||||||||||||
Investment advisory and management fees | 1,047,985 | 337,701 | 393,029 | 228,868 | 1,665,279 | |||||||||||||||
Service fees | 306,730 | 88,768 | 115,452 | 67,207 | 438,179 | |||||||||||||||
Transfer agent fees | 54 | 89 | 76 | 76 | 67 | |||||||||||||||
Trustees’ fees and expenses | 801 | 435 | 421 | 450 | 268 | |||||||||||||||
Other accrued expenses | 110,579 | 72,861 | 63,635 | 55,909 | 127,357 | |||||||||||||||
|
|
|
|
|
|
|
|
|
| |||||||||||
Total liabilities | 5,468,986 | 6,256,493 | 22,539,140 | 2,045,986 | 19,078,964 | |||||||||||||||
|
|
|
|
|
|
|
|
|
| |||||||||||
NET ASSETS | $ | 1,480,384,727 | $ | 422,092,871 | $ | 545,610,663 | $ | 325,970,712 | $ | 2,114,233,691 | ||||||||||
|
|
|
|
|
|
|
|
|
| |||||||||||
NET ASSETS REPRESENTED BY: | ||||||||||||||||||||
Paid-in capital | 1,243,501,586 | 273,195,487 | 309,144,890 | 259,758,128 | 1,662,671,197 | |||||||||||||||
Total accumulated earnings (loss) | 236,883,141 | 148,897,384 | 236,465,773 | 66,212,584 | 451,562,494 | |||||||||||||||
|
|
|
|
|
|
|
|
|
| |||||||||||
NET ASSETS | $ | 1,480,384,727 | $ | 422,092,871 | $ | 545,610,663 | $ | 325,970,712 | $ | 2,114,233,691 | ||||||||||
|
|
|
|
|
|
|
|
|
| |||||||||||
Class 1 (unlimited shares authorized): | ||||||||||||||||||||
Net assets | $ | 7,207,426 | $ | 557,531 | $ | 703,653 | $ | 566,988 | $ | 255,201 | ||||||||||
Shares of beneficial interest issued and outstanding | 436,171 | 42,085 | 43,142 | 48,087 | 15,765 | |||||||||||||||
Net asset value, offering and redemption price per share | $ | 16.52 | $ | 13.25 | $ | 16.31 | $ | 11.79 | $ | 16.19 | ||||||||||
|
|
|
|
|
|
|
|
|
| |||||||||||
Class 3 (unlimited shares authorized): | ||||||||||||||||||||
Net assets | $ | 1,473,177,301 | $ | 421,535,340 | $ | 544,907,010 | $ | 325,403,724 | $ | 2,113,978,490 | ||||||||||
Shares of beneficial interest issued and outstanding | 89,482,630 | 31,811,132 | 33,483,068 | 27,704,737 | 131,078,033 | |||||||||||||||
Net asset value, offering and redemption price per share | $ | 16.46 | $ | 13.25 | $ | 16.27 | $ | 11.75 | $ | 16.13 | ||||||||||
|
|
|
|
|
|
|
|
|
| |||||||||||
| ||||||||||||||||||||
*Cost | ||||||||||||||||||||
Investment securities (unaffiliated) | $ | 1,277,774,144 | $ | 276,397,227 | $ | 338,342,636 | $ | 275,364,842 | $ | 1,808,704,958 | ||||||||||
|
|
|
|
|
|
|
|
|
| |||||||||||
See Notes To Financial Statements
| ||
| 14 |
Table of Contents
SUNAMERICA SERIES TRUST
For the Year Ended December 31, 2020
| SA American Funds Asset Allocation Portfolio | SA American Funds Global Growth Portfolio | SA American Funds Growth Portfolio | SA American Funds Growth- Income Portfolio | SA American Funds VCP Managed Allocation Portfolio | ||||||||||||||||
INVESTMENT INCOME: | ||||||||||||||||||||
Dividends (unaffiliated) | $ | 25,084,342 | $ | 2,229,294 | $ | 2,447,934 | $ | 4,584,155 | $ | 37,427,640 | ||||||||||
|
|
|
|
|
|
|
|
|
| |||||||||||
Total investment income | 25,084,342 | 2,229,294 | 2,447,934 | 4,584,155 | 37,427,640 | |||||||||||||||
|
|
|
|
|
|
|
|
|
| |||||||||||
EXPENSES: | ||||||||||||||||||||
Investment advisory and management fees | 10,581,961 | 3,603,721 | 3,652,463 | 2,390,344 | 18,620,325 | |||||||||||||||
Service fees | 3,098,569 | 947,556 | 1,073,121 | 702,141 | 4,899,602 | |||||||||||||||
Transfer agent fees | 463 | 969 | 710 | 710 | 658 | |||||||||||||||
Custodian and accounting fees | 12,013 | 12,015 | 12,099 | 12,040 | 12,034 | |||||||||||||||
Reports to shareholders | 109,543 | 42,845 | 49,790 | 37,146 | 208,821 | |||||||||||||||
Audit and tax fees | 41,146 | 46,401 | 35,893 | 35,893 | 41,146 | |||||||||||||||
Legal fees | 11,618 | 7,230 | 6,985 | 6,383 | 8,362 | |||||||||||||||
Trustees’ fees and expenses | 27,411 | 7,464 | 8,875 | 5,821 | 39,593 | |||||||||||||||
Other expenses | 35,130 | 22,003 | 9,438 | 11,447 | 23,281 | |||||||||||||||
|
|
|
|
|
|
|
|
|
| |||||||||||
Total expenses before fee waivers and expense reimbursements | 13,917,854 | 4,690,204 | 4,849,374 | 3,201,925 | 23,853,822 | |||||||||||||||
|
|
|
|
|
|
|
|
|
| |||||||||||
Net (fees waived and expenses reimbursed)/recouped by investment adviser (Note 4) | (7,469,619 | ) | (2,655,373 | ) | (2,578,209 | ) | (1,687,302 | ) | (13,720,239 | ) | ||||||||||
|
|
|
|
|
|
|
|
|
| |||||||||||
Net expenses | 6,448,235 | 2,034,831 | 2,271,165 | 1,514,623 | 10,133,583 | |||||||||||||||
|
|
|
|
|
|
|
|
|
| |||||||||||
Net investment income (loss) | 18,636,107 | 194,463 | 176,769 | 3,069,532 | 27,294,057 | |||||||||||||||
|
|
|
|
|
|
|
|
|
| |||||||||||
REALIZED AND UNREALIZED GAIN (LOSS) ON INVESTMENTS: | ||||||||||||||||||||
Net realized gain (loss) on investments (unaffiliated) | 10,473,694 | 14,317,218 | 19,767,724 | 8,024,409 | 14,882,915 | |||||||||||||||
Net realized gain from capital gain distributions received from underlying funds (unaffliated) | 5,630,398 | 10,887,773 | 10,204,156 | 7,427,307 | 102,926,505 | |||||||||||||||
|
|
|
|
|
|
|
|
|
| |||||||||||
Net realized gain (loss) on investments | 16,104,092 | 25,204,991 | 29,971,880 | 15,451,716 | 117,809,420 | |||||||||||||||
|
|
|
|
|
|
|
|
|
| |||||||||||
Net change in unrealized appreciation (depreciation) on investments (unaffiliated) | 123,553,069 | 76,331,840 | 159,432,338 | 20,065,996 | 28,609,625 | |||||||||||||||
|
|
|
|
|
|
|
|
|
| |||||||||||
Net realized and unrealized gain (loss) on investments | 139,657,161 | 101,536,831 | 189,404,218 | 35,517,712 | 146,419,045 | |||||||||||||||
|
|
|
|
|
|
|
|
|
| |||||||||||
NET INCREASE (DECREASE) IN NET ASSETS RESULTING FROM OPERATIONS | $ | 158,293,268 | $ | 101,731,294 | $ | 189,580,987 | $ | 38,587,244 | $ | 173,713,102 | ||||||||||
|
|
|
|
|
|
|
|
|
| |||||||||||
See Notes To Financial Statements
| ||
| 15 |
Table of Contents
SUNAMERICA SERIES TRUST
STATEMENT OF CHANGES IN NET ASSETS
| SA American Funds Asset Allocation Portfolio | SA American Funds Global Growth Portfolio | SA American Funds Growth Portfolio | ||||||||||||||||||||||
| For the year ended December 31, 2020 | For the year ended December 31, 2019 | For the year ended December 31, 2020 | For the year ended December 31, 2019 | For the year ended December 31, 2020 | For the year ended December 31, 2019 | |||||||||||||||||||
INCREASE (DECREASE) IN NET ASSETS | ||||||||||||||||||||||||
OPERATIONS: | ||||||||||||||||||||||||
Net investment income (loss) | $ | 18,636,107 | $ | 17,832,965 | $ | 194,463 | $ | 3,008,690 | $ | 176,769 | $ | 1,626,589 | ||||||||||||
Net realized gain (loss) on investments | 16,104,092 | 53,198,127 | 25,204,991 | 48,949,222 | 29,971,880 | 49,238,095 | ||||||||||||||||||
Net unrealized gain (loss) on investments | 123,553,069 | 110,621,498 | 76,331,840 | 62,726,695 | 159,432,338 | 40,453,808 | ||||||||||||||||||
|
|
|
|
|
|
|
|
|
|
|
| |||||||||||||
Net increase (decrease) in net assets resulting from operations | 158,293,268 | 181,652,590 | 101,731,294 | 114,684,607 | 189,580,987 | 91,318,492 | ||||||||||||||||||
|
|
|
|
|
|
|
|
|
|
|
| |||||||||||||
DISTRIBUTIONS TO SHAREHOLDERS FROM: | ||||||||||||||||||||||||
Distributable earnings — Class 1 | (5,036 | ) | (271,331 | ) | (32,074 | ) | (25,901 | ) | (63,046 | ) | (315 | ) | ||||||||||||
Distributable earnings — Class 3 | (1,067,179 | ) | (70,044,680 | ) | (29,251,778 | ) | (46,412,353 | ) | (49,437,023 | ) | (1,646,049 | ) | ||||||||||||
|
|
|
|
|
|
|
|
|
|
|
| |||||||||||||
Total distributions to shareholders | (1,072,215 | ) | (70,316,011 | ) | (29,283,852 | ) | (46,438,254 | ) | (49,500,069 | ) | (1,646,364 | ) | ||||||||||||
|
|
|
|
|
|
|
|
|
|
|
| |||||||||||||
Net increase (decrease) in net assets resulting from capital share transactions (Note 6) | 147,461,605 | 273,639,381 | (41,254,261 | ) | (30,883,101 | ) | 27,547,031 | (17,249,591 | ) | |||||||||||||||
|
|
|
|
|
|
|
|
|
|
|
| |||||||||||||
TOTAL INCREASE (DECREASE) IN NET ASSETS | 304,682,658 | 384,975,960 | 31,193,181 | 37,363,252 | 167,627,949 | 72,422,537 | ||||||||||||||||||
NET ASSETS: | ||||||||||||||||||||||||
Beginning of period | 1,175,702,069 | 790,726,109 | 390,899,690 | 353,536,438 | 377,982,714 | 305,560,177 | ||||||||||||||||||
|
|
|
|
|
|
|
|
|
|
|
| |||||||||||||
End of period | $ | 1,480,384,727 | $ | 1,175,702,069 | $ | 422,092,871 | $ | 390,899,690 | $ | 545,610,663 | $ | 377,982,714 | ||||||||||||
|
|
|
|
|
|
|
|
|
|
|
| |||||||||||||
See Notes to Financial Statements
| ||
| 16 |
Table of Contents
SUNAMERICA SERIES TRUST
STATEMENT OF CHANGES IN NET ASSETS
| SA American Funds Growth-Income Portfolio | SA American Funds VCP Managed Allocation Portfolio | |||||||||||||||
| For the year ended December 31, 2020 | For the year ended December 31, 2019 | For the year ended December 31, 2020 | For the year ended December 31, 2019 | |||||||||||||
INCREASE (DECREASE) IN NET ASSETS | ||||||||||||||||
OPERATIONS: | ||||||||||||||||
Net investment income (loss) | $ | 3,069,532 | $ | 3,632,580 | $ | 27,294,057 | $ | 1,944,339 | ||||||||
Net realized gain (loss) on investments | 15,451,716 | 35,596,964 | 117,809,420 | 25,454,542 | ||||||||||||
Net unrealized gain (loss) on investments | 20,065,996 | 21,535,910 | 28,609,625 | 283,553,888 | ||||||||||||
|
|
|
|
|
|
|
| |||||||||
Net increase (decrease) in net assets resulting from operations | 38,587,244 | 60,765,454 | 173,713,102 | 310,952,769 | ||||||||||||
|
|
|
|
|
|
|
| |||||||||
DISTRIBUTIONS TO SHAREHOLDERS FROM: | ||||||||||||||||
Distributable earnings — Class 1 | (61,852 | ) | (566 | ) | (564 | ) | (4,391 | ) | ||||||||
Distributable earnings — Class 3 | (38,354,060 | ) | (1,226,850 | ) | (4,674,638 | ) | (29,070,206 | ) | ||||||||
|
|
|
|
|
|
|
| |||||||||
Total distributions to shareholders | (38,415,912 | ) | (1,227,416 | ) | (4,675,202 | ) | (29,074,597 | ) | ||||||||
|
|
|
|
|
|
|
| |||||||||
Net increase (decrease) in net assets resulting from capital share transactions (Note 6) | 39,981,300 | (18,949,816 | ) | (37,257,949 | ) | 41,072,316 | ||||||||||
|
|
|
|
|
|
|
| |||||||||
TOTAL INCREASE (DECREASE) IN NET ASSETS | 40,152,632 | 40,588,222 | 131,779,951 | 322,950,488 | ||||||||||||
NET ASSETS: | ||||||||||||||||
Beginning of period | 285,818,080 | 245,229,858 | 1,982,453,740 | 1,659,503,252 | ||||||||||||
|
|
|
|
|
|
|
| |||||||||
End of period | $ | 325,970,712 | $ | 285,818,080 | $ | 2,114,233,691 | $ | 1,982,453,740 | ||||||||
|
|
|
|
|
|
|
| |||||||||
See Notes to Financial Statements
| ||
| 17 |
Table of Contents
SUNAMERICA SERIES TRUST
December 31, 2020
Note 1. Description of Business and Basis of Presentation
SunAmerica Series Trust (the “Trust”), organized as a Massachusetts business trust on September 11, 1992, is an open-end management investment company. The Trust is comprised of sixty-one separate investment series, five of which are included in this report: SA American Funds Asset Allocation Portfolio, SA American Funds Global Growth Portfolio, SA American Funds Growth Portfolio, SA American Funds Growth-Income Portfolio and SA American Funds VCP Managed Allocation Portfolio, (collectively, the “Portfolios”). SunAmerica Asset Management, LLC (“SAAMCO” or the “Adviser”), an indirect wholly-owned subsidiary of American International Group, Inc., a Delaware corporation (“AIG”), serves as investment adviser for all Portfolios of the Trust.
Shares of the Trust are issued and redeemed only in connection with investments in and payments under variable annuity contracts and variable life policies. Shares of the Portfolios are held by separate accounts of American General Life Insurance Company, a Texas life insurer (“AGL”), The United States Life Insurance Company in The City of New York, a New York life insurer (“USL”) and The Variable Annuity Life Insurance Company, a Texas life insurer (“VALIC”). AGL and USL and VALIC are indirect wholly-owned subsidiaries of AIG. The life insurance companies listed above are collectively referred to as the “Life Companies.” All shares may be purchased or redeemed at net asset value without any sales or redemption charges.
SA American Funds Asset Allocation Portfolio, SA American Funds Global Growth Portfolio, SA American Funds Growth Portfolio, SA American Funds Growth-Income Portfolio and SA American Funds VCP Managed Allocation Portfolio operate as “Feeder Funds,” and invest all or substantially all of their assets in shares of an underlying mutual fund (“underlying fund” and/or “Master Fund”).
Class 1 shares and Class 3 shares of each Portfolio may be offered only in connection with certain variable contracts. Class 3 shares of a given Portfolio are identical in all respects to Class 1 shares of the same Portfolio, except that (i) each class may bear differing amounts of certain class-specific expenses; (ii) Class 3 shares are subject to service fees while Class 1 shares are not; and (iii) Class 3 shares have voting rights on matters that pertain to the Rule 12b-1 plan adopted with respect to Class 3 shares. Class 3 shares of each Portfolio pay service fees at an annual rate of 0.25% of each class’s average daily net assets. The Board of Trustees may establish additional portfolios or classes in the future.
Each Master Fund is a portfolio offered by American Funds Insurance Series® (“AFIS” or “American Funds”), a registered open-end management investment company. Each Portfolio’s corresponding Master Fund is listed below:
Trust Feeder Funds | American Funds Master Funds | |
SA American Funds Asset Allocation Portfolio | American Funds® Asset Allocation Fund | |
SA American Funds Global Growth Portfolio | American Funds® Global Growth Fund | |
SA American Funds Growth Portfolio | American Funds® Growth Fund | |
SA American Funds Growth-Income Portfolio | American Funds® Growth-Income Fund | |
SA American Funds VCP Managed Allocation Portfolio | American Funds® Managed Risk Growth-Income Fund |
The underlying fund’s accounting policies are outlined in the underlying funds’ financial statements, available at U.S. Securities and Exchange Commission (“SEC”) Internet website at www.sec.gov, and should be read in conjunction with these financial statements.
The investment goals for the Portfolios included in this report are as follows:
The SA American Funds Asset Allocation Portfolio seeks high total return (including income and capital gains) consistent with the preservation of capital over the long term. Its strategy is to invest all or substantially all of its assets in Class 1 shares of the Master Fund, the American Funds Insurance Series® Asset Allocation Fund (“the Master Asset Allocation Fund”), a portfolio offered by AFIS, a registered open-end investment company. In turn, the Master Asset Allocation Fund invests in a diversified portfolio of common stocks and other equity securities, bonds and other intermediate and long-term debt securities and money market instruments.
The SA American Funds Global Growth Portfolio seeks growth. Its strategy is to invest all or substantially all of its assets in Class 1 shares of the Master Fund, the American Funds Insurance Series® Global Growth Fund (“the Master Global Growth Fund”), a portfolio offered by AFIS, a registered open-end investment company. In turn, the Master Global Growth Fund invests primarily in common stocks and other securities of companies around the world that have the potential for growth.
The SA American Funds Growth Portfolio seeks growth. Its strategy is to invest all or substantially all of its assets in Class 1 shares of the Master Fund, the American Funds Insurance Series® Growth Fund (“the Master Growth Fund”), a portfolio offered by AFIS, a registered open-end investment company. In turn, the Master Growth Fund invests primarily in common stocks of companies that appear to offer superior opportunities for growth of capital.
| ||
| 18 |
Table of Contents
The SA American Funds Growth-Income Portfolio seeks growth and income. Its strategy is to invest all or substantially all of its assets in Class 1 shares of the Master Fund, the American Funds Insurance Series® Growth-Income Fund (“the Master Growth-Income Fund”), a portfolio offered by AFIS, a registered open-end investment company. In turn, the Master Growth-Income Fund invests primarily in common stocks or other securities that demonstrate the potential for appreciation and/or dividends.
The SA American Funds VCP Managed Allocation Portfolio seeks long-term capital growth and income while seeking to manage volatility and provide downside protection. It invests all or substantially all of its assets in Class P1 shares of the Master Fund, the American Funds Insurance Series® Managed Risk Growth-Income Fund (“the Master Managed Risk Fund”), a portfolio offered by AFIS, a registered open-end investment company. In turn, the Master Managed Risk Fund invests in the shares of an underlying fund, the American Funds Growth-Income Fund and American Funds Bond Fund (the “Underlying Funds”). The Underlying Funds invest in a diversified portfolio of common stocks and other equity securities, bonds and other debt securities and money market instruments.
Indemnifications: The Trust’s organizational documents provide current and former officers and trustees with a limited indemnification against liabilities arising out of the performance of their duties to the Trust. In addition, pursuant to Indemnification Agreements between the Trust and each of the current (and certain former) trustees who is not an “interested person,” as defined in Section 2(a)(19) of the Investment Company Act of 1940, as amended (the “1940 Act”), of the Trust (collectively, the “Disinterested Trustees”), the Trust provides the Disinterested Trustees with a limited indemnification against liabilities arising out of the performance of their duties to the Trust, whether such liabilities are asserted during or after their service as trustees. In addition, in the normal course of business the Trust enters into contracts that contain the obligation to indemnify others. The Trust’s maximum exposure under these arrangements is unknown. Currently, however, the Trust expects the risk of loss to be remote.
Note 2. Significant Accounting Policies
The preparation of financial statements in accordance with U.S. generally accepted accounting principles (“GAAP”) requires management to make estimates and assumptions that affect the reported amounts and disclosures in the financial statements. Actual results could differ from those estimates and those differences could be significant. The Portfolios are considered investment companies under GAAP and follow the accounting and reporting guidance applicable to investment companies. The following is a summary of significant accounting policies consistently followed by the Trust and the Master Funds, in the preparation of their respective financial statements:
Security Valuation
In accordance with the authoritative guidance on fair value measurements and disclosures under GAAP, the Portfolios disclose the fair value of their investments in a hierarchy that prioritizes the inputs to valuation techniques used to measure the fair value. In accordance with GAAP, fair value is defined as the price that the Portfolios would receive upon selling an asset or transferring a liability in a timely transaction to an independent third party in the principal or most advantageous market. GAAP establishes a three-tier hierarchy to provide more transparency around the inputs used to measure fair value and to establish classification of fair value measurements for disclosure purposes. Inputs refer broadly to the assumptions that market participants would use in pricing the asset or liability, including assumptions about risk. Inputs may be observable or unobservable. Observable inputs are inputs that reflect the assumptions market participants would use in pricing the asset or liability developed based on market data obtained from sources independent of the reporting entity. Unobservable inputs are inputs that reflect the reporting entity’s own assumptions about the assumptions market participants would use in pricing the asset or liability developed based on the best information available in the circumstances. The three-tiers are as follows:
Level 1 — Unadjusted quoted prices in active markets for identical securities
Level 2 — Other significant observable inputs (including quoted prices for similar securities, interest rates, prepayment speeds, credit risk, referenced indices, quoted prices in inactive markets, adjusted quoted prices in active markets, adjusted quoted prices on foreign equity securities that were adjusted in accordance with pricing procedures approved by the Board of Trustees (the “Board”), etc.)
Level 3 — Significant unobservable inputs (includes inputs that reflect the Portfolios’ own assumptions about the assumptions market participants would use in pricing the security, developed based on the best information available under the circumstances)
Changes in valuation techniques may result in transfers in or out of an investment’s assigned Level within the hierarchy. The methodology used for valuing investments is not necessarily an indication of the risk associated with investing in those investments and the determination of the significance of a particular input to the fair value measurement in its entirety requires judgment and consideration of factors specific to each security.
The availability of observable inputs can vary from security to security and is affected by a wide variety of factors, including, for example, the type of security, whether the security is recently issued and not yet established in the marketplace, the liquidity of markets, and other characteristics particular to the security. To the extent that valuation is based on models or inputs that are less observable or unobservable in the market, the determination of fair value requires more judgment. Accordingly, the degree of judgment exercised in determining fair value is greatest for instruments categorized in Level 3.
| ||
| 19 |
Table of Contents
The summary of the Portfolios’ assets and liabilities classified in the fair value hierarchy as of December 31, 2020, is reported on a schedule at the end of each Portfolio’s Portfolio of Investments.
The net asset value (“NAV”) of each Portfolio is determined based upon the NAV of its corresponding Master Fund.
Master Funds
Each Master Fund is a series of AFIS. All portfolio securities of funds managed by Capital Research and Management Company (“Capital Research”) are valued, and the NAV per share for each share class are determined, as follows:
The AFIS investment adviser values the AFIS investments at fair value as defined by U.S. GAAP. The net asset value of per share is calculated once daily as of the close of regular trading on New York Stock Exchange, normally 4:00 p.m. New York time, each day the New York Stock Exchange is open.
Methods and inputs — The AFIS investment adviser uses the following methods and inputs to establish the fair value of each fund’s assets and liabilities. Use of particular methods and inputs may vary over time based on availability and relevance as market and economic conditions evolve.
Equity securities are generally valued at the official closing price of, or the last reported sale price on, the exchange or market on which such securities are traded, as of the close of business on the day the securities are being valued or, lacking any sales, at the last available bid price. Prices for each security are taken from the principal exchange or market in which the security trades. The value of an underlying fund is based on its reported net asset value.
Fixed-income securities, including short-term securities, are generally valued at prices obtained from one or more pricing vendors. Vendors value such securities based on one or more of the inputs described in the following table. The table provides examples of inputs that are commonly relevant for valuing particular classes of fixed-income securities in which the funds are authorized to invest. However, these classifications are not exclusive and any of the inputs may be used to value any other class of fixed-income security.
| Fixed-income class | Examples of standard inputs | |
| All | Benchmark yields, transactions, bids, offers, quotations from dealers and trading systems, new issues, spreads and other relationships observed in the markets among comparable securities; and proprietary pricing models such as yield measures calculated using factors such as cash flows, financial or collateral performance and other reference data (collectively referred to as “standard inputs”) | |
| Corporate bonds & notes; convertible securities | Standard inputs and underlying equity of the issuer | |
| Bonds & notes of governments & government agencies | Standard inputs and interest rate volatilities | |
| Mortgage-backed; asset-backed obligations | Standard inputs and cash flows, prepayment information, default rates, delinquency and loss assumptions, collateral characteristics, credit enhancements and specific deal information | |
| Municipal securities | Standard inputs and, for certain distressed securities, cash flows or liquidation values using a net present value calculation based on inputs that include, but are not limited to, financial statements and debt contracts | |
When the AFIS investment adviser deems it appropriate to do so (such as when vendor prices are unavailable or not deemed to be representative), fixed-income securities will be valued in good faith at the mean quoted bid and ask prices that are reasonably and timely available (or bid prices, if ask prices are not available) or at prices for securities of comparable maturity, quality and type.
Securities with both fixed-income and equity characteristics, or equity securities traded principally among fixed-income dealers, are generally valued in the manner described for either equity or fixed-income securities, depending on which method is deemed most appropriate by the AFIS investment adviser. The Capital Group Central Cash Fund (“CCF”), a fund within the Capital Group Central Fund Series (“Central Funds”), is valued based upon a floating net asset value, which fluctuates with changes in the value of CCF’s portfolio securities. The underlying securities are valued based on the policies and procedures in CCF’s statement of additional information. The State Street Institutional U.S. Government Money Market Fund held by the managed risk funds is managed to maintain a $1.00 net asset value per share. The net asset value of each share class of each managed risk fund is calculated based on the reported net asset values of the underlying funds in which each fund invests.
Exchange-traded options and futures are generally valued at the official closing price for options and official settlement price for futures of the exchange or market on which such instruments are traded, as of the close of business on the day such instruments are being valued. Forward currency contracts are based on the spot and forward exchange rates obtained from one or more pricing vendors. Interest rate swaps and credit default swaps are generally valued by pricing vendors based on market inputs that include the index and term of index, reset frequency, payer/receiver, currency and pay frequency.
| ||
| 20 |
Table of Contents
Securities and other assets for which representative market quotations are not readily available or are considered unreliable by the AFIS investment adviser are fair valued as determined in good faith under fair value guidelines adopted by authority of the AFIS board of trustees as further described. The AFIS investment adviser follows fair valuation guidelines, consistent with U.S. Securities and Exchange Commission rules and guidance, to consider relevant principles and factors when making fair value determinations. The AFIS investment adviser considers relevant indications of value that are reasonably and timely available to it in determining the fair value to be assigned to a particular security, such as the type and cost of the security; contractual or legal restrictions on resale of the security; relevant financial or business developments of the issuer; actively traded similar or related securities; conversion or exchange rights on the security; related corporate actions; significant events occurring after the close of trading in the security; and changes in overall market conditions. In addition, the closing prices of equity securities and futures that trade in markets outside U.S. time zones may be adjusted to reflect significant events that occur after the close of local trading but before the net asset value of each share class of each fund is determined. Fair valuations and valuations of investments and futures that are not actively trading involve judgment and may differ materially from valuations that would have been used had greater market activity occurred.
Processes and structure — The AFIS board of trustees has delegated authority to the AFIS investment adviser to make fair value determinations, subject to board oversight. The AFIS investment adviser has established a Joint Fair Valuation Committee (the “Fair Valuation Committee”) to administer, implement and oversee the fair valuation process, and to make fair value decisions. The Fair Valuation Committee regularly reviews its own fair value decisions, as well as decisions made under its standing instructions to the AFIS investment adviser’s valuation teams. The Fair Valuation Committee reviews changes in fair value measurements from period to period and may, as deemed appropriate, update the fair valuation guidelines to better reflect the results of back testing and address new or evolving issues. The Fair Valuation Committee reports any changes to the fair valuation guidelines to the board of trustees. The AFIS board and audit committee also regularly review reports that describe fair value determinations and methods.
The AFIS investment adviser has also established a Fixed-Income Pricing Review Group to administer and oversee the fixed-income valuation process, including the use of fixed-income pricing vendors. This group regularly reviews pricing vendor information and market data. Pricing decisions, processes and controls over security valuation are also subject to additional internal reviews, including an annual control self-evaluation program facilitated by the investment adviser’s compliance group.
Securities Transactions, Investment Income, Expenses, Dividends and Distributions to Shareholders: Security transactions are recorded on a trade date basis. Interest income is accrued daily from settlement date except when collection is not expected. Realized gains and losses on the sale of investments are calculated on the identified cost basis. Dividend income is recorded on the ex-dividend date.
The Portfolios invest in Master Fund portfolios offered by American Funds including funds investing in fixed income securities. Distributions from income from the Master Funds, if any, are recorded to income on ex-dividend date. Distributions from net realized capital gains from the Master Funds, if any, are recorded to realized gains on ex-dividend date.
Expenses common to all Portfolios, not directly related to individual Portfolios are allocated among the Portfolios based upon relative net assets or other appropriate allocation methods. In all other respects, expenses are charged to each Portfolio as incurred on a specific identification basis.
The expenses included in the accompanying financial statements reflect the expenses of the Portfolios and do not include indirect expenses borne by each underlying Portfolio in connection with its investment in the underlying Portfolio.
Dividends from net investment income and capital gain distributions, if any, are paid annually. The Portfolios record dividends and distributions to their shareholders on the ex-dividend date.
The amount of dividends and distributions from net investment income and net realized capital gains are determined in accordance with federal income tax regulations, which may differ from GAAP. These “book/tax” differences are either considered temporary or permanent in nature. To the extent these differences are permanent in nature, such amounts are reclassified within the capital accounts at fiscal year end based on their federal tax-basis treatment; temporary differences do not require reclassification. Net assets are not affected by these reclassifications.
Each Portfolio is considered a separate entity for tax purposes and intends to comply with the requirements of the Internal Revenue Code, as amended, applicable to regulated investment companies and distribute all of its taxable income, including any net capital gains on investments, to its shareholders. Each Portfolio also intends to distribute sufficient net investment income and net capital gains, if any, so that it will not be subject to excise tax on undistributed income and gains. Therefore, no federal income tax or excise tax provision is required.
Each Portfolio recognizes the tax benefits of uncertain tax positions only when the position is more likely than not to be sustained, assuming examination by tax authorities. Management has analyzed each Portfolio’s tax positions and concluded that no liability for unrecognized tax benefits should be recorded related to uncertain tax positions. The Portfolios are not aware of any tax provisions for which it is reasonably possible that the total amounts of unrecognized tax benefits will change materially in the next twelve months. The Portfolios file U.S. federal and certain state income tax returns. The Portfolios federal tax returns for the prior three fiscal years remain subject to examinations by the Internal Revenue Service.
| ||
| 21 |
Table of Contents
LIBOR Risk: A fund’s investments, payment obligations and financing terms may be based on floating rates, such as London Interbank Offer Rate (“LIBOR”), Euro Interbank Offered Rate and other similar types of reference rates (each, a “Reference Rate”). On July 27, 2017, the Chief Executive of the UK Financial Conduct Authority (“FCA”), which regulates LIBOR, announced that the FCA will no longer persuade nor require banks to submit rates for the calculation of LIBOR and certain other Reference Rates after 2021. Such announcement indicates that the continuation of LIBOR and other Reference Rates on the current basis cannot and will not be guaranteed after 2021. This announcement and any additional regulatory or market changes may have an adverse impact on a fund or its investments.
In advance of 2021, regulators and market participants will work together to identify or develop successor Reference Rates. Additionally, prior to 2021, it is expected that market participants will focus on the transition mechanisms by which the Reference Rates in existing contracts or instruments may be amended, whether through market wide protocols, fallback contractual provisions, bespoke negotiations or amendments or otherwise. Nonetheless, the termination of certain Reference Rates presents risks to a fund. At this time, it is not possible to completely identify or predict the effect of any such changes, any establishment of alternative Reference Rates or any other reforms to Reference Rates that may be enacted in the UK or elsewhere. The elimination of a Reference Rate or any other changes or reforms to the determination or supervision of Reference Rates could have an adverse impact on the market for or value of any securities or payments linked to those Reference Rates and other financial obligations held by a fund or on its overall financial condition or results of operations. In addition, any substitute Reference Rate and any pricing adjustments imposed by a regulator or by counterparties or otherwise may adversely affect a fund’s performance and/or NAV.
Recent Accounting and Regulatory Developments: In August 2018, the FASB issued Accounting Standards Update (“ASU”) No. 2018-13 “Disclosure Framework — Changes to the Disclosure Requirements for Fair Value Measurement”. The ASU eliminates, modifies, and adds disclosure requirements for fair value measurements and is effective for fiscal years, and interim periods within those fiscal years, beginning after December 15, 2019. Adoption of the ASU had no material impact on the Portfolios.
On December 3, 2020, the SEC announced that it voted to adopt a new rule that establishes an updated regulatory framework for fund valuation practices (the “Rule”). The Rule, in part, provides (i) a framework for determining fair value in good faith and (ii) provides for a fund Board’s assignment of its responsibility for the execution of valuation-related activities to a fund’s investment adviser. Further, the SEC is rescinding previously issued guidance on related issues. The Rule will become effective 60 days after publication in the Federal Register, and will have a compliance date 18 months following the effective date. Management is currently evaluating the Rule and its impact to the Portfolios.
Note 3. Federal Income Taxes
The following details the tax basis of distributions as well as the components of distributable earnings. The tax basis components of distributable earnings differ from the amounts reflected in the Statement of Assets and Liabilities by temporary book/tax differences primarily arising from wash sales.
| For the year ended December 31, 2020 | ||||||||||||||||||||
| Distributable Earnings | Tax Distributions | |||||||||||||||||||
Portfolio | Ordinary Income | Long-term Gains/ Capital and Other Losses | Unrealized Appreciation (Depreciation) | Ordinary Income | Long-Term Capital Gains | |||||||||||||||
SA American Funds Asset Allocation | $ | 18,636,107 | $ | 15,591,160 | $ | 202,655,874 | $ | — | $ | 1,072,215 | ||||||||||
SA American Funds Global Growth | — | 3,249,501 | 145,647,885 | 194,463 | 29,089,389 | |||||||||||||||
SA American Funds Growth | 176,769 | 29,270,875 | 207,018,129 | 3,420,192 | 46,079,877 | |||||||||||||||
SA American Funds Growth-Income | 3,822,091 | 13,217,705 | 49,172,789 | 4,770,252 | 33,645,660 | |||||||||||||||
SA American Funds VCP Managed Allocation | 27,294,057 | 117,809,419 | 306,459,018 | 4,675,202 | — | |||||||||||||||
| For the year ended December 31, 2019 | ||||||||
| Tax Distributions | ||||||||
| Ordinary Income | Long-Term Capital Gains | |||||||
SA American Funds Asset Allocation | $ | 17,853,138 | $ | 52,462,873 | ||||
SA American Funds Global Growth | 3,008,690 | 43,429,564 | ||||||
SA American Funds Growth | — | 1,646,364 | ||||||
SA American Funds Growth-Income | — | 1,227,416 | ||||||
SA American Funds VCP Managed Allocation | 4,948,518 | 24,126,079 | ||||||
For the year ended December 31, 2020, the reclassifications arising from book/tax differences resulted in increases (decreases) that were primarily due to organizational costs were as follows:
Portfolio | Accumulated Undistributed Net Investment Income (Loss) | Accumulated Undistributed Net Realized Gain (Loss) | Capital Paid-in | |||||||||
SA American Funds Asset Allocation | $ | — | $ | — | $ | — | ||||||
SA American Funds Global Growth | 17,844 | (17,844 | ) | — | ||||||||
SA American Funds Growth | — | — | — | |||||||||
SA American Funds Growth-Income | 752,559 | (752,559 | ) | — | ||||||||
SA American Funds VCP Managed Allocation | — | — | — | |||||||||
| ||
| 22 |
Table of Contents
The amounts of aggregate unrealized gain (loss) and the cost of investment securities for Federal tax purposes, including short-term securities and repurchase agreements, were as follows:
Portfolio | Aggregate Unrealized Gain | Aggregate Unrealized Loss | Net Unrealized Gain/(Loss) | Cost of Investments | ||||||||||||
SA American Funds Asset Allocation | $ | 203,329,501 | $ | (673,627 | ) | $ | 202,655,874 | $ | 1,278,447,771 | |||||||
SA American Funds Global Growth | 145,940,565 | (292,680 | ) | 145,647,885 | 276,689,907 | |||||||||||
SA American Funds Growth | 207,557,243 | (539,114 | ) | 207,018,129 | 338,881,750 | |||||||||||
SA American Funds Growth-Income | 50,791,068 | (1,618,279 | ) | 49,172,789 | 276,983,121 | |||||||||||
SA American Funds VCP Managed Allocation | 306,522,999 | (63,981 | ) | 306,459,018 | 1,808,768,939 | |||||||||||
Note 4. Investment Advisory and Management Agreement, and Service Plan (12b-1 Plan)
Capital Research serves as investment adviser to the Master Funds. Capital Research, a wholly owned subsidiary of The Capital Group Companies, Inc., manages the investment fund and business affairs of the Master Funds. The Trust, on behalf of each Portfolio, entered into an Investment Advisory and Management Agreement (the “Agreement”) with SAAMCo to handle the Trust’s day-to-day affairs. The Agreement provides that SAAMCo shall manage the Trust’s investments and administer its business affairs; furnish offices, necessary facilities and equipment; provide clerical, bookkeeping and administrative services; and permit any of its officers or employees to serve, without compensation, as trustees or officers of the Trust, if duly elected to such positions. SAAMCo performs all investment advisory services for these Portfolios with the exception of portfolio management. The term “Assets,” as used in the following table, means the average daily net assets of the Portfolios.
The Trust pays SAAMCo a monthly fee calculated daily at the following annual percentages of each Portfolio’s Assets:
Portfolio | Management Fees | |||
SA American Funds Asset Allocation | 0.85 | % | ||
SA American Funds Global Growth | 0.95 | % | ||
SA American Funds Growth | 0.85 | % | ||
SA American Funds Growth-Income | 0.85 | % | ||
SA American Funds VCP Managed Allocation | 0.95 | % | ||
The Trust has entered into a contractual agreement with SAAMCo under which SAAMCo will waive 0.60%, 0.70%, 0.60%, 0.60%, and 0.70% for SA American Funds Asset Allocation Portfolio, SA American Funds Global Growth Portfolio, SA American Funds Growth Portfolio, SA American Funds Growth-Income Portfolio and SA American Funds VCP Managed Allocation Portfolio, respectively, of its advisory fee for such time as the Portfolios are operated as feeder funds, because during that time it will not be providing the portfolio management portion of the advisory and management services to be provided under its investment advisory and management agreement with the Trust. This fee waiver will continue as long as the Portfolios are part of a master-feeder fund structure unless the Board approves a change in or elimination of the waiver.
For the year ended December 31, 2020, SAAMCo has agreed to waive advisory fees as follows:
Portfolio | Amount | |||
SA American Funds Asset Allocation | $ | 7,469,619 | ||
SA American Funds Global Growth | 2,655,373 | |||
SA American Funds Growth | 2,578,209 | |||
SA American Funds Growth-Income | 1,687,302 | |||
SA American Funds VCP Managed Allocation | 13,720,239 | |||
SAAMCo has contractually agreed to waive fees and/or reimburse expenses of the following Portfolio until April 30, 2021; so that the annual operating expenses do not exceed the following percentage of the Portfolio’s average net assets. For purposes of the waived fees and/or reimbursed expense calculations, annual operating expenses shall not include extraordinary expenses (i.e. expenses that are unusual in nature and infrequent in occurrence such as litigation), or acquired fund fees and expenses, brokerage commissions and other transactional expenses relating to the purchase and sale of portfolio securities, interest, taxes and governmental fees, and other expenses not incurred in the ordinary course of the Portfolio’s business. This agreement may be modified or discontinued prior to April 30, 2021 only with the approval of the Board of Trustees of the Portfolio, including a majority of the Independent Trustees. This agreement will be renewed in terms of one year only if the Adviser agrees to extend the expense limitation.
Portfolio | Class 1 | Class 3 | ||||||
SA American Funds VCP Managed Allocation | 0.28 | % | 0.53 | % | ||||
With the exception of advisory fee waivers, for the year ended December 31, 2020, pursuant to the contractual waivers/reimbursement expense referred to above, SAAMCo did not waive or reimburse any expenses.
With the exception of advisory fee waivers, any contractual waivers or reimbursements made by the Adviser are subject to recoupment from that Portfolio within the following two years after the occurrence of the waivers and/or reimbursements provided that the Portfolio is able to effect such payment to the Adviser and remain in compliance with the expense limitations in effect at the time the waivers and/or reimbursements were made. For the year ended December 31, 2020, no amounts were repaid to the Adviser, and there are no remaining balances subject to recoupment.
| ||
| 23 |
Table of Contents
The Trust has entered into a master Transfer Agency and Service Agreement with VALIC Retirement Services Company (VRSCO), a wholly-owned subsidiary of VALIC, which is an affiliate of the Adviser. Under the agreement, VRSCO provides services, which include the issuance and redemption of shares, payment of dividends between the Trust and their “institutional” shareholders and certain shareholder reporting services including confirmation of transactions, statements of account and tax reporting. The Trust, and certain other mutual funds advised by SAAMCo pay VRSCO on an annual basis, a fee in the aggregate amount of $150,000 for transfer agency services provided, pursuant to the agreement. Accordingly, for the year ended December 31, 2020, transfer agent fees were paid (see Statement of Operations) based on the aforementioned agreement.
Class 3 shares of each Portfolio are subject to Rule 12b-1 plans that provide for service fees payable at the annual rate 0.25% of the average daily net assets of Class 3 shares. The service fees are used to compensate the Life Companies for costs associated with the servicing of Class 3 shares, including the cost of reimbursing the Life Companies for expenditures made to financial intermediaries for providing services to contract holders who are the indirect beneficial owners of the Portfolios’ Class 3 shares. Accordingly, for the year ended December 31, 2020, service fees were paid (see Statement of Operations) based on the aforementioned rate.
Note 5. Purchases and Sales of Investment Securities
The cost of purchases and proceeds from sales and maturities of long-term investments during the year ended December 31, 2020 were as follows:
Portfolio | Purchases of Portfolio Securities (excluding U.S. Government Securities) | Sales of Portfolio Securities (excluding U.S. Government Securities) | Purchases of U.S. Government Securities | Sales of U.S. Government Securities | ||||||||||||
SA American Funds Asset Allocation | $ | 176,014,768 | $ | 35,950,635 | $ | — | $ | — | ||||||||
SA American Funds Global Growth | 4,284,460 | 76,856,360 | — | — | ||||||||||||
SA American Funds Growth | 56,860,314 | 81,031,378 | — | — | ||||||||||||
SA American Funds Growth-Income | 25,461,416 | 25,411,419 | — | — | ||||||||||||
SA American Funds VCP Managed Asset Allocation | 90,821,647 | 142,899,147 | — | — | ||||||||||||
Note 6. Capital Share Transactions
Transactions in capital shares of each class of each Portfolio were as follows:
| SA American Funds Asset Allocation Portfolio | ||||||||||||||||||||||||||||||||
| Class 1 | Class 3 | |||||||||||||||||||||||||||||||
| For the year ended December 31, 2020 | For the year ended December 31, 2019 | For the year ended December 31, 2020 | For the year ended December 31, 2019 | |||||||||||||||||||||||||||||
| Shares | Amount | Shares | Amount | Shares | Amount | Shares | Amount | |||||||||||||||||||||||||
Shares sold | 151,188 | $ | 2,120,868 | 222,934 | $ | 3,239,870 | 12,014,655 | $ | 178,138,937 | 16,498,719 | $ | 237,438,124 | ||||||||||||||||||||
Reinvested dividends | 330 | 5,036 | 18,522 | 271,331 | 70,117 | 1,067,179 | 4,784,758 | 70,044,680 | ||||||||||||||||||||||||
Shares redeemed | (8,959 | ) | (128,203 | ) | (11,495 | ) | (169,328 | ) | (2,317,917 | ) | (33,742,212 | ) | (2,637,839 | ) | (37,185,296 | ) | ||||||||||||||||
|
|
|
|
|
|
|
|
|
|
|
|
|
|
|
| |||||||||||||||||
Net increase (decrease) | 142,559 | 1,997,701 | 229,961 | $ | 3,341,873 | 9,766,855 | 145,463,904 | 18,645,638 | $ | 270,297,508 | ||||||||||||||||||||||
|
|
|
|
|
|
|
|
|
|
|
|
|
|
|
| |||||||||||||||||
| SA American Funds Global Growth Portfolio | ||||||||||||||||||||||||||||||||
| Class 1 | Class 3 | |||||||||||||||||||||||||||||||
| For the year ended December 31, 2020 | For the year ended December 31, 2019 | For the year ended December 31, 2020 | For the year ended December 31, 2019 | |||||||||||||||||||||||||||||
| Shares | Amount | Shares | Amount | Shares | Amount | Shares | Amount | |||||||||||||||||||||||||
Shares sold | 17,655 | $ | 220,124 | 7,893 | $ | 87,976 | 405,126 | $ | 4,771,069 | 874,642 | $ | 9,388,124 | ||||||||||||||||||||
Reinvested dividends | 2,476 | 32,074 | 2,390 | 25,901 | 2,264,245 | 29,251,778 | 4,278,941 | 46,412,353 | ||||||||||||||||||||||||
Shares redeemed | (561 | ) | (6,767 | ) | (283 | ) | (3,101 | ) | (6,547,398 | ) | (75,522,539 | ) | (8,051,947 | ) | (86,794,354 | ) | ||||||||||||||||
|
|
|
|
|
|
|
|
|
|
|
|
|
|
|
| |||||||||||||||||
Net increase (decrease) | 19,570 | 245,431 | 10,000 | $ | 110,776 | (3,878,027 | ) | (41,499,692 | ) | (2,898,364 | ) | $ | (30,993,877 | ) | ||||||||||||||||||
|
|
|
|
|
|
|
|
|
|
|
|
|
|
|
| |||||||||||||||||
| SA American Funds Growth Portfolio | ||||||||||||||||||||||||||||||||
| Class 1 | Class 3 | |||||||||||||||||||||||||||||||
| For the year ended December 31, 2020 | For the year ended December 31, 2019 | For the year ended December 31, 2020 | For the year ended December 31, 2019 | |||||||||||||||||||||||||||||
| Shares | Amount | Shares | Amount | Shares | Amount | Shares | Amount | |||||||||||||||||||||||||
Shares sold | 30,301 | $ | 398,746 | 8,767 | $ | 100,063 | 4,211,047 | $ | 58,934,339 | 3,015,269 | $ | 32,193,311 | ||||||||||||||||||||
Reinvested dividends | 4,510 | 63,046 | 30 | 315 | 3,541,334 | 49,437,023 | 156,469 | 1,646,049 | ||||||||||||||||||||||||
Shares redeemed | (5,002 | ) | (76,749 | ) | (1,616 | ) | (19,369 | ) | (5,781,153 | ) | (81,209,374 | ) | (4,728,043 | ) | (51,169,960 | ) | ||||||||||||||||
|
|
|
|
|
|
|
|
|
|
|
|
|
|
|
| |||||||||||||||||
Net increase (decrease) | 29,809 | 385,043 | 7,181 | $ | 81,009 | 1,971,228 | 27,161,988 | (1,556,305 | ) | $ | (17,330,600 | ) | ||||||||||||||||||||
|
|
|
|
|
|
|
|
|
|
|
|
|
|
|
| |||||||||||||||||
| ||
| 24 |
Table of Contents
| SA American Funds Growth-Income Portfolio | ||||||||||||||||||||||||||||||||
| Class 1 | Class 3 | |||||||||||||||||||||||||||||||
| For the year ended December 31, 2020 | For the year ended December 31, 2019 | For the year ended December 31, 2020 | For the year ended December 31, 2019 | |||||||||||||||||||||||||||||
| Shares | Amount | Shares | Amount | Shares | Amount | Shares | Amount | |||||||||||||||||||||||||
Shares sold | 29,660 | $ | 351,145 | 8,378 | $ | 94,666 | 2,448,044 | $ | 26,639,755 | 1,718,711 | $ | 18,733,207 | ||||||||||||||||||||
Reinvested dividends | 5,764 | 61,852 | 52 | 566 | 3,584,492 | 38,354,060 | 113,808 | 1,226,850 | ||||||||||||||||||||||||
Shares redeemed | (589 | ) | (6,705 | ) | (129 | ) | (1,517 | ) | (2,255,239 | ) | (25,418,807 | ) | (3,611,355 | ) | (39,003,588 | ) | ||||||||||||||||
|
|
|
|
|
|
|
|
|
|
|
|
|
|
|
| |||||||||||||||||
Net increase (decrease) | 34,835 | 406,292 | 8,301 | $ | 93,715 | 3,777,297 | 39,575,008 | (1,778,836 | ) | $ | (19,043,531 | ) | ||||||||||||||||||||
|
|
|
|
|
|
|
|
|
|
|
|
|
|
|
| |||||||||||||||||
| SA American Funds VCP Managed Allocation Portfolio | ||||||||||||||||||||||||||||||||
| Class 1 | Class 3 | |||||||||||||||||||||||||||||||
| For the year ended December 31, 2020 | For the year ended December 31, 2019 | For the year ended December 31, 2020 | For the year ended December 31, 2019 | |||||||||||||||||||||||||||||
| Shares | Amount | Shares | Amount | Shares | Amount | Shares | Amount | |||||||||||||||||||||||||
Shares sold | 7,742 | $ | 113,672 | 6,181 | $ | 85,928 | 6,072,969 | $ | 92,554,650 | 8,554,243 | $ | 117,397,960 | ||||||||||||||||||||
Reinvested dividends | 37 | 564 | 301 | 4,391 | 305,332 | 4,674,638 | 2,003,304 | 29,070,206 | ||||||||||||||||||||||||
Shares redeemed | (792 | ) | (11,391 | ) | (9,123 | ) | (135,373 | ) | (9,311,010 | ) | (134,590,082 | ) | (7,526,249 | ) | (105,350,796 | ) | ||||||||||||||||
|
|
|
|
|
|
|
|
|
|
|
|
|
|
|
| |||||||||||||||||
Net increase (decrease) | 6,987 | 102,845 | (2,641 | ) | $ | (45,054 | ) | (2,932,709 | ) | (37,360,794 | ) | 3,031,298 | $ | 41,117,370 | ||||||||||||||||||
|
|
|
|
|
|
|
|
|
|
|
|
|
|
|
| |||||||||||||||||
Note 7. Line of Credit
The Trust, along with certain other funds managed by the Adviser, has access to a $75 million committed unsecured line of credit and a $50 million uncommitted unsecured line of credit. The committed and uncommitted lines of credit are renewable on an annual basis with State Street Bank and Trust Company (“State Street”), the Trust’s custodian. Prior to September 4, 2020, interest is payable on the committed line of credit at the higher of the Federal Funds Rate (but not less than zero) plus 125 basis points or the One-Month London Interbank Offered Rate (but not less than zero) plus 125 basis points and State Street’s discretionary bid rate on the uncommitted line of credit. The Trust, on behalf of each of the Portfolios, has paid State Street for its own account, such Portfolio’s ratable portion of an upfront fee in an amount equal to $25,000 in the aggregate for the uncommitted line of credit made available by State Street to certain other funds managed by the Adviser, which are also party to the uncommitted line of credit. There is also a commitment fee of 25 basis points per annum on the daily unused portion of the committed line of credit. Effective September 4, 2020, interest on each of the committed and uncommitted lines of credit is payable at a variable rate per annum equal to the Applicable Rate plus one and one quarter of one percent (1.25%). The Applicable Rate per annum shall be equal to the higher of (a) the Federal Funds Effective Rate on such date and (b) the Overnight Bank Funding Rate on such date, plus, in each case, 10 basis points. Notwithstanding anything to the contrary, if the Federal Funds Effective Rate or the Overnight Bank Funding Rate shall be less than zero, then the Federal Funds Effective Rate or the Overnight Bank Funding Rate, shall be deemed to be zero for the purposes of determining the rate. The Trust, on behalf of each of the Portfolios, has paid State Street for its own account, such Portfolio’s ratable portion of an upfront fee in an amount equal to $40,000 in the aggregate for the uncommitted line of credit made available by State Street to certain other funds managed by the Adviser, which are also party to the uncommitted line of credit. There is also a commitment fee of 30 basis points per annum on the daily unused portion of the committed line of credit. Borrowings under the line of credit will commence when the respective Portfolio’s cash shortfall exceeds $100,000.
For the year ended December 31, 2020, the Portfolios did not utilize the line of credit.
Note 8. Transactions with Affiliates
At December 31, 2020, the following affiliates owned outstanding shares of the following Portfolios:
| Holder | ||||||||||||
Portfolio | USL | AGL | VALIC | |||||||||
SA American Funds Asset Allocation | 6.53 | % | 89.35 | % | 4.12 | % | ||||||
SA American Funds Global Growth | 4.88 | % | 94.37 | % | 0.75 | % | ||||||
SA American Funds Growth | 4.69 | % | 93.67 | % | 1.64 | % | ||||||
SA American Funds Global-Income | 5.62 | % | 92.58 | % | 1.80 | % | ||||||
SA American Funds VCP Managed Allocation | 9.83 | % | 86.62 | % | 3.55 | % | ||||||
Note 9. Other Matters
The coronavirus pandemic and the related governmental and public responses have had and may continue to have an impact on the Portfolio’s investments and net asset value and have led and may continue to lead to increased market volatility and the potential for illiquidity in certain classes of securities and sectors of the market. Preventative or protective actions that governments may take in respect of pandemic or epidemic diseases may result in periods of business disruption, business closures, inability to obtain raw materials, supplies and component parts, and reduced or disrupted operations for the issuers in which the Portfolio invests. Government intervention in markets may impact interest rates, market volatility and security pricing. The occurrence, reoccurrence and pendency of such diseases could adversely affect the economies (including through changes in business activity and increased unemployment) and financial markets either in specific countries or worldwide.
| ||
| 25 |
Table of Contents
SUNAMERICA SERIES TRUST
Selected data for a share of beneficial interest outstanding throughout each period
| Period ended | Net Asset Value, beginning of period | Net investment income (loss)* | Net gain (loss) on investments (both realized and unrealized) | Total from investment operations | Dividends from net investment income | Dividend from net realized gain on investments | Total Distributions | Net Asset Value, end of period | Total Return** | Net Assets, end of period (000’s) | Ratio of expenses to average net assets(1)(2) | Ratio of net investment income (loss) to average net assets(1)(2)(3) | Portfolio turnover | |||||||||||||||||||||||||||||||||||||||
| SA American Funds Asset Allocation Portfolio Class 1 |
| |||||||||||||||||||||||||||||||||||||||||||||||||||
| 09/26/16#-12/31/16 | $ | 12.86 | $ | 0.18 | $ | 0.07 | $ | 0.25 | $ | — | $ | — | $ | — | $ | 13.11 | 1.94 | % | $ | 102 | 0.29 | %† | 5.35 | %† | 4 | % | ||||||||||||||||||||||||||
| 12/31/17 | 13.11 | 0.23 | 1.88 | 2.11 | (0.12 | ) | (0.25 | ) | (0.37 | ) | 14.85 | 16.10 | 201 | 0.28 | 1.64 | 1 | ||||||||||||||||||||||||||||||||||||
| 12/31/18 | 14.85 | 0.32 | (0.99 | ) | (0.67 | ) | (0.44 | ) | (0.80 | ) | (1.24 | ) | 12.94 | (4.58 | ) | 824 | 0.27 | 2.30 | 1 | |||||||||||||||||||||||||||||||||
| 12/31/19 | 12.94 | 0.43 | 2.31 | 2.74 | (0.27 | ) | (0.70 | ) | (0.97 | ) | 14.71 | 21.22 | 4,320 | 0.27 | 3.05 | 2 | ||||||||||||||||||||||||||||||||||||
| 12/31/20 | 14.71 | 0.28 | 1.54 | 1.82 | — | (0.01 | ) | (0.01 | ) | 16.52 | 12.40 | 7,207 | 0.27 | 1.92 | 3 | |||||||||||||||||||||||||||||||||||||
| SA American Funds Asset Allocation Portfolio Class 3 |
| |||||||||||||||||||||||||||||||||||||||||||||||||||
| 12/31/16 | 13.05 | 0.20 | 0.95 | 1.15 | (0.24 | ) | (0.86 | ) | (1.10 | ) | 13.10 | 9.09 | 272,006 | 0.54 | 1.52 | 4 | ||||||||||||||||||||||||||||||||||||
| 12/31/17 | 13.10 | 0.23 | 1.84 | 2.07 | (0.11 | ) | (0.25 | ) | (0.36 | ) | 14.81 | 15.84 | 548,335 | 0.53 | 1.69 | 1 | ||||||||||||||||||||||||||||||||||||
| 12/31/18 | 14.81 | 0.24 | (0.95 | ) | (0.71 | ) | (0.37 | ) | (0.80 | ) | (1.17 | ) | 12.93 | (4.86 | ) | 789,902 | 0.52 | 1.68 | 1 | |||||||||||||||||||||||||||||||||
| 12/31/19 | 12.93 | 0.26 | 2.44 | 2.70 | (0.24 | ) | (0.70 | ) | (0.94 | ) | 14.69 | 20.91 | 1,171,382 | 0.52 | 1.82 | 2 | ||||||||||||||||||||||||||||||||||||
| 12/31/20 | 14.69 | 0.22 | 1.56 | 1.78 | — | (0.01 | ) | (0.01 | ) | 16.46 | 12.14 | 1,473,177 | 0.52 | 1.49 | 3 | |||||||||||||||||||||||||||||||||||||
| SA American Funds Global Growth Portfolio Class 1 |
| |||||||||||||||||||||||||||||||||||||||||||||||||||
| 09/26/16#-12/31/16 | 11.64 | 0.09 | (0.58 | ) | (0.49 | ) | — | — | — | 11.15 | (4.21 | ) | 96 | 0.29 | † | 2.92 | † | 10 | ||||||||||||||||||||||||||||||||||
| 12/31/17 | 11.15 | 0.08 | 3.37 | 3.45 | (0.13 | ) | (1.34 | ) | (1.47 | ) | 13.13 | 31.51 | 126 | 0.28 | 0.64 | 1 | ||||||||||||||||||||||||||||||||||||
| 12/31/18 | 13.13 | 0.09 | (1.23 | ) | (1.14 | ) | (0.22 | ) | (2.62 | ) | (2.84 | ) | 9.15 | (9.12 | ) | 115 | 0.27 | 0.68 | 5 | |||||||||||||||||||||||||||||||||
| 12/31/19 | 9.15 | 0.14 | 3.07 | 3.21 | (0.12 | ) | (1.30 | ) | (1.42 | ) | 10.94 | 35.27 | 246 | 0.29 | 1.34 | 1 | ||||||||||||||||||||||||||||||||||||
| 12/31/20 | 10.94 | 0.05 | 3.25 | 3.30 | (0.04 | ) | (0.95 | ) | (0.99 | ) | 13.25 | 30.48 | 558 | 0.29 | 0.41 | 1 | ||||||||||||||||||||||||||||||||||||
| SA American Funds Global Growth Portfolio Class 3 |
| |||||||||||||||||||||||||||||||||||||||||||||||||||
| 12/31/16 | 13.29 | 0.08 | 0.01 | 0.09 | (0.23 | ) | (2.00 | ) | (2.23 | ) | 11.15 | 0.37 | 411,747 | 0.53 | 0.62 | 10 | ||||||||||||||||||||||||||||||||||||
| 12/31/17 | 11.15 | 0.04 | 3.37 | 3.41 | (0.13 | ) | (1.34 | ) | (1.47 | ) | 13.09 | 31.05 | 439,414 | 0.53 | 0.33 | 1 | ||||||||||||||||||||||||||||||||||||
| 12/31/18 | 13.09 | 0.05 | (1.21 | ) | (1.16 | ) | (0.15 | ) | (2.62 | ) | (2.77 | ) | 9.16 | (9.28 | ) | 353,422 | 0.53 | 0.35 | 5 | |||||||||||||||||||||||||||||||||
| 12/31/19 | 9.16 | 0.09 | 3.09 | 3.18 | (0.09 | ) | (1.30 | ) | (1.39 | ) | 10.95 | 34.93 | 390,653 | 0.54 | 0.79 | 1 | ||||||||||||||||||||||||||||||||||||
12/31/20 | 10.95 | 0.01 | 3.25 | 3.26 | (0.01 | ) | (0.95 | ) | (0.96 | ) | 13.25 | 30.09 | 421,535 | 0.54 | 0.05 | 1 | ||||||||||||||||||||||||||||||||||||
| * | Calculated based on average shares outstanding. |
| ** | Total return is not annualized and does not reflect expenses that apply to the separate accounts of the Life Companies. If such expenses had been included, the total return would have been lower for each period presented. Total return does include expense reimbursements (recoupment). |
| † | Annualized |
| # | Commencement of operations. |
| (1) | Net of the following expense reimbursements, waivers and (recoupments) (based on average assets): |
Portfolio | 12/16 | 12/17 | 12/18 | 12/19 | 12/20 | |||||||||||||||
SA American Funds Asset Allocation Class 1 | 0.60 | %† | 0.60 | % | 0.60 | % | 0.60 | % | 0.60 | % | ||||||||||
SA American Funds Asset Allocation Class 3 | 0.60 | 0.60 | 0.60 | 0.60 | 0.60 | |||||||||||||||
SA American Funds Global Growth Class 1 | 0.70 | † | 0.70 | 0.70 | 0.70 | 0.70 | ||||||||||||||
SA American Funds Global Growth Class 3 | 0.70 | 0.70 | 0.70 | 0.70 | 0.70 | |||||||||||||||
| (2) | Does not include underlying fund expenses that the Portfolios bear indirectly. |
| (3) | Recognition of net investment income by the Portfolios is affected by the timing of the declaration of dividends by the underlying investment companies in which the Portfolios invest. |
See Notes to Financial Statements
| ||
| 26 |
Table of Contents
SUNAMERICA SERIES TRUST
FINANCIAL HIGHLIGHTS
Selected data for a share of beneficial interest outstanding throughout each period
| Period ended | Net Asset Value, beginning of period | Net investment income (loss)* | Net gain (loss) on investments (both realized and unrealized) | Total from investment operations | Dividends from net investment income | Dividend from net realized gain on investments | Total Distributions | Net Asset Value, end of period | Total Return** | Net Assets, end of period (000’s) | Ratio of expenses to average net assets(1)(2) | Ratio of net investment income (loss) to average net assets(1)(2)(3) | Portfolio turnover | |||||||||||||||||||||||||||||||||||||||
| SA American Funds Growth Portfolio Class 1 |
| |||||||||||||||||||||||||||||||||||||||||||||||||||
| 09/26/16#-12/31/16 | $ | 11.24 | $ | 0.08 | $ | 0.23 | $ | 0.31 | $ | — | $ | — | $ | — | $ | 11.55 | 2.76 | % | $ | 103 | 0.30 | %† | 2.63 | %† | 4 | % | ||||||||||||||||||||||||||
| 12/31/17 | 11.55 | 0.06 | �� | 3.12 | 3.18 | (0.07 | ) | (1.51 | ) | (1.58 | ) | 13.15 | 28.24 | 132 | 0.28 | 0.48 | 1 | |||||||||||||||||||||||||||||||||||
| 12/31/18 | 13.15 | (0.32 | ) | 0.41 | 0.09 | (0.19 | ) | (3.82 | ) | (4.01 | ) | 9.23 | (0.40 | ) | 57 | 0.27 | (2.25 | ) | 4 | |||||||||||||||||||||||||||||||||
| 12/31/19 | 9.23 | 0.13 | 2.70 | 2.83 | — | (0.05 | ) | (0.05 | ) | 12.01 | 30.75 | 160 | 0.29 | 1.22 | 7 | |||||||||||||||||||||||||||||||||||||
12/31/20 | 12.01 | 0.05 | 5.92 | 5.97 | (0.14 | ) | (1.53 | ) | (1.67 | ) | 16.31 | 52.09 | 704 | 0.28 | 0.34 | 13 | ||||||||||||||||||||||||||||||||||||
| SA American Funds Growth Portfolio Class 3 |
| |||||||||||||||||||||||||||||||||||||||||||||||||||
| 12/31/16 | 14.43 | 0.06 | 1.06 | 1.12 | (0.05 | ) | (3.96 | ) | (4.01 | ) | 11.54 | 9.17 | 321,687 | 0.53 | 0.49 | 4 | ||||||||||||||||||||||||||||||||||||
| 12/31/17 | 11.54 | 0.03 | 3.12 | 3.15 | (0.06 | ) | (1.51 | ) | (1.57 | ) | 13.12 | 28.02 | 350,726 | 0.54 | 0.19 | 1 | ||||||||||||||||||||||||||||||||||||
| 12/31/18 | 13.12 | 0.02 | 0.04 | 0.06 | (0.12 | ) | (3.82 | ) | (3.94 | ) | 9.24 | (0.55 | ) | 305,503 | 0.53 | 0.13 | 4 | |||||||||||||||||||||||||||||||||||
| 12/31/19 | 9.24 | 0.05 | 2.75 | 2.80 | — | (0.05 | ) | (0.05 | ) | 11.99 | 30.39 | 377,823 | 0.54 | 0.47 | 7 | |||||||||||||||||||||||||||||||||||||
12/31/20 | 11.99 | 0.01 | 5.91 | 5.92 | (0.11 | ) | (1.53 | ) | (1.64 | ) | 16.27 | 51.72 | 544,907 | 0.53 | 0.04 | 13 | ||||||||||||||||||||||||||||||||||||
| SA American Funds Growth-Income Portfolio Class 1 |
| |||||||||||||||||||||||||||||||||||||||||||||||||||
| 09/26/16#-12/31/16 | 11.83 | 0.16 | 0.26 | 0.42 | — | — | — | 12.25 | 3.55 | 104 | 0.29 | † | 4.89 | † | 3 | |||||||||||||||||||||||||||||||||||||
| 12/31/17 | 12.25 | 0.18 | 2.47 | 2.65 | (0.23 | ) | (1.68 | ) | (1.91 | ) | 12.99 | 22.39 | 127 | 0.29 | 1.38 | 2 | ||||||||||||||||||||||||||||||||||||
| 12/31/18 | 12.99 | 0.06 | (0.17 | ) | (0.11 | ) | (0.41 | ) | (2.93 | ) | (3.34 | ) | 9.54 | (1.86 | ) | 47 | 0.28 | 0.45 | 4 | |||||||||||||||||||||||||||||||||
| 12/31/19 | 9.54 | 0.21 | 2.28 | 2.49 | — | (0.05 | ) | (0.05 | ) | 11.98 | 26.17 | 159 | 0.31 | 2.06 | 4 | |||||||||||||||||||||||||||||||||||||
12/31/20 | 11.98 | 0.18 | 1.27 | 1.45 | (0.23 | ) | (1.41 | ) | (1.64 | ) | 11.79 | 13.47 | 567 | 0.29 | 1.60 | 9 | ||||||||||||||||||||||||||||||||||||
| SA American Funds Growth-Income Portfolio Class 3 |
| |||||||||||||||||||||||||||||||||||||||||||||||||||
| 12/31/16 | 13.63 | 0.16 | 1.20 | 1.36 | (0.20 | ) | (2.55 | ) | (2.75 | ) | 12.24 | 11.16 | 258,669 | 0.54 | 1.19 | 3 | ||||||||||||||||||||||||||||||||||||
| 12/31/17 | 12.24 | 0.14 | 2.47 | 2.61 | (0.22 | ) | (1.68 | ) | (1.90 | ) | 12.95 | 22.08 | 281,189 | 0.54 | 1.06 | 2 | ||||||||||||||||||||||||||||||||||||
| 12/31/18 | 12.95 | 0.14 | (0.28 | ) | (0.14 | ) | (0.34 | ) | (2.93 | ) | (3.27 | ) | 9.54 | (2.05 | ) | 245,183 | 0.53 | 1.07 | 4 | |||||||||||||||||||||||||||||||||
| 12/31/19 | 9.54 | 0.15 | 2.30 | 2.45 | — | (0.05 | ) | (0.05 | ) | 11.94 | 25.75 | 285,659 | 0.55 | 1.37 | 4 | |||||||||||||||||||||||||||||||||||||
12/31/20 | 11.94 | 0.12 | 1.30 | 1.42 | (0.20 | ) | (1.41 | ) | (1.61 | ) | 11.75 | 13.25 | 325,404 | 0.54 | 1.09 | 9 | ||||||||||||||||||||||||||||||||||||
| * | Calculated based on average shares outstanding. |
| ** | Total return is not annualized and does not reflect expenses that apply to the separate accounts of the Life Companies. If such expenses had been included, the total return would have been lower for each period presented. Total return does include expense reimbursements (recoupment). |
| † | Annualized |
| # | Commencement of operations. |
| (1) | Net of the following expense reimbursements, waivers and (recoupments) (based on average assets): |
Portfolio | 12/16 | 12/17 | 12/18 | 12/19 | 12/20 | |||||||||||||||
SA American Funds Growth Class 1 | 0.60 | %† | 0.60 | % | 0.60 | % | 0.60 | % | 0.60 | % | ||||||||||
SA American Funds Growth Class 3 | 0.60 | 0.60 | 0.60 | 0.60 | 0.60 | |||||||||||||||
SA American Funds Growth-Income Class 1 | 0.60 | † | 0.60 | 0.60 | 0.60 | 0.60 | ||||||||||||||
SA American Funds Growth-Income Class 3 | 0.60 | 0.60 | 0.60 | 0.60 | 0.60 | |||||||||||||||
| (2) | Does not include underlying fund expenses that the Portfolios bear indirectly. |
| (3) | Recognition of net investment income by the Portfolios is affected by the timing of the declaration of dividends by the underlying investment companies in which the Portfolios invest. |
See Notes to Financial Statements
| ||
| 27 |
Table of Contents
SUNAMERICA SERIES TRUST
FINANCIAL HIGHLIGHTS
Selected data for a share of beneficial interest outstanding throughout each period
| Period ended | Net Asset Value, beginning of period | Net investment income (loss)* | Net gain (loss) on investments (both realized and unrealized) | Total from investment operations | Dividends from net investment income | Dividend from net realized gain on investments | Total Distributions | Net Asset Value, end of period | Total Return** | Net Assets, end of period (000’s) | Ratio of expenses to average net assets(1)(2) | Ratio of net investment income (loss) to average net assets(1)(2)(3) | Portfolio turnover | |||||||||||||||||||||||||||||||||||||||
| SA American Funds VCP Managed Allocation Portfolio Class 1 |
| |||||||||||||||||||||||||||||||||||||||||||||||||||
| 09/26/16#-12/31/16 | $ | 12.66 | $ | 0.05 | $ | 0.16 | $ | 0.21 | $ | — | $ | — | $ | — | $ | 12.87 | 1.66 | % | $ | 102 | 0.28 | %† | 1.40 | %† | 2 | % | ||||||||||||||||||||||||||
| 12/31/17 | 12.87 | 0.07 | 1.82 | 1.89 | (0.11 | ) | (0.28 | ) | (0.39 | ) | 14.37 | 14.78 | 123 | 0.27 | 0.51 | 2 | ||||||||||||||||||||||||||||||||||||
| 12/31/18 | 14.37 | 0.22 | (0.92 | ) | (0.70 | ) | (0.28 | ) | (0.71 | ) | (0.99 | ) | 12.68 | (4.89 | ) | 145 | 0.27 | 1.56 | 103 | |||||||||||||||||||||||||||||||||
| 12/31/19 | 12.68 | 0.06 | 2.32 | 2.38 | (0.07 | ) | (0.18 | ) | (0.25 | ) | 14.81 | 18.81 | 130 | 0.28 | 0.42 | 4 | ||||||||||||||||||||||||||||||||||||
12/31/20 | 14.81 | 0.21 | 1.21 | 1.42 | — | (0.04 | ) | (0.04 | ) | 16.19 | 9.57 | 255 | 0.27 | 1.38 | 5 | |||||||||||||||||||||||||||||||||||||
| SA American Funds VCP Managed Allocation Portfolio Class 3 |
| |||||||||||||||||||||||||||||||||||||||||||||||||||
| 12/31/16 | 12.22 | 0.14 | 0.72 | 0.86 | (0.09 | ) | (0.12 | ) | (0.21 | ) | 12.87 | 7.07 | 1,215,590 | 0.53 | 1.16 | 2 | ||||||||||||||||||||||||||||||||||||
| 12/31/17 | 12.87 | 0.04 | 1.80 | 1.84 | (0.10 | ) | (0.28 | ) | (0.38 | ) | 14.33 | 14.41 | 1,654,513 | 0.52 | 0.26 | 2 | ||||||||||||||||||||||||||||||||||||
| 12/31/18 | 14.33 | 0.19 | (0.93 | ) | (0.74 | ) | (0.21 | ) | (0.71 | ) | (0.92 | ) | 12.67 | (5.12 | ) | 1,659,358 | 0.52 | 1.32 | 103 | |||||||||||||||||||||||||||||||||
| 12/31/19 | 12.67 | 0.01 | 2.33 | 2.34 | (0.04 | ) | (0.18 | ) | (0.22 | ) | 14.79 | 18.48 | 1,982,324 | 0.53 | 0.11 | 4 | ||||||||||||||||||||||||||||||||||||
12/31/20 | 14.79 | 0.21 | 1.17 | 1.38 | — | (0.04 | ) | (0.04 | ) | 16.13 | 9.32 | 2,113,978 | 0.52 | 1.39 | 5 | |||||||||||||||||||||||||||||||||||||
| * | Calculated based on average shares outstanding. |
| ** | Total return is not annualized and does not reflect expenses that apply to the separate accounts of the Life Companies. If such expenses had been included, the total return would have been lower for each period presented. Total return does include expense reimbursements (recoupment). |
| † | Annualized |
| # | Commencement of operations. |
| (1) | Net of the following expense reimbursements, waivers and (recoupments) (based on average net assets): |
Portfolio | 12/16 | 12/17 | 12/18 | 12/19 | 12/20 | |||||||||||||||
SA American Funds VCP Managed Allocation Class 1 | 0.70 | %† | 0.70 | % | 0.70 | % | 0.70 | % | 0.70 | % | ||||||||||
SA American Funds VCP Managed Allocation Class 3 | 0.70 | 0.70 | 0.70 | 0.70 | 0.70 | |||||||||||||||
| (2) | Does not include underlying fund expenses that the Portfolios bear indirectly. |
| (3) | Recognition of net investment income by the Portfolios is affected by the timing of the declaration of dividends by the underlying investment companies in which the Portfolios invest. |
See Notes to Financial Statements
| ||
| 28 |
Table of Contents
SUNAMERICA SERIES TRUST
REPORT OF INDEPENDENT REGISTERED PUBLIC ACCOUNTING FIRM
To the Board of Trustees of SunAmerica Series Trust and Shareholders of SA American Funds Asset
Allocation Portfolio, SA American Funds Global Growth Portfolio, SA American Funds Growth-Income Portfolio, SA American Funds Growth Portfolio and SA American Funds VCP Managed Allocation Portfolio
Opinions on the Financial Statements
We have audited the accompanying statements of assets and liabilities, including the portfolios of investments, of SA American Funds Asset Allocation Portfolio, SA American Funds Global Growth Portfolio, SA American Funds Growth-Income Portfolio, SA American Funds Growth Portfolio and SA American Funds VCP Managed Allocation Portfolio (constituting SunAmerica Series Trust, hereafter collectively referred to as the “Portfolios”) as of December 31, 2020, the related statements of operations for the year ended December 31, 2020, the statements of changes in net assets for each of the two years in the period ended December 31, 2020, including the related notes, and the financial highlights for each of the periods therein (collectively referred to as the “financial statements”). In our opinion, the financial statements present fairly, in all material respects, the financial position of each of the Portfolios as of December 31, 2020, the results of each of their operations for the year then ended, the changes in each of their net assets for each of the two years in the period ended December 31, 2020 and each of the financial highlights for the periods indicated therein in conformity with accounting principles generally accepted in the United States of America.
Basis for Opinions
These financial statements are the responsibility of the Portfolios’ management. Our responsibility is to express an opinion on the Portfolios’ financial statements based on our audits. We are a public accounting firm registered with the Public Company Accounting Oversight Board (United States) (“PCAOB”) and are required to be independent with respect to the Portfolios in accordance with the U.S. federal securities laws and the applicable rules and regulations of the Securities and Exchange Commission and the PCAOB.
We conducted our audits of these financial statements in accordance with the standards of the PCAOB. Those standards require that we plan and perform the audit to obtain reasonable assurance about whether the financial statements are free of material misstatement, whether due to error or fraud.
Our audits included performing procedures to assess the risks of material misstatement of the financial statements, whether due to error or fraud, and performing procedures that respond to those risks. Such procedures included examining, on a test basis, evidence regarding the amounts and disclosures in the financial statements. Our audits also included evaluating the accounting principles used and significant estimates made by management, as well as evaluating the overall presentation of the financial statements. Our procedures included confirmation of securities owned as of December 31, 2020 by correspondence with the transfer agent. We believe that our audits provide a reasonable basis for our opinions.
/s/ PricewaterhouseCoopers LLP
Houston, Texas
February 25, 2021
We have served as the auditor of one or more investment companies in the SunAmerica annuity family of funds (consisting of SunAmerica Series Trust, Seasons Series Trust and Anchor Series Trust) since at least 1986. We have not been able to determine the specific year we began serving as auditor.
| ||
| 29 |
Table of Contents
SUNAMERICA SERIES TRUST
APPROVAL OF ADVISORY AGREEMENT
December 31, 2020 (unaudited)
At a meeting held on October 7, 2020, the Board of Trustees (the “Board”), including the Trustees that are not interested persons of SunAmerica Series Trust (the “Trust”), as defined in the Investment Company Act of 1940, as amended (the “Independent Trustees”), approved with respect to the American Funds Asset Allocation SAST Portfolio, American Funds Growth SAST Portfolio, American Funds Global Growth SAST Portfolio, American Funds Growth-Income SAST Portfolio and VCP Managed Asset Allocation Portfolio (collectively, the “Portfolios”) the continuation of the Investment Management and Advisory Agreement between SunAmerica Asset Management, LLC (“SAAMCo” or the “Adviser”) and the Trust (the “Advisory Agreement”).
In connection with the approval of the Advisory Agreement, the Board received materials related to certain factors used in its consideration whether to renew or approve the Advisory Agreement. Those factors included:
| (1) | the requirements of the Trust in the areas of investment supervisory and administrative services; |
| (2) | the nature, extent and quality of the investment advisory, administrative, operational and compliance services provided by SAAMCo, including a review of the investment performance of the Portfolios; |
| (3) | the size and structure of the investment advisory fee and any other material payments to the Adviser and, in connection therewith, a review of the costs of services provided and the profits realized by the Adviser and its affiliates from the relationship with the Trust; |
| (4) | the expenses paid by each of the Portfolios, including their total operating expenses and any applicable expense limitation; |
| (5) | the extent to which the Adviser realizes economies of scale and shares them with the Trust; and |
| (6) | the organizational capability, resources, personnel and financial condition of the Adviser and its affiliates. |
In addition, the Board considered (a) the historical relationship between the Trust and SAAMCo; (b) the possibility that services of the type required by the Trust might be better obtained from other organizations; and (c) the conditions and trends prevailing in the economy, the securities markets and the investment company industry
The Independent Trustees were separately represented by counsel that is independent of SAAMCo in connection with their consideration of approval of the Advisory Agreement. The matters discussed below were also considered separately by the Independent Trustees in executive sessions during which their independent counsel provided guidance to the Independent Trustees.
The Board received information regarding the Trust’s advisory fees compared to advisory fee rates of a group of funds with similar investment strategies and/or objectives, as applicable, (the “Expense Group/Universe”), as selected and prepared by an independent third-party provider of investment company data. The Board also received performance data and expense information prepared by management.
Nature, Extent and Quality of Services.
The Board, including the Independent Trustees, considered the nature, quality and extent of services provided by SAAMCo. In making its evaluation, the Board considered that SAAMCo acts as adviser for each Portfolio and manages the daily business affairs of the Trust, subject to the Trustees’ oversight and control. It was also noted that SAAMCo’s advisory fees compensate SAAMCo for services such as monitoring Portfolio performance and other administrative, compliance and legal services.
The Board noted that SAAMCo is responsible for overseeing the performance of services by the Trust’s custodian, transfer agent and dividend disbursing agent. The Board also noted that SAAMCo is responsible for the financial, legal and accounting records required to be maintained by each Portfolio and for the administration of the Trust’s business affairs, including providing such office space, bookkeeping, accounting, clerical, secretarial and administrative services (exclusive of, and in addition to, any such service provided by any others retained by the Trust or any Portfolio) and such executive and other personnel as may be necessary for the operations of each Portfolio. The Board considered that SAAMCo monitors and reviews the activities of third-party service providers that may provide additional administrative services.
In addition, the Board considered the key personnel of SAAMCo that are involved in the investment management, administration, compliance and risk management activities with respect to the Portfolios. The Board also considered the compensation program for SAAMCo’s investment professionals.
The Board reviewed the qualifications, background and responsibilities of SAAMCo’s staff who is responsible for providing investment management services to the Portfolios and other key personnel of SAAMCo in addition to current and projected staffing levels and compensation practices.
| ||
| 30 |
Table of Contents
SUNAMERICA SERIES TRUST
APPROVAL OF ADVISORY AGREEMENT
December 31, 2020 (unaudited) (continued)
The Board considered SAAMCo’s reputation and long-standing relationship with the Portfolios and considered the benefit to shareholders of investing in funds that are part of a family of funds offering a variety of types of mutual funds and shareholder services. The Board also considered the Trust’s relationship with affiliated life insurance companies that offer the Portfolios through variable annuity and variable life insurance products. The Board considered SAAMCo’s experience in providing management and investment advisory and administrative services to advisory clients. The Board also considered SAAMCo’s code of ethics and its risk management process, and that SAAMCo has developed internal procedures, adopted by the Board, for monitoring compliance with the investment objectives, policies and restrictions of the Portfolios as set forth in the Portfolios’ registration statement.
The Board also reviewed and considered SAAMCo’s compliance and regulatory history, including information about any litigation, regulatory actions or investigations that could impair its ability to serve as an adviser to the Portfolios. The Board considered SAAMCo’s risk assessment and risk management processes. The Board concluded that there was no information provided that would have a material adverse effect on SAAMCo’s ability to provide services to the Trust.
The Board concluded that it was satisfied with the nature, quality and extent of the services provided by or to be provided by SAAMCo and that there was a reasonable basis on which to conclude that they would provide high quality services to the Trust.
Portfolio Fees and Expenses; Investment Performance.
The Board, including the Independent Trustees, received and reviewed information regarding the Portfolios’ fees (actual or contractual management fees, non-management fees, and 12b-1 fees, if applicable), and expense ratios compared against such fees and expense ratios of the Expense Group/Universe for each Portfolio. Such fees and expense ratios were compared both before and after expense waivers, caps and reimbursements, if any.
To assist in analyzing the reasonableness of the advisory fee, the Board received a report prepared independently by Broadridge Financial Solutions, Inc. (“Broadridge”) as well as information provided by management. The Board also considered advisory fees received by the Adviser with respect to other mutual funds and accounts with similar investment strategies to the Portfolios. Based on the information from Broadridge, the Board reviewed detailed information about peer groups of comparable mutual funds based on various factors such as the type of fund (those underlying variable insurance products), comparable investment objectives and strategies, among other factors. Referred to herein are “Expense Groups” and “Performance Groups” that represent those peer groups of funds used to compare expenses and performance, respectively.
The performance information included annualized returns for the period since inception and the one-, three-, five-and ten-year periods, as applicable, ended June 30, 2020 from Broadridge and performance information as of June 30, 2020 from management. On a quarterly basis, the Board monitors and reviews various materials presented and prepared by management, including but not limited to each Portfolio’s overall performance, performance relative to each Portfolio’s relevant benchmark and Morningstar and/or Broadridge peer groups, as applicable. The Board considered that management makes particular note of Portfolios that may require closer monitoring or potential corrective action by the Board.
As part of its review of the Portfolios’ fees and expenses and performance, the Board considered information, including but not limited to the following expense and performance information, provided by Broadridge and management in making its determinations. It was noted that actual advisory fees and total expenses were calculated as of each Portfolio’s most recent fiscal year end, which may vary among the Portfolio’s Expense Group/Universe.
The Boards considered that certain Portfolios pay advisory fees indirectly to Capital Research & Management Company (“Capital Research”) through their investment in the master funds. The Boards further considered the amount of such fees and the amount of the management fees paid to SAAMCo and determined that the amounts paid to SAAMCo by such Portfolios were reasonable in light of the services performed by SAAMCo.
| • | SA American Funds® Asset Allocation Portfolio (master-feeder fund advised by Capital Research/SAAMCo). The Board noted that both actual management fees and total expenses were below the medians of its Expense Group. The Board considered that SAAMCo has contractually agreed to waive 0.60% of its investment advisory fee. |
The Board considered that the Portfolio outperformed its benchmark index for the one-, three-, five- and ten-year periods. The Board further considered that the Portfolio performed at the medians of its Performance Group for the one- and ten-year periods, above the median for the five-year period and slightly below the median for the three-year period. The Board took into account management’s discussion of the Master Fund’s performance.
| • | SA American Funds® Global Growth Portfolio (master-feeder fund advised by Capital Research/SAAMCo). The Board considered that both actual management fees and total expenses were slightly above the medians of its Expense Group. The Board considered that SAAMCo has contractually agreed to waive 0.70% of its investment advisory fee. |
| ||
| 31 |
Table of Contents
SUNAMERICA SERIES TRUST
APPROVAL OF ADVISORY AGREEMENT
December 31, 2020 (unaudited) (continued)
The Board considered that the Portfolio outperformed its benchmark index for the one-, three-, five- and ten-year periods. The Board further considered that the Portfolio performed above the medians of its Performance Group for the same periods.
| • | SA American Funds® Growth-Income Portfolio (master-feeder fund advised by Capital Research/SAAMCo). The Board noted that both actual management fees and actual total expenses were below the medians of its Expense Group. The Board considered that SAAMCo has contractually agreed to waive 0.60% of its investment advisory fee. |
The Board considered that the Portfolio outperformed its benchmark index for the three-, five- and ten-year periods but below that index for the one-year period. The Board also noted that the Portfolio performed at or near the medians of its Performance Group for the three-, five- and ten-year periods and below the median for the one-year period. The Board took into account management’s discussion of the Master Fund’s performance.
| • | SA American Funds® Growth Portfolio (master-feeder fund advised by Capital Research/SAAMCo). The Board noted that both actual management fees and total expenses were below the medians of its Expense Group. The Board considered that SAAMCo has contractually agreed to waive 0.60% of its investment advisory fee. |
The Board considered that the Portfolio performed above its benchmark index for the one- and five-year periods and below that index for the three- and ten-year periods. The Board further considered that the Portfolio performed above the median of its Performance Group for the one-year period and below the medians for the three-, five-, and ten-year periods. The Board took into account management’s discussion of the Master Fund’s performance.
| • | SA American Funds® VCP Managed Asset Allocation Portfolio (master-feeder fund advised by Capital Research/SAAMCo). The Board noted that actual management fees were below and total expenses were above the medians of its Expense Group. The Board further noted that SAAMCo has contractually agreed to waive 0.70% of its advisory fee and that there is an expense limitation of 0.28% and 0.53% on Class 1 and Class 3 shares, respectively. The Board took account of management’s discussion of the Portfolio’s expenses. |
The Board considered that the Portfolio outperformed its benchmark index for the one-, three- and five-year periods. The Board also considered that the Portfolio performed above the medians of its Performance Group for the same periods.
Cost of Services & Benefits Derived.
With respect to indirect costs and benefits, the Board was informed, based on management’s judgment, that any indirect costs incurred by SAAMCo in connection with rendering investment advisory services to the Trust were inconsequential to the analysis of the adequacy of the advisory fees, and that any collateral benefits derived as a result of providing advisory services to the Trust did not impact the reasonableness of the advisory fee. The Board considered that SAAMCo is paid an administrative services fee of up to 0.04% of the average daily net asset value of the Trust’s Portfolios pursuant to an arrangement between SAAMCo and certain affiliated life insurance companies (the “Life Companies”). The Board considered that the Trust also pays VALIC Retirement Services Company, an affiliate of SAAMCo, a fee for the provision of recordkeeping and shareholder services to contract owners and participants.
In connection with benefits derived from the Trust, the Board considered that the Life Companies may benefit as a result of their direct ownership of the Portfolios’ shares, which amounts may be significant. It was noted that in calculating their corporate income tax liability as insurance companies, the Life Companies, as corporate mutual fund shareholders, may exclude a portion of the ordinary dividends paid by underlying U.S. equities in the Portfolios to the same extent the Portfolios receive certain dividends with respect to shares of stock issued by domestic corporations, subject to applicable tax laws and regulations. In addition, the Life Companies may also rely on foreign tax credits with respect to certain foreign securities held by applicable Portfolios. The Board considered that the Life Companies receive financial support from SAAMCo for distribution-related activities, including administrative, marketing and other servicing activities, including payments to help offset costs for marketing activities and training (including training of registered representatives of AIG Capital Services, Inc., an affiliate of SAAMCo) to support sales of the Portfolios, as well as occasional gifts, entertainment or other compensation as incentives. It was noted that such payments may be derived from 12b-1 (service) fees that are deducted directly from the assets of the Portfolios or from investment management fees received by SAAMCo. In addition, the Board considered that, because shares of the Portfolios are offered as investment options through variable annuity or life contracts issued by the Life Companies (the “Variable Contracts”), the investment objectives, strategies and performance of the Portfolios may positively or negatively impact a Life Company’s ability to hedge and the related hedging costs associated with guarantees that the Life Company may provide as the issuer of the Variable Contracts.
The Board concluded that any benefits that SAAMCo and its affiliates could be expected to receive with regard to providing investment advisory and other services to the Portfolios were reasonable.
| ||
| 32 |
Table of Contents
SUNAMERICA SERIES TRUST
APPROVAL OF ADVISORY AGREEMENT
December 31, 2020 (unaudited) (continued)
Profitability and Economies of Scale.
The Board received information related to SAAMCo’s profitability as well as the profitability of certain affiliates with respect to the services they provide to the Trust’s Portfolios. The profitability analysis reflected the relationship between SAAMCo and the affiliated Life Companies. The Board considered that, pursuant to administrative services agreements between SAAMCo and each of the Life Companies, SAAMCo pays a fee to each Life Company at an annual rate of 25 basis points of the average daily net assets of the Portfolios that are held by the corresponding separate accounts of each Life Company, in exchange for certain administrative services provided to the Portfolios. The Board determined that the profitability to SAAMCo in connection with its relationship to the Trust was reasonable. In addition, the Board considered the Investment Management Profitability Analysis prepared by an independent information service, Broadridge, and noted that SAAMCo’s profitability was generally in the range of the profitability of companies contained in the report.
The Board also received and considered information regarding the ability of the Portfolios to achieve economies of scale. It was noted that the advisory fees of nearly all Portfolios contain breakpoints that will reduce the fees paid by a Portfolio as its assets increase. The Board also considered that SAAMCo has voluntarily agreed to waive fees in certain instances, which was noted earlier in the discussion of fees. It was noted that as a result of being part of a complex of mutual funds advised or administered by SAAMCo, the Trust is able to share common resources and may share certain expenses, which could result in a Portfolio experiencing lower expenses than it otherwise would achieve if the Trust were a stand-alone entity. The Board considered that management believed that the Portfolios’ existing fee schedules and the fee schedules for those Portfolios for which management proposed reductions or waivers reflect the economies of scale inherent in providing investment advice to a Portfolio in its particular asset category and asset size. The Board concluded that any potential economies of scale are currently being shared between the Trust and SAAMCo in an appropriate manner.
Terms of Advisory Agreement.
The Board, including the Independent Trustees, reviewed the terms of the Advisory Agreement including the duties and responsibilities undertaken by SAAMCo as discussed above. The Board considered that SAAMCo pays all of its own expenses in connection with the performance of its duties, as well as the salaries, fees and expenses of the officers of the Trust who are employees of SAAMCo.
Conclusions.
In reaching its decision to recommend the renewal of the Advisory Agreement, the Board did not identify any single factor as being controlling, but based its recommendation on each of the factors it considered and each Trustee attributes different weight to the various factors. Based upon the materials it reviewed, the representations made to it and the considerations described above, and as part of their deliberations, the Board, including the Independent Trustees, concluded that SAAMCo possesses the capability and resources to perform the duties required of it under the Advisory Agreement.
Further, based upon its review of the Advisory Agreement, the materials provided, and the considerations described above, the Board, including the Independent Trustees, concluded that: (1) the terms of the Advisory Agreement are reasonable, fair and in the best interest of the Portfolios and their shareholders, and (2) the advisory fee rates are fair and reasonable in light of the usual and customary charges made for services of the same nature and quality and the other factors considered.
| ||
| 33 |
Table of Contents
SUNAMERICA SERIES TRUST
TRUSTEES AND OFFICERS INFORMATION (unaudited)
The following table contains information regarding the Trustees and Officers that oversee operations of the Portfolios and other investment companies within the Fund complex.
Name and Age† | Position Held | Term of | Principal Occupation(s) | Number of Portfolios in Fund Complex Overseen by Trustee(1) | Other Directorships | |||||||
Disinterested Trustee | ||||||||||||
| Garrett F. Bouton Age: 76 | Trustee | 2007 – Present | Retired (2003-Present); Managing Director and CEO, Barclays Global Investors (1996-2003). | 80 | Chairman/Director, The LECG Group (consulting services) (2006-2010). | |||||||
| Carl D. Covitz Age: 81 | Trustee | 2001 – Present | Owner and President, Landmark Capital, Inc. (1973-Present). | 80 | Director, Arden Realty, Inc. (real estate) (1995-2006). | |||||||
| Jane Jelenko Age: 72 | Trustee | 2006 – Present | Retired Partner KPMG, LLP and Managing Director Bearingpoint, Inc. (formerly KPMG Consulting). (2003-Present). | 80 | Director, Countrywide Bank (2003-2008) and Director, Cathay General Bancorp and CathayBank (banking) (2012-Present). | |||||||
| Gilbert T. Ray Age: 76 | Trustee | 2001 – Present | Retired Partner, O’Melveny & Myers LLP (law firm) (2000-Present). | 80 | Director, Advanced Auto Parts, Inc. (retail, auto and home supply stores) (2002-2016); Director, Watson, Wyatt Worldwide (services — management consulting services) (2000-2009); Director Dine Equity (services — restaurant) (2004-Present); Director Diamond Rock Hospitality (financial — real estate) (2005-Present); Director, Towers Watson & Co. (services — management consulting services) (2010-2016). | |||||||
| Allan L. Sher Age: 89 | Trustee | 1997 – Present | Retired Brokerage Executive (1992-Present). | 80 | Director, Bowl America Inc. (1997-Present). | |||||||
| Bruce G. Willison Age: 72 | Trustee and Chairman | 2001 – Present | Professor of Management, Anderson School at UCLA (1999-2011); Dean, Anderson School at UCLA (1999-2005); co-founder, Grandpoint Capital, Inc. (2009-2010). | 80 | Director, GrandPoint Bank (banking). (2011-Present); Director, Indy Mac Bancorp (banking) (2003-2008); Director, Move, Inc. (internet real estate site) (2003-Present); Director, Healthnet International, Inc. (business services) (2000-2016). | |||||||
Interested Trustee | ||||||||||||
| Sharon French (2) Age: 55 | Trustee | 2019 – present | President and CEO of SunAmerica (since 2019); Vice President of AIG (since 2019); Executive Vice President and Head of Beta Solutions, OppenheimerFunds (2016-2019); President, F-Squared Capital, LLC (financial services) (2013-2015). | 80 | None | |||||||
| ||
| 34 |
Table of Contents
SUNAMERICA SERIES TRUST
TRUSTEES AND OFFICERS INFORMATION (unaudited) — (continued)
Name and Age† | Position Held | Term of Office and Time Served(4) | Principal Occupation(s) During Past 5 Years | Number of Portfolios in Fund Complex Overseen by Trustee(1) | Other Directorships Held by Trustee(3) | |||||
Officers | ||||||||||
| John T. Genoy Age: 52 | President | 2007 – Present | Chief Financial Officer, SAAMCo (2002-Present); Senior Vice President, SAAMCo (2004-Present); Chief Operating Officer, SAAMCo (2006-Present). | N/A | N/A | |||||
| Kathleen D. Fuentes Age: 51 | Chief Legal Officer, Vice President, and Secretary | 2015 – Present | Vice President and Deputy General Counsel, SAAMCo (2004-Present). | N/A | N/A | |||||
| Christopher C. Joe Age: 51 | Chief Compliance Officer | 2017-Present | Chief Compliance Officer, AIG Funds, Seasons Series Trust, SunAmerica Series Trust, VALIC Company I and VALIC Company II (2017-Present); Chief Compliance Officer, VALIC Retirement Services Company (2017-Present); Chief Compliance Officer, Invesco Powershares (2012-2017); Chief Compliance Officer, Invesco Investment Advisers, LLC (2010- 2013); U.S. Compliance Director, Invesco, Ltd (2006-2014); Deputy Chief Compliance Officer, Invesco Advisers, Inc. (2014-2015). | N/A | N/A | |||||
Gregory N. Bressler Age: 54 | Vice President and Assistant Secretary | 2005 – Present | Senior Vice President and General Counsel, SAAMCo (2005-Present). | N/A | N/A | |||||
Gregory R. Kingston Age 54 | Treasurer | 2014 – Present | Vice President, SAAMCo (2001-Present); Head of Mutual Fund Administration (2014-Present) | N/A | N/A | |||||
Shawn Parry Age: 48 | Vice President and Assistant Treasurer | 2014 – Present | Assistant Vice President, SAAMCo (2005-2014); Vice President, SAAMCo (2014-Present). | N/A | N/A | |||||
Donna McManus Age: 59 | Vice President and Assistant Treasurer | 2014 – Present | Vice President, SAAMCo (2014-Present); Managing Director, BNY Mellon (2009-2014). | N/A | N/A | |||||
Matthew J. Hackethal Age: 49 | Anti-Money Laundering Compliance Officer | 2006 – Present | Acting Chief Compliance Officer (2016-2017); Chief Compliance Officer, SAAMCo (2006-Present) and Vice President, SAAMCo (2011 to Present). | N/A | N/A | |||||
| † | The business address for each Trustee and Officer is 21650 Oxnard Street, 10th Floor, Woodland Hills, CA 91367. |
| (1) | The “Fund Complex” consists of all registered investment company portfolios for which SAAMCo serves as investment adviser or administrator. The “Fund Complex” includes the Trust (61 portfolios), the SunAmerica Equity Funds (2 funds), SunAmerica Income Funds (3 funds), SunAmerica Money Market Funds, Inc. (1 fund), SunAmerica Senior Floating Rate Fund, Inc. (1 fund), SunAmerica Series, Inc. (6 portfolios), Anchor Series Trust (4 portfolios), Seasons Series Trust (19 portfolios), SunAmerica Specialty Series (6 funds), VALIC Company I (45 portfolios), and VALIC Company II (15 funds). |
| (2) | Interested Trustee, as defined within the Investment Company Act of 1940, because she serves as President and CEO of SunAmerica. |
| (3) | Directorships of companies required to report to the Securities and Exchange Commission under the Securities Exchange Act of 1934 (i.e. “Public Company”) registered under the 1940 Act. |
| (4) | Trustees serve until their successors are duly elected and qualified. Each officer will hold office for an indefinite term until the date he or she resigns or retires or until his/her successor is duly elected and qualifies. |
Additional information concerning the Trustees and Officers is contained in the Statement of Additional Information and is available without charge by calling (800) 445-7862.
| ||
| 35 |
Table of Contents
SUNAMERICA SERIES TRUST
SHAREHOLDERS TAX INFORMATION (unaudited)
Certain tax information regarding the SunAmerica Series Trust is required to be provided to the shareholders based upon each Portfolio’s income and capital gain distributions for the taxable year ended December 31, 2020.
During the year ended December 31, 2020 the Portfolios paid the following dividends per share along with the percentage of ordinary income dividends that qualified for the dividends received deductions for corporations.
| Total Dividends | Net Investment Income | Net Short-Term Capital Gains* | Net Long-Term Capital Gains* | Qualifying% for the Dividends Received Deduction | ||||||||||||||||
SA American Funds Asset Allocation Portfolio Class 1 | $ | 0.01 | $ | — | $ | — | $ | 0.01 | — | % | ||||||||||
SA American Funds Asset Allocation Portfolio Class 3 | 0.01 | — | — | 0.01 | — | |||||||||||||||
SA American Funds Global Growth Portfolio Class 1 | 0.99 | 0.04 | — | 0.95 | 100.00 | |||||||||||||||
SA American Funds Global Growth Portfolio Class 3 | 0.96 | 0.01 | — | 0.95 | 100.00 | |||||||||||||||
SA American Funds Growth Portfolio Class 1 | 1.67 | 0.14 | — | 1.53 | 100.00 | |||||||||||||||
SA American Funds Growth Portfolio Class 3 | 1.64 | 0.11 | — | 1.53 | 100.00 | |||||||||||||||
SA American Funds Growth-Income Portfolio Class 1 | 1.64 | 0.23 | — | 1.41 | 100.00 | |||||||||||||||
SA American Funds Growth-Income Portfolio Class 3 | 1.61 | 0.20 | — | 1.41 | 100.00 | |||||||||||||||
SA American Funds VCP Managed Allocation Portfolio Class 1 | 0.04 | — | 0.04 | — | 100.00 | |||||||||||||||
SA American Funds VCP Managed Allocation Portfolio Class 3 | 0.04 | — | 0.04 | — | 100.00 | |||||||||||||||
| * | Short-term capital gains are treated as ordinary income for tax purposes |
| ||
| 36 |
Table of Contents
COMPARISONS: PORTFOLIOS VS. INDEXES (unaudited)
As required by the Securities and Exchange Commission, the following graphs compare the performance of a $10,000 investment in the presented Feeder Portfolios of SunAmerica Series Trust (the “Trust”) to a $10,000 investment in a comparable securities index benchmark since the portfolio’s inception. Importantly, such indices represent “paper” portfolios and do not reflect the costs and expenses of actual investing. Following each graph is a discussion of portfolio performance and factors affecting performance over the year ended December 31, 2020.
The following graphs and tables show the performance of the Portfolios at the SunAmerica Series Trust Feeder Funds level and include all trust expenses but no insurance company expenses associated with the variable annuity or variable life policy and no insurance company contingent deferred sales charge. All dividends are assumed to be reinvested. No expenses are deducted from the performance of the indexes.
The SA American Funds portfolios (“Feeder Funds”) are a part of the Trust and currently do not buy individual securities directly, but instead invest all of their assets in the underlying funds (“Master Funds”) of the American Funds Insurance Series. Each Feeder Fund has the same investment goal and limitations as the underlying Master Fund. Investing in a Feeder Fund may result in higher fees and expenses than investing directly in a Master Fund as the Feeder Funds will bear their own portfolio expenses as well as their pro rata share of each Feeder Fund’s underlying Master Fund fees and expenses. Please see the product prospectus for more information regarding the master-feeder fund structure.
Market indices referenced are unmanaged. You cannot invest directly in an index.
Note: The performance data quoted represents past performance; past performance does not guarantee future results; the investment return and principal value of an investment will fluctuate so that an investor’s shares, when redeemed, may be worth more or less than their original cost; current performance may be lower or higher than the performance data quoted. Please visit www.aig.com/Annuities for performance data current to the most recent month-end.
| ||
| 37 |
Table of Contents
American Funds
SA American Funds Asset Allocation Portfolio — Class 3
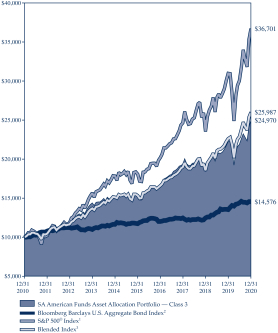
| SA American Funds Asset Allocation Portfolio |
| |||||||
| Average Annual Total Returns as of 12/31/20 |
| |||||||
Class 1* | Class 3* | |||||||
1-year | 12.40% | 12.14% | ||||||
5-year | N/A | 10.27% | ||||||
10-year | N/A | 9.58% | ||||||
Since Inception | 10.63% | 7.22% | ||||||
| * | Inception date for Class 1: 09/26/16; Class 3: 09/01/06. |
| 1 | The S&P 500® Index tracks the performance of 500 stocks representing a sampling of the largest domestic stocks traded publicly in the United States. Because it is market-weighted, the index will reflect the changes in larger companies more heavily than those in smaller companies. |
| 2 | The Bloomberg Barclays U.S. Aggregate Bond Index is a broad, unmanaged index generally representative of intermediate-term government bonds, investment grade corporate debt securities and mortgage-backed securities. |
| 3 | The Blended Index is comprised of 60% S&P 500® Index and 40% Bloomberg Barclays U.S. Aggregate Bond Index. |
Note: The performance data quoted represents past performance; past performance does not guarantee future results; the investment return and principal value of an investment will fluctuate so that an investor’s shares, when redeemed, may be worth more or less than their original cost; current performance may be lower or higher than the performance data quoted. Please visit aig.com/annuities for performance data current to the most recent month-end.
The SA American Funds Asset Allocation Portfolio — Class 3 (Feeder Fund), which is a mix of stocks and bonds, returned 12.14% for the twelve months ended December 31, 2020. The S&P 500® Index increased 18.40% over the same period, while the Bloomberg Barclays U.S. Aggregate Bond Index returned 7.51%. The Blended Index (60% S&P 500 ® Index and 40% Bloomberg Barclays U.S. Aggregate Bond Index) increased 14.73%. The American Funds Insurance Series® Asset Allocation Fund — Class 1 (Master Fund), which is a mix of stocks and bonds, returned 12.71% for the annual period.
U.S. equities ended 2020 at record highs, showing resilience during a volatile year that included a pandemic-induced recession, a sharp bear market, civil unrest and a contentious presidential election. Information technology, consumer discretionary and communication services stocks that benefited from stay-at-home restrictions led markets, including Amazon and Netflix. Overall, the information technology sector rose 44%, while consumer discretionary and communication services gained 33% and 24%, respectively. Energy lagged all other sectors, declining 34%. The significant reduction in travel reduced the demand for oil, which was briefly priced below $0 for the first time in history amid fears of dwindling storage capacity. The real estate and financials sectors were also negative for the year, each declining 2%.
Investments in the information technology sector, the Master Fund’s largest sector holding, contributed to relative returns. Within the sector, TSMC and ASML Holding contributed to relative results with double-digit returns that outpaced the general market. On the downside, commercial aerospace company Boeing detracted from relative returns as shares slumped in the face of unprecedented disruptions arising from the COVID-19 pandemic. The fixed income investments were additive to relative returns due to sector positioning and security selection.
Past performance is no guarantee of future results.
Securities listed may or may not be a part of current Portfolio construction.
| ||
| 38 |
Table of Contents
American Funds
SA American Funds Global Growth Portfolio — Class 3
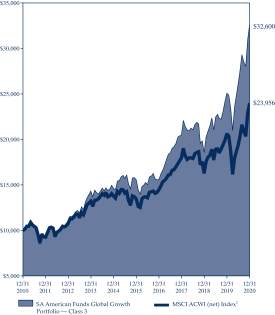
| SA American Funds Global Growth Portfolio |
| |||||||
| Average Annual Total Returns as of 12/31/20 |
| |||||||
Class 1* | Class 3* | |||||||
1-year | 30.48% | 30.09% | ||||||
5-year | N/A | 15.94% | ||||||
10-year | N/A | 12.54% | ||||||
Since Inception | 17.93% | 10.04% | ||||||
| * | Inception date for Class 1: 09/26/16; Class 3: 09/01/06. |
| 1 | The MSCI ACWI (net) Index captures large and mid cap representation across 23 developed and 27 emerging markets countries. The index covers approximately 85% of the global investable equity opportunity set. The net index approximates the minimum possible dividend reinvestment and assumes that the dividend is reinvested after the deduction of withholding tax, applying the rate to nonresident individuals who do not benefit from double taxation treaties. |
Note: The performance data quoted represents past performance; past performance does not guarantee future results; the investment return and principal value of an investment will fluctuate so that an investor’s shares, when redeemed, may be worth more or less than their original cost; current performance may be lower or higher than the performance data quoted. Please visit aig.com/annuities for performance data current to the most recent month-end.
The SA American Funds Global Growth Portfolio — Class 3 (Feeder Fund) returned 30.09% for the twelve months ended December 31, 2020, compared with a 16.26% return for the MSCI ACWI (net) Index. The American Funds Insurance Series® Global Growth Fund — Class 1 (Master Fund) returned 30.79% for the annual period.
Global stocks rose in the face of a deadly pandemic, boosted by massive government stimulus measures and the rapid development of coronavirus vaccines. In a year marked by unprecedented volatility, stocks declined sharply from February to March, followed by a remarkable nine-month rally that lifted a few key market indexes to all-time highs. U.S. equities also ended 2020 at record highs, showing resilience during a volatile year that included a pandemic-induced recession, a sharp bear market, civil unrest and a contentious presidential election. European stocks declined in local currency terms as the eurozone economy suffered the effects of government-imposed lockdowns and a severe recession. Emerging markets posted solid gains for a second consecutive year, led by China’s economic rebound and the technology-export-driven economies of Taiwan and South Korea.
Stock selection and allocation within the information technology sector were large relative return drivers. The Master Fund’s relative weightings in ASML and TSMC benefitted as both outpaced the wider market and were among the top contributors to relative returns. Consumer discretionary stock Amazon also helped relative returns, as its returns outpaced the market. The biggest drag on relative results was Apple, a stock the Master Fund didn’t own, as it proved to be one of the strongest performers for the year. On a geographic basis, stocks of companies domiciled in the United States and the Netherlands were additive to results, while stocks of companies based in France and Switzerland detracted.
Past performance is no guarantee of future results.
Securities listed may or may not be a part of current Portfolio construction.
| ||
| 39 |
Table of Contents
American Funds
SA American Funds Growth Portfolio — Class 3
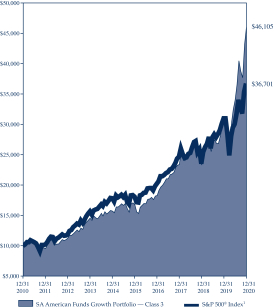
| SA American Funds Growth Portfolio |
| |||||||
| Average Annual Total Returns as of 12/31/20 |
| |||||||
Class 1* | Class 3* | |||||||
1-year | 52.09% | 51.72% | ||||||
5-year | N/A | 22.42% | ||||||
10-year | N/A | 16.51% | ||||||
Since Inception | 25.22% | 11.96% | ||||||
| * | Inception date for Class 1: 09/26/16; Class 3: 09/01/06. |
| 1 | The S&P 500® Index tracks the performance of 500 stocks representing a sampling of the largest domestic stocks traded publicly in the United States. Because it is market-weighted, the index will reflect the changes in larger companies more heavily than those in smaller companies. |
Note: The performance data quoted represents past performance; past performance does not guarantee future results; the investment return and principal value of an investment will fluctuate so that an investor’s shares, when redeemed, may be worth more or less than their original cost; current performance may be lower or higher than the performance data quoted. Please visit aig.com/annuities for performance data current to the most recent month-end.
The SA American Funds Growth Portfolio — Class 3 (Feeder Fund) returned 51.72% for the twelve months ended December 31, 2020, compared with a 18.40% increase in the S&P 500® Index. The American Funds Insurance Series® Growth Fund — Class 1 (Master Fund) returned 52.45% for the annual period.
U.S. equities ended 2020 at record highs, showing resilience during a volatile year that included a pandemic-induced recession, a sharp bear market, civil unrest and a contentious presidential election. Information technology, consumer discretionary and communication services stocks that benefited from stay-at-home restrictions led markets, including Amazon and Netflix. Overall, the information technology sector rose 44%, while consumer discretionary and communication services gained 33% and 24%, respectively. Energy lagged all other sectors, declining 34%. The significant reduction in travel reduced the demand for oil, which was briefly priced below $0 for the first time in history amid fears of dwindling storage capacity. The real estate and financials sectors were also negative for the year, each declining 2%.
The Master Fund’s top contributors in relative terms were the consumer discretionary and communication services sectors. Investments in Tesla and Netflix were additive to relative results. Tesla’s shares soared as founder Elon Musk’s effort to bring electric vehicles into the mainstream gained traction, transforming the company’s underlying financial performance. On the downside, investments in Suncor Energy and MTU Aero Engines detracted from relative returns. The significantly lower-than-benchmark position in Apple, which proved to be a high-performing stock, also detracted from relative returns.
Past performance is no guarantee of future results.
Securities listed may or may not be a part of current Portfolio construction.
| ||
| 40 |
Table of Contents
American Funds
SA American Funds Growth-Income Portfolio — Class 3
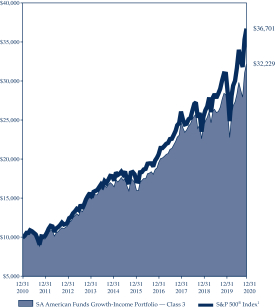
| SA American Funds Growth-Income Portfolio |
| |||||||
| Average Annual Total Returns as of 12/31/20 |
| |||||||
Class 1* | Class 3* | |||||||
1-year | 13.47% | 13.25% | ||||||
5-year | N/A | 13.61% | ||||||
10-year | N/A | 12.42% | ||||||
Since Inception | 14.48% | 8.62% | ||||||
| * | Inception date for Class 1: 09/26/16; Class 3: 09/01/06. |
| 1 | The S&P 500® Index tracks the performance of 500 stocks representing a sampling of the largest domestic stocks traded publicly in the United States. Because it is market-weighted, the index will reflect the changes in larger companies more heavily than those in smaller companies. |
Note: The performance data quoted represents past performance; past performance does not guarantee future results; the investment return and principal value of an investment will fluctuate so that an investor’s shares, when redeemed, may be worth more or less than their original cost; current performance may be lower or higher than the performance data quoted. Please visit aig.com/annuities for performance data current to the most recent month-end.
The SA American Funds Growth-Income Portfolio — Class 3 (Feeder Fund) returned 13.25% for the 12 months ended December 31, 2020, while the S&P 500® Index increased 18.40% over the same period. The American Funds Insurance Series® Growth-Income Fund — Class 1 (Master Fund) returned 13.81% for annual period.
U.S. equities ended 2020 at record highs, showing resilience during a volatile year that included a pandemic-induced recession, a sharp bear market, civil unrest and a contentious presidential election. Information technology, consumer discretionary and communication services stocks that benefited from stay-at-home restrictions led markets, including Amazon and Netflix. Overall, the information technology sector rose 44%, while consumer discretionary and communication services gained 33% and 24%, respectively. Energy lagged all other sectors, declining 34%. The significant reduction in travel reduced the demand for oil, which was briefly priced below $0 for the first time in history amid fears of dwindling storage capacity. The real estate and financials sectors were also negative for the year, each declining 2%.
The Master Fund’s investments in the communications services sector contributed the most to relative returns. Among these stocks, Netflix added the most to relative results as shares soared while stay-at-home orders spurred demand for internet-streaming media. On the downside, the lower-than-index position in information technology stocks, a sector that performed strongly over the period, weighed on relative returns. In particular, the lower-than-index investment in Apple hindered sector results the most as Apple shares outperformed the broader market over the period.
Past performance is no guarantee of future results.
Securities listed may or may not be a part of current Portfolio construction.
| ||
| 41 |
Table of Contents
American Funds
SA American Funds VCP Managed Allocation Portfolio — Class 3
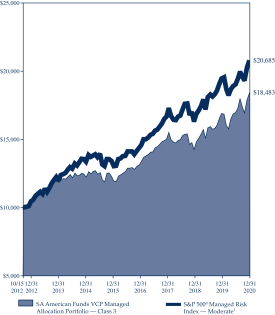
| SA American Funds VCP Managed Allocation Portfolio |
| |||||||
| Average Annual Total Returns as of 12/31/20 |
| |||||||
Class 1* | Class 3* | |||||||
1-year | 9.57% | 9.32% | ||||||
5-year | N/A | 8.53% | ||||||
10-year | N/A | N/A | ||||||
Since Inception | 9.01% | 7.77% | ||||||
| * | Inception date for Class 1: 09/26/16; Class 3: 10/15/12. |
| 1 | The S&P 500® Managed Risk Index — Moderate is designed to simulate a dynamic protective portfolio that allocates between the underlying equity index and cash, based on realized volatilities of the underlying equity and bond indices, while maintaining a fixed allocation to the underlying bond index. |
Note: The performance data quoted represents past performance; past performance does not guarantee future results; the investment return and principal value of an investment will fluctuate so that an investor’s shares, when redeemed, may be worth more or less than their original cost; current performance may be lower or higher than the performance data quoted. Please visit aig.com/annuities for performance data current to the most recent month-end.
The SA American Funds VCP Managed Allocation Portfolio — Class 3 (Feeder Fund) returned 9.32% for the twelve months ended December 31, 2020. The S&P 500® Managed Risk Index — Moderate Index increased 6.83% over the same period. The American Funds Insurance Series® Managed Risk Growth-Income Fund — Class P1 (Master Fund) returned 9.85% for the period.
The SA American Funds VCP Managed Allocation Portfolio is a Feeder Fund investing in shares of American Funds Insurance Series® Managed Risk Growth-Income Fund (Master Fund). The Master Fund pursues its objective by investing in shares of American Funds Insurance Series® Growth-Income Fund and American Funds Insurance Series® Bond Fund while seeking to manage portfolio volatility and provide downside protection, primarily through the use of exchange-traded futures. The benefit of the Master Fund’s managed risk strategy should be most apparent during periods of high volatility and in down markets. In steady or rising markets, the Master Fund’s results can be expected to lag those of the Master Fund’s underlying fund.
The underlying American Funds Insurance Series® Growth-Income Fund’s stock selection in the communication services sector was a top contributor to relative returns, while stock selection in the information technology sector detracted from relative results.
| ||
| 42 |
Table of Contents
SUNAMERICA SERIES TRUST
December 31, 2020 (unaudited)
Filed under Rules 497(e) and 497(k)
Registration No. 33-52742
SunAmerica Series Trust
SA American Funds Asset Allocation Portfolio
SA American Funds VCP Managed Allocation Portfolio
(each, a “Portfolio,” and together, the “Portfolios”)
Supplement dated November 12, 2020
to the Portfolios’ Summary Prospectus and Prospectus dated
May 1, 2020, as supplemented and amended to date
Capital Group portfolio manager James R. Mulally has announced his intention to retire effective March 31, 2021. Accordingly, effective March 31, 2021, all references to Mr. Mulally will be deleted from the Portfolios’ Prospectus and Summary Prospectuses.
Capitalized terms used but not defined herein shall have the meanings assigned to them by the Prospectus.
PLEASE RETAIN THIS SUPPLEMENT FOR FUTURE REFERENCE.
| ||
| 43 |
Table of Contents
SUNAMERICA SERIES TRUST
SUPPLEMENTS TO THE PROSPECTUS
December 31, 2020 (unaudited) (continued)
Filed under Rules 497(e) and 497(k)
Registration No. 33-52742
SunAmerica Series Trust
SA American Funds Growth Portfolio
(the “Portfolio”)
Supplement dated November 12, 2020
to the Portfolio’s Summary Prospectus and Prospectus dated
May 1, 2020, as supplemented and amended to date
Michael T. Kerr has retired from Capital Group and is no longer acting as a portfolio manager of the American Funds Insurance Series® Growth Fund (the “Master Growth Fund”). Accordingly, all references to Mr. Kerr on the Portfolio’s Summary Prospectus and Prospectus are hereby deleted. Dylan Yolles has been named portfolio manager of the Master Growth Fund. Effective immediately, in the section of the Summary Prospectus entitled “Investment Adviser” and in the section of the Prospectus entitled “Portfolio Summary: SA American Funds Growth Portfolio – Investment Adviser,” in the table under the heading “Portfolio Managers” the following information is added:
Name and Title | Portfolio Manager of Master Growth Fund Since | |
Dylan Yolles | 2020 | |
In the section of the Prospectus entitled “Management,” under the heading “Portfolio Management of the Master Funds,” the following paragraph is added under “Master Growth Fund Team Members”:
Dylan Yolles is an equity portfolio manager at Capital Group. He has 22 years of investment experience and has been with Capital Group for 20 years. Earlier in his career, as an equity investment analyst at Capital, he covered U.S. and European software companies, as well as U.S. and Canadian railroads. Before joining Capital, Mr. Yolles was a select fund portfolio manager and an equity analyst covering software, chemicals, gaming and lodging at Fidelity in Boston. Mr. Yolles holds an MBA from Stanford Graduate School of Business and a bachelor’s degree from Stanford University. Mr. Yolles is based in Los Angeles.
Capitalized terms used but not defined herein shall have the meanings assigned to them by the Prospectus.
PLEASE RETAIN THIS SUPPLEMENT FOR FUTURE REFERENCE.
| ||
| 44 |
Table of Contents
Past performance is no guarantee of future results.
Securities listed may or may not be a part of current Portfolio construction.
| ||
| 45 |
Table of Contents
SUNAMERICA SERIES TRUST
VOTING PROXIES ON TRUST PORTFOLIO SECURITIES
A description of the policies and procedures that the Trust uses to determine how to vote proxies related to securities held in the Trust‘s Portfolios which is available in the Trust‘s Statement of Additional Information, may be obtained without charge upon request, by calling (800) 445-SUN2. This information is also available from the EDGAR database on the U.S. Securities and Exchange Commission‘s website at http://www.sec.gov.
PROXY VOTING RECORD ON TRUST PORTFOLIO SECURITIES
Information regarding how the SunAmerica Series Trust Portfolios voted proxies relating to securities held in the Trust‘s Portfolios during the most recent twelve month period ended June 30 is available, once filed with the U.S. Securities and Exchange Commission, without charge, upon request, by calling (800) 445-SUN2 or on the U.S. Securities and Exchange Commission‘s website at http://www.sec.gov.
DISCLOSURE OF QUARTERLY PORTFOLIO HOLDINGS
The Trust is required to file its complete schedule of portfolio holdings with the U.S. Securities and Exchange Commission for the first and third quarters of each fiscal year on Form N-PORT. The Trust’s Forms N-PORT are available on the U.S. Securities and Exchange Commission’s website at http://www.sec.gov.
This report is submitted solely for the general information of shareholders of the Trust. Distribution of this report to persons other than shareholders of the Trust is authorized only in connection with a currently effective prospectus, setting forth details of the Trust, which must precede or accompany this report.
| ||
| 46 |
Table of Contents
Annuity Service Center P.O. Box 15570 Amarillo, TX 79105-5570
CHANGE SERVICE REQUESTED |

THISREPORTISNOTAUTHORIZEDFORDISTRIBUTIONTOPROSPECTIVEPURCHASERSUNLESSACCOMPANIEDORPRECEDEDBYACURRENTPROSPECTUS.
R4397AR.14 (2/21)
Table of Contents
Table of Contents
American Funds Insurance Series, by Capital Group, is the underlying investment vehicle for many variable annuities and insurance products. For nearly 90 years, Capital Group has invested with a long-term focus based on thorough research and attention to risk.
Investing for short periods makes losses more likely. For current information and month-end results, visit capitalgroup.com/afis. For information about your insurance contract and month-end results, go to the website of the company that issued your contract.
Investing outside the United States involves risks, such as currency fluctuations, periods of illiquidity and price volatility, as more fully described in the prospectus. These risks may be heightened in connection with investments in developing countries. Investing in small-capitalization stocks can involve greater risk than is customarily associated with investing in stocks of larger, more established companies. The return of principal for bond funds and for funds with significant underlying bond holdings is not guaranteed. Fund shares are subject to the same interest rate, inflation and credit risks associated with the underlying bond holdings. High-yield bonds are subject to greater fluctuations in value and risk of loss of income and principal than investment-grade bonds. Bond ratings, which typically range from AAA/Aaa (highest) to D (lowest), are assigned by credit rating agencies such as Standard & Poor’s, Moody’s and/or Fitch as an indication of an issuer’s creditworthiness. Futures may not provide an effective hedge of the underlying securities because changes in the prices of futures may not track those of the securities they are intended to hedge. In addition, the managed risk strategy may not effectively protect the funds from market declines and will limit the funds’ participation in market gains. The use of the managed risk strategy could cause the funds’ returns to lag those of the applicable underlying funds in certain rising market conditions. Refer to the funds’ prospectuses and the Risk Factors section of this report for more information on these and other risks associated with investing in the funds.
Investments are not FDIC-insured, nor are they deposits of or guaranteed by a bank or any other entity, so they may lose value.
Table of Contents
Fellow investors:
Global stocks, as measured by the MSCI ACWI (All Country World Index),1,2 rose 16.25% in the face of a deadly pandemic, boosted by massive government stimulus measures and the rapid development of coronavirus vaccines. In a year marked by unprecedented volatility, stocks declined sharply from February to March, followed by a remarkable nine-month rally that lifted many market indexes to all-time highs. Technology stocks led markets higher, gaining more than 40%, followed closely by consumer discretionary stocks. Digitally focused companies prospered as millions of homebound customers switched to online services for food, entertainment and other basic needs. Conversely, energy stocks and travel-related stocks plummeted as government-imposed lockdowns brought the global economy to a crawl.
U.S. equities showed resilience during a volatile year that included civil unrest and a contentious presidential election on top of pandemic-related pressures, ending the year at all-time highs, with an increase of 21.37% recorded by the MSCI USA Index1,3. Massive stimulus helped calm markets even as government restrictions aimed at curbing the spread of COVID-19 brought segments of the economy to a near standstill. In March, Congress passed the $2 trillion CARES Act, which included aid for individuals and businesses most economically impacted by the pandemic. A $900 billion stimulus package followed
in December, after COVID-19 cases accelerated in the fall. The Federal Reserve cut rates 150 basis points in March, bringing the lower range of its target rate near zero for the first time since 2015.
European stocks declined in local currency terms as the eurozone economy suffered the effects of government-imposed lockdowns and a severe recession. Italy was struck hard and early by COVID-19, which then spread quickly throughout the continent, crippling key industries including tourism, banking and aircraft manufacturing. Overall, the MSCI Europe Index1,4 fell 2.21% in local currency terms. However, in U.S. dollar terms, the index registered a 5.38% gain as a weak dollar provided a currency tailwind to international equity markets. Elsewhere among developed markets, the Japanese economy entered its first recession since 2015 as the pandemic exacerbated a slowdown that began in late 2019. The Summer Olympics in Tokyo were postponed to 2021, dealing another blow to the economy. The MSCI Japan Index1,5 gained 14.48% over the year.
Emerging markets posted solid gains for a second consecutive year, led by China’s economic rebound and the technology-export-driven economies of Taiwan and South Korea. A weakening U.S. dollar and strengthening prices for industrial metals and oil further boosted gains, which were
All market returns referenced in this report are unmanaged and, therefore, have no expenses. Investors cannot invest directly in an index. Country returns are based on MSCI indexes, which reflect reinvestment of distributions and dividends net of withholding taxes, except for the MSCI USA Index, which reflects dividends gross of withholding taxes. Source: MSCI.
| 1 | Source: MSCI. |
| 2 | The MSCI ACWI is a free float-adjusted market capitalization-weighted index that is designed to measure equity market results in the global developed and emerging markets, consisting of more than 40 developed and emerging market country indexes. Results reflect dividends gross of withholding taxes through December 31, 2000, and dividends net of withholding taxes thereafter. |
| 3 | The MSCI USA Index is a free float-adjusted, market capitalization-weighted index that is designed to measure the U.S. portion of the world market. Results reflect dividends gross of withholding taxes. |
| 4 | MSCI Europe Index is a free float-adjusted market capitalization-weighted index that is designed to measure results of more than 10 developed equity markets in Europe. Results reflect dividends net of withholding taxes. |
| 5 | MSCI Japan Index is a free float-adjusted market capitalization-weighted index that is designed to measure the equity market results of Japan. Results reflect dividends net of withholding taxes. |
American Funds Insurance Series 1
Table of Contents
led by the information technology and health care sectors. Overall, the MSCI Emerging Markets Investable Market Index1,6 bounced back from steep losses in early 2020 to finish up 18.39% for the year. Being the first country to shut down its economy and the first to reopen during the pandemic, China led the global economic rebound after quarantine measures there eased.
Government bonds advanced as central banks around the world slashed interest rates and ramped up stimulus programs in an attempt to counter the damaging effects of the pandemic. The U.S. Federal Reserve cut rates to near zero in March, launched an array of emergency lending programs, and expanded an aggressive asset purchase program. The Bloomberg Barclays U.S. Corporate Investment Grade Index7,8 and the Bloomberg Barclays U.S. Corporate High Yield 2% Issuer Capped Index7,9 gained 9.89% and 7.05%, respectively. More broadly, the Bloomberg Barclays Global Aggregate Index7,10 was up 9.20%, while the Bloomberg Barclays U.S. Aggregate Index7,11 advanced 7.51%. The J.P. Morgan Emerging Markets Bond Index7,12 – Global gained 5.88%.
In foreign exchange markets, the U.S. dollar fell against the euro, the yen and most other currencies. Signaling a
potential end to about a decade of dollar strength, the euro rose 9.00% against the greenback. Late in the year, the British pound staged a strong rally as Brexit negotiators approved a new trade agreement governing the relationship between the United Kingdom and the European Union.
Looking ahead
The future path for stocks remains difficult to predict, as always. Investors are currently counting on a strong economic recovery as vaccines roll out and reduce the impact of the coronavirus. They are also counting on a continuation of supportive fiscal and monetary policies from the government, with low, accommodative interest rates. We expect these assumptions to hold true, and that we will find plenty of attractive securities in this environment. Digital-enabled business trends have been accelerated due to the pandemic, and many old-technology businesses should improve as the recovery continues, so there is much to be excited about.
However, we must keep in mind that these conditions are not guaranteed. New variants of the virus may cause a temporary stall, and if interest rates rise too much, there may be a concomitant decrease in the valuation of stocks. So, we will be watching carefully as we execute
our investment approach, which seeks to appropriately balance risk and return. New individual investors attracted by the strong recent results of the stock market may be surprised when a patch of volatility inevitably recurs — but with our long history and investment horizon, we will view any such occurrences as opportunities.
Our time-tested process, based on extensive research, a long-term outlook and close attention to valuation, has served investors well over time, and will continue. As always, we thank you for your continued support of our efforts and we look forward to reporting to you again in six months.
Sincerely,

Donald D. O’Neal
Co-President

Alan N. Berro
Co-President
February 12, 2021
| 6 | MSCI Emerging Markets Investable Market Index (IMI) is a free float-adjusted market capitalization weighted index that is designed to measure results of the large-, mid-, and small-capitalization segments of more than 20 emerging equity markets. Results reflect dividends net of withholding taxes. |
| 7 | Source: Bloomberg Index Services Ltd. |
| 8 | Bloomberg Barclays U.S. Corporate Investment Grade Index represents the universe of investment grade, publicly issued U.S. corporate and specified foreign debentures and secured notes that meet the specified maturity, liquidity, and quality requirements. |
| 9 | Bloomberg Barclays U.S. Corporate High Yield 2% Issuer Capped Index covers the universe of fixed-rate, non-investment-grade debt. The index limits the maximum exposure of any one issuer to 2%. |
| 10 | Bloomberg Barclays Global Aggregate Index represents the global investment-grade fixed income markets. |
| 11 | Bloomberg Barclays U.S. Aggregate Index represents the U.S. investment-grade fixed-rate bond market. |
| 12 | JP Morgan Emerging Markets Bond Index – Global tracks total returns for U.S. dollar-denominated debt instruments issued by emerging markets sovereign and quasi-sovereign entities, including Brady bonds, loans and Eurobonds. |
2 American Funds Insurance Series
Table of Contents
About the series
Unless otherwise indicated, American Funds Insurance Series investment results are for Class 1 shares (Class P1 shares for managed risk funds). Class 1A shares began operations on January 6, 2017. Class 2 shares began operations on April 30, 1997. Class 3 shares began operations on January 16, 2004. Class 4 shares began operations on December 14, 2012. Results encompassing periods prior to those dates assume a hypothetical investment in Class 1 shares and include the deduction of additional annual expenses (0.25% for Class 1A shares, 0.25% for Class 2 shares, 0.18% for Class 3 shares and 0.50% for Class 4 shares).
The variable annuities and life insurance contracts that use the series’ funds contain certain fees and expenses not reflected in this report. Investment results assume all distributions are reinvested and reflect applicable fees and expenses. When applicable, investment results reflect fee waivers and/or expense reimbursements, without which results would have been lower. Visit capitalgroup.com for more information.
For New World Fund, Capital Income Builder, Capital World Bond Fund and American Funds Mortgage Fund, the investment adviser is currently waiving a portion of its management fee equal to 0.18%, 0.26%, 0.10% and 0.18%, respectively, of each fund’s net assets. This waiver will be in effect through at least May 1, 2021. The waiver may only be modified or terminated with the approval of the series’ board. Applicable fund results shown reflect the waivers, without which results would have been lower. See the Financial Highlights tables in this report for details.
For the managed risk funds, the investment adviser is currently waiving a portion of its management fee equal to 0.05% of each fund’s net assets. In addition, the investment adviser is currently reimbursing a portion of other expenses for Managed Risk International Fund. The waivers and reimbursement will be in effect through at least May 1, 2021, unless modified or terminated by the series’ board. After that time, the investment adviser may elect to extend, modify or terminate the reimbursement. The waivers may only be modified or terminated with the approval of the series’ board. Applicable fund results shown reflect the waivers and reimbursement, without which results would have been lower. See the Financial Highlights tables in this report for details.
The Managed Risk Growth Fund pursues its objective by investing in shares of American Funds Insurance Series — Growth FundSM and American Funds Insurance Series — Bond FundSM. The Managed Risk International Fund pursues its objective by investing in shares of American Funds Insurance Series — International FundSM and American Funds Insurance Series — Bond FundSM. The Managed Risk Blue Chip Income and Growth Fund pursues its objective by investing in shares of American Funds Insurance Series — Blue Chip Income and Growth FundSM and American Funds Insurance Series — U.S. Government/AAA-Rated Securities FundSM. The Managed Risk Growth-Income Fund pursues its objective by investing in shares of American Funds Insurance Series — Growth-Income FundSM and American Funds Insurance Series — Bond FundSM. The Managed Risk Asset Allocation Fund pursues its objective by investing in shares of American Funds Insurance Series — Asset Allocation FundSM. The funds seek to manage portfolio volatility and provide downside protection, primarily through the use of exchange-traded futures. The benefit of the funds’ managed risk strategy should be most apparent during periods of high volatility and in down markets. In steady or rising markets, the funds’ results can be expected to lag those of the underlying fund.
Funds are listed in the report as follows: equity, balanced, fixed income and managed risk.
American Funds Insurance Series 3
Table of Contents
Global Growth Fund
Fund results shown are for past periods and are not predictive of results for future periods. Current and future results may be lower or higher than those shown. Prices and returns will vary, so investors may lose money. Investing for short periods makes losses more likely. For current information and month-end results, visit capitalgroup.com/afis. For information about your insurance contract and month-end results, go to the website of the company that issued your contract.
Global Growth Fund advanced 30.79% for the 12 months ended December 31, 2020, compared with a 16.25% increase in its benchmark index, MSCI ACWI (All Country World Index),1 a free float-adjusted market capitalization-weighted index that is designed to measure equity market results in the global developed and emerging markets, consisting of more than 40 developed and emerging market country indexes.
Global stocks rose in the face of a deadly pandemic, boosted by massive government stimulus measures and the rapid development of coronavirus vaccines. In a year marked by unprecedented volatility, stocks declined sharply from February to March, followed by a remarkable nine-month rally that lifted many market indexes to all-time highs. U.S. equities also ended 2020 at record highs, showing resilience during a volatile year that included a pandemic-induced recession, a sharp bear market, civil unrest and a contentious presidential election. European stocks declined in local currency terms as the eurozone economy suffered the effects of government-imposed lockdowns and a severe recession. Emerging markets posted solid gains for a second consecutive year, led by China’s economic rebound and the technology-export-driven economies of Taiwan and South Korea.
Stock selection and allocation within the information technology sector were large relative return drivers. The fund’s relative weightings in ASML and TSMC benefitted the fund as both outpaced the wider market and were among the top contributors to the fund’s relative returns. Consumer discretionary stock Amazon also helped the fund’s relative returns, as its returns outpaced the market.
The biggest drag on relative results was Apple — a stock the fund didn’t own — as it proved to be one of the strongest performers for the year.
On a geographic basis, stocks of companies domiciled in the United States and the Netherlands were additive to results, while stocks of companies based in France and Switzerland detracted.
The fund’s portfolio managers are optimistic they will continue to find good companies globally that offer high quality products, and whose values are not yet fully reflected in their share prices.
4 American Funds Insurance Series
Table of Contents
Global Growth Fund (continued)
How a hypothetical $10,000 investment has grown
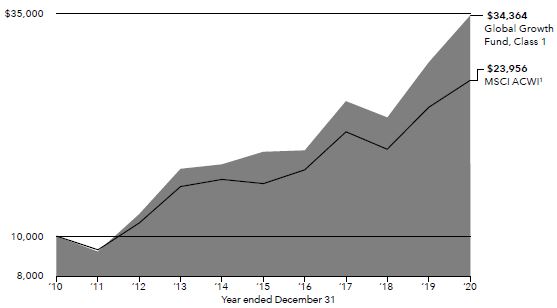
Total returns based on a $1,000 investment For periods ended December 31, 20202
| 1 year | 5 years | 10 years | Lifetime (since April 30, 1997) | Expense ratio | ||||||||||||||||
Class 1 | 30.79 | % | 16.55 | % | 13.14 | % | 11.01 | % | .56 | % | ||||||||||
Class 1A | 30.49 | 16.27 | 12.86 | 10.74 | .81 | |||||||||||||||
Class 2 | 30.47 | 16.26 | 12.86 | 10.74 | .81 | |||||||||||||||
Class 4 | 30.17 | 15.96 | 12.62 | 10.48 | 1.06 | |||||||||||||||
Investment results assume all distributions are reinvested and reflect applicable fees and expenses. When applicable, investment results reflect fee waivers and/or expense reimbursements, without which results would have been lower. Visit capitalgroup.com for more information. Expense ratios are as of the fund’s prospectus dated May 1, 2021 (unaudited). See the Financial Highlights table in this report for details.
Any market index shown is unmanaged and, therefore, has no expenses. Investors cannot invest directly in an index.
| 1 | Source: MSCI. The MSCI index result reflects dividends net of withholding taxes and reinvestment of distributions. |
| 2 | Periods greater than one year are annualized. |
| Where the fund’s assets were invested as of December 31, 2020 | Percent of net assets |
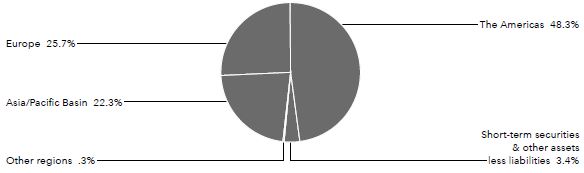
American Funds Insurance Series 5
Table of Contents
Global Small Capitalization Fund
Fund results shown are for past periods and are not predictive of results for future periods. Current and future results may be lower or higher than those shown. Prices and returns will vary, so investors may lose money. Investing for short periods makes losses more likely. For current information and month-end results, visit capitalgroup.com/afis. For information about your insurance contract and month-end results, go to the website of the company that issued your contract.
Global Small Capitalization Fund increased 30.04% for the 12 months ended December 31, 2020. Its benchmark, the MSCI All Country World Small Cap Index,1 a free float-adjusted market capitalization-weighted index designed to measure equity market results of smaller capitalization companies in both developed and emerging markets, gained 16.33%.
Global stocks rose in the face of a deadly pandemic, boosted by massive government stimulus measures and the rapid development of coronavirus vaccines. In a year marked by unprecedented volatility, stocks declined sharply from February to March, followed by a remarkable nine-month rally that lifted many market indexes to all-time highs. U.S. equities also ended 2020 at record highs, showing resilience during a volatile year that included a pandemic-induced recession, a sharp bear market, civil unrest and a contentious presidential election. European stocks declined in local currency terms as the eurozone economy suffered the effects of government-imposed lockdowns and a severe recession. Emerging markets posted solid gains for a second consecutive year, led by China’s economic rebound and the technology-export-driven economies of Taiwan and South Korea.
Fund holdings in the information technology and financial sectors contributed the most to relative returns. Information technology stock Cree widely outpaced the broader market and was among the fund’s top contributors over the period. However, the fund’s holdings of health care company Cortexyme detracted from returns.
While investments in U.S. companies were additive to returns, investments in companies domiciled in Brazil detracted.
The fund’s portfolio managers continue to seek investment opportunities in undervalued companies that have the potential to change industries and benefit shareholders. They believe rigorous bottom-up research into each potential equity investment can help achieve this goal. The fund currently holds more than 250 companies diversified across geographies and industries. As always, we maintain our commitment to investing for the long term.
6 American Funds Insurance Series
Table of Contents
Global Small Capitalization Fund (continued)
How a hypothetical $10,000 investment has grown
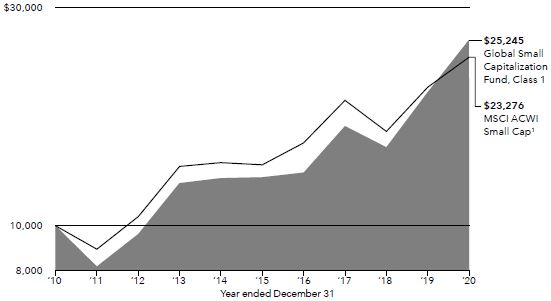
Total returns based on a $1,000 investment For periods ended December 31, 20202
| 1 year | 5 years | 10 years | Lifetime (since April 30, 1998) | Expense ratio | ||||||||||||||||
Class 1 | 30.04 | % | 14.71 | % | 9.70 | % | 10.53 | % | 74 | % | ||||||||||
Class 1A | 29.72 | 14.45 | 9.44 | 10.25 | .99 | |||||||||||||||
Class 2 | 29.72 | 14.43 | 9.43 | 10.25 | .99 | |||||||||||||||
Class 4 | 29.39 | 14.15 | 9.17 | 9.98 | 1.24 | |||||||||||||||
Investment results assume all distributions are reinvested and reflect applicable fees and expenses. When applicable, investment results reflect fee waivers and/or expense reimbursements, without which results would have been lower. Visit capitalgroup.com for more information. Expense ratios are as of the fund’s prospectus dated May 1, 2021 (unaudited). See the Financial Highlights table in this report for details.
Any market index shown is unmanaged and, therefore, has no expenses. Investors cannot invest directly in an index.
| 1 | Source: MSCI. The MSCI index result reflects dividends net of withholding taxes and reinvestment of distributions. |
| 2 | Periods greater than one year are annualized. |
| Where the fund’s assets were invested as of December 31, 2020 | Percent of net assets |
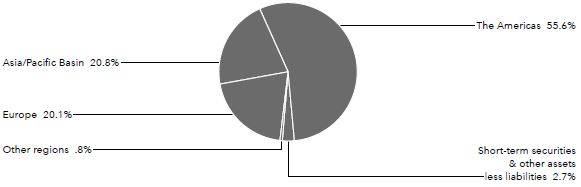
American Funds Insurance Series 7
Table of Contents
Growth Fund
Fund results shown are for past periods and are not predictive of results for future periods. Current and future results may be lower or higher than those shown. Prices and returns will vary, so investors may lose money. Investing for short periods makes losses more likely. For current information and month-end results, visit capitalgroup.com/afis. For information about your insurance contract and month-end results, go to the website of the company that issued your contract.
Growth Fund gained 52.45% for the 12 months ended December 31, 2020, compared with a 18.40% increase in its benchmark index, Standard & Poor’s 500 Composite Index,1 a market capitalization-weighted index based on the results of approximately 500 widely held common stocks.
U.S. equities ended 2020 at record highs, showing resilience during a volatile year that included a pandemic-induced recession, a sharp bear market, civil unrest and a contentious presidential election. Information technology, consumer discretionary and communication services stocks that benefited from stay-at-home restrictions led markets, including Amazon and Netflix. Overall, the information technology sector rose 44%, while consumer discretionary and communication services gained 33% and 24%, respectively. Energy lagged all other sectors, declining 34%. The significant reduction in travel reduced the demand for oil, which was briefly priced below $0 for the first time in history amid fears of dwindling storage capacity. The real estate and financials sectors were also negative for the year, each declining 2%.
The fund’s top contributors in relative terms were the consumer discretionary and communication services sectors. Investments in Tesla and Netflix were additive to relative results. Tesla’s shares soared as founder Elon Musk’s effort to bring electric vehicles into the mainstream gained traction, transforming the company’s underlying financial performance.
On the downside, investments in Suncor Energy and MTU Aero Engines detracted from relative returns. The fund’s significantly lower-than-benchmark position in Apple, which proved to be a high-performing stock, also detracted from relative returns.
Although U.S. economic growth remained solid, the fund’s portfolio managers are keeping a close watch on the impact of COVID-recovery and stimulus measures on economic indicators. Portfolio managers continue to favor well-positioned companies with capital appreciation potential that are capable of generating outstanding returns in myriad near-term economic environments. They also remain optimistic that our global research will help us identify attractive long-term investment opportunities.
8 American Funds Insurance Series
Table of Contents
Growth Fund (continued)
How a hypothetical $10,000 investment has grown
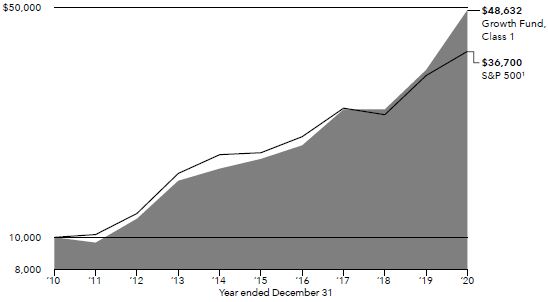
Total returns based on a $1,000 investment For periods ended December 31, 20202
| 1 year | 5 years | 10 years | Lifetime (since February 8, 1984) | Expense ratio | ||||||||||||||||
Class 1 | 52.45 | % | 23.06 | % | 17.14 | % | 13.85 | % | .36 | % | ||||||||||
Class 1A | 52.07 | 22.76 | 16.85 | 13.56 | .61 | |||||||||||||||
Class 2 | 52.10 | 22.75 | 16.85 | 13.56 | .61 | |||||||||||||||
Class 3 | 52.20 | 22.83 | 16.93 | 13.64 | .54 | |||||||||||||||
Class 4 | 51.71 | 22.44 | 16.57 | 13.28 | .86 | |||||||||||||||
Investment results assume all distributions are reinvested and reflect applicable fees and expenses. When applicable, investment results reflect fee waivers and/or expense reimbursements, without which results would have been lower. Visit capitalgroup.com for more information. Expense ratios are as of the fund’s prospectus dated May 1, 2021 (unaudited). See the Financial Highlights table in this report for details.
Any market index shown is unmanaged and, therefore, has no expenses. Investors cannot invest directly in an index.
| 1 | Source: S&P Dow Jones Indices LLC. |
| 2 | Periods greater than one year are annualized. |
| Where the fund’s assets were invested as of December 31, 2020 | Percent of net assets |
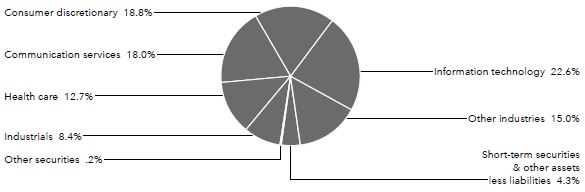
American Funds Insurance Series 9
Table of Contents
International Fund
Fund results shown are for past periods and are not predictive of results for future periods. Current and future results may be lower or higher than those shown. Prices and returns will vary, so investors may lose money. Investing for short periods makes losses more likely. For current information and month-end results, visit capitalgroup.com/afis. For information about your insurance contract and month-end results, go to the website of the company that issued your contract.
International Fund advanced 14.28% for the 12 months ended December 31, 2020, compared with a 10.65% increase in its benchmark index, MSCI ACWI (All Country World Index) ex USA,1 a free float-adjusted market capitalization-weighted index that is designed to measure equity market results in the global developed and emerging markets (consisting of more than 40 developed and emerging market country indexes, excluding the U.S.).
Global stocks rose in the face of a deadly pandemic, boosted by massive government stimulus measures and the rapid development of coronavirus vaccines. In a year marked by unprecedented volatility, stocks declined sharply from February to March, followed by a remarkable nine-month rally that lifted many market indexes to all-time highs. U.S. equities also ended 2020 at record highs, showing resilience during a volatile year that included a pandemic-induced recession, a sharp bear market, civil unrest and a contentious presidential election. European stocks declined in local currency terms as the eurozone economy suffered the effects of government-imposed lockdowns and a severe recession. Emerging markets posted solid gains for a second consecutive year, led by China’s economic rebound and the technology-export-driven economies of Taiwan and South Korea.
Investments in the consumer discretionary and health care sectors boosted relative returns. MercadoLibre, the leading e-commerce site for Latin America, was among the top contributors as shares surged to fresh highs while the COVID-19 pandemic drove the adoption of online shopping in Latin America. On the downside, some investments in the industrials sector hindered relative returns. In particular, Airbus was a top relative detractor.
The fund’s portfolio managers continue to monitor volatility and potential headwinds brought about by political and trade uncertainty. Given how late it may be in the current bull market, they seek opportunities especially in regions, countries and sectors less affected by these global headlines. Their focus on a company’s fundamental growth drivers and intrinsic worth is critical to helping them identify investments that they believe represent the best value over the long term.
10 American Funds Insurance Series
Table of Contents
International Fund (continued)
How a hypothetical $10,000 investment has grown
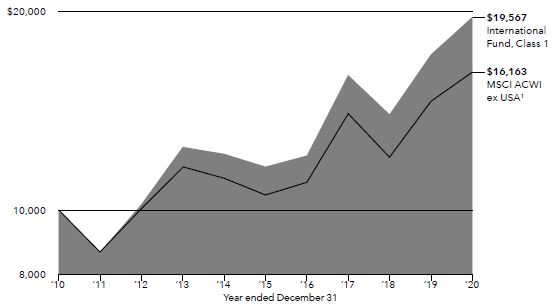
Total returns based on a $1,000 investment For periods ended December 31, 20202
| 1 year | 5 years | 10 years | Lifetime (since May 1, 1990) | Expense ratio | ||||||||||||||||
Class 1 | 14.28 | % | 11.00 | % | 6.94 | % | 8.40 | % | .55 | % | ||||||||||
Class 1A | 13.96 | 10.73 | 6.68 | 8.13 | .80 | |||||||||||||||
Class 2 | 13.97 | 10.73 | 6.68 | 8.13 | .80 | |||||||||||||||
Class 3 | 14.00 | 10.79 | 6.75 | 8.21 | .73 | |||||||||||||||
Class 4 | 13.66 | 10.45 | 6.43 | 7.87 | 1.05 | |||||||||||||||
Investment results assume all distributions are reinvested and reflect applicable fees and expenses. When applicable, investment results reflect fee waivers and/or expense reimbursements, without which results would have been lower. Visit capitalgroup.com for more information. Expense ratios are as of the fund’s prospectus dated May 1, 2021 (unaudited). See the Financial Highlights table in this report for details.
Any market index shown is unmanaged and, therefore, has no expenses. Investors cannot invest directly in an index.
| 1 | Source: MSCI. The MSCI index result reflects dividends net of withholding taxes and reinvestment of distributions. |
| 2 | Periods greater than one year are annualized. |
| Where the fund’s assets were invested as of December 31, 2020 | Percent of net assets |
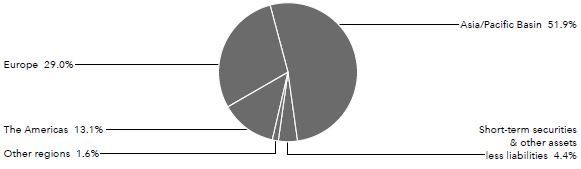
American Funds Insurance Series 11
Table of Contents
New World Fund®
Fund results shown are for past periods and are not predictive of results for future periods. Current and future results may be lower or higher than those shown. Prices and returns will vary, so investors may lose money. Investing for short periods makes losses more likely. For current information and month-end results, visit capitalgroup.com/afis. For information about your insurance contract and month-end results, go to the website of the company that issued your contract.
New World Fund was up 23.89% for the 12 months ended December 31, 2020. Its benchmark index, the MSCI ACWI (All Country World Index),1 a free float-adjusted market capitalization-weighted index that is designed to measure equity market results in the global developed and emerging markets (consisting of more than 40 developed and emerging market country indexes), was up 16.25%. The MSCI Emerging Markets (EM) Index,1 a free float-adjusted market capitalization-weighted index that is designed to measure equity market results in the global emerging markets (consisting of more than 20 emerging market country indexes), increased by 18.31%.
Global stocks rose in the face of a deadly pandemic, boosted by massive government stimulus measures and the rapid development of coronavirus vaccines. In a year marked by unprecedented volatility, stocks declined sharply from February to March, followed by a remarkable nine-month rally that lifted many market indexes to all-time highs. U.S. equities also ended 2020 at record highs, showing resilience during a volatile year that included a pandemic-induced recession, a sharp bear market, civil unrest and a contentious presidential election. European stocks declined in local currency terms as the eurozone economy suffered the effects of government-imposed lockdowns and a severe recession. Emerging markets posted solid gains for a second consecutive year, led by China’s economic rebound and the technology-export-driven economies of Taiwan and South Korea.
The fund’s relative returns outpaced emerging markets in general. Investments in the communication services and consumer staples sectors were beneficial to the fund. MercadoLibre, the leading e-commerce site for Latin America, was among the top contributors as shares surged to fresh highs while the COVID-19 pandemic drove the adoption of online shopping in Latin America. On the downside, a position in Societe Generale detracted from relative returns, as its performance lagged the general market.
The fund’s portfolio managers continue to pursue a bottom-up approach to investing and search for undervalued companies with solid foundations around the world, as well as stocks that are domestically focused and more insulated from geopolitical events given increased volatility at this point in the market cycle.
12 American Funds Insurance Series
Table of Contents
New World Fund® (continued)
How a hypothetical $10,000 investment has grown
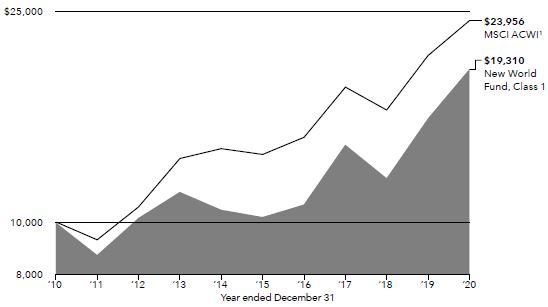
Total returns based on a $1,000 investment For periods ended December 31, 20202
| 1 year | 5 years | 10 years | Lifetime (since June 17, 1999) | Gross expense ratio | Net expense ratio | |||||||||||||||||||
Class 1 | 23.89 | % | 13.62 | % | 6.80 | % | 9.16 | % | .77 | % | .59 | % | ||||||||||||
Class 1A | 23.63 | 13.34 | 6.54 | 8.89 | 1.02 | .84 | ||||||||||||||||||
Class 2 | 23.58 | 13.33 | 6.54 | 8.89 | 1.02 | .84 | ||||||||||||||||||
Class 4 | 23.29 | 13.05 | 6.28 | 8.62 | 1.27 | 1.09 | ||||||||||||||||||
Investment results assume all distributions are reinvested and reflect applicable fees and expenses. The investment adviser is currently waiving a portion of its management fee. This waiver will be in effect through at least May 1, 2021. The waiver may only be modified or terminated with the approval of the series’ board. When applicable, investment results reflect fee waivers and/or expense reimbursements, without which results would have been lower. Visit capitalgroup.com for more information. Expense ratios are as of the fund’s prospectus dated May 1, 2021 (unaudited). See the Financial Highlights table in this report for details.
Any market index shown is unmanaged and, therefore, has no expenses. Investors cannot invest directly in an index.
| 1 | Source: MSCI. Results for MSCI indexes reflect dividends net of withholding taxes and reinvestment of distributions. |
| 2 | Periods greater than one year are annualized. |
| Where the fund’s assets were invested as of December 31, 2020 | Percent of net assets |
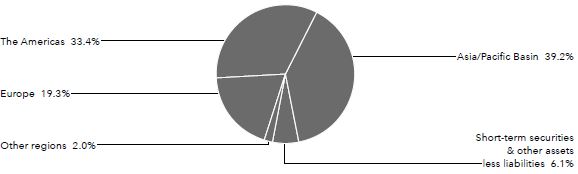
American Funds Insurance Series 13
Table of Contents
Blue Chip Income and Growth Fund
Fund results shown are for past periods and are not predictive of results for future periods. Current and future results may be lower or higher than those shown. Prices and returns will vary, so investors may lose money. Investing for short periods makes losses more likely. For current information and month-end results, visit capitalgroup.com/afis. For information about your insurance contract and month-end results, go to the website of the company that issued your contract.
Blue Chip Income and Growth Fund gained 9.04% for the 12 months ended December 31, 2020, trailing the 18.40 % rise in its benchmark index, Standard & Poor’s 500 Composite Index,1 a market capitalization-weighted index based on the results of approximately 500 widely held common stocks.
U.S. equities ended 2020 at record highs, showing resilience during a volatile year that included a pandemic-induced recession, a sharp bear market, civil unrest and a contentious presidential election. Information technology, consumer discretionary and communication services stocks that benefited from stay-at-home restrictions led markets, including Amazon and Netflix. Overall, the information technology sector rose 44%, while consumer discretionary and communication services gained 33% and 24%, respectively. Energy lagged all other sectors, declining 34%. The significant reduction in travel reduced the demand for oil, which was briefly priced below $0 for the first time in history amid fears of dwindling storage capacity. The real estate and financials sectors were also negative for the year, each declining 2%.
Among the fund’s top contributors to relative returns was Broadcom. The semiconductor and wireless company added the most to relative returns, boosted by strong financial results, including revenues of $23.9 billion in fiscal 2020, up 6% over fiscal 2019. Another top contributor was Carrier Global, where sales growth was largely driven by record demand for residential HVAC products in North America.
On the downside, investments in the energy sector were a drag on results. Energy lagged all other sectors as a significant reduction in travel reduced the demand for oil, which was briefly priced below $0 for the first time in history over fears of dwindling storage capacity. Within the sector, investments in Exxon Mobil and Diamondback Energy hurt results. While overall results lagged the market, we continue to believe the focus on dividend-paying stocks will pay off over the long term.
Nearer term, the fund’s portfolio managers are aware that the market is keeping a close watch on U.S. monetary policy, recovery from the pandemic, economic stimulus and the resulting implications on the U.S. economy. Portfolio managers continue to favor well-managed, high-quality companies that are capable of paying dividends in myriad economic environments. We remain optimistic that this focus, supported by our global research, will help us to identify attractive long-term investment opportunities.
14 American Funds Insurance Series
Table of Contents
Blue Chip Income and Growth Fund (continued)
How a hypothetical $10,000 investment has grown
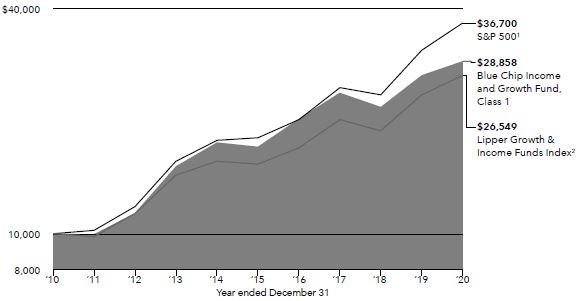
Total returns based on a $1,000 investment For periods ended December 31, 20203
| 1 year | 5 years | 10 years | Lifetime (since July 5,2001) | Gross expense ratio | Net expense ratio | |||||||||||||||||||
Class 1 | 9.04 | % | 11.14 | % | 11.18 | % | 6.82 | % | .43 | % | .27 | % | ||||||||||||
Class 1A | 8.79 | 10.89 | 10.91 | 6.56 | .91 | .68 | ||||||||||||||||||
Class 2 | 8.68 | 10.85 | 10.90 | 6.55 | .68 | .52 | ||||||||||||||||||
Class 4 | 8.47 | 10.58 | 10.68 | 6.32 | .93 | .93 | ||||||||||||||||||
Investment results assume all distributions are reinvested and reflect applicable fees and expenses. The investment adviser intends to waive a portion of its management fees beginning May 1, 2021. This waiver will be in effect through at least May 1, 2022. The waiver may only be modified or terminated with the approval of the series’ board. When applicable, investment results reflect fee waivers and/or expense reimbursements, without which results would have been lower. Visit capitalgroup.com for more information. Expense ratios are as of the fund’s prospectus dated May 1, 2021 (unaudited). See the Financial Highlights table in this report for details.
Any market index shown is unmanaged and, therefore, has no expenses. Investors cannot invest directly in an index.
| 1 | Source: S&P Dow Jones Indices LLC. |
| 2 | Source: Refinitiv Lipper. Results for the Lipper indexes do not reflect sales charges. Lipper indexes track the largest mutual funds (no more than 30), represented by one share class per fund, in the corresponding Lipper category. |
| 3 | Periods greater than one year are annualized. |
| Where the fund’s assets were invested as of December 31, 2020 | Percent of net assets |

American Funds Insurance Series 15
Table of Contents
Global Growth and Income Fund
Fund results shown are for past periods and are not predictive of results for future periods. Current and future results may be lower or higher than those shown. Prices and returns will vary, so investors may lose money. Investing for short periods makes losses more likely. For current information and month-end results, visit capitalgroup.com/afis. For information about your insurance contract and month-end results, go to the website of the company that issued your contract.
Global Growth and Income Fund advanced 9.03% for the 12 months ended December 31, 2020, compared with a 16.25% increase in its benchmark index, MSCI ACWI (All Country World Index),1 a free float-adjusted market capitalization-weighted index that is designed to measure equity market results in the global developed and emerging markets, consisting of more than 40 developed and emerging market country indexes.
Global stocks rose in the face of a deadly pandemic, boosted by massive government stimulus measures and the rapid development of coronavirus vaccines. In a year marked by unprecedented volatility, stocks declined sharply from February to March, followed by a remarkable nine-month rally that lifted many market indexes to all-time highs. U.S. equities also ended 2020 at record highs, showing resilience during a volatile year that included a pandemic-induced recession, a sharp bear market, civil unrest and a contentious presidential election. European stocks declined in local currency terms as the eurozone economy suffered the effects of government-imposed lockdowns and a severe recession. Emerging markets posted solid gains for a second consecutive year, led by China’s economic rebound and the technology-export-driven economies of Taiwan and South Korea.
The fund’s relative performance benefited from specific stock selection, particularly within the information technology and energy sectors. Information technology firm TSMC was the top contributor to results. On the downside, some investments in the industrials sector hindered relative returns. In particular, Airbus was the top relative detractor.
On a country basis, holdings in Taiwan and Australia contributed the most to relative returns, and holdings in the U.S. and France were a drag on returns.
The fund’s portfolio managers recognize that we are experiencing a slowdown in global economic growth. However, we expect that some sectors’ businesses and companies’ share prices, particularly hard-hit by COVID-19, will recover in the medium term as vaccinations are rolled out globally in 2021. Portfolio managers continue to invest based on a bottom-up approach to long-term investing and believe they can uncover promising companies with strong positions in their industries, sustainable growth and income opportunities globally – including in emerging markets.
16 American Funds Insurance Series
Table of Contents
Global Growth and Income Fund (continued)
How a hypothetical $10,000 investment has grown
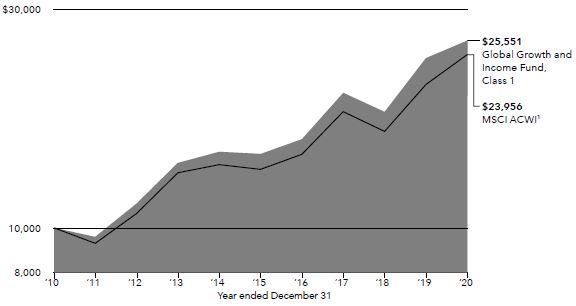
Total returns based on a $1,000 investment For periods ended December 31, 20202
| 1 year | 5 years | 10 years | Lifetime (since May 1, 2006) | Gross expense ratio | Net expense ratio | |||||||||||||||||||
Class 1 | 9.03 | % | 12.05 | % | 9.83 | % | 7.66 | % | .66 | % | .43 | % | ||||||||||||
Class 1A | 8.78 | 11.81 | 9.58 | 7.40 | .91 | .68 | ||||||||||||||||||
Class 2 | 8.73 | 11.76 | 9.56 | 7.39 | .91 | .68 | ||||||||||||||||||
Class 4 | 8.55 | 11.48 | 9.31 | 7.14 | 1.16 | .93 | ||||||||||||||||||
Investment results assume all distributions are reinvested and reflect applicable fees and expenses. The investment adviser intends to waive a portion of its management fees beginning May 1, 2021. This waiver will be in effect through at least May 1, 2022. The waiver may only be modified or terminated with the approval of the series’ board. When applicable, investment results reflect fee waivers and/or expense reimbursements, without which results would have been lower. Visit capitalgroup.com for more information. Expense ratios are as of the fund’s prospectus dated May 1, 2021 (unaudited). See the Financial Highlights table in this report for details.
Any market index shown is unmanaged and, therefore, has no expenses. Investors cannot invest directly in an index.
| 1 | Source MSCI. The MSCI index result reflects dividends net of withholding taxes and reinvestment of distributions. |
| 2 | Periods greater than one year are annualized. |
| Where the fund’s assets were invested as of December 31, 2020 | Percent of net assets |
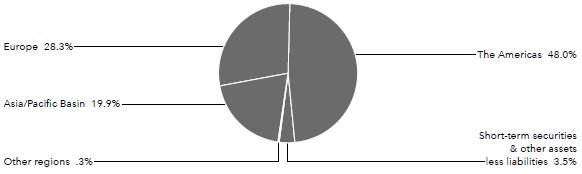
American Funds Insurance Series 17
Table of Contents
Growth-Income Fund
Fund results shown are for past periods and are not predictive of results for future periods. Current and future results may be lower or higher than those shown. Prices and returns will vary, so investors may lose money. Investing for short periods makes losses more likely. For current information and month-end results, visit capitalgroup.com/afis. For information about your insurance contract and month-end results, go to the website of the company that issued your contract.
Growth-Income Fund gained 13.81% for the 12 months ended December 31, 2020, compared with a 18.40% increase in its benchmark index, Standard & Poor’s 500 Composite Index,1 a market capitalization-weighted index based on the results of approximately 500 widely held common stocks.
U.S. equities ended 2020 at record highs, showing resilience during a volatile year that included a pandemic-induced recession, a sharp bear market, civil unrest and a contentious presidential election. Information technology, consumer discretionary and communication services stocks that benefited from stay-at-home restrictions led markets, including Amazon and Netflix. Overall, the information technology sector rose 44%, while consumer discretionary and communication services gained 33% and 24%, respectively. Energy lagged all other sectors, declining 34%. The significant reduction in travel reduced the demand for oil, which was briefly priced below $0 for the first time in history amid fears of dwindling storage capacity. The real estate and financials sectors were also negative for the year, each declining 2%.
Regarding the fund, investments in the communication services sector contributed the most to the fund’s relative returns. Among these stocks, Netflix added the most to the fund’s relative results as shares soared while stay-at-home orders spurred demand for internet-streaming media. On the downside, the fund’s lower-than-index position in information technology stocks, a sector that performed strongly over the period, weighed on relative returns. In particular, the fund’s lower-than-index investment in Apple hindered sector results the most as Apple shares outperformed the broader market over the period.
The fund’s portfolio managers continue to look for compelling investment opportunities, buying stocks they believe represent the best value over the long term.
18 American Funds Insurance Series
Table of Contents
Growth-Income Fund (continued)
How a hypothetical $10,000 investment has grown
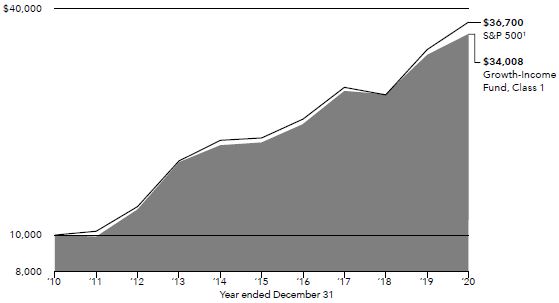
Total returns based on a $1,000 investment For periods ended December 31, 20202
| 1 year | 5 years | 10 years | Lifetime (since February 8, 1984) | Expense ratio | ||||||||||||||||
Class 1 | 13.81 | % | 14.22 | % | 13.02 | % | 11.52 | % | .30 | % | ||||||||||
Class 1A | 13.55 | 13.95 | 12.75 | 11.25 | .55 | |||||||||||||||
Class 2 | 13.54 | 13.93 | 12.74 | 11.24 | .55 | |||||||||||||||
Class 3 | 13.60 | 14.01 | 12.82 | 11.32 | .48 | |||||||||||||||
Class 4 | 13.25 | 13.65 | 12.47 | 10.97 | .80 | |||||||||||||||
Investment results assume all distributions are reinvested and reflect applicable fees and expenses. When applicable, investment results reflect fee waivers and/or expense reimbursements, without which results would have been lower. Visit capitalgroup.com for more information. Expense ratios are as of the fund’s prospectus dated May 1, 2021 (unaudited). See the Financial Highlights table in this report for details.
Any market index shown is unmanaged and, therefore, has no expenses. Investors cannot invest directly in an index.
| 1 | Source: S&P Dow Jones Indices LLC. |
| 2 | Periods greater than one year are annualized. |
| Where the fund’s assets were invested as of December 31, 2020 | Percent of net assets |
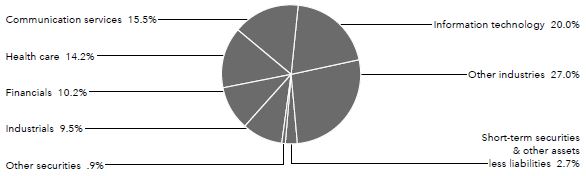
American Funds Insurance Series 19
Table of Contents
International Growth and Income Fund
Fund results shown are for past periods and are not predictive of results for future periods. Current and future results may be lower or higher than those shown. Prices and returns will vary, so investors may lose money. Investing for short periods makes losses more likely. For current information and month-end results, visit capitalgroup.com/afis. For information about your insurance contract and month-end results, go to the website of the company that issued your contract.
International Growth and Income Fund advanced 6.24% for the 12 months ended December 31, 2020, compared with a 10.65% increase in its benchmark index, MSCI ACWI (All Country World Index) ex USA,1 a free float-adjusted market capitalization-weighted index that is designed to measure equity market results in the global developed and emerging markets (consisting of more than 40 developed and emerging market country indexes excluding the U.S.).
Global stocks rose in the face of a deadly pandemic, boosted by massive government stimulus measures and the rapid development of coronavirus vaccines. In a year marked by unprecedented volatility, stocks declined sharply from February to March, followed by a remarkable nine-month rally that lifted many market indexes to all-time highs. U.S. equities also ended 2020 at record highs, showing resilience during a volatile year that included a pandemic-induced recession, a sharp bear market, civil unrest and a contentious presidential election. European stocks declined in local currency terms as the eurozone economy suffered the effects of government-imposed lockdowns and a severe recession. Emerging markets posted solid gains for a second consecutive year, led by China’s economic rebound and the technology-export-driven economies of Taiwan and South Korea.
The top contributors to the fund’s relative returns were the communication services and utilities sectors due in part to good stock selection. Health care stock Daiichi Sankyo was the top contributor to the fund’s relative returns as it benefited from positive sentiment on Daiichi Sankyo’s sales of mainstay products. The company also indicated it was aiming to initiate clinical studies for an mRNA coronavirus vaccine candidate in March 2021.
On the downside, investments in the industrials and information technology sectors detracted from the fund’s relative returns. Among energy stocks, Royal Dutch Shell was one of the fund’s biggest drags on returns as shares fell sharply when oil prices plummeted, a result of decreasing demand brought about by a pandemic-induced slump in global economic growth.
The fund’s portfolio managers follow global economic and geopolitical uncertainties with an aim to preserve value in any potential market correction while preparing to take advantage of buying opportunities as they arise.
20 American Funds Insurance Series
Table of Contents
International Growth and Income Fund (continued)
How a hypothetical $10,000 investment has grown
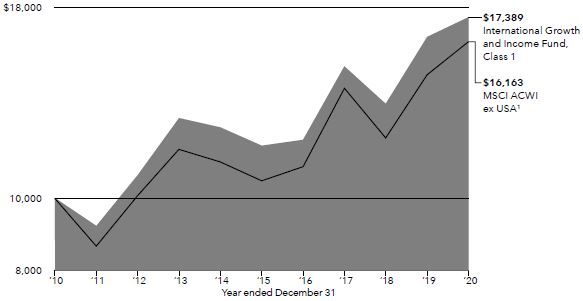
Total returns based on a $1,000 investment For periods ended December 31, 20202
| 1 year | 5 years | 10 years | Lifetime (since November 18, 2008) | Expense ratio | ||||||||||||||||
Class 1 | 6.24 | % | 8.20 | % | 5.69 | % | 9.06 | % | .68 | % | ||||||||||
Class 1A | 5.98 | 7.95 | 5.44 | 8.80 | .93 | |||||||||||||||
Class 2 | 6.01 | 7.94 | 5.43 | 8.79 | .93 | |||||||||||||||
Class 4 | 5.73 | 7.67 | 5.20 | 8.55 | 1.18 | |||||||||||||||
Investment results assume all distributions are reinvested and reflect applicable fees and expenses. When applicable, investment results reflect fee waivers and/or expense reimbursements, without which results would have been lower. Visit capitalgroup.com for more information. Expense ratios are as of the fund’s prospectus dated May 1, 2021 (unaudited). See the Financial Highlights table in this report for details.
Any market index shown is unmanaged and, therefore, has no expenses. Investors cannot invest directly in an index.
| 1 | Source: MSCI. The MSCI index result reflects dividends net of withholding taxes and reinvestment of distributions. |
| 2 | Periods greater than one year are annualized. |
| Where the fund’s assets were invested as of December 31, 2020 | Percent of net assets |
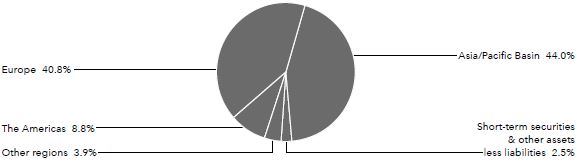
American Funds Insurance Series 21
Table of Contents
Capital Income Builder®
Fund results shown are for past periods and are not predictive of results for future periods. Current and future results may be lower or higher than those shown. Prices and returns will vary, so investors may lose money. Investing for short periods makes losses more likely. For current information and month-end results, visit capitalgroup.com/afis. For information about your insurance contract and month-end results, go to the website of the company that issued your contract.
Capital Income Builder, which invests in a mix of stocks and bonds, gained 4.64% for the 12 months ended December 31, 2020. During the same period, the MSCI ACWI (All Country World Index)1, a free float-adjusted market capitalization-weighted index that is designed to measure equity market results in the global developed and emerging markets (consisting of more than 40 developed and emerging market country indexes), gained 16.25%. The Bloomberg Barclays U.S. Aggregate Index2, which represents the U.S. investment-grade (rated BBB/ Baa and above) fixed-rate bond market, gained 7.51%. The index blend of 70%/30% MSCI ACWI/Bloomberg Barclays U.S. Aggregate Index3 gained 14.28%. Effective May 1, 2021, the fund has elected to use the 70%/30% MSCI ACWI/Bloomberg Barclays U.S. Aggregate Index as its primary benchmark, because it comes closest to reflecting its investment universe and best measures its long-term results and portfolio managers’ success over time. The Lipper Global Equity Income Funds Average4, a measure of similar funds, was up 2.51%.
Global stocks rose in the face of a deadly pandemic, boosted by massive government stimulus measures and the rapid development of coronavirus vaccines. In a year marked by unprecedented volatility, stocks declined sharply from February to March, followed by a remarkable nine-month rally that lifted many market indexes to all-time highs. U.S. equities also ended 2020 at record highs, showing resilience during a volatile year that included a pandemic-induced recession, a sharp bear market, civil unrest and a contentious presidential election. European stocks declined in local currency terms as the eurozone economy suffered the effects of government-imposed lockdowns and a severe recession. Emerging markets posted solid gains for a second consecutive year, led by China’s economic rebound and the technology-export-driven economies of Taiwan and South Korea.
In the equity portfolio, the top contributors in relative terms were the financials and real estate sectors. Semiconductor and wireless company Broadcom added the most to relative returns, boosted by strong financial results, including revenues of $23.9 billion in fiscal 2020, up 6% over fiscal 2019.
On the downside, the consumer discretionary sector was a drag on relative returns. The fund’s top detractor to relative returns was information technology company Apple. The fund had a significantly lower investment in Apple compared to the index and Apple proved to be one of the top performers for the year. The fund’s fixed income portfolio added to relative returns, due to duration, sector positioning and security selection.
Despite expectations for a gradual lessening of the impact of the COVID-19 pandemic, the current market environment continues to be characterized by significant uncertainty. Anticipation is strong for central bankers and legislatures to do everything in their power to maintain economic growth, but the fund’s portfolio managers continue to seek to avoid companies that take on inappropriate levels of debt to pay dividends and are focused instead on identifying companies with strong business models and a commitment to paying and growing dividends over time.
22 American Funds Insurance Series
Table of Contents
Capital Income Builder® (continued)
How a hypothetical $10,000 investment has grown
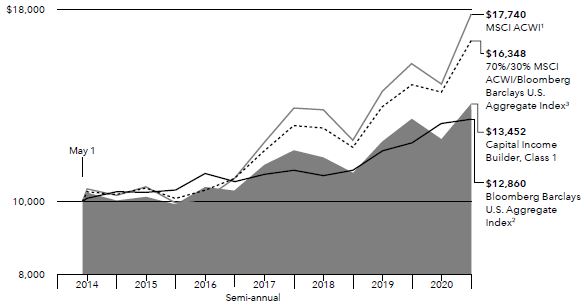
Total returns based on a $1,000 investment For periods ended December 31, 20205
| Lifetime | Gross | Net | ||||||||||||||||||
| 1 year | 5 years | (since May 1, 2014) | expense ratio | expense ratio | ||||||||||||||||
Class 1 | 4.64 | % | 6.35 | % | 4.55 | % | .53 | % | .28 | % | ||||||||||
Class 1A | 4.38 | 6.09 | 4.29 | .78 | .53 | |||||||||||||||
Class 2 | 4.48 | 6.13 | 4.39 | .78 | .53 | |||||||||||||||
Class 4 | 4.11 | 5.84 | 4.03 | 1.03 | .78 | |||||||||||||||
Investment results assume all distributions are reinvested and reflect applicable fees and expenses. The investment adviser is currently waiving a portion of its management fee. This waiver will be in effect through at least May 1, 2021. The waiver may only be modified or terminated with the approval of the series’ board. When applicable, investment results reflect fee waivers and/or expense reimbursements, without which results would have been lower. Visit capitalgroup.com for more information. Expense ratios are as of the fund’s prospectus dated May 1, 2021 (unaudited). See the Financial Highlights table in this report for details.
Any market index shown is unmanaged and, therefore, has no expenses. Investors cannot invest directly in an index.
| ¹ | Source: MSCI. The MSCI index result reflects dividends net of withholding taxes and reinvestment of distributions. |
| 2 | Source: Bloomberg Index Services Ltd. |
| 3 | Data sources: MSCI and Bloomberg Index Services Ltd. The 70%/30% MSCI ACWI/Bloomberg Barclays U.S. Aggregate Index blends the MSCI ACWI (All Country World Index) with the Bloomberg Barclays U.S. Aggregate Index by weighting their total returns at 70% and 30%, respectively. Its result assumes the blend is rebalanced monthly. |
| 4 | Source: Refinitiv Lipper. Lipper averages reflect the current composition of all eligible mutual funds (all share classes) within a given category. Lipper categories are dynamic and averages may have few funds, especially over longer periods. To see the number of funds included in the Lipper category for each fund’s lifetime, please see the Quarterly Statistical Update, available on our website. |
| 5 | Periods greater than one year are annualized. |
| Where the fund’s assets were invested as of December 31, 2020 | Percent of net assets |
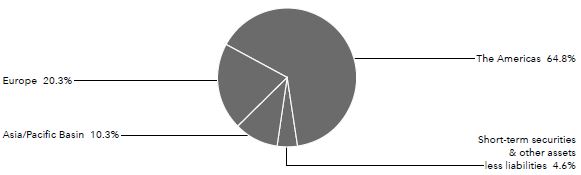
American Funds Insurance Series 23
Table of Contents
Asset Allocation Fund
Fund results shown are for past periods and are not predictive of results for future periods. Current and future results may be lower or higher than those shown. Prices and returns will vary, so investors may lose money. Investing for short periods makes losses more likely. For current information and month-end results, visit capitalgroup.com/afis. For information about your insurance contract and month-end results, go to the website of the company that issued your contract.
Asset Allocation Fund, which is a mix of stocks and bonds, gained 12.71% for the 12 months ended December 31, 2020. Standard & Poor’s 500 Composite Index1, a market capitalization-weighted index based on the results of approximately 500 widely held common stocks, was up 18.40% over the same period, while the Bloomberg Barclays U.S. Aggregate Index2, which represents the U.S. investment-grade (rated BBB/Baa and above) fixed-rate bond market, returned 7.51%. A blend of the two indexes, the 60%/40% S&P 500 Index/ Bloomberg Barclays U.S. Aggregate Index3, gained 14.73%. Effective May 1, 2020, the fund has elected to use the 60%/40% S&P 500 Index/Bloomberg Barclays U.S. Aggregate Index as its primary benchmark, because it comes closest to reflecting its investment universe and best measures its long-term results and portfolio managers’ success over time.
U.S. equities ended 2020 at record highs, showing resilience during a volatile year that included a pandemic-induced recession, a sharp bear market, civil unrest and a contentious presidential election. Information technology, consumer discretionary and communication services stocks that benefited from stay-at-home restrictions led markets, including Amazon and Netflix. Overall, the information technology sector rose 44%, while consumer discretionary and communication services gained 33% and 24%, respectively. Energy lagged all other sectors, declining 34%. The significant reduction in travel reduced the demand for oil, which was briefly priced below $0 for the first time in history amid fears of dwindling storage capacity. The real estate and financials sectors were also negative for the year, each declining 2%.
Investments in the technology sector – the fund’s largest sector holding – contributed to the fund’s relative returns. Within the sector, TSMC and ASML Holding contributed to relative results with double-digit returns that outpaced the general market.
On the downside, commercial aerospace company Boeing detracted from relative returns as shares slumped in the face of unprecedented disruptions arising from the COVID-19 pandemic. The fund’s fixed income investments were additive to relative returns due to sector positioning and security selection.
The fund’s portfolio managers continue to evaluate the economic and market/sector implications of the current administration’s decisions regarding trade. The fund’s cash position allows portfolio managers to remain flexible and better navigate uncertainty by focusing on opportunities when stock prices are favorable.
24 American Funds Insurance Series
Table of Contents
Asset Allocation Fund (continued)
How a hypothetical $10,000 investment has grown
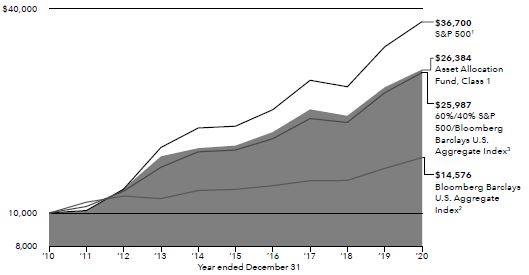
Total returns based on a $1,000 investment For periods ended December 31, 20204
| 1 year | 5 years | 10 years | Lifetime (since August 1,1989) | Expense ratio | ||||||||||||||||
Class 1 | 12.71 | % | 10.86 | % | 10.19 | % | 8.76 | % | .30 | % | ||||||||||
Class 1A | 12.43 | 10.60 | 9.92 | 8.49 | .55 | |||||||||||||||
Class 2 | 12.46 | 10.59 | 9.91 | 8.49 | .55 | |||||||||||||||
Class 3 | 12.50 | 10.66 | 9.99 | 8.57 | .48 | |||||||||||||||
Class 4 | 12.16 | 10.31 | 9.68 | 8.23 | .80 | |||||||||||||||
Investment results assume all distributions are reinvested and reflect applicable fees and expenses. When applicable, investment results reflect fee waivers and/or expense reimbursements, without which results would have been lower. Visit capitalgroup.com for more information. Expense ratios are as of the fund’s prospectus dated May 1, 2021 (unaudited). See the Financial Highlights table in this report for details.
Any market index shown is unmanaged and, therefore, has no expenses. Investors cannot invest directly in an index.
| 1 | Source: S&P Dow Jones Indices LLC. |
| 2 | Source: Bloomberg Index Services Ltd. |
| 3 | Sources: Bloomberg Index Services Ltd. and S&P Dow Jones Indices LLC. Blends the S&P 500 with the Bloomberg Barclays U.S. Aggregate Index by weighting their total returns at 60% and 40%, respectively. Results assume the blend is rebalanced monthly. |
| 4 | Periods greater than one year are annualized. |
| Where the fund’s assets were invested as of December 31, 2020 | Percent of net assets |
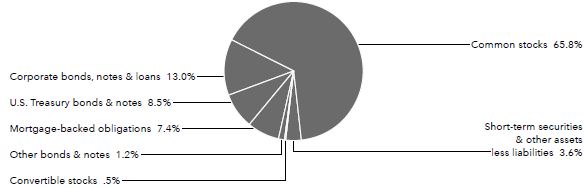
American Funds Insurance Series 25
Table of Contents
Global Balanced Fund
Fund results shown are for past periods and are not predictive of results for future periods. Current and future results may be lower or higher than those shown. Prices and returns will vary, so investors may lose money. Investing for short periods makes losses more likely. For current information and month-end results, visit capitalgroup.com/afis. For information about your insurance contract and month-end results, go to the website of the company that issued your contract.
Global Balanced Fund gained 10.53% for the 12 months ended December 31, 2020. The MSCI ACWI (All Country World Index),1 a free float-adjusted market capitalization-weighted index that is designed to measure equity market results in the global developed and emerging markets (consisting of more than 40 developed and emerging market country indexes), increased by 16.25%, while the Bloomberg Barclays Global Aggregate Index,2 a measure of global investment-grade bonds (rated BBB/Baa and above), increased 9.20%. The 60%/40% MSCI ACWI/Bloomberg Barclays Global Aggregate Index,3 a blend of the two indexes, gained 14.05%. Effective May 1, 2021, the fund has elected to use the 60%/40% MSCI ACWI/Bloomberg Barclays Global Aggregate Index as its primary benchmark, because it comes closest to reflecting its investment universe and best measures its long-term results and portfolio managers’ success over time.
Global stocks rose in the face of a deadly pandemic, boosted by massive government stimulus measures and the rapid development of coronavirus vaccines. In a year marked by unprecedented volatility, stocks declined sharply from February to March, followed by a remarkable nine-month rally that lifted many market indexes to all-time highs. U.S. equities also ended 2020 at record highs, showing resilience during a volatile year that included a pandemic-induced recession, a sharp bear market, civil unrest and a contentious presidential election. European stocks declined in local currency terms as the eurozone economy suffered the effects of government-imposed lockdowns and a severe recession. Emerging markets posted solid gains for a second consecutive year, led by China’s economic rebound and the technology-export-driven economies of Taiwan and South Korea.
Stock selection in the financials sector was additive to relative returns. Investments in information technology firms TSMC and ASML Holding were top contributors to results. Despite COVID-19-related supply-side disruptions, 5G, artificial intelligence and high-performance computing continued to underpin long-term demand for ASML’s extreme ultraviolet lithography products. The fund’s fixed income investments also helped relative returns, with sector positioning, duration and curve being among the additive factors. On the downside, stock selection in the consumer staples and health care sectors detracted from relative returns. An investment in aerospace firm Boeing was a drag on results as it faced unprecedented disruption arising from the pandemic, as well as uncertainty over recertification of the 737 MAX for much of the year. In fixed income, unhedged currency, particularly in euro-denominated bonds, also detracted from relative returns.
Portfolio managers continue to monitor cross-border trade discussions that could have negative economic implications due to a possible reduction in global trade. Further considerations include continued easing by monetary authorities and the possibility of increased fiscal stimulus in a number of countries. Portfolio managers continue to focus on global research and stock-by-stock, bottom-up fundamental analysis.
26 American Funds Insurance Series
Table of Contents
Global Balanced Fund (continued)
How a hypothetical $10,000 investment has grown
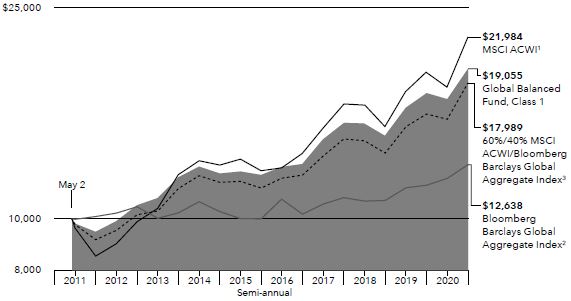
Total returns based on a $1,000 investment For periods ended December 31, 20204
| 1 year | 5 years | Lifetime (since May 2, 2011) | Expense ratio | |||||||||||||
Class 1 | 10.53 | % | 9.57 | % | 6.90 | % | .72 | % | ||||||||
Class 1A | 10.25 | 9.34 | 6.65 | .97 | ||||||||||||
Class 2 | 10.30 | 9.30 | 6.63 | .97 | ||||||||||||
Class 4 | 10.00 | 9.03 | 6.49 | 1.22 | ||||||||||||
Investment results assume all distributions are reinvested and reflect applicable fees and expenses. When applicable, investment results reflect fee waivers and/or expense reimbursements, without which results would have been lower. Visit capitalgroup.com for more information. Expense ratios are as of the fund’s prospectus dated May 1, 2021 (unaudited). See the Financial Highlights table in this report for details.
Any market index shown is unmanaged and, therefore, has no expenses. Investors cannot invest directly in an index.
| 1 | Source: MSCI. The MSCI index results reflect dividends net of withholding taxes and reinvestment of distributions. |
| 2 | Source: Bloomberg Index Services Ltd. |
| 3 | Data sources: MSCI and Bloomberg Index Services Ltd. The 60%/40% MSCI ACWI/Bloomberg Barclays Global Aggregate Index blends the MSCI ACWI (All Country World Index) with the Bloomberg Barclays Global Aggregate Index by weighting their cumulative total returns at 60% and 40%, respectively. Its result assumes the blend is rebalanced monthly. |
| 4 | Periods greater than one year are annualized. |
| Where the fund’s assets were invested as of December 31, 2020 | Percent of net assets |
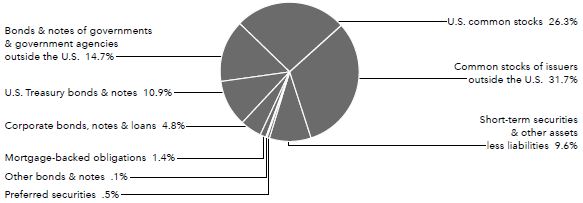
American Funds Insurance Series 27
Table of Contents
Bond Fund
Fund results shown are for past periods and are not predictive of results for future periods. Current and future results may be lower or higher than those shown. Prices and returns will vary, so investors may lose money. Investing for short periods makes losses more likely. For current information and month-end results, visit capitalgroup.com/afis. For information about your insurance contract and month-end results, go to the website of the company that issued your contract.
Bond Fund gained 9.96% for the 12 months ended December 31, 2020. In comparison, the fund’s benchmark, the Bloomberg Barclays U.S. Aggregate Index1, which represents the U.S. investment-grade (rated BBB/Baa and above) fixed-rate bond market, returned 7.51%.
Bond markets rebounded sharply supported by extraordinary measures from the Federal Reserve. The central bank slashed interest rates to near-zero in March, launched an array of emergency lending programs, and purchased corporate and government debt. The yield on the benchmark 10-year Treasury note closed the year at 0.92%, down from 1.92% the previous year. Corporate spreads ended the year near pre-pandemic levels. The Treasury curve steepened amid declining yields.
The fund benefitted from security selection, sector selection and duration positioning. Within sector selection, overweights in investment-grade corporates and agency mortgage backed securities helped relative results. Also, out-of-benchmark investments in Treasury Inflation Protected Securities (TIPS) and high-yield bonds all added to relative returns. Within security selection, bonds issued by Teva Pharmaceutical were notable contributors. Municipal issuers such as the State of Illinois and Chicago Board of Education detracted over the period.
Valuations have largely recovered from the lows seen in March. Consequently, managers have begun reducing risk in the portfolio and will likely continue if valuations improve further. This will enable managers to take advantage of future volatility by purchasing bonds when prices look more attractive at that time. With interest rates at relatively low levels and the Fed holding short-term rates near zero, managers expect longer term yields to rise as the economic backdrop improves.
Managers believe that stimulative fiscal and monetary policy should help to keep U.S. economic growth positive. Although the portfolio is positioned toward an economic recovery, managers anticipate a high level of uncertainty and a fragile state of the economy. As such, careful, research-driven security selection will continue to be an important driver of future investment results.
28 American Funds Insurance Series
Table of Contents
Bond Fund (continued)
How a hypothetical $10,000 investment has grown
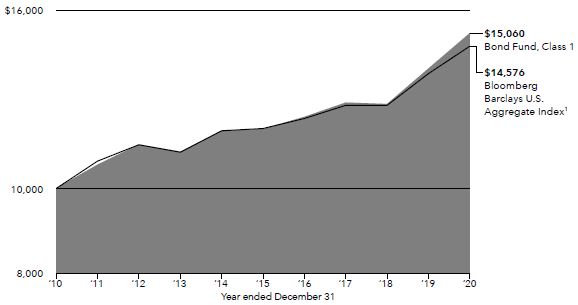
Total returns based on a $1,000 investment For periods ended December 31, 20202
| 1 year | 5 years | 10 years | Lifetime (since January 2, 1996) | Gross expense ratio | Net expense ratio | |||||||||||||||||||
Class 1 | 9.96 | % | 5.20 | % | 4.18 | % | 4.93 | % | .40 | % | .21 | % | ||||||||||||
Class 1A | 9.68 | 4.94 | 3.92 | 4.67 | .65 | .46 | ||||||||||||||||||
Class 2 | 9.73 | 4.92 | 3.92 | 4.67 | .65 | .46 | ||||||||||||||||||
Class 4 | 9.38 | 4.66 | 3.67 | 4.41 | .90 | .71 | ||||||||||||||||||
Investment results assume all distributions are reinvested and reflect applicable fees and expenses. The investment adviser intends to waive a portion of its management fees beginning May 1, 2021. This waiver will be in effect through at least May 1, 2022. The waiver may only be modified or terminated with the approval of the series’ board. When applicable, investment results reflect fee waivers and/or expense reimbursements, without which results would have been lower. Visit capitalgroup.com for more information. Expense ratios are as of the fund’s prospectus dated May 1, 2021 (unaudited). See the Financial Highlights table in this report for details.
Any market index shown is unmanaged and, therefore, has no expenses. Investors cannot invest directly in an index.
| 1 | Source: Bloomberg Index Services Ltd. |
| 2 | Periods greater than one year are annualized. |
| Where the fund’s assets were invested as of December 31, 2020 | Percent of net assets |
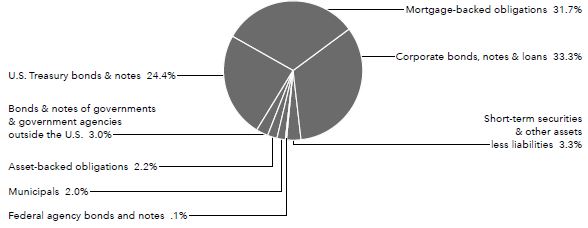
American Funds Insurance Series 29
Table of Contents
Capital World Bond Fund®
Fund results shown are for past periods and are not predictive of results for future periods. Current and future results may be lower or higher than those shown. Prices and returns will vary, so investors may lose money. Investing for short periods makes losses more likely. For current information and month-end results, visit capitalgroup.com/afis. For information about your insurance contract and month-end results, go to the website of the company that issued your contract.
Capital World Bond Fund gained 10.17% for the 12 months ended December 31, 2020. This outpaced the fund’s benchmark, the Bloomberg Barclays Global Aggregate Index1, which measures global investment-grade bonds (rated BBB/Baa and above) and increased 9.20%.
Government bonds advanced as central banks around the world slashed interest rates and ramped up stimulus programs in an attempt to counter the damaging effects of the pandemic. The U.S. Federal Reserve cut rates to near zero in March and launched an array of emergency lending programs as part of its COVID-19 response. The Treasury curve steepened amid declining yields.
Sector and security selection contributed positively to the fund’s relative returns over the period. The fund managers favored credits from Southern Europe and Eastern Europe, of which Greece and Romania were among top contributors to returns. Diversified exposures to local emerging markets, such as Mexico, also added to results. Government bonds from France and Brazil were among individual detractors to relative returns.
As growth in the U.S. moderates, the fund’s portfolio managers seek to identify long-term investments around the world such as in emerging markets where sovereign, corporate and high-yield debt may present opportunities. Given the fund’s core objective is to provide a high-level of total return over the long term, the fund’s portfolio managers maintain a cautious approach to investing in different sectors of the bond market, such as high-yield debt.
30 American Funds Insurance Series
Table of Contents
Capital World Bond Fund® (continued)
How a hypothetical $10,000 investment has grown
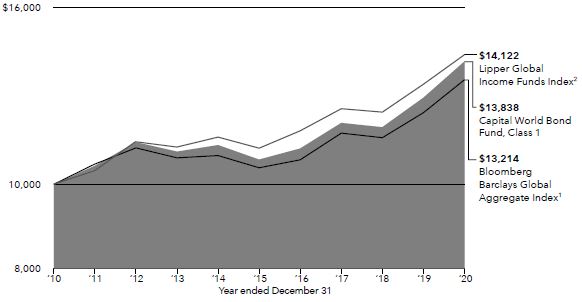
Total returns based on a $1,000 investment For periods ended December 31, 20203
| 1 year | 5 years | 10 years | Lifetime (since October 4, 2006) | Gross expense ratio | Net expense ratio | |||||||||||||||||||
Class 1 | 10.17 | % | 5.35 | % | 3.30 | % | 4.49 | % | .58 | % | .48 | % | ||||||||||||
Class 1A | 9.89 | 5.12 | 3.06 | 4.24 | .83 | .73 | ||||||||||||||||||
Class 24 | 9.90 | 5.10 | 3.04 | 4.22 | .83 | .73 | ||||||||||||||||||
Class 4 | 9.62 | 4.84 | 2.83 | 4.00 | 1.08 | .98 | ||||||||||||||||||
Investment results assume all distributions are reinvested and reflect applicable fees and expenses. The investment adviser is currently waiving a portion of its management fee. This waiver will be in effect through at least May 1, 2021. The waiver may only be modified or terminated with the approval of the series’ board. When applicable, investment results reflect fee waivers and/or expense reimbursements, without which results would have been lower. Visit capitalgroup.com for more information. Expense ratios are as of the fund’s prospectus dated May 1, 2021 (unaudited). See the Financial Highlights table in this report for details.
Any market index shown is unmanaged and, therefore, has no expenses. Investors cannot invest directly in an index.
| 1 | Source: Bloomberg Index Services Ltd. |
| 2 | Source: Refinitiv Lipper. Results for the Lipper indexes do not reflect sales charges. Lipper indexes track the largest mutual funds (no more than 30), represented by one share class per fund, in the corresponding Lipper category. |
| 3 | Periods greater than one year are annualized. |
| 4 | Capital World Bond Fund Class 2 shares were first sold on November 6, 2006. Results prior to that date are hypothetical based on Class 1 share results adjusted for estimated additional annual expenses of 0.25%. |
| Where the fund’s assets were invested as of December 31, 2020 | Percent of net assets |

American Funds Insurance Series 31
Table of Contents
High-Income Bond Fund
Fund results shown are for past periods and are not predictive of results for future periods. Current and future results may be lower or higher than those shown. Prices and returns will vary, so investors may lose money. Investing for short periods makes losses more likely. For current information and month-end results, visit capitalgroup.com/afis. For information about your insurance contract and month-end results, go to the website of the company that issued your contract.
High-Income Bond Fund gained 8.21% for the 12 months ended December 31, 2020. In comparison, the fund’s benchmark, the Bloomberg Barclays U.S. Corporate High Yield 2% Issuer Capped Index,1 which measures fixed-rate non-investment-grade bonds (rated BB/Ba and below) and limits the exposure of an issuer to 2%, was up 7.05%.
Credit markets rebounded sharply from their pandemic lows, supported by extraordinary measures from the Federal Reserve and other global central banks. The Federal Reserve reduced interest rates to near-zero in March and launched an array of emergency programs that included purchasing corporate bonds. The yield on the benchmark 10-year Treasury note closed the year at 0.92%, down from 1.92% the previous year. Corporate spreads ended the year near pre-pandemic levels, after increasing dramatically during the early stages of the pandemic.
Sector and security selection contributed positively to the fund’s relative returns over the period. In particular, security selection within the consumer non-cyclical sector was additive to results. Conversely, investments within the energy sector detracted from relative returns.
The fund’s portfolio managers continue to believe current fundamentals support a mildly constructive outlook for the high-yield market and that ongoing fiscal and monetary support – combined with synchronous global growth as economies gradually reopen – will mitigate adverse impacts of the pandemic. We continue to monitor these themes and believe that high-yield bonds will be supported by stronger economic growth and central bank policies.
32 American Funds Insurance Series
Table of Contents
High-Income Bond Fund (continued)
How a hypothetical $10,000 investment has grown
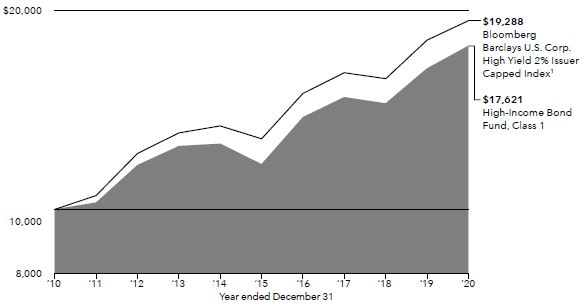
Total returns based on a $1,000 investment For periods ended December 31, 20202
| 1 year | 5 years | 10 years | Lifetime (since February 8,1984) | Gross expense ratio | Net expense ratio | |||||||||||||||||||
Class 1 | 8.21 | % | 8.59 | % | 5.83 | % | 8.65 | % | .52 | % | .33 | % | ||||||||||||
Class 1A | 7.94 | 8.35 | 5.58 | 8.39 | .77 | .58 | ||||||||||||||||||
Class 2 | 7.94 | 8.34 | 5.57 | 8.38 | .77 | .58 | ||||||||||||||||||
Class 3 | 7.93 | 8.39 | 5.63 | 8.46 | .70 | .51 | ||||||||||||||||||
Class 4 | 7.74 | 8.05 | 5.35 | 8.13 | 1.02 | .83 | ||||||||||||||||||
Investment results assume all distributions are reinvested and reflect applicable fees and expenses. The investment adviser intends to waive a portion of its management fees beginning May 1, 2021. This waiver will be in effect through at least May 1, 2022. The waiver may only be modified or terminated with the approval of the series’ board. When applicable, investment results reflect fee waivers and/or expense reimbursements, without which results would have been lower. Visit capitalgroup.com for more information. Expense ratios are as of the fund’s prospectus dated May 1, 2021 (unaudited). See the Financial Highlights table in this report for details.
Any market index shown is unmanaged and, therefore, has no expenses. Investors cannot invest directly in an index.
| 1 | Source: Bloomberg Index Services Ltd. |
| 2 | Periods greater than one year are annualized. |
Where the fund’s assets were invested as of December 31, 2020 | Percent of net assets |
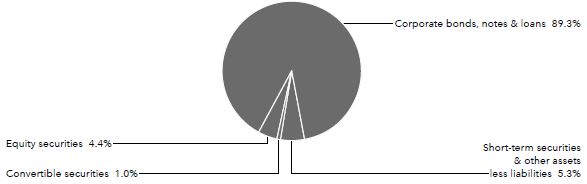
American Funds Insurance Series 33
Table of Contents
American Funds Mortgage Fund®
Fund results shown are for past periods and are not predictive of results for future periods. Current and future results may be lower or higher than those shown. Prices and returns will vary, so investors may lose money. Investing for short periods makes losses more likely. For current information and month-end results, visit capitalgroup.com/afis. For information about your insurance contract and month-end results, go to the website of the company that issued your contract.
American Funds Mortgage Fund gained 6.98% for the 12 months ended December 31, 2020, while the Bloomberg Barclays U.S. Mortgage-Backed Securities Index,1 which covers the mortgage-backed pass-through securities of Ginnie Mae, Fannie Mae and Freddie Mac, rose 3.87%.
Bond markets rebounded sharply supported by extraordinary measures from the Federal Reserve. The central bank slashed interest rates to near-zero in March, launched an array of emergency lending programs, and purchased corporate and government debt. The yield on the benchmark 10-year Treasury note closed the year at 0.92%, down from 1.92% the previous year. Corporate spreads ended the year near pre-pandemic levels. The Treasury curve steepened amid declining yields.
Duration and curve positioning, as well as sector and security selection, all contributed to the fund’s relative returns over the period. The fund benefited from a lower-than-benchmark weighting in mortgages. On the downside, duration positioning in IRS swaps detracted from relative results.
The fund’s portfolio managers remain focused on meeting the core objectives of the fund providing current income and protecting capital. Rate hikes in the near future are unlikely as the Federal Reserve looks to extend economic expansion and raise inflation closer to its stated “strong commitment” for a symmetric target of 2%. Due to the Fed’s interest policy and market optimism with respect to economic growth, the Treasury yield curve steepened considerably in 2020. The fund positioning is intended to provide some stability if we experience another bout of weakness in equity or credit markets. More attractive valuations for mortgage investments are expected to emerge going forward amid a transition from our extended period of extremely low volatility to a more normal period of economic and asset price uncertainty.
34 American Funds Insurance Series
Table of Contents
American Funds Mortgage Fund® (continued)
How a hypothetical $10,000 investment has grown
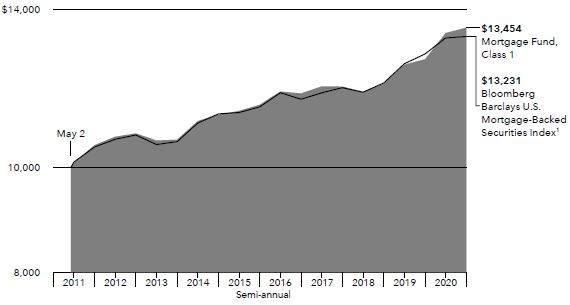
Total returns based on a $1,000 investment For periods ended December 31, 20202
| 1 year | 5 years | Lifetime (since May 2, 2011) | Gross expense ratio | Net expense ratio | ||||||||||||||||
Class 1 | 6.98 | % | 3.34 | % | 3.12 | % | .48 | % | .27 | % | ||||||||||
Class 1A | 6.63 | 3.08 | 2.86 | .73 | .52 | |||||||||||||||
Class 2 | 6.72 | 3.08 | 2.86 | .73 | .52 | |||||||||||||||
Class 4 | 6.38 | 2.82 | 2.66 | .98 | .77 | |||||||||||||||
Investment results assume all distributions are reinvested and reflect applicable fees and expenses. The investment adviser is currently waiving a portion of its management fee. This waiver will be in effect through at least May 1, 2021. The waiver may only be modified or terminated with the approval of the series’ board. When applicable, investment results reflect fee waivers and/or expense reimbursements, without which results would have been lower. Visit capitalgroup.com for more information. Expense ratios are as of the fund’s prospectus dated May 1, 2021 (unaudited). See the Financial Highlights table in this report for details.
Any market index shown is unmanaged and, therefore, has no expenses. Investors cannot invest directly in an index.
| 1 | Source: Bloomberg Index Services Ltd. |
| 2 | Periods greater than one year are annualized. |
| Where the fund’s assets were invested as of December 31, 2020 | Percent of net assets |
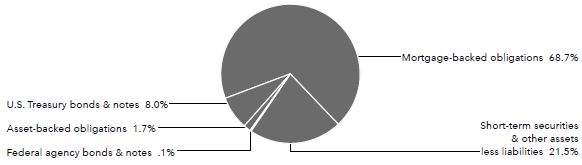
American Funds Insurance Series 35
Table of Contents
Ultra-Short Bond Fund
Fund results shown are for past periods and are not predictive of results for future periods. Current and future results may be lower or higher than those shown. Prices and returns will vary, so investors may lose money. Investing for short periods makes losses more likely. For current information and month-end results, visit capitalgroup.com/afis. For information about your insurance contract and month-end results, go to the website of the company that issued your contract.
Ultra-Short Bond Fund gained 0.34% for the 12 months ended December 31, 2020, compared with a 1.31% rise in the Bloomberg Barclays Short-Term Government/Corporate Index1, which consists of investment-grade (rated BBB/Baa and above), fixed-rate, publicly placed, dollar-denominated and non-convertible securities with remaining maturity from one up to (but not including) 12 months within either the government or corporate sector. With a focus on capital preservation and liquidity, the fund continues to be managed in a relatively conservative manner compared to the above-described index.
Short-term interest rates are near zero and have been since the Federal Reserve cut rates in March. The current low interest rate environment may persist, as uncertainty regarding the coronavirus continues even with positive news on the vaccine front.
36 American Funds Insurance Series
Table of Contents
Ultra-Short Bond Fund (continued)
Total returns based on a $1,000 investment For periods ended December 31, 20202
| 1 year | 5 years | 10 years | Lifetime (since February 8, 1984) | Expense ratio | ||||||||||||||||
Class 1 | 0.34 | % | 0.91 | % | 0.34 | % | 3.31 | % | 0.37 | % | ||||||||||
Class 1A | 0.32 | 0.86 | 0.19 | 3.08 | 0.62 | |||||||||||||||
Class 2 | 0.03 | 0.65 | 0.08 | 3.05 | 0.62 | |||||||||||||||
Class 3 | 0.13 | 0.74 | 0.16 | 3.12 | 0.55 | |||||||||||||||
Class 4 | –0.25 | 0.40 | –0.09 | 2.81 | 0.87 | |||||||||||||||
Investment results assume all distributions are reinvested and reflect applicable fees and expenses. When applicable, investment results reflect fee waivers and/or expense reimbursements, without which results would have been lower. Visit capitalgroup.com for more information. Expense ratios are as of the fund’s prospectus dated May 1, 2021 (unaudited). See the Financial Highlights table in this report for details.
Any market index shown is unmanaged and, therefore, has no expenses. Investors cannot invest directly in an index.
| 1 | Source: Bloomberg Index Services Ltd. |
| 2 | Periods greater than one year are annualized. |
| Where the fund’s assets were invested as of December 31, 2020 | Percent of net assets |
Commercial paper | 71.5 | % | ||
Federal agency bills & notes | 16.2 | |||
U.S. Treasury bills | 11.4 | |||
Other assets less liabilities | .9 | |||
|
| |||
| Total | 100.0 | % | ||
|
|
American Funds Insurance Series 37
Table of Contents
U.S. Government/AAA-Rated Securities Fund
Fund results shown are for past periods and are not predictive of results for future periods. Current and future results may be lower or higher than those shown. Prices and returns will vary, so investors may lose money. Investing for short periods makes losses more likely. For current information and month-end results, visit capitalgroup.com/afis. For information about your insurance contract and month-end results, go to the website of the company that issued your contract.
U.S. Government/AAA-Rated Securities Fund rose 10.09% for the 12 months ended December 31, 2020, while the Bloomberg Barclays U.S. Government/Mortgage-Backed Securities Index,1 which covers obligations issued by the U.S. Treasury and U.S. government agencies, increased by 6.36%.
Bond markets rebounded sharply supported by extraordinary measures from the Federal Reserve. The central bank slashed interest rates to near-zero in March, launched an array of emergency lending programs, and purchased corporate and government debt. The yield on the benchmark 10-year Treasury note closed the year at 0.92%, down from 1.92% the previous year. Corporate spreads ended the year near pre-pandemic levels. The Treasury curve steepened amid declining yields.
During the period, the fund’s duration and mortgage positioning were additive to results. On the downside, duration positioning in IRS swaps detracted from relative results.
The fund strives to meet its objective of providing a high level of current income consistent with the preservation of capital. Rate hikes in the near future are unlikely as the Federal Reserve looks to extend economic expansion and raise inflation closer to its stated “strong commitment” symmetric target of 2%. Due to the Fed’s interest policy and market optimism with respect to economic growth, the Treasury yield curve steepened considerably in 2020. The fund positioning is intended to provide some stability if we experience another bout of weakness in equity or credit markets.
38 American Funds Insurance Series
Table of Contents
U.S. Government/AAA-Rated Securities Fund (continued)
How a hypothetical $10,000 investment has grown
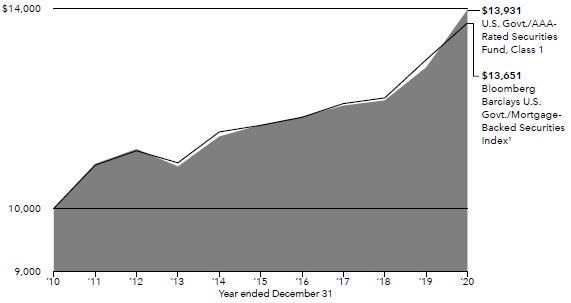
Total returns based on a $1,000 investment For periods ended December 31, 20202
| 1 year | 5 years | 10 years | Lifetime (since December 2, 1985) | Gross expense ratio | Net expense ratio | |||||||||||||||||||
Class 1 | 10.09 | % | 3.93 | % | 3.37 | % | 5.83 | % | .39 | % | .23 | % | ||||||||||||
Class 1A | 9.75 | 3.70 | 3.12 | 5.57 | .64 | .48 | ||||||||||||||||||
Class 2 | 9.80 | 3.67 | 3.10 | 5.57 | .64 | .48 | ||||||||||||||||||
Class 3 | 9.91 | 3.76 | 3.18 | 5.64 | .57 | .41 | ||||||||||||||||||
Class 4 | 9.48 | 3.42 | 2.90 | 5.32 | .89 | .73 | ||||||||||||||||||
Investment results assume all distributions are reinvested and reflect applicable fees and expenses. The investment adviser intends to waive a portion of its management fees beginning May 1, 2021. This waiver will be in effect through at least May 1, 2022. The waiver may only be modified or terminated with the approval of the series’ board. When applicable, investment results reflect fee waivers and/or expense reimbursements, without which results would have been lower. Visit capitalgroup.com for more information. Expense ratios are as of the fund’s prospectus dated May 1, 2021 (unaudited). See the Financial Highlights table in this report for details.
Any market index shown is unmanaged and, therefore, has no expenses. Investors cannot invest directly in an index.
| 1 | Source: Bloomberg Index Services Ltd. |
| 2 | Periods greater than one year are annualized. |
| Where the fund’s assets were invested as of December 31, 2020 | Percent of net assets |
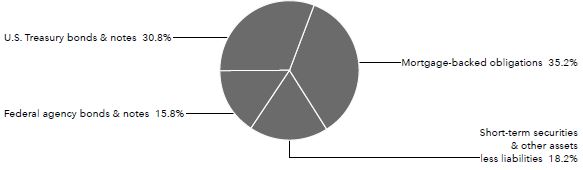
American Funds Insurance Series 39
Table of Contents
Managed Risk Growth Fund
Fund results shown are for past periods and are not predictive of results for future periods. Current and future results may be lower or higher than those shown. Prices and returns will vary, so investors may lose money. Investing for short periods makes losses more likely. For current information and month-end results, visit capitalgroup.com/afis. For information about your insurance contract and month-end results, go to the website of the company that issued your contract.
The fund gained 32.45% for the 12 months ended December 31, 2020. S&P 500 Managed Risk Index — Moderate Aggressive1 was up 6.92%. Standard & Poor’s 500 Composite Index2, a market capitalization-weighted index based on the results of approximately 500 widely held common stocks, increased 18.40%.
The fund pursues its objective by investing in shares of American Funds Insurance Series — Growth FundSM and American Funds Insurance Series – Bond FundSM while seeking to manage portfolio volatility and provide downside protection, primarily through the use of exchange-traded futures. The benefit of the fund’s managed risk strategy should be most apparent during periods of high volatility and in down markets. In steady or rising markets, the fund’s results can be expected to lag those of the underlying fund.
The underlying Growth Fund’s investments in consumer discretionary and communication services sectors were top contributors to relative returns, while its cash holdings detracted.
How a hypothetical $10,000 investment has grown
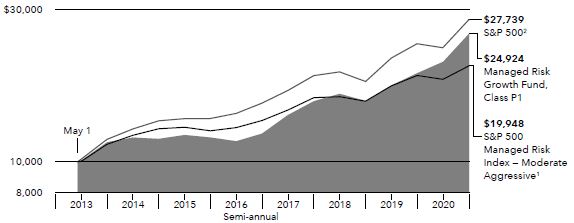
Total returns based on a $1,000 investment For periods ended December 31, 20203
| 1 year | 5 years | Lifetime (since May 1, 2013) | Gross expense ratio | Net expense ratio | ||||||||||||||||
Class P1 | 32.45 | % | 15.97 | % | 12.65 | % | .74 | % | .69 | % | ||||||||||
Class P2 | 32.03 | 15.64 | 12.32 | .99 | .94 | |||||||||||||||
The investment adviser is currently waiving a portion of its management fee. This waiver will be in effect through at least May 1, 2022. The waiver may only be modified or terminated with the approval of the series’ board. When applicable, investment results reflect fee waivers and/or expense reimbursements, without which results would have been lower. Visit capitalgroup.com for more information. Expense ratios are restated to reflect current fees and are as of the fund’s prospectus dated May 1, 2021 (unaudited).
Any market index shown is unmanaged and, therefore, has no expenses. Investors cannot invest directly in an index.
| 1 | Source: S&P Dow Jones Indices LLC. Standard & Poor’s Managed Risk Index Series is designed to simulate a dynamic protective portfolio that allocates between the underlying equity index and cash, based on realized volatilities of the underlying equity and bond indexes, while maintaining a fixed allocation to the underlying bond index. |
| 2 | Source: S&P Dow Jones Indices LLC. |
| 3 | Periods greater than one year are annualized. |
Milliman Financial Risk Management LLC serves as the subadviser with respect to the management of the fund’s managed risk strategy.
40 American Funds Insurance Series
Table of Contents
Managed Risk International Fund
Fund results shown are for past periods and are not predictive of results for future periods. Current and future results may be lower or higher than those shown. Prices and returns will vary, so investors may lose money. Investing for short periods makes losses more likely. For current information and month-end results, visit capitalgroup.com/afis. For information about your insurance contract and month-end results, go to the website of the company that issued your contract.
The fund gained 3.13% for the 12 months ended December 31, 2020, compared to the S&P EPAC Ex. Korea LargeMidCap Managed Risk Index – Moderate Aggressive1, which was flat at 0.00%. The MSCI ACWI (All Country World Index) ex USA2, a free float-adjusted market capitalization-weighted index that is designed to measure equity market results in the global developed and emerging markets (consisting of more than 40 developed and emerging market country indexes, excluding the U.S.), increased 10.65%.
The fund pursues its objective by investing in shares of American Funds Insurance Series – International FundSM and American Funds Insurance Series – Bond FundSM while seeking to manage portfolio volatility and provide downside protection, primarily through the use of exchange-traded futures. The benefit of the fund’s managed risk strategy should be most apparent during periods of high volatility and in down markets. In steady or rising markets, the fund’s results can be expected to lag those of the underlying fund.
The underlying International Fund’s investments in the consumer discretionary and health care sectors were additive to relative returns, while stock selection in the industrials sector detracted from relative results.
How a hypothetical $10,000 investment has grown
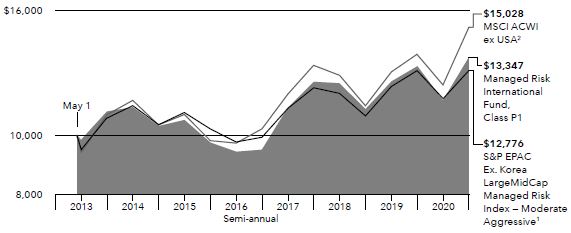
Total returns based on a $1,000 investment For periods ended December 31, 20203
| 1 year | 5 years | Lifetime (since May 1, 2013) | Gross expense ratio | Net expense ratio | ||||||||||||||||
Class P1 | 3.13 | % | 6.60 | % | 3.84 | % | .94 | % | .86 | % | ||||||||||
Class P2 | 2.80 | 6.19 | 3.46 | 1.19 | 1.11 | |||||||||||||||
The investment adviser is currently waiving a portion of its management fee. In addition, the investment adviser is currently reimbursing a portion of other expenses. This waiver and reimbursement will be in effect through at least May 1, 2022. The adviser may elect at its discretion to extend, modify or terminate the reimbursement at that time. The waiver may only be modified or terminated with the approval of the series’ board. When applicable, investment results reflect fee waivers and/or expense reimbursements, without which results would have been lower. Visit capitalgroup.com for more information. Expense ratios are restated to reflect current fees and are as of the fund’s prospectus dated May 1, 2021 (unaudited).
Any market index shown is unmanaged and, therefore, has no expenses. Investors cannot invest directly in an index.
| 1 | Source: S&P Dow Jones Indices LLC. Standard & Poor’s Managed Risk Index Series is designed to simulate a dynamic protective portfolio that allocates between the underlying equity index and cash, based on realized volatilities of the underlying equity and bond indexes, while maintaining a fixed allocation to the underlying bond index. |
| 2 | Source: MSCI. The MSCI index result reflects reinvestment of distributions and dividends net of withholding taxes. |
| 3 | Periods greater than one year are annualized. |
Milliman Financial Risk Management LLC serves as the subadviser with respect to the management of the fund’s managed risk strategy.
American Funds Insurance Series 41
Table of Contents
Managed Risk Blue Chip Income and Growth Fund
Fund results shown are for past periods and are not predictive of results for future periods. Current and future results may be lower or higher than those shown. Prices and returns will vary, so investors may lose money. Investing for short periods makes losses more likely. For current information and month-end results, visit capitalgroup.com/afis. For information about your insurance contract and month-end results, go to the website of the company that issued your contract.
The fund declined 0.93% for the 12 months ended December 31, 2020. S&P 500 Managed Risk Index — Moderate1 gained 7.01%. Standard & Poor’s 500 Composite Index2, a market capitalization-weighted index based on the results of approximately 500 widely held common stocks, increased 18.40%.
The fund pursues its objective by investing in shares of American Funds Insurance Series — Blue Chip Income and Growth FundSM and American Funds Insurance Series — U.S. Government/AAA-Rated Securities FundSM while seeking to manage portfolio volatility and provide downside protection, primarily through the use of exchange-traded futures. The benefit of the fund’s managed risk strategy should be most apparent during periods of high volatility and in down markets. In steady or rising markets, the fund’s results can be expected to lag those of the underlying fund.
The underlying Blue Chip Income and Growth Fund’s investments in the financials sector was additive to relative returns, while stock selection in the energy sector detracted from relative results.
How a hypothetical $10,000 investment has grown
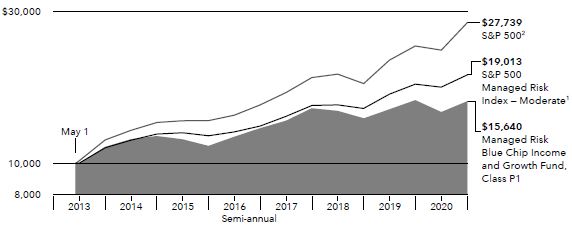
Total returns based on a $1,000 investment For periods ended December 31, 20203
| 1 year | 5 years | Lifetime (since May 1, 2013) | Gross expense ratio | Net expense ratio | ||||||||||||||||
Class P1 | –0.93 | % | 6.68 | % | 6.01 | % | .68 | % | .63 | % | ||||||||||
Class P2 | –1.25 | 6.32 | 5.64 | .93 | .88 | |||||||||||||||
The investment adviser is currently waiving a portion of its management fee. This waiver will be in effect through at least May 1, 2022. The waiver may only be modified or terminated with the approval of the series’ board. When applicable, investment results reflect fee waivers and/or expense reimbursements, without which results would have been lower. Visit capitalgroup.com for more information. Expense ratios are restated to reflect current fees and are as of the fund’s prospectus dated May 1, 2021 (unaudited).
Any market index shown is unmanaged and, therefore, has no expenses. Investors cannot invest directly in an index.
| 1 | Source: S&P Dow Jones Indices LLC. Standard & Poor’s Managed Risk Index Series is designed to simulate a dynamic protective portfolio that allocates between the underlying equity index and cash, based on realized volatilities of the underlying equity and bond indexes, while maintaining a fixed allocation to the underlying bond index. |
| 2 | Source: S&P Dow Jones Indices LLC. |
| 3 | Periods greater than one year are annualized. |
Milliman Financial Risk Management LLC serves as the subadviser with respect to the management of the fund’s managed risk strategy.
42 American Funds Insurance Series
Table of Contents
Managed Risk Growth-Income Fund
Fund results shown are for past periods and are not predictive of results for future periods. Current and future results may be lower or higher than those shown. Prices and returns will vary, so investors may lose money. Investing for short periods makes losses more likely. For current information and month-end results, visit capitalgroup.com/afis. For information about your insurance contract and month-end results, go to the website of the company that issued your contract.
The fund gained 9.85% for the 12 months ended December 31, 2020, compared to the S&P 500 Managed Risk Index — Moderate1, which rose 7.01%. Standard & Poor’s 500 Composite Index2, a market capitalization-weighted index based on the results of approximately 500 widely held common stocks, increased 18.40%.
The fund pursues its objective by investing in shares of American Funds Insurance Series — Growth-Income FundSM and American Funds Insurance Series — Bond FundSM while seeking to manage portfolio volatility and provide downside protection, primarily through the use of exchange-traded futures. The benefit of the fund’s managed risk strategy should be most apparent during periods of high volatility and in down markets. In steady or rising markets, the fund’s results can be expected to lag those of the underlying fund.
The underlying Growth-Income Fund’s stock selection in the communication services sector was a top contributor to relative returns, while stock selection in the information technology sector detracted from relative results.
How a hypothetical $10,000 investment has grown
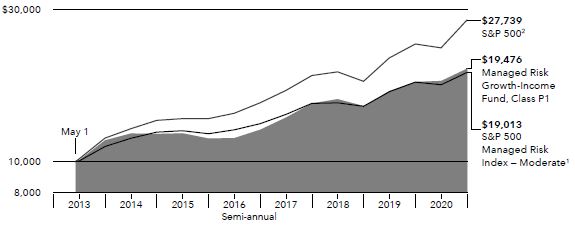
Total returns based on a $1,000 investment For periods ended December 31, 20203
| 1 year | 5 years | Lifetime (since May 1, 2013) | Gross expense ratio | Net expense ratio | ||||||||||||||||
Class P1 | 9.85 | % | 10.58 | % | 9.08 | % | .68 | % | .63 | % | ||||||||||
Class P2 | 9.58 | 10.27 | 8.76 | .93 | .88 | |||||||||||||||
The investment adviser is currently waiving a portion of its management fee. This waiver will be in effect through at least May 1, 2022. The waiver may only be modified or terminated with the approval of the series’ board. When applicable, investment results reflect fee waivers and/or expense reimbursements, without which results would have been lower. Visit capitalgroup.com for more information. Expense ratios are restated to reflect current fees and are as of the fund’s prospectus dated May 1, 2021 (unaudited).
Any market index shown is unmanaged and, therefore, has no expenses. Investors cannot invest directly in an index.
| 1 | Source: S&P Dow Jones Indices LLC. Standard & Poor’s Managed Risk Index Series is designed to simulate a dynamic protective portfolio that allocates between the underlying equity index and cash, based on realized volatilities of the underlying equity and bond indexes, while maintaining a fixed allocation to the underlying bond index. |
| 2 | Source: S&P Dow Jones Indices LLC. |
| 3 | Periods greater than one year are annualized. |
Milliman Financial Risk Management LLC serves as the subadviser with respect to the management of the fund’s managed risk strategy.
American Funds Insurance Series 43
Table of Contents
Managed Risk Asset Allocation Fund
Fund results shown are for past periods and are not predictive of results for future periods. Current and future results may be lower or higher than those shown. Prices and returns will vary, so investors may lose money. Investing for short periods makes losses more likely. For current information and month-end results, visit capitalgroup.com/afis. For information about your insurance contract and month-end results, go to the website of the company that issued your contract.
The fund gained 6.10% for the 12 months ended December 31, 2020. S&P 500 Managed Risk Index — Moderate Conservative1 was up 7.20%. Standard & Poor’s 500 Composite Index2, a market capitalization-weighted index based on the results of approximately 500 widely held common stocks, increased 18.40%.
The fund pursues its objective by investing in shares of American Funds Insurance Series — Asset Allocation FundSM while seeking to manage portfolio volatility and provide downside protection, primarily through the use of exchange-traded futures. The benefit of the fund’s managed risk strategy should be most apparent during periods of high volatility and in down markets. In steady or rising markets, the fund’s results can be expected to lag those of the underlying fund.
The underlying Asset Allocation Fund’s investments in the real estate and information technology sectors were top contributors to relative returns, while stock selection in the energy and industrials sectors detracted from relative results.
44 American Funds Insurance Series
Table of Contents
Managed Risk Asset Allocation Fund (continued)
How a hypothetical $10,000 investment has grown
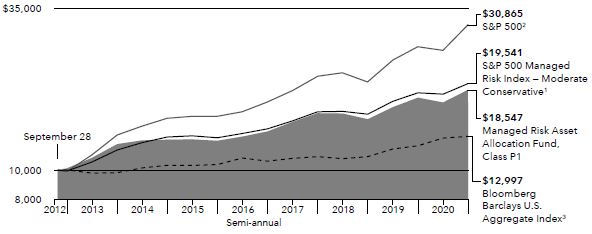
Total returns based on a $1,000 investment For periods ended December 31, 20204
| 1 year | 5 years | Lifetime (since September 28, 2012) | Gross expense ratio | Net expense ratio | ||||||||||||||||
Class P1 | 6.10 | % | 8.17 | % | 7.77 | % | .70 | % | .65 | % | ||||||||||
Class P2 | 5.88 | 7.91 | 7.51 | .95 | .90 | |||||||||||||||
The investment adviser is currently waiving a portion of its management fee. This waiver will be in effect through at least May 1, 2022. The waiver may only be modified or terminated with the approval of the series’ board. When applicable, investment results reflect fee waivers and/or expense reimbursements, without which results would have been lower. Visit capitalgroup.com for more information. Expense ratios are as of the fund’s prospectus dated May 1, 2021 (unaudited).
Any market index shown is unmanaged and, therefore, has no expenses. Investors cannot invest directly in an index.
| 1 | Source: S&P Dow Jones Indices LLC. Standard & Poor’s Managed Risk Index Series is designed to simulate a dynamic protective portfolio that allocates between the underlying equity index and cash, based on realized volatilities of the underlying equity and bond indexes, while maintaining a fixed allocation to the underlying bond index. |
| 2 | Source: S&P Dow Jones Indices LLC. |
| 3 | Source: Bloomberg Index Services Ltd. |
| 4 | Periods greater than one year are annualized. |
Milliman Financial Risk Management LLC serves as the subadviser with respect to the management of the fund’s managed risk strategy.
American Funds Insurance Series 45
Table of Contents
Investment portfolio December 31, 2020
Common stocks 93.72%
| Shares | Value (000) | |||||||
Information technology 31.71% | ||||||||
ASML Holding NV1 | 591,992 | $ | 286,087 | |||||
ASML Holding NV (New York registered) (ADR) | 464,300 | 226,449 | ||||||
Taiwan Semiconductor Manufacturing Company, Ltd.1 | 24,817,000 | 466,100 | ||||||
Taiwan Semiconductor Manufacturing Company, Ltd. (ADR) | 280,000 | 30,531 | ||||||
Microsoft Corp. | 1,902,900 | 423,243 | ||||||
Paycom Software, Inc.2 | 357,000 | 161,453 | ||||||
Adyen NV1,2 | 61,500 | 143,105 | ||||||
PayPal Holdings, Inc.2 | 490,000 | 114,758 | ||||||
Visa Inc., Class A | 515,000 | 112,646 | ||||||
Broadcom Inc. | 233,350 | 102,172 | ||||||
PagSeguro Digital Ltd., Class A2 | 1,340,900 | 76,270 | ||||||
Adobe Inc.2 | 135,000 | 67,516 | ||||||
Zendesk, Inc.2 | 454,000 | 64,977 | ||||||
Samsung Electronics Co., Ltd.1 | 785,100 | 58,676 | ||||||
Amphenol Corp., Class A | 373,500 | 48,843 | ||||||
Keyence Corp.1 | 72,300 | 40,689 | ||||||
EPAM Systems, Inc.2 | 105,240 | 37,713 | ||||||
Advanced Micro Devices, Inc.2 | 301,500 | 27,651 | ||||||
Mastercard Inc., Class A | 67,500 | 24,094 | ||||||
TeamViewer AG1,2 | 428,000 | 22,922 | ||||||
Hexagon AB, Class B1 | 240,000 | 21,855 | ||||||
Amadeus IT Group SA, Class A, non-registered shares1 | 212,301 | 15,370 | ||||||
Worldline SA, non-registered shares1,2 | 152,800 | 14,779 | ||||||
Network International Holdings PLC1,2 | 3,173,000 | 14,168 | ||||||
Jack Henry & Associates, Inc. | 69,400 | 11,242 | ||||||
|
| |||||||
| 2,613,309 | ||||||||
|
| |||||||
Consumer discretionary 20.46% | ||||||||
Amazon.com, Inc.2 | 145,050 | 472,419 | ||||||
Alibaba Group Holding Ltd.1,2 | 5,241,300 | 153,138 | ||||||
Chipotle Mexican Grill, Inc.2 | 107,400 | 148,933 | ||||||
Just Eat Takeaway (GBP denominated)1,2 | 640,914 | 72,424 | ||||||
Just Eat Takeaway (EUR denominated)1,2 | 347,000 | 39,116 | ||||||
LVMH Moët Hennessy-Louis Vuitton SE1 | 158,900 | 99,286 | ||||||
Ocado Group PLC1,2 | 2,881,000 | 90,274 | ||||||
Domino’s Pizza, Inc. | 156,800 | 60,127 | ||||||
NIKE, Inc., Class B | 383,100 | 54,197 | ||||||
Floor & Decor Holdings, Inc., Class A2 | 546,500 | 50,742 | ||||||
Prosus NV1 | 447,800 | 48,171 | ||||||
Renault SA1,2 | 1,100,000 | 48,132 | ||||||
MercadoLibre, Inc.2 | 16,400 | 27,474 | ||||||
Meituan, Class B1,2 | 699,700 | 26,761 | ||||||
Naspers Ltd., Class N1 | 122,700 | 25,113 | ||||||
Home Depot, Inc. | 92,275 | 24,510 | ||||||
Sony Corp.1 | 243,000 | 24,432 | ||||||
MGM China Holdings, Ltd.1,3 | 12,708,000 | 21,841 | ||||||
Peugeot SA1,2 | 761,800 | 20,848 | ||||||
XPeng Inc., Class A (ADR)2,3 | 445,100 | 19,064 | ||||||
Delivery Hero SE1,2 | 118,000 | 18,315 | ||||||
Wynn Macau, Ltd.1,2 | 10,510,400 | 17,672 | ||||||
Flutter Entertainment PLC (EUR denominated)1 | 84,650 | 17,339 | ||||||
JD Health International Inc.1,2,3 | 893,550 | 17,289 | ||||||
IDP Education Ltd.1 | 1,119,000 | 17,141 | ||||||
EssilorLuxottica1 | 102,335 | 15,960 | ||||||
Melco Resorts & Entertainment Ltd. (ADR) | 835,000 | 15,489 | ||||||
Moncler SpA1,2 | 217,370 | 13,296 | ||||||
THG Holdings PLC1,2 | 1,026,870 | 10,965 | ||||||
Marriott International, Inc., Class A | 74,000 | 9,762 | ||||||
Airbnb, Inc., Class A2 | 41,500 | 6,092 | ||||||
|
| |||||||
| 1,686,322 | ||||||||
|
| |||||||
46 American Funds Insurance Series
Table of Contents
Global Growth Fund (continued)
Common stocks (continued)
| Shares | Value (000) | |||||||
Health care 11.35% | ||||||||
UnitedHealth Group Inc. | 276,800 | $ | 97,068 | |||||
DexCom, Inc.2 | 253,000 | 93,539 | ||||||
Mettler-Toledo International Inc.2 | 65,000 | 74,079 | ||||||
AstraZeneca PLC1 | 674,300 | 67,369 | ||||||
Pfizer Inc. | 1,699,000 | 62,540 | ||||||
Fisher & Paykel Healthcare Corp. Ltd.1 | 2,550,000 | 60,555 | ||||||
Cigna Corp. | 290,214 | 60,417 | ||||||
NovoCure Ltd.2 | 340,000 | 58,834 | ||||||
Merck & Co., Inc. | 620,000 | 50,716 | ||||||
Regeneron Pharmaceuticals, Inc.2 | 98,300 | 47,490 | ||||||
Tandem Diabetes Care, Inc.2 | 285,000 | 27,269 | ||||||
Danaher Corp. | 110,000 | 24,435 | ||||||
Humana Inc. | 55,000 | 22,565 | ||||||
Zoetis Inc., Class A | 130,000 | 21,515 | ||||||
Bayer AG1 | 363,860 | 21,387 | ||||||
Catalent, Inc.2 | 200,000 | 20,814 | ||||||
bioMérieux SA1 | 135,000 | 19,038 | ||||||
Olympus Corp.1 | 796,800 | 17,442 | ||||||
Novartis AG1 | 165,600 | 15,641 | ||||||
Rede D’Or Sao Luiz SA2 | 1,060,000 | 13,938 | ||||||
Sanofi1 | 135,000 | 13,044 | ||||||
Teladoc Health, Inc.2 | 63,600 | 12,717 | ||||||
Vertex Pharmaceuticals Inc.2 | 49,500 | 11,699 | ||||||
GN Store Nord AS1 | 115,500 | 9,180 | ||||||
Coloplast A/S, Class B1 | 55,750 | 8,516 | ||||||
Viatris Inc.2 | 179,542 | 3,365 | ||||||
|
| |||||||
| 935,172 | ||||||||
|
| |||||||
Financials 9.80% | ||||||||
AIA Group Ltd.1 | 12,338,700 | 151,984 | ||||||
Tradeweb Markets Inc., Class A | 1,685,360 | 105,251 | ||||||
Kotak Mahindra Bank Ltd.1,2 | 3,704,500 | 101,380 | ||||||
MarketAxess Holdings Inc. | 151,400 | 86,383 | ||||||
JPMorgan Chase & Co. | 438,700 | 55,746 | ||||||
AXA SA1 | 1,692,893 | 40,614 | ||||||
Prudential PLC1 | 1,773,082 | 32,728 | ||||||
Citigroup Inc. | 497,600 | 30,682 | ||||||
Moscow Exchange MICEX-RTS PJSC1 | 12,640,000 | 27,274 | ||||||
CME Group Inc., Class A | 144,437 | 26,295 | ||||||
Société Générale1,2 | 1,011,450 | 21,071 | ||||||
BlackRock, Inc. | 26,500 | 19,121 | ||||||
Willis Towers Watson PLC | 73,000 | 15,380 | ||||||
HDFC Life Insurance Company Ltd.1,2 | 1,589,691 | 14,746 | ||||||
FinecoBank SpA1,2 | 893,000 | 14,573 | ||||||
QBE Insurance Group Ltd.1 | 2,132,000 | 14,036 | ||||||
Bank of America Corp. | 385,000 | 11,669 | ||||||
Macquarie Group Ltd.1 | 101,500 | 10,845 | ||||||
Lufax Holding Ltd. (ADR)2,3 | 680,000 | 9,656 | ||||||
Sberbank of Russia PJSC (ADR)1 | 645,500 | 9,305 | ||||||
Banco Santander, SA1,2 | 2,946,020 | 9,147 | ||||||
|
| |||||||
| 807,886 | ||||||||
|
| |||||||
Communication services 7.24% | ||||||||
Alphabet Inc., Class A2 | 95,500 | 167,377 | ||||||
Alphabet Inc., Class C2 | 63,852 | 111,861 | ||||||
Tencent Holdings Ltd.1 | 2,028,000 | 148,180 | ||||||
Facebook, Inc., Class A2 | 395,600 | 108,062 | ||||||
Altice USA, Inc., Class A2 | 751,200 | 28,448 | ||||||
Sea Ltd., Class A (ADR)2 | 95,851 | 19,079 | ||||||
Twitter, Inc.2 | 252,000 | 13,646 | ||||||
|
| |||||||
| 596,653 | ||||||||
|
| |||||||
American Funds Insurance Series 47
Table of Contents
Global Growth Fund (continued)
Common stocks (continued)
| Shares | Value (000) | |||||||
Consumer staples 6.07% | ||||||||
British American Tobacco PLC1 | 2,921,900 | $ | 108,680 | |||||
Kweichow Moutai Co., Ltd., Class A1 | 269,957 | 82,496 | ||||||
Philip Morris International Inc. | 919,500 | 76,125 | ||||||
Nestlé SA1 | 495,497 | 58,334 | ||||||
Keurig Dr Pepper Inc. | 1,624,000 | 51,968 | ||||||
Altria Group, Inc. | 1,248,500 | 51,189 | ||||||
Walgreens Boots Alliance, Inc. | 657,651 | 26,227 | ||||||
Associated British Foods PLC1,2 | 595,000 | 18,435 | ||||||
Costco Wholesale Corp. | 42,170 | 15,889 | ||||||
Mondelez International, Inc. | 192,000 | 11,226 | ||||||
|
| |||||||
| 500,569 | ||||||||
|
| |||||||
Industrials 3.51% | ||||||||
MTU Aero Engines AG1 | 167,000 | 43,512 | ||||||
Airbus SE, non-registered shares1,2 | 327,000 | 35,921 | ||||||
DSV Panalpina A/S1 | 201,000 | 33,638 | ||||||
Alliance Global Group, Inc.1 | 135,603,500 | 29,946 | ||||||
GT Capital Holdings, Inc.1 | 2,454,611 | 29,915 | ||||||
Safran SA1,2 | 164,000 | 23,259 | ||||||
NIBE Industrier AB, Class B1 | 685,000 | 22,494 | ||||||
Nidec Corp.1 | 149,100 | 18,786 | ||||||
SMC Corp.1 | 22,500 | 13,741 | ||||||
General Electric Co. | 1,260,000 | 13,608 | ||||||
Country Garden Services Holdings Co., Ltd.1 | 2,003,000 | 13,586 | ||||||
Boeing Company | 51,300 | 10,981 | ||||||
|
| |||||||
| 289,387 | ||||||||
|
| |||||||
Materials 1.84% | ||||||||
Sherwin-Williams Company | 153,900 | 113,103 | ||||||
Shin-Etsu Chemical Co., Ltd.1 | 119,500 | 20,920 | ||||||
Koninklijke DSM NV1 | 101,700 | 17,519 | ||||||
|
| |||||||
| 151,542 | ||||||||
|
| |||||||
Energy 1.10% | ||||||||
Reliance Industries Ltd.1 | 1,807,924 | 49,250 | ||||||
Reliance Industries Ltd., interim shares1 | 106,956 | 1,640 | ||||||
Gazprom PJSC (ADR)1 | 4,173,000 | 23,198 | ||||||
LUKOIL Oil Co. PJSC (ADR)1 | 246,300 | 16,794 | ||||||
|
| |||||||
| 90,882 | ||||||||
|
| |||||||
Real estate 0.41% | ||||||||
Goodman Logistics (HK) Ltd. REIT1 | 1,276,503 | 18,621 | ||||||
ESR Cayman Ltd.1,2 | 4,100,000 | 14,735 | ||||||
|
| |||||||
| 33,356 | ||||||||
|
| |||||||
Utilities 0.23% | ||||||||
Ørsted AS1 | 91,250 | 18,663 | ||||||
|
| |||||||
Total common stocks (cost: $3,554,514,000) | 7,723,741 | |||||||
|
| |||||||
Preferred securities 2.90% | ||||||||
Health care 1.84% | ||||||||
Sartorius AG, nonvoting preferred, non-registered shares1 | 360,500 | 151,100 | ||||||
|
| |||||||
Information technology 1.06% | ||||||||
Samsung Electronics Co., Ltd., nonvoting preferred shares1 | 1,289,000 | 87,500 | ||||||
|
| |||||||
Total preferred securities (cost: $70,623,000) | 238,600 | |||||||
|
| |||||||
48 American Funds Insurance Series
Table of Contents
Global Growth Fund (continued)
Short-term securities 3.87%
Principal (000) | Value (000) | |||||||
Commercial paper 2.12% | ||||||||
Toronto-Dominion Bank 0.19% due 1/19/20214 | $ | 100,000 | $ | 99,993 | ||||
NRW.Bank 0.21% due 1/22/20214 | 59,000 | 58,995 | ||||||
LVMH Moët Hennessy Louis Vuitton Inc. 0.15% due 1/14/20214 | 16,000 | 15,999 | ||||||
|
| |||||||
| 174,987 | ||||||||
|
| |||||||
| Shares | ||||||||
Money market investments 1.75% | ||||||||
Capital Group Central Cash Fund 0.12%5,6 | 1,256,834 | 125,696 | ||||||
Goldman Sachs Financial Square Government Fund, Institutional Shares 0.02%5,7 | 18,274,600 | 18,274 | ||||||
|
| |||||||
| 143,970 | ||||||||
|
| |||||||
Total short-term securities (cost: $318,936,000) | 318,957 | |||||||
|
| |||||||
Total investment securities 100.49% (cost: $3,944,073,000) | 8,281,298 | |||||||
Other assets less liabilities (0.49)% | (40,328 | ) | ||||||
|
| |||||||
Net assets 100.00% | $ | 8,240,970 | ||||||
|
| |||||||
Investments in affiliates6
| Value of affiliate at 1/1/2020 (000) | Additions (000) | Reductions (000) | Net realized gain (000) | Net unrealized depreciation (000) | Value of affiliate at 12/31/2020 (000) | Dividend income (000) | ||||||||||||||||||||||
Short-term securities 1.53% | ||||||||||||||||||||||||||||
Money market investments 1.53% | ||||||||||||||||||||||||||||
Capital Group Central Cash Fund 0.12%5 | $ | 137,140 | $ | 1,204,128 | $ | 1,215,496 | $ | 170 | $ | (246 | ) | $ | 125,696 | $ | 973 | |||||||||||||
| 1 | Valued under fair value procedures adopted by authority of the board of trustees. The total value of all such securities was $3,662,002,000, which represented 44.44% of the net assets of the fund. This entire amount relates to certain securities trading outside the U.S. whose values were adjusted as a result of significant market movements following the close of local trading. |
| 2 | Security did not produce income during the last 12 months. |
| 3 | All or a portion of this security was on loan. The total value of all such securities was $21,446,000, which represented .26% of the net assets of the fund. Refer to Note 5 for more information on securities lending. |
| 4 | Acquired in a transaction exempt from registration under Section 4(2) of the Securities Act of 1933. May be resold in the U.S. in transactions exempt from registration, normally to qualified institutional buyers. The total value of all such securities was $174,987,000, which represented 2.12% of the net assets of the fund. |
| 5 | Rate represents the seven-day yield at 12/31/2020. |
| 6 | Part of the same group of investment companies as the fund as defined under the Investment Company Act of 1940. |
| 7 | Security purchased with cash collateral from securities on loan. Refer to Note 5 for more information on securities lending. |
Key to abbreviations
ADR = American Depositary Receipts
EUR = Euros
GBP = British pounds
See notes to financial statements.
American Funds Insurance Series 49
Table of Contents
Global Small Capitalization Fund
Investment portfolio December 31, 2020
Common stocks 95.25%
| Shares | Value (000) | |||||||
Information technology 27.03% | ||||||||
Cree, Inc.1 | 1,356,800 | $ | 143,685 | |||||
Ceridian HCM Holding Inc.1 | 730,900 | 77,885 | ||||||
Net One Systems Co., Ltd.2 | 1,855,865 | 65,640 | ||||||
BE Semiconductor Industries NV2 | 801,930 | 48,310 | ||||||
Kingdee International Software Group Co. Ltd.2 | 11,717,074 | 48,085 | ||||||
PAR Technology Corp.1,3 | 700,482 | 43,983 | ||||||
SimCorp AS2 | 265,750 | 39,473 | ||||||
Unimicron Technology Corp.2 | 12,305,000 | 38,529 | ||||||
Appfolio, Inc., Class A1 | 203,903 | 36,711 | ||||||
Inphi Corp.1 | 215,191 | 34,532 | ||||||
Avast PLC2 | 4,532,443 | 33,340 | ||||||
Silergy Corp.2 | 383,740 | 32,898 | ||||||
Avalara, Inc.1 | 194,419 | 32,058 | ||||||
C3.ai, Inc., Class A1,3 | 229,200 | 31,801 | ||||||
Qorvo, Inc.1 | 190,000 | 31,591 | ||||||
Lightspeed POS Inc., subordinate voting shares1 | 443,300 | 31,204 | ||||||
Skillz Inc., Class A1,2,4 | 1,399,676 | 24,914 | ||||||
Euronet Worldwide, Inc.1 | 167,890 | 24,331 | ||||||
Smartsheet Inc., Class A1 | 337,600 | 23,392 | ||||||
Bentley Systems, Inc., Class B | 563,300 | 22,819 | ||||||
Pegasystems Inc. | 169,591 | 22,600 | ||||||
Nuance Communications, Inc.1 | 499,400 | 22,019 | ||||||
Globant SA1 | 101,000 | 21,979 | ||||||
SUMCO Corp.2 | 999,000 | 21,934 | ||||||
Carel Industries SpA2 | 929,751 | 21,804 | ||||||
Anaplan, Inc.1 | 295,733 | 21,248 | ||||||
Alteryx, Inc., Class A1 | 173,000 | 21,070 | ||||||
MACOM Technology Solutions Holdings, Inc.1 | 380,000 | 20,915 | ||||||
AI inside Inc.1,2 | 27,813 | 19,667 | ||||||
Nordic Semiconductor ASA1,2 | 1,196,967 | 19,159 | ||||||
LEM Holding SA2 | 9,570 | 18,679 | ||||||
Paycom Software, Inc.1 | 40,000 | 18,090 | ||||||
Bechtle AG, non-registered shares2 | 77,700 | 16,945 | ||||||
Oneconnect Financial Technology Co., Ltd. (ADR)1 | 830,436 | 16,368 | ||||||
Network International Holdings PLC1,2 | 3,434,882 | 15,338 | ||||||
Silicon Laboratories Inc.1 | 115,900 | 14,759 | ||||||
Keywords Studios PLC1,2 | 350,000 | 13,734 | ||||||
SoftwareONE Holding AG2 | 449,700 | 13,300 | ||||||
JFrog Ltd.1,3 | 209,100 | 13,138 | ||||||
ON Semiconductor Corp.1 | 395,000 | 12,928 | ||||||
Aspen Technology, Inc.1 | 93,100 | 12,126 | ||||||
Tanla Platforms Ltd.2 | 1,339,330 | 12,106 | ||||||
Asana, Inc., Class A1 | 401,900 | 11,876 | ||||||
Cognex Corp. | 136,300 | 10,943 | ||||||
Rapid7, Inc.1 | 121,000 | 10,909 | ||||||
Nuvei Corp., subordinate voting shares1 | 173,200 | 10,432 | ||||||
Computer Services, Inc. | 163,500 | 9,712 | ||||||
Paya Holdings Inc., Class A1,3 | 667,000 | 9,058 | ||||||
MongoDB, Inc., Class A1 | 25,000 | 8,976 | ||||||
SHIFT Inc.1,2 | 63,700 | 8,799 | ||||||
Renishaw PLC1,2 | 100,000 | 7,876 | ||||||
Globalwafers Co., Ltd.2 | 311,000 | 7,870 | ||||||
DocuSign, Inc.1 | 34,300 | 7,625 | ||||||
QAD Inc., Class A | 115,350 | 7,288 | ||||||
ALTEN SA, non-registered shares1,2 | 63,900 | 7,238 | ||||||
Megaport Ltd.1,2 | 650,000 | 7,134 | ||||||
Okta, Inc., Class A1 | 27,263 | 6,932 | ||||||
INFICON Holding AG2 | 7,397 | 6,748 | ||||||
Allegro Microsystems, Inc.1 | 246,500 | 6,572 | ||||||
Coupa Software Inc.1 | 18,000 | 6,100 | ||||||
BigCommerce Holdings, Inc., Series 11,3 | 90,000 | 5,773 | ||||||
SVMK Inc.1 | 221,600 | 5,662 | ||||||
50 American Funds Insurance Series
Table of Contents
Global Small Capitalization Fund (continued)
Common stocks (continued)
| Shares | Value (000) | |||||||
Information technology (continued) | ||||||||
Pexip Holding ASA1,2,3 | 676,082 | $ | 5,193 | |||||
Yangtze Optical Fibre and Cable Joint Stock Ltd. Co., Class H2 | 3,605,500 | 4,827 | ||||||
Tyro Payments Ltd.1,2,3 | 1,727,332 | 4,251 | ||||||
Appen Ltd.2 | 162,863 | 3,117 | ||||||
|
| |||||||
| 1,435,998 | ||||||||
|
| |||||||
Health care 22.94% | ||||||||
Insulet Corp.1 | 567,720 | 145,126 | ||||||
Haemonetics Corp.1 | 796,700 | 94,608 | ||||||
Allakos Inc.1 | 586,080 | 82,051 | ||||||
Notre Dame Intermédica Participações SA | 4,089,700 | 61,682 | ||||||
WuXi Biologics (Cayman) Inc.1,2 | 4,236,000 | 56,424 | ||||||
GW Pharmaceuticals PLC (ADR)1 | 473,768 | 54,678 | ||||||
iRhythm Technologies, Inc.1 | 213,120 | 50,554 | ||||||
Mani, Inc.2 | 1,808,129 | 49,243 | ||||||
CanSino Biologics Inc., Class H1,2 | 2,132,400 | 48,805 | ||||||
Ultragenyx Pharmaceutical Inc.1 | 325,474 | 45,055 | ||||||
Applied Molecular Transport Inc.1,3 | 1,365,957 | 42,030 | ||||||
Health Catalyst, Inc.1 | 922,700 | 40,165 | ||||||
Integra LifeSciences Holdings Corp.1 | 602,696 | 39,127 | ||||||
PRA Health Sciences, Inc.1 | 257,150 | 32,257 | ||||||
New Frontier Health Corp., Class A1 | 3,422,000 | 29,429 | ||||||
Kronos Bio, Inc.1,2 | 619,195 | 17,386 | ||||||
Kronos Bio, Inc.1 | 387,795 | 11,583 | ||||||
Globus Medical, Inc., Class A1 | 434,000 | 28,305 | ||||||
CompuGroup Medical SE & Co. KGaA2 | 277,700 | 26,669 | ||||||
GVS SpA1,2 | 1,350,919 | 25,165 | ||||||
Allogene Therapeutics, Inc.1 | 947,234 | 23,908 | ||||||
Nevro Corp.1 | 128,100 | 22,174 | ||||||
Cortexyme, Inc.1,3 | 759,458 | 21,098 | ||||||
CONMED Corp. | 157,000 | 17,584 | ||||||
Max Healthcare Institute Ltd.1,2 | 8,885,394 | 17,116 | ||||||
Amplifon SpA1,2 | 401,700 | 16,646 | ||||||
Guardant Health, Inc.1 | 119,227 | 15,366 | ||||||
Ambu AS, Class B, non-registered shares2,3 | 283,500 | 12,241 | ||||||
Ocumension Therapeutics1,2 | 3,168,466 | 11,051 | ||||||
NuCana PLC (ADR)1,3 | 2,356,233 | 10,579 | ||||||
AddLife AB, Class B2 | 553,888 | 9,693 | ||||||
Bluebird Bio, Inc.1 | 196,815 | 8,516 | ||||||
BioMarin Pharmaceutical Inc.1 | 92,000 | 8,067 | ||||||
Shandong Pharmaceutical Glass Co., Ltd., Class A2 | 955,000 | 7,342 | ||||||
Madrigal Pharmaceuticals, Inc.1 | 61,425 | 6,829 | ||||||
Encompass Health Corp. | 79,000 | 6,533 | ||||||
Bachem Holding AG, Class B2 | 14,100 | 6,266 | ||||||
Arjo AB, Class B2 | 765,000 | 5,842 | ||||||
Hikma Pharmaceuticals PLC2 | 131,000 | 4,512 | ||||||
Hutchison China MediTech Ltd. (ADR)1 | 124,000 | 3,970 | ||||||
Uniphar PLC2 | 1,022,000 | 2,974 | ||||||
NMC Health PLC1,2,5 | 219,652 | 3 | ||||||
|
| |||||||
| 1,218,652 | ||||||||
|
| |||||||
Consumer discretionary 14.67% | ||||||||
Shop Apotheke Europe NV, non-registered shares1,2,3 | 282,300 | 51,122 | ||||||
Wyndham Hotels & Resorts, Inc. | 808,069 | 48,032 | ||||||
Helen of Troy Ltd.1 | 207,200 | 46,038 | ||||||
Lands’ End, Inc.1,6 | 2,100,000 | 45,297 | ||||||
Thor Industries, Inc. | 463,600 | 43,110 | ||||||
YETI Holdings, Inc.1 | 593,379 | 40,629 | ||||||
Mattel, Inc.1 | 2,100,069 | 36,646 | ||||||
Five Below, Inc.1 | 199,700 | 34,944 | ||||||
Evolution Gaming Group AB2 | 328,676 | 33,323 | ||||||
Entain PLC1,2 | 1,748,600 | 27,143 | ||||||
American Funds Insurance Series 51
Table of Contents
Global Small Capitalization Fund (continued)
Common stocks (continued)
| Shares | Value (000) | |||||||
Consumer discretionary (continued) | ||||||||
Leslie’s, Inc.1,3 | 824,800 | $ | 22,888 | |||||
Arco Platform Ltd., Class A1 | 638,725 | 22,668 | ||||||
Skechers USA, Inc., Class A1 | 550,000 | 19,767 | ||||||
Tongcheng-Elong Holdings Ltd.1,2 | 10,084,800 | 19,537 | ||||||
Just Eat Takeaway (EUR denominated)1,2 | 166,200 | 18,735 | ||||||
Tube Investments of India Ltd.2 | 1,700,000 | 18,641 | ||||||
Everi Holdings Inc.1 | 1,324,553 | 18,292 | ||||||
Kindred Group PLC (SDR)1,2 | 1,806,800 | 17,683 | ||||||
zooplus AG, non-registered shares1,2 | 78,700 | 16,299 | ||||||
Melco International Development Ltd.2 | 7,826,000 | 15,240 | ||||||
B2W - Cia. Digital, ordinary nominative1 | 1,010,093 | 14,704 | ||||||
SSP Group PLC2 | 3,233,990 | 14,687 | ||||||
TopBuild Corp.1 | 73,600 | 13,548 | ||||||
Musti Group Oyj1,2 | 436,550 | 13,083 | ||||||
Bright Horizons Family Solutions Inc.1 | 74,300 | 12,853 | ||||||
Purple Innovation, Inc., Class A1 | 390,000 | 12,847 | ||||||
Basic-Fit NV1,2 | 348,300 | 12,725 | ||||||
Cie. Plastic Omnium SA2 | 308,912 | 10,724 | ||||||
IDP Education Ltd.2 | 691,561 | 10,594 | ||||||
Patrick Industries, Inc. | 131,700 | 9,002 | ||||||
Thule Group AB1,2 | 219,800 | 8,215 | ||||||
Cairn Homes PLC1,2 | 6,829,200 | 7,972 | ||||||
Sushiro Global Holdings Ltd.2 | 187,000 | 7,142 | ||||||
OneSpaWorld Holdings Ltd. | 695,690 | 7,054 | ||||||
Zhongsheng Group Holdings Ltd.2 | 938,500 | 6,691 | ||||||
Elior Group SA2 | 882,500 | 5,961 | ||||||
Countryside Properties PLC2 | 743,015 | 4,771 | ||||||
Kerry Express (Thailand) PCL, foreign registered1,2 | 2,250,000 | 3,699 | ||||||
Dalata Hotel Group PLC1,2 | 800,000 | 3,689 | ||||||
Coursera, Inc.1,2,5,7 | 160,625 | 2,409 | ||||||
DraftKings Inc., Class A1 | 16,755 | 780 | ||||||
China Zenix Auto International Ltd. (ADR)1 | 428,500 | 111 | ||||||
|
| |||||||
| 779,295 | ||||||||
|
| |||||||
Industrials 13.20% | ||||||||
Nihon M&A Center Inc.2 | 1,304,292 | 87,283 | ||||||
Boyd Group Services Inc.3 | 233,326 | 40,246 | ||||||
International Container Terminal Services, Inc.2 | 15,047,500 | 38,708 | ||||||
Stericycle, Inc.1 | 539,531 | 37,406 | ||||||
IMCD NV2 | 285,600 | 36,288 | ||||||
Meggitt PLC1,2 | 5,035,900 | 32,174 | ||||||
Bingo Industries Ltd.2,3 | 14,571,008 | 27,435 | ||||||
Instalco AB2 | 836,795 | 25,503 | ||||||
Japan Elevator Service Holdings Co., Ltd.2 | 970,400 | 24,707 | ||||||
Alfen NV1,2 | 227,700 | 22,879 | ||||||
Interpump Group SpA2 | 447,000 | 22,084 | ||||||
Nolato AB, Class B1,2 | 185,100 | 18,716 | ||||||
Melrose Industries PLC1,2 | 7,236,000 | 17,647 | ||||||
Wizz Air Holdings PLC1,2 | 278,200 | 17,375 | ||||||
VAT Group AG2 | 68,150 | 16,986 | ||||||
Diploma PLC2 | 556,200 | 16,689 | ||||||
Avon Rubber PLC2 | 383,500 | 16,610 | ||||||
Matson, Inc. | 289,400 | 16,487 | ||||||
Cleanaway Waste Management Ltd.2 | 7,580,970 | 13,779 | ||||||
Centre Testing International Group Co., Ltd.2 | 3,266,269 | 13,692 | ||||||
Han’s Laser Technology Industry Group Co., Ltd., Class A2 | 2,037,982 | 13,354 | ||||||
Woodward, Inc. | 105,000 | 12,761 | ||||||
Granite Construction Inc. | 465,000 | 12,420 | ||||||
Guangzhou Baiyun International Airport Co. Ltd., Class A2 | 5,704,039 | 12,329 | ||||||
Marel hf.2 | 1,971,482 | 12,157 | ||||||
Rumo SA1 | 3,025,547 | 11,207 | ||||||
CAE Inc. | 375,000 | 10,391 | ||||||
52 American Funds Insurance Series
Table of Contents
Global Small Capitalization Fund (continued)
Common stocks (continued)
| Shares | Value (000) | |||||||
Industrials (continued) | ||||||||
IAA, Inc.1 | 141,750 | $ | 9,211 | |||||
Addtech AB, Class B2 | 497,200 | 6,583 | ||||||
Montrose Environmental Group, Inc.1 | 190,800 | 5,907 | ||||||
Nitto Boseki Co., Ltd.2 | 132,500 | 5,853 | ||||||
Atlas Corp. | 500,000 | 5,420 | ||||||
Imperial Logistics Ltd.2 | 2,103,000 | 5,351 | ||||||
TOMRA Systems ASA2 | 106,900 | 5,268 | ||||||
BWX Technologies, Inc. | 85,000 | 5,124 | ||||||
BELIMO Holding AG2 | 523 | 4,543 | ||||||
VARTA AG, non-registered shares1,2,3 | 30,875 | 4,459 | ||||||
LIXIL Corp.2 | 196,500 | 4,268 | ||||||
Howden Joinery Group PLC1,2 | 440,000 | 4,155 | ||||||
McPhy Energy SA1,2,3 | 74,800 | 3,144 | ||||||
Vicor Corp, Class A1 | 27,800 | 2,564 | ||||||
The AZEK Company Inc., Class A1 | 54,400 | 2,092 | ||||||
|
| |||||||
| 701,255 | ||||||||
|
| |||||||
Financials 7.47% | ||||||||
Cannae Holdings, Inc.1 | 1,931,800 | 85,521 | ||||||
Trupanion, Inc.1 | 671,200 | 80,349 | ||||||
Janus Henderson Group PLC | 1,088,400 | 35,384 | ||||||
Capitec Bank Holdings Ltd.1,2 | 232,177 | 22,625 | ||||||
Live Oak Bancshares, Inc. | 462,000 | 21,926 | ||||||
South State Corp. | 283,300 | 20,483 | ||||||
Kotak Mahindra Bank Ltd.1,2 | 715,825 | 19,590 | ||||||
Eurobank Ergasias Services and Holdings SA1,2 | 27,631,908 | 19,562 | ||||||
East West Bancorp, Inc. | 287,300 | 14,569 | ||||||
Stifel Financial Corp. | 271,050 | 13,677 | ||||||
Independent Bank Group, Inc. | 192,300 | 12,023 | ||||||
Indian Energy Exchange Ltd.2 | 3,150,000 | 9,842 | ||||||
IIFL Wealth Management Ltd.2 | 677,558 | 9,388 | ||||||
Aavas Financiers Ltd.1,2 | 402,000 | 9,335 | ||||||
Multi Commodity Exchange of India Ltd.2 | 342,375 | 8,115 | ||||||
Essent Group Ltd. | 175,000 | 7,560 | ||||||
Third Point Reinsurance Ltd.1 | 340,400 | 3,241 | ||||||
Fanhua Inc. (ADR) | 157,600 | 1,897 | ||||||
Huize Holding Ltd. (ADR)1 | 223,220 | 1,562 | ||||||
|
| |||||||
| 396,649 | ||||||||
|
| |||||||
Materials 2.33% | ||||||||
Nanofilm Technologies International Ltd.1,2 | 7,424,900 | 24,720 | ||||||
Lundin Mining Corp. | 2,773,100 | 24,618 | ||||||
PI Industries Ltd.2 | 778,604 | 23,446 | ||||||
Navin Fluorine International Ltd.2 | 445,388 | 16,030 | ||||||
Fasadgruppen Group AB1,2 | 770,604 | 8,233 | ||||||
Vidrala, SA, non-registered shares2 | 67,694 | 7,850 | ||||||
Valvoline Inc. | 315,300 | 7,296 | ||||||
SK Materials Co., Ltd.2 | 16,400 | 5,411 | ||||||
LANXESS AG2 | 54,500 | 4,179 | ||||||
Arkema SA2 | 15,200 | 1,737 | ||||||
|
| |||||||
| 123,520 | ||||||||
|
| |||||||
Real estate 2.07% | ||||||||
Altus Group Ltd. | 939,007 | 36,250 | ||||||
Embassy Office Parks REIT2 | 5,189,400 | 24,506 | ||||||
MGM Growth Properties LLC REIT, Class A | 500,000 | 15,650 | ||||||
JHSF Participações SA | 9,099,476 | 13,682 | ||||||
Mitre Realty Empreendimentos E Participações SA1 | 1,955,500 | 6,400 | ||||||
WHA Corp. PCL2 | 59,416,400 | 5,988 | ||||||
Mindspace Business Parks REIT1,2,4 | 654,600 | 2,810 | ||||||
American Funds Insurance Series 53
Table of Contents
Global Small Capitalization Fund (continued)
Common stocks (continued)
| Shares | Value (000) | |||||||
Real estate (continued) | ||||||||
Mindspace Business Parks REIT1,2 | 595,400 | $ | 2,608 | |||||
DoubleDragon Properties Corp.1,2 | 6,395,985 | 1,984 | ||||||
Cyrela Commercial Properties SA, ordinary nominative | 105,754 | 279 | ||||||
|
| |||||||
| 110,157 | ||||||||
|
| |||||||
Communication services 2.00% | ||||||||
Altice Europe NV, Class A1,2 | 4,115,000 | 26,791 | ||||||
Bandwidth Inc., Class A1 | 122,000 | 18,748 | ||||||
Capcom Co., Ltd.2 | 226,800 | 14,745 | ||||||
New York Times Co., Class A | 259,500 | 13,434 | ||||||
Square Enix Holdings Co., Ltd.2 | 143,200 | 8,690 | ||||||
Kamakura Shinsho, Ltd.2 | 677,700 | 7,514 | ||||||
Euskaltel, SA, non-registered shares2 | 630,178 | 6,734 | ||||||
Zee Entertainment Enterprises Ltd.2 | 1,398,700 | 4,295 | ||||||
Daily Mail and General Trust PLC, Class A, nonvoting shares2 | 296,800 | 3,025 | ||||||
Cardlytics, Inc.1,3 | 16,500 | 2,356 | ||||||
|
| |||||||
| 106,332 | ||||||||
|
| |||||||
Consumer staples 1.86% | ||||||||
Freshpet, Inc.1 | 318,400 | 45,210 | ||||||
Grocery Outlet Holding Corp.1 | 755,400 | 29,649 | ||||||
AAK AB2 | 511,300 | 10,311 | ||||||
Hilton Food Group PLC2 | 586,277 | 8,938 | ||||||
Vector Group Ltd. | 224,000 | 2,610 | ||||||
Raia Drogasil SA, ordinary nominative | 445,000 | 2,145 | ||||||
|
| |||||||
| 98,863 | ||||||||
|
| |||||||
Utilities 1.22% | ||||||||
ENN Energy Holdings Ltd.2 | 4,026,200 | 59,096 | ||||||
Neoenergia SA | 1,727,000 | 5,859 | ||||||
|
| |||||||
| 64,955 | ||||||||
|
| |||||||
Energy 0.46% | ||||||||
Parsley Energy, Inc., Class A | 915,000 | 12,993 | ||||||
Venture Global LNG, Inc., Series C1,2,4,5,7 | 2,760 | 10,434 | ||||||
NuVista Energy Ltd.1 | 1,325,000 | 979 | ||||||
|
| |||||||
| 24,406 | ||||||||
|
| |||||||
Total common stocks (cost: $2,750,940,000) | 5,060,082 | |||||||
|
| |||||||
Preferred securities 1.81% | ||||||||
Information technology 1.30% | ||||||||
Marqeta, Inc., Series E-1, 8.00% noncumulative, preferred shares1,2,5,7 | 1,859,092 | 32,887 | ||||||
Avidxchange, Inc., Series F, preferred shares1,2,5,7 | 492,864 | 24,156 | ||||||
Gitlab Inc., Series E, preferred shares1,2,5,7 | 297,916 | 11,917 | ||||||
|
| |||||||
| 68,960 | ||||||||
|
| |||||||
Industrials 0.36% | ||||||||
Azul SA, preferred nominative (ADR)1,3 | 800,316 | 18,263 | ||||||
Azul SA, preferred nominative1 | 109,500 | 829 | ||||||
|
| |||||||
| 19,092 | ||||||||
|
| |||||||
Health care 0.15% | ||||||||
PACT Pharma, Inc., Series C, 8.00% noncumulative, preferred shares1,2,5,7 | 2,931,405 | 8,231 | ||||||
|
| |||||||
Total preferred securities (cost: $62,052,000) | 96,283 | |||||||
|
| |||||||
54 American Funds Insurance Series
Table of Contents
Global Small Capitalization Fund (continued)
Rights & warrants 0.03%
| Shares | Value (000) | |||||||
Consumer staples 0.03% | ||||||||
Qingdao Richen Food Co., Ltd., Class A, warrants, expire 20221,2,4 | 132,100 | $ | 1,580 | |||||
|
| |||||||
Total rights & warrants (cost: $1,550,000) | 1,580 | |||||||
|
| |||||||
Convertible stocks 0.26% | ||||||||
Consumer discretionary 0.26% | ||||||||
Coursera, Inc., Series C, 8.00% noncumulative, convertible preferred shares2,5,7 | 531,643 | 9,038 | ||||||
Coursera, Inc., Series B, noncumulative, convertible preferred shares2,5,7 | 246,302 | 4,187 | ||||||
Coursera, Inc., Series F, noncumulative, convertible preferred shares2,5,7 | 36,964 | 629 | ||||||
|
| |||||||
| 13,854 | ||||||||
|
| |||||||
Total convertible stocks (cost: $10,863,000) | 13,854 | |||||||
|
| |||||||
Short-term securities 4.21% | ||||||||
Commercial paper 2.58% | ||||||||
Toronto-Dominion Bank 0.19% due 1/19/20214 | 100,000 | 99,993 | ||||||
NRW.Bank 0.22% due 1/22/20214 | 37,000 | 36,997 | ||||||
|
| |||||||
| 136,990 | ||||||||
|
| |||||||
Money market investments 1.63% | ||||||||
Goldman Sachs Financial Square Government Fund, Institutional Shares 0.02%8,9 | 71,737,955 | 71,738 | ||||||
Capital Group Central Cash Fund 0.12%6,8 | 151,346 | 15,136 | ||||||
|
| |||||||
| 86,874 | ||||||||
|
| |||||||
Total short-term securities (cost: $223,856,000) | 223,864 | |||||||
|
| |||||||
Total investment securities 101.56% (cost: $3,049,261,000) | 5,395,663 | |||||||
Other assets less liabilities (1.56)% | (82,922 | ) | ||||||
|
| |||||||
Net assets 100.00% | $ | 5,312,741 | ||||||
|
| |||||||
Investments in affiliates6
| Value of affiliates at 1/1/2020 (000) | Additions (000) | Reductions (000) | Net realized gain (000) | Net unrealized (depreciation) appreciation (000) | Value of affiliates at 12/31/2020 (000) | Dividend income (000) | ||||||||||||||||||||||
Common stocks 0.85% | ||||||||||||||||||||||||||||
Health care 0.00% | ||||||||||||||||||||||||||||
NuCana PLC (ADR)1,3,10 | $ | 12,711 | $ | 1,226 | $ | — | $ | — | $ | (3,358 | ) | $ | — | $ | — | |||||||||||||
Consumer discretionary 0.85% | ||||||||||||||||||||||||||||
Lands’ End, Inc.1 | — | 14,805 | — | — | 30,492 | 45,297 | — | |||||||||||||||||||||
|
| |||||||||||||||||||||||||||
Total common stocks | 45,297 | |||||||||||||||||||||||||||
|
| |||||||||||||||||||||||||||
Short-term securities 0.29% | ||||||||||||||||||||||||||||
Money market investments 0.29% | ||||||||||||||||||||||||||||
Capital Group Central Cash Fund 0.12%8 | 192,600 | 961,788 | 1,139,083 | 68 | (237 | ) | 15,136 | 1,310 | ||||||||||||||||||||
|
|
|
|
|
|
|
| |||||||||||||||||||||
Total 1.14% | $ | 68 | $ | 26,897 | $ | 60,433 | $ | 1,310 | ||||||||||||||||||||
|
|
|
|
|
|
|
| |||||||||||||||||||||
American Funds Insurance Series 55
Table of Contents
Global Small Capitalization Fund (continued)
| 1 | Security did not produce income during the last 12 months. |
| 2 | Valued under fair value procedures adopted by authority of the board of trustees. The total value of all such securities was $2,225,547,000, which represented 41.89% of the net assets of the fund. This amount includes $2,067,250,000 related to certain securities trading outside the U.S. whose values were adjusted as a result of significant market movements following the close of local trading. |
| 3 | All or a portion of this security was on loan. The total value of all such securities was $77,648,000, which represented 1.46% of the net assets of the fund. Refer to Note 5 for more information on securities lending. |
| 4 | Acquired in a transaction exempt from registration under Rule 144A or Section 4(2) of the Securities Act of 1933. May be resold in the U.S. in transactions exempt from registration, normally to qualified institutional buyers. The total value of all such securities was $176,728,000, which represented 3.33% of the net assets of the fund. |
| 5 | Value determined using significant unobservable inputs. |
| 6 | Affiliate of the fund or part of the same group of investment companies as the fund, in each case as defined under the Investment Company Act of 1940. |
| 7 | Acquired through a private placement transaction exempt from registration under the Securities Act of 1933. May be subject to legal or contractual restrictions on resale. Further details on these holdings appear below. |
| 8 | Rate represents the seven-day yield at 12/31/2020. |
| 9 | Security purchased with cash collateral from securities on loan. Refer to Note 5 for more information on securities lending. |
| 10 | Unaffiliated issuer at 12/31/2020. |
Private placement securities | Acquisition date | Cost (000) | Value (000) | Percent of net assets | ||||||||||
Marqeta, Inc., Series E-1, 8.00% noncumulative, preferred shares | 5/27/2020 | $ | 15,500 | $ | 32,887 | .62 | % | |||||||
Avidxchange, Inc., Series F, preferred shares | 12/26/2019 | 24,156 | 24,156 | .45 | ||||||||||
Gitlab Inc., Series E, preferred shares | 9/11/2019 | 5,550 | 11,917 | .22 | ||||||||||
Venture Global LNG, Inc., Series C | 5/1/2015 | 8,280 | 10,434 | .20 | ||||||||||
Coursera, Inc., Series C, 8.00% noncumulative, convertible preferred shares | 2/20/2020 | 6,380 | 9,038 | .17 | ||||||||||
PACT Pharma, Inc., Series C, 8.00% noncumulative, preferred shares | 2/7/2020 | 6,000 | 8,231 | .16 | ||||||||||
Coursera, Inc., Series B, noncumulative, convertible preferred shares | 8/12/2020 | 3,855 | 4,187 | .08 | ||||||||||
Coursera, Inc. | 8/12/2020 | 2,514 | 2,409 | .05 | ||||||||||
Coursera, Inc., Series F, noncumulative, convertible preferred shares | 7/15/2020 | 628 | 629 | .01 | ||||||||||
|
|
|
|
|
| |||||||||
Total private placement securities | $ | 72,863 | $ | 103,888 | 1.96 | % | ||||||||
|
|
|
|
|
| |||||||||
Key to abbreviations
ADR = American Depositary Receipts
EUR = Euros
SDR = Swedish Depositary Receipts
See notes to financial statements.
56 American Funds Insurance Series
Table of Contents
Investment portfolio December 31, 2020
Common stocks 95.50%
| Shares | Value (000) | |||||||
Information technology 22.59% | ||||||||
Microsoft Corp. | 8,170,085 | $ | 1,817,190 | |||||
Broadcom Inc. | 1,811,536 | 793,181 | ||||||
ASML Holding NV (New York registered) (ADR) | 632,100 | 308,288 | ||||||
ASML Holding NV1 | 635,000 | 306,871 | ||||||
Taiwan Semiconductor Manufacturing Company, Ltd.1 | 18,618,000 | 349,673 | ||||||
Taiwan Semiconductor Manufacturing Company, Ltd. (ADR) | 2,218,945 | 241,954 | ||||||
RingCentral, Inc., Class A2 | 1,322,397 | 501,149 | ||||||
Shopify Inc., Class A, subordinate voting shares2 | 410,400 | 464,552 | ||||||
Visa Inc., Class A | 1,591,570 | 348,124 | ||||||
PayPal Holdings, Inc.2 | 1,319,600 | 309,050 | ||||||
Mastercard Inc., Class A | 716,844 | 255,870 | ||||||
Advanced Micro Devices, Inc.2 | 2,360,947 | 216,522 | ||||||
MongoDB, Inc., Class A2 | 594,973 | 213,619 | ||||||
Autodesk, Inc.2 | 654,703 | 199,907 | ||||||
FleetCor Technologies, Inc.2 | 710,400 | 193,818 | ||||||
Keyence Corp.1 | 300,900 | 169,341 | ||||||
Cree, Inc.2 | 1,495,879 | 158,414 | ||||||
Square, Inc., Class A2 | 726,255 | 158,062 | ||||||
Ceridian HCM Holding Inc.2 | 1,274,711 | 135,833 | ||||||
ServiceNow, Inc.2 | 235,806 | 129,795 | ||||||
Samsung Electronics Co., Ltd.1 | 1,538,083 | 114,952 | ||||||
Tyler Technologies, Inc.2 | 263,200 | 114,892 | ||||||
Micron Technology, Inc.2 | 1,447,335 | 108,811 | ||||||
Guidewire Software, Inc.2 | 821,399 | 105,739 | ||||||
Apple Inc. | 779,886 | 103,483 | ||||||
Applied Materials, Inc. | 1,033,670 | 89,206 | ||||||
HubSpot, Inc.2 | 210,067 | 83,279 | ||||||
Trimble Inc.2 | 900,572 | 60,131 | ||||||
Bill.Com Holdings, Inc.2 | 433,100 | 59,118 | ||||||
Adobe Inc.2 | 115,899 | 57,963 | ||||||
Intel Corp. | 1,136,000 | 56,596 | ||||||
Elastic NV, non-registered shares2 | 346,722 | 50,667 | ||||||
Fidelity National Information Services, Inc. | 328,778 | 46,509 | ||||||
Alteryx, Inc., Class A2 | 353,058 | 42,999 | ||||||
Flex Ltd.2 | 2,234,300 | 40,173 | ||||||
SK hynix, Inc.1 | 330,800 | 36,189 | ||||||
Zendesk, Inc.2 | 252,368 | 36,119 | ||||||
NetApp, Inc. | 527,540 | 34,944 | ||||||
Fiserv, Inc.2 | 304,473 | 34,667 | ||||||
Jack Henry & Associates, Inc. | 167,789 | 27,180 | ||||||
MKS Instruments, Inc. | 157,800 | 23,741 | ||||||
Okta, Inc., Class A2 | 93,170 | 23,689 | ||||||
Motorola Solutions, Inc. | 134,257 | 22,832 | ||||||
ON Semiconductor Corp.2 | 640,919 | 20,977 | ||||||
EPAM Systems, Inc.2 | 52,839 | 18,935 | ||||||
GoDaddy Inc., Class A2 | 213,800 | 17,735 | ||||||
Smartsheet Inc., Class A2 | 238,281 | 16,511 | ||||||
Enphase Energy, Inc.2 | 87,779 | 15,403 | ||||||
VeriSign, Inc.2 | 68,100 | 14,737 | ||||||
Amadeus IT Group SA, Class A, non-registered shares1 | 160,263 | 11,603 | ||||||
Concentrix Corp.2 | 108,272 | 10,686 | ||||||
Global Payments Inc. | 46,612 | 10,041 | ||||||
SYNNEX Corp. | 108,272 | 8,818 | ||||||
Atlassian Corp. PLC, Class A2 | 19,317 | 4,518 | ||||||
|
| |||||||
| 8,795,056 | ||||||||
|
| |||||||
Consumer discretionary 18.83% | ||||||||
Tesla, Inc.2 | 5,488,000 | 3,872,717 | ||||||
Amazon.com, Inc.2 | 270,876 | 882,224 | ||||||
Dollar General Corp. | 1,774,500 | 373,177 | ||||||
Home Depot, Inc. | 848,736 | 225,441 | ||||||
LVMH Moët Hennessy-Louis Vuitton SE1 | 330,000 | 206,194 | ||||||
American Funds Insurance Series 57
Table of Contents
Growth Fund (continued)
Common stocks (continued)
| Shares | Value (000) | |||||||
Consumer discretionary (continued) | ||||||||
Domino’s Pizza, Inc. | 448,575 | $ | 172,011 | |||||
Darden Restaurants, Inc. | 1,438,876 | 171,399 | ||||||
Booking Holdings Inc.2 | 74,213 | 165,292 | ||||||
Toll Brothers, Inc. | 3,280,000 | 142,582 | ||||||
Bright Horizons Family Solutions Inc.2 | 681,000 | 117,806 | ||||||
Burlington Stores, Inc.2 | 432,204 | 113,043 | ||||||
Hermès International1 | 97,299 | 104,631 | ||||||
Royal Caribbean Cruises Ltd. | 1,201,909 | 89,771 | ||||||
NIKE, Inc., Class B | 546,407 | 77,300 | ||||||
Floor & Decor Holdings, Inc., Class A2 | 769,300 | 71,430 | ||||||
Chipotle Mexican Grill, Inc.2 | 46,247 | 64,131 | ||||||
Aramark | 1,666,401 | 64,123 | ||||||
Airbnb, Inc., Class A2 | 374,400 | 54,962 | ||||||
Five Below, Inc.2 | 198,640 | 34,758 | ||||||
Flutter Entertainment PLC (EUR denominated)1 | 166,291 | 34,062 | ||||||
Wynn Resorts, Ltd. | 258,022 | 29,113 | ||||||
Las Vegas Sands Corp. | 485,638 | 28,944 | ||||||
Westwing Group AG, non-registered shares1,2,3 | 707,000 | 28,606 | ||||||
Caesars Entertainment, Inc.2 | 379,500 | 28,185 | ||||||
Norwegian Cruise Line Holdings Ltd.2,3 | 1,095,796 | 27,866 | ||||||
Marriott International, Inc., Class A | 210,000 | 27,703 | ||||||
Peloton Interactive, Inc., Class A2 | 180,000 | 27,310 | ||||||
Grand Canyon Education, Inc.2 | 213,615 | 19,890 | ||||||
Hilton Worldwide Holdings Inc. | 151,700 | 16,878 | ||||||
Evolution Gaming Group AB1 | 160,210 | 16,243 | ||||||
Cie. Financière Richemont SA, Class A1 | 174,005 | 15,724 | ||||||
YUM! Brands, Inc. | 129,700 | 14,080 | ||||||
EssilorLuxottica1 | 69,400 | 10,823 | ||||||
|
| |||||||
| 7,328,419 | ||||||||
|
| |||||||
Communication services 18.02% | ||||||||
Facebook, Inc., Class A2 | 7,454,034 | 2,036,144 | ||||||
Netflix, Inc.2 | 3,139,599 | 1,697,675 | ||||||
Alphabet Inc., Class C2 | 466,472 | 817,203 | ||||||
Alphabet Inc., Class A2 | 60,216 | 105,537 | ||||||
T-Mobile US, Inc.2 | 4,003,260 | 539,840 | ||||||
Activision Blizzard, Inc. | 5,097,672 | 473,319 | ||||||
Charter Communications, Inc., Class A2 | 695,547 | 460,139 | ||||||
Snap Inc., Class A2 | 8,325,383 | 416,852 | ||||||
Comcast Corp., Class A | 4,324,019 | 226,579 | ||||||
Zillow Group, Inc., Class C, nonvoting shares2 | 347,800 | 45,144 | ||||||
Zillow Group, Inc., Class A2 | 271,354 | 36,888 | ||||||
Pinterest, Inc., Class A2 | 1,027,744 | 67,728 | ||||||
Match Group, Inc.2 | 234,000 | 35,379 | ||||||
Live Nation Entertainment, Inc.2 | 400,000 | 29,392 | ||||||
Twitter, Inc.2 | 460,000 | 24,909 | ||||||
|
| |||||||
| 7,012,728 | ||||||||
|
| |||||||
Health care 12.72% | ||||||||
UnitedHealth Group Inc. | 2,472,454 | 867,040 | ||||||
Intuitive Surgical, Inc.2 | 803,680 | 657,491 | ||||||
Regeneron Pharmaceuticals, Inc.2 | 841,544 | 406,558 | ||||||
Centene Corp.2 | 5,286,474 | 317,347 | ||||||
Thermo Fisher Scientific Inc. | 632,000 | 294,373 | ||||||
Humana Inc. | 496,800 | 203,822 | ||||||
Exact Sciences Corp.2 | 1,296,188 | 171,732 | ||||||
ResMed Inc. | 755,000 | 160,483 | ||||||
Insulet Corp.2 | 622,000 | 159,002 | ||||||
NovoCure Ltd.2 | 916,689 | 158,624 | ||||||
Seagen Inc.2 | 874,815 | 153,215 | ||||||
Teladoc Health, Inc.2 | 643,000 | 128,574 | ||||||
Vertex Pharmaceuticals Inc.2 | 450,522 | 106,476 | ||||||
58 American Funds Insurance Series
Table of Contents
Growth Fund (continued)
Common stocks (continued)
| Shares | Value (000) | |||||||
Health care (continued) | ||||||||
CRISPR Therapeutics AG2 | 652,706 | $ | 99,936 | |||||
Biohaven Pharmaceutical Holding Co. Ltd.2 | 1,068,637 | 91,593 | ||||||
Abbott Laboratories | 643,963 | 70,508 | ||||||
CVS Health Corp. | 862,934 | 58,938 | ||||||
DexCom, Inc.2 | 158,238 | 58,504 | ||||||
Allakos Inc.2 | 401,374 | 56,192 | ||||||
Cigna Corp. | 262,355 | 54,617 | ||||||
Danaher Corp. | 235,935 | 52,411 | ||||||
Gilead Sciences, Inc. | 899,185 | 52,387 | ||||||
Edwards Lifesciences Corp.2 | 569,100 | 51,919 | ||||||
Galapagos NV1,2 | 527,552 | 51,910 | ||||||
Vir Biotechnology, Inc.2,3 | 1,555,475 | 41,656 | ||||||
Verily Life Sciences LLC1,2,4,5 | 300,178 | 41,103 | ||||||
Catalent, Inc.2 | 319,000 | 33,198 | ||||||
Oak Street Health, Inc.2 | 538,184 | 32,915 | ||||||
Pfizer Inc. | 884,714 | 32,566 | ||||||
Neurocrine Biosciences, Inc.2 | 326,200 | 31,266 | ||||||
Allogene Therapeutics, Inc.2 | 1,146,511 | 28,938 | ||||||
AstraZeneca PLC1 | 256,500 | 25,627 | ||||||
Guardant Health, Inc.2 | 196,303 | 25,300 | ||||||
Incyte Corp.2 | 288,800 | 25,120 | ||||||
Molina Healthcare, Inc.2 | 96,799 | 20,587 | ||||||
Chemed Corp. | 37,667 | 20,062 | ||||||
Mettler-Toledo International Inc.2 | 16,900 | 19,261 | ||||||
Grail, Inc.1,2,4,5,6 | 1,864,884 | 18,350 | ||||||
Eli Lilly and Company | 100,800 | 17,019 | ||||||
Pacific Biosciences of California, Inc.2 | 619,579 | 16,072 | ||||||
Ultragenyx Pharmaceutical Inc.2 | 67,100 | 9,289 | ||||||
Adaptive Biotechnologies Corp.2 | 141,048 | 8,340 | ||||||
Novavax, Inc.2 | 72,500 | 8,084 | ||||||
Global Blood Therapeutics, Inc.2 | 125,000 | 5,414 | ||||||
GoodRx Holdings, Inc., Class A2 | 97,500 | 3,933 | ||||||
Cortexyme, Inc.2,3 | 128,600 | 3,573 | ||||||
Zimmer Biomet Holdings, Inc. | 13,800 | 2,126 | ||||||
|
| |||||||
| 4,953,451 | ||||||||
|
| |||||||
Industrials 8.44% | ||||||||
Uber Technologies, Inc.2 | 8,501,767 | 433,590 | ||||||
Delta Air Lines, Inc. | 10,425,000 | 419,189 | ||||||
TransDigm Group Inc.2 | 582,800 | 360,666 | ||||||
MTU Aero Engines AG1 | 745,782 | 194,314 | ||||||
Jacobs Engineering Group Inc. | 1,716,000 | 186,975 | ||||||
CSX Corp. | 1,920,800 | 174,313 | ||||||
United Rentals, Inc.2 | 520,800 | 120,779 | ||||||
Airbus SE, non-registered shares1,2 | 944,893 | 103,796 | ||||||
Middleby Corp.2 | 702,000 | 90,502 | ||||||
Lockheed Martin Corp. | 243,441 | 86,417 | ||||||
Carrier Global Corp. | 2,181,661 | 82,292 | ||||||
ITOCHU Corp.1 | 2,545,000 | 73,299 | ||||||
Dun & Bradstreet Holdings, Inc.2 | 2,885,458 | 71,848 | ||||||
Ryanair Holdings PLC (ADR)2 | 634,951 | 69,832 | ||||||
Ryanair Holdings PLC1,2 | 96,554 | 1,923 | ||||||
Komatsu Ltd.1 | 1,995,900 | 54,693 | ||||||
Honeywell International Inc. | 251,344 | 53,461 | ||||||
Norfolk Southern Corp. | 216,936 | 51,546 | ||||||
Southwest Airlines Co. | 1,100,000 | 51,271 | ||||||
Equifax Inc. | 247,800 | 47,786 | ||||||
Westinghouse Air Brake Technologies Corp. | 641,700 | 46,972 | ||||||
ASGN Inc.2 | 560,000 | 46,777 | ||||||
HEICO Corp. | 311,000 | 41,177 | ||||||
HEICO Corp., Class A | 43,500 | 5,092 | ||||||
Boeing Company | 215,302 | 46,088 | ||||||
American Funds Insurance Series 59
Table of Contents
Growth Fund (continued)
Common stocks (continued)
| Shares | Value (000) | |||||||
Industrials (continued) | ||||||||
Armstrong World Industries, Inc. | 616,904 | $ | 45,892 | |||||
Emerson Electric Co. | 508,000 | 40,828 | ||||||
BWX Technologies, Inc. | 615,900 | 37,126 | ||||||
Safran SA1,2 | 259,640 | 36,822 | ||||||
Plug Power Inc.2 | 1,054,776 | 35,767 | ||||||
Parker-Hannifin Corp. | 113,931 | 31,036 | ||||||
AMETEK, Inc. | 253,600 | 30,670 | ||||||
Waste Connections, Inc. | 290,200 | 29,766 | ||||||
FedEx Corp. | 99,600 | 25,858 | ||||||
Caterpillar Inc. | 111,500 | 20,295 | ||||||
Lennox International Inc. | 55,533 | 15,214 | ||||||
Northrop Grumman Corp. | 47,900 | 14,596 | ||||||
Generac Holdings Inc.2 | 31,762 | 7,223 | ||||||
|
| |||||||
| 3,285,691 | ||||||||
|
| |||||||
Financials 5.43% | ||||||||
Bank of America Corp. | 14,780,700 | 448,003 | ||||||
First Republic Bank | 1,800,955 | 264,614 | ||||||
Intercontinental Exchange, Inc. | 1,735,900 | 200,132 | ||||||
Berkshire Hathaway Inc., Class B2 | 582,700 | 135,111 | ||||||
Berkshire Hathaway Inc., Class A2 | 57 | 19,825 | ||||||
SVB Financial Group2 | 349,456 | 135,529 | ||||||
BlackRock, Inc. | 150,000 | 108,231 | ||||||
S&P Global Inc. | 236,500 | 77,745 | ||||||
State Street Corp. | 973,886 | 70,879 | ||||||
Marsh & McLennan Companies, Inc. | 577,751 | 67,597 | ||||||
American International Group, Inc. | 1,761,110 | 66,676 | ||||||
JPMorgan Chase & Co. | 510,000 | 64,806 | ||||||
MSCI Inc. | 117,900 | 52,646 | ||||||
London Stock Exchange Group PLC1 | 426,339 | 52,553 | ||||||
Arch Capital Group Ltd.2 | 1,326,267 | 47,838 | ||||||
Capital One Financial Corp. | 390,000 | 38,551 | ||||||
Moody’s Corp. | 102,277 | 29,685 | ||||||
CME Group Inc., Class A | 134,493 | 24,484 | ||||||
Onex Corp. | 425,000 | 24,393 | ||||||
KKR & Co. Inc. | 600,300 | 24,306 | ||||||
Bank of New York Mellon Corp. | 559,000 | 23,724 | ||||||
The Blackstone Group Inc., Class A | 360,000 | 23,332 | ||||||
Aon PLC, Class A | 110,000 | 23,240 | ||||||
East West Bancorp, Inc. | 326,417 | 16,553 | ||||||
Everest Re Group, Ltd. | 66,500 | 15,567 | ||||||
Ares Management Corp., Class A | 310,500 | 14,609 | ||||||
Western Alliance Bancorporation | 241,906 | 14,502 | ||||||
RenaissanceRe Holdings Ltd. | 63,000 | 10,447 | ||||||
BNP Paribas SA1,2 | 180,106 | 9,500 | ||||||
PNC Financial Services Group, Inc. | 56,934 | 8,483 | ||||||
|
| |||||||
| 2,113,561 | ||||||||
|
| |||||||
Consumer staples 3.22% | ||||||||
Kroger Co. | 8,065,000 | 256,144 | ||||||
Philip Morris International Inc. | 2,996,360 | 248,069 | ||||||
British American Tobacco PLC1 | 3,967,410 | 147,567 | ||||||
British American Tobacco PLC (ADR) | 195,000 | 7,311 | ||||||
Costco Wholesale Corp. | 403,332 | 151,967 | ||||||
Constellation Brands, Inc., Class A | 617,500 | 135,263 | ||||||
Altria Group, Inc. | 2,873,699 | 117,822 | ||||||
Molson Coors Beverage Company, Class B, restricted voting shares | 1,104,700 | 49,921 | ||||||
Associated British Foods PLC1,2 | 1,515,607 | 46,958 | ||||||
Estée Lauder Companies Inc., Class A | 146,800 | 39,077 | ||||||
Grocery Outlet Holding Corp.2 | 529,261 | 20,774 | ||||||
60 American Funds Insurance Series
Table of Contents
Growth Fund (continued)
Common stocks (continued)
| Shares | Value (000) | |||||||
Consumer staples (continued) | ||||||||
Church & Dwight Co., Inc. | 151,700 | $ | 13,233 | |||||
Anheuser-Busch InBev SA/NV1 | 162,528 | 11,358 | ||||||
Monster Beverage Corp.2 | 73,900 | 6,834 | ||||||
|
| |||||||
| 1,252,298 | ||||||||
|
| |||||||
Materials 3.09% | ||||||||
Vale SA, ordinary nominative (ADR) | 14,554,387 | 243,931 | ||||||
Wheaton Precious Metals Corp. | 3,176,400 | 132,583 | ||||||
Franco-Nevada Corp. | 937,000 | 117,484 | ||||||
LyondellBasell Industries NV | 1,249,142 | 114,496 | ||||||
Grupo México, SAB de CV, Series B | 25,084,100 | 106,037 | ||||||
Barrick Gold Corp. | 4,058,000 | 92,441 | ||||||
CCL Industries Inc., Class B, nonvoting shares | 1,615,000 | 73,321 | ||||||
Royal Gold, Inc. | 517,000 | 54,988 | ||||||
Sherwin-Williams Company | 71,200 | 52,326 | ||||||
Celanese Corp. | 350,400 | 45,531 | ||||||
CF Industries Holdings, Inc. | 979,000 | 37,897 | ||||||
Allegheny Technologies Inc.2 | 2,070,860 | 34,728 | ||||||
Shin-Etsu Chemical Co., Ltd.1 | 194,100 | 33,980 | ||||||
Linde PLC | 120,000 | 31,621 | ||||||
PPG Industries, Inc. | 149,623 | 21,579 | ||||||
Nucor Corp. | 95,800 | 5,096 | ||||||
Dow Inc. | 66,000 | 3,663 | ||||||
|
| |||||||
| 1,201,702 | ||||||||
|
| |||||||
Energy 1.66% | ||||||||
Halliburton Co. | 13,300,000 | 251,370 | ||||||
Canadian Natural Resources, Ltd. (CAD denominated) | 5,048,400 | 121,322 | ||||||
Canadian Natural Resources, Ltd. | 105,100 | 2,527 | ||||||
Cenovus Energy Inc. | 12,798,618 | 77,924 | ||||||
EOG Resources, Inc. | 1,139,372 | 56,820 | ||||||
Suncor Energy Inc. | 3,326,066 | 55,787 | ||||||
ConocoPhillips | 527,835 | 21,108 | ||||||
Concho Resources Inc. | 319,500 | 18,643 | ||||||
Cimarex Energy Co. | 435,500 | 16,336 | ||||||
Equitrans Midstream Corp. | 1,858,695 | 14,944 | ||||||
Schlumberger Ltd. | 363,800 | 7,942 | ||||||
|
| |||||||
| 644,723 | ||||||||
|
| |||||||
Real estate 0.95% | ||||||||
Equinix, Inc. REIT | 311,485 | 222,456 | ||||||
American Tower Corp. REIT | 349,342 | 78,413 | ||||||
Park Hotels & Resorts Inc. REIT | 2,181,898 | 37,420 | ||||||
Pebblebrook Hotel Trust REIT | 1,660,276 | 31,213 | ||||||
|
| |||||||
| 369,502 | ||||||||
|
| |||||||
Utilities 0.55% | ||||||||
PG&E Corp.2 | 7,278,900 | 90,695 | ||||||
Edison International | 751,381 | 47,202 | ||||||
Xcel Energy Inc. | 680,000 | 45,336 | ||||||
Ørsted AS1 | 125,286 | 25,624 | ||||||
AES Corp. | 312,000 | 7,332 | ||||||
|
| |||||||
| 216,189 | ||||||||
|
| |||||||
Total common stocks (cost: $16,215,513,000) | 37,173,320 | |||||||
|
| |||||||
Preferred securities 0.12% | ||||||||
Information technology 0.12% | ||||||||
Samsung Electronics Co., Ltd., nonvoting preferred shares1 | 654,840 | 44,452 | ||||||
|
| |||||||
Total preferred securities (cost: $27,479,000) | 44,452 | |||||||
|
| |||||||
American Funds Insurance Series 61
Table of Contents
Growth Fund (continued)
Convertible bonds & notes 0.07%
Principal amount (000) | Value (000) | |||||||
Consumer staples 0.07% | ||||||||
JUUL Labs, Inc., convertible notes, 7.00% 2025 (100% PIK)1,4,5,7 | $ | 40,439 | $ | 29,464 | ||||
|
| |||||||
Total convertible bonds & notes (cost: $40,250,000) | 29,464 | |||||||
|
| |||||||
| Shares | ||||||||
Short-term securities 4.19% | ||||||||
Money market investments 4.19% | ||||||||
Capital Group Central Cash Fund 0.12%8,9 | �� | 16,235,284 | 1,623,691 | |||||
|
| |||||||
Goldman Sachs Financial Square Government Fund, Institutional Shares 0.02%8,10 | 6,803,461 | 6,803 | ||||||
|
| |||||||
Total short-term securities (cost: $1,630,388,000) | 1,630,494 | |||||||
Total investment securities 99.88% (cost: $17,913,630,000) | 38,877,730 | |||||||
Other assets less liabilities 0.12% | 46,314 | |||||||
|
| |||||||
Net assets 100.00% | $ | 38,924,044 | ||||||
|
| |||||||
Investments in affiliates9
| Value of affiliate at 1/1/2020 (000) | Additions (000) | Reductions (000) | Net realized gain (000) | Net unrealized depreciation (000) | Value of affiliate at 12/31/2020 (000) | Dividend income (000) | ||||||||||||||||||||||
Short-term securities 4.17% | ||||||||||||||||||||||||||||
Money market investments 4.17% | ||||||||||||||||||||||||||||
Capital Group Central Cash Fund 0.12%8 | $ | 1,102,492 | $ | 7,443,677 | $ | 6,923,077 | $ | 602 | $ | (3 | ) | $ | 1,623,691 | $ | 6,391 | |||||||||||||
| 1 | Valued under fair value procedures adopted by authority of the board of trustees. The total value of all such securities was $2,408,205,000, which represented 6.19% of the net assets of the fund. This amount includes $2,319,288,000 related to certain securities trading outside the U.S. whose values were adjusted as a result of significant market movements following the close of local trading. |
| 2 | Security did not produce income during the last 12 months. |
| 3 | All or a portion of this security was on loan. The total value of all such securities was $7,302,000, which represented .02% of the net assets of the fund. Refer to Note 5 for more information on securities lending. |
| 4 | Value determined using significant unobservable inputs. |
| 5 | Acquired through a private placement transaction exempt from registration under the Securities Act of 1933. May be subject to legal or contractual restrictions on resale. Further details on these holdings appear below. |
| 6 | Acquired in a transaction exempt from registration under Rule 144A of the Securities Act of 1933. May be resold in the U.S. in transactions exempt from registration, normally to qualified institutional buyers. The total value of all such securities was $18,350,000, which represented .05% of the net assets of the fund. |
| 7 | Payment in kind; the issuer has the option of paying additional securities in lieu of cash. Most recent payment was 100% cash unless otherwise noted. |
| 8 | Rate represents the seven-day yield at 12/31/2020. |
| 9 | Part of the same group of investment companies as the fund as defined under the Investment Company Act of 1940. |
| 10 | Security purchased with cash collateral from securities on loan. Refer to Note 5 for more information on securities lending. |
Private placement securities | Acquisition date(s) | Cost (000) | Value (000) | Percent of net assets | ||||||||||||
Verily Life Sciences LLC | 12/21/2018 | $ | 37,000 | $ | 41,103 | .10 | % | |||||||||
JUUL Labs, Inc., convertible notes, 7.00% 2025 | 2/3/2020-11/3/2020 | 40,250 | 29,464 | .08 | ||||||||||||
Grail, Inc. | 4/17/2020 | 9,526 | 18,350 | .05 | ||||||||||||
|
|
|
|
|
| |||||||||||
Total private placement securities | $ | 86,776 | $ | 88,917 | .23 | % | ||||||||||
|
|
|
|
|
| |||||||||||
Key To abbreviations
ADR = American Depositary Receipts
CAD = Canadian dollars
EUR = Euros
See notes to financial statements.
62 American Funds Insurance Series
Table of Contents
Investment portfolio December 31, 2020
Common stocks 93.80%
| Shares | Value (000) | |||||||
Financials 17.06% | ||||||||
AIA Group Ltd.1 | 36,489,500 | $ | 449,466 | |||||
HDFC Bank Ltd.1,2 | 17,086,200 | 336,563 | ||||||
HDFC Bank Ltd. (ADR)2 | 531,294 | 38,392 | ||||||
Kotak Mahindra Bank Ltd.1,2 | 10,657,149 | 291,651 | ||||||
Ping An Insurance (Group) Company of China, Ltd., Class H1 | 11,877,600 | 145,893 | ||||||
Ping An Insurance (Group) Company of China, Ltd., Class A1 | 962,202 | 12,803 | ||||||
Bank Rakyat Indonesia (Persero) Tbk PT1 | 214,873,000 | 63,782 | ||||||
Sberbank of Russia PJSC (ADR)1 | 4,253,000 | 61,311 | ||||||
XP Inc., Class A2 | 1,483,000 | 58,831 | ||||||
BNP Paribas SA1,2 | 847,058 | 44,677 | ||||||
B3 SA - Brasil, Bolsa, Balcao | 3,338,300 | 39,834 | ||||||
Axis Bank Ltd.1,2 | 3,890,055 | 33,115 | ||||||
Aegon NV1 | 7,120,095 | 28,434 | ||||||
London Stock Exchange Group PLC1 | 217,000 | 26,748 | ||||||
Banco Santander, SA1,2 | 7,887,200 | 24,489 | ||||||
Lufax Holding Ltd. (ADR)2,3 | 1,676,700 | 23,809 | ||||||
PICC Property and Casualty Co. Ltd., Class H1 | 26,414,000 | 20,013 | ||||||
FinecoBank SpA1,2 | 1,211,135 | 19,765 | ||||||
Deutsche Bank AG1,2 | 1,715,430 | 18,676 | ||||||
Bajaj Finance Ltd.1 | 244,400 | 17,750 | ||||||
ING Groep NV1,2 | 1,486,000 | 14,077 | ||||||
IndusInd Bank Ltd.1,2 | 941,500 | 11,568 | ||||||
BOC Hong Kong (Holdings) Ltd.1 | 3,739,000 | 11,363 | ||||||
China Merchants Bank Co., Ltd., Class H1 | 1,254,500 | 7,967 | ||||||
The People’s Insurance Co. (Group) of China Ltd., Class H1 | 17,500,000 | 5,560 | ||||||
|
| |||||||
| 1,806,537 | ||||||||
|
| |||||||
Consumer discretionary 14.88% | ||||||||
MercadoLibre, Inc.2 | 190,800 | 319,632 | ||||||
Alibaba Group Holding Ltd.1,2 | 8,148,200 | 238,071 | ||||||
Alibaba Group Holding Ltd. (ADR)2 | 17,700 | 4,119 | ||||||
Sony Corp.1 | 1,610,700 | 161,946 | ||||||
Delivery Hero SE1,2 | 854,887 | 132,687 | ||||||
Galaxy Entertainment Group Ltd.1 | 9,203,000 | 71,582 | ||||||
Meituan, Class B1,2 | 1,755,447 | 67,139 | ||||||
B2W - Cia. Digital, ordinary nominative2 | 3,734,000 | 54,354 | ||||||
Fast Retailing Co., Ltd.1 | 58,900 | 52,854 | ||||||
adidas AG1,2 | 138,518 | 50,425 | ||||||
Evolution Gaming Group AB1 | 483,000 | 48,970 | ||||||
LVMH Moët Hennessy-Louis Vuitton SE1 | 72,223 | 45,127 | ||||||
Kering SA1 | 61,638 | 44,811 | ||||||
Maruti Suzuki India Ltd.1 | 422,000 | 44,280 | ||||||
Melco Resorts & Entertainment Ltd. (ADR) | 2,334,881 | 43,312 | ||||||
Cie. Financière Richemont SA, Class A1 | 454,500 | 41,070 | ||||||
Prosus NV1 | 361,000 | 38,834 | ||||||
Naspers Ltd., Class N1 | 147,000 | 30,087 | ||||||
Flutter Entertainment PLC (GBP denominated)1 | 112,374 | 23,266 | ||||||
H & M Hennes & Mauritz AB, Class B1,2 | 768,000 | 16,042 | ||||||
EssilorLuxottica1 | 90,000 | 14,036 | ||||||
Just Eat Takeaway (GBP denominated)1,2 | 79,800 | 9,017 | ||||||
Astra International Tbk PT1 | 19,726,000 | 8,472 | ||||||
Pan Pacific International Holdings Corp.1 | 354,000 | 8,177 | ||||||
Bandai Namco Holdings Inc.1 | 86,442 | 7,482 | ||||||
|
| |||||||
| 1,575,792 | ||||||||
|
| |||||||
Health care 14.59% | ||||||||
Daiichi Sankyo Company, Ltd.1 | 6,480,000 | 222,137 | ||||||
Chugai Pharmaceutical Co., Ltd.1 | 3,896,700 | 208,040 | ||||||
WuXi Biologics (Cayman) Inc.1,2 | 13,919,700 | 185,411 | ||||||
Olympus Corp.1 | 4,813,000 | 105,357 | ||||||
Novartis AG1 | 1,008,000 | 95,206 | ||||||
Grifols, SA, Class A, non-registered shares1,3 | 2,691,000 | 78,559 | ||||||
American Funds Insurance Series 63
Table of Contents
International Fund (continued)
Common stocks (continued)
| Shares | Value (000) | |||||||
Health care (continued) | ||||||||
Grifols, SA, Class B (ADR) | 793,690 | $ | 14,636 | |||||
Fresenius SE & Co. KGaA1 | 1,959,154 | 90,529 | ||||||
M3, Inc.1 | 882,000 | 83,426 | ||||||
Hikma Pharmaceuticals PLC1 | 2,371,000 | 81,673 | ||||||
Teva Pharmaceutical Industries Ltd. (ADR)2 | 7,216,598 | 69,640 | ||||||
Alcon Inc.1,2 | 872,151 | 58,225 | ||||||
Aier Eye Hospital Group Co., Ltd., Class A1 | 4,254,057 | 48,723 | ||||||
WuXi AppTec Co., Ltd., Class A1 | 2,102,800 | 43,412 | ||||||
WuXi AppTec Co., Ltd., Class H1 | 260,000 | 5,108 | ||||||
Notre Dame Intermédica Participações SA | 3,111,000 | 46,921 | ||||||
Fresenius Medical Care AG & Co. KGaA1 | 325,140 | 27,120 | ||||||
HOYA Corp.1 | 189,100 | 26,139 | ||||||
Merck KGaA1 | 129,000 | 22,112 | ||||||
Takeda Pharmaceutical Company, Ltd.1 | 533,765 | 19,350 | ||||||
Yunnan Baiyao Group Co., Ltd., Class A1 | 790,600 | 13,767 | ||||||
NMC Health PLC1,2,4 | 449,500 | 6 | ||||||
|
| |||||||
| 1,545,497 | ||||||||
|
| |||||||
Industrials 11.54% | ||||||||
Airbus SE, non-registered shares1,2 | 2,732,749 | 300,191 | ||||||
Recruit Holdings Co., Ltd.1 | 3,195,109 | 134,014 | ||||||
Knorr-Bremse AG, non-registered shares1 | 847,671 | 115,475 | ||||||
Melrose Industries PLC1,2 | 45,834,933 | 111,783 | ||||||
Safran SA1,2 | 701,300 | 99,459 | ||||||
NIBE Industrier AB, Class B1 | 2,666,589 | 87,563 | ||||||
Ryanair Holdings PLC (ADR)2 | 591,300 | 65,031 | ||||||
Ryanair Holdings PLC1,2 | 348,056 | 6,933 | ||||||
MTU Aero Engines AG1 | 182,000 | 47,420 | ||||||
Airports of Thailand PCL, foreign registered1 | 21,472,000 | 44,267 | ||||||
Rheinmetall AG1 | 381,264 | 40,293 | ||||||
ASSA ABLOY AB, Class B1 | 1,510,047 | 37,142 | ||||||
International Container Terminal Services, Inc.1 | 12,890,350 | 33,159 | ||||||
CCR SA, ordinary nominative | 9,410,222 | 24,403 | ||||||
Shanghai International Airport Co., Ltd., Class A1 | 2,032,685 | 23,527 | ||||||
Jardine Matheson Holdings Ltd.1 | 336,600 | 18,852 | ||||||
BAE Systems PLC1 | 2,510,000 | 16,788 | ||||||
Brenntag AG1 | 77,900 | 6,029 | ||||||
Rumo SA2 | 1,514,700 | 5,611 | ||||||
Alliance Global Group, Inc.1 | 20,000,000 | 4,417 | ||||||
|
| |||||||
| 1,222,357 | ||||||||
|
| |||||||
Information technology 8.15% | ||||||||
StoneCo Ltd., Class A2 | 1,215,600 | 102,013 | ||||||
PagSeguro Digital Ltd., Class A2 | 1,743,000 | 99,142 | ||||||
Nice Ltd. (ADR)2 | 263,000 | 74,571 | ||||||
Nomura Research Institute, Ltd.1 | 1,945,500 | 69,515 | ||||||
Taiwan Semiconductor Manufacturing Company, Ltd.1 | 3,433,000 | 64,477 | ||||||
ASML Holding NV1 | 125,945 | 60,864 | ||||||
Samsung Electronics Co., Ltd.1 | 777,000 | 58,071 | ||||||
Atlassian Corp. PLC, Class A2 | 210,500 | 49,230 | ||||||
Keyence Corp.1 | 83,000 | 46,711 | ||||||
Delta Electronics, Inc.1 | 4,812,409 | 44,891 | ||||||
Silergy Corp.1 | 474,000 | 40,636 | ||||||
OBIC Co., Ltd.1 | 172,600 | 34,712 | ||||||
Oneconnect Financial Technology Co., Ltd. (ADR)2 | 1,716,000 | 33,822 | ||||||
Avast PLC1 | 4,289,000 | 31,550 | ||||||
STMicroelectronics NV1 | 631,500 | 23,397 | ||||||
Hexagon AB, Class B1 | 208,900 | 19,023 | ||||||
Xero Ltd.1,2 | 95,031 | 10,819 | ||||||
|
| |||||||
| 863,444 | ||||||||
|
| |||||||
64 American Funds Insurance Series
Table of Contents
International Fund (continued)
Common stocks (continued)
| Shares | Value (000) | |||||||
Communication services 7.69% | ||||||||
SoftBank Group Corp.1 | 2,723,400 | $ | 213,285 | |||||
Tencent Holdings Ltd.1 | 1,729,587 | 126,376 | ||||||
Z Holdings Corp.1 | 14,787,000 | 89,685 | ||||||
Square Enix Holdings Co., Ltd.1 | 1,251,900 | 75,968 | ||||||
SoftBank Corp.1 | 4,438,300 | 55,641 | ||||||
Sea Ltd., Class A (ADR)2 | 273,600 | 54,460 | ||||||
Nintendo Co., Ltd.1 | 82,500 | 52,651 | ||||||
Bharti Airtel Ltd.1 | 6,879,515 | 48,090 | ||||||
Altice Europe NV, Class A1,2 | 5,269,395 | 34,307 | ||||||
Altice Europe NV, Class B1,2 | 1,077,927 | 6,955 | ||||||
Bilibili Inc., Class Z (ADR)2 | 429,261 | 36,796 | ||||||
Scout24 AG1 | 154,000 | 12,616 | ||||||
América Móvil, SAB de CV, Series L (ADR) | 409,657 | 5,957 | ||||||
América Móvil, SAB de CV, Series L | 2,139,900 | 1,558 | ||||||
|
| |||||||
| 814,345 | ||||||||
|
| |||||||
Energy 6.24% | ||||||||
Reliance Industries Ltd.1 | 8,944,564 | 243,658 | ||||||
Reliance Industries Ltd., interim shares1 | 196,599 | 3,015 | ||||||
Neste Oyj1 | 1,676,225 | 121,090 | ||||||
Royal Dutch Shell PLC, Class B1 | 5,001,407 | 86,166 | ||||||
Royal Dutch Shell PLC, Class A (GBP denominated)1 | 620,800 | 11,021 | ||||||
Canadian Natural Resources, Ltd. (CAD denominated) | 2,290,400 | 55,042 | ||||||
Total SE1,3 | 1,147,298 | 49,492 | ||||||
BP PLC1 | 13,959,863 | 48,089 | ||||||
Cenovus Energy Inc. | 6,343,100 | 38,620 | ||||||
Petróleo Brasileiro SA (Petrobras), ordinary nominative (ADR) | 426,000 | 4,784 | ||||||
|
| |||||||
| 660,977 | ||||||||
|
| |||||||
Materials 5.26% | ||||||||
Vale SA, ordinary nominative (ADR) | 15,872,642 | 266,026 | ||||||
Vale SA, ordinary nominative | 608,881 | 10,251 | ||||||
First Quantum Minerals Ltd. | 5,508,100 | 98,877 | ||||||
Shin-Etsu Chemical Co., Ltd.1 | 321,400 | 56,265 | ||||||
Linde PLC (EUR denominated)1 | 207,300 | 53,837 | ||||||
BHP Group PLC1 | 976,400 | 25,732 | ||||||
Akzo Nobel NV1 | 118,578 | 12,737 | ||||||
BASF SE1 | 151,600 | 11,971 | ||||||
CRH PLC1 | 250,861 | 10,604 | ||||||
Koninklijke DSM NV1 | 61,300 | 10,560 | ||||||
|
| |||||||
| 556,860 | ||||||||
|
| |||||||
Consumer staples 4.32% | ||||||||
Nestlé SA1 | 970,200 | 114,221 | ||||||
Pernod Ricard SA1 | 294,714 | 56,493 | ||||||
Inner Mongolia Yili Industrial Group Co., Ltd., Class A1 | 8,254,713 | 56,087 | ||||||
Imperial Brands PLC1 | 2,046,000 | 42,989 | ||||||
Kweichow Moutai Co., Ltd., Class A1 | 134,543 | 41,115 | ||||||
British American Tobacco PLC1 | 951,000 | 35,372 | ||||||
Kirin Holdings Company, Ltd.1,3 | 1,365,800 | 32,247 | ||||||
Treasury Wine Estates Ltd.1 | 3,771,435 | 27,358 | ||||||
Heineken NV1 | 135,200 | 15,077 | ||||||
Chocoladefabriken Lindt & Sprüngli AG1 | 107 | 10,693 | ||||||
Shiseido Company, Ltd.1 | 152,000 | 10,544 | ||||||
JBS SA, ordinary nominative | 1,811,000 | 8,249 | ||||||
Dabur India Ltd.1 | 980,000 | 7,170 | ||||||
|
| |||||||
| 457,615 | ||||||||
|
| |||||||
American Funds Insurance Series 65
Table of Contents
International Fund (continued)
Common stocks (continued)
| Shares | Value (000) | |||||||
Utilities 3.28% | ||||||||
ENN Energy Holdings Ltd.1 | 13,250,000 | $ | 194,483 | |||||
China Gas Holdings Ltd.1 | 24,134,000 | 96,227 | ||||||
E.ON SE1 | 5,147,000 | 57,003 | ||||||
|
| |||||||
| 347,713 | ||||||||
|
| |||||||
Real estate 0.79% | ||||||||
Ayala Land, Inc.1 | 54,527,900 | 46,441 | ||||||
China Overseas Land & Investment Ltd.1 | 13,502,000 | 29,371 | ||||||
CK Asset Holdings Ltd.1 | 1,442,000 | 7,417 | ||||||
|
| |||||||
| 83,229 | ||||||||
|
| |||||||
Total common stocks (cost: $6,233,438,000) | 9,934,366 | |||||||
|
| |||||||
Preferred securities 1.19% | ||||||||
Energy 0.66% | ||||||||
Petróleo Brasileiro SA (Petrobras), preferred nominative (ADR) | 6,336,898 | 70,086 | ||||||
|
| |||||||
Health care 0.53% | ||||||||
Grifols, SA, Class B, nonvoting preferred, non-registered shares1 | 3,026,230 | 56,376 | ||||||
|
| |||||||
Total preferred securities (cost: $104,416,000) | 126,462 | |||||||
|
| |||||||
Rights & warrants 0.40% | ||||||||
Health care 0.40% | ||||||||
Aier Eye Hospital Group Co., Ltd., Class A, warrants, expire 20211,5 | 1,448,500 | 16,590 | ||||||
Aier Eye Hospital Group Co., Ltd., Class A, warrants, expire 20211,2,5 | 578,554 | 6,527 | ||||||
WuXi AppTec Co., Ltd., Class A, warrants, expire 20211,5 | 896,000 | 18,498 | ||||||
|
| |||||||
| 41,615 | ||||||||
|
| |||||||
Consumer discretionary 0.00% | ||||||||
Cie. Financière Richemont SA, Class A, warrants, expire 20232 | 909,000 | 236 | ||||||
|
| |||||||
Total rights & warrants (cost: $21,623,000) | 41,851 | |||||||
|
| |||||||
Principal amount (000) | ||||||||
Convertible bonds & notes 0.01% | ||||||||
Health care 0.01% | ||||||||
NMC Health Jersey Ltd., convertible notes, 1.875% 20256 | $ | 28,000 | 1,260 | |||||
|
| |||||||
Total convertible bonds & notes (cost: $5,855,000) | 1,260 | |||||||
|
| |||||||
Bonds, notes & other debt instruments 0.17% | ||||||||
Bonds & notes of governments & government agencies outside the U.S. 0.11% | ||||||||
United Mexican States, Series M, 8.00% 2023 | MXN203,000 | 11,204 | ||||||
|
| |||||||
Corporate bonds, notes & loans 0.06% | ||||||||
Materials 0.06% | ||||||||
Vale Overseas Ltd. 3.75% 2030 | $ | 5,936 | 6,610 | |||||
|
| |||||||
Total bonds, notes & other debt instruments (cost: $15,915,000) | 17,814 | |||||||
|
| |||||||
66 American Funds Insurance Series
Table of Contents
International Fund (continued)
| Shares | Value (000) | |||||||
Short-term securities 5.08% | ||||||||
Money market investments 5.08% | ||||||||
Capital Group Central Cash Fund 0.12%7,8 | 5,237,912 | $ | 523,844 | |||||
Goldman Sachs Financial Square Government Fund, Institutional Shares 0.02%7,9 | 13,975,150 | 13,975 | ||||||
|
| |||||||
Total short-term securities (cost: $537,755,000) | 537,819 | |||||||
|
| |||||||
Total investment securities 100.65% (cost: $6,919,002,000) | 10,659,572 | |||||||
Other assets less liabilities (0.65)% | (68,714 | ) | ||||||
|
| |||||||
Net assets 100.00% | $ | 10,590,858 | ||||||
|
| |||||||
Forward currency contracts
| Contract amount | Unrealized appreciation | |||||||||||||
| Purchases (000) | Sales (000) | Counterparty | Settlement date | (depreciation) at 12/31/2020 (000) | ||||||||||
| GBP 18,500 | USD 24,992 | Citibank | 1/11/2021 | $ | 309 | |||||||||
| USD 24,907 | GBP 18,500 | Citibank | 1/11/2021 | (395 | ) | |||||||||
|
| |||||||||||||
| $ | (86 | ) | ||||||||||||
|
| |||||||||||||
Investments in affiliates8
| Value of affiliate at 1/1/2020 (000) | Additions (000) | Reductions (000) | Net realized gain (000) | Net unrealized depreciation (000) | Value of affiliate at 12/31/2020 (000) | Dividend income (000) | ||||||||||||||||||||||
Short-term securities 4.95% | ||||||||||||||||||||||||||||
Money market investments 4.95% | ||||||||||||||||||||||||||||
Capital Group Central Cash Fund 0.12%7 | $ | 544,457 | $ | 2,134,592 | $ | 2,155,054 | $ | 36 | $ | (187 | ) | $ | 523,844 | $ | 3,029 | |||||||||||||
| 1 | Valued under fair value procedures adopted by authority of the board of trustees. The total value of all such securities was $8,284,434,000, which represented 78.22% of the net assets of the fund. This amount includes $8,284,428,000 related to certain securities trading outside the U.S. whose values were adjusted as a result of significant market movements following the close of local trading. |
| 2 | Security did not produce income during the last 12 months. |
| 3 | All or a portion of this security was on loan. The total value of all such securities was $83,899,000, which represented .79% of the net assets of the fund. Refer to Note 5 for more information on securities lending. |
| 4 | Value determined using significant unobservable inputs. |
| 5 | Acquired in a transaction exempt from registration under Rule 144A of the Securities Act of 1933. May be resold in the U.S. in transactions exempt from registration, normally to qualified institutional buyers. The total value of all such securities was $41,615,000, which represented .39% of the net assets of the fund. |
| 6 | Scheduled interest and/or principal payment was not received. |
| 7 | Rate represents the seven-day yield at 12/31/2020. |
| 8 | Part of the same group of investment companies as the fund as defined under the Investment Company Act of 1940. |
| 9 | Security purchased with cash collateral from securities on loan. Refer to Note 5 for more information on securities lending. |
Key to abbreviations and symbol
ADR = American Depositary Receipts
CAD = Canadian dollars
EUR = Euros
GBP = British pounds
MXN = Mexican pesos
USD/$ = U.S. dollars
See notes to financial statements.
American Funds Insurance Series 67
Table of Contents
Investment portfolio December 31, 2020
Common stocks 89.66%
| Shares | Value (000) | |||||||
Information technology 18.98% | ||||||||
Microsoft Corp. | 410,007 | $ | 91,194 | |||||
Taiwan Semiconductor Manufacturing Company, Ltd.1 | 3,960,000 | 74,375 | ||||||
PagSeguro Digital Ltd., Class A2 | 1,145,350 | 65,147 | ||||||
StoneCo Ltd., Class A2 | 712,435 | 59,788 | ||||||
Mastercard Inc., Class A | 146,107 | 52,151 | ||||||
PayPal Holdings, Inc.2 | 204,345 | 47,858 | ||||||
Keyence Corp.1 | 68,700 | 38,663 | ||||||
Broadcom Inc. | 86,409 | 37,834 | ||||||
Adobe Inc.2 | 67,840 | 33,928 | ||||||
ASML Holding NV1 | 62,856 | 30,376 | ||||||
Cree, Inc.2 | 253,513 | 26,847 | ||||||
Silergy Corp.1 | 307,000 | 26,319 | ||||||
Samsung Electronics Co., Ltd.1 | 308,854 | 23,083 | ||||||
EPAM Systems, Inc.2 | 52,701 | 18,885 | ||||||
Kingdee International Software Group Co. Ltd.1 | 3,135,000 | 12,866 | ||||||
Accenture PLC, Class A | 43,462 | 11,353 | ||||||
Apple Inc. | 82,604 | 10,961 | ||||||
Visa Inc., Class A | 45,355 | 9,920 | ||||||
Trimble Inc.2 | 143,946 | 9,611 | ||||||
Hexagon AB, Class B1 | 91,408 | 8,324 | ||||||
Oneconnect Financial Technology Co., Ltd. (ADR)2 | 417,419 | 8,227 | ||||||
Tokyo Electron Ltd.1 | 18,600 | 6,937 | ||||||
MediaTek Inc.1 | 259,000 | 6,917 | ||||||
Edenred SA1 | 112,405 | 6,378 | ||||||
Advanced Micro Devices, Inc.2 | 67,034 | 6,148 | ||||||
FleetCor Technologies, Inc.2 | 20,916 | 5,706 | ||||||
Network International Holdings PLC1,2 | 1,260,807 | 5,630 | ||||||
Inphi Corp.2 | 32,349 | 5,191 | ||||||
Atlassian Corp. PLC, Class A2 | 20,258 | 4,738 | ||||||
Chindata Group Holdings Ltd., Class A (ADR)2 | 172,368 | 4,130 | ||||||
Halma PLC1 | 121,095 | 4,057 | ||||||
Autodesk, Inc.2 | 12,375 | 3,779 | ||||||
NetEase, Inc.1 | 194,400 | 3,720 | ||||||
Logitech International SA1 | 37,097 | 3,598 | ||||||
Nokia Corp.1,2 | 802,140 | 3,059 | ||||||
Micron Technology, Inc.2 | 39,018 | 2,933 | ||||||
Cognizant Technology Solutions Corp., Class A | 35,343 | 2,896 | ||||||
ON Semiconductor Corp.2 | 82,489 | 2,700 | ||||||
GDS Holdings Ltd., Class A1,2 | 230,900 | 2,691 | ||||||
Nice Ltd. (ADR)2 | 9,355 | 2,652 | ||||||
Aspen Technology, Inc.2 | 19,209 | 2,502 | ||||||
Elastic NV, non-registered shares2 | 15,997 | 2,338 | ||||||
Globant SA2 | 10,638 | 2,315 | ||||||
Amphenol Corp., Class A | 16,828 | 2,201 | ||||||
Hamamatsu Photonics KK1 | 30,700 | 1,758 | ||||||
SAP SE1 | 12,349 | 1,623 | ||||||
TravelSky Technology Ltd., Class H1 | 664,000 | 1,602 | ||||||
KLA Corp. | 5,692 | 1,474 | ||||||
Hangzhou Hikvision Digital Technology Co., Ltd., Class A1 | 193,443 | 1,438 | ||||||
Intel Corp. | 28,781 | 1,434 | ||||||
CMC Materials, Inc. | 8,338 | 1,261 | ||||||
VeriSign, Inc.2 | 5,316 | 1,150 | ||||||
Amadeus IT Group SA, Class A, non-registered shares1 | 14,929 | 1,081 | ||||||
Vontier Corp.2 | 31,087 | 1,038 | ||||||
Coforge Ltd.1 | 20,580 | 765 | ||||||
|
| |||||||
| 805,550 | ||||||||
|
| |||||||
Consumer discretionary 14.40% | ||||||||
MercadoLibre, Inc.2 | 53,020 | 88,820 | ||||||
Alibaba Group Holding Ltd.1,2 | 2,075,204 | 60,633 | ||||||
LVMH Moët Hennessy-Louis Vuitton SE1 | 57,683 | 36,042 | ||||||
Delivery Hero SE1,2 | 228,670 | 35,492 | ||||||
68 American Funds Insurance Series
Table of Contents
New World Fund (continued)
Common stocks (continued)
| Shares | Value (000) | |||||||
Consumer discretionary (continued) | ||||||||
Naspers Ltd., Class N1 | 129,169 | $ | 26,437 | |||||
General Motors Company | 531,686 | 22,139 | ||||||
Galaxy Entertainment Group Ltd.1 | 2,777,000 | 21,600 | ||||||
Hermès International1 | 19,805 | 21,297 | ||||||
Meituan, Class B1,2 | 523,802 | 20,034 | ||||||
Kering SA1 | 26,627 | 19,358 | ||||||
XPeng Inc., Class A (ADR)2,3 | 434,541 | 18,611 | ||||||
EssilorLuxottica1 | 106,218 | 16,565 | ||||||
Evolution Gaming Group AB1 | 158,058 | 16,025 | ||||||
JD Health International Inc.1,2 | 710,150 | 13,741 | ||||||
adidas AG1,2 | 32,858 | 11,961 | ||||||
Cie. Financière Richemont SA, Class A1 | 115,827 | 10,466 | ||||||
Sony Corp.1 | 103,800 | 10,436 | ||||||
NIKE, Inc., Class B | 71,017 | 10,047 | ||||||
Booking Holdings Inc.2 | 4,420 | 9,845 | ||||||
Gree Electric Appliances, Inc. of Zhuhai, Class A1 | 895,846 | 8,504 | ||||||
Li Ning Co. Ltd.1 | 1,231,501 | 8,484 | ||||||
Pop Mart International Group Ltd.1,2 | 778,200 | 8,166 | ||||||
Melco Resorts & Entertainment Ltd. (ADR) | 411,713 | 7,637 | ||||||
IDP Education Ltd.1 | 418,781 | 6,415 | ||||||
Jumbo SA1 | 362,261 | 6,308 | ||||||
Astra International Tbk PT1 | 14,461,800 | 6,211 | ||||||
YUM! Brands, Inc. | 52,525 | 5,702 | ||||||
Wyndham Hotels & Resorts, Inc. | 95,196 | 5,659 | ||||||
Marriott International, Inc., Class A | 42,036 | 5,545 | ||||||
JD.com, Inc., Class A1,2 | 120,550 | 5,309 | ||||||
Zhongsheng Group Holdings Ltd.1 | 683,500 | 4,873 | ||||||
Midea Group Co., Ltd., Class A1 | 307,835 | 4,642 | ||||||
Fast Retailing Co., Ltd.1 | 4,900 | 4,397 | ||||||
Suzuki Motor Corp.1 | 86,400 | 4,011 | ||||||
Wynn Macau, Ltd.1,2 | 2,336,800 | 3,929 | ||||||
Ferrari NV1 | 14,576 | 3,371 | ||||||
China MeiDong Auto Holdings Ltd.1 | 816,000 | 3,318 | ||||||
Prosus NV1 | 30,717 | 3,304 | ||||||
Industria de Diseño Textil, SA1 | 101,889 | 3,244 | ||||||
Samsonite International SA1,2 | 1,787,100 | 3,175 | ||||||
Allegro.eu1,2 | 136,887 | 3,111 | ||||||
Maruti Suzuki India Ltd.1 | 28,401 | 2,980 | ||||||
Domino’s Pizza, Inc. | 7,473 | 2,866 | ||||||
Flutter Entertainment PLC (GBP denominated)1 | 12,491 | 2,586 | ||||||
Hyundai Motor Co.1 | 12,662 | 2,246 | ||||||
Shangri-La Asia Ltd.1,2 | 2,212,000 | 1,973 | ||||||
Aptiv PLC | 14,036 | 1,829 | ||||||
InterContinental Hotels Group PLC1,2 | 26,077 | 1,694 | ||||||
Airbnb, Inc., Class A2 | 10,563 | 1,551 | ||||||
Lojas Americanas SA, ordinary nominative | 384,328 | 1,513 | ||||||
Entain PLC1,2 | 94,780 | 1,471 | ||||||
Peugeot SA1,2 | 39,005 | 1,068 | ||||||
Vivo Energy PLC1 | 919,486 | 1,063 | ||||||
Dada Nexus Ltd. (ADR)2,3 | 25,200 | 920 | ||||||
Levi Strauss & Co., Class A | 45,515 | 914 | ||||||
Wynn Resorts, Ltd. | 7,397 | 835 | ||||||
Bayerische Motoren Werke AG1 | 6,118 | 540 | ||||||
|
| |||||||
| 610,913 | ||||||||
|
| |||||||
Health care 12.35% | ||||||||
Zai Lab Ltd. (ADR)2 | 384,191 | 51,996 | ||||||
Thermo Fisher Scientific Inc. | 83,711 | 38,991 | ||||||
WuXi Biologics (Cayman) Inc.1,2 | 2,647,600 | 35,266 | ||||||
Carl Zeiss Meditec AG, non-registered shares1 | 205,241 | 27,310 | ||||||
WuXi AppTec Co., Ltd., Class A1 | 871,716 | 17,996 | ||||||
WuXi AppTec Co., Ltd., Class H1 | 459,100 | 9,020 | ||||||
American Funds Insurance Series 69
Table of Contents
New World Fund (continued)
Common stocks (continued)
| Shares | Value (000) | |||||||
Health care (continued) | ||||||||
AstraZeneca PLC1 | 232,864 | $ | 23,265 | |||||
Notre Dame Intermédica Participações SA | 1,465,403 | 22,102 | ||||||
Abbott Laboratories | 200,515 | 21,954 | ||||||
BioMarin Pharmaceutical Inc.2 | 179,080 | 15,704 | ||||||
PerkinElmer, Inc. | 107,200 | 15,383 | ||||||
Asahi Intecc Co., Ltd.1 | 412,600 | 15,062 | ||||||
bioMérieux SA1 | 95,915 | 13,526 | ||||||
Jiangsu Hengrui Medicine Co., Ltd., Class A1 | 779,198 | 13,311 | ||||||
BeiGene, Ltd. (ADR)2 | 46,796 | 12,091 | ||||||
BeiGene, Ltd.1,2 | 54,000 | 1,086 | ||||||
CSL Ltd.1 | 57,968 | 12,666 | ||||||
Pharmaron Beijing Co., Ltd., Class H1 | 431,200 | 7,308 | ||||||
Pharmaron Beijing Co., Ltd., Class A1 | 265,800 | 4,894 | ||||||
Aier Eye Hospital Group Co., Ltd., Class A1 | 1,033,827 | 11,841 | ||||||
Yunnan Baiyao Group Co., Ltd., Class A1 | 679,100 | 11,826 | ||||||
Koninklijke Philips NV (EUR denominated)1,2 | 205,320 | 10,988 | ||||||
Shionogi & Co., Ltd.1 | 179,300 | 9,801 | ||||||
Olympus Corp.1 | 440,900 | 9,651 | ||||||
Novo Nordisk A/S, Class B1 | 111,509 | 7,800 | ||||||
Hypera SA, ordinary nominative | 1,156,915 | 7,629 | ||||||
Hugel, Inc.1,2 | 43,840 | 7,585 | ||||||
CanSino Biologics Inc., Class H1,2 | 323,600 | 7,406 | ||||||
Straumann Holding AG1 | 6,192 | 7,211 | ||||||
Guangzhou Kingmed Diagnostics Group Co., Ltd., Class A1 | 346,233 | 6,802 | ||||||
Pfizer Inc. | 171,061 | 6,297 | ||||||
Hangzhou Tigermed Consulting Co., Ltd., Class A1 | 227,271 | 5,632 | ||||||
Teva Pharmaceutical Industries Ltd. (ADR)2 | 573,624 | 5,536 | ||||||
Novartis AG1 | 55,224 | 5,216 | ||||||
Zoetis Inc., Class A | 31,037 | 5,137 | ||||||
Alibaba Health Information Technology Ltd.1,2 | 1,650,600 | 4,898 | ||||||
Hikma Pharmaceuticals PLC1 | 135,368 | 4,663 | ||||||
Medtronic PLC | 39,620 | 4,641 | ||||||
Danaher Corp. | 20,736 | 4,606 | ||||||
HOYA Corp.1 | 27,600 | 3,815 | ||||||
Baxter International Inc. | 47,480 | 3,810 | ||||||
Alcon Inc.1,2 | 55,002 | 3,672 | ||||||
Grifols, SA, Class A, non-registered shares1 | 84,195 | 2,458 | ||||||
Grifols, SA, Class B (ADR) | 30,657 | 565 | ||||||
Mettler-Toledo International Inc.2 | 1,661 | 1,893 | ||||||
Lupin Ltd.1 | 140,828 | 1,885 | ||||||
OdontoPrev SA, ordinary nominative | 554,693 | 1,554 | ||||||
Viatris Inc.2 | 21,294 | 399 | ||||||
NMC Health PLC1,2,4 | 49,400 | 1 | ||||||
|
| |||||||
| 524,149 | ||||||||
|
| |||||||
Financials 11.00% | ||||||||
Kotak Mahindra Bank Ltd.1,2 | 2,768,189 | 75,756 | ||||||
AIA Group Ltd.1 | 4,488,200 | 55,284 | ||||||
HDFC Bank Ltd.1,2 | 2,384,834 | 46,976 | ||||||
HDFC Bank Ltd. (ADR)2 | 76,097 | 5,499 | ||||||
B3 SA - Brasil, Bolsa, Balcao | 2,627,316 | 31,351 | ||||||
Société Générale1,2 | 1,218,593 | 25,386 | ||||||
XP Inc., Class A2 | 480,952 | 19,079 | ||||||
Bajaj Finance Ltd.1 | 261,996 | 19,028 | ||||||
Capitec Bank Holdings Ltd.1,2 | 185,645 | 18,091 | ||||||
Sberbank of Russia PJSC (ADR)1 | 1,012,500 | 14,596 | ||||||
Sberbank of Russia PJSC (ADR) | 226,687 | 3,287 | ||||||
Ping An Insurance (Group) Company of China, Ltd., Class H1 | 1,371,300 | 16,844 | ||||||
Ping An Insurance (Group) Company of China, Ltd., Class A1 | 36,100 | 480 | ||||||
UniCredit SpA1,2 | 1,762,672 | 16,312 | ||||||
HDFC Life Insurance Company Ltd.1,2 | 1,109,818 | 10,295 | ||||||
ICICI Bank Ltd. (ADR)2 | 495,101 | 7,357 | ||||||
70 American Funds Insurance Series
Table of Contents
New World Fund (continued)
Common stocks (continued)
| Shares | Value (000) | |||||||
Financials (continued) | ||||||||
ICICI Bank Ltd.1,2 | 384,782 | $ | 2,825 | |||||
Moody’s Corp. | 31,860 | 9,247 | ||||||
Banco Bilbao Vizcaya Argentaria, SA1 | 1,830,437 | 8,973 | ||||||
Hong Kong Exchanges and Clearing Ltd.1 | 153,700 | 8,454 | ||||||
S&P Global Inc. | 22,691 | 7,459 | ||||||
Discovery Ltd.1 | 565,192 | 5,849 | ||||||
Bajaj Finserv Ltd.1 | 45,189 | 5,518 | ||||||
Fairfax Financial Holdings Ltd., subordinate voting shares | 15,658 | 5,337 | ||||||
TCS Group Holding PLC (GDR)1,5 | 140,222 | 4,584 | ||||||
TCS Group Holding PLC (GDR)1 | 1,553 | 51 | ||||||
Bank Central Asia Tbk PT1 | 1,879,300 | 4,528 | ||||||
Lufax Holding Ltd. (ADR)2 | 291,670 | 4,142 | ||||||
China Merchants Bank Co., Ltd., Class H1 | 605,500 | 3,845 | ||||||
UBS Group AG1 | 225,557 | 3,155 | ||||||
AU Small Finance Bank Ltd.1,2 | 259,859 | 3,050 | ||||||
Moscow Exchange MICEX-RTS PJSC1 | 1,404,664 | 3,031 | ||||||
Eurobank Ergasias Services and Holdings SA1,2 | 4,206,715 | 2,978 | ||||||
PICC Property and Casualty Co. Ltd., Class H1 | 3,623,000 | 2,745 | ||||||
Alpha Bank SA1,2 | 2,100,154 | 2,453 | ||||||
Chubb Ltd. | 15,529 | 2,390 | ||||||
The People’s Insurance Co. (Group) of China Ltd., Class H1 | 6,833,000 | 2,171 | ||||||
Axis Bank Ltd.1,2 | 219,958 | 1,872 | ||||||
BB Seguridade Participações SA | 273,314 | 1,559 | ||||||
Bank of the Philippine Islands1 | 839,100 | 1,424 | ||||||
Kasikornbank PCL, foreign registered1 | 345,200 | 1,318 | ||||||
Banco Santander México, SA, Institución de Banca Múltiple, Grupo Financiero Santander México, Class B2 | 1,278,484 | 1,305 | ||||||
Credicorp Ltd. | 4,951 | 812 | ||||||
|
| |||||||
| 466,696 | ||||||||
|
| |||||||
Communication services 8.28% | ||||||||
Tencent Holdings Ltd.1 | 1,058,700 | 77,356 | ||||||
Sea Ltd., Class A (ADR)2 | 259,149 | 51,584 | ||||||
Facebook, Inc., Class A2 | 183,040 | 49,999 | ||||||
Alphabet Inc., Class C2 | 22,802 | 39,946 | ||||||
Alphabet Inc., Class A2 | 3,487 | 6,112 | ||||||
Netflix, Inc.2 | 48,388 | 26,165 | ||||||
Yandex NV, Class A2 | 283,230 | 19,707 | ||||||
América Móvil, SAB de CV, Series L (ADR) | 1,066,269 | 15,504 | ||||||
Electronic Arts Inc. | 92,639 | 13,303 | ||||||
Activision Blizzard, Inc. | 126,033 | 11,702 | ||||||
Bharti Airtel Ltd.1 | 892,598 | 6,239 | ||||||
Indus Towers Ltd.1 | 1,872,343 | 5,909 | ||||||
Vodafone Group PLC1 | 3,261,452 | 5,367 | ||||||
JOYY Inc., Class A (ADR) | 53,334 | 4,266 | ||||||
Bilibili Inc., Class Z (ADR)2 | 47,070 | 4,035 | ||||||
MTN Group Ltd.1 | 943,276 | 3,868 | ||||||
China Tower Corp. Ltd., Class H1 | 23,738,000 | 3,494 | ||||||
SoftBank Group Corp.1 | 39,400 | 3,086 | ||||||
Informa PLC1 | 186,868 | 1,404 | ||||||
JCDecaux SA1,2 | 48,473 | 1,107 | ||||||
Telkom Indonesia (Persero) Tbk PT, Class B1 | 4,360,300 | 1,029 | ||||||
|
| |||||||
| 351,182 | ||||||||
|
| |||||||
Materials 5.95% | ||||||||
Vale SA, ordinary nominative | 1,721,168 | 28,977 | ||||||
Vale SA, ordinary nominative (ADR) | 1,497,718 | 25,102 | ||||||
First Quantum Minerals Ltd. | 1,278,353 | 22,948 | ||||||
Sika AG1 | 70,329 | 19,200 | ||||||
Asian Paints Ltd.1 | 499,171 | 18,927 | ||||||
Freeport-McMoRan Inc. | 394,687 | 10,270 | ||||||
Shin-Etsu Chemical Co., Ltd.1 | 56,900 | 9,961 | ||||||
American Funds Insurance Series 71
Table of Contents
New World Fund (continued)
Common stocks (continued)
| Shares | Value (000) | |||||||
Materials (continued) | ||||||||
Rio Tinto PLC1 | 106,811 | $ | 7,992 | |||||
Linde PLC | 29,913 | 7,882 | ||||||
LANXESS AG1 | 98,732 | 7,571 | ||||||
Koninklijke DSM NV1 | 39,449 | 6,796 | ||||||
Givaudan SA1 | 1,578 | 6,647 | ||||||
AngloGold Ashanti Ltd. (ADR) | 210,144 | 4,753 | ||||||
AngloGold Ashanti Ltd.1 | 70,895 | 1,621 | ||||||
Gerdau SA (ADR) | 1,298,914 | 6,066 | ||||||
Shree Cement Ltd.1 | 18,011 | 5,933 | ||||||
Arkema SA1 | 44,846 | 5,126 | ||||||
BHP Group PLC1 | 192,429 | 5,071 | ||||||
CCL Industries Inc., Class B, nonvoting shares | 93,655 | 4,252 | ||||||
Umicore SA1 | 87,348 | 4,196 | ||||||
Air Liquide SA, non-registered shares1 | 25,294 | 4,151 | ||||||
Akzo Nobel NV1 | 36,592 | 3,931 | ||||||
Loma Negra Compania Industrial Argentina SA (ADR) | 599,550 | 3,687 | ||||||
BASF SE1 | 45,331 | 3,580 | ||||||
Alrosa PJSC1 | 2,643,724 | 3,515 | ||||||
Barrick Gold Corp. | 142,586 | 3,248 | ||||||
Beijing Oriental Yuhong Waterproof Technology Co., Ltd., Class A1 | 546,193 | 3,242 | ||||||
Chr. Hansen Holding A/S1,2 | 27,666 | 2,847 | ||||||
SIG Combibloc Group AG1 | 122,353 | 2,834 | ||||||
Huntsman Corp. | 103,725 | 2,608 | ||||||
Turquoise Hill Resources Ltd.2 | 156,812 | 1,948 | ||||||
Turquoise Hill Resources Ltd. (CAD denominated)2 | 49,730 | 618 | ||||||
Amcor PLC (CDI)1 | 162,847 | 1,934 | ||||||
Celanese Corp. | 14,743 | 1,916 | ||||||
Dow Inc. | 32,269 | 1,791 | ||||||
Asahi Kasei Corp.1 | 130,400 | 1,341 | ||||||
|
| |||||||
| 252,482 | ||||||||
|
| |||||||
Industrials 5.91% | ||||||||
Shanghai International Airport Co., Ltd., Class A1 | 2,560,277 | 29,634 | ||||||
Airbus SE, non-registered shares1,2 | 244,231 | 26,829 | ||||||
Safran SA1,2 | 162,243 | 23,009 | ||||||
CCR SA, ordinary nominative | 8,621,584 | 22,358 | ||||||
Wizz Air Holdings PLC1,2 | 220,032 | 13,742 | ||||||
IMCD NV1 | 99,924 | 12,696 | ||||||
International Container Terminal Services, Inc.1 | 4,297,260 | 11,054 | ||||||
DSV Panalpina A/S1 | 64,161 | 10,738 | ||||||
SMC Corp.1 | 16,500 | 10,077 | ||||||
Rumo SA2 | 2,191,897 | 8,119 | ||||||
Nidec Corp.1 | 56,800 | 7,157 | ||||||
TransDigm Group Inc.2 | 11,118 | 6,880 | ||||||
Ryanair Holdings PLC (ADR)2 | 52,278 | 5,750 | ||||||
Fortive Corp. | 76,735 | 5,434 | ||||||
Daikin Industries, Ltd.1 | 23,300 | 5,189 | ||||||
Han’s Laser Technology Industry Group Co., Ltd., Class A1 | 771,125 | 5,053 | ||||||
Airports of Thailand PCL, foreign registered1 | 2,363,200 | 4,872 | ||||||
Spirax-Sarco Engineering PLC1 | 28,754 | 4,444 | ||||||
Centre Testing International Group Co., Ltd.1 | 1,056,096 | 4,427 | ||||||
Copa Holdings, SA, Class A | 48,964 | 3,782 | ||||||
Jardine Matheson Holdings Ltd.1 | 59,000 | 3,305 | ||||||
Guangzhou Baiyun International Airport Co. Ltd., Class A1 | 1,501,303 | 3,245 | ||||||
Epiroc AB, Class B1 | 178,529 | 3,025 | ||||||
A-Living Smart City Services Co., Ltd., Class H1 | 659,500 | 2,938 | ||||||
Boeing Company | 11,550 | 2,472 | ||||||
ABB Ltd.1 | 83,200 | 2,327 | ||||||
Komatsu Ltd.1 | 81,500 | 2,233 | ||||||
Experian PLC1 | 56,793 | 2,164 | ||||||
Air Lease Corp., Class A | 43,452 | 1,930 | ||||||
Hefei Meyer Optoelectronic Technology Inc., Class A1 | 254,600 | 1,728 | ||||||
72 American Funds Insurance Series
Table of Contents
New World Fund (continued)
Common stocks (continued)
| Shares | Value (000) | |||||||
Industrials (continued) | ||||||||
Atlas Copco AB, Class B1 | 37,156 | $ | 1,669 | |||||
Havells India Ltd.1 | 126,664 | 1,589 | ||||||
Carrier Global Corp. | 23,873 | 901 | ||||||
|
| |||||||
| 250,770 | ||||||||
|
| |||||||
Consumer staples 5.71% | ||||||||
Kweichow Moutai Co., Ltd., Class A1 | 253,607 | 77,500 | ||||||
Nestlé SA1 | 162,495 | 19,130 | ||||||
Foshan Haitian Flavouring and Food Co. Ltd., Class A1 | 597,861 | 18,388 | ||||||
Nongfu Spring Co., Ltd., Class H1,2,3 | 2,018,605 | 14,354 | ||||||
Anheuser-Busch InBev SA/NV1 | 176,745 | 12,351 | ||||||
Carlsberg A/S, Class B1 | 55,396 | 8,881 | ||||||
Raia Drogasil SA, ordinary nominative | 1,594,597 | 7,687 | ||||||
Pernod Ricard SA1 | 39,282 | 7,530 | ||||||
Avenue Supermarts Ltd.1,2 | 142,505 | 5,389 | ||||||
Mondelez International, Inc. | 85,994 | 5,028 | ||||||
Reckitt Benckiser Group PLC1 | 53,352 | 4,772 | ||||||
Fomento Económico Mexicano, SAB de CV | 618,449 | 4,672 | ||||||
Unilever PLC1 | 76,805 | 4,623 | ||||||
British American Tobacco PLC1 | 117,770 | 4,380 | ||||||
United Spirits Ltd.1,2 | 535,599 | 4,246 | ||||||
Wal-Mart de México, SAB de CV, Series V | 1,351,284 | 3,801 | ||||||
Shiseido Company, Ltd.1 | 50,800 | 3,524 | ||||||
Inner Mongolia Yili Industrial Group Co., Ltd., Class A1 | 513,300 | 3,488 | ||||||
ITC Ltd.1 | 1,169,574 | 3,350 | ||||||
Heineken NV1 | 27,072 | 3,019 | ||||||
Kimberly-Clark de México, SAB de CV, Class A | 1,647,040 | 2,813 | ||||||
Jonjee Hi-Tech Industrial and Commercial Holding Co., Ltd., Class A1 | 266,585 | 2,725 | ||||||
Constellation Brands, Inc., Class A | 11,586 | 2,538 | ||||||
Uni-Charm Corp.1 | 52,100 | 2,472 | ||||||
L’Oréal SA, non-registered shares1 | 6,491 | 2,466 | ||||||
Kirin Holdings Company, Ltd.1 | 89,700 | 2,118 | ||||||
Herbalife Nutrition Ltd.2 | 41,972 | 2,017 | ||||||
Japan Tobacco Inc.1,3 | 97,300 | 1,983 | ||||||
Colgate-Palmolive Company | 18,811 | 1,609 | ||||||
Danone SA1 | 21,048 | 1,383 | ||||||
McCormick & Co., Inc., nonvoting shares | 13,126 | 1,255 | ||||||
JBS SA, ordinary nominative | 259,002 | 1,180 | ||||||
Chengdu Hongqi Chain Co., Ltd.1 | 1,109,901 | 1,124 | ||||||
Diageo PLC1 | 11,617 | 459 | ||||||
|
| |||||||
| 242,255 | ||||||||
|
| |||||||
Energy 3.77% | ||||||||
Reliance Industries Ltd.1 | 2,911,135 | 79,302 | ||||||
Reliance Industries Ltd., interim shares1 | 152,741 | 2,343 | ||||||
Petróleo Brasileiro SA (Petrobras), ordinary nominative (ADR) | 3,866,812 | 43,424 | ||||||
Royal Dutch Shell PLC, Class B1 | 446,106 | 7,686 | ||||||
Rosneft Oil Company PJSC (GDR)1 | 1,301,724 | 7,340 | ||||||
New Fortress Energy Inc., Class A | 96,956 | 5,196 | ||||||
Gazprom PJSC (ADR)1 | 780,774 | 4,341 | ||||||
Schlumberger Ltd. | 172,397 | 3,763 | ||||||
Total SE1,3 | 74,483 | 3,213 | ||||||
Chevron Corp. | 31,798 | 2,685 | ||||||
United Tractors Tbk PT1 | 326,800 | 620 | ||||||
|
| |||||||
| 159,913 | ||||||||
|
| |||||||
Real estate 1.68% | ||||||||
American Tower Corp. REIT | 45,257 | 10,158 | ||||||
Shimao Services Holdings Ltd.1,2 | 6,203,187 | 9,570 | ||||||
ESR Cayman Ltd.1,2 | 2,262,400 | 8,131 | ||||||
CK Asset Holdings Ltd.1 | 1,249,500 | 6,427 | ||||||
BR Malls Participacoes SA, ordinary nominative2 | 3,304,622 | 6,298 | ||||||
American Funds Insurance Series 73
Table of Contents
New World Fund (continued)
Common stocks (continued)
| Shares | Value (000) | |||||||
Real estate (continued) | ||||||||
Ayala Land, Inc.1 | 6,681,900 | $ | 5,691 | |||||
KE Holdings Inc., Class A (ADR)2 | 87,058 | 5,358 | ||||||
CIFI Holdings (Group) Co. Ltd.1 | 5,873,674 | 4,981 | ||||||
Embassy Office Parks REIT1 | 939,200 | 4,435 | ||||||
Shimao Group Holdings Ltd.1 | 1,282,000 | 4,099 | ||||||
China Overseas Land & Investment Ltd.1 | 1,464,500 | 3,186 | ||||||
Longfor Group Holdings Ltd.1 | 495,000 | 2,907 | ||||||
|
| |||||||
| 71,241 | ||||||||
|
| |||||||
Utilities 1.63% | ||||||||
ENN Energy Holdings Ltd.1 | 1,619,800 | 23,776 | ||||||
China Gas Holdings Ltd.1 | 5,533,000 | 22,061 | ||||||
AES Corp. | 345,838 | 8,127 | ||||||
China Resources Gas Group Ltd.1 | 1,092,000 | 5,808 | ||||||
Enel SpA1 | 515,991 | 5,211 | ||||||
Engie SA1,2 | 275,227 | 4,214 | ||||||
|
| |||||||
| 69,197 | ||||||||
|
| |||||||
Total common stocks (cost: $2,195,857,000) | 3,804,348 | |||||||
|
| |||||||
Preferred securities 1.14% | ||||||||
Industrials 0.31% | ||||||||
Azul SA, preferred nominative (ADR)2,3 | 357,605 | 8,161 | ||||||
GOL Linhas Aéreas Inteligentes SA, preferred nominative2 | 847,943 | 4,071 | ||||||
GOL Linhas Aéreas Inteligentes SA, preferred nominative (ADR)2 | 72,525 | 712 | ||||||
|
| |||||||
| 12,944 | ||||||||
|
| |||||||
Materials 0.29% | ||||||||
Gerdau SA, preferred nominative | 2,652,635 | 12,487 | ||||||
|
| |||||||
Consumer discretionary 0.22% | ||||||||
Volkswagen AG, nonvoting preferred shares1 | 35,834 | 6,676 | ||||||
Lojas Americanas SA, preferred nominative | 489,555 | 2,478 | ||||||
|
| |||||||
| 9,154 | ||||||||
|
| |||||||
Health care 0.10% | ||||||||
Grifols, SA, Class B, nonvoting preferred, non-registered shares1 | 235,609 | 4,389 | ||||||
|
| |||||||
Consumer staples 0.07% | ||||||||
Henkel AG & Co. KGaA, nonvoting preferred shares1 | 27,859 | 3,139 | ||||||
|
| |||||||
Information technology 0.07% | ||||||||
Samsung Electronics Co., Ltd., nonvoting preferred shares1 | 44,182 | 2,999 | ||||||
|
| |||||||
Energy 0.05% | ||||||||
Petróleo Brasileiro SA (Petrobras), preferred nominative (ADR) | 101,360 | 1,121 | ||||||
Petróleo Brasileiro SA (Petrobras), preferred nominative | 182,615 | 997 | ||||||
|
| |||||||
| 2,118 | ||||||||
|
| |||||||
Financials 0.03% | ||||||||
Itaúsa SA, preferred nominative | 525,633 | 1,187 | ||||||
|
| |||||||
Real estate 0.00% | ||||||||
Ayala Land, Inc., preferred shares1,2,4 | 15,000,000 | — | 6 | |||||
|
| |||||||
Total preferred securities (cost: $30,866,000) | 48,417 | |||||||
|
| |||||||
74 American Funds Insurance Series
Table of Contents
New World Fund (continued)
Rights & warrants 0.27%
| Shares | Value (000) | |||||||
Consumer staples 0.25% | ||||||||
Foshan Haitian Flavouring and Food Co., Ltd., Class A, warrants, expire 20221,5 | 336,160 | $ | 10,339 | |||||
|
| |||||||
Health care 0.02% | ||||||||
Aier Eye Hospital Group Co., Ltd., Class A, warrants, expire 20211,5 | 54,200 | 621 | ||||||
Aier Eye Hospital Group Co., Ltd., Class A, warrants, expire 20211,2,5 | 21,625 | 244 | ||||||
|
| |||||||
| 865 | ||||||||
|
| |||||||
Consumer discretionary 0.00% | ||||||||
Cie. Financière Richemont SA, Class A, warrants, expire 20232 | 144,354 | 37 | ||||||
|
| |||||||
Total rights & warrants (cost: $3,236,000) | 11,241 | |||||||
|
| |||||||
Convertible bonds & notes 0.00% | ||||||||
Principal amount (000) | ||||||||
Health care 0.00% | ||||||||
BioMarin Pharmaceutical Inc., convertible bonds, 1.25% 20275 | $ | 114 | 120 | |||||
|
| |||||||
Total convertible bonds & notes (cost: $121,000) | 120 | |||||||
|
| |||||||
Bonds, notes & other debt instruments 2.83% | ||||||||
Bonds & notes of governments & government agencies outside the U.S. 2.47% | ||||||||
Abu Dhabi (Emirate of) 2.50% 20295 | 1,900 | 2,055 | ||||||
Abu Dhabi (Emirate of) 1.70% 20315 | 455 | 456 | ||||||
Angola (Republic of) 9.50% 2025 | 800 | 833 | ||||||
Angola (Republic of) 8.25% 2028 | 200 | 192 | ||||||
Angola (Republic of) 8.00% 20295 | 2,800 | 2,639 | ||||||
Angola (Republic of) 8.00% 2029 | 200 | 189 | ||||||
Argentine Republic 1.00% 2029 | 384 | 167 | ||||||
Argentine Republic 0.125% 2030 (0.50% on 7/9/2021)7 | 757 | 308 | ||||||
Argentine Republic 0.125% 2035 (1.125% on 7/9/2021)7 | 4,190 | 1,538 | ||||||
Argentine Republic 0.125% 2038 (2.00% on 7/9/2021)7 | 1,318 | 541 | ||||||
Argentine Republic 0.125% 2041 (2.50% on 7/9/2021)7 | 5,900 | 2,239 | ||||||
Armenia (Republic of) 7.15% 2025 | 490 | 566 | ||||||
Bahrain (Kingdom of) 6.75% 20295 | 500 | 576 | ||||||
Belarus (Republic of) 6.875% 2023 | 1,775 | 1,860 | ||||||
Belarus (Republic of) 5.875% 2026 | 230 | 237 | ||||||
Belarus (Republic of) 7.625% 2027 | 335 | 370 | ||||||
Buenos Aires (City of) 8.95% 2021 | 359 | 359 | ||||||
Cameroon (Republic of) 9.50% 2025 | 805 | 899 | ||||||
Colombia (Republic of) 4.50% 2026 | 1,250 | 1,419 | ||||||
Colombia (Republic of) 7.375% 2037 | 600 | 878 | ||||||
Colombia (Republic of) 4.125% 2051 | 350 | 390 | ||||||
Costa Rica (Republic of) 4.375% 2025 | 234 | 219 | ||||||
Costa Rica (Republic of) 6.125% 20315 | 1,250 | 1,170 | ||||||
Costa Rica (Republic of) 6.125% 2031 | 818 | 766 | ||||||
Costa Rica (Republic of) 7.158% 2045 | 498 | 464 | ||||||
Cote d’Ivoire (Republic of) 4.875% 2032 | € | 150 | 189 | |||||
Dominican Republic 9.75% 2026 | DOP | 18,150 | 336 | |||||
Dominican Republic 8.625% 20275 | $ | 575 | 733 | |||||
Dominican Republic 11.375% 2029 | DOP | 12,800 | 265 | |||||
Dominican Republic 7.45% 20445 | $ | 1,125 | 1,458 | |||||
Dominican Republic 7.45% 2044 | 1,100 | 1,426 | ||||||
Dominican Republic 6.85% 2045 | 100 | 122 | ||||||
Dominican Republic 5.875% 20605 | 280 | 309 | ||||||
Egypt (Arab Republic of) 5.75% 20245 | 450 | 483 | ||||||
Egypt (Arab Republic of) 5.625% 2030 | € | 260 | 333 | |||||
Egypt (Arab Republic of) 7.625% 20325 | $ | 1,140 | 1,294 | |||||
Egypt (Arab Republic of) 8.50% 2047 | 1,200 | 1,364 | ||||||
Egypt (Arab Republic of) 8.15% 20595 | 900 | 993 | ||||||
American Funds Insurance Series 75
Table of Contents
New World Fund (continued)
Bonds, notes & other debt instruments (continued)
Principal amount (000) | Value (000) | |||||||
Bonds & notes of governments & government agencies outside the U.S. (continued) | ||||||||
Ethiopia (Federal Democratic Republic of) 6.625% 2024 | $ | 1,230 | $ | 1,255 | ||||
Export-Import Bank of India 3.25% 2030 | 1,180 | 1,265 | ||||||
Gabonese Republic 6.375% 2024 | 2,480 | 2,589 | ||||||
Guatemala (Republic of) 4.375% 2027 | 600 | 668 | ||||||
Honduras (Republic of) 6.25% 2027 | 1,750 | 2,032 | ||||||
Honduras (Republic of) 5.625% 20305 | 200 | 230 | ||||||
Indonesia (Republic of) 6.625% 2037 | 700 | 999 | ||||||
Indonesia (Republic of) 5.25% 2042 | 840 | 1,091 | ||||||
Iraq (Republic of) 6.752% 2023 | 960 | 941 | ||||||
Jordan (Hashemite Kingdom of) 4.95% 20255 | 600 | 639 | ||||||
Jordan (Hashemite Kingdom of) 5.75% 20275 | 1,530 | 1,691 | ||||||
Jordan (Hashemite Kingdom of) 5.75% 2027 | 200 | 221 | ||||||
Kazakhstan (Republic of) 5.125% 20255 | 900 | 1,066 | ||||||
Kazakhstan (Republic of) 6.50% 20455 | 800 | 1,294 | ||||||
Kenya (Republic of) 6.875% 20245 | 900 | 988 | ||||||
Kenya (Republic of) 8.25% 20485 | 2,200 | 2,526 | ||||||
Malaysia (Federation of), Series 0419, 3.828% 2034 | MYR | 430 | 114 | |||||
Malaysia (Federation of), Series 0418, 4.893% 2038 | 1,150 | 338 | ||||||
Pakistan (Islamic Republic of) 8.25% 2024 | $ | 500 | 547 | |||||
Pakistan (Islamic Republic of) 8.25% 20255 | 410 | 453 | ||||||
Pakistan (Islamic Republic of) 6.875% 20275 | 1,250 | 1,309 | ||||||
Pakistan (Islamic Republic of) 7.875% 2036 | 400 | 415 | ||||||
Panama (Republic of) 3.75% 20265 | 1,380 | 1,513 | ||||||
Panama (Republic of) 4.50% 2047 | 1,155 | 1,489 | ||||||
Panama (Republic of) 4.50% 2050 | 400 | 516 | ||||||
Panama (Republic of) 4.30% 2053 | 400 | 510 | ||||||
Paraguay (Republic of) 5.00% 20265 | 500 | 588 | ||||||
Paraguay (Republic of) 5.00% 2026 | 210 | 247 | ||||||
Paraguay (Republic of) 4.70% 20275 | 800 | 938 | ||||||
Paraguay (Republic of) 4.70% 2027 | 500 | 586 | ||||||
Paraguay (Republic of) 4.95% 2031 | 320 | 388 | ||||||
Peru (Republic of) 6.55% 2037 | 1,070 | 1,628 | ||||||
Peru (Republic of) 2.78% 2060 | 840 | 849 | ||||||
PETRONAS Capital Ltd. 3.50% 20305 | 200 | 230 | ||||||
PETRONAS Capital Ltd. 4.55% 20505 | 400 | 536 | ||||||
Philippines (Republic of) 6.375% 2034 | 820 | 1,206 | ||||||
Philippines (Republic of) 2.95% 2045 | 1,220 | 1,291 | ||||||
PT Indonesia Asahan Aluminium Tbk 6.757% 2048 | 200 | 274 | ||||||
Qatar (State of) 4.50% 20285 | 3,000 | 3,640 | ||||||
Qatar (State of) 4.50% 2028 | 1,000 | 1,213 | ||||||
Romania 2.00% 2032 | € | 1,510 | 1,940 | |||||
Romania 5.125% 20485 | $ | 1,700 | 2,180 | |||||
Russian Federation 4.375% 20295 | 1,000 | 1,169 | ||||||
Russian Federation 5.10% 2035 | 1,200 | 1,520 | ||||||
Russian Federation 5.25% 2047 | 1,400 | 1,943 | ||||||
Senegal (Republic of) 4.75% 2028 | € | 1,100 | 1,436 | |||||
Serbia (Republic of) 3.125% 2027 | 1,020 | 1,403 | ||||||
South Africa (Republic of) 5.875% 2030 | $ | 2,110 | 2,396 | |||||
Sri Lanka (Democratic Socialist Republic of) 5.75% 2022 | 250 | 196 | ||||||
Sri Lanka (Democratic Socialist Republic of) 5.875% 2022 | 1,000 | 697 | ||||||
Sri Lanka (Democratic Socialist Republic of) 6.125% 2025 | 410 | 247 | ||||||
Sri Lanka (Democratic Socialist Republic of) 6.85% 2025 | 700 | 426 | ||||||
Sri Lanka (Democratic Socialist Republic of) 6.825% 2026 | 1,610 | 934 | ||||||
Sri Lanka (Democratic Socialist Republic of) 7.55% 2030 | 800 | 462 | ||||||
Sri Lanka (Democratic Socialist Republic of) 7.55% 20305 | 500 | 289 | ||||||
Tunisia (Republic of) 6.75% 2023 | € | 110 | 129 | |||||
Tunisia (Republic of) 5.625% 2024 | 710 | 805 | ||||||
Tunisia (Republic of) 5.75% 2025 | $ | 875 | 801 | |||||
Turkey (Republic of) 6.375% 2025 | 475 | 514 | ||||||
Turkey (Republic of) 11.875% 2030 | 600 | 877 | ||||||
Turkey (Republic of) 4.875% 2043 | 1,295 | 1,137 | ||||||
76 American Funds Insurance Series
Table of Contents
New World Fund (continued)
Bonds, notes & other debt instruments (continued)
Principal amount (000) | Value (000) | |||||||
Bonds & notes of governments & government agencies outside the U.S. (continued) | ||||||||
Turkey (Republic of) 5.75% 2047 | $ | 2,205 | $ | 2,106 | ||||
Ukraine 7.75% 2027 | 2,328 | 2,648 | ||||||
Ukraine 9.75% 2028 | 700 | 863 | ||||||
Ukraine 7.375% 2032 | 2,180 | 2,402 | ||||||
United Mexican States 3.90% 2025 | 320 | 360 | ||||||
United Mexican States 4.50% 2029 | 1,070 | 1,258 | ||||||
United Mexican States 4.75% 2032 | 870 | 1,049 | ||||||
United Mexican States 4.75% 2044 | 1,090 | 1,300 | ||||||
Venezuela (Bolivarian Republic of) 7.00% 20188 | 64 | 6 | ||||||
Venezuela (Bolivarian Republic of) 7.75% 20198 | 1,149 | 111 | ||||||
Venezuela (Bolivarian Republic of) 6.00% 20208 | 950 | 92 | ||||||
Venezuela (Bolivarian Republic of) 12.75% 20228 | 85 | 8 | ||||||
Venezuela (Bolivarian Republic of) 9.00% 20238 | 1,383 | 134 | ||||||
Venezuela (Bolivarian Republic of) 8.25% 20248 | 299 | 29 | ||||||
Venezuela (Bolivarian Republic of) 7.65% 20258 | 129 | 13 | ||||||
Venezuela (Bolivarian Republic of) 11.75% 20268 | 64 | 6 | ||||||
Venezuela (Bolivarian Republic of) 9.25% 20278 | 170 | 17 | ||||||
Venezuela (Bolivarian Republic of) 9.25% 20288 | 319 | 31 | ||||||
Venezuela (Bolivarian Republic of) 11.95% 20318 | 106 | 10 | ||||||
Venezuela (Bolivarian Republic of) 7.00% 20388 | 107 | 10 | ||||||
|
| |||||||
| 104,902 | ||||||||
|
| |||||||
Corporate bonds, notes & loans 0.36% | ||||||||
Energy 0.10% | ||||||||
Oleoducto Central SA 4.00% 20275 | 255 | 277 | ||||||
Petrobras Global Finance Co. 5.60% 2031 | 575 | 662 | ||||||
Petrobras Global Finance Co. 6.75% 2050 | 110 | 137 | ||||||
Petrobras Global Finance Co. 6.85% 2115 | 314 | 392 | ||||||
Petróleos Mexicanos 6.875% 20255 | 624 | 685 | ||||||
Petróleos Mexicanos 6.875% 2026 | 755 | 826 | ||||||
Petróleos Mexicanos 6.49% 2027 | 910 | 962 | ||||||
PTT Exploration and Production PCL 2.587% 20275 | 320 | 335 | ||||||
|
| |||||||
| 4,276 | ||||||||
|
| |||||||
Financials 0.08% | ||||||||
Bangkok Bank PCL 3.733% 2034 (UST Yield Curve Rate T Note Constant Maturity 5-year + 1.90% on 9/25/2029)7 | 1,140 | 1,189 | ||||||
HSBK (Europe) BV 7.25% 20215 | 665 | 674 | ||||||
Power Financial Corp Ltd. 5.25% 2028 | 425 | 491 | ||||||
Power Financial Corp Ltd. 6.15% 2028 | 432 | 527 | ||||||
Power Financial Corp Ltd. 4.50% 2029 | 273 | 301 | ||||||
|
| |||||||
| 3,182 | ||||||||
|
| |||||||
Utilities 0.06% | ||||||||
AES Panama Generation Holdings SRL 4.375% 20305 | 280 | 303 | ||||||
Empresas Publicas de Medellin ESP 4.25% 20295 | 665 | 716 | ||||||
Empresas Publicas de Medellin ESP 4.375% 20315 | 360 | 387 | ||||||
State Grid Overseas Investment Ltd. 3.50% 20275 | 900 | 1,002 | ||||||
State Grid Overseas Investment Ltd. 4.25% 2028 | 200 | 234 | ||||||
|
| |||||||
| 2,642 | ||||||||
|
| |||||||
Industrials 0.05% | ||||||||
DP World Crescent 4.848% 20285 | 835 | 973 | ||||||
Empresa de Transporte de Pasajeros Metro SA 4.70% 20505 | 270 | 340 | ||||||
Mexico City Airport Trust 4.25% 2026 | 675 | 716 | ||||||
Mexico City Airport Trust 3.875% 2028 | 200 | 207 | ||||||
|
| |||||||
| 2,236 | ||||||||
|
| |||||||
American Funds Insurance Series 77
Table of Contents
New World Fund (continued)
Bonds, notes & other debt instruments (continued)
Principal amount (000) | Value (000) | |||||||
Corporate bonds, notes & loans (continued) | ||||||||
Communication services 0.04% | ||||||||
Axiata SPV5 Labuan Ltd. 3.064% 2050 | $ | 357 | $ | 359 | ||||
PLDT Inc. 2.50% 2031 | 210 | 220 | ||||||
Tencent Holdings Ltd. 3.975% 2029 | 400 | 456 | ||||||
Tencent Holdings Ltd. 3.24% 20505 | 580 | 601 | ||||||
|
| |||||||
| 1,636 | ||||||||
|
| |||||||
Materials 0.02% | ||||||||
Braskem Idesa SAPI 7.45% 2029 | 775 | 728 | ||||||
Braskem Idesa SAPI 7.45% 20295 | 300 | 282 | ||||||
|
| |||||||
| 1,010 | ||||||||
|
| |||||||
Consumer discretionary 0.01% | ||||||||
Sands China Ltd. 4.375% 20305 | 220 | 246 | ||||||
|
| |||||||
Total corporate bonds, notes & loans | 15,228 | |||||||
|
| |||||||
Total bonds, notes & other debt instruments (cost: $110,988,000) | 120,130 | |||||||
|
| |||||||
| Short-term securities 5.62% | Shares | |||||||
Money market investments 5.62% | ||||||||
Capital Group Central Cash Fund 0.12%9,10 | 2,244,744 | 224,497 | ||||||
Goldman Sachs Financial Square Government Fund, Institutional Shares 0.02%9,11 | 14,020,660 | 14,020 | ||||||
|
| |||||||
Total short-term securities (cost: $238,510,000) | 238,517 | |||||||
|
| |||||||
Total investment securities 99.52% (cost: $2,579,578,000) | 4,222,773 | |||||||
Other assets less liabilities 0.48% | 20,380 | |||||||
|
| |||||||
Net assets 100.00% | $ | 4,243,153 | ||||||
|
| |||||||
Futures contracts
Contracts | Type | Number of contracts | Expiration | Notional amount12 (000) | Value at 12/31/202013 (000) | Unrealized appreciation (depreciation) at 12/31/2020 (000) | ||||||||||||||
10 Year Ultra U.S. Treasury Note Futures | Short | 8 | March 2021 | $ | (800 | ) | $ | (1,251 | ) | $ | 3 | |||||||||
30 Year Ultra U.S. Treasury Bond Futures | Long | 10 | March 2021 | 1,000 | 2,136 | (13 | ) | |||||||||||||
|
| |||||||||||||||||||
| $ | (10 | ) | ||||||||||||||||||
|
| |||||||||||||||||||
Forward currency contracts
Contract amount | Unrealized depreciation | |||||||||||
Purchases (000) | Sales (000) | Counterparty | Settlement date | at 12/31/2020 (000) | ||||||||
USD 3,404 | EUR 2,830 | Bank of New York Mellon | 1/8/2021 | $ | (54 | ) | ||||||
78 American Funds Insurance Series
Table of Contents
New World Fund (continued)
Investments in affiliates10
| Value of affiliate at 1/1/2020 (000) | Additions (000) | Reductions (000) | Net realized gain (000) | Net unrealized depreciation (000) | Value of affiliate at 12/31/2020 (000) | Dividend income (000) | ||||||||||||||||||||||
Short-term securities 5.29% | ||||||||||||||||||||||||||||
Money market investments 5.29% | ||||||||||||||||||||||||||||
Capital Group Central Cash Fund 0.12%9 | $ | 238,673 | $ | 930,010 | $ | 944,104 | $ | 40 | $ | (122 | ) | $ | 224,497 | $ | 1,220 | |||||||||||||
| 1 | Valued under fair value procedures adopted by authority of the board of trustees. The total value of all such securities was $2,245,296,000, which represented 52.92% of the net assets of the fund. This amount includes $2,245,295,000 related to certain securities trading outside the U.S. whose values were adjusted as a result of significant market movements following the close of local trading. |
| 2 | Security did not produce income during the last 12 months. |
| 3 | All or a portion of this security was on loan. The total value of all such securities was $18,411,000, which represented .43% of the net assets of the fund. Refer to Note 5 for more information on securities lending. |
| 4 | Value determined using significant unobservable inputs. |
| 5 | Acquired in a transaction exempt from registration under Rule 144A of the Securities Act of 1933. May be resold in the U.S. in transactions exempt from registration, normally to qualified institutional buyers. The total value of all such securities was $56,174,000, which represented 1.32% of the net assets of the fund. |
| 6 | Amount less than one thousand. |
| 7 | Step bond; coupon rate may change at a later date. |
| 8 | Scheduled interest and/or principal payment was not received. |
| 9 | Rate represents the seven-day yield at 12/31/2020. |
| 10 | Part of the same group of investment companies as the fund as defined under the Investment Company Act of 1940. |
| 11 | Security purchased with cash collateral from securities on loan. Refer to Note 5 for more information on securities lending. |
| 12 | Notional amount is calculated based on the number of contracts and notional contract size. |
| 13 | Value is calculated based on the notional amount and current market price. |
Key to abbreviations and symbols
ADR = American Depositary Receipts
CAD = Canadian dollars
CDI = CREST Depository Interest
DOP = Dominican pesos
EUR/€ = Euros
GBP = British pounds
GDR = Global Depositary Receipts
MYR = Malaysian ringgits
USD/$ = U.S. dollars
See notes to financial statements.
American Funds Insurance Series 79
Table of Contents
Blue Chip Income and Growth Fund
Investment portfolio December 31, 2020
Common stocks 97.04%
| Shares | Value (000) | |||||||
Health care 17.33% | ||||||||
Abbott Laboratories | 3,362,500 | $ | 368,160 | |||||
Amgen Inc. | 1,258,510 | 289,357 | ||||||
UnitedHealth Group Inc. | 593,400 | 208,093 | ||||||
AbbVie Inc. | 1,890,460 | 202,563 | ||||||
Gilead Sciences, Inc. | 3,005,712 | 175,113 | ||||||
Teva Pharmaceutical Industries Ltd. (ADR)1 | 10,333,800 | 99,721 | ||||||
Medtronic PLC | 700,000 | 81,998 | ||||||
Stryker Corp. | 296,800 | 72,728 | ||||||
Humana Inc. | 124,700 | 51,161 | ||||||
Merck & Co., Inc. | 500,000 | 40,900 | ||||||
Zimmer Biomet Holdings, Inc. | 225,000 | 34,670 | ||||||
PerkinElmer, Inc. | 210,400 | 30,192 | ||||||
GlaxoSmithKline PLC (ADR) | 148,000 | 5,446 | ||||||
|
| |||||||
| 1,660,102 | ||||||||
|
| |||||||
Information technology 17.11% | ||||||||
Microsoft Corp. | 2,598,300 | 577,914 | ||||||
Broadcom Inc. | 1,007,100 | 440,959 | ||||||
Mastercard Inc., Class A | 613,600 | 219,018 | ||||||
Apple Inc. | 1,600,000 | 212,304 | ||||||
SS&C Technologies Holdings, Inc. | 1,153,800 | 83,939 | ||||||
Intel Corp. | 1,100,000 | 54,802 | ||||||
Cognizant Technology Solutions Corp., Class A | 486,000 | 39,828 | ||||||
QUALCOMM Inc. | 68,000 | 10,359 | ||||||
|
| |||||||
| 1,639,123 | ||||||||
|
| |||||||
Industrials 13.56% | ||||||||
CSX Corp. | 3,255,142 | 295,404 | ||||||
Raytheon Technologies Corp. | 3,935,100 | 281,399 | ||||||
General Dynamics Corp. | 908,000 | 135,129 | ||||||
Union Pacific Corp. | 565,600 | 117,769 | ||||||
General Electric Co. | 9,974,300 | 107,722 | ||||||
Carrier Global Corp. | 2,549,000 | 96,148 | ||||||
Illinois Tool Works Inc. | 450,000 | 91,746 | ||||||
Airbus Group SE (ADR)1 | 2,639,000 | 72,097 | ||||||
RELX PLC (ADR) | 1,225,000 | 30,209 | ||||||
Stanley Black & Decker, Inc. | 136,000 | 24,284 | ||||||
Otis Worldwide Corp. | 277,500 | 18,745 | ||||||
L3Harris Technologies, Inc. | 85,000 | 16,067 | ||||||
ManpowerGroup Inc. | 131,500 | 11,859 | ||||||
Rolls-Royce Holdings PLC (ADR)2 | 356,800 | 564 | ||||||
|
| |||||||
| 1,299,142 | ||||||||
|
| |||||||
Communication services 9.47% | ||||||||
Comcast Corp., Class A | 5,789,400 | 303,364 | ||||||
Facebook, Inc., Class A1 | 967,600 | 264,310 | ||||||
Alphabet Inc., Class A1 | 80,975 | 141,920 | ||||||
Alphabet Inc., Class C1 | 3,000 | 5,256 | ||||||
Netflix, Inc.1 | 201,800 | 109,119 | ||||||
Omnicom Group Inc. | 1,000,000 | 62,370 | ||||||
Activision Blizzard, Inc. | 113,000 | 10,492 | ||||||
Electronic Arts Inc. | 73,000 | 10,483 | ||||||
|
| |||||||
| 907,314 | ||||||||
|
| |||||||
Energy 9.05% | ||||||||
EOG Resources, Inc. | 4,588,100 | 228,809 | ||||||
Baker Hughes Co., Class A | 10,437,000 | 217,611 | ||||||
Chevron Corp. | 1,099,000 | 92,811 | ||||||
Diamondback Energy, Inc. | 1,320,033 | 63,890 | ||||||
Royal Dutch Shell PLC, Class B (ADR) | 1,839,000 | 61,809 | ||||||
Pioneer Natural Resources Company | 486,800 | 55,442 | ||||||
Concho Resources Inc. | 616,100 | 35,949 | ||||||
80 American Funds Insurance Series
Table of Contents
Blue Chip Income and Growth Fund (continued)
Common stocks (continued)
| Shares | Value (000) | |||||||
Energy (continued) | ||||||||
Williams Companies, Inc. | 1,661,000 | $ | 33,303 | |||||
Canadian Natural Resources, Ltd. | 1,230,250 | 29,587 | ||||||
TC Energy Corp. | 600,000 | 24,432 | ||||||
Schlumberger Ltd. | 1,045,400 | 22,821 | ||||||
|
| |||||||
| 866,464 | ||||||||
|
| |||||||
Consumer staples 8.16% | ||||||||
Philip Morris International Inc. | 3,090,600 | 255,871 | ||||||
Altria Group, Inc. | 2,448,000 | 100,368 | ||||||
British American Tobacco PLC (ADR) | 2,630,706 | 98,625 | ||||||
Constellation Brands, Inc., Class A | 408,300 | 89,438 | ||||||
Coca-Cola Company | 1,250,000 | 68,550 | ||||||
PepsiCo, Inc. | 400,000 | 59,320 | ||||||
Keurig Dr Pepper Inc. | 1,746,500 | 55,888 | ||||||
Lamb Weston Holdings, Inc. | 400,000 | 31,496 | ||||||
Mondelez International, Inc. | 384,000 | 22,452 | ||||||
|
| |||||||
| 782,008 | ||||||||
|
| |||||||
Consumer discretionary 7.63% | ||||||||
General Motors Company | 4,485,500 | 186,776 | ||||||
Royal Caribbean Cruises Ltd. | 1,525,200 | 113,917 | ||||||
McDonald’s Corp. | 500,000 | 107,290 | ||||||
Starbucks Corp. | 608,000 | 65,044 | ||||||
Lowe’s Companies, Inc. | 392,000 | 62,920 | ||||||
Sony Corp. (ADR) | 561,000 | 56,717 | ||||||
Home Depot, Inc. | 150,000 | 39,843 | ||||||
NIKE, Inc., Class B | 225,000 | 31,831 | ||||||
Hasbro, Inc. | 315,000 | 29,465 | ||||||
Williams-Sonoma, Inc. | 273,700 | 27,874 | ||||||
Darden Restaurants, Inc. | 76,000 | 9,053 | ||||||
|
| |||||||
| 730,730 | ||||||||
|
| |||||||
Financials 6.98% | ||||||||
Citigroup Inc. | 2,947,300 | 181,730 | ||||||
JPMorgan Chase & Co. | 1,349,300 | 171,456 | ||||||
American International Group, Inc. | 3,230,000 | 122,288 | ||||||
Discover Financial Services | 920,000 | 83,288 | ||||||
Franklin Resources, Inc. | 1,550,000 | 38,734 | ||||||
Nasdaq, Inc. | 260,000 | 34,512 | ||||||
PNC Financial Services Group, Inc. | 125,300 | 18,670 | ||||||
CME Group Inc., Class A | 96,500 | 17,568 | ||||||
|
| |||||||
| 668,246 | ||||||||
|
| |||||||
Utilities 3.42% | ||||||||
Public Service Enterprise Group Inc. | 1,520,000 | 88,616 | ||||||
Entergy Corp. | 812,300 | 81,100 | ||||||
DTE Energy Company | 421,000 | 51,114 | ||||||
Sempra Energy | 331,000 | 42,173 | ||||||
American Electric Power Company, Inc. | 450,000 | 37,471 | ||||||
NextEra Energy, Inc. | 200,000 | 15,430 | ||||||
E.ON SE (ADR) | 1,090,000 | 12,055 | ||||||
|
| |||||||
| 327,959 | ||||||||
|
| |||||||
Materials 2.58% | ||||||||
Linde PLC | 782,200 | 206,118 | ||||||
Freeport-McMoRan Inc. | 1,565,000 | 40,721 | ||||||
|
| |||||||
| 246,839 | ||||||||
|
| |||||||
American Funds Insurance Series 81
Table of Contents
Blue Chip Income and Growth Fund (continued)
Common stocks (continued)
| Shares | Value (000) | |||||||
Real estate 1.75% | ||||||||
Crown Castle International Corp. REIT | 525,000 | $ | 83,575 | |||||
Americold Realty Trust REIT | 690,000 | 25,758 | ||||||
Digital Realty Trust, Inc. REIT | 177,500 | 24,763 | ||||||
Alexandria Real Estate Equities, Inc. REIT | 98,500 | 17,555 | ||||||
Equinix, Inc. REIT | 22,400 | 15,997 | ||||||
|
| |||||||
| 167,648 | ||||||||
|
| |||||||
Total common stocks (cost: $6,473,788,000) | 9,295,575 | |||||||
|
| |||||||
Rights & warrants 0.00% | ||||||||
Financials 0.00% | ||||||||
American International Group, Inc., warrants, expire 20211 | 1,151,554 | 138 | ||||||
|
| |||||||
Total rights & warrants (cost: $17,794,000) | 138 | |||||||
|
| |||||||
Convertible stocks 0.90% | ||||||||
Consumer discretionary 0.70% | ||||||||
Aptiv PLC, Series A, convertible preferred shares, 5.50% 2023 | 431,213 | 66,536 | ||||||
|
| |||||||
Health care 0.20% | ||||||||
Danaher Corp., Series B, cumulative convertible preferred shares, 5.00% 20232 | 8,921 | 11,607 | ||||||
Danaher Corp., Series A, cumulative convertible preferred shares, 4.75% 2022 | 4,900 | 7,437 | ||||||
|
| |||||||
| 19,044 | ||||||||
|
| |||||||
Total convertible stocks (cost: $57,918,000) | 85,580 | |||||||
|
| |||||||
| Convertible bonds & notes 0.14% | Principal amount (000) | |||||||
Consumer discretionary 0.14% | ||||||||
Royal Caribbean Cruises Ltd., convertible notes, 2.875% 20233 | $ | 11,376 | 13,651 | |||||
|
| |||||||
Total convertible bonds & notes (cost: $11,376,000) | 13,651 | |||||||
|
| |||||||
| Short-term securities 1.90% | Shares | |||||||
Money market investments 1.90% | ||||||||
Capital Group Central Cash Fund 0.12%4,5 | 1,785,145 | 178,532 | ||||||
Goldman Sachs Financial Square Government Fund, Institutional Shares 0.02%4,6 | 3,229,762 | 3,230 | ||||||
|
| |||||||
Total short-term securities (cost: $181,729,000) | 181,762 | |||||||
|
| |||||||
Total investment securities 99.98% (cost: $6,742,605,000) | 9,576,706 | |||||||
Other assets less liabilities 0.02% | 2,360 | |||||||
|
| |||||||
Net assets 100.00% | $ | 9,579,066 | ||||||
|
| |||||||
Investments in affiliates5
| Value of affiliate at 1/1/2020 (000) | Additions (000) | Reductions (000) | Net realized gain (000) | Net unrealized appreciation (000) | Value of affiliate at 12/31/2020 (000) | Dividend income (000) | ||||||||||||||||||||||
Short-term securities 1.86% | ||||||||||||||||||||||||||||
Money market investments 1.86% | ||||||||||||||||||||||||||||
Capital Group Central Cash Fund 0.12%4 | $ | 312,462 | $ | 1,545,068 | $ | 1,679,415 | $ | 414 | $ | 3 | $ | 178,532 | $ | 2,015 | ||||||||||||||
82 American Funds Insurance Series
Table of Contents
Blue Chip Income and Growth Fund (continued)
| 1 | Security did not produce income during the last 12 months. |
| 2 | All or a portion of this security was on loan. The total value of all such securities was $3,447,000, which represented .04% of the net assets of the fund. Refer to Note 5 for more information on securities lending. |
| 3 | Acquired in a transaction exempt from registration under Rule 144A of the Securities Act of 1933. May be resold in the U.S. in transactions exempt from registration, normally to qualified institutional buyers. The total value of all such securities was $13,651,000, which represented .14% of the net assets of the fund. |
| 4 | Rate represents the seven-day yield at 12/31/2020. |
| 5 | Part of the same group of investment companies as the fund as defined under the Investment Company Act of 1940. |
| 6 | Security purchased with cash collateral from securities on loan. Refer to Note 5 for more information on securities lending. |
Key to abbreviation
ADR = American Depositary Receipts
See notes to financial statements.
American Funds Insurance Series 83
Table of Contents
Investment portfolio December 31, 2020
Common stocks 94.88%
| Shares | Value (000) | |||||||
Information technology 18.51% | ||||||||
Taiwan Semiconductor Manufacturing Company, Ltd.1 | 4,709,800 | $ | 88,457 | |||||
Broadcom Inc. | 155,700 | 68,173 | ||||||
Apple Inc. | 423,960 | 56,255 | ||||||
Microsoft Corp. | 213,200 | 47,420 | ||||||
ASML Holding NV1 | 70,000 | 33,828 | ||||||
Tokyo Electron Ltd.1 | 49,000 | 18,276 | ||||||
Afterpay Ltd.1,2 | 184,495 | 16,914 | ||||||
GoDaddy Inc., Class A2 | 142,000 | 11,779 | ||||||
Fiserv, Inc.2 | 88,000 | 10,020 | ||||||
Advanced Micro Devices, Inc.2 | 98,400 | 9,024 | ||||||
NetEase, Inc.1 | 420,800 | 8,052 | ||||||
PagSeguro Digital Ltd., Class A2 | 130,000 | 7,395 | ||||||
Texas Instruments Inc. | 40,000 | 6,565 | ||||||
Murata Manufacturing Co., Ltd.1 | 67,000 | 6,034 | ||||||
MediaTek Inc.1 | 194,000 | 5,181 | ||||||
SAP SE1 | 34,500 | 4,534 | ||||||
Atlassian Corp. PLC, Class A2 | 19,200 | 4,490 | ||||||
|
| |||||||
| 402,397 | ||||||||
|
| |||||||
Financials 15.82% | ||||||||
Société Générale1,2 | 2,306,018 | 48,040 | ||||||
Fannie Mae2 | 16,006,000 | 38,254 | ||||||
Sberbank of Russia PJSC (ADR)1 | 2,177,000 | 31,383 | ||||||
HDFC Bank Ltd.1,2 | 1,166,577 | 22,979 | ||||||
Discover Financial Services | 249,000 | 22,542 | ||||||
AIA Group Ltd.1 | 1,590,000 | 19,585 | ||||||
Toronto-Dominion Bank (CAD denominated) | 320,492 | 18,108 | ||||||
B3 SA - Brasil, Bolsa, Balcao | 1,500,000 | 17,899 | ||||||
UniCredit SpA1,2 | 1,686,696 | 15,608 | ||||||
DBS Group Holdings Ltd.1 | 805,000 | 15,226 | ||||||
Macquarie Group Ltd.1 | 142,118 | 15,186 | ||||||
Ping An Insurance (Group) Company of China, Ltd., Class H1 | 1,195,000 | 14,678 | ||||||
CME Group Inc., Class A | 70,000 | 12,744 | ||||||
JPMorgan Chase & Co. | 92,000 | 11,690 | ||||||
The Blackstone Group Inc., Class A | 136,700 | 8,860 | ||||||
HDFC Life Insurance Company Ltd.1,2 | 773,990 | 7,180 | ||||||
Barclays PLC1,2 | 3,365,000 | 6,754 | ||||||
Zurich Insurance Group AG1 | 14,000 | 5,934 | ||||||
BB Seguridade Participações SA | 997,600 | 5,691 | ||||||
Truist Financial Corp. | 116,550 | 5,586 | ||||||
|
| |||||||
| 343,927 | ||||||||
|
| |||||||
Industrials 11.32% | ||||||||
Airbus SE, non-registered shares1,2 | 607,200 | 66,700 | ||||||
CCR SA, ordinary nominative | 18,355,800 | 47,602 | ||||||
Lockheed Martin Corp. | 66,000 | 23,429 | ||||||
Safran SA1,2 | 123,500 | 17,515 | ||||||
Honeywell International Inc. | 71,700 | 15,251 | ||||||
Illinois Tool Works Inc. | 54,000 | 11,009 | ||||||
Rheinmetall AG1 | 98,800 | 10,441 | ||||||
VAT Group AG1 | 35,200 | 8,773 | ||||||
Boeing Company | 35,500 | 7,599 | ||||||
CSX Corp. | 73,000 | 6,625 | ||||||
Experian PLC1 | 171,000 | 6,516 | ||||||
Watsco, Inc. | 23,500 | 5,324 | ||||||
Union Pacific Corp. | 24,400 | 5,081 | ||||||
PACCAR Inc. | 58,600 | 5,056 | ||||||
Aeroflot - Russian Airlines PJSC1,2 | 3,920,000 | 3,773 | ||||||
Seven Group Holdings Ltd.1 | 180,000 | 3,244 | ||||||
International Consolidated Airlines Group SA (CDI)1,2 | 1,035,000 | 2,265 | ||||||
|
| |||||||
| 246,203 | ||||||||
|
| |||||||
84 American Funds Insurance Series
Table of Contents
Global Growth and Income Fund (continued)
Common stocks (continued)
| Shares | Value (000) | |||||||
Health care 9.11% | ||||||||
Novartis AG1 | 337,000 | $ | 31,830 | |||||
UnitedHealth Group Inc. | 86,300 | 30,264 | ||||||
Sarepta Therapeutics, Inc.2 | 94,500 | 16,111 | ||||||
Abbott Laboratories | 125,000 | 13,686 | ||||||
Hikma Pharmaceuticals PLC1 | 340,000 | 11,712 | ||||||
Allogene Therapeutics, Inc.2 | 461,000 | 11,636 | ||||||
Centene Corp.2 | 186,000 | 11,166 | ||||||
HOYA Corp.1 | 76,700 | 10,602 | ||||||
DexCom, Inc.2 | 23,700 | 8,762 | ||||||
AstraZeneca PLC1 | 83,000 | 8,292 | ||||||
CSL Ltd.1 | 35,200 | 7,691 | ||||||
Eli Lilly and Company | 45,000 | 7,598 | ||||||
Gilead Sciences, Inc. | 130,000 | 7,574 | ||||||
Insulet Corp.2 | 28,300 | 7,234 | ||||||
CVS Health Corp. | 95,000 | 6,489 | ||||||
Pfizer Inc. | 104,000 | 3,828 | ||||||
Regeneron Pharmaceuticals, Inc.2 | 7,650 | 3,696 | ||||||
|
| |||||||
| 198,171 | ||||||||
|
| |||||||
Consumer discretionary 9.09% | ||||||||
LVMH Moët Hennessy-Louis Vuitton SE1 | 74,096 | 46,298 | ||||||
Flutter Entertainment PLC (EUR denominated)1 | 126,077 | 25,825 | ||||||
Home Depot, Inc. | 81,000 | 21,515 | ||||||
General Motors Company | 400,000 | 16,656 | ||||||
Alibaba Group Holding Ltd.1,2 | 522,600 | 15,269 | ||||||
Li Ning Co. Ltd.1 | 1,685,000 | 11,608 | ||||||
Amazon.com, Inc.2 | 3,005 | 9,787 | ||||||
Aston Martin Lagonda Global Holdings PLC1,2 | 267,252 | 7,360 | ||||||
NIKE, Inc., Class B | 51,800 | 7,328 | ||||||
Tesla, Inc.2 | 9,000 | 6,351 | ||||||
Restaurant Brands International Inc. (CAD denominated) | 103,600 | 6,335 | ||||||
Gentex Corp. | 166,000 | 5,632 | ||||||
Naspers Ltd., Class N1 | 27,000 | 5,526 | ||||||
Melco Resorts & Entertainment Ltd. (ADR) | 297,000 | 5,509 | ||||||
lululemon athletica inc.2 | 9,800 | 3,411 | ||||||
Strategic Education, Inc. | 34,000 | 3,241 | ||||||
|
| |||||||
| 197,651 | ||||||||
|
| |||||||
Communication services 7.63% | ||||||||
Alphabet Inc., Class A2 | 21,800 | 38,208 | ||||||
Alphabet Inc., Class C2 | 7,000 | 12,263 | ||||||
Comcast Corp., Class A | 546,000 | 28,610 | ||||||
Facebook, Inc., Class A2 | 65,000 | 17,755 | ||||||
Warner Music Group Corp., Class A | 419,376 | 15,932 | ||||||
Walt Disney Company2 | 67,000 | 12,139 | ||||||
Activision Blizzard, Inc. | 101,000 | 9,378 | ||||||
SoftBank Corp.1 | 663,800 | 8,322 | ||||||
New York Times Co., Class A | 160,000 | 8,283 | ||||||
Tencent Holdings Ltd.1 | 100,000 | 7,307 | ||||||
Koninklijke KPN NV1 | 1,528,000 | 4,633 | ||||||
Netflix, Inc.2 | 5,500 | 2,974 | ||||||
|
| |||||||
| 165,804 | ||||||||
|
| |||||||
Utilities 6.03% | ||||||||
Ørsted AS1 | 189,456 | 38,748 | ||||||
Enel SpA1 | 3,539,000 | 35,738 | ||||||
Dominion Energy, Inc. | 150,000 | 11,280 | ||||||
E.ON SE1 | 1,015,000 | 11,241 | ||||||
China Resources Gas Group Ltd.1 | 1,778,000 | 9,457 | ||||||
National Grid PLC1 | 750,000 | 8,933 | ||||||
American Funds Insurance Series 85
Table of Contents
Global Growth and Income Fund (continued)
Common stocks (continued)
| Shares | Value (000) | |||||||
Utilities (continued) | ||||||||
Brookfield Infrastructure Partners LP | 170,000 | $ | 8,411 | |||||
American Electric Power Company, Inc. | 72,700 | 6,054 | ||||||
Brookfield Infrastructure Corp., Class A, subordinate voting shares | 18,888 | 1,368 | ||||||
|
| |||||||
| 131,230 | ||||||||
|
| |||||||
Materials 5.75% | ||||||||
Vale SA, ordinary nominative | 1,409,600 | 23,732 | ||||||
Vale SA, ordinary nominative (ADR) | 385,600 | 6,463 | ||||||
BHP Group PLC1 | 870,000 | 22,928 | ||||||
Koninklijke DSM NV1 | 96,800 | 16,675 | ||||||
Fortescue Metals Group Ltd.1 | 915,000 | 16,544 | ||||||
Evonik Industries AG1 | 375,000 | 12,217 | ||||||
Shin-Etsu Chemical Co., Ltd.1 | 63,000 | 11,029 | ||||||
Eastman Chemical Company | 68,000 | 6,819 | ||||||
Air Products and Chemicals, Inc. | 18,700 | 5,109 | ||||||
Lynas Rare Earths Ltd.1,2 | 1,180,000 | 3,624 | ||||||
|
| |||||||
| 125,140 | ||||||||
|
| |||||||
Energy 4.63% | ||||||||
Reliance Industries Ltd.1 | 1,606,099 | 43,752 | ||||||
Reliance Industries Ltd., interim shares1 | 107,073 | 1,642 | ||||||
Canadian Natural Resources, Ltd. (CAD denominated) | 904,000 | 21,725 | ||||||
EOG Resources, Inc. | 350,000 | 17,454 | ||||||
Gazprom PJSC (ADR)1 | 2,141,000 | 11,902 | ||||||
Total SE1,3 | 95,600 | 4,124 | ||||||
|
| |||||||
| 100,599 | ||||||||
|
| |||||||
Consumer staples 4.47% | ||||||||
Nestlé SA1 | 298,275 | 35,116 | ||||||
Keurig Dr Pepper Inc. | 405,000 | 12,960 | ||||||
ITC Ltd.1 | 3,410,972 | 9,769 | ||||||
British American Tobacco PLC1 | 252,000 | 9,373 | ||||||
Pernod Ricard SA1 | 35,000 | 6,709 | ||||||
Philip Morris International Inc. | 80,000 | 6,623 | ||||||
Altria Group, Inc. | 145,000 | 5,945 | ||||||
Mondelez International, Inc. | 72,000 | 4,210 | ||||||
Reckitt Benckiser Group PLC1 | 42,000 | 3,756 | ||||||
Beyond Meat, Inc.2,3 | 21,500 | 2,688 | ||||||
|
| |||||||
| 97,149 | ||||||||
|
| |||||||
Real estate 2.52% | ||||||||
Mindspace Business Parks REIT1,2 | 2,124,800 | 9,308 | ||||||
Mindspace Business Parks REIT1,2,4 | 1,309,000 | 5,619 | ||||||
Alexandria Real Estate Equities, Inc. REIT | 75,000 | 13,367 | ||||||
Prologis, Inc. REIT | 90,000 | 8,969 | ||||||
Iron Mountain Inc. REIT | 219,200 | 6,462 | ||||||
Longfor Group Holdings Ltd.1 | 1,025,000 | 6,020 | ||||||
CIFI Holdings (Group) Co. Ltd.1 | 5,910,000 | 5,011 | ||||||
|
| |||||||
| 54,756 | ||||||||
|
| |||||||
Total common stocks (cost: $1,313,317,000) | 2,063,027 | |||||||
|
| |||||||
Bonds, notes & other debt instruments 1.58% | ||||||||
Principal amount | ||||||||
Corporate bonds, notes & loans 1.58% | ||||||||
Communication services 1.58% | ||||||||
Sprint Corp. 7.25% 2021 | $ | 33,000 | 34,378 | |||||
|
| |||||||
Total bonds, notes & other debt instruments (cost: $32,569,000) | 34,378 | |||||||
|
| |||||||
86 American Funds Insurance Series
Table of Contents
Global Growth and Income Fund (continued)
Short-term securities 3.35%
| Shares | Value (000) | |||||||
Money market investments 3.35% | ||||||||
Capital Group Central Cash Fund 0.12%5,6 | 664,822 | $ | 66,489 | |||||
Goldman Sachs Financial Square Government Fund, Institutional Shares 0.02%5,7 | 6,440,115 | 6,440 | ||||||
|
| |||||||
Total short-term securities (cost: $72,921,000) | 72,929 | |||||||
|
| |||||||
Total investment securities 99.81% (cost: $1,418,807,000) | 2,170,334 | |||||||
Other assets less liabilities 0.19% | 4,116 | |||||||
|
| |||||||
Net assets 100.00% | $ | 2,174,450 | ||||||
|
| |||||||
Investments in affiliates6
| Value of affiliate at 1/1/2020 (000) | Additions (000) | Reductions (000) | Net realized gain (000) | Net unrealized depreciation (000) | Value of affiliate at 12/31/2020 (000) | Dividend income (000) | ||||||||||||||||||||||
Short-term securities 3.06% | ||||||||||||||||||||||||||||
Money market investments 3.06% | ||||||||||||||||||||||||||||
Capital Group Central Cash Fund 0.12%5 | $ | 28,561 | $ | 583,471 | $ | 545,530 | $ | 51 | $ | (64 | ) | $ | 66,489 | $ | 578 | |||||||||||||
| 1 | Valued under fair value procedures adopted by authority of the board of trustees. The total value of all such securities was $1,044,566,000, which represented 48.04% of the net assets of the fund. This entire amount relates to certain securities trading outside the U.S. whose values were adjusted as a result of significant market movements following the close of local trading. |
| 2 | Security did not produce income during the last 12 months. |
| 3 | All or a portion of this security was on loan. The total value of all such securities was $6,890,000, which represented .32% of the net assets of the fund. Refer to Note 5 for more information on securities lending. |
| 4 | Acquired in a transaction exempt from registration under Rule 144A of the Securities Act of 1933. May be resold in the U.S. in transactions exempt from registration, normally to qualified institutional buyers. The total value of all such securities was $5,619,000, which represented .26% of the net assets of the fund. |
| 5 | Rate represents the seven-day yield at 12/31/2020. |
| 6 | Part of the same group of investment companies as the fund as defined under the Investment Company Act of 1940. |
| 7 | Security purchased with cash collateral from securities on loan. Refer to Note 5 for more information on securities lending. |
Key to abbreviations
ADR = American Depositary Receipts
CAD = Canadian dollars
CDI = CREST Depository Interest
EUR = Euros
See notes to financial statements.
American Funds Insurance Series 87
Table of Contents
Investment portfolio December 31, 2020
Common stocks 96.33%
| Shares | Value (000) | |||||||
Information technology 19.97% | ||||||||
Microsoft Corp. | 10,689,658 | $ | 2,377,594 | |||||
Broadcom Inc. | 2,735,734 | 1,197,841 | ||||||
Mastercard Inc., Class A | 1,692,300 | 604,049 | ||||||
Accenture PLC, Class A | 991,200 | 258,911 | ||||||
Intel Corp. | 4,856,300 | 241,941 | ||||||
Visa Inc., Class A | 1,093,800 | 239,247 | ||||||
Taiwan Semiconductor Manufacturing Company, Ltd.1 | 10,147,000 | 190,576 | ||||||
Adobe Inc.2 | 360,100 | 180,093 | ||||||
Apple Inc. | 1,220,400 | 161,935 | ||||||
Autodesk, Inc.2 | 530,000 | 161,830 | ||||||
ServiceNow, Inc.2 | 280,100 | 154,175 | ||||||
QUALCOMM Inc. | 1,007,952 | 153,551 | ||||||
Automatic Data Processing, Inc. | 845,000 | 148,889 | ||||||
ASML Holding NV (New York registered) (ADR) | 147,800 | 72,085 | ||||||
ASML Holding NV1 | 140,000 | 67,657 | ||||||
Ceridian HCM Holding Inc.2 | 1,240,574 | 132,196 | ||||||
StoneCo Ltd., Class A2 | 1,285,500 | 107,879 | ||||||
Global Payments Inc. | 498,100 | 107,301 | ||||||
CDK Global, Inc. | 2,042,800 | 105,878 | ||||||
Cognizant Technology Solutions Corp., Class A | 1,219,000 | 99,897 | ||||||
Samsung Electronics Co., Ltd.1 | 1,110,000 | 82,958 | ||||||
MKS Instruments, Inc. | 481,000 | 72,366 | ||||||
Fidelity National Information Services, Inc. | 504,200 | 71,324 | ||||||
Euronet Worldwide, Inc.2 | 491,600 | 71,243 | ||||||
PayPal Holdings, Inc.2 | 298,500 | 69,909 | ||||||
Concentrix Corp.2 | 641,935 | 63,359 | ||||||
Fiserv, Inc.2 | 536,700 | 61,109 | ||||||
Atlassian Corp. PLC, Class A2 | 247,800 | 57,953 | ||||||
NetApp, Inc. | 873,100 | 57,834 | ||||||
Micron Technology, Inc.2 | 760,600 | 57,182 | ||||||
Amphenol Corp., Class A | 386,000 | 50,477 | ||||||
FleetCor Technologies, Inc.2 | 167,000 | 45,563 | ||||||
SAP SE1 | 239,500 | 31,472 | ||||||
Applied Materials, Inc. | 337,400 | 29,118 | ||||||
Trimble Inc.2 | 413,300 | 27,596 | ||||||
Teradata Corp.2 | 1,056,057 | 23,730 | ||||||
Vontier Corp.2 | 434,000 | 14,496 | ||||||
VeriSign, Inc.2 | 61,000 | 13,200 | ||||||
GoDaddy Inc., Class A2 | 143,400 | 11,895 | ||||||
Analog Devices, Inc. | 75,000 | 11,080 | ||||||
|
| |||||||
| 7,687,389 | ||||||||
|
| |||||||
Communication services 15.48% | ||||||||
Facebook, Inc., Class A2 | 7,410,800 | 2,024,334 | ||||||
Alphabet Inc., Class C2 | 336,784 | 590,005 | ||||||
Alphabet Inc., Class A2 | 308,780 | 541,180 | ||||||
Netflix, Inc.2 | 1,952,025 | 1,055,518 | ||||||
Comcast Corp., Class A | 15,095,800 | 791,020 | ||||||
Charter Communications, Inc., Class A2 | 443,970 | 293,708 | ||||||
Electronic Arts Inc. | 1,168,000 | 167,725 | ||||||
Verizon Communications Inc. | 2,665,513 | 156,599 | ||||||
ViacomCBS Inc., Class B | 2,666,983 | 99,372 | ||||||
Tencent Holdings Ltd.1 | 1,295,500 | 94,659 | ||||||
Cable One, Inc. | 33,300 | 74,183 | ||||||
Vodafone Group PLC1 | 20,000,000 | 32,913 | ||||||
Activision Blizzard, Inc. | 262,939 | 24,414 | ||||||
Fox Corp., Class A | 473,666 | 13,793 | ||||||
|
| |||||||
| 5,959,423 | ||||||||
|
| |||||||
88 American Funds Insurance Series
Table of Contents
Growth-Income Fund (continued)
Common stocks (continued)
| Shares | Value (000) | |||||||
Health care 14.22% | ||||||||
UnitedHealth Group Inc. | 2,609,900 | $ | 915,240 | |||||
Abbott Laboratories | 6,645,169 | 727,580 | ||||||
Gilead Sciences, Inc. | 9,502,600 | 553,621 | ||||||
Amgen Inc. | 1,909,500 | 439,032 | ||||||
Merck & Co., Inc. | 3,038,880 | 248,580 | ||||||
Thermo Fisher Scientific Inc. | 392,000 | 182,586 | ||||||
AstraZeneca PLC1 | 1,451,800 | 145,048 | ||||||
AstraZeneca PLC (ADR) | 721,200 | 36,053 | ||||||
Seagen Inc.2 | 871,319 | 152,603 | ||||||
Daiichi Sankyo Company, Ltd.1 | 4,176,000 | 143,155 | ||||||
AbbVie Inc. | 1,296,036 | 138,870 | ||||||
PRA Health Sciences, Inc.2 | 1,023,500 | 128,388 | ||||||
Royalty Pharma PLC, Class A | 2,557,706 | 128,013 | ||||||
Novo Nordisk A/S, Class B1 | 1,611,056 | 112,686 | ||||||
Chugai Pharmaceutical Co., Ltd.1 | 2,105,700 | 112,421 | ||||||
Anthem, Inc. | 342,000 | 109,813 | ||||||
GlaxoSmithKline PLC1 | 5,827,300 | 106,774 | ||||||
Eli Lilly and Company | 625,800 | 105,660 | ||||||
Medtronic PLC | 860,000 | 100,740 | ||||||
Novartis AG1 | 1,066,059 | 100,690 | ||||||
PerkinElmer, Inc. | 596,500 | 85,598 | ||||||
Baxter International Inc. | 995,800 | 79,903 | ||||||
Allakos Inc.2 | 511,000 | 71,540 | ||||||
Ultragenyx Pharmaceutical Inc.2 | 508,100 | 70,336 | ||||||
Galapagos NV1,2 | 268,105 | 26,381 | ||||||
Galapagos NV (ADR)2,3 | 209,697 | 20,756 | ||||||
Zimmer Biomet Holdings, Inc. | 305,670 | 47,101 | ||||||
Vertex Pharmaceuticals Inc.2 | 192,000 | 45,377 | ||||||
Incyte Corp.2 | 473,200 | 41,159 | ||||||
NovoCure Ltd.2 | 193,600 | 33,501 | ||||||
Roche Holding AG, nonvoting, non-registered shares1 | 93,081 | 32,477 | ||||||
Allogene Therapeutics, Inc.2 | 1,258,500 | 31,764 | ||||||
Edwards Lifesciences Corp.2 | 330,750 | 30,174 | ||||||
AmerisourceBergen Corp. | 283,400 | 27,705 | ||||||
Humana Inc. | 65,300 | 26,791 | ||||||
Stryker Corp. | 106,535 | 26,105 | ||||||
Biohaven Pharmaceutical Holding Co. Ltd.2 | 259,600 | 22,250 | ||||||
Karuna Therapeutics, Inc.2 | 215,600 | 21,903 | ||||||
Cigna Corp. | 59,413 | 12,369 | ||||||
GoodRx Holdings, Inc., Class A2 | 243,100 | 9,807 | ||||||
Cortexyme, Inc.2 | 258,690 | 7,186 | ||||||
Vir Biotechnology, Inc.2,3 | 258,400 | 6,920 | ||||||
Bluebird Bio, Inc.2 | 109,400 | 4,734 | ||||||
Agios Pharmaceuticals, Inc.2 | 89,350 | 3,871 | ||||||
|
| |||||||
| 5,473,261 | ||||||||
|
| |||||||
Financials 10.23% | ||||||||
JPMorgan Chase & Co. | 4,105,630 | 521,702 | ||||||
Intercontinental Exchange, Inc. | 3,183,555 | 367,032 | ||||||
CME Group Inc., Class A | 1,779,800 | 324,013 | ||||||
Aon PLC, Class A | 1,214,800 | 256,651 | ||||||
Marsh & McLennan Companies, Inc. | 2,162,201 | 252,978 | ||||||
PNC Financial Services Group, Inc. | 1,587,422 | 236,526 | ||||||
State Street Corp. | 3,126,915 | 227,577 | ||||||
Nasdaq, Inc. | 1,609,900 | 213,698 | ||||||
Chubb Ltd. | 1,239,153 | 190,730 | ||||||
Moody’s Corp. | 640,058 | 185,770 | ||||||
BlackRock, Inc. | 180,700 | 130,382 | ||||||
Travelers Companies, Inc. | 906,955 | 127,309 | ||||||
S&P Global Inc. | 342,408 | 112,560 | ||||||
Bank of New York Mellon Corp. | 2,299,000 | 97,570 | ||||||
American International Group, Inc. | 2,572,000 | 97,376 | ||||||
American Funds Insurance Series 89
Table of Contents
Growth-Income Fund (continued)
Common stocks (continued)
| Shares | Value (000) | |||||||
Financials (continued) | ||||||||
KeyCorp | 4,886,953 | $ | 80,195 | |||||
Arthur J. Gallagher & Co. | 617,000 | 76,329 | ||||||
Power Corp. of Canada, subordinate voting shares3 | 2,625,000 | 60,279 | ||||||
B3 SA - Brasil, Bolsa, Balcao | 5,032,000 | 60,045 | ||||||
London Stock Exchange Group PLC1 | 424,000 | 52,264 | ||||||
Citizens Financial Group, Inc. | 1,457,453 | 52,119 | ||||||
Charles Schwab Corp. | 879,000 | 46,622 | ||||||
Discover Financial Services | 478,900 | 43,355 | ||||||
Truist Financial Corp. | 870,732 | 41,734 | ||||||
Wells Fargo & Company | 1,222,300 | 36,889 | ||||||
Bank of America Corp. | 914,300 | 27,712 | ||||||
UBS Group AG1 | 1,343,666 | 18,793 | ||||||
|
| |||||||
| 3,938,210 | ||||||||
|
| |||||||
Industrials 9.50% | ||||||||
CSX Corp. | 3,114,900 | 282,677 | ||||||
Woodward, Inc. | 2,204,500 | 267,913 | ||||||
Carrier Global Corp. | 6,668,375 | 251,531 | ||||||
Norfolk Southern Corp. | 946,977 | 225,011 | ||||||
Northrop Grumman Corp. | 733,200 | 223,421 | ||||||
BWX Technologies, Inc. | 3,080,911 | 185,717 | ||||||
TransDigm Group Inc.2 | 295,700 | 182,994 | ||||||
Airbus SE, non-registered shares1,2 | 1,617,590 | 177,691 | ||||||
Raytheon Technologies Corp. | 2,349,100 | 167,984 | ||||||
Union Pacific Corp. | 746,200 | 155,374 | ||||||
Meggitt PLC1,2 | 24,131,952 | 154,177 | ||||||
Equifax Inc. | 777,300 | 149,895 | ||||||
Waste Connections, Inc. | 1,042,100 | 106,888 | ||||||
Lockheed Martin Corp. | 294,900 | 104,684 | ||||||
Westinghouse Air Brake Technologies Corp. | 1,422,942 | 104,159 | ||||||
Air Lease Corp., Class A | 2,097,300 | 93,162 | ||||||
Waste Management, Inc. | 767,700 | 90,535 | ||||||
L3Harris Technologies, Inc. | 443,000 | 83,736 | ||||||
Old Dominion Freight Line, Inc. | 405,000 | 79,048 | ||||||
Fortive Corp. | 1,085,000 | 76,840 | ||||||
Safran SA1,2 | 539,713 | 76,542 | ||||||
General Electric Co. | 7,022,250 | 75,840 | ||||||
General Dynamics Corp. | 482,600 | 71,821 | ||||||
Ryanair Holdings PLC (ADR)2 | 445,550 | 49,002 | ||||||
Ryanair Holdings PLC1,2 | 611,907 | 12,189 | ||||||
Middleby Corp.2 | 441,000 | 56,854 | ||||||
Otis Worldwide Corp. | 555,100 | 37,497 | ||||||
Fastenal Co. | 635,000 | 31,007 | ||||||
ManpowerGroup Inc. | 252,000 | 22,725 | ||||||
Cummins Inc. | 100,000 | 22,710 | ||||||
Caterpillar Inc. | 101,600 | 18,493 | ||||||
Nielsen Holdings PLC | 856,400 | 17,873 | ||||||
|
| |||||||
| 3,655,990 | ||||||||
|
| |||||||
Consumer discretionary 8.11% | ||||||||
Amazon.com, Inc.2 | 346,130 | 1,127,321 | ||||||
General Motors Company | 7,736,000 | 322,127 | ||||||
Wyndham Hotels & Resorts, Inc. | 3,198,334 | 190,109 | ||||||
Home Depot, Inc. | 623,900 | 165,720 | ||||||
Royal Caribbean Cruises Ltd. | 2,084,381 | 155,683 | ||||||
Burlington Stores, Inc.2 | 555,458 | 145,280 | ||||||
Thor Industries, Inc. | 1,289,600 | 119,920 | ||||||
MercadoLibre, Inc.2 | 70,000 | 117,265 | ||||||
Lowe’s Companies, Inc. | 666,000 | 106,900 | ||||||
Booking Holdings Inc.2 | 47,600 | 106,018 | ||||||
Flutter Entertainment PLC (GBP denominated)1 | 387,005 | 80,125 | ||||||
Chipotle Mexican Grill, Inc.2 | 53,110 | 73,648 | ||||||
90 American Funds Insurance Series
Table of Contents
Growth-Income Fund (continued)
Common stocks (continued)
| Shares | Value (000) | |||||||
Consumer discretionary (continued) | ||||||||
Darden Restaurants, Inc. | 600,000 | $ | 71,472 | |||||
D.R. Horton, Inc. | 913,000 | 62,924 | ||||||
Hasbro, Inc. | 600,000 | 56,124 | ||||||
Wynn Resorts, Ltd. | 490,966 | 55,396 | ||||||
Kering SA1 | 62,207 | 45,224 | ||||||
Marriott International, Inc., Class A | 250,500 | 33,046 | ||||||
Aptiv PLC | 233,000 | 30,358 | ||||||
Hilton Worldwide Holdings Inc. | 197,720 | 21,998 | ||||||
YUM! Brands, Inc. | 196,630 | 21,346 | ||||||
Airbnb, Inc., Class A2 | 99,500 | 14,607 | ||||||
|
| |||||||
| 3,122,611 | ||||||||
|
| |||||||
Consumer staples 5.06% | ||||||||
Keurig Dr Pepper Inc. | 10,220,935 | 327,070 | ||||||
British American Tobacco PLC1 | 8,704,673 | 323,770 | ||||||
Philip Morris International Inc. | 3,549,640 | 293,875 | ||||||
Costco Wholesale Corp. | 459,800 | 173,243 | ||||||
Nestlé SA1 | 1,227,796 | 144,547 | ||||||
Lamb Weston Holdings, Inc. | 1,506,566 | 118,627 | ||||||
Carlsberg A/S, Class B1 | 720,474 | 115,505 | ||||||
Reckitt Benckiser Group PLC1 | 1,275,000 | 114,030 | ||||||
Mondelez International, Inc. | 1,676,300 | 98,013 | ||||||
Clorox Co. | 255,000 | 51,490 | ||||||
Herbalife Nutrition Ltd.2 | 849,000 | 40,795 | ||||||
Church & Dwight Co., Inc. | 424,500 | 37,029 | ||||||
General Mills, Inc. | 428,800 | 25,213 | ||||||
Pernod Ricard SA1 | 117,200 | 22,466 | ||||||
Constellation Brands, Inc., Class A | 100,700 | 22,058 | ||||||
Anheuser-Busch InBev SA/NV1 | 281,571 | 19,677 | ||||||
Kraft Heinz Company | 567,200 | 19,659 | ||||||
|
| |||||||
| 1,947,067 | ||||||||
|
| |||||||
Materials 4.89% | ||||||||
Celanese Corp. | 2,593,233 | 336,965 | ||||||
LyondellBasell Industries NV | 2,453,100 | 224,851 | ||||||
Vale SA, ordinary nominative (ADR) | 9,206,039 | 154,293 | ||||||
Vale SA, ordinary nominative | 3,404,848 | 57,325 | ||||||
Linde PLC | 774,300 | 204,036 | ||||||
Dow Inc. | 2,859,700 | 158,713 | ||||||
Sherwin-Williams Company | 162,500 | 119,423 | ||||||
International Flavors & Fragrances Inc.3 | 1,075,000 | 117,003 | ||||||
Freeport-McMoRan Inc. | 4,073,000 | 105,980 | ||||||
Air Products and Chemicals, Inc. | 312,100 | 85,272 | ||||||
Rio Tinto PLC1 | 1,020,655 | 76,369 | ||||||
Barrick Gold Corp. | 2,373,000 | 54,057 | ||||||
Mosaic Co. | 2,333,266 | 53,688 | ||||||
PPG Industries, Inc. | 295,550 | 42,624 | ||||||
Centerra Gold Inc. | 2,917,909 | 33,789 | ||||||
DuPont de Nemours Inc. | 459,700 | 32,689 | ||||||
Asahi Kasei Corp.1 | 2,392,300 | 24,606 | ||||||
|
| |||||||
| 1,881,683 | ||||||||
|
| |||||||
Energy 3.42% | ||||||||
Canadian Natural Resources, Ltd. (CAD denominated) | 10,768,800 | 258,793 | ||||||
Chevron Corp. | 2,670,200 | 225,498 | ||||||
Enbridge Inc. (CAD denominated) | 5,382,362 | 172,139 | ||||||
EOG Resources, Inc. | 3,255,400 | 162,347 | ||||||
Baker Hughes Co., Class A | 5,510,024 | 114,884 | ||||||
ConocoPhillips | 2,307,010 | 92,257 | ||||||
Equitrans Midstream Corp. | 8,547,400 | 68,721 | ||||||
Schlumberger Ltd. | 2,727,900 | 59,550 | ||||||
Royal Dutch Shell PLC, Class B (ADR) | 1,622,300 | 54,525 | ||||||
American Funds Insurance Series 91
Table of Contents
Growth-Income Fund (continued)
Common stocks (continued)
| Shares | Value (000) | |||||||
Energy (continued) | ||||||||
| Royal Dutch Shell PLC, Class A (ADR) | 13,204 | $ 464 | ||||||
| TC Energy Corp. (CAD denominated)3 | 1,168,019 | 47,486 | ||||||
| Concho Resources Inc. | 653,000 | 38,103 | ||||||
| Exxon Mobil Corp. | 500,000 | 20,610 | ||||||
| Tullow Oil PLC1,2 | 3,674,051 | 1,473 | ||||||
| Weatherford International2 | 128,424 | 771 | ||||||
|
| |||||||
| 1,317,621 | ||||||||
|
| |||||||
Utilities 2.89% | ||||||||
Edison International | 2,916,721 | 183,228 | ||||||
CenterPoint Energy, Inc. | 6,548,899 | 141,718 | ||||||
Enel SpA1 | 13,587,341 | 137,210 | ||||||
AES Corp. | 5,203,200 | 122,275 | ||||||
Sempra Energy | 750,000 | 95,557 | ||||||
American Electric Power Company, Inc. | 1,036,600 | 86,318 | ||||||
Exelon Corp. | 1,576,100 | 66,543 | ||||||
Endesa, SA1 | 2,286,838 | 62,703 | ||||||
PG&E Corp.2 | 4,171,900 | 51,982 | ||||||
CMS Energy Corp. | 692,700 | 42,262 | ||||||
Public Service Enterprise Group Inc. | 686,500 | 40,023 | ||||||
Xcel Energy Inc. | 423,300 | 28,221 | ||||||
Entergy Corp. | 274,900 | 27,446 | ||||||
DTE Energy Company | 125,900 | 15,286 | ||||||
E.ON SE1 | 937,841 | 10,387 | ||||||
|
| |||||||
| 1,111,159 | ||||||||
|
| |||||||
Real estate 2.56% | ||||||||
Equinix, Inc. REIT | 541,418 | 386,670 | ||||||
Crown Castle International Corp. REIT | 1,561,966 | 248,649 | ||||||
MGM Growth Properties LLC REIT, Class A | 3,346,000 | 104,730 | ||||||
American Tower Corp. REIT | 421,300 | 94,565 | ||||||
Digital Realty Trust, Inc. REIT | 645,000 | 89,984 | ||||||
SBA Communications Corp. REIT | 210,000 | 59,247 | ||||||
|
| |||||||
| 983,845 | ||||||||
|
| |||||||
Total common stocks (cost: $22,668,560,000) | 37,078,259 | |||||||
|
| |||||||
Convertible stocks 0.81% | ||||||||
Health care 0.47% | ||||||||
Danaher Corp., Series B, cumulative convertible preferred shares, 5.00% 20233 | 80,972 | 105,353 | ||||||
Danaher Corp., Series A, cumulative convertible preferred shares, 4.75% 2022 | 50,000 | 75,882 | ||||||
|
| |||||||
| 181,235 | ||||||||
|
| |||||||
Information technology 0.33% | ||||||||
Broadcom Inc., Series A, cumulative convertible preferred shares, 8.00% 2022 | 88,400 | 125,746 | ||||||
|
| |||||||
Industrials 0.01% | ||||||||
Stanley Black & Decker, Inc., convertible preferred shares, 5.25% 2022 | 35,448 | 3,965 | ||||||
|
| |||||||
Consumer discretionary 0.00% | ||||||||
Aptiv PLC, Series A, convertible preferred shares, 5.50% 2023 | 675 | 104 | ||||||
|
| |||||||
Total convertible stocks (cost: $234,248,000) | 311,050 | |||||||
|
| |||||||
92 American Funds Insurance Series
Table of Contents
Growth-Income Fund (continued)
Bonds, notes & other debt instruments 0.12%
Principal (000) | Value (000) | |||||||
Corporate bonds, notes & loans 0.12% | ||||||||
Consumer discretionary 0.09% | ||||||||
Carnival Corp. 11.50% 20234 | $ | 27,790 | $ | 32,174 | ||||
General Motors Financial Co. 4.30% 2025 | 160 | 180 | ||||||
General Motors Financial Co. 5.25% 2026 | 827 | 976 | ||||||
|
| |||||||
| 33,330 | ||||||||
|
| |||||||
Energy 0.02% | ||||||||
Weatherford International PLC 8.75% 20244 | 1,983 | 1,990 | ||||||
Weatherford International PLC 11.00% 20244 | 5,280 | 4,132 | ||||||
|
| |||||||
| 6,122 | ||||||||
|
| |||||||
Industrials 0.01% | ||||||||
Boeing Company 4.875% 2025 | 4,706 | 5,367 | ||||||
|
| |||||||
Total corporate bonds, notes & loans | 44,819 | |||||||
|
| |||||||
Total bonds, notes & other debt instruments (cost: $40,235,000) | 44,819 | |||||||
|
| |||||||
| Shares | ||||||||
Short-term securities 3.06% |
| |||||||
Money market investments 3.06% |
| |||||||
Capital Group Central Cash Fund 0.12%5,6 | 10,056,640 | 1,005,764 | ||||||
Goldman Sachs Financial Square Government Fund, Institutional Shares 0.02%5,7 | 174,462,623 | 174,463 | ||||||
|
| |||||||
| 1,180,227 | ||||||||
|
| |||||||
Total short-term securities (cost: $1,180,023,000) |
| 1,180,227 | ||||||
|
| |||||||
Total investment securities 100.32% (cost: $24,123,066,000) |
| 38,614,355 | ||||||
Other assets less liabilities (0.32)% |
| (122,820 | ) | |||||
|
| |||||||
Net assets 100.00% |
| $ | 38,491,535 | |||||
|
| |||||||
Investments in affiliates6
| Value of affiliates at 1/1/2020 (000) | Additions (000) | Reductions (000) | Net realized (loss) gain (000) | Net unrealized depreciation (000) | Value of affiliates at 12/31/2020 (000) | Dividend income (000) | ||||||||||||||||||||||
Common stocks 0.00% | ||||||||||||||||||||||||||||
Industrials 0.00% | ||||||||||||||||||||||||||||
BWX Technologies, Inc.8 | $ | 336,143 | $ | 16,890 | $ | 138,597 | $ | (18,623 | ) | $ | (10,096 | ) | $ | — | $ | 3,020 | ||||||||||||
Short-term securities 2.61% | ||||||||||||||||||||||||||||
Money market investments 2.61% | ||||||||||||||||||||||||||||
Capital Group Central Cash Fund 0.12%5 | 1,940,600 | 5,169,467 | 6,103,677 | 262 | (888 | ) | 1,005,764 | 9,905 | ||||||||||||||||||||
|
|
|
|
|
|
|
| |||||||||||||||||||||
Total 2.61% | $ | (18,361 | ) | $ | (10,984 | ) | $ | 1,005,764 | $ | 12,925 | ||||||||||||||||||
|
|
|
|
|
|
|
| |||||||||||||||||||||
| 1 | Valued under fair value procedures adopted by authority of the board of trustees. The total value of all such securities was $2,949,615,000, which represented 7.66% of the net assets of the fund. This entire amount relates to certain securities trading outside the U.S. whose values were adjusted as a result of significant market movements following the close of local trading. |
| 2 | Security did not produce income during the last 12 months. |
| 3 | All or a portion of this security was on loan. The total value of all such securities was $188,806,000, which represented .49% of the net assets of the fund. Refer to Note 5 for more information on securities lending. |
| 4 | Acquired in a transaction exempt from registration under Rule 144A of the Securities Act of 1933. May be resold in the U.S. in transactions exempt from registration, normally to qualified institutional buyers. The total value of all such securities was $38,296,000, which represented .10% of the net assets of the fund. |
| 5 | Rate represents the seven-day yield at 12/31/2020. |
| 6 | Affiliate of the fund or part of the same group of investment companies as the fund, in each case as defined under the Investment Company Act of 1940. |
| 7 | Security purchased with cash collateral from securities on loan. Refer to Note 5 for more information on securities lending. |
| 8 | Unaffiliated issuer at 12/31/2020. |
American Funds Insurance Series 93
Table of Contents
Growth-Income Fund (continued)
Key to abbreviations
ADR = American Depositary Receipts
CAD = Canadian dollars
GBP = British pounds
See notes to financial statements.
94 American Funds Insurance Series
Table of Contents
International Growth and Income Fund
Investment portfolio December 31, 2020
Common stocks 94.17%
| Shares | Value (000) | |||||||
Financials 17.86% | ||||||||
HDFC Bank Ltd.1,2 | 2,457,600 | $ | 48,410 | |||||
AIA Group Ltd.1 | 2,338,600 | 28,806 | ||||||
ING Groep NV1,2 | 2,789,300 | 26,424 | ||||||
Zurich Insurance Group AG1 | 54,100 | 22,930 | ||||||
DNB ASA1,2 | 825,000 | 16,243 | ||||||
B3 SA - Brasil, Bolsa, Balcao | 1,302,000 | 15,536 | ||||||
Sberbank of Russia PJSC (ADR)1 | 999,000 | 14,402 | ||||||
IndusInd Bank Ltd.1,2 | 1,105,000 | 13,577 | ||||||
Moscow Exchange MICEX-RTS PJSC1 | 5,665,000 | 12,224 | ||||||
DBS Group Holdings Ltd.1 | 558,000 | 10,555 | ||||||
Banco Santander, SA1,2 | 3,393,521 | 10,536 | ||||||
Haci Ömer Sabanci Holding AS1 | 6,520,900 | 10,063 | ||||||
Aegon NV1 | 2,483,308 | 9,917 | ||||||
Ping An Insurance (Group) Company of China, Ltd., Class H1 | 690,500 | 8,481 | ||||||
PICC Property and Casualty Co. Ltd., Class H1 | 7,905,000 | 5,989 | ||||||
Great-West Lifeco Inc. (CAD denominated) | 248,102 | 5,916 | ||||||
|
| |||||||
| 260,009 | ||||||||
|
| |||||||
Industrials 12.94% | ||||||||
Shanghai International Airport Co., Ltd., Class A1 | 3,091,967 | 35,788 | ||||||
Airbus SE, non-registered shares1,2 | 246,912 | 27,123 | ||||||
Ryanair Holdings PLC (ADR)2 | 179,000 | 19,686 | ||||||
Singapore Technologies Engineering Ltd1 | 5,270,000 | 15,216 | ||||||
SAAB AB, Class B1,2 | 510,000 | 14,838 | ||||||
Recruit Holdings Co., Ltd.1 | 319,900 | 13,418 | ||||||
Komatsu Ltd.1 | 445,000 | 12,194 | ||||||
Alliance Global Group, Inc.1 | 54,617,900 | 12,062 | ||||||
Airports of Thailand PCL, foreign registered1 | 5,250,000 | 10,824 | ||||||
GT Capital Holdings, Inc.1 | 797,142 | 9,715 | ||||||
Aena SME, SA, non-registered shares1,2 | 52,450 | 9,159 | ||||||
LIXIL Corp.1 | 385,000 | 8,362 | ||||||
|
| |||||||
| 188,385 | ||||||||
|
| |||||||
Communication services 12.10% | ||||||||
SoftBank Corp.1 | 4,691,700 | 58,818 | ||||||
SoftBank Group Corp.1 | 580,800 | 45,486 | ||||||
Yandex NV, Class A2 | 470,000 | 32,702 | ||||||
Tencent Holdings Ltd.1 | 297,700 | 21,752 | ||||||
Rightmove PLC1,2 | 1,290,000 | 11,488 | ||||||
Bilibili Inc., Class Z (ADR)2,3 | 69,200 | 5,932 | ||||||
|
| |||||||
| 176,178 | ||||||||
|
| |||||||
Consumer discretionary 11.91% | ||||||||
LVMH Moët Hennessy-Louis Vuitton SE1 | 48,000 | 29,992 | ||||||
Sony Corp.1 | 265,900 | 26,734 | ||||||
Taylor Wimpey PLC1,2 | 10,317,400 | 23,457 | ||||||
Kering SA1 | 29,000 | 21,083 | ||||||
Naspers Ltd., Class N1 | 95,400 | 19,526 | ||||||
Flutter Entertainment PLC (GBP denominated)1 | 73,000 | 15,114 | ||||||
Alibaba Group Holding Ltd.1,2 | 442,500 | 12,929 | ||||||
Galaxy Entertainment Group Ltd.1 | 1,345,000 | 10,461 | ||||||
Entain PLC1,2 | 494,100 | 7,670 | ||||||
Prosus NV1 | 59,100 | 6,357 | ||||||
|
| |||||||
| 173,323 | ||||||||
|
| |||||||
Health care 9.62% | ||||||||
Daiichi Sankyo Company, Ltd.1 | 1,359,000 | 46,587 | ||||||
Aier Eye Hospital Group Co., Ltd., Class A1 | 1,937,655 | 22,193 | ||||||
Fresenius SE & Co. KGaA1 | 283,701 | 13,109 | ||||||
Chugai Pharmaceutical Co., Ltd.1 | 228,900 | 12,221 | ||||||
HOYA Corp.1 | 85,000 | 11,750 | ||||||
Novartis AG1 | 113,564 | 10,726 | ||||||
American Funds Insurance Series 95
Table of Contents
International Growth and Income Fund (continued)
Common stocks (continued)
| Shares | Value (000) | |||||||
Health care (continued) | ||||||||
GlaxoSmithKline PLC1 | 386,500 | $ | 7,082 | |||||
Richter Gedeon Nyrt.1 | 265,232 | 6,656 | ||||||
Teva Pharmaceutical Industries Ltd. (ADR)2 | 662,000 | 6,388 | ||||||
Alcon Inc.1,2 | 48,672 | 3,249 | ||||||
NMC Health PLC1,2,4 | 304,610 | 4 | ||||||
|
| |||||||
| 139,965 | ||||||||
|
| |||||||
Materials 6.96% | ||||||||
Vale SA, ordinary nominative | 1,712,500 | 28,832 | ||||||
Vale SA, ordinary nominative (ADR) | 424,300 | 7,111 | ||||||
Rio Tinto PLC1 | 379,300 | 28,381 | ||||||
Linde PLC | 53,000 | 13,966 | ||||||
Air Liquide SA, non-registered shares1 | 79,200 | 12,999 | ||||||
Akzo Nobel NV1 | 93,955 | 10,092 | ||||||
|
| |||||||
| 101,381 | ||||||||
|
| |||||||
Consumer staples 6.72% | ||||||||
Imperial Brands PLC1 | 2,228,016 | 46,814 | ||||||
Treasury Wine Estates Ltd.1 | 2,607,742 | 18,916 | ||||||
Philip Morris International Inc. | 140,000 | 11,591 | ||||||
British American Tobacco PLC1 | 216,802 | 8,064 | ||||||
Pernod Ricard SA1 | 39,400 | 7,553 | ||||||
Kirin Holdings Company, Ltd.1 | 209,500 | 4,946 | ||||||
|
| |||||||
| 97,884 | ||||||||
|
| |||||||
Information technology 5.36% | ||||||||
ASML Holding NV1 | 47,800 | 23,100 | ||||||
Nice Ltd. (ADR)2 | 73,400 | 20,812 | ||||||
Taiwan Semiconductor Manufacturing Company, Ltd.1 | 1,010,000 | 18,969 | ||||||
SUMCO Corp.1 | 692,000 | 15,193 | ||||||
|
| |||||||
| 78,074 | ||||||||
|
| |||||||
Utilities 5.20% | ||||||||
E.ON SE1 | 2,453,000 | 27,167 | ||||||
ENN Energy Holdings Ltd.1 | 1,358,000 | 19,933 | ||||||
Ørsted AS1 | 63,707 | 13,030 | ||||||
Iberdrola, SA, non-registered shares1 | 623,669 | 8,919 | ||||||
SSE PLC1 | 325,350 | 6,706 | ||||||
|
| |||||||
| 75,755 | ||||||||
|
| |||||||
Energy 2.84% | ||||||||
Royal Dutch Shell PLC, Class A (GBP denominated)1 | 792,000 | 14,061 | ||||||
Royal Dutch Shell PLC, Class B1 | 482,000 | 8,304 | ||||||
Canadian Natural Resources, Ltd. (CAD denominated) | 272,500 | 6,549 | ||||||
Canadian Natural Resources, Ltd. | 92,000 | 2,212 | ||||||
Cenovus Energy Inc. | 935,000 | 5,692 | ||||||
Total SE1,3 | 104,750 | 4,519 | ||||||
|
| |||||||
| 41,337 | ||||||||
|
| |||||||
Real estate 2.66% | ||||||||
CK Asset Holdings Ltd.1 | 2,626,000 | 13,507 | ||||||
China Resources Mixc Lifestyle Services Ltd.1,2 | 2,193,461 | 10,171 | ||||||
Sun Hung Kai Properties Ltd.1 | 747,000 | 9,644 | ||||||
China Resources Land Ltd.1 | 1,308,000 | 5,420 | ||||||
|
| |||||||
| 38,742 | ||||||||
|
| |||||||
Total common stocks (cost: $998,798,000) | 1,371,033 | |||||||
|
| |||||||
96 American Funds Insurance Series
Table of Contents
International Growth and Income Fund (continued)
Preferred securities 1.67%
| Shares | Value (000) | |||||||
Energy 1.67% | ||||||||
Petróleo Brasileiro SA (Petrobras), preferred nominative (ADR) | 1,182,200 | $ | 13,075 | |||||
Petróleo Brasileiro SA (Petrobras), preferred nominative | 2,062,500 | 11,253 | ||||||
|
| |||||||
| 24,328 | ||||||||
|
| |||||||
Total preferred securities (cost: $16,583,000) | 24,328 | |||||||
|
| |||||||
Rights & warrants 1.05% | ||||||||
Health care 1.05% | ||||||||
Aier Eye Hospital Group Co., Ltd., Class A, warrants, expire 20211,5 | 958,500 | 10,978 | ||||||
Aier Eye Hospital Group Co., Ltd., Class A, warrants, expire 20211,2,5 | 382,799 | 4,319 | ||||||
|
| |||||||
Total rights & warrants (cost: $8,134,000) | 15,297 | |||||||
|
| |||||||
Bonds, notes & other debt instruments 0.61% | ||||||||
Principal (000) | ||||||||
Bonds & notes of governments & government agencies outside the U.S. 0.34% | ||||||||
Brazil (Federative Republic of) 10.00% 2025 | BRL | 22,000 | 4,900 | |||||
|
| |||||||
Corporate bonds, notes & loans 0.27% | ||||||||
Health care 0.27% | ||||||||
Teva Pharmaceutical Finance Co. BV 3.15% 2026 | $ | 1,060 | 1,021 | |||||
Teva Pharmaceutical Finance Co. BV 4.10% 2046 | 1,160 | 1,035 | ||||||
Valeant Pharmaceuticals International, Inc. 6.125% 20255 | 1,865 | 1,924 | ||||||
|
| |||||||
| 3,980 | ||||||||
|
| |||||||
Total bonds, notes & other debt instruments (cost: $9,565,000) | 8,880 | |||||||
|
| |||||||
Short-term securities 2.62% | ||||||||
| Shares | ||||||||
Money market investments 2.62% | ||||||||
Capital Group Central Cash Fund 0.12%6,7 | 317,516 | 31,755 | ||||||
Goldman Sachs Financial Square Government Fund, Institutional Shares 0.02%6,8 | 6,385,194 | 6,385 | ||||||
|
| |||||||
Total short-term securities (cost: $38,133,000) | 38,140 | |||||||
|
| |||||||
Total investment securities 100.12% (cost: $1,071,213,000) | 1,457,678 | |||||||
Other assets less liabilities (0.12)% | (1,795 | ) | ||||||
|
| |||||||
Net assets 100.00% | $ | 1,455,883 | ||||||
|
| |||||||
Investments in affiliates7
| Value of affiliate at 1/1/2020 (000) | Additions (000) | Reductions (000) | Net realized gain (000) | Net unrealized depreciation (000) | Value of affiliate at 12/31/2020 (000) | Dividend income (000) | ||||||||||||||||||||||
Short-term securities 2.18% | ||||||||||||||||||||||||||||
Money market investments 2.18% | ||||||||||||||||||||||||||||
Capital Group Central Cash Fund 0.12%6 | $ | 128,026 | $ | 424,730 | $ | 520,991 | $ | 29 | $ | (39 | ) | $ | 31,755 | $ | 543 | |||||||||||||
American Funds Insurance Series 97
Table of Contents
International Growth and Income Fund (continued)
| 1 | Valued under fair value procedures adopted by authority of the board of trustees. The total value of all such securities was $1,203,405,000, which represented 82.66% of the net assets of the fund. This amount includes $1,203,401,000 related to certain securities trading outside the U.S. whose values were adjusted as a result of significant market movements following the close of local trading. |
| 2 | Security did not produce income during the last 12 months. |
| 3 | All or a portion of this security was on loan. The total value of all such securities was $6,820,000, which represented .47% of the net assets of the fund. Refer to Note 5 for more information on securities lending. |
| 4 | Value determined using significant unobservable inputs. |
| 5 | Acquired in a transaction exempt from registration under Rule 144A of the Securities Act of 1933. May be resold in the U.S. in transactions exempt from registration, normally to qualified institutional buyers. The total value of all such securities was $17,221,000, which represented 1.18% of the net assets of the fund. |
| 6 | Rate represents the seven-day yield at 12/31/2020. |
| 7 | Part of the same group of investment companies as the fund as defined under the Investment Company Act of 1940. 8Security purchased with cash collateral from securities on loan. Refer to Note 5 for more information on securities lending. |
Key to abbreviations
ADR = American Depositary Receipts
BRL = Brazilian reais
CAD = Canadian dollars
GBP = British pounds
See notes to financial statements.
98 American Funds Insurance Series
Table of Contents
Investment portfolio December 31, 2020
Common stocks 73.08%
| Shares | Value (000) | |||||||
Financials 13.08% | ||||||||
Zurich Insurance Group AG1 | 31,951 | $ | 13,542 | |||||
JPMorgan Chase & Co. | 93,281 | 11,853 | ||||||
Toronto-Dominion Bank (CAD denominated) | 177,227 | 10,014 | ||||||
Münchener Rückversicherungs-Gesellschaft AG1 | 32,434 | 9,606 | ||||||
Ping An Insurance (Group) Company of China, Ltd., Class H1 | 519,000 | 6,375 | ||||||
Ping An Insurance (Group) Company of China, Ltd., Class A1 | 67,300 | 895 | ||||||
Truist Financial Corp. | 146,476 | 7,021 | ||||||
CME Group Inc., Class A | 37,418 | 6,812 | ||||||
Hong Kong Exchanges and Clearing Ltd.1 | 107,600 | 5,918 | ||||||
PNC Financial Services Group, Inc. | 38,822 | 5,784 | ||||||
DBS Group Holdings Ltd.1 | 258,926 | 4,898 | ||||||
Power Corp. of Canada, subordinate voting shares | 200,855 | 4,612 | ||||||
Principal Financial Group, Inc. | 89,574 | 4,444 | ||||||
Great-West Lifeco Inc. (CAD denominated) | 179,325 | 4,276 | ||||||
State Street Corp. | 56,582 | 4,118 | ||||||
Citizens Financial Group, Inc. | 99,875 | 3,572 | ||||||
American International Group, Inc. | 78,458 | 2,970 | ||||||
Kaspi.kz JSC1,2,3 | 42,503 | 2,855 | ||||||
Kaspi.kz JSC (GDR)1,2 | 528 | 35 | ||||||
Royal Bank of Canada | 34,719 | 2,853 | ||||||
China Pacific Insurance (Group) Co., Ltd., Class H1 | 672,000 | 2,639 | ||||||
KeyCorp | 159,523 | 2,618 | ||||||
Citigroup Inc. | 34,320 | 2,116 | ||||||
East West Bancorp, Inc. | 41,043 | 2,081 | ||||||
Moscow Exchange MICEX-RTS PJSC1 | 879,942 | 1,899 | ||||||
Travelers Companies, Inc. | 13,301 | 1,867 | ||||||
Sberbank of Russia PJSC (ADR)1 | 124,715 | 1,798 | ||||||
DNB ASA1,2 | 89,834 | 1,769 | ||||||
AIA Group Ltd.1 | 109,200 | 1,345 | ||||||
U.S. Bancorp | 27,892 | 1,300 | ||||||
National Bank of Canada (Canada) | 21,800 | 1,227 | ||||||
BOC Hong Kong (Holdings) Ltd.1 | 401,500 | 1,220 | ||||||
BNP Paribas SA1,2 | 21,885 | 1,154 | ||||||
Tryg A/S1 | 32,699 | 1,031 | ||||||
Franklin Resources, Inc. | 36,936 | 923 | ||||||
PICC Property and Casualty Co. Ltd., Class H1 | 1,170,000 | 887 | ||||||
Everest Re Group, Ltd. | 3,444 | 806 | ||||||
Banco Santander, SA1,2 | 256,104 | 795 | ||||||
Banca Mediolanum SpA1,2 | 79,459 | 688 | ||||||
B3 SA - Brasil, Bolsa, Balcao | 51,891 | 619 | ||||||
Marsh & McLennan Companies, Inc. | 5,080 | 594 | ||||||
China Merchants Bank Co., Ltd., Class H1 | 92,000 | 584 | ||||||
Euronext NV1 | 3,260 | 359 | ||||||
Wells Fargo & Company | 9,632 | 291 | ||||||
The Blackstone Group Inc., Class A | 2,897 | 188 | ||||||
UBS Group AG1 | 12,103 | 169 | ||||||
TISCO Financial Group PCL, foreign registered1 | 31,200 | 93 | ||||||
|
| |||||||
| 143,513 | ||||||||
|
| |||||||
Information technology 9.11% | ||||||||
Broadcom Inc. | 85,538 | 37,453 | ||||||
Microsoft Corp. | 80,505 | 17,906 | ||||||
Taiwan Semiconductor Manufacturing Company, Ltd.1 | 710,800 | 13,350 | ||||||
Vanguard International Semiconductor Corp.1 | 1,036,700 | 4,296 | ||||||
International Business Machines Corp. | 29,876 | 3,761 | ||||||
Intel Corp. | 70,500 | 3,512 | ||||||
NetApp, Inc. | 51,604 | 3,418 | ||||||
Globalwafers Co., Ltd.1 | 111,000 | 2,809 | ||||||
Paychex, Inc. | 30,081 | 2,803 | ||||||
Western Union Company | 127,630 | 2,800 | ||||||
QUALCOMM Inc. | 14,936 | 2,275 | ||||||
KLA Corp. | 8,387 | 2,172 | ||||||
American Funds Insurance Series 99
Table of Contents
Capital Income Builder (continued)
Common stocks (continued)
| Shares | Value (000) | |||||||
Information technology (continued) | ||||||||
Apple Inc. | 11,238 | $ | 1,491 | |||||
Texas Instruments Inc. | 6,003 | 985 | ||||||
Tokyo Electron Ltd.1 | 2,300 | 858 | ||||||
|
| |||||||
| 99,889 | ||||||||
|
| |||||||
Consumer staples 9.03% | ||||||||
Philip Morris International Inc. | 310,514 | 25,706 | ||||||
British American Tobacco PLC1 | 439,883 | 16,361 | ||||||
Coca-Cola Company | 141,409 | 7,755 | ||||||
Altria Group, Inc. | 157,834 | 6,471 | ||||||
General Mills, Inc. | 103,684 | 6,097 | ||||||
Nestlé SA1 | 49,230 | 5,796 | ||||||
Unilever PLC1 | 77,436 | 4,661 | ||||||
Imperial Brands PLC1 | 204,285 | 4,292 | ||||||
Carlsberg A/S, Class B1 | 25,128 | 4,029 | ||||||
Danone SA1 | 48,065 | 3,159 | ||||||
Kraft Heinz Company | 54,961 | 1,905 | ||||||
Anheuser-Busch InBev SA/NV1 | 25,927 | 1,812 | ||||||
ITC Ltd.1 | 581,859 | 1,667 | ||||||
Kirin Holdings Company, Ltd.1 | 63,700 | 1,504 | ||||||
Kimberly-Clark Corp. | 10,979 | 1,480 | ||||||
Keurig Dr Pepper Inc. | 43,352 | 1,387 | ||||||
Japan Tobacco Inc.1,4 | 62,300 | 1,270 | ||||||
Reckitt Benckiser Group PLC1 | 14,019 | 1,254 | ||||||
Vector Group Ltd. | 102,492 | 1,194 | ||||||
Procter & Gamble Company | 4,639 | 645 | ||||||
PepsiCo, Inc. | 3,593 | 533 | ||||||
Treasury Wine Estates Ltd.1 | 13,106 | 95 | ||||||
Convenience Retail Asia Ltd.1 | 510,000 | 39 | ||||||
|
| |||||||
| 99,112 | ||||||||
|
| |||||||
Health care 8.92% | ||||||||
AbbVie Inc. | 195,093 | 20,904 | ||||||
Amgen Inc. | 79,926 | 18,377 | ||||||
GlaxoSmithKline PLC1 | 894,600 | 16,392 | ||||||
Gilead Sciences, Inc. | 263,841 | 15,371 | ||||||
Novartis AG1 | 111,820 | 10,561 | ||||||
Merck & Co., Inc. | 52,966 | 4,333 | ||||||
AstraZeneca PLC1 | 36,532 | 3,650 | ||||||
Roche Holding AG, nonvoting, non-registered shares1 | 7,659 | 2,672 | ||||||
Abbott Laboratories | 23,690 | 2,594 | ||||||
Royalty Pharma PLC, Class A | 33,980 | 1,701 | ||||||
Eli Lilly and Company | 5,814 | 982 | ||||||
UnitedHealth Group Inc. | 811 | 284 | ||||||
|
| |||||||
| 97,821 | ||||||||
|
| |||||||
Utilities 8.26% | ||||||||
E.ON SE1 | 1,163,311 | 12,884 | ||||||
Iberdrola, SA, non-registered shares1 | 883,550 | 12,636 | ||||||
Dominion Energy, Inc. | 125,783 | 9,459 | ||||||
Enel SpA1 | 707,229 | 7,142 | ||||||
Duke Energy Corp. | 75,190 | 6,884 | ||||||
DTE Energy Company | 55,834 | 6,779 | ||||||
National Grid PLC1 | 527,889 | 6,287 | ||||||
SSE PLC1 | 182,254 | 3,756 | ||||||
Southern Co. | 56,300 | 3,459 | ||||||
Consolidated Edison, Inc. | 42,140 | 3,045 | ||||||
Exelon Corp. | 58,099 | 2,453 | ||||||
Naturgy Energy Group, SA1 | 95,933 | 2,239 | ||||||
Power Grid Corp. of India Ltd.1 | 707,310 | 1,844 | ||||||
EDP - Energias de Portugal, SA1 | 237,733 | 1,498 | ||||||
Endesa, SA1 | 54,319 | 1,489 | ||||||
100 American Funds Insurance Series
Table of Contents
Capital Income Builder (continued)
Common stocks (continued)
| Shares | Value (000) | |||||||
Utilities (continued) | ||||||||
Public Service Enterprise Group Inc. | 21,289 | $ | 1,241 | |||||
AES Corp. | 51,108 | 1,201 | ||||||
Infratil Ltd.1 | 177,514 | 932 | ||||||
Centrica PLC1,2 | 1,385,547 | 884 | ||||||
China Gas Holdings Ltd.1 | 218,200 | 870 | ||||||
Power Assets Holdings Ltd.1 | 134,500 | 730 | ||||||
Engie SA1,2 | 43,725 | 670 | ||||||
Sempra Energy | 3,323 | 423 | ||||||
Ratch Group PCL, foreign registered1 | 239,000 | 421 | ||||||
Keppel Infrastructure Trust1 | 1,021,236 | 421 | ||||||
CLP Holdings Ltd.1 | 44,000 | 407 | ||||||
Guangdong Investment Ltd.1 | 222,000 | 401 | ||||||
NextEra Energy, Inc. | 1,367 | 106 | ||||||
|
| |||||||
| 90,561 | ||||||||
|
| |||||||
Real estate 5.64% | ||||||||
Crown Castle International Corp. REIT | 124,703 | 19,851 | ||||||
Digital Realty Trust, Inc. REIT | 62,741 | 8,753 | ||||||
Link Real Estate Investment Trust REIT1 | 528,018 | 4,811 | ||||||
VICI Properties Inc. REIT | 180,807 | 4,611 | ||||||
CK Asset Holdings Ltd.1 | 683,000 | 3,513 | ||||||
Gaming and Leisure Properties, Inc. REIT | 82,780 | 3,510 | ||||||
Federal Realty Investment Trust REIT | 32,070 | 2,730 | ||||||
Longfor Group Holdings Ltd.1 | 394,500 | 2,317 | ||||||
TAG Immobilien AG1 | 70,512 | 2,229 | ||||||
Charter Hall Group REIT1 | 160,868 | 1,826 | ||||||
MGM Growth Properties LLC REIT, Class A | 50,154 | 1,570 | ||||||
American Tower Corp. REIT | 4,721 | 1,060 | ||||||
Embassy Office Parks REIT1 | 223,400 | 1,055 | ||||||
Mindspace Business Parks REIT1,2 | 115,800 | 507 | ||||||
Mindspace Business Parks REIT1,2,3 | 110,400 | 474 | ||||||
Americold Realty Trust REIT | 25,291 | 944 | ||||||
Sun Hung Kai Properties Ltd.1 | 61,755 | 797 | ||||||
China Overseas Land & Investment Ltd.1 | 215,000 | 468 | ||||||
Ventas, Inc. REIT | 6,719 | 329 | ||||||
China Resources Land Ltd.1 | 72,000 | 298 | ||||||
AvalonBay Communities, Inc. REIT | 1,264 | 203 | ||||||
|
| |||||||
| 61,856 | ||||||||
|
| |||||||
Communication services 5.11% | ||||||||
Verizon Communications Inc. | 169,518 | 9,959 | ||||||
BCE Inc. | 186,983 | 7,996 | ||||||
SoftBank Corp.1 | 573,300 | 7,187 | ||||||
Comcast Corp., Class A | 129,064 | 6,763 | ||||||
Koninklijke KPN NV1 | 1,905,767 | 5,778 | ||||||
Nippon Telegraph and Telephone Corp.1 | 141,600 | 3,631 | ||||||
HKT Trust and HKT Ltd., units1 | 2,729,240 | 3,543 | ||||||
Vodafone Group PLC1 | 1,455,807 | 2,396 | ||||||
AT&T Inc. | 59,287 | 1,705 | ||||||
TELUS Corp. | 75,253 | 1,490 | ||||||
Indus Towers Ltd.1 | 362,801 | 1,145 | ||||||
ITV PLC1,2 | 755,275 | 1,104 | ||||||
HKBN Ltd.1 | 466,500 | 722 | ||||||
KT Corp. (ADR) | 65,529 | 721 | ||||||
ProSiebenSat.1 Media SE1,2 | 38,716 | 651 | ||||||
Omnicom Group Inc. | 10,004 | 624 | ||||||
Lumen Technologies, Inc. | 39,066 | 381 | ||||||
Zegona Communications PLC1 | 190,674 | 274 | ||||||
|
| |||||||
| 56,070 | ||||||||
|
| |||||||
American Funds Insurance Series 101
Table of Contents
Capital Income Builder (continued)
Common stocks (continued)
| Shares | Value (000) | |||||||
Energy 4.55% | ||||||||
Chevron Corp. | 145,007 | $ | 12,246 | |||||
TC Energy Corp. (CAD denominated) | 168,661 | 6,857 | ||||||
TC Energy Corp. | 50,505 | 2,056 | ||||||
Enbridge Inc. (CAD denominated) | 205,928 | 6,586 | ||||||
Canadian Natural Resources, Ltd. (CAD denominated) | 216,326 | 5,199 | ||||||
Total SE1,4 | 81,796 | 3,528 | ||||||
ConocoPhillips | 73,490 | 2,939 | ||||||
Royal Dutch Shell PLC, Class B1 | 150,315 | 2,590 | ||||||
Royal Dutch Shell PLC, Class B (ADR) | 8,064 | 271 | ||||||
EOG Resources, Inc. | 54,719 | 2,729 | ||||||
BP PLC1 | 719,280 | 2,478 | ||||||
Equitrans Midstream Corp. | 199,833 | 1,606 | ||||||
Gazprom PJSC (ADR)1 | 113,653 | 632 | ||||||
Exxon Mobil Corp. | 4,511 | 186 | ||||||
|
| |||||||
| 49,903 | ||||||||
|
| |||||||
Industrials 4.27% | ||||||||
Raytheon Technologies Corp. | 140,295 | 10,032 | ||||||
United Parcel Service, Inc., Class B | 38,043 | 6,406 | ||||||
VINCI SA1 | 38,230 | 3,804 | ||||||
Singapore Technologies Engineering Ltd1 | 1,141,700 | 3,296 | ||||||
BOC Aviation Ltd.1 | 378,700 | 3,275 | ||||||
Caterpillar Inc. | 14,767 | 2,688 | ||||||
Deutsche Post AG1 | 45,308 | 2,242 | ||||||
Trinity Industries, Inc. | 81,264 | 2,145 | ||||||
RELX PLC1 | 75,368 | 1,854 | ||||||
Cía. de Distribución Integral Logista Holdings, SA, non-registered shares1 | 76,271 | 1,479 | ||||||
Stanley Black & Decker, Inc. | 7,147 | 1,276 | ||||||
Union Pacific Corp. | 6,033 | 1,256 | ||||||
BAE Systems PLC1 | 162,460 | 1,087 | ||||||
ABB Ltd.1 | 36,607 | 1,024 | ||||||
CCR SA, ordinary nominative | 320,739 | 832 | ||||||
ComfortDelGro Corp., Ltd.1 | 643,200 | 813 | ||||||
Lockheed Martin Corp. | 2,118 | 752 | ||||||
ALD SA1 | 52,301 | 735 | ||||||
Cummins Inc. | 2,832 | 643 | ||||||
Melrose Industries PLC1,2 | 200,791 | 490 | ||||||
General Dynamics Corp. | 2,392 | 356 | ||||||
Honeywell International Inc. | 1,235 | 263 | ||||||
L3Harris Technologies, Inc. | 655 | 124 | ||||||
|
| |||||||
| 46,872 | ||||||||
|
| |||||||
Materials 3.88% | ||||||||
Dow Inc. | 143,551 | 7,967 | ||||||
Rio Tinto PLC1 | 93,848 | 7,022 | ||||||
BHP Group PLC1 | 250,488 | 6,601 | ||||||
LyondellBasell Industries NV | 54,261 | 4,974 | ||||||
Vale SA, ordinary nominative | 100,331 | 1,689 | ||||||
Vale SA, ordinary nominative (ADR) | 87,319 | 1,464 | ||||||
Fortescue Metals Group Ltd.1 | 138,322 | 2,501 | ||||||
Evonik Industries AG1 | 74,726 | 2,435 | ||||||
Nutrien Ltd. | 30,705 | 1,479 | ||||||
BASF SE1 | 18,013 | 1,422 | ||||||
Asahi Kasei Corp.1 | 121,900 | 1,254 | ||||||
Amcor PLC (CDI)1 | 90,984 | 1,081 | ||||||
Celanese Corp. | 6,820 | 886 | ||||||
Nexa Resources SA4 | 49,159 | 474 | ||||||
CRH PLC1 | 9,678 | 409 | ||||||
102 American Funds Insurance Series
Table of Contents
Capital Income Builder (continued)
Common stocks (continued)
| Shares | Value (000) | |||||||
Materials (continued) | ||||||||
Linde PLC | 1,401 | $ | 369 | |||||
WestRock Co. | 7,219 | 314 | ||||||
Air Products and Chemicals, Inc. | 704 | 192 | ||||||
|
| |||||||
| 42,533 | ||||||||
|
| |||||||
Consumer discretionary 1.23% | ||||||||
McDonald’s Corp. | 10,713 | 2,299 | ||||||
Kering SA1 | 2,740 | 1,992 | ||||||
Hasbro, Inc. | 17,740 | 1,659 | ||||||
Sands China Ltd.1 | 290,000 | 1,275 | ||||||
Home Depot, Inc. | 4,332 | 1,151 | ||||||
Gree Electric Appliances, Inc. of Zhuhai, Class A1 | 109,338 | 1,038 | ||||||
LVMH Moët Hennessy-Louis Vuitton SE1 | 1,515 | 946 | ||||||
Taylor Wimpey PLC1,2 | 307,380 | 699 | ||||||
Starbucks Corp. | 5,854 | 626 | ||||||
VF Corp. | 6,812 | 582 | ||||||
Industria de Diseño Textil, SA1 | 15,355 | 489 | ||||||
YUM! Brands, Inc. | 3,958 | 430 | ||||||
Cie. Financière Richemont SA, Class A1 | 3,565 | 322 | ||||||
|
| |||||||
| 13,508 | ||||||||
|
| |||||||
Total common stocks (cost: $658,866,000) | 801,638 | |||||||
|
| |||||||
Preferred securities 0.18% | ||||||||
Information technology 0.18% | ||||||||
Samsung Electronics Co., Ltd., nonvoting preferred shares1 | 29,272 | 1,987 | ||||||
|
| |||||||
Total preferred securities (cost: $1,093,000) | 1,987 | |||||||
|
| |||||||
Rights & warrants 0.00% | ||||||||
Consumer discretionary 0.00% | ||||||||
Cie. Financière Richemont SA, Class A, warrants, expire 20232 | 7,130 | 2 | ||||||
|
| |||||||
Total rights & warrants (cost: $0) | 2 | |||||||
|
| |||||||
Convertible stocks 1.26% | ||||||||
Utilities 0.57% | ||||||||
Sempra Energy, Series A, convertible preferred shares, 6.00% 2021 | 17,965 | 1,792 | ||||||
NextEra Energy, Inc., convertible preferred units, 4.872% 2022 | 29,485 | 1,745 | ||||||
Dominion Energy, Inc., Series A, convertible preferred shares, 7.25% 2022 | 16,000 | 1,605 | ||||||
American Electric Power Company, Inc., convertible preferred units, 6.125% 2023 | 15,148 | 767 | ||||||
American Electric Power Company, Inc., convertible preferred shares, 6.125% 2022 | 6,400 | 321 | ||||||
|
| |||||||
| 6,230 | ||||||||
|
| |||||||
Information technology 0.35% | ||||||||
Broadcom Inc., Series A, cumulative convertible preferred shares, 8.00% 2022 | 2,746 | 3,906 | ||||||
|
| |||||||
Health care 0.21% | ||||||||
Danaher Corp., Series B, cumulative convertible preferred shares, 5.00% 20234 | 1,745 | 2,270 | ||||||
|
| |||||||
Industrials 0.10% | ||||||||
Stanley Black & Decker, Inc., convertible preferred shares, 5.25% 20224 | 10,100 | 1,130 | ||||||
|
| |||||||
American Funds Insurance Series 103
Table of Contents
Capital Income Builder (continued)
Convertible stocks (continued)
| Shares | Value (000) | |||||||
Consumer discretionary 0.03% | ||||||||
Aptiv PLC, Series A, convertible preferred shares, 5.50% 2023 | 1,948 | $ | 301 | |||||
|
| |||||||
Total convertible stocks (cost: $11,489,000) | 13,837 | |||||||
|
| |||||||
Convertible bonds & notes 0.07% | ||||||||
Principal amount (000) | ||||||||
Consumer discretionary 0.07% | ||||||||
Carnival Corp., convertible notes, 5.75% 20233 | $ | 110 | 261 | |||||
Royal Caribbean Cruises Ltd., convertible notes, 4.25% 20233 | 392 | 523 | ||||||
|
| |||||||
| 784 | ||||||||
|
| |||||||
Total convertible bonds & notes (cost: $540,000) | 784 | |||||||
|
| |||||||
Bonds, notes & other debt instruments 20.79% | ||||||||
U.S. Treasury bonds & notes 9.20% | ||||||||
U.S. Treasury 8.40% | ||||||||
U.S. Treasury 0.125% 2022 | 20,800 | 20,806 | ||||||
U.S. Treasury 0.125% 2022 | 9,600 | 9,601 | ||||||
U.S. Treasury 0.125% 2022 | 5,850 | 5,851 | ||||||
U.S. Treasury 0.125% 2022 | 2,600 | 2,600 | ||||||
U.S. Treasury 0.125% 2022 | 2,500 | 2,501 | ||||||
U.S. Treasury 0.25% 2025 | 7,612 | 7,582 | ||||||
U.S. Treasury 0.375% 2025 | 907 | 910 | ||||||
U.S. Treasury 0.375% 2025 | 850 | 851 | ||||||
U.S. Treasury 2.00% 20255 | 10,000 | 10,773 | ||||||
U.S. Treasury 1.875% 2026 | 6,300 | 6,795 | ||||||
U.S. Treasury 2.00% 20265 | 2,800 | 3,047 | ||||||
U.S. Treasury 0.50% 2027 | 2,900 | 2,892 | ||||||
U.S. Treasury 0.875% 2030 | 3,154 | 3,142 | ||||||
U.S. Treasury 1.125% 20405 | 2,400 | 2,278 | ||||||
U.S. Treasury 1.375% 20505 | 13,332 | 12,475 | ||||||
|
| |||||||
| 92,104 | ||||||||
|
| |||||||
U.S. Treasury inflation-protected securities 0.80% | ||||||||
U.S. Treasury Inflation-Protected Security 0.125% 20256 | 4,133 | 4,445 | ||||||
U.S. Treasury Inflation-Protected Security 0.125% 20306 | 2,226 | 2,484 | ||||||
U.S. Treasury Inflation-Protected Security 0.25% 20505,6 | 1,544 | 1,840 | ||||||
|
| |||||||
| 8,769 | ||||||||
|
| |||||||
Total U.S. Treasury bonds & notes | 100,873 | |||||||
|
| |||||||
Corporate bonds, notes & loans 5.98% | ||||||||
Health care 0.87% | ||||||||
Abbott Laboratories 3.75% 2026 | 240 | 281 | ||||||
AbbVie Inc. 2.95% 2026 | 369 | 409 | ||||||
AbbVie Inc. 4.25% 2049 | 92 | 116 | ||||||
Amgen Inc. 3.375% 2050 | 150 | 168 | ||||||
AstraZeneca PLC 3.375% 2025 | 200 | 225 | ||||||
Becton, Dickinson and Company 3.70% 2027 | 930 | 1,067 | ||||||
Boston Scientific Corp. 2.65% 2030 | 250 | 268 | ||||||
Centene Corp. 4.625% 2029 | 530 | 589 | ||||||
Centene Corp. 3.375% 2030 | 179 | 189 | ||||||
Novartis Capital Corp. 1.75% 2025 | 208 | 218 | ||||||
Novartis Capital Corp. 2.00% 2027 | 120 | 128 | ||||||
Partners HealthCare System, Inc. 3.192% 2049 | 210 | 232 | ||||||
Pfizer Inc. 2.70% 2050 | 425 | 457 | ||||||
Regeneron Pharmaceuticals, Inc. 1.75% 2030 | 54 | 53 | ||||||
Regeneron Pharmaceuticals, Inc. 2.80% 2050 | 109 | 106 | ||||||
Shire PLC 3.20% 2026 | 182 | 204 | ||||||
Takeda Pharmaceutical Company, Ltd. 4.40% 2023 | 1,330 | 1,475 | ||||||
Tenet Healthcare Corp. 7.50% 20253 | 325 | 356 | ||||||
104 American Funds Insurance Series
Table of Contents
Capital Income Builder (continued)
Bonds, notes & other debt instruments (continued)
Principal amount (000) | Value (000) | |||||||
Corporate bonds, notes & loans (continued) | ||||||||
Health care (continued) | ||||||||
Teva Pharmaceutical Finance Co. BV 6.00% 2024 | $ | 700 | $ | 744 | ||||
Teva Pharmaceutical Finance Co. BV 3.15% 2026 | 1,375 | 1,324 | ||||||
Teva Pharmaceutical Finance Co. BV 4.10% 2046 | 300 | 268 | ||||||
Thermo Fisher Scientific Inc. 4.497% 2030 | 95 | 119 | ||||||
UnitedHealth Group Inc. 2.375% 2024 | 35 | 37 | ||||||
UnitedHealth Group Inc. 4.45% 2048 | 170 | 235 | ||||||
Upjohn Inc. 2.70% 20303 | 83 | 88 | ||||||
Upjohn Inc. 3.85% 20403 | 32 | 36 | ||||||
Upjohn Inc. 4.00% 20503 | 70 | 80 | ||||||
|
| |||||||
| 9,472 | ||||||||
|
| |||||||
Energy 0.82% | ||||||||
Apache Corp. 4.25% 2030 | 385 | 405 | ||||||
Baker Hughes, a GE Co. 4.08% 2047 | 37 | 42 | ||||||
BP Capital Markets America Inc. 3.633% 2030 | 360 | 419 | ||||||
BP Capital Markets America Inc. 2.772% 2050 | 90 | 89 | ||||||
BP Capital Markets America Inc. 2.939% 2051 | 80 | 82 | ||||||
Canadian Natural Resources Ltd. 3.85% 2027 | 185 | 208 | ||||||
Canadian Natural Resources Ltd. 2.95% 2030 | 83 | 89 | ||||||
Canadian Natural Resources Ltd. 4.95% 2047 | 91 | 115 | ||||||
Cenovus Energy Inc. 5.40% 2047 | 75 | 88 | ||||||
Cheniere Energy, Inc. 3.70% 2029 | 252 | 281 | ||||||
Concho Resources Inc. 4.30% 2028 | 210 | 248 | ||||||
Enbridge Energy Partners, LP 7.375% 2045 | 37 | 56 | ||||||
Energy Transfer Operating, LP 5.00% 2050 | 361 | 391 | ||||||
Energy Transfer Partners, LP 5.30% 2047 | 60 | 67 | ||||||
Energy Transfer Partners, LP 6.00% 2048 | 161 | 192 | ||||||
Energy Transfer Partners, LP 6.25% 2049 | 150 | 181 | ||||||
Enterprise Products Operating LLC 3.20% 2052 | 24 | 24 | ||||||
EQT Corp. 5.00% 2029 | 35 | 37 | ||||||
Equinor ASA 2.375% 2030 | 365 | 391 | ||||||
Exxon Mobil Corp. 2.995% 2039 | 200 | 217 | ||||||
Exxon Mobil Corp. 3.452% 2051 | 72 | 82 | ||||||
Kinder Morgan, Inc. 5.05% 2046 | 925 | 1,134 | ||||||
MPLX LP 5.50% 2049 | 625 | 823 | ||||||
ONEOK, Inc. 3.10% 2030 | 42 | 45 | ||||||
ONEOK, Inc. 4.95% 2047 | 51 | 57 | ||||||
ONEOK, Inc. 5.20% 2048 | 184 | 215 | ||||||
ONEOK, Inc. 7.15% 2051 | 97 | 134 | ||||||
Pemex Project Funding Master Trust, Series 13, 6.625% 2035 | 150 | 149 | ||||||
Petrobras Global Finance Co. 5.60% 2031 | 150 | 173 | ||||||
Petróleos Mexicanos 7.69% 2050 | 75 | 76 | ||||||
Pioneer Natural Resources Company 1.90% 2030 | 163 | 162 | ||||||
Plains All American Pipeline, LP 3.80% 2030 | 11 | 12 | ||||||
Sabine Pass Liquefaction, LLC 4.50% 20303 | 215 | 255 | ||||||
Shell International Finance BV 2.00% 2024 | 420 | 443 | ||||||
Total Capital International 2.434% 2025 | 175 | 187 | ||||||
Total Capital International 3.127% 2050 | 250 | 271 | ||||||
TransCanada PipeLines Ltd. 4.10% 2030 | 205 | 242 | ||||||
TransCanada PipeLines Ltd. 5.10% 2049 | 425 | 569 | ||||||
Williams Companies, Inc. 3.50% 2030 | 216 | 245 | ||||||
Williams Partners LP 6.30% 2040 | 95 | 126 | ||||||
|
| |||||||
| 9,022 | ||||||||
|
| |||||||
Financials 0.82% | ||||||||
Allstate Corp. 3.85% 2049 | 170 | 214 | ||||||
American International Group, Inc. 4.375% 2050 | 250 | 327 | ||||||
AON Corp. 2.20% 2022 | 249 | 258 | ||||||
Bank of America Corp. 0.81% 2024 (USD-SOFR + 0.74% on 10/24/2023)7 | 150 | 151 | ||||||
Bank of America Corp. 1.922% 2031 (USD-SOFR + 1.37% on 10/24/2030)7 | 1,125 | 1,140 | ||||||
American Funds Insurance Series 105
Table of Contents
Capital Income Builder (continued)
Bonds, notes & other debt instruments (continued)
Principal amount (000) | Value (000) | |||||||
Corporate bonds, notes & loans (continued) | ||||||||
Financials (continued) | ||||||||
Citigroup Inc. 2.572% 2031 (USD-SOFR + 2.107% on 6/3/2030)7 | $ | 540 | $ | 576 | ||||
Credit Suisse Group AG 4.194% 2031 (USD-SOFR + 3.73% on 4/1/2030)3,7 | 500 | 589 | ||||||
Deutsche Bank AG 2.129% 2026 (USD-SOFR + 1.87% on 11/24/2025)7 | 150 | 154 | ||||||
Goldman Sachs Group, Inc. 3.50% 2025 | 177 | 197 | ||||||
Goldman Sachs Group, Inc. 2.60% 2030 | 400 | 431 | ||||||
Hartford Financial Services Group, Inc. 2.80% 2029 | 300 | 326 | ||||||
HSBC Holdings PLC 2.633% 2025 (3-month USD-LIBOR + 1.14% on 11/7/2024)7 | 500 | 532 | ||||||
HSBC Holdings PLC 3.973% 2030 (3-month USD-LIBOR + 1.61% on 5/22/2029)7 | 250 | 289 | ||||||
JPMorgan Chase & Co. 1.764% 2031 (USD-SOFR + 1.05% on 11/19/2030)7 | 120 | 121 | ||||||
JPMorgan Chase & Co. 2.522% 2031 (USD-SOFR + 2.04% on 4/22/2030)7 | 475 | 511 | ||||||
JPMorgan Chase & Co. 2.525% 2041 (USD-SOFR + 1.51% on 11/19/2040)7 | 75 | 77 | ||||||
JPMorgan Chase & Co. 3.109% 2051 (USD-SOFR + 3.109% on 4/22/2050)7 | 241 | 268 | ||||||
Lloyds Banking Group PLC 3.87% 2025 (UST Yield Curve Rate T Note Constant Maturity 1-year + 3.50% on 7/9/2024)7 | 390 | 430 | ||||||
MetLife, Inc. 4.55% 2030 | 190 | 238 | ||||||
Metropolitan Life Global Funding I 1.95% 20233 | 380 | 392 | ||||||
Mitsubishi UFJ Financial Group, Inc. 3.195% 2029 | 290 | 327 | ||||||
Morgan Stanley 3.70% 2024 | 260 | 290 | ||||||
Morgan Stanley 1.794% 2032 (USD-SOFR + 1.034% on 2/13/2031)7 | 100 | 101 | ||||||
Morgan Stanley 5.597% 2051 (USD-SOFR + 4.84% on 3/24/2050)7 | 115 | 185 | ||||||
Navient Corp. 5.00% 2027 | 150 | 152 | ||||||
New York Life Global Funding 3.00% 20283 | 150 | 168 | ||||||
New York Life Insurance Company 3.75% 20503 | 62 | 74 | ||||||
Travelers Companies, Inc. 4.10% 2049 | 130 | 171 | ||||||
Wells Fargo & Company 4.60% 2021 | 300 | 303 | ||||||
|
| |||||||
| 8,992 | ||||||||
|
| |||||||
Communication services 0.77% | ||||||||
Alphabet Inc. 2.05% 2050 | 80 | 76 | ||||||
AT&T Inc. 2.25% 2032 | 75 | 76 | ||||||
AT&T Inc. 3.50% 2041 | 75 | 81 | ||||||
AT&T Inc. 3.50% 20533 | 624 | 624 | ||||||
CCO Holdings LLC and CCO Holdings Capital Corp. 5.125% 20273 | 235 | 250 | ||||||
CCO Holdings LLC and CCO Holdings Capital Corp. 2.80% 2031 | 158 | 167 | ||||||
CCO Holdings LLC and CCO Holdings Capital Corp. 4.25% 20313 | 360 | 380 | ||||||
CCO Holdings LLC and CCO Holdings Capital Corp. 4.50% 20323 | 950 | 1,016 | ||||||
CCO Holdings LLC and CCO Holdings Capital Corp. 5.125% 2049 | 65 | 79 | ||||||
CCO Holdings LLC and CCO Holdings Capital Corp. 3.70% 2051 | 100 | 104 | ||||||
CenturyLink, Inc. 7.50% 2024 | 300 | 340 | ||||||
Comcast Corp. 3.75% 2040 | 138 | 166 | ||||||
Comcast Corp. 2.80% 2051 | 200 | 208 | ||||||
Discovery Communications, Inc. 4.65% 2050 | 139 | 174 | ||||||
NBCUniversal Enterprise, Inc., junior subordinated, 5.25% 20493 | 630 | 643 | ||||||
Sprint Corp. 11.50% 2021 | 1,425 | 1,549 | ||||||
Sprint Corp. 6.875% 2028 | 325 | 429 | ||||||
T-Mobile US, Inc. 3.875% 20303 | 625 | 725 | ||||||
T-Mobile US, Inc. 3.00% 20413 | 100 | 104 | ||||||
T-Mobile US, Inc. 3.30% 20513 | 186 | 192 | ||||||
Verizon Communications Inc. 4.329% 2028 | 192 | 231 | ||||||
Verizon Communications Inc. 3.875% 2029 | 25 | 30 | ||||||
Verizon Communications Inc. 4.016% 2029 | 215 | 255 | ||||||
Verizon Communications Inc. 1.75% 2031 | 98 | 98 | ||||||
Verizon Communications Inc. 2.875% 2050 | 125 | 126 | ||||||
Vodafone Group PLC 4.25% 2050 | 75 | 93 | ||||||
Walt Disney Co. 4.625% 2040 | 120 | 160 | ||||||
|
| |||||||
| 8,376 | ||||||||
|
| |||||||
106 American Funds Insurance Series
Table of Contents
Capital Income Builder (continued)
Bonds, notes & other debt instruments (continued)
Principal amount (000) | Value (000) | |||||||
Corporate bonds, notes & loans (continued) | ||||||||
Utilities 0.67% | ||||||||
AEP Transmission Co. LLC 3.15% 2049 | $ | 60 | $ | 67 | ||||
AEP Transmission Co. LLC 3.80% 2049 | 45 | 56 | ||||||
AEP Transmission Co. LLC 3.65% 2050 | 75 | 91 | ||||||
American Electric Power Company, Inc. 3.65% 2021 | 300 | 309 | ||||||
American Electric Power Company, Inc. 1.00% 2025 | 25 | 25 | ||||||
CenterPoint Energy, Inc. 2.95% 2030 | 345 | 376 | ||||||
Connecticut Light and Power Co. 3.20% 2027 | 445 | 500 | ||||||
Consumers Energy Co. 3.10% 2050 | 159 | 184 | ||||||
Duke Energy Florida, LLC 2.50% 2029 | 430 | 470 | ||||||
Edison International 3.55% 2024 | 375 | 404 | ||||||
Edison International 5.75% 2027 | 158 | 189 | ||||||
Edison International 4.125% 2028 | 332 | 370 | ||||||
Emera Inc. 6.75% 2076 (3-month USD-LIBOR + 5.44% on 6/15/2026)7 | 120 | 140 | ||||||
Evergy Metro, Inc. 2.25% 2030 | 125 | 132 | ||||||
FirstEnergy Corp. 3.90% 2027 (4.40% on 1/16/2021)7 | 50 | 55 | ||||||
FirstEnergy Corp. 2.25% 2030 | 162 | 157 | ||||||
FirstEnergy Corp. 2.65% 2030 | 493 | 495 | ||||||
Jersey Central Power & Light Co. 4.30% 20263 | 115 | 129 | ||||||
NSTAR Electric Co. 3.95% 2030 | 50 | 61 | ||||||
Pacific Gas and Electric Co. 2.95% 2026 | 97 | 103 | ||||||
Pacific Gas and Electric Co. 3.75% 2028 | 105 | 115 | ||||||
Pacific Gas and Electric Co. 4.65% 2028 | 284 | 325 | ||||||
Pacific Gas and Electric Co. 2.50% 2031 | 450 | 451 | ||||||
Pacific Gas and Electric Co. 3.30% 2040 | 100 | 100 | ||||||
Pacific Gas and Electric Co. 3.50% 2050 | 325 | 324 | ||||||
Public Service Company of Colorado 3.80% 2047 | 20 | 25 | ||||||
San Diego Gas & Electric Co. 3.75% 2047 | 227 | 266 | ||||||
San Diego Gas & Electric Co. 4.10% 2049 | 115 | 144 | ||||||
Southern California Edison Co. 4.125% 2048 | 235 | 281 | ||||||
Southern California Edison Co. 3.65% 2050 | 298 | 339 | ||||||
Southern California Edison Co., Series C, 3.60% 2045 | 256 | 284 | ||||||
Virginia Electric and Power Co. 2.45% 2050 | 25 | 25 | ||||||
Xcel Energy Inc. 2.60% 2029 | 175 | 189 | ||||||
Xcel Energy Inc. 3.50% 2049 | 145 | 170 | ||||||
|
| |||||||
| 7,351 | ||||||||
|
| |||||||
Consumer discretionary 0.63% | ||||||||
Amazon.com, Inc. 2.50% 2050 | 75 | 78 | ||||||
Amazon.com, Inc. 2.70% 2060 | 30 | 32 | ||||||
Bayerische Motoren Werke AG 4.15% 20303 | 290 | 351 | ||||||
Carnival Corp. 11.50% 20233 | 775 | 897 | ||||||
Carnival Corp. 10.50% 20263 | 165 | 192 | ||||||
Ford Motor Co. 9.625% 2030 | 50 | 71 | ||||||
General Motors Company 5.95% 2049 | 90 | 122 | ||||||
Home Depot, Inc. 3.35% 2050 | 350 | 417 | ||||||
PetSmart, Inc. 7.125% 20233 | 125 | 125 | ||||||
Royal Caribbean Cruises Ltd. 10.875% 20233 | 600 | 684 | ||||||
Royal Caribbean Cruises Ltd. 11.50% 20253 | 1,210 | 1,416 | ||||||
Toyota Motor Credit Corp. 2.15% 2022 | 505 | 521 | ||||||
Toyota Motor Credit Corp. 2.60% 2022 | 856 | 876 | ||||||
Toyota Motor Credit Corp. 3.00% 2025 | 1,010 | 1,111 | ||||||
|
| |||||||
| 6,893 | ||||||||
|
| |||||||
Consumer staples 0.46% | ||||||||
Altria Group, Inc. 5.95% 2049 | 327 | 458 | ||||||
Anheuser-Busch Co. / InBev Worldwide 4.90% 2046 | 420 | 548 | ||||||
British American Tobacco PLC 3.215% 2026 | 250 | 276 | ||||||
British American Tobacco PLC 3.557% 2027 | 660 | 735 | ||||||
British American Tobacco PLC 4.906% 2030 | 350 | 423 | ||||||
British American Tobacco PLC 4.54% 2047 | 73 | 81 | ||||||
American Funds Insurance Series 107
Table of Contents
Capital Income Builder (continued)
Bonds, notes & other debt instruments (continued)
| Principal amount (000) | Value (000) | |||||||
Corporate bonds, notes & loans (continued) | ||||||||
Consumer staples (continued) | ||||||||
British American Tobacco PLC 4.758% 2049 | $ | 130 | $ | 151 | ||||
Coca-Cola Co. 1.375% 2031 | 100 | 100 | ||||||
Coca-Cola Co. 2.50% 2051 | 65 | 67 | ||||||
Conagra Brands, Inc. 5.30% 2038 | 18 | 24 | ||||||
Conagra Brands, Inc. 5.40% 2048 | 52 | 74 | ||||||
Constellation Brands, Inc. 3.15% 2029 | 190 | 212 | ||||||
Constellation Brands, Inc. 2.875% 2030 | 210 | 230 | ||||||
Keurig Dr Pepper Inc. 3.20% 2030 | 25 | 28 | ||||||
Keurig Dr Pepper Inc. 5.085% 2048 | 64 | 91 | ||||||
Keurig Dr Pepper Inc. 3.80% 2050 | 51 | 61 | ||||||
Kimberly-Clark Corp. 3.10% 2030 | 56 | 65 | ||||||
Kraft Heinz Company 3.00% 2026 | 100 | 104 | ||||||
Molson Coors Brewing Co. 4.20% 2046 | 65 | 75 | ||||||
PepsiCo, Inc. 1.40% 2031 | 40 | 40 | ||||||
PepsiCo, Inc. 3.625% 2050 | 240 | 305 | ||||||
Philip Morris International Inc. 3.375% 2029 | 450 | 516 | ||||||
Procter & Gamble Company 0.55% 2025 | 185 | 187 | ||||||
Wal-Mart Stores, Inc. 2.85% 2024 | 210 | 227 | ||||||
|
| |||||||
| 5,078 | ||||||||
|
| |||||||
Industrials 0.45% | ||||||||
Boeing Company 2.70% 2022 | 300 | 308 | ||||||
Boeing Company 2.75% 2026 | 91 | 96 | ||||||
Boeing Company 2.95% 2030 | 190 | 197 | ||||||
Boeing Company 3.60% 2034 | 90 | 95 | ||||||
Boeing Company 5.805% 2050 | 235 | 325 | ||||||
Carrier Global Corp. 2.242% 2025 | 102 | 108 | ||||||
Carrier Global Corp. 2.493% 2027 | 84 | 91 | ||||||
Carrier Global Corp. 2.722% 2030 | 74 | 79 | ||||||
CSX Corp. 4.75% 2048 | 50 | 68 | ||||||
CSX Corp. 3.35% 2049 | 310 | 354 | ||||||
CSX Corp. 2.50% 2051 | 50 | 50 | ||||||
General Electric Co. 3.45% 2027 | 50 | 56 | ||||||
General Electric Co. 4.25% 2040 | 75 | 89 | ||||||
General Electric Co. 4.35% 2050 | 50 | 61 | ||||||
Honeywell International Inc. 2.15% 2022 | 305 | 313 | ||||||
Honeywell International Inc. 2.30% 2024 | 175 | 187 | ||||||
Honeywell International Inc. 2.70% 2029 | 70 | 78 | ||||||
Norfolk Southern Corp. 3.00% 2022 | 224 | 230 | ||||||
Raytheon Technologies Corp. 3.125% 2050 | 125 | 138 | ||||||
TransDigm Inc. 6.50% 2024 | 455 | 464 | ||||||
TransDigm Inc. 8.00% 20253 | 230 | 255 | ||||||
TransDigm Inc. 6.25% 20263 | 445 | 474 | ||||||
Union Pacific Corp. 3.70% 2029 | 430 | 499 | ||||||
Union Pacific Corp. 4.30% 2049 | 110 | 144 | ||||||
Union Pacific Corp. 3.25% 2050 | 53 | 60 | ||||||
Union Pacific Corp. 3.95% 2059 | 45 | 56 | ||||||
Westinghouse Air Brake Technologies Corp. 4.40% 20247 | 39 | 43 | ||||||
|
| |||||||
| 4,918 | ||||||||
|
| |||||||
Information technology 0.35% | ||||||||
Adobe Inc. 2.30% 2030 | 645 | 698 | ||||||
Apple Inc. 0.55% 2025 | 125 | 126 | ||||||
Apple Inc. 2.40% 2050 | 75 | 77 | ||||||
Broadcom Inc. 5.00% 2030 | 420 | 511 | ||||||
Broadcom Ltd. 3.875% 2027 | 370 | 416 | ||||||
Fiserv, Inc. 3.50% 2029 | 870 | 995 | ||||||
Intuit Inc. 0.95% 2025 | 50 | 51 | ||||||
Lenovo Group Ltd. 5.875% 2025 | 400 | 461 | ||||||
108 American Funds Insurance Series
Table of Contents
Capital Income Builder (continued)
Bonds, notes & other debt instruments (continued)
Principal amount (000) | Value (000) | |||||||
Corporate bonds, notes & loans (continued) | ||||||||
Information technology (continued) | ||||||||
Microsoft Corp. 2.525% 2050 | $ | 227 | $ | 239 | ||||
Oracle Corp. 3.60% 2050 | 150 | 175 | ||||||
ServiceNow, Inc. 1.40% 2030 | 130 | 127 | ||||||
|
| |||||||
| 3,876 | ||||||||
|
| |||||||
Real estate 0.07% | ||||||||
Corporate Office Properties LP 2.25% 2026 | 68 | 71 | ||||||
Equinix, Inc. 2.90% 2026 | 266 | 291 | ||||||
Equinix, Inc. 1.55% 2028 | 25 | 26 | ||||||
Equinix, Inc. 3.20% 2029 | 288 | 318 | ||||||
Equinix, Inc. 3.00% 2050 | 18 | 18 | ||||||
Equinix, Inc. 2.95% 2051 | 25 | 25 | ||||||
Westfield Corp. Ltd. 3.50% 20293 | 54 | 57 | ||||||
|
| |||||||
| 806 | ||||||||
|
| |||||||
Materials 0.07% | ||||||||
Anglo American Capital PLC 5.625% 20303 | 240 | 306 | ||||||
Braskem SA 4.50% 20303 | 200 | 206 | ||||||
Dow Chemical Co. 4.80% 2049 | 67 | 90 | ||||||
LYB International Finance III, LLC 2.25% 2030 | 32 | 33 | ||||||
LYB International Finance III, LLC 4.20% 2050 | 75 | 88 | ||||||
LYB International Finance III, LLC 3.625% 2051 | 52 | 57 | ||||||
|
| |||||||
| 780 | ||||||||
|
| |||||||
Total corporate bonds, notes & loans | 65,564 | |||||||
|
| |||||||
Mortgage-backed obligations 5.07% | ||||||||
Federal agency mortgage-backed obligations 4.46% | ||||||||
Fannie Mae Pool #695412 5.00% 20338 | — | 9 | — | 9 | ||||
Fannie Mae Pool #MA4124 2.50% 20358 | 2,633 | 2,755 | ||||||
Fannie Mae Pool #AD3566 5.00% 20358 | 2 | 2 | ||||||
Fannie Mae Pool #MA4228 1.50% 20368 | 2,670 | 2,749 | ||||||
Fannie Mae Pool #AC0794 5.00% 20398 | 10 | 11 | ||||||
Fannie Mae Pool #931768 5.00% 20398 | 2 | 2 | ||||||
Fannie Mae Pool #AE0311 3.50% 20408 | 17 | 18 | ||||||
Fannie Mae Pool #932606 5.00% 20408 | 5 | 6 | ||||||
Fannie Mae Pool #AJ1873 4.00% 20418 | 7 | 8 | ||||||
Fannie Mae Pool #AE1248 5.00% 20418 | 11 | 13 | ||||||
Fannie Mae Pool #AE1274 5.00% 20418 | 9 | 10 | ||||||
Fannie Mae Pool #AE1277 5.00% 20418 | 5 | 6 | ||||||
Fannie Mae Pool #AE1283 5.00% 20418 | 3 | 4 | ||||||
Fannie Mae Pool #AE1290 5.00% 20428 | 6 | 7 | ||||||
Fannie Mae Pool #AL3829 3.50% 20438 | 64 | 70 | ||||||
Fannie Mae Pool #AT7161 3.50% 20438 | 29 | 31 | ||||||
Fannie Mae Pool #AR1512 3.50% 20438 | 14 | 15 | ||||||
Fannie Mae Pool #AT0412 3.50% 20438 | 7 | 8 | ||||||
Fannie Mae Pool #AT3954 3.50% 20438 | 4 | 4 | ||||||
Fannie Mae Pool #AT0300 3.50% 20438 | 3 | 3 | ||||||
Fannie Mae Pool #AY1829 3.50% 20448 | 5 | 6 | ||||||
Fannie Mae Pool #AW8240 3.50% 20448 | 1 | 1 | ||||||
Fannie Mae Pool #BE5017 3.50% 20458 | 36 | 39 | ||||||
Fannie Mae Pool #BE5009 3.50% 20458 | 29 | 31 | ||||||
Fannie Mae Pool #BE8740 3.50% 20478 | 33 | 36 | ||||||
Fannie Mae Pool #BE8742 3.50% 20478 | 10 | 11 | ||||||
Fannie Mae Pool #BH2848 3.50% 20478 | 5 | 5 | ||||||
Fannie Mae Pool #BH2847 3.50% 20478 | 3 | 4 | ||||||
Fannie Mae Pool #BH2846 3.50% 20478 | 4 | 4 | ||||||
Fannie Mae Pool #BJ5015 4.00% 20478 | 79 | 87 | ||||||
Fannie Mae Pool #BH3122 4.00% 20478 | 3 | 3 | ||||||
Fannie Mae Pool #BJ4901 3.50% 20488 | 23 | 25 | ||||||
Fannie Mae Pool #CA2850 4.00% 20488 | 91 | 102 | ||||||
American Funds Insurance Series 109
Table of Contents
Capital Income Builder (continued)
Bonds, notes & other debt instruments (continued)
| Principal amount (000) | Value (000) | |||||||
Mortgage-backed obligations (continued) | ||||||||
Federal agency mortgage-backed obligations (continued) | ||||||||
Fannie Mae Pool #BK6840 4.00% 20488 | $ | 51 | $ | 55 | ||||
Fannie Mae Pool #BK5232 4.00% 20488 | 40 | 45 | ||||||
Fannie Mae Pool #BK9743 4.00% 20488 | 14 | 15 | ||||||
Fannie Mae Pool #CA2804 4.50% 20488 | 654 | 709 | ||||||
Fannie Mae Pool #BK7665 4.50% 20488 | 336 | 373 | ||||||
Fannie Mae Pool #BK0951 4.50% 20488 | 257 | 288 | ||||||
Fannie Mae Pool #BK9761 4.50% 20488 | 14 | 15 | ||||||
Fannie Mae Pool #CA4151 3.50% 20498 | 318 | 350 | ||||||
Fannie Mae Pool #BJ8411 3.50% 20498 | 67 | 73 | ||||||
Fannie Mae Pool #CA5540 3.00% 20508 | 5,289 | 5,632 | ||||||
Freddie Mac Pool #SB8083 1.50% 20368 | 285 | 294 | ||||||
Freddie Mac Pool #Q18236 3.50% 20438 | 29 | 31 | ||||||
Freddie Mac Pool #Q19133 3.50% 20438 | 18 | 20 | ||||||
Freddie Mac Pool #Q17696 3.50% 20438 | 16 | 18 | ||||||
Freddie Mac Pool #Q15874 4.00% 20438 | 2 | 2 | ||||||
Freddie Mac Pool #Q52069 3.50% 20478 | 48 | 52 | ||||||
Freddie Mac Pool #Q55056 3.50% 20488 | 60 | 65 | ||||||
Freddie Mac Pool #Q54709 3.50% 20488 | 36 | 39 | ||||||
Freddie Mac Pool #Q54701 3.50% 20488 | 34 | 37 | ||||||
Freddie Mac Pool #Q54782 3.50% 20488 | 30 | 32 | ||||||
Freddie Mac Pool #Q54781 3.50% 20488 | 27 | 30 | ||||||
Freddie Mac Pool #Q54700 3.50% 20488 | 26 | 29 | ||||||
Freddie Mac Pool #Q55060 3.50% 20488 | 19 | 20 | ||||||
Freddie Mac Pool #Q56591 3.50% 20488 | 18 | 19 | ||||||
Freddie Mac Pool #Q56590 3.50% 20488 | 17 | 18 | ||||||
Freddie Mac Pool #Q56589 3.50% 20488 | 16 | 17 | ||||||
Freddie Mac Pool #Q54698 3.50% 20488 | 14 | 15 | ||||||
Freddie Mac Pool #Q54699 3.50% 20488 | 13 | 14 | ||||||
Freddie Mac Pool #Q54831 3.50% 20488 | 9 | 10 | ||||||
Freddie Mac Pool #G67711 4.00% 20488 | 440 | 486 | ||||||
Freddie Mac Pool #Q56599 4.00% 20488 | 57 | 63 | ||||||
Freddie Mac Pool #Q56175 4.00% 20488 | 43 | 47 | ||||||
Freddie Mac Pool #Q55971 4.00% 20488 | 38 | 42 | ||||||
Freddie Mac Pool #Q56576 4.00% 20488 | 29 | 31 | ||||||
Freddie Mac Pool #Q55970 4.00% 20488 | 19 | 21 | ||||||
Freddie Mac Pool #Q58411 4.50% 20488 | 116 | 129 | ||||||
Freddie Mac Pool #Q58436 4.50% 20488 | 52 | 59 | ||||||
Freddie Mac Pool #Q58378 4.50% 20488 | 43 | 48 | ||||||
Freddie Mac Pool #Q57242 4.50% 20488 | 31 | 34 | ||||||
Freddie Mac Pool #RA1463 3.50% 20498 | 216 | 238 | ||||||
Freddie Mac Pool #QA2748 3.50% 20498 | 29 | 32 | ||||||
Freddie Mac Pool #SD7512 3.00% 20508 | 6,954 | 7,446 | ||||||
Freddie Mac Seasoned Credit Risk Transfer Trust, Series 2017-2, Class MA, 3.00% 20568 | 390 | 418 | ||||||
Freddie Mac Seasoned Credit Risk Transfer Trust, Series 2017-2, Class HA, 3.00% 20568,10 | 390 | 410 | ||||||
Freddie Mac Seasoned Credit Risk Transfer Trust, Series 2017-1, Class HA, 3.00% 20568,10 | 193 | 203 | ||||||
Freddie Mac Seasoned Credit Risk Transfer Trust, Series 2017-4, Class HT, 3.25% 20578,10 | 149 | 162 | ||||||
Freddie Mac Seasoned Credit Risk Transfer Trust, Series 2017-4, Class MT, 3.50% 20578 | 121 | 132 | ||||||
Freddie Mac Seasoned Credit Risk Transfer Trust, Series 2018-3, Class MA, 3.50% 20578 | 36 | 39 | ||||||
Freddie Mac Seasoned Credit Risk Transfer Trust, Series 2019-1, Class MT, 3.50% 20588 | 1,422 | 1,553 | ||||||
Freddie Mac Seasoned Credit Risk Transfer Trust, Series 2019-2, Class MA, 3.50% 20588 | 1,026 | 1,118 | ||||||
Freddie Mac Seasoned Credit Risk Transfer Trust, Series 2019-1, Class MA, 3.50% 20588 | 715 | 777 | ||||||
Freddie Mac Seasoned Credit Risk Transfer Trust, Series 2019-3, Class MA, 3.50% 20588 | 34 | 37 | ||||||
Freddie Mac Seasoned Credit Risk Transfer Trust, Series 2019-3, Class MT, 3.50% 20588 | 15 | 16 | ||||||
Freddie Mac Seasoned Loan Structured Transaction Trust, Series 2018-2, Class A1, 3.50% 20288 | 1,440 | 1,524 | ||||||
Freddie Mac Seasoned Loan Structured Transaction Trust, Series 2019-2, Class A1C, 2.75% 20298 | 2,121 | 2,232 | ||||||
Government National Mortgage Assn. 2.00% 20518,11 | 3,390 | 3,533 | ||||||
Government National Mortgage Assn. 2.00% 20518,11 | 1,710 | 1,786 | ||||||
110 American Funds Insurance Series
Table of Contents
Capital Income Builder (continued)
Bonds, notes & other debt instruments (continued)
| Principal amount (000) | Value (000) | |||||||
Mortgage-backed obligations (continued) | ||||||||
Federal agency mortgage-backed obligations (continued) | ||||||||
Government National Mortgage Assn. 2.50% 20518,11 | $ | 2,650 | $ | 2,794 | ||||
Government National Mortgage Assn. 3.50% 20518,11 | 21 | 22 | ||||||
Government National Mortgage Assn. 3.50% 20518,11 | 21 | 22 | ||||||
Government National Mortgage Assn. Pool #MA5764 4.50% 20498 | 1,476 | 1,597 | ||||||
Government National Mortgage Assn. Pool #MA5877 4.50% 20498 | 165 | 179 | ||||||
Government National Mortgage Assn. Pool #694836 5.661% 20598 | 1 | 1 | ||||||
Government National Mortgage Assn. Pool #765152 4.14% 20618 | — | 9 | — | 9 | ||||
Government National Mortgage Assn. Pool #766525 4.70% 20628 | — | 9 | — | 9 | ||||
Government National Mortgage Assn. Pool #777452 3.676% 20638 | 6 | 7 | ||||||
Government National Mortgage Assn. Pool #767639 3.913% 20638 | 9 | 9 | ||||||
Government National Mortgage Assn. Pool #AA1709 4.343% 20638 | 4 | 4 | ||||||
Government National Mortgage Assn. Pool #725893 5.20% 20648 | 1 | 1 | ||||||
Government National Mortgage Assn. Pool #AA7554 6.64% 20648 | 2 | 2 | ||||||
Uniform Mortgage-Backed Security 1.50% 20368,11 | 1,632 | 1,676 | ||||||
Uniform Mortgage-Backed Security 2.00% 20368,11 | 2,100 | 2,193 | ||||||
Uniform Mortgage-Backed Security 3.50% 20518,11 | 1,775 | 1,879 | ||||||
Uniform Mortgage-Backed Security 4.50% 20518,11 | 1,477 | 1,603 | ||||||
|
| |||||||
| 48,998 | ||||||||
|
| |||||||
Collateralized mortgage-backed obligations (privately originated) 0.45% | ||||||||
Cascade Funding Mortgage Trust, Series 2019-HB1, Class A, 2.386% 20293,8,10 | 295 | 297 | ||||||
Cascade Funding Mortgage Trust, Series 2020-HB4, Class A, 0.946% 20303,8,10 | 194 | 194 | ||||||
Citigroup Mortgage Loan Trust Inc., Series 2020-EXP1, Class A1A, 1.804% 20603,8,10 | 75 | 76 | ||||||
Finance of America HECM Buyout, Series 2020-HB1, Class A, 2.012% 20303,8,10 | 592 | 597 | ||||||
Legacy Mortgage Asset Trust, Series 2019-GS5, Class A1, 3.20% 20593,8,10 | 213 | 215 | ||||||
Legacy Mortgage Asset Trust, Series 2019-GS2, Class A1, 3.75% 20593,8,10 | 186 | 186 | ||||||
Mello Warehouse Securitization Trust, Series 2019-2, Class A, (1-month USD-LIBOR + 0.75%) 0.898% 20523,8,10 | 1,000 | 1,001 | ||||||
Mello Warehouse Securitization Trust, Series 2020-2, Class A, (1-month USD-LIBOR + 0.80%) 0.996% 20533,8,10 | 175 | 175 | ||||||
Mello Warehouse Securitization Trust, Series 2020-1, Class A, (1-month USD-LIBOR + 0.90%) 1.048% 20533,8,10 | 279 | 280 | ||||||
Nationstar HECM Loan Trust, Series 2019-2A, Class A, 2.272% 20293,8,10 | 82 | 83 | ||||||
Nationstar HECM Loan Trust, Series 2019-1A, Class A, 2.651% 20293,8,10 | 58 | 58 | ||||||
New York Mortgage Trust, Series 2020-SP1, Class A1, 3.962% 20603,8 | 302 | 305 | ||||||
Towd Point Mortgage Trust, Series 2016-5, Class A1, 2.50% 20563,8,10 | 106 | 108 | ||||||
Towd Point Mortgage Trust, Series 2017-3, Class A1, 2.75% 20573,8,10 | 115 | 119 | ||||||
Towd Point Mortgage Trust, Series 2017-6, Class A1, 2.75% 20573,8,10 | 94 | 97 | ||||||
Towd Point Mortgage Trust, Series 2018-2, Class A1, 3.25% 20583,8,10 | 261 | 274 | ||||||
Towd Point Mortgage Trust, Series 2018-5, Class A1A, 3.25% 20583,8,10 | 63 | 66 | ||||||
Towd Point Mortgage Trust, Series 2020-4, Class A1, 1.75% 20603,8 | 787 | 806 | ||||||
|
| |||||||
| 4,937 | ||||||||
|
| |||||||
Commercial mortgage-backed securities 0.16% | ||||||||
GS Mortgage Securities Trust, Series 2018-HULA, Class A, 1.079% 20253,8,10 | 243 | 239 | ||||||
Hawaii Hotel Trust, Series 2019-MAUI, Class A, (1-month USD-LIBOR + 1.15%) 1.309% 20383,8,10 | 300 | 299 | ||||||
MRA Issuance Trust, Series 2020-10, Class A, (1-month USD-LIBOR + 1.75%) 2.25% 20211,3,8,10 | 1,057 | 1,057 | ||||||
Multi Family Connecticut Avenue Securities, Series 2019-1, Class M10, (1-month USD-LIBOR + 3.25%) 3.398% 20493,8,10 | 150 | 141 | ||||||
|
| |||||||
| 1,736 | ||||||||
|
| |||||||
Total mortgage-backed obligations | 55,671 | |||||||
|
| |||||||
Asset-backed obligations 0.35% | ||||||||
Aesop Funding LLC, Series 2020-2, Class A, 2.02% 20273,8 | 297 | 303 | ||||||
Aesop Funding LLC, Series 2020-2A, Class B, 2.96% 20273,8 | 100 | 102 | ||||||
CF Hippolyta LLC, Series 2020-1, Class A1, 1.69% 20603,8 | 372 | 380 | ||||||
CF Hippolyta LLC, Series 2020-1, Class A2, 1.99% 20603,8 | 95 | 97 | ||||||
American Funds Insurance Series 111
Table of Contents
Capital Income Builder (continued)
Bonds, notes & other debt instruments (continued)
Principal amount (000) | Value (000) | |||||||
Asset-backed obligations (continued) | ||||||||
CF Hippolyta LLC, Series 2020-1, Class B1, 2.28% 20603,8 | $ | 95 | $ | 97 | ||||
CF Hippolyta LLC, Series 2020-1, Class B2, 2.60% 20603,8 | 95 | 97 | ||||||
Drivetime Auto Owner Trust, Series 2019-3, Class A, 2.55% 20223,8 | 40 | 40 | ||||||
Drivetime Auto Owner Trust, Series 2020-1, Class A, 1.94% 20233,8 | 222 | 223 | ||||||
Exeter Automobile Receivables Trust, Series 2019-4A, Class A, 2.18% 20233,8 | 96 | 97 | ||||||
FirstKey Homes Trust, Series 2020-SFR2, Class A, 1.266% 20373,8 | 425 | 428 | ||||||
GCI Funding I LLC, Series 2020-1, Class A, 2.82% 20453,8 | 678 | 682 | ||||||
Global SC Finance V SRL, Series 2019-1A, Class B, 4.81% 20393,8 | 172 | 173 | ||||||
OSW Structured Asset Trust, Series 2020-RPL1, Class A1, 3.072% 20603,8,10 | 226 | 231 | ||||||
Westlake Automobile Receivables Trust, Series 2019-3A, Class A2, 2.15% 20233,8 | 845 | 851 | ||||||
|
| |||||||
| 3,801 | ||||||||
|
| |||||||
Bonds & notes of governments & government agencies outside the U.S. 0.13% | ||||||||
Portuguese Republic 5.125% 2024 | 18 | 21 | ||||||
Qatar (State of) 4.50% 2028 | 200 | 243 | ||||||
Saudi Arabia (Kingdom of) 3.625% 2028 | 200 | 225 | ||||||
United Mexican States, Series M, 6.50% 2021 | MXN | 15,000 | 760 | |||||
United Mexican States 3.25% 2030 | $ | 200 | 216 | |||||
|
| |||||||
| 1,465 | ||||||||
|
| |||||||
Municipals 0.06% | ||||||||
Illinois 0.02% | ||||||||
G.O. Bonds, Pension Funding Series 2003, 5.10% 2033 | 225 | 242 | ||||||
|
| |||||||
South Carolina 0.04% | ||||||||
Public Service Auth., Rev. Ref. Obligations (Santee Cooper), Series 2016-C, 5.00% 2035 | 350 | 429 | ||||||
|
| |||||||
Total municipals | 671 | |||||||
|
| |||||||
Total bonds, notes & other debt instruments (cost: $218,849,000) | 228,045 | |||||||
|
| |||||||
Short-term securities 5.28% | ||||||||
| Shares | ||||||||
Money market investments 5.28% | ||||||||
Capital Group Central Cash Fund 0.12%12,13 | 567,564 | 56,762 | ||||||
Goldman Sachs Financial Square Government Fund, Institutional Shares 0.02%12,14 | 1,184,688 | 1,185 | ||||||
|
| |||||||
Total short-term securities (cost: $57,947,000) | 57,947 | |||||||
|
| |||||||
Total investment securities 100.66% (cost: $948,784,000) | 1,104,240 | |||||||
Other assets less liabilities (0.66)% | (7,288 | ) | ||||||
|
| |||||||
Net assets 100.00% | $ | 1,096,952 | ||||||
|
| |||||||
Futures contracts
Contracts | Type | Number of contracts | Expiration | Notional amount15 (000) | Value at 12/31/202016 (000) | Unrealized (depreciation) appreciation at 12/31/2020 (000) | ||||||||||||||||||
90 Day Euro Dollar Futures | Short | 80 | March 2021 | $ | (20,000 | ) | $ | (19,966 | ) | $ | (13 | ) | ||||||||||||
2 Year U.S. Treasury Note Futures | Short | 8 | April 2021 | (1,600 | ) | (1,768 | ) | (1 | ) | |||||||||||||||
5 Year U.S. Treasury Note Futures | Long | 83 | April 2021 | 8,300 | 10,472 | 23 | ||||||||||||||||||
10 Year U.S. Treasury Note Futures | Long | 14 | March 2021 | 1,400 | 1,933 | 2 | ||||||||||||||||||
10 Year Ultra U.S. Treasury Note Futures | Short | 38 | March 2021 | (3,800 | ) | (5,942 | ) | 14 | ||||||||||||||||
112 American Funds Insurance Series
Table of Contents
Capital Income Builder (continued)
Futures contracts (continued)
Contracts | Type | Number of contracts | Expiration | Notional amount15 (000) | Value at 12/31/202016 (000) | Unrealized (depreciation) appreciation at 12/31/2020 (000) | ||||||||||||||||||
20 Year U.S. Treasury Bond Futures | Long | 6 | March 2021 | $ | 600 | $ | 1,039 | $ | (10 | ) | ||||||||||||||
30 Year Ultra U.S. Treasury Bond Futures | Long | 48 | March 2021 | 4,800 | 10,251 | (65 | ) | |||||||||||||||||
|
| |||||||||||||||||||||||
| $ | (50 | ) | ||||||||||||||||||||||
|
| |||||||||||||||||||||||
Forward currency contracts
| Contract amount | Unrealized appreciation (depreciation) | |||||||||||||||
| Purchases (000) | Sales (000) | Counterparty | Settlement date | at 12/31/2020 (000) | ||||||||||||
| MXN | 3,100 | USD | 154 | HSBC Bank | 1/8/2021 | $ | 1 | |||||||||
| GBP | 1,594 | USD | 2,151 | Bank of New York Mellon | 1/11/2021 | 29 | ||||||||||
| GBP | 382 | USD | 519 | Goldman Sachs | 1/11/2021 | 4 | ||||||||||
| USD | 169 | GBP | 127 | Bank of New York Mellon | 1/11/2021 | (4 | ) | |||||||||
| USD | 2,663 | GBP | 1,985 | Standard Chartered Bank | 1/11/2021 | (52 | ) | |||||||||
|
| |||||||||||||||
| $ | (22 | ) | ||||||||||||||
|
| |||||||||||||||
Swap contracts
Interest rate swaps
Receive | Pay | Expiration date | Notional (000) | Value at 12/31/2020 (000) | Upfront premium paid (000) | Unrealized appreciation at 12/31/2020 (000) | ||||||||||||||||
U.S. EFFR | 0.11% | 5/18/2024 | $ | 6,200 | $ | 7 | $ | — | $ | 7 | ||||||||||||
3-month USD-LIBOR | 0.337% | 5/18/2025 | 21,500 | 23 | — | 23 | ||||||||||||||||
U.S. EFFR | 0.1275% | 6/25/2025 | 2,700 | 10 | — | 10 | ||||||||||||||||
U.S. EFFR | 0.105% | 6/30/2025 | 2,700 | 13 | — | 13 | ||||||||||||||||
U.S. EFFR | 0.0975% | 6/30/2025 | 1,460 | 8 | — | 8 | ||||||||||||||||
U.S. EFFR | 0.106% | 6/30/2025 | 1,190 | 6 | — | 6 | ||||||||||||||||
U.S. EFFR | 0.10875% | 7/6/2025 | 2,600 | 13 | — | 13 | ||||||||||||||||
U.S. EFFR | 0.105% | 7/9/2025 | 1,300 | 7 | — | 7 | ||||||||||||||||
U.S. EFFR | 0.0995% | 7/9/2025 | 1,300 | 7 | — | 7 | ||||||||||||||||
U.S. EFFR | 0.099% | 7/10/2025 | 3,000 | 16 | — | 16 | ||||||||||||||||
3-month USD-LIBOR | 0.5935% | 5/18/2030 | 7,200 | 187 | — | 187 | ||||||||||||||||
3-month USD-LIBOR | 0.807% | 5/18/2050 | 1,800 | 272 | — | 272 | ||||||||||||||||
|
|
|
| |||||||||||||||||||
| $ | — | $ | 569 | |||||||||||||||||||
|
|
|
| |||||||||||||||||||
Credit default swaps
Centrally cleared credit default swaps on credit indices — sell protection
Receive/ Payment frequency | Pay | Expiration date | Notional (000) | Value at 12/31/2020 (000) | Upfront premium paid (000) | Unrealized appreciation at 12/31/2020 (000) | ||||||||||||||||
5.00%/Quarterly | CDX.NA.HY.25 | 6/20/2025 | $ | 3,335 | $ | 309 | $ | 157 | $ | 152 | ||||||||||||
American Funds Insurance Series 113
Table of Contents
Capital Income Builder (continued)
Investments in affiliates13
| Value of affiliate at 1/1/2020 (000) | Additions (000) | Reductions (000) | Net realized gain (000) | Net unrealized depreciation (000) | Value of affiliate at 12/31/2020 (000) | Dividend income (000) | ||||||||||||||||||||||
Short-term securities 5.17% | ||||||||||||||||||||||||||||
Money market investments 5.17% | ||||||||||||||||||||||||||||
Capital Group Central Cash Fund 0.12%12 | $ | 76,520 | $ | 398,466 | $ | 418,149 | $ | 52 | $ | (127 | ) | $ | 56,762 | $ | 436 | |||||||||||||
| 1 | Valued under fair value procedures adopted by authority of the board of trustees. The total value of all such securities was $323,175,000, which represented 29.46% of the net assets of the fund. This amount includes $322,118,000 related to certain securities trading outside the U.S. whose values were adjusted as a result of significant market movements following the close of local trading. |
| 2 | Security did not produce income during the last 12 months. |
| 3 | Acquired in a transaction exempt from registration under Rule 144A of the Securities Act of 1933. May be resold in the U.S. in transactions exempt from registration, normally to qualified institutional buyers. The total value of all such securities was $25,651,000, which represented 2.34% of the net assets of the fund. |
| 4 | All or a portion of this security was on loan. The total value of all such securities was $5,528,000, which represented .50% of the net assets of the fund. Refer to Note 5 for more information on securities lending. |
| 5 | All or a portion of this security was pledged as collateral. The total value of pledged collateral was $2,268,000, which represented .21% of the net assets of the fund. |
| 6 | Index-linked bond whose principal amount moves with a government price index. |
| 7 | Step bond; coupon rate may change at a later date. |
| 8 | Principal payments may be made periodically. Therefore, the effective maturity date may be earlier than the stated maturity date. |
| 9 | Amount less than one thousand. |
| 10 | Coupon rate may change periodically. Reference rate and spread are as of the most recent information available. Some coupon rates are determined by the issuer or agent based on current market conditions; therefore, the reference rate and spread are not available. |
| 11 | Purchased on a TBA basis. |
| 12 | Rate represents the seven-day yield at 12/31/2020. |
| 13 | Part of the same group of investment companies as the fund as defined under the Investment Company Act of 1940. |
| 14 | Security purchased with cash collateral from securities on loan. Refer to Note 5 for more information on securities lending. |
| 15 | Notional amount is calculated based on the number of contracts and notional contract size. |
| 16 | Value is calculated based on the notional amount and current market price. |
Key to abbreviations and symbol
ADR = American Depositary Receipts
Auth. = Authority
CAD = Canadian dollars
CDI = CREST Depository Interest
EFFR = Effective Federal Funds Rate
G.O. = General Obligation
GBP = British pounds
GDR = Global Depositary Receipts
LIBOR = London Interbank Offered Rate
MXN = Mexican pesos
Ref. = Refunding
Rev. = Revenue
SOFR = Secured Overnight Financing Rate
TBA = To-be-announced
USD/$ = U.S. dollars
See notes to financial statements.
114 American Funds Insurance Series
Table of Contents
Investment portfolio December 31, 2020
Common stocks 65.78%
| Shares | Value (000) | |||||||
Information technology 16.49% | ||||||||
Microsoft Corp. | 4,891,900 | $ | 1,088,056 | |||||
Taiwan Semiconductor Manufacturing Company, Ltd. (ADR) | 6,056,700 | 660,423 | ||||||
Broadcom Inc. | 1,490,000 | 652,397 | ||||||
ASML Holding NV (New York registered) (ADR) | 795,900 | 388,177 | ||||||
ASML Holding NV1 | 70,000 | 33,828 | ||||||
MKS Instruments, Inc. | 2,200,000 | 330,990 | ||||||
Flex Ltd.2 | 14,500,000 | 260,710 | ||||||
FleetCor Technologies, Inc.2 | 900,000 | 245,547 | ||||||
Dell Technologies Inc., Class C2 | 3,250,000 | 238,193 | ||||||
VeriSign, Inc.2 | 1,100,000 | 238,040 | ||||||
Mastercard Inc., Class A | 510,000 | 182,039 | ||||||
Visa Inc., Class A | 700,200 | 153,155 | ||||||
RingCentral, Inc., Class A2 | 221,100 | 83,790 | ||||||
PayPal Holdings, Inc.2 | 316,300 | 74,077 | ||||||
Shopify Inc., Class A, subordinate voting shares2 | 55,800 | 63,163 | ||||||
Intel Corp. | 1,250,000 | 62,275 | ||||||
Okta, Inc., Class A2 | 174,680 | 44,414 | ||||||
NVIDIA Corp. | 68,566 | 35,805 | ||||||
MongoDB, Inc., Class A2 | 94,819 | 34,044 | ||||||
Smartsheet Inc., Class A2 | 311,910 | 21,612 | ||||||
|
| |||||||
| 4,890,735 | ||||||||
|
| |||||||
Health care 10.70% | ||||||||
Johnson & Johnson | 3,885,000 | 611,421 | ||||||
UnitedHealth Group Inc. | 1,322,300 | 463,704 | ||||||
Humana Inc. | 865,000 | 354,884 | ||||||
Cigna Corp. | 1,275,000 | 265,429 | ||||||
Thermo Fisher Scientific Inc. | 507,000 | 236,150 | ||||||
Abbott Laboratories | 2,000,000 | 218,980 | ||||||
Daiichi Sankyo Company, Ltd.1 | 3,873,900 | 132,799 | ||||||
Vertex Pharmaceuticals Inc.2 | 550,000 | 129,987 | ||||||
Merck & Co., Inc. | 1,400,000 | 114,520 | ||||||
Pfizer Inc. | 3,060,000 | 112,639 | ||||||
Gilead Sciences, Inc. | 1,600,000 | 93,216 | ||||||
Regeneron Pharmaceuticals, Inc.2 | 150,000 | 72,466 | ||||||
Zoetis Inc., Class A | 434,700 | 71,943 | ||||||
IDEXX Laboratories, Inc.2 | 94,102 | 47,039 | ||||||
Allakos Inc.2 | 293,700 | 41,118 | ||||||
Cortexyme, Inc.2,3 | 1,218,038 | 33,837 | ||||||
Centene Corp.2 | 562,770 | 33,783 | ||||||
Ultragenyx Pharmaceutical Inc.2 | 217,400 | 30,095 | ||||||
AbCellera Biologics Inc.2,3 | 625,100 | 25,154 | ||||||
Viatris Inc.2 | 1,121,937 | 21,025 | ||||||
Sarepta Therapeutics, Inc.2 | 115,700 | 19,726 | ||||||
Bluebird Bio, Inc.2 | 378,900 | 16,395 | ||||||
NuCana PLC (ADR)2,4 | 2,977,153 | 13,367 | ||||||
Rotech Healthcare Inc.1,2,5,6 | 184,138 | 13,074 | ||||||
Advanz Pharma Corp. Ltd.2,6 | 175,310 | 773 | ||||||
Advanz Pharma Corp. Ltd.2 | 41,657 | 184 | ||||||
|
| |||||||
| 3,173,708 | ||||||||
|
| |||||||
Financials 10.36% | ||||||||
Chubb Ltd. | 2,200,000 | 338,624 | ||||||
First Republic Bank | 1,780,000 | 261,535 | ||||||
Capital One Financial Corp. | 2,000,000 | 197,700 | ||||||
CME Group Inc., Class A | 977,200 | 177,899 | ||||||
JPMorgan Chase & Co. | 1,400,000 | 177,898 | ||||||
Bank of America Corp. | 5,750,000 | 174,283 | ||||||
Synchrony Financial | 5,000,000 | 173,550 | ||||||
The Blackstone Group Inc., Class A | 2,190,950 | 141,995 | ||||||
Sberbank of Russia PJSC (ADR)1 | 9,788,000 | 141,103 | ||||||
Citigroup Inc. | 2,250,000 | 138,735 | ||||||
American Funds Insurance Series 115
Table of Contents
Asset Allocation Fund (continued)
Common stocks (continued)
| Shares | Value (000) | |||||||
Financials (continued) | ||||||||
Apollo Global Management, Inc., Class A | 2,769,732 | $ | 135,661 | |||||
Aon PLC, Class A | 620,000 | 130,987 | ||||||
Arch Capital Group Ltd.2 | 3,234,000 | 116,650 | ||||||
Nasdaq, Inc. | 844,100 | 112,046 | ||||||
MSCI Inc. | 225,200 | 100,559 | ||||||
Intercontinental Exchange, Inc. | 840,000 | 96,844 | ||||||
Truist Financial Corp. | 1,966,000 | 94,230 | ||||||
PNC Financial Services Group, Inc. | 500,000 | 74,500 | ||||||
Kotak Mahindra Bank Ltd.1,2 | 2,713,240 | 74,253 | ||||||
RenaissanceRe Holdings Ltd. | 357,000 | 59,198 | ||||||
Ares Management Corp., Class A | 1,015,403 | 47,775 | ||||||
BlackRock, Inc. | 56,000 | 40,406 | ||||||
S&P Global Inc. | 102,000 | 33,530 | ||||||
Berkshire Hathaway Inc., Class A2 | 61 | 21,217 | ||||||
Tradeweb Markets Inc., Class A | 156,400 | 9,767 | ||||||
Jonah Energy Parent LLC1,2,5 | 32,117 | 482 | ||||||
|
| |||||||
| 3,071,427 | ||||||||
|
| |||||||
Consumer discretionary 6.66% | ||||||||
Amazon.com, Inc.2 | 134,822 | 439,106 | ||||||
Aramark | 8,000,000 | 307,840 | ||||||
Home Depot, Inc. | 1,113,000 | 295,635 | ||||||
General Motors Company | 4,100,000 | 170,724 | ||||||
LVMH Moët Hennessy-Louis Vuitton SE1 | 256,896 | 160,516 | ||||||
MercadoLibre, Inc.2 | 91,300 | 152,948 | ||||||
Kontoor Brands, Inc.4 | 3,700,000 | 150,072 | ||||||
VF Corp. | 1,000,000 | 85,410 | ||||||
Darden Restaurants, Inc. | 627,109 | 74,701 | ||||||
NIKE, Inc., Class B | 357,000 | 50,505 | ||||||
Restaurant Brands International Inc. | 595,000 | 36,360 | ||||||
Booking Holdings Inc.2 | 12,750 | 28,398 | ||||||
XPeng Inc., Class A (ADR)2,3 | 517,000 | 22,143 | ||||||
|
| |||||||
| 1,974,358 | ||||||||
|
| |||||||
Consumer staples 5.31% | ||||||||
Philip Morris International Inc. | 7,543,000 | 624,485 | ||||||
Nestlé SA1 | 2,700,000 | 317,868 | ||||||
Nestlé SA (ADR) | 665,000 | 78,337 | ||||||
British American Tobacco PLC (ADR) | 3,919,700 | 146,949 | ||||||
British American Tobacco PLC1 | 1,060,000 | 39,427 | ||||||
Altria Group, Inc. | 3,750,000 | 153,750 | ||||||
Mondelez International, Inc. | 1,200,000 | 70,164 | ||||||
Colgate-Palmolive Company | 677,300 | 57,916 | ||||||
Archer Daniels Midland Company | 1,000,000 | 50,410 | ||||||
Avenue Supermarts Ltd.1,2 | 970,539 | 36,704 | ||||||
|
| |||||||
| 1,576,010 | ||||||||
|
| |||||||
Communication services 5.01% | ||||||||
Charter Communications, Inc., Class A2 | 754,600 | 499,206 | ||||||
Facebook, Inc., Class A2 | 952,100 | 260,076 | ||||||
Comcast Corp., Class A | 4,278,910 | 224,215 | ||||||
Alphabet Inc., Class C2 | 78,600 | 137,698 | ||||||
Alphabet Inc., Class A2 | 27,616 | 48,401 | ||||||
Netflix, Inc.2 | 226,700 | 122,583 | ||||||
New York Times Co., Class A | 1,450,000 | 75,066 | ||||||
Tencent Holdings Ltd.1 | 965,000 | 70,510 | ||||||
Activision Blizzard, Inc. | 519,500 | 48,235 | ||||||
|
| |||||||
| 1,485,990 | ||||||||
|
| |||||||
116 American Funds Insurance Series
Table of Contents
Asset Allocation Fund (continued)
Common stocks (continued)
| Shares | Value (000) | |||||||
Industrials 4.28% | ||||||||
Northrop Grumman Corp. | 1,211,900 | $ | 369,290 | |||||
Lockheed Martin Corp. | 663,000 | 235,352 | ||||||
CSX Corp. | 2,038,000 | 184,949 | ||||||
L3Harris Technologies, Inc. | 791,100 | 149,534 | ||||||
Komatsu Ltd.1 | 4,604,900 | 126,186 | ||||||
Boeing Company | 583,000 | 124,797 | ||||||
Honeywell International Inc. | 152,000 | 32,330 | ||||||
Waste Management, Inc. | 214,000 | 25,237 | ||||||
Cintas Corp. | 34,000 | 12,018 | ||||||
Associated Materials Group Inc.1,2,5 | 1,588,250 | 9,974 | ||||||
ACR III LSC Holdings LLC1,2,5 | 467 | 703 | ||||||
|
| |||||||
| 1,270,370 | ||||||||
|
| |||||||
Materials 3.16% | ||||||||
Dow Inc. | 4,800,000 | 266,400 | ||||||
LyondellBasell Industries NV | 2,368,100 | 217,060 | ||||||
Franco-Nevada Corp. | 838,620 | 105,149 | ||||||
Rio Tinto PLC1 | 1,250,000 | 93,530 | ||||||
Royal Gold, Inc. | 695,000 | 73,920 | ||||||
Nucor Corp. | 1,000,000 | 53,190 | ||||||
First Quantum Minerals Ltd. | 2,775,000 | 49,814 | ||||||
Allegheny Technologies Inc.2 | 2,589,437 | 43,425 | ||||||
Barrick Gold Corp. | 1,455,000 | 33,145 | ||||||
|
| |||||||
| 935,633 | ||||||||
|
| |||||||
Energy 1.53% | ||||||||
Chevron Corp. | 2,100,000 | 177,345 | ||||||
Pioneer Natural Resources Company | 800,000 | 91,112 | ||||||
EOG Resources, Inc. | 1,352,400 | 67,444 | ||||||
Suncor Energy Inc. | 4,000,000 | 67,091 | ||||||
Rosneft Oil Company PJSC (GDR)1 | 3,730,353 | 21,035 | ||||||
ConocoPhillips | 335,000 | 13,397 | ||||||
Euronav NV | 750,000 | 6,000 | ||||||
Scorpio Tankers Inc. | 345,000 | 3,860 | ||||||
Oasis Petroleum Inc.2 | 79,058 | 2,930 | ||||||
Weatherford International2 | 289,547 | 1,737 | ||||||
Tribune Resources, LLC1,2,5 | 926,514 | 843 | ||||||
McDermott International, Inc.2 | 40,219 | 33 | ||||||
Sable Permian Resources, LLC, units1,2,5 | 24,001,604 | — | 7 | |||||
|
| |||||||
| 452,827 | ||||||||
|
| |||||||
Real estate 1.28% | ||||||||
Crown Castle International Corp. REIT | 1,032,335 | 164,337 | ||||||
American Tower Corp. REIT | 328,100 | 73,645 | ||||||
VICI Properties Inc. REIT | 2,805,000 | 71,528 | ||||||
Alexandria Real Estate Equities, Inc. REIT | 399,000 | 71,110 | ||||||
|
| |||||||
| 380,620 | ||||||||
|
| |||||||
Utilities 1.00% | ||||||||
Enel SpA1 | 24,000,000 | 242,361 | ||||||
DTE Energy Company | 226,000 | 27,439 | ||||||
Xcel Energy Inc. | 400,000 | 26,668 | ||||||
|
| |||||||
| 296,468 | ||||||||
|
| |||||||
Total common stocks (cost: $11,273,725,000) | 19,508,146 | |||||||
|
| |||||||
American Funds Insurance Series 117
Table of Contents
Asset Allocation Fund (continued)
| Shares | Value (000) | |||||||
Rights & warrants 0.00% | ||||||||
Energy 0.00% | ||||||||
Tribune Resources, LLC, Class A, warrants, expire 20231,2,5 | 311,755 | $ | — | 7 | ||||
Tribune Resources, LLC, Class B, warrants, expire 20231,2,5 | 242,476 | — | 7 | |||||
Tribune Resources, LLC, Class C, warrants, expire 20231,2,5 | 227,540 | — | 7 | |||||
|
| |||||||
Total rights & warrants (cost: $47,000) | — | 7 | ||||||
|
| |||||||
Convertible stocks 0.50% | ||||||||
Information technology 0.29% | ||||||||
Broadcom Inc., Series A, cumulative convertible preferred shares, 8.00% 2022 | 60,000 | 85,348 | ||||||
|
| |||||||
Financials 0.15% | ||||||||
2020 Cash Mandatory Exchangeable Trust, convertible preferred shares, 5.25% 20238 | 37,778 | 45,378 | ||||||
|
| |||||||
Health care 0.06% | ||||||||
Danaher Corp., Series B, cumulative convertible preferred shares, 5.00% 20233 | 13,300 | 17,304 | ||||||
|
| |||||||
Total convertible stocks (cost: $110,591,000) | 148,030 | |||||||
|
| |||||||
Bonds, notes & other debt instruments 30.11% | ||||||||
| Principal amount (000) | ||||||||
Corporate bonds, notes & loans 12.99% | ||||||||
Financials 2.27% | ||||||||
ACE INA Holdings Inc. 2.875% 2022 | $ | 3,880 | 4,047 | |||||
ACE INA Holdings Inc. 3.35% 2026 | 1,380 | 1,556 | ||||||
ACE INA Holdings Inc. 4.35% 2045 | 800 | 1,085 | ||||||
Advisor Group Holdings, LLC 6.25% 20288 | 2,445 | 2,479 | ||||||
AG Merger Sub II, Inc. 10.75% 20278 | 2,484 | 2,752 | ||||||
Allstate Corp. 3.85% 2049 | 950 | 1,194 | ||||||
Ally Financial Inc. 8.00% 2031 | 3,000 | 4,274 | ||||||
American International Group, Inc. 2.50% 2025 | 15,800 | 16,992 | ||||||
American International Group, Inc. 4.20% 2028 | 565 | 671 | ||||||
American International Group, Inc. 3.40% 2030 | 4,540 | 5,203 | ||||||
American International Group, Inc. 4.375% 2050 | 1,770 | 2,318 | ||||||
AON Corp. 2.20% 2022 | 2,236 | 2,312 | ||||||
Banco Santander, SA 2.749% 2030 | 5,400 | 5,578 | ||||||
Bangkok Bank PCL 3.733% 2034 (UST Yield Curve Rate T Note Constant Maturity 5-year + 1.90% on 9/25/2029)9 | 1,278 | 1,333 | ||||||
Bank of America Corp. 3.55% 2024 (3-month USD-LIBOR + 0.78% on 3/5/2023)9 | 6,000 | 6,413 | ||||||
Bank of America Corp. 1.197% 2026 (USD-SOFR + 1.01% on 10/24/2025)9 | 2,500 | 2,534 | ||||||
Bank of America Corp. 3.419% 2028 (3-month USD-LIBOR + 1.04% on 12/20/2027)9 | 2,345 | 2,653 | ||||||
Bank of America Corp. 1.898% 2031 (USD-SOFR + 1.53% on 7/23/2030)9 | 42,674 | 43,128 | ||||||
Bank of America Corp. 1.922% 2031 (USD-SOFR + 1.37% on 10/24/2030)9 | 11,065 | 11,215 | ||||||
Bank of America Corp. 2.676% 2041 (USD-SOFR + 1.93% on 6/19/2040)9 | 750 | 783 | ||||||
Bank of Nova Scotia 1.625% 2023 | 5,000 | 5,145 | ||||||
BB&T Corp. 2.625% 2022 | 2,500 | 2,557 | ||||||
BB&T Corp. 2.75% 2022 | 762 | 784 | ||||||
Berkshire Hathaway Finance Corp. 4.20% 2048 | 6,570 | 8,679 | ||||||
Berkshire Hathaway Finance Corp. 4.25% 2049 | 1,125 | 1,495 | ||||||
Berkshire Hathaway Inc. 2.20% 2021 | 500 | 501 | ||||||
Berkshire Hathaway Inc. 2.75% 2023 | 1,615 | 1,696 | ||||||
Berkshire Hathaway Inc. 3.125% 2026 | 500 | 559 | ||||||
BNP Paribas 3.375% 20258 | 3,225 | 3,538 | ||||||
Citigroup Inc. 2.312% 2022 (USD-SOFR + 0.867% on 11/4/2021)9 | 9,000 | 9,146 | ||||||
Citigroup Inc. 2.976% 2030 (USD-SOFR + 1.422% on 11/5/2029)9 | 3,254 | 3,585 | ||||||
Citigroup Inc. 2.572% 2031 (USD-SOFR + 2.107% on 6/3/2030)9 | 5,575 | 5,944 | ||||||
CME Group Inc. 3.75% 2028 | 3,425 | 4,059 | ||||||
Commonwealth Bank of Australia 3.35% 2024 | 1,225 | 1,342 | ||||||
Commonwealth Bank of Australia 3.35% 20248 | 1,000 | 1,096 | ||||||
Compass Diversified Holdings 8.00% 20268 | 3,245 | 3,419 | ||||||
118 American Funds Insurance Series
Table of Contents
Asset Allocation Fund (continued)
Bonds, notes & other debt instruments (continued)
| Principal amount (000) | Value (000) | |||||||
Corporate bonds, notes & loans (continued) | ||||||||
Financials (continued) | ||||||||
Crédit Agricole SA 4.375% 20258 | $ | 850 | $ | 955 | ||||
Credit Suisse AG (New York Branch) 2.95% 2025 | 2,700 | 2,963 | ||||||
Credit Suisse Group AG 3.80% 2023 | 1,625 | 1,751 | ||||||
Credit Suisse Group AG 3.869% 2029 (3-month USD-LIBOR + 1.41% on 1/12/2028)8,9 | 800 | 907 | ||||||
Credit Suisse Group AG 4.194% 2031 (USD-SOFR + 3.73% on 4/1/2030)8,9 | 11,625 | 13,683 | ||||||
Danske Bank AS 2.70% 20228 | 1,000 | 1,025 | ||||||
Deutsche Bank AG 2.129% 2026 (USD-SOFR + 1.87% on 11/24/2025)9 | 5,800 | 5,935 | ||||||
Deutsche Bank AG 3.547% 2031 (USD-SOFR + 3.043% on 9/18/2030)9 | 4,050 | 4,401 | ||||||
DNB Bank ASA 2.375% 20218 | 2,000 | 2,018 | ||||||
Ford Motor Credit Co. 3.375% 2025 | 5,750 | 5,896 | ||||||
FS Energy and Power Fund 7.50% 20238 | 2,995 | 2,883 | ||||||
Goldman Sachs Group, Inc. 1.093% 2026 (USD-SOFR + 0.789% on 12/9/2025)9 | 11,150 | 11,275 | ||||||
Goldman Sachs Group, Inc. 3.691% 2028 (3-month USD-LIBOR + 1.51% on 6/5/2027)9 | 2,000 | 2,307 | ||||||
Goldman Sachs Group, Inc. 3.814% 2029 (3-month USD-LIBOR + 1.158% on 4/23/2028)9 | 390 | 452 | ||||||
Goldman Sachs Group, Inc. 2.60% 2030 | 7,000 | 7,538 | ||||||
Groupe BPCE SA 2.75% 20238 | 600 | 628 | ||||||
Groupe BPCE SA 5.70% 20238 | 3,460 | 3,918 | ||||||
Groupe BPCE SA 5.15% 20248 | 2,500 | 2,849 | ||||||
Groupe BPCE SA 1.652% 2026 (USD-SOFR + 1.52% on 10/6/2025)8,9 | 6,375 | 6,530 | ||||||
Hartford Financial Services Group, Inc. 2.80% 2029 | 3,480 | 3,786 | ||||||
Hartford Financial Services Group, Inc. 3.60% 2049 | 1,000 | 1,175 | ||||||
HSBC Holdings PLC 3.262% 2023 (3-month USD-LIBOR + 1.055% on 3/13/2022)9 | 1,500 | 1,551 | ||||||
HSBC Holdings PLC 4.25% 2024 | 3,000 | 3,312 | ||||||
HSBC Holdings PLC 2.633% 2025 (3-month USD-LIBOR + 1.14% on 11/7/2024)9 | 625 | 665 | ||||||
HSBC Holdings PLC 2.099% 2026 (USD-SOFR + 1.929% on 6/4/2025)9 | 6,000 | 6,240 | ||||||
HSBC Holdings PLC 4.583% 2029 (3-month USD-LIBOR + 1.535% on 6/19/2028)9 | 4,675 | 5,532 | ||||||
HSBC Holdings PLC 3.973% 2030 (3-month USD-LIBOR + 1.61% on 5/22/2029)9 | 9,675 | 11,191 | ||||||
HSBC Holdings PLC 2.357% 2031 (USD-SOFR + 1.947% on 8/18/2030)9 | 12,025 | 12,439 | ||||||
Icahn Enterprises Finance Corp. 6.25% 2022 | 5,675 | 5,702 | ||||||
Icahn Enterprises Finance Corp. 5.25% 2027 | 1,185 | 1,273 | ||||||
Intercontinental Exchange, Inc. 2.65% 2040 | 7,425 | 7,643 | ||||||
Intercontinental Exchange, Inc. 3.00% 2060 | 2,380 | 2,499 | ||||||
Intesa Sanpaolo SpA 3.375% 20238 | 750 | 786 | ||||||
Intesa Sanpaolo SpA 3.25% 20248 | 750 | 802 | ||||||
Intesa Sanpaolo SpA 5.017% 20248 | 1,730 | 1,893 | ||||||
Intesa Sanpaolo SpA 3.875% 20278 | 300 | 330 | ||||||
JPMorgan Chase & Co. 3.559% 2024 (3-month USD-LIBOR + 0.73% on 4/23/2023)9 | 4,725 | 5,066 | ||||||
JPMorgan Chase & Co. 1.045% 2026 (USD-SOFR + 0.80% on 11/19/2025)9 | 3,955 | 4,001 | ||||||
JPMorgan Chase & Co. 1.764% 2031 (USD-SOFR + 1.05% on 11/19/2030)9 | 5,000 | 5,053 | ||||||
JPMorgan Chase & Co. 2.522% 2031 (USD-SOFR + 2.04% on 4/22/2030)9 | 7,325 | 7,879 | ||||||
JPMorgan Chase & Co. 3.109% 2051 (USD-SOFR + 3.109% on 4/22/2050)9 | 3,236 | 3,603 | ||||||
JPMorgan Chase & Co., Series Z, junior subordinated, 4.014% (3-month USD-LIBOR + 3.80% on 2/1/2021)9 | 500 | 498 | ||||||
Kasikornbank PC HK 3.343% 2031 (UST Yield Curve Rate T Note Constant Maturity 5-year + 1.70% on 10/2/2026)9 | 1,222 | 1,257 | ||||||
Ladder Capital Corp. 5.25% 20228 | 475 | 478 | ||||||
Ladder Capital Corp. 4.25% 20278 | 3,157 | 3,110 | ||||||
Lloyds Banking Group PLC 2.907% 2023 (3-month USD-LIBOR + 0.81% on 11/7/2022)9 | 750 | 784 | ||||||
Lloyds Banking Group PLC 4.05% 2023 | 2,000 | 2,187 | ||||||
Lloyds Banking Group PLC 3.87% 2025 (UST Yield Curve Rate T Note Constant Maturity 1-year + 3.50% on 7/9/2024)9 | 6,340 | 6,998 | ||||||
Lloyds Banking Group PLC 4.45% 2025 | 800 | 918 | ||||||
Lloyds Banking Group PLC 4.375% 2028 | 2,150 | 2,559 | ||||||
LPL Financial Holdings Inc. 4.625% 20278 | 2,200 | 2,284 | ||||||
Marsh & McLennan Companies, Inc. 3.875% 2024 | 820 | 905 | ||||||
Marsh & McLennan Companies, Inc. 4.375% 2029 | 1,705 | 2,076 | ||||||
Marsh & McLennan Companies, Inc. 4.90% 2049 | 1,539 | 2,233 | ||||||
MetLife, Inc. 4.55% 2030 | 3,770 | 4,715 | ||||||
Metropolitan Life Global Funding I 1.95% 20218 | 1,250 | 1,265 | ||||||
Metropolitan Life Global Funding I 1.95% 20238 | 7,800 | 8,050 | ||||||
American Funds Insurance Series 119
Table of Contents
Asset Allocation Fund (continued)
Bonds, notes & other debt instruments (continued)
| Principal amount (000) | Value (000) | |||||||
Corporate bonds, notes & loans (continued) | ||||||||
Financials (continued) | ||||||||
Metropolitan Life Global Funding I 0.95% 20258 | $ | 18,767 | $ | 19,024 | ||||
MGIC Investment Corp. 5.25% 2028 | 1,175 | 1,259 | ||||||
Mitsubishi UFJ Financial Group, Inc. 2.623% 2022 | 1,610 | 1,665 | ||||||
Mitsubishi UFJ Financial Group, Inc. 2.801% 2024 | 1,610 | 1,727 | ||||||
Mitsubishi UFJ Financial Group, Inc. 3.195% 2029 | 5,000 | 5,636 | ||||||
Morgan Stanley 2.50% 2021 | 3,000 | 3,019 | ||||||
Morgan Stanley 3.70% 2024 | 2,410 | 2,684 | ||||||
Morgan Stanley 3.737% 2024 (3-month USD-LIBOR + 0.847% on 4/24/2023)9 | 300 | 323 | ||||||
Morgan Stanley 0.985% 2026 (USD-SOFR + 0.72% on 12/10/2025)9 | 18,706 | 18,853 | ||||||
Morgan Stanley 3.125% 2026 | 325 | 364 | ||||||
Morgan Stanley 2.699% 2031 (USD-SOFR + 1.143% on 1/22/2030)9 | 6,000 | 6,518 | ||||||
Morgan Stanley 1.794% 2032 (USD-SOFR + 1.034% on 2/13/2031)9 | 3,000 | 3,020 | ||||||
Navient Corp. 6.50% 2022 | 3,675 | 3,898 | ||||||
Navient Corp. 5.50% 2023 | 10,165 | 10,654 | ||||||
Navient Corp. 7.25% 2023 | 725 | 796 | ||||||
Navient Corp. 5.875% 2024 | 1,005 | 1,070 | ||||||
Navient Corp. 6.125% 2024 | 8,030 | 8,597 | ||||||
New York Life Global Funding 1.70% 20218 | 1,125 | 1,136 | ||||||
New York Life Global Funding 2.30% 20228 | 250 | 257 | ||||||
New York Life Global Funding 0.95% 20258 | 8,537 | 8,658 | ||||||
New York Life Global Funding 2.35% 20268 | 890 | 951 | ||||||
New York Life Global Funding 1.20% 20308 | 3,528 | 3,424 | ||||||
New York Life Insurance Company 3.75% 20508 | 527 | 631 | ||||||
Owl Rock Capital Corp. 4.625% 20248 | 2,305 | 2,363 | ||||||
Owl Rock Capital Corp. 3.75% 2025 | 2,874 | 2,985 | ||||||
Owl Rock Capital Corp. 4.00% 2025 | 102 | 107 | ||||||
Owl Rock Capital Corp. 3.375% 2026 | 1,290 | 1,308 | ||||||
PNC Bank 2.55% 2021 | 4,000 | 4,079 | ||||||
PNC Financial Services Group, Inc. 2.854% 20229 | 1,445 | 1,513 | ||||||
PNC Financial Services Group, Inc. 3.50% 2024 | 3,850 | 4,198 | ||||||
PNC Financial Services Group, Inc. 3.90% 2024 | 2,000 | 2,217 | ||||||
PNC Financial Services Group, Inc. 2.55% 2030 | 2,000 | 2,192 | ||||||
Power Financial Corp Ltd. 5.25% 2028 | 383 | 442 | ||||||
Power Financial Corp Ltd. 6.15% 2028 | 350 | 427 | ||||||
Power Financial Corp Ltd. 4.50% 2029 | 554 | 611 | ||||||
Power Financial Corp Ltd. 3.95% 2030 | 1,213 | 1,298 | ||||||
Progressive Corp. 3.20% 2030 | 1,380 | 1,592 | ||||||
Prudential Financial, Inc. 3.878% 2028 | 500 | 588 | ||||||
Prudential Financial, Inc. 4.35% 2050 | 7,000 | 9,196 | ||||||
Quicken Loans, LLC 3.625% 20298 | 1,505 | 1,538 | ||||||
Rabobank Nederland 2.75% 2022 | 2,250 | 2,307 | ||||||
Rabobank Nederland 4.375% 2025 | 4,500 | 5,138 | ||||||
Royal Bank of Canada 3.20% 2021 | 12,000 | 12,115 | ||||||
Royal Bank of Canada 1.15% 2025 | 11,711 | 11,972 | ||||||
Skandinaviska Enskilda Banken AB 1.875% 2021 | 1,675 | 1,694 | ||||||
Skandinaviska Enskilda Banken AB 2.625% 2021 | 250 | 251 | ||||||
Skandinaviska Enskilda Banken AB 2.80% 2022 | 700 | 721 | ||||||
Springleaf Finance Corp. 6.125% 2024 | 5,825 | 6,371 | ||||||
Starwood Property Trust, Inc. 5.00% 2021 | 6,625 | 6,753 | ||||||
Starwood Property Trust, Inc. 5.50% 20238 | 1,160 | 1,214 | ||||||
Swiss Re Finance (Luxembourg) SA 5.00% 2049 (UST Yield Curve Rate T Note Constant Maturity 5-year + 3.582% on 4/2/2029)8,9 | 2,800 | 3,271 | ||||||
Toronto-Dominion Bank 2.65% 2024 | 625 | 670 | ||||||
Toronto-Dominion Bank 0.75% 2025 | 5,375 | 5,398 | ||||||
Toronto-Dominion Bank 1.15% 2025 | 12,000 | 12,259 | ||||||
Travelers Companies, Inc. 4.00% 2047 | 860 | 1,116 | ||||||
Travelers Companies, Inc. 4.10% 2049 | 910 | 1,199 | ||||||
Travelers Companies, Inc. 2.55% 2050 | 172 | 181 | ||||||
Travelport Finance Luxembourg SARL, Term Loan, (3-month USD-LIBOR + 8.00%) 1.06% 2025 (72.22% PIK)10,11,12 | 1,460 | 1,445 | ||||||
120 American Funds Insurance Series
Table of Contents
Asset Allocation Fund (continued)
Bonds, notes & other debt instruments (continued)
| Principal amount (000) | Value (000) | |||||||
Corporate bonds, notes & loans (continued) | ||||||||
Financials (continued) | ||||||||
Travelport Finance Luxembourg SARL, Term Loan, (3-month USD-LIBOR + 5.00%) 5.254% 202610,12 | $ | 1,795 | $ | 1,244 | ||||
U.S. Bancorp 2.625% 2022 | 1,805 | 1,847 | ||||||
U.S. Bancorp 2.40% 2024 | 2,000 | 2,133 | ||||||
U.S. Bancorp 3.70% 2024 | 5,000 | 5,486 | ||||||
U.S. Bancorp 2.375% 2026 | 4,000 | 4,339 | ||||||
UBS Group AG 4.125% 20258 | 2,750 | 3,152 | ||||||
UBS Group AG 1.364% 2027 (UST Yield Curve Rate T Note Constant Maturity 5-year + 1.08% on 1/30/2026)8,9 | 2,925 | 2,959 | ||||||
UniCredit SpA 3.75% 20228 | 5,725 | 5,934 | ||||||
UniCredit SpA 6.572% 20228 | 475 | 501 | ||||||
UniCredit SpA 4.625% 20278 | 625 | 712 | ||||||
UniCredit SpA 5.861% 2032 (5-year USD-ICE Swap + 3.703% on 6/19/2027)8,9 | 1,200 | 1,353 | ||||||
Wells Fargo & Company 2.164% 2026 (3-month USD-LIBOR + 0.75% on 2/11/2025)9 | 8,000 | 8,416 | ||||||
Wells Fargo & Company 3.196% 2027 (3-month USD-LIBOR + 1.17% on 6/17/2026)9 | 1,988 | 2,205 | ||||||
Wells Fargo & Company 3.584% 2028 (3-month USD-LIBOR + 1.31% on 5/22/2027)9 | 217 | 246 | ||||||
Wells Fargo & Company 2.879% 2030 (3-month USD-LIBOR + 1.17% on 10/30/2029)9 | 2,904 | 3,169 | ||||||
Wells Fargo & Company 2.572% 2031 (3-month USD-LIBOR + 1.00% on 2/11/2030)9 | 12,846 | 13,604 | ||||||
Wells Fargo & Company 3.068% 2041 (USD-SOFR + 2.53% on 4/30/2040)9 | 3,076 | 3,351 | ||||||
Westpac Banking Corp. 2.75% 2023 | 1,750 | 1,840 | ||||||
Westpac Banking Corp. 2.894% 2030 (UST Yield Curve Rate T Note Constant Maturity 5-year + 1.35% on 2/4/2025)9 | 8,500 | 8,914 | ||||||
Westpac Banking Corp. 2.668% 2035 (UST Yield Curve Rate T Note Constant Maturity 5-year + 1.75% on 11/15/2030)9 | 3,325 | 3,429 | ||||||
Westpac Banking Corp. 2.963% 2040 | 1,500 | 1,597 | ||||||
|
| |||||||
| 674,041 | ||||||||
|
| |||||||
Utilities 1.54% | ||||||||
AEP Transmission Co. LLC 3.75% 2047 | 2,390 | 2,915 | ||||||
AEP Transmission Co. LLC 4.25% 2048 | 1,524 | 2,015 | ||||||
AEP Transmission Co. LLC 3.65% 2050 | 550 | 669 | ||||||
Ameren Corp. 2.50% 2024 | 969 | 1,034 | ||||||
Ameren Corp. 3.50% 2031 | 4,829 | 5,560 | ||||||
Ameren Corp. 4.50% 2049 | 425 | 579 | ||||||
American Electric Power Company, Inc. 2.95% 2022 | 3,020 | 3,155 | ||||||
American Electric Power Company, Inc. 1.00% 2025 | 625 | 633 | ||||||
American Electric Power Company, Inc. 2.30% 2030 | 4,500 | 4,706 | ||||||
CenterPoint Energy, Inc. 2.50% 2022 | 900 | 931 | ||||||
CenterPoint Energy, Inc. 3.85% 2024 | 3,275 | 3,585 | ||||||
CenterPoint Energy, Inc. 2.95% 2030 | 1,350 | 1,471 | ||||||
CenterPoint Energy, Inc. 3.70% 2049 | 2,775 | 3,202 | ||||||
CenterPoint Energy, Inc. 2.90% 2050 | 350 | 380 | ||||||
CMS Energy Corp. 3.00% 2026 | 1,004 | 1,108 | ||||||
CMS Energy Corp. 3.45% 2027 | 1,850 | 2,093 | ||||||
Comisión Federal de Electricidad 4.75% 20278 | 645 | 734 | ||||||
Commonwealth Edison Co. 4.35% 2045 | 1,585 | 2,070 | ||||||
Commonwealth Edison Co. 4.00% 2048 | 2,600 | 3,293 | ||||||
Connecticut Light and Power Co. 0.75% 2025 | 825 | 835 | ||||||
Connecticut Light and Power Co. 3.20% 2027 | 1,525 | 1,713 | ||||||
Consolidated Edison Co. of New York, Inc. 4.50% 2058 | 6,100 | 8,064 | ||||||
Consumers Energy Co. 3.25% 2046 | 507 | 580 | ||||||
Consumers Energy Co. 4.05% 2048 | 3,017 | 3,954 | ||||||
Consumers Energy Co. 3.10% 2050 | 1,730 | 2,004 | ||||||
Consumers Energy Co. 3.75% 2050 | 1,193 | 1,500 | ||||||
Dominion Resources, Inc. 2.00% 2021 | 665 | 671 | ||||||
Dominion Resources, Inc. 2.75% 2022 | 800 | 818 | ||||||
Dominion Resources, Inc. 3.30% 2025 | 1,164 | 1,283 | ||||||
Dominion Resources, Inc. 2.85% 2026 | 750 | 827 | ||||||
Dominion Resources, Inc., junior subordinated, 3.071% 20249 | 1,775 | 1,917 | ||||||
DPL Inc. 4.125% 20258 | 1,160 | 1,254 | ||||||
American Funds Insurance Series 121
Table of Contents
Asset Allocation Fund (continued)
Bonds, notes & other debt instruments (continued)
| Principal amount (000) | Value (000) | |||||||
Corporate bonds, notes & loans (continued) | ||||||||
Utilities (continued) | ||||||||
DTE Energy Co. 3.95% 2049 | $ | 1,800 | $ | 2,337 | ||||
Duke Energy Carolinas, LLC 3.95% 2028 | 1,250 | 1,491 | ||||||
Duke Energy Corp. 0.90% 2025 | 800 | 802 | ||||||
Duke Energy Florida, LLC 3.20% 2027 | 1,445 | 1,615 | ||||||
Duke Energy Florida, LLC 1.75% 2030 | 5,000 | 5,116 | ||||||
Duke Energy Indiana, Inc. 3.25% 2049 | 1,225 | 1,387 | ||||||
Duke Energy Ohio, Inc. 2.125% 2030 | 850 | 891 | ||||||
Duke Energy Progress Inc. 3.70% 2046 | 750 | 907 | ||||||
Duke Energy Progress, LLC 2.50% 2050 | 1,459 | 1,471 | ||||||
Edison International 3.55% 2024 | 4,763 | 5,133 | ||||||
Edison International 4.95% 2025 | 250 | 286 | ||||||
Edison International 5.75% 2027 | 5,436 | 6,512 | ||||||
Edison International 4.125% 2028 | 5,904 | 6,584 | ||||||
EDP Finance BV 3.625% 20248 | 4,100 | 4,478 | ||||||
Electricité de France SA 4.75% 20358 | 1,250 | 1,558 | ||||||
Electricité de France SA 4.875% 20388 | 2,750 | 3,434 | ||||||
Electricité de France SA 5.60% 2040 | 525 | 705 | ||||||
Emera US Finance LP 3.55% 2026 | 320 | 360 | ||||||
Enersis Américas SA 4.00% 2026 | 245 | 275 | ||||||
Entergy Corp. 2.95% 2026 | 872 | 962 | ||||||
Entergy Corp. 3.12% 2027 | 3,000 | 3,346 | ||||||
Entergy Corp. 1.60% 2030 | 875 | 885 | ||||||
Entergy Corp. 2.80% 2030 | 4,700 | 5,081 | ||||||
Entergy Corp. 3.75% 2050 | 850 | 987 | ||||||
Entergy Louisiana, LLC 4.20% 2048 | 4,200 | 5,475 | ||||||
Entergy Texas, Inc. 1.75% 2031 | 5,575 | 5,597 | ||||||
Evergy Metro, Inc. 2.25% 2030 | 1,320 | 1,399 | ||||||
Eversource Energy 3.80% 2023 | 2,730 | 2,991 | ||||||
Exelon Corp. 3.40% 2026 | 100 | 113 | ||||||
Exelon Corp. 4.70% 2050 | 500 | 666 | ||||||
Exelon Corp., junior subordinated, 3.497% 20229 | 1,075 | 1,118 | ||||||
FirstEnergy Corp. 1.60% 2026 | 4,160 | 4,070 | ||||||
FirstEnergy Corp. 3.90% 2027 (4.40% on 1/16/2021)9 | 6,708 | 7,400 | ||||||
FirstEnergy Corp. 2.25% 2030 | 25,443 | 24,629 | ||||||
FirstEnergy Corp. 2.65% 2030 | 11,581 | 11,630 | ||||||
FirstEnergy Corp. 3.40% 2050 | 9,400 | 9,037 | ||||||
Florida Power & Light Co. 3.15% 2049 | 1,975 | 2,276 | ||||||
Gulf Power Co. 3.30% 2027 | 4,500 | 5,075 | ||||||
Interstate Power and Light Co. 2.30% 2030 | 825 | 874 | ||||||
Jersey Central Power & Light Co. 4.30% 20268 | 1,790 | 2,004 | ||||||
MidAmerican Energy Holdings Co. 3.10% 2027 | 2,000 | 2,244 | ||||||
Mississippi Power Co. 3.95% 2028 | 2,814 | 3,283 | ||||||
National Grid PLC 3.15% 20278 | 275 | 306 | ||||||
NextEra Energy Capital Holdings, Inc. 2.75% 2029 | 641 | 699 | ||||||
Northern States Power Co. 4.125% 2044 | 6,000 | 7,781 | ||||||
Northern States Power Co. 2.60% 2051 | 147 | 156 | ||||||
Oncor Electric Delivery Company LLC 2.75% 2024 | 1,525 | 1,636 | ||||||
Oncor Electric Delivery Company LLC 0.55% 20258 | 1,625 | 1,624 | ||||||
Pacific Gas and Electric Co. 1.75% 2022 | 1,575 | 1,580 | ||||||
Pacific Gas and Electric Co. 4.25% 2023 | 3,445 | 3,701 | ||||||
Pacific Gas and Electric Co. 3.40% 2024 | 1,385 | 1,476 | ||||||
Pacific Gas and Electric Co. 2.95% 2026 | 7,825 | 8,282 | ||||||
Pacific Gas and Electric Co. 3.15% 2026 | 6,925 | 7,385 | ||||||
Pacific Gas and Electric Co. 2.10% 2027 | 14,885 | 15,127 | ||||||
Pacific Gas and Electric Co. 3.30% 2027 | 5,118 | 5,484 | ||||||
Pacific Gas and Electric Co. 3.30% 2027 | 4,775 | 5,104 | ||||||
Pacific Gas and Electric Co. 3.75% 2028 | 500 | 547 | ||||||
Pacific Gas and Electric Co. 4.65% 2028 | 5,449 | 6,229 | ||||||
Pacific Gas and Electric Co. 2.50% 2031 | 21,246 | 21,300 | ||||||
Pacific Gas and Electric Co. 3.30% 2040 | 375 | 375 | ||||||
Pacific Gas and Electric Co. 3.75% 2042 | 1,505 | 1,517 | ||||||
122 American Funds Insurance Series
Table of Contents
Asset Allocation Fund (continued)
Bonds, notes & other debt instruments (continued)
| Principal amount (000) | Value (000) | |||||||
Corporate bonds, notes & loans (continued) | ||||||||
Utilities (continued) | ||||||||
Pacific Gas and Electric Co. 3.50% 2050 | $ | 5,012 | $ | 4,993 | ||||
PacifiCorp., First Mortgage Bonds, 3.60% 2024 | 5,695 | 6,210 | ||||||
PacifiCorp., First Mortgage Bonds, 4.125% 2049 | 5,500 | 7,072 | ||||||
Peco Energy Co. 2.80% 2050 | 975 | 1,038 | ||||||
PG&E Corp. 5.00% 2028 | 3,850 | 4,105 | ||||||
Public Service Company of Colorado 2.25% 2022 | 2,000 | 2,048 | ||||||
Public Service Company of Colorado 1.90% 2031 | 2,500 | 2,612 | ||||||
Public Service Company of Colorado 3.80% 2047 | 1,720 | 2,132 | ||||||
Public Service Electric and Gas Co. 3.65% 2028 | 1,700 | 1,975 | ||||||
Public Service Electric and Gas Co. 3.20% 2029 | 2,333 | 2,663 | ||||||
Public Service Electric and Gas Co. 2.45% 2030 | 679 | 738 | ||||||
Public Service Electric and Gas Co. 3.60% 2047 | 548 | 661 | ||||||
Public Service Electric and Gas Co. 2.05% 2050 | 1,840 | 1,731 | ||||||
Public Service Electric and Gas Co. 3.15% 2050 | 4,150 | 4,740 | ||||||
Public Service Enterprise Group Inc. 2.65% 2022 | 1,900 | 1,981 | ||||||
Public Service Enterprise Group Inc. 2.25% 2026 | 345 | 373 | ||||||
Public Service Enterprise Group Inc. 1.60% 2030 | 4,375 | 4,320 | ||||||
Puget Energy, Inc. 6.00% 2021 | 1,823 | 1,887 | ||||||
Puget Energy, Inc. 5.625% 2022 | 1,965 | 2,081 | ||||||
Puget Sound Energy, Inc. 3.25% 2049 | 3,000 | 3,339 | ||||||
San Diego Gas & Electric Co. 1.70% 2030 | 851 | 861 | ||||||
San Diego Gas & Electric Co. 6.125% 2037 | 1,450 | 1,998 | ||||||
San Diego Gas & Electric Co. 4.50% 2040 | 750 | 956 | ||||||
San Diego Gas & Electric Co. 3.75% 2047 | 331 | 388 | ||||||
San Diego Gas & Electric Co. 4.10% 2049 | 1,607 | 2,008 | ||||||
San Diego Gas & Electric Co. 3.32% 2050 | 500 | 570 | ||||||
Southern California Edison Co. 2.90% 2021 | 8,000 | 8,033 | ||||||
Southern California Edison Co. 3.70% 2025 | 611 | 686 | ||||||
Southern California Edison Co. 3.65% 2028 | 821 | 922 | ||||||
Southern California Edison Co. 2.85% 2029 | 5,450 | 5,949 | ||||||
Southern California Edison Co. 2.25% 2030 | 7,642 | 7,965 | ||||||
Southern California Edison Co. 6.00% 2034 | 2,500 | 3,482 | ||||||
Southern California Edison Co. 5.35% 2035 | 3,000 | 4,075 | ||||||
Southern California Edison Co. 5.75% 2035 | 675 | 933 | ||||||
Southern California Edison Co. 4.00% 2047 | 1,406 | 1,652 | ||||||
Southern California Edison Co. 4.125% 2048 | 2,902 | 3,468 | ||||||
Southern California Edison Co. 4.875% 2049 | 3,745 | 4,946 | ||||||
Southern California Edison Co. 3.65% 2050 | 1,030 | 1,171 | ||||||
Southern California Edison Co., Series C, 3.60% 2045 | 3,840 | 4,261 | ||||||
Southern California Gas Company 2.55% 2030 | 4,650 | 5,047 | ||||||
Talen Energy Corp. 10.50% 20268 | 885 | 789 | ||||||
Talen Energy Corp. 7.25% 20278 | 4,130 | 4,405 | ||||||
Talen Energy Supply, LLC 7.625% 20288 | 1,575 | 1,700 | ||||||
Union Electric Co. 2.625% 2051 | 5,625 | 5,896 | ||||||
Virginia Electric and Power Co. 3.80% 2028 | 2,000 | 2,343 | ||||||
Virginia Electric and Power Co. 4.00% 2043 | 969 | 1,220 | ||||||
Virginia Electric and Power Co. 4.60% 2048 | 2,650 | 3,723 | ||||||
Virginia Electric and Power Co. 2.45% 2050 | 1,825 | 1,835 | ||||||
Xcel Energy Inc. 3.35% 2026 | 5,000 | 5,646 | ||||||
Xcel Energy Inc. 2.60% 2029 | 4,758 | 5,155 | ||||||
Xcel Energy Inc. 3.40% 2030 | 1,000 | 1,151 | ||||||
Xcel Energy Inc. 6.50% 2036 | 2,000 | 3,011 | ||||||
Xcel Energy Inc. 3.50% 2049 | 1,276 | 1,496 | ||||||
|
| |||||||
| 456,786 | ||||||||
|
| |||||||
Energy 1.53% | ||||||||
American Energy-Permian Basin, LLC / AEPB Finance Corp. 12.00% 20248,13 | 2,935 | 22 | ||||||
Antero Resources Corp. 7.875% 20268 | 207 | 214 | ||||||
Apache Corp. 4.875% 2027 | 2,150 | 2,282 | ||||||
Apache Corp. 4.375% 2028 | 2,580 | 2,690 | ||||||
American Funds Insurance Series 123
Table of Contents
Asset Allocation Fund (continued)
Bonds, notes & other debt instruments (continued)
| Principal amount (000) | Value (000) | |||||||
Corporate bonds, notes & loans (continued) | ||||||||
Energy (continued) | ||||||||
Baker Hughes, a GE Co. 4.486% 2030 | $ | 1,596 | $ | 1,919 | ||||
Baker Hughes, a GE Co. 4.08% 2047 | 571 | 645 | ||||||
BP Capital Markets America Inc. 1.749% 2030 | 2,024 | 2,032 | ||||||
BP Capital Markets America Inc. 3.633% 2030 | 1,190 | 1,385 | ||||||
BP Capital Markets America Inc. 2.772% 2050 | 7,552 | 7,472 | ||||||
BP Capital Markets America Inc. 2.939% 2051 | 1,260 | 1,287 | ||||||
Canadian Natural Resources Ltd. 2.95% 2023 | 1,935 | 2,024 | ||||||
Canadian Natural Resources Ltd. 2.05% 2025 | 5,814 | 6,104 | ||||||
Canadian Natural Resources Ltd. 3.85% 2027 | 4,448 | 4,996 | ||||||
Canadian Natural Resources Ltd. 2.95% 2030 | 10,682 | 11,439 | ||||||
Canadian Natural Resources Ltd. 4.95% 2047 | 1,559 | 1,980 | ||||||
Cenovus Energy Inc. 3.80% 2023 | 3,970 | 4,125 | ||||||
Cenovus Energy Inc. 4.25% 2027 | 5,690 | 6,216 | ||||||
Cenovus Energy Inc. 6.75% 2039 | 400 | 529 | ||||||
Cheniere Energy Partners, LP 5.625% 2026 | 2,475 | 2,584 | ||||||
Cheniere Energy, Inc. 4.625% 20288 | 4,595 | 4,831 | ||||||
Cheniere Energy, Inc. 3.70% 2029 | 5,977 | 6,663 | ||||||
Chesapeake Energy Corp. 4.875% 202213 | 7,225 | 361 | ||||||
Chesapeake Energy Corp. 11.50% 20258,13 | 5,122 | 904 | ||||||
Chesapeake Energy Corp., Term Loan, (3-month USD-LIBOR + 8.00%) 8.223% 202410,12,13 | 6,132 | 5,028 | ||||||
Chevron Corp. 1.995% 2027 | 2,631 | 2,791 | ||||||
Chevron Corp. 2.236% 2030 | 1,862 | 1,994 | ||||||
Chevron Corp. 2.978% 2040 | 268 | 297 | ||||||
Chevron Corp. 3.078% 2050 | 301 | 335 | ||||||
Chevron USA Inc. 0.687% 2025 | 3,135 | 3,154 | ||||||
Chevron USA Inc. 1.018% 2027 | 7,311 | 7,309 | ||||||
CNX Resources Corp. 7.25% 20278 | 1,725 | 1,848 | ||||||
CNX Resources Corp. 6.00% 20298 | 425 | 436 | ||||||
Comstock Resources, Inc. 9.75% 2026 | 1,266 | 1,360 | ||||||
Concho Resources Inc. 4.30% 2028 | 9,615 | 11,370 | ||||||
Concho Resources Inc. 2.40% 2031 | 963 | 1,010 | ||||||
Concho Resources Inc. 4.85% 2048 | 750 | 1,010 | ||||||
Constellation Oil Services Holding SA 10.00% 2024 (100% PIK)8,11 | 1,084 | 309 | ||||||
Continental Resources Inc. 5.75% 20318 | 1,430 | 1,590 | ||||||
DCP Midstream Operating LP 4.95% 2022 | 3,145 | 3,250 | ||||||
Diamond Offshore Drilling, Inc. 4.875% 204313 | 5,610 | 711 | ||||||
Enbridge Energy Partners, LP 5.875% 2025 | 3,200 | 3,915 | ||||||
Enbridge Energy Partners, LP 7.375% 2045 | 544 | 831 | ||||||
Enbridge Energy Partners, LP, Series B, 7.50% 2038 | 2,000 | 2,841 | ||||||
Enbridge Inc. 4.00% 2023 | 1,678 | 1,827 | ||||||
Enbridge Inc. 2.50% 2025 | 1,700 | 1,822 | ||||||
Enbridge Inc. 3.70% 2027 | 162 | 185 | ||||||
Energy Transfer Operating, LP 2.90% 2025 | 1,601 | 1,695 | ||||||
Energy Transfer Operating, LP 3.75% 2030 | 1,361 | 1,469 | ||||||
Energy Transfer Operating, LP 5.00% 2050 | 23,216 | 25,161 | ||||||
Energy Transfer Partners, LP 4.50% 2024 | 1,210 | 1,325 | ||||||
Energy Transfer Partners, LP 4.75% 2026 | 2,494 | 2,823 | ||||||
Energy Transfer Partners, LP 5.25% 2029 | 5,757 | 6,723 | ||||||
Energy Transfer Partners, LP 6.00% 2048 | 774 | 921 | ||||||
Energy Transfer Partners, LP 6.25% 2049 | 6,257 | 7,569 | ||||||
Enterprise Products Operating LLC 2.80% 2030 | 942 | 1,022 | ||||||
Enterprise Products Operating LLC 4.90% 2046 | 500 | 637 | ||||||
Enterprise Products Operating LLC 3.20% 2052 | 1,954 | 1,993 | ||||||
EQM Midstream Partners, LP 4.125% 2026 | 686 | 692 | ||||||
EQM Midstream Partners, LP 6.50% 20278 | 2,690 | 3,033 | ||||||
EQM Midstream Partners, LP 5.50% 2028 | 2,588 | 2,834 | ||||||
EQT Corp. 7.875% 2025 | 1,295 | 1,477 | ||||||
EQT Corp. 3.90% 2027 | 450 | 448 | ||||||
EQT Corp. 5.00% 2029 | 340 | 359 | ||||||
EQT Corp. 8.75% 2030 | 1,110 | 1,358 | ||||||
124 American Funds Insurance Series
Table of Contents
Asset Allocation Fund (continued)
Bonds, notes & other debt instruments (continued)
| Principal amount (000) | Value (000) | |||||||
Corporate bonds, notes & loans (continued) | ||||||||
Energy (continued) | ||||||||
Equinor ASA 1.75% 2026 | $ | 4,064 | $ | 4,270 | ||||
Equinor ASA 3.625% 2028 | 3,685 | 4,295 | ||||||
Equinor ASA 3.25% 2049 | 5,320 | 5,912 | ||||||
Extraction Oil & Gas, Inc. 5.625% 20268,13 | 4,125 | 757 | ||||||
Exxon Mobil Corp. 2.222% 2021 | 3,070 | 3,074 | ||||||
Exxon Mobil Corp. 2.019% 2024 | 643 | 677 | ||||||
Exxon Mobil Corp. 2.992% 2025 | 2,000 | 2,190 | ||||||
Exxon Mobil Corp. 2.44% 2029 | 1,963 | 2,133 | ||||||
Exxon Mobil Corp. 3.452% 2051 | 596 | 681 | ||||||
Genesis Energy, LP 5.625% 2024 | 575 | 560 | ||||||
Genesis Energy, LP 6.50% 2025 | 3,572 | 3,480 | ||||||
Genesis Energy, LP 8.00% 2027 | 595 | 594 | ||||||
Halliburton Company 3.80% 2025 | 16 | 18 | ||||||
Harvest Midstream I, LP 7.50% 20288 | 850 | 906 | ||||||
Hess Midstream Partners LP 5.125% 20288 | 2,155 | 2,255 | ||||||
Hilcorp Energy I, LP 5.75% 20258 | 2,575 | 2,613 | ||||||
Kinder Morgan, Inc. 4.30% 2028 | 4,359 | 5,116 | ||||||
Kinder Morgan, Inc. 2.00% 2031 | 3,000 | 3,034 | ||||||
Kinder Morgan, Inc. 3.25% 2050 | 1,338 | 1,347 | ||||||
Marathon Oil Corp. 4.40% 2027 | 1,005 | 1,117 | ||||||
MPLX LP 1.75% 2026 | 1,756 | 1,818 | ||||||
MPLX LP 4.125% 2027 | 500 | 577 | ||||||
MPLX LP 4.80% 2029 | 1,724 | 2,084 | ||||||
MPLX LP 2.65% 2030 | 8,266 | 8,672 | ||||||
MPLX LP 4.50% 2038 | 750 | 858 | ||||||
MPLX LP 4.70% 2048 | 2,500 | 2,970 | ||||||
MPLX LP 5.50% 2049 | 6,393 | 8,419 | ||||||
New Fortress Energy Inc. 6.75% 20258 | 17 | 18 | ||||||
NGL Energy Partners LP 7.50% 2023 | 1,610 | 1,143 | ||||||
NGL Energy Partners LP 6.125% 2025 | 8,322 | 5,295 | ||||||
Occidental Petroleum Corp. 4.85% 2021 | 2,751 | 2,763 | ||||||
Occidental Petroleum Corp. 2.90% 2024 | 2,698 | 2,601 | ||||||
Occidental Petroleum Corp. 5.50% 2025 | 1,640 | 1,713 | ||||||
Occidental Petroleum Corp. 6.375% 2028 | 1,855 | 1,965 | ||||||
ONEOK, Inc. 2.20% 2025 | 527 | 550 | ||||||
ONEOK, Inc. 5.85% 2026 | 16,837 | 20,185 | ||||||
ONEOK, Inc. 3.10% 2030 | 2,141 | 2,283 | ||||||
ONEOK, Inc. 6.35% 2031 | 1,601 | 2,056 | ||||||
ONEOK, Inc. 5.20% 2048 | 298 | 348 | ||||||
ONEOK, Inc. 4.50% 2050 | 873 | 918 | ||||||
ONEOK, Inc. 7.15% 2051 | 812 | 1,125 | ||||||
Ovintiv Inc. 6.50% 2034 | 1,825 | 2,114 | ||||||
Parsley Energy, Inc. 5.25% 20258 | 403 | 421 | ||||||
Peabody Energy Corp. 6.00% 20228 | 2,750 | 2,013 | ||||||
Petrobras Global Finance Co. 6.75% 2050 | 2,240 | 2,786 | ||||||
Petróleos Mexicanos 6.875% 20258 | 5,700 | 6,255 | ||||||
Petróleos Mexicanos 5.35% 2028 | 1,870 | 1,848 | ||||||
Phillips 66 3.90% 2028 | 2,107 | 2,432 | ||||||
Phillips 66 2.15% 2030 | 1,541 | 1,567 | ||||||
Phillips 66 Partners LP 3.55% 2026 | 160 | 175 | ||||||
Phillips 66 Partners LP 4.68% 2045 | 400 | 434 | ||||||
Phillips 66 Partners LP 4.90% 2046 | 275 | 308 | ||||||
Pioneer Natural Resources Company 1.90% 2030 | 2,564 | 2,542 | ||||||
Plains All American Pipeline, LP 3.80% 2030 | 830 | 893 | ||||||
Rattler Midstream Partners LP 5.625% 20258 | 355 | 376 | ||||||
Rockies Express Pipeline LLC 4.95% 20298 | 2,689 | 2,802 | ||||||
Sabine Pass Liquefaction, LLC 5.875% 2026 | 923 | 1,117 | ||||||
Sabine Pass Liquefaction, LLC 4.20% 2028 | 1,307 | 1,501 | ||||||
Sabine Pass Liquefaction, LLC 4.50% 20308 | 11,548 | 13,696 | ||||||
Saudi Arabian Oil Co. 1.25% 20238 | 250 | 253 | ||||||
Saudi Arabian Oil Co. 1.625% 20258 | 1,160 | 1,189 | ||||||
American Funds Insurance Series 125
Table of Contents
Asset Allocation Fund (continued)
Bonds, notes & other debt instruments (continued)
| Principal amount (000) | Value (000) | |||||||
Corporate bonds, notes & loans (continued) | ||||||||
Energy (continued) | ||||||||
Saudi Arabian Oil Co. 2.25% 20308 | $ | 1,800 | $ | 1,834 | ||||
Schlumberger BV 3.75% 20248 | 495 | 540 | ||||||
Schlumberger BV 4.00% 20258 | 70 | 80 | ||||||
Shell International Finance BV 3.875% 2028 | 2,787 | 3,302 | ||||||
Shell International Finance BV 2.75% 2030 | 5,000 | 5,520 | ||||||
Shell International Finance BV 3.25% 2050 | 907 | 1,029 | ||||||
Southwestern Energy Co. 6.45% 20259 | 1,760 | 1,829 | ||||||
Southwestern Energy Co. 7.50% 2026 | 335 | 352 | ||||||
Southwestern Energy Co. 8.375% 2028 | 395 | 429 | ||||||
Statoil ASA 2.75% 2021 | 1,925 | 1,964 | ||||||
Statoil ASA 3.25% 2024 | 2,850 | 3,143 | ||||||
Statoil ASA 4.25% 2041 | 2,000 | 2,515 | ||||||
Suncor Energy Inc. 3.10% 2025 | 3,687 | 4,042 | ||||||
Sunoco Logistics Operating Partners, LP 5.40% 2047 | 650 | 733 | ||||||
Tallgrass Energy Partners, LP 7.50% 20258 | 550 | 595 | ||||||
Targa Resources Partners LP 5.875% 2026 | 1,350 | 1,434 | ||||||
Targa Resources Partners LP 5.50% 2030 | 2,260 | 2,456 | ||||||
Targa Resources Partners LP 4.875% 20318 | 1,065 | 1,157 | ||||||
Teekay Corp. 9.25% 20228 | 4,825 | 4,934 | ||||||
Teekay Offshore Partners LP 8.50% 20238 | 3,550 | 3,026 | ||||||
Total Capital International 3.127% 2050 | 808 | 877 | ||||||
Total SE 2.986% 2041 | 11,607 | 12,705 | ||||||
TransCanada PipeLines Ltd. 4.25% 2028 | 1,090 | 1,288 | ||||||
TransCanada PipeLines Ltd. 4.10% 2030 | 7,951 | 9,400 | ||||||
TransCanada PipeLines Ltd. 4.75% 2038 | 3,000 | 3,754 | ||||||
TransCanada PipeLines Ltd. 4.875% 2048 | 700 | 905 | ||||||
Valero Energy Corp. 4.00% 2029 | 4,000 | 4,501 | ||||||
Vine Oil & Gas LP 8.75% 20238 | 2,500 | 2,000 | ||||||
Weatherford International PLC 8.75% 20248 | 3,571 | 3,584 | ||||||
Weatherford International PLC 11.00% 20248 | 9,918 | 7,761 | ||||||
Western Gas Partners LP 4.50% 2028 | 4,450 | 4,628 | ||||||
Williams Companies, Inc. 3.50% 2030 | 10,474 | 11,871 | ||||||
Williams Partners LP 4.30% 2024 | 85 | 94 | ||||||
Woodside Finance Ltd. 4.60% 20218 | 1,965 | 1,973 | ||||||
|
| |||||||
| 453,833 | ||||||||
|
| |||||||
Health care 1.51% | ||||||||
Abbott Laboratories 3.40% 2023 | 185 | 201 | ||||||
Abbott Laboratories 3.75% 2026 | 5,012 | 5,874 | ||||||
Abbott Laboratories 4.75% 2036 | 460 | 634 | ||||||
Abbott Laboratories 4.90% 2046 | 500 | 740 | ||||||
AbbVie Inc. 2.60% 2024 | 3,000 | 3,218 | ||||||
AbbVie Inc. 3.60% 2025 | 10,000 | 11,150 | ||||||
AbbVie Inc. 3.80% 2025 | 206 | 230 | ||||||
AbbVie Inc. 2.95% 2026 | 1,445 | 1,600 | ||||||
Amgen Inc. 2.20% 2027 | 2,429 | 2,605 | ||||||
Anthem, Inc. 2.375% 2025 | 818 | 875 | ||||||
AstraZeneca PLC 2.375% 2022 | 4,072 | 4,186 | ||||||
AstraZeneca PLC 3.375% 2025 | 13,790 | 15,515 | ||||||
AstraZeneca PLC 0.70% 2026 | 8,935 | 8,892 | ||||||
AstraZeneca PLC 1.375% 2030 | 2,000 | 1,981 | ||||||
Bausch Health Companies Inc. 5.00% 20288 | 1,735 | 1,790 | ||||||
Bausch Health Companies Inc. 5.25% 20318 | 1,610 | 1,685 | ||||||
Bayer US Finance II LLC 3.875% 20238 | 1,685 | 1,837 | ||||||
Bayer US Finance II LLC 4.25% 20258 | 425 | 486 | ||||||
Bayer US Finance II LLC 4.375% 20288 | 312 | 367 | ||||||
Bayer US Finance II LLC 4.20% 20348 | 460 | 510 | ||||||
Becton, Dickinson and Company 2.894% 2022 | 9,020 | 9,325 | ||||||
Becton, Dickinson and Company 3.363% 2024 | 647 | 703 | ||||||
Becton, Dickinson and Company 3.70% 2027 | 19,246 | 22,091 | ||||||
126 American Funds Insurance Series
Table of Contents
Asset Allocation Fund (continued)
Bonds, notes & other debt instruments (continued)
| Principal amount (000) | Value (000) | |||||||
Corporate bonds, notes & loans (continued) | ||||||||
Health care (continued) | ||||||||
Becton, Dickinson and Company 2.823% 2030 | $ | 1,271 | $ | 1,398 | ||||
Boston Scientific Corp. 3.45% 2024 | 3,100 | 3,361 | ||||||
Boston Scientific Corp. 1.90% 2025 | 5,856 | 6,154 | ||||||
Boston Scientific Corp. 3.85% 2025 | 2,289 | 2,584 | ||||||
Boston Scientific Corp. 3.75% 2026 | 2,595 | 2,946 | ||||||
Boston Scientific Corp. 4.00% 2029 | 1,550 | 1,827 | ||||||
Boston Scientific Corp. 2.65% 2030 | 4,030 | 4,328 | ||||||
Boston Scientific Corp. 4.70% 2049 | 515 | 707 | ||||||
Centene Corp. 4.75% 2025 | 4,000 | 4,110 | ||||||
Centene Corp. 4.25% 2027 | 565 | 600 | ||||||
Centene Corp. 4.625% 2029 | 9,665 | 10,743 | ||||||
Centene Corp. 3.00% 2030 | 6,895 | 7,317 | ||||||
Centene Corp. 3.375% 2030 | 3,397 | 3,579 | ||||||
Cigna Corp. 3.40% 2021 | 1,350 | 1,379 | ||||||
Cigna Corp. 3.75% 2023 | 1,836 | 1,985 | ||||||
Cigna Corp. 4.125% 2025 | 2,000 | 2,304 | ||||||
Cigna Corp. 4.80% 2038 | 3,880 | 5,058 | ||||||
CVS Health Corp. 3.35% 2021 | 194 | 195 | ||||||
CVS Health Corp. 3.70% 2023 | 69 | 74 | ||||||
CVS Health Corp. 1.30% 2027 | 3,760 | 3,778 | ||||||
CVS Health Corp. 4.30% 2028 | 588 | 700 | ||||||
CVS Health Corp. 1.75% 2030 | 4,000 | 4,025 | ||||||
CVS Health Corp. 1.875% 2031 | 4,000 | 4,050 | ||||||
Eli Lilly and Co. 3.375% 2029 | 3,330 | 3,867 | ||||||
Encompass Health Corp. 4.50% 2028 | 1,449 | 1,517 | ||||||
Endo Dac / Endo Finance LLC / Endo Finco 9.50% 20278 | 4,517 | 5,051 | ||||||
Endo International PLC 5.75% 20228 | 7,340 | 7,129 | ||||||
GlaxoSmithKline PLC 3.625% 2025 | 4,585 | 5,154 | ||||||
HCA Inc. 5.875% 2023 | 2,125 | 2,338 | ||||||
HCA Inc. 5.375% 2025 | 515 | 580 | ||||||
HCA Inc. 4.125% 2029 | 2,250 | 2,612 | ||||||
HCA Inc. 3.50% 2030 | 2,125 | 2,259 | ||||||
HealthSouth Corp. 5.75% 2025 | 2,685 | 2,779 | ||||||
LifePoint Health, Inc. 5.375% 20298 | 1,680 | 1,681 | ||||||
Mallinckrodt PLC 10.00% 20258 | 7,120 | 7,743 | ||||||
Medtronic, Inc. 3.50% 2025 | 701 | 787 | ||||||
Molina Healthcare, Inc. 5.375% 2022 | 6,985 | 7,408 | ||||||
Molina Healthcare, Inc. 3.875% 20308 | 720 | 774 | ||||||
Novartis Capital Corp. 1.75% 2025 | 4,731 | 4,965 | ||||||
Novartis Capital Corp. 2.00% 2027 | 4,336 | 4,630 | ||||||
Novartis Capital Corp. 2.20% 2030 | 2,385 | 2,562 | ||||||
Owens & Minor, Inc. 4.375% 2024 | 5,615 | 5,773 | ||||||
Owens & Minor, Inc., Term Loan B, (3-month USD-LIBOR + 4.50%) 4.655% 202510,12 | 1,867 | 1,865 | ||||||
Par Pharmaceutical Inc. 7.50% 20278 | 7,028 | 7,635 | ||||||
Partners HealthCare System, Inc. 3.192% 2049 | 1,920 | 2,124 | ||||||
Pfizer Inc. 2.95% 2024 | 3,825 | 4,128 | ||||||
Pfizer Inc. 3.45% 2029 | 8,000 | 9,352 | ||||||
Regeneron Pharmaceuticals, Inc. 1.75% 2030 | 5,529 | 5,451 | ||||||
Regeneron Pharmaceuticals, Inc. 2.80% 2050 | 6,055 | 5,891 | ||||||
Rotech Healthcare Inc., Term Loan, (3-month USD-LIBOR + 11.00%) 13.00% 2023 (100% PIK)1,5,10,11,12 | 4,079 | 4,079 | ||||||
Shire PLC 2.40% 2021 | 1,227 | 1,243 | ||||||
Shire PLC 2.875% 2023 | 3,413 | 3,621 | ||||||
Shire PLC 3.20% 2026 | 14,821 | 16,589 | ||||||
Takeda Pharmaceutical Company, Ltd. 2.05% 2030 | 3,408 | 3,489 | ||||||
Team Health Holdings, Inc. 6.375% 20258 | 8,415 | 7,279 | ||||||
Team Health Holdings, Inc., Term Loan B, 3.75% 202410,12 | 2,177 | 1,962 | ||||||
Tenet Healthcare Corp. 4.625% 2024 | 1,953 | 2,004 | ||||||
Tenet Healthcare Corp. 4.875% 20268 | 16,225 | 16,993 | ||||||
Teva Pharmaceutical Finance Co. BV 2.80% 2023 | 12,560 | 12,457 | ||||||
Teva Pharmaceutical Finance Co. BV 6.00% 2024 | 12,016 | 12,765 | ||||||
American Funds Insurance Series 127
Table of Contents
Asset Allocation Fund (continued)
Bonds, notes & other debt instruments (continued)
| Principal amount (000) | Value (000) | |||||||
Corporate bonds, notes & loans (continued) | ||||||||
Health care (continued) | ||||||||
Teva Pharmaceutical Finance Co. BV 7.125% 2025 | $ | 1,935 | $ | 2,143 | ||||
Teva Pharmaceutical Finance Co. BV 3.15% 2026 | 28,373 | 27,327 | ||||||
Teva Pharmaceutical Finance Co. BV 4.10% 2046 | 3,550 | 3,168 | ||||||
Thermo Fisher Scientific Inc. 4.497% 2030 | 883 | 1,104 | ||||||
UnitedHealth Group Inc. 2.375% 2024 | 590 | 629 | ||||||
UnitedHealth Group Inc. 3.50% 2024 | 4,500 | 4,925 | ||||||
UnitedHealth Group Inc. 3.375% 2027 | 245 | 280 | ||||||
UnitedHealth Group Inc. 3.875% 2028 | 2,500 | 3,001 | ||||||
UnitedHealth Group Inc. 2.875% 2029 | 1,050 | 1,194 | ||||||
UnitedHealth Group Inc. 4.45% 2048 | 5,315 | 7,337 | ||||||
Upjohn Inc. 2.30% 20278 | 2,447 | 2,608 | ||||||
Upjohn Inc. 2.70% 20308 | 5,692 | 6,042 | ||||||
Upjohn Inc. 3.85% 20408 | 3,531 | 3,985 | ||||||
Upjohn Inc. 4.00% 20508 | 2,907 | 3,331 | ||||||
Valeant Pharmaceuticals International, Inc. 6.125% 20258 | 14,550 | 15,011 | ||||||
Zimmer Holdings, Inc. 3.15% 2022 | 7,070 | 7,273 | ||||||
|
| |||||||
| 447,591 | ||||||||
|
| |||||||
Communication services 1.37% | ||||||||
Alphabet Inc. 1.998% 2026 | 3,000 | 3,218 | ||||||
Alphabet Inc. 1.10% 2030 | 10,770 | 10,620 | ||||||
Alphabet Inc. 1.90% 2040 | 2,190 | 2,150 | ||||||
Alphabet Inc. 2.05% 2050 | 440 | 420 | ||||||
Alphabet Inc. 2.25% 2060 | 4,085 | 3,955 | ||||||
AT&T Inc. 1.65% 2028 | 10,775 | 11,003 | ||||||
AT&T Inc. 2.75% 2031 | 9,742 | 10,417 | ||||||
AT&T Inc. 2.25% 2032 | 7,525 | 7,644 | ||||||
AT&T Inc. 2.55% 20338 | 348 | 359 | ||||||
AT&T Inc. 3.50% 20538 | 6,966 | 6,966 | ||||||
CCO Holdings LLC and CCO Holdings Capital Corp. 4.908% 2025 | 500 | 581 | ||||||
CCO Holdings LLC and CCO Holdings Capital Corp. 5.75% 20268 | 5,050 | 5,217 | ||||||
CCO Holdings LLC and CCO Holdings Capital Corp. 5.05% 2029 | 1,150 | 1,399 | ||||||
CCO Holdings LLC and CCO Holdings Capital Corp. 4.50% 20308 | 3,500 | 3,719 | ||||||
CCO Holdings LLC and CCO Holdings Capital Corp. 4.75% 20308 | 2,500 | 2,701 | ||||||
CCO Holdings LLC and CCO Holdings Capital Corp. 2.80% 2031 | 10,842 | 11,468 | ||||||
CCO Holdings LLC and CCO Holdings Capital Corp. 4.25% 20318 | 2,975 | 3,139 | ||||||
CCO Holdings LLC and CCO Holdings Capital Corp. 2.30% 2032 | 2,500 | 2,504 | ||||||
CCO Holdings LLC and CCO Holdings Capital Corp. 4.50% 20328 | 2,710 | 2,897 | ||||||
CCO Holdings LLC and CCO Holdings Capital Corp. 5.125% 2049 | 570 | 696 | ||||||
CCO Holdings LLC and CCO Holdings Capital Corp. 4.80% 2050 | 800 | 956 | ||||||
CCO Holdings LLC and CCO Holdings Capital Corp. 3.70% 2051 | 3,770 | 3,922 | ||||||
CenturyLink, Inc. 6.75% 2023 | 2,500 | 2,789 | ||||||
CenturyLink, Inc. 7.50% 2024 | 1,500 | 1,701 | ||||||
CenturyLink, Inc. 5.125% 20268 | 2,050 | 2,168 | ||||||
CenturyLink, Inc. 4.00% 20278 | 700 | 724 | ||||||
Comcast Corp. 3.00% 2024 | 500 | 538 | ||||||
Comcast Corp. 3.70% 2024 | 2,245 | 2,471 | ||||||
Comcast Corp. 3.95% 2025 | 1,470 | 1,690 | ||||||
Comcast Corp. 2.35% 2027 | 4,000 | 4,307 | ||||||
Comcast Corp. 4.15% 2028 | 2,608 | 3,140 | ||||||
Comcast Corp. 1.50% 2031 | 4,000 | 3,976 | ||||||
Comcast Corp. 1.95% 2031 | 9,236 | 9,506 | ||||||
Comcast Corp. 3.20% 2036 | 750 | 853 | ||||||
Comcast Corp. 3.90% 2038 | 1,000 | 1,224 | ||||||
Comcast Corp. 4.60% 2038 | 2,000 | 2,635 | ||||||
Comcast Corp. 3.75% 2040 | 594 | 716 | ||||||
Comcast Corp. 4.00% 2048 | 250 | 315 | ||||||
Comcast Corp. 2.80% 2051 | 1,791 | 1,866 | ||||||
Comcast Corp. 2.45% 2052 | 2,000 | 1,948 | ||||||
Deutsche Telekom International Finance BV 9.25% 2032 | 3,570 | 6,016 | ||||||
128 American Funds Insurance Series
Table of Contents
Asset Allocation Fund (continued)
Bonds, notes & other debt instruments (continued)
| Principal amount (000) | Value (000) | |||||||
Corporate bonds, notes & loans (continued) | ||||||||
Communication services (continued) | ||||||||
Discovery Communications, Inc. 3.625% 2030 | $ | 5,512 | $ | 6,318 | ||||
Discovery Communications, Inc. 4.65% 2050 | 920 | 1,152 | ||||||
Embarq Corp. 7.995% 2036 | 3,075 | 3,799 | ||||||
Fox Corp. 4.03% 2024 | 1,120 | 1,234 | ||||||
France Télécom 4.125% 2021 | 2,500 | 2,563 | ||||||
Frontier Communications Corp. 5.875% 20278 | 2,225 | 2,410 | ||||||
Frontier Communications Corp. 5.00% 20288 | 2,175 | 2,272 | ||||||
Frontier Communications Corp. 6.75% 20298 | 775 | 831 | ||||||
Gogo Inc. 9.875% 20248 | 20,346 | 21,823 | ||||||
iHeartCommunications, Inc. 5.25% 20278 | 2,493 | 2,616 | ||||||
Intelsat Jackson Holding Co. 8.00% 20248 | 7,275 | 7,460 | ||||||
Intelsat Jackson Holding Co. 8.50% 20248,13 | 7,650 | 5,488 | ||||||
Intelsat Jackson Holding Co., Term Loan, (3-month USD-LIBOR + 5.50%) 6.50% 202110,12 | 2,072 | 2,122 | ||||||
Intelsat Jackson Holding Co., Term Loan, 6.625% 202410 | 1,400 | 1,428 | ||||||
Liberty Global PLC 5.50% 20288 | 2,075 | 2,193 | ||||||
Ligado Networks LLC 15.50% 20238,11 | 4,325 | 4,217 | ||||||
Live Nation Entertainment, Inc. 3.75% 20288 | 575 | 582 | ||||||
MDC Partners Inc. 6.50% 20248 | 3,225 | 3,274 | ||||||
NBCUniversal Enterprise, Inc., junior subordinated, 5.25% 20498 | 4,630 | 4,728 | ||||||
Nexstar Broadcasting, Inc. 4.75% 20288 | 1,350 | 1,415 | ||||||
Scripps Escrow II, Inc. 3.875% 20298 | 450 | 470 | ||||||
Sinclair Television Group, Inc. 4.125% 20308 | 1,175 | 1,206 | ||||||
Sirius XM Radio Inc. 3.875% 20228 | 3,450 | 3,506 | ||||||
Sirius XM Radio Inc. 4.625% 20248 | 3,345 | 3,470 | ||||||
Sprint Corp. 7.625% 2026 | 4,125 | 5,126 | ||||||
Sprint Corp. 6.875% 2028 | 6,900 | 9,110 | ||||||
TEGNA Inc. 4.75% 20268 | 2,350 | 2,512 | ||||||
TEGNA Inc. 4.625% 20288 | 425 | 435 | ||||||
T-Mobile US, Inc. 1.50% 20268 | 3,000 | 3,077 | ||||||
T-Mobile US, Inc. 2.05% 20288 | 10,100 | 10,518 | ||||||
T-Mobile US, Inc. 3.875% 20308 | 18,459 | 21,399 | ||||||
T-Mobile US, Inc. 2.55% 20318 | 9,149 | 9,619 | ||||||
T-Mobile US, Inc. 4.50% 20508 | 7,638 | 9,435 | ||||||
T-Mobile US, Inc. 3.30% 20518 | 7,565 | 7,797 | ||||||
Trilogy International Partners, LLC 8.875% 20228 | 12,800 | 12,381 | ||||||
Uniti Group LP / Uniti Fiber Holdings Inc. / CSL Capital LLC 7.875% 20258 | 425 | 457 | ||||||
Univision Communications Inc. 6.625% 20278 | 4,800 | 5,164 | ||||||
Verizon Communications Inc. 3.00% 2027 | 2,200 | 2,439 | ||||||
Verizon Communications Inc. 4.329% 2028 | 5,785 | 6,968 | ||||||
Verizon Communications Inc. 3.875% 2029 | 250 | 295 | ||||||
Verizon Communications Inc. 4.016% 2029 | 1,902 | 2,259 | ||||||
Verizon Communications Inc. 1.68% 20308 | 983 | 980 | ||||||
Verizon Communications Inc. 1.75% 2031 | 6,012 | 5,989 | ||||||
Verizon Communications Inc. 4.50% 2033 | 2,000 | 2,522 | ||||||
Verizon Communications Inc. 4.272% 2036 | 582 | 722 | ||||||
Verizon Communications Inc. 2.65% 2040 | 16,740 | 16,931 | ||||||
Verizon Communications Inc. 2.875% 2050 | 5,500 | 5,547 | ||||||
Verizon Communications Inc. 3.00% 2060 | 2,500 | 2,517 | ||||||
Virgin Media O2 4.25% 20318 | 2,075 | 2,125 | ||||||
Virgin Media Secured Finance PLC 4.50% 20308 | 2,590 | 2,709 | ||||||
Vodafone Group PLC 3.75% 2024 | 3,788 | 4,141 | ||||||
Vodafone Group PLC 4.125% 2025 | 2,500 | 2,860 | ||||||
Vodafone Group PLC 4.375% 2028 | 350 | 419 | ||||||
Vodafone Group PLC 5.25% 2048 | 500 | 696 | ||||||
Vodafone Group PLC 4.25% 2050 | 8,000 | 9,928 | ||||||
Walt Disney Company 2.65% 2031 | 2,000 | 2,193 | ||||||
Ziggo Bond Co. BV 5.125% 20308 | 1,775 | 1,875 | ||||||
Ziggo Bond Finance BV 5.50% 20278 | 4,813 | 5,032 | ||||||
|
| |||||||
| 407,288 | ||||||||
|
| |||||||
American Funds Insurance Series 129
Table of Contents
Asset Allocation Fund (continued)
Bonds, notes & other debt instruments (continued)
| Principal amount (000) | Value (000) | |||||||
Corporate bonds, notes & loans (continued) | ||||||||
Industrials 1.01% | ||||||||
Allison Transmission Holdings, Inc. 3.75% 20318 | $ | 2,175 | $ | 2,229 | ||||
Associated Materials, LLC 9.00% 20258 | 3,749 | 3,983 | ||||||
Avis Budget Car Rental, LLC 5.75% 20278 | 2,025 | 2,072 | ||||||
Avis Budget Group, Inc. 5.25% 20258 | 2,275 | 2,291 | ||||||
Avis Budget Group, Inc. 10.50% 20258 | 2,719 | 3,214 | ||||||
Avolon Holdings Funding Ltd. 3.625% 20228 | 1,254 | 1,281 | ||||||
Avolon Holdings Funding Ltd. 3.95% 20248 | 1,587 | 1,677 | ||||||
Avolon Holdings Funding Ltd. 4.25% 20268 | 1,126 | 1,214 | ||||||
Avolon Holdings Funding Ltd. 4.375% 20268 | 1,975 | 2,141 | ||||||
Boeing Company 2.70% 2022 | 4,400 | 4,524 | ||||||
Boeing Company 4.875% 2025 | 5,529 | 6,306 | ||||||
Boeing Company 2.75% 2026 | 18,731 | 19,706 | ||||||
Boeing Company 3.10% 2026 | 1,508 | 1,615 | ||||||
Boeing Company 5.04% 2027 | 3,000 | 3,511 | ||||||
Boeing Company 3.25% 2028 | 13,481 | 14,460 | ||||||
Boeing Company 5.15% 2030 | 2,061 | 2,498 | ||||||
Boeing Company 3.625% 2031 | 4,615 | 5,064 | ||||||
Boeing Company 3.60% 2034 | 7,500 | 7,933 | ||||||
Boeing Company 3.50% 2039 | 250 | 253 | ||||||
Boeing Company 3.75% 2050 | 1,300 | 1,367 | ||||||
Boeing Company 5.805% 2050 | 1,100 | 1,520 | ||||||
Bombardier Inc. 8.75% 20218 | 1,250 | 1,302 | ||||||
Bombardier Inc. 7.875% 20278 | 2,120 | 1,952 | ||||||
Burlington Northern Santa Fe, LLC 4.40% 2042 | 5,000 | 6,639 | ||||||
Burlington Northern Santa Fe, LLC 3.05% 2051 | 4,860 | 5,519 | ||||||
Canadian National Railway Company 3.20% 2046 | 1,320 | 1,566 | ||||||
Carrier Global Corp. 2.242% 2025 | 1,560 | 1,653 | ||||||
Carrier Global Corp. 2.493% 2027 | 762 | 823 | ||||||
Carrier Global Corp. 2.722% 2030 | 687 | 735 | ||||||
CSX Corp. 3.80% 2028 | 4,060 | 4,737 | ||||||
CSX Corp. 4.25% 2029 | 3,062 | 3,713 | ||||||
CSX Corp. 4.30% 2048 | 1,125 | 1,448 | ||||||
CSX Corp. 3.35% 2049 | 563 | 642 | ||||||
CSX Corp. 2.50% 2051 | 5,350 | 5,314 | ||||||
Dun & Bradstreet Corp. 6.875% 20268 | 1,067 | 1,149 | ||||||
Fortress Transportation and Infrastructure Investors LLC 6.50% 20258 | 1,040 | 1,091 | ||||||
GE Capital International Funding Co. 4.418% 2035 | 1,200 | 1,433 | ||||||
General Dynamics Corp. 3.375% 2023 | 1,000 | 1,070 | ||||||
General Dynamics Corp. 3.50% 2025 | 329 | 368 | ||||||
General Electric Co. 3.45% 2027 | 2,150 | 2,428 | ||||||
General Electric Co. 3.625% 2030 | 800 | 915 | ||||||
General Electric Co. 4.25% 2040 | 550 | 650 | ||||||
General Electric Co. 4.35% 2050 | 1,075 | 1,307 | ||||||
Honeywell International Inc. 2.15% 2022 | 4,400 | 4,519 | ||||||
Honeywell International Inc. 2.30% 2024 | 6,925 | 7,386 | ||||||
Honeywell International Inc. 1.35% 2025 | 5,947 | 6,157 | ||||||
Honeywell International Inc. 2.70% 2029 | 4,330 | 4,849 | ||||||
Honeywell International Inc. 1.95% 2030 | 2,000 | 2,119 | ||||||
Howmet Aerospace Inc. 6.875% 2025 | 1,885 | 2,227 | ||||||
Icahn Enterprises Finance Corp. 4.75% 2024 | 3,590 | 3,735 | ||||||
L3Harris Technologies, Inc. 1.80% 2031 | 2,625 | 2,675 | ||||||
MasTec, Inc. 4.50% 20288 | 1,425 | 1,498 | ||||||
Meritor, Inc. 4.50% 20288 | 1,025 | 1,053 | ||||||
Nielsen Finance LLC and Nielsen Finance Co. 5.00% 20258 | 2,175 | 2,236 | ||||||
Norfolk Southern Corp. 3.00% 2022 | 2,056 | 2,111 | ||||||
Norfolk Southern Corp. 3.05% 2050 | 4,151 | 4,552 | ||||||
Northrop Grumman Corp. 2.55% 2022 | 5,400 | 5,610 | ||||||
Northrop Grumman Corp. 2.93% 2025 | 1,820 | 1,980 | ||||||
Northrop Grumman Corp. 3.25% 2028 | 3,495 | 3,953 | ||||||
Otis Worldwide Corp. 2.293% 2027 | 2,135 | 2,283 | ||||||
Otis Worldwide Corp. 2.565% 2030 | 3,000 | 3,225 | ||||||
130 American Funds Insurance Series
Table of Contents
Asset Allocation Fund (continued)
Bonds, notes & other debt instruments (continued)
| Principal amount (000) | Value (000) | |||||||
Corporate bonds, notes & loans (continued) | ||||||||
Industrials (continued) | ||||||||
R.R. Donnelley & Sons Co. 6.50% 2023 | $ | 2,635 | $ | 2,724 | ||||
Raytheon Technologies Corp. 2.80% 2022 | 1,500 | 1,543 | ||||||
Rolls-Royce PLC 5.75% 20278 | 765 | 848 | ||||||
Siemens AG 2.70% 20228 | 2,685 | 2,758 | ||||||
SkyMiles IP Ltd. 4.75% 20288 | 3,975 | 4,342 | ||||||
The Brink’s Co. 4.625% 20278 | 2,385 | 2,497 | ||||||
TransDigm Inc. 6.50% 2024 | 33,817 | 34,480 | ||||||
TransDigm Inc. 6.25% 20268 | 451 | 481 | ||||||
TransDigm Inc. 5.50% 2027 | 1,100 | 1,158 | ||||||
Triumph Group, Inc. 5.25% 2022 | 740 | 707 | ||||||
Triumph Group, Inc. 6.25% 20248 | 970 | 964 | ||||||
Triumph Group, Inc. 8.875% 20248 | 970 | 1,066 | ||||||
Triumph Group, Inc. 7.75% 20258 | 875 | 803 | ||||||
Union Pacific Corp. 3.15% 2024 | 1,287 | 1,394 | ||||||
Union Pacific Corp. 3.75% 2025 | 4,643 | 5,273 | ||||||
Union Pacific Corp. 2.15% 2027 | 2,318 | 2,465 | ||||||
Union Pacific Corp. 3.95% 2028 | 1,875 | 2,228 | ||||||
Union Pacific Corp. 3.70% 2029 | 6,500 | 7,547 | ||||||
Union Pacific Corp. 2.40% 2030 | 2,414 | 2,603 | ||||||
Union Pacific Corp. 4.30% 2049 | 2,690 | 3,511 | ||||||
Union Pacific Corp. 3.25% 2050 | 371 | 423 | ||||||
Union Pacific Corp. 3.95% 2059 | 1,365 | 1,697 | ||||||
Union Pacific Corp. 3.75% 2070 | 1,091 | 1,323 | ||||||
United Airlines Holdings, Inc. 6.50% 20278 | 2,200 | 2,369 | ||||||
United Rentals, Inc. 3.875% 2031 | 675 | 709 | ||||||
United Technologies Corp. 3.65% 2023 | 52 | 56 | ||||||
United Technologies Corp. 3.95% 2025 | 5,155 | 5,914 | ||||||
United Technologies Corp. 4.125% 2028 | 1,960 | 2,337 | ||||||
Vertical U.S. Newco Inc. 5.25% 20278 | 2,000 | 2,124 | ||||||
Vinci SA 3.75% 20298 | 2,237 | 2,626 | ||||||
Wesco Aircraft Holdings, Inc. 9.00% 20268 | 1,045 | 991 | ||||||
WESCO Distribution, Inc. 7.125% 20258 | 1,210 | 1,332 | ||||||
WESCO Distribution, Inc. 7.25% 20288 | 1,320 | 1,503 | ||||||
XPO Logistics, Inc. 6.25% 20258 | 660 | 711 | ||||||
|
| |||||||
| 300,988 | ||||||||
|
| |||||||
Consumer discretionary 0.95% | ||||||||
Adient US LLC 9.00% 20258 | 521 | 582 | ||||||
Amazon.com, Inc. 1.50% 2030 | 2,000 | 2,033 | ||||||
Amazon.com, Inc. 2.50% 2050 | 920 | 955 | ||||||
Amazon.com, Inc. 2.70% 2060 | 4,485 | 4,802 | ||||||
American Honda Finance Corp. 0.875% 2023 | 13,000 | 13,162 | ||||||
American Honda Finance Corp. 1.20% 2025 | 2,546 | 2,607 | ||||||
American Honda Finance Corp. 3.50% 2028 | 750 | 865 | ||||||
Bayerische Motoren Werke AG 2.25% 20238 | 300 | 313 | ||||||
Bayerische Motoren Werke AG 3.45% 20238 | 1,870 | 1,994 | ||||||
Bayerische Motoren Werke AG 3.15% 20248 | 8,510 | 9,179 | ||||||
Caesars Entertainment, Inc. 6.25% 20258 | 3,315 | 3,535 | ||||||
Carnival Corp. 11.50% 20238 | 5,575 | 6,455 | ||||||
Ford Motor Credit Co. 3.20% 2021 | 2,250 | 2,255 | ||||||
Ford Motor Credit Co. 3.087% 2023 | 405 | 413 | ||||||
Ford Motor Credit Co. 3.664% 2024 | 455 | 468 | ||||||
Ford Motor Credit Co. 3.81% 2024 | 1,070 | 1,098 | ||||||
Ford Motor Credit Co. 5.584% 2024 | 423 | 457 | ||||||
Ford Motor Credit Co. 5.125% 2025 | 12,355 | 13,449 | ||||||
Ford Motor Credit Co. 4.542% 2026 | 2,455 | 2,624 | ||||||
Ford Motor Credit Co. 3.815% 2027 | 250 | 257 | ||||||
General Motors Company 4.20% 2027 | 5,156 | 5,844 | ||||||
General Motors Company 5.95% 2049 | 2,200 | 2,978 | ||||||
General Motors Financial Co. 3.45% 2022 | 2,000 | 2,054 | ||||||
American Funds Insurance Series 131
Table of Contents
Asset Allocation Fund (continued)
Bonds, notes & other debt instruments (continued)
| Principal amount (000) | Value (000) | |||||||
Corporate bonds, notes & loans (continued) | ||||||||
Consumer discretionary (continued) | ||||||||
General Motors Financial Co. 3.55% 2022 | $ | 1,780 | $ | 1,857 | ||||
General Motors Financial Co. 5.20% 2023 | 7,768 | 8,521 | ||||||
General Motors Financial Co. 3.50% 2024 | 4,145 | 4,483 | ||||||
General Motors Financial Co. 2.75% 2025 | 5,000 | 5,350 | ||||||
General Motors Financial Co. 4.30% 2025 | 400 | 449 | ||||||
General Motors Financial Co. 4.35% 2027 | 500 | 570 | ||||||
Hanesbrands Inc. 4.625% 20248 | 860 | 902 | ||||||
Hanesbrands Inc. 5.375% 20258 | 706 | 748 | ||||||
Hanesbrands Inc. 4.875% 20268 | 2,700 | 2,936 | ||||||
Hilton Worldwide Holdings Inc. 5.125% 2026 | 2,675 | 2,769 | ||||||
Hilton Worldwide Holdings Inc. 4.00% 20318 | 1,035 | 1,094 | ||||||
Home Depot, Inc. 3.90% 2028 | 825 | 993 | ||||||
Home Depot, Inc. 2.95% 2029 | 9,301 | 10,575 | ||||||
Home Depot, Inc. 2.70% 2030 | 2,180 | 2,434 | ||||||
Home Depot, Inc. 4.25% 2046 | 3,500 | 4,643 | ||||||
Home Depot, Inc. 4.50% 2048 | 428 | 601 | ||||||
Home Depot, Inc. 3.35% 2050 | 3,060 | 3,642 | ||||||
Hyundai Capital America 3.25% 20228 | 480 | 500 | ||||||
Hyundai Capital America 1.80% 20258 | 4,523 | 4,641 | ||||||
Hyundai Capital America 2.375% 20278 | 2,579 | 2,707 | ||||||
International Game Technology PLC 6.25% 20228 | 687 | 711 | ||||||
International Game Technology PLC 6.50% 20258 | 4,555 | 5,104 | ||||||
International Game Technology PLC 5.25% 20298 | 940 | 1,014 | ||||||
Lithia Motors, Inc. 4.375% 20318 | 1,025 | 1,101 | ||||||
Lowe’s Companies, Inc. 3.65% 2029 | 3,574 | 4,172 | ||||||
Macy’s, Inc. 8.375% 20258 | 1,230 | 1,367 | ||||||
Magna International Inc. 2.45% 2030 | 6,875 | 7,400 | ||||||
Mattel, Inc. 6.75% 20258 | 3,225 | 3,407 | ||||||
Melco International Development Ltd. 5.75% 20288 | 1,485 | 1,584 | ||||||
MGM Growth Properties LLC 4.625% 20258 | 1,050 | 1,126 | ||||||
MGM Growth Properties LLC 3.875% 20298 | 1,175 | 1,204 | ||||||
MGM Resorts International 7.75% 2022 | 1,700 | 1,814 | ||||||
Nissan Motor Co., Ltd. 3.043% 20238 | 1,686 | 1,764 | ||||||
Nissan Motor Co., Ltd. 3.522% 20258 | 4,180 | 4,485 | ||||||
Nissan Motor Co., Ltd. 4.345% 20278 | 9,815 | 10,849 | ||||||
Nissan Motor Co., Ltd. 4.81% 20308 | 4,000 | 4,514 | ||||||
Panther BF Aggregator 2, LP 6.25% 20268 | 556 | 597 | ||||||
PetSmart, Inc. 8.875% 20258 | 12,215 | 12,561 | ||||||
PetSmart, Inc., Term Loan, (3-month USD-LIBOR + 3.00%) 4.00% 202210,12 | 5,870 | 5,824 | ||||||
Royal Caribbean Cruises Ltd. 11.50% 20258 | 1,225 | 1,434 | ||||||
Sally Holdings LLC and Sally Capital Inc. 5.625% 2025 | 5,255 | 5,407 | ||||||
Sally Holdings LLC and Sally Capital Inc. 8.75% 20258 | 2,347 | 2,614 | ||||||
Scientific Games Corp. 5.00% 20258 | 1,996 | 2,062 | ||||||
Scientific Games Corp. 8.625% 20258 | 1,260 | 1,381 | ||||||
Scientific Games Corp. 8.25% 20268 | 6,905 | 7,453 | ||||||
Scientific Games Corp. 7.00% 20288 | 950 | 1,023 | ||||||
Scientific Games Corp. 7.25% 20298 | 1,615 | 1,775 | ||||||
Staples, Inc. 7.50% 20268 | 3,055 | 3,195 | ||||||
Toyota Motor Credit Corp. 2.15% 2022 | 545 | 562 | ||||||
Toyota Motor Credit Corp. 2.60% 2022 | 924 | 946 | ||||||
Toyota Motor Credit Corp. 0.80% 2025 | 2,994 | 3,016 | ||||||
Toyota Motor Credit Corp. 3.05% 2028 | 2,430 | 2,732 | ||||||
Toyota Motor Credit Corp. 3.375% 2030 | 2,225 | 2,605 | ||||||
VICI Properties LP 4.625% 20298 | 995 | 1,066 | ||||||
VICI Properties LP / VICI Note Co. Inc. 3.50% 20258 | 2,100 | 2,152 | ||||||
VICI Properties LP / VICI Note Co. Inc. 3.75% 20278 | 450 | 461 | ||||||
VICI Properties LP / VICI Note Co. Inc. 4.125% 20308 | 2,225 | 2,351 | ||||||
Volkswagen Group of America Finance, LLC 4.00% 20218 | 2,500 | 2,577 | ||||||
Volkswagen Group of America Finance, LLC 4.25% 20238 | 5,320 | 5,856 | ||||||
Volkswagen Group of America Finance, LLC 1.25% 20258 | 3,610 | 3,642 | ||||||
Volkswagen Group of America Finance, LLC 3.35% 20258 | 2,578 | 2,836 | ||||||
132 American Funds Insurance Series
Table of Contents
Asset Allocation Fund (continued)
Bonds, notes & other debt instruments (continued)
| Principal amount (000) | Value (000) | |||||||
Corporate bonds, notes & loans (continued) | ||||||||
Consumer discretionary (continued) | ||||||||
Volkswagen Group of America Finance, LLC 4.625% 20258 | $ | 3,845 | $ | 4,485 | ||||
Volkswagen Group of America Finance, LLC 3.20% 20268 | 3,201 | 3,539 | ||||||
Volkswagen Group of America Finance, LLC 1.625% 20278 | 985 | 994 | ||||||
Wyndham Worldwide Corp. 5.375% 20268 | 625 | 648 | ||||||
Wyndham Worldwide Corp. 4.375% 20288 | 1,855 | 1,931 | ||||||
Wynn Las Vegas, LLC and Wynn Capital Corp. 4.25% 20238 | 3,468 | 3,525 | ||||||
|
| |||||||
| 281,660 | ||||||||
|
| |||||||
Consumer staples 0.89% | ||||||||
Albertsons Companies, Inc. 3.50% 20298 | 660 | 668 | ||||||
Altria Group, Inc. 3.80% 2024 | 2,630 | 2,873 | ||||||
Altria Group, Inc. 4.40% 2026 | 445 | 517 | ||||||
Altria Group, Inc. 4.80% 2029 | 1,681 | 2,017 | ||||||
Altria Group, Inc. 3.40% 2030 | 437 | 491 | ||||||
Altria Group, Inc. 5.80% 2039 | 4,820 | 6,351 | ||||||
Altria Group, Inc. 4.50% 2043 | 3,000 | 3,445 | ||||||
Altria Group, Inc. 5.95% 2049 | 490 | 686 | ||||||
Altria Group, Inc. 4.45% 2050 | 3,500 | 4,145 | ||||||
Anheuser-Busch InBev NV 4.15% 2025 | 8,000 | 9,112 | ||||||
Anheuser-Busch InBev NV 4.00% 2028 | 4,345 | 5,124 | ||||||
Anheuser-Busch InBev NV 4.75% 2029 | 886 | 1,093 | ||||||
Anheuser-Busch InBev NV 5.45% 2039 | 7,070 | 9,557 | ||||||
Anheuser-Busch InBev NV 5.55% 2049 | 2,500 | 3,554 | ||||||
Anheuser-Busch InBev NV 4.50% 2050 | 2,150 | 2,710 | ||||||
B&G Foods, Inc. 5.25% 2025 | 2,175 | 2,248 | ||||||
British American Tobacco International Finance PLC 3.95% 20258 | 4,250 | 4,783 | ||||||
British American Tobacco PLC 2.789% 2024 | 4,000 | 4,280 | ||||||
British American Tobacco PLC 3.222% 2024 | 2,826 | 3,061 | ||||||
British American Tobacco PLC 3.215% 2026 | 3,323 | 3,664 | ||||||
British American Tobacco PLC 3.557% 2027 | 1,384 | 1,541 | ||||||
British American Tobacco PLC 2.259% 2028 | 2,509 | 2,607 | ||||||
British American Tobacco PLC 3.462% 2029 | 2,000 | 2,185 | ||||||
British American Tobacco PLC 4.906% 2030 | 4,770 | 5,764 | ||||||
British American Tobacco PLC 2.726% 2031 | 4,000 | 4,148 | ||||||
British American Tobacco PLC 4.39% 2037 | 5,500 | 6,157 | ||||||
British American Tobacco PLC 4.54% 2047 | 2,953 | 3,279 | ||||||
Coca-Cola Co. 1.00% 2028 | 3,015 | 3,028 | ||||||
Coca-Cola Co. 1.375% 2031 | 1,460 | 1,458 | ||||||
Coca-Cola Co. 2.50% 2051 | 1,040 | 1,075 | ||||||
Conagra Brands, Inc. 4.30% 2024 | 4,685 | 5,245 | ||||||
Conagra Brands, Inc. 1.375% 2027 | 4,105 | 4,145 | ||||||
Conagra Brands, Inc. 5.30% 2038 | 55 | 74 | ||||||
Conagra Brands, Inc. 5.40% 2048 | 412 | 588 | ||||||
Constellation Brands, Inc. 2.65% 2022 | 7,846 | 8,156 | ||||||
Constellation Brands, Inc. 2.70% 2022 | 195 | 201 | ||||||
Constellation Brands, Inc. 3.20% 2023 | 1,340 | 1,416 | ||||||
Constellation Brands, Inc. 3.60% 2028 | 938 | 1,072 | ||||||
Constellation Brands, Inc. 2.875% 2030 | 2,259 | 2,479 | ||||||
Constellation Brands, Inc. 4.50% 2047 | 220 | 278 | ||||||
Constellation Brands, Inc. 3.75% 2050 | 351 | 414 | ||||||
Costco Wholesale Corp. 2.75% 2024 | 10,000 | 10,763 | ||||||
Costco Wholesale Corp. 1.60% 2030 | 5,000 | 5,127 | ||||||
H.J. Heinz Co. 3.875% 20278 | 2,475 | 2,669 | ||||||
H.J. Heinz Co. 5.50% 20508 | 1,215 | 1,534 | ||||||
Imperial Tobacco Finance PLC 3.50% 20238 | 4,000 | 4,190 | ||||||
Keurig Dr Pepper Inc. 4.057% 2023 | 2,000 | 2,174 | ||||||
Keurig Dr Pepper Inc. 4.597% 2028 | 2,000 | 2,437 | ||||||
Keurig Dr Pepper Inc. 3.20% 2030 | 3,771 | 4,274 | ||||||
Keurig Dr Pepper Inc. 4.985% 2038 | 3,351 | 4,495 | ||||||
Keurig Dr Pepper Inc. 5.085% 2048 | 75 | 106 | ||||||
American Funds Insurance Series 133
Table of Contents
Asset Allocation Fund (continued)
Bonds, notes & other debt instruments (continued)
| Principal amount (000) | Value (000) | |||||||
Corporate bonds, notes & loans (continued) | ||||||||
Consumer staples (continued) | ||||||||
Keurig Dr Pepper Inc. 3.80% 2050 | $ | 2,552 | $ | 3,062 | ||||
Kimberly-Clark Corp. 1.05% 2027 | 1,395 | 1,414 | ||||||
Kimberly-Clark Corp. 3.10% 2030 | 844 | 972 | ||||||
Kraft Heinz Company 3.95% 2025 | 2,195 | 2,418 | ||||||
Kraft Heinz Company 4.375% 2046 | 840 | 909 | ||||||
Kraft Heinz Company 4.875% 20498 | 1,725 | 2,013 | ||||||
Molson Coors Brewing Co. 4.20% 2046 | 2,270 | 2,605 | ||||||
Nestlé Holdings, Inc. 3.35% 20238 | 750 | 809 | ||||||
Nestlé Holdings, Inc. 0.625% 20268 | 5,240 | 5,217 | ||||||
Nestlé Holdings, Inc. 1.00% 20278 | 19,720 | 19,773 | ||||||
Nestlé Holdings, Inc. 1.25% 20308 | 5,000 | 4,979 | ||||||
PepsiCo, Inc. 1.40% 2031 | 3,795 | 3,825 | ||||||
PepsiCo, Inc. 3.625% 2050 | 2,180 | 2,769 | ||||||
Philip Morris International Inc. 1.875% 2021 | 1,500 | 1,500 | ||||||
Philip Morris International Inc. 2.375% 2022 | 1,960 | 2,023 | ||||||
Philip Morris International Inc. 2.625% 2022 | 1,670 | 1,712 | ||||||
Philip Morris International Inc. 2.875% 2024 | 788 | 849 | ||||||
Philip Morris International Inc. 3.25% 2024 | 2,000 | 2,203 | ||||||
Philip Morris International Inc. 0.875% 2026 | 2,990 | 3,004 | ||||||
Philip Morris International Inc. 3.375% 2029 | 3,268 | 3,746 | ||||||
Philip Morris International Inc. 1.75% 2030 | 4,974 | 5,039 | ||||||
Philip Morris International Inc. 2.10% 2030 | 2,477 | 2,585 | ||||||
Post Holdings, Inc. 4.625% 20308 | 2,886 | 3,040 | ||||||
Procter & Gamble Company 1.70% 2021 | 400 | 405 | ||||||
Procter & Gamble Company 0.55% 2025 | 5,595 | 5,646 | ||||||
Procter & Gamble Company 1.20% 2030 | 8,210 | 8,224 | ||||||
Reckitt Benckiser Group PLC 2.375% 20228 | 1,125 | 1,157 | ||||||
Reynolds American Inc. 4.45% 2025 | 1,425 | 1,623 | ||||||
Reynolds American Inc. 5.85% 2045 | 2,030 | 2,598 | ||||||
TreeHouse Foods, Inc. 4.00% 2028 | 320 | 332 | ||||||
Wal-Mart Stores, Inc. 2.35% 2022 | 1,000 | 1,042 | ||||||
Wal-Mart Stores, Inc. 2.85% 2024 | 1,805 | 1,953 | ||||||
Wal-Mart Stores, Inc. 3.05% 2026 | 2,060 | 2,320 | ||||||
|
| |||||||
| 265,224 | ||||||||
|
| |||||||
Materials 0.76% | ||||||||
Anglo American Capital PLC 2.625% 20308 | 11,275 | 11,808 | ||||||
Anglo American Capital PLC 5.625% 20308 | 720 | 918 | ||||||
Anglo American Capital PLC 3.95% 20508 | 2,945 | 3,313 | ||||||
Ardagh Packaging Finance 5.25% 20258 | 833 | 880 | ||||||
Chevron Phillips Chemical Co. LLC 3.30% 20238 | 595 | 630 | ||||||
Cleveland-Cliffs Inc. 4.875% 20248 | 3,975 | 4,057 | ||||||
Cleveland-Cliffs Inc. 5.75% 2025 | 9,456 | 9,616 | ||||||
Cleveland-Cliffs Inc. 9.875% 20258 | 925 | 1,089 | ||||||
Cleveland-Cliffs Inc. 6.75% 20268 | 2,035 | 2,200 | ||||||
Cleveland-Cliffs Inc. 5.875% 2027 | 10,500 | 10,719 | ||||||
CVR Partners, LP 9.25% 20238 | 2,350 | 2,355 | ||||||
Dow Chemical Co. 4.55% 2025 | 1,405 | 1,645 | ||||||
Dow Chemical Co. 3.625% 2026 | 1,884 | 2,124 | ||||||
Dow Chemical Co. 2.10% 2030 | 4,000 | 4,105 | ||||||
Dow Chemical Co. 4.80% 2049 | 627 | 845 | ||||||
Dow Chemical Co. 3.60% 2050 | 15,250 | 17,135 | ||||||
First Quantum Minerals Ltd. 7.25% 20238 | 1,200 | 1,239 | ||||||
First Quantum Minerals Ltd. 6.50% 20248 | 4,704 | 4,842 | ||||||
First Quantum Minerals Ltd. 7.50% 20258 | 15,400 | 16,055 | ||||||
First Quantum Minerals Ltd. 6.875% 20268 | 11,375 | 11,880 | ||||||
First Quantum Minerals Ltd. 6.875% 20278 | 3,240 | 3,520 | ||||||
Freeport-McMoRan Inc. 3.875% 2023 | 825 | 862 | ||||||
Freeport-McMoRan Inc. 4.25% 2030 | 2,550 | 2,750 | ||||||
FXI Holdings, Inc. 7.875% 20248 | 2,226 | 2,248 | ||||||
134 American Funds Insurance Series
Table of Contents
Asset Allocation Fund (continued)
Bonds, notes & other debt instruments (continued)
| Principal amount (000) | Value (000) | |||||||
Corporate bonds, notes & loans (continued) | ||||||||
Materials (continued) | ||||||||
FXI Holdings, Inc. 12.25% 20268 | $ | 4,392 | $ | 5,014 | ||||
Glencore Funding LLC 4.125% 20248 | 945 | 1,041 | ||||||
Hexion Inc. 7.875% 20278 | 2,045 | 2,192 | ||||||
International Paper Co. 7.30% 2039 | 2,005 | 3,218 | ||||||
Joseph T. Ryerson & Son, Inc. 8.50% 20288 | 1,148 | 1,302 | ||||||
LSB Industries, Inc. 9.625% 20238 | 5,170 | 5,344 | ||||||
LYB International Finance III, LLC 1.25% 2025 | 5,780 | 5,885 | ||||||
LYB International Finance III, LLC 2.25% 2030 | 3,690 | 3,819 | ||||||
LYB International Finance III, LLC 3.375% 2040 | 11,184 | 11,977 | ||||||
LYB International Finance III, LLC 3.625% 2051 | 2,922 | 3,199 | ||||||
LYB International Finance III, LLC 3.80% 2060 | 1,186 | 1,281 | ||||||
Methanex Corp. 5.125% 2027 | 4,525 | 4,924 | ||||||
Mosaic Co. 3.25% 2022 | 1,788 | 1,869 | ||||||
Mosaic Co. 4.05% 2027 | 1,587 | 1,799 | ||||||
Newcrest Finance Pty Ltd. 3.25% 20308 | 1,329 | 1,470 | ||||||
Newcrest Finance Pty Ltd. 4.20% 20508 | 371 | 455 | ||||||
Nutrition & Biosciences, Inc. 1.832% 20278 | 7,468 | 7,699 | ||||||
Nutrition & Biosciences, Inc. 2.30% 20308 | 5,310 | 5,471 | ||||||
Praxair, Inc. 1.10% 2030 | 6,604 | 6,540 | ||||||
Praxair, Inc. 2.00% 2050 | 1,605 | 1,505 | ||||||
Sherwin-Williams Co. 2.75% 2022 | 29 | 30 | ||||||
Sherwin-Williams Co. 3.125% 2024 | 275 | 299 | ||||||
Sherwin-Williams Co. 2.95% 2029 | 4,000 | 4,407 | ||||||
Sherwin-Williams Co. 3.80% 2049 | 5,208 | 6,295 | ||||||
Tronox Ltd. 6.50% 20268 | 1,980 | 2,064 | ||||||
Vale Overseas Ltd. 3.75% 2030 | 3,949 | 4,397 | ||||||
Valvoline Inc. 4.375% 2025 | 670 | 692 | ||||||
Venator Materials Corp. 5.75% 20258 | 5,845 | 5,476 | ||||||
Venator Materials Corp. 9.50% 20258 | 1,495 | 1,637 | ||||||
Warrior Met Coal, Inc. 8.00% 20248 | 5,095 | 5,214 | ||||||
Westlake Chemical Corp. 4.375% 2047 | 500 | 595 | ||||||
|
| |||||||
| 223,945 | ||||||||
|
| |||||||
Information technology 0.74% | ||||||||
Adobe Inc. 1.90% 2025 | 2,216 | 2,344 | ||||||
Adobe Inc. 2.30% 2030 | 11,627 | 12,593 | ||||||
Almonde Inc., Term Loan, (3-month USD-LIBOR + 7.25%) 8.25% 202510,12 | 4,150 | 4,172 | ||||||
Apple Inc. 3.00% 2024 | 625 | 673 | ||||||
Apple Inc. 0.55% 2025 | 14,140 | 14,213 | ||||||
Apple Inc. 1.125% 2025 | 1,866 | 1,920 | ||||||
Apple Inc. 3.35% 2027 | 40 | 46 | ||||||
Apple Inc. 1.25% 2030 | 8,760 | 8,768 | ||||||
Apple Inc. 2.40% 2050 | 3,000 | 3,077 | ||||||
Avaya Inc. 6.125% 20288 | 1,600 | 1,712 | ||||||
Broadcom Inc. 3.125% 2022 | 1,575 | 1,649 | ||||||
Broadcom Inc. 3.625% 2024 | 1,575 | 1,731 | ||||||
Broadcom Inc. 4.25% 2026 | 7,508 | 8,606 | ||||||
Broadcom Inc. 4.75% 2029 | 4,710 | 5,634 | ||||||
Broadcom Inc. 4.15% 2030 | 5,000 | 5,791 | ||||||
Broadcom Inc. 5.00% 2030 | 1,807 | 2,198 | ||||||
Broadcom Ltd. 3.625% 2024 | 750 | 811 | ||||||
Broadcom Ltd. 3.875% 2027 | 3,060 | 3,440 | ||||||
CommScope Finance LLC 6.00% 20268 | 2,425 | 2,558 | ||||||
Diebold Nixdorf AG, Term Loan B, (3-month USD-LIBOR + 2.75%) 3.004% 202310,12 | 1,342 | 1,312 | ||||||
Diebold Nixdorf, Inc. 9.375% 20258 | 3,775 | 4,235 | ||||||
Diebold, Inc. 8.50% 2024 | 1,400 | 1,419 | ||||||
Fiserv, Inc. 2.75% 2024 | 1,600 | 1,719 | ||||||
Fiserv, Inc. 3.20% 2026 | 7,455 | 8,355 | ||||||
Fiserv, Inc. 2.25% 2027 | 1,030 | 1,099 | ||||||
Fiserv, Inc. 3.50% 2029 | 4,070 | 4,654 | ||||||
American Funds Insurance Series 135
Table of Contents
Asset Allocation Fund (continued)
Bonds, notes & other debt instruments (continued)
| Principal amount (000) | Value (000) | |||||||
Corporate bonds, notes & loans (continued) | ||||||||
Information technology (continued) | ||||||||
Fiserv, Inc. 2.65% 2030 | $ | 12,611 | $ | 13,653 | ||||
Fiserv, Inc. 4.40% 2049 | 1,800 | 2,411 | ||||||
Gartner, Inc. 4.50% 20288 | 650 | 687 | ||||||
Global Payments Inc. 2.90% 2030 | 3,528 | 3,839 | ||||||
Intuit Inc. 0.95% 2025 | 1,530 | 1,551 | ||||||
Intuit Inc. 1.35% 2027 | 3,565 | 3,652 | ||||||
Intuit Inc. 1.65% 2030 | 4,870 | 5,006 | ||||||
McAfee, LLC, Term Loan, (3-month USD-LIBOR + 3.75%) 4.004% 202410,12 | 2,602 | 2,606 | ||||||
Microsoft Corp. 3.30% 2027 | 4,000 | 4,565 | ||||||
Microsoft Corp. 4.20% 2035 | 6,000 | 7,890 | ||||||
Microsoft Corp. 4.10% 2037 | 628 | 825 | ||||||
Microsoft Corp. 2.525% 2050 | 2,961 | 3,123 | ||||||
Oracle Corp. 3.60% 2050 | 6,730 | 7,860 | ||||||
PayPal Holdings, Inc. 2.65% 2026 | 2,364 | 2,599 | ||||||
PayPal Holdings, Inc. 2.85% 2029 | 2,770 | 3,081 | ||||||
PayPal Holdings, Inc. 2.30% 2030 | 3,303 | 3,541 | ||||||
PayPal Holdings, Inc. 3.25% 2050 | 932 | 1,077 | ||||||
Sabre Holdings Corp. 5.25% 20238 | 325 | 330 | ||||||
Sabre Holdings Corp. 9.25% 20258 | 1,025 | 1,221 | ||||||
ServiceNow, Inc. 1.40% 2030 | 8,965 | 8,752 | ||||||
Unisys Corp. 6.875% 20278 | 725 | 794 | ||||||
Veritas Holdings Ltd. 7.50% 20258 | 3,860 | 3,966 | ||||||
ViaSat, Inc. 5.625% 20278 | 555 | 584 | ||||||
Visa Inc. 2.80% 2022 | 2,000 | 2,093 | ||||||
Visa Inc. 3.15% 2025 | 5,500 | 6,173 | ||||||
Visa Inc. 0.75% 2027 | 4,450 | 4,441 | ||||||
Visa Inc. 1.10% 2031 | 10,000 | 9,872 | ||||||
Visa Inc. 2.00% 2050 | 5,000 | 4,776 | ||||||
Xerox Corp. 4.125% 2023 | 906 | 953 | ||||||
Xerox Corp. 5.50% 20288 | 2,450 | 2,604 | ||||||
|
| |||||||
| 219,254 | ||||||||
|
| |||||||
Real estate 0.42% | ||||||||
Alexandria Real Estate Equities, Inc. 3.80% 2026 | 315 | 363 | ||||||
Alexandria Real Estate Equities, Inc. 3.95% 2028 | 1,220 | 1,418 | ||||||
Alexandria Real Estate Equities, Inc. 2.75% 2029 | 1,940 | 2,122 | ||||||
Alexandria Real Estate Equities, Inc. 3.375% 2031 | 1,320 | 1,513 | ||||||
Alexandria Real Estate Equities, Inc. 1.875% 2033 | 4,095 | 4,097 | ||||||
Alexandria Real Estate Equities, Inc. 4.85% 2049 | 410 | 576 | ||||||
American Campus Communities, Inc. 3.75% 2023 | 3,055 | 3,230 | ||||||
American Campus Communities, Inc. 4.125% 2024 | 2,075 | 2,267 | ||||||
American Campus Communities, Inc. 3.30% 2026 | 1,698 | 1,855 | ||||||
American Campus Communities, Inc. 3.625% 2027 | 9,545 | 10,528 | ||||||
American Campus Communities, Inc. 2.85% 2030 | 144 | 151 | ||||||
American Campus Communities, Inc. 3.875% 2031 | 744 | 844 | ||||||
American Tower Corp. 3.55% 2027 | 1,425 | 1,613 | ||||||
American Tower Corp. 1.50% 2028 | 10,000 | 10,068 | ||||||
American Tower Corp. 3.60% 2028 | 1,000 | 1,137 | ||||||
Brandywine Operating Partnership, LP 3.95% 2023 | 1,070 | 1,115 | ||||||
Brookfield Property REIT Inc. 5.75% 20268 | 6,050 | 5,980 | ||||||
Communications Sales & Leasing, Inc. 6.00% 20238 | 2,475 | 2,529 | ||||||
Corporate Office Properties LP 3.60% 2023 | 390 | 413 | ||||||
Corporate Office Properties LP 5.25% 2024 | 3,595 | 3,976 | ||||||
Corporate Office Properties LP 2.25% 2026 | 1,431 | 1,493 | ||||||
Equinix, Inc. 2.625% 2024 | 501 | 536 | ||||||
Equinix, Inc. 2.90% 2026 | 6,087 | 6,664 | ||||||
Equinix, Inc. 1.80% 2027 | 1,295 | 1,334 | ||||||
Equinix, Inc. 1.55% 2028 | 5,920 | 6,023 | ||||||
Equinix, Inc. 3.20% 2029 | 6,170 | 6,810 | ||||||
Equinix, Inc. 2.15% 2030 | 2,969 | 3,025 | ||||||
136 American Funds Insurance Series
Table of Contents
Asset Allocation Fund (continued)
Bonds, notes & other debt instruments (continued)
| Principal amount (000) | Value (000) | |||||||
Corporate bonds, notes & loans (continued) | ||||||||
Real estate (continued) | ||||||||
Equinix, Inc. 3.00% 2050 | $ | 2,095 | $ | 2,128 | ||||
Essex Portfolio LP 3.875% 2024 | 1,000 | 1,099 | ||||||
Essex Portfolio LP 3.50% 2025 | 6,825 | 7,566 | ||||||
Gaming and Leisure Properties, Inc. 3.35% 2024 | 1,263 | 1,330 | ||||||
Hospitality Properties Trust 4.50% 2023 | 1,945 | 1,958 | ||||||
Hospitality Properties Trust 4.50% 2025 | 150 | 148 | ||||||
Hospitality Properties Trust 4.95% 2027 | 500 | 504 | ||||||
Hospitality Properties Trust 3.95% 2028 | 1,950 | 1,888 | ||||||
Host Hotels & Resorts LP 4.50% 2026 | 355 | 389 | ||||||
Howard Hughes Corp. 5.375% 20288 | 2,450 | 2,640 | ||||||
Iron Mountain Inc. 5.25% 20308 | 3,695 | 3,995 | ||||||
Iron Mountain Inc. 4.50% 20318 | 2,015 | 2,113 | ||||||
Ladder Capital Corp. 5.25% 20258 | 440 | 440 | ||||||
Public Storage 2.37% 2022 | 565 | 584 | ||||||
QTS Realty Trust, Inc. 3.875% 20288 | 2,025 | 2,068 | ||||||
Scentre Group 3.25% 20258 | 1,000 | 1,066 | ||||||
Scentre Group 3.50% 20258 | 3,075 | 3,290 | ||||||
Scentre Group 3.75% 20278 | 2,430 | 2,620 | ||||||
UDR, Inc. 2.95% 2026 | 760 | 835 | ||||||
Westfield Corp. Ltd. 3.15% 20228 | 4,290 | 4,364 | ||||||
Westfield Corp. Ltd. 3.50% 20298 | 443 | 465 | ||||||
|
| |||||||
| 123,170 | ||||||||
|
| |||||||
Total corporate bonds, notes & loans | 3,853,780 | |||||||
|
| |||||||
U.S. Treasury bonds & notes 8.47% | ||||||||
U.S. Treasury 6.99% | ||||||||
U.S. Treasury 1.50% 2021 | 3,777 | 3,811 | ||||||
U.S. Treasury 1.625% 2021 | 3,704 | 3,732 | ||||||
U.S. Treasury 1.625% 2021 | 98 | 99 | ||||||
U.S. Treasury 1.75% 2021 | 425 | 431 | ||||||
U.S. Treasury 2.25% 202114 | 95,000 | 95,664 | ||||||
U.S. Treasury 2.50% 2021 | 200,000 | 200,359 | ||||||
U.S. Treasury 2.75% 2021 | 19,232 | 19,586 | ||||||
U.S. Treasury 0.125% 2022 | 114,525 | 114,548 | ||||||
U.S. Treasury 0.125% 2022 | 20,000 | 20,004 | ||||||
U.S. Treasury 1.375% 2022 | 5,000 | 5,068 | ||||||
U.S. Treasury 1.375% 2022 | 280 | 286 | ||||||
U.S. Treasury 1.50% 2022 | 9,407 | 9,627 | ||||||
U.S. Treasury 1.625% 2022 | 94 | 97 | ||||||
U.S. Treasury 1.875% 2022 | 80,000 | 81,633 | ||||||
U.S. Treasury 1.875% 2022 | 4,000 | 4,122 | ||||||
U.S. Treasury 2.125% 2022 | 37,000 | 38,471 | ||||||
U.S. Treasury 0.125% 2023 | 5,362 | 5,355 | ||||||
U.S. Treasury 0.125% 2023 | 2,000 | 1,999 | ||||||
U.S. Treasury 0.25% 2023 | 30,000 | 30,077 | ||||||
U.S. Treasury 1.375% 2023 | 5,309 | 5,449 | ||||||
U.S. Treasury 2.25% 2023 | 5,000 | 5,312 | ||||||
U.S. Treasury 2.375% 2023 | 5,000 | 5,233 | ||||||
U.S. Treasury 2.75% 2023 | 15,000 | 15,908 | ||||||
U.S. Treasury 1.50% 2024 | 22,500 | 23,583 | ||||||
U.S. Treasury 1.50% 2024 | 907 | 950 | ||||||
U.S. Treasury 2.125% 2024 | 5,000 | 5,313 | ||||||
U.S. Treasury 2.25% 2024 | 5,000 | 5,319 | ||||||
U.S. Treasury 2.375% 2024 | 70,000 | 75,442 | ||||||
U.S. Treasury 2.50% 2024 | 225,000 | 241,055 | ||||||
U.S. Treasury 2.50% 2024 | 700 | 754 | ||||||
U.S. Treasury 0.25% 2025 | 89,250 | 89,011 | ||||||
U.S. Treasury 0.25% 2025 | 84,812 | 84,641 | ||||||
U.S. Treasury 0.25% 2025 | 2,272 | 2,263 | ||||||
U.S. Treasury 0.375% 2025 | 3,368 | 3,372 | ||||||
American Funds Insurance Series 137
Table of Contents
Asset Allocation Fund (continued)
Bonds, notes & other debt instruments (continued)
| Principal amount (000) | Value (000) | |||||||
U.S. Treasury bonds & notes (continued) | ||||||||
U.S. Treasury (continued) | ||||||||
U.S. Treasury 0.375% 2025 | $ | 2,705 | $ | 2,715 | ||||
U.S. Treasury 2.50% 2025 | 3,500 | 3,818 | ||||||
U.S. Treasury 2.75% 2025 | 3,229 | 3,581 | ||||||
U.S. Treasury 1.50% 2026 | 500 | 529 | ||||||
U.S. Treasury 1.625% 2026 | 60,000 | 63,990 | ||||||
U.S. Treasury 1.625% 2026 | 27,000 | 28,786 | ||||||
U.S. Treasury 1.625% 2026 | 7,000 | 7,444 | ||||||
U.S. Treasury 1.625% 2026 | 1,500 | 1,597 | ||||||
U.S. Treasury 0.50% 2027 | 46,770 | 46,591 | ||||||
U.S. Treasury 0.50% 2027 | 33,050 | 32,899 | ||||||
U.S. Treasury 0.50% 2027 | 4,418 | 4,389 | ||||||
U.S. Treasury 1.125% 2027 | 762 | 790 | ||||||
U.S. Treasury 2.25% 2027 | 78,250 | 86,472 | ||||||
U.S. Treasury 2.375% 2027 | 880 | 981 | ||||||
U.S. Treasury 2.875% 2028 | 5,217 | 6,042 | ||||||
U.S. Treasury 0.625% 2030 | 18,400 | 17,985 | ||||||
U.S. Treasury 0.875% 2030 | 128,258 | 127,767 | ||||||
U.S. Treasury 1.50% 2030 | 36,651 | 38,765 | ||||||
U.S. Treasury 1.125% 2040 | 60,975 | 57,877 | ||||||
U.S. Treasury 2.50% 2046 | 3,755 | 4,486 | ||||||
U.S. Treasury 3.00% 2047 | 9,355 | 12,252 | ||||||
U.S. Treasury 3.00% 2048 | 336 | 441 | ||||||
U.S. Treasury 2.25% 204914 | 15,000 | 17,169 | ||||||
U.S. Treasury 2.375% 204914 | 75,000 | 88,101 | ||||||
U.S. Treasury 1.375% 2050 | 194,447 | 181,954 | ||||||
U.S. Treasury 1.625% 2050 | 20,000 | 19,905 | ||||||
U.S. Treasury 2.00% 205014 | 15,075 | 16,370 | ||||||
|
| |||||||
| 2,072,270 | ||||||||
|
| |||||||
U.S. Treasury inflation-protected securities 1.48% | ||||||||
U.S. Treasury Inflation-Protected Security 0.125% 202415 | 86,266 | 92,498 | ||||||
U.S. Treasury Inflation-Protected Security 0.625% 202415 | 87,479 | 93,915 | ||||||
U.S. Treasury Inflation-Protected Security 0.125% 202515 | 23,186 | 24,937 | ||||||
U.S. Treasury Inflation-Protected Security 0.75% 202815 | 18,153 | 21,133 | ||||||
U.S. Treasury Inflation-Protected Security 0.875% 202915 | 20,465 | 24,068 | ||||||
U.S. Treasury Inflation-Protected Security 0.125% 203015 | 23,488 | 26,199 | ||||||
U.S. Treasury Inflation-Protected Security 1.00% 204915 | 102,525 | 144,589 | ||||||
U.S. Treasury Inflation-Protected Security 0.25% 205015 | 10,301 | 12,271 | ||||||
|
| |||||||
| 439,610 | ||||||||
|
| |||||||
Total U.S. Treasury bonds & notes | 2,511,880 | |||||||
|
| |||||||
Mortgage-backed obligations 7.41% | ||||||||
Federal agency mortgage-backed obligations 7.05% | ||||||||
Fannie Mae Pool #885290 6.00% 202116 | 2 | 2 | ||||||
Fannie Mae Pool #AD7072 4.00% 202516 | 5 | 5 | ||||||
Fannie Mae Pool #AE3069 4.00% 202516 | 3 | 3 | ||||||
Fannie Mae Pool #AE2321 4.00% 202516 | 2 | 2 | ||||||
Fannie Mae Pool #AH9695 4.00% 202616 | 519 | 552 | ||||||
Fannie Mae Pool #AH6431 4.00% 202616 | 472 | 503 | ||||||
Fannie Mae Pool #890329 4.00% 202616 | 72 | 76 | ||||||
Fannie Mae Pool #AJ3010 4.00% 202616 | 42 | 45 | ||||||
Fannie Mae Pool #AH8174 4.00% 202616 | 5 | 6 | ||||||
Fannie Mae Pool #AL3908 4.00% 202616 | 4 | 4 | ||||||
Fannie Mae Pool #AH5618 4.00% 202616 | 4 | 4 | ||||||
Fannie Mae Pool #AH0829 4.00% 202616 | 4 | 4 | ||||||
Fannie Mae Pool #AH8275 4.00% 202616 | 2 | 3 | ||||||
Fannie Mae Pool #AL7299 4.00% 202716 | 265 | 281 | ||||||
Fannie Mae Pool #MA1109 4.00% 202716 | 5 | 5 | ||||||
Fannie Mae Pool #MA3653 3.00% 202916 | 45 | 48 | ||||||
Fannie Mae Pool #AL8347 4.00% 202916 | 534 | 567 | ||||||
138 American Funds Insurance Series
Table of Contents
Asset Allocation Fund (continued)
Bonds, notes & other debt instruments (continued)
| Principal amount (000) | Value (000) | |||||||
Mortgage-backed obligations (continued) | ||||||||
Federal agency mortgage-backed obligations (continued) | ||||||||
Fannie Mae Pool #254767 5.50% 203316 | $ | 321 | $ | 374 | ||||
Fannie Mae Pool #555956 5.50% 203316 | 217 | 253 | ||||||
Fannie Mae Pool #BN1085 4.00% 203416 | 820 | 870 | ||||||
Fannie Mae Pool #BN3172 4.00% 203416 | 408 | 432 | ||||||
Fannie Mae Pool #MA4228 1.50% 203616 | 64,738 | 66,646 | ||||||
Fannie Mae Pool #MA4229 2.00% 203616 | 12,064 | 12,621 | ||||||
Fannie Mae Pool #AS8554 3.00% 203616 | 12,279 | 12,934 | ||||||
Fannie Mae Pool #929185 5.50% 203616 | 473 | 556 | ||||||
Fannie Mae Pool #893641 6.00% 203616 | 1,046 | 1,251 | ||||||
Fannie Mae Pool #893688 6.00% 203616 | 286 | 342 | ||||||
Fannie Mae Pool #907239 6.00% 203616 | 60 | 70 | ||||||
Fannie Mae Pool #AD0249 5.50% 203716 | 177 | 206 | ||||||
Fannie Mae Pool #190379 5.50% 203716 | 94 | 111 | ||||||
Fannie Mae Pool #924952 6.00% 203716 | 1,205 | 1,431 | ||||||
Fannie Mae Pool #888292 6.00% 203716 | 969 | 1,153 | ||||||
Fannie Mae Pool #928031 6.00% 203716 | 117 | 138 | ||||||
Fannie Mae Pool #888637 6.00% 203716 | 16 | 19 | ||||||
Fannie Mae Pool #AD0119 6.00% 203816 | 1,484 | 1,761 | ||||||
Fannie Mae Pool #AD0095 6.00% 203816 | 1,154 | 1,365 | ||||||
Fannie Mae Pool #995674 6.00% 203816 | 562 | 667 | ||||||
Fannie Mae Pool #AE0021 6.00% 203816 | 468 | 553 | ||||||
Fannie Mae Pool #AL7164 6.00% 203816 | 281 | 328 | ||||||
Fannie Mae Pool #AB0538 6.00% 203816 | 222 | 260 | ||||||
Fannie Mae Pool #995391 6.00% 203816 | 32 | 38 | ||||||
Fannie Mae Pool #889983 6.00% 203816 | 30 | 35 | ||||||
Fannie Mae Pool #995224 6.00% 203816 | 18 | 21 | ||||||
Fannie Mae Pool #AD0833 6.00% 203916 | 1 | 1 | ||||||
Fannie Mae Pool #AL0013 6.00% 204016 | 294 | 347 | ||||||
Fannie Mae Pool #AL0309 6.00% 204016 | 96 | 114 | ||||||
Fannie Mae Pool #AB4536 6.00% 204116 | 565 | 669 | ||||||
Fannie Mae Pool #AL7228 6.00% 204116 | 395 | 467 | ||||||
Fannie Mae Pool #AP2131 3.50% 204216 | 5,880 | 6,346 | ||||||
Fannie Mae Pool #AU8813 4.00% 204316 | 2,968 | 3,356 | ||||||
Fannie Mae Pool #AU9348 4.00% 204316 | 1,768 | 2,000 | ||||||
Fannie Mae Pool #AU9350 4.00% 204316 | 1,410 | 1,568 | ||||||
Fannie Mae Pool #AL8773 3.50% 204516 | 9,959 | 10,820 | ||||||
Fannie Mae Pool #AL8354 3.50% 204516 | 2,392 | 2,614 | ||||||
Fannie Mae Pool #BC4764 3.00% 204616 | 21,678 | 22,815 | ||||||
Fannie Mae Pool #AL8522 3.50% 204616 | 4,748 | 5,188 | ||||||
Fannie Mae Pool #BD9699 3.50% 204616 | 1,895 | 2,040 | ||||||
Fannie Mae Pool #BD9307 4.00% 204616 | 1,733 | 1,897 | ||||||
Fannie Mae Pool #BC7611 4.00% 204616 | 501 | 549 | ||||||
Fannie Mae Pool #BH4084 3.50% 204716 | 20,500 | 21,774 | ||||||
Fannie Mae Pool #BE1290 3.50% 204716 | 3,822 | 4,145 | ||||||
Fannie Mae Pool #CA0770 3.50% 204716 | 3,514 | 3,735 | ||||||
Fannie Mae Pool #MA3211 4.00% 204716 | 6,971 | 7,490 | ||||||
Fannie Mae Pool #257036 7.00% 204716 | 11 | 12 | ||||||
Fannie Mae Pool #256975 7.00% 204716 | 2 | 2 | ||||||
Fannie Mae Pool #BJ3775 3.50% 204816 | 13,514 | 14,336 | ||||||
Fannie Mae Pool #BK7655 3.899% 204812,16 | 683 | 719 | ||||||
Fannie Mae Pool #CA2377 4.00% 204816 | 16,923 | 18,085 | ||||||
Fannie Mae Pool #BK0920 4.00% 204816 | 2,979 | 3,182 | ||||||
Fannie Mae Pool #BJ9256 4.00% 204816 | 2,968 | 3,170 | ||||||
Fannie Mae Pool #BJ9252 4.00% 204816 | 891 | 952 | ||||||
Fannie Mae Pool #BK0915 4.00% 204816 | 265 | 283 | ||||||
Fannie Mae Pool #BK6971 4.00% 204816 | 216 | 231 | ||||||
Fannie Mae Pool #MA3277 4.00% 204816 | 28 | 30 | ||||||
Fannie Mae Pool #BK5255 4.00% 204816 | 27 | 30 | ||||||
Fannie Mae Pool #CA2493 4.50% 204816 | 1,894 | 2,058 | ||||||
Fannie Mae Pool #CA4756 3.00% 204916 | 10,033 | 10,863 | ||||||
Fannie Mae Pool #BK8767 4.00% 204916 | 189 | 206 | ||||||
American Funds Insurance Series 139
Table of Contents
Asset Allocation Fund (continued)
Bonds, notes & other debt instruments (continued)
| Principal amount (000) | Value (000) | |||||||
Mortgage-backed obligations (continued) | ||||||||
Federal agency mortgage-backed obligations (continued) | ||||||||
Fannie Mae Pool #MA4256 2.50% 205116 | $ | 3,051 | $ | 3,218 | ||||
Fannie Mae, Series 2001-T10, Class A1, 7.00% 204116 | 121 | 144 | ||||||
Fannie Mae, Series 2002-W3, Class A5, 7.50% 204116 | 32 | 39 | ||||||
Fannie Mae, Series 2012-M14, Class A2, Multi Family, 2.301% 202212,16 | 1,160 | 1,191 | ||||||
Fannie Mae, Series 2012-M9, Class A2, Multi Family, 2.482% 202216 | 2,248 | 2,288 | ||||||
Fannie Mae, Series 2012-M5, Class A2, Multi Family, 2.715% 202216 | 1,603 | 1,627 | ||||||
Fannie Mae, Series 2014-M1, Class A2, Multi Family, 3.128% 202312,16 | 5,566 | 5,880 | ||||||
Fannie Mae, Series 2013-M14, Class A2, Multi Family, 3.329% 202312,16 | 5,262 | 5,589 | ||||||
Fannie Mae, Series 2014-M2, Class A2, Multi Family, 3.513% 202312,16 | 4,544 | 4,869 | ||||||
Fannie Mae, Series 2014-M9, Class A2, Multi Family, 3.103% 202412,16 | 5,881 | 6,372 | ||||||
Fannie Mae, Series 2014-M3, Class A2, Multi Family, 3.501% 202412,16 | 4,697 | 5,080 | ||||||
Fannie Mae, Series 2017-M3, Class A2, Multi Family, 2.477% 202612,16 | 9,665 | 10,575 | ||||||
Fannie Mae, Series 2017-M7, Class A2, Multi Family, 2.961% 202712,16 | 2,891 | 3,241 | ||||||
Fannie Mae, Series 2006-43, Class JO, principal only, 0% 203616 | 67 | 63 | ||||||
Freddie Mac Pool #Q46021 3.50% 204716 | 2,396 | 2,592 | ||||||
Freddie Mac Pool #ZK7598 3.00% 202716 | 10,439 | 10,976 | ||||||
Freddie Mac Pool #ZK7580 3.00% 202716 | 4,541 | 4,828 | ||||||
Freddie Mac Pool #QN1174 2.50% 203416 | 642 | 670 | ||||||
Freddie Mac Pool #SB8083 1.50% 203616 | 14,002 | 14,415 | ||||||
Freddie Mac Pool #SB8084 2.00% 203616 | 3,275 | 3,426 | ||||||
Freddie Mac Pool #C91912 3.00% 203716 | 19,815 | 20,882 | ||||||
Freddie Mac Pool #G03978 5.00% 203816 | 692 | 805 | ||||||
Freddie Mac Pool #G04553 6.50% 203816 | 84 | 95 | ||||||
Freddie Mac Pool #G08347 4.50% 203916 | 121 | 135 | ||||||
Freddie Mac Pool #C03518 5.00% 204016 | 1,211 | 1,409 | ||||||
Freddie Mac Pool #Q05807 4.00% 204216 | 2,988 | 3,295 | ||||||
Freddie Mac Pool #Q23185 4.00% 204316 | 1,886 | 2,134 | ||||||
Freddie Mac Pool #Q23190 4.00% 204316 | 1,446 | 1,608 | ||||||
Freddie Mac Pool #760014 3.116% 204512,16 | 420 | 439 | ||||||
Freddie Mac Pool #Q37988 4.00% 204516 | 10,020 | 11,077 | ||||||
Freddie Mac Pool #G60344 4.00% 204516 | 8,736 | 9,678 | ||||||
Freddie Mac Pool #Z40130 3.00% 204616 | 6,415 | 7,004 | ||||||
Freddie Mac Pool #Q41909 4.50% 204616 | 884 | 970 | ||||||
Freddie Mac Pool #Q41090 4.50% 204616 | 547 | 600 | ||||||
Freddie Mac Pool #760015 2.849% 204712,16 | 980 | 1,013 | ||||||
Freddie Mac Pool #Q52216 3.50% 204716 | 13,195 | 14,009 | ||||||
Freddie Mac Pool #Q52157 3.50% 204716 | 2,902 | 3,081 | ||||||
Freddie Mac Pool #SI2002 4.00% 204816 | 6,236 | 6,675 | ||||||
Freddie Mac Pool #ZM6968 4.00% 204816 | 3,718 | 3,970 | ||||||
Freddie Mac Pool #SD7507 3.00% 204916 | 33,113 | 35,812 | ||||||
Freddie Mac Pool #RA2020 3.00% 205016 | 13,908 | 14,949 | ||||||
Freddie Mac, Series T041, Class 3A, 5.222% 203212,16 | 240 | 272 | ||||||
Freddie Mac, Series K723, Class A2, Multi Family, 2.454% 202316 | 3,025 | 3,176 | ||||||
Freddie Mac, Series K725, Class A2, Multi Family, 3.002% 202416 | 5,555 | 5,981 | ||||||
Freddie Mac, Series K044, Class A2, Multi Family, 2.811% 202516 | 4,265 | 4,648 | ||||||
Freddie Mac, Series K047, Class A2, Multi Family, 3.329% 202516 | 4,000 | 4,466 | ||||||
Freddie Mac, Series K733, Class A2, Multi Family, 3.75% 202512,16 | 9,778 | 10,998 | ||||||
Freddie Mac, Series K055, Class A2, Multi Family, 2.673% 202616 | 10,050 | 11,062 | ||||||
Freddie Mac, Series K734, Class A2, Multi Family, 3.208% 202616 | 7,370 | 8,226 | ||||||
Freddie Mac, Series K066, Class A2, Multi Family, 3.117% 202716 | 4,755 | 5,420 | ||||||
Freddie Mac, Series K067, Class A2, Multi Family, 3.194% 202716 | 5,770 | 6,622 | ||||||
Freddie Mac, Series K063, Class A2, Multi Family, 3.43% 202716 | 4,375 | 5,035 | ||||||
Freddie Mac, Series K076, Class A2, Multi Family, 3.90% 202816 | 3,237 | 3,884 | ||||||
Freddie Mac Seasoned Credit Risk Transfer Trust, Series 2017-2, Class MA, 3.00% 205616 | 8,475 | 9,091 | ||||||
Freddie Mac Seasoned Credit Risk Transfer Trust, Series 2017-2, Class HA, 3.00% 205612,16 | 8,495 | 8,927 | ||||||
Freddie Mac Seasoned Credit Risk Transfer Trust, Series 2017-1, Class HA, 3.00% 205612,16 | 4,449 | 4,677 | ||||||
Freddie Mac Seasoned Credit Risk Transfer Trust, Series 2017-3, Class HA, 3.25% 205612,16 | 1,877 | 1,990 | ||||||
140 American Funds Insurance Series
Table of Contents
Asset Allocation Fund (continued)
Bonds, notes & other debt instruments (continued)
| Principal amount (000) | Value (000) | |||||||
Mortgage-backed obligations (continued) | ||||||||
Federal agency mortgage-backed obligations (continued) | ||||||||
Freddie Mac Seasoned Credit Risk Transfer Trust, Series 2017-4, Class HT, 3.25% 205712,16 | $ | 1,401 | $ | 1,527 | ||||
Freddie Mac Seasoned Credit Risk Transfer Trust, Series 2018-3, Class MA, 3.50% 205716 | 3,306 | 3,582 | ||||||
Freddie Mac Seasoned Credit Risk Transfer Trust, Series 2018-2, Class MT, 3.50% 205716 | 2,852 | 3,115 | ||||||
Freddie Mac Seasoned Credit Risk Transfer Trust, Series 2017-4, Class MT, 3.50% 205716 | 1,135 | 1,239 | ||||||
Freddie Mac Seasoned Credit Risk Transfer Trust, Series 2019-2, Class MA, 3.50% 205816 | 15,488 | 16,882 | ||||||
Freddie Mac Seasoned Credit Risk Transfer Trust, Series 2019-4, Class MA, 3.00% 205916 | 8,737 | 9,322 | ||||||
Freddie Mac Seasoned Loan Structured Transaction Trust, Series 2018-2, Class A1, 3.50% 202816 | 3,363 | 3,558 | ||||||
Freddie Mac Seasoned Loan Structured Transaction Trust, Series 2019-3, Class A1C, 2.75% 202916 | 4,393 | 4,650 | ||||||
Freddie Mac Seasoned Loan Structured Transaction Trust, Series 2019-1, Class A1, 3.50% 202916 | 7,001 | 7,426 | ||||||
Freddie Mac Seasoned Loan Structured Transaction Trust, Series 2019-1, Class A2, 3.50% 202916 | 2,455 | 2,714 | ||||||
Freddie Mac Structured Agency Credit Risk Debt Notes, Series 2015-DNA1, Class M3, 3.448% 202712,16 | 1,301 | 1,338 | ||||||
Government National Mortgage Assn. 2.00% 205116,17 | 149,150 | 155,465 | ||||||
Government National Mortgage Assn. 2.00% 205116,17 | 83,050 | 86,703 | ||||||
Government National Mortgage Assn. 2.50% 205116,17 | 5,375 | 5,668 | ||||||
Government National Mortgage Assn. 3.00% 205116,17 | 74,000 | 77,425 | ||||||
Government National Mortgage Assn. 3.50% 205116,17 | 13,404 | 14,202 | ||||||
Government National Mortgage Assn. 3.50% 205116,17 | 13,352 | 14,139 | ||||||
Government National Mortgage Assn. 4.00% 205116,17 | 13,107 | 13,981 | ||||||
Government National Mortgage Assn. 4.50% 205116,17 | 7,053 | 7,560 | ||||||
Government National Mortgage Assn. 4.50% 205116,17 | 2,947 | 3,156 | ||||||
Government National Mortgage Assn. Pool #BD7245 4.00% 204816 | 1,191 | 1,302 | ||||||
Government National Mortgage Assn. Pool #MA5876 4.00% 204916 | 17,039 | 18,229 | ||||||
Government National Mortgage Assn. Pool #MA5986 4.00% 204916 | 2,226 | 2,391 | ||||||
Government National Mortgage Assn. Pool #MA5764 4.50% 204916 | 28,452 | 30,796 | ||||||
Government National Mortgage Assn. Pool #MA6092 4.50% 204916 | 6,837 | 7,374 | ||||||
Government National Mortgage Assn. Pool #MA5877 4.50% 204916 | 4,167 | 4,506 | ||||||
Government National Mortgage Assn. Pool #MA7052 2.50% 205016 | 15,905 | 16,854 | ||||||
Uniform Mortgage-Backed Security 1.50% 203616,17 | 89,384 | 91,842 | ||||||
Uniform Mortgage-Backed Security 1.50% 203616,17 | 15,049 | 15,455 | ||||||
Uniform Mortgage-Backed Security 2.00% 203616,17 | 54,690 | 57,117 | ||||||
Uniform Mortgage-Backed Security 2.00% 203616,17 | 17,235 | 18,017 | ||||||
Uniform Mortgage-Backed Security 3.00% 203616,17 | 8,784 | 9,218 | ||||||
Uniform Mortgage-Backed Security 2.00% 205116,17 | 69,840 | 72,297 | ||||||
Uniform Mortgage-Backed Security 2.00% 205116,17 | 45,476 | 47,153 | ||||||
Uniform Mortgage-Backed Security 2.50% 205116,17 | 123,053 | 129,292 | ||||||
Uniform Mortgage-Backed Security 2.50% 205116,17 | 92,374 | 97,198 | ||||||
Uniform Mortgage-Backed Security 3.00% 205116,17 | 114,305 | 119,939 | ||||||
Uniform Mortgage-Backed Security 3.00% 205116,17 | 24,371 | 25,555 | ||||||
Uniform Mortgage-Backed Security 3.50% 205116,17 | 147,126 | 155,725 | ||||||
Uniform Mortgage-Backed Security 4.00% 205116,17 | 105,276 | 112,587 | ||||||
Uniform Mortgage-Backed Security 4.50% 205116,17 | 41,792 | 45,352 | ||||||
|
| |||||||
| 2,091,688 | ||||||||
|
| |||||||
Collateralized mortgage-backed obligations (privately originated) 0.18% | ||||||||
Arroyo Mortgage Trust, Series 2018-1, Class A1, 3.763% 20488,12,16 | 1,624 | 1,651 | ||||||
Bellemeade Re Ltd., Series 2019-3A, Class M1B, (1-month USD-LIBOR + 1.60%) 1.748% 20298,12,16 | 3,810 | 3,817 | ||||||
Cascade Funding Mortgage Trust, Series 2018-RM2, Class A, 4.00% 20688,12,16 | 2,163 | 2,240 | ||||||
Credit Suisse Mortgage Trust, Series 2020-NET, Class A, 2.257% 20378,16 | 4,191 | 4,353 | ||||||
CS First Boston Mortgage Securities Corp., Series 2004-5, Class IVA1, 6.00% 203416 | 216 | 228 | ||||||
Finance of America Structured Securities Trust, Series 2019-JR2, Class A1, 2.00% 20698,16 | 10,763 | 11,678 | ||||||
Finance of America Structured Securities Trust, Series 2019-JR1, Class A, 2.00% 20698,16 | 3,798 | 4,172 | ||||||
JPMorgan Mortgage Trust, Series 2019-INV3, Class A13, 3.50% 20508,12,16 | 1,120 | 1,167 | ||||||
American Funds Insurance Series 141
Table of Contents
Asset Allocation Fund (continued)
Bonds, notes & other debt instruments (continued)
| Principal amount (000) | Value (000) | |||||||
Mortgage-backed obligations (continued) | ||||||||
Collateralized mortgage-backed obligations (privately originated) (continued) | ||||||||
JPMorgan Mortgage Trust, Series 2019-INV3, Class A3, 3.50% 20508,12,16 | $ | 1,069 | $ | 1,114 | ||||
Legacy Mortgage Asset Trust, Series 2019-GS5, Class A1, 3.20% 20598,12,16 | 5,422 | 5,483 | ||||||
Legacy Mortgage Asset Trust, Series 2019-GS7, Class A1, 3.25% 20598,12,16 | 1,408 | 1,412 | ||||||
Legacy Mortgage Asset Trust, Series 2019-GS2, Class A1, 3.75% 20598,12,16 | 765 | 768 | ||||||
MASTR Alternative Loan Trust, Series 2004-2, Class 2A1, 6.00% 203416 | 495 | 518 | ||||||
Mello Warehouse Securitization Trust, Series 2019-2, Class A, (1-month USD-LIBOR + 0.75%) 0.898% 20528,12,16 | 3,001 | 3,005 | ||||||
Mortgage Repurchase Agreement Financing Trust, Series 2020-1, Class A1, | ||||||||
(1-month USD-LIBOR + 2.00%) 2.149% 20228,12,16 | 1,625 | 1,629 | ||||||
Mortgage Repurchase Agreement Financing Trust, Series 2020-5, Class A1, (1-month USD-LIBOR + 1.00%) 1.149% 20238,12,16 | 2,862 | 2,884 | ||||||
Onslow Bay Financial LLC, Series 2020-INV1, Class A5, 3.50% 20498,12,16 | 2,427 | 2,505 | ||||||
RMF Proprietary Issuance Trust, Series 2019-1, Class A, 2.75% 20638,12,16 | 981 | 987 | ||||||
Sequoia Mortgage Trust, Series 2018-CH1, Class A1, 4.00% 20488,12,16 | 1,794 | 1,845 | ||||||
Station Place Securitization Trust, Series 2020-WL1, Class A, (1-month USD-LIBOR + 1.15%) 1.298% 20518,12,16 | 2,500 | 2,504 | ||||||
|
| |||||||
| 53,960 | ||||||||
|
| |||||||
Commercial mortgage-backed securities 0.18% | ||||||||
Bank Commercial Mortgage Trust, Series 2020-BN26, Class A4, 2.403% 206316 | 2,909 | 3,130 | ||||||
Barclays Commercial Mortgage Securities LLC, Series 2017-DELC, Class A, 1.009% 20368,12,16 | 2,000 | 1,982 | ||||||
Benchmark Mortgage Trust, Series 2018-B2, Class A4, 3.615% 205116 | 1,000 | 1,146 | ||||||
Benchmark Mortgage Trust, Series 2020-B17, Class A5, 2.289% 205316 | 2,960 | 3,168 | ||||||
Citigroup Commercial Mortgage Trust, Series 2015-GC29, Class AAB, 2.984% 204816 | 1,015 | 1,058 | ||||||
Commercial Mortgage Trust, Series 2015-PC1, Class A5, 3.902% 205016 | 4,735 | 5,308 | ||||||
CSAIL Commercial Mortgage Trust, Series 2015-C4, Class ASB, 3.617% 204816 | 1,335 | 1,426 | ||||||
Grace Mortgage Trust, Series 2020-GRCE, Class A, 2.347% 20408,16 | 5,201 | 5,517 | ||||||
GS Mortgage Securities Trust, Series 2020-GC47, Class A5, 2.377% 205316 | 5,602 | 6,040 | ||||||
Manhattan West, Series 2020-OMW, Class A, 2.13% 20398,16 | 13,772 | 14,516 | ||||||
Morgan Stanley Bank of America Merrill Lynch Trust, Series 2015-C27, Class ASB, 3.557% 204716 | 981 | 1,044 | ||||||
Morgan Stanley Bank of America Merrill Lynch Trust, Series 2015-C22, Class ASB, 3.04% 204816 | 1,038 | 1,086 | ||||||
Morgan Stanley Capital I Trust, Series 2014-CPT, Class A, 3.35% 20298,16 | 2,650 | 2,669 | ||||||
MRA Issuance Trust, Series 2020-10, Class A, (1-month USD-LIBOR + 1.75%) 2.25% 20211,8,12,16 | 5,219 | 5,219 | ||||||
|
| |||||||
| 53,309 | ||||||||
|
| |||||||
Total mortgage-backed obligations | 2,198,957 | |||||||
|
| |||||||
Asset-backed obligations 0.79% | ||||||||
Aesop Funding LLC, Series 2017-2A, Class A, 2.97% 20248,16 | 1,920 | 1,998 | ||||||
Aesop Funding LLC, Series 2018-1A, Class A, 3.70% 20248,16 | 1,114 | 1,176 | ||||||
Aesop Funding LLC, Series 2020-2, Class A, 2.02% 20278,16 | 539 | 551 | ||||||
Aesop Funding LLC, Series 2020-2A, Class B, 2.96% 20278,16 | 138 | 141 | ||||||
CarMaxAuto Owner Trust, Series 2020-1, Class A2, 1.87% 202316 | 993 | 1,000 | ||||||
CF Hippolyta LLC, Series 2020-1, Class A1, 1.69% 20608,16 | 15,289 | 15,616 | ||||||
CF Hippolyta LLC, Series 2020-1, Class A2, 1.99% 20608,16 | 2,633 | 2,677 | ||||||
CF Hippolyta LLC, Series 2020-1, Class B1, 2.28% 20608,16 | 945 | 962 | ||||||
CF Hippolyta LLC, Series 2020-1, Class B2, 2.60% 20608,16 | 177 | 179 | ||||||
CLI Funding V LLC, Series 2020-2A, Class A, 2.03% 20458,16 | 7,267 | 7,339 | ||||||
CLI Funding V LLC, Series 2020-3A, Class A, 2.07% 20458,16 | 1,527 | 1,544 | ||||||
CLI Funding V LLC, Series 2020-1A, Class A, 2.08% 20458,16 | 9,277 | 9,403 | ||||||
CLI Funding V LLC, Series 2020-3A, Class B, 3.30% 20458,16 | 973 | 983 | ||||||
Cloud Pass-Through Trust, Series 2019-1A, Class CLOU, 3.554% 20228,12,16 | 918 | 930 | ||||||
Credit Acceptance Auto Loan Trust, Series 2020-1A, Class A, 2.01% 20298,16 | 2,964 | 3,032 | ||||||
Drive Auto Receivables Trust, Series 2020-1, Class A2, 1.99% 202216 | 153 | 153 | ||||||
Drive Auto Receivables Trust, Series 2019-3, Class A3, 2.49% 202316 | 1,498 | 1,502 | ||||||
Drive Auto Receivables Trust, Series 2019-3, Class B, 2.65% 202416 | 595 | 601 | ||||||
142 American Funds Insurance Series
Table of Contents
Asset Allocation Fund (continued)
Bonds, notes & other debt instruments (continued)
| Principal amount (000) | Value (000) | |||||||
Asset-backed obligations (continued) | ||||||||
Drive Auto Receivables Trust, Series 2019-3, Class C, 2.90% 202516 | $ | 820 | $ | 845 | ||||
Drive Auto Receivables Trust, Series 2020-1, Class C, 2.36% 202616 | 2,262 | 2,316 | ||||||
Drivetime Auto Owner Trust, Series 2019-3, Class A, 2.55% 20228,16 | 40 | 40 | ||||||
Drivetime Auto Owner Trust, Series 2019-2A, Class A, 2.85% 20228,16 | 36 | 36 | ||||||
Drivetime Auto Owner Trust, Series 2019-3, Class B, 2.60% 20238,16 | 285 | 287 | ||||||
Drivetime Auto Owner Trust, Series 2019-3, Class C, 2.74% 20258,16 | 110 | 112 | ||||||
Exeter Automobile Receivables Trust, Series 2018-1A, Class C, 3.03% 20238,16 | 688 | 690 | ||||||
FirstKey Homes Trust, Series 2020-SFR2, Class A, 1.266% 20378,16 | 13,474 | 13,572 | ||||||
Ford Credit Auto Owner Trust, Series 2016-2, Class A, 2.03% 20278,16 | 3,900 | 3,932 | ||||||
Ford Credit Auto Owner Trust, Series 2017-1, Class A, 2.62% 20288,16 | 4,330 | 4,441 | ||||||
Ford Credit Auto Owner Trust, Series 2018-2, Class A, 3.47% 20308,16 | 13,095 | 14,053 | ||||||
Ford Credit Auto Owner Trust, Series 2018-1, Class A, 3.52% 20308,16 | 9,756 | 10,650 | ||||||
Ford Credit Auto Owner Trust, Series 2020-1, Class A, 2.04% 20318,16 | 8,861 | 9,354 | ||||||
Ford Credit Auto Owner Trust, Series 2018-1, Class A, 3.19% 20318,16 | 11,965 | 13,165 | ||||||
Ford Credit Auto Owner Trust, Series 2020-2, Class A, 1.06% 20338,16 | 12,376 | 12,516 | ||||||
Ford Credit Floorplan Master Owner Trust, Series 2020-2, Class A, 1.06% 202716 | 10,000 | 10,172 | ||||||
GCI Funding I LLC, Series 2020-1, Class A, 2.82% 20458,16 | 917 | 922 | ||||||
GCI Funding I LLC, Series 2020-1, Class B, 3.81% 20458,16 | 369 | 359 | ||||||
Global SC Finance II SRL, Series 2014-1A, Class A1, 3.19% 20298,16 | 159 | 159 | ||||||
Global SC Finance V SRL, Series 2019-1A, Class B, 4.81% 20398,16 | 3,152 | 3,169 | ||||||
Global SC Finance V SRL, Series 2020-1A, Class A, 2.17% 20408,16 | 13,337 | 13,504 | ||||||
Global SC Finance VII SRL, Series 2020-2A, Class A, 2.26% 20408,16 | 16,701 | 16,926 | ||||||
Global SC Finance VII SRL, Series 2020-2A, Class B, 3.32% 20408,16 | 691 | 700 | ||||||
Hertz Vehicle Financing LLC, Rental Car Asset-Backed Notes, Series 2017-2A, Class A, 3.29% 20238,16 | 483 | 484 | ||||||
Hertz Vehicle Financing LLC, Rental Car Asset-Backed Notes, Series 2018-1A, Class A, 3.29% 20248,16 | 746 | 748 | ||||||
Hertz Vehicle Financing LLC, Rental Car Asset-Backed Notes, Series 2018-3A, Class A, 4.03% 20248,16 | 280 | 281 | ||||||
Hertz Vehicle Financing LLC, Rental Car Asset-Backed Notes, Series 2019-3A, Class A, 2.67% 20258,16 | 730 | 731 | ||||||
Honda Auto Receivables Owner Trust, Series 2019-2, Class A3, 2.52% 202316 | 2,815 | 2,868 | ||||||
Palmer Square Loan Funding, CLO, Series 2020-4, Class A1, (3-month USD-LIBOR + 1.00%) 1.134% 20288,12,16 | 3,400 | 3,404 | ||||||
Santander Drive Auto Receivables Trust, Series 2020-1, Class A2A, 2.07% 202316 | 380 | 382 | ||||||
Santander Drive Auto Receivables Trust, Series 2020-1, Class A3, 2.03% 202416 | 444 | 450 | ||||||
Santander Drive Auto Receivables Trust, Series 2020-1, Class B, 3.03% 202416 | 345 | 357 | ||||||
Santander Drive Auto Receivables Trust, Series 2020-1, Class C, 4.11% 202516 | 1,000 | 1,069 | ||||||
Symphony Ltd., CLO, Series 2013-12A, Class AR, (3-month USD-LIBOR + 1.03%) 1.267% 20258,12,16 | 2,976 | 2,977 | ||||||
TAL Advantage V LLC, Series 2020-1A, Class A, 2.05% 20458,16 | 2,320 | 2,348 | ||||||
TAL Advantage V LLC, Series 2020-1A, Class B, 3.29% 20458,16 | 260 | 263 | ||||||
Textainer Marine Containers Ltd., Series 2020-2A, Class A, 2.10% 20458,16 | 3,648 | 3,710 | ||||||
Toyota Auto Loan Extended Note Trust, Series 2019-1, Class A, 2.56% 20318,16 | 3,250 | 3,474 | ||||||
Toyota Auto Loan Extended Note Trust, Series 2020-1, Class A, 1.35% 20338,16 | 889 | 917 | ||||||
Triton Container Finance LLC, Series 2020-1A, Class A, 2.11% 20458,16 | 18,596 | 18,875 | ||||||
Westlake Automobile Receivables Trust, Series 2019-2A, Class A2, 2.57% 20238,16 | 915 | 919 | ||||||
Westlake Automobile Receivables Trust, Series 2019-2A, Class B, 2.62% 20248,16 | 870 | 881 | ||||||
Westlake Automobile Receivables Trust, Series 2019-2A, Class C, 2.84% 20248,16 | 1,390 | 1,419 | ||||||
World Financial Network Credit Card Master Note Trust, Series 2018-A, Class A, 3.07% 202416 | 7,000 | 7,023 | ||||||
|
| |||||||
| 235,287 | ||||||||
|
| |||||||
Bonds & notes of governments & government agencies outside the U.S. 0.21% | ||||||||
CPPIB Capital Inc. 2.375% 20218 | 6,000 | 6,009 | ||||||
CPPIB Capital Inc. 2.25% 20228 | 4,286 | 4,377 | ||||||
CPPIB Capital Inc. 2.75% 20278 | 6,600 | 7,436 | ||||||
KfW 2.125% 2022 | 375 | 384 | ||||||
Manitoba (Province of) 3.05% 2024 | 2,600 | 2,824 | ||||||
Morocco (Kingdom of) 3.00% 20328 | 3,000 | 3,054 | ||||||
American Funds Insurance Series 143
Table of Contents
Asset Allocation Fund (continued)
Bonds, notes & other debt instruments (continued)
| Principal amount (000) | Value (000) | |||||||
Bonds & notes of governments & government agencies outside the U.S. (continued) | ||||||||
Morocco (Kingdom of) 4.00% 20508 | $ | 3,000 | $ | 3,103 | ||||
Peru (Republic of) 1.862% 2032 | 2,525 | 2,550 | ||||||
Peru (Republic of) 2.78% 2060 | 3,775 | 3,817 | ||||||
Qatar (State of) 3.375% 20248 | 2,315 | 2,511 | ||||||
Qatar (State of) 4.00% 20298 | 745 | 885 | ||||||
Qatar (State of) 4.817% 20498 | 750 | 1,025 | ||||||
Quebec (Province of) 2.375% 2022 | 5,057 | 5,173 | ||||||
Quebec (Province of) 2.75% 2027 | 9,000 | 10,077 | ||||||
Saudi Arabia (Kingdom of) 3.25% 20308 | 1,750 | 1,933 | ||||||
Saudi Arabia (Kingdom of) 5.25% 20508 | 1,000 | 1,366 | ||||||
United Mexican States 2.659% 2031 | 2,703 | 2,773 | ||||||
United Mexican States 3.771% 2061 | 1,528 | 1,595 | ||||||
|
| |||||||
| 60,892 | ||||||||
|
| |||||||
Federal agency bonds & notes 0.13% | ||||||||
Fannie Mae 1.875% 2026 | 13,000 | 14,062 | ||||||
Fannie Mae 0.875% 2030 | 23,958 | 23,506 | ||||||
|
| |||||||
| 37,568 | ||||||||
|
| |||||||
Municipals 0.11% | ||||||||
California 0.01% | ||||||||
Regents of the University of California, General Rev. Bonds, Series 2020-BG, 1.316% 2027 | 2,285 | 2,323 | ||||||
Regents of the University of California, General Rev. Bonds, Series 2020-BG, 1.614% 2030 | 1,340 | 1,355 | ||||||
|
| |||||||
| 3,678 | ||||||||
|
| |||||||
Connecticut 0.00% | ||||||||
Housing Fin. Auth., Housing Mortgage Fin. Program Bonds, Series 2014-A-1, 4.00% 2044 | 25 | 26 | ||||||
Housing Fin. Auth., Housing Mortgage Fin. Program Bonds, Series 2014-C-1, 4.00% 2044 | 35 | 37 | ||||||
|
| |||||||
| 63 | ||||||||
|
| |||||||
Florida 0.04% | ||||||||
Board of Administration Fin. Corp., Rev. Bonds, Series 2020-A, 1.705% 2027 | 5,335 | 5,541 | ||||||
Board of Administration Fin. Corp., Rev. Bonds, Series 2020-A, 2.154% 2030 | 5,365 | 5,650 | ||||||
|
| |||||||
| 11,191 | ||||||||
|
| |||||||
Illinois 0.02% | ||||||||
G.O. Bonds, Pension Funding Series 2003, Assured Guaranty Municipal insured, 5.10% 2033 | 4,125 | 4,757 | ||||||
|
| |||||||
Maryland 0.00% | ||||||||
Community Dev. Administration, Dept. of Housing and Community Dev., Residential Rev. Ref. Bonds, Series 2014-E, 2.857% 2040 | 40 | 40 | ||||||
|
| |||||||
Minnesota 0.00% | ||||||||
Housing Fin. Agcy., Residential Housing Fin. Bonds, Series 2014-A, 4.00% 2038 | 70 | 74 | ||||||
|
| |||||||
Nebraska 0.00% | ||||||||
Investment Fin. Auth., Single Family Housing Rev. Bonds, Series 2013-A, 3.00% 2043 | 15 | 15 | ||||||
|
| |||||||
South Carolina 0.04% | ||||||||
Housing Fin. Auth., Mortgage Rev. Ref. Bonds, Series 2014, AMT, 4.00% 2041 | 20 | 21 | ||||||
Public Service Auth., Rev. Obligations (Santee Cooper), Series 2013-E, 5.00% 2048 | 20 | 22 | ||||||
Public Service Auth., Rev. Obligations (Santee Cooper), Series 2014-A, 5.50% 2054 | 1,350 | 1,552 | ||||||
144 American Funds Insurance Series
Table of Contents
Asset Allocation Fund (continued)
Bonds, notes & other debt instruments (continued)
Principal (000) | Value (000) | |||||||
Municipals (continued) | ||||||||
South Carolina (continued) | ||||||||
Public Service Auth., Rev. Obligations (Santee Cooper), Series 2015-A, 5.00% 2050 | $ | 1,390 | $ | 1,606 | ||||
Public Service Auth., Rev. Obligations (Santee Cooper), Series 2015-A, 5.00% 2055 | 2,955 | 3,408 | ||||||
Public Service Auth., Rev. Obligations (Santee Cooper), Series 2015-E, 5.25% 2055 | 3,020 | 3,572 | ||||||
Public Service Auth., Rev. Obligations (Santee Cooper), Series 2016-B, 5.00% 2035 | 410 | 502 | ||||||
Public Service Auth., Rev. Obligations (Santee Cooper), Series 2016-B, 5.00% 2036 | 1,685 | 2,058 | ||||||
Public Service Auth., Rev. Ref. Obligations (Santee Cooper), Series 2016-C, 5.00% 2035 | 650 | 796 | ||||||
|
| |||||||
| 13,537 | ||||||||
|
| |||||||
South Dakota 0.00% | ||||||||
Housing Dev. Auth., Homeownership Mortgage Bonds, Series 2014-F, 4.00% 2034 | 10 | 10 | ||||||
|
| |||||||
Tennessee 0.00% | ||||||||
Housing Dev. Agcy., Residential Fin. Program Bonds, Series 2013-2-A, AMT, 4.00% 2043 | 15 | 16 | ||||||
|
| |||||||
Total municipals | 33,381 | |||||||
|
| |||||||
Total bonds, notes & other debt instruments (cost: $8,502,239,000) | 8,931,745 | |||||||
|
| |||||||
Short-term securities 7.71% | ||||||||
| Shares | ||||||||
Money market investments 7.71% | ||||||||
Capital Group Central Cash Fund 0.12%4,18 | 22,734,631 | 2,273,691 | ||||||
Goldman Sachs Financial Square Government Fund, Institutional Shares 0.02%18,19 | 12,643,336 | 12,643 | ||||||
|
| |||||||
Total short-term securities (cost: $2,285,981,000) | 2,286,334 | |||||||
|
| |||||||
Total investment securities 104.10% (cost: $22,172,583,000) | 30,874,255 | |||||||
Other assets less liabilities (4.10)% | (1,216,604 | ) | ||||||
|
| |||||||
Net assets 100.00% | $ | 29,657,651 | ||||||
|
| |||||||
American Funds Insurance Series 145
Table of Contents
Asset Allocation Fund (continued)
Futures contracts
Contracts | Type | Number of contracts | Expiration | Notional amount20 (000) | Value at 12/31/202021 (000) | Unrealized appreciation (depreciation) at 12/31/2020 (000) | ||||||||||||||
2 Year U.S. Treasury Note Futures | Long | 1,726 | April 2021 | $ | 345,200 | $ | 381,405 | $ | 362 | |||||||||||
5 Year U.S. Treasury Note Futures | Long | 485 | April 2021 | 48,500 | 61,190 | 128 | ||||||||||||||
10 Year U.S. Treasury Note Futures | Long | 116 | March 2021 | 11,600 | 16,017 | 27 | ||||||||||||||
10 Year Ultra U.S. Treasury Note Futures | Short | 3,275 | March 2021 | (327,500 | ) | (512,077 | ) | 1,093 | ||||||||||||
20 Year U.S. Treasury Bond Futures | Long | 1,185 | March 2021 | 118,500 | 205,227 | (1,792 | ) | |||||||||||||
30 Year Ultra U.S. Treasury Bond Futures | Long | 494 | March 2021 | 49,400 | 105,500 | (590 | ) | |||||||||||||
|
| |||||||||||||||||||
| $ | (772 | ) | ||||||||||||||||||
|
| |||||||||||||||||||
Swap contracts
Interest rate swaps
Receive | Pay | Expiration date | Notional (000) | Value at 12/31/2020 (000) | Upfront premium paid (000) | Unrealized appreciation at 12/31/2020 (000) | ||||||||||||||||
U.S. EFFR | 0.0795% | 7/13/2025 | $ | 125,400 | $ | 796 | $ | — | $ | 796 | ||||||||||||
Credit default swaps
Centrally cleared credit default swaps on credit indices — sell protection
Receive/ | Pay | Expiration date | Notional (000) | Value at 12/31/2020 (000) | Upfront premium paid (000) | Unrealized appreciation at 12/31/2020 (000) | ||||||||||||||||
1.00%/Quarterly | CDX.NA.IG.35 | 12/20/2025 | $ | 100 | $ | 2 | $ | 2 | $ | — | 7 | |||||||||||
Investments in affiliates4
| Value of affiliates at 1/1/2020 (000) | Additions (000) | Reductions (000) | Net realized gain (000) | Net unrealized appreciation (depreciation) (000) | Value of affiliates at 12/31/2020 (000) | Dividend income (000) | ||||||||||||||||||||||
Common stocks 0.55% | ||||||||||||||||||||||||||||
Information technology 0.00% | ||||||||||||||||||||||||||||
MKS Instruments, Inc.22 | $ | 308,028 | $ | 14,580 | $ | 87,945 | $ | 13,498 | $ | 82,829 | $ | — | $ | 2,040 | ||||||||||||||
Health care 0.04% | ||||||||||||||||||||||||||||
NuCana PLC (ADR)2 | 7,257 | 8,574 | 1 | — | (2,463 | ) | 13,367 | — | ||||||||||||||||||||
Consumer discretionary 0.51% | ||||||||||||||||||||||||||||
Kontoor Brands, Inc. | 136,467 | 9,313 | — | — | 4,292 | 150,072 | 3,300 | |||||||||||||||||||||
|
| |||||||||||||||||||||||||||
Total common stocks | 163,439 | |||||||||||||||||||||||||||
|
| |||||||||||||||||||||||||||
Short-term securities 7.67% | ||||||||||||||||||||||||||||
Money market investments 7.67% | ||||||||||||||||||||||||||||
Capital Group Central Cash Fund 0.12%18 | 1,584,844 | 5,613,428 | 4,925,712 | 1,347 | (216 | ) | 2,273,691 | 10,928 | ||||||||||||||||||||
|
|
|
|
|
|
|
| |||||||||||||||||||||
Total 8.22% | $ | 14,845 | $ | 84,442 | $ | 2,437,130 | $ | 16,268 | ||||||||||||||||||||
|
|
|
|
|
|
|
| |||||||||||||||||||||
146 American Funds Insurance Series
Table of Contents
Asset Allocation Fund (continued)
| 1 | Valued under fair value procedures adopted by authority of the board of trustees. The total value of all such securities was $1,524,494,000, which represented 5.14% of the net assets of the fund. This amount includes $1,490,120,000 related to certain securities trading outside the U.S. whose values were adjusted as a result of significant market movements following the close of local trading. |
| 2 | Security did not produce income during the last 12 months. |
| 3 | All or a portion of this security was on loan. The total value of all such securities was $13,741,000, which represented .05% of the net assets of the fund. Refer to Note 5 for more information on securities lending. |
| 4 | Affiliate of the fund or part of the same group of investment companies as the fund, in each case as defined under the Investment Company Act of 1940. |
| 5 | Value determined using significant unobservable inputs. |
| 6 | Acquired through a private placement transaction exempt from registration under the Securities Act of 1933. May be subject to legal or contractual restrictions on resale. Further details on these holdings appear below. |
| 7 | Amount less than one thousand. |
| 8 | Acquired in a transaction exempt from registration under Rule 144A of the Securities Act of 1933. May be resold in the U.S. in transactions exempt from registration, normally to qualified institutional buyers. The total value of all such securities was $1,283,591,000, which represented 4.33% of the net assets of the fund. |
| 9 | Step bond; coupon rate may change at a later date. |
| 10 | Loan participations and assignments; may be subject to legal or contractual restrictions on resale. The total value of all such loans was $33,087,000, which represented .11% of the net assets of the fund. |
| 11 | Payment in kind; the issuer has the option of paying additional securities in lieu of cash. Most recent payment was 100% cash unless otherwise noted. |
| 12 | Coupon rate may change periodically. Reference rate and spread are as of the most recent information available. Some coupon rates are determined by the issuer or agent based on current market conditions; therefore, the reference rate and spread are not available. |
| 13 | Scheduled interest and/or principal payment was not received. |
| 14 | All or a portion of this security was pledged as collateral. The total value of pledged collateral was $8,238,000, which represented .03% of the net assets of the fund. |
| 15 | Index-linked bond whose principal amount moves with a government price index. |
| 16 | Principal payments may be made periodically. Therefore, the effective maturity date may be earlier than the stated maturity date. |
| 17 | Purchased on a TBA basis. |
| 18 | Rate represents the seven-day yield at 12/31/2020. |
| 19 | Security purchased with cash collateral from securities on loan. Refer to Note 5 for more information on securities lending. |
| 20 | Notional amount is calculated based on the number of contracts and notional contract size. |
| 21 | Value is calculated based on the notional amount and current market price. |
| 22 | Unaffiliated issuer at 12/31/2020. |
Private placement securities | Acquisition date(s) | Cost (000) | Value (000) | Percent of net assets | ||||||||||||
Rotech Healthcare Inc. | 9/26/2013 | $ | 6,949 | $ | 13,074 | .04 | % | |||||||||
Advanz Pharma Corp. Ltd. | 8/31/2018-9/4/2018 | 2,219 | 773 | .01 | ||||||||||||
|
|
|
|
|
| |||||||||||
Total private placement securities | $ | 9,168 | $ | 13,847 | .05 | % | ||||||||||
|
|
|
|
|
| |||||||||||
Key to abbreviations and symbol
ADR = American Depositary Receipts
Agcy. = Agency
AMT = Alternative Minimum Tax
Auth. = Authority
CLO = Collateralized Loan Obligations
Dept. = Department
Dev. = Development
EFFR = Effective Federal Funds Rate
Fin. = Finance
G.O. = General Obligation
GDR = Global Depositary Receipts
ICE = Intercontinental Exchange, Inc.
LIBOR = London Interbank Offered Rate
Ref. = Refunding
Rev. = Revenue
SOFR = Secured Overnight Financing Rate
TBA = To-be-announced
USD/$ = U.S. dollars
See notes to financial statements.
American Funds Insurance Series 147
Table of Contents
Investment portfolio December 31, 2020
Common stocks 58.02%
| Shares | Value (000) | |||||||
Information technology 14.67% | ||||||||
Taiwan Semiconductor Manufacturing Company, Ltd.1 | 772,000 | $ | 14,499 | |||||
Microsoft Corp. | 51,361 | 11,423 | ||||||
ASML Holding NV1 | 21,414 | 10,349 | ||||||
Broadcom Inc. | 19,688 | 8,620 | ||||||
PagSeguro Digital Ltd., Class A2 | 98,303 | 5,591 | ||||||
Tokyo Electron Ltd.1 | 12,300 | 4,588 | ||||||
Keyence Corp.1 | 3,900 | 2,195 | ||||||
Edenred SA1 | 38,207 | 2,168 | ||||||
Visa Inc., Class A | 8,945 | 1,957 | ||||||
Mastercard Inc., Class A | 5,259 | 1,877 | ||||||
Amphenol Corp., Class A | 13,928 | 1,821 | ||||||
Murata Manufacturing Co., Ltd.1 | 18,800 | 1,693 | ||||||
|
| |||||||
| 66,781 | ||||||||
|
| |||||||
Health care 8.83% | ||||||||
AstraZeneca PLC1 | 68,312 | 6,825 | ||||||
UnitedHealth Group Inc. | 14,645 | 5,136 | ||||||
Humana Inc. | 8,875 | 3,641 | ||||||
Pfizer Inc. | 88,181 | 3,246 | ||||||
Thermo Fisher Scientific Inc. | 6,032 | 2,810 | ||||||
Merck & Co., Inc. | 33,487 | 2,739 | ||||||
Coloplast A/S, Class B1 | 17,427 | 2,662 | ||||||
Mettler-Toledo International Inc.2 | 2,089 | 2,381 | ||||||
Fisher & Paykel Healthcare Corp. Ltd.1 | 87,349 | 2,074 | ||||||
Novartis AG1 | 20,845 | 1,969 | ||||||
Cigna Corp. | 6,958 | 1,449 | ||||||
Carl Zeiss Meditec AG, non-registered shares1 | 10,029 | 1,334 | ||||||
Viatris Inc.2 | 63,052 | 1,182 | ||||||
Gilead Sciences, Inc. | 16,639 | 969 | ||||||
Koninklijke Philips NV (EUR denominated)1,2 | 16,938 | 906 | ||||||
Bayer AG1 | 14,514 | 853 | ||||||
|
| |||||||
| 40,176 | ||||||||
|
| |||||||
Financials 7.28% | ||||||||
JPMorgan Chase & Co. | 53,654 | 6,818 | ||||||
Zurich Insurance Group AG1 | 13,094 | 5,550 | ||||||
Berkshire Hathaway Inc., Class A2 | 11 | 3,826 | ||||||
BlackRock, Inc. | 4,013 | 2,895 | ||||||
AIA Group Ltd.1 | 206,600 | 2,545 | ||||||
Hong Kong Exchanges and Clearing Ltd.1 | 43,100 | 2,370 | ||||||
Tokio Marine Holdings, Inc.1 | 40,000 | 2,072 | ||||||
S&P Global Inc. | 5,890 | 1,936 | ||||||
B3 SA - Brasil, Bolsa, Balcao | 154,305 | 1,841 | ||||||
Deutsche Boerse AG1 | 10,789 | 1,832 | ||||||
FinecoBank SpA1,2 | 89,681 | 1,464 | ||||||
|
| |||||||
| 33,149 | ||||||||
|
| |||||||
Consumer staples 6.32% | ||||||||
Nestlé SA1 | 49,011 | 5,770 | ||||||
Philip Morris International Inc. | 62,968 | 5,213 | ||||||
Kweichow Moutai Co., Ltd., Class A1 | 12,400 | 3,790 | ||||||
British American Tobacco PLC1 | 88,645 | 3,297 | ||||||
British American Tobacco PLC (ADR) | 4,587 | 172 | ||||||
Altria Group, Inc. | 81,153 | 3,327 | ||||||
Keurig Dr Pepper Inc. | 98,392 | 3,149 | ||||||
Budweiser Brewing Co. APAC Ltd.1 | 367,900 | 1,216 | ||||||
Coca-Cola European Partners PLC | 20,787 | 1,036 | ||||||
Coca-Cola Company | 17,456 | 957 | ||||||
Procter & Gamble Company | 5,916 | 823 | ||||||
|
| |||||||
| 28,750 | ||||||||
|
| |||||||
148 American Funds Insurance Series
Table of Contents
Global Balanced Fund (continued)
Common stocks (continued)
| Shares | Value (000) | |||||||
Consumer discretionary 5.27% | ||||||||
LVMH Moët Hennessy-Louis Vuitton SE1 | 7,305 | $ | 4,564 | |||||
Home Depot, Inc. | 14,441 | 3,836 | ||||||
Amazon.com, Inc.2 | 905 | 2,947 | ||||||
Ocado Group PLC1,2 | 91,873 | 2,879 | ||||||
Darden Restaurants, Inc. | 17,400 | 2,073 | ||||||
Domino’s Pizza, Inc. | 4,733 | 1,815 | ||||||
Alibaba Group Holding Ltd.1,2 | 57,300 | 1,674 | ||||||
General Motors Company | 34,796 | 1,449 | ||||||
Ferrari NV1 | 5,608 | 1,297 | ||||||
Peugeot SA1,2 | 31,465 | 861 | ||||||
Wynn Resorts, Ltd. | 5,258 | 593 | ||||||
|
| |||||||
| 23,988 | ||||||||
|
| |||||||
Industrials 4.99% | ||||||||
Airbus SE, non-registered shares1,2 | 25,944 | 2,850 | ||||||
SITC International Holdings Co. Ltd.1 | 1,109,000 | 2,401 | ||||||
SMC Corp.1 | 3,700 | 2,260 | ||||||
Lockheed Martin Corp. | 6,285 | 2,231 | ||||||
Spirax-Sarco Engineering PLC1 | 12,695 | 1,962 | ||||||
MTU Aero Engines AG1 | 7,308 | 1,904 | ||||||
Watsco, Inc. | 6,594 | 1,494 | ||||||
CSX Corp. | 16,155 | 1,466 | ||||||
BAE Systems PLC1 | 201,878 | 1,350 | ||||||
Honeywell International Inc. | 5,705 | 1,214 | ||||||
United Parcel Service, Inc., Class B | 6,356 | 1,070 | ||||||
Union Pacific Corp. | 4,976 | 1,036 | ||||||
Nidec Corp.1 | 7,400 | 932 | ||||||
Boeing Company | 2,458 | 526 | ||||||
|
| |||||||
| 22,696 | ||||||||
|
| |||||||
Communication services 2.86% | ||||||||
SoftBank Corp.1 | 295,200 | 3,701 | ||||||
Alphabet Inc., Class C2 | 1,708 | 2,992 | ||||||
Nintendo Co., Ltd.1 | 4,500 | 2,872 | ||||||
Verizon Communications Inc. | 46,262 | 2,718 | ||||||
América Móvil, SAB de CV, Series L (ADR) | 49,856 | 725 | ||||||
|
| |||||||
| 13,008 | ||||||||
|
| |||||||
Materials 2.86% | ||||||||
Givaudan SA1 | 657 | 2,768 | ||||||
Vale SA, ordinary nominative | 138,510 | 2,332 | ||||||
Croda International PLC1 | 24,263 | 2,192 | ||||||
LyondellBasell Industries NV | 17,400 | 1,595 | ||||||
Akzo Nobel NV1 | 14,721 | 1,581 | ||||||
Koninklijke DSM NV1 | 8,699 | 1,499 | ||||||
Rio Tinto PLC1 | 13,862 | 1,037 | ||||||
|
| |||||||
| 13,004 | ||||||||
|
| |||||||
Real estate 2.69% | ||||||||
Crown Castle International Corp. REIT | 18,510 | 2,947 | ||||||
Equinix, Inc. REIT | 3,430 | 2,450 | ||||||
Longfor Group Holdings Ltd.1 | 374,000 | 2,196 | ||||||
Gaming and Leisure Properties, Inc. REIT | 43,213 | 1,832 | ||||||
American Tower Corp. REIT | 7,855 | 1,763 | ||||||
Shimao Group Holdings Ltd.1 | 334,500 | 1,069 | ||||||
Shimao Services Holdings Ltd.1,2 | 4,271 | 7 | ||||||
|
| |||||||
| 12,264 | ||||||||
|
| |||||||
American Funds Insurance Series 149
Table of Contents
Global Balanced Fund (continued)
Common stocks (continued)
| Shares | Value (000) | |||||||
Energy 1.25% | ||||||||
TC Energy Corp. (CAD denominated) | 51,157 | $ | 2,080 | |||||
Baker Hughes Co., Class A | 78,260 | 1,632 | ||||||
Chevron Corp. | 13,871 | 1,171 | ||||||
Petróleo Brasileiro SA (Petrobras), ordinary nominative (ADR) | 73,448 | 825 | ||||||
|
| |||||||
| 5,708 | ||||||||
|
| |||||||
Utilities 1.00% | ||||||||
Enel SpA1 | 365,980 | 3,696 | ||||||
Brookfield Infrastructure Partners LP | 17,213 | 852 | ||||||
|
| |||||||
| 4,548 | ||||||||
|
| |||||||
Total common stocks (cost: $171,327,000) | 264,072 | |||||||
|
| |||||||
Preferred securities 0.45% | ||||||||
Information technology 0.45% | ||||||||
Samsung Electronics Co., Ltd., nonvoting preferred shares1 | 30,276 | 2,055 | ||||||
|
| |||||||
Total preferred securities (cost: $1,560,000) | 2,055 | |||||||
|
| |||||||
Principal amount (000) | ||||||||
Bonds, notes & other debt instruments 31.89% | ||||||||
Bonds & notes of governments & government agencies outside the U.S. 14.75% | ||||||||
Abu Dhabi (Emirate of) 2.50% 20223 | $ | 200 | 207 | |||||
Abu Dhabi (Emirate of) 0.75% 20233 | 275 | 276 | ||||||
Abu Dhabi (Emirate of) 3.125% 20273 | 200 | 225 | ||||||
Agricultural Development Bank of China 3.75% 2029 | CNY | 550 | 85 | |||||
Agricultural Development Bank of China 2.96% 2030 | 4,350 | 630 | ||||||
Australia (Commonwealth of), Series 152, 2.75% 2028 | A$ | 1,175 | 1,046 | |||||
Australia (Commonwealth of), Series 162, 1.75% 2051 | 400 | 294 | ||||||
Bermuda 2.375% 20303 | $ | 200 | 210 | |||||
Brazil (Federative Republic of) 0% 2021 | BRL | 3,000 | 572 | |||||
Brazil (Federative Republic of) 6.00% 20244 | 2,395 | 532 | ||||||
Brazil (Federative Republic of) 10.00% 2027 | 1,200 | 273 | ||||||
Canada 2.25% 2025 | C$ | 1,400 | 1,191 | |||||
Canada 2.25% 2029 | 1,440 | 1,286 | ||||||
Chile (Republic of) 4.50% 2026 | CLP | 235,000 | 379 | |||||
China (People’s Republic of), Series 1916, 3.12% 2026 | CNY | 6,650 | 1,017 | |||||
China (People’s Republic of), Series INBK, 2.85% 2027 | 6,000 | 902 | ||||||
China (People’s Republic of), Series 1906, 3.29% 2029 | 5,500 | 845 | ||||||
China (People’s Republic of), Series 1910, 3.86% 2049 | 5,010 | 778 | ||||||
China (People’s Republic of), Series INBK, 3.39% 2050 | 300 | 43 | ||||||
China Development Bank Corp., Series 1805, 4.04% 2028 | 5,000 | 789 | ||||||
China Development Bank Corp., Series 1905, 3.48% 2029 | 11,780 | 1,785 | ||||||
Colombia (Republic of) 5.75% 2027 | COP | 2,154,200 | 669 | |||||
Colombia (Republic of), Series B, 7.75% 2030 | 453,000 | 156 | ||||||
French Republic O.A.T. 3.25% 2045 | € | 160 | 338 | |||||
Germany (Federal Republic of) 0% 2025 | 910 | 1,152 | ||||||
Germany (Federal Republic of) 0.50% 2027 | 675 | 893 | ||||||
Germany (Federal Republic of) 0.25% 2029 | 830 | 1,091 | ||||||
Germany (Federal Republic of) 0% 2030 | 705 | 910 | ||||||
Germany (Federal Republic of) 0% 2030 | 400 | 516 | ||||||
Germany (Federal Republic of) 0% 2050 | 610 | 782 | ||||||
Greece (Hellenic Republic of) 3.375% 2025 | 475 | 659 | ||||||
Greece (Hellenic Republic of) 3.75% 2028 | 280 | 421 | ||||||
Greece (Hellenic Republic of) 3.875% 2029 | 270 | 418 | ||||||
Indonesia (Republic of) 3.75% 2022 | $ | 410 | 427 | |||||
Indonesia (Republic of) 3.85% 20273 | 400 | 458 | ||||||
Indonesia (Republic of), Series 78, 8.25% 2029 | IDR | 3,977,000 | 327 | |||||
Indonesia (Republic of), Series 82, 7.00% 2030 | 1,000,000 | 77 | ||||||
150 American Funds Insurance Series
Table of Contents
Global Balanced Fund (continued)
Bonds, notes & other debt instruments (continued)
Principal amount (000) | Value (000) | |||||||
Bonds & notes of governments & government agencies outside the U.S. (continued) | ||||||||
Indonesia (Republic of), Series 87, 6.50% 2031 | IDR | 2,010,000 | $ | 150 | ||||
Indonesia (Republic of), Series 74, 7.50% 2032 | 597,000 | 46 | ||||||
Indonesia (Republic of), Series 65, 6.625% 2033 | 1,493,000 | 109 | ||||||
Israel (State of) 2.875% 2024 | € | 200 | 267 | |||||
Israel (State of) 1.50% 2027 | 100 | 133 | ||||||
Israel (State of) 2.00% 2027 | ILS | 2,600 | 888 | |||||
Israel (State of) 5.50% 2042 | 700 | 373 | ||||||
Italy (Republic of) 0.10% 20234 | € | 772 | 965 | |||||
Italy (Republic of) 0.95% 2027 | 1,025 | 1,315 | ||||||
Japan, Series 134, 0.10% 2022 | ¥ | 31,900 | 310 | |||||
Japan, Series 17, 0.10% 20234 | 10,450 | 101 | ||||||
Japan, Series 19, 0.10% 20244 | 30,330 | 294 | ||||||
Japan, Series 18, 0.10% 20244 | 20,780 | 202 | ||||||
Japan, Series 145, 0.10% 2025 | 110,200 | 1,078 | ||||||
Japan, Series 21, 0.10% 20264 | 40,483 | 394 | ||||||
Japan, Series 346, 0.10% 2027 | 173,250 | 1,699 | ||||||
Japan, Series 22, 0.10% 20274 | 25,376 | 247 | ||||||
Japan, Series 23, 0.10% 20284 | 66,293 | 644 | ||||||
Japan, Series 24, 0.10% 20294 | 213,289 | 2,076 | ||||||
Japan, Series 356, 0.10% 2029 | 112,800 | 1,105 | ||||||
Japan, Series 360, 0.10% 2030 | 415,150 | 4,052 | ||||||
Japan, Series 152, 1.20% 2035 | 212,000 | 2,339 | ||||||
Japan, Series 42, 1.70% 2044 | 94,100 | 1,156 | ||||||
Kuwait (State of) 2.75% 20223 | $ | 200 | 206 | |||||
Malaysia (Federation of), Series 0119, 3.906% 2026 | MYR | 1,380 | 372 | |||||
Malaysia (Federation of), Series 0417, 3.899% 2027 | 1,300 | 355 | ||||||
Malaysia (Federation of), Series 0418, 4.893% 2038 | 2,800 | 822 | ||||||
Malaysia (Federation of), Series 0519, 3.757% 2040 | 1,650 | 431 | ||||||
Malaysia (Federation of), Series 0216, 4.736% 2046 | 609 | 173 | ||||||
Morocco (Kingdom of) 4.25% 2022 | $ | 200 | 211 | |||||
Morocco (Kingdom of) 3.50% 2024 | € | 100 | 133 | |||||
Morocco (Kingdom of) 1.375% 2026 | 130 | 160 | ||||||
Morocco (Kingdom of) 1.50% 2031 | 125 | 149 | ||||||
Morocco (Kingdom of) 1.50% 2031 | 100 | 119 | ||||||
Morocco (Kingdom of) 3.00% 20323 | $ | 200 | 204 | |||||
National Highways Authority of India 7.17% 2021 | INR | 30,000 | 424 | |||||
Netherlands (Kingdom of the) 0% 2027 | € | 810 | 1,029 | |||||
Netherlands (Kingdom of the) 5.50% 2028 | 100 | 176 | ||||||
Norway (Kingdom of) 1.75% 2025 | NKr | 4,000 | 489 | |||||
Nova Scotia (Province of) 3.15% 2051 | C$ | 170 | 165 | |||||
Panama (Republic of) 3.16% 2030 | $ | 265 | 294 | |||||
Peru (Republic of) 2.392% 2026 | 90 | 96 | ||||||
Peru (Republic of) 6.15% 2032 | PEN | 600 | 202 | |||||
Peru (Republic of) 5.625% 2050 | $ | 20 | 32 | |||||
Philippines (Republic of) 1.648% 2031 | 200 | 203 | ||||||
Qatar (State of) 3.40% 20253 | 200 | 221 | ||||||
Qatar (State of) 4.50% 20283 | 500 | 607 | ||||||
Quebec (Province of) 1.90% 2030 | C$ | 700 | 581 | |||||
Romania 3.624% 2030 | € | 692 | 1,011 | |||||
Romania 3.624% 2030 | 225 | 329 | ||||||
Romania 2.00% 2032 | 100 | 128 | ||||||
Romania 3.50% 2034 | 65 | 95 | ||||||
Romania 3.875% 2035 | 170 | 255 | ||||||
Romania 3.375% 2038 | 250 | 352 | ||||||
Romania 4.625% 2049 | 184 | 304 | ||||||
Romania 4.625% 2049 | 25 | 41 | ||||||
Romania 3.375% 2050 | 73 | 103 | ||||||
Russian Federation 7.00% 2023 | RUB | 16,600 | 237 | |||||
Russian Federation 2.875% 2025 | € | 200 | 270 | |||||
Russian Federation 2.875% 2025 | 100 | 135 | ||||||
Russian Federation 4.25% 2027 | $ | 200 | 229 | |||||
American Funds Insurance Series 151
Table of Contents
Global Balanced Fund (continued)
Bonds, notes & other debt instruments (continued)
Principal amount (000) | Value (000) | |||||||
Bonds & notes of governments & government agencies outside the U.S. (continued) | ||||||||
Russian Federation 6.90% 2029 | RUB | 25,250 | $ | 367 | ||||
Russian Federation 7.65% 2030 | 6,000 | 92 | ||||||
Russian Federation 8.50% 2031 | 5,530 | 90 | ||||||
Russian Federation 7.70% 2033 | 23,030 | 351 | ||||||
Russian Federation 7.25% 2034 | 8,140 | 120 | ||||||
Saudi Arabia (Kingdom of) 2.894% 20223 | $ | 200 | 206 | |||||
Saudi Arabia (Kingdom of) 3.625% 20283 | 200 | 224 | ||||||
Serbia (Republic of) 3.125% 2027 | € | 915 | 1,259 | |||||
Singapore (Republic of) 2.625% 2028 | S$ | 275 | 236 | |||||
Singapore (Republic of) 2.875% 2029 | 155 | 137 | ||||||
Singapore (Republic of) 2.875% 2030 | 165 | 148 | ||||||
South Africa (Republic of), Series R-214, 6.50% 2041 | ZAR | 2,200 | 98 | |||||
South Africa (Republic of), Series R-2048, 8.75% 2048 | 6,300 | 353 | ||||||
South Korea (Republic of), Series 2209, 2.00% 2022 | KRW | 560,000 | 525 | |||||
South Korea (Republic of), Series 2503, 1.50% 2025 | 639,700 | 595 | ||||||
Sri Lanka (Democratic Socialist Republic of) 6.25% 2021 | $ | 250 | 218 | |||||
Thailand (Kingdom of) 2.125% 2026 | THB | 16,450 | 594 | |||||
Ukraine 6.75% 2026 | € | 150 | 202 | |||||
United Kingdom 1.75% 2022 | £ | 280 | 395 | |||||
United Kingdom 2.75% 2024 | 50 | 76 | ||||||
United Kingdom 4.75% 2030 | 460 | 911 | ||||||
United Kingdom 4.25% 2032 | 280 | 553 | ||||||
United Kingdom 4.50% 2034 | 225 | 476 | ||||||
United Kingdom 0.625% 2035 | 600 | 833 | ||||||
United Kingdom 3.25% 2044 | 250 | 526 | ||||||
United Mexican States 0.70% 2021 | ¥ | 100,000 | 968 | |||||
United Mexican States, Series M, 7.50% 2027 | MXN | 25,740 | 1,473 | |||||
United Mexican States, Series M20, 8.50% 2029 | 11,500 | 705 | ||||||
United Mexican States 2.659% 2031 | $ | 216 | 222 | |||||
United Mexican States, Series M, 8.00% 2047 | MXN | 4,000 | 237 | |||||
|
| |||||||
| 67,135 | ||||||||
|
| |||||||
U.S. Treasury bonds & notes 10.85% | ||||||||
U.S. Treasury 10.36% | ||||||||
U.S. Treasury 0.125% 2022 | $ | 8,318 | 8,319 | |||||
U.S. Treasury 1.875% 2022 | 700 | 713 | ||||||
U.S. Treasury 1.875% 2022 | 600 | 617 | ||||||
U.S. Treasury 0.375% 2025 | 8,605 | 8,616 | ||||||
U.S. Treasury 2.25% 2027 | 700 | 774 | ||||||
U.S. Treasury 2.25% 2027 | 300 | 333 | ||||||
U.S. Treasury 2.875% 20285 | 1,275 | 1,477 | ||||||
U.S. Treasury 2.875% 2028 | 700 | 813 | ||||||
U.S. Treasury 0.625% 2030 | 2,640 | 2,580 | ||||||
U.S. Treasury 0.625% 2030 | 650 | 633 | ||||||
U.S. Treasury 0.875% 2030 | 14,286 | 14,231 | ||||||
U.S. Treasury 2.875% 2046 | 400 | 511 | ||||||
U.S. Treasury 1.375% 20505 | 8,058 | 7,540 | ||||||
|
| |||||||
| 47,157 | ||||||||
|
| |||||||
U.S. Treasury inflation-protected securities 0.49% | ||||||||
U.S. Treasury Inflation-Protected Security 0.25% 20294 | 713 | 807 | ||||||
U.S. Treasury Inflation-Protected Security 1.375% 20444,5 | 279 | 403 | ||||||
U.S. Treasury Inflation-Protected Security 1.00% 20494,5 | 724 | 1,021 | ||||||
|
| |||||||
| 2,231 | ||||||||
|
| |||||||
Total U.S. Treasury bonds & notes | 49,388 | |||||||
|
| |||||||
152 American Funds Insurance Series
Table of Contents
Global Balanced Fund (continued)
Bonds, notes & other debt instruments (continued)
Principal amount (000) | Value (000) | |||||||
Corporate bonds, notes & loans 4.81% | ||||||||
Financials 1.23% | ||||||||
ACE INA Holdings Inc. 2.875% 2022 | $ | 10 | $ | 10 | ||||
ACE INA Holdings Inc. 3.35% 2026 | 10 | 11 | ||||||
ACE INA Holdings Inc. 4.35% 2045 | 20 | 27 | ||||||
Allianz SE 4.75% 2049 (3-month EUR-EURIBOR + 3.60% on 10/24/2023)6 | € | 100 | 137 | |||||
Bank of America Corp. 3.55% 2024 (3-month USD-LIBOR + 0.78% on 3/5/2023)6 | $ | 100 | 107 | |||||
Bank of America Corp. 1.319% 2026 (USD-SOFR + 1.15% on 6/19/2025)6 | 500 | 511 | ||||||
Bank of America Corp. 3.419% 2028 (3-month USD-LIBOR + 1.04% on 12/20/2027)6 | 236 | 267 | ||||||
Bank of America Corp. 2.496% 2031 (3-month USD-LIBOR + 0.99% on 2/13/2030)6 | 20 | 21 | ||||||
CaixaBank, SA 3.50% 2027 (5-year EUR Mid-Swap + 3.35% on 2/15/2022)6 | € | 100 | 126 | |||||
China Construction Bank Corp. 2.45% 2030 (UST Yield Curve Rate T Note Constant Maturity 5-year + 2.15% on 6/24/2025)6 | $ | 300 | 308 | |||||
Citigroup Inc. 3.106% 2026 (USD-SOFR + 2.842% on 3/8/2026)6 | 175 | 192 | ||||||
Goldman Sachs Group, Inc. 2.905% 2023 (3-month USD-LIBOR + 0.99% on 7/24/2022)6 | 130 | 135 | ||||||
Goldman Sachs Group, Inc. 3.50% 2025 | 207 | 230 | ||||||
Goldman Sachs Group, Inc. 4.017% 2038 (3-month USD-LIBOR + 1.373% on 10/31/2037)6 | 78 | 95 | ||||||
Groupe BPCE SA 0.64% 2022 | ¥ | 100,000 | 972 | |||||
Groupe BPCE SA 5.70% 20233 | $ | 200 | 227 | |||||
Groupe BPCE SA 1.00% 2025 | € | 100 | 127 | |||||
HSBC Holdings PLC 4.292% 2026 (3-month USD-LIBOR + 1.348% on 9/12/2025)6 | $ | 200 | 228 | |||||
JPMorgan Chase & Co. 3.25% 2022 | 28 | 30 | ||||||
JPMorgan Chase & Co. 4.493% 2031 (USD-SOFR + 3.79% on 3/24/2030)6 | 160 | 197 | ||||||
Mizuho Financial Group, Ltd. 2.721% 2023 (3-month USD-LIBOR + 0.84% on 7/16/2022)6 | 271 | 280 | ||||||
Morgan Stanley 0.985% 2026 (USD-SOFR + 0.72% on 12/10/2025)6 | 200 | 202 | ||||||
Morgan Stanley 3.125% 2026 | 110 | 123 | ||||||
Morgan Stanley 2.699% 2031 (USD-SOFR + 1.143% on 1/22/2030)6 | 72 | 78 | ||||||
New York Life Insurance Company 3.75% 20503 | 23 | 28 | ||||||
PNC Financial Services Group, Inc. 2.854% 20226 | 100 | 105 | ||||||
Rabobank Nederland 3.875% 2023 | € | 100 | 134 | |||||
Skandinaviska Enskilda Banken AB 2.80% 2022 | $ | 250 | 257 | |||||
Wells Fargo & Company 2.393% 2028 (USD-SOFR + 2.10% on 6/2/2027)6 | 400 | 426 | ||||||
|
| |||||||
| 5,591 | ||||||||
|
| |||||||
Utilities 1.05% | ||||||||
Abu Dhabi National Energy Company PJSC (TAQA) 3.625% 20233 | 200 | 212 | ||||||
Berkshire Hathaway Energy Company 3.70% 20303 | 25 | 30 | ||||||
Berkshire Hathaway Energy Company 1.65% 20313 | 175 | 175 | ||||||
CMS Energy Corp. 3.00% 2026 | 150 | 166 | ||||||
Duke Energy Carolinas, LLC 3.05% 2023 | 280 | 296 | ||||||
Duke Energy Progress, LLC 3.70% 2028 | 75 | 88 | ||||||
Edison International 4.125% 2028 | 160 | 178 | ||||||
Enel Finance International SA 2.75% 20233 | 200 | 209 | ||||||
Enel Finance International SA 3.50% 20283 | 200 | 228 | ||||||
Enersis Américas SA 4.00% 2026 | 35 | 39 | ||||||
Exelon Corp. 3.40% 2026 | 150 | 169 | ||||||
Exelon Corp., junior subordinated, 3.497% 20226 | 25 | 26 | ||||||
FirstEnergy Corp. 3.90% 2027 (4.40% on 1/16/2021)6 | 120 | 132 | ||||||
FirstEnergy Corp. 3.50% 20283 | 35 | 37 | ||||||
Interstate Power and Light Co. 2.30% 2030 | 50 | 53 | ||||||
NextEra Energy Capital Holdings, Inc. 2.75% 2029 | 234 | 255 | ||||||
NextEra Energy Capital Holdings, Inc. 2.25% 2030 | 478 | 502 | ||||||
Niagara Mohawk Power Corp. 3.508% 20243 | 85 | 93 | ||||||
Pacific Gas and Electric Co. 2.95% 2026 | 25 | 26 | ||||||
Pacific Gas and Electric Co. 2.10% 2027 | 100 | 102 | ||||||
Pacific Gas and Electric Co. 4.65% 2028 | 114 | 130 | ||||||
Pacific Gas and Electric Co. 4.55% 2030 | 31 | 35 | ||||||
Pacific Gas and Electric Co. 2.50% 2031 | 600 | 602 | ||||||
Pacific Gas and Electric Co. 3.50% 2050 | 137 | 137 | ||||||
American Funds Insurance Series 153
Table of Contents
Global Balanced Fund (continued)
Bonds, notes & other debt instruments (continued)
Principal amount (000) | Value (000) | |||||||
Corporate bonds, notes & loans (continued) | ||||||||
Utilities (continued) | ||||||||
State Grid Overseas Investment Ltd. 1.25% 2022 | € | 100 | $ | 124 | ||||
State Grid Overseas Investment Ltd. 3.50% 20273 | $ | 450 | 501 | |||||
Xcel Energy Inc. 3.35% 2026 | 216 | 244 | ||||||
|
| |||||||
| 4,789 | ||||||||
|
| |||||||
Communication services 0.48% | ||||||||
AT&T Inc. 2.75% 2031 | 375 | 401 | ||||||
AT&T Inc. 2.55% 20333 | 64 | 66 | ||||||
Comcast Corp. 3.95% 2025 | 80 | 92 | ||||||
Deutsche Telekom International Finance BV 9.25% 2032 | 45 | 76 | ||||||
France Télécom 9.00% 20316 | 65 | 107 | ||||||
KT Corp. 0.22% 2022 | ¥ | 100,000 | 966 | |||||
T-Mobile US, Inc. 2.05% 20283 | $ | 200 | 208 | |||||
Walt Disney Company 2.65% 2031 | 240 | 263 | ||||||
|
| |||||||
| 2,179 | ||||||||
|
| |||||||
Health care 0.46% | ||||||||
Abbott Laboratories 3.75% 2026 | 51 | 60 | ||||||
Aetna Inc. 2.80% 2023 | 10 | 10 | ||||||
Amgen Inc. 1.90% 2025 | 40 | 42 | ||||||
Amgen Inc. 2.20% 2027 | 30 | 32 | ||||||
AstraZeneca PLC 3.50% 2023 | 150 | 162 | ||||||
Bayer US Finance II LLC 3.875% 20233 | 200 | 218 | ||||||
Becton, Dickinson and Company 2.894% 2022 | 47 | 49 | ||||||
Becton, Dickinson and Company 3.734% 2024 | 35 | 39 | ||||||
Becton, Dickinson and Company 3.70% 2027 | 43 | 49 | ||||||
Becton, Dickinson and Company 2.823% 2030 | 28 | 31 | ||||||
Bristol-Myers Squibb Co. 2.90% 2024 | 178 | 193 | ||||||
Cigna Corp. 4.125% 2025 | 80 | 92 | ||||||
EMD Finance LLC 3.25% 20253 | 250 | 274 | ||||||
Medtronic, Inc. 3.50% 2025 | 31 | 35 | ||||||
Novartis Capital Corp. 1.75% 2025 | 31 | 33 | ||||||
Novartis Capital Corp. 2.00% 2027 | 34 | 36 | ||||||
Novartis Capital Corp. 2.20% 2030 | 73 | 78 | ||||||
Stryker Corp. 0.75% 2029 | € | 210 | 267 | |||||
Takeda Pharmaceutical Company, Ltd. 2.25% 2026 | 100 | 137 | ||||||
Thermo Fisher Scientific Inc. 4.133% 2025 | $ | 84 | 96 | |||||
Upjohn Inc. 2.70% 20303 | 142 | 151 | ||||||
|
| |||||||
| 2,084 | ||||||||
|
| |||||||
Energy 0.39% | ||||||||
Canadian Natural Resources Ltd. 2.95% 2030 | 161 | 173 | ||||||
Enbridge Inc. 4.25% 2026 | 70 | 82 | ||||||
Enbridge Inc. 3.70% 2027 | 45 | 51 | ||||||
Equinor ASA 1.75% 2026 | 35 | 37 | ||||||
Equinor ASA 2.375% 2030 | 70 | 75 | ||||||
Exxon Mobil Corp. 2.992% 2025 | 135 | 148 | ||||||
Exxon Mobil Corp. 3.482% 2030 | 170 | 198 | ||||||
Halliburton Company 3.80% 2025 | 3 | 3 | ||||||
MPLX LP 2.65% 2030 | 75 | 79 | ||||||
Petróleos Mexicanos 7.19% 2024 | MXN | 1,335 | 61 | |||||
Petróleos Mexicanos 7.47% 2026 | 5,330 | 224 | ||||||
Saudi Arabian Oil Co. 1.625% 20253 | $ | 200 | 205 | |||||
Shell International Finance BV 3.50% 2023 | 330 | 359 | ||||||
Statoil ASA 3.70% 2024 | 50 | 55 | ||||||
|
| |||||||
| 1,750 | ||||||||
|
| |||||||
154 American Funds Insurance Series
Table of Contents
Global Balanced Fund (continued)
Bonds, notes & other debt instruments (continued)
Principal amount (000) | Value (000) | |||||||
Corporate bonds, notes & loans (continued) | ||||||||
Consumer discretionary 0.36% | ||||||||
Amazon.com, Inc. 2.80% 2024 | $ | 170 | $ | 184 | ||||
Amazon.com, Inc. 1.20% 2027 | 50 | 51 | ||||||
Amazon.com, Inc. 2.50% 2050 | 305 | 316 | ||||||
Bayerische Motoren Werke AG 3.90% 20253 | 70 | 79 | ||||||
Bayerische Motoren Werke AG 4.15% 20303 | 70 | 85 | ||||||
DaimlerChrysler North America Holding Corp. 2.00% 20213 | 200 | 201 | ||||||
Hyundai Capital America 3.25% 20223 | 65 | 68 | ||||||
Hyundai Capital America 2.375% 20273 | 109 | 114 | ||||||
Hyundai Capital Services Inc. 3.75% 20233 | 250 | 266 | ||||||
Toyota Motor Credit Corp. 2.90% 2023 | 100 | 106 | ||||||
Toyota Motor Credit Corp. 3.00% 2025 | 100 | 110 | ||||||
Toyota Motor Credit Corp. 3.375% 2030 | 33 | 39 | ||||||
|
| |||||||
| 1,619 | ||||||||
|
| |||||||
Consumer staples 0.35% | ||||||||
Altria Group, Inc. 1.00% 2023 | € | 110 | 137 | |||||
Altria Group, Inc. 2.20% 2027 | 270 | 360 | ||||||
Anheuser-Busch InBev NV 4.00% 2028 | $ | 100 | 118 | |||||
Anheuser-Busch InBev NV 4.75% 2029 | 220 | 272 | ||||||
British American Tobacco PLC 3.215% 2026 | 62 | 68 | ||||||
British American Tobacco PLC 3.557% 2027 | 105 | 117 | ||||||
British American Tobacco PLC 3.462% 2029 | 75 | 82 | ||||||
Conagra Brands, Inc. 4.30% 2024 | 210 | 235 | ||||||
Keurig Dr Pepper Inc. 4.597% 2028 | 175 | 213 | ||||||
|
| |||||||
| 1,602 | ||||||||
|
| |||||||
Real estate 0.19% | ||||||||
American Campus Communities, Inc. 3.75% 2023 | 100 | 106 | ||||||
American Campus Communities, Inc. 4.125% 2024 | 90 | 98 | ||||||
Corporate Office Properties LP 3.60% 2023 | 65 | 69 | ||||||
Equinix, Inc. 2.15% 2030 | 197 | 201 | ||||||
Essex Portfolio LP 3.50% 2025 | 120 | 133 | ||||||
Essex Portfolio LP 3.375% 2026 | 40 | 45 | ||||||
WEA Finance LLC 3.75% 20243 | 200 | 211 | ||||||
|
| |||||||
| 863 | ||||||||
|
| |||||||
Industrials 0.15% | ||||||||
Carrier Global Corp. 2.242% 2025 | 36 | 38 | ||||||
Carrier Global Corp. 2.493% 2027 | 30 | 32 | ||||||
CCCI Treasure Ltd. 3.425% | ||||||||
(UST Yield Curve Rate T Note Constant Maturity 5-year + 1.998% on 2/21/2025)6 | 200 | 198 | ||||||
CSX Corp. 3.80% 2050 | 6 | 7 | ||||||
CSX Corp. 2.50% 2051 | 75 | 75 | ||||||
Lima Metro Line 2 Finance Ltd. 5.875% 20343 | 105 | 127 | ||||||
United Technologies Corp. 4.125% 2028 | 170 | 203 | ||||||
|
| |||||||
| 680 | ||||||||
|
| |||||||
Information technology 0.13% | ||||||||
Broadcom Inc. 3.15% 2025 | 70 | 76 | ||||||
Broadcom Inc. 4.15% 2030 | 70 | 81 | ||||||
Microsoft Corp. 2.40% 2026 | 187 | 204 | ||||||
Oracle Corp. 2.65% 2026 | 216 | 238 | ||||||
|
| |||||||
| 599 | ||||||||
|
| |||||||
Materials 0.02% | ||||||||
Vale Overseas Ltd. 3.75% 2030 | 94 | 105 | ||||||
|
| |||||||
Total corporate bonds, notes & loans | 21,861 | |||||||
|
| |||||||
American Funds Insurance Series 155
Table of Contents
Global Balanced Fund (continued)
Bonds, notes & other debt instruments (continued)
Principal amount (000) | Value (000) | |||||||
Mortgage-backed obligations 1.42% | ||||||||
Other mortgage-backed securities 0.73% | ||||||||
Korea Housing Finance Corp. 2.00% 20213,7 | $ | 250 | $ | 253 | ||||
Nordea Kredit 0.50% 20407 | DKr | 1,846 | 305 | |||||
Nykredit Realkredit AS, Series 01E, 1.50% 20377 | 821 | 140 | ||||||
Nykredit Realkredit AS, Series 01E, 0.50% 20407 | 12,241 | 2,021 | ||||||
Nykredit Realkredit AS, Series 01E, 1.50% 20407 | 2,102 | 358 | ||||||
Nykredit Realkredit AS, Series 01E, 0.50% 20507 | 1,466 | 238 | ||||||
|
| |||||||
| 3,315 | ||||||||
|
| |||||||
Federal agency mortgage-backed obligations 0.69% | ||||||||
Fannie Mae Pool #MA4228 1.50% 20367 | $ | 1,042 | 1,073 | |||||
Freddie Mac Pool #SB8083 1.50% 20367 | 267 | 275 | ||||||
Freddie Mac Pool #2B7343 3.711% 20497,8 | 136 | 142 | ||||||
Government National Mortgage Assn. 4.00% 20517,9 | 75 | 80 | ||||||
Government National Mortgage Assn. Pool #MA5986 4.00% 20497 | 18 | 19 | ||||||
Uniform Mortgage-Backed Security 1.50% 20367,9 | 1,508 | 1,550 | ||||||
|
| |||||||
| 3,139 | ||||||||
|
| |||||||
Total mortgage-backed obligations | 6,454 | |||||||
|
| |||||||
Municipals 0.04% | ||||||||
Ohio 0.02% | ||||||||
Turnpike and Infrastructure Commission, Turnpike Rev. Ref. Bonds (Infrastructure Projects), Series 2020-A, 3.216% 2048 | 100 | 102 | ||||||
|
| |||||||
Texas 0.02% | ||||||||
Grand Parkway Transportation Corp., Grand Parkway System Toll Rev. Ref. Bonds, Series 2020-B, 3.236% 2052 | 80 | 84 | ||||||
|
| |||||||
Total municipals | 186 | |||||||
|
| |||||||
Asset-backed obligations 0.02% | ||||||||
OSW Structured Asset Trust, Series 2020-RPL1, Class A1, 3.072% 20603,7,8 | 93 | 95 | ||||||
|
| |||||||
Total bonds, notes & other debt instruments (cost: $137,636,000) | 145,119 | |||||||
|
| |||||||
Short-term securities 9.30% | ||||||||
Money market investments 5.35% | ||||||||
Capital Group Central Cash Fund 0.12%10,11 | 243,271 | 24,329 | ||||||
|
| |||||||
Commercial paper 3.95% | ||||||||
Toronto-Dominion Bank 0.19% due 1/19/20213 | 9,000 | 9,000 | ||||||
NRW.Bank 0.21% due 1/22/20213 | 9,000 | 8,999 | ||||||
|
| |||||||
| 17,999 | ||||||||
|
| |||||||
Total short-term securities (cost: $42,325,000) | 42,328 | |||||||
|
| |||||||
Total investment securities 99.66% (cost: $352,848,000) | 453,574 | |||||||
Other assets less liabilities 0.34% | 1,558 | |||||||
|
| |||||||
Net assets 100.00% | $ | 455,132 | ||||||
|
| |||||||
156 American Funds Insurance Series
Table of Contents
Global Balanced Fund (continued)
Futures contracts
Contracts | Type | Number of contracts | Expiration | Notional amount12 (000) | Value at 12/31/202013 (000) | Unrealized appreciation at 12/31/2020 (000) | ||||||||||||||||
10 Year Ultra U.S. Treasury Note Futures | Short | 18 | March 2021 | $ | (1,800 | ) | $ | (2,814 | ) | $ | 3 | |||||||||||
Forward currency contracts
| Contract amount | Unrealized appreciation (depreciation) | |||||||||||||||
| Purchases (000) | Sales (000) | Counterparty | Settlement date | at 12/31/2020 (000) | ||||||||||||
| GBP | 626 | USD | 833 | Citibank | 1/6/2021 | $ | 24 | |||||||||
| EUR | 560 | USD | 665 | Goldman Sachs | 1/6/2021 | 19 | ||||||||||
| ILS | 800 | USD | 239 | Standard Chartered Bank | 1/6/2021 | 9 | ||||||||||
| JPY | 39,700 | USD | 383 | UBS AG | 1/6/2021 | 2 | ||||||||||
| CAD | 10 | USD | 8 | Standard Chartered Bank | 1/6/2021 | — | 14 | |||||||||
| GBP | 200 | EUR | 224 | Citibank | 1/6/2021 | — | 14 | |||||||||
| USD | 275 | MXN | 5,550 | HSBC Bank | 1/6/2021 | (4 | ) | |||||||||
| PLN | 1,400 | USD | 372 | Citibank | 1/7/2021 | 3 | ||||||||||
| EUR | 715 | USD | 860 | Bank of New York Mellon | 1/8/2021 | 14 | ||||||||||
| CNH | 3,320 | USD | 505 | HSBC Bank | 1/8/2021 | 6 | ||||||||||
| USD | 377 | PLN | 1,400 | Barclays Bank PLC | 1/8/2021 | 3 | ||||||||||
| USD | 451 | EUR | 370 | Citibank | 1/8/2021 | (1 | ) | |||||||||
| USD | 520 | EUR | 430 | JPMorgan Chase | 1/8/2021 | (5 | ) | |||||||||
| USD | 717 | MXN | 14,415 | HSBC Bank | 1/8/2021 | (6 | ) | |||||||||
| USD | 541 | CAD | 700 | Standard Chartered Bank | 1/8/2021 | (9 | ) | |||||||||
| USD | 397 | ZAR | 6,080 | Standard Chartered Bank | 1/8/2021 | (16 | ) | |||||||||
| USD | 899 | ILS2,960 | Citibank | 1/8/2021 | (23 | ) | ||||||||||
| CAD | 1,400 | USD | 1,094 | Goldman Sachs | 1/12/2021 | 6 | ||||||||||
| USD | 260 | AUD | 350 | Citibank | 1/12/2021 | (10 | ) | |||||||||
| JPY | 234,930 | USD | 2,252 | HSBC Bank | 1/14/2021 | 24 | ||||||||||
| CLP | 175,000 | USD | 237 | Citibank | 1/14/2021 | 9 | ||||||||||
| KRW | 320,500 | USD | 295 | Standard Chartered Bank | 1/14/2021 | — | 14 | |||||||||
| USD | 421 | INR | 31,100 | HSBC Bank | 1/14/2021 | (4 | ) | |||||||||
| USD | 11 | RUB | 800 | Citibank | 1/15/2021 | — | 14 | |||||||||
| EUR | 717 | USD | 871 | Goldman Sachs | 1/19/2021 | 5 | ||||||||||
| CZK | 11,700 | EUR | 444 | Standard Chartered Bank | 1/19/2021 | 2 | ||||||||||
| USD | 549 | CAD | 700 | Barclays Bank PLC | 1/19/2021 | (1 | ) | |||||||||
| USD | 513 | CNH | 3,360 | Goldman Sachs | 1/19/2021 | (3 | ) | |||||||||
| USD | 540 | CZK | 11,700 | Standard Chartered Bank | 1/19/2021 | (5 | ) | |||||||||
| ILS | 2,000 | USD | 617 | Goldman Sachs | 1/21/2021 | 6 | ||||||||||
| MXN | 8,100 | USD | 404 | Morgan Stanley | 1/21/2021 | 2 | ||||||||||
| CNH | 1,700 | USD | 261 | Goldman Sachs | 1/21/2021 | — | 14 | |||||||||
| USD | 174 | JPY | 18,000 | Goldman Sachs | 1/21/2021 | — | 14 | |||||||||
| USD | 523 | ILS | 1,700 | JPMorgan Chase | 1/21/2021 | (6 | ) | |||||||||
| USD | 545 | BRL | 2,788 | Goldman Sachs | 1/22/2021 | 8 | ||||||||||
| KRW | 476,000 | USD | 435 | Citibank | 1/22/2021 | 3 | ||||||||||
| USD | 431 | KRW | 476,000 | Citibank | 1/22/2021 | (7 | ) | |||||||||
| EUR | 3,234 | USD | 3,945 | HSBC Bank | 1/25/2021 | 8 | ||||||||||
| CAD | 1,170 | USD | 896 | Morgan Stanley | 1/29/2021 | 24 | ||||||||||
| CAD | 1,170 | USD | 897 | Citibank | 1/29/2021 | 22 | ||||||||||
| MXN | 6,630 | USD | 317 | Morgan Stanley | 1/29/2021 | 15 | ||||||||||
| MXN | 6,640 | USD | 319 | Morgan Stanley | 1/29/2021 | 13 | ||||||||||
| ZAR | 2,790 | USD | 177 | JPMorgan Chase | 1/29/2021 | 12 | ||||||||||
| EUR | 502 | DKK | 3,737 | Citibank | 1/29/2021 | — | 14 | |||||||||
| EUR | 63 | DKK | 467 | Goldman Sachs | 1/29/2021 | — | 14 | |||||||||
| EUR | 63 | DKK | 467 | Citibank | 1/29/2021 | — | 14 | |||||||||
American Funds Insurance Series 157
Table of Contents
Global Balanced Fund (continued)
Forward currency contracts (continued)
| Contract amount | Unrealized appreciation (depreciation) | |||||||||||||||
| Purchases (000) | Sales (000) | Counterparty | Settlement date | at 12/31/2020 (000) | ||||||||||||
| EUR | 1,219 | DKK | 9,069 | Citibank | 1/29/2021 | $ | — | 14 | ||||||||
| USD | 280 | AUD | 370 | HSBC Bank | 1/29/2021 | (5 | ) | |||||||||
| USD | 169 | ZAR | 2,790 | Bank of America | 1/29/2021 | (21 | ) | |||||||||
| USD | 617 | MXN | 13,270 | Morgan Stanley | 1/29/2021 | (48 | ) | |||||||||
| USD | 1,764 | CAD | 2,340 | Citibank | 1/29/2021 | (74 | ) | |||||||||
| CAD | 1,390 | USD | 1,074 | Barclays Bank PLC | 2/10/2021 | 18 | ||||||||||
| USD | 1,027 | CAD | 1,320 | Goldman Sachs | 2/10/2021 | (11 | ) | |||||||||
|
| |||||||||||||||
| $ | (2 | ) | ||||||||||||||
|
| |||||||||||||||
Swap contracts
Interest rate swaps
Receive | Pay | Expiration date | Notional (000) | Value at 12/31/2020 (000) | Upfront premium paid (000) | Unrealized appreciation at 12/31/2020 (000) | ||||||||||||||||
(0.0955)% | 6-month EURIBOR | 7/22/2024 | € | 2,200 | $ | 21 | $ | — | $ | 21 | ||||||||||||
Credit default swaps
Centrally cleared credit default swaps on credit indices — sell protection
Receive/ Payment frequency | Pay | Expiration date | Notional (000) | Value at 12/31/2020 (000) | Upfront premium paid (000) | Unrealized depreciation at 12/31/2020 (000) | ||||||||||||||||
1.00%/Quarterly | CDX.NA.IG.35 | 12/20/2025 | $ | 3,800 | $ | 93 | $ | 93 | $ | — | 14 | |||||||||||
Investments in affiliates11
| Value of affiliate at 1/1/2020 (000) | Additions (000) | Reductions (000) | Net realized gain (000) | Net unrealized depreciation (000) | Value of affiliate at 12/31/2020 (000) | Dividend income (000) | ||||||||||||||||||||||
Short-term securities 5.35% | ||||||||||||||||||||||||||||
Money market investments 5.35% | ||||||||||||||||||||||||||||
Capital Group Central Cash Fund 0.12%10 | $ | 2,825 | $ | 130,916 | $ | 109,410 | $ | 3 | $ | (5 | ) | $ | 24,329 | $ | 103 | |||||||||||||
158 American Funds Insurance Series
Table of Contents
Global Balanced Fund (continued)
| 1 | Valued under fair value procedures adopted by authority of the board of trustees. The total value of all such securities was $131,628,000, which represented 28.92% of the net assets of the fund. This entire amount relates to certain securities trading outside the U.S. whose values were adjusted as a result of significant market movements following the close of local trading. |
| 2 | Security did not produce income during the last 12 months. |
| 3 | Acquired in a transaction exempt from registration under Rule 144A or Section 4(2) of the Securities Act of 1933. May be resold in the U.S. in transactions exempt from registration, normally to qualified institutional buyers. The total value of all such securities was $25,404,000, which represented 5.58% of the net assets of the fund. |
| 4 | Index-linked bond whose principal amount moves with a government price index. |
| 5 | All or a portion of this security was pledged as collateral. The total value of pledged collateral was $184,000, which represented .04% of the net assets of the fund. |
| 6 | Step bond; coupon rate may change at a later date. |
| 7 | Principal payments may be made periodically. Therefore, the effective maturity date may be earlier than the stated maturity date. |
| 8 | Coupon rate may change periodically. Reference rate and spread are as of the most recent information available. Some coupon rates are determined by the issuer or agent based on current market conditions; therefore, the reference rate and spread are not available. |
| 9 | Purchased on a TBA basis. |
| 10 | Rate represents the seven-day yield at 12/31/2020. |
| 11 | Part of the same group of investment companies as the fund as defined under the Investment Company Act of 1940. |
| 12 | Notional amount is calculated based on the number of contracts and notional contract size. |
| 13 | Value is calculated based on the notional amount and current market price. |
| 14 | Amount less than one thousand. |
Key to abbreviations and symbols
ADR = American Depositary Receipts
AUD/A$ = Australian dollars
BRL = Brazilian reais
CAD/C$ = Canadian dollars
CLP = Chilean pesos
CNH/CNY = Chinese yuan renminbi
COP = Colombian pesos
CZK = Czech korunas
DKK/DKr = Danish kroner
EUR/€ = Euros
EURIBOR = Euro Interbank Offered Rate
GBP/£ = British pounds
IDR = Indonesian rupiah
ILS = Israeli shekels
INR = Indian rupees
JPY/¥ = Japanese yen
KRW = South Korean won
LIBOR = London Interbank Offered Rate
MXN = Mexican pesos
MYR = Malaysian ringgits
NKr = Norwegian kroner
PEN = Peruvian nuevos soles
PLN = Polish zloty
Ref. = Refunding
Rev. = Revenue
RUB = Russian rubles
S$ = Singapore dollars
SOFR = Secured Overnight Financing Rate
TBA = To-be-announced
THB = Thai baht
USD/$ = U.S. dollars
ZAR = South African rand
See notes to financial statements.
American Funds Insurance Series 159
Table of Contents
Investment portfolio December 31, 2020
Bonds, notes & other debt instruments 96.71%
Principal amount (000) | Value (000) | |||||||
Corporate bonds, notes & loans 33.25% | ||||||||
Financials 7.75% | ||||||||
ACE INA Holdings Inc. 2.875% 2022 | $ | 3,625 | $ | 3,781 | ||||
ACE INA Holdings Inc. 3.35% 2026 | 2,025 | 2,283 | ||||||
ACE INA Holdings Inc. 4.35% 2045 | 2,220 | 3,011 | ||||||
AerCap Holdings NV 6.50% 2025 | 1,798 | 2,151 | ||||||
Ally Financial Inc. 5.125% 2024 | 1,500 | 1,730 | ||||||
Ally Financial Inc. 8.00% 2031 | 8,479 | 12,081 | ||||||
Ally Financial Inc. 8.00% 2031 | 7,070 | 10,393 | ||||||
American International Group, Inc. 4.20% 2028 | 9,875 | 11,733 | ||||||
American International Group, Inc. 3.40% 2030 | 12,313 | 14,111 | ||||||
American International Group, Inc. 4.375% 2050 | 3,455 | 4,524 | ||||||
Assicurazioni Generali SpA 10.125% 2042 (3-month EUR-EURIBOR + 9.181% on 7/10/2022)1 | € | 3,800 | 5,376 | |||||
Banco Do Brasil, SA 4.75% 20242 | $ | 10,000 | 10,775 | |||||
Bank of America Corp. 3.419% 2028 (3-month USD-LIBOR + 1.04% on 12/20/2027)1 | 16,676 | 18,867 | ||||||
Bank of America Corp. 1.898% 2031 (USD-SOFR + 1.53% on 7/23/2030)1 | 2,515 | 2,542 | ||||||
Bank of America Corp. 1.922% 2031 (USD-SOFR + 1.37% on 10/24/2030)1 | 21,177 | 21,463 | ||||||
Berkshire Hathaway Finance Corp. 4.20% 2048 | 8,720 | 11,520 | ||||||
BNP Paribas 3.80% 20242 | 18,775 | 20,490 | ||||||
BNP Paribas 2.819% 2025 (3-month USD-LIBOR + 1.111% on 11/19/2024)1,2 | 2,875 | 3,073 | ||||||
BNP Paribas 3.375% 20252 | 6,425 | 7,049 | ||||||
BNP Paribas 2.219% 2026 (USD-SOFR + 2.074% on 6/9/2025)1,2 | 12,000 | 12,565 | ||||||
CIT Group Inc. 3.929% 2024 (USD-SOFR + 3.827% on 6/19/2023)1 | 5,410 | 5,728 | ||||||
CIT Group Inc. 4.75% 2024 | 2,066 | 2,263 | ||||||
Citigroup Inc. 4.60% 2026 | 1,800 | 2,111 | ||||||
Citigroup Inc. 3.668% 2028 (3-month USD-LIBOR + 1.39% on 7/24/2027)1 | 1,000 | 1,134 | ||||||
Citigroup Inc. 2.976% 2030 (USD-SOFR + 1.422% on 11/5/2029)1 | 3,001 | 3,306 | ||||||
Citigroup Inc. 2.572% 2031 (USD-SOFR + 2.107% on 6/3/2030)1 | 18,102 | 19,300 | ||||||
Citigroup Inc. 4.412% 2031 (USD-SOFR + 3.914% on 3/31/2030)1 | 18,470 | 22,399 | ||||||
Crédit Agricole SA 1.907% 2026 (USD-SOFR + 1.676% on 6/16/2025)1,2 | 4,450 | 4,620 | ||||||
Credit Suisse Group AG 2.997% 2023 (3-month USD-LIBOR + 1.20% on 12/14/2022)1,2 | 12,000 | 12,555 | ||||||
Credit Suisse Group AG 3.80% 2023 | 12,925 | 13,927 | ||||||
Credit Suisse Group AG 4.207% 2024 (3-month USD-LIBOR + 1.24% on 6/12/2023)1,2 | 500 | 542 | ||||||
Credit Suisse Group AG 2.593% 2025 (USD-SOFR + 1.56% on 9/11/2024)1,2 | 850 | 895 | ||||||
Credit Suisse Group AG 2.193% 2026 (USD-SOFR + 2.044% on 6/5/2025)1,2 | 5,750 | 6,014 | ||||||
Credit Suisse Group AG 4.194% 2031 (USD-SOFR + 3.73% on 4/1/2030)1,2 | 3,096 | 3,644 | ||||||
Deutsche Bank AG 3.15% 2021 | 28,037 | 28,068 | ||||||
Deutsche Bank AG 3.375% 2021 | 1,300 | 1,313 | ||||||
Deutsche Bank AG 4.25% 2021 | 27,043 | 27,116 | ||||||
Deutsche Bank AG 4.25% 2021 | 525 | 538 | ||||||
Deutsche Bank AG 3.30% 2022 | 2,695 | 2,812 | ||||||
Deutsche Bank AG 5.00% 2022 | 2,675 | 2,798 | ||||||
Deutsche Bank AG 3.95% 2023 | 6,350 | 6,751 | ||||||
Deutsche Bank AG 2.222% 2024 (USD-SOFR + 2.159% on 9/18/2023)1 | 10,475 | 10,782 | ||||||
Deutsche Bank AG 3.70% 2024 | 4,950 | 5,330 | ||||||
Deutsche Bank AG 3.70% 2024 | 2,750 | 2,967 | ||||||
Deutsche Bank AG 3.961% 2025 (USD-SOFR + 2.581% on 11/26/2024)1 | 8,835 | 9,662 | ||||||
Deutsche Bank AG 2.129% 2026 (USD-SOFR + 1.87% on 11/24/2025)1 | 42,015 | 42,990 | ||||||
Deutsche Bank AG 4.10% 2026 | 7,305 | 8,154 | ||||||
Deutsche Bank AG 4.10% 2026 | 857 | 950 | ||||||
Deutsche Bank AG 3.547% 2031 (USD-SOFR + 3.043% on 9/18/2030)1 | 2,900 | 3,151 | ||||||
GE Capital Funding, LLC 4.05% 20272 | 5,346 | 6,119 | ||||||
GE Capital Funding, LLC 4.40% 20302 | 10,000 | 11,791 | ||||||
Goldman Sachs Group, Inc. 5.75% 2022 | 4,800 | 5,074 | ||||||
Goldman Sachs Group, Inc. 3.814% 2029 (3-month USD-LIBOR + 1.158% on 4/23/2028)1 | 9,600 | 11,126 | ||||||
Goldman Sachs Group, Inc., junior subordinated, 5.30% (3-month USD-LIBOR + 3.834% on 11/10/2026)1 | 1,750 | 1,916 | ||||||
Groupe BPCE SA 2.75% 20232 | 6,875 | 7,192 | ||||||
Groupe BPCE SA 5.70% 20232 | 28,166 | 31,898 | ||||||
Groupe BPCE SA 5.15% 20242 | 5,481 | 6,247 | ||||||
Groupe BPCE SA 1.652% 2026 (USD-SOFR + 1.52% on 10/6/2025)1,2 | 6,350 | 6,504 | ||||||
160 American Funds Insurance Series
Table of Contents
Bond Fund (continued)
Bonds, notes & other debt instruments (continued)
| Principal amount (000) | Value (000) | |||||||
Corporate bonds, notes & loans (continued) | ||||||||
Financials (continued) | ||||||||
HSBC Holdings PLC 4.583% 2029 (3-month USD-LIBOR + 1.535% on 6/19/2028)1 | $ | 12,000 | $ | 14,200 | ||||
Intesa Sanpaolo SpA 3.375% 20232 | 10,035 | 10,514 | ||||||
Intesa Sanpaolo SpA 3.25% 20242 | 770 | 823 | ||||||
Intesa Sanpaolo SpA 5.017% 20242 | 68,143 | 74,578 | ||||||
Intesa Sanpaolo SpA 5.71% 20262 | 15,400 | 17,634 | ||||||
Intesa Sanpaolo SpA 3.875% 20272 | 6,250 | 6,866 | ||||||
Intesa Sanpaolo SpA 3.875% 20282 | 1,986 | 2,194 | ||||||
JPMorgan Chase & Co. 2.182% 2028 (USD-SOFR + 1.89% on 6/1/2027)1 | 4,750 | 5,046 | ||||||
JPMorgan Chase & Co. 3.509% 2029 (3-month USD-LIBOR + 0.945% on 1/23/2028)1 | 9,600 | 10,958 | ||||||
JPMorgan Chase & Co. 4.203% 2029 (3-month USD-LIBOR + 1.26% on 7/23/2028)1 | 11,980 | 14,331 | ||||||
JPMorgan Chase & Co. 2.522% 2031 (USD-SOFR + 2.04% on 4/22/2030)1 | 1,766 | 1,900 | ||||||
Lloyds Banking Group PLC 2.438% 2026 (UST Yield Curve Rate T Note Constant Maturity 1-year + 1.00% on 2/5/2025)1 | 2,675 | 2,827 | ||||||
Lloyds Banking Group PLC 4.375% 2028 | 8,825 | 10,505 | ||||||
MetLife Capital Trust IV, junior subordinated, 7.875% 2067 (3-month USD-LIBOR + 3.96% on 12/1/2037)1,2 | 1,405 | 1,985 | ||||||
MetLife, Inc. 3.60% 2025 | 3,490 | 3,954 | ||||||
Mizuho Financial Group, Inc. 0.849% 2024 (3-month USD-LIBOR + 0.61% on 9/8/2023)1 | 6,000 | 6,036 | ||||||
Morgan Stanley 2.50% 2021 | 19,200 | 19,320 | ||||||
Morgan Stanley 2.72% 2025 (USD-SOFR + 1.152% on 7/22/2024)1 | 2,300 | 2,461 | ||||||
New York Life Insurance Company 3.75% 20502 | 5,749 | 6,884 | ||||||
PNC Financial Services Group, Inc. 2.854% 20221 | 5,850 | 6,127 | ||||||
PNC Funding Corp. 3.30% 2022 | 8,700 | 8,989 | ||||||
Rede D’Or Finance SARL 4.50% 20302 | 3,000 | 3,133 | ||||||
Santander Holdings USA, Inc. 3.50% 2024 | 8,325 | 8,997 | ||||||
Synchrony Financial 2.85% 2022 | 5,400 | 5,578 | ||||||
Synchrony Financial 4.375% 2024 | 3,640 | 4,009 | ||||||
Travelers Companies, Inc. 2.55% 2050 | 768 | 809 | ||||||
UBS Group AG 1.364% 2027 (UST Yield Curve Rate T Note Constant Maturity 5-year + 1.08% on | 1,675 | 1,695 | ||||||
UniCredit SpA 3.75% 20222 | 2,545 | 2,638 | ||||||
UniCredit SpA 6.572% 20222 | 11,295 | 11,904 | ||||||
UniCredit SpA 4.625% 20272 | 1,395 | 1,588 | ||||||
UniCredit SpA 5.861% 2032 (5-year USD-ICE Swap + 3.703% on 6/19/2027)1,2 | 16,130 | 18,192 | ||||||
UniCredit SpA 7.296% 2034 (5-year USD-ICE Swap + 4.914% on 4/2/2029)1,2 | 10,221 | 12,362 | ||||||
UniCredit SpA 5.459% 2035 (5-year USD-ICE Swap + 4.75% on 6/30/2030)1,2 | 606 | 668 | ||||||
Wells Fargo & Company 2.10% 2021 | 16,800 | 16,971 | ||||||
Wells Fargo & Company 2.406% 2025 (3-month USD-LIBOR + 0.825% on 10/30/2024)1 | 20,480 | 21,659 | ||||||
Wells Fargo & Company 2.188% 2026 (USD-SOFR + 2.00% on 4/30/2025)1 | 10,408 | 10,968 | ||||||
Wells Fargo & Company 2.572% 2031 (3-month USD-LIBOR + 1.00% on 2/11/2030)1 | 14,200 | 15,038 | ||||||
|
| |||||||
| 883,546 | ||||||||
|
| |||||||
Energy 5.65% | ||||||||
Apache Corp. 4.625% 2025 | 645 | 678 | ||||||
Apache Corp. 4.875% 2027 | 5,475 | 5,812 | ||||||
Apache Corp. 4.25% 2030 | 2,465 | 2,593 | ||||||
Apache Corp. 4.75% 2043 | 12,100 | 12,569 | ||||||
Apache Corp. 4.25% 2044 | 2,100 | 2,077 | ||||||
Apache Corp. 5.35% 2049 | 800 | 823 | ||||||
Baker Hughes, a GE Co. 4.486% 2030 | 914 | 1,099 | ||||||
Boardwalk Pipeline Partners, LP 3.375% 2023 | 1,900 | 1,984 | ||||||
BP Capital Markets America Inc. 2.772% 2050 | 6,417 | 6,349 | ||||||
BP Capital Markets PLC 3.00% 2050 | 8,284 | 8,490 | ||||||
Canadian Natural Resources Ltd. 2.05% 2025 | 3,849 | 4,041 | ||||||
Canadian Natural Resources Ltd. 3.85% 2027 | 1,151 | 1,293 | ||||||
Canadian Natural Resources Ltd. 2.95% 2030 | 2,374 | 2,542 | ||||||
Cenovus Energy Inc. 3.80% 2023 | 1,120 | 1,164 | ||||||
Cenovus Energy Inc. 4.25% 2027 | 12,685 | 13,858 | ||||||
Cenovus Energy Inc. 5.25% 2037 | 770 | 872 | ||||||
Cenovus Energy Inc. 5.40% 2047 | 15,180 | 17,821 | ||||||
American Funds Insurance Series 161
Table of Contents
Bond Fund (continued)
Bonds, notes & other debt instruments (continued)
Principal amount (000) | Value (000) | |||||||
Corporate bonds, notes & loans (continued) | ||||||||
Energy (continued) | ||||||||
Cheniere Energy, Inc. 7.00% 2024 | $ | 410 | $ | 479 | ||||
Cheniere Energy, Inc. 5.125% 2027 | 16,000 | 18,946 | ||||||
Cheniere Energy, Inc. 3.70% 2029 | 7,369 | 8,215 | ||||||
Chevron Corp. 2.355% 2022 | 4,800 | 4,973 | ||||||
Chevron Corp. 3.078% 2050 | 1,114 | 1,239 | ||||||
Chevron USA Inc. 2.343% 2050 | 1,365 | 1,330 | ||||||
Columbia Pipeline Partners LP 5.80% 2045 | 1,410 | 1,929 | ||||||
Concho Resources Inc. 4.30% 2028 | 6,095 | 7,207 | ||||||
Concho Resources Inc. 4.85% 2048 | 5,000 | 6,735 | ||||||
DCP Midstream Operating LP 4.95% 2022 | 500 | 517 | ||||||
Enbridge Energy Partners, LP 4.20% 2021 | 6,325 | 6,432 | ||||||
Enbridge Energy Partners, LP 5.875% 2025 | 7,700 | 9,420 | ||||||
Enbridge Energy Partners, LP 7.375% 2045 | 18,154 | 27,723 | ||||||
Enbridge Inc. 4.00% 2023 | 1,500 | 1,633 | ||||||
Energy Transfer Operating, LP 5.875% 2024 | 294 | 331 | ||||||
Energy Transfer Operating, LP 2.90% 2025 | 4,402 | 4,661 | ||||||
Energy Transfer Operating, LP 3.75% 2030 | 7,707 | 8,319 | ||||||
Energy Transfer Operating, LP 5.00% 2050 | 15,408 | 16,699 | ||||||
Energy Transfer Partners, LP 4.20% 2023 | 2,860 | 3,085 | ||||||
Energy Transfer Partners, LP 4.50% 2024 | 4,915 | 5,380 | ||||||
Energy Transfer Partners, LP 4.75% 2026 | 1,506 | 1,705 | ||||||
Energy Transfer Partners, LP 4.20% 2027 | 45 | 50 | ||||||
Energy Transfer Partners, LP 4.95% 2028 | 4,559 | 5,256 | ||||||
Energy Transfer Partners, LP 5.25% 2029 | 1,275 | 1,489 | ||||||
Energy Transfer Partners, LP 6.125% 2045 | 11,780 | 13,993 | ||||||
Energy Transfer Partners, LP 5.30% 2047 | 10,459 | 11,681 | ||||||
Energy Transfer Partners, LP 6.00% 2048 | 1,868 | 2,223 | ||||||
Energy Transfer Partners, LP 6.25% 2049 | 1,775 | 2,147 | ||||||
Energy Transfer Partners, LP, junior subordinated, 6.25% (3-month USD-LIBOR + 4.028% on 2/15/2023)1 | 7,850 | 6,260 | ||||||
Energy Transfer Partners, LP, junior subordinated, 6.625% (3-month USD-LIBOR + 4.155% on | 500 | 425 | ||||||
Enterprise Products Operating LLC 3.20% 2052 | 3,031 | 3,091 | ||||||
EOG Resources, Inc. 4.375% 2030 | 451 | 549 | ||||||
EOG Resources, Inc. 4.95% 2050 | 1,776 | 2,409 | ||||||
EQT Corp. 3.00% 2022 | 6,700 | 6,763 | ||||||
EQT Corp. 8.75% 2030 | 7,500 | 9,178 | ||||||
Equinor ASA 3.625% 2028 | 4,928 | 5,744 | ||||||
Equinor ASA 3.125% 2030 | 20,000 | 22,706 | ||||||
Equinor ASA 3.25% 2049 | 5,687 | 6,320 | ||||||
Exxon Mobil Corp. 3.043% 2026 | 4,625 | 5,127 | ||||||
Exxon Mobil Corp. 2.61% 2030 | 1,293 | 1,413 | ||||||
Exxon Mobil Corp. 3.452% 2051 | 4,701 | 5,373 | ||||||
Kinder Morgan Energy Partners, LP 6.50% 2037 | 900 | 1,167 | ||||||
Kinder Morgan Energy Partners, LP 5.50% 2044 | 700 | 881 | ||||||
Kinder Morgan, Inc. 5.30% 2034 | 760 | 937 | ||||||
MPLX LP 1.75% 2026 | 5,557 | 5,754 | ||||||
MPLX LP 4.00% 2028 | 4,665 | 5,368 | ||||||
MPLX LP 2.65% 2030 | 2,404 | 2,522 | ||||||
MPLX LP 5.50% 2049 | 4,741 | 6,243 | ||||||
Noble Energy, Inc. 3.25% 2029 | 744 | 855 | ||||||
Noble Energy, Inc. 5.05% 2044 | 2,407 | 3,386 | ||||||
Noble Energy, Inc. 4.95% 2047 | 4,845 | 6,889 | ||||||
Noble Energy, Inc. 4.20% 2049 | 10,334 | 13,419 | ||||||
Occidental Petroleum Corp. 2.90% 2024 | 4,336 | 4,180 | ||||||
Odebrecht Drilling Norbe 7.35% 20262,3 | 37 | 10 | ||||||
Odebrecht Drilling Norbe 0% 20492 | 1,150 | 7 | ||||||
ONEOK, Inc. 2.20% 2025 | 193 | 201 | ||||||
ONEOK, Inc. 5.85% 2026 | 896 | 1,074 | ||||||
ONEOK, Inc. 3.10% 2030 | 540 | 576 | ||||||
ONEOK, Inc. 6.35% 2031 | 2,794 | 3,587 | ||||||
162 American Funds Insurance Series
Table of Contents
Bond Fund (continued)
Bonds, notes & other debt instruments (continued)
Principal amount (000) | Value (000) | |||||||
Corporate bonds, notes & loans (continued) | ||||||||
Energy (continued) | ||||||||
ONEOK, Inc. 5.20% 2048 | $ | 9,563 | $ | 11,162 | ||||
ONEOK, Inc. 4.50% 2050 | 1,266 | 1,331 | ||||||
ONEOK, Inc. 7.15% 2051 | 3,275 | 4,538 | ||||||
Petrobras Global Finance Co. 5.093% 2030 | 5,000 | 5,594 | ||||||
Petrobras Global Finance Co. 6.90% 2049 | 4,000 | 5,080 | ||||||
Petróleos Mexicanos 6.875% 2026 | 43,810 | 47,928 | ||||||
Petróleos Mexicanos 6.50% 2027 | 29,533 | 31,156 | ||||||
Pioneer Natural Resources Company 1.90% 2030 | 5,726 | 5,676 | ||||||
Plains All American Pipeline, LP 3.80% 2030 | 590 | 635 | ||||||
QEP Resources, Inc. 5.25% 2023 | 3,420 | 3,605 | ||||||
Sabine Pass Liquefaction, LLC 6.25% 2022 | 2,300 | 2,421 | ||||||
Sabine Pass Liquefaction, LLC 5.625% 20231 | 1,000 | 1,099 | ||||||
Sabine Pass Liquefaction, LLC 5.75% 2024 | 8,000 | 9,149 | ||||||
Sabine Pass Liquefaction, LLC 5.625% 2025 | 10,000 | 11,667 | ||||||
Sabine Pass Liquefaction, LLC 5.875% 2026 | 15,700 | 18,991 | ||||||
Sabine Pass Liquefaction, LLC 4.50% 20302 | 1,797 | 2,131 | ||||||
Saudi Arabian Oil Co. 2.875% 20242 | 4,885 | 5,189 | ||||||
Saudi Arabian Oil Co. 1.625% 20252 | 1,410 | 1,446 | ||||||
Schlumberger BV 4.00% 20252 | 7,915 | 9,004 | ||||||
Shell International Finance BV 3.875% 2028 | 9,410 | 11,149 | ||||||
Southwestern Energy Co. 6.45% 20251 | 920 | 956 | ||||||
Sunoco Logistics Operating Partners, LP 5.40% 2047 | 6,190 | 6,982 | ||||||
Targa Resources Partners LP 5.125% 2025 | 175 | 180 | ||||||
Targa Resources Partners LP 5.375% 2027 | 175 | 184 | ||||||
TC PipeLines, LP 4.375% 2025 | 405 | 457 | ||||||
Total Capital Canada Ltd. 2.75% 2023 | 2,140 | 2,273 | ||||||
Total Capital International 3.127% 2050 | 6,910 | 7,496 | ||||||
Total SE 2.986% 2041 | 1,726 | 1,889 | ||||||
Total SE 3.386% 2060 | 5,200 | 5,916 | ||||||
TransCanada PipeLines Ltd. 4.25% 2028 | 11,275 | 13,320 | ||||||
TransCanada PipeLines Ltd. 4.10% 2030 | 4,776 | 5,646 | ||||||
Transcontinental Gas Pipe Line Company, LLC 3.95% 2050 | 1,372 | 1,556 | ||||||
Western Midstream Operating, LP 4.10% 20251 | 2,782 | 2,871 | ||||||
Western Midstream Operating, LP 4.05% 2030 | 2,202 | 2,453 | ||||||
Western Midstream Operating, LP 5.25% 2050 | 3,079 | 3,392 | ||||||
Williams Partners LP 4.50% 2023 | 500 | 552 | ||||||
Williams Partners LP 4.30% 2024 | 595 | 657 | ||||||
WPX Energy, Inc. 4.50% 2030 | 7,995 | 8,487 | ||||||
|
| |||||||
| 644,494 | ||||||||
|
| |||||||
Utilities 4.13% | ||||||||
Abu Dhabi National Energy Co. PJSC (TAQA) 4.375% 20252 | 10,500 | 11,896 | ||||||
Abu Dhabi National Energy Co. PJSC (TAQA) 4.375% 20262 | 300 | 348 | ||||||
AEP Transmission Co. LLC 3.65% 2050 | 350 | 426 | ||||||
Alliant Energy Finance LLC 4.25% 20282 | 500 | 581 | ||||||
Ameren Corp. 3.50% 2031 | 325 | 374 | ||||||
Ameren Corp. 4.50% 2049 | 2,875 | 3,914 | ||||||
American Electric Power Company, Inc. 2.30% 2030 | 1,825 | 1,909 | ||||||
Berkshire Hathaway Energy Company 4.50% 2045 | 5,895 | 7,475 | ||||||
Consolidated Edison Co. of New York, Inc. 3.875% 2047 | 9,200 | 10,892 | ||||||
Consumers Energy Co. 4.05% 2048 | 8,270 | 10,839 | ||||||
Consumers Energy Co. 3.75% 2050 | 5,625 | 7,074 | ||||||
Duke Energy Corp. 3.75% 2024 | 3,826 | 4,214 | ||||||
Duke Energy Florida, LLC 3.40% 2046 | 6,445 | 7,372 | ||||||
Duke Energy Progress, LLC 3.70% 2028 | 3,750 | 4,393 | ||||||
Edison International 3.125% 2022 | 2,900 | 3,013 | ||||||
Edison International 3.55% 2024 | 6,850 | 7,382 | ||||||
Edison International 4.95% 2025 | 175 | 200 | ||||||
Edison International 5.75% 2027 | 3,181 | 3,810 | ||||||
Edison International 4.125% 2028 | 3,644 | 4,064 | ||||||
American Funds Insurance Series 163
Table of Contents
Bond Fund (continued)
Bonds, notes & other debt instruments (continued)
Principal amount (000) | Value | |||||||
Corporate bonds, notes & loans (continued) | ||||||||
Utilities (continued) | ||||||||
Emera Inc. 6.75% 2076 (3-month USD-LIBOR + 5.44% on 6/15/2026)1 | $ | 1,950 | $ | 2,282 | ||||
Enel Società per Azioni 8.75% 2073 (USD Semi Annual 30/360 (vs. 3-month USD-LIBOR) + 5.88% on 9/24/2023)1,2 | 1,000 | 1,170 | ||||||
Entergy Louisiana, LLC 4.20% 2048 | 6,325 | 8,245 | ||||||
Eversource Energy 2.75% 2022 | 527 | 541 | ||||||
Eversource Energy 3.80% 2023 | 5,000 | 5,478 | ||||||
Exelon Corp. 3.40% 2026 | 1,570 | 1,769 | ||||||
Exelon Corp. 4.05% 2030 | 1,250 | 1,481 | ||||||
Exelon Corp. 4.70% 2050 | 250 | 333 | ||||||
FirstEnergy Corp. 2.85% 2022 (3.10% on 1/15/2021)1 | 8,750 | 8,897 | ||||||
FirstEnergy Corp. 1.60% 2026 | 481 | 471 | ||||||
FirstEnergy Corp. 3.90% 2027 (4.40% on 1/16/2021)1 | 12,178 | 13,434 | ||||||
FirstEnergy Corp. 3.50% 20282 | 2,400 | 2,555 | ||||||
FirstEnergy Corp. 2.25% 2030 | 1,184 | 1,146 | ||||||
FirstEnergy Corp. 2.65% 2030 | 3,428 | 3,442 | ||||||
FirstEnergy Corp. 7.375% 2031 | 5,150 | 7,349 | ||||||
FirstEnergy Corp., Series B, 4.25% 2023 (4.75% on 3/15/2021)1 | 2,750 | 2,905 | ||||||
Georgia Power Co. 3.70% 2050 | 1,938 | 2,337 | ||||||
IPALCO Enterprises, Inc. 3.70% 2024 | 200 | 218 | ||||||
Mississippi Power Co. 4.25% 2042 | 11,247 | 13,614 | ||||||
NextEra Energy Capital Holdings, Inc. 2.25% 2030 | 2,700 | 2,833 | ||||||
Niagara Mohawk Power Corp. 3.508% 20242 | 7,575 | 8,325 | ||||||
Niagara Mohawk Power Corp. 4.278% 20342 | 1,000 | 1,248 | ||||||
Pacific Gas and Electric Co. 1.75% 2022 | 13,000 | 13,038 | ||||||
Pacific Gas and Electric Co. 3.25% 2023 | 5,615 | 5,862 | ||||||
Pacific Gas and Electric Co. 3.40% 2024 | 850 | 906 | ||||||
Pacific Gas and Electric Co. 2.95% 2026 | 9,436 | 9,988 | ||||||
Pacific Gas and Electric Co. 3.15% 2026 | 8,705 | 9,283 | ||||||
Pacific Gas and Electric Co. 2.10% 2027 | 456 | 463 | ||||||
Pacific Gas and Electric Co. 3.30% 2027 | 9,125 | 9,754 | ||||||
Pacific Gas and Electric Co. 3.30% 2027 | 4,675 | 5,009 | ||||||
Pacific Gas and Electric Co. 3.75% 2028 | 6,788 | 7,421 | ||||||
Pacific Gas and Electric Co. 4.65% 2028 | 7,900 | 9,030 | ||||||
Pacific Gas and Electric Co. 4.55% 2030 | 14,505 | 16,539 | ||||||
Pacific Gas and Electric Co. 2.50% 2031 | 19,695 | 19,745 | ||||||
Pacific Gas and Electric Co. 3.30% 2040 | 8,898 | 8,891 | ||||||
Pacific Gas and Electric Co. 3.75% 2042 | 7,825 | 7,885 | ||||||
Pacific Gas and Electric Co. 4.75% 2044 | 336 | 378 | ||||||
Pacific Gas and Electric Co. 3.95% 2047 | 2,835 | 2,941 | ||||||
Pacific Gas and Electric Co. 3.50% 2050 | 6,567 | 6,542 | ||||||
Progress Energy, Inc. 7.75% 2031 | 1,820 | 2,713 | ||||||
Public Service Electric and Gas Co. 3.20% 2029 | 6,000 | 6,849 | ||||||
Puget Energy, Inc. 6.00% 2021 | 3,135 | 3,245 | ||||||
Puget Energy, Inc. 5.625% 2022 | 8,004 | 8,477 | ||||||
Puget Energy, Inc. 3.65% 2025 | 3,000 | 3,312 | ||||||
San Diego Gas & Electric Co. 3.32% 2050 | 1,350 | 1,539 | ||||||
Southern California Edison Co. 3.70% 2025 | 1,275 | 1,431 | ||||||
Southern California Edison Co. 2.85% 2029 | 7,500 | 8,186 | ||||||
Southern California Edison Co. 4.20% 2029 | 11,700 | 13,853 | ||||||
Southern California Edison Co. 5.35% 2035 | 6,450 | 8,762 | ||||||
Southern California Edison Co. 5.75% 2035 | 4,550 | 6,291 | ||||||
Southern California Edison Co. 5.625% 2036 | 7,050 | 9,007 | ||||||
Southern California Edison Co. 5.55% 2037 | 2,775 | 3,553 | ||||||
Southern California Edison Co. 5.95% 2038 | 5,654 | 7,691 | ||||||
Southern California Edison Co. 4.50% 2040 | 8,620 | 10,400 | ||||||
Southern California Edison Co. 5.50% 2040 | 607 | 811 | ||||||
Southern California Edison Co. 4.00% 2047 | 9,061 | 10,644 | ||||||
Southern California Edison Co. 4.125% 2048 | 9,027 | 10,788 | ||||||
Southern California Edison Co. 4.875% 2049 | 5,034 | 6,649 | ||||||
Southern California Edison Co. 3.65% 2050 | 3,461 | 3,935 | ||||||
Southern California Edison Co., Series C, 3.60% 2045 | 2,717 | 3,015 | ||||||
164 American Funds Insurance Series
Table of Contents
Bond Fund (continued)
Bonds, notes & other debt instruments (continued)
Principal amount (000) | Value (000) | |||||||
Corporate bonds, notes & loans (continued) | ||||||||
Utilities (continued) | ||||||||
Southern California Gas Company 2.55% 2030 | $ | 625 | $ | 678 | ||||
Southern Co. 3.70% 2030 | 5,450 | 6,318 | ||||||
Southern Co. 4.25% 2036 | 1,725 | 2,118 | ||||||
Southern Co. 4.40% 2046 | 787 | 991 | ||||||
Tampa Electric Co. 2.60% 2022 | 4,350 | 4,486 | ||||||
Wisconsin Power and Light Co. 3.65% 2050 | 1,550 | 1,842 | ||||||
Xcel Energy Inc. 3.30% 2025 | 5,650 | 6,215 | ||||||
Xcel Energy Inc. 2.60% 2029 | 2,925 | 3,169 | ||||||
|
| |||||||
| 470,892 | ||||||||
|
| |||||||
Health care 3.88% | ||||||||
Abbott Laboratories 3.40% 2023 | 910 | 987 | ||||||
Abbott Laboratories 3.75% 2026 | 2,244 | 2,630 | ||||||
Abbott Laboratories 4.75% 2036 | 4,565 | 6,291 | ||||||
AbbVie Inc. 3.20% 2022 | 9,600 | 10,054 | ||||||
AbbVie Inc. 3.20% 2029 | 23,754 | 26,648 | ||||||
Amgen Inc. 2.45% 2030 | 10,000 | 10,720 | ||||||
Anthem, Inc. 2.375% 2025 | 1,534 | 1,641 | ||||||
AstraZeneca PLC 4.00% 2029 | 5,920 | 7,056 | ||||||
Bayer US Finance II LLC 3.875% 20232 | 8,783 | 9,576 | ||||||
Bayer US Finance II LLC 4.25% 20252 | 17,570 | 20,106 | ||||||
Becton, Dickinson and Company 3.734% 2024 | 903 | 1,001 | ||||||
Becton, Dickinson and Company 4.669% 2047 | 3,395 | 4,458 | ||||||
Boston Scientific Corp. 3.375% 2022 | 350 | 365 | ||||||
Boston Scientific Corp. 3.85% 2025 | 255 | 288 | ||||||
Centene Corp. 4.75% 2025 | 325 | 334 | ||||||
Centene Corp. 4.25% 2027 | 14,860 | 15,786 | ||||||
Centene Corp. 4.625% 2029 | 14,945 | 16,611 | ||||||
Centene Corp. 3.375% 2030 | 15,718 | 16,561 | ||||||
Cigna Corp. 4.375% 2028 | 7,090 | 8,571 | ||||||
EMD Finance LLC 2.95% 20222 | 2,100 | 2,157 | ||||||
Gilead Sciences, Inc. 1.20% 2027 | 3,828 | 3,859 | ||||||
GlaxoSmithKline PLC 3.375% 2023 | 16,800 | 18,030 | ||||||
Laboratory Corp. of America Holdings 4.70% 2045 | 4,160 | 5,465 | ||||||
Novartis Capital Corp. 1.75% 2025 | 2,361 | 2,478 | ||||||
Novartis Capital Corp. 2.20% 2030 | 5,446 | 5,851 | ||||||
Shire PLC 3.20% 2026 | 15,100 | 16,901 | ||||||
Teva Pharmaceutical Finance Co. BV 2.20% 2021 | 4,911 | 4,908 | ||||||
Teva Pharmaceutical Finance Co. BV 2.80% 2023 | 16,420 | 16,286 | ||||||
Teva Pharmaceutical Finance Co. BV 7.125% 2025 | 45,000 | 49,828 | ||||||
Teva Pharmaceutical Finance Co. BV 3.15% 2026 | 68,853 | 66,315 | ||||||
Teva Pharmaceutical Finance Co. BV 6.75% 2028 | 26,824 | 30,394 | ||||||
Teva Pharmaceutical Finance Co. BV 4.10% 2046 | 46,666 | 41,649 | ||||||
UnitedHealth Group Inc. 3.35% 2022 | 4,385 | 4,597 | ||||||
UnitedHealth Group Inc. 3.75% 2025 | 5,410 | 6,166 | ||||||
Zimmer Holdings, Inc. 3.15% 2022 | 7,845 | 8,070 | ||||||
|
| |||||||
| 442,638 | ||||||||
|
| |||||||
Consumer discretionary 3.74% | ||||||||
Carnival Corp. 11.50% 20232 | 9,140 | 10,582 | ||||||
DaimlerChrysler North America Holding Corp. 1.75% 20232 | 8,000 | 8,216 | ||||||
DaimlerChrysler North America Holding Corp. 3.35% 20232 | 2,000 | 2,118 | ||||||
Ford Motor Credit Co. 4.375% 2023 | 16,400 | 17,056 | ||||||
Ford Motor Credit Co. 4.063% 2024 | 17,230 | 18,123 | ||||||
Ford Motor Credit Co. 3.815% 2027 | 3,630 | 3,737 | ||||||
Ford Motor Credit Co. 4.125% 2027 | 28,345 | 29,727 | ||||||
Ford Motor Credit Co. 4.271% 2027 | 17,442 | 18,314 | ||||||
Ford Motor Credit Co. 5.113% 2029 | 8,075 | 9,003 | ||||||
General Motors Company 5.40% 2023 | 421 | 472 | ||||||
General Motors Company 6.125% 2025 | 28,743 | 34,886 | ||||||
American Funds Insurance Series 165
Table of Contents
Bond Fund (continued)
Bonds, notes & other debt instruments (continued)
Principal amount (000) | Value (000) | |||||||
Corporate bonds, notes & loans (continued) | ||||||||
Consumer discretionary (continued) | ||||||||
General Motors Company 6.80% 2027 | $ | 1,030 | $ | 1,325 | ||||
General Motors Company 5.00% 2035 | 5,000 | 6,026 | ||||||
General Motors Company 6.75% 2046 | 1,093 | 1,579 | ||||||
General Motors Company 5.40% 2048 | 7,200 | 9,068 | ||||||
General Motors Company 5.95% 2049 | 334 | 452 | ||||||
General Motors Financial Co. 3.15% 2022 | 25 | 26 | ||||||
General Motors Financial Co. 3.45% 2022 | 200 | 205 | ||||||
General Motors Financial Co. 3.55% 2022 | 3,703 | 3,863 | ||||||
General Motors Financial Co. 3.25% 2023 | 964 | 1,011 | ||||||
General Motors Financial Co. 3.70% 2023 | 2,076 | 2,202 | ||||||
General Motors Financial Co. 5.20% 2023 | 4,371 | 4,795 | ||||||
General Motors Financial Co. 3.50% 2024 | 9,945 | 10,757 | ||||||
General Motors Financial Co. 3.95% 2024 | 6,269 | 6,830 | ||||||
General Motors Financial Co. 5.10% 2024 | 1,081 | 1,210 | ||||||
General Motors Financial Co. 2.75% 2025 | 3,819 | 4,086 | ||||||
General Motors Financial Co. 2.90% 2025 | 1,032 | 1,103 | ||||||
General Motors Financial Co. 4.00% 2025 | 587 | 647 | ||||||
General Motors Financial Co. 4.35% 2025 | 11,358 | 12,692 | ||||||
General Motors Financial Co. 5.25% 2026 | 995 | 1,174 | ||||||
General Motors Financial Co. 2.70% 2027 | 6,079 | 6,454 | ||||||
General Motors Financial Co. 3.60% 2030 | 465 | 519 | ||||||
Home Depot, Inc. 4.40% 2021 | 7,200 | 7,200 | ||||||
Home Depot, Inc. 2.95% 2029 | 6,081 | 6,914 | ||||||
Home Depot, Inc. 4.50% 2048 | 1,915 | 2,691 | ||||||
Hyundai Capital America 3.75% 20212 | 8,500 | 8,626 | ||||||
Hyundai Capital America 2.85% 20222 | 4,118 | 4,270 | ||||||
Hyundai Capital America 3.00% 20222 | 4,500 | 4,642 | ||||||
Hyundai Capital America 3.25% 20222 | 1,521 | 1,584 | ||||||
Hyundai Capital America 3.95% 20222 | 8,000 | 8,268 | ||||||
Hyundai Capital America 1.25% 20232 | 3,150 | 3,189 | ||||||
Hyundai Capital America 2.375% 20232 | 9,977 | 10,292 | ||||||
Hyundai Capital America 3.40% 20242 | 8,180 | 8,730 | ||||||
Hyundai Capital America 1.80% 20252 | 12,714 | 13,047 | ||||||
Hyundai Capital America 2.65% 20252 | 13,054 | 13,854 | ||||||
Hyundai Capital America 2.375% 20272 | 6,264 | 6,575 | ||||||
Hyundai Capital America 3.00% 20272 | 10,408 | 11,325 | ||||||
International Game Technology PLC 6.25% 20272 | 880 | 1,009 | ||||||
International Game Technology PLC 5.25% 20292 | 4,075 | 4,397 | ||||||
McDonald’s Corp. 2.125% 2030 | 2,482 | 2,620 | ||||||
McDonald’s Corp. 4.45% 2047 | 3,535 | 4,593 | ||||||
McDonald’s Corp. 3.625% 2049 | 2,938 | 3,454 | ||||||
MGM Resorts International 7.75% 2022 | 2,000 | 2,134 | ||||||
NIKE, Inc. 3.25% 2040 | 6,171 | 7,183 | ||||||
NIKE, Inc. 3.875% 2045 | 1,560 | 2,025 | ||||||
Nissan Motor Co., Ltd. 2.60% 20222 | 1,415 | 1,452 | ||||||
Sally Holdings LLC and Sally Capital Inc. 5.625% 2025 | 300 | 309 | ||||||
Starbucks Corp. 3.75% 2047 | 3,785 | 4,429 | ||||||
Starbucks Corp. 4.50% 2048 | 7,680 | 10,027 | ||||||
Toyota Motor Credit Corp. 3.375% 2030 | 6,664 | 7,802 | ||||||
Volkswagen Group of America Finance, LLC 4.00% 20212 | 4,510 | 4,649 | ||||||
Volkswagen Group of America Finance, LLC 2.70% 20222 | 2,473 | 2,565 | ||||||
Volkswagen Group of America Finance, LLC 3.125% 20232 | 2,459 | 2,598 | ||||||
Volkswagen Group of America Finance, LLC 4.25% 20232 | 15,000 | 16,512 | ||||||
Volkswagen Group of America Finance, LLC 2.85% 20242 | 2,996 | 3,202 | ||||||
Volkswagen Group of America Finance, LLC 3.35% 20252 | 2,636 | 2,900 | ||||||
Volkswagen Group of America Finance, LLC 4.625% 20252 | 1,177 | 1,373 | ||||||
Volkswagen Group of America Finance, LLC 1.625% 20272 | 1,645 | 1,660 | ||||||
|
| |||||||
| 426,358 | ||||||||
|
| |||||||
166 American Funds Insurance Series
Table of Contents
Bond Fund (continued)
Bonds, notes & other debt instruments (continued)
| Principal amount (000) | Value (000) | |||||||
Corporate bonds, notes & loans (continued) | ||||||||
Industrials 2.75% | ||||||||
Air Lease Corp. 2.875% 2026 | $ | 11,453 | $ | 12,127 | ||||
Airbus Group SE 2.70% 20232 | 2,120 | 2,227 | ||||||
Avolon Holdings Funding Ltd. 3.625% 20222 | 2,810 | 2,872 | ||||||
Avolon Holdings Funding Ltd. 3.95% 20242 | 12,514 | 13,225 | ||||||
Avolon Holdings Funding Ltd. 4.25% 20262 | 3,302 | 3,560 | ||||||
Avolon Holdings Funding Ltd. 3.25% 20272 | 8,000 | 8,181 | ||||||
BNSF Funding Trust I, junior subordinated, 6.613% 2055 (3-month USD-LIBOR + 2.35% on 1/15/2026)1 | 1,680 | 1,922 | ||||||
Boeing Company 4.508% 2023 | 7,801 | 8,435 | ||||||
Boeing Company 1.95% 2024 | 8,719 | 8,983 | ||||||
Boeing Company 2.80% 2024 | 500 | 525 | ||||||
Boeing Company 4.875% 2025 | 31,752 | 36,216 | ||||||
Boeing Company 2.75% 2026 | 15,262 | 16,056 | ||||||
Boeing Company 3.10% 2026 | 649 | 695 | ||||||
Boeing Company 2.70% 2027 | 12,728 | 13,241 | ||||||
Boeing Company 5.04% 2027 | 10,099 | 11,818 | ||||||
Boeing Company 3.25% 2028 | 5,379 | 5,770 | ||||||
Boeing Company 3.25% 2028 | 1,925 | 2,039 | ||||||
Boeing Company 3.45% 2028 | 1,400 | 1,504 | ||||||
Boeing Company 3.20% 2029 | 675 | 713 | ||||||
Boeing Company 5.15% 2030 | 13,626 | 16,514 | ||||||
Boeing Company 3.625% 2031 | 7,358 | 8,074 | ||||||
Boeing Company 3.90% 2049 | 1,411 | 1,497 | ||||||
Boeing Company 5.805% 2050 | 1,782 | 2,462 | ||||||
Bohai Financial Investment Holding Co., Ltd. 5.25% 20222 | 2,485 | 2,609 | ||||||
Carrier Global Corp. 2.722% 2030 | 855 | 914 | ||||||
Carrier Global Corp. 3.377% 2040 | 15,000 | 16,400 | ||||||
Continental Airlines, Inc., Series 2001-1, Class A1, 6.703% 2022 | 38 | 38 | ||||||
Continental Airlines, Inc., Series 2000-2, Class A1, 7.707% 2022 | 164 | 163 | ||||||
GE Capital International Funding Co. 4.418% 2035 | 20,075 | 23,965 | ||||||
General Electric Capital Corp. 3.373% 2025 | 4,615 | 5,139 | ||||||
General Electric Capital Corp. 6.15% 2037 | 1,425 | 1,967 | ||||||
General Electric Co. 3.45% 2027 | 1,250 | 1,412 | ||||||
General Electric Co. 3.625% 2030 | 675 | 772 | ||||||
General Electric Co. 4.25% 2040 | 5,500 | 6,502 | ||||||
General Electric Co. 4.35% 2050 | 6,575 | 7,997 | ||||||
Mexico City Airport Trust 5.50% 2046 | 1,959 | 2,090 | ||||||
Mexico City Airport Trust 5.50% 2047 | 5,909 | 6,238 | ||||||
Mexico City Airport Trust 5.50% 20472 | 1,132 | 1,195 | ||||||
Northrop Grumman Corp. 3.25% 2028 | 10,845 | 12,266 | ||||||
Union Pacific Corp. 2.15% 2027 | 2,213 | 2,354 | ||||||
Union Pacific Corp. 2.40% 2030 | 4,454 | 4,802 | ||||||
Union Pacific Corp. 3.25% 2050 | 7,000 | 7,980 | ||||||
United Rentals, Inc. 5.50% 2027 | 5,000 | 5,366 | ||||||
United Technologies Corp. 3.125% 2027 | 9,525 | 10,695 | ||||||
Vinci SA 3.75% 20292 | 12,456 | 14,620 | ||||||
|
| |||||||
| 314,140 | ||||||||
|
| |||||||
Consumer staples 2.24% | ||||||||
Altria Group, Inc. 2.85% 2022 | 4,800 | 4,986 | ||||||
Altria Group, Inc. 4.40% 2026 | 8,840 | 10,266 | ||||||
Altria Group, Inc. 4.50% 2043 | 1,585 | 1,820 | ||||||
Altria Group, Inc. 5.95% 2049 | 9,039 | 12,664 | ||||||
Anheuser-Busch InBev NV 4.75% 2029 | 7,500 | 9,255 | ||||||
Anheuser-Busch InBev NV 5.55% 2049 | 11,149 | 15,850 | ||||||
Anheuser-Busch InBev NV 4.50% 2050 | 5,000 | 6,302 | ||||||
British American Tobacco International Finance PLC 3.95% 20252 | 16,879 | 18,997 | ||||||
British American Tobacco International Finance PLC 1.668% 2026 | 4,070 | 4,168 | ||||||
British American Tobacco PLC 3.557% 2027 | 10,991 | 12,241 | ||||||
British American Tobacco PLC 2.259% 2028 | 4,348 | 4,517 | ||||||
American Funds Insurance Series 167
Table of Contents
Bond Fund (continued)
Bonds, notes & other debt instruments (continued)
| Principal amount (000) | Value (000) | |||||||
Corporate bonds, notes & loans (continued) | ||||||||
Consumer staples (continued) | ||||||||
British American Tobacco PLC 4.39% 2037 | $ | 1,500 | $ | 1,679 | ||||
British American Tobacco PLC 4.54% 2047 | 12,786 | 14,199 | ||||||
British American Tobacco PLC 4.758% 2049 | 23,659 | 27,475 | ||||||
Conagra Brands, Inc. 5.30% 2038 | 436 | 584 | ||||||
Conagra Brands, Inc. 5.40% 2048 | 57 | 81 | ||||||
Constellation Brands, Inc. 3.50% 2027 | 7,500 | 8,470 | ||||||
General Mills, Inc. (3-month USD-LIBOR + 0.54%) 0.770% 20214 | 10,620 | 10,636 | ||||||
General Mills, Inc. 3.20% 2021 | 2,170 | 2,187 | ||||||
Imperial Tobacco Finance PLC 3.50% 20232 | 2,335 | 2,446 | ||||||
JBS Investments GmbH II 7.00% 20262 | 3,868 | 4,181 | ||||||
JBS Investments GmbH II 7.00% 2026 | 1,665 | 1,800 | ||||||
Keurig Dr Pepper Inc. 4.057% 2023 | 6,190 | 6,730 | ||||||
Keurig Dr Pepper Inc. 4.597% 2028 | 10,752 | 13,101 | ||||||
Molson Coors Brewing Co. 2.10% 2021 | 2,415 | 2,435 | ||||||
Molson Coors Brewing Co. 4.20% 2046 | 9,955 | 11,423 | ||||||
Philip Morris International Inc. 4.25% 2044 | 9,550 | 12,029 | ||||||
Reynolds American Inc. 4.45% 2025 | 14,570 | 16,598 | ||||||
Reynolds American Inc. 5.85% 2045 | 1,970 | 2,521 | ||||||
Wal-Mart Stores, Inc. 2.85% 2024 | 6,765 | 7,321 | ||||||
Wal-Mart Stores, Inc. 3.05% 2026 | 7,720 | 8,694 | ||||||
|
| |||||||
| 255,656 | ||||||||
|
| |||||||
Communication services 1.48% | ||||||||
AT&T Inc. 2.55% 20332 | 4,953 | 5,104 | ||||||
AT&T Inc. 3.50% 20532 | 1,915 | 1,915 | ||||||
AT&T Inc. 3.55% 20552 | 8,325 | 8,297 | ||||||
CCO Holdings LLC and CCO Holdings Capital Corp. 5.125% 20272 | 4,800 | 5,100 | ||||||
CCO Holdings LLC and CCO Holdings Capital Corp. 2.80% 2031 | 5,642 | 5,968 | ||||||
CCO Holdings LLC and CCO Holdings Capital Corp. 5.75% 2048 | 5,000 | 6,547 | ||||||
CenturyLink, Inc. 4.00% 20272 | 16,374 | 16,929 | ||||||
CenturyLink, Inc. 7.65% 2042 | 5,000 | 6,066 | ||||||
Comcast Corp. 3.15% 2028 | 7,200 | 8,130 | ||||||
Comcast Corp. 2.65% 2030 | 7,500 | 8,199 | ||||||
Comcast Corp. 4.00% 2048 | 5,000 | 6,292 | ||||||
NBCUniversal Enterprise, Inc., junior subordinated, 5.25% 20492 | 5,170 | 5,280 | ||||||
SoftBank Group Corp. 3.36% 20232 | 2,175 | 2,199 | ||||||
Tencent Holdings Ltd. 2.39% 20302 | 10,000 | 10,264 | ||||||
T-Mobile US, Inc. 3.50% 20252 | 3,275 | 3,622 | ||||||
T-Mobile US, Inc. 3.75% 20272 | 5,000 | 5,699 | ||||||
T-Mobile US, Inc. 3.875% 20302 | 4,500 | 5,217 | ||||||
T-Mobile US, Inc. 3.00% 20412 | 2,100 | 2,181 | ||||||
T-Mobile US, Inc. 4.50% 20502 | 11,575 | 14,298 | ||||||
Verizon Communications Inc. 4.40% 2034 | 5,080 | 6,342 | ||||||
Verizon Communications Inc. 2.875% 2050 | 3,000 | 3,026 | ||||||
Vodafone Group PLC 4.375% 2028 | 10,000 | 11,979 | ||||||
Vodafone Group PLC 4.25% 2050 | 3,050 | 3,785 | ||||||
Walt Disney Company 2.65% 2031 | 15,000 | 16,450 | ||||||
|
| |||||||
| 168,889 | ||||||||
|
| |||||||
Information technology 1.02% | ||||||||
Apple Inc. 1.55% 2021 | 11,630 | 11,714 | ||||||
Broadcom Inc. 3.625% 2024 | 3,000 | 3,297 | ||||||
Broadcom Inc. 3.15% 2025 | 5,000 | 5,462 | ||||||
Broadcom Inc. 4.25% 2026 | 41,375 | 47,428 | ||||||
Broadcom Ltd. 3.875% 2027 | 14,860 | 16,706 | ||||||
Financial & Risk US Holdings, Inc. 6.25% 20262 | 3,325 | 3,556 | ||||||
Microsoft Corp. 2.525% 2050 | 10,000 | 10,546 | ||||||
168 American Funds Insurance Series
Table of Contents
Bond Fund (continued)
Bonds, notes & other debt instruments (continued)
| Principal amount (000) | Value (000) | |||||||
Corporate bonds, notes & loans (continued) | ||||||||
Information technology (continued) | ||||||||
PayPal Holdings, Inc. 1.65% 2025 | $ | 6,989 | $ | 7,308 | ||||
Simon Property Group, LP 3.50% 2025 | 4,775 | 5,305 | ||||||
Simon Property Group, LP 2.65% 2030 | 5,225 | 5,569 | ||||||
|
| |||||||
| 116,891 | ||||||||
|
| |||||||
Real estate 0.36% | ||||||||
Alexandria Real Estate Equities, Inc. 3.95% 2028 | 1,425 | 1,657 | ||||||
Alexandria Real Estate Equities, Inc. 4.50% 2029 | 150 | 184 | ||||||
American Campus Communities, Inc. 3.75% 2023 | 2,900 | 3,066 | ||||||
American Campus Communities, Inc. 3.875% 2031 | 620 | 703 | ||||||
Corporate Office Properties LP 5.25% 2024 | 10 | 11 | ||||||
Equinix, Inc. 2.90% 2026 | 3,287 | 3,599 | ||||||
Equinix, Inc. 3.20% 2029 | 3,846 | 4,245 | ||||||
Essex Portfolio LP 3.25% 2023 | 335 | 353 | ||||||
Essex Portfolio LP 3.875% 2024 | 1,000 | 1,099 | ||||||
Hospitality Properties Trust 5.00% 2022 | 1,270 | 1,295 | ||||||
Hospitality Properties Trust 4.50% 2025 | 855 | 844 | ||||||
Hospitality Properties Trust 3.95% 2028 | 1,710 | 1,655 | ||||||
Iron Mountain Inc. 4.875% 20272 | 1,605 | 1,682 | ||||||
Iron Mountain Inc. 5.25% 20282 | 3,500 | 3,700 | ||||||
Iron Mountain Inc. 4.875% 20292 | 2,770 | 2,925 | ||||||
Iron Mountain Inc. 5.25% 20302 | 3,000 | 3,244 | ||||||
Iron Mountain Inc. 4.50% 20312 | 2,080 | 2,181 | ||||||
Kimco Realty Corp. 3.40% 2022 | 1,045 | 1,098 | ||||||
Omega Healthcare Investors, Inc. 4.375% 2023 | 900 | 974 | ||||||
Piedmont Operating Partnership LP 4.45% 2024 | 1,000 | 1,072 | ||||||
Scentre Group 2.375% 20212 | 175 | 176 | ||||||
Scentre Group 3.50% 20252 | 4,565 | 4,885 | ||||||
|
| |||||||
| 40,648 | ||||||||
|
| |||||||
Materials 0.25% | ||||||||
Air Products and Chemicals, Inc. 2.70% 2040 | 5,736 | 6,182 | ||||||
Braskem SA 4.50% 20302 | 2,500 | 2,572 | ||||||
LYB International Finance III, LLC 2.25% 2030 | 3,802 | 3,935 | ||||||
LYB International Finance III, LLC 3.375% 2040 | 2,996 | 3,208 | ||||||
LYB International Finance III, LLC 3.625% 2051 | 8,881 | 9,723 | ||||||
LYB International Finance III, LLC 3.80% 2060 | 2,833 | 3,061 | ||||||
|
| |||||||
| 28,681 | ||||||||
|
| |||||||
Total corporate bonds, notes & loans | 3,792,833 | |||||||
|
| |||||||
Mortgage-backed obligations 31.72% | ||||||||
Federal agency mortgage-backed obligations 30.74% | ||||||||
Fannie Mae Pool #976945 5.50% 20235 | 67 | 68 | ||||||
Fannie Mae Pool #AB1068 4.50% 20255 | 136 | 145 | ||||||
Fannie Mae Pool #AB4088 3.00% 20265 | 629 | 662 | ||||||
Fannie Mae Pool #AJ9156 3.00% 20265 | 326 | 343 | ||||||
Fannie Mae Pool #AJ6967 3.00% 20265 | 164 | 173 | ||||||
Fannie Mae Pool #AJ5522 3.00% 20265 | 4 | 4 | ||||||
Fannie Mae Pool #256133 4.50% 20265 | 161 | 175 | ||||||
Fannie Mae Pool #AK5394 3.00% 20275 | 774 | 814 | ||||||
Fannie Mae Pool #AL5603 3.00% 20275 | 685 | 719 | ||||||
Fannie Mae Pool #AX3597 3.00% 20275 | 318 | 335 | ||||||
Fannie Mae Pool #AL4641 3.00% 20275 | 300 | 315 | ||||||
Fannie Mae Pool #AB4281 3.00% 20275 | 136 | 143 | ||||||
Fannie Mae Pool #AJ9355 3.00% 20275 | 88 | 92 | ||||||
Fannie Mae Pool #AB4486 3.00% 20275 | 69 | 73 | ||||||
Fannie Mae Pool #AB5236 3.00% 20275 | 27 | 29 | ||||||
Fannie Mae Pool #AO0800 3.00% 20275 | 24 | 25 | ||||||
Fannie Mae Pool #AK0971 3.00% 20275 | 12 | 12 | ||||||
Fannie Mae Pool #AL3802 3.00% 20285 | 957 | 1,005 | ||||||
American Funds Insurance Series 169
Table of Contents
Bond Fund (continued)
Bonds, notes & other debt instruments (continued)
| Principal amount (000) | Value (000) | |||||||
Mortgage-backed obligations (continued) | ||||||||
Federal agency mortgage-backed obligations (continued) | ||||||||
Fannie Mae Pool #AR3058 3.00% 20285 | $ | 107 | $ | 113 | ||||
Fannie Mae Pool #AL8241 3.00% 20295 | 908 | 954 | ||||||
Fannie Mae Pool #BM4299 3.00% 20305 | 2,701 | 2,834 | ||||||
Fannie Mae Pool #AL9573 3.00% 20315 | 109 | 114 | ||||||
Fannie Mae Pool #AS8018 3.00% 20315 | 81 | 87 | ||||||
Fannie Mae Pool #BM4741 3.00% 20325 | 66 | 69 | ||||||
Fannie Mae Pool #MA4229 2.00% 20365 | 58,877 | 61,594 | ||||||
Fannie Mae Pool #924866 2.265% 20374,5 | 728 | 737 | ||||||
Fannie Mae Pool #945680 6.00% 20375 | 709 | 840 | ||||||
Fannie Mae Pool #913966 6.00% 20375 | 70 | 81 | ||||||
Fannie Mae Pool #889982 5.50% 20385 | 1,514 | 1,779 | ||||||
Fannie Mae Pool #988588 5.50% 20385 | 271 | 319 | ||||||
Fannie Mae Pool #AB1297 5.00% 20405 | 323 | 376 | ||||||
Fannie Mae Pool #AH8144 5.00% 20415 | 1,915 | 2,228 | ||||||
Fannie Mae Pool #AH9479 5.00% 20415 | 1,866 | 2,170 | ||||||
Fannie Mae Pool #AI1862 5.00% 20415 | 1,569 | 1,825 | ||||||
Fannie Mae Pool #AI3510 5.00% 20415 | 923 | 1,073 | ||||||
Fannie Mae Pool #AJ0704 5.00% 20415 | 837 | 974 | ||||||
Fannie Mae Pool #AJ5391 5.00% 20415 | 479 | 554 | ||||||
Fannie Mae Pool #BM6240 2.754% 20444,5 | 3,104 | 3,245 | ||||||
Fannie Mae Pool #AZ3904 4.00% 20455 | 85 | 92 | ||||||
Fannie Mae Pool #AL8522 3.50% 20465 | 1,516 | 1,656 | ||||||
Fannie Mae Pool #BD1968 4.00% 20465 | 2,149 | 2,347 | ||||||
Fannie Mae Pool #BE0592 4.00% 20465 | 851 | 912 | ||||||
Fannie Mae Pool #BD5477 4.00% 20465 | 517 | 566 | ||||||
Fannie Mae Pool #CA0770 3.50% 20475 | 10,841 | 11,523 | ||||||
Fannie Mae Pool #BJ1910 3.50% 20475 | 4,361 | 4,626 | ||||||
Fannie Mae Pool #CA0706 4.00% 20475 | 268 | 288 | ||||||
Fannie Mae Pool #MA3058 4.00% 20475 | 108 | 116 | ||||||
Fannie Mae Pool #BM4413 4.50% 20475 | 7,086 | 7,724 | ||||||
Fannie Mae Pool #BF0293 3.00% 20485 | 13,107 | 13,989 | ||||||
Fannie Mae Pool #BF0318 3.50% 20485 | 12,283 | 13,278 | ||||||
Fannie Mae Pool #CA1189 3.50% 20485 | 3,157 | 3,352 | ||||||
Fannie Mae Pool #BK0920 4.00% 20485 | 1,600 | 1,709 | ||||||
Fannie Mae Pool #BJ9252 4.00% 20485 | 506 | 540 | ||||||
Fannie Mae Pool #MA3384 4.00% 20485 | 308 | 330 | ||||||
Fannie Mae Pool #BJ9256 4.00% 20485 | 287 | 306 | ||||||
Fannie Mae Pool #BJ0639 4.00% 20485 | 214 | 229 | ||||||
Fannie Mae Pool #BJ9169 4.00% 20485 | 182 | 195 | ||||||
Fannie Mae Pool #BK0915 4.00% 20485 | 150 | 160 | ||||||
Fannie Mae Pool #BJ5749 4.00% 20485 | 33 | 36 | ||||||
Fannie Mae Pool #BM4676 4.00% 20485 | 25 | 27 | ||||||
Fannie Mae Pool #CA2493 4.50% 20485 | 1,774 | 1,928 | ||||||
Fannie Mae Pool #CA4534 3.00% 20495 | 16,409 | 17,767 | ||||||
Fannie Mae Pool #CA3807 3.00% 20495 | 2,275 | 2,468 | ||||||
Fannie Mae Pool #CA3806 3.00% 20495 | 1,230 | 1,338 | ||||||
Fannie Mae Pool #FM0007 3.50% 20495 | 31,664 | 34,351 | ||||||
Fannie Mae Pool #CA4802 3.50% 20495 | 30,616 | 33,658 | ||||||
Fannie Mae Pool #FM1954 3.50% 20495 | 14,979 | 16,159 | ||||||
Fannie Mae Pool #FM1589 3.50% 20495 | 9,307 | 10,016 | ||||||
Fannie Mae Pool #FM2092 3.50% 20495 | 9,040 | 9,875 | ||||||
Fannie Mae Pool #FM1262 4.00% 20495 | 125,351 | 136,525 | ||||||
Fannie Mae Pool #MA4256 2.50% 20515 | 2,843 | 2,998 | ||||||
Fannie Mae Pool #BF0264 3.50% 20585 | 14,025 | 15,509 | ||||||
Fannie Mae Pool #BF0332 3.00% 20595 | 30,573 | 33,245 | ||||||
Fannie Mae, Series 2001-4, Class GA, 9.081% 20254,5 | — | 6 | — | 6 | ||||
Fannie Mae, Series 2001-50, Class BA, 7.00% 20415 | 10 | 12 | ||||||
Fannie Mae, Series 2002-W3, Class A5, 7.50% 20415 | 23 | 28 | ||||||
Fannie Mae, Series 2002-W1, Class 2A, 5.522% 20424,5 | 30 | 34 | ||||||
Freddie Mac Pool #ZA2657 3.00% 20265 | 455 | 479 | ||||||
Freddie Mac Pool #ZK3537 3.00% 20265 | 88 | 92 | ||||||
170 American Funds Insurance Series
Table of Contents
Bond Fund (continued)
Bonds, notes & other debt instruments (continued)
| Principal amount (000) | Value (000) | |||||||
Mortgage-backed obligations (continued) | ||||||||
Federal agency mortgage-backed obligations (continued) | ||||||||
Freddie Mac Pool #ZK4277 3.00% 20275 | $ | 575 | $ | 605 | ||||
Freddie Mac Pool #ZK3836 3.00% 20275 | 190 | 200 | ||||||
Freddie Mac Pool #ZK3970 3.00% 20275 | 181 | 190 | ||||||
Freddie Mac Pool #ZS6521 3.00% 20275 | 119 | 125 | ||||||
Freddie Mac Pool #ZK3893 3.00% 20275 | 59 | 62 | ||||||
Freddie Mac Pool #ZK4162 3.00% 20275 | 45 | 47 | ||||||
Freddie Mac Pool #ZS8452 3.00% 20275 | 15 | 15 | ||||||
Freddie Mac Pool #ZK4039 3.00% 20275 | 6 | 7 | ||||||
Freddie Mac Pool #ZS8463 3.00% 20275 | 6 | 6 | ||||||
Freddie Mac Pool #ZS8507 3.00% 20285 | 225 | 236 | ||||||
Freddie Mac Pool #ZK7590 3.00% 20295 | 4,648 | 4,925 | ||||||
Freddie Mac Pool #ZK7593 3.00% 20295 | 235 | 249 | ||||||
Freddie Mac Pool #ZT1931 3.00% 20335 | 306 | 322 | ||||||
Freddie Mac Pool #A15120 5.50% 20335 | 64 | 72 | ||||||
Freddie Mac Pool #QN1073 3.00% 20345 | 154 | 163 | ||||||
Freddie Mac Pool #SB8083 1.50% 20365 | 14,702 | 15,135 | ||||||
Freddie Mac Pool #SB8084 2.00% 20365 | 15,986 | 16,724 | ||||||
Freddie Mac Pool #G05196 5.50% 20385 | 84 | 99 | ||||||
Freddie Mac Pool #G05267 5.50% 20385 | 62 | 73 | ||||||
Freddie Mac Pool #G06020 5.50% 20395 | 121 | 142 | ||||||
Freddie Mac Pool #A93948 4.50% 20405 | 269 | 303 | ||||||
Freddie Mac Pool #G05860 5.50% 20405 | 448 | 525 | ||||||
Freddie Mac Pool #G06868 4.50% 20415 | 294 | 329 | ||||||
Freddie Mac Pool #G06841 5.50% 20415 | 689 | 810 | ||||||
Freddie Mac Pool #841039 3.54% 20434,5 | 3,059 | 3,166 | ||||||
Freddie Mac Pool #G60138 3.50% 20455 | 23,567 | 25,901 | ||||||
Freddie Mac Pool #Z40130 3.00% 20465 | 29,938 | 32,684 | ||||||
Freddie Mac Pool #G61733 3.00% 20475 | 7,668 | 8,318 | ||||||
Freddie Mac Pool #Q52157 3.50% 20475 | 4,216 | 4,476 | ||||||
Freddie Mac Pool #G08789 4.00% 20475 | 1,664 | 1,788 | ||||||
Freddie Mac Pool #G67709 3.50% 20485 | 23,635 | 25,832 | ||||||
Freddie Mac Pool #G67710 3.50% 20485 | 21,713 | 23,367 | ||||||
Freddie Mac Pool #G61628 3.50% 20485 | 657 | 712 | ||||||
Freddie Mac Pool #SI2002 4.00% 20485 | 3,356 | 3,592 | ||||||
Freddie Mac Pool #Q58494 4.00% 20485 | 1,884 | 2,015 | ||||||
Freddie Mac Pool #QA4673 3.00% 20495 | 42,800 | 46,229 | ||||||
Freddie Mac Pool #SD7507 3.00% 20495 | 28,385 | 30,699 | ||||||
Freddie Mac Pool #SD7509 3.00% 20495 | 8,724 | 9,372 | ||||||
Freddie Mac Pool #QA5125 3.50% 20495 | 27,889 | 30,661 | ||||||
Freddie Mac Pool #SD7508 3.50% 20495 | 19,850 | 21,774 | ||||||
Freddie Mac Pool #RA1369 3.50% 20495 | 4,667 | 5,071 | ||||||
Freddie Mac Pool #ZN4842 3.50% 20495 | 1,676 | 1,818 | ||||||
Freddie Mac Pool #RA2020 3.00% 20505 | 3,353 | 3,604 | ||||||
Freddie Mac Pool #SD7514 3.50% 20505 | 39,178 | 42,144 | ||||||
Freddie Mac, Series 3061, Class PN, 5.50% 20355 | 90 | 105 | ||||||
Freddie Mac, Series 3318, Class JT, 5.50% 20375 | 236 | 272 | ||||||
Freddie Mac, Series K716, Class A2, Multi Family, 3.13% 20215 | 6,104 | 6,143 | ||||||
Freddie Mac, Series K020, Class A2, Multi Family, 2.373% 20225 | 4,300 | 4,402 | ||||||
Freddie Mac, Series K718, Class A2, Multi Family, 2.791% 20225 | 9,240 | 9,432 | ||||||
Freddie Mac, Series 3156, Class PO, principal only, 0% 20365 | 189 | 177 | ||||||
Freddie Mac, Series 3146, Class PO, principal only, 0% 20365 | 190 | 175 | ||||||
Freddie Mac Seasoned Credit Risk Transfer Trust, Series 2018-3, Class MA, 3.50% 20575 | 15,166 | 16,431 | ||||||
Freddie Mac Seasoned Credit Risk Transfer Trust, Series 2019-2, Class MA, 3.50% 20585 | 3,146 | 3,429 | ||||||
Government National Mortgage Assn. 2.00% 20515,7 | 285,328 | 297,877 | ||||||
Government National Mortgage Assn. 2.00% 20515,7 | 144,122 | 150,225 | ||||||
Government National Mortgage Assn. Pool #MA5817 4.00% 20495 | 38,672 | 41,466 | ||||||
Government National Mortgage Assn. Pool #MA5876 4.00% 20495 | 5,631 | 6,024 | ||||||
Government National Mortgage Assn. Pool #MA6221 4.50% 20495 | 17,517 | 18,955 | ||||||
Government National Mortgage Assn. Pool #MA5764 4.50% 20495 | 1,913 | 2,071 | ||||||
Government National Mortgage Assn. Pool #MA5878 5.00% 20495 | 44,710 | 48,986 | ||||||
Government National Mortgage Assn. Pool #MA6042 5.00% 20495 | 119 | 131 | ||||||
American Funds Insurance Series 171
Table of Contents
Bond Fund (continued)
Bonds, notes & other debt instruments (continued)
| Principal amount (000) | Value (000) | |||||||
Mortgage-backed obligations (continued) | ||||||||
Federal agency mortgage-backed obligations (continued) | ||||||||
Uniform Mortgage-Backed Security 1.50% 20365,7 | $ | 408,695 | $ | 419,729 | ||||
Uniform Mortgage-Backed Security 1.50% 20365,7 | 343,501 | 352,950 | ||||||
Uniform Mortgage-Backed Security 2.00% 20365,7 | 197,784 | 206,562 | ||||||
Uniform Mortgage-Backed Security 2.00% 20515,7 | 330,010 | 341,624 | ||||||
Uniform Mortgage-Backed Security 2.00% 20515,7 | 170,554 | 176,843 | ||||||
Uniform Mortgage-Backed Security 2.50% 20515,7 | 134,685 | 141,513 | ||||||
Uniform Mortgage-Backed Security 2.50% 20515,7 | 86,091 | 90,588 | ||||||
Uniform Mortgage-Backed Security 3.00% 20515,7 | 166,000 | 174,066 | ||||||
Uniform Mortgage-Backed Security 3.50% 20515,7 | 31,602 | 33,449 | ||||||
Uniform Mortgage-Backed Security 4.00% 20515,7 | 52,938 | 56,615 | ||||||
Uniform Mortgage-Backed Security 4.50% 20515,7 | 68,056 | 73,853 | ||||||
|
| |||||||
| 3,506,261 | ||||||||
|
| |||||||
Collateralized mortgage-backed obligations (privately originated) 0.64% | ||||||||
Arroyo Mortgage Trust, Series 2020-1, Class A1A, 1.662% 20552,5 | 390 | 394 | ||||||
Bellemeade Re Ltd., Series 2019-3A, Class M1B, (1-month USD-LIBOR + 1.60%) 1.748% 20292,4,5 | 3,175 | 3,181 | ||||||
BRAVO Residential Funding Trust, Series 2020-RPL2, Class A1, 2.00% 20592,5 | 1,381 | 1,426 | ||||||
BRAVO Residential Funding Trust, Series 2020-RPL1, Class A1, 2.50% 20592,4,5 | 1,127 | 1,167 | ||||||
Bunker Hill Loan Depositary Trust, Series 2019-1, Class A1, 3.613% 20482,4,5 | 1,038 | 1,050 | ||||||
Bunker Hill Loan Depositary Trust, Series 2019-1, Class A3, 3.919% 20482,4,5 | 1,546 | 1,572 | ||||||
Cascade Funding Mortgage Trust, Series 2019-HB1, Class M1, 2.572% 20292,4,5 | 1,950 | 1,960 | ||||||
Cascade Funding Mortgage Trust, Series 2019-HB1, Class M2, 2.863% 20292,4,5 | 475 | 478 | ||||||
Cascade Funding Mortgage Trust, Series 2019-HB1, Class M3, 3.257% 20292,4,5 | 243 | 241 | ||||||
Cascade Funding Mortgage Trust, Series 2020-HB4, Class A, 0.946% 20302,4,5 | 1,162 | 1,163 | ||||||
Citigroup Mortgage Loan Trust Inc., Series 2020-EXP1, Class A1A, 1.804% 20602,4,5 | 1,479 | 1,491 | ||||||
Credit Suisse Mortgage Trust, Series 2020-NET, Class A, 2.257% 20372,5 | 1,612 | 1,674 | ||||||
Finance of America HECM Buyout, Series 2019-HB1, Class M1, 2.105% 20302,4,5 | 1,400 | 1,407 | ||||||
Finance of America HECM Buyout, Series 2020-HB1, Class M2, 2.389% 20302,4,5 | 500 | 490 | ||||||
Finance of America HECM Buyout, Series 2020-HB1, Class M3, 2.723% 20302,4,5 | 253 | 243 | ||||||
Finance of America Structured Securities Trust, Series 2019-JR2, Class A1, 2.00% 20692,5 | 4,485 | 4,866 | ||||||
Finance of America Structured Securities Trust, Series 2019-JR1, Class A, 2.00% 20692,5 | 3,798 | 4,172 | ||||||
JPMorgan Mortgage Trust, Series 2020-INV1, Class A3, 3.50% 20502,4,5 | 4,399 | 4,584 | ||||||
Legacy Mortgage Asset Trust, Series 2019-GS2, Class A1, 3.75% 20592,4,5 | 1,529 | 1,536 | ||||||
Mortgage Repurchase Agreement Financing Trust, Series 2020-1, Class A1, (1-month USD-LIBOR + 2.00%) 2.149% 20222,4,5 | 6,556 | 6,571 | ||||||
Mortgage Repurchase Agreement Financing Trust, Series 2020-5, Class A1, (1-month USD-LIBOR + 1.00%) 1.149% 20232,4,5 | 11,402 | 11,490 | ||||||
Onslow Bay Financial LLC, Series 2020-INV1, Class A5, 3.50% 20492,4,5 | 2,119 | 2,187 | ||||||
Starwood Mortgage Residential Trust, Series 2019-IMC1, Class A1, 3.468% 20492,4,5 | 1,684 | 1,697 | ||||||
Towd Point Mortgage Trust, Series 2020-4, Class A1, 1.75% 20602,5 | 17,877 | 18,323 | ||||||
|
| |||||||
| 73,363 | ||||||||
|
| |||||||
Commercial mortgage-backed securities 0.34% | ||||||||
Bank Commercial Mortgage Trust, Series 2019-BN17, Class A4, 3.714% 20525 | 100 | 117 | ||||||
Bank Commercial Mortgage Trust, Series 2019-BN16, Class A4, 4.005% 20525 | 770 | 915 | ||||||
Bank Commercial Mortgage Trust, Series 2019-BN19, Class A3, 3.183% 20615 | 1,018 | 1,156 | ||||||
Bank Commercial Mortgage Trust, Series 2018-BN10, Class A4, 3.428% 20615 | 130 | 147 | ||||||
Bank Commercial Mortgage Trust, Series 2018-BN10, Class A5, 3.688% 20615 | 205 | 237 | ||||||
Bank Commercial Mortgage Trust, Series 2018-BN12, Class A4, 4.255% 20614,5 | 2,444 | 2,916 | ||||||
Bank Commercial Mortgage Trust, Series 2020-BN26, Class A4, 2.403% 20635 | 295 | 317 | ||||||
Benchmark Mortgage Trust, Series 2018-B8, Class A5, 4.232% 20525 | 2,541 | 3,057 | ||||||
Benchmark Mortgage Trust, Series 2018-B7, Class A4, 4.51% 20534,5 | 781 | 955 | ||||||
Citigroup Commercial Mortgage Trust, Series 2016-C1, Class AS, 3.514% 20495 | 250 | 277 | ||||||
Citigroup Commercial Mortgage Trust, Series 2016-GC36, Class A5, 3.616% 20495 | 610 | 687 | ||||||
Commercial Mortgage Trust, Series 2012-CR3, Class B, 3.922% 20452,5 | 430 | 425 | ||||||
Commercial Mortgage Trust, Series 2013-LC13, Class B, 5.009% 20462,4,5 | 312 | 330 | ||||||
Commercial Mortgage Trust, Series 2014-LC15, Class AM, 4.198% 20475 | 350 | 385 | ||||||
CSAIL Commercial Mortgage Trust, Series 2015-C4, Class C, 4.563% 20484,5 | 204 | 211 | ||||||
CSAIL Commercial Mortgage Trust, Series 2015-C1, Class B, 4.044% 20504,5 | 300 | 318 | ||||||
172 American Funds Insurance Series
Table of Contents
Bond Fund (continued)
Bonds, notes & other debt instruments (continued)
| Principal amount (000) | Value (000) | |||||||
Mortgage-backed obligations (continued) | ||||||||
Commercial mortgage-backed securities (continued) | ||||||||
Deutsche Bank Commercial Mortgage Trust, Series 2016-C1, Class AM, 3.539% 20495 | $ | 200 | $ | 219 | ||||
Grace Mortgage Trust, Series 2020-GRCE, Class A, 2.347% 20402,5 | 2,601 | 2,759 | ||||||
GS Mortgage Securities Trust, Series 2011-GC5, Class B, 5.555% 20442,4,5 | 530 | 529 | ||||||
GS Mortgage Securities Trust, Series 2017-GS7, Class A4, 3.43% 20505 | 400 | 457 | ||||||
GS Mortgage Securities Trust, Series 2019-GC38, Class A4, 3.968% 20525 | 100 | 119 | ||||||
GS Mortgage Securities Trust, Series 2020-GC47, Class A5, 2.377% 20535 | 1,536 | 1,656 | ||||||
JPMBB Commercial Mortgage Securities Trust, Series 2014-C18, Class A5, 4.079% 20475 | 3,280 | 3,597 | ||||||
JPMDB Commercial Mortgage Securities Trust, Series 2017-C7, Class A5, 3.409% 20505 | 240 | 272 | ||||||
JPMDB Commercial Mortgage Securities Trust, Series 2017-C5, Class A5, 3.694% 20505 | 640 | 732 | ||||||
JPMorgan Chase Commercial Mortgage Securities Trust, Series 2018-BCON, Class A, | 785 | 818 | ||||||
JPMorgan Chase Commercial Mortgage Securities Trust, Series 2016-JP4, Class A4, 3.648% 20494,5 | 2,040 | 2,327 | ||||||
L.A. Arena Funding, LLC, Series 1, Class A, 7.656% 20262,5 | 153 | 153 | ||||||
Morgan Stanley Bank of America Merrill Lynch Trust, Series 2014-C17, Class A5, 3.741% 20475 | 2,038 | 2,224 | ||||||
Morgan Stanley Bank of America Merrill Lynch Trust, Series 2015-C22, Class A4, 3.306% 20485 | 410 | 447 | ||||||
Morgan Stanley Bank of America Merrill Lynch Trust, Series 2016-C32, Class A4, 3.72% 20495 | 245 | 281 | ||||||
Morgan Stanley Capital I Trust, Series 2015-UBS8, Class AS, 4.114% 20485 | 730 | 814 | ||||||
Morgan Stanley Capital I Trust, Series 2016-UBS9, Class C, 4.608% 20494,5 | 208 | 204 | ||||||
Wells Fargo Commercial Mortgage Trust, Series 2015-SG1, Class A4, 3.789% 20485 | 2,437 | 2,714 | ||||||
Wells Fargo Commercial Mortgage Trust, Series 2015-C28, Class C, 4.094% 20484,5 | 220 | 225 | ||||||
Wells Fargo Commercial Mortgage Trust, Series 2016-BNK1, Class B, 2.967% 20495 | 350 | 360 | ||||||
Wells Fargo Commercial Mortgage Trust, Series 2016-C34, Class AS, 3.484% 20495 | 130 | 143 | ||||||
Wells Fargo Commercial Mortgage Trust, Series 2016-C37, Class A5, 3.794% 20495 | 2,550 | 2,932 | ||||||
Wells Fargo Commercial Mortgage Trust, Series 2019-C54, Class A4, 3.146% 20525 | 1,019 | 1,154 | ||||||
Wells Fargo Commercial Mortgage Trust, Series 2016-NXS5, Class AS, 3.988% 20595 | 250 | 280 | ||||||
Wells Fargo Commercial Mortgage Trust, Series 2017-RC1, Class A4, 3.631% 20605 | 205 | 235 | ||||||
|
| |||||||
| 38,101 | ||||||||
|
| |||||||
Total mortgage-backed obligations | 3,617,725 | |||||||
|
| |||||||
U.S. Treasury bonds & notes 24.40% | ||||||||
U.S. Treasury 22.29% | ||||||||
U.S. Treasury 0.125% 2022 | 63,000 | 63,006 | ||||||
U.S. Treasury 2.625% 2023 | 70,000 | 75,132 | ||||||
U.S. Treasury 2.75% 2023 | 173,600 | 184,108 | ||||||
U.S. Treasury 2.125% 2024 | 72,100 | 77,178 | ||||||
U.S. Treasury 2.125% 20248 | 72,100 | 77,015 | ||||||
U.S. Treasury 0.25% 20258 | 402,459 | 401,224 | ||||||
U.S. Treasury 0.25% 2025 | 11,240 | 11,190 | ||||||
U.S. Treasury 2.875% 20258 | 96,200 | 107,380 | ||||||
U.S. Treasury 2.875% 2025 | 72,100 | 80,105 | ||||||
U.S. Treasury 1.375% 20268 | 75,000 | 78,872 | ||||||
U.S. Treasury 1.625% 2026 | 50,000 | 53,288 | ||||||
U.S. Treasury 0.50% 2027 | 185,625 | 185,110 | ||||||
U.S. Treasury 0.50% 2027 | 160,000 | 158,960 | ||||||
U.S. Treasury 2.25% 20278 | 120,200 | 133,420 | ||||||
U.S. Treasury 2.25% 20278 | 72,100 | 79,675 | ||||||
U.S. Treasury 6.125% 2027 | 24,000 | 32,951 | ||||||
U.S. Treasury 2.875% 2028 | 72,100 | 83,726 | ||||||
U.S. Treasury 0.875% 2030 | 147,750 | 147,185 | ||||||
U.S. Treasury 1.125% 2040 | 88,288 | 83,802 | ||||||
U.S. Treasury 2.25% 2049 | 41,697 | 47,726 | ||||||
American Funds Insurance Series 173
Table of Contents
Bond Fund (continued)
Bonds, notes & other debt instruments (continued)
Principal amount (000) | Value (000) | |||||||
U.S. Treasury bonds & notes (continued) | ||||||||
U.S. Treasury (continued) | ||||||||
U.S. Treasury 3.00% 20498 | $ | 150,000 | $ | 197,801 | ||||
U.S. Treasury 1.25% 2050 | 44,000 | 39,906 | ||||||
U.S. Treasury 1.375% 2050 | 153,811 | 143,929 | ||||||
|
| |||||||
| 2,542,689 | ||||||||
|
| |||||||
U.S. Treasury inflation-protected securities 2.11% | ||||||||
U.S. Treasury Inflation-Protected Security 0.375% 20278,9 | 79,834 | 89,865 | ||||||
U.S. Treasury Inflation-Protected Security 0.50% 20288,9 | 79,172 | 89,819 | ||||||
U.S. Treasury Inflation-Protected Security 1.00% 20499 | 14,978 | 21,124 | ||||||
U.S. Treasury Inflation-Protected Security 0.25% 20509 | 33,837 | 40,307 | ||||||
|
| |||||||
| 241,115 | ||||||||
|
| |||||||
Total U.S. Treasury bonds & notes | 2,783,804 | |||||||
|
| |||||||
Bonds & notes of governments & government agencies outside the U.S. 3.06% | ||||||||
Dominican Republic 5.95% 20272 | 8,100 | 9,548 | ||||||
Italy (Republic of) 0.95% 2023 | € | 45,000 | 56,628 | |||||
Italy (Republic of) 1.50% 2025 | 33,327 | 43,649 | ||||||
Japan, Series 20, 0.10% 20259 | ¥ | 11,396,250 | 110,591 | |||||
Paraguay (Republic of) 4.625% 2023 | $ | 1,025 | 1,104 | |||||
Paraguay (Republic of) 5.00% 2026 | 1,250 | 1,469 | ||||||
Paraguay (Republic of) 4.95% 2031 | 3,487 | 4,232 | ||||||
Portuguese Republic 5.125% 2024 | 24,775 | 28,835 | ||||||
Portuguese Republic 5.65% 2024 | € | 20,000 | 29,205 | |||||
PT Indonesia Asahan Aluminium Tbk 5.23% 20212 | $ | 1,862 | 1,935 | |||||
PT Indonesia Asahan Aluminium Tbk 5.71% 20232 | 1,020 | 1,129 | ||||||
PT Indonesia Asahan Aluminium Tbk 4.75% 20252 | 1,270 | 1,405 | ||||||
PT Indonesia Asahan Aluminium Tbk 5.45% 20302 | 340 | 410 | ||||||
PT Indonesia Asahan Aluminium Tbk 5.80% 20502 | 1,150 | 1,431 | ||||||
Qatar (State of) 4.50% 20282 | 5,100 | 6,188 | ||||||
Qatar (State of) 5.103% 20482 | 3,400 | 4,790 | ||||||
Saudi Arabia (Kingdom of) 3.628% 20272 | 5,000 | 5,624 | ||||||
Saudi Arabia (Kingdom of) 3.625% 20282 | 11,435 | 12,835 | ||||||
United Mexican States, Series M, 5.75% 2026 | MXN | 527,500 | 27,728 | |||||
|
| |||||||
| 348,736 | ||||||||
|
| |||||||
Asset-backed obligations 2.19% | ||||||||
Aesop Funding LLC, Series 2020-1A, Class A, 2.33% 20262,5 | $ | 7,689 | 7,958 | |||||
Aesop Funding LLC, Series 2020-2, Class A, 2.02% 20272,5 | 2,427 | 2,480 | ||||||
Aesop Funding LLC, Series 2020-2A, Class B, 2.96% 20272,5 | 623 | 637 | ||||||
Aesop Funding LLC, Series 2020-2A, Class C, 4.25% 20272,5 | 1,279 | 1,316 | ||||||
American Credit Acceptance Receivables Trust, Series 2020-3, Class B, 1.15% 20242,5 | 900 | 905 | ||||||
American Credit Acceptance Receivables Trust, Series 2020-3, Class C, 1.85% 20262,5 | 2,602 | 2,648 | ||||||
American Credit Acceptance Receivables Trust, Series 2020-3, Class D, 2.40% 20262,5 | 2,500 | 2,587 | ||||||
AmeriCredit Automobile Receivables Trust, Series 2017-1, Class C, 2.71% 20225 | 3,749 | 3,771 | ||||||
CarMaxAuto Owner Trust, Series 2019-2, Class C, 3.16% 20255 | 400 | 420 | ||||||
CF Hippolyta LLC, Series 2020-1, Class A1, 1.69% 20602,5 | 10,894 | 11,127 | ||||||
CF Hippolyta LLC, Series 2020-1, Class A2, 1.99% 20602,5 | 2,086 | 2,121 | ||||||
CF Hippolyta LLC, Series 2020-1, Class B1, 2.28% 20602,5 | 3,567 | 3,634 | ||||||
CF Hippolyta LLC, Series 2020-1, Class B2, 2.60% 20602,5 | 387 | 392 | ||||||
CPS Auto Receivables Trust, Series 2019-B, Class C, 3.35% 20242,5 | 835 | 852 | ||||||
CPS Auto Receivables Trust, Series 2019-C, Class C, 2.84% 20252,5 | 743 | 759 | ||||||
CPS Auto Receivables Trust, Series 2019-C, Class D, 3.17% 20252,5 | 1,125 | 1,166 | ||||||
CPS Auto Receivables Trust, Series 2019-B, Class D, 3.69% 20252,5 | 3,045 | 3,140 | ||||||
Credit Acceptance Auto Loan Trust, Series 2020-1A, Class A, 2.01% 20292,5 | 7,411 | 7,581 | ||||||
Drive Auto Receivables Trust, Series 2019-2, Class B, 3.17% 20235 | 2,087 | 2,101 | ||||||
Drive Auto Receivables Trust, Series 2019-3, Class C, 2.90% 20255 | 4,910 | 5,060 | ||||||
Drive Auto Receivables Trust, Series 2019-2, Class C, 3.42% 20255 | 4,665 | 4,794 | ||||||
Drive Auto Receivables Trust, Series 2019-3, Class D, 3.18% 20265 | 4,020 | 4,190 | ||||||
174 American Funds Insurance Series
Table of Contents
Bond Fund (continued)
Bonds, notes & other debt instruments (continued)
| Principal amount (000) | Value (000) | |||||||
Asset-backed obligations (continued) | ||||||||
Drivetime Auto Owner Trust, Series 2019-3, Class C, 2.74% 20252,5 | $ | 880 | $ | 898 | ||||
Drivetime Auto Owner Trust, Series 2019-3, Class D, 2.96% 20252,5 | 1,915 | 1,981 | ||||||
Drivetime Auto Owner Trust, Series 2019-2A, Class C, 3.18% 20252,5 | 2,565 | 2,619 | ||||||
Drivetime Auto Owner Trust, Series 2019-2A, Class D, 3.48% 20252,5 | 4,250 | 4,414 | ||||||
Drivetime Auto Owner Trust, Series 2020-3A, Class C, 1.47% 20262,5 | 817 | 825 | ||||||
Exeter Automobile Receivables Trust, Series 2017-3A, Class B, 2.81% 20222,5 | 572 | 572 | ||||||
Exeter Automobile Receivables Trust, Series 2019-2A, Class B, 3.06% 20232,5 | 1,791 | 1,800 | ||||||
Exeter Automobile Receivables Trust, Series 2019-3A, Class C, 2.79% 20242,5 | 5,000 | 5,108 | ||||||
Exeter Automobile Receivables Trust, Series 2019-2A, Class C, 3.30% 20242,5 | 2,500 | 2,553 | ||||||
Exeter Automobile Receivables Trust, Series 2019-1A, Class C, 3.82% 20242,5 | 4,145 | 4,208 | ||||||
Exeter Automobile Receivables Trust, Series 2020-3A, Class C, 1.32% 20255 | 780 | 787 | ||||||
Exeter Automobile Receivables Trust, Series 2019-3A, Class D, 3.11% 20252,5 | 5,000 | 5,171 | ||||||
Exeter Automobile Receivables Trust, Series 2019-2A, Class D, 3.71% 20252,5 | 6,000 | 6,271 | ||||||
Exeter Automobile Receivables Trust, Series 2020-3A, Class D, 1.73% 20265 | 1,012 | 1,027 | ||||||
FirstKey Homes Trust, Series 2020-SFR2, Class A, 1.266% 20372,5 | 18,161 | 18,292 | ||||||
Ford Credit Auto Owner Trust, Series 2016-2, Class A, 2.03% 20272,5 | 26,755 | 26,972 | ||||||
Ford Credit Auto Owner Trust, Series 2018-2, Class A, 3.47% 20302,5 | 17,675 | 18,968 | ||||||
Ford Credit Auto Owner Trust, Series 2018-1, Class A, 3.52% 20302,5 | 939 | 1,025 | ||||||
Ford Credit Auto Owner Trust, Series 2020-1, Class A, 2.04% 20312,5 | 6,672 | 7,043 | ||||||
Ford Credit Auto Owner Trust, Series 2018-1, Class A, 3.19% 20312,5 | 30,740 | 33,823 | ||||||
Ford Credit Floorplan Master Owner Trust, Series 2019-3, Class A1, 2.23% 20245 | 2,625 | 2,709 | ||||||
GM Financial Automobile Leasing Trust, Series 2020-2, Class B, 1.56% 20245 | 360 | 367 | ||||||
GM Financial Automobile Leasing Trust, Series 2020-2, Class C, 2.56% 20245 | 301 | 312 | ||||||
GM Financial Automobile Leasing Trust, Series 2020-2, Class D, 3.21% 20245 | 425 | 444 | ||||||
GM Financial Consumer Automobile Receivables Trust, Series 2018-1, Class B, 2.57% 20235 | 520 | 528 | ||||||
GM Financial Consumer Automobile Receivables Trust, Series 2018-1, Class C, 2.77% 20235 | 360 | 366 | ||||||
Hertz Vehicle Financing LLC, Rental Car Asset-Backed Notes, Series 2016-4A, Class A, 2.65% 20222,5 | 838 | 840 | ||||||
Hertz Vehicle Financing LLC, Rental Car Asset-Backed Notes, Series 2019-3A, Class A, 2.67% 20252,5 | 1,894 | 1,898 | ||||||
Hertz Vehicle Financing LLC, Rental Car Asset-Backed Notes, Series 2019-2A, Class A, 3.42% 20252,5 | 1,027 | 1,031 | ||||||
Prestige Auto Receivables Trust, Series 2019-1A, Class C, 2.70% 20242,5 | 2,190 | 2,248 | ||||||
Prestige Auto Receivables Trust, Series 2019-1A, Class D, 3.01% 20252,5 | 1,355 | 1,402 | ||||||
Santander Drive Auto Receivables Trust, Series 2017-3, Class C, 2.76% 20225 | 435 | 436 | ||||||
Santander Drive Auto Receivables Trust, Series 2019-2, Class D, 3.22% 20255 | 3,110 | 3,236 | ||||||
Santander Drive Auto Receivables Trust, Series 2020-3, Class C, 1.12% 20265 | 3,344 | 3,373 | ||||||
Santander Drive Auto Receivables Trust, Series 2020-3, Class D, 1.64% 20265 | 2,211 | 2,246 | ||||||
Social Professional Loan Program LLC, Series 2015-C, Class A2, 2.51% 20332,5 | 688 | 691 | ||||||
Toyota Auto Loan Extended Note Trust, Series 2019-1, Class A, 2.56% 20312,5 | 6,000 | 6,414 | ||||||
Verizon Owner Trust, Series 2017-3A, Class B, 2.38% 20222,5 | 1,572 | 1,575 | ||||||
Voya Ltd., CLO, Series 2014-3A, Class A1R, (3-month USD-LIBOR + 0.72%) 0.935% 20262,4,5 | 928 | 927 | ||||||
Westlake Automobile Receivables Trust, Series 2020-3A, Class C, 1.24% 20252,5 | 1,557 | 1,567 | ||||||
Westlake Automobile Receivables Trust, Series 2020-3A, Class D, 1.65% 20262,5 | 3,023 | 3,062 | ||||||
|
| |||||||
| 249,668 | ||||||||
|
| |||||||
Municipals 1.98% | ||||||||
California 0.06% | ||||||||
G.O. Bonds, Series 2009, 7.50% 2034 | 2,100 | 3,503 | ||||||
High-Speed Passenger Train G.O. Rev. Ref. Bonds, Series 2017-A, 2.367% 2022 | 3,775 | 3,871 | ||||||
|
| |||||||
| 7,374 | ||||||||
|
| |||||||
American Funds Insurance Series 175
Table of Contents
Bond Fund (continued)
Bonds, notes & other debt instruments (continued)
Principal amount (000) | Value (000) | |||||||
Municipals (continued) | ||||||||
Illinois 1.88% | ||||||||
City of Chicago, Board of Education, Unlimited Tax G.O. Bonds (Dedicated Rev.), Series 2009-E, | $ | 30,835 | $ | 32,542 | ||||
City of Chicago, Board of Education, Unlimited Tax G.O. Bonds (Dedicated Rev.), Series 2010-C, | 65 | 70 | ||||||
City of Chicago, Board of Education, Unlimited Tax G.O. Bonds (Dedicated Rev.), Series 2010-D, | 8,945 | 9,285 | ||||||
City of Chicago, Board of Education, Unlimited Tax G.O. Bonds (Dedicated Rev.), Series 2011-A, 5.50% 2039 | 410 | 417 | ||||||
City of Chicago, Board of Education, Unlimited Tax G.O. Bonds (Dedicated Rev.), Series 2015-C, | 1,190 | 1,288 | ||||||
City of Chicago, Board of Education, Unlimited Tax G.O. Rev. Ref. Bonds (Dedicated Rev.), Series 2017-C, 5.00% 2026 | 1,100 | 1,260 | ||||||
City of Chicago, Board of Education, Unlimited Tax G.O. Rev. Ref. Bonds (Dedicated Rev.), Series 2017-C, 5.00% 2030 | 2,205 | 2,537 | ||||||
City of Chicago, Board of Education, Unlimited Tax G.O. Rev. Ref. Bonds (Dedicated Rev.), Series 2017-C, 5.00% 2034 | 490 | 556 | ||||||
City of Chicago, Board of Education, Unlimited Tax G.O. Rev. Ref. Bonds (Dedicated Rev.), Series 2017-D, 5.00% 2031 | 980 | 1,123 | ||||||
City of Chicago, Board of Education, Unlimited Tax G.O. Rev. Ref. Bonds (Dedicated Rev.), Series 2017-G, 5.00% 2044 | 1,350 | 1,514 | ||||||
City of Chicago, Board of Education, Unlimited Tax G.O. Rev. Ref. Bonds (Dedicated Rev.), Series 2017-H, 5.00% 2036 | 980 | 1,107 | ||||||
City of Chicago, Board of Education, Unlimited Tax G.O. Rev. Ref. Bonds (Dedicated Rev.), Series 2017-H, 5.00% 2046 | 2,770 | 3,090 | ||||||
City of Chicago, Board of Education, Unlimited Tax G.O. Rev. Ref. Bonds (Dedicated Rev.), Series 2018-A, Assured Guaranty Municipal insured, 5.00% 2026 | 730 | 836 | ||||||
City of Chicago, Board of Education, Unlimited Tax G.O. Rev. Ref. Bonds (Dedicated Rev.), Series 2018-A, Assured Guaranty Municipal insured, 5.00% 2028 | 855 | 1,079 | ||||||
City of Chicago, Board of Education, Unlimited Tax G.O. Rev. Ref. Bonds (Dedicated Rev.), Series 2018-A, Assured Guaranty Municipal insured, 5.00% 2029 | 430 | 536 | ||||||
City of Chicago, Board of Education, Unlimited Tax G.O. Rev. Ref. Bonds (Dedicated Rev.), Series 2018-A, Assured Guaranty Municipal insured, 5.00% 2029 | 245 | 286 | ||||||
City of Chicago, Board of Education, Unlimited Tax G.O. Rev. Ref. Bonds (Dedicated Rev.), Series 2018-A, Assured Guaranty Municipal insured, 5.00% 2030 | 245 | 304 | ||||||
City of Chicago, Board of Education, Unlimited Tax G.O. Rev. Ref. Bonds (Dedicated Rev.), Series 2018-A, Assured Guaranty Municipal insured, 5.00% 2030 | 245 | 286 | ||||||
City of Chicago, Board of Education, Unlimited Tax G.O. Rev. Ref. Bonds (Dedicated Rev.), Series 2018-A, Assured Guaranty Municipal insured, 5.00% 2031 | 490 | 605 | ||||||
City of Chicago, Board of Education, Unlimited Tax G.O. Rev. Ref. Bonds (Dedicated Rev.), Series 2018-A, Assured Guaranty Municipal insured, 5.00% 2032 | 490 | 602 | ||||||
City of Chicago, Board of Education, Unlimited Tax G.O. Rev. Ref. Bonds (Dedicated Rev.), Series 2018-A, Assured Guaranty Municipal insured, 5.00% 2033 | 245 | 300 | ||||||
City of Chicago, Board of Education, Unlimited Tax G.O. Rev. Ref. Bonds (Dedicated Rev.), Series 2018-A, Assured Guaranty Municipal insured, 5.00% 2034 | 280 | 323 | ||||||
City of Chicago, Board of Education, Unlimited Tax G.O. Rev. Ref. Bonds (Dedicated Rev.), Series 2018-C, Assured Guaranty Municipal insured, 5.00% 2028 | 1,090 | 1,378 | ||||||
City of Chicago, Board of Education, Unlimited Tax G.O. Rev. Ref. Bonds (Dedicated Rev.), Series 2018-C, Assured Guaranty Municipal insured, 5.00% 2029 | 730 | 914 | ||||||
City of Chicago, School Reform Board of Trustees of the Board of Education, Unlimited Tax G.O. Bonds (Dedicated Tax Rev.), Capital Appreciation Bonds, Series 1998-B-1, National insured, 0% 2031 | 490 | 351 | ||||||
City of Chicago, School Reform Board of Trustees of the Board of Education, Unlimited Tax G.O. Bonds (Dedicated Tax Rev.), Series 2011-A, 5.00% 2041 | 665 | 674 | ||||||
City of Chicago, School Reform Board of Trustees of the Board of Education, Unlimited Tax G.O. Bonds (Dedicated Tax Rev.), Series 2012-A, 5.00% 2042 | 1,875 | 1,923 | ||||||
G.O. Bonds, Pension Funding Series 2003, 4.95% 2023 | 22,553 | 23,112 | ||||||
G.O. Bonds, Pension Funding Series 2003, 5.10% 2033 | 107,310 | 115,570 | ||||||
G.O. Bonds, Series 2013-B, 4.11% 2022 | 750 | 761 | ||||||
G.O. Bonds, Series 2013-B, 4.31% 2023 | 2,125 | 2,175 | ||||||
176 American Funds Insurance Series
Table of Contents
Bond Fund (continued)
Bonds, notes & other debt instruments (continued)
Principal (000) | Value (000) | |||||||
Municipals (continued) | ||||||||
Illinois (continued) | ||||||||
G.O. Bonds, Taxable Build America Bonds, Series 2010-2, 5.85% 2022 | $ | 2,370 | $ | 2,449 | ||||
G.O. Bonds, Taxable Build America Bonds, Series 2010-2, 5.95% 2023 | 3,210 | 3,396 | ||||||
G.O. Bonds, Taxable Build America Bonds, Series 2010-5, 6.20% 2021 | 1,946 | 1,979 | ||||||
|
| |||||||
| 214,628 | ||||||||
|
| |||||||
Texas 0.04% | ||||||||
Grand Parkway Transportation Corp., Grand Parkway System Toll Rev. Ref. Bonds, Series 2020-B, 3.236% 2052 | 4,075 | 4,265 | ||||||
|
| |||||||
Total municipals | 226,267 | |||||||
|
| |||||||
Federal agency bonds & notes 0.11% | ||||||||
Fannie Mae 2.125% 2026 | 11,910 | 12,979 | ||||||
|
| |||||||
Total bonds, notes & other debt instruments (cost: $10,403,219,000) | 11,032,012 | |||||||
|
| |||||||
| Shares | ||||||||
Short-term securities 23.58% | ||||||||
Money market investments 23.58% | ||||||||
Capital Group Central Cash Fund 0.12%10,11 | 26,897,764 | 2,690,045 | ||||||
|
| |||||||
Total short-term securities (cost: $2,690,027,000) | 2,690,045 | |||||||
|
| |||||||
Total investment securities 120.29% (cost: $13,093,246,000) | 13,722,057 | |||||||
Other assets less liabilities (20.29)% | (2,314,638 | ) | ||||||
|
| |||||||
Net assets 100.00% | $ | 11,407,419 | ||||||
|
| |||||||
Futures contracts
Contracts | Type | Number of contracts | Expiration | Notional amount12 (000) | Value at 12/31/202013 (000) | Unrealized appreciation (depreciation) at 12/31/2020 (000) | ||||||||||||||||||
2 Year U.S. Treasury Note Futures | Long | 4,793 | April 2021 | $ | 958,600 | $ | 1,059,141 | $ | 791 | |||||||||||||||
5 Year Euro-Bobl Futures | Short | 1,321 | March 2021 | € | (132,100 | ) | (218,153 | ) | (211 | ) | ||||||||||||||
5 Year U.S. Treasury Note Futures | Long | 18,935 | April 2021 | $ | 1,893,500 | 2,388,916 | 5,023 | |||||||||||||||||
10 Year Euro-Bund Futures | Short | 468 | March 2021 | € | (46,800 | ) | (101,563 | ) | (438 | ) | ||||||||||||||
10 Year U.S. Treasury Note Futures | Short | 953 | March 2021 | $ | (95,300 | ) | (131,588 | ) | (140 | ) | ||||||||||||||
10 Year Ultra U.S. Treasury Note Futures | Short | 4,048 | March 2021 | (404,800 | ) | (632,943 | ) | 809 | ||||||||||||||||
30 Year Euro-Buxl Futures | Long | 245 | March 2021 | € | 24,500 | 67,415 | 1,008 | |||||||||||||||||
30 Year Ultra U.S. Treasury Bond Futures | Short | 84 | March 2021 | $ | (8,400 | ) | (17,939 | ) | (35 | ) | ||||||||||||||
|
| |||||||||||||||||||||||
| $ | 6,807 | |||||||||||||||||||||||
|
| |||||||||||||||||||||||
Forward currency contracts
| Contract amount | Unrealized (depreciation) appreciation | |||||||||||||
| Purchases (000) | Sales (000) | Counterparty | Settlement date | at 12/31/2020 | ||||||||||
| USD | 13,934 | JPY | 1,445,000 | UBS AG | 1/6/2021 | $ (62) | ||||||||
| USD | 55,331 | EUR | 46,000 | Bank of New York Mellon | 1/8/2021 | (877) | ||||||||
| USD | 37,932 | MXN | 755,000 | Morgan Stanley | 1/12/2021 | 46 | ||||||||
American Funds Insurance Series 177
Table of Contents
Bond Fund (continued)
Forward currency contracts (continued)
| Contract amount | Unrealized (depreciation) appreciation | |||||||||||||||
| Purchases (000) | Sales (000) | Counterparty | Settlement date | at 12/31/2020 (000) | ||||||||||||
| USD | 132,884 | EUR | 109,250 | HSBC Bank | 1/12/2021 | $ | (624 | ) | ||||||||
| USD | 102,847 | JPY | 10,730,000 | HSBC Bank | 1/14/2021 | (1,090 | ) | |||||||||
|
| |||||||||||||||
| $ | (2,607 | ) | ||||||||||||||
|
| |||||||||||||||
Swap contracts
Interest rate swaps
Receive | Pay | Expiration date | Notional (000) | Value at 12/31/2020 (000) | Upfront premium paid (000) | Unrealized (depreciation) appreciation at 12/31/2020 (000) | ||||||||||||||||
3-month USD-LIBOR | 2.18075% | 3/29/2024 | $ | 31,600 | $ | (1,973 | ) | $ | — | $ | (1,973 | ) | ||||||||||
3-month USD-LIBOR | 2.194% | 3/29/2024 | 31,900 | (2,005 | ) | — | (2,005 | ) | ||||||||||||||
3-month USD-LIBOR | 2.21875% | 3/29/2024 | 33,500 | (2,133 | ) | — | (2,133 | ) | ||||||||||||||
3-month USD-LIBOR | 2.3105% | 5/3/2024 | 275,590 | (18,844 | ) | — | (18,844 | ) | ||||||||||||||
6-month EURIBOR | 0.9852% | 10/17/2024 | € | 25,000 | (1,733 | ) | — | (1,733 | ) | |||||||||||||
U.S. EFFR | 0.10875% | 7/6/2025 | $ | 121,300 | 595 | — | 595 | |||||||||||||||
U.S. EFFR | 0.0995% | 7/9/2025 | 60,700 | 325 | — | 325 | ||||||||||||||||
U.S. EFFR | 0.105% | 7/9/2025 | 60,600 | 310 | — | 310 | ||||||||||||||||
U.S. EFFR | 0.099% | 7/10/2025 | 149,000 | 804 | — | 804 | ||||||||||||||||
6-month JPY-LIBOR | 0.0875% | 3/10/2026 | ¥ | 11,100,000 | (698 | ) | — | (698 | ) | |||||||||||||
6-month JPY-LIBOR | 0.58295% | 3/23/2046 | 2,000,000 | (1,131 | ) | — | (1,131 | ) | ||||||||||||||
0.64355% | 6-month JPY-LIBOR | 4/27/2046 | 2,000,000 | 1,422 | — | 1,422 | ||||||||||||||||
|
|
|
| |||||||||||||||||||
| $ | — | $ | (25,061 | ) | ||||||||||||||||||
|
|
|
| |||||||||||||||||||
Investments in affiliates11
| Value of affiliate at 1/1/2020 (000) | Additions (000) | Reductions (000) | Net realized gain (000) | Net unrealized depreciation (000) | Value of affiliate at 12/31/2020 (000) | Dividend income (000) | ||||||||||||||||||||||
Short-term securities 23.58% | ||||||||||||||||||||||||||||
Money market investments 23.58% | ||||||||||||||||||||||||||||
Capital Group Central Cash Fund 0.12%10 | $ | 602,451 | $ | 5,522,355 | $ | 3,435,554 | $ | 885 | $ | (92 | ) | $ | 2,690,045 | $ | 5,601 | |||||||||||||
| 1 | Step bond; coupon rate may change at a later date. |
| 2 | Acquired in a transaction exempt from registration under Rule 144A of the Securities Act of 1933. May be resold in the U.S. in transactions exempt from registration, normally to qualified institutional buyers. The total value of all such securities was $1,081,328,000, which represented 9.48% of the net assets of the fund. |
| 3 | Payment in kind; the issuer has the option of paying additional securities in lieu of cash. Most recent payment was 100% cash unless otherwise noted. |
| 4 | Coupon rate may change periodically. Reference rate and spread are as of the most recent information available. Some coupon rates are determined by the issuer or agent based on current market conditions; therefore, the reference rate and spread are not available. |
| 5 | Principal payments may be made periodically. Therefore, the effective maturity date may be earlier than the stated maturity date. |
| 6 | Amount less than one thousand. |
| 7 | Purchased on a TBA basis. |
| 8 | All or a portion of this security was pledged as collateral. The total value of pledged collateral was $28,008,000, which represented .25% of the net assets of the fund. |
| 9 | Index-linked bond whose principal amount moves with a government price index. |
| 10 | Rate represents the seven-day yield at 12/31/2020. |
| 11 | Part of the same group of investment companies as the fund as defined under the Investment Company Act of 1940. |
| 12 | Notional amount is calculated based on the number of contracts and notional contract size. |
| 13 | Value is calculated based on the notional amount and current market price. |
178 American Funds Insurance Series
Table of Contents
Bond Fund (continued)
Key to abbreviations and symbols
CLO = Collateralized Loan Obligations
EFFR = Effective Federal Funds Rate
EUR/€ = Euros
EURIBOR = Euro Interbank Offered Rate
G.O. = General Obligation
ICE = Intercontinental Exchange, Inc.
JPY/¥ = Japanese yen
LIBOR = London Interbank Offered Rate
MXN = Mexican pesos
Ref. = Refunding
Rev. = Revenue
SOFR = Secured Overnight Financing Rate
TBA = To-be-announced
USD/$ = U.S. dollars
See notes to financial statements.
American Funds Insurance Series 179
Table of Contents
CapitalWorld Bond Fund (formerly Global Bond Fund)
Investment portfolio December 31, 2020
Bonds, notes & other debt instruments 93.64%
Principal amount | Value (000) | |||||||
Euros 17.23% | ||||||||
Allianz SE 4.75% 2049 (3-month EUR-EURIBOR + 3.60% on 10/24/2023)1 | € | 4,200 | $ | 5,748 | ||||
Altria Group, Inc. 1.00% 2023 | 1,020 | 1,272 | ||||||
Altria Group, Inc. 1.70% 2025 | 1,600 | 2,071 | ||||||
Altria Group, Inc. 2.20% 2027 | 2,900 | 3,870 | ||||||
American Honda Finance Corp. 1.60% 2022 | 620 | 775 | ||||||
American Honda Finance Corp. 1.95% 2024 | 560 | 736 | ||||||
AT&T Inc. 1.60% 2028 | 2,350 | 3,136 | ||||||
Bank of America Corp. 3.648% 2029 (3-month EUR-EURIBOR + 3.67% on 3/31/2028)1,2 | 5,000 | 7,602 | ||||||
Barclays Bank PLC 6.00% 2021 | 1,000 | 1,223 | ||||||
Barclays Bank PLC 6.625% 2022 | 1,070 | 1,416 | ||||||
CaixaBank, SA 3.50% 2027 (5-year EUR Mid-Swap + 3.35% on 2/15/2022)1 | 1,500 | 1,890 | ||||||
CaixaBank, SA 2.25% 2030 (EUR Annual (vs. 6-month EUR-EURIBOR) 5-year + 1.68% on 4/17/2025)1 | 2,400 | 3,071 | ||||||
Comcast Corp. 0.25% 2027 | 1,250 | 1,552 | ||||||
Cote d’Ivoire (Republic of) 5.25% 2030 | 900 | 1,182 | ||||||
Cote d’Ivoire (Republic of) 5.875% 2031 | 840 | 1,137 | ||||||
Deutsche Telekom International Finance BV 7.50% 2033 | 200 | 446 | ||||||
Dow Chemical Co. 0.50% 2027 | 1,110 | 1,371 | ||||||
Dow Chemical Co. 1.125% 2032 | 1,010 | 1,284 | ||||||
Egypt (Arab Republic of) 5.625% 2030 | 745 | 954 | ||||||
European Financial Stability Facility 0.40% 2025 | 6,000 | 7,637 | ||||||
European Union 0% 2035 | 220 | 276 | ||||||
French Republic O.A.T. 0% 2030 | 17,930 | 22,663 | ||||||
Germany (Federal Republic of) 0.50% 2027 | 2,510 | 3,319 | ||||||
Germany (Federal Republic of) 0% 2030 | 21,090 | 27,221 | ||||||
Germany (Federal Republic of) 0% 2050 | 3,540 | 4,540 | ||||||
Goldman Sachs Group, Inc. 3.375% 20252 | 5,000 | 6,961 | ||||||
Greece (Hellenic Republic of) 3.375% 2025 | 21,435 | 29,726 | ||||||
Greece (Hellenic Republic of) 3.75% 2028 | 4,964 | 7,468 | ||||||
Greece (Hellenic Republic of) 3.875% 2029 | 6,884 | 10,666 | ||||||
Greece (Hellenic Republic of) 1.50% 2030 | 5,160 | 6,812 | ||||||
Groupe BPCE SA 4.625% 2023 | 1,200 | 1,637 | ||||||
Groupe BPCE SA 1.00% 2025 | 2,900 | 3,687 | ||||||
Honeywell International Inc. 0.75% 2032 | 370 | 471 | ||||||
Intesa Sanpaolo SpA 6.625% 2023 | 510 | 712 | ||||||
Ireland (Republic of) 0.20% 2030 | 900 | 1,155 | ||||||
Israel (State of) 2.875% 2024 | 1,180 | 1,577 | ||||||
Israel (State of) 1.50% 2027 | 775 | 1,031 | ||||||
Israel (State of) 1.50% 2029 | 725 | 982 | ||||||
Italy (Republic of) 0.10% 20233 | 8,578 | 10,711 | ||||||
Italy (Republic of) 1.85% 2025 | 21,390 | 28,444 | ||||||
Italy (Republic of) 0.95% 2027 | 7,270 | 9,326 | ||||||
Italy (Republic of) 2.80% 2028 | 5,828 | 8,505 | ||||||
Italy (Republic of) 1.35% 2030 | 1,657 | 2,192 | ||||||
Italy (Republic of) 1.65% 2030 | 7,400 | 10,033 | ||||||
JPMorgan Chase & Co. 0.389% 2028 (3-month EUR-EURIBOR + 0.65% on 2/24/2027)1,2 | 3,208 | 3,988 | ||||||
Lloyds Banking Group PLC 1.75% 2028 (5-year EUR-EURIBOR + 1.30% on 9/7/2023)1 | 2,400 | 3,020 | ||||||
Morocco (Kingdom of) 3.50% 2024 | 1,400 | 1,867 | ||||||
Morocco (Kingdom of) 1.375% 2026 | 1,130 | 1,394 | ||||||
Morocco (Kingdom of) 2.00% 2030 | 1,285 | 1,595 | ||||||
Morocco (Kingdom of) 1.50% 2031 | 4,100 | 4,895 | ||||||
Morocco (Kingdom of) 1.50% 2031 | 1,700 | 2,030 | ||||||
Netherlands (Kingdom of the) 0% 2027 | 10,320 | 13,104 | ||||||
Philippines (Republic of) 0.70% 2029 | 940 | 1,156 | ||||||
Portuguese Republic 0.475% 2030 | 1,610 | 2,053 | ||||||
Rabobank Nederland 2.50% 2026 (5-year EUR Mid-Swap + 1.40% on 5/26/2021)1 | 2,400 | 2,962 | ||||||
Rolls-Royce PLC 4.625% 2026 | 100 | 133 | ||||||
Romania 3.624% 2030 | 6,530 | 9,538 | ||||||
Romania 2.00% 2032 | 2,665 | 3,424 | ||||||
Romania 3.50% 2034 | 835 | 1,217 | ||||||
Romania 3.875% 2035 | 2,810 | 4,213 | ||||||
Romania 3.375% 2038 | 4,170 | 5,877 | ||||||
180 American Funds Insurance Series
Table of Contents
CapitalWorld Bond Fund (formerly Global Bond Fund) (continued)
Bonds, notes & other debt instruments (continued)
Principal amount (000) | Value (000) | |||||||
Euros (continued) | ||||||||
Romania 4.625% 2049 | € | 5,795 | $ | 9,586 | ||||
Russian Federation 2.875% 2025 | 4,500 | 6,082 | ||||||
Serbia (Republic of) 3.125% 2027 | 15,747 | 21,665 | ||||||
Serbia (Republic of) 1.50% 2029 | 4,943 | 6,260 | ||||||
Spain (Kingdom of) 0.80% 2027 | 2,280 | 2,983 | ||||||
Spain (Kingdom of) 1.45% 2029 | 1,890 | 2,610 | ||||||
Spain (Kingdom of) 1.25% 2030 | 13,840 | 18,906 | ||||||
Spain (Kingdom of) 2.70% 2048 | 850 | 1,528 | ||||||
State Grid Europe Development (2014) PLC 1.50% 2022 | 194 | 241 | ||||||
State Grid Overseas Investment Ltd. 1.25% 2022 | 765 | 948 | ||||||
State Grid Overseas Investment Ltd. 1.375% 2025 | 441 | 562 | ||||||
State Grid Overseas Investment Ltd. 2.125% 2030 | 200 | 273 | ||||||
Stryker Corp. 0.25% 2024 | 480 | 594 | ||||||
Stryker Corp. 0.75% 2029 | 980 | 1,246 | ||||||
Stryker Corp. 1.00% 2031 | 450 | 576 | ||||||
Takeda Pharmaceutical Company, Ltd. 2.25% 2026 | 2,275 | 3,128 | ||||||
Tunisia (Republic of) 6.75% 2023 | 1,250 | 1,460 | ||||||
Tunisia (Republic of) 6.375% 2026 | 3,800 | 4,273 | ||||||
Ukraine 6.75% 2026 | 4,344 | 5,862 | ||||||
Ukraine 4.375% 2030 | 2,705 | 3,169 | ||||||
|
| |||||||
| 402,906 | ||||||||
|
| |||||||
Japanese yen 9.28% | ||||||||
Export-Import Bank of India 0.59% 2022 | ¥ | 400,000 | 3,860 | |||||
Goldman Sachs Group, Inc. 1.00% 20212 | 28,000 | 272 | ||||||
Goldman Sachs Group, Inc. 2.80% 20222 | 100,000 | 996 | ||||||
Groupe BPCE SA 0.64% 2022 | 400,000 | 3,886 | ||||||
Indonesia (Republic of) 0.67% 2021 | 200,000 | 1,937 | ||||||
Indonesia (Republic of) 0.54% 2022 | 100,000 | 967 | ||||||
Intesa Sanpaolo SpA 1.36% 2022 | 600,000 | 5,851 | ||||||
Japan, Series 19, 0.10% 20243 | 1,839,110 | 17,847 | ||||||
Japan, Series 18, 0.10% 20243 | 1,021,233 | 9,910 | ||||||
Japan, Series 20, 0.10% 20253 | 678,710 | 6,586 | ||||||
Japan, Series 21, 0.10% 20263 | 986,778 | 9,595 | ||||||
Japan, Series 346, 0.10% 2027 | 875,700 | 8,587 | ||||||
Japan, Series 23, 0.10% 20283 | 1,988,280 | 19,316 | ||||||
Japan, Series 356, 0.10% 2029 | 3,529,000 | 34,576 | ||||||
Japan, Series 24, 0.10% 20293 | 1,604,510 | 15,619 | ||||||
Japan, Series 116, 2.20% 2030 | 576,100 | 6,715 | ||||||
Japan, Series 145, 1.70% 2033 | 2,210,000 | 25,534 | ||||||
Japan, Series 152, 1.20% 2035 | 966,000 | 10,656 | ||||||
Japan, Series 21, 2.30% 2035 | 720,000 | 9,085 | ||||||
Japan, Series 173, 0.40% 2040 | 492,000 | 4,773 | ||||||
Japan, Series 42, 1.70% 2044 | 641,900 | 7,888 | ||||||
Japan, Series 59, 0.70% 2048 | 260,500 | 2,597 | ||||||
Japan, Series 12, 0.50% 2059 | 138,850 | 1,266 | ||||||
KT Corp. 0.38% 2021 | 200,000 | 1,938 | ||||||
United Mexican States 0.70% 2021 | 600,000 | 5,810 | ||||||
United Mexican States 0.62% 2022 | 100,000 | 965 | ||||||
|
| |||||||
| 217,032 | ||||||||
|
| |||||||
Chinese yuan renminbi 6.03% | ||||||||
Agricultural Development Bank of China 3.75% 2029 | CNY | 9,850 | 1,518 | |||||
Agricultural Development Bank of China 2.96% 2030 | 90,980 | 13,176 | ||||||
China (People’s Republic of), Series 1916, 3.12% 2026 | 50,200 | 7,677 | ||||||
China (People’s Republic of), Series 1906, 3.29% 2029 | 73,800 | 11,343 | ||||||
China (People’s Republic of), Series 1910, 3.86% 2049 | 259,860 | 40,357 | ||||||
China Development Bank Corp., Series 1814, 4.15% 2025 | 20,900 | 3,325 | ||||||
China Development Bank Corp., Series 1909, 3.50% 2026 | 10,400 | 1,599 | ||||||
China Development Bank Corp., Series 2004, 3.43% 2027 | 150,100 | 22,961 | ||||||
American Funds Insurance Series 181
Table of Contents
CapitalWorld Bond Fund (formerly Global Bond Fund) (continued)
Bonds, notes & other debt instruments (continued)
Principal amount (000) | Value (000) | |||||||
Chinese yuan renminbi (continued) | ||||||||
China Development Bank Corp., Series 1805, 4.04% 2028 | CNY | 51,800 | $ | 8,174 | ||||
China Development Bank Corp., Series 1905, 3.48% 2029 | 128,200 | 19,425 | ||||||
China Development Bank Corp., Series 2005, 3.07% 2030 | 78,250 | 11,451 | ||||||
|
| |||||||
| 141,006 | ||||||||
|
| |||||||
British pounds 3.90% | ||||||||
American Honda Finance Corp. 0.75% 2026 | £ | 1,420 | 1,952 | |||||
France Télécom 5.375% 2050 | 300 | 741 | ||||||
Lloyds Banking Group PLC 7.625% 2025 | 655 | 1,138 | ||||||
Rolls-Royce PLC 5.75% 2027 | 200 | 304 | ||||||
United Kingdom 2.75% 2024 | 1,210 | 1,828 | ||||||
United Kingdom 1.25% 2027 | 570 | 842 | ||||||
United Kingdom 4.25% 2027 | 2,800 | 4,954 | ||||||
United Kingdom 1.625% 2028 | 2,215 | 3,400 | ||||||
United Kingdom 0.375% 2030 | 4,970 | 6,905 | ||||||
United Kingdom 4.75% 2030 | 14,360 | 28,430 | ||||||
United Kingdom 4.25% 2032 | 3,414 | 6,742 | ||||||
United Kingdom 4.50% 2034 | 2,210 | 4,672 | ||||||
United Kingdom 0.625% 2035 | 8,262 | 11,473 | ||||||
United Kingdom 3.25% 2044 | 4,440 | 9,347 | ||||||
United Kingdom 0.625% 2050 | 6,330 | 8,387 | ||||||
|
| |||||||
| 91,115 | ||||||||
|
| |||||||
Danish kroner 2.55% | ||||||||
Nordea Kredit 0.50% 20404 | DKr | 19,969 | 3,295 | |||||
Nykredit Realkredit AS, Series 01E, 1.50% 20374 | 27,851 | 4,768 | ||||||
Nykredit Realkredit AS, Series 01E, 2.00% 20374 | 8,278 | 1,423 | ||||||
Nykredit Realkredit AS, Series 01E, 0.50% 20404 | 210,985 | 34,839 | ||||||
Nykredit Realkredit AS, Series 01E, 1.50% 20404 | 87,271 | 14,876 | ||||||
Nykredit Realkredit AS, Series 01E, 2.50% 20474 | 2,934 | 509 | ||||||
|
| |||||||
| 59,710 | ||||||||
|
| |||||||
Canadian dollars 2.06% | ||||||||
Canada 1.00% 2022 | C$ | 1,050 | 837 | |||||
Canada 2.25% 2025 | 15,900 | 13,528 | ||||||
Canada 2.25% 2029 | 26,105 | 23,312 | ||||||
Canada 2.75% 2048 | 3,500 | 3,774 | ||||||
Quebec (Province of) 1.90% 2030 | 8,200 | 6,807 | ||||||
|
| |||||||
| 48,258 | ||||||||
|
| |||||||
Mexican pesos 2.00% | ||||||||
Petróleos Mexicanos 7.19% 2024 | MXN | 27,473 | 1,252 | |||||
Petróleos Mexicanos 7.47% 2026 | 95,267 | 3,999 | ||||||
United Mexican States, Series M20, 10.00% 2024 | 54,000 | 3,248 | ||||||
United Mexican States, Series M, 7.50% 2027 | 341,420 | 19,539 | ||||||
United Mexican States, Series M20, 8.50% 2029 | 140,400 | 8,607 | ||||||
United Mexican States, Series M30, 8.50% 2038 | 21,100 | 1,316 | ||||||
United Mexican States, Series M, 8.00% 2047 | 147,500 | 8,755 | ||||||
|
| |||||||
| 46,716 | ||||||||
|
| |||||||
Malaysian ringgits 1.79% | ||||||||
Malaysia (Federation of), Series 0417, 3.899% 2027 | MYR | 19,152 | 5,226 | |||||
Malaysia (Federation of), Series 0310, 4.498% 2030 | 8,420 | 2,406 | ||||||
Malaysia (Federation of), Series 0418, 4.893% 2038 | 60,780 | 17,838 | ||||||
Malaysia (Federation of), Series 0219, 4.467% 2039 | 9,167 | 2,569 | ||||||
Malaysia (Federation of), Series 0519, 3.757% 2040 | 40,283 | 10,526 | ||||||
Malaysia (Federation of), Series 0216, 4.736% 2046 | 7,559 | 2,149 | ||||||
Malaysia (Federation of), Series 0518, 4.921% 2048 | 2,773 | 815 | ||||||
Malaysia (Federation of), Series 0519, 4.638% 2049 | 560 | 157 | ||||||
Malaysia (Federation of), Series 0120, 4.065% 2050 | 1,110 | 287 | ||||||
|
| |||||||
| 41,973 | ||||||||
|
| |||||||
182 American Funds Insurance Series
Table of Contents
CapitalWorld Bond Fund (formerly Global Bond Fund) (continued)
Bonds, notes & other debt instruments (continued)
Principal amount (000) | Value (000) | |||||||
Australian dollars 1.34% | ||||||||
Australia (Commonwealth of), Series 152, 2.75% 2028 | A$ | 3,690 | $ | 3,284 | ||||
Australia (Commonwealth of), Series 163, 1.00% 2031 | 32,100 | 24,628 | ||||||
Australia (Commonwealth of), Series 162, 1.75% 2051 | 4,620 | 3,393 | ||||||
|
| |||||||
| 31,305 | ||||||||
|
| |||||||
Russian rubles 1.16% | ||||||||
Russian Federation 7.00% 2023 | RUB | 430,300 | 6,137 | |||||
Russian Federation 6.90% 2029 | 403,750 | 5,871 | ||||||
Russian Federation 7.65% 2030 | 485,000 | 7,408 | ||||||
Russian Federation 8.50% 2031 | 82,440 | 1,339 | ||||||
Russian Federation 7.70% 2033 | 295,840 | 4,509 | ||||||
Russian Federation 7.25% 2034 | 121,920 | 1,795 | ||||||
|
| |||||||
| 27,059 | ||||||||
|
| |||||||
Israeli shekels 1.09% | ||||||||
Israel (State of) 2.00% 2027 | ILS | 42,900 | 14,658 | |||||
Israel (State of) 5.50% 2042 | 20,200 | 10,768 | ||||||
|
| |||||||
| 25,426 | ||||||||
|
| |||||||
South Korean won 0.89% | ||||||||
South Korea (Republic of), Series 2503, 1.50% 2025 | KRW | 13,411,000 | 12,465 | |||||
South Korea (Republic of), Series 2712, 2.375% 2027 | 8,658,930 | 8,427 | ||||||
|
| |||||||
| 20,892 | ||||||||
|
| |||||||
Indonesian rupiah 0.67% | ||||||||
Indonesia (Republic of), Series 84, 7.25% 2026 | IDR | 22,733,000 | 1,751 | |||||
Indonesia (Republic of), Series 56, 8.375% 2026 | 6,725,000 | 549 | ||||||
Indonesia (Republic of), Series 59, 7.00% 2027 | 11,000,000 | 845 | ||||||
Indonesia (Republic of), Series 78, 8.25% 2029 | 30,605,000 | 2,514 | ||||||
Indonesia (Republic of), Series 82, 7.00% 2030 | 59,605,000 | 4,601 | ||||||
Indonesia (Republic of), Series 87, 6.50% 2031 | 17,649,000 | 1,316 | ||||||
Indonesia (Republic of), Series 74, 7.50% 2032 | 7,073,000 | 549 | ||||||
Indonesia (Republic of), Series 65, 6.625% 2033 | 17,683,000 | 1,295 | ||||||
Indonesia (Republic of), Series 68, 8.375% 2034 | 27,353,000 | 2,274 | ||||||
|
| |||||||
| 15,694 | ||||||||
|
| |||||||
Colombian pesos 0.64% | ||||||||
Colombia (Republic of) 5.75% 2027 | COP | 16,661,900 | 5,171 | |||||
Colombia (Republic of) 7.25% 2050 | 31,167,000 | 9,836 | ||||||
|
| |||||||
| 15,007 | ||||||||
|
| |||||||
Brazilian reais 0.47% | ||||||||
Brazil (Federative Republic of) 6.00% 20243 | BRL | 34,215 | 7,606 | |||||
Brazil (Federative Republic of) 10.00% 2027 | 15,000 | 3,417 | ||||||
|
| |||||||
| 11,023 | ||||||||
|
| |||||||
New Zealand dollars 0.41% | ||||||||
New Zealand 1.75% 2041 | NZ$ | 13,580 | 9,638 | |||||
|
| |||||||
Thai baht 0.40% | ||||||||
Thailand (Kingdom of) 2.125% 2026 | THB | 257,750 | 9,308 | |||||
|
| |||||||
Chilean pesos 0.36% | ||||||||
Chile (Republic of) 4.50% 2026 | CLP | 5,205,000 | 8,404 | |||||
|
| |||||||
South African rand 0.34% | ||||||||
South Africa (Republic of), Series R-2048, 8.75% 2048 | ZAR | 140,650 | 7,886 | |||||
|
| |||||||
American Funds Insurance Series 183
Table of Contents
CapitalWorld Bond Fund (formerly Global Bond Fund) (continued)
Bonds, notes & other debt instruments (continued)
Principal amount (000) | Value (000) | |||||||
Ukrainian hryvnia 0.31% | ||||||||
Ukraine 16.06% 2022 | UAH | 86,536 | $ | 3,268 | ||||
Ukraine 17.00% 2022 | 60,180 | 2,279 | ||||||
Ukraine 17.25% 2022 | 47,384 | 1,775 | ||||||
|
| |||||||
| 7,322 | ||||||||
|
| |||||||
Singapore dollars 0.27% | ||||||||
Singapore (Republic of) 2.625% 2028 | S$ | 3,307 | 2,834 | |||||
Singapore (Republic of) 2.875% 2029 | 1,906 | 1,688 | ||||||
Singapore (Republic of) 2.875% 2030 | 2,037 | 1,832 | ||||||
|
| |||||||
| 6,354 | ||||||||
|
| |||||||
Norwegian kroner 0.26% | ||||||||
Norway (Kingdom of) 1.75% 2025 | NKr | 48,880 | 5,980 | |||||
|
| |||||||
Peruvian nuevos soles 0.24% | ||||||||
Peru (Republic of) 6.15% 2032 | PEN | 16,770 | 5,639 | |||||
|
| |||||||
Indian rupees 0.16% | ||||||||
National Highways Authority of India 7.17% 2021 | INR | 220,000 | 3,112 | |||||
National Highways Authority of India 7.27% 2022 | 50,000 | 717 | ||||||
|
| |||||||
| 3,829 | ||||||||
|
| |||||||
Dominican pesos 0.13% | ||||||||
Dominican Republic 9.75% 2026 | DOP | 158,600 | 2,938 | |||||
|
| |||||||
Polish zloty 0.06% | ||||||||
Poland (Republic of), Series 1029, 2.75% 2029 | PLN | 4,900 | 1,500 | |||||
|
| |||||||
Romanian leu 0.06% | ||||||||
Romania 4.75% 2025 | RON | 5,000 | 1,361 | |||||
|
| |||||||
U.S. dollars 39.54% | ||||||||
99 Escrow Issuer, Inc. 7.50% 20262 | $ | 70 | 70 | |||||
Abbott Laboratories 3.40% 2023 | 137 | 149 | ||||||
Abbott Laboratories 3.75% 2026 | 793 | 929 | ||||||
AbbVie Inc. 2.90% 2022 | 1,170 | 1,224 | ||||||
AbbVie Inc. 3.20% 2022 | 200 | 209 | ||||||
Abu Dhabi (Emirate of) 0.75% 20232 | 5,460 | 5,477 | ||||||
Abu Dhabi (Emirate of) 2.50% 20252 | 2,195 | 2,349 | ||||||
ACE INA Holdings Inc. 2.875% 2022 | 195 | 203 | ||||||
ACE INA Holdings Inc. 3.35% 2026 | 195 | 220 | ||||||
ACE INA Holdings Inc. 4.35% 2045 | 425 | 576 | ||||||
Adobe Inc. 2.15% 2027 | 1,062 | 1,140 | ||||||
Advisor Group Holdings, LLC 6.25% 20282 | 425 | 431 | ||||||
Aetna Inc. 2.80% 2023 | 340 | 358 | ||||||
Affinity Gaming 6.875% 20272 | 205 | 215 | ||||||
AG Merger Sub II, Inc. 10.75% 20272 | 311 | 345 | ||||||
Albertsons Companies, Inc. 3.50% 20292 | 65 | 66 | ||||||
Alexandria Real Estate Equities, Inc. 1.875% 2033 | 2,047 | 2,048 | ||||||
Alliant Holdings Intermediate, LLC 6.75% 20272 | 410 | 439 | ||||||
Allied Universal Holdco LLC 9.75% 20272 | 200 | 218 | ||||||
Allison Transmission Holdings, Inc. 3.75% 20312 | 100 | 102 | ||||||
Allstate Corp. 0.75% 2025 | 1,563 | 1,572 | ||||||
Almonde Inc., Term Loan, (3-month USD-LIBOR + 7.25%) 8.25% 20255,6 | 650 | 654 | ||||||
Altice NV 7.50% 20262 | 50 | 53 | ||||||
Altria Group, Inc. 5.95% 2049 | 131 | 184 | ||||||
184 American Funds Insurance Series
Table of Contents
CapitalWorld Bond Fund (formerly Global Bond Fund) (continued)
Bonds, notes & other debt instruments (continued)
Principal (000) | Value (000) | |||||||
U.S. dollars (continued) | ||||||||
Amazon.com, Inc. 1.50% 2030 | $ | 2,040 | $ | 2,073 | ||||
Amazon.com, Inc. 2.50% 2050 | 2,500 | 2,594 | ||||||
American Campus Communities, Inc. 3.75% 2023 | 1,810 | 1,914 | ||||||
American Campus Communities, Inc. 4.125% 2024 | 1,195 | 1,305 | ||||||
American Campus Communities, Inc. 3.875% 2031 | 514 | 583 | ||||||
American Electric Power Company, Inc. 1.00% 2025 | 250 | 253 | ||||||
American Energy-Permian Basin, LLC / AEPB Finance Corp. 12.00% 20242,7 | 355 | 3 | ||||||
American Honda Finance Corp. 1.20% 2025 | 3,202 | 3,278 | ||||||
Amgen Inc. 1.90% 2025 | 580 | 611 | ||||||
Amgen Inc. 2.20% 2027 | 445 | 477 | ||||||
Amipeace Ltd. 2.50% 2024 | 4,100 | 4,275 | ||||||
Anglo American Capital PLC 3.95% 20502 | 521 | 586 | ||||||
Angola (Republic of) 9.50% 2025 | 2,400 | 2,500 | ||||||
Angola (Republic of) 8.25% 2028 | 2,200 | 2,116 | ||||||
Anheuser-Busch Co. / InBev Worldwide 4.70% 2036 | 1,780 | 2,260 | ||||||
Anheuser-Busch InBev NV 4.15% 2025 | 2,230 | 2,540 | ||||||
Anheuser-Busch InBev NV 4.00% 2028 | 1,050 | 1,238 | ||||||
Anheuser-Busch InBev NV 4.75% 2029 | 2,535 | 3,128 | ||||||
Anheuser-Busch InBev NV 4.50% 2050 | 2,250 | 2,836 | ||||||
Apache Corp. 4.625% 2025 | 100 | 105 | ||||||
Apache Corp. 4.875% 2027 | 305 | 324 | ||||||
Apache Corp. 4.375% 2028 | 171 | 178 | ||||||
Apache Corp. 5.10% 2040 | 100 | 107 | ||||||
Apple Inc. 3.35% 2027 | 1,075 | 1,227 | ||||||
Apple Inc. 2.40% 2050 | 1,100 | 1,128 | ||||||
Ardagh Group SA 6.50% 20272,8 | 210 | 224 | ||||||
Argentine Republic 1.00% 2029 | 427 | 185 | ||||||
Argentine Republic 0.125% 2030 (0.50% on 7/9/2021)1 | 4,221 | 1,718 | ||||||
Argentine Republic 0.125% 2035 (1.125% on 7/9/2021)1 | 3,025 | 1,110 | ||||||
Ascent Resources - Utica LLC 8.25% 20282 | 230 | 230 | ||||||
Associated Materials, LLC 9.00% 20252 | 400 | 425 | ||||||
AssuredPartners, Inc. 7.00% 20252 | 200 | 208 | ||||||
AssuredPartners, Inc. 5.625% 20292 | 230 | 240 | ||||||
AstraZeneca PLC 3.50% 2023 | 2,700 | 2,911 | ||||||
AT&T Inc. 1.65% 2028 | 1,575 | 1,608 | ||||||
AT&T Inc. 2.55% 20332 | 4,414 | 4,549 | ||||||
AT&T Inc. 3.30% 2052 | 2,080 | 2,062 | ||||||
ATS Automation Tooling Systems Inc. 4.125% 20282 | 230 | 235 | ||||||
Austin BidCo Inc. 7.125% 20282 | 120 | 125 | ||||||
Austin BidCo Inc., Term Loan B, (3-month USD-LIBOR + 4.50%) 4.732% 20275,6 | 25 | 25 | ||||||
Autoridad del Canal de Panama 4.95% 20352 | 1,000 | 1,267 | ||||||
Avis Budget Car Rental, LLC 5.75% 20272 | 220 | 225 | ||||||
Avis Budget Group, Inc. 5.25% 20252 | 350 | 352 | ||||||
Avis Budget Group, Inc. 10.50% 20252 | 202 | 239 | ||||||
Axiata SPV2 Bhd. 2.163% 2030 | 651 | 659 | ||||||
B&G Foods, Inc. 5.25% 2025 | 100 | 103 | ||||||
B&G Foods, Inc. 5.25% 2027 | 210 | 223 | ||||||
Baidu Inc. 3.425% 2030 | 675 | 748 | ||||||
Baker Hughes, a GE Co. 4.486% 2030 | 68 | 82 | ||||||
Banff Merger Sub Inc. 9.75% 20262 | 210 | 227 | ||||||
Bank of America Corp. 2.456% 2025 (3-month USD-LIBOR + 0.87% on 10/22/2024)1 | 847 | 903 | ||||||
Bank of America Corp. 1.197% 2026 (USD-SOFR + 1.01% on 10/24/2025)1 | 7,710 | 7,815 | ||||||
Bausch Health Companies Inc. 9.25% 20262 | 795 | 887 | ||||||
Bausch Health Companies Inc. 5.00% 20282 | 315 | 325 | ||||||
Bausch Health Companies Inc. 5.00% 20292 | 225 | 232 | ||||||
Bausch Health Companies Inc. 5.25% 20312 | 85 | 89 | ||||||
Bayer AG 3.375% 20242 | 840 | 918 | ||||||
Bayer US Finance II LLC 3.875% 20232 | 900 | 981 | ||||||
Bayer US Finance II LLC 4.25% 20252 | 203 | 232 | ||||||
Bayerische Motoren Werke AG 2.95% 20222 | 3,675 | 3,801 | ||||||
Bayerische Motoren Werke AG 3.15% 20242 | 5,000 | 5,393 | ||||||
Bayerische Motoren Werke AG 3.90% 20252 | 900 | 1,014 | ||||||
American Funds Insurance Series 185
Table of Contents
CapitalWorld Bond Fund (formerly Global Bond Fund) (continued)
Bonds, notes & other debt instruments (continued)
Principal (000) | Value (000) | |||||||
U.S. dollars (continued) | ||||||||
Bayerische Motoren Werke AG 4.15% 20302 | $ | 900 | $ | 1,089 | ||||
Becton, Dickinson and Company 3.70% 2027 | 933 | 1,071 | ||||||
Becton, Dickinson and Company 2.823% 2030 | 3,312 | 3,643 | ||||||
Berkshire Hathaway Energy Company 2.85% 20512 | 300 | 309 | ||||||
Bermuda 2.375% 20302 | 760 | 799 | ||||||
Black Knight Inc. 3.625% 20282 | 335 | 343 | ||||||
Blue Racer Midstream LLC and Blue Racer Finance Corp. 7.625% 20252 | 225 | 240 | ||||||
BMC Software, Inc. 7.125% 20252 | 70 | 76 | ||||||
BMC Software, Inc. 9.125% 20262 | 150 | 162 | ||||||
Boeing Company 5.15% 2030 | 4,000 | 4,848 | ||||||
Bombardier Inc. 8.75% 20212 | 50 | 52 | ||||||
Bombardier Inc. 5.75% 20222 | 100 | 102 | ||||||
Bombardier Inc. 6.125% 20232 | 245 | 240 | ||||||
Bombardier Inc. 7.50% 20242 | 10 | 10 | ||||||
Bombardier Inc. 7.875% 20272 | 125 | 115 | ||||||
Boyd Gaming Corp. 4.75% 2027 | 220 | 229 | ||||||
BP Capital Markets America Inc. 2.939% 2051 | 2,280 | 2,328 | ||||||
Brandywine Operating Partnership, LP 3.95% 2023 | 190 | 198 | ||||||
Brasil Foods SA 5.75% 20502 | 220 | 245 | ||||||
Braskem SA 4.50% 20302 | 745 | 766 | ||||||
Brightstar Escrow Corp. 9.75% 20252 | 180 | 193 | ||||||
British Airways, Series 2020-1, Class B, 8.375% 20282 | 100 | 111 | ||||||
British Airways, Series 2020-1, Class A, 4.25% 20322 | 100 | 107 | ||||||
British American Tobacco PLC 2.789% 2024 | 1,150 | 1,230 | ||||||
British American Tobacco PLC 3.215% 2026 | 955 | 1,053 | ||||||
British American Tobacco PLC 3.557% 2027 | 1,545 | 1,721 | ||||||
British American Tobacco PLC 3.462% 2029 | 1,150 | 1,256 | ||||||
British American Tobacco PLC 4.758% 2049 | 894 | 1,038 | ||||||
Broadcom Inc. 3.15% 2025 | 910 | 994 | ||||||
Broadcom Inc. 4.15% 2030 | 1,450 | 1,680 | ||||||
Brookfield Property REIT Inc. 5.75% 20262 | 760 | 751 | ||||||
Brookfield Residential Properties Inc. 4.875% 20302 | 85 | 88 | ||||||
Cablevision Systems Corp. 6.75% 2021 | 950 | 995 | ||||||
Caesars Entertainment, Inc. 6.25% 20252 | 445 | 474 | ||||||
Canadian Natural Resources Ltd. 2.95% 2030 | 2,343 | 2,509 | ||||||
Carnival Corp. 11.50% 20232 | 2,630 | 3,045 | ||||||
Carrier Global Corp. 2.242% 2025 | 530 | 562 | ||||||
Carrier Global Corp. 2.493% 2027 | 438 | 473 | ||||||
Cars.com Inc. 6.375% 20282 | 220 | 234 | ||||||
CCCI Treasure Ltd. 3.425% (UST Yield Curve Rate T Note Constant Maturity 5-year + 1.998% on | 2,680 | 2,648 | ||||||
CCCI Treasure Ltd. 3.65% (UST Yield Curve Rate T Note Constant Maturity 5-year + 3.00% on 2/21/2027)1 | 510 | 502 | ||||||
CCO Holdings LLC and CCO Holdings Capital Corp. 5.75% 20262 | 475 | 491 | ||||||
CCO Holdings LLC and CCO Holdings Capital Corp. 3.75% 2028 | 2,650 | 2,975 | ||||||
CCO Holdings LLC and CCO Holdings Capital Corp. 4.50% 20302 | 1,045 | 1,110 | ||||||
CCO Holdings LLC and CCO Holdings Capital Corp. 4.75% 20302 | 275 | 297 | ||||||
CCO Holdings LLC and CCO Holdings Capital Corp. 4.25% 20312 | 375 | 396 | ||||||
CCO Holdings LLC and CCO Holdings Capital Corp. 4.50% 20322 | 210 | 224 | ||||||
Cenovus Energy Inc. 5.375% 2025 | 175 | 197 | ||||||
Cenovus Energy Inc. 6.75% 2039 | 50 | 66 | ||||||
Centene Corp. 4.75% 2025 | 350 | 360 | ||||||
Centene Corp. 4.625% 2029 | 405 | 450 | ||||||
Central Garden & Pet Co. 4.125% 2030 | 99 | 103 | ||||||
Cheniere Energy Partners, LP 5.625% 2026 | 210 | 219 | ||||||
Cheniere Energy Partners, LP 4.50% 2029 | 210 | 222 | ||||||
Cheniere Energy, Inc. 4.625% 20282 | 405 | 426 | ||||||
Chesapeake Energy Corp. 4.875% 20227 | 915 | 46 | ||||||
Chesapeake Energy Corp. 11.50% 20252,7 | 636 | 112 | ||||||
Chesapeake Energy Corp., Term Loan, (3-month USD-LIBOR + 8.00%) 8.223% 20245,6,7 | 756 | 620 | ||||||
China Construction Bank Corp. (Hong Kong Branch) 1.00% 2023 | 6,000 | 6,016 | ||||||
186 American Funds Insurance Series
Table of Contents
CapitalWorld Bond Fund (formerly Global Bond Fund) (continued)
Bonds, notes & other debt instruments (continued)
Principal (000) | Value (000) | |||||||
U.S. dollars (continued) | ||||||||
Cigna Corp. 3.40% 2021 | $ | 750 | $ | 766 | ||||
Cigna Corp. 4.125% 2025 | 830 | 956 | ||||||
Cirsa Gaming Corp. SA 7.875% 20232 | 200 | 202 | ||||||
Citigroup Inc. 2.35% 2021 | 1,500 | 1,518 | ||||||
Citigroup Inc. 3.106% 2026 (USD-SOFR + 2.842% on 3/8/2026)1 | 4,500 | 4,922 | ||||||
Citigroup Inc. 2.976% 2030 (USD-SOFR + 1.422% on 11/5/2029)1 | 425 | 468 | ||||||
Cleveland-Cliffs Inc. 9.875% 20252 | 425 | 500 | ||||||
Cleveland-Cliffs Inc. 6.75% 20262 | 315 | 341 | ||||||
Cleveland-Cliffs Inc. 5.875% 2027 | 100 | 102 | ||||||
CMS Energy Corp. 3.875% 2024 | 100 | 109 | ||||||
CMS Energy Corp. 3.00% 2026 | 1,200 | 1,324 | ||||||
CNX Resources Corp. 7.25% 20272 | 210 | 225 | ||||||
CNX Resources Corp. 6.00% 20292 | 225 | 231 | ||||||
Colombia (Republic of) 3.875% 2027 | 350 | 391 | ||||||
Colombia (Republic of) 4.50% 2029 | 1,165 | 1,351 | ||||||
Comcast Corp. 3.95% 2025 | 2,610 | 3,000 | ||||||
Community Health Systems Inc. 5.625% 20272 | 90 | 97 | ||||||
Community Health Systems Inc. 6.00% 20292 | 230 | 249 | ||||||
Compass Diversified Holdings 8.00% 20262 | 475 | 500 | ||||||
Comstock Resources, Inc. 9.75% 2026 | 295 | 317 | ||||||
Conagra Brands, Inc. 4.30% 2024 | 2,380 | 2,664 | ||||||
Constellation Oil Services Holding SA 10.00% 2024 (100% PIK)2,8 | 2,741 | 781 | ||||||
Consumers Energy Co. 3.375% 2023 | 345 | 370 | ||||||
Continental Airlines, Inc., Series 2000-2, Class A1, 7.707% 2022 | 4 | 4 | ||||||
Convey Park Energy LLC 7.50% 20252 | 125 | 127 | ||||||
Costa Rica (Republic of) 6.125% 20312 | 640 | 599 | ||||||
CP Atlas Buyer, Inc. 7.00% 20282 | 50 | 52 | ||||||
Crédit Agricole SA 4.375% 20252 | 1,100 | 1,236 | ||||||
Crédit Agricole SA 1.907% 2026 (USD-SOFR + 1.676% on 6/16/2025)1,2 | 2,675 | 2,777 | ||||||
Credit Suisse AG (New York Branch) 2.95% 2025 | 875 | 960 | ||||||
CSX Corp. 3.80% 2050 | 75 | 93 | ||||||
CSX Corp. 2.50% 2051 | 1,075 | 1,068 | ||||||
CVR Partners, LP 9.25% 20232 | 230 | 231 | ||||||
CVS Health Corp. 3.35% 2021 | 277 | 279 | ||||||
CVS Health Corp. 3.50% 2022 | 430 | 449 | ||||||
CVS Health Corp. 3.70% 2023 | 97 | 104 | ||||||
DaimlerChrysler North America Holding Corp. 2.00% 20212 | 2,100 | 2,117 | ||||||
DaimlerChrysler North America Holding Corp. 2.875% 20212 | 2,275 | 2,285 | ||||||
DaimlerChrysler North America Holding Corp. 3.00% 20212 | 6,425 | 6,446 | ||||||
Dana Inc. 5.625% 2028 | 410 | 442 | ||||||
Danske Bank AS 2.70% 20222 | 1,400 | 1,436 | ||||||
Danske Bank AS 3.875% 20232 | 1,675 | 1,806 | ||||||
Darling Ingredients Inc. 5.25% 20272 | 210 | 224 | ||||||
Dave & Buster’s, Inc. 7.625% 20252 | 220 | 232 | ||||||
DCP Midstream LP 7.375% 2049 (3-month USD-LIBOR + 5.148% on 12/15/2022)1 | 50 | 42 | ||||||
Deutsche Bank AG 2.129% 2026 (USD-SOFR + 1.87% on 11/24/2025)1 | 850 | 870 | ||||||
Deutsche Bank AG 3.547% 2031 (USD-SOFR + 3.043% on 9/18/2030)1 | 1,500 | 1,630 | ||||||
Deutsche Telekom International Finance BV 1.95% 20212 | 575 | 580 | ||||||
Deutsche Telekom International Finance BV 2.82% 20222 | 1,675 | 1,712 | ||||||
Deutsche Telekom International Finance BV 4.375% 20282 | 890 | 1,052 | ||||||
Deutsche Telekom International Finance BV 9.25% 2032 | 930 | 1,567 | ||||||
Diamond Offshore Drilling, Inc. 4.875% 20437 | 825 | 105 | ||||||
Diamond Sports Group LLC 6.625% 20272 | 385 | 233 | ||||||
Diebold Nixdorf AG, Term Loan B, (3-month USD-LIBOR + 2.75%) 3.004% 20235,6 | 108 | 106 | ||||||
Diebold Nixdorf, Inc. 9.375% 20252 | 630 | 707 | ||||||
Diebold, Inc. 8.50% 2024 | 150 | 152 | ||||||
Discovery Communications, Inc. 3.625% 2030 | 468 | 536 | ||||||
Dominican Republic 5.50% 20252 | 1,375 | 1,552 | ||||||
Dominican Republic 5.95% 2027 | 624 | 736 | ||||||
Dominican Republic 8.625% 20272 | 225 | 287 | ||||||
Dominican Republic 4.50% 20302 | 1,400 | 1,524 | ||||||
Dominican Republic 6.40% 20492 | 1,613 | 1,899 | ||||||
American Funds Insurance Series 187
Table of Contents
CapitalWorld Bond Fund (formerly Global Bond Fund) (continued)
Bonds, notes & other debt instruments (continued)
Principal (000) | Value (000) | |||||||
U.S. dollars (continued) | ||||||||
Dominican Republic 5.875% 20602 | $ | 1,075 | $ | 1,188 | ||||
DP World Crescent 4.848% 20282 | 550 | 641 | ||||||
DPL Inc. 4.125% 20252 | 95 | 103 | ||||||
Duke Energy Corp. 3.75% 2024 | 550 | 606 | ||||||
Duke Energy Progress, LLC 3.70% 2028 | 1,225 | 1,435 | ||||||
Dun & Bradstreet Corp. 6.875% 20262 | 123 | 132 | ||||||
Edison International 5.75% 2027 | 370 | 443 | ||||||
Edison International 4.125% 2028 | 2,390 | 2,665 | ||||||
Egypt (Arab Republic of) 7.50% 20272 | 2,200 | 2,550 | ||||||
Electricité de France SA 4.875% 20382 | 795 | 993 | ||||||
Embarq Corp. 7.995% 2036 | 530 | 655 | ||||||
EMD Finance LLC 2.95% 20222 | 225 | 231 | ||||||
EMD Finance LLC 3.25% 20252 | 2,924 | 3,206 | ||||||
Empire Communities Corp. 7.00% 20252 | 100 | 106 | ||||||
Empresas Publicas de Medellin ESP 4.25% 20292 | 1,030 | 1,109 | ||||||
Enbridge Inc. 4.00% 2023 | 600 | 653 | ||||||
Enbridge Inc. 2.50% 2025 | 900 | 965 | ||||||
Enbridge Inc. 4.25% 2026 | 655 | 767 | ||||||
Enbridge Inc. 3.70% 2027 | 754 | 860 | ||||||
Encompass Health Corp. 4.50% 2028 | 100 | 105 | ||||||
Encompass Health Corp. 4.75% 2030 | 200 | 215 | ||||||
Endo Dac / Endo Finance LLC / Endo Finco 9.50% 20272 | 551 | 616 | ||||||
Endo Dac / Endo Finance LLC / Endo Finco 6.00% 20282 | 292 | 248 | ||||||
Enel Finance International SA 2.75% 20232 | 5,000 | 5,235 | ||||||
Enel Finance International SA 3.625% 20272 | 2,375 | 2,698 | ||||||
Enel Finance International SA 3.50% 20282 | 1,800 | 2,052 | ||||||
Energizer Holdings, Inc. 4.375% 20292 | 210 | 218 | ||||||
Energy Transfer Operating, LP 5.00% 2050 | 3,337 | 3,617 | ||||||
Energy Transfer Partners, LP 4.20% 2027 | 110 | 121 | ||||||
Energy Transfer Partners, LP 6.00% 2048 | 70 | 83 | ||||||
Energy Transfer Partners, LP 6.25% 2049 | 910 | 1,101 | ||||||
Engie Energia Chile SA 3.40% 20302 | 547 | 593 | ||||||
EnLink Midstream Partners, LLC 5.625% 20282 | 135 | 138 | ||||||
ENN Energy Holdings Ltd. 2.625% 20302 | 2,982 | 3,001 | ||||||
Entergy Corp. 0.90% 2025 | 750 | 750 | ||||||
Entergy Texas, Inc. 1.75% 2031 | 525 | 527 | ||||||
Enterprise Products Operating LLC 2.80% 2030 | 377 | 409 | ||||||
EQM Midstream Partners, LP 6.50% 20272 | 340 | 383 | ||||||
EQT Corp. 8.75% 2030 | 105 | 128 | ||||||
Equinix, Inc. 1.80% 2027 | 1,145 | 1,180 | ||||||
Equinix, Inc. 2.15% 2030 | 9,390 | 9,566 | ||||||
Equinor ASA 1.75% 2026 | 462 | 485 | ||||||
Equinor ASA 2.375% 2030 | 928 | 994 | ||||||
Equinor ASA 3.70% 2050 | 1,441 | 1,740 | ||||||
Essex Portfolio LP 3.50% 2025 | 2,835 | 3,143 | ||||||
Essex Portfolio LP 3.375% 2026 | 885 | 994 | ||||||
European Investment Bank 2.25% 2022 | 700 | 717 | ||||||
Exelon Corp. 3.40% 2026 | 1,465 | 1,651 | ||||||
Exelon Corp., junior subordinated, 3.497% 20221 | 525 | 546 | ||||||
Export-Import Bank of India 3.25% 2030 | 3,489 | 3,741 | ||||||
Extraction Oil & Gas, Inc. 5.625% 20262,7 | 425 | 78 | ||||||
Exxon Mobil Corp. 3.482% 2030 | 4,170 | 4,860 | ||||||
Fannie Mae, Series 2012-M17, Class A2, Multi Family, 2.184% 20224 | 1,159 | 1,188 | ||||||
Fannie Mae Pool #MA2754 3.00% 20264 | 155 | 163 | ||||||
Fannie Mae Pool #AB4281 3.00% 20274 | 23 | 24 | ||||||
Fannie Mae Pool #MA4228 1.50% 20364 | 6,429 | 6,618 | ||||||
Fannie Mae Pool #AP7888 3.50% 20424 | 527 | 576 | ||||||
Fannie Mae Pool #AO4151 3.50% 20424 | 205 | 222 | ||||||
Fannie Mae Pool #AQ0770 3.50% 20424 | 177 | 195 | ||||||
FEL Energy VI SARL 5.75% 20402 | 200 | 213 | ||||||
First Quantum Minerals Ltd. 7.25% 20232 | 665 | 686 | ||||||
First Quantum Minerals Ltd. 7.50% 20252 | 895 | 933 | ||||||
188 American Funds Insurance Series
Table of Contents
CapitalWorld Bond Fund (formerly Global Bond Fund) (continued)
Bonds, notes & other debt instruments (continued)
Principal (000) | Value (000) | |||||||
U.S. dollars (continued) | ||||||||
First Quantum Minerals Ltd. 6.875% 20262 | $ | 325 | $ | 339 | ||||
First Quantum Minerals Ltd. 6.875% 20272 | 440 | 478 | ||||||
FirstEnergy Corp. 3.90% 2027 (4.40% on 1/16/2021)1 | 1,800 | 1,986 | ||||||
FirstEnergy Corp. 3.40% 2050 | 240 | 231 | ||||||
Ford Motor Credit Co. 3.81% 2024 | 800 | 821 | ||||||
Ford Motor Credit Co. 5.125% 2025 | 1,035 | 1,127 | ||||||
Ford Motor Credit Co. 4.00% 2030 | 125 | 132 | ||||||
France Télécom 9.00% 20311 | 2,434 | 4,005 | ||||||
Freddie Mac Pool #ZS8588 3.00% 20304 | 93 | 97 | ||||||
Freddie Mac, Series 3213, Class OG, principal only, 0% 20364 | 8 | 7 | ||||||
Freddie Mac Pool #SB8083 1.50% 20364 | 252 | 260 | ||||||
Freddie Mac, Series 3292, Class BO, principal only, 0% 20374 | 33 | 31 | ||||||
Freddie Mac Pool #SI2002 4.00% 20484 | 3,151 | 3,373 | ||||||
Freddie Mac Pool #2B7343 3.711% 20494,6 | 2,053 | 2,146 | ||||||
Freedom Mortgage Corp. 7.625% 20262 | 225 | 238 | ||||||
Freeport-McMoRan Inc. 3.875% 2023 | 75 | 78 | ||||||
Freeport-McMoRan Inc. 4.25% 2030 | 275 | 297 | ||||||
Fresnillo PLC 4.25% 20502 | 973 | 1,070 | ||||||
Frontier Communications Corp. 11.00% 20257 | 1,515 | 798 | ||||||
Frontier Communications Corp. 5.875% 20272 | 125 | 135 | ||||||
Frontier Communications Corp. 5.00% 20282 | 125 | 131 | ||||||
Frontier Communications Corp. 6.75% 20292 | 125 | 134 | ||||||
FS Energy and Power Fund 7.50% 20232 | 525 | 505 | ||||||
FXI Holdings, Inc. 7.875% 20242 | 246 | 248 | ||||||
FXI Holdings, Inc. 12.25% 20262 | 652 | 744 | ||||||
General Mills, Inc. 3.20% 2021 | 455 | 459 | ||||||
General Motors Company 6.125% 2025 | 117 | 142 | ||||||
General Motors Financial Co. 5.20% 2023 | 1,190 | 1,305 | ||||||
Genesis Energy, LP 8.00% 2027 | 205 | 204 | ||||||
Global Payments Inc. 2.90% 2030 | 683 | 743 | ||||||
Gogo Inc. 9.875% 20242 | 985 | 1,057 | ||||||
Goldman Sachs Group, Inc. 2.905% 2023 (3-month USD-LIBOR + 0.99% on 7/24/2022)1 | 1,200 | 1,247 | ||||||
Goldman Sachs Group, Inc. 3.50% 2025 | 5,111 | 5,688 | ||||||
GPC Merger Sub Inc. 7.125% 20282 | 210 | 232 | ||||||
GrafTech Finance Inc. 4.625% 20282 | 25 | 25 | ||||||
Groupe BPCE SA 5.70% 20232 | 1,800 | 2,038 | ||||||
Grupo Energia Bogota SA ESP 4.875% 20302 | 660 | 778 | ||||||
H.J. Heinz Co. 3.875% 20272 | 300 | 324 | ||||||
Halliburton Company 3.80% 2025 | 54 | 61 | ||||||
Hanesbrands Inc. 4.625% 20242 | 85 | 89 | ||||||
Hanesbrands Inc. 5.375% 20252 | 86 | 91 | ||||||
Hanesbrands Inc. 4.875% 20262 | 350 | 381 | ||||||
Harsco Corp. 5.75% 20272 | 210 | 222 | ||||||
Harvest Midstream I, LP 7.50% 20282 | 100 | 107 | ||||||
HCA Inc. 5.875% 2023 | 145 | 160 | ||||||
HCA Inc. 5.375% 2025 | 55 | 62 | ||||||
HCA Inc. 5.625% 2028 | 190 | 225 | ||||||
HCA Inc. 3.50% 2030 | 100 | 106 | ||||||
HCA Inc. 5.25% 2049 | 170 | 225 | ||||||
Hess Midstream Partners LP 5.125% 20282 | 140 | 146 | ||||||
Hexion Inc. 7.875% 20272 | 370 | 397 | ||||||
Hilton Worldwide Holdings Inc. 4.00% 20312 | 130 | 137 | ||||||
Howard Hughes Corp. 5.375% 20282 | 435 | 469 | ||||||
Howmet Aerospace Inc. 6.875% 2025 | 190 | 224 | ||||||
HSBC Holdings PLC 3.033% 2023 (3-month USD-LIBOR + 0.923% on 11/12/2022)1 | 430 | 452 | ||||||
HSBC Holdings PLC 2.633% 2025 (3-month USD-LIBOR + 1.14% on 11/7/2024)1 | 305 | 325 | ||||||
HSBC Holdings PLC 4.292% 2026 (3-month USD-LIBOR + 1.348% on 9/12/2025)1 | 4,172 | 4,759 | ||||||
HSBC Holdings PLC 2.357% 2031 (USD-SOFR + 1.947% on 8/18/2030)1 | 1,032 | 1,068 | ||||||
HSBC Holdings PLC 2.848% 2031 (USD-SOFR + 2.387% on 6/4/2030)1 | 6,000 | 6,453 | ||||||
Humana Inc. 3.85% 2024 | 1,000 | 1,108 | ||||||
Hyundai Capital America 3.25% 20222 | 250 | 260 | ||||||
Hyundai Capital America 2.375% 20272 | 1,284 | 1,348 | ||||||
American Funds Insurance Series 189
Table of Contents
CapitalWorld Bond Fund (formerly Global Bond Fund) (continued)
Bonds, notes & other debt instruments (continued)
Principal amount | Value | |||||||
| (000) | (000) | |||||||
U.S. dollars (continued) | ||||||||
Hyundai Capital Services Inc. 3.75% 20232 | $ | 2,450 | $ | 2,606 | ||||
Imperial Tobacco Finance PLC 3.50% 20232 | 2,000 | 2,095 | ||||||
Indonesia (Republic of) 3.75% 2022 | 1,110 | 1,157 | ||||||
Indonesia (Republic of) 4.75% 2026 | 3,500 | 4,100 | ||||||
Indonesia (Republic of) 3.85% 2030 | 315 | 367 | ||||||
International Game Technology PLC 6.50% 20252 | 500 | 560 | ||||||
International Game Technology PLC 5.25% 20292 | 200 | 216 | ||||||
International Paper Co. 7.30% 2039 | 600 | 963 | ||||||
Interstate Power and Light Co. 2.30% 2030 | 1,275 | 1,350 | ||||||
Intesa Sanpaolo SpA 5.017% 20242 | 3,270 | 3,579 | ||||||
Intuit Inc. 1.35% 2027 | 700 | 717 | ||||||
Iraq (Republic of) 6.752% 20232 | 545 | 534 | ||||||
Iron Mountain Inc. 5.25% 20302 | 290 | 314 | ||||||
Iron Mountain Inc. 4.50% 20312 | 280 | 294 | ||||||
Israel (State of) 2.50% 2030 | 3,850 | 4,176 | ||||||
Israel (State of) 2.75% 2030 | 1,135 | 1,253 | ||||||
Israel (State of) 3.375% 2050 | 1,470 | 1,631 | ||||||
Israel (State of) 3.875% 2050 | 1,265 | 1,524 | ||||||
J2 Global, Inc. 4.625% 20302 | 220 | 233 | ||||||
Jaguar Land Rover PLC 7.75% 20252 | 225 | 243 | ||||||
Jaguar Land Rover PLC 5.875% 20282 | 150 | 152 | ||||||
Jordan (Hashemite Kingdom of) 5.75% 20272 | 1,035 | 1,144 | ||||||
Joseph T. Ryerson & Son, Inc. 8.50% 20282 | 157 | 178 | ||||||
JPMorgan Chase & Co. 1.045% 2026 (USD-SOFR + 0.80% on 11/19/2025)1 | 6,710 | 6,787 | ||||||
KB Home 6.875% 2027 | 370 | 435 | ||||||
Keurig Dr Pepper Inc. 4.597% 2028 | 2,740 | 3,339 | ||||||
Keurig Dr Pepper Inc. 3.20% 2030 | 146 | 165 | ||||||
Keurig Dr Pepper Inc. 5.085% 2048 | 1,075 | 1,521 | ||||||
Kimberly-Clark Corp. 1.05% 2027 | 770 | 781 | ||||||
Kimberly-Clark Corp. 3.10% 2030 | 110 | 127 | ||||||
Kraft Heinz Company 3.95% 2025 | 235 | 259 | ||||||
Kraft Heinz Company 4.375% 2046 | 825 | 893 | ||||||
Kronos Acquisition Holdings Inc. 5.00% 20262 | 95 | 99 | ||||||
Kronos Acquisition Holdings Inc. 7.00% 20272 | 45 | 47 | ||||||
Kuwait (State of) 2.75% 20222 | 3,550 | 3,655 | ||||||
L3Harris Technologies, Inc. 1.80% 2031 | 950 | 968 | ||||||
Lamar Media Corp. 3.75% 2028 | 210 | 216 | ||||||
LBM Acquisition LLC 6.25% 20292 | 50 | 52 | ||||||
LD Holdings Group LLC 6.50% 20252 | 220 | 232 | ||||||
Liberty Global PLC 5.50% 20282 | 250 | 264 | ||||||
Ligado Networks LLC 15.50% 20232,8 | 225 | 219 | ||||||
Lima Metro Line 2 Finance Ltd. 5.875% 20342 | 1,052 | 1,273 | ||||||
Lima Metro Line 2 Finance Ltd. 5.875% 2034 | 721 | 872 | ||||||
Lima Metro Line 2 Finance Ltd. 4.35% 20362 | 630 | 700 | ||||||
Live Nation Entertainment, Inc. 3.75% 20282 | 50 | 51 | ||||||
Lloyds Banking Group PLC 1.326% 2023 (UST Yield Curve Rate T Note Constant Maturity 1-year on 6/15/2022)1 | 1,825 | 1,846 | ||||||
LPL Financial Holdings Inc. 4.625% 20272 | 395 | 410 | ||||||
LSB Industries, Inc. 9.625% 20232 | 760 | 786 | ||||||
LYB International Finance III, LLC 1.25% 2025 | 1,452 | 1,478 | ||||||
Magna International Inc. 2.45% 2030 | 725 | 780 | ||||||
Mallinckrodt PLC 10.00% 20252 | 1,190 | 1,294 | ||||||
MasTec, Inc. 4.50% 20282 | 100 | 105 | ||||||
Mattel, Inc. 6.75% 20252 | 210 | 222 | ||||||
MDC Partners Inc. 6.50% 20242 | 470 | 477 | ||||||
Medical Properties Trust, Inc. 3.50% 2031 | 450 | 465 | ||||||
Medtronic, Inc. 3.50% 2025 | 1,091 | 1,225 | ||||||
Methanex Corp. 5.125% 2027 | 350 | 381 | ||||||
Methanex Corp. 5.65% 2044 | 240 | 258 | ||||||
Mexico City Airport Trust 5.50% 2047 | 432 | 456 | ||||||
MGM Growth Properties LLC 3.875% 20292 | 100 | 102 | ||||||
MGM Resorts International 7.75% 2022 | 200 | 213 | ||||||
190 American Funds Insurance Series
Table of Contents
CapitalWorld Bond Fund (formerly Global Bond Fund) (continued)
Bonds, notes & other debt instruments (continued)
Principal amount | Value | |||||||
| (000) | (000) | |||||||
U.S. dollars (continued) | ||||||||
Microsoft Corp. 2.40% 2026 | $ | 2,688 | $ | 2,933 | ||||
Molina Healthcare, Inc. 5.375% 2022 | 1,200 | 1,273 | ||||||
Molina Healthcare, Inc. 3.875% 20302 | 75 | 81 | ||||||
Morgan Stanley 0.985% 2026 (USD-SOFR + 0.72% on 12/10/2025)1 | 5,730 | 5,775 | ||||||
Morgan Stanley 2.699% 2031 (USD-SOFR + 1.143% on 1/22/2030)1 | 1,510 | 1,640 | ||||||
Morocco (Kingdom of) 5.50% 2042 | 3,100 | 3,881 | ||||||
MPLX LP 2.65% 2030 | 837 | 878 | ||||||
MPLX LP 5.50% 2049 | 1,900 | 2,502 | ||||||
MSCI Inc. 3.875% 20312 | 410 | 434 | ||||||
National CineMedia, LLC 5.875% 20282 | 100 | 85 | ||||||
National Financial Partners Corp. 6.875% 20282 | 210 | 224 | ||||||
Nationstar Mortgage Holdings Inc. 5.125% 20302 | 230 | 241 | ||||||
Navient Corp. 5.50% 2023 | 440 | 461 | ||||||
Navient Corp. 5.875% 2024 | 600 | 639 | ||||||
Navient Corp. 6.125% 2024 | 100 | 107 | ||||||
NCL Corp. Ltd. 3.625% 20242 | 345 | 328 | ||||||
NCL Corp. Ltd. 5.875% 20262 | 115 | 121 | ||||||
Neon Holdings, Inc. 10.125% 20262 | 200 | 219 | ||||||
Nestlé Holdings, Inc. 0.625% 20262 | 5,550 | 5,525 | ||||||
Netflix, Inc. 4.875% 20302 | 190 | 219 | ||||||
New Fortress Energy Inc. 6.75% 20252 | 103 | 109 | ||||||
New York Life Global Funding 1.20% 20302 | 2,725 | 2,645 | ||||||
New York Life Insurance Company 3.75% 20502 | 413 | 495 | ||||||
Newcrest Finance Pty Ltd. 3.25% 20302 | 909 | 1,005 | ||||||
Newell Rubbermaid Inc. 4.70% 2026 | 100 | 110 | ||||||
Newell Rubbermaid Inc. 5.875% 20361 | 100 | 122 | ||||||
Nexstar Broadcasting, Inc. 4.75% 20282 | 215 | 225 | ||||||
NGL Energy Partners LP 7.50% 2023 | 175 | 124 | ||||||
Niagara Mohawk Power Corp. 3.508% 20242 | 180 | 198 | ||||||
Nielsen Finance LLC and Nielsen Finance Co. 5.00% 20252 | 225 | 231 | ||||||
Nielsen Finance LLC and Nielsen Finance Co. 5.625% 20282 | 210 | 229 | ||||||
NIKE, Inc. 3.375% 2050 | 602 | 741 | ||||||
Nissan Motor Co., Ltd. 3.043% 20232 | 1,543 | 1,614 | ||||||
Nissan Motor Co., Ltd. 3.522% 20252 | 2,260 | 2,425 | ||||||
Northriver Midstream Finance LP 5.625% 20262 | 220 | 228 | ||||||
Nouryon Holding BV 8.00% 20262 | 210 | 224 | ||||||
Nova Chemicals Corp. 5.25% 20272 | 120 | 128 | ||||||
Novartis Capital Corp. 1.75% 2025 | 460 | 483 | ||||||
Novartis Capital Corp. 2.00% 2027 | 501 | 535 | ||||||
Novartis Capital Corp. 2.20% 2030 | 1,060 | 1,139 | ||||||
NRG Energy, Inc. 3.375% 20292 | 225 | 231 | ||||||
NRG Energy, Inc. 3.625% 20312 | 225 | 232 | ||||||
Occidental Petroleum Corp. 2.70% 2023 | 230 | 230 | ||||||
Occidental Petroleum Corp. 5.875% 2025 | 240 | 256 | ||||||
Occidental Petroleum Corp. 6.375% 2028 | 234 | 248 | ||||||
Occidental Petroleum Corp. 6.125% 2031 | 155 | 166 | ||||||
State of Ohio, Turnpike and Infrastructure Commission, Turnpike Rev. Ref. Bonds (Infrastructure Projects), Series 2020-A, 3.216% 2048 | 1,410 | 1,438 | ||||||
ONEOK, Inc. 6.35% 2031 | 31 | 40 | ||||||
ONEOK, Inc. 4.95% 2047 | 111 | 124 | ||||||
ONEOK, Inc. 5.20% 2048 | 1,378 | 1,608 | ||||||
ONEOK, Inc. 7.15% 2051 | 355 | 492 | ||||||
Oracle Corp. 2.65% 2026 | 2,327 | 2,560 | ||||||
Oracle Corp. 3.25% 2027 | 1,880 | 2,144 | ||||||
Oracle Corp. 3.60% 2050 | 980 | 1,145 | ||||||
OSW Structured Asset Trust, Series 2020-RPL1, Class A1, 3.072% 20602,4,6 | 621 | 636 | ||||||
Oversea-Chinese Banking Corp. Ltd. 1.832% 2030 (UST Yield Curve Rate T Note Constant Maturity 5-year + 1.58% on 9/10/2025)1,2 | 1,416 | 1,440 | ||||||
Owens & Minor, Inc. 4.375% 2024 | 425 | 437 | ||||||
Owens & Minor, Inc., Term Loan B, (3-month USD-LIBOR + 4.50%) 4.655% 20255,6 | 352 | 352 | ||||||
Pacific Gas and Electric Co. 2.95% 2026 | 590 | 624 | ||||||
Pacific Gas and Electric Co. 2.10% 2027 | 9,935 | 10,097 | ||||||
American Funds Insurance Series 191
Table of Contents
CapitalWorld Bond Fund (formerly Global Bond Fund) (continued)
Bonds, notes & other debt instruments (continued)
Principal amount | Value | |||||||
| (000) | (000) | |||||||
U.S. dollars (continued) | ||||||||
Pacific Gas and Electric Co. 3.30% 2027 | $ | 659 | $ | 706 | ||||
Pacific Gas and Electric Co. 4.65% 2028 | 542 | 620 | ||||||
Pacific Gas and Electric Co. 4.55% 2030 | 783 | 893 | ||||||
Pacific Gas and Electric Co. 3.30% 2040 | 6,850 | 6,845 | ||||||
Pacific Gas and Electric Co. 3.50% 2050 | 931 | 927 | ||||||
Pakistan (Islamic Republic of) 5.50% 20212 | 3,535 | 3,588 | ||||||
Panama (Republic of) 3.75% 20262 | 1,440 | 1,579 | ||||||
Panama (Republic of) 3.16% 2030 | 3,730 | 4,138 | ||||||
Panama (Republic of) 4.50% 2050 | 1,230 | 1,587 | ||||||
Panama (Republic of) 4.50% 2056 | 1,465 | 1,893 | ||||||
Panther BF Aggregator 2, LP 6.25% 20262 | 55 | 59 | ||||||
Panther BF Aggregator 2, LP 8.50% 20272 | 200 | 218 | ||||||
Par Pharmaceutical Inc. 7.50% 20272 | 206 | 224 | ||||||
Paraguay (Republic of) 4.625% 2023 | 947 | 1,020 | ||||||
Paraguay (Republic of) 5.00% 2026 | 235 | 276 | ||||||
Paraguay (Republic of) 4.70% 20272 | 350 | 410 | ||||||
Paraguay (Republic of) 5.60% 20482 | 2,340 | 3,019 | ||||||
Paraguay (Republic of) 5.40% 20502 | 1,510 | 1,918 | ||||||
PayPal Holdings, Inc. 2.30% 2030 | 541 | 580 | ||||||
Peabody Energy Corp. 6.00% 20222 | 225 | 165 | ||||||
PennyMac Financial Services, Inc. 5.375% 20252 | 210 | 222 | ||||||
Peru (Republic of) 2.392% 2026 | 500 | 534 | ||||||
Petrobras Global Finance Co. 6.75% 2050 | 1,370 | 1,704 | ||||||
Petróleos Mexicanos 6.875% 20252 | 1,340 | 1,471 | ||||||
Petróleos Mexicanos 6.49% 2027 | 100 | 106 | ||||||
Petróleos Mexicanos 6.35% 2048 | 723 | 657 | ||||||
Petróleos Mexicanos 7.69% 2050 | 250 | 252 | ||||||
Petróleos Mexicanos 6.95% 2060 | 201 | 189 | ||||||
PETRONAS Capital Ltd. 3.50% 20302 | 605 | 697 | ||||||
PetSmart, Inc. 5.875% 20252 | 790 | 813 | ||||||
PetSmart, Inc. 8.875% 20252 | 1,035 | 1,064 | ||||||
PG&E Corp. 5.00% 2028 | 220 | 235 | ||||||
PG&E Corp. 5.25% 2030 | 125 | 138 | ||||||
Philip Morris International Inc. 2.10% 2030 | 634 | 662 | ||||||
Philippines (Republic of) 1.648% 2031 | 1,637 | 1,662 | ||||||
Pioneer Natural Resources Company 1.90% 2030 | 1,078 | 1,069 | ||||||
Plains All American Pipeline, LP 3.80% 2030 | 352 | 379 | ||||||
Poland (Republic of) 3.25% 2026 | 3,090 | 3,491 | ||||||
Post Holdings, Inc. 4.625% 20302 | 579 | 610 | ||||||
PowerTeam Services, LLC 9.033% 20252 | 100 | 111 | ||||||
Prime Healthcare Services, Inc. 7.25% 20252 | 140 | 149 | ||||||
Prime Security Services Borrower, LLC 3.375% 20272 | 160 | 159 | ||||||
Procter & Gamble Company 3.00% 2030 | 338 | 390 | ||||||
Progress Energy, Inc. 7.75% 2031 | 150 | 224 | ||||||
PT Indonesia Asahan Aluminium Tbk 5.23% 20212 | 555 | 577 | ||||||
PT Indonesia Asahan Aluminium Tbk 5.45% 20302 | 500 | 602 | ||||||
PTT Exploration and Production PCL 2.587% 20272 | 200 | 209 | ||||||
Public Service Electric and Gas Co. 2.05% 2050 | 415 | 391 | ||||||
Puget Energy, Inc. 6.00% 2021 | 1,023 | 1,059 | ||||||
Puget Energy, Inc. 5.625% 2022 | 480 | 508 | ||||||
Qatar (State of) 3.875% 20232 | 475 | 511 | ||||||
Qatar (State of) 3.40% 20252 | 4,805 | 5,306 | ||||||
Qatar (State of) 4.50% 20282 | 3,205 | 3,889 | ||||||
Qatar (State of) 5.103% 20482 | 530 | 747 | ||||||
Rabobank Nederland 4.625% 2023 | 2,180 | 2,431 | ||||||
Radiology Partners, Inc. 9.25% 20282 | 410 | 462 | ||||||
Radiology Partners, Inc., Term Loan, (3-month USD-LIBOR + 4.25%) 4.476% 20255,6 | 325 | 321 | ||||||
Rattler Midstream Partners LP 5.625% 20252 | 220 | 233 | ||||||
Rayonier A.M. Products Inc. 7.625% 20262 | 40 | 42 | ||||||
Regeneron Pharmaceuticals, Inc. 1.75% 2030 | 1,014 | 1,000 | ||||||
Reynolds American Inc. 4.45% 2025 | 2,115 | 2,409 | ||||||
Rolls-Royce PLC 5.75% 20272 | 220 | 244 | ||||||
192 American Funds Insurance Series
Table of Contents
CapitalWorld Bond Fund (formerly Global Bond Fund) (continued)
Bonds, notes & other debt instruments (continued)
| Principal amount | Value | |||||||
| (000) | (000) | |||||||
U.S. dollars (continued) | ||||||||
Roper Technologies, Inc. 1.00% 2025 | $ | 2,210 | $ | 2,238 | ||||
Royal Caribbean Cruises Ltd. 11.50% 20252 | 95 | 111 | ||||||
RP Escrow Issuer, LLC 5.25% 20252 | 75 | 79 | ||||||
Russian Federation 4.25% 2027 | 1,400 | 1,600 | ||||||
Sabine Pass Liquefaction, LLC 4.50% 20302 | 88 | 104 | ||||||
Sabre GLBL Inc. 7.375% 20252 | 210 | 228 | ||||||
Sabre Holdings Corp. 5.25% 20232 | 50 | 51 | ||||||
Sabre Holdings Corp. 9.25% 20252 | 125 | 149 | ||||||
Sally Holdings LLC and Sally Capital Inc. 5.625% 2025 | 640 | 659 | ||||||
Sally Holdings LLC and Sally Capital Inc. 8.75% 20252 | 283 | 315 | ||||||
Santander Holdings USA, Inc. 3.244% 2026 | 3,750 | 4,095 | ||||||
Saudi Arabia (Kingdom of) 2.894% 20222 | 1,900 | 1,959 | ||||||
Saudi Arabia (Kingdom of) 2.90% 2025 | 2,000 | 2,158 | ||||||
Saudi Arabia (Kingdom of) 3.628% 20272 | 1,900 | 2,137 | ||||||
Saudi Arabia (Kingdom of) 3.625% 20282 | 3,840 | 4,310 | ||||||
Saudi Arabian Oil Co. 1.625% 20252 | 430 | 441 | ||||||
Scentre Group 3.50% 20252 | 210 | 225 | ||||||
Scentre Group 3.75% 20272 | 110 | 119 | ||||||
Schlumberger BV 4.00% 20252 | 935 | 1,064 | ||||||
Scientific Games Corp. 5.00% 20252 | 539 | 557 | ||||||
Scientific Games Corp. 8.25% 20262 | 615 | 664 | ||||||
Scientific Games Corp. 7.00% 20282 | 100 | 108 | ||||||
Scientific Games Corp. 7.25% 20292 | 160 | 176 | ||||||
Scripps Escrow II, Inc. 3.875% 20292 | 50 | 52 | ||||||
Service Properties Trust 5.50% 2027 | 85 | 93 | ||||||
ServiceNow, Inc. 1.40% 2030 | 1,830 | 1,787 | ||||||
Shell International Finance BV 3.25% 2050 | 1,000 | 1,135 | ||||||
Shire PLC 2.40% 2021 | 1,072 | 1,086 | ||||||
Sinclair Television Group, Inc. 5.125% 20272 | 155 | 158 | ||||||
Sinclair Television Group, Inc. 4.125% 20302 | 230 | 236 | ||||||
Six Flags Entertainment Corp. 4.875% 20242 | 230 | 231 | ||||||
Sizzling Platter LLC 8.50% 20252 | 200 | 209 | ||||||
Skandinaviska Enskilda Banken AB 2.625% 2021 | 2,250 | 2,261 | ||||||
Skandinaviska Enskilda Banken AB 2.80% 2022 | 2,100 | 2,162 | ||||||
SkyMiles IP Ltd. 4.75% 20282 | 210 | 229 | ||||||
Sotera Health Holdings LLC, Term Loan, (3-months USD-LIBOR + 4.50%) 5.50% 20265,6 | 184 | 185 | ||||||
Southern California Edison Co. 2.85% 2029 | 200 | 218 | ||||||
Southwestern Energy Co. 6.45% 20251 | 200 | 208 | ||||||
Southwestern Energy Co. 8.375% 2028 | 60 | 65 | ||||||
Springleaf Finance Corp. 6.125% 2024 | 650 | 711 | ||||||
Sprint Corp. 7.625% 2026 | 180 | 224 | ||||||
Sprint Corp. 6.875% 2028 | 725 | 957 | ||||||
Sri Lanka (Democratic Socialist Republic of) 6.25% 2021 | 7,010 | 6,101 | ||||||
Sri Lanka (Democratic Socialist Republic of) 5.75% 2022 | 3,700 | 2,902 | ||||||
Sri Lanka (Democratic Socialist Republic of) 5.75% 2023 | 2,890 | 1,863 | ||||||
State Grid Overseas Investment Ltd. 3.50% 20272 | 5,600 | 6,232 | ||||||
Statoil ASA 3.70% 2024 | 1,950 | 2,145 | ||||||
Statoil ASA 4.25% 2041 | 1,000 | 1,257 | ||||||
Stericycle, Inc. 3.875% 20292 | 65 | 67 | ||||||
Summit Materials, Inc. 6.50% 20272 | 210 | 224 | ||||||
Sunoco Logistics Operating Partners, LP 4.00% 2027 | 1,490 | 1,631 | ||||||
Sunoco LP 5.50% 2026 | 210 | 216 | ||||||
Sunoco LP 4.50% 20292 | 220 | 229 | ||||||
Surgery Center Holdings 10.00% 20272 | 210 | 232 | ||||||
Swiss Re Finance (Luxembourg) SA 5.00% 2049 (UST Yield Curve Rate T Note Constant Maturity 5-year + 3.582% on 4/2/2029)1,2 | 800 | 935 | ||||||
Syneos Health, Inc. 3.625% 20292 | 45 | 45 | ||||||
Talen Energy Corp. 10.50% 20262 | 105 | 94 | ||||||
Talen Energy Corp. 7.25% 20272 | 510 | 544 | ||||||
Talen Energy Supply, LLC 7.625% 20282 | 70 | 76 | ||||||
Targa Resources Partners LP 5.875% 2026 | 125 | 133 | ||||||
Targa Resources Partners LP 5.50% 2030 | 230 | 250 | ||||||
American Funds Insurance Series 193
Table of Contents
CapitalWorld Bond Fund (formerly Global Bond Fund) (continued)
Bonds, notes & other debt instruments (continued)
| Principal amount | Value | |||||||
| (000) | (000) | |||||||
U.S. dollars (continued) | ||||||||
Targa Resources Partners LP 4.875% 20312 | $ | 90 | $ | 98 | ||||
Teekay Offshore Partners LP 8.50% 20232 | 550 | 469 | ||||||
TEGNA Inc. 4.75% 20262 | 100 | 107 | ||||||
Tencent Holdings Ltd. 3.24% 20502 | 7,950 | 8,245 | ||||||
Tencent Music Entertainment Group 2.00% 2030 | 610 | 607 | ||||||
Tenet Healthcare Corp. 4.875% 20262 | 865 | 906 | ||||||
Teva Pharmaceutical Finance Co. BV 2.20% 2021 | 71 | 71 | ||||||
Teva Pharmaceutical Finance Co. BV 2.80% 2023 | 4,361 | 4,325 | ||||||
Teva Pharmaceutical Finance Co. BV 6.00% 2024 | 4,600 | 4,887 | ||||||
Teva Pharmaceutical Finance Co. BV 7.125% 2025 | 3,910 | 4,329 | ||||||
Teva Pharmaceutical Finance Co. BV 3.15% 2026 | 2,900 | 2,793 | ||||||
State of Texas, Grand Parkway Transportation Corp., Grand Parkway System Toll Rev. Ref. Bonds, Series 2020-B, 3.236% 2052 | 1,780 | 1,863 | ||||||
The Home Company Inc. 7.25% 20252 | 290 | 299 | ||||||
Thermo Fisher Scientific Inc. 4.133% 2025 | 1,170 | 1,331 | ||||||
T-Mobile US, Inc. 3.875% 20302 | 2,925 | 3,391 | ||||||
T-Mobile US, Inc. 2.55% 20312 | 9,390 | 9,872 | ||||||
Toronto-Dominion Bank 1.15% 2025 | 7,000 | 7,151 | ||||||
Total Capital International 3.127% 2050 | 3,283 | 3,562 | ||||||
Total Play Telecomunicaciones, SA de CV 7.50% 20252 | 230 | 230 | ||||||
Toyota Motor Credit Corp. 2.90% 2023 | 1,360 | 1,439 | ||||||
Toyota Motor Credit Corp. 1.80% 2025 | 8,000 | 8,392 | ||||||
Toyota Motor Credit Corp. 3.00% 2025 | 1,360 | 1,496 | ||||||
Toyota Motor Credit Corp. 3.375% 2030 | 453 | 530 | ||||||
TransCanada PipeLines Ltd. 4.10% 2030 | 1,342 | 1,587 | ||||||
TransDigm Inc. 6.50% 2024 | 25 | 25 | ||||||
TransDigm Inc. 6.25% 20262 | 204 | 218 | ||||||
TransDigm Inc. 5.50% 2027 | 220 | 232 | ||||||
Transocean Guardian Ltd. 5.875% 20242 | 43 | 36 | ||||||
Transocean Inc. 6.125% 20252 | 94 | 89 | ||||||
Transocean Poseidon Ltd. 6.875% 20272 | 130 | 119 | ||||||
Travelport Finance Luxembourg SARL, Term Loan, (3-month USD-LIBOR + 5.00%) 5.254% 20265,6 | 73 | 51 | ||||||
TreeHouse Foods, Inc. 4.00% 2028 | 50 | 52 | ||||||
Trilogy International Partners, LLC 8.875% 20222 | 1,585 | 1,533 | ||||||
Trivium Packaging BV 8.50% 20272 | 200 | 219 | ||||||
Tronox Ltd. 6.50% 20262 | 375 | 391 | ||||||
Turkey (Republic of) 6.25% 2022 | 1,880 | 1,971 | ||||||
Turkey (Republic of) 5.75% 2024 | 2,500 | 2,638 | ||||||
Turkey (Republic of) 6.35% 2024 | 2,220 | 2,388 | ||||||
U.S. Treasury 0.125% 2022 | 12,340 | 12,341 | ||||||
U.S. Treasury 2.625% 2023 | 6,900 | 7,270 | ||||||
U.S. Treasury 1.875% 2024 | 4,515 | 4,787 | ||||||
U.S. Treasury 2.75% 2025 | 10,140 | 11,245 | ||||||
U.S. Treasury 2.875% 2025 | 5,400 | 6,063 | ||||||
U.S. Treasury 0.625% 2030 | 11,600 | 11,338 | ||||||
U.S. Treasury 1.125% 2040 | 9,170 | 8,704 | ||||||
U.S. Treasury 2.75% 20479 | 1,625 | 2,040 | ||||||
U.S. Treasury 3.00% 2048 | 5,045 | 6,637 | ||||||
U.S. Treasury 1.25% 20509 | 12,900 | 11,700 | ||||||
U.S. Treasury 2.00% 20509 | 8,100 | 8,796 | ||||||
U.S. Treasury Inflation-Protected Security 0.125% 20213 | 3,340 | 3,352 | ||||||
U.S. Treasury Inflation-Protected Security 1.125% 20213 | 3,321 | 3,322 | ||||||
U.S. Treasury Inflation-Protected Security 0.125% 20303,9 | 14,594 | 16,279 | ||||||
U.S. Treasury Inflation-Protected Security 0.75% 20423 | 720 | 918 | ||||||
U.S. Treasury Inflation-Protected Security 0.625% 20433 | 1,359 | 1,697 | ||||||
U.S. Treasury Inflation-Protected Security 1.375% 20443 | 5,921 | 8,540 | ||||||
U.S. Treasury Inflation-Protected Security 1.00% 20493,9 | 5,381 | 7,588 | ||||||
U.S. Treasury Inflation-Protected Security 0.25% 20503,9 | 5,672 | 6,756 | ||||||
Uber Technologies, Inc. 8.00% 20262 | 300 | 327 | ||||||
UBS Group AG 1.008% 2024 (UST Yield Curve Rate T Note Constant Maturity 5-year + 0.83% on 7/30/2023)1,2 | 1,950 | 1,970 | ||||||
194 American Funds Insurance Series
Table of Contents
CapitalWorld Bond Fund (formerly Global Bond Fund) (continued)
Bonds, notes & other debt instruments (continued)
| Principal amount | Value | |||||||
| (000) | (000) | |||||||
U.S. dollars (continued) | ||||||||
Ultimate Software Group Inc., Term Loan, (3-month USD-LIBOR + 4.00%) 4.75% 20265,6 | $ | 319 | $ | 321 | ||||
UniCredit SpA 3.75% 20222 | 1,750 | 1,814 | ||||||
UniCredit SpA 4.625% 20272 | 6,805 | 7,749 | ||||||
Uniform Mortgage-Backed Security 1.50% 20364,10 | 19,656 | 20,196 | ||||||
Uniform Mortgage-Backed Security 2.00% 20514,10 | 5,652 | 5,851 | ||||||
Uniform Mortgage-Backed Security 2.00% 20514,10 | 4,350 | 4,510 | ||||||
Unisys Corp. 6.875% 20272 | 50 | 55 | ||||||
United Airlines Holdings, Inc. 6.50% 20272 | 290 | 312 | ||||||
United Mexican States 3.90% 2025 | 1,080 | 1,213 | ||||||
United Mexican States 3.25% 2030 | 2,685 | 2,906 | ||||||
United Mexican States 2.659% 2031 | 1,822 | 1,869 | ||||||
United Mexican States 4.75% 2032 | 950 | 1,146 | ||||||
United Mexican States 5.00% 2051 | 890 | 1,111 | ||||||
United Natural Foods, Inc. 6.75% 20282 | 175 | 183 | ||||||
United Rentals, Inc. 3.875% 2031 | 50 | 53 | ||||||
United Technologies Corp. 4.125% 2028 | 1,900 | 2,266 | ||||||
Univision Communications Inc. 6.625% 20272 | 220 | 237 | ||||||
Upjohn Inc. 2.30% 20272 | 794 | 846 | ||||||
Upjohn Inc. 3.85% 20402 | 970 | 1,095 | ||||||
Uruguay (Oriental Republic of) 4.375% 2031 | 600 | 737 | ||||||
Vale Overseas Ltd. 3.75% 2030 | 1,873 | 2,086 | ||||||
Valeant Pharmaceuticals International, Inc. 6.125% 20252 | 800 | 825 | ||||||
Valvoline Inc. 4.375% 2025 | 90 | 93 | ||||||
Valvoline Inc. 3.625% 20312 | 210 | 216 | ||||||
Venator Materials Corp. 5.75% 20252 | 620 | 581 | ||||||
Venator Materials Corp. 9.50% 20252 | 420 | 460 | ||||||
Veritas Holdings Ltd. 7.50% 20232 | 440 | 442 | ||||||
Veritas Holdings Ltd. 10.50% 20242 | 200 | 204 | ||||||
Veritas Holdings Ltd. 7.50% 20252 | 285 | 293 | ||||||
Verizon Communications Inc. 0.85% 2025 | 4,480 | 4,516 | ||||||
Verizon Communications Inc. 3.15% 2030 | 575 | 645 | ||||||
Vertical U.S. Newco Inc. 5.25% 20272 | 225 | 239 | ||||||
VICI Properties LP 4.25% 20262 | 175 | 182 | ||||||
VICI Properties LP 4.625% 20292 | 45 | 48 | ||||||
VICI Properties LP / VICI Note Co. Inc. 3.50% 20252 | 110 | 113 | ||||||
VICI Properties LP / VICI Note Co. Inc. 4.125% 20302 | 250 | 264 | ||||||
Vine Oil & Gas LP 8.75% 20232 | 175 | 140 | ||||||
Virgin Media O2 4.25% 20312 | 275 | 282 | ||||||
Volkswagen Group of America Finance, LLC 4.00% 20212 | 1,900 | 1,959 | ||||||
Volkswagen Group of America Finance, LLC 4.625% 20252 | 1,280 | 1,493 | ||||||
Walt Disney Company 2.65% 2031 | 5,520 | 6,053 | ||||||
Warner Music Group 3.875% 20302 | 210 | 224 | ||||||
WEA Finance LLC 3.75% 20242 | 535 | 565 | ||||||
Wells Fargo & Company 2.393% 2028 (USD-SOFR + 2.10% on 6/2/2027)1 | 11,775 | 12,542 | ||||||
WESCO Distribution, Inc. 7.125% 20252 | 195 | 215 | ||||||
WESCO Distribution, Inc. 7.25% 20282 | 215 | 245 | ||||||
Western Gas Partners LP 4.50% 2028 | 230 | 239 | ||||||
Western Global Airlines LLC 10.375% 20252 | 80 | 89 | ||||||
Western Midstream Operating, LP 4.10% 20251 | 155 | 160 | ||||||
Western Midstream Operating, LP 4.75% 2028 | 70 | 73 | ||||||
Westfield Corp. Ltd. 3.15% 20222 | 245 | 249 | ||||||
Westpac Banking Corp. 2.894% 2030 (UST Yield Curve Rate T Note Constant Maturity 5-year + 1.35% on 2/4/2025)1 | 2,900 | 3,041 | ||||||
Williams Companies, Inc. 3.50% 2030 | 1,024 | 1,161 | ||||||
Williams Partners LP 4.30% 2024 | 820 | 905 | ||||||
Wyndham Worldwide Corp. 4.375% 20282 | 230 | 239 | ||||||
Wynn Las Vegas, LLC and Wynn Capital Corp. 4.25% 20232 | 228 | 232 | ||||||
Wynn Macau, Ltd. 5.625% 20282 | 200 | 210 | ||||||
Wynn Resorts Ltd. 7.75% 20252 | 180 | 195 | ||||||
Xcel Energy Inc. 3.35% 2026 | 2,581 | 2,914 | ||||||
Xerox Corp. 5.50% 20282 | 450 | 478 | ||||||
Ziggo Bond Co. BV 5.125% 20302 | 200 | 211 | ||||||
American Funds Insurance Series 195
Table of Contents
CapitalWorld Bond Fund (formerly Global Bond Fund) (continued)
Bonds, notes & other debt instruments (continued)
| Principal amount | Value | |||||||
| (000) | (000) | |||||||
U.S. dollars (continued) | ||||||||
Ziggo Bond Finance BV 5.50% 20272 | $ | 412 | $ | 431 | ||||
Ziggo Bond Finance BV 4.875% 20302 | 100 | 105 | ||||||
Zimmer Holdings, Inc. 3.15% 2022 | 790 | 813 | ||||||
|
| |||||||
| 924,718 | ||||||||
|
| |||||||
Total bonds, notes & other debt instruments (cost: $2,015,926,000) | 2,189,999 | |||||||
|
| |||||||
Common stocks 0.08% | ||||||||
| Shares | ||||||||
U.S. dollars 0.08% | ||||||||
Associated Materials Group Inc.11,12,13 | 174,911 | 1,098 | ||||||
Oasis Petroleum Inc.13 | 8,735 | 324 | ||||||
Weatherford International13 | 29,931 | 180 | ||||||
Tribune Resources, LLC11,12,13 | 158,988 | 145 | ||||||
ACR III LSC Holdings LLC11,12,13 | 49 | 74 | ||||||
Advanz Pharma Corp. Ltd.13,14 | 9,130 | 40 | ||||||
Advanz Pharma Corp. Ltd.13 | 6,028 | 27 | ||||||
McDermott International, Inc.13 | 4,287 | 3 | ||||||
Jonah Energy Parent LLC11,12,13 | 130 | 2 | ||||||
Sable Permian Resources, LLC, units11,12,13 | 2,905,980 | — | 15 | |||||
|
| |||||||
Total common stocks (cost: $4,556,000) | 1,893 | |||||||
|
| |||||||
Rights & warrants 0.00% | ||||||||
U.S. dollars 0.00% | ||||||||
Tribune Resources, LLC, Class A, warrants, expire 202311,12,13 | 53,128 | — | 15 | |||||
Tribune Resources, LLC, Class B, warrants, expire 202311,12,13 | 41,322 | — | 15 | |||||
Tribune Resources, LLC, Class C, warrants, expire 202311,12,13 | 39,060 | — | 15 | |||||
|
| |||||||
Total rights & warrants (cost: $8,000) | — | 15 | ||||||
|
| |||||||
Short-term securities 6.44% | ||||||||
Money market investments 6.28% | ||||||||
Capital Group Central Cash Fund 0.12%16,17 | 1,470,026 | 147,017 | ||||||
|
| |||||||
| Principal amount | ||||||||
| (000) | ||||||||
Bills & notes of governments outside the U.S. 0.16% | ||||||||
Greek Treasury Bill 0.13% due 1/4/2021 | € | 3,000 | 3,665 | |||||
|
| |||||||
Total short-term securities (cost: $150,388,000) | 150,682 | |||||||
|
| |||||||
Total investment securities 100.16% (cost: $2,170,878,000) | 2,342,574 | |||||||
Other assets less liabilities (0.16)% | (3,829 | ) | ||||||
|
| |||||||
Net assets 100.00% | $ | 2,338,745 | ||||||
|
| |||||||
Futures contracts
Contracts | Type | Number of contracts | Expiration | Notional amount18 (000) | Value at 12/31/202019 (000) | Unrealized appreciation (depreciation) at 12/31/2020 (000) | ||||||||||||||||||
5 Year U.S. Treasury Note Futures | Long | 53 | April 2021 | $ | 5,300 | $ | 6,687 | $ | 14 | |||||||||||||||
10 Year Japanese Government Bond Futures | Long | 1 | March 2021 | ¥ | 100,000 | 1,471 | (1 | ) | ||||||||||||||||
10 Year Ultra U.S. Treasury Note Futures | Short | 256 | March 2021 | $ | (25,600 | ) | (40,028 | ) | 88 | |||||||||||||||
196 American Funds Insurance Series
Table of Contents
CapitalWorld Bond Fund (formerly Global Bond Fund) (continued)
Futures contracts (continued)
Contracts | Type | Number of contracts | Expiration | Notional amount18 (000) | Value at 12/31/202019 (000) | Unrealized appreciation (depreciation) at 12/31/2020 (000) | ||||||||||||||||||
10 Year U.S. Treasury Note Futures | Short | 363 | March 2021 | (36,300 | ) | $ | (50,122 | ) | $ | (53 | ) | |||||||||||||
30 Year Euro-Buxl Futures | Long | 50 | March 2021 | € | 5,000 | 13,758 | 206 | |||||||||||||||||
30 Year Ultra U.S. Treasury Bond Futures | Long | 75 | March 2021 | $ | 7,500 | 16,017 | (101 | ) | ||||||||||||||||
|
| |||||||||||||||||||||||
| $ | 153 | |||||||||||||||||||||||
|
| |||||||||||||||||||||||
Forward currency contracts
| Contract amount | Unrealized appreciation (depreciation) | |||||||||||||||
| Purchases (000) | Sales (000) | Counterparty | Settlement date | at 12/31/2020 (000) | ||||||||||||
| AUD | 1,830 | USD | 1,338 | Bank of New York Mellon | 1/6/2021 | $ | 73 | |||||||||
| USD | 1,384 | AUD | 1,830 | HSBC Bank | 1/6/2021 | (27 | ) | |||||||||
| USD | 7,916 | NZD | 11,400 | Bank of America | 1/6/2021 | (287 | ) | |||||||||
| EUR | 5,320 | USD | 6,419 | Bank of America | 1/7/2021 | 81 | ||||||||||
| EUR | 2,080 | USD | 2,519 | HSBC Bank | 1/7/2021 | 23 | ||||||||||
| USD | 4,624 | EUR | 3,790 | Citibank | 1/7/2021 | (7 | ) | |||||||||
| JPY | 11,212,630 | USD | 107,405 | Goldman Sachs | 1/8/2021 | 1,198 | ||||||||||
| EUR | 74,298 | USD | 89,863 | JPMorgan Chase | 1/8/2021 | 924 | ||||||||||
| CAD | 16,330 | USD | 12,628 | Standard Chartered Bank | 1/8/2021 | 202 | ||||||||||
| SEK | 23,400 | USD | 2,746 | Bank of America | 1/8/2021 | 99 | ||||||||||
| MXN | 220,660 | USD | 10,980 | HSBC Bank | 1/8/2021 | 98 | ||||||||||
| AUD | 1,260 | USD | 928 | HSBC Bank | 1/8/2021 | 44 | ||||||||||
| NOK | 10,500 | USD | 1,188 | Bank of New York Mellon | 1/8/2021 | 36 | ||||||||||
| CHF | 800 | USD | 894 | Bank of America | 1/8/2021 | 10 | ||||||||||
| CZK | 181,540 | EUR | 6,914 | HSBC Bank | 1/8/2021 | 5 | ||||||||||
| EUR | 10,116 | DKK | 75,300 | Bank of New York Mellon | 1/8/2021 | (2 | ) | |||||||||
| USD | 2,299 | EUR | 1,890 | Citibank | 1/8/2021 | (11 | ) | |||||||||
| PLN | 12,600 | USD | 3,397 | Citibank | 1/8/2021 | (24 | ) | |||||||||
| USD | 2,283 | MXN | 46,000 | Goldman Sachs | 1/8/2021 | (26 | ) | |||||||||
| USD | 1,861 | AUD | 2,460 | HSBC Bank | 1/8/2021 | (36 | ) | |||||||||
| USD | 984 | ZAR | 15,210 | Bank of America | 1/8/2021 | (49 | ) | |||||||||
| USD | 2,623 | GBP | 1,970 | Citibank | 1/8/2021 | (71 | ) | |||||||||
| USD | 6,270 | CZK | 136,930 | Citibank | 1/8/2021 | (106 | ) | |||||||||
| USD | 12,699 | CAD | 16,330 | Goldman Sachs | 1/8/2021 | (130 | ) | |||||||||
| USD | 17,096 | ILS | 56,300 | Citibank | 1/8/2021 | (427 | ) | |||||||||
| USD | 15,021 | AUD | 20,170 | UBS AG | 1/8/2021 | (531 | ) | |||||||||
| CNH | 137,510 | USD | 21,027 | UBS AG | 1/12/2021 | 102 | ||||||||||
| USD | 2,914 | THB | 88,000 | Citibank | 1/12/2021 | (24 | ) | |||||||||
| JPY | 1,485,880 | USD | 14,244 | HSBC Bank | 1/14/2021 | 149 | ||||||||||
| COP | 4,735,500 | USD | 1,368 | Citibank | 1/14/2021 | 19 | ||||||||||
| KRW | 28,454,610 | USD | 26,193 | Citibank | 1/14/2021 | 7 | ||||||||||
| USD | 2,244 | IDR | 31,688,220 | Standard Chartered Bank | 1/14/2021 | (8 | ) | |||||||||
| USD | 3,313 | INR | 244,900 | HSBC Bank | 1/14/2021 | (34 | ) | |||||||||
| USD | 1,765 | CLP | 1,302,100 | Citibank | 1/14/2021 | (67 | ) | |||||||||
| USD | 6,914 | KRW | 7,636,890 | Citibank | 1/14/2021 | (117 | ) | |||||||||
| USD | 5,644 | DKK | 34,570 | Goldman Sachs | 1/19/2021 | (34 | ) | |||||||||
| USD | 10,438 | NZD | 14,740 | Goldman Sachs | 1/21/2021 | (169 | ) | |||||||||
| CAD | 13,240 | USD | 10,150 | Citibank | 1/29/2021 | 253 | ||||||||||
| CAD | 13,190 | USD | 10,114 | Bank of America | 1/29/2021 | 249 | ||||||||||
| MXN | 76,040 | USD | 3,645 | Goldman Sachs | 1/29/2021 | 163 | ||||||||||
| USD | 2,093 | ZAR | 30,700 | UBS AG | 1/29/2021 | 13 | ||||||||||
| EUR | 5,779 | DKK | 43,000 | Citibank | 1/29/2021 | 2 | ||||||||||
| EUR | 722 | DKK | 5,372 | Goldman Sachs | 1/29/2021 | — | 15 | |||||||||
American Funds Insurance Series 197
Table of Contents
CapitalWorld Bond Fund (formerly Global Bond Fund) (continued)
Forward currency contracts (continued)
| Contract amount | Unrealized appreciation (depreciation) | |||||||||||||||
| Purchases (000) | Sales (000) | Counterparty | Settlement date | at 12/31/2020 (000) | ||||||||||||
| EUR | 722 | DKK | 5,372 | Citibank | 1/29/2021 | $ | — | 15 | ||||||||
| EUR | 14,020 | DKK | 104,345 | Citibank | 1/29/2021 | — | 15 | |||||||||
| USD | 1,769 | ZAR | 29,280 | Bank of America | 1/29/2021 | (215 | ) | |||||||||
| USD | 7,227 | MXN | 155,490 | Morgan Stanley | 1/29/2021 | (560 | ) | |||||||||
| USD | 19,929 | CAD | 26,430 | Citibank | 1/29/2021 | (837 | ) | |||||||||
| CAD | 17,000 | USD | 13,128 | UBS AG | 2/10/2021 | 230 | ||||||||||
| RUB | 422,320 | USD | 5,511 | Goldman Sachs | 2/10/2021 | 175 | ||||||||||
|
| |||||||||||||||
| $ | 356 | |||||||||||||||
|
| |||||||||||||||
Swap contracts
Interest rate swaps
Receive | Pay | Expiration date | Notional (000) | Value at 12/31/2020 (000) | Upfront premium paid (000) | Unrealized depreciation at 12/31/2020 (000) | ||||||||||||||||
0.0079% | 6-month JPY-LIBOR | 4/8/2030 | ¥ | 1,620,000 | $ | (32 | ) | $ | 32 | $ | (64 | ) | ||||||||||
Credit default swaps
Centrally cleared credit default swaps on credit indices — buy protection
Receive | Pay/ Payment frequency | Expiration date | Notional (000) | Value at 12/31/2020 (000) | Upfront premium paid (000) | Unrealized depreciation at 12/31/2020 (000) | ||||||
CDX.EM.34 | 1.00%/Quarterly | 12/20/2025 | $25,000 | $602 | $1,300 | $(698) |
Centrally cleared credit default swaps on credit indices — buy protection
Receive | Pay/ Payment frequency | Expiration | Notional | Value at | Upfront | Unrealized | ||||||
CDX.EM.34 | 1.00%/Quarterly | 12/20/2025 | $25,000 | $602 | $1,300 | $(698) |
Centrally cleared credit default swaps on credit indices — sell protection
Receive/ Payment frequency | Pay | Expiration date | Notional (000) | Value at 12/31/2020 (000) | Upfront premium paid (000) | Unrealized appreciation at 12/31/2020 (000) | ||||||||||||||||
1.00%/Quarterly | CDX.NA.IG.35 | 12/20/2025 | $ | 13,090 | $ | 321 | $ | 290 | $ | 31 | ||||||||||||
Investments in affiliates17
| Value of affiliate at 1/1/2020 (000) | Additions (000) | Reductions (000) | Net realized gain (000) | Net unrealized depreciation (000) | Value of affiliate at 12/31/2020 (000) | Dividend income (000) | ||||||||||||||||||||||
Short-term securities 6.29% | ||||||||||||||||||||||||||||
Money market investments 6.29% | ||||||||||||||||||||||||||||
Capital Group Central Cash Fund 0.12%16 | $ | 77,745 | $ | 900,757 | $ | 831,352 | $ | 35 | $ | (168 | ) | $ | 147,017 | $ | 477 | |||||||||||||
198 American Funds Insurance Series
Table of Contents
CapitalWorld Bond Fund (formerly Global Bond Fund) (continued)
| 1 | Step bond; coupon rate may change at a later date. |
| 2 | Acquired in a transaction exempt from registration under Rule 144A of the Securities Act of 1933. May be resold in the U.S. in transactions exempt from registration, normally to qualified institutional buyers. The total value of all such securities was $282,947,000, which represented 12.10% of the net assets of the fund. |
| 3 | Index-linked bond whose principal amount moves with a government price index. |
| 4 | Principal payments may be made periodically. Therefore, the effective maturity date may be earlier than the stated maturity date. |
| 5 | Loan participations and assignments; may be subject to legal or contractual restrictions on resale. The total value of all such loans was $2,635,000, which represented .11% of the net assets of the fund. |
| 6 | Coupon rate may change periodically. Reference rate and spread are as of the most recent information available. Some coupon rates are determined by the issuer or agent based on current market conditions; therefore, the reference rate and spread are not available. |
| 7 | Scheduled interest and/or principal payment was not received. |
| 8 | Payment in kind; the issuer has the option of paying additional securities in lieu of cash. Most recent payment was 100% cash unless otherwise noted. |
| 9 | All or a portion of this security was pledged as collateral. The total value of pledged collateral was $4,515,000, which represented .19% of the net assets of the fund. |
| 10 | Purchased on a TBA basis. |
| 11 | Valued under fair value procedures adopted by authority of the board of trustees. The total value of all such securities was $1,319,000, which represented .06% of the net assets of the fund. |
| 12 | Value determined using significant unobservable inputs. |
| 13 | Security did not produce income during the last 12 months. |
| 14 | Acquired through a private placement transaction exempt from registration under the Securities Act of 1933. May be subject to legal or contractual restrictions on resale. Further details on this holding appear below. |
| 15 | Amount less than one thousand. |
| 16 | Rate represents the seven-day yield at 12/31/2020. |
| 17 | Part of the same group of investment companies as the fund as defined under the Investment Company Act of 1940. |
| 18 | Notional amount is calculated based on the number of contracts and notional contract size. |
| 19 | Value is calculated based on the notional amount and current market price. |
Private placement security | Acquisition date | Cost (000) | Value (000) | Percent of net assets | ||||||||
Advanz Pharma Corp. Ltd. | 8/31/2018 | $ | 116 | $ | 40 | .00% | ||||||
Key to abbreviations and symbols
AUD/A$ = Australian dollars
BRL = Brazilian reais
CAD/C$ = Canadian dollars
CHF = Swiss francs
CLP = Chilean pesos
CNH/CNY = Chinese yuan renminbi
COP = Colombian pesos
CZK = Czech korunas
DKK/DKr = Danish kroner
DOP = Dominican pesos
EUR/€ = Euros
EURIBOR = Euro Interbank Offered Rate
GBP/£ = British pounds
IDR = Indonesian rupiah
ILS = Israeli shekels
INR = Indian rupees
JPY/¥ = Japanese yen
KRW = South Korean won
LIBOR = London Interbank Offered Rate
MXN = Mexican pesos
MYR = Malaysian ringgits
NOK/NKr = Norwegian kroner
NZD/NZ$ = New Zealand dollars
PEN = Peruvian nuevos soles
PLN = Polish zloty
Ref. = Refunding
Rev. = Revenue
RON = Romanian leu
RUB = Russian rubles
S$ = Singapore dollars
SEK = Swedish kronor
SOFR = Secured Overnight Financing Rate
TBA = To-be-announced
THB = Thai baht
UAH = Ukrainian hryvnia
USD/$ = U.S. dollars
ZAR = South African rand
See notes to financial statements.
American Funds Insurance Series 199
Table of Contents
Investment portfolio December 31, 2020
Bonds, notes & other debt instruments 89.34%
| Principal amount (000) | Value (000) | |||||||
Corporate bonds, notes & loans 89.33% | ||||||||
Communication services 13.43% | ||||||||
Brightstar Escrow Corp. 9.75% 20251 | $ | 575 | $ | 616 | ||||
Cars.com Inc. 6.375% 20281 | 625 | 665 | ||||||
CCO Holdings LLC and CCO Holdings Capital Corp. 4.00% 20231 | 1,155 | 1,164 | ||||||
CCO Holdings LLC and CCO Holdings Capital Corp. 5.50% 20261 | 263 | 273 | ||||||
CCO Holdings LLC and CCO Holdings Capital Corp. 5.75% 20261 | 3,182 | 3,287 | ||||||
CCO Holdings LLC and CCO Holdings Capital Corp. 5.00% 20281 | 96 | 102 | ||||||
CCO Holdings LLC and CCO Holdings Capital Corp. 5.375% 20291 | 24 | 26 | ||||||
CCO Holdings LLC and CCO Holdings Capital Corp. 4.50% 20301 | 304 | 323 | ||||||
CCO Holdings LLC and CCO Holdings Capital Corp. 4.75% 20301 | 787 | 850 | ||||||
CCO Holdings LLC and CCO Holdings Capital Corp. 4.25% 20311 | 4,535 | 4,785 | ||||||
CCO Holdings LLC and CCO Holdings Capital Corp. 4.50% 20321 | 2,549 | 2,725 | ||||||
CenturyLink, Inc. 6.75% 2023 | 2,235 | 2,493 | ||||||
CenturyLink, Inc. 7.50% 2024 | 583 | 661 | ||||||
CenturyLink, Inc. 5.125% 20261 | 2,069 | 2,188 | ||||||
CenturyLink, Inc. 4.00% 20271 | 134 | 139 | ||||||
Clear Channel Worldwide Holdings, Inc. 9.25% 2024 | 561 | 569 | ||||||
Diamond Sports Group LLC 5.375% 20261 | 993 | 809 | ||||||
Diamond Sports Group LLC 6.625% 20271 | 1,155 | 700 | ||||||
Discovery Communications, Inc. 4.65% 2050 | 442 | 553 | ||||||
Embarq Corp. 7.995% 2036 | 927 | 1,145 | ||||||
Epicor Software Corp., Term Loan, (3-month USD-LIBOR + 4.25%) 5.25% 20272,3 | 75 | 75 | ||||||
Epicor Software Corp., Term Loan, (3-month USD-LIBOR + 7.75%) 8.75% 20282,3 | 525 | 549 | ||||||
Front Range BidCo, Inc. 6.125% 20281 | 1,089 | 1,153 | ||||||
Frontier Communications Corp. 10.50% 20224 | 4,500 | 2,356 | ||||||
Frontier Communications Corp. 5.875% 20271 | 1,550 | 1,679 | ||||||
Frontier Communications Corp. 5.00% 20281 | 3,500 | 3,655 | ||||||
Frontier Communications Corp. 6.75% 20291 | 1,675 | 1,795 | ||||||
Gogo Inc. 9.875% 20241 | 10,414 | 11,170 | ||||||
Gray Television, Inc. 7.00% 20271 | 808 | 886 | ||||||
iHeartCommunications, Inc. 5.25% 20271 | 1,235 | 1,296 | ||||||
Inmarsat PLC 6.75% 20261 | 1,475 | 1,591 | ||||||
Intelsat Jackson Holding Co. 8.00% 20241 | 1,675 | 1,718 | ||||||
Intelsat Jackson Holding Co. 8.50% 20241,4 | 3,175 | 2,278 | ||||||
Intelsat Jackson Holding Co., Term Loan, (3-month USD-LIBOR + 5.50%) 6.50% 20212,3 | 1,212 | 1,241 | ||||||
Intelsat Jackson Holding Co., Term Loan, 6.625% 20242 | 3,900 | 3,976 | ||||||
Lamar Media Corp. 3.75% 2028 | 61 | 63 | ||||||
Lamar Media Corp. 4.875% 2029 | 300 | 320 | ||||||
Lamar Media Corp. 4.00% 2030 | 260 | 270 | ||||||
Liberty Global PLC 5.50% 20281 | 656 | 693 | ||||||
Ligado Networks LLC 15.50% 20231,5 | 1,750 | 1,706 | ||||||
Live Nation Entertainment, Inc. 3.75% 20281 | 450 | 456 | ||||||
Match Group, Inc. 4.625% 20281 | 1,100 | 1,155 | ||||||
MDC Partners Inc. 6.50% 20241 | 5,170 | 5,249 | ||||||
Meredith Corp. 6.875% 2026 | 2,239 | 2,187 | ||||||
National CineMedia, LLC 5.875% 20281 | 250 | 213 | ||||||
Netflix, Inc. 5.375% 2021 | 1,300 | 1,307 | ||||||
Netflix, Inc. 4.875% 2028 | 360 | 407 | ||||||
Netflix, Inc. 4.875% 20301 | 174 | 200 | ||||||
Nexstar Broadcasting, Inc. 4.75% 20281 | 2,500 | 2,620 | ||||||
Nexstar Escrow Corp. 5.625% 20271 | 289 | 310 | ||||||
Numericable Group SA 7.375% 20261 | 1,049 | 1,105 | ||||||
Qwest Capital Funding, Inc. 6.875% 2028 | 660 | 705 | ||||||
Scripps Escrow II, Inc. 3.875% 20291 | 1,125 | 1,175 | ||||||
Sinclair Television Group, Inc. 5.125% 20271 | 345 | 352 | ||||||
Sinclair Television Group, Inc. 4.125% 20301 | 1,800 | 1,847 | ||||||
Sirius XM Radio Inc. 4.625% 20241 | 74 | 77 | ||||||
Sirius XM Radio Inc. 4.125% 20301 | 345 | 368 | ||||||
Sprint Corp. 11.50% 2021 | 987 | 1,073 | ||||||
Sprint Corp. 7.625% 2026 | 2,000 | 2,485 | ||||||
Sprint Corp. 6.875% 2028 | 3,671 | 4,847 | ||||||
Sprint Corp. 8.75% 2032 | 2,440 | 3,866 | ||||||
200 American Funds Insurance Series
Table of Contents
High-Income Bond Fund (continued)
Bonds, notes & other debt instruments (continued)
| Principal amount (000) | Value (000) | |||||||
Corporate bonds, notes & loans (continued) | ||||||||
Communication services (continued) | ||||||||
TEGNA Inc. 4.75% 20261 | $ | 850 | $ | 909 | ||||
TEGNA Inc. 4.625% 20281 | 635 | 650 | ||||||
TEGNA Inc. 5.00% 2029 | 716 | 757 | ||||||
T-Mobile US, Inc. 3.875% 20301 | 292 | 339 | ||||||
T-Mobile US, Inc. 4.50% 20501 | 379 | 468 | ||||||
Total Play Telecomunicaciones, SA de CV 7.50% 20251 | 725 | 725 | ||||||
Trilogy International Partners, LLC 8.875% 20221 | 4,500 | 4,353 | ||||||
Uniti Group LP / Uniti Fiber Holdings Inc. / CSL Capital LLC 7.875% 20251 | 75 | 81 | ||||||
Univision Communications Inc. 5.125% 20251 | 3,195 | 3,225 | ||||||
Univision Communications Inc. 6.625% 20271 | 3,050 | 3,281 | ||||||
Virgin Media O2 4.25% 20311 | 1,925 | 1,971 | ||||||
Virgin Media Secured Finance PLC 4.50% 20301 | 790 | 826 | ||||||
Vodafone Group PLC 7.00% 2079 (5-year USD Swap + 4.873% on 4/4/2029)6 | 105 | 131 | ||||||
Warner Music Group 5.50% 20261 | 228 | 236 | ||||||
Warner Music Group 3.875% 20301 | 850 | 905 | ||||||
Ziggo Bond Co. BV 5.125% 20301 | 419 | 443 | ||||||
Ziggo Bond Finance BV 5.50% 20271 | 1,491 | 1,559 | ||||||
Ziggo Bond Finance BV 4.875% 20301 | 1,075 | 1,132 | ||||||
|
| |||||||
| 116,538 | ||||||||
|
| |||||||
Energy 12.44% | ||||||||
American Energy-Permian Basin, LLC / AEPB Finance Corp. 12.00% 20241,4 | 1,934 | 14 | ||||||
Antero Resources Corp. 5.375% 2024 | 875 | 855 | ||||||
Antero Resources Corp. 7.875% 20261 | 92 | 95 | ||||||
Apache Corp. 4.625% 2025 | 770 | 809 | ||||||
Apache Corp. 4.875% 2027 | 1,360 | 1,444 | ||||||
Apache Corp. 4.375% 2028 | 791 | 825 | ||||||
Apache Corp. 6.00% 2037 | 165 | 183 | ||||||
Apache Corp. 5.10% 2040 | 795 | 854 | ||||||
Apache Corp. 4.75% 2043 | 295 | 306 | ||||||
Ascent Resources - Utica LLC 7.00% 20261 | 765 | 734 | ||||||
Ascent Resources - Utica LLC 9.00% 20271 | 120 | 134 | ||||||
Ascent Resources - Utica LLC 8.25% 20281 | 271 | 271 | ||||||
Ascent Resources - Utica LLC, Term Loan, (3-month USD-LIBOR + 9.00%) 9.233% 20251,2,3 | 228 | 249 | ||||||
Blue Racer Midstream LLC and Blue Racer Finance Corp. 6.125% 20221 | 1,300 | 1,303 | ||||||
Blue Racer Midstream LLC and Blue Racer Finance Corp. 7.625% 20251 | 871 | 930 | ||||||
Carrizo Oil & Gas Inc. 6.25% 2023 | 750 | 478 | ||||||
Cenovus Energy Inc. 5.375% 2025 | 755 | 852 | ||||||
Cenovus Energy Inc. 6.75% 2039 | 125 | 165 | ||||||
Cenovus Energy Inc. 5.40% 2047 | 400 | 470 | ||||||
Centennial Resource Production, LLC 6.875% 20271 | 465 | 335 | ||||||
Cheniere Energy Partners, LP 5.625% 2026 | 1,146 | 1,197 | ||||||
Cheniere Energy Partners, LP 4.50% 2029 | 583 | 618 | ||||||
Cheniere Energy, Inc. 7.00% 2024 | 319 | 373 | ||||||
Cheniere Energy, Inc. 5.875% 2025 | 495 | 576 | ||||||
Cheniere Energy, Inc. 4.625% 20281 | 5,055 | 5,314 | ||||||
Chesapeake Energy Corp. 4.875% 20224 | 4,300 | 215 | ||||||
Chesapeake Energy Corp. 11.50% 20251,4 | 2,824 | 498 | ||||||
Chesapeake Energy Corp., Term Loan, (3-month USD-LIBOR + 8.00%) 8.223% 20242,3,4 | 2,627 | 2,154 | ||||||
CITGO Petroleum Corp. 7.00% 20251 | 500 | 500 | ||||||
CNX Resources Corp. 7.25% 20271 | 935 | 1,002 | ||||||
CNX Resources Corp. 6.00% 20291 | 1,345 | 1,380 | ||||||
Comstock Resources, Inc. 9.75% 2026 | 1,363 | 1,464 | ||||||
Constellation Oil Services Holding SA 10.00% 2024 (100% PIK)1,5 | 7,784 | 2,219 | ||||||
Continental Resources Inc. 5.75% 20311 | 655 | 728 | ||||||
Convey Park Energy LLC 7.50% 20251 | 417 | 423 | ||||||
DCP Midstream LP 7.375% 2049 (3-month USD-LIBOR + 5.148% on 12/15/2022)6 | 270 | 225 | ||||||
DCP Midstream Operating LP 4.95% 2022 | 1,072 | 1,108 | ||||||
American Funds Insurance Series 201
Table of Contents
High-Income Bond Fund (continued)
Bonds, notes & other debt instruments (continued)
| Principal amount (000) | Value (000) | |||||||
Corporate bonds, notes & loans (continued) | ||||||||
Energy (continued) | ||||||||
Diamond Offshore Drilling, Inc. 7.875% 20254 | $ | 508 | $ | 65 | ||||
Diamond Offshore Drilling, Inc. 4.875% 20434 | 1,362 | 173 | ||||||
Endeavor Energy Resources, LP 6.625% 20251 | 850 | 911 | ||||||
Energy Transfer Operating, LP 5.00% 2050 | 2,051 | 2,223 | ||||||
EnLink Midstream Partners, LLC 5.625% 20281 | 660 | 676 | ||||||
EnLink Midstream Partners, LP 4.15% 2025 | 400 | 393 | ||||||
EQM Midstream Partners, LP 4.75% 2023 | 400 | 421 | ||||||
EQM Midstream Partners, LP 4.125% 2026 | 127 | 128 | ||||||
EQM Midstream Partners, LP 6.50% 20271 | 2,365 | 2,666 | ||||||
EQM Midstream Partners, LP 5.50% 2028 | 1,231 | 1,348 | ||||||
EQT Corp. 7.875% 2025 | 630 | 718 | ||||||
EQT Corp. 3.90% 2027 | 125 | 124 | ||||||
EQT Corp. 5.00% 2029 | 480 | 507 | ||||||
EQT Corp. 8.75% 2030 | 400 | 489 | ||||||
Extraction Oil & Gas, Inc. 5.625% 20261,4 | 1,575 | 289 | ||||||
Genesis Energy, LP 5.625% 2024 | 150 | 146 | ||||||
Genesis Energy, LP 6.50% 2025 | 2,235 | 2,178 | ||||||
Genesis Energy, LP 8.00% 2027 | 1,528 | 1,524 | ||||||
Harvest Midstream I, LP 7.50% 20281 | 1,325 | 1,413 | ||||||
Hess Midstream Partners LP 5.125% 20281 | 687 | 719 | ||||||
Hilcorp Energy I, LP 5.75% 20251 | 775 | 787 | ||||||
Lealand Finance Company BV, Term Loan, (3-month USD-LIBOR + 3.00%) 3.146% 20242,3,7 | 12 | 10 | ||||||
Lealand Finance Company BV, Term Loan, | ||||||||
(3-month USD-LIBOR + 4.00%) 4.146% 20252,3,5 | 146 | 100 | ||||||
MPLX LP 5.50% 2049 | 417 | 549 | ||||||
Murphy Oil Corp. 6.875% 2024 | 1,000 | 1,019 | ||||||
Nabors Industries Inc. 5.75% 2025 | 355 | 186 | ||||||
New Fortress Energy Inc. 6.75% 20251 | 1,034 | 1,097 | ||||||
NGL Energy Partners LP 7.50% 2023 | 767 | 545 | ||||||
NGL Energy Partners LP 6.125% 2025 | 3,179 | 2,023 | ||||||
Northriver Midstream Finance LP 5.625% 20261 | 625 | 647 | ||||||
NuStar Logistics, LP 6.75% 20211 | 15 | 15 | ||||||
NuStar Logistics, LP 6.00% 2026 | 686 | 743 | ||||||
Occidental Petroleum Corp. 2.70% 2023 | 275 | 275 | ||||||
Occidental Petroleum Corp. 2.90% 2024 | 2,093 | 2,018 | ||||||
Occidental Petroleum Corp. 5.50% 2025 | 755 | 789 | ||||||
Occidental Petroleum Corp. 5.875% 2025 | 710 | 757 | ||||||
Occidental Petroleum Corp. 8.00% 2025 | 1,475 | 1,683 | ||||||
Occidental Petroleum Corp. 3.40% 2026 | 600 | 573 | ||||||
Occidental Petroleum Corp. 6.375% 2028 | 575 | 609 | ||||||
Occidental Petroleum Corp. 3.50% 2029 | 210 | 192 | ||||||
Occidental Petroleum Corp. 6.625% 2030 | 885 | 962 | ||||||
Occidental Petroleum Corp. 8.875% 2030 | 375 | 441 | ||||||
Occidental Petroleum Corp. 6.125% 2031 | 845 | 906 | ||||||
Occidental Petroleum Corp. 4.20% 2048 | 165 | 134 | ||||||
ONEOK, Inc. 5.85% 2026 | 273 | 327 | ||||||
ONEOK, Inc. 4.95% 2047 | 23 | 26 | ||||||
ONEOK, Inc. 5.20% 2048 | 282 | 329 | ||||||
ONEOK, Inc. 7.15% 2051 | 83 | 115 | ||||||
Ovintiv Inc. 6.50% 2034 | 550 | 637 | ||||||
Parsley Energy, Inc. 5.25% 20251 | 150 | 157 | ||||||
PBF Holding Company LLC 9.25% 20251 | 235 | 231 | ||||||
PDC Energy Inc. 5.75% 2026 | 1,100 | 1,138 | ||||||
Peabody Energy Corp. 6.00% 20221 | 1,738 | 1,272 | ||||||
Peabody Energy Corp. 6.375% 20251 | 100 | 55 | ||||||
Petrobras Global Finance Co. 5.60% 2031 | 250 | 288 | ||||||
Petrobras Global Finance Co. 6.90% 2049 | 375 | 476 | ||||||
Petrobras Global Finance Co. 6.75% 2050 | 850 | 1,057 | ||||||
Petróleos Mexicanos 6.875% 20251 | 350 | 384 | ||||||
Petróleos Mexicanos 6.49% 2027 | 495 | 523 | ||||||
202 American Funds Insurance Series
Table of Contents
High-Income Bond Fund (continued)
Bonds, notes & other debt instruments (continued)
| Principal amount (000) | Value (000) | |||||||
Corporate bonds, notes & loans (continued) | ||||||||
Energy (continued) | ||||||||
Petróleos Mexicanos 5.35% 2028 | $ | 449 | $ | 444 | ||||
Petróleos Mexicanos 6.375% 2045 | 210 | 193 | ||||||
Petróleos Mexicanos 6.35% 2048 | 108 | 98 | ||||||
Petróleos Mexicanos 7.69% 2050 | 651 | 657 | ||||||
PowerTeam Services, LLC 9.033% 20251 | 560 | 624 | ||||||
QEP Resources, Inc. 5.625% 2026 | 435 | 478 | ||||||
Range Resources Corp. 4.875% 2025 | 472 | 447 | ||||||
Rattler Midstream Partners LP 5.625% 20251 | 1,105 | 1,169 | ||||||
Rockies Express Pipeline LLC 4.95% 20291 | 1,000 | 1,042 | ||||||
Sabine Pass Liquefaction, LLC 4.50% 20301 | 256 | 304 | ||||||
Sanchez Energy Corp. 7.25% 20231,4 | 739 | 7 | ||||||
SM Energy Co. 5.625% 2025 | 247 | 201 | ||||||
SM Energy Co. 6.625% 2027 | 290 | 233 | ||||||
Southwestern Energy Co. 6.45% 20256 | 935 | 972 | ||||||
Southwestern Energy Co. 7.50% 2026 | 1,224 | 1,286 | ||||||
Southwestern Energy Co. 7.75% 2027 | 72 | 78 | ||||||
Southwestern Energy Co. 8.375% 2028 | 865 | 940 | ||||||
Sunoco LP 5.50% 2026 | 513 | 528 | ||||||
Sunoco LP 6.00% 2027 | 147 | 156 | ||||||
Sunoco LP 4.50% 20291 | 1,205 | 1,255 | ||||||
Tallgrass Energy Partners, LP 5.50% 20241 | 1,000 | 1,020 | ||||||
Tallgrass Energy Partners, LP 7.50% 20251 | 585 | 633 | ||||||
Tapstone Energy, Term Loan, (3-month USD-LIBOR + 4.00%) 4.741% 20242,3,7,8 | 11 | 6 | ||||||
Targa Resources Partners LP 5.875% 2026 | 321 | 341 | ||||||
Targa Resources Partners LP 6.50% 2027 | 133 | 145 | ||||||
Targa Resources Partners LP 6.875% 2029 | 332 | 374 | ||||||
Targa Resources Partners LP 5.50% 2030 | 477 | 518 | ||||||
Targa Resources Partners LP 4.875% 20311 | 2,000 | 2,173 | ||||||
Teekay Corp. 9.25% 20221 | 3,108 | 3,178 | ||||||
Teekay Offshore Partners LP 8.50% 20231 | 2,009 | 1,712 | ||||||
Transocean Guardian Ltd. 5.875% 20241 | 862 | 726 | ||||||
Transocean Inc. 6.125% 20251 | 1,876 | 1,788 | ||||||
Transocean Poseidon Ltd. 6.875% 20271 | 655 | 598 | ||||||
USA Compression Partners, LP 6.875% 2026 | 264 | 276 | ||||||
USA Compression Partners, LP 6.875% 2027 | 247 | 264 | ||||||
Vine Oil & Gas LP 8.75% 20231 | 1,767 | 1,414 | ||||||
Weatherford International PLC 8.75% 20241 | 1,346 | 1,351 | ||||||
Weatherford International PLC 11.00% 20241 | 4,211 | 3,295 | ||||||
Western Gas Partners LP 4.50% 2028 | 1,368 | 1,423 | ||||||
Western Gas Partners LP 5.45% 2044 | 55 | 56 | ||||||
Western Midstream Operating, LP 4.10% 20256 | 369 | 381 | ||||||
Western Midstream Operating, LP 4.75% 2028 | 160 | 167 | ||||||
Western Midstream Operating, LP 5.25% 2050 | 500 | 551 | ||||||
WPX Energy, Inc. 5.75% 2026 | 297 | 313 | ||||||
WPX Energy, Inc. 5.25% 2027 | 160 | 170 | ||||||
WPX Energy, Inc. 5.875% 2028 | 620 | 677 | ||||||
WPX Energy, Inc. 4.50% 2030 | 759 | 806 | ||||||
|
| |||||||
| 107,954 | ||||||||
|
| |||||||
Consumer discretionary 12.17% | ||||||||
99 Escrow Issuer, Inc. 7.50% 20261 | 405 | 403 | ||||||
Adient US LLC 9.00% 20251 | 205 | 229 | ||||||
Affinity Gaming 6.875% 20271 | 1,125 | 1,180 | ||||||
Allied Universal Holdco LLC 6.625% 20261 | 858 | 916 | ||||||
Allied Universal Holdco LLC 9.75% 20271 | 826 | 902 | ||||||
At Home Holding III Inc. 8.75% 20251 | 300 | 325 | ||||||
Boyd Gaming Corp. 8.625% 20251 | 120 | 134 | ||||||
Boyd Gaming Corp. 4.75% 2027 | 861 | 896 | ||||||
Brookfield Residential Properties Inc. 4.875% 20301 | 325 | 336 | ||||||
Caesars Entertainment, Inc. 6.25% 20251 | 1,195 | 1,274 | ||||||
American Funds Insurance Series 203
Table of Contents
High-Income Bond Fund (continued)
Bonds, notes & other debt instruments (continued)
| Principal amount (000) | Value (000) | |||||||
Corporate bonds, notes & loans (continued) | ||||||||
Consumer discretionary (continued) | ||||||||
Caesars Resort Collection, LLC 5.75% 20251 | $ | 345 | $ | 366 | ||||
Carnival Corp. 11.50% 20231 | 1,812 | 2,098 | ||||||
Carnival Corp. 7.625% 20261 | 175 | 191 | ||||||
Carnival Corp. 10.50% 20261 | 275 | 321 | ||||||
Cedar Fair, LP 5.25% 2029 | 271 | 279 | ||||||
Churchill Downs Inc. 4.75% 20281 | 430 | 454 | ||||||
Cirsa Gaming Corp. SA 7.875% 20231 | 2,277 | 2,300 | ||||||
Clarios Global LP 6.75% 20251 | 375 | 405 | ||||||
Dana Inc. 5.625% 2028 | 675 | 728 | ||||||
Dave & Buster’s, Inc. 7.625% 20251 | 375 | 396 | ||||||
Empire Communities Corp. 7.00% 20251 | 525 | 555 | ||||||
Fertitta Entertainment, Inc. 6.75% 20241 | 371 | 369 | ||||||
Ford Motor Co. 8.50% 2023 | 1,787 | 2,018 | ||||||
Ford Motor Co. 9.00% 2025 | 684 | 841 | ||||||
Ford Motor Co. 9.625% 2030 | 250 | 353 | ||||||
Ford Motor Co. 7.45% 2031 | 275 | 353 | ||||||
Ford Motor Credit Co. 3.087% 2023 | 400 | 408 | ||||||
Ford Motor Credit Co. 3.664% 2024 | 500 | 514 | ||||||
Ford Motor Credit Co. 3.81% 2024 | 887 | 910 | ||||||
Ford Motor Credit Co. 5.584% 2024 | 350 | 378 | ||||||
Ford Motor Credit Co. 5.125% 2025 | 6,285 | 6,842 | ||||||
Ford Motor Credit Co. 4.542% 2026 | 510 | 545 | ||||||
Ford Motor Credit Co. 3.815% 2027 | 275 | 283 | ||||||
Ford Motor Credit Co. 4.125% 2027 | 835 | 876 | ||||||
Ford Motor Credit Co. 4.271% 2027 | 525 | 551 | ||||||
Ford Motor Credit Co. 5.113% 2029 | 200 | 223 | ||||||
Ford Motor Credit Co. 4.00% 2030 | 1,820 | 1,917 | ||||||
Hanesbrands Inc. 4.625% 20241 | 445 | 467 | ||||||
Hanesbrands Inc. 5.375% 20251 | 432 | 458 | ||||||
Hanesbrands Inc. 4.875% 20261 | 274 | 298 | ||||||
Hilton Worldwide Holdings Inc. 5.125% 2026 | 700 | 724 | ||||||
Hilton Worldwide Holdings Inc. 4.875% 2030 | 508 | 556 | ||||||
Hilton Worldwide Holdings Inc. 4.00% 20311 | 870 | 920 | ||||||
International Game Technology PLC 6.25% 20221 | 403 | 417 | ||||||
International Game Technology PLC 6.50% 20251 | 1,383 | 1,550 | ||||||
International Game Technology PLC 5.25% 20291 | 1,455 | 1,570 | ||||||
Jaguar Land Rover PLC 7.75% 20251 | 450 | 486 | ||||||
Jaguar Land Rover PLC 5.875% 20281 | 550 | 556 | ||||||
KB Home 6.875% 2027 | 330 | 388 | ||||||
Landry’s Finance Acquisition Co., Term Loan, (3-month USD-LIBOR + 12.00%) 13.00% 20232,3,7 | 17 | 20 | ||||||
Landry’s Finance Acquisition Co., Term Loan B, (3-month USD-LIBOR + 12.00%) 13.00% 20232,3 | — | 9 | — | 9 | ||||
Lennar Corp. 4.50% 2024 | 40 | 44 | ||||||
Levi Strauss & Co. 5.00% 2025 | 452 | 464 | ||||||
Limited Brands, Inc. 6.875% 20251 | 245 | 266 | ||||||
Limited Brands, Inc. 6.625% 20301 | 380 | 423 | ||||||
Limited Brands, Inc. 6.875% 2035 | 346 | 389 | ||||||
Limited Brands, Inc. 6.75% 2036 | 495 | 552 | ||||||
Lithia Motors, Inc. 4.375% 20311 | 475 | 510 | ||||||
M.D.C. Holdings, Inc. 6.00% 2043 | 823 | 1,105 | ||||||
Macy’s, Inc. 8.375% 20251 | 145 | 161 | ||||||
Mattel, Inc. 6.75% 20251 | 904 | 955 | ||||||
McGraw-Hill Global Education Holdings, LLC, Term Loan B, (3-month USD-LIBOR + 4.00%) | 1,224 | 1,196 | ||||||
Melco International Development Ltd. 5.75% 20281 | 2,000 | 2,133 | ||||||
Merlin Entertainment 5.75% 20261 | 792 | 834 | ||||||
MGM Growth Properties LLC 5.625% 2024 | 307 | 334 | ||||||
MGM Growth Properties LLC 4.625% 20251 | 900 | 965 | ||||||
MGM Growth Properties LLC 3.875% 20291 | 1,490 | 1,526 | ||||||
MGM Resorts International 7.75% 2022 | 740 | 789 | ||||||
204 American Funds Insurance Series
Table of Contents
High-Income Bond Fund (continued)
Bonds, notes & other debt instruments (continued)
| Principal amount (000) | Value (000) | |||||||
Corporate bonds, notes & loans (continued) | ||||||||
Consumer discretionary (continued) | ||||||||
MGM Resorts International 6.00% 2023 | $ | 541 | $ | 582 | ||||
MGM Resorts International 5.50% 2027 | 541 | 604 | ||||||
MYT Holding LLC 7.50% 20251,5 | 1,712 | 1,725 | ||||||
NCL Corp. Ltd. 3.625% 20241 | 650 | 619 | ||||||
NCL Corp. Ltd. 12.25% 20241 | 175 | 210 | ||||||
NCL Corp. Ltd. 5.875% 20261 | 475 | 501 | ||||||
Neiman Marcus Group Ltd. LLC, Term Loan, (3-month USD-LIBOR + 12.00%) 13.00% 20252,3 | 1,497 | 1,601 | ||||||
Newell Rubbermaid Inc. 4.875% 2025 | 445 | 490 | ||||||
Newell Rubbermaid Inc. 5.875% 20366 | 30 | 37 | ||||||
Nissan Motor Co., Ltd. 4.81% 20301 | 425 | 480 | ||||||
Norwegian Cruise Line Holdings Ltd. 10.25% 20261 | 275 | 322 | ||||||
Panther BF Aggregator 2, LP 6.25% 20261 | 155 | 166 | ||||||
Panther BF Aggregator 2, LP 8.50% 20271 | 990 | 1,077 | ||||||
Party City Holdings Inc. 6.625% 20261 | 500 | 376 | ||||||
PetSmart, Inc. 7.125% 20231 | 6,489 | 6,495 | ||||||
PetSmart, Inc. 5.875% 20251 | 3,342 | 3,440 | ||||||
PetSmart, Inc. 8.875% 20251 | 1,846 | 1,898 | ||||||
PetSmart, Inc., Term Loan, (3-month USD-LIBOR + 3.00%) 4.00% 20222,3 | 2,555 | 2,535 | ||||||
Royal Caribbean Cruises Ltd. 10.875% 20231 | 325 | 370 | ||||||
Royal Caribbean Cruises Ltd. 11.50% 20251 | 775 | 907 | ||||||
Sally Holdings LLC and Sally Capital Inc. 5.50% 2023 | 57 | 57 | ||||||
Sally Holdings LLC and Sally Capital Inc. 5.625% 2025 | 2,825 | 2,907 | ||||||
Sally Holdings LLC and Sally Capital Inc. 8.75% 20251 | 1,244 | 1,386 | ||||||
Scientific Games Corp. 5.00% 20251 | 301 | 311 | ||||||
Scientific Games Corp. 8.625% 20251 | 2,170 | 2,379 | ||||||
Scientific Games Corp. 8.25% 20261 | 3,644 | 3,933 | ||||||
Scientific Games Corp. 7.00% 20281 | 85 | 92 | ||||||
Scientific Games Corp. 7.25% 20291 | 845 | 929 | ||||||
Six Flags Entertainment Corp. 4.875% 20241 | 1,277 | 1,283 | ||||||
Six Flags Theme Parks Inc. 7.00% 20251 | 140 | 151 | ||||||
Sizzling Platter LLC 8.50% 20251 | 450 | 469 | ||||||
Staples, Inc. 7.50% 20261 | 1,366 | 1,429 | ||||||
Stars Group Holdings BV 7.00% 20261 | 525 | 554 | ||||||
The Home Company Inc. 7.25% 20251 | 725 | 746 | ||||||
Vail Resorts, Inc. 6.25% 20251 | 315 | 337 | ||||||
VICI Properties LP 4.25% 20261 | 962 | 999 | ||||||
VICI Properties LP 4.625% 20291 | 135 | 145 | ||||||
VICI Properties LP / VICI Note Co. Inc. 3.50% 20251 | 851 | 872 | ||||||
VICI Properties LP / VICI Note Co. Inc. 3.75% 20271 | 379 | 388 | ||||||
VICI Properties LP / VICI Note Co. Inc. 4.125% 20301 | 1,774 | 1,875 | ||||||
Viking Cruises Ltd. 6.25% 20251 | 140 | 138 | ||||||
Viking Cruises Ltd. 13.00% 20251 | 430 | 515 | ||||||
Viking Cruises Ltd. 5.875% 20271 | 185 | 181 | ||||||
Wyndham Destinations, Inc. 6.625% 20261 | 525 | 602 | ||||||
Wyndham Worldwide Corp. 5.375% 20261 | 860 | 892 | ||||||
Wyndham Worldwide Corp. 4.375% 20281 | 1,380 | 1,436 | ||||||
Wynn Las Vegas, LLC and Wynn Capital Corp. 4.25% 20231 | 1,171 | 1,190 | ||||||
Wynn Las Vegas, LLC and Wynn Capital Corp. 5.25% 20271 | 373 | 385 | ||||||
Wynn Macau, Ltd. 5.125% 20291 | 200 | 205 | ||||||
Wynn Resorts Ltd. 7.75% 20251 | 820 | 890 | ||||||
Wynn Resorts Ltd. 5.125% 20291 | 342 | 359 | ||||||
|
| |||||||
| 105,595 | ||||||||
|
| |||||||
Materials 11.58% | ||||||||
Alcoa Netherlands Holding BV 5.50% 20271 | 510 | 559 | ||||||
Anglo American Capital PLC 5.625% 20301 | 310 | 395 | ||||||
Arconic Corp. 6.00% 20251 | 810 | 866 | ||||||
Ardagh Group SA 6.50% 20271,5 | 622 | 665 | ||||||
Ardagh Packaging Finance 5.25% 20251 | 495 | 523 | ||||||
American Funds Insurance Series 205
Table of Contents
High-Income Bond Fund (continued)
Bonds, notes & other debt instruments (continued)
| Principal amount (000) | Value (000) | |||||||
Corporate bonds, notes & loans (continued) | ||||||||
Materials (continued) | ||||||||
Ardagh Packaging Finance 6.00% 20251 | $ | 533 | $ | 553 | ||||
Ardagh Packaging Finance 5.25% 20271 | 425 | 447 | ||||||
Axalta Coating Systems LLC 4.75% 20271 | 460 | 490 | ||||||
Blue Cube Spinco Inc. 10.00% 2025 | 660 | 700 | ||||||
BWAY Parent Co., Inc. 5.50% 20241 | 1,619 | 1,653 | ||||||
CANPACK SA and Eastern PA Land Investment Holding LLC 3.125% 20251 | 425 | 428 | ||||||
Carlyle Group LP 8.75% 20231,5 | 215 | 217 | ||||||
Cascades Inc. 5.125% 20261 | 495 | 524 | ||||||
Cascades Inc. 5.375% 20281 | 340 | 362 | ||||||
Cleveland-Cliffs Inc. 4.875% 20241 | 2,245 | 2,291 | ||||||
Cleveland-Cliffs Inc. 5.75% 2025 | 2,739 | 2,785 | ||||||
Cleveland-Cliffs Inc. 9.875% 20251 | 309 | 364 | ||||||
Cleveland-Cliffs Inc. 6.75% 20261 | 1,167 | 1,262 | ||||||
Cleveland-Cliffs Inc. 5.875% 2027 | 4,675 | 4,773 | ||||||
Cleveland-Cliffs Inc. 7.00% 20271 | 297 | 288 | ||||||
Consolidated Energy Finance SA 6.50% 20261 | 1,250 | 1,253 | ||||||
CVR Partners, LP 9.25% 20231 | 2,248 | 2,253 | ||||||
Element Solutions Inc. 3.875% 20281 | 620 | 639 | ||||||
First Quantum Minerals Ltd. 7.25% 20231 | 2,073 | 2,140 | ||||||
First Quantum Minerals Ltd. 6.50% 20241 | 411 | 423 | ||||||
First Quantum Minerals Ltd. 7.50% 20251 | 7,943 | 8,281 | ||||||
First Quantum Minerals Ltd. 6.875% 20261 | 3,076 | 3,213 | ||||||
First Quantum Minerals Ltd. 6.875% 20271 | 5,790 | 6,289 | ||||||
Freeport-McMoRan Inc. 3.875% 2023 | 189 | 198 | ||||||
Freeport-McMoRan Inc. 4.25% 2030 | 925 | 998 | ||||||
Freeport-McMoRan Inc. 5.40% 2034 | 300 | 376 | ||||||
FXI Holdings, Inc. 7.875% 20241 | 3,425 | 3,459 | ||||||
FXI Holdings, Inc. 12.25% 20261 | 4,575 | 5,223 | ||||||
GPC Merger Sub Inc. 7.125% 20281 | 434 | 480 | ||||||
GrafTech Finance Inc. 4.625% 20281 | 425 | 431 | ||||||
Hexion Inc. 7.875% 20271 | 2,304 | 2,470 | ||||||
INEOS Group Holdings SA 5.625% 20241 | 772 | 785 | ||||||
Joseph T. Ryerson & Son, Inc. 8.50% 20281 | 1,260 | 1,429 | ||||||
LSB Industries, Inc. 9.625% 20231 | 3,363 | 3,476 | ||||||
LYB International Finance III, LLC 3.80% 2060 | 213 | 230 | ||||||
Methanex Corp. 5.125% 2027 | 4,075 | 4,434 | ||||||
Methanex Corp. 5.25% 2029 | 450 | 489 | ||||||
Methanex Corp. 5.65% 2044 | 475 | 510 | ||||||
Neon Holdings, Inc. 10.125% 20261 | 2,500 | 2,744 | ||||||
Newcrest Finance Pty Ltd. 4.20% 20501 | 550 | 674 | ||||||
Nouryon Holding BV 8.00% 20261 | 931 | 991 | ||||||
Nova Chemicals Corp. 4.875% 20241 | 495 | 516 | ||||||
Nova Chemicals Corp. 5.25% 20271 | 1,036 | 1,105 | ||||||
Novelis Corp. 5.875% 20261 | 950 | 994 | ||||||
Novelis Corp. 4.75% 20301 | 990 | 1,068 | ||||||
OCI NV 5.25% 20241 | 278 | 289 | ||||||
Olin Corp. 9.50% 20251 | 490 | 613 | ||||||
Olin Corp. 5.00% 2030 | 280 | 299 | ||||||
Owens-Illinois, Inc. 5.875% 20231 | 1,670 | 1,792 | ||||||
Owens-Illinois, Inc. 6.375% 20251 | 265 | 294 | ||||||
Plastipak Holdings, Inc. 6.25% 20251 | 200 | 206 | ||||||
Rayonier A.M. Products Inc. 7.625% 20261 | 745 | 778 | ||||||
Scotts Miracle-Gro Co. 4.50% 2029 | 639 | 691 | ||||||
Sealed Air Corp. 4.875% 20221 | 660 | 693 | ||||||
Sealed Air Corp. 5.25% 20231 | 267 | 285 | ||||||
Sealed Air Corp. 4.00% 20271 | 316 | 338 | ||||||
Silgan Holdings Inc. 4.125% 2028 | 377 | 393 | ||||||
Summit Materials, Inc. 6.50% 20271 | 360 | 384 | ||||||
Summit Materials, Inc. 5.25% 20291 | 1,275 | 1,340 | ||||||
Trivium Packaging BV 5.50% 20261 | 530 | 561 | ||||||
Trivium Packaging BV 8.50% 20271 | 403 | 442 | ||||||
206 American Funds Insurance Series
Table of Contents
High-Income Bond Fund (continued)
Bonds, notes & other debt instruments (continued)
| Principal amount (000) | Value (000) | |||||||
Corporate bonds, notes & loans (continued) | ||||||||
Materials (continued) | ||||||||
Tronox Ltd. 5.75% 20251 | $ | 700 | $ | 728 | ||||
Tronox Ltd. 6.50% 20261 | 775 | 808 | ||||||
Valvoline Inc. 4.375% 2025 | 555 | 573 | ||||||
Valvoline Inc. 4.25% 20301 | 353 | 375 | ||||||
Valvoline Inc. 3.625% 20311 | 620 | 638 | ||||||
Venator Materials Corp. 5.75% 20251 | 5,956 | 5,580 | ||||||
Venator Materials Corp. 9.50% 20251 | 2,175 | 2,382 | ||||||
W. R. Grace & Co. 4.875% 20271 | 790 | 839 | ||||||
Warrior Met Coal, Inc. 8.00% 20241 | 1,400 | 1,433 | ||||||
|
| |||||||
| 100,470 | ||||||||
|
| |||||||
Health care 11.31% | ||||||||
Auris Luxembourg III SARL, Term Loan, (3-month USD-LIBOR + 3.75%) 3.897% 20262,3 | 845 | 817 | ||||||
Avantor Funding, Inc. 4.625% 20281 | 1,510 | 1,599 | ||||||
Bausch Health Companies Inc. 9.25% 20261 | 2,644 | 2,952 | ||||||
Bausch Health Companies Inc. 5.00% 20281 | 587 | 606 | ||||||
Bausch Health Companies Inc. 7.00% 20281 | 1,153 | 1,269 | ||||||
Bausch Health Companies Inc. 5.00% 20291 | 891 | 918 | ||||||
Bausch Health Companies Inc. 6.25% 20291 | 815 | 886 | ||||||
Bausch Health Companies Inc. 5.25% 20301 | 852 | 893 | ||||||
Bausch Health Companies Inc. 5.25% 20311 | 3,055 | 3,197 | ||||||
Catalent Pharma Solutions Inc. 5.00% 20271 | 53 | 56 | ||||||
Centene Corp. 4.75% 2025 | 1,000 | 1,027 | ||||||
Centene Corp. 5.375% 20261 | 850 | 898 | ||||||
Centene Corp. 5.375% 20261 | 330 | 349 | ||||||
Centene Corp. 4.25% 2027 | 634 | 674 | ||||||
Centene Corp. 4.625% 2029 | 2,505 | 2,784 | ||||||
Centene Corp. 3.00% 2030 | 2,805 | 2,977 | ||||||
Centene Corp. 3.375% 2030 | 132 | 139 | ||||||
Charles River Laboratories International, Inc. 5.50% 20261 | 584 | 613 | ||||||
Charles River Laboratories International, Inc. 4.25% 20281 | 241 | 253 | ||||||
Community Health Systems Inc. 5.625% 20271 | 730 | 786 | ||||||
Community Health Systems Inc. 6.00% 20291 | 653 | 706 | ||||||
Concordia International Corp. 8.00% 2024 | 34 | 35 | ||||||
Concordia International Corp., Term Loan, (3-month USD-LIBOR + 5.50%) 6.50% 20242,3 | 59 | 58 | ||||||
Encompass Health Corp. 4.50% 2028 | 496 | 519 | ||||||
Encompass Health Corp. 4.75% 2030 | 635 | 681 | ||||||
Endo Dac / Endo Finance LLC / Endo Finco 9.50% 20271 | 1,644 | 1,838 | ||||||
Endo Dac / Endo Finance LLC / Endo Finco 6.00% 20281 | 1,185 | 1,008 | ||||||
Endo International PLC 5.75% 20221 | 2,937 | 2,853 | ||||||
Endo International PLC 5.875% 20241 | 1,300 | 1,320 | ||||||
HCA Inc. 5.875% 2023 | 604 | 665 | ||||||
HCA Inc. 5.375% 2025 | 175 | 197 | ||||||
HCA Inc. 5.875% 2026 | 321 | 370 | ||||||
HCA Inc. 4.50% 2027 | 173 | 201 | ||||||
HCA Inc. 5.625% 2028 | 1,315 | 1,556 | ||||||
HCA Inc. 3.50% 2030 | 1,325 | 1,408 | ||||||
HCA Inc. 5.50% 2047 | 128 | 171 | ||||||
HCA Inc. 5.25% 2049 | 475 | 627 | ||||||
HealthSouth Corp. 5.75% 2025 | 942 | 975 | ||||||
IMS Health Holdings, Inc. 5.00% 20261 | 823 | 864 | ||||||
Jaguar Holding Co. II 4.625% 20251 | 350 | 370 | ||||||
Jaguar Holding Co. II 5.00% 20281 | 375 | 401 | ||||||
Mallinckrodt International Finance SA 5.50% 20251,4 | 1,118 | 391 | ||||||
Mallinckrodt PLC 5.75% 20221 | 420 | 147 | ||||||
Mallinckrodt PLC 10.00% 20251 | 4,358 | 4,739 | ||||||
Molina Healthcare, Inc. 5.375% 2022 | 4,589 | 4,867 | ||||||
Molina Healthcare, Inc. 4.375% 20281 | 920 | 969 | ||||||
Molina Healthcare, Inc. 3.875% 20301 | 1,420 | 1,527 | ||||||
Owens & Minor, Inc. 4.375% 2024 | 1,440 | 1,481 | ||||||
American Funds Insurance Series 207
Table of Contents
High-Income Bond Fund (continued)
Bonds, notes & other debt instruments (continued)
| Principal amount (000) | Value (000) | |||||||
Corporate bonds, notes & loans (continued) | ||||||||
Health care (continued) | ||||||||
Owens & Minor, Inc., Term Loan B, (3-month USD-LIBOR + 4.50%) 4.655% 20252,3 | $ | 1,460 | $ | 1,458 | ||||
Par Pharmaceutical Inc. 7.50% 20271 | 4,612 | 5,010 | ||||||
PAREXEL International Corp. 6.375% 20251 | 685 | 703 | ||||||
Prime Healthcare Services, Inc. 7.25% 20251 | 600 | 639 | ||||||
Radiology Partners, Inc. 9.25% 20281 | 1,293 | 1,458 | ||||||
Radiology Partners, Inc., Term Loan, (3-month USD-LIBOR + 4.25%) 4.476% 20252,3 | 575 | 567 | ||||||
Rotech Healthcare Inc., Term Loan, (3-month USD-LIBOR + 11.00%) 13.00% 2023 (100% PIK)2,3,5,7,8 | 3,850 | 3,850 | ||||||
RP Escrow Issuer, LLC 5.25% 20251 | 655 | 686 | ||||||
Select Medical Holdings Corp. 6.25% 20261 | 554 | 597 | ||||||
Sotera Health Holdings LLC, Term Loan, (3-months USD-LIBOR + 4.50%) 5.50% 20262,3 | 570 | 573 | ||||||
Surgery Center Holdings 10.00% 20271 | 416 | 460 | ||||||
Syneos Health, Inc. 3.625% 20291 | 630 | 633 | ||||||
Team Health Holdings, Inc. 6.375% 20251 | 3,171 | 2,743 | ||||||
Team Health Holdings, Inc., Term Loan B, 3.75% 20242,3 | 917 | 826 | ||||||
Tenet Healthcare Corp. 4.625% 2024 | 559 | 574 | ||||||
Tenet Healthcare Corp. 4.875% 20261 | 6,080 | 6,368 | ||||||
Tenet Healthcare Corp. 5.125% 20271 | 710 | 753 | ||||||
Tenet Healthcare Corp. 6.125% 20281 | 275 | 288 | ||||||
Teva Pharmaceutical Finance Co. BV 2.20% 2021 | 75 | 75 | ||||||
Teva Pharmaceutical Finance Co. BV 2.80% 2023 | 1,908 | 1,892 | ||||||
Teva Pharmaceutical Finance Co. BV 6.00% 2024 | 4,779 | 5,077 | ||||||
Teva Pharmaceutical Finance Co. BV 7.125% 2025 | 1,309 | 1,449 | ||||||
Teva Pharmaceutical Finance Co. BV 3.15% 2026 | 1,684 | 1,622 | ||||||
Teva Pharmaceutical Finance Co. BV 6.75% 2028 | 1,188 | 1,346 | ||||||
Teva Pharmaceutical Finance Co. BV 4.10% 2046 | 525 | 469 | ||||||
U.S. Renal Care, Inc. 10.625% 20271 | 359 | 398 | ||||||
Valeant Pharmaceuticals International, Inc. 6.125% 20251 | 1,584 | 1,634 | ||||||
Valeant Pharmaceuticals International, Inc. 9.00% 20251 | 581 | 644 | ||||||
Valeant Pharmaceuticals International, Inc. 8.50% 20271 | 608 | 677 | ||||||
|
| |||||||
| 98,106 | ||||||||
|
| |||||||
Industrials 9.51% | ||||||||
ADT Corp. 3.50% 2022 | 1,221 | 1,255 | ||||||
Aircastle Ltd. 5.25% 20251 | 650 | 716 | ||||||
Alaska Air Group, Inc. 4.80% 20271 | 575 | 635 | ||||||
Allison Transmission Holdings, Inc. 3.75% 20311 | 1,950 | 1,999 | ||||||
ASGN Inc. 4.625% 20281 | 330 | 344 | ||||||
Ashtead Group PLC 4.25% 20291 | 488 | 536 | ||||||
Associated Materials, LLC 9.00% 20251 | 2,156 | 2,291 | ||||||
ATS Automation Tooling Systems Inc. 4.125% 20281 | 275 | 281 | ||||||
Aviation Capital Group LLC 5.50% 20241 | 500 | 554 | ||||||
Avis Budget Car Rental, LLC 5.75% 20271 | 1,375 | 1,407 | ||||||
Avis Budget Group, Inc. 6.375% 20241 | 1,710 | 1,747 | ||||||
Avis Budget Group, Inc. 5.25% 20251 | 437 | 440 | ||||||
Avis Budget Group, Inc. 10.50% 20251 | 800 | 946 | ||||||
Avolon Holdings Funding Ltd. 5.25% 20241 | 660 | 718 | ||||||
Avolon Holdings Funding Ltd. 4.25% 20261 | 218 | 235 | ||||||
Boeing Company 3.625% 2031 | 1,400 | 1,536 | ||||||
Boeing Company 3.50% 2039 | 70 | 71 | ||||||
Boeing Company 3.75% 2050 | 400 | 421 | ||||||
Boeing Company 5.93% 2060 | 700 | 993 | ||||||
Bohai Financial Investment Holding Co., Ltd. 5.25% 20221 | 1,600 | 1,680 | ||||||
Bohai Financial Investment Holding Co., Ltd. 4.50% 20231 | 1,072 | 1,124 | ||||||
Bohai Financial Investment Holding Co., Ltd. 5.125% 20231 | 660 | 707 | ||||||
Bohai Financial Investment Holding Co., Ltd. 5.50% 20241 | 600 | 655 | ||||||
Bombardier Inc. 8.75% 20211 | 445 | 464 | ||||||
Bombardier Inc. 5.75% 20221 | 255 | 260 | ||||||
Bombardier Inc. 6.125% 20231 | 338 | 331 | ||||||
Bombardier Inc. 7.50% 20241 | 140 | 135 | ||||||
208 American Funds Insurance Series
Table of Contents
High-Income Bond Fund (continued)
Bonds, notes & other debt instruments (continued)
| Principal amount (000) | Value (000) | |||||||
Corporate bonds, notes & loans (continued) | ||||||||
Industrials (continued) | ||||||||
Bombardier Inc. 7.50% 20251 | $ | 1,191 | $ | 1,106 | ||||
Bombardier Inc. 7.875% 20271 | 1,598 | 1,472 | ||||||
British Airways, Series 2020-1, Class B, 8.375% 20281 | 185 | 205 | ||||||
British Airways, Series 2020-1, Class A, 4.25% 20321 | 370 | 397 | ||||||
BWX Technologies, Inc. 4.125% 20281 | 615 | 642 | ||||||
Clean Harbors, Inc. 4.875% 20271 | 766 | 800 | ||||||
Covanta Holding Corp. 5.875% 2025 | 858 | 895 | ||||||
Covanta Holding Corp. 5.00% 2030 | 1,000 | 1,071 | ||||||
CP Atlas Buyer, Inc. 7.00% 20281 | 450 | 468 | ||||||
Dun & Bradstreet Corp. 6.875% 20261 | 203 | 219 | ||||||
Dun & Bradstreet Corp. 10.25% 20271 | 2,098 | 2,370 | ||||||
F-Brasile SpA 7.375% 20261 | 1,338 | 1,301 | ||||||
Fortress Transportation and Infrastructure Investors LLC 6.50% 20251 | 480 | 503 | ||||||
Fortress Transportation and Infrastructure Investors LLC 9.75% 20271 | 445 | 511 | ||||||
Harsco Corp. 5.75% 20271 | 650 | 689 | ||||||
Howmet Aerospace Inc. 6.875% 2025 | 1,662 | 1,963 | ||||||
Icahn Enterprises Finance Corp. 4.75% 2024 | 1,080 | 1,124 | ||||||
JELD-WEN Holding, Inc. 4.875% 20271 | 1,033 | 1,095 | ||||||
JetBlue Airways Corp., Pass Through Trust Certificates, Series 2019-1, Class B, 8.00% 2027 | 158 | 171 | ||||||
JetBlue Airways Corp., Pass Through Trust Certificates, Series 2020-1, Class A, 7.75% 2028 | 350 | 382 | ||||||
Kratos Defense & Security Solutions, Inc. 6.50% 20251 | 1,710 | 1,785 | ||||||
LABL Escrow Issuer, LLC 10.50% 20271 | 690 | 778 | ||||||
LBM Acquisition LLC 6.25% 20291 | 400 | 417 | ||||||
LSC Communications, Inc. 8.75% 20231,4,7,8 | 8,744 | 482 | ||||||
LSC Communications, Inc., Term Loan B, (3-month USD-LIBOR + 5.50%) 6.25% 20222,3,4,7,8 | 195 | 16 | ||||||
MasTec, Inc. 4.50% 20281 | 1,250 | 1,314 | ||||||
Meritor, Inc. 4.50% 20281 | 325 | 334 | ||||||
Moog Inc. 4.25% 20271 | 125 | 130 | ||||||
Nielsen Finance LLC and Nielsen Finance Co. 5.00% 20251 | 750 | 771 | ||||||
Nielsen Finance LLC and Nielsen Finance Co. 5.625% 20281 | 250 | 272 | ||||||
Nielsen Finance LLC and Nielsen Finance Co. 5.875% 20301 | 1,400 | 1,586 | ||||||
Prime Security Services Borrower, LLC 3.375% 20271 | 925 | 919 | ||||||
Prime Security Services Borrower, LLC 6.25% 20281 | 627 | 674 | ||||||
R.R. Donnelley & Sons Co. 6.50% 2023 | 1,100 | 1,137 | ||||||
R.R. Donnelley & Sons Co., Term Loan B, (3-month USD-LIBOR + 5.00%) 5.254% 20242,3 | 1,323 | 1,290 | ||||||
Rexnord Corp. 4.875% 20251 | 848 | 867 | ||||||
Rolls-Royce PLC 4.625% 2026 | € | 300 | 398 | |||||
Rolls-Royce PLC 5.75% 20271 | $ | 1,060 | 1,175 | |||||
Rolls-Royce PLC 5.75% 2027 | £ | 275 | 417 | |||||
Sensata Technologies, Inc. 3.75% 20311 | $ | 500 | 519 | |||||
Signature Aviation PLC 4.00% 20281 | 185 | 187 | ||||||
SkyMiles IP Ltd. 4.50% 20251 | 275 | 294 | ||||||
SkyMiles IP Ltd. 4.75% 20281 | 2,285 | 2,496 | ||||||
SkyMiles IP Ltd., Term Loan, (3-month USD-LIBOR + 3.75%) 4.75% 20272,3 | 525 | 545 | ||||||
Specialty Building Products Holdings LLC 6.375% 20261 | 450 | 477 | ||||||
Spirit AeroSystems, Inc. (3-month USD-LIBOR + 0.80%) 1.017% 20213 | 120 | 118 | ||||||
Stericycle, Inc. 5.375% 20241 | 1,135 | 1,186 | ||||||
Stericycle, Inc. 3.875% 20291 | 500 | 514 | ||||||
The Brink’s Co. 4.625% 20271 | 719 | 753 | ||||||
TransDigm Inc. 6.50% 2024 | 529 | 539 | ||||||
TransDigm Inc. 8.00% 20251 | 658 | 729 | ||||||
TransDigm Inc. 6.25% 20261 | 513 | 547 | ||||||
TransDigm Inc. 5.50% 2027 | 855 | 900 | ||||||
Triumph Group, Inc. 5.25% 2022 | 240 | 229 | ||||||
Triumph Group, Inc. 6.25% 20241 | 310 | 308 | ||||||
Triumph Group, Inc. 8.875% 20241 | 445 | 489 | ||||||
Triumph Group, Inc. 7.75% 20251 | 270 | 248 | ||||||
Uber Technologies, Inc. 8.00% 20261 | 498 | 543 | ||||||
American Funds Insurance Series 209
Table of Contents
High-Income Bond Fund (continued)
Bonds, notes & other debt instruments (continued)
Principal amount (000) | Value (000) | |||||||
Corporate bonds, notes & loans (continued) | ||||||||
Industrials (continued) | ||||||||
United Airlines Holdings, Inc. 6.50% 20271 | $ | 4,625 | $ | 4,981 | ||||
United Parcel Service, Inc. 3.125% 2021 | 200 | 200 | ||||||
United Rentals, Inc. 5.875% 2026 | 53 | 56 | ||||||
United Rentals, Inc. 3.875% 2031 | 650 | 683 | ||||||
Vertical Holdco GMBH 7.625% 20281 | 975 | 1,065 | ||||||
Vertical U.S. Newco Inc. 5.25% 20271 | 2,375 | 2,522 | ||||||
Virgin Australia Holdings Ltd. 7.875% 20211,4 | 800 | 66 | ||||||
Wesco Aircraft Holdings, Inc. 8.50% 20241 | 233 | 223 | ||||||
Wesco Aircraft Holdings, Inc. 9.00% 20261 | 939 | 891 | ||||||
WESCO Distribution, Inc. 7.125% 20251 | 1,865 | 2,054 | ||||||
WESCO Distribution, Inc. 7.25% 20281 | 1,770 | 2,016 | ||||||
Western Global Airlines LLC 10.375% 20251 | 385 | 430 | ||||||
XPO Logistics, Inc. 6.75% 20241 | 198 | 211 | ||||||
XPO Logistics, Inc. 6.25% 20251 | 800 | 862 | ||||||
|
| |||||||
| 82,508 | ||||||||
|
| |||||||
Financials 6.63% | ||||||||
Advisor Group Holdings, LLC 6.25% 20281 | 1,551 | 1,572 | ||||||
AG Merger Sub II, Inc. 10.75% 20271 | 1,862 | 2,063 | ||||||
Alliant Holdings Intermediate, LLC 6.75% 20271 | 1,036 | 1,110 | ||||||
Ally Financial Inc. 8.00% 2031 | 403 | 592 | ||||||
Ally Financial Inc. 8.00% 2031 | 63 | 90 | ||||||
American International Group, Inc. 4.375% 2050 | 245 | 321 | ||||||
AssuredPartners, Inc. 7.00% 20251 | 373 | 388 | ||||||
AssuredPartners, Inc. 8.00% 20271 | 603 | 656 | ||||||
AssuredPartners, Inc. 5.625% 20291 | 365 | 381 | ||||||
CIT Group Inc. 4.125% 2021 | 950 | 953 | ||||||
Compass Diversified Holdings 8.00% 20261 | 3,214 | 3,386 | ||||||
Credit Acceptance Corp. 5.125% 20241 | 765 | 798 | ||||||
Fairstone Financial Inc. 7.875% 20241 | 1,258 | 1,337 | ||||||
Ford Motor Credit Co. 3.375% 2025 | 1,875 | 1,923 | ||||||
Freedom Mortgage Corp. 7.625% 20261 | 625 | 662 | ||||||
FS Energy and Power Fund 7.50% 20231 | 3,999 | 3,850 | ||||||
HUB International Ltd. 7.00% 20261 | 1,950 | 2,041 | ||||||
Icahn Enterprises Finance Corp. 6.25% 2022 | 2,334 | 2,345 | ||||||
Icahn Enterprises Finance Corp. 5.25% 2027 | 377 | 405 | ||||||
Iris Merger Sub 2019 Inc. 9.375% 20281 | 349 | 383 | ||||||
Ladder Capital Corp. 5.25% 20221 | 150 | 151 | ||||||
Ladder Capital Corp. 4.25% 20271 | 1,239 | 1,220 | ||||||
LD Holdings Group LLC 6.50% 20251 | 625 | 659 | ||||||
LPL Financial Holdings Inc. 4.625% 20271 | 1,209 | 1,255 | ||||||
MGIC Investment Corp. 5.25% 2028 | 525 | 563 | ||||||
MSCI Inc. 5.375% 20271 | 320 | 342 | ||||||
MSCI Inc. 3.625% 20301 | 66 | 69 | ||||||
MSCI Inc. 3.875% 20311 | 2,150 | 2,276 | ||||||
National Financial Partners Corp. 6.875% 20281 | 1,094 | 1,169 | ||||||
Nationstar Mortgage Holdings Inc. 5.50% 20281 | 425 | 448 | ||||||
Nationstar Mortgage Holdings Inc. 5.125% 20301 | 650 | 680 | ||||||
Navient Corp. 6.50% 2022 | 3,533 | 3,748 | ||||||
Navient Corp. 5.50% 2023 | 3,086 | 3,235 | ||||||
Navient Corp. 5.875% 2024 | 1,020 | 1,086 | ||||||
Navient Corp. 6.125% 2024 | 417 | 447 | ||||||
Navient Corp. 5.00% 2027 | 2,483 | 2,508 | ||||||
Navient Corp. 5.625% 2033 | 978 | 941 | ||||||
New Residential Investment Corp. 6.25% 20251 | 275 | 277 | ||||||
NMI Holdings, Inc. 7.375% 20251 | 290 | 325 | ||||||
OneMain Holdings, Inc. 7.125% 2026 | 685 | 811 | ||||||
Owl Rock Capital Corp. 4.625% 20241 | 750 | 769 | ||||||
Owl Rock Capital Corp. 3.75% 2025 | 900 | 935 | ||||||
Owl Rock Capital Corp. 3.375% 2026 | 390 | 396 | ||||||
210 American Funds Insurance Series
Table of Contents
High-Income Bond Fund (continued)
Bonds, notes & other debt instruments (continued)
Principal amount (000) | Value (000) | |||||||
Corporate bonds, notes & loans (continued) | ||||||||
Financials (continued) | ||||||||
PennyMac Financial Services, Inc. 5.375% 20251 | $ | 525 | $ | 556 | ||||
Quicken Loans, LLC 3.625% 20291 | 455 | 465 | ||||||
Springleaf Finance Corp. 6.125% 2024 | 1,517 | 1,659 | ||||||
Springleaf Finance Corp. 6.625% 2028 | 190 | 226 | ||||||
Springleaf Finance Corp. 5.375% 2029 | 183 | 206 | ||||||
Starwood Property Trust, Inc. 5.00% 2021 | 2,371 | 2,417 | ||||||
Starwood Property Trust, Inc. 5.50% 20231 | 465 | 487 | ||||||
Travelport Finance Luxembourg SARL, Term Loan, (3-month USD-LIBOR + 8.00%) 1.06% 2025 | 895 | 886 | ||||||
Travelport Finance Luxembourg SARL, Term Loan, (3-month USD-LIBOR + 5.00%) 5.254% 20262,3 | 1,483 | 1,028 | ||||||
|
| |||||||
| 57,496 | ||||||||
|
| |||||||
Information technology 3.94% | ||||||||
Almonde Inc., Term Loan, (3-month USD-LIBOR + 7.25%) 8.25% 20252,3 | 3,324 | 3,342 | ||||||
Applied Systems, Inc., Term Loan, (3-month USD-LIBOR + 7.00%) 8.00% 20252,3 | 822 | 829 | ||||||
Austin BidCo Inc. 7.125% 20281 | 940 | 983 | ||||||
Austin BidCo Inc., Term Loan B, (3-month USD-LIBOR + 4.50%) 4.732% 20272,3 | 125 | 125 | ||||||
Avaya Inc. 6.125% 20281 | 490 | 524 | ||||||
Banff Merger Sub Inc. 9.75% 20261 | 723 | 782 | ||||||
Black Knight Inc. 3.625% 20281 | 815 | 835 | ||||||
BMC Software, Inc. 7.125% 20251 | 225 | 245 | ||||||
BMC Software, Inc. 9.125% 20261 | 240 | 259 | ||||||
BMC Software, Inc., Term Loan, (3-month USD-LIBOR + 4.25%) 4.504% 20252,3 | 372 | 371 | ||||||
CommScope Finance LLC 6.00% 20261 | 833 | 879 | ||||||
Diebold Nixdorf AG, Term Loan B, (3-month USD-LIBOR + 2.75%) 3.004% 20232,3 | 647 | 632 | ||||||
Diebold Nixdorf, Inc. 9.375% 20251 | 4,850 | 5,441 | ||||||
Diebold, Inc. 8.50% 2024 | 1,534 | 1,555 | ||||||
Gartner, Inc. 4.50% 20281 | 1,475 | 1,558 | ||||||
Internet Brands, Inc., Term Loan, (3-month USD-LIBOR + 7.50%) 7.647% 20252,3 | 448 | 450 | ||||||
Logan Merger Sub, Inc. 5.50% 20271 | 725 | 760 | ||||||
McAfee, LLC, Term Loan, (3-month USD-LIBOR + 3.75%) 4.004% 20242,3 | 1,035 | 1,036 | ||||||
MoneyGram International Inc., Term Loan B, (3-month USD-LIBOR + 6.00%) 7.00% 20232,3 | 1,216 | 1,223 | ||||||
Sabre GLBL Inc. 7.375% 20251 | 600 | 652 | ||||||
Sabre Holdings Corp. 5.25% 20231 | 83 | 84 | ||||||
Sabre Holdings Corp. 9.25% 20251 | 546 | 651 | ||||||
Solera Holdings, Inc. 10.50% 20241 | 726 | 753 | ||||||
Ultimate Software Group Inc., Term Loan, (3-month USD-LIBOR + 6.75%) 7.50% 20272,3 | 1,325 | 1,366 | ||||||
Unisys Corp. 6.875% 20271 | 1,725 | 1,889 | ||||||
VeriSign, Inc. 4.625% 2023 | 429 | 434 | ||||||
VeriSign, Inc. 5.25% 2025 | 132 | 150 | ||||||
Veritas Holdings Ltd. 7.50% 20231 | 852 | 856 | ||||||
Veritas Holdings Ltd. 10.50% 20241 | 625 | 638 | ||||||
Veritas Holdings Ltd. 7.50% 20251 | 2,140 | 2,199 | ||||||
ViaSat, Inc. 5.625% 20271 | 175 | 184 | ||||||
Xerox Corp. 4.125% 2023 | 314 | 330 | ||||||
Xerox Corp. 5.50% 20281 | 2,035 | 2,163 | ||||||
|
| |||||||
| 34,178 | ||||||||
|
| |||||||
Utilities 2.98% | ||||||||
AES Corp. 3.95% 20301 | 675 | 764 | ||||||
AES Panama Generation Holdings SRL 4.375% 20301 | 200 | 217 | ||||||
AmeriGas Partners, LP 5.75% 2027 | 297 | 339 | ||||||
Calpine Corp. 5.25% 20261 | 96 | 99 | ||||||
Calpine Corp. 4.50% 20281 | 500 | 521 | ||||||
Calpine Corp. 5.125% 20281 | 518 | 546 | ||||||
Calpine Corp. 5.00% 20311 | 1,000 | 1,046 | ||||||
DPL Inc. 4.125% 20251 | 765 | 827 | ||||||
DPL Inc. 4.35% 2029 | 575 | 646 | ||||||
American Funds Insurance Series 211
Table of Contents
High-Income Bond Fund (continued)
Bonds, notes & other debt instruments (continued)
Principal amount (000) | Value (000) | |||||||
Corporate bonds, notes & loans (continued) | ||||||||
Utilities (continued) | ||||||||
Emera Inc. 6.75% 2076 (3-month USD-LIBOR + 5.44% on 6/15/2026)6 | $ | 1,155 | $ | 1,352 | ||||
Enel Società per Azioni 8.75% 2073 (USD Semi Annual 30/360 (vs. 3-month USD-LIBOR) | 1,050 | 1,229 | ||||||
FEL Energy VI SARL 5.75% 20401 | 550 | 586 | ||||||
FirstEnergy Corp. 7.375% 2031 | 364 | 519 | ||||||
FirstEnergy Corp. 4.85% 2047 (5.10% on 1/15/2021)6 | 550 | 685 | ||||||
FirstEnergy Corp. 3.40% 2050 | 1,430 | 1,375 | ||||||
NextEra Energy Partners, LP 4.25% 20241 | 122 | 131 | ||||||
NextEra Energy Partners, LP 3.875% 20261 | 92 | 98 | ||||||
NGL Energy Partners LP 7.50% 2026 | 1,492 | 928 | ||||||
NRG Energy, Inc. 7.25% 2026 | 328 | 347 | ||||||
NRG Energy, Inc. 3.375% 20291 | 630 | 646 | ||||||
NRG Energy, Inc. 3.625% 20311 | 630 | 649 | ||||||
Pacific Gas and Electric Co. 3.75% 2028 | 203 | 221 | ||||||
Pacific Gas and Electric Co. 4.55% 2030 | 473 | 539 | ||||||
Pacific Gas and Electric Co. 4.95% 2050 | 600 | 716 | ||||||
PG&E Corp. 5.00% 2028 | 1,655 | 1,765 | ||||||
PG&E Corp. 5.25% 2030 | 675 | 743 | ||||||
PG&E Corp., Term Loan, (3-month USD-LIBOR + 4.50%) 5.50% 20252,3 | 254 | 257 | ||||||
Talen Energy Corp. 10.50% 20261 | 3,248 | 2,897 | ||||||
Talen Energy Corp. 7.25% 20271 | 2,773 | 2,958 | ||||||
Talen Energy Supply, LLC 7.625% 20281 | 1,590 | 1,716 | ||||||
UEP Penonome II SA 6.50% 20381 | 250 | 261 | ||||||
Vistra Operations Co. LLC 3.55% 20241 | 231 | 250 | ||||||
|
| |||||||
| 25,873 | ||||||||
|
| |||||||
Consumer staples 2.72% | ||||||||
Albertsons Companies, Inc. 3.50% 20291 | 585 | 592 | ||||||
Albertsons Companies, Inc. 4.875% 20301 | 335 | 370 | ||||||
B&G Foods, Inc. 5.25% 2025 | 612 | 633 | ||||||
B&G Foods, Inc. 5.25% 2027 | 228 | 243 | ||||||
Brasil Foods SA 5.75% 20501 | 370 | 412 | ||||||
C&S Wholsesale Grocers Inc. 5.00% 20281 | 650 | 649 | ||||||
Central Garden & Pet Co. 4.125% 2030 | 420 | 439 | ||||||
Darling Ingredients Inc. 5.25% 20271 | 579 | 617 | ||||||
Edgewell Personal Care Co. 5.50% 20281 | 275 | 296 | ||||||
Energizer Holdings, Inc. 7.75% 20271 | 227 | 253 | ||||||
Energizer Holdings, Inc. 4.375% 20291 | 545 | 565 | ||||||
H.J. Heinz Co. 3.875% 20271 | 725 | 782 | ||||||
H.J. Heinz Co. 4.25% 20311 | 713 | 795 | ||||||
H.J. Heinz Co. 4.625% 20391 | 165 | 185 | ||||||
H.J. Heinz Co. 5.50% 20501 | 1,341 | 1,694 | ||||||
Kraft Heinz Company 3.95% 2025 | 580 | 639 | ||||||
Kraft Heinz Company 5.20% 2045 | 330 | 392 | ||||||
Kraft Heinz Company 4.375% 2046 | 1,466 | 1,586 | ||||||
Kraft Heinz Company 4.875% 20491 | 985 | 1,149 | ||||||
Kronos Acquisition Holdings Inc. 5.00% 20261 | 385 | 402 | ||||||
Kronos Acquisition Holdings Inc. 7.00% 20271 | 485 | 509 | ||||||
Lamb Weston Holdings, Inc. 4.625% 20241 | 561 | 586 | ||||||
Nestle Skin Health SA, Term Loan B1, (3-month USD-LIBOR + 4.00%) 4.254% 20262,3 | 1,806 | 1,813 | ||||||
Post Holdings, Inc. 5.00% 20261 | 1,958 | 2,025 | ||||||
Post Holdings, Inc. 5.625% 20281 | 569 | 607 | ||||||
Post Holdings, Inc. 5.50% 20291 | 166 | 181 | ||||||
Post Holdings, Inc. 4.625% 20301 | 1,905 | 2,006 | ||||||
Prestige Brands International Inc. 6.375% 20241 | 260 | 266 | ||||||
Prestige Brands International Inc. 5.125% 20281 | 103 | 110 | ||||||
Spectrum Brands Inc. 5.75% 2025 | 528 | 546 | ||||||
212 American Funds Insurance Series
Table of Contents
High-Income Bond Fund (continued)
Bonds, notes & other debt instruments (continued)
Principal amount (000) | Value (000) | |||||||
Corporate bonds, notes & loans (continued) | ||||||||
Consumer staples (continued) | ||||||||
TreeHouse Foods, Inc. 6.00% 20241 | $ | 1,188 | $ | 1,213 | ||||
TreeHouse Foods, Inc. 4.00% 2028 | 145 | 150 | ||||||
United Natural Foods, Inc. 6.75% 20281 | 865 | 906 | ||||||
|
| |||||||
| 23,611 | ||||||||
|
| |||||||
Real estate 2.62% | ||||||||
Brookfield Property REIT Inc. 5.75% 20261 | 2,839 | 2,806 | ||||||
Diversified Healthcare Trust 4.75% 2024 | 275 | 283 | ||||||
Diversified Healthcare Trust 9.75% 2025 | 650 | 739 | ||||||
Hospitality Properties Trust 7.50% 2025 | 238 | 274 | ||||||
Howard Hughes Corp. 5.375% 20251 | 2,568 | 2,655 | ||||||
Howard Hughes Corp. 5.375% 20281 | 1,950 | 2,101 | ||||||
Iron Mountain Inc. 4.875% 20271 | 1,266 | 1,327 | ||||||
Iron Mountain Inc. 5.00% 20281 | 617 | 656 | ||||||
Iron Mountain Inc. 5.25% 20281 | 1,214 | 1,283 | ||||||
Iron Mountain Inc. 5.25% 20301 | 2,450 | 2,649 | ||||||
Iron Mountain Inc. 4.50% 20311 | 1,960 | 2,056 | ||||||
Ladder Capital Corp. 5.25% 20251 | 140 | 140 | ||||||
Medical Properties Trust, Inc. 5.00% 2027 | 1,333 | 1,420 | ||||||
Medical Properties Trust, Inc. 3.50% 2031 | 1,369 | 1,416 | ||||||
Park Hotels & Resorts Inc. 7.50% 20251 | 425 | 460 | ||||||
QTS Realty Trust, Inc. 3.875% 20281 | 625 | 638 | ||||||
Realogy Corp. 9.375% 20271 | 740 | 821 | ||||||
Realogy Group LLC 7.625% 20251 | 260 | 283 | ||||||
Service Properties Trust 5.50% 2027 | 335 | 366 | ||||||
Xenia Hotels & Resorts, Inc. 6.375% 20251 | 300 | 317 | ||||||
|
| |||||||
| 22,690 | ||||||||
|
| |||||||
Total corporate bonds, notes & loans | 775,019 | |||||||
|
| |||||||
Asset-backed obligations 0.01% | ||||||||
CF Hippolyta LLC, Series 2020-1, Class B2, 2.60% 20601,10 | 95 | 97 | ||||||
|
| |||||||
Municipals 0.00% | ||||||||
Puerto Rico 0.00% | ||||||||
Aqueduct and Sewer Auth., Rev. Bonds, Series 2012-B, 5.35% 2027 | 5 | 5 | ||||||
|
| |||||||
Total bonds, notes & other debt instruments (cost: $755,326,000) | 775,121 | |||||||
|
| |||||||
Convertible bonds & notes 0.61% | ||||||||
Communication services 0.27% | ||||||||
Cinemark USA, Inc., convertible notes, 4.50% 20251 | 190 | 278 | ||||||
DISH DBS Corp., convertible notes, 3.375% 2026 | 635 | 607 | ||||||
Liberty Broadband Corp., convertible notes, 2.75% 20501 | 321 | 344 | ||||||
Live Nation Entertainment, Inc., convertible notes, 2.125% 20251 | 430 | 459 | ||||||
Match Group Financeco 2 Inc., convertible notes, 0.875% 20261 | 175 | 321 | ||||||
Zillow Group, Inc., convertible notes, 1.50% 2023 | 180 | 307 | ||||||
|
| |||||||
| 2,316 | ||||||||
|
| |||||||
Information technology 0.15% | ||||||||
LivePerson, Inc., convertible notes, 0% 20261 | 219 | 240 | ||||||
Sabre Holdings Corp., convertible notes, 4.00% 20251 | 390 | 702 | ||||||
Shift4 Payments, Inc., convertible notes, 0% 20251 | 267 | 327 | ||||||
|
| |||||||
| 1,269 | ||||||||
|
| |||||||
Industrials 0.12% | ||||||||
American Airlines Group Inc., convertible notes, 6.50% 2025 | 183 | 230 | ||||||
Southwest Airlines Co., convertible notes, 1.25% 2025 | 403 | 587 | ||||||
Uber Technologies, Inc., convertible notes, 0% 20251 | 270 | 278 | ||||||
|
| |||||||
| 1,095 | ||||||||
|
| |||||||
American Funds Insurance Series 213
Table of Contents
High-Income Bond Fund (continued)
Convertible bonds & notes (continued)
Principal amount (000) | Value (000) | |||||||
Consumer discretionary 0.06% | ||||||||
NCL Corp. Ltd., convertible notes, 5.375% 20251 | $ | 155 | $ | 263 | ||||
Royal Caribbean Cruises Ltd., convertible notes, 4.25% 20231 | 200 | 267 | ||||||
|
| |||||||
| 530 | ||||||||
|
| |||||||
Energy 0.01% | ||||||||
Mesquite Energy Inc., convertible notes, 15.04% 2023 (100% PIK)1,5,7,8 | 65 | 65 | ||||||
|
| |||||||
Total convertible bonds & notes (cost: $4,324,000) | 5,275 | |||||||
|
| |||||||
Convertible stocks 0.38% | ||||||||
| Shares | ||||||||
Utilities 0.14% | ||||||||
PG&E Corp., convertible preferred units, 5.50% 202311 | 3,350 | 411 | ||||||
American Electric Power Company, Inc., convertible preferred shares, 6.125% 2022 | 8,000 | 401 | ||||||
NextEra Energy, Inc., convertible preferred units, 5.279% 2023 | 4,300 | 219 | ||||||
Essential Utilities, Inc., convertible preferred units, 6.00% 2022 | 2,600 | 161 | ||||||
|
| |||||||
| 1,192 | ||||||||
|
| |||||||
Financials 0.10% | ||||||||
2020 Cash Mandatory Exchangeable Trust, convertible preferred shares, 5.25% 20231 | 411 | 494 | ||||||
KKR & Co. Inc., Series C, convertible preferred shares, 6.00% | 6,980 | 421 | ||||||
|
| |||||||
| 915 | ||||||||
|
| |||||||
Information technology 0.07% | ||||||||
Broadcom Inc., Series A, cumulative convertible preferred shares, 8.00% 2022 | 450 | 640 | ||||||
|
| |||||||
Health care 0.07% | ||||||||
Danaher Corp., Series B, cumulative convertible preferred shares, 5.00% 2023 | 291 | 379 | ||||||
Boston Scientific Corp., Series A, convertible preferred shares, 5.50% 2023 | 1,935 | 212 | ||||||
|
| |||||||
| 591 | ||||||||
|
| |||||||
Total convertible stocks (cost: $2,799,000) | 3,338 | |||||||
|
| |||||||
Preferred securities 0.33% | ||||||||
Consumer discretionary 0.33% | ||||||||
MYT Holding LLC, Series A, preferred shares7,11 | 2,470,906 | 2,841 | ||||||
|
| |||||||
Total preferred securities (cost: $2,212,000) | 2,841 | |||||||
|
| |||||||
Common stocks 4.07% | ||||||||
Health care 1.71% | ||||||||
Rotech Healthcare Inc.7,8,11,12 | 201,793 | 14,327 | ||||||
Advanz Pharma Corp. Ltd.11,12 | 80,350 | 354 | ||||||
Advanz Pharma Corp. Ltd.11 | 29,584 | 131 | ||||||
|
| |||||||
| 14,812 | ||||||||
|
| |||||||
Energy 0.84% | ||||||||
Denbury Inc.11 | 63,840 | 1,640 | ||||||
Oasis Petroleum Inc.11 | 43,838 | 1,625 | ||||||
Ascent Resources - Utica, LLC, Class A7,8,11,12 | 6,297,894 | 1,385 | ||||||
Weatherford International11 | 156,870 | 941 | ||||||
Tribune Resources, LLC7,8,11 | 1,006,339 | 916 | ||||||
California Resources Corp.11 | 17,202 | 406 | ||||||
Whiting Petroleum Corp.11 | 12,063 | 302 | ||||||
McDermott International, Inc.11 | 107,875 | 87 | ||||||
214 American Funds Insurance Series
Table of Contents
High-Income Bond Fund (continued)
Common stocks (continued)
| Shares | Value (000) | |||||||
Energy (continued) | ||||||||
Mesquite Energy, Inc.7,8,11 | 3,557 | $ | 21 | |||||
Tapstone Energy, LLC1,7,8,11 | 14,603 | — | 9 | |||||
Sable Permian Resources, LLC, units7,8,11 | 15,816,020 | — | 9 | |||||
|
| |||||||
| 7,323 | ||||||||
|
| |||||||
Industrials 0.81% | ||||||||
Associated Materials Group Inc.7,8,11 | 949,277 | 5,961 | ||||||
ACR III LSC Holdings LLC7,8,11 | 1,061 | 1,098 | ||||||
|
| |||||||
| 7,059 | ||||||||
|
| |||||||
Consumer discretionary 0.37% | ||||||||
MYT Holding Co., Class B7,11 | 608,846 | 1,644 | ||||||
NMG Parent LLC7,11 | 14,350 | 947 | ||||||
NMG Parent LLC1,7,8,11 | 1,615 | 75 | ||||||
Chewy, Inc., Class A11 | 3,070 | 276 | ||||||
Scientific Games Corp.11 | 6,000 | 249 | ||||||
|
| |||||||
| 3,191 | ||||||||
|
| |||||||
Materials 0.12% | ||||||||
Hexion Holdings Corp., Class B11 | 81,939 | 1,004 | ||||||
|
| |||||||
Information technology 0.10% | ||||||||
Snowflake Inc., Class A11 | 1,200 | 338 | ||||||
MoneyGram International, Inc.11 | 50,000 | 273 | ||||||
C3.ai, Inc., Class A11 | 1,800 | 250 | ||||||
|
| |||||||
| 861 | ||||||||
|
| |||||||
Financials 0.09% | ||||||||
Jonah Energy Parent LLC7,8,11 | 38,716 | 581 | ||||||
Navient Corp. | 20,000 | 196 | ||||||
|
| |||||||
| 777 | ||||||||
|
| |||||||
Communication services 0.03% | ||||||||
iHeartMedia, Inc., Class A11 | 22,639 | 294 | ||||||
|
| |||||||
Total common stocks (cost: $41,154,000) | 35,321 | |||||||
|
| |||||||
Rights & warrants 0.01% | ||||||||
Consumer discretionary 0.01% | ||||||||
NMG Parent LLC, warrants, expire 20277,11 | 27,111 | 76 | ||||||
|
| |||||||
Energy 0.00% | ||||||||
Tribune Resources, LLC, Class A, warrants, expire 20237,8,11 | 336,564 | — | 9 | |||||
Tribune Resources, LLC, Class B, warrants, expire 20237,8,11 | 261,772 | — | 9 | |||||
Tribune Resources, LLC, Class C, warrants, expire 20237,8,11 | 247,225 | — | 9 | |||||
|
| |||||||
| — | 9 | |||||||
|
| |||||||
Total rights & warrants (cost: $215,000) | 76 | |||||||
|
| |||||||
American Funds Insurance Series 215
Table of Contents
High-Income Bond Fund (continued)
Short-term securities 3.86%
| Shares | Value (000) | |||||||
Money market investments 3.86% | ||||||||
Capital Group Central Cash Fund 0.12%13,14 | 334,899 | $ | 33,493 | |||||
|
| |||||||
Total short-term securities (cost: $33,489,000) | 33,493 | |||||||
|
| |||||||
Total investment securities 98.60% (cost: $839,519,000) | 855,465 | |||||||
Other assets less liabilities 1.40% | 12,114 | |||||||
|
| |||||||
Net assets 100.00% | $ | 867,579 | ||||||
|
| |||||||
Futures contracts
Contracts | Type | Number of contracts | Expiration | Notional amount15 (000) | Value at 12/31/202016 (000) | Unrealized appreciation (depreciation) at 12/31/2020 (000) | ||||||||||||||||
10 Year Ultra U.S. Treasury Note Futures | Short | 24 | March 2021 | $ | (2,400 | ) | $ | (3,753 | ) | $ | 8 | |||||||||||
10 Year U.S. Treasury Note Futures | Short | 82 | March 2021 | (8,200 | ) | (11,322 | ) | (27 | ) | |||||||||||||
|
| |||||||||||||||||||||
| $ | (19 | ) | ||||||||||||||||||||
|
| |||||||||||||||||||||
Swap contracts
Credit default swaps
Centrally cleared credit default swaps on credit indices — buy protection
Receive | Pay/ Payment frequency | Expiration date | Notional (000) | Value at 12/31/2020 (000) | Upfront premium received (000) | Unrealized appreciation (depreciation) at 12/31/2020 (000) | ||||||||||||||||||
CDX.NA.IG.35 | 1.00%/Quarterly | 12/20/2025 | $ | 15,200 | $ | (372 | ) | $ | (379 | ) | $ | 7 | ||||||||||||
CDX.NA.HY.35 | 5.00%/Quarterly | 12/20/2025 | 20,525 | (1,911 | ) | (1,183 | ) | (728 | ) | |||||||||||||||
|
|
|
| |||||||||||||||||||||
| $ | (1,562 | ) | $ | (721 | ) | |||||||||||||||||||
|
|
|
| |||||||||||||||||||||
Investments in affiliates14
| Value of affiliate at 1/1/2020 (000) | Additions (000) | Reductions (000) | Net realized gain (000) | Net unrealized depreciation (000) | Value of affiliate at 12/31/2020 (000) | Dividend income (000) | ||||||||||||||||||||||
Short-term securities 3.86% | ||||||||||||||||||||||||||||
Money market investments 3.86% | ||||||||||||||||||||||||||||
Capital Group Central Cash Fund 0.12%13 | $ | 39,112 | $ | 330,467 | $ | 336,030 | $ | 73 | $ | (129 | ) | $ | 33,493 | $ | 227 | |||||||||||||
216 American Funds Insurance Series
Table of Contents
High-Income Bond Fund (continued)
| 1 | Acquired in a transaction exempt from registration under Rule 144A of the Securities Act of 1933. May be resold in the U.S. in transactions exempt from registration, normally to qualified institutional buyers. The total value of all such securities was $517,886,000, which represented 59.69% of the net assets of the fund. |
| 2 | Loan participations and assignments; may be subject to legal or contractual restrictions on resale. The total value of all such loans was $37,070,000, which represented 4.27% of the net assets of the fund. |
| 3 | Coupon rate may change periodically. Reference rate and spread are as of the most recent information available. Some coupon rates are determined by the issuer or agent based on current market conditions; therefore, the reference rate and spread are not available. |
| 4 | Scheduled interest and/or principal payment was not received. |
| 5 | Payment in kind; the issuer has the option of paying additional securities in lieu of cash. Most recent payment was 100% cash unless otherwise noted. |
| 6 | Step bond; coupon rate may change at a later date. |
| 7 | Valued under fair value procedures adopted by authority of the board of trustees. The total value of all such securities was $34,321,000, which represented 3.96% of the net assets of the fund. |
| 8 | Value determined using significant unobservable inputs. |
| 9 | Amount less than one thousand. |
| 10 | Principal payments may be made periodically. Therefore, the effective maturity date may be earlier than the stated maturity date. |
| 11 | Security did not produce income during the last 12 months. |
| 12 | Acquired through a private placement transaction exempt from registration under the Securities Act of 1933. May be subject to legal or contractual restrictions on resale. Further details on these holdings appear on the following page. |
| 13 | Rate represents the seven-day yield at 12/31/2020. |
| 14 | Part of the same group of investment companies as the fund as defined under the Investment Company Act of 1940. |
| 15 | Notional amount is calculated based on the number of contracts and notional contract size. |
| 16 | Value is calculated based on the notional amount and current market price. |
Private placement securities | Acquisition date | Cost (000) | Value (000) | Percent of net assets | ||||||||
Rotech Healthcare Inc. | 9/26/2013 | $ | 4,331 | $ | 14,327 | 1.65% | ||||||
Ascent Resources - Utica, LLC, Class A | 11/15/2016 | 302 | 1,385 | .16 | ||||||||
Advanz Pharma Corp. Ltd. | 8/31/2018 | 1,017 | 354 | .04 | ||||||||
|
|
|
|
| ||||||||
Total private placement securities | $ | 5,650 | $ | 16,066 | 1.85% | |||||||
|
|
|
|
| ||||||||
Key to abbreviations and symbols
Auth. = Authority
£ = British pounds
€ = Euros
LIBOR = London Interbank Offered Rate
Rev. = Revenue
USD/$ = U.S. dollars
See notes to financial statements.
American Funds Insurance Series 217
Table of Contents
American Funds Mortgage Fund (formerly Mortgage Fund)
Investment portfolio December 31, 2020
Bonds, notes & other debt instruments 78.54%
| Principal amount | Value | |||||||
| (000) | (000) | |||||||
Mortgage-backed obligations 68.70% | ||||||||
Federal agency mortgage-backed obligations 64.32% | ||||||||
Fannie Mae Pool #AS7638 2.50% 20311 | $ | 1,073 | $ | 1,120 | ||||
Fannie Mae Pool #695412 5.00% 20331 | — | 2 | — | 2 | ||||
Fannie Mae Pool #AD3566 5.00% 20351 | 2 | 2 | ||||||
Fannie Mae Pool #MA4228 1.50% 20361 | 80 | 82 | ||||||
Fannie Mae Pool #256583 5.00% 20361,3 | 35 | 37 | ||||||
Fannie Mae Pool #889101 2.125% 20381,4 | 35 | 36 | ||||||
Fannie Mae Pool #964279 2.633% 20381,4 | 32 | 32 | ||||||
Fannie Mae Pool #964708 2.765% 20381,4 | 4 | 4 | ||||||
Fannie Mae Pool #AC0794 5.00% 20391 | 10 | 11 | ||||||
Fannie Mae Pool #931768 5.00% 20391 | 2 | 2 | ||||||
Fannie Mae Pool #AL9335 2.604% 20401,4 | 1,327 | 1,389 | ||||||
Fannie Mae Pool #932606 5.00% 20401 | 5 | 6 | ||||||
Fannie Mae Pool #AL9327 3.122% 20411,4 | 1,241 | 1,302 | ||||||
Fannie Mae Pool #AL9326 3.302% 20411,4 | 1,704 | 1,788 | ||||||
Fannie Mae Pool #AJ1873 4.00% 20411 | 7 | 8 | ||||||
Fannie Mae Pool #AE1248 5.00% 20411 | 11 | 13 | ||||||
Fannie Mae Pool #AE1274 5.00% 20411 | 9 | 10 | ||||||
Fannie Mae Pool #AE1277 5.00% 20411 | 5 | 6 | ||||||
Fannie Mae Pool #AE1283 5.00% 20411 | 3 | 4 | ||||||
Fannie Mae Pool #AP7553 3.00% 20421 | 402 | 430 | ||||||
Fannie Mae Pool #AE1290 5.00% 20421 | 6 | 7 | ||||||
Fannie Mae Pool #AL3829 3.50% 20431 | 64 | 70 | ||||||
Fannie Mae Pool #AT7161 3.50% 20431 | 29 | 31 | ||||||
Fannie Mae Pool #AR1512 3.50% 20431 | 14 | 15 | ||||||
Fannie Mae Pool #AT0412 3.50% 20431 | 7 | 8 | ||||||
Fannie Mae Pool #AT3954 3.50% 20431 | 4 | 4 | ||||||
Fannie Mae Pool #AT0300 3.50% 20431 | 3 | 3 | ||||||
Fannie Mae Pool #AY1829 3.50% 20441 | 5 | 6 | ||||||
Fannie Mae Pool #AW8240 3.50% 20441 | 1 | 1 | ||||||
Fannie Mae Pool #BE5017 3.50% 20451 | 36 | 39 | ||||||
Fannie Mae Pool #BE5009 3.50% 20451 | 29 | 31 | ||||||
Fannie Mae Pool #BE8740 3.50% 20471 | 33 | 36 | ||||||
Fannie Mae Pool #BE8742 3.50% 20471 | 10 | 11 | ||||||
Fannie Mae Pool #BH2848 3.50% 20471 | 5 | 5 | ||||||
Fannie Mae Pool #BH2847 3.50% 20471 | 3 | 4 | ||||||
Fannie Mae Pool #BH2846 3.50% 20471 | 4 | 4 | ||||||
Fannie Mae Pool #BJ5015 4.00% 20471 | 79 | 87 | ||||||
Fannie Mae Pool #BH3122 4.00% 20471 | 3 | 3 | ||||||
Fannie Mae Pool #BM4488 3.398% 20481,4 | 892 | 928 | ||||||
Fannie Mae Pool #BJ4901 3.50% 20481 | 23 | 25 | ||||||
Fannie Mae Pool #CA2850 4.00% 20481 | 91 | 102 | ||||||
Fannie Mae Pool #BK6840 4.00% 20481 | 51 | 55 | ||||||
Fannie Mae Pool #BK5232 4.00% 20481 | 40 | 44 | ||||||
Fannie Mae Pool #BK9743 4.00% 20481 | 14 | 15 | ||||||
Fannie Mae Pool #BK7665 4.50% 20481 | 336 | 373 | ||||||
Fannie Mae Pool #BK0951 4.50% 20481 | 257 | 288 | ||||||
Fannie Mae Pool #CA2205 4.50% 20481 | 67 | 72 | ||||||
Fannie Mae Pool #BK9761 4.50% 20481 | 14 | 15 | ||||||
Fannie Mae Pool #CA4867 3.00% 20491,3 | 4,614 | 5,010 | ||||||
Fannie Mae Pool #CA4151 3.50% 20491 | 318 | 350 | ||||||
Fannie Mae Pool #BJ8411 3.50% 20491 | 67 | 73 | ||||||
Fannie Mae Pool #BJ8402 3.53% 20491,4 | 178 | 185 | ||||||
Fannie Mae Pool #CA5496 3.00% 20501 | 9,365 | 10,214 | ||||||
Fannie Mae Pool #MA4256 2.50% 20511 | 7 | 7 | ||||||
Freddie Mac Pool #A18781 5.00% 20341,3 | 907 | 1,049 | ||||||
Freddie Mac Pool #SB8083 1.50% 20361 | 1,256 | 1,293 | ||||||
Freddie Mac Pool #C91883 4.00% 20361 | 3,471 | 3,792 | ||||||
Freddie Mac Pool #840222 2.803% 20401,4 | 363 | 382 | ||||||
Freddie Mac Pool #Q18236 3.50% 20431 | 29 | 31 | ||||||
Freddie Mac Pool #Q19133 3.50% 20431 | 18 | 20 | ||||||
Freddie Mac Pool #Q17696 3.50% 20431 | 16 | 18 | ||||||
| 218 | American Funds Insurance Series |
Table of Contents
American Funds Mortgage Fund (formerly Mortgage Fund) (continued)
Bonds, notes & other debt instruments (continued)
| Principal amount (000) | Value (000) | |||||||
Mortgage-backed obligations (continued) | ||||||||
Federal agency mortgage-backed obligations (continued) | ||||||||
Freddie Mac Pool #Q15874 4.00% 20431 | $ | 2 | $ | 2 | ||||
Freddie Mac Pool #760012 3.097% 20451,4 | 83 | 86 | ||||||
Freddie Mac Pool #760014 3.116% 20451,4 | 788 | 823 | ||||||
Freddie Mac Pool #760013 3.162% 20451,4 | 46 | 48 | ||||||
Freddie Mac Pool #760015 2.849% 20471,4 | 140 | 145 | ||||||
Freddie Mac Pool #Q52069 3.50% 20471 | 48 | 52 | ||||||
Freddie Mac Pool #Q47615 3.50% 20471 | 33 | 36 | ||||||
Freddie Mac Pool #Q55056 3.50% 20481 | 60 | 65 | ||||||
Freddie Mac Pool #Q54709 3.50% 20481 | 36 | 39 | ||||||
Freddie Mac Pool #Q54701 3.50% 20481 | 34 | 37 | ||||||
Freddie Mac Pool #Q54782 3.50% 20481 | 30 | 32 | ||||||
Freddie Mac Pool #Q54781 3.50% 20481 | 27 | 30 | ||||||
Freddie Mac Pool #Q54700 3.50% 20481 | 26 | 29 | ||||||
Freddie Mac Pool #Q55060 3.50% 20481 | 19 | 20 | ||||||
Freddie Mac Pool #Q56591 3.50% 20481 | 18 | 19 | ||||||
Freddie Mac Pool #Q56590 3.50% 20481 | 17 | 18 | ||||||
Freddie Mac Pool #Q56589 3.50% 20481 | 16 | 17 | ||||||
Freddie Mac Pool #Q54698 3.50% 20481 | 14 | 15 | ||||||
Freddie Mac Pool #Q54699 3.50% 20481 | 13 | 14 | ||||||
Freddie Mac Pool #Q54831 3.50% 20481 | 9 | 10 | ||||||
Freddie Mac Pool #G67711 4.00% 20481 | 440 | 486 | ||||||
Freddie Mac Pool #Q56599 4.00% 20481 | 57 | 63 | ||||||
Freddie Mac Pool #Q56175 4.00% 20481 | 43 | 47 | ||||||
Freddie Mac Pool #Q55971 4.00% 20481 | 38 | 42 | ||||||
Freddie Mac Pool #Q55970 4.00% 20481 | 19 | 21 | ||||||
Freddie Mac Pool #Q58411 4.50% 20481 | 116 | 129 | ||||||
Freddie Mac Pool #Q58436 4.50% 20481 | 52 | 59 | ||||||
Freddie Mac Pool #Q58378 4.50% 20481 | 43 | 48 | ||||||
Freddie Mac Pool #Q57242 4.50% 20481 | 31 | 34 | ||||||
Freddie Mac Pool #RA1339 3.00% 20491 | 3,063 | 3,282 | ||||||
Freddie Mac Pool #RA1463 3.50% 20491 | 216 | 238 | ||||||
Freddie Mac Pool #QA2748 3.50% 20491 | 29 | 32 | ||||||
Freddie Mac Pool #SD7514 3.50% 20501,3 | 10,578 | 11,378 | ||||||
Freddie Mac, Series K030, Class A2, Multi Family, 3.25% 20231 | 1,746 | 1,850 | ||||||
Freddie Mac, Series K031, Class A2, Multi Family, 3.30% 20231 | 4,722 | 5,026 | ||||||
Freddie Mac, Series K083, Class A2, Multi Family, 4.05% 20281,4 | 900 | 1,096 | ||||||
Freddie Mac Seasoned Credit Risk Transfer Trust, Series 2017-2, Class MA, 3.00% 20561 | 1,257 | 1,348 | ||||||
Freddie Mac Seasoned Credit Risk Transfer Trust, Series 2017-2, Class HA, 3.00% 20561,4 | 1,260 | 1,324 | ||||||
Freddie Mac Seasoned Credit Risk Transfer Trust, Series 2017-1, Class HA, 3.00% 20561,4 | 1,032 | 1,084 | ||||||
Freddie Mac Seasoned Credit Risk Transfer Trust, Series 2017-3, Class HT, 3.25% 20561 | 136 | 149 | ||||||
Freddie Mac Seasoned Credit Risk Transfer Trust, Series 2018-1, Class HT, 3.00% 20571 | 722 | 783 | ||||||
Freddie Mac Seasoned Credit Risk Transfer Trust, Series 2017-4, Class HT, 3.25% 20571,4 | 4,576 | 4,990 | ||||||
Freddie Mac Seasoned Credit Risk Transfer Trust, Series 2018-3, Class MA, 3.50% 20571 | 2,640 | 2,861 | ||||||
Freddie Mac Seasoned Credit Risk Transfer Trust, Series 2017-4, Class MT, 3.50% 20571 | 2,020 | 2,205 | ||||||
Freddie Mac Seasoned Credit Risk Transfer Trust, Series 2018-2, Class MT, 3.50% 20571 | 1,097 | 1,198 | ||||||
Freddie Mac Seasoned Credit Risk Transfer Trust, Series 2019-2, Class MT, 3.50% 20581 | 42 | 46 | ||||||
Freddie Mac Seasoned Credit Risk Transfer Trust, Series 2019-3, Class MT, 3.50% 20581 | 27 | 30 | ||||||
Freddie Mac Seasoned Loan Structured Transaction Trust, Series 2018-2, Class A1, 3.50% 20281 | 5,765 | 6,099 | ||||||
Freddie Mac Seasoned Loan Structured Transaction Trust, Series 2018-1, Class A1, 3.50% 20281 | 1,608 | 1,692 | ||||||
Government National Mortgage Assn. 2.00% 20511,5 | 18,325 | 19,101 | ||||||
Government National Mortgage Assn. 2.50% 20511,5 | 4,750 | 5,009 | ||||||
Government National Mortgage Assn. 3.00% 20511,5 | 150 | 157 | ||||||
Government National Mortgage Assn. 3.50% 20511,5 | 19 | 20 | ||||||
Government National Mortgage Assn. 3.50% 20511,5 | 18 | 20 | ||||||
Government National Mortgage Assn. Pool #AH5894 3.75% 20341 | 988 | 1,062 | ||||||
Government National Mortgage Assn. Pool #AD0028 3.75% 20381 | 663 | 714 | ||||||
Government National Mortgage Assn. Pool #AH5897 3.75% 20391 | 624 | 671 | ||||||
Government National Mortgage Assn. Pool #004410 4.00% 20391 | 60 | 62 | ||||||
Government National Mortgage Assn. Pool #783690 6.00% 20391 | 134 | 155 | ||||||
| American Funds Insurance Series | 219 |
Table of Contents
American Funds Mortgage Fund (formerly Mortgage Fund) (continued)
Bonds, notes & other debt instruments (continued)
| Principal amount | Value | |||||||
| (000) | (000) | |||||||
Mortgage-backed obligations (continued) | ||||||||
Federal agency mortgage-backed obligations (continued) | ||||||||
Government National Mortgage Assn. Pool #004823 4.00% 20401 | $ | 141 | $ | 146 | ||||
Government National Mortgage Assn. Pool #005142 4.50% 20411 | 29 | 31 | ||||||
Government National Mortgage Assn. Pool #005104 5.00% 20411 | 553 | 608 | ||||||
Government National Mortgage Assn. Pool #005165 6.50% 20411 | 145 | 167 | ||||||
Government National Mortgage Assn. Pool #AA5326 3.50% 20421 | 243 | 252 | ||||||
Government National Mortgage Assn. Pool #MA0366 3.50% 20421 | 210 | 217 | ||||||
Government National Mortgage Assn. Pool #AA5526 3.50% 20421 | 143 | 151 | ||||||
Government National Mortgage Assn. Pool #AA7301 3.50% 20431 | 1,338 | 1,493 | ||||||
Government National Mortgage Assn. Pool #AD7278 3.50% 20431,3 | 1,043 | 1,120 | ||||||
Government National Mortgage Assn. Pool #AF0140 3.50% 20431 | 237 | 251 | ||||||
Government National Mortgage Assn. Pool #AD4360 3.50% 20431 | 96 | 102 | ||||||
Government National Mortgage Assn. Pool #AH5882 3.75% 20441 | 532 | 587 | ||||||
Government National Mortgage Assn. Pool #AH5884 4.25% 20441 | 1,444 | 1,631 | ||||||
Government National Mortgage Assn. Pool #MA3727 4.00% 20461 | 463 | 487 | ||||||
Government National Mortgage Assn. Pool #MA5877 4.50% 20491 | 783 | 847 | ||||||
Government National Mortgage Assn. Pool #MA6092 4.50% 20491 | 336 | 362 | ||||||
Government National Mortgage Assn. Pool #AO0409 4.55% 20651 | 218 | 237 | ||||||
Government National Mortgage Assn. Pool #AO0461 4.562% 20651 | 118 | 128 | ||||||
Government National Mortgage Assn. Pool #AN1825 4.573% 20651 | 375 | 407 | ||||||
Government National Mortgage Assn. Pool #AO0385 4.502% 20661 | 836 | 920 | ||||||
Government National Mortgage Assn. Pool #725897 5.20% 20661 | 4 | 4 | ||||||
Uniform Mortgage-Backed Security 1.50% 20361,5 | 23,863 | 24,519 | ||||||
Uniform Mortgage-Backed Security 1.50% 20361,5 | 12,400 | 12,735 | ||||||
Uniform Mortgage-Backed Security 2.00% 20361,5 | 10,700 | 11,175 | ||||||
Uniform Mortgage-Backed Security 2.00% 20511,5 | 12,555 | 12,997 | ||||||
Uniform Mortgage-Backed Security 2.00% 20511,5 | 9,663 | 10,019 | ||||||
Uniform Mortgage-Backed Security 2.50% 20511,5 | 280 | 295 | ||||||
Uniform Mortgage-Backed Security 2.50% 20511,5 | 211 | 221 | ||||||
Uniform Mortgage-Backed Security 3.00% 20511,5 | 3,656 | 3,833 | ||||||
Uniform Mortgage-Backed Security 3.50% 20511,5 | 5,206 | 5,511 | ||||||
Uniform Mortgage-Backed Security 4.00% 20511,5 | 77 | 82 | ||||||
Uniform Mortgage-Backed Security 4.50% 20511,5 | 6,348 | 6,889 | ||||||
|
| |||||||
| 205,560 | ||||||||
|
| |||||||
Collateralized mortgage-backed obligations (privately originated) 3.68% | ||||||||
Arroyo Mortgage Trust, Series 2018-1, Class A1, 3.763% 20481,4,6 | 464 | 472 | ||||||
Cascade Funding Mortgage Trust, Series 2019-HB1, Class A, 2.386% 20291,4,6 | 221 | 223 | ||||||
Cascade Funding Mortgage Trust, Series 2020-HB4, Class A, 0.946% 20301,4,6 | 726 | 727 | ||||||
Cascade Funding Mortgage Trust, Series 2020-HB3, Class A, 2.812% 20301,4,6 | 921 | 930 | ||||||
Cascade Funding Mortgage Trust, Series 2020-HBA, Class A, 3.405% 20301,4,6 | 217 | 220 | ||||||
Finance of America HECM Buyout, Series 2020-HB1, Class A, 2.012% 20301,4,6 | 449 | 453 | ||||||
JPMorgan Mortgage Trust, Series 2019-INV3, Class A3, 3.50% 20501,4,6 | 534 | 557 | ||||||
Mello Warehouse Securitization Trust, Series 2019-2, Class A, (1-month USD-LIBOR + 0.75%) 0.898% 20521,4,6 | 750 | 751 | ||||||
Mello Warehouse Securitization Trust, Series 2020-2, Class A, (1-month USD-LIBOR + 0.80%) 0.996% 20531,4,6 | 583 | 584 | ||||||
Mello Warehouse Securitization Trust, Series 2020-1, Class A, (1-month USD-LIBOR + 0.90%) 1.048% 20531,4,6 | 809 | 811 | ||||||
Mortgage Repurchase Agreement Financing Trust, Series 2020-1, Class A1, (1-month USD-LIBOR + 2.00%) 2.149% 20221,4,6 | 500 | 501 | ||||||
Mortgage Repurchase Agreement Financing Trust, Series 2020-5, Class A1, (1-month USD-LIBOR + 1.00%) 1.149% 20231,4,6 | 750 | 756 | ||||||
Nationstar HECM Loan Trust, Series 2019-2A, Class A, 2.272% 20291,4,6 | 268 | 269 | ||||||
Nationstar HECM Loan Trust, Series 2019-1A, Class A, 2.651% 20291,4,6 | 347 | 347 | ||||||
Onslow Bay Financial LLC, Series 2020-INV1, Class A5, 3.50% 20491,4,6 | 314 | 324 | ||||||
RMF Proprietary Issuance Trust, Series 2019-1, Class A, 2.75% 20631,4,6 | 806 | 811 | ||||||
Starwood Mortgage Residential Trust, Series 2020-2, Class A1, 2.718% 20601,4,6 | 395 | 403 | ||||||
Station Place Securitization Trust, Series 2020-WL1, Class A, (1-month USD-LIBOR + 1.15%) 1.298% 20511,4,6 | 750 | 751 | ||||||
Towd Point Mortgage Trust, Series 2016-5, Class A1, 2.50% 20561,4,6 | 435 | 444 | ||||||
| 220 | American Funds Insurance Series |
Table of Contents
American Funds Mortgage Fund (formerly Mortgage Fund) (continued)
Bonds, notes & other debt instruments (continued)
| Principal amount | Value | |||||||
| (000) | (000) | |||||||
Mortgage-backed obligations (continued) | ||||||||
Collateralized mortgage-backed obligations (privately originated) (continued) | ||||||||
Towd Point Mortgage Trust, Series 2017-5, Class A1, 0.748% 20571,4,6 | $ | 32 | $ | 32 | ||||
Towd Point Mortgage Trust, Series 2017-4, Class A1, 2.75% 20571,4,6 | 118 | 122 | ||||||
Towd Point Mortgage Trust, Series 2017-3, Class A1, 2.75% 20571,4,6 | 87 | 90 | ||||||
Towd Point Mortgage Trust, Series 2017-6, Class A1, 2.75% 20571,4,6 | 72 | 74 | ||||||
Towd Point Mortgage Trust, Series 2015-2, Class 2A11, 3.00% 20571,4,6 | 78 | 78 | ||||||
Towd Point Mortgage Trust, Series 2018-2, Class A1, 3.25% 20581,4,6 | 185 | 194 | ||||||
Towd Point Mortgage Trust, Series 2020-4, Class A1, 1.75% 20601,6 | 721 | 739 | ||||||
Vendee Mortgage Trust, Series 2010-1, Class DA, 4.25% 20351 | 93 | 94 | ||||||
|
| |||||||
| 11,757 | ||||||||
|
| |||||||
Commercial mortgage-backed securities 0.70% | ||||||||
MRA Issuance Trust, Series 2020-10, Class A, (1-month USD-LIBOR + 1.75%) 2.25% 20211,4,6,7 | 2,250 | 2,250 | ||||||
|
| |||||||
Total mortgage-backed obligations | 219,567 | |||||||
|
| |||||||
U.S. Treasury bonds & notes 8.02% | ||||||||
U.S. Treasury 6.74% | ||||||||
U.S. Treasury 0.375% 2025 | 200 | 200 | ||||||
U.S. Treasury 0.625% 2030 | 2,000 | 1,949 | ||||||
U.S. Treasury 1.25% 2050 | 6,655 | 6,036 | ||||||
U.S. Treasury 1.375% 2050 | 6,150 | 5,755 | ||||||
U.S. Treasury 1.625% 2050 | 7,640 | 7,604 | ||||||
|
| |||||||
| 21,544 | ||||||||
|
| |||||||
U.S. Treasury inflation-protected securities 1.28% | ||||||||
U.S. Treasury Inflation-Protected Security 2.125% 20418 | 131 | 205 | ||||||
U.S. Treasury Inflation-Protected Security 0.75% 20423,8 | 1,640 | 2,091 | ||||||
U.S. Treasury Inflation-Protected Security 1.00% 20498 | 1,268 | 1,788 | ||||||
|
| |||||||
| 4,084 | ||||||||
|
| |||||||
Total U.S. Treasury bonds & notes | 25,628 | |||||||
|
| |||||||
Asset-backed obligations 1.73% | ||||||||
American Express Credit Account Master Trust, Series 2018-3, Class A, 0.479% 20251,4 | 210 | 211 | ||||||
CF Hippolyta LLC, Series 2020-1, Class A1, 1.69% 20601,6 | 635 | 648 | ||||||
CF Hippolyta LLC, Series 2020-1, Class A2, 1.99% 20601,6 | 105 | 106 | ||||||
Drivetime Auto Owner Trust, Series 2019-3, Class A, 2.55% 20221,6 | 30 | 30 | ||||||
Dryden Senior Loan Fund, Series 2014-33A, Class AR3, CLO, (3-month USD-LIBOR + 1.00%) 1.237% 20291,4,6 | 250 | 250 | ||||||
Exeter Automobile Receivables Trust, Series 2019-3A, Class C, 2.79% 20241,6 | 1,000 | 1,022 | ||||||
FirstKey Homes Trust, Series 2020-SFR2, Class A, 1.266% 20371,6 | 879 | 885 | ||||||
Ford Credit Floorplan Master Owner Trust, Series 2019-3, Class A1, 2.23% 20241 | 1,000 | 1,032 | ||||||
GM Financial Consumer Automobile Receivables Trust, Series 2020-2, Class A2B, 1.203% 20231,4 | 116 | 117 | ||||||
GM Financial Consumer Automobile Receivables Trust, Series 2020-2, Class A3, 1.49% 20241 | 74 | 76 | ||||||
OSW Structured Asset Trust, Series 2020-RPL1, Class A1, 3.072% 20601,4,6 | 128 | 131 | ||||||
Palmer Square Loan Funding, CLO, Series 2019-2, Class A1, (3-month USD-LIBOR + 0.97%) 1.188% 20271,4,6 | 587 | 586 | ||||||
Palmer Square Ltd., Series 2015-1A, Class A1R3, (3-month USD-LIBOR + 1.00%) 1.245% 20291,4,6 | 330 | 330 | ||||||
Symphony Ltd., CLO, Series 2013-12A, Class AR, (3-month USD-LIBOR + 1.03%) 1.267% 20251,4,6 | 122 | 122 | ||||||
|
| |||||||
| 5,546 | ||||||||
|
| |||||||
| American Funds Insurance Series | 221 |
Table of Contents
American Funds Mortgage Fund (formerly Mortgage Fund) (continued)
Bonds, notes & other debt instruments (continued)
| Principal amount (000) | Value (000) | |||||||
Federal agency bonds & notes 0.09% | ||||||||
Fannie Mae 0.875% 2030 | $ | 300 | $ | 294 | ||||
|
| |||||||
Total bonds, notes & other debt instruments (cost: $246,328,000) | 251,035 | |||||||
|
| |||||||
Short-term securities 44.24% |
| |||||||
Commercial paper 27.57% |
| |||||||
Army and Air Force Exchange Service 0.11% due 1/7/20216 | 8,300 | 8,299 | ||||||
Atlantic Asset Securitization LLC 0.16% due 1/11/20216 | 6,600 | 6,600 | ||||||
Chariot Funding, LLC 0.16% due 1/11/20216 | 5,000 | 5,000 | ||||||
CHARTA, LLC 0.17% due 1/19/20216 | 8,000 | 7,999 | ||||||
Chevron Corp. 0.11% due 2/1/20216 | 8,000 | 7,999 | ||||||
Emerson Electric Co. 0.11%-0.12% due 1/22/2021-2/22/20216 | 7,804 | 7,803 | ||||||
ExxonMobil Corp. 0.10%-0.13% due 1/27/202-2/22/2021 | 9,000 | 8,999 | ||||||
Johnson & Johnson 0% due 6/1/20216 | 4,000 | 3,998 | ||||||
Kaiser Foundation Hospitals 0% due 5/4/2021 | 8,027 | 8,019 | ||||||
National Rural Utilities Cooperative Finance Corp. 0.12% due 2/4/2021 | 5,000 | 4,999 | ||||||
Old Line Funding, LLC 0.15% due 1/7/20216 | 7,900 | 7,900 | ||||||
Paccar Financial Corp. 0.11%-0.12% due 1/11/2021-2/9/2021 | 9,000 | 8,999 | ||||||
Regents of the University of California 0.17% due 2/18/2021 | 1,500 | 1,500 | ||||||
|
| |||||||
| 88,114 | ||||||||
|
| |||||||
Federal agency bills & notes 16.67% | ||||||||
Federal Farm Credit Banks 0.07%-0.10% due 1/20/2021-5/12/2021 | 23,100 | 23,092 | ||||||
Federal Home Loan Bank 0.07%-0.09% due 1/4/2021-3/5/2021 | 30,200 | 30,198 | ||||||
|
| |||||||
| 53,290 | ||||||||
|
| |||||||
Total short-term securities (cost: $141,410,000) | 141,404 | |||||||
|
| |||||||
Total investment securities 122.78% (cost: $387,738,000) | 392,439 | |||||||
Other assets less liabilities (22.78)% | (72,820 | ) | ||||||
|
| |||||||
Net assets 100.00% | $ | 319,619 | ||||||
|
| |||||||
| Futures contracts | ||||||||||||||||||||||||
Contracts | Type | Number of contracts | Expiration | Notional amount9 (000) | Value at 12/31/202010 (000) | Unrealized (depreciation) appreciation at 12/31/2020 (000) | ||||||||||||||||||
90 Day Euro Dollar Futures | Short | 123 | March 2021 | $ | (30,750 | ) | $ | (30,698 | ) | $ | (15 | ) | ||||||||||||
5 Year U.S. Treasury Note Futures | Long | 7 | April 2021 | 700 | 883 | 1 | ||||||||||||||||||
10 Year U.S. Treasury Note Futures | Long | 23 | March 2021 | 2,300 | 3,176 | 5 | ||||||||||||||||||
10 Year Ultra U.S. Treasury Note Futures | Short | 122 | March 2021 | (12,200 | ) | (19,076 | ) | 44 | ||||||||||||||||
20 Year U.S. Treasury Bond Futures | Long | 4 | March 2021 | 400 | 693 | (6 | ) | |||||||||||||||||
30 Year Ultra U.S. Treasury Bond Futures | Short | 3 | March 2021 | (300 | ) | (640 | ) | 4 | ||||||||||||||||
|
| |||||||||||||||||||||||
| $ | 33 | |||||||||||||||||||||||
|
| |||||||||||||||||||||||
| 222 | American Funds Insurance Series |
Table of Contents
American Funds Mortgage Fund (formerly Mortgage Fund) (continued)
| Swap contracts | ||||||||||||||||||||||
| Interest rate swaps | ||||||||||||||||||||||
Receive | Pay | Expiration date | Notional (000) | Value at 12/31/2020 (000) | Upfront premium paid (000) | Unrealized (depreciation) appreciation at 12/31/2020 (000) | ||||||||||||||||
3-month USD-LIBOR | 0.243% | 5/2/2024 | $ | 33,400 | $ | 18 | $ | 22 | $ | (4 | ) | |||||||||||
U.S. EFFR | 0.11% | 5/18/2024 | 9,400 | 11 | — | 11 | ||||||||||||||||
U.S. EFFR | 0.1275% | 6/25/2025 | 4,400 | 17 | — | 17 | ||||||||||||||||
U.S. EFFR | 0.105% | 6/30/2025 | 4,300 | 22 | — | 22 | ||||||||||||||||
U.S. EFFR | 0.0975% | 6/30/2025 | 2,387 | 13 | — | 13 | ||||||||||||||||
U.S. EFFR | 0.106% | 6/30/2025 | 1,913 | 9 | — | 9 | ||||||||||||||||
3-month USD-LIBOR | 0.32% | 9/23/2025 | 3,600 | 13 | — | 13 | ||||||||||||||||
3-month USD-LIBOR | 0.81% | 7/28/2045 | 5,700 | 696 | 16 | 680 | ||||||||||||||||
3-month USD-LIBOR | 0.811% | 7/27/2050 | 3,000 | 453 | — | 453 | ||||||||||||||||
|
|
|
| |||||||||||||||||||
| $ | 38 | $ | 1,214 | |||||||||||||||||||
|
|
|
| |||||||||||||||||||
The following footnotes apply to either the individual securities noted or one or more of the securities aggregated and listed as a single line item.
| 1 | Principal payments may be made periodically. Therefore, the effective maturity date may be earlier than the stated maturity date. |
| 2 | Amount less than one thousand. |
| 3 | All or a portion of this security was pledged as collateral. The total value of pledged collateral was $2,200,000, which represented .69% of the net assets of the fund. |
| 4 | Coupon rate may change periodically. Reference rate and spread are as of the most recent information available. Some coupon rates are determined by the issuer or agent based on current market conditions; therefore, the reference rate and spread are not available. |
| 5 | Purchased on a TBA basis. |
| 6 | Acquired in a transaction exempt from registration under Rule 144A or Section 4(2) of the Securities Act of 1933. May be resold in the U.S. in transactions exempt from registration, normally to qualified institutional buyers. The total value of all such securities was $73,621,000, which represented 23.03% of the net assets of the fund. |
| 7 | Valued under fair value procedures adopted by authority of the board of trustees. The total value of the security was $2,250,000, which represented .70% of the net assets of the fund. |
| 8 | Index-linked bond whose principal amount moves with a government price index. |
| 9 | Notional amount is calculated based on the number of contracts and notional contract size. |
| 10 | Value is calculated based on the notional amount and current market price. |
Key to abbreviations and symbol
CLO = Collateralized Loan Obligations
EFFR = Effective Federal Funds Rate
LIBOR = London Interbank Offered Rate
TBA = To-be-announced
USD/$ = U.S. dollars
See notes to financial statements.
| American Funds Insurance Series | 223 |
Table of Contents
Investment portfolio December 31, 2020
Short-term securities 99.10%
| Principal amount (000) | Value (000) | |||||||
Commercial paper 71.47% | ||||||||
Alberta (Province of) 0.16% due 1/15/20211 | $ | 3,000 | $ | 3,000 | ||||
Alberta (Province of) 0.16% due 2/8/20211 | 6,700 | 6,699 | ||||||
Apple Inc. 0.12% due 1/8/20211 | 10,000 | 10,000 | ||||||
Army and Air Force Exchange Service 0.10% due 1/8/20211 | 10,000 | 9,999 | ||||||
Bank of Nova Scotia 0.20% due 1/26/20211 | 8,000 | 7,999 | ||||||
British Columbia (Province of) 0.10% due 1/7/2021 | 8,600 | 8,600 | ||||||
Caisse d’Amortissement de la Dette Sociale 0.17% due 1/20/2021 | 10,000 | 9,999 | ||||||
Canadian Imperial Bank of Commerce 0.17% due 1/13/20211 | 8,300 | 8,300 | ||||||
Chariot Funding, LLC 0.16% due 1/6/20211 | 10,000 | 10,000 | ||||||
CHARTA, LLC 0.16% due 1/6/20211 | 10,000 | 10,000 | ||||||
DBS Bank Ltd. 0.19% due 1/4/20211 | 10,000 | 10,000 | ||||||
Denmark (Kingdom of) 0.13% due 1/25/2021 | 10,000 | 9,999 | ||||||
Emerson Electric Co. 0.11% due 2/2/20211 | 7,000 | 6,999 | ||||||
Equinor ASA 0.17% due 2/23/20211 | 7,500 | 7,498 | ||||||
European Investment Bank 0.14% due 1/21/2021 | 9,500 | 9,499 | ||||||
ExxonMobil Corp. 0.09% due 1/22/2021 | 4,100 | 4,100 | ||||||
Fairway Finance Company, LLC 0.15% due 1/21/20211 | 3,700 | 3,700 | ||||||
FMS Wertmanagement 0.21% due 3/10/20211 | 8,000 | 7,997 | ||||||
L’Oréal USA, Inc. 0.08% due 1/19/20211 | 2,800 | 2,800 | ||||||
LVMH Moët Hennessy Louis Vuitton Inc. 0.21% due 3/22/20211 | 9,500 | 9,496 | ||||||
Merck & Co. Inc. 0.09% due 2/9/20211 | 10,000 | 9,999 | ||||||
National Rural Utilities Cooperative Finance Corp. 0.11% due 1/7/2021 | 9,000 | 9,000 | ||||||
NRW.Bank 0.15% due 1/6/20211 | 5,000 | 5,000 | ||||||
OMERS Finance Trust 0.13% due 1/5/2021 | 9,000 | 9,000 | ||||||
Paccar Financial Corp. 0.10% due 1/13/2021 | 3,500 | 3,500 | ||||||
Paccar Financial Corp. 0.11% due 1/14/2021 | 2,500 | 2,500 | ||||||
Shell International Finance BV 0.20% due 5/25/20211 | 7,000 | 6,994 | ||||||
Siemens Capital Co. LLC 0.11% due 1/5/20211 | 4,000 | 4,000 | ||||||
Sumitomo Mitsui Banking Corp. 0.21% due 2/23/20211 | 7,500 | 7,498 | ||||||
Thunder Bay Funding, LLC 0.17% due 1/25/20211 | 10,000 | 9,999 | ||||||
Toronto-Dominion Bank 0.21% due 1/28/20211 | 10,000 | 9,999 | ||||||
Total Capital Canada Ltd. 0.19% due 2/17/20211 | 5,700 | 5,699 | ||||||
Total Capital Canada Ltd. 0.19% due 2/23/20211 | 4,000 | 3,999 | ||||||
Toyota Industries Commercial Finance, Inc. 0.16% due 1/15/20211 | 9,698 | 9,698 | ||||||
Unilever Capital Corp. 0.12% due 1/26/20211 | 5,000 | 5,000 | ||||||
Victory Receivables Corp. 0.19% due 2/22/20211 | 10,000 | 9,997 | ||||||
|
| |||||||
| 268,566 | ||||||||
|
| |||||||
Federal agency bills & notes 16.21% | ||||||||
Federal Farm Credit Banks 0.07% due 1/20/2021 | 5,000 | 5,000 | ||||||
Federal Farm Credit Banks 0.08% due 5/14/2021 | 5,000 | 4,998 | ||||||
Federal Home Loan Bank 0.09% due 1/6/2021 | 6,700 | 6,700 | ||||||
Federal Home Loan Bank 0.07% due 1/22/2021 | 8,000 | 8,000 | ||||||
Federal Home Loan Bank 0.10% due 1/27/2021 | 10,000 | 9,999 | ||||||
Federal Home Loan Bank 0.08% due 2/5/2021 | 5,000 | 5,000 | ||||||
Federal Home Loan Bank 0.08% due 2/8/2021 | 9,700 | 9,699 | ||||||
Federal Home Loan Bank 0.08% due 2/10/2021 | 11,500 | 11,499 | ||||||
|
| |||||||
| 60,895 | ||||||||
|
| |||||||
| 224 | American Funds Insurance Series |
Table of Contents
Ultra-Short Bond Fund (continued)
Short-term securities (continued)
| Principal amount | Value | |||||||
| (000) | (000) | |||||||
U.S. Treasury bills 11.42% | ||||||||
U.S. Treasury 0.09% due 1/5/2021 | $ | 6,600 | $ | 6,600 | ||||
U.S. Treasury 0.09% due 2/4/2021 | 11,600 | 11,599 | ||||||
U.S. Treasury 0.09% due 2/16/2021 | 8,000 | 8,000 | ||||||
U.S. Treasury 0.09% due 3/4/2021 | 2,800 | 2,799 | ||||||
U.S. Treasury 0.09% due 3/9/2021 | 3,800 | 3,800 | ||||||
U.S. Treasury 0.10% due 4/13/2021 | 10,100 | 10,098 | ||||||
|
| |||||||
| 42,896 | ||||||||
|
| |||||||
Total short-term securities (cost: $372,351,000) | 372,357 | |||||||
|
| |||||||
Total investment securities 99.10% (cost: $372,351,000) | 372,357 | |||||||
Other assets less liabilities 0.90% | 3,392 | |||||||
|
| |||||||
Net assets 100.00% | $ | 375,749 | ||||||
|
| |||||||
| 1 | Acquired in a transaction exempt from registration under Rule 144A or Section 4(2) of the Securities Act of 1933. May be resold in the U.S. in transactions exempt from registration, normally to qualified institutional buyers. The total value of all such securities was $202,368,000, which represented 53.86% of the net assets of the fund. |
See notes to financial statements.
| American Funds Insurance Series | 225 |
Table of Contents
U.S. Government/AAA-Rated Securities Fund
Investment portfolio December 31, 2020
Bonds, notes & other debt instruments 81.82%
| Principal amount | Value | |||||||
| (000) | (000) | |||||||
Mortgage-backed obligations 35.15% | ||||||||
Federal agency mortgage-backed obligations 35.10% | ||||||||
Fannie Mae Pool #257104 6.50% 20281 | $ | 97 | $ | 108 | ||||
Fannie Mae Pool #695412 5.00% 20331 | 1 | 1 | ||||||
Fannie Mae Pool #AD3566 5.00% 20351 | 8 | 9 | ||||||
Fannie Mae Pool #MA4228 1.50% 20361 | 24,617 | 25,343 | ||||||
Fannie Mae Pool #MA4229 2.00% 20361 | 1,731 | 1,811 | ||||||
Fannie Mae Pool #MA2746 4.00% 20361 | 2,283 | 2,487 | ||||||
Fannie Mae Pool #MA2588 4.00% 20361 | 1,234 | 1,344 | ||||||
Fannie Mae Pool #256860 6.50% 20371 | 20 | 23 | ||||||
Fannie Mae Pool #888698 7.00% 20371 | 44 | 51 | ||||||
Fannie Mae Pool #256828 7.00% 20371 | 4 | 5 | ||||||
Fannie Mae Pool #970343 6.00% 20381 | 15 | 16 | ||||||
Fannie Mae Pool #AC0794 5.00% 20391 | 38 | 44 | ||||||
Fannie Mae Pool #931768 5.00% 20391 | 6 | 8 | ||||||
Fannie Mae Pool #932606 5.00% 20401 | 20 | 23 | ||||||
Fannie Mae Pool #AJ1873 4.00% 20411 | 29 | 33 | ||||||
Fannie Mae Pool #AI1862 5.00% 20411 | 613 | 713 | ||||||
Fannie Mae Pool #AI3510 5.00% 20411 | 361 | 419 | ||||||
Fannie Mae Pool #AJ0704 5.00% 20411 | 327 | 380 | ||||||
Fannie Mae Pool #AJ5391 5.00% 20411 | 187 | 216 | ||||||
Fannie Mae Pool #AE1248 5.00% 20411 | 45 | 52 | ||||||
Fannie Mae Pool #AE1274 5.00% 20411 | 36 | 42 | ||||||
Fannie Mae Pool #AE1277 5.00% 20411 | 21 | 24 | ||||||
Fannie Mae Pool #AE1283 5.00% 20411 | 13 | 14 | ||||||
Fannie Mae Pool #AP7553 3.00% 20421 | 3,453 | 3,695 | ||||||
Fannie Mae Pool #AE1290 5.00% 20421 | 25 | 29 | ||||||
Fannie Mae Pool #AL3829 3.50% 20431 | 257 | 281 | ||||||
Fannie Mae Pool #AT7161 3.50% 20431 | 114 | 124 | ||||||
Fannie Mae Pool #AR1512 3.50% 20431 | 55 | 60 | ||||||
Fannie Mae Pool #AT0412 3.50% 20431 | 28 | 30 | ||||||
Fannie Mae Pool #AT3954 3.50% 20431 | 15 | 16 | ||||||
Fannie Mae Pool #AT0300 3.50% 20431 | 12 | 12 | ||||||
Fannie Mae Pool #BM6240 2.754% 20441,2 | 810 | 846 | ||||||
Fannie Mae Pool #AY1829 3.50% 20441 | 20 | 22 | ||||||
Fannie Mae Pool #AW8240 3.50% 20441 | 4 | 4 | ||||||
Fannie Mae Pool #BE5017 3.50% 20451 | 142 | 155 | ||||||
Fannie Mae Pool #BE5009 3.50% 20451 | 115 | 124 | ||||||
Fannie Mae Pool #MA3120 3.50% 20471 | 5,723 | 6,075 | ||||||
Fannie Mae Pool #BE8740 3.50% 20471 | 132 | 144 | ||||||
Fannie Mae Pool #BE8742 3.50% 20471 | 39 | 43 | ||||||
Fannie Mae Pool #BH2848 3.50% 20471 | 20 | 22 | ||||||
Fannie Mae Pool #BH2846 3.50% 20471 | 16 | 17 | ||||||
Fannie Mae Pool #BH2847 3.50% 20471 | 13 | 14 | ||||||
Fannie Mae Pool #BJ5015 4.00% 20471 | 315 | 347 | ||||||
Fannie Mae Pool #BH2597 4.00% 20471 | 10 | 11 | ||||||
Fannie Mae Pool #BH3122 4.00% 20471 | 10 | 11 | ||||||
Fannie Mae Pool #BM3788 3.50% 20481 | 8,392 | 9,169 | ||||||
Fannie Mae Pool #FM3164 3.50% 20481 | 4,066 | 4,291 | ||||||
Fannie Mae Pool #BJ4901 3.50% 20481 | 91 | 99 | ||||||
Fannie Mae Pool #CA2850 4.00% 20481 | 363 | 406 | ||||||
Fannie Mae Pool #BK6840 4.00% 20481 | 202 | 222 | ||||||
Fannie Mae Pool #BK5232 4.00% 20481 | 162 | 178 | ||||||
Fannie Mae Pool #BK9743 4.00% 20481 | 56 | 61 | ||||||
Fannie Mae Pool #MA3416 4.50% 20481 | 4,016 | 4,361 | ||||||
Fannie Mae Pool #BK7665 4.50% 20481 | 1,345 | 1,493 | ||||||
Fannie Mae Pool #BK0951 4.50% 20481 | 1,027 | 1,150 | ||||||
Fannie Mae Pool #BK9761 4.50% 20481 | 54 | 60 | ||||||
Fannie Mae Pool #CA1909 4.50% 20481 | 49 | 53 | ||||||
Fannie Mae Pool #CA4151 3.50% 20491 | 1,271 | 1,401 | ||||||
Fannie Mae Pool #FM1062 3.50% 20491 | 774 | 853 | ||||||
Fannie Mae Pool #FM1443 3.50% 20491 | 646 | 709 | ||||||
Fannie Mae Pool #BJ8411 3.50% 20491 | 267 | 293 | ||||||
| 226 | American Funds Insurance Series |
Table of Contents
U.S. Government/AAA-Rated Securities Fund (continued)
Bonds, notes & other debt instruments (continued)
| Principal amount (000) | Value (000) | |||||||
Mortgage-backed obligations (continued) | ||||||||
Federal agency mortgage-backed obligations (continued) | ||||||||
Fannie Mae Pool #CA5229 3.00% 20501 | $ | 27,582 | $ | 29,859 | ||||
Fannie Mae Pool #FM2179 3.00% 20501 | 10,829 | 11,643 | ||||||
Fannie Mae Pool #FM3834 4.50% 20501 | 2,462 | 2,660 | ||||||
Fannie Mae Pool #MA4256 2.50% 20511 | 11 | 12 | ||||||
Fannie Mae, Series 2001-4, Class NA, 9.011% 20251,2 | — | 3 | — | 3 | ||||
Fannie Mae, Series 2001-4, Class GA, 9.081% 20251,2 | — | 3 | — | 3 | ||||
Fannie Mae, Series 2012-M2, Class A2, Multi Family, 2.717% 20221 | 444 | 452 | ||||||
Fannie Mae, Series 2012-M3, Class 1A2, Multi Family, 3.044% 20221 | 460 | 470 | ||||||
Fannie Mae, Series 2014-M1, Class A2, Multi Family, 3.128% 20231,2 | 625 | 660 | ||||||
Fannie Mae, Series 2014-M3, Class A2, Multi Family, 3.501% 20241,2 | 1,292 | 1,397 | ||||||
Freddie Mac Pool #SB8083 1.50% 20361 | 2,805 | 2,887 | ||||||
Freddie Mac Pool #SB8084 2.00% 20361 | 996 | 1,042 | ||||||
Freddie Mac Pool #1H1354 2.442% 20361,2 | 137 | 145 | ||||||
Freddie Mac Pool #C03518 5.00% 20401 | 590 | 686 | ||||||
Freddie Mac Pool #G06459 5.00% 20411 | 1,175 | 1,367 | ||||||
Freddie Mac Pool #Q18236 3.50% 20431 | 115 | 125 | ||||||
Freddie Mac Pool #Q19133 3.50% 20431 | 73 | 79 | ||||||
Freddie Mac Pool #Q17696 3.50% 20431 | 64 | 70 | ||||||
Freddie Mac Pool #841039 3.54% 20431,2 | 832 | 861 | ||||||
Freddie Mac Pool #Q23190 4.00% 20431 | 277 | 308 | ||||||
Freddie Mac Pool #Q15874 4.00% 20431 | 7 | 7 | ||||||
Freddie Mac Pool #Q28558 3.50% 20441 | 345 | 378 | ||||||
Freddie Mac Pool #760014 3.116% 20451,2 | 630 | 658 | ||||||
Freddie Mac Pool #Q52069 3.50% 20471 | 192 | 209 | ||||||
Freddie Mac Pool #Q47615 3.50% 20471 | 90 | 99 | ||||||
Freddie Mac Pool #ZM4352 3.50% 20471 | 17 | 18 | ||||||
Freddie Mac Pool #Q55056 3.50% 20481 | 239 | 259 | ||||||
Freddie Mac Pool #Q54709 3.50% 20481 | 144 | 156 | ||||||
Freddie Mac Pool #Q54701 3.50% 20481 | 135 | 147 | ||||||
Freddie Mac Pool #Q54782 3.50% 20481 | 118 | 129 | ||||||
Freddie Mac Pool #Q54781 3.50% 20481 | 110 | 120 | ||||||
Freddie Mac Pool #Q54700 3.50% 20481 | 105 | 115 | ||||||
Freddie Mac Pool #Q55060 3.50% 20481 | 74 | 80 | ||||||
Freddie Mac Pool #Q56591 3.50% 20481 | 70 | 75 | ||||||
Freddie Mac Pool #Q56590 3.50% 20481 | 67 | 73 | ||||||
Freddie Mac Pool #Q56589 3.50% 20481 | 64 | 70 | ||||||
Freddie Mac Pool #Q54698 3.50% 20481 | 55 | 61 | ||||||
Freddie Mac Pool #Q54699 3.50% 20481 | 51 | 56 | ||||||
Freddie Mac Pool #Q54831 3.50% 20481 | 38 | 42 | ||||||
Freddie Mac Pool #G67711 4.00% 20481 | 2,642 | 2,914 | ||||||
Freddie Mac Pool #Q56599 4.00% 20481 | 228 | 250 | ||||||
Freddie Mac Pool #Q56175 4.00% 20481 | 171 | 188 | ||||||
Freddie Mac Pool #Q55971 4.00% 20481 | 152 | 168 | ||||||
Freddie Mac Pool #Q56576 4.00% 20481 | 118 | 126 | ||||||
Freddie Mac Pool #Q55970 4.00% 20481 | 75 | 83 | ||||||
Freddie Mac Pool #Q58411 4.50% 20481 | 464 | 516 | ||||||
Freddie Mac Pool #Q58436 4.50% 20481 | 209 | 234 | ||||||
Freddie Mac Pool #Q58378 4.50% 20481 | 174 | 191 | ||||||
Freddie Mac Pool #Q57242 4.50% 20481 | 122 | 134 | ||||||
Freddie Mac Pool #ZT0522 4.50% 20481 | 61 | 66 | ||||||
Freddie Mac Pool #ZS4774 4.50% 20481 | 56 | 61 | ||||||
Freddie Mac Pool #RA1463 3.50% 20491 | 864 | 953 | ||||||
Freddie Mac Pool #QA0284 3.50% 20491 | 372 | 408 | ||||||
Freddie Mac Pool #RA1580 3.50% 20491 | 299 | 332 | ||||||
Freddie Mac Pool #QA2748 3.50% 20491 | 115 | 127 | ||||||
Freddie Mac Pool #RA2236 4.50% 20491 | 733 | 796 | ||||||
Freddie Mac Pool #QA4453 4.50% 20491 | 47 | 51 | ||||||
Freddie Mac Pool #QA8801 3.00% 20501 | 16,922 | 18,221 | ||||||
Freddie Mac, Series 1567, Class A, (1-month USD-LIBOR + 0.40%) 0.559% 20231,2 | 6 | 6 | ||||||
Freddie Mac, Series K031, Class A1, Multi Family, 2.778% 20221 | 202 | 206 | ||||||
Freddie Mac, Series KS01, Class A2, Multi Family, 2.522% 20231 | 788 | 811 | ||||||
| American Funds Insurance Series | 227 |
Table of Contents
U.S. Government/AAA-Rated Securities Fund (continued)
Bonds, notes & other debt instruments (continued)
| Principal amount (000) | Value (000) | |||||||
Mortgage-backed obligations (continued) | ||||||||
Federal agency mortgage-backed obligations (continued) | ||||||||
Freddie Mac, Series K029, Class A2, Multi Family, 3.32% 20231 | $ | 200 | $ | 212 | ||||
Freddie Mac, Series K035, Class A2, Multi Family, 3.458% 20231,2 | 2,565 | 2,757 | ||||||
Freddie Mac, Series K034, Class A2, Multi Family, 3.531% 20231 | 2,745 | 2,955 | ||||||
Freddie Mac, Series K040, Class A2, Multi Family, 3.241% 20241 | 2,000 | 2,197 | ||||||
Freddie Mac, Series K038, Class A2, Multi Family, 3.389% 20241 | 6,895 | 7,513 | ||||||
Freddie Mac, Series K063, Class A2, Multi Family, 3.43% 20271 | 1,080 | 1,243 | ||||||
Freddie Mac, Series K095, Class A1, Multi Family, 2.631% 20281 | 518 | 566 | ||||||
Freddie Mac, Series K081, Class A2, Multi Family, 3.90% 20281,2 | 4,200 | 5,055 | ||||||
Freddie Mac, Series K082, Class A2, Multi Family, 3.92% 20281,2 | 3,300 | 3,985 | ||||||
Freddie Mac, Series K083, Class A2, Multi Family, 4.05% 20281,2 | 3,500 | 4,261 | ||||||
Freddie Mac Seasoned Credit Risk Transfer Trust, Series 2017-2, Class MA, 3.00% 20561 | 8,362 | 8,970 | ||||||
Freddie Mac Seasoned Credit Risk Transfer Trust, Series 2017-1, Class HA, 3.00% 20561,2 | 7,932 | 8,337 | ||||||
Freddie Mac Seasoned Credit Risk Transfer Trust, Series 2017-2, Class HA, 3.00% 20561,2 | 7,589 | 7,975 | ||||||
Freddie Mac Seasoned Credit Risk Transfer Trust, Series 2017-3, Class MT, 3.00% 20561 | 2,298 | 2,466 | ||||||
Freddie Mac Seasoned Credit Risk Transfer Trust, Series 2017-3, Class HT, 3.25% 20561 | 447 | 491 | ||||||
Freddie Mac Seasoned Credit Risk Transfer Trust, Series 2018-1, Class HT, 3.00% 20571 | 2,367 | 2,567 | ||||||
Freddie Mac Seasoned Credit Risk Transfer Trust, Series 2017-4, Class HT, 3.25% 20571,2 | 4,382 | 4,778 | ||||||
Freddie Mac Seasoned Credit Risk Transfer Trust, Series 2018-2, Class MT, 3.50% 20571 | 7,399 | 8,080 | ||||||
Freddie Mac Seasoned Credit Risk Transfer Trust, Series 2018-3, Class MA, 3.50% 20571 | 5,672 | 6,145 | ||||||
Freddie Mac Seasoned Credit Risk Transfer Trust, Series 2017-4, Class MT, 3.50% 20571 | 2,723 | 2,973 | ||||||
Freddie Mac Seasoned Credit Risk Transfer Trust, Series 2018-2, Class MA, 3.50% 20571 | 1,183 | 1,279 | ||||||
Freddie Mac Seasoned Credit Risk Transfer Trust, Series 2019-2, Class MA, 3.50% 20581 | 4,700 | 5,122 | ||||||
Freddie Mac Seasoned Credit Risk Transfer Trust, Series 2019-1, Class MT, 3.50% 20581 | 2,695 | 2,943 | ||||||
Freddie Mac Seasoned Credit Risk Transfer Trust, Series 2019-1, Class MA, 3.50% 20581 | 1,400 | 1,522 | ||||||
Freddie Mac Seasoned Credit Risk Transfer Trust, Series 2019-2, Class MT, 3.50% 20581 | 1,005 | 1,097 | ||||||
Freddie Mac Seasoned Credit Risk Transfer Trust, Series 2019-3, Class MT, 3.50% 20581 | 589 | 648 | ||||||
Freddie Mac Seasoned Credit Risk Transfer Trust, Series 2019-4, Class MA, 3.00% 20591 | 5,350 | 5,708 | ||||||
Freddie Mac Seasoned Loan Structured Transaction Trust, Series 2018-2, Class A1, 3.50% 20281 | 33,151 | 35,072 | ||||||
Freddie Mac Seasoned Loan Structured Transaction Trust, Series 2018-1, Class A1, 3.50% 20281 | 7,871 | 8,284 | ||||||
Freddie Mac Seasoned Loan Structured Transaction Trust, Series 2019-3, Class A1C, 2.75% 20291 | 9,710 | 10,277 | ||||||
Freddie Mac Seasoned Loan Structured Transaction Trust, Series 2020-1, Class A1D, 2.00% 20301 | 3,111 | 3,210 | ||||||
Freddie Mac Seasoned Loan Structured Transaction Trust, Series 2020-1, Class A2D, 2.00% 20301 | 535 | 555 | ||||||
Government National Mortgage Assn. 5.50% 20381 | 162 | 185 | ||||||
Government National Mortgage Assn. 5.50% 20381 | 46 | 51 | ||||||
Government National Mortgage Assn. 2.00% 20511,4 | 11,627 | 12,139 | ||||||
Government National Mortgage Assn. 2.00% 20511,4 | 9,780 | 10,194 | ||||||
Government National Mortgage Assn. 2.50% 20511,4 | 460 | 485 | ||||||
Government National Mortgage Assn. 3.00% 20511,4 | 800 | 837 | ||||||
Government National Mortgage Assn. 3.50% 20511,4 | 22,750 | 24,105 | ||||||
Government National Mortgage Assn. 3.50% 20511,4 | 22,662 | 23,998 | ||||||
Government National Mortgage Assn. Pool #699537 5.50% 20381 | 94 | 105 | ||||||
Government National Mortgage Assn. Pool #700778 5.50% 20381 | 25 | 29 | ||||||
Government National Mortgage Assn. Pool #782365 6.00% 20381 | 149 | 179 | ||||||
Government National Mortgage Assn. Pool #004269 6.50% 20381 | 260 | 305 | ||||||
Government National Mortgage Assn. Pool #698406 5.00% 20391 | 317 | 359 | ||||||
Government National Mortgage Assn. Pool #783690 6.00% 20391 | 134 | 155 | ||||||
Government National Mortgage Assn. Pool #783689 5.50% 20401 | 3,959 | 4,560 | ||||||
Government National Mortgage Assn. Pool #783687 4.50% 20411 | 880 | 952 | ||||||
Government National Mortgage Assn. Pool #783688 5.00% 20411 | 1,546 | 1,743 | ||||||
Government National Mortgage Assn. Pool #MA0533 3.00% 20421 | 32 | 35 | ||||||
Government National Mortgage Assn. Pool #MA1012 3.50% 20431 | 1,119 | 1,223 | ||||||
Government National Mortgage Assn. Pool #MA5764 4.50% 20491 | 10,111 | 10,944 | ||||||
Government National Mortgage Assn. Pool #MA5877 4.50% 20491 | 4,528 | 4,898 | ||||||
Government National Mortgage Assn. Pool #MA6092 4.50% 20491 | 769 | 829 | ||||||
Government National Mortgage Assn. Pool #MA7052 2.50% 20501 | 6,040 | 6,400 | ||||||
Uniform Mortgage-Backed Security 1.50% 20361,4 | 119,476 | 122,702 | ||||||
| 228 | American Funds Insurance Series |
Table of Contents
U.S. Government/AAA-Rated Securities Fund (continued)
Bonds, notes & other debt instruments (continued)
| Principal amount (000) | Value (000) | |||||||
Mortgage-backed obligations (continued) | ||||||||
Federal agency mortgage-backed obligations (continued) | ||||||||
Uniform Mortgage-Backed Security 1.50% 20361,4 | $ | 89,298 | $ | 91,755 | ||||
Uniform Mortgage-Backed Security 2.00% 20361,4 | 70,158 | 73,272 | ||||||
Uniform Mortgage-Backed Security 2.00% 20511,4 | 16,809 | 17,401 | ||||||
Uniform Mortgage-Backed Security 2.00% 20511,4 | 9,414 | 9,761 | ||||||
Uniform Mortgage-Backed Security 2.50% 20511,4 | 451 | 474 | ||||||
Uniform Mortgage-Backed Security 2.50% 20511,4 | 339 | 357 | ||||||
Uniform Mortgage-Backed Security 3.00% 20511,4 | 2 | 2 | ||||||
Uniform Mortgage-Backed Security 3.50% 20511,4 | 20,663 | 21,871 | ||||||
|
| |||||||
| 755,912 | ||||||||
|
| |||||||
Collateralized mortgage-backed obligations 0.05% | ||||||||
Vendee Mortgage Trust, Series 2010-1, Class DA, 4.25% 20351 | 1,050 | 1,063 | ||||||
|
| |||||||
Total mortgage-backed obligations | 756,975 | |||||||
|
| |||||||
U.S. Treasury bonds & notes 30.83% | ||||||||
U.S. Treasury 24.25% | ||||||||
U.S. Treasury 1.375% 2022 | 3,100 | 3,142 | ||||||
U.S. Treasury 1.75% 2022 | 32,093 | 32,831 | ||||||
U.S. Treasury 2.125% 2023 | — | 3 | — | 3 | ||||
U.S. Treasury 2.875% 2023 | 5,000 | 5,394 | ||||||
U.S. Treasury 0.25% 2025 | 65,000 | 64,801 | ||||||
U.S. Treasury 0.25% 2025 | 4,000 | 3,984 | ||||||
U.S. Treasury 0.375% 2025 | 10,000 | 10,013 | ||||||
U.S. Treasury 1.625% 2026 | 10,000 | 10,665 | ||||||
U.S. Treasury 0.50% 2027 | 5,314 | 5,280 | ||||||
U.S. Treasury 0.625% 2030 | 1,175 | 1,145 | ||||||
U.S. Treasury 1.125% 2040 | 10,750 | 10,176 | ||||||
U.S. Treasury 1.125% 2040 | 7,000 | 6,644 | ||||||
U.S. Treasury 2.50% 2046 | 5,400 | 6,453 | ||||||
U.S. Treasury 2.50% 2046 | 3,900 | 4,659 | ||||||
U.S. Treasury 2.875% 2046 | 2,700 | 3,450 | ||||||
U.S. Treasury 2.25% 20495 | 25,700 | 29,416 | ||||||
U.S. Treasury 2.375% 2049 | 13,000 | 15,271 | ||||||
U.S. Treasury 2.875% 20495 | 26,000 | 33,565 | ||||||
U.S. Treasury 3.00% 20495 | 22,500 | 29,670 | ||||||
U.S. Treasury 1.25% 20505 | 46,500 | 42,173 | ||||||
U.S. Treasury 1.375% 20505 | 100,000 | 93,575 | ||||||
U.S. Treasury 1.625% 20505 | 110,500 | 109,973 | ||||||
|
| |||||||
| 522,280 | ||||||||
|
| |||||||
U.S. Treasury inflation-protected securities 6.58% | ||||||||
U.S. Treasury Inflation-Protected Security 0.125% 20216 | 65,918 | 66,164 | ||||||
U.S. Treasury Inflation-Protected Security 0.125% 20226 | 6,097 | 6,209 | ||||||
U.S. Treasury Inflation-Protected Security 0.125% 20306 | 27,420 | 30,761 | ||||||
U.S. Treasury Inflation-Protected Security 0.125% 20306 | 6,222 | 6,940 | ||||||
U.S. Treasury Inflation-Protected Security 2.125% 20416 | 369 | 579 | ||||||
U.S. Treasury Inflation-Protected Security 0.75% 20425,6 | 15,199 | 19,375 | ||||||
U.S. Treasury Inflation-Protected Security 1.00% 20496 | 8,278 | 11,674 | ||||||
|
| |||||||
| 141,702 | ||||||||
|
| |||||||
Total U.S. Treasury bonds & notes | 663,982 | |||||||
|
| |||||||
Federal agency bonds & notes 15.84% | ||||||||
Export-Import Bank of the United States-Guaranteed, Ethiopian Leasing 2012 LLC 2.646% 2026 | 483 | 508 | ||||||
Fannie Mae 1.25% 2021 | 2,900 | 2,921 | ||||||
Fannie Mae 2.875% 2023 | 36,000 | 38,605 | ||||||
Fannie Mae 0.625% 2025 | 10,000 | 10,116 | ||||||
| American Funds Insurance Series | 229 |
Table of Contents
U.S. Government/AAA-Rated Securities Fund (continued)
Bonds, notes & other debt instruments (continued)
| Principal amount (000) | Value (000) | |||||||
Federal agency bonds & notes (continued) | ||||||||
Fannie Mae 0.75% 2027 | $ | 2,900 | $ | 2,916 | ||||
Fannie Mae 0.875% 2030 | 8,600 | 8,438 | ||||||
Fannie Mae 7.125% 2030 | 2,000 | 3,059 | ||||||
Federal Farm Credit Banks 0.375% 2022 | 1,500 | 1,505 | ||||||
Federal Home Loan Bank 3.375% 2023 | 16,715 | 18,125 | ||||||
Federal Home Loan Bank 3.25% 2028 | 6,500 | 7,745 | ||||||
Federal Home Loan Bank 5.50% 2036 | 300 | 464 | ||||||
Freddie Mac 2.375% 2021 | 40,000 | 40,108 | ||||||
Private Export Funding Corp. 3.266% 20217 | 34,000 | 34,886 | ||||||
Private Export Funding Corp. 3.55% 2024 | 3,190 | 3,500 | ||||||
Small Business Administration, Series 2001-20F, 6.44% 2021 | 7 | 7 | ||||||
Tennessee Valley Authority, Series A, 3.875% 2021 | 32,975 | 33,117 | ||||||
Tennessee Valley Authority 0.75% 2025 | 1,800 | 1,828 | ||||||
Tennessee Valley Authority 2.875% 2027 | 5,000 | 5,639 | ||||||
Tennessee Valley Authority 4.65% 2035 | 1,780 | 2,472 | ||||||
Tennessee Valley Authority 5.88% 2036 | 875 | 1,340 | ||||||
Tennessee Valley Authority, Series A, 4.625% 2060 | 250 | 391 | ||||||
TVA Southaven 3.846% 2033 | 1,112 | 1,214 | ||||||
U.S. Agency for International Development, Iraq (State of) 2.149% 2022 | 3,370 | 3,439 | ||||||
U.S. Agency for International Development, Jordan (Kingdom of) 2.578% 2022 | 41,500 | 42,998 | ||||||
U.S. Agency for International Development, Jordan (Kingdom of) 3.00% 2025 | 14,779 | 16,354 | ||||||
U.S. Agency for International Development, Morocco (Kingdom of) 7.55% 2026 | 2,669 | 3,168 | ||||||
U.S. Agency for International Development, Tunisia (Kingdom of) 1.416% 2021 | 1,500 | 1,513 | ||||||
U.S. Agency for International Development, Ukraine 1.471% 2021 | 2,210 | 2,234 | ||||||
U.S. Department of Housing and Urban Development, Series 2015-A-7, 2.35% 2021 | 3,750 | 3,799 | ||||||
U.S. Department of Housing and Urban Development, Series 2015-A-8, 2.45% 2022 | 6,000 | 6,212 | ||||||
U.S. Department of Housing and Urban Development, Series 2015-A-9, 2.80% 2023 | 1,500 | 1,599 | ||||||
U.S. Department of Housing and Urban Development, Series 2015-A-10, 2.85% 2024 | 2,250 | 2,455 | ||||||
U.S. Department of Housing and Urban Development, Series 2015-A-11, 2.95% 2025 | 2,640 | 2,892 | ||||||
U.S. Department of Housing and Urban Development, Series 2015-A-12, 3.10% 2026 | 2,625 | 2,889 | ||||||
U.S. Department of Housing and Urban Development, Series 2015-A-13, 3.15% 2027 | 11,482 | 12,649 | ||||||
U.S. Department of Housing and Urban Development, Series 2015-A-14, 3.25% 2028 | 3,856 | 4,259 | ||||||
U.S. Department of Housing and Urban Development, Series 2015-A-15, 3.35% 2029 | 2,650 | 2,934 | ||||||
U.S. Department of Housing and Urban Development, Series 2015-A-16, 3.50% 2030 | 2,482 | 2,729 | ||||||
U.S. Department of Housing and Urban Development, Series 2015-A-17, 3.55% 2031 | 2,475 | 2,726 | ||||||
U.S. Department of Housing and Urban Development, Series 2015-A-18, 3.60% 2032 | 2,377 | 2,621 | ||||||
U.S. Department of Housing and Urban Development, Series 2015-A-19, 3.65% 2033 | 2,059 | 2,275 | ||||||
U.S. Department of Housing and Urban Development, Series 2015-A-20, 3.70% 2034 | 651 | 720 | ||||||
U.S. Government-Guaranteed Certificates of Participation, Overseas Private Investment Corp. 3.82% 2032 | 833 | 994 | ||||||
U.S. Government-Guaranteed Certificates of Participation, Overseas Private Investment Corp. 3.938% 2032 | 681 | 792 | ||||||
|
| |||||||
| 341,155 | ||||||||
|
| |||||||
Total bonds, notes & other debt instruments (cost: $1,717,324,000) | 1,762,112 | |||||||
|
| |||||||
Short-term securities 33.97% | ||||||||
Commercial paper 25.22% | ||||||||
Amazon.com, Inc. 0.08% due 1/25/20217 | 15,000 | 14,999 | ||||||
Apple Inc. 0.10%-0.11% due 1/21/2021-1/29/20217 | 40,700 | 40,698 | ||||||
Army and Air Force Exchange Service 0.11% due 1/7/20217 | 11,700 | 11,699 | ||||||
Atlantic Asset Securitization LLC 0.16% due 1/11/20217 | 12,000 | 11,999 | ||||||
CAFCO, LLC 0.16% due 1/4/20217 | 25,000 | 25,000 | ||||||
Chariot Funding, LLC 0.16%-0.20% due 1/11/2021-2/12/20217 | 46,000 | 45,992 | ||||||
Chevron Corp. 0.08%-0.12% due 1/7/2021-2/26/20217 | 46,800 | 46,794 | ||||||
CRC Funding, LLC 0.16%-0.17% due 1/4/2021-1/22/20217 | 35,000 | 34,997 | ||||||
Emerson Electric Co. 0.12%-0.13% due 1/14/2021-1/26/20217 | 52,650 | 52,647 | ||||||
ExxonMobil Corp. 0.12%-0.15% due 1/5/2021-2/17/2021 | 45,000 | 44,996 | ||||||
| 230 | American Funds Insurance Series |
Table of Contents
U.S. Government/AAA-Rated Securities Fund (continued)
Short-term securities (continued)
| Principal amount (000) | Value (000) | |||||||
Commercial paper (continued) | ||||||||
Johnson & Johnson 0.11% due 6/1/20217 | $ | 26,000 | $ | 25,985 | ||||
Kaiser Foundation Hospitals 0.18% due 5/4/2021 | 17,000 | 16,983 | ||||||
Merck & Co. Inc. 0.09%-0.12% due 1/22/2021-2/19/20217 | 46,000 | 45,995 | ||||||
National Rural Utilities Cooperative Finance Corp. 0.12% due 2/4/2021 | 10,000 | 9,999 | ||||||
Paccar Financial Corp. 0.11%-0.12% due 1/19/2021-2/3/2021 | 33,500 | 33,498 | ||||||
PepsiCo Inc. 0.15% due 3/1/20217 | 3,000 | 2,999 | ||||||
Pfizer Inc. 0.10% due 1/7/20217 | 28,800 | 28,800 | ||||||
Regents of the University of California 0.17% due 2/18/2021 | 18,500 | 18,496 | ||||||
Sumitomo Mitsui Banking Corp. 0.15% due 2/3/20217 | 30,500 | 30,496 | ||||||
|
| |||||||
| 543,072 | ||||||||
|
| |||||||
Federal agency bills & notes 8.29% | ||||||||
Federal Farm Credit Banks 0.07%-0.10% due 1/7/2021-5/5/2021 | 83,300 | 83,289 | ||||||
Federal Home Loan Bank 0.07%-0.09% due 1/4/2021-2/9/2021 | 95,200 | 95,195 | ||||||
|
| |||||||
| 178,484 | ||||||||
|
| |||||||
U.S. Treasury bills 0.46% | ||||||||
U.S. Treasury 0.09% due 1/14/2021 | 10,000 | 10,000 | ||||||
|
| |||||||
Total short-term securities (cost: $731,564,000) | 731,556 | |||||||
|
| |||||||
Total investment securities 115.79% (cost: $2,448,888,000) | 2,493,668 | |||||||
Other assets less liabilities (15.79)% | (340,011 | ) | ||||||
|
| |||||||
Net assets 100.00% | $ | 2,153,657 | ||||||
|
| |||||||
Futures contracts
Contracts | Type | Number of contracts | Expiration | Notional amount8 (000) | Value at 12/31/20209 (000) | Unrealized appreciation (depreciation) at 12/31/2020 (000) | ||||||||||||||||||
30 Day Federal Funds Futures | Short | 759 | January 2021 | $ | (316,275 | ) | $ | (316,022 | ) | $ | 173 | |||||||||||||
90 Day Euro Dollar Futures | Short | 1,703 | March 2021 | (425,750 | ) | (425,026 | ) | (173 | ) | |||||||||||||||
2 Year U.S. Treasury Note Futures | Short | 195 | April 2021 | (39,000 | ) | (43,090 | ) | (41 | ) | |||||||||||||||
5 Year U.S. Treasury Note Futures | Long | 1,142 | April 2021 | 114,200 | 144,079 | 307 | ||||||||||||||||||
10 Year U.S. Treasury Note Futures | Short | 1,087 | March 2021 | (108,700 | ) | (150,091 | ) | (178 | ) | |||||||||||||||
10 Year Ultra U.S. Treasury Note Futures | Short | 2,164 | March 2021 | (216,400 | ) | (338,362 | ) | 755 | ||||||||||||||||
20 Year U.S. Treasury Bond Futures | Long | 214 | March 2021 | 21,400 | 37,062 | (336 | ) | |||||||||||||||||
30 Year Ultra U.S. Treasury Bond Futures | Long | 695 | March 2021 | 69,500 | 148,426 | (547 | ) | |||||||||||||||||
|
| |||||||||||||||||||||||
| $ | (40 | ) | ||||||||||||||||||||||
|
| |||||||||||||||||||||||
| American Funds Insurance Series | 231 |
Table of Contents
U.S. Government/AAA-Rated Securities Fund (continued)
Swap contracts
| Interest rate swaps |
| |||||||||||||||||||||
Receive | Pay | Expiration date | Notional (000) | Value at 12/31/2020 (000) | Upfront premium paid (received) (000) | Unrealized appreciation (depreciation) at 12/31/2020 (000) | ||||||||||||||||
2.5775% | U.S. EFFR | 7/16/2022 | $ | 181,639 | $ | 4,629 | $ | — | $ | 4,629 | ||||||||||||
1.2525% | U.S. EFFR | 2/14/2023 | 156,941 | 3,951 | — | 3,951 | ||||||||||||||||
U.S. EFFR | 0.11% | 5/18/2024 | 163,600 | 187 | — | 187 | ||||||||||||||||
U.S. EFFR | 0.1275% | 6/25/2025 | 48,600 | 188 | — | 188 | ||||||||||||||||
U.S. EFFR | 0.126% | 6/25/2025 | 20,100 | 79 | — | 79 | ||||||||||||||||
U.S. EFFR | 0.106% | 6/30/2025 | 35,063 | 173 | — | 173 | ||||||||||||||||
U.S. EFFR | 0.105% | 6/30/2025 | 28,500 | 142 | — | 142 | ||||||||||||||||
U.S. EFFR | 0.0975% | 6/30/2025 | 15,429 | 82 | — | 82 | ||||||||||||||||
3-month USD-LIBOR | 1.867% | 7/11/2025 | 49,400 | (2,059 | ) | — | (2,059 | ) | ||||||||||||||
2.91% | 3-month USD-LIBOR | 2/1/2028 | 16,000 | 1,613 | — | 1,613 | ||||||||||||||||
2.908% | 3-month USD-LIBOR | 2/1/2028 | 16,000 | 1,611 | — | 1,611 | ||||||||||||||||
2.925% | 3-month USD-LIBOR | 2/1/2028 | 12,800 | 1,300 | — | 1,300 | ||||||||||||||||
2.92% | 3-month USD-LIBOR | 2/2/2028 | 12,200 | 1,236 | — | 1,236 | ||||||||||||||||
U.S. EFFR | 0.5385% | 3/26/2030 | 49,000 | 658 | — | 658 | ||||||||||||||||
0.913% | 3-month USD-LIBOR | 6/9/2030 | 31,000 | 93 | — | 93 | ||||||||||||||||
U.S. EFFR | 0.666% | 11/19/2030 | 15,500 | 107 | — | 107 | ||||||||||||||||
3-month USD-LIBOR | 2.986% | 2/1/2038 | 7,800 | (892 | ) | — | (892 | ) | ||||||||||||||
3-month USD-LIBOR | 2.9625% | 2/1/2038 | 9,800 | (1,100 | ) | — | (1,100 | ) | ||||||||||||||
3-month USD-LIBOR | 2.963% | 2/1/2038 | 9,800 | (1,100 | ) | — | (1,100 | ) | ||||||||||||||
0.833% | 3-month USD-LIBOR | 4/3/2040 | 15,800 | (1,319 | ) | — | (1,319 | ) | ||||||||||||||
3-month USD-LIBOR | 0.81% | 7/28/2045 | 87,600 | 10,704 | (52 | ) | 10,756 | |||||||||||||||
0.8235% | 3-month USD-LIBOR | 4/24/2050 | 5,300 | (776 | ) | — | (776 | ) | ||||||||||||||
3-month USD-LIBOR | 0.811% | 7/27/2050 | 52,500 | 7,921 | — | 7,921 | ||||||||||||||||
|
|
|
| |||||||||||||||||||
| $ | (52 | ) | $ | 27,480 | ||||||||||||||||||
|
|
|
| |||||||||||||||||||
The following footnotes apply to either the individual securities noted or one or more of the securities aggregated and listed as a single line item.
| 1 | Principal payments may be made periodically. Therefore, the effective maturity date may be earlier than the stated maturity date. |
| 2 | Coupon rate may change periodically. Reference rate and spread are as of the most recent information available. Some coupon rates are determined by the issuer or agent based on current market conditions; therefore, the reference rate and spread are not available. |
| 3 | Amount less than one thousand. |
| 4 | Purchased on a TBA basis. |
| 5 | All or a portion of this security was pledged as collateral. The total value of pledged collateral was $22,183,000, which represented 1.03% of the net assets of the fund. |
| 6 | Index-linked bond whose principal amount moves with a government price index. |
| 7 | Acquired in a transaction exempt from registration under Rule 144A or Section 4(2) of the Securities Act of 1933. May be resold in the U.S. in transactions exempt from registration, normally to qualified institutional buyers. The total value of all such securities was $453,986,000, which represented 21.08% of the net assets of the fund. |
| 8 | Notional amount is calculated based on the number of contracts and notional contract size. |
| 9 | Value is calculated based on the notional amount and current market price. |
Key to abbreviations and symbol
EFFR = Effective Federal Funds Rate
LIBOR = London Interbank Offered Rate
TBA = To-be-announced
USD/$ = U.S. dollars
See notes to financial statements.
| 232 | American Funds Insurance Series |
Table of Contents
Investment portfolio December 31, 2020
| Shares | Value (000) | |||||||
Growth funds 80.18% | ||||||||
American Funds Insurance Series – Growth Fund, Class 1 | 3,764,738 | $ | 452,559 | |||||
|
| |||||||
Total growth funds (cost: $296,745,000) | 452,559 | |||||||
|
| |||||||
Fixed income funds 15.04% | ||||||||
American Funds Insurance Series – Bond Fund, Class 1 | 7,142,308 | 84,922 | ||||||
|
| |||||||
Total fixed income funds (cost: $84,212,000) | 84,922 | |||||||
|
| |||||||
Short-term securities 4.84% | ||||||||
State Street Institutional U.S. Government Money Market Fund, Premier Class 0.03%1 | 27,316,055 | 27,316 | ||||||
|
| |||||||
Total short-term securities (cost: $27,316,000) | 27,316 | |||||||
|
| |||||||
Total investment securities 100.06% (cost: $408,273,000) | 564,797 | |||||||
Other assets less liabilities (0.06)% | (351 | ) | ||||||
|
| |||||||
Net assets 100.00% | $ | 564,446 | ||||||
|
| |||||||
Futures contracts
Contracts | Type | Number of contracts | Expiration | Notional amount2 (000) | Value at 12/31/20203 (000) | Unrealized appreciation at 12/31/2020 (000) | ||||||||||||||
5 Year U.S. Treasury Note Futures | Long | 242 | March 2021 | $ | 24,200 | $ | 30,532 | $ | 69 | |||||||||||
Investments in affiliates4
| Value of affiliates at 1/1/2020 (000) | Additions (000) | Reductions (000) | Net realized (loss) gain (000) | Net unrealized appreciation (depreciation) (000) | Value of affiliates at 12/31/2020 (000) | Dividend income (000) | Capital gain distributions received (000) | |||||||||||||||||||||||||
Growth funds 80.18% | ||||||||||||||||||||||||||||||||
American Funds Insurance Series - Growth Fund, Class 1 | $ | 358,426 | $ | 260,676 | $ | 327,558 | $ | 49,300 | $ | 111,715 | $ | 452,559 | $ | 2,083 | $ | 9,098 | ||||||||||||||||
Fixed income funds 15.04% | ||||||||||||||||||||||||||||||||
American Funds Insurance Series - Bond Fund, Class 1 | 66,685 | 100,237 | 84,848 | 4,035 | (1,187 | ) | 84,922 | 1,784 | 580 | |||||||||||||||||||||||
|
|
|
|
|
|
|
|
|
| |||||||||||||||||||||||
Total 95.22% | $ | 53,335 | $ | 110,528 | $ | 537,481 | $ | 3,867 | $ | 9,678 | ||||||||||||||||||||||
|
|
|
|
|
|
|
|
|
| |||||||||||||||||||||||
| 1 | Rate represents the seven-day yield at 12/31/2020. |
| 2 | Notional amount is calculated based on the number of contracts and notional contract size. |
| 3 | Value is calculated based on the notional amount and current market price. |
| 4 | Part of the same group of investment companies as the fund as defined under the Investment Company Act of 1940. |
See notes to financial statements.
| American Funds Insurance Series | 233 |
Table of Contents
Managed Risk International Fund
Investment portfolio December 31, 2020
| Shares | Value (000) | |||||||
Growth funds 80.05% | ||||||||
American Funds Insurance Series – International Fund, Class 1 | 5,742,124 | $ | 135,744 | |||||
|
| |||||||
Total growth funds (cost: $102,112,000) | 135,744 | |||||||
|
| |||||||
Fixed income funds 15.02% | ||||||||
American Funds Insurance Series – Bond Fund, Class 1 | 2,142,314 | 25,472 | ||||||
|
| |||||||
Total fixed income funds (cost: $25,280,000) | 25,472 | |||||||
|
| |||||||
Short-term securities 4.73% | ||||||||
State Street Institutional U.S. Government Money Market Fund, Premier Class 0.03%1 | 8,021,459 | 8,021 | ||||||
|
| |||||||
Total short-term securities (cost: $8,021,000) | 8,021 | |||||||
|
| |||||||
Total investment securities 99.80% (cost: $135,413,000) | 169,237 | |||||||
Other assets less liabilities 0.20% | 332 | |||||||
|
| |||||||
Net assets 100.00% | $ | 169,569 | ||||||
|
| |||||||
Futures contracts
Contracts | Type | Number of contracts | Expiration | Notional amount2 (000) | Value at 12/31/20203 (000) | Unrealized appreciation at 12/31/2020 (000) | ||||||||||||||
5 Year U.S. Treasury Note Futures | Long | 72 | March 2021 | $ | 7,200 | $ | 9,084 | $ | 21 | |||||||||||
Investments in affiliates4
| Value of affiliates at 1/1/2020 (000) | Additions (000) | Reductions (000) | Net realized (loss) gain (000) | Net unrealized appreciation (depreciation) (000) | Value of affiliates at 12/31/2020 (000) | Dividend income (000) | Capital gain distributions received (000) | |||||||||||||||||||||||||
Growth funds 80.05% | ||||||||||||||||||||||||||||||||
American Funds Insurance Series – International Fund, Class 1 | $ | 133,862 | $ | 72,083 | $ | 88,432 | $ | (1,268 | ) | $ | 19,499 | $ | 135,744 | $ | 1,092 | $ | — | |||||||||||||||
Fixed income funds 15.02% | ||||||||||||||||||||||||||||||||
American Funds Insurance Series – Bond Fund, Class 1 | 24,465 | 30,573 | 30,185 | 1,103 | (484 | ) | 25,472 | 529 | 159 | |||||||||||||||||||||||
|
|
|
|
|
|
|
|
|
| |||||||||||||||||||||||
Total 95.07% | $ | (165 | ) | $ | 19,015 | $ | 161,216 | $ | 1,621 | $ | 159 | |||||||||||||||||||||
|
|
|
|
|
|
|
|
|
| |||||||||||||||||||||||
| 1 | Rate represents the seven-day yield at 12/31/2020. |
| 2 | Notional amount is calculated based on the number of contracts and notional contract size. |
| 3 | Value is calculated based on the notional amount and current market price. |
| 4 | Part of the same group of investment companies as the fund as defined under the Investment Company Act of 1940. |
See notes to financial statements.
| 234 | American Funds Insurance Series |
Table of Contents
Managed Risk Blue Chip Income and Growth Fund
Investment portfolio December 31, 2020
| Shares | Value (000) | |||||||
Growth-and-income funds 80.10% | ||||||||
American Funds Insurance Series – Blue Chip Income and Growth Fund, Class 1 | 19,891,981 | $ | 285,450 | |||||
|
| |||||||
Total growth-and-income funds (cost: $223,384,000) | 285,450 | |||||||
|
| |||||||
Fixed income funds 15.03% | ||||||||
American Funds Insurance Series – U.S. Government/AAA-Rated Securities Fund, Class 1 | 4,107,687 | 53,565 | ||||||
|
| |||||||
Total fixed income funds (cost: $54,284,000) | 53,565 | |||||||
|
| |||||||
Short-term securities 4.92% | ||||||||
State Street Institutional U.S. Government Money Market Fund, Premier Class 0.03%1 | 17,540,474 | 17,540 | ||||||
|
| |||||||
Total short-term securities (cost: $17,540,000) | 17,540 | |||||||
|
| |||||||
Total investment securities 100.05% (cost: $295,208,000) | 356,555 | |||||||
Other assets less liabilities (0.05)% | (195 | ) | ||||||
|
| |||||||
Net assets 100.00% | $ | 356,360 | ||||||
|
| |||||||
Futures contracts
Contracts | Type | Number of contracts | Expiration | Notional amount2 (000) | Value at 12/31/20203 (000) | Unrealized appreciation at 12/31/2020 (000) | ||||||||||||||
5 Year U.S. Treasury Note Futures | Long | 167 | March 2021 | $ | 16,700 | $ | 21,069 | $ | 38 | |||||||||||
Investments in affiliates4
| Value of affiliates at 1/1/2020 (000) | Additions (000) | Reductions (000) | Net realized (loss) gain (000) | Net unrealized appreciation (depreciation) (000) | Value of affiliates at 12/31/2020 (000) | Dividend income (000) | Capital gain distributions received (000) | |||||||||||||||||||||||||
Growth-and-income funds 80.10% | ||||||||||||||||||||||||||||||||
American Funds Insurance Series - Blue Chip Income and Growth Fund, Class 1 | $ | 299,536 | $ | 237,327 | $ | 269,536 | $ | (40,214 | ) | $ | 58,337 | $ | 285,450 | $ | 5,176 | $ | 3,353 | |||||||||||||||
Fixed income funds 15.03% | ||||||||||||||||||||||||||||||||
American Funds Insurance Series - U.S. Government/AAA-Rated Securities Fund, Class 1 | 53,524 | 87,643 | 90,377 | 4,226 | (1,451 | ) | 53,565 | 1,038 | 976 | |||||||||||||||||||||||
|
|
|
|
|
|
|
|
|
| |||||||||||||||||||||||
Total 95.13% | $ | (35,988 | ) | $ | 56,886 | $ | 339,015 | $ | 6,214 | $ | 4,329 | |||||||||||||||||||||
|
|
|
|
|
|
|
|
|
| |||||||||||||||||||||||
| 1 | Rate represents the seven-day yield at 12/31/2020. |
| 2 | Notional amount is calculated based on the number of contracts and notional contract size. |
| 3 | Value is calculated based on the notional amount and current market price. |
| 4 | Part of the same group of investment companies as the fund as defined under the Investment Company Act of 1940. |
See notes to financial statements.
| American Funds Insurance Series | 235 |
Table of Contents
Managed Risk Growth-Income Fund
Investment portfolio December 31, 2020
| Shares | Value (000) | |||||||
Growth-and-income funds 79.61% | ||||||||
American Funds Insurance Series – Growth-Income Fund, Class 1 | 34,999,287 | $ | 1,938,260 | |||||
|
| |||||||
Total growth-and-income funds (cost: $1,602,958,000) | 1,938,260 | |||||||
|
| |||||||
Fixed income funds 14.94% | ||||||||
American Funds Insurance Series – Bond Fund, Class 1 | 30,589,705 | 363,712 | ||||||
|
| |||||||
Total fixed income funds (cost: $350,930,000) | 363,712 | |||||||
|
| |||||||
Short-term securities 4.72% | ||||||||
State Street Institutional U.S. Government Money Market Fund, Premier Class 0.03%1 | 114,850,821 | 114,851 | ||||||
|
| |||||||
Total short-term securities (cost: $114,851,000) | 114,851 | |||||||
|
| |||||||
Options purchased 0.49% | ||||||||
Options purchased* | 12,028 | |||||||
|
| |||||||
Total options purchased (cost: $44,381,000) | 12,028 | |||||||
|
| |||||||
Total investment securities 99.76% (cost: $2,113,120,000) | 2,428,851 | |||||||
Other assets less liabilities 0.24% | 5,765 | |||||||
|
| |||||||
Net assets 100.00% | $ | 2,434,616 | ||||||
|
| |||||||
*Options purchased
Put |
| |||||||||||||||||||
Description | Number of contracts | Notional amount (000) | Exercise price | Expiration date | Value at 12/31/2020 (000) | |||||||||||||||
S&P 500 Index | 460 | $ | 1,728 | $ | 2,025.00 | 3/19/2021 | $ | 122 | ||||||||||||
S&P 500 Index | 965 | 3,625 | 2,050.00 | 3/19/2021 | 251 | |||||||||||||||
S&P 500 Index | 9,680 | 36,359 | 2,075.00 | 3/19/2021 | 2,759 | |||||||||||||||
S&P 500 Index | 750 | 2,817 | 2,100.00 | 3/19/2021 | 225 | |||||||||||||||
S&P 500 Index | 120 | 451 | 2,175.00 | 3/19/2021 | 41 | |||||||||||||||
S&P 500 Index | 200 | 751 | 2,325.00 | 6/18/2021 | 312 | |||||||||||||||
S&P 500 Index | 275 | 1,033 | 2,350.00 | 6/18/2021 | 483 | |||||||||||||||
S&P 500 Index | 625 | 2,347 | 2,375.00 | 6/18/2021 | 1,147 | |||||||||||||||
S&P 500 Index | 1,980 | 7,437 | 2,400.00 | 6/18/2021 | 3,514 | |||||||||||||||
S&P 500 Index | 1,285 | 4,826 | 2,425.00 | 6/18/2021 | 2,397 | |||||||||||||||
S&P 500 Index | 55 | 207 | 2,475.00 | 6/18/2021 | 113 | |||||||||||||||
S&P 500 Index | 130 | 488 | 2,325.00 | 9/17/2021 | 367 | |||||||||||||||
S&P 500 Index | 100 | 376 | 2,350.00 | 9/17/2021 | 297 | |||||||||||||||
|
| |||||||||||||||||||
| $ | 12,028 | |||||||||||||||||||
|
| |||||||||||||||||||
Futures contracts
Contracts | Type | Number of contracts | Expiration | Notional amount2 (000) | Value at 12/31/20203 (000) | Unrealized appreciation at 12/31/2020 (000) | ||||||||||||||||||
5 Year U.S. Treasury Note Futures | Long | 1,167 | March 2021 | $ | 116,700 | $ | 147,234 | $ | 341 | |||||||||||||||
S&P 500 E-mini Index Contracts | Long | 601 | March 2021 | 30 | 112,651 | 2,637 | ||||||||||||||||||
|
| |||||||||||||||||||||||
| $ | 2,978 | |||||||||||||||||||||||
|
| |||||||||||||||||||||||
| 236 | American Funds Insurance Series |
Table of Contents
Managed Risk Growth-Income Fund (continued)
Investments in affiliates4
| Value of affiliates at 1/1/2020 (000) | Additions (000) | Reductions (000) | Net realized gain (000) | Net unrealized appreciation (depreciation) (000) | Value of affiliates at 12/31/2020 (000) | Dividend income (000) | Capital gain distributions received (000) | |||||||||||||||||||||||||
Growth-and-income funds 79.61% |
| |||||||||||||||||||||||||||||||
American Funds Insurance Series – Growth-Income Fund, Class 1 | $ | 1,841,827 | $ | 536,730 | $ | 621,211 | $ | 8,083 | $ | 172,831 | $ | 1,938,260 | $ | 27,764 | $ | 46,619 | ||||||||||||||||
Fixed income funds 14.94% | ||||||||||||||||||||||||||||||||
American Funds Insurance Series – Bond Fund, Class 1 | 337,186 | 271,155 | 261,381 | 23,965 | (7,213 | ) | 363,712 | 7,976 | 3,178 | |||||||||||||||||||||||
|
|
|
|
|
|
|
|
|
| |||||||||||||||||||||||
Total 94.55% | $ | 32,048 | $ | 165,618 | $ | 2,301,972 | $ | 35,740 | $ | 49,797 | ||||||||||||||||||||||
|
|
|
|
|
|
|
|
|
| |||||||||||||||||||||||
| 1 | Rate represents the seven-day yield at 12/31/2020. |
| 2 | Notional amount is calculated based on the number of contracts and notional contract size. |
| 3 | Value is calculated based on the notional amount and current market price. |
| 4 | Part of the same group of investment companies as the fund as defined under the Investment Company Act of 1940. |
See notes to financial statements.
| American Funds Insurance Series | 237 |
Table of Contents
Managed Risk Asset Allocation Fund
Investment portfolio December 31, 2020
| Shares | Value (000) | |||||||
Asset allocation funds 95.25% | ||||||||
American Funds Insurance Series – Asset Allocation Fund, Class 1 | 99,876,172 | $ | 2,646,718 | |||||
|
| |||||||
Total asset allocation funds (cost: $2,242,813,000) | 2,646,718 | |||||||
|
| |||||||
Short-term securities 4.82% | ||||||||
State Street Institutional U.S. Government Money Market Fund, Premier Class 0.03%1 | 133,963,576 | 133,964 | ||||||
|
| |||||||
Total short-term securities (cost: $133,964,000) | 133,964 | |||||||
|
| |||||||
Total investment securities 100.07% (cost: $2,376,777,000) | 2,780,682 | |||||||
Other assets less liabilities (0.07)% | (1,911 | ) | ||||||
|
| |||||||
Net assets 100.00% | $ | 2,778,771 | ||||||
|
| |||||||
Futures contracts
Contracts | Type | Number of contracts | Expiration | Notional amount2 (000) | Value at 12/31/20203 (000) | Unrealized appreciation at 12/31/2020 (000) | ||||||||||||||
5 Year U.S. Treasury Note Futures | Long | 1,187 | March 2021 | $ | 118,700 | $ | 149,757 | $ | 358 | |||||||||||
Investments in affiliates4
| Value of affiliate at 1/1/2020 (000) | Additions (000) | Reductions (000) | Net realized gain (000) | Net unrealized appreciation (000) | Value of affiliate at 12/31/2020 (000) | Dividend income (000) | Capital gain distributions received (000) | |||||||||||||||||||||||||
Asset allocation funds 95.25% | ||||||||||||||||||||||||||||||||
American Funds Insurance Series – Asset Allocation Fund, Class 1 | $ | 2,704,731 | $ | 748,623 | $ | 1,032,662 | $ | 65,756 | $ | 160,270 | $ | 2,646,718 | $ | 46,786 | $ | 11,668 | ||||||||||||||||
| 1 | Rate represents the seven-day yield at 12/31/2020. |
| 2 | Notional amount is calculated based on the number of contracts and notional contract size. |
| 3 | Value is calculated based on the notional amount and current market price. |
| 4 | Part of the same group of investment companies as the fund as defined under the Investment Company Act of 1940. |
See notes to financial statements.
| 238 | American Funds Insurance Series |
Table of Contents
| ||
Statements of assets and liabilities at December 31, 2020 |
| (dollars in thousands) | ||||||||||||||||||||
| Global Growth Fund | Global Small Capitalization Fund | Growth Fund | International Fund | New World Fund | ||||||||||||||||
Assets: | ||||||||||||||||||||
Investment securities, at value: | ||||||||||||||||||||
Unaffiliated issuers | $ | 8,155,602 | $ | 5,335,230 | $ | 37,254,039 | $ | 10,135,728 | $ | 3,998,276 | ||||||||||
Affiliated issuers | 125,696 | 60,433 | 1,623,691 | 523,844 | 224,497 | |||||||||||||||
Cash | 50 | 3,005 | 210 | 41 | 2,018 | |||||||||||||||
Cash collateral received for securities on loan | 2,031 | 7,971 | 756 | 1,553 | 1,558 | |||||||||||||||
Cash collateral pledged for futures contracts | — | — | — | — | 85 | |||||||||||||||
Cash denominated in currencies other than U.S. dollars | 2,207 | 97 | 3,164 | 2,778 | 304 | |||||||||||||||
Unrealized appreciation on open forward currency contracts | — | — | — | 309 | — | |||||||||||||||
Receivables for: | ||||||||||||||||||||
Sales of investments | — | 238 | 150,761 | 3,290 | 10,960 | |||||||||||||||
Sales of fund’s shares | 1,566 | 2,116 | 16,007 | 1,802 | 37,379 | |||||||||||||||
Dividends and interest | 10,576 | 1,569 | 18,278 | 9,735 | 3,890 | |||||||||||||||
Variation margin on futures contracts | — | — | — | — | 8 | |||||||||||||||
Securities lending income | 22 | 278 | 4 | 19 | 24 | |||||||||||||||
Other | 494 | — | 81 | 141 | 1,813 | |||||||||||||||
|
|
|
|
|
|
|
|
|
| |||||||||||
| 8,298,244 | 5,410,937 | 39,066,991 | 10,679,240 | 4,280,812 | ||||||||||||||||
|
|
|
|
|
|
|
|
|
| |||||||||||
Liabilities: | ||||||||||||||||||||
Collateral for securities on loan | 20,305 | 79,709 | 7,559 | 15,528 | 15,578 | |||||||||||||||
Unrealized depreciation on open forward currency contracts | — | — | — | 395 | 54 | |||||||||||||||
Payables for: | ||||||||||||||||||||
Purchases of investments | 24 | 1,561 | 1,824 | 1,556 | 215 | |||||||||||||||
Repurchases of fund’s shares | 23,218 | 6,758 | 114,829 | 37,500 | 3,100 | |||||||||||||||
Investment advisory services | 3,454 | 3,020 | 10,027 | 4,312 | 1,758 | |||||||||||||||
Insurance administrative fees | 311 | 150 | 1,347 | 249 | 468 | |||||||||||||||
Services provided by related parties | 1,221 | 734 | 5,719 | 1,278 | 487 | |||||||||||||||
Trustees’ deferred compensation | 88 | 59 | 528 | 205 | 42 | |||||||||||||||
Variation margin on futures contracts | — | — | — | — | 2 | |||||||||||||||
Non-U.S. taxes | 8,523 | 6,043 | 1,032 | 27,099 | 15,804 | |||||||||||||||
Other | 130 | 162 | 82 | 260 | 151 | |||||||||||||||
|
|
|
|
|
|
|
|
|
| |||||||||||
| 57,274 | 98,196 | 142,947 | 88,382 | 37,659 | ||||||||||||||||
|
|
|
|
|
|
|
|
|
| |||||||||||
Net assets at December 31, 2020 | $ | 8,240,970 | $ | 5,312,741 | $ | 38,924,044 | $ | 10,590,858 | $ | 4,243,153 | ||||||||||
|
|
|
|
|
|
|
|
|
| |||||||||||
Net assets consist of: | ||||||||||||||||||||
Capital paid in on shares of beneficial interest | $ | 3,464,639 | $ | 2,848,920 | $ | 12,646,186 | $ | 7,030,548 | $ | 2,476,998 | ||||||||||
Total distributable earnings | 4,776,331 | 2,463,821 | 26,277,858 | 3,560,310 | 1,766,155 | |||||||||||||||
|
|
|
|
|
|
|
|
|
| |||||||||||
Net assets at December 31, 2020 | $ | 8,240,970 | $ | 5,312,741 | $ | 38,924,044 | $ | 10,590,858 | $ | 4,243,153 | ||||||||||
|
|
|
|
|
|
|
|
|
| |||||||||||
Investment securities on loan, at value | $ | 21,446 | $ | 77,648 | $ | 7,302 | $ | 83,899 | $ | 18,411 | ||||||||||
Investment securities, at cost | ||||||||||||||||||||
Unaffiliated issuers | 3,818,393 | 3,019,323 | 16,290,045 | 6,395,222 | 2,355,089 | |||||||||||||||
Affiliated issuers | 125,680 | 29,938 | 1,623,585 | 523,780 | 224,489 | |||||||||||||||
Cash denominated in currencies other than U.S. dollars, at cost | 2,119 | 96 | 3,115 | 2,761 | 304 | |||||||||||||||
See end of statements of assets and liabilities for footnote.
See notes to financial statements.
| American Funds Insurance Series | 239 |
Table of Contents
| Statements of assets and liabilities at December 31, 2020 (continued) |
| (dollars in thousands) | ||||||||||||||||||||
| Blue Chip Income and Growth Fund | Global Growth and Income Fund | Growth- Income Fund | International Growth and Income Fund | Capital Income Builder | ||||||||||||||||
Assets: | ||||||||||||||||||||
Investment securities, at value: | ||||||||||||||||||||
Unaffiliated issuers | $ | 9,398,174 | $ | 2,103,845 | $ | 37,608,591 | $ | 1,425,923 | $ | 1,047,478 | ||||||||||
Affiliated issuers | 178,532 | 66,489 | 1,005,764 | 31,755 | 56,762 | |||||||||||||||
Cash | 795 | 192 | 1,475 | 50 | 208 | |||||||||||||||
Cash collateral received for securities on loan | 359 | 716 | 19,384 | 710 | 131 | |||||||||||||||
Cash denominated in currencies other than U.S. dollars | — | 529 | 8,131 | 1,847 | 1,180 | |||||||||||||||
Unrealized appreciation on open forward currency contracts | — | — | — | — | 34 | |||||||||||||||
Receivables for: | ||||||||||||||||||||
Sales of investments | — | 12,647 | 1,628 | 824 | 40,739 | |||||||||||||||
Sales of fund’s shares | 1,354 | 1,765 | 25,220 | 180 | 1,808 | |||||||||||||||
Dividends and interest | 14,453 | 3,886 | 50,590 | 3,015 | 4,041 | |||||||||||||||
Variation margin on futures contracts | — | — | — | — | 44 | |||||||||||||||
Variation margin on swap contracts | — | — | — | — | 4 | |||||||||||||||
Securities lending income | 5 | 6 | 268 | 1 | 3 | |||||||||||||||
Other | 4 | 427 | 592 | 184 | 63 | |||||||||||||||
|
|
|
|
|
|
|
|
|
| |||||||||||
| 9,593,676 | 2,190,502 | 38,721,643 | 1,464,489 | 1,152,495 | ||||||||||||||||
|
|
|
|
|
|
|
|
|
| |||||||||||
Liabilities: | ||||||||||||||||||||
Collateral for securities on loan | 3,589 | 7,156 | 193,847 | 7,095 | 1,316 | |||||||||||||||
Unrealized depreciation on open forward currency contracts | — | — | — | — | 56 | |||||||||||||||
Payables for: | ||||||||||||||||||||
Purchases of investments | 76 | 8 | 2,168 | 4 | 50,258 | |||||||||||||||
Repurchases of fund’s shares | 6,089 | 3,403 | 18,913 | 455 | 3,045 | |||||||||||||||
Investment advisory services | 3,113 | 1,074 | 8,083 | 738 | 197 | |||||||||||||||
Insurance administrative fees | 471 | 96 | 829 | 65 | 280 | |||||||||||||||
Services provided by related parties | 1,047 | 371 | 4,183 | 106 | 124 | |||||||||||||||
Trustees’ deferred compensation | 105 | 27 | 603 | 14 | 7 | |||||||||||||||
Variation margin on futures contracts | — | — | — | — | 9 | |||||||||||||||
Variation margin on swap contracts | — | — | — | — | 36 | |||||||||||||||
Non-U.S. taxes | — | 3,879 | 1,398 | 81 | 205 | |||||||||||||||
Other | 120 | 38 | 84 | 48 | 10 | |||||||||||||||
|
|
|
|
|
|
|
|
|
| |||||||||||
| 14,610 | 16,052 | 230,108 | 8,606 | 55,543 | ||||||||||||||||
|
|
|
|
|
|
|
|
|
| |||||||||||
Net assets at December 31, 2020 | $ | 9,579,066 | $ | 2,174,450 | $ | 38,491,535 | $ | 1,455,883 | $ | 1,096,952 | ||||||||||
|
|
|
|
|
|
|
|
|
| |||||||||||
Net assets consist of: | ||||||||||||||||||||
Capital paid in on shares of beneficial interest | $ | 6,782,313 | $ | 1,372,114 | $ | 23,517,537 | $ | 1,145,069 | $ | 1,004,823 | ||||||||||
Total distributable earnings | 2,796,753 | 802,336 | 14,973,998 | 310,814 | 92,129 | |||||||||||||||
|
|
|
|
|
|
|
|
|
| |||||||||||
Net assets at December 31, 2020 | $ | 9,579,066 | $ | 2,174,450 | $ | 38,491,535 | $ | 1,455,883 | $ | 1,096,952 | ||||||||||
|
|
|
|
|
|
|
|
|
| |||||||||||
Investment securities on loan, at value | $ | 3,447 | $ | 6,890 | $ | 188,806 | $ | 6,820 | $ | 5,528 | ||||||||||
Investment securities, at cost | ||||||||||||||||||||
Unaffiliated issuers | 6,564,106 | 1,352,326 | 23,117,506 | 1,039,465 | 892,022 | |||||||||||||||
Affiliated issuers | 178,499 | 66,481 | 1,005,560 | 31,748 | 56,762 | |||||||||||||||
Cash denominated in currencies other than U.S. dollars, at cost | — | 524 | 8,047 | 1,847 | 1,175 | |||||||||||||||
See end of statements of assets and liabilities for footnote.
See notes to financial statements.
| 240 | American Funds Insurance Series |
Table of Contents
| Statements of assets and liabilities at December 31, 2020 (continued) |
| (dollars in thousands) | ||||||||||||||||||||
| Asset Allocation Fund | Global Balanced Fund | Bond Fund | Capital World Bond Fund (formerly Global Bond Fund) | High- Income Bond Fund | ||||||||||||||||
Assets: | ||||||||||||||||||||
Investment securities, at value: | ||||||||||||||||||||
Unaffiliated issuers | $ | 28,437,125 | $ | 429,245 | $ | 11,032,012 | $ | 2,195,557 | $ | 821,972 | ||||||||||
Affiliated issuers | 2,437,130 | 24,329 | 2,690,045 | 147,017 | 33,493 | |||||||||||||||
Cash | 1,502 | 60 | 1,931 | 234 | 13 | |||||||||||||||
Cash collateral received for securities on loan | 1,405 | — | — | — | — | |||||||||||||||
Cash collateral pledged for futures contracts | — | — | — | — | 180 | |||||||||||||||
Cash collateral pledged for swap contracts | — | — | — | — | 1,527 | |||||||||||||||
Cash denominated in currencies other than U.S. dollars | 1,043 | 243 | 8 | 1,536 | — | * | ||||||||||||||
Unrealized appreciation on open forward currency contracts | — | 257 | 46 | 4,155 | — | |||||||||||||||
Receivables for: | ||||||||||||||||||||
Sales of investments | 2,211,415 | 2,039 | 4,259,301 | 37,036 | 2,195 | |||||||||||||||
Sales of fund’s shares | 18,047 | 120 | 16,175 | 2,630 | 10 | |||||||||||||||
Dividends and interest | 82,937 | 1,399 | 56,775 | 18,981 | 12,591 | |||||||||||||||
Variation margin on futures contracts | 854 | — | 1,067 | 60 | — | |||||||||||||||
Variation margin on swap contracts | — | 2 | 3 | 4 | — | |||||||||||||||
Securities lending income | 35 | — | — | — | — | |||||||||||||||
Unrealized appreciation on unfunded commitments | 740 | — | — | — | 323 | |||||||||||||||
Other | 317 | 60 | 208 | 457 | 4 | |||||||||||||||
|
|
|
|
|
|
|
|
|
| |||||||||||
| 33,192,550 | 457,754 | 18,057,571 | 2,407,667 | 872,308 | ||||||||||||||||
|
|
|
|
|
|
|
|
|
| |||||||||||
Liabilities: | ||||||||||||||||||||
Collateral for securities on loan | 14,048 | — | — | — | — | |||||||||||||||
Unrealized depreciation on open forward currency contracts | — | 259 | 2,653 | 3,799 | — | |||||||||||||||
Payables for: | ||||||||||||||||||||
Purchases of investments | 3,495,044 | 1,762 | 6,637,389 | 63,377 | 3,274 | |||||||||||||||
Repurchases of fund’s shares | 6,458 | 154 | 3,405 | 217 | 789 | |||||||||||||||
Investment advisory services | 6,508 | 250 | 3,453 | 841 | 355 | |||||||||||||||
Insurance administrative fees | 3,028 | 63 | 426 | 35 | 39 | |||||||||||||||
Services provided by related parties | 2,894 | 75 | 1,237 | 293 | 177 | |||||||||||||||
Trustees’ deferred compensation | 326 | 4 | 137 | 29 | 41 | |||||||||||||||
Variation margin on futures contracts | 716 | 4 | 1,143 | 114 | 14 | |||||||||||||||
Variation margin on swap contracts | 66 | — | 295 | 18 | 39 | |||||||||||||||
Non-U.S. taxes | 5,162 | 43 | — | 89 | — | |||||||||||||||
Other | 649 | 8 | 14 | 110 | 1 | |||||||||||||||
|
|
|
|
|
|
|
|
|
| |||||||||||
| 3,534,899 | 2,622 | 6,650,152 | 68,922 | 4,729 | ||||||||||||||||
|
|
|
|
|
|
|
|
|
| |||||||||||
Net assets at December 31, 2020 | $ | 29,657,651 | $ | 455,132 | $ | 11,407,419 | $ | 2,338,745 | $ | 867,579 | ||||||||||
|
|
|
|
|
|
|
|
|
| |||||||||||
Net assets consist of: | ||||||||||||||||||||
Capital paid in on shares of beneficial interest | $ | 20,079,887 | $ | 352,482 | $ | 10,340,097 | $ | 2,109,516 | $ | 1,110,844 | ||||||||||
Total distributable earnings (accumulated loss) | 9,577,764 | 102,650 | 1,067,322 | 229,229 | (243,265 | ) | ||||||||||||||
|
|
|
|
|
|
|
|
|
| |||||||||||
Net assets at December 31, 2020 | $ | 29,657,651 | $ | 455,132 | $ | 11,407,419 | $ | 2,338,745 | $ | 867,579 | ||||||||||
|
|
|
|
|
|
|
|
|
| |||||||||||
Investment securities on loan, at value | $ | 13,741 | $ | — | $ | — | $ | — | $ | — | ||||||||||
Investment securities, at cost | ||||||||||||||||||||
Unaffiliated issuers | 19,781,571 | 328,521 | 10,403,219 | 2,023,861 | 806,030 | |||||||||||||||
Affiliated issuers | 2,391,012 | 24,327 | 2,690,027 | 147,017 | 33,489 | |||||||||||||||
Cash denominated in currencies other than U.S. dollars, at cost | 1,010 | 243 | 8 | 1,529 | — | * | ||||||||||||||
See end of statements of assets and liabilities for footnote.
See notes to financial statements.
| American Funds Insurance Series | 241 |
Table of Contents
| Statements of assets and liabilities at December 31, 2020 (continued) |
| (dollars in thousands) | ||||||||||||||||||||
| American Funds Mortgage Fund (formerly Mortgage Fund) | Ultra-Short Bond Fund | U.S. Government/ AAA-Rated Securities Fund | Managed Risk Growth Fund | Managed Risk International Fund | ||||||||||||||||
Assets: | ||||||||||||||||||||
Investment securities, at value: | ||||||||||||||||||||
Unaffiliated issuers | $ | 392,439 | $ | 372,357 | $ | 2,493,668 | $ | 27,316 | $ | 8,021 | ||||||||||
Affiliated issuers | — | — | — | 537,481 | 161,216 | |||||||||||||||
Cash | 388 | 98 | 231 | — | — | |||||||||||||||
Cash collateral pledged for futures contracts | — | — | — | 139 | 42 | |||||||||||||||
Receivables for: | ||||||||||||||||||||
Sales of investments | 179,573 | — | 1,028,854 | 706 | 854 | |||||||||||||||
Sales of fund’s shares | 429 | 3,527 | 4,197 | 191 | — | |||||||||||||||
Dividends and interest | 460 | — | 5,801 | 1 | — | * | ||||||||||||||
Variation margin on futures contracts | 4 | — | 648 | 11 | 3 | |||||||||||||||
Variation margin on swap contracts | — | — | 160 | — | — | |||||||||||||||
Other | 1 | — | — | — | — | |||||||||||||||
|
|
|
|
|
|
|
|
|
| |||||||||||
| 573,294 | 375,982 | 3,533,559 | 565,845 | 170,136 | ||||||||||||||||
|
|
|
|
|
|
|
|
|
| |||||||||||
Liabilities: | ||||||||||||||||||||
Payables for: | ||||||||||||||||||||
Purchases of investments | 253,353 | — | 1,376,273 | 482 | 175 | |||||||||||||||
Repurchases of fund’s shares | 123 | 11 | 946 | 427 | 241 | |||||||||||||||
Investment advisory services | 65 | 102 | 641 | 47 | 14 | |||||||||||||||
Insurance administrative fees | 23 | 25 | 174 | 328 | 101 | |||||||||||||||
Services provided by related parties | 28 | 80 | 415 | 112 | 35 | |||||||||||||||
Trustees’ deferred compensation | 3 | 15 | 54 | 3 | 1 | |||||||||||||||
Variation margin on futures contracts | 29 | — | 613 | — | — | |||||||||||||||
Variation margin on swap contracts | 51 | — | 785 | — | — | |||||||||||||||
Other | — | — | 1 | — | — | |||||||||||||||
|
|
|
|
|
|
|
|
|
| |||||||||||
| 253,675 | 233 | 1,379,902 | 1,399 | 567 | ||||||||||||||||
|
|
|
|
|
|
|
|
|
| |||||||||||
Net assets at December 31, 2020 | $ | 319,619 | $ | 375,749 | $ | 2,153,657 | $ | 564,446 | $ | 169,569 | ||||||||||
|
|
|
|
|
|
|
|
|
| |||||||||||
Net assets consist of: | ||||||||||||||||||||
Capital paid in on shares of beneficial interest | $ | 302,094 | $ | 375,759 | $ | 1,908,506 | $ | 386,634 | $ | 155,543 | ||||||||||
Total distributable earnings (accumulated loss) | 17,525 | (10 | ) | 245,151 | 177,812 | 14,026 | ||||||||||||||
|
|
|
|
|
|
|
|
|
| |||||||||||
Net assets at December 31, 2020 | $ | 319,619 | $ | 375,749 | $ | 2,153,657 | $ | 564,446 | $ | 169,569 | ||||||||||
|
|
|
|
|
|
|
|
|
| |||||||||||
Investment securities, at cost | ||||||||||||||||||||
Unaffiliated issuers | $ | 387,738 | $ | 372,351 | $ | 2,448,888 | $ | 27,316 | $ | 8,021 | ||||||||||
Affiliated issuers | — | — | — | 380,957 | 127,392 | |||||||||||||||
See end of statements of assets and liabilities for footnote.
See notes to financial statements.
| 242 | American Funds Insurance Series |
Table of Contents
| Statements of assets and liabilities at December 31, 2020 (continued) |
| (dollars in thousands) | ||||||||||||||||||||
| Managed Risk Blue Chip Income and Growth Fund | Managed Risk Growth- Income Fund | Managed Risk Asset Allocation Fund | ||||||||||||||||||
Assets: | ||||||||||||||||||||
Investment securities, at value: | ||||||||||||||||||||
Unaffiliated issuers | $ | 17,540 | $ | 126,879 | $ | 133,964 | ||||||||||||||
Affiliated issuers | 339,015 | 2,301,972 | 2,646,718 | |||||||||||||||||
Cash collateral pledged for futures contracts | 132 | 6,144 | 683 | |||||||||||||||||
Receivables for: | ||||||||||||||||||||
Sales of investments | 702 | — | 2,195 | |||||||||||||||||
Sales of fund’s shares | 2 | 16,998 | 149 | |||||||||||||||||
Dividends and interest | — | * | 3 | 3 | ||||||||||||||||
Variation margin on futures contracts | 8 | 794 | 56 | |||||||||||||||||
|
|
|
|
|
| |||||||||||||||
| 357,399 | 2,452,790 | 2,783,768 | ||||||||||||||||||
|
|
|
|
|
| |||||||||||||||
Liabilities: | ||||||||||||||||||||
Payables for: | ||||||||||||||||||||
Purchases of investments | 489 | 16,441 | — | |||||||||||||||||
Repurchases of fund’s shares | 226 | 6 | 2,460 | |||||||||||||||||
Investment advisory services | 30 | 202 | 234 | |||||||||||||||||
Insurance administrative fees | 218 | 1,449 | 1,697 | |||||||||||||||||
Services provided by related parties | 73 | 64 | 575 | |||||||||||||||||
Trustees’ deferred compensation | 3 | 12 | 31 | |||||||||||||||||
|
|
|
|
|
| |||||||||||||||
| 1,039 | 18,174 | 4,997 | ||||||||||||||||||
|
|
|
|
|
| |||||||||||||||
Net assets at December 31, 2020 | $ | 356,360 | $ | 2,434,616 | $ | 2,778,771 | ||||||||||||||
|
|
|
|
|
| |||||||||||||||
Net assets consist of: | ||||||||||||||||||||
Capital paid in on shares of beneficial interest | $ | 357,836 | $ | 2,054,184 | $ | 2,392,464 | ||||||||||||||
Total (accumulated loss) distributable earnings | (1,476 | ) | 380,432 | 386,307 | ||||||||||||||||
|
|
|
|
|
| |||||||||||||||
Net assets at December 31, 2020 | $ | 356,360 | $ | 2,434,616 | $ | 2,778,771 | ||||||||||||||
|
|
|
|
|
| |||||||||||||||
Investment securities, at cost | ||||||||||||||||||||
Unaffiliated issuers | $ | 17,540 | $ | 159,232 | $ | 133,964 | ||||||||||||||
Affiliated issuers | 277,668 | 1,953,888 | 2,242,813 | |||||||||||||||||
| * | Amount less than one thousand. |
See notes to financial statements.
| American Funds Insurance Series | 243 |
Table of Contents
| Statements of assets and liabilities at December 31, 2020 (continued) |
| (dollars and shares in thousands, except per-share amounts) | ||||||||||||||||||||
| Global Growth Fund | Global Small Capitalization Fund | Growth Fund | International Fund | New World Fund | ||||||||||||||||
Shares of beneficial interest issued and outstanding (no stated par value) — unlimited shares authorized | ||||||||||||||||||||
Class 1: | ||||||||||||||||||||
Net assets | $ | 3,309,395 | $ | 2,390,834 | $ | 15,644,155 | $ | 5,652,007 | $ | 2,308,973 | ||||||||||
Shares outstanding | 80,401 | 73,257 | 130,131 | 239,107 | 73,091 | |||||||||||||||
Net asset value per share | $ | 41.16 | $ | 32.64 | $ | 120.22 | $ | 23.64 | $ | 31.59 | ||||||||||
Class 1A: | ||||||||||||||||||||
Net assets | $ | 11,706 | $ | 1,226 | $ | 60,452 | $ | 9,847 | $ | 17,803 | ||||||||||
Shares outstanding | 285 | 38 | 505 | 418 | 566 | |||||||||||||||
Net asset value per share | $ | 41.02 | $ | 32.49 | $ | 119.59 | $ | 23.55 | $ | 31.43 | ||||||||||
Class 2: | ||||||||||||||||||||
Net assets | $ | 4,386,644 | $ | 2,652,518 | $ | 20,593,851 | $ | 4,480,961 | $ | 1,108,860 | ||||||||||
Shares outstanding | 107,734 | 84,047 | 172,799 | 190,374 | 35,483 | |||||||||||||||
Net asset value per share | $ | 40.72 | $ | 31.56 | $ | 119.18 | $ | 23.54 | $ | 31.25 | ||||||||||
Class 3: | ||||||||||||||||||||
Net assets | $ | 278,776 | $ | 24,720 | ||||||||||||||||
Shares outstanding | | Not applicable | | | Not applicable | | 2,301 | 1,043 | | Not applicable | | |||||||||
Net asset value per share | $ | 121.13 | $ | 23.69 | ||||||||||||||||
Class 4: | ||||||||||||||||||||
Net assets | $ | 533,225 | $ | 268,163 | $ | 2,346,810 | $ | 423,323 | $ | 807,517 | ||||||||||
Shares outstanding | 13,182 | 8,469 | 20,017 | 18,209 | 26,016 | |||||||||||||||
Net asset value per share | $ | 40.45 | $ | 31.67 | $ | 117.24 | $ | 23.25 | $ | 31.04 | ||||||||||
| Blue Chip Income and Growth Fund | Global Growth and Income Fund | Growth- Income Fund | International Growth and Income Fund | Capital Income Builder | ||||||||||||||||
Shares of beneficial interest issued and outstanding (no stated par value) — unlimited shares authorized | ||||||||||||||||||||
Class 1: | ||||||||||||||||||||
Net assets | $ | 5,684,371 | $ | 657,344 | $ | 22,902,591 | $ | 1,119,711 | $ | 620,828 | ||||||||||
Shares outstanding | 396,056 | 39,436 | 413,533 | 58,897 | 57,099 | |||||||||||||||
Net asset value per share | $ | 14.35 | $ | 16.67 | $ | 55.38 | $ | 19.01 | $ | 10.87 | ||||||||||
Class 1A: | ||||||||||||||||||||
Net assets | $ | 24,659 | $ | 2,375 | $ | 15,908 | $ | 2,967 | $ | 6,465 | ||||||||||
Shares outstanding | 1,727 | 143 | 288 | 156 | 595 | |||||||||||||||
Net asset value per share | $ | 14.28 | $ | 16.62 | $ | 55.16 | $ | 18.97 | $ | 10.86 | ||||||||||
Class 2: | ||||||||||||||||||||
Net assets | $ | 3,081,893 | $ | 1,348,612 | $ | 14,012,328 | $ | 221,049 | $ | 7,705 | ||||||||||
Shares outstanding | 217,731 | 81,086 | 256,372 | 11,666 | 709 | |||||||||||||||
Net asset value per share | $ | 14.15 | $ | 16.63 | $ | 54.66 | $ | 18.95 | $ | 10.87 | ||||||||||
Class 3: | ||||||||||||||||||||
Net assets | $ | 153,750 | ||||||||||||||||||
Shares outstanding | | Not applicable | | | Not applicable | | 2,771 | | Not applicable | | | Not applicable | | |||||||
Net asset value per share | $ | 55.49 | ||||||||||||||||||
Class 4: | ||||||||||||||||||||
Net assets | $ | 788,143 | $ | 166,119 | $ | 1,406,958 | $ | 112,156 | $ | 461,954 | ||||||||||
Shares outstanding | 56,038 | 10,162 | 26,061 | 5,961 | 42,571 | |||||||||||||||
Net asset value per share | $ | 14.06 | $ | 16.35 | $ | 53.99 | $ | 18.82 | $ | 10.85 | ||||||||||
See notes to financial statements.
| 244 | American Funds Insurance Series |
Table of Contents
| Statements of assets and liabilities at December 31, 2020 (continued) |
| (dollars and shares in thousands, except per-share amounts) | ||||||||||||||||||||
| Asset Allocation Fund | Global Balanced Fund | Bond Fund | Capital World Bond Fund (formerly Global Bond Fund) | High- Income Bond Fund | ||||||||||||||||
Shares of beneficial interest issued and outstanding (no stated par value) — unlimited shares authorized | ||||||||||||||||||||
Class 1: | ||||||||||||||||||||
Net assets | $ | 19,237,782 | $ | 139,461 | $ | 6,844,251 | $ | 1,218,619 | $ | 122,902 | ||||||||||
Shares outstanding | 725,940 | 9,827 | 575,693 | 94,166 | 12,541 | |||||||||||||||
Net asset value per share | $ | 26.50 | $ | 14.19 | $ | 11.89 | $ | 12.94 | $ | 9.80 | ||||||||||
Class 1A: | ||||||||||||||||||||
Net assets | $ | 14,543 | $ | 2,724 | $ | 9,495 | $ | 703 | $ | 997 | ||||||||||
Shares outstanding | 550 | 192 | 802 | 54 | 102 | |||||||||||||||
Net asset value per share | $ | 26.42 | $ | 14.16 | $ | 11.84 | $ | 12.91 | $ | 9.78 | ||||||||||
Class 2: | ||||||||||||||||||||
Net assets | $ | 5,241,950 | $ | 207,779 | $ | 3,839,814 | $ | 1,058,224 | $ | 664,940 | ||||||||||
Shares outstanding | 200,022 | 14,669 | 327,353 | 82,417 | 69,210 | |||||||||||||||
Net asset value per share | $ | 26.21 | $ | 14.16 | $ | 11.73 | $ | 12.84 | $ | 9.61 | ||||||||||
Class 3: | ||||||||||||||||||||
Net assets | $ | 32,685 | $ | 9,938 | ||||||||||||||||
Shares outstanding | 1,232 | | Not applicable | | | Not applicable | | | Not applicable | | 1,010 | |||||||||
Net asset value per share | $ | 26.53 | $ | 9.84 | ||||||||||||||||
Class 4: | ||||||||||||||||||||
Net assets | $ | 5,130,691 | $ | 105,168 | $ | 713,859 | $ | 61,199 | $ | 68,802 | ||||||||||
Shares outstanding | 196,868 | 7,501 | 61,047 | 4,815 | 6,530 | |||||||||||||||
Net asset value per share | $ | 26.06 | $ | 14.02 | $ | 11.69 | $ | 12.71 | $ | 10.54 | ||||||||||
| American Funds Mortgage Fund (formerly Mortgage Fund) | Ultra-Short Bond Fund | U.S. Government/ AAA-Rated Securities Fund | Managed Risk Growth Fund | Managed Risk International Fund | ||||||||||||||||
Shares of beneficial interest issued and outstanding (no stated par value) — unlimited shares authorized | ||||||||||||||||||||
Class 1: | ||||||||||||||||||||
Net assets | $ | 223,554 | $ | 43,579 | $ | 428,683 | ||||||||||||||
Shares outstanding | 20,121 | 3,855 | 32,878 | | Not applicable | | | Not applicable | | |||||||||||
Net asset value per share | $ | 11.11 | $ | 11.31 | $ | 13.04 | ||||||||||||||
Class 1A: | ||||||||||||||||||||
Net assets | $ | 1,161 | $ | 10 | $ | 3,585 | ||||||||||||||
Shares outstanding | 105 | 1 | 276 | | Not applicable | | | Not applicable | | |||||||||||
Net asset value per share | $ | 11.08 | $ | 11.31 | $ | 13.00 | ||||||||||||||
Class 2: | ||||||||||||||||||||
Net assets | $ | 57,906 | $ | 287,757 | $ | 1,439,405 | ||||||||||||||
Shares outstanding | 5,222 | 26,184 | 111,630 | | Not applicable | | | Not applicable | | |||||||||||
Net asset value per share | $ | 11.09 | $ | 10.99 | $ | 12.89 | ||||||||||||||
Class 3: | ||||||||||||||||||||
Net assets | $ | 4,301 | $ | 10,295 | ||||||||||||||||
Shares outstanding | | Not applicable | | 387 | 788 | | Not applicable | | | Not applicable | | |||||||||
Net asset value per share | $ | 11.12 | $ | 13.07 | ||||||||||||||||
Class 4: | ||||||||||||||||||||
Net assets | $ | 36,998 | $ | 40,102 | $ | 271,689 | ||||||||||||||
Shares outstanding | 3,371 | 3,618 | 21,091 | | Not applicable | | | Not applicable | | |||||||||||
Net asset value per share | $ | 10.97 | $ | 11.08 | $ | 12.88 | ||||||||||||||
Class P1: | ||||||||||||||||||||
Net assets | $ | 10,705 | $ | 1,538 | ||||||||||||||||
Shares outstanding | | Not applicable | | | Not applicable | | | Not applicable | | 621 | 139 | |||||||||
Net asset value per share | $ | 17.25 | $ | 11.07 | ||||||||||||||||
Class P2: | ||||||||||||||||||||
Net assets | $ | 553,741 | $ | 168,031 | ||||||||||||||||
Shares outstanding | | Not applicable | | | Not applicable | | | Not applicable | | 32,357 | 15,286 | |||||||||
Net asset value per share | $ | 17.11 | $ | 10.99 | ||||||||||||||||
See notes to financial statements.
| American Funds Insurance Series | 245 |
Table of Contents
| Statements of assets and liabilities at December 31, 2020 (continued) |
| (dollars and shares in thousands, except per-share amounts) | ||||||||||||||||||||
| Managed Risk Blue Chip Income and Growth Fund | Managed Risk Growth- Income Fund | Managed Risk Asset Allocation Fund | ||||||||||||||||||
Shares of beneficial interest issued and outstanding (no stated par value) — unlimited shares authorized | ||||||||||||||||||||
Class P1: | ||||||||||||||||||||
Net assets | $ | 1,525 | $ | 2,119,963 | $ | 5,317 | ||||||||||||||
Shares outstanding | 136 | 151,361 | 384 | |||||||||||||||||
Net asset value per share | $ | 11.24 | $ | 14.01 | $ | 13.84 | ||||||||||||||
Class P2: | ||||||||||||||||||||
Net assets | $ | 354,835 | $ | 314,653 | $ | 2,773,454 | ||||||||||||||
Shares outstanding | 31,732 | 22,583 | 206,250 | |||||||||||||||||
Net asset value per share | $ | 11.18 | $ | 13.93 | $ | 13.45 | ||||||||||||||
See notes to financial statements.
| 246 | American Funds Insurance Series |
Table of Contents
Financial statements (continued) | ||
Statements of operations for the year ended December 31, 2020 | ||
| (dollars in thousands) | ||||||||||||||||||||
| Global Growth Fund | Global Small Capitalization Fund | Growth Fund | International Fund | New World Fund | ||||||||||||||||
Investment income: | ||||||||||||||||||||
Income (net of non-U.S. taxes1): | ||||||||||||||||||||
Dividends: | ||||||||||||||||||||
Unaffiliated issuers | $ | 78,231 | $ | 25,305 | $ | 243,220 | $ | 108,464 | $ | 35,320 | ||||||||||
Affiliated issuers | 973 | 1,310 | 6,391 | 3,029 | 1,220 | |||||||||||||||
|
|
|
|
|
|
|
|
|
| |||||||||||
| 79,204 | 26,615 | 249,611 | 111,493 | 36,540 | ||||||||||||||||
Interest from unaffiliated issuers | 18 | 3 | 2,485 | 4,177 | 6,645 | |||||||||||||||
Securities lending income (net of fees) | 176 | 3,888 | 37 | 175 | 133 | |||||||||||||||
|
|
|
|
|
|
|
|
|
| |||||||||||
| 79,398 | 30,506 | 252,133 | 115,845 | 43,318 | ||||||||||||||||
|
|
|
|
|
|
|
|
|
| |||||||||||
Fees and expenses1: | ||||||||||||||||||||
Investment advisory services | 35,225 | 30,652 | 98,281 | 45,293 | 24,693 | |||||||||||||||
Distribution services | 10,622 | 6,084 | 47,087 | 10,718 | 3,931 | |||||||||||||||
Insurance administrative services | 1,063 | 518 | 4,484 | 905 | 1,653 | |||||||||||||||
Transfer agent services | 1 | 1 | 4 | 1 | — | 2 | ||||||||||||||
Administrative services | 2,068 | 1,324 | 9,318 | 2,752 | 1,062 | |||||||||||||||
Reports to shareholders | 143 | 91 | 634 | 199 | 85 | |||||||||||||||
Registration statement and prospectus | 44 | 75 | 231 | 94 | 31 | |||||||||||||||
Trustees’ compensation | 36 | 23 | 162 | 47 | 18 | |||||||||||||||
Auditing and legal | 67 | 85 | 75 | 83 | 116 | |||||||||||||||
Custodian | 905 | 710 | 527 | 1,874 | 975 | |||||||||||||||
Other | 5 | 72 | 16 | 7 | 58 | |||||||||||||||
|
|
|
|
|
|
|
|
|
| |||||||||||
Total fees and expenses before waivers/reimbursements | 50,179 | 39,635 | 160,819 | 61,973 | 32,622 | |||||||||||||||
Less waivers/reimbursements of fees and expenses: | ||||||||||||||||||||
Investment advisory services waivers | 1 | — | — | — | 4,382 | |||||||||||||||
Miscellaneous fee reimbursements | — | — | — | — | — | |||||||||||||||
|
|
|
|
|
|
|
|
|
| |||||||||||
Total waivers/reimbursements of fees and expenses | 1 | — | — | — | 4,382 | |||||||||||||||
|
|
|
|
|
|
|
|
|
| |||||||||||
Total fees and expenses after waivers/reimbursements | 50,178 | 39,635 | 160,819 | 61,973 | 28,240 | |||||||||||||||
|
|
|
|
|
|
|
|
|
| |||||||||||
Net investment income (loss) | 29,220 | (9,129 | ) | 91,314 | 53,872 | 15,078 | ||||||||||||||
|
|
|
|
|
|
|
|
|
| |||||||||||
Net realized gain (loss) and unrealized appreciation (depreciation): | ||||||||||||||||||||
Net realized gain (loss) on: | ||||||||||||||||||||
Investments in: | ||||||||||||||||||||
Unaffiliated issuers | 460,355 | 114,077 | 5,288,250 | 41,340 | 134,422 | |||||||||||||||
Affiliated issuers | 170 | 68 | 602 | 36 | 40 | |||||||||||||||
Futures contracts | — | — | — | — | 140 | |||||||||||||||
Forward currency contracts | — | — | — | 182 | (245 | ) | ||||||||||||||
Currency transactions | (1,374 | ) | (445 | ) | 176 | (1,536 | ) | (1,712 | ) | |||||||||||
|
|
|
|
|
|
|
|
|
| |||||||||||
| 459,151 | 113,700 | 5,289,028 | 40,022 | 132,645 | ||||||||||||||||
|
|
|
|
|
|
|
|
|
| |||||||||||
Net unrealized appreciation (depreciation) on: | ||||||||||||||||||||
Investments in: | ||||||||||||||||||||
Unaffiliated issuers | 1,448,079 | 1,153,033 | 8,444,104 | 1,257,109 | 658,964 | |||||||||||||||
Affiliated issuers | (246 | ) | 26,897 | (3 | ) | (187 | ) | (122 | ) | |||||||||||
Futures contracts | — | — | — | — | (10 | ) | ||||||||||||||
Forward currency contracts | — | — | — | 45 | (54 | ) | ||||||||||||||
Currency translations | 113 | (297 | ) | 77 | 45 | (150 | ) | |||||||||||||
|
|
|
|
|
|
|
|
|
| |||||||||||
| 1,447,946 | 1,179,633 | 8,444,178 | 1,257,012 | 658,628 | ||||||||||||||||
|
|
|
|
|
|
|
|
|
| |||||||||||
Net realized gain (loss) and unrealized appreciation (depreciation) | 1,907,097 | 1,293,333 | 13,733,206 | 1,297,034 | 791,273 | |||||||||||||||
|
|
|
|
|
|
|
|
|
| |||||||||||
Net increase (decrease) in net assets resulting from operations | $ | 1,936,317 | $ | 1,284,204 | $ | 13,824,520 | $ | 1,350,906 | $ | 806,351 | ||||||||||
|
|
|
|
|
|
|
|
|
| |||||||||||
See end of statements of operations for footnotes.
See notes to financial statements.
| American Funds Insurance Series | 247 |
Table of Contents
| Statements of operations for the year ended December 31, 2020 (continued) |
| (dollars in thousands) | ||||||||||||||||||||
| Blue Chip Income and Growth Fund | Global Growth and Income Fund | Growth- Income Fund | International Growth and Income Fund | Capital Income Builder | ||||||||||||||||
Investment income: | ||||||||||||||||||||
Income (net of non-U.S. taxes1): | ||||||||||||||||||||
Dividends: | ||||||||||||||||||||
Unaffiliated issuers | $ | 206,845 | $ | 38,168 | $ | 607,278 | $ | 30,125 | $ | 28,587 | ||||||||||
Affiliated issuers | 2,015 | 578 | 12,925 | 543 | 436 | |||||||||||||||
|
|
|
|
|
|
|
|
|
| |||||||||||
| 208,860 | 38,746 | 620,203 | 30,668 | 29,023 | ||||||||||||||||
Interest from unaffiliated issuers | 66 | 2,960 | 3,327 | 810 | 4,459 | |||||||||||||||
Securities lending income (net of fees) | 5 | 34 | 620 | 13 | 39 | |||||||||||||||
|
|
|
|
|
|
|
|
|
| |||||||||||
| 208,931 | 41,740 | 624,150 | 31,491 | 33,521 | ||||||||||||||||
|
|
|
|
|
|
|
|
|
| |||||||||||
Fees and expenses1: | ||||||||||||||||||||
Investment advisory services | 33,547 | 11,651 | 87,809 | 8,128 | 4,711 | |||||||||||||||
Distribution services | 8,654 | 3,375 | 35,109 | 727 | 1,084 | |||||||||||||||
Insurance administrative services | 1,660 | 348 | 3,054 | 239 | 1,083 | |||||||||||||||
Transfer agent services | 1 | — | 2 | 4 | — | 2 | — | 2 | ||||||||||||
Administrative services | 2,579 | 585 | 10,328 | 398 | 294 | |||||||||||||||
Reports to shareholders | 137 | 32 | 761 | 15 | 10 | |||||||||||||||
Registration statement and prospectus | 112 | 20 | 241 | 7 | 33 | |||||||||||||||
Trustees’ compensation | 44 | 10 | 177 | 7 | 5 | |||||||||||||||
Auditing and legal | 47 | 71 | 89 | 69 | 49 | |||||||||||||||
Custodian | 120 | 413 | 571 | 395 | 91 | |||||||||||||||
Other | 5 | 2 | 20 | 2 | 2 | |||||||||||||||
|
|
|
|
|
|
|
|
|
| |||||||||||
Total fees and expenses before waivers/reimbursements | 46,906 | 16,507 | 138,163 | 9,987 | 7,362 | |||||||||||||||
Less waivers/reimbursements of fees and expenses: | ||||||||||||||||||||
Investment advisory services waivers | — | — | — | — | 1,735 | |||||||||||||||
Miscellaneous fee reimbursements | — | — | — | — | — | |||||||||||||||
|
|
|
|
|
|
|
|
|
| |||||||||||
Total waivers/reimbursements of fees and expenses | — | — | — | — | 1,735 | |||||||||||||||
|
|
|
|
|
|
|
|
|
| |||||||||||
Total fees and expenses after waivers/reimbursements | 46,906 | 16,507 | 138,163 | 9,987 | 5,627 | |||||||||||||||
|
|
|
|
|
|
|
|
|
| |||||||||||
Net investment income (loss) | 162,025 | 25,233 | 485,987 | 21,504 | 27,894 | |||||||||||||||
|
|
|
|
|
|
|
|
|
| |||||||||||
Net realized gain (loss) and unrealized appreciation (depreciation): | ||||||||||||||||||||
Net realized gain (loss) on: | ||||||||||||||||||||
Investments in: | ||||||||||||||||||||
Unaffiliated issuers | (75,549 | ) | 51,131 | 377,029 | (43,978 | ) | (48,491 | ) | ||||||||||||
Affiliated issuers | 414 | 51 | (18,361 | ) | 29 | 52 | ||||||||||||||
Futures contracts | — | — | — | — | 3,606 | |||||||||||||||
Forward currency contracts | — | (521 | ) | — | 18 | 38 | ||||||||||||||
Swap contracts | — | — | — | — | 2,686 | |||||||||||||||
Currency transactions | 2 | (974 | ) | 470 | 714 | 54 | ||||||||||||||
|
|
|
|
|
|
|
|
|
| |||||||||||
| (75,133 | ) | 49,687 | 359,138 | (43,217 | ) | (42,055 | ) | |||||||||||||
|
|
|
|
|
|
|
|
|
| |||||||||||
Net unrealized appreciation (depreciation) on: | ||||||||||||||||||||
Investments in: | ||||||||||||||||||||
Unaffiliated issuers | 717,525 | 113,105 | 3,860,050 | 123,508 | 60,596 | |||||||||||||||
Affiliated issuers | 3 | (64 | ) | (10,984 | ) | (39 | ) | (127 | ) | |||||||||||
Futures contracts | — | — | — | — | 281 | |||||||||||||||
Forward currency contracts | — | 137 | — | 12 | (22 | ) | ||||||||||||||
Swap contracts | — | — | — | — | (108 | ) | ||||||||||||||
Currency translations | (6 | ) | 38 | 282 | 144 | 46 | ||||||||||||||
|
|
|
|
|
|
|
|
|
| |||||||||||
| 717,522 | 113,216 | 3,849,348 | 123,625 | 60,666 | ||||||||||||||||
|
|
|
|
|
|
|
|
|
| |||||||||||
Net realized gain (loss) and unrealized appreciation (depreciation) | 642,389 | 162,903 | 4,208,486 | 80,408 | 18,611 | |||||||||||||||
|
|
|
|
|
|
|
|
|
| |||||||||||
Net increase (decrease) in net assets resulting from operations | $ | 804,414 | $ | 188,136 | $ | 4,694,473 | $ | 101,912 | $ | 46,505 | ||||||||||
|
|
|
|
|
|
|
|
|
| |||||||||||
See end of statements of operations for footnotes.
See notes to financial statements.
| 248 | American Funds Insurance Series |
Table of Contents
| Statements of operations for the year ended December 31, 2020 (continued) |
| (dollars in thousands) | ||||||||||||||||||||
| Asset Allocation Fund | Global Balanced Fund | Bond Fund | Capital World Bond Fund3 | High- Income Bond Fund | ||||||||||||||||
Investment income: | ||||||||||||||||||||
Income (net of non-U.S. taxes1): | ||||||||||||||||||||
Dividends: | ||||||||||||||||||||
Unaffiliated issuers | $ | 331,247 | $ | 5,802 | $ | — | $ | — | $ | 161 | ||||||||||
Affiliated issuers | 16,268 | 103 | 5,601 | 477 | 227 | |||||||||||||||
|
|
|
|
|
|
|
|
|
| |||||||||||
| 347,515 | 5,905 | 5,601 | 477 | 388 | ||||||||||||||||
Interest from unaffiliated issuers | 216,938 | 2,516 | 251,927 | 55,130 | 62,664 | |||||||||||||||
Securities lending income (net of fees) | 690 | — | — | — | — | |||||||||||||||
|
|
|
|
|
|
|
|
|
| |||||||||||
| 565,143 | 8,421 | 257,528 | 55,607 | 63,052 | ||||||||||||||||
|
|
|
|
|
|
|
|
|
| |||||||||||
Fees and expenses1: | ||||||||||||||||||||
Investment advisory services | 71,046 | 2,767 | 38,894 | 11,401 | 4,534 | |||||||||||||||
Distribution services | 23,649 | 721 | 10,588 | 2,609 | 1,726 | |||||||||||||||
Insurance administrative services | 11,402 | 239 | 1,504 | 131 | 140 | |||||||||||||||
Transfer agent services | 3 | — | 2 | 1 | — | 2 | — | 2 | ||||||||||||
Administrative services | 8,053 | 126 | 3,223 | 642 | 281 | |||||||||||||||
Reports to shareholders | 481 | 5 | 227 | 35 | 22 | |||||||||||||||
Registration statement and prospectus | 330 | 5 | 80 | 22 | 7 | |||||||||||||||
Trustees’ compensation | 135 | 2 | 51 | 11 | 4 | |||||||||||||||
Auditing and legal | 72 | 53 | 54 | 48 | 47 | |||||||||||||||
Custodian | 753 | 76 | 147 | 389 | 16 | |||||||||||||||
Other | 14 | 2 | 7 | 9 | 17 | |||||||||||||||
|
|
|
|
|
|
|
|
|
| |||||||||||
Total fees and expenses before waivers/reimbursements | 115,938 | 3,996 | 54,776 | 15,297 | 6,794 | |||||||||||||||
Less waivers/reimbursements of fees and expenses: | ||||||||||||||||||||
Investment advisory services waivers | — | — | — | 1,458 | — | |||||||||||||||
Miscellaneous fee reimbursements | — | — | — | — | — | |||||||||||||||
|
|
|
|
|
|
|
|
|
| |||||||||||
Total waivers/reimbursements of fees and expenses | — | — | — | 1,458 | — | |||||||||||||||
|
|
|
|
|
|
|
|
|
| |||||||||||
Total fees and expenses after waivers/reimbursements | 115,938 | 3,996 | 54,776 | 13,839 | 6,794 | |||||||||||||||
|
|
|
|
|
|
|
|
|
| |||||||||||
Net investment income (loss) | 449,205 | 4,425 | 202,752 | 41,768 | 56,258 | |||||||||||||||
|
|
|
|
|
|
|
|
|
| |||||||||||
Net realized gain (loss) and unrealized appreciation (depreciation): | ||||||||||||||||||||
Net realized gain (loss) on: | ||||||||||||||||||||
Investments in: | ||||||||||||||||||||
Unaffiliated issuers | 767,904 | 17,369 | 406,202 | 33,450 | (55,642 | ) | ||||||||||||||
Affiliated issuers | 14,845 | 3 | 885 | 35 | 73 | |||||||||||||||
Futures contracts | 36,747 | 442 | 89,071 | (180 | ) | (166 | ) | |||||||||||||
Forward currency contracts | — | 801 | (15,906 | ) | 16,206 | — | ||||||||||||||
Swap contracts | (10,831 | ) | (123 | ) | 44 | (2,905 | ) | 3,842 | ||||||||||||
Currency transactions | (271 | ) | (237 | ) | (14 | ) | (766 | ) | 6 | |||||||||||
|
|
|
|
|
|
|
|
|
| |||||||||||
| 808,394 | 18,255 | 480,282 | 45,840 | (51,887 | ) | |||||||||||||||
|
|
|
|
|
|
|
|
|
| |||||||||||
Net unrealized appreciation (depreciation) on: | ||||||||||||||||||||
Investments in: | ||||||||||||||||||||
Unaffiliated issuers | 1,914,198 | 18,521 | 308,933 | 114,258 | 18,771 | |||||||||||||||
Affiliated issuers | 84,442 | (5 | ) | (92 | ) | (168 | ) | (129 | ) | |||||||||||
Futures contracts | 2,190 | 19 | 10,886 | 958 | (178 | ) | ||||||||||||||
Forward currency contracts | — | 97 | (1,417 | ) | 2,566 | — | ||||||||||||||
Swap contracts | 4,608 | 23 | (18,955 | ) | (923 | ) | 857 | |||||||||||||
Currency translations | 190 | 28 | 132 | 301 | 2 | |||||||||||||||
|
|
|
|
|
|
|
|
|
| |||||||||||
| 2,005,628 | 18,683 | 299,487 | 116,992 | 19,323 | ||||||||||||||||
|
|
|
|
|
|
|
|
|
| |||||||||||
Net realized gain (loss) and unrealized appreciation (depreciation) | 2,814,022 | 36,938 | 779,769 | 162,832 | (32,564 | ) | ||||||||||||||
|
|
|
|
|
|
|
|
|
| |||||||||||
Net increase (decrease) in net assets resulting from operations | $ | 3,263,227 | $ | 41,363 | $ | 982,521 | $ | 204,600 | $ | 23,694 | ||||||||||
|
|
|
|
|
|
|
|
|
| |||||||||||
See end of statements of operations for footnotes.
See notes to financial statements.
| American Funds Insurance Series | 249 |
Table of Contents
| Statements of operations for the year ended December 31, 2020 (continued) |
| (dollars in thousands) | ||||||||||||||||||||
| American Funds Mortgage Fund4 | Ultra-Short Bond Fund | U.S. Government/ AAA-Rated Securities Fund | Managed Risk Growth Fund | Managed Risk International Fund | ||||||||||||||||
Investment income: | ||||||||||||||||||||
Income (net of non-U.S. taxes1): | ||||||||||||||||||||
Dividends: | ||||||||||||||||||||
Unaffiliated issuers | $ | — | $ | — | $ | — | $ | — | $ | — | ||||||||||
Affiliated issuers | — | — | — | 3,867 | 1,621 | |||||||||||||||
|
|
|
|
|
|
|
|
|
| |||||||||||
| — | — | — | 3,867 | 1,621 | ||||||||||||||||
Interest from unaffiliated issuers | 3,819 | 1,927 | 34,038 | 56 | 26 | |||||||||||||||
|
|
|
|
|
|
|
|
|
| |||||||||||
| 3,819 | 1,927 | 34,038 | 3,923 | 1,647 | ||||||||||||||||
|
|
|
|
|
|
|
|
|
| |||||||||||
Fees and expenses1: | ||||||||||||||||||||
Investment advisory services | 1,248 | 1,098 | 8,276 | 719 | 235 | |||||||||||||||
Distribution services | 230 | 754 | 4,056 | 1,177 | 389 | |||||||||||||||
Insurance administrative services | 90 | 85 | 587 | 1,198 | 392 | |||||||||||||||
Transfer agent services | — | 2 | — | 2 | — | 2 | — | 2 | — | 2 | ||||||||||
Administrative services | 89 | 103 | 712 | — | — | |||||||||||||||
Accounting and administrative services | — | — | — | 61 | 54 | |||||||||||||||
Reports to shareholders | 4 | 6 | 83 | 6 | 4 | |||||||||||||||
Registration statement and prospectus | 3 | 4 | 14 | 8 | 1 | |||||||||||||||
Trustees’ compensation | 1 | 2 | 9 | 3 | 1 | |||||||||||||||
Auditing and legal | 44 | 45 | 46 | 16 | 16 | |||||||||||||||
Custodian | 24 | 1 | 37 | 11 | 11 | |||||||||||||||
Other | — | 2 | — | 2 | 2 | 2 | 2 | |||||||||||||
|
|
|
|
|
|
|
|
|
| |||||||||||
Total fees and expenses before waivers/reimbursements | 1,733 | 2,098 | 13,822 | 3,201 | 1,105 | |||||||||||||||
Less waivers/reimbursements of fees and expenses: | ||||||||||||||||||||
Investment advisory services waivers | 360 | — | — | 240 | 79 | |||||||||||||||
Miscellaneous fee reimbursements | — | — | — | — | 41 | |||||||||||||||
|
|
|
|
|
|
|
|
|
| |||||||||||
Total waivers/reimbursements of fees and expenses | 360 | — | — | 240 | 120 | |||||||||||||||
|
|
|
|
|
|
|
|
|
| |||||||||||
Total fees and expenses after waivers/reimbursements | 1,373 | 2,098 | 13,822 | 2,961 | 985 | |||||||||||||||
|
|
|
|
|
|
|
|
|
| |||||||||||
Net investment income (loss) | 2,446 | (171 | ) | 20,216 | 962 | 662 | ||||||||||||||
|
|
|
|
|
|
|
|
|
| |||||||||||
Net realized gain (loss) and unrealized appreciation (depreciation): | ||||||||||||||||||||
Net realized gain (loss) on: | ||||||||||||||||||||
Investments in: | ||||||||||||||||||||
Unaffiliated issuers | 11,818 | — | 145,064 | — | — | |||||||||||||||
Affiliated issuers | — | — | — | 53,335 | (165 | ) | ||||||||||||||
Futures contracts | 8,696 | — | 89,336 | (35,338 | ) | (14,051 | ) | |||||||||||||
Swap contracts | (8,505 | ) | — | (46,704 | ) | — | — | |||||||||||||
Currency transactions | — | — | — | 77 | 178 | |||||||||||||||
Capital gain distributions received from affiliated issuers | — | — | — | 9,678 | 159 | |||||||||||||||
|
|
|
|
|
|
|
|
|
| |||||||||||
| 12,009 | — | 187,696 | 27,752 | (13,879 | ) | |||||||||||||||
|
|
|
|
|
|
|
|
|
| |||||||||||
Net unrealized appreciation (depreciation) on: | ||||||||||||||||||||
Investments in: | ||||||||||||||||||||
Unaffiliated issuers | 239 | (1 | ) | 6,199 | — | — | ||||||||||||||
Affiliated issuers | — | — | — | 110,528 | 19,015 | |||||||||||||||
Futures contracts | 779 | — | 7,908 | 130 | 51 | |||||||||||||||
Swap contracts | 4,046 | — | 47,782 | — | — | |||||||||||||||
|
|
|
|
|
|
|
|
|
| |||||||||||
| 5,064 | (1 | ) | 61,889 | 110,658 | 19,066 | |||||||||||||||
|
|
|
|
|
|
|
|
|
| |||||||||||
Net realized gain (loss) and unrealized appreciation (depreciation) | 17,073 | (1 | ) | 249,585 | 138,410 | 5,187 | ||||||||||||||
|
|
|
|
|
|
|
|
|
| |||||||||||
Net increase (decrease) in net assets resulting from operations | $ | 19,519 | $ | (172 | ) | $ | 269,801 | $ | 139,372 | $ | 5,849 | |||||||||
|
|
|
|
|
|
|
|
|
| |||||||||||
See end of statements of operations for footnotes.
See notes to financial statements.
| 250 | American Funds Insurance Series |
Table of Contents
| Statements of operations for the year ended December 31, 2020 (continued) |
| (dollars in thousands) | ||||||||||||
| Managed Risk Blue Chip Income and Growth Fund | Managed Risk Growth- Income Fund | Managed Risk Asset Allocation Fund | ||||||||||
Investment income: | ||||||||||||
Income (net of non-U.S. taxes1): | ||||||||||||
Dividends: | ||||||||||||
Unaffiliated issuers | $ | — | $ | — | $ | — | ||||||
Affiliated issuers | 6,214 | 35,740 | 46,786 | |||||||||
|
|
|
|
|
| |||||||
| 6,214 | 35,740 | 46,786 | ||||||||||
Interest from unaffiliated issuers | 45 | 297 | 433 | |||||||||
|
|
|
|
|
| |||||||
| 6,259 | 36,037 | 47,219 | ||||||||||
|
|
|
|
|
| |||||||
Fees and expenses1: | ||||||||||||
Investment advisory services | 518 | 3,378 | 4,028 | |||||||||
Distribution services | 861 | 718 | 6,703 | |||||||||
Insurance administrative services | 864 | 5,630 | 6,712 | |||||||||
Transfer agent services | — | 2 | — | 2 | — | 2 | ||||||
Accounting and administrative services | 58 | 100 | 102 | |||||||||
Reports to shareholders | 5 | 21 | 44 | |||||||||
Registration statement and prospectus | 3 | 14 | 11 | |||||||||
Trustees’ compensation | 2 | 11 | 13 | |||||||||
Auditing and legal | 16 | 18 | 19 | |||||||||
Custodian | 11 | 11 | 11 | |||||||||
Other | 2 | 3 | 3 | |||||||||
|
|
|
|
|
| |||||||
Total fees and expenses before waivers/reimbursements | 2,340 | 9,904 | 17,646 | |||||||||
Less waivers/reimbursements of fees and expenses: | ||||||||||||
Investment advisory services waivers | 173 | 1,126 | 1,342 | |||||||||
Miscellaneous fee reimbursements | — | — | — | |||||||||
|
|
|
|
|
| |||||||
Total waivers/reimbursements of fees and expenses | 173 | 1,126 | 1,342 | |||||||||
|
|
|
|
|
| |||||||
Total fees and expenses after waivers/reimbursements | 2,167 | 8,778 | 16,304 | |||||||||
|
|
|
|
|
| |||||||
Net investment income (loss) | 4,092 | 27,259 | 30,915 | |||||||||
|
|
|
|
|
| |||||||
Net realized gain (loss) and unrealized appreciation (depreciation): | ||||||||||||
Net realized gain (loss) on: | ||||||||||||
Investments in: | ||||||||||||
Unaffiliated issuers | — | (22,888 | ) | — | ||||||||
Affiliated issuers | (35,988 | ) | 32,048 | 65,756 | ||||||||
Futures contracts | (32,684 | ) | (20,595 | ) | (119,251 | ) | ||||||
Currency transactions | 15 | 307 | 140 | |||||||||
Capital gain distributions received from affiliated issuers | 4,329 | 49,797 | 11,668 | |||||||||
|
|
|
|
|
| |||||||
| (64,328 | ) | 38,669 | (41,687 | ) | ||||||||
|
|
|
|
|
| |||||||
Net unrealized appreciation (depreciation) on: | ||||||||||||
Investments in: | ||||||||||||
Unaffiliated issuers | — | (22,232 | ) | — | ||||||||
Affiliated issuers | 56,886 | 165,618 | 160,270 | |||||||||
Futures contracts | 90 | 2,308 | 883 | |||||||||
|
|
|
|
|
| |||||||
| 56,976 | 145,694 | 161,153 | ||||||||||
|
|
|
|
|
| |||||||
Net realized gain (loss) and unrealized appreciation (depreciation) | (7,352 | ) | 184,363 | 119,466 | ||||||||
|
|
|
|
|
| |||||||
Net increase (decrease) in net assets resulting from operations | $ | (3,260 | ) | $ | 211,622 | $ | 150,381 | |||||
|
|
|
|
|
| |||||||
| 1 | Additional information related to non-U.S. taxes and class-specific fees and expenses is included in the notes to financial statements. |
| 2 | Amount less than one thousand. |
| 3 | Formerly Global Bond Fund. |
| 4 | Formerly Mortgage Fund. |
See notes to financial statements.
| American Funds Insurance Series | 251 |
Table of Contents
| Financial statements (continued) | ||
| Statements of changes in net assets | ||
| (dollars in thousands) | ||||||||||||||||||||||||
| Global Growth Fund | Global Small Capitalization Fund | Growth Fund | ||||||||||||||||||||||
| Year ended December 31, | Year ended December 31, | Year ended December 31, | ||||||||||||||||||||||
| 2020 | 2019 | 2020 | 2019 | 2020 | 2019 | |||||||||||||||||||
Operations: | ||||||||||||||||||||||||
Net investment income (loss) | $ | 29,220 | $ | 56,332 | $ | (9,129 | ) | $ | 13,730 | $ | 91,314 | $ | 241,310 | |||||||||||
Net realized gain (loss) | 459,151 | 193,918 | 113,700 | 251,270 | 5,289,028 | 745,536 | ||||||||||||||||||
Net unrealized appreciation (depreciation) | 1,447,946 | 1,619,747 | 1,179,633 | 882,559 | 8,444,178 | 6,038,232 | ||||||||||||||||||
|
|
|
|
|
|
|
|
|
|
|
| |||||||||||||
Net increase (decrease) in net assets resulting from operations | 1,936,317 | 1,869,997 | 1,284,204 | 1,147,559 | 13,824,520 | 7,025,078 | ||||||||||||||||||
|
|
|
|
|
|
|
|
|
|
|
| |||||||||||||
Distributions paid to shareholders | (224,589 | ) | (417,934 | ) | (284,490 | ) | (284,752 | ) | (865,145 | ) | (2,978,202 | ) | ||||||||||||
Net capital share transactions | (271,205 | ) | (153,769 | ) | (307,246 | ) | 102,952 | (2,504,990 | ) | 974,922 | ||||||||||||||
|
|
|
|
|
|
|
|
|
|
|
| |||||||||||||
Total increase (decrease) in net assets | 1,440,523 | 1,298,294 | 692,468 | 965,759 | 10,454,385 | 5,021,798 | ||||||||||||||||||
Net assets: | ||||||||||||||||||||||||
Beginning of year | 6,800,447 | 5,502,153 | 4,620,273 | 3,654,514 | 28,469,659 | 23,447,861 | ||||||||||||||||||
|
|
|
|
|
|
|
|
|
|
|
| |||||||||||||
End of year | $ | 8,240,970 | $ | 6,800,447 | $ | 5,312,741 | $ | 4,620,273 | $ | 38,924,044 | $ | 28,469,659 | ||||||||||||
|
|
|
|
|
|
|
|
|
|
|
| |||||||||||||
| International Fund | New World Fund | Blue Chip Income and Growth Fund | ||||||||||||||||||||||
| Year ended December 31, | Year ended December 31, | Year ended December 31, | ||||||||||||||||||||||
| 2020 | 2019 | 2020 | 2019 | 2020 | 2019 | |||||||||||||||||||
Operations: | ||||||||||||||||||||||||
Net investment income (loss) | $ | 53,872 | $ | 136,307 | $ | 15,078 | $ | 34,732 | $ | 162,025 | $ | 189,701 | ||||||||||||
Net realized gain (loss) | 40,022 | (127,992 | ) | 132,645 | 32,951 | (75,133 | ) | 85,829 | ||||||||||||||||
Net unrealized appreciation (depreciation) | 1,257,012 | 1,988,427 | 658,628 | 791,400 | 717,522 | 1,423,960 | ||||||||||||||||||
|
|
|
|
|
|
|
|
|
|
|
| |||||||||||||
Net increase (decrease) in net assets resulting from operations | 1,350,906 | 1,996,742 | 806,351 | 859,083 | 804,414 | 1,699,490 | ||||||||||||||||||
|
|
|
|
|
|
|
|
|
|
|
| |||||||||||||
Distributions paid to shareholders | (71,715 | ) | (394,620 | ) | (43,949 | ) | (164,192 | ) | (265,213 | ) | (878,225 | ) | ||||||||||||
Net capital share transactions | (763,764 | ) | (536,801 | ) | (279,660 | ) | 54,641 | (242,496 | ) | 429,824 | ||||||||||||||
|
|
|
|
|
|
|
|
|
|
|
| |||||||||||||
Total increase (decrease) in net assets | 515,427 | 1,065,321 | 482,742 | 749,532 | 296,705 | 1,251,089 | ||||||||||||||||||
Net assets: | ||||||||||||||||||||||||
Beginning of year | 10,075,431 | 9,010,110 | 3,760,411 | 3,010,879 | 9,282,361 | 8,031,272 | ||||||||||||||||||
|
|
|
|
|
|
|
|
|
|
|
| |||||||||||||
End of year | $ | 10,590,858 | $ | 10,075,431 | $ | 4,243,153 | $ | 3,760,411 | $ | 9,579,066 | $ | 9,282,361 | ||||||||||||
|
|
|
|
|
|
|
|
|
|
|
| |||||||||||||
See notes to financial statements.
| 252 | American Funds Insurance Series |
Table of Contents
| Statements of changes in net assets (continued) |
| (dollars in thousands) | ||||||||||||||||||||||||
| Global Growth and Income Fund | Growth-Income Fund | International Growth and Income Fund | ||||||||||||||||||||||
| Year ended December 31, | Year ended December 31, | Year ended December 31, | ||||||||||||||||||||||
| 2020 | 2019 | 2020 | 2019 | 2020 | 2019 | |||||||||||||||||||
Operations: | ||||||||||||||||||||||||
Net investment income (loss) | $ | 25,233 | $ | 38,039 | $ | 485,987 | $ | 648,555 | $ | 21,504 | $ | 37,530 | ||||||||||||
Net realized gain (loss) | 49,687 | 51,837 | 359,138 | 902,476 | (43,217 | ) | (37,024 | ) | ||||||||||||||||
Net unrealized appreciation (depreciation) | 113,216 | 449,868 | 3,849,348 | 6,175,985 | 123,625 | 293,939 | ||||||||||||||||||
|
|
|
|
|
|
|
|
|
|
|
| |||||||||||||
Net increase (decrease) in net assets resulting from operations | 188,136 | 539,744 | 4,694,473 | 7,727,016 | 101,912 | 294,445 | ||||||||||||||||||
|
|
|
|
|
|
|
|
|
|
|
| |||||||||||||
Distributions paid to shareholders | (77,584 | ) | (140,198 | ) | (1,429,478 | ) | (3,957,175 | ) | (21,467 | ) | (53,548 | ) | ||||||||||||
Net capital share transactions | (74,585 | ) | (76,937 | ) | (799,726 | ) | 2,392,290 | (124,648 | ) | (78,069 | ) | |||||||||||||
|
|
|
|
|
|
|
|
|
|
|
| |||||||||||||
Total increase (decrease) in net assets | 35,967 | 322,609 | 2,465,269 | 6,162,131 | (44,203 | ) | 162,828 | |||||||||||||||||
Net assets: | ||||||||||||||||||||||||
Beginning of year | 2,138,483 | 1,815,874 | 36,026,266 | 29,864,135 | 1,500,086 | 1,337,258 | ||||||||||||||||||
|
|
|
|
|
|
|
|
|
|
|
| |||||||||||||
End of year | $ | 2,174,450 | $ | 2,138,483 | $ | 38,491,535 | $ | 36,026,266 | $ | 1,455,883 | $ | 1,500,086 | ||||||||||||
|
|
|
|
|
|
|
|
|
|
|
| |||||||||||||
| Capital Income Builder | Asset Allocation Fund | Global Balanced Fund | ||||||||||||||||||||||
| Year ended December 31, | Year ended December 31, | Year ended December 31, | ||||||||||||||||||||||
| 2020 | 2019 | 2020 | 2019 | 2020 | 2019 | |||||||||||||||||||
Operations: | ||||||||||||||||||||||||
Net investment income (loss) | $ | 27,894 | $ | 24,376 | $ | 449,205 | $ | 527,540 | $ | 4,425 | $ | 6,777 | ||||||||||||
Net realized gain (loss) | (42,055 | ) | (6,878 | ) | 808,394 | 20,909 | 18,255 | 9,826 | ||||||||||||||||
Net unrealized appreciation (depreciation) | 60,666 | 117,343 | 2,005,628 | 4,312,978 | 18,683 | 58,663 | ||||||||||||||||||
|
|
|
|
|
|
|
|
|
|
|
| |||||||||||||
Net increase (decrease) in net assets resulting from operations | 46,505 | 134,841 | 3,263,227 | 4,861,427 | 41,363 | 75,266 | ||||||||||||||||||
|
|
|
|
|
|
|
|
|
|
|
| |||||||||||||
Distributions paid to shareholders | (28,997 | ) | (24,614 | ) | (606,436 | ) | (1,801,337 | ) | (21,373 | ) | (16,934 | ) | ||||||||||||
Net capital share transactions | 80,728 | 213,209 | (418,795 | ) | 1,434,114 | (1,808 | ) | 12,429 | ||||||||||||||||
|
|
|
|
|
|
|
|
|
|
|
| |||||||||||||
Total increase (decrease) in net assets | 98,236 | 323,436 | 2,237,996 | 4,494,204 | 18,182 | 70,761 | ||||||||||||||||||
Net assets: | ||||||||||||||||||||||||
Beginning of year | 998,716 | 675,280 | 27,419,655 | 22,925,451 | 436,950 | 366,189 | ||||||||||||||||||
|
|
|
|
|
|
|
|
|
|
|
| |||||||||||||
End of year | $ | 1,096,952 | $ | 998,716 | $ | 29,657,651 | $ | 27,419,655 | $ | 455,132 | $ | 436,950 | ||||||||||||
|
|
|
|
|
|
|
|
|
|
|
| |||||||||||||
See notes to financial statements.
| American Funds Insurance Series | 253 |
Table of Contents
| Statements of changes in net assets (continued) |
| (dollars in thousands) | ||||||||||||||||||||||||
| Bond Fund | Capital World Bond Fund (formerly Global Bond Fund) | High-Income Bond Fund | ||||||||||||||||||||||
| Year ended December 31, | Year ended December 31, | Year ended December 31, | ||||||||||||||||||||||
| 2020 | 2019 | 2020 | 2019 | 2020 | 2019 | |||||||||||||||||||
Operations: | ||||||||||||||||||||||||
Net investment income (loss) | $ | 202,752 | $ | 272,023 | $ | 41,768 | $ | 52,158 | $ | 56,258 | $ | 82,861 | ||||||||||||
Net realized gain (loss) | 480,282 | 243,332 | 45,840 | 21,665 | (51,887 | ) | (19,893 | ) | ||||||||||||||||
Net unrealized appreciation (depreciation) | 299,487 | 411,625 | 116,992 | 87,557 | 19,323 | 86,931 | ||||||||||||||||||
|
|
|
|
|
|
|
|
|
|
|
| |||||||||||||
Net increase (decrease) in net assets resulting from operations | 982,521 | 926,980 | 204,600 | 161,380 | 23,694 | 149,899 | ||||||||||||||||||
|
|
|
|
|
|
|
|
|
|
|
| |||||||||||||
Distributions paid to shareholders | (339,511 | ) | (280,200 | ) | (64,860 | ) | (35,756 | ) | (69,840 | ) | (79,066 | ) | ||||||||||||
Net capital share transactions | 213,249 | 49,693 | 70,361 | (84,997 | ) | (352,568 | ) | (8,439 | ) | |||||||||||||||
|
|
|
|
|
|
|
|
|
|
|
| |||||||||||||
Total increase (decrease) in net assets | 856,259 | 696,473 | 210,101 | 40,627 | (398,714 | ) | 62,394 | |||||||||||||||||
Net assets: | ||||||||||||||||||||||||
Beginning of year | 10,551,160 | 9,854,687 | 2,128,644 | 2,088,017 | 1,266,293 | 1,203,899 | ||||||||||||||||||
|
|
|
|
|
|
|
|
|
|
|
| |||||||||||||
End of year | $ | 11,407,419 | $ | 10,551,160 | $ | 2,338,745 | $ | 2,128,644 | $ | 867,579 | $ | 1,266,293 | ||||||||||||
|
|
|
|
|
|
|
|
|
|
|
| |||||||||||||
| American Funds Mortgage Fund (formerly Mortgage Fund) | Ultra-Short Bond Fund | U.S. Government/ AAA-Rated Securities Fund | ||||||||||||||||||||||
| Year ended December 31, | Year ended December 31, | Year ended December 31, | ||||||||||||||||||||||
| 2020 | 2019 | 2020 | 2019 | 2020 | 2019 | |||||||||||||||||||
Operations: | ||||||||||||||||||||||||
Net investment income (loss) | $ | 2,446 | $ | 6,346 | $ | (171) | $ | 4,833 | $ | 20,216 | $ | 55,852 | ||||||||||||
Net realized gain (loss) | 12,009 | 9,940 | — | (1 | ) | 187,696 | 122,154 | |||||||||||||||||
Net unrealized appreciation (depreciation) | 5,064 | (1,209 | ) | (1 | ) | 15 | 61,889 | (22,336 | ) | |||||||||||||||
|
|
|
|
|
|
|
|
|
|
|
| |||||||||||||
Net increase (decrease) in net assets resulting from operations | 19,519 | 15,077 | (172 | ) | 4,847 | 269,801 | 155,670 | |||||||||||||||||
|
|
|
|
|
|
|
|
|
|
|
| |||||||||||||
Distributions paid to shareholders | (4,820 | ) | (7,525 | ) | (737 | ) | (5,093 | ) | (77,781 | ) | (60,961 | ) | ||||||||||||
Net capital share transactions | 10,410 | (4,217 | ) | 92,028 | (21,528 | ) | (934,697 | ) | (67,678 | ) | ||||||||||||||
|
|
|
|
|
|
|
|
|
|
|
| |||||||||||||
Total increase (decrease) in net assets | 25,109 | 3,335 | 91,119 | (21,774 | ) | (742,677 | ) | 27,031 | ||||||||||||||||
Net assets: | ||||||||||||||||||||||||
Beginning of year | 294,510 | 291,175 | 284,630 | 306,404 | 2,896,334 | 2,869,303 | ||||||||||||||||||
|
|
|
|
|
|
|
|
|
|
|
| |||||||||||||
End of year | $ | 319,619 | $ | 294,510 | $ | 375,749 | $ | 284,630 | $ | 2,153,657 | $ | 2,896,334 | ||||||||||||
|
|
|
|
|
|
|
|
|
|
|
| |||||||||||||
See notes to financial statements.
| 254 | American Funds Insurance Series |
Table of Contents
| Statements of changes in net assets (continued) |
| (dollars in thousands) | ||||||||||||||||||||||||
| Managed Risk Growth Fund | Managed Risk International Fund | Managed Risk Blue Chip Income and Growth Fund | ||||||||||||||||||||||
| Year ended December 31, | Year ended December 31, | Year ended December 31, | ||||||||||||||||||||||
| 2020 | 2019 | 2020 | 2019 | 2020 | 2019 | |||||||||||||||||||
Operations: | ||||||||||||||||||||||||
Net investment income (loss) | $ | 962 | $ | 2,886 | $ | 662 | $ | 1,940 | $ | 4,092 | $ | 5,680 | ||||||||||||
Net realized gain (loss) | 27,752 | 30,629 | (13,879 | ) | 2,677 | (64,328 | ) | 16,823 | ||||||||||||||||
Net unrealized appreciation (depreciation) | 110,658 | 43,736 | 19,066 | 21,114 | 56,976 | 23,125 | ||||||||||||||||||
|
|
|
|
|
|
|
|
|
|
|
| |||||||||||||
Net increase (decrease) in net assets resulting from operations | 139,372 | 77,251 | 5,849 | 25,731 | (3,260 | ) | 45,628 | |||||||||||||||||
|
|
|
|
|
|
|
|
|
|
|
| |||||||||||||
Distributions paid to shareholders | (25,274 | ) | (30,222 | ) | (3,247 | ) | (7,796 | ) | (16,900 | ) | (23,415 | ) | ||||||||||||
Net capital share transactions | 10,698 | 49,348 | 1,198 | (3,125 | ) | 11,085 | 6,553 | |||||||||||||||||
|
|
|
|
|
|
|
|
|
|
|
| |||||||||||||
Total increase (decrease) in net assets | 124,796 | 96,377 | 3,800 | 14,810 | (9,075 | ) | 28,766 | |||||||||||||||||
Net assets: | ||||||||||||||||||||||||
Beginning of year | 439,650 | 343,273 | 165,769 | 150,959 | 365,435 | 336,669 | ||||||||||||||||||
|
|
|
|
|
|
|
|
|
|
|
| |||||||||||||
End of year | $ | 564,446 | $ | 439,650 | $ | 169,569 | $ | 165,769 | $ | 356,360 | $ | 365,435 | ||||||||||||
|
|
|
|
|
|
|
|
|
|
|
| |||||||||||||
| Managed Risk Growth-Income Fund | Managed Risk Asset Allocation Fund | |||||||||||||||
| Year ended December 31, | Year ended December 31, | |||||||||||||||
| 2020 | 2019 | 2020 | 2019 | |||||||||||||
Operations: | ||||||||||||||||
Net investment income (loss) | $ | 27,259 | $ | 35,433 | $ | 30,915 | $ | 40,653 | ||||||||
Net realized gain (loss) | 38,669 | 149,567 | (41,687 | ) | 131,826 | |||||||||||
Net unrealized appreciation (depreciation) | 145,694 | 180,419 | 161,153 | 271,610 | ||||||||||||
|
|
|
|
|
|
|
| |||||||||
Net increase (decrease) in net assets resulting from operations | 211,622 | 365,419 | 150,381 | 444,089 | ||||||||||||
|
|
|
|
|
|
|
| |||||||||
Distributions paid to shareholders | (160,767 | ) | (32,440 | ) | (146,678 | ) | (177,811 | ) | ||||||||
Net capital share transactions | 114,037 | 44,643 | (57,436 | ) | 23,729 | |||||||||||
|
|
|
|
|
|
|
| |||||||||
Total increase (decrease) in net assets | 164,892 | 377,622 | (53,733 | ) | 290,007 | |||||||||||
Net assets: | ||||||||||||||||
Beginning of year | 2,269,724 | 1,892,102 | 2,832,504 | 2,542,497 | ||||||||||||
|
|
|
|
|
|
|
| |||||||||
End of year | $ | 2,434,616 | $ | 2,269,724 | $ | 2,778,771 | $ | 2,832,504 | ||||||||
|
|
|
|
|
|
|
| |||||||||
See notes to financial statements.
| American Funds Insurance Series | 255 |
Table of Contents
Notes to financial statements
1. Organization
American Funds Insurance Series (the “series”) is registered under the Investment Company Act of 1940 as an open-end, diversified management investment company with 34 different funds (“the funds”), including 23 funds in the series covered in this report. The other 11 funds in the series are covered in separate reports. Six funds in the series are covered in the American Funds Insurance Series -Target Date Series report and five funds in the series are covered in the American Funds Insurance Series - Portfolio Series report. The assets of each fund are segregated, with each fund accounted for separately. Capital Research and Management Company (“CRMC”) is the series’ investment adviser. Milliman Financial Risk Management LLC (“Milliman FRM”) is the subadviser for the risk management strategy for eight of the funds (the “managed risk funds”), five of which are covered in this report.
The managed risk funds covered in this report are Managed Risk Growth Fund, Managed Risk International Fund, Managed Risk Blue Chip Income and Growth Fund, Managed Risk Growth-Income Fund and Managed Risk Asset Allocation Fund. The managed risk funds invest in other funds within the series (the “underlying funds”) and employ Milliman FRM to implement the risk management strategy, which consists of using hedging instruments — primarily short positions on exchange-traded futures contracts — to attempt to stabilize the volatility of the funds around target volatility levels and reduce the downside exposure of the funds during periods of significant market declines.
Shareholders approved a proposal to reorganize the series from a Massachusetts business trust to a Delaware statutory trust. The series reserved the right to delay implementing the reorganization and has elected to do so.
The investment objective(s) for each fund covered in this report are as follows:
Global Growth Fund — To provide long-term growth of capital.
Global Small Capitalization Fund — To provide long-term growth of capital.
Growth Fund — To provide growth of capital.
International Fund — To provide long-term growth of capital.
New World Fund — To provide long-term capital appreciation.
Blue Chip Income and Growth Fund — To produce income exceeding the average yield on U.S. stocks generally and to provide an opportunity for growth of principal consistent with sound common stock investing.
Global Growth and Income Fund — To provide long-term growth of capital while providing current income.
Growth-Income Fund — To achieve long-term growth of capital and income.
International Growth and Income Fund — To provide long-term growth of capital while providing current income.
Capital Income Builder — The two primary objectives are (1) to provide a level of current income that exceeds the average yield on U.S. stocks generally and (2) to provide a growing stream of income over the years. The secondary objective is to provide growth of capital.
Asset Allocation Fund — To provide high total return (including income and capital gains) consistent with preservation of capital over the long term.
Global Balanced Fund — Seeks the balanced accomplishment of three objectives: long-term growth of capital, conservation of principal and current income.
Bond Fund — To provide as high a level of current income as is consistent with the preservation of capital.
Capital World Bond Fund (formerly Global Bond Fund) — To provide, over the long term, a high level of total return consistent with prudent investment management.
| 256 | American Funds Insurance Series |
Table of Contents
High-Income Bond Fund — The primary objective is to provide a high level of current income. The secondary objective is capital appreciation.
American Funds Mortgage Fund (formerly Mortgage Fund) — To provide current income and preservation of capital.
Ultra-Short Bond Fund — To provide current income, consistent with the maturity and quality standards applicable to the fund, and preservation of capital and liquidity.
U.S. Government/AAA-Rated Securities Fund — To provide a high level of current income consistent with preservation of capital.
Managed Risk Growth Fund — To provide growth of capital while seeking to manage volatility and provide downside protection.
Managed Risk International Fund — To provide long-term growth of capital while seeking to manage volatility and provide downside protection.
Managed Risk Blue Chip Income and Growth Fund — To produce income exceeding the average yield on U.S. stocks generally and to provide an opportunity for growth of principal consistent with sound common stock investing, in each case while seeking to manage volatility and provide downside protection.
Managed Risk Growth-Income Fund — To achieve long-term growth of capital and income while seeking to manage volatility and provide downside protection.
Managed Risk Asset Allocation Fund — To provide high total return (including income and capital gains) consistent with preservation of capital over the long term while seeking to manage volatility and provide downside protection.
Each fund in the series, except the managed risk funds, offers either four or five share classes (Classes 1, 1A, 2, 3 or 4); the managed risk funds offer two share classes (Classes P1 and P2). Holders of all share classes of each fund have equal pro rata rights to assets, dividends and liquidation proceeds of each fund held. Each share class of each fund has identical voting rights, except for the exclusive right to vote on matters affecting only its class. Share classes have different fees and expenses (“class-specific fees and expenses”), primarily due to different arrangements for certain distribution expenses. Differences in class-specific fees and expenses will result in differences in net investment income and, therefore, the payment of different per-share dividends by each class of each fund.
2. Significant accounting policies
Each fund is an investment company that applies the accounting and reporting guidance issued in Topic 946 by the U.S. Financial Accounting Standards Board. Each fund’s financial statements have been prepared to comply with U.S. generally accepted accounting principles (“U.S. GAAP”). These principles require the series’ investment adviser to make estimates and assumptions that affect reported amounts and disclosures. Actual results could differ from those estimates. Subsequent events, if any, have been evaluated through the date of issuance in the preparation of the financial statements. The funds follow the significant accounting policies described in this section, as well as the valuation policies described in the next section on valuation.
Security transactions and related investment income — Security transactions are recorded by the funds as of the date the trades are executed with brokers. Realized gains and losses from security transactions are determined based on the specific identified cost of the securities. In the event a security is purchased with a delayed payment date, the funds will segregate liquid assets sufficient to meet their payment obligations. Dividend income is recognized on the ex-dividend date and interest income is recognized on an accrual basis. Market discounts, premiums and original issue discounts on fixed-income securities are amortized daily over the expected life of the security.
Fees and expenses — The fees and expenses of the underlying funds held by the managed risk funds are not included in the fees and expenses reported for each of the managed risk funds; however, they are indirectly reflected in the valuation of each of the underlying funds. These fees are included in the net effective expense ratios that are provided as additional information in the financial highlights tables.
| American Funds Insurance Series | 257 |
Table of Contents
Class allocations — Income, fees and expenses (other than class-specific fees and expenses), realized gains and losses and unrealized appreciation and depreciation are allocated daily among the various share classes of each fund based on their relative net assets. Class-specific fees and expenses, such as distribution expenses, are accrued daily and charged directly to the respective share class of each fund.
Distributions paid to shareholders — Income dividends and capital gain distributions are recorded on each fund’s ex-dividend date.
Currency translation — Assets and liabilities, including investment securities, denominated in currencies other than U.S. dollars are translated into U.S. dollars at the exchange rates supplied by one or more pricing vendors on the valuation date. Purchases and sales of investment securities and income and expenses are translated into U.S. dollars at the exchange rates on the dates of such transactions. The effects of changes in exchange rates on investment securities are included with the net realized gain or loss and net unrealized appreciation or depreciation on investments in the funds’ statements of operations. The realized gain or loss and unrealized appreciation or depreciation resulting from all other transactions denominated in currencies other than U.S. dollars are disclosed separately.
3. Valuation
CRMC, the series’ investment adviser, values the funds’ investments at fair value as defined by U.S. GAAP. The net asset value per share is calculated once daily as of the close of regular trading on the New York Stock Exchange, normally 4 p.m. New York time, each day the New York Stock Exchange is open.
Methods and inputs — The series’ investment adviser uses the following methods and inputs to establish the fair value of each fund’s assets and liabilities. Use of particular methods and inputs may vary over time based on availability and relevance as market and economic conditions evolve.
Equity securities are generally valued at the official closing price of, or the last reported sale price on, the exchange or market on which such securities are traded, as of the close of business on the day the securities are being valued or, lacking any sales, at the last available bid price. Prices for each security are taken from the principal exchange or market on which the security trades. The value of an underlying fund is based on its reported net asset value.
Fixed-income securities, including short-term securities, are generally valued at prices obtained from one or more pricing vendors. Vendors value such securities based on one or more of the inputs described in the following table. The table provides examples of inputs that are commonly relevant for valuing particular classes of fixed-income securities in which the funds are authorized to invest. However, these classifications are not exclusive and any of the inputs may be used to value any other class of fixed-income security.
Fixed-income class | Examples of standard inputs | |
| All | Benchmark yields, transactions, bids, offers, quotations from dealers and trading systems, new issues, spreads and other relationships observed in the markets among comparable securities; and proprietary pricing models such as yield measures calculated using factors such as cash flows, financial or collateral performance and other reference data (collectively referred to as “standard inputs”) | |
| Corporate bonds, notes & loans; convertible securities | Standard inputs and underlying equity of the issuer | |
| Bonds & notes of governments & government agencies | Standard inputs and interest rate volatilities | |
| Mortgage-backed; asset-backed obligations | Standard inputs and cash flows, prepayment information, default rates, delinquency and loss assumptions, collateral characteristics, credit enhancements and specific deal information | |
| Municipal securities | Standard inputs and, for certain distressed securities, cash flows or liquidation values using a net present value calculation based on inputs that include, but are not limited to, financial statements and debt contracts | |
When the series’ investment adviser deems it appropriate to do so (such as when vendor prices are unavailable or not deemed to be representative), fixed-income securities will be valued in good faith at the mean quoted bid and ask prices that are reasonably and timely available (or bid prices, if ask prices are not available) or at prices for securities of comparable maturity, quality and type.
| 258 | American Funds Insurance Series |
Table of Contents
Securities with both fixed-income and equity characteristics, or equity securities traded principally among fixed-income dealers, are generally valued in the manner described for either equity or fixed-income securities, depending on which method is deemed most appropriate by the series’ investment adviser. The Capital Group Central Cash Fund (“CCF”), a fund within the Capital Group Central Fund Series (“Central Funds“), is valued based upon a floating net asset value, which fluctuates with changes in the value of CCF’s portfolio securities. The underlying securities are valued based on the policies and procedures in CCF’s statement of additional information. The State Street Institutional U.S. Government Money Market Fund held by the managed risk funds is managed to maintain a $1.00 net asset value per share. The net asset value of each share class of each managed risk fund is calculated based on the reported net asset values of the underlying funds in which each fund invests.
Exchange-traded options and futures are generally valued at the official closing price for options and official settlement price for futures of the exchange or market on which such instruments are traded, as of the close of business on the day such instruments are being valued. Forward currency contracts are valued based on the spot and forward exchange rates obtained from one or more pricing vendors. Interest rate swaps and credit default swaps are generally valued by pricing vendors based on market inputs that include the index and term of index, reset frequency, payer/receiver, currency and pay frequency.
Securities and other assets for which representative market quotations are not readily available or are considered unreliable by the series’ investment adviser are fair valued as determined in good faith under fair value guidelines adopted by authority of the series’ board of trustees as further described. The investment adviser follows fair valuation guidelines, consistent with U.S. Securities and Exchange Commission rules and guidance, to consider relevant principles and factors when making fair value determinations. The investment adviser considers relevant indications of value that are reasonably and timely available to it in determining the fair value to be assigned to a particular security, such as the type and cost of the security; contractual or legal restrictions on resale of the security; relevant financial or business developments of the issuer; actively traded similar or related securities; conversion or exchange rights on the security; related corporate actions; significant events occurring after the close of trading in the security; and changes in overall market conditions. In addition, the closing prices of equity securities and futures that trade in markets outside U.S. time zones may be adjusted to reflect significant events that occur after the close of local trading but before the net asset value of each share class of each fund is determined. Fair valuations and valuations of investments and futures that are not actively trading involve judgment and may differ materially from valuations that would have been used had greater market activity occurred.
Processes and structure — The series’ board of trustees has delegated authority to the series’ investment adviser to make fair value determinations, subject to board oversight. The investment adviser has established a Joint Fair Valuation Committee (the “Fair Valuation Committee”) to administer, implement and oversee the fair valuation process, and to make fair value decisions. The Fair Valuation Committee regularly reviews its own fair value decisions, as well as decisions made under its standing instructions to the investment adviser’s valuation teams. The Fair Valuation Committee reviews changes in fair value measurements from period to period and may, as deemed appropriate, update the fair valuation guidelines to better reflect the results of back testing and address new or evolving issues. The Fair Valuation Committee reports any changes to the fair valuation guidelines to the board of trustees. The series’ board and audit committee also regularly review reports that describe fair value determinations and methods.
The series’ investment adviser has also established a Fixed-Income Pricing Review Group to administer and oversee the fixed-income valuation process, including the use of fixed-income pricing vendors. This group regularly reviews pricing vendor information and market data. Pricing decisions, processes and controls over security valuation are also subject to additional internal reviews, including an annual control self-evaluation program facilitated by the investment adviser’s compliance group.
Classifications — The series’ investment adviser classifies the funds’ assets and liabilities into three levels based on the inputs used to value the assets or liabilities. Level 1 values are based on quoted prices in active markets for identical securities. Level 2 values are based on significant observable market inputs, such as quoted prices for similar securities and quoted prices in inactive markets. Certain securities trading outside the U.S. may transfer between Level 1 and Level 2 due to valuation adjustments resulting from significant market movements following the close of local trading. Level 3 values are based on significant unobservable inputs that reflect the investment adviser’s determination of assumptions that market participants might reasonably use in valuing the securities.
| American Funds Insurance Series | 259 |
Table of Contents
The valuation levels are not necessarily an indication of the risk or liquidity associated with the underlying investment. For example, U.S. government securities are reflected as Level 2 because the inputs used to determine fair value may not always be quoted prices in an active market. The following tables present the funds’ valuation levels as of December 31, 2020 (dollars in thousands):
Global Growth Fund
| Investment securities | ||||||||||||||||
| Level 1 | Level 2 | Level 3 | Total | |||||||||||||
Assets: | ||||||||||||||||
Common stocks: | ||||||||||||||||
Information technology | $ | 1,529,558 | $ | 1,083,751 | $ | — | $ | 2,613,309 | ||||||||
Consumer discretionary | 888,809 | 797,513 | — | 1,686,322 | ||||||||||||
Health care | 703,000 | 232,172 | — | 935,172 | ||||||||||||
Financials | 360,183 | 447,703 | — | 807,886 | ||||||||||||
Communication services | 448,473 | 148,180 | — | 596,653 | ||||||||||||
Consumer staples | 232,624 | 267,945 | — | 500,569 | ||||||||||||
Industrials | 24,589 | 264,798 | — | 289,387 | ||||||||||||
Materials | 113,103 | 38,439 | — | 151,542 | ||||||||||||
Energy | — | 90,882 | — | 90,882 | ||||||||||||
Real estate | — | 33,356 | — | 33,356 | ||||||||||||
Utilities | — | 18,663 | — | 18,663 | ||||||||||||
Preferred securities | — | 238,600 | — | 238,600 | ||||||||||||
Short-term securities | 143,970 | 174,987 | — | 318,957 | ||||||||||||
|
|
|
|
|
|
|
| |||||||||
Total | $ | 4,444,309 | $ | 3,836,989 | $ | — | $ | 8,281,298 | ||||||||
|
|
|
|
|
|
|
| |||||||||
Global Small Capitalization Fund
| Investment securities | ||||||||||||||||
| Level 1 | Level 2 | Level 3 | Total | |||||||||||||
Assets: | ||||||||||||||||
Common stocks: | ||||||||||||||||
Information technology | $ | 869,090 | $ | 566,908 | $ | — | $ | 1,435,998 | ||||||||
Health care | 901,274 | 317,375 | 3 | 1,218,652 | ||||||||||||
Consumer discretionary | 449,210 | 327,676 | 2,409 | 779,295 | ||||||||||||
Industrials | 171,236 | 530,019 | — | 701,255 | ||||||||||||
Financials | 298,192 | 98,457 | — | 396,649 | ||||||||||||
Materials | 31,914 | 91,606 | — | 123,520 | ||||||||||||
Real estate | 72,261 | 37,896 | — | 110,157 | ||||||||||||
Communication services | 34,538 | 71,794 | — | 106,332 | ||||||||||||
Consumer staples | 79,614 | 19,249 | — | 98,863 | ||||||||||||
Utilities | 5,859 | 59,096 | — | 64,955 | ||||||||||||
Energy | 13,972 | — | 10,434 | 24,406 | ||||||||||||
Preferred securities | 19,092 | — | 77,191 | 96,283 | ||||||||||||
Rights & warrants | — | 1,580 | — | 1,580 | ||||||||||||
Convertible stocks | — | — | 13,854 | 13,854 | ||||||||||||
Short-term securities | 86,874 | 136,990 | — | 223,864 | ||||||||||||
|
|
|
|
|
|
|
| |||||||||
Total | $ | 3,033,126 | $ | 2,258,646 | $ | 103,891 | $ | 5,395,663 | ||||||||
|
|
|
|
|
|
|
| |||||||||
The following table reconciles the valuation of the fund’s Level 3 investment securities and related transactions for the year ended December 31, 2020 (dollars in thousands):
| Beginning value at 1/1/2020 | Transfers into Level 3* | Purchases | Sales | Net realized loss† | Unrealized appreciation† | Transfers out of Level 3* | Ending value at 12/31/2020 | |||||||||||||||||||||||||
Investment securities | $ | 44,058 | $ | 914 | $ | 52,617 | $ | (10,017 | ) | $ | (4,877 | ) | $ | 21,196 | $ | — | $ | 103,891 | ||||||||||||||
Net unrealized appreciation during the period on Level 3 investment securities held at December 31, 2020 |
| $ | 21,196 | |||||||||||||||||||||||||||||
| * | Transfers into or out of Level 3 are based on the beginning market value of the quarter in which they occurred. These transfers are the result of changes in the availability of pricing sources and/or in the observability of significant inputs used in valuing the securities. |
| † | Net realized loss and unrealized appreciation are included in the related amounts on investments in the statement of operations. |
| 260 | American Funds Insurance Series |
Table of Contents
Unobservable inputs — Valuation of the fund’s Level 3 securities is based on significant unobservable inputs that reflect the investment adviser’s determination of assumptions that market participants might reasonably use in valuing the securities. The following table provides additional information used by the fund’s investment adviser to fair value the fund’s Level 3 securities (dollars in thousands):
| Value at 12/31/2020 | Valuation techniques | Unobservable inputs | Range | Weighted | Impact to | |||||||||
Common stocks | $ | 12,846 |
| Liquidation value | N/A | N/A | N/A | N/A | ||||||
Market comparable companies | Price/Cash flow multiple | 8.8x | 8.8x | Increase | ||||||||||
| DLOM | 25% | 25% | Decrease | |||||||||||
$ per one billion Btu | $2.25 | $2.25 | Increase | |||||||||||
MMTPA | 10 MMTPA | 10 MMTPA | Increase | |||||||||||
Transaction price | N/A | N/A | N/A | N/A | ||||||||||
Preferred securities | 77,191 | Transaction price | N/A | N/A | N/A | N/A | ||||||||
Convertible stocks | 13,854 | Transaction price | N/A | N/A | N/A | N/A | ||||||||
|
| |||||||||||||
| $ | 103,891 | |||||||||||||
|
| |||||||||||||
| * | Weighted average is by relative fair value. |
| † | This column represents the directional change in fair value of the Level 3 securities that would result in an increase from the corresponding input. A decrease to the unobservable input would have the opposite effect. Significant increases and decreases in these inputs in isolation could result in significantly higher or lower fair value measurements. |
Key to abbreviations
Btu = British thermal unit
DLOM = Discount for lack of marketability
MMTPA = Million metric tonnes per annum
Growth Fund
| Investment securities | ||||||||||||||||
| Level 1 | Level 2 | Level 3 | Total | |||||||||||||
Assets: | ||||||||||||||||
Common stocks: | ||||||||||||||||
Information technology | $ | 7,806,427 | $ | 988,629 | $ | — | $ | 8,795,056 | ||||||||
Consumer discretionary | 6,912,136 | 416,283 | — | 7,328,419 | ||||||||||||
Communication services | 7,012,728 | — | — | 7,012,728 | ||||||||||||
Health care | 4,816,461 | 77,537 | 59,453 | 4,953,451 | ||||||||||||
Industrials | 2,820,844 | 464,847 | — | 3,285,691 | ||||||||||||
Financials | 2,051,508 | 62,053 | — | 2,113,561 | ||||||||||||
Consumer staples | 1,046,415 | 205,883 | — | 1,252,298 | ||||||||||||
Materials | 1,167,722 | 33,980 | — | 1,201,702 | ||||||||||||
Energy | 644,723 | — | — | 644,723 | ||||||||||||
Real estate | 369,502 | — | — | 369,502 | ||||||||||||
Utilities | 190,565 | 25,624 | — | 216,189 | ||||||||||||
Preferred securities | — | 44,452 | — | 44,452 | ||||||||||||
Convertible bonds & notes | — | — | 29,464 | 29,464 | ||||||||||||
Short-term securities | 1,630,494 | — | — | 1,630,494 | ||||||||||||
|
|
|
|
|
|
|
| |||||||||
Total | $ | 36,469,525 | $ | 2,319,288 | $ | 88,917 | $ | 38,877,730 | ||||||||
|
|
|
|
|
|
|
| |||||||||
| American Funds Insurance Series | 261 |
Table of Contents
International Fund
| Investment securities | ||||||||||||||||
| Level 1 | Level 2 | Level 3 | Total | |||||||||||||
Assets: | ||||||||||||||||
Common stocks: | ||||||||||||||||
Financials | $ | 160,866 | $ | 1,645,671 | $ | — | $ | 1,806,537 | ||||||||
Consumer discretionary | 421,417 | 1,154,375 | — | 1,575,792 | ||||||||||||
Health care | 131,197 | 1,414,294 | 6 | 1,545,497 | ||||||||||||
Industrials | 95,045 | 1,127,312 | — | 1,222,357 | ||||||||||||
Information technology | 358,778 | 504,666 | — | 863,444 | ||||||||||||
Communication services | 98,771 | 715,574 | — | 814,345 | ||||||||||||
Energy | 98,446 | 562,531 | — | 660,977 | ||||||||||||
Materials | 375,154 | 181,706 | — | 556,860 | ||||||||||||
Consumer staples | 8,249 | 449,366 | — | 457,615 | ||||||||||||
Utilities | — | 347,713 | — | 347,713 | ||||||||||||
Real estate | — | 83,229 | — | 83,229 | ||||||||||||
Preferred securities | 70,086 | 56,376 | — | 126,462 | ||||||||||||
Rights & warrants | 236 | 41,615 | — | 41,851 | ||||||||||||
Convertible bonds & notes | — | 1,260 | — | 1,260 | ||||||||||||
Bonds, notes & other debt instruments | — | 17,814 | — | 17,814 | ||||||||||||
Short-term securities | 537,819 | — | — | 537,819 | ||||||||||||
|
|
|
|
|
|
|
| |||||||||
Total | $ | 2,356,064 | $ | 8,303,502 | $ | 6 | $ | 10,659,572 | ||||||||
|
|
|
|
|
|
|
| |||||||||
| Other investments* | ||||||||||||||||
| Level 1 | Level 2 | Level 3 | Total | |||||||||||||
Assets: | ||||||||||||||||
Unrealized appreciation on open forward currency contracts | $ | — | $ | 309 | $ | — | $ | 309 | ||||||||
Liabilities: | ||||||||||||||||
Unrealized depreciation on open forward currency contracts | — | (395 | ) | — | (395 | ) | ||||||||||
|
|
|
|
|
|
|
| |||||||||
Total | $ | — | $ | (86 | ) | $ | — | $ | (86 | ) | ||||||
|
|
|
|
|
|
|
| |||||||||
| * | Forward currency contracts are not included in the investment portfolio. |
New World Fund
| Investment securities | ||||||||||||||||
| Level 1 | Level 2 | Level 3 | Total | |||||||||||||
Assets: | ||||||||||||||||
Common stocks: | ||||||||||||||||
Information technology | $ | 540,290 | $ | 265,260 | $ | — | $ | 805,550 | ||||||||
Consumer discretionary | 184,433 | 426,480 | — | 610,913 | ||||||||||||
Health care | 220,288 | 303,860 | 1 | 524,149 | ||||||||||||
Financials | 98,824 | 367,872 | — | 466,696 | ||||||||||||
Communication services | 242,323 | 108,859 | — | 351,182 | ||||||||||||
Materials | 126,066 | 126,416 | — | 252,482 | ||||||||||||
Industrials | 57,626 | 193,144 | — | 250,770 | ||||||||||||
Consumer staples | 32,600 | 209,655 | — | 242,255 | ||||||||||||
Energy | 55,068 | 104,845 | — | 159,913 | ||||||||||||
Real estate | 21,814 | 49,427 | — | 71,241 | ||||||||||||
Utilities | 8,127 | 61,070 | — | 69,197 | ||||||||||||
Preferred securities | 31,214 | 17,203 | — | * | 48,417 | |||||||||||
Rights & warrants | 37 | 11,204 | — | 11,241 | ||||||||||||
Convertible bonds & notes | — | 120 | — | 120 | ||||||||||||
Bonds, notes & other debt instruments | — | 120,130 | — | 120,130 | ||||||||||||
Short-term securities | 238,517 | — | — | 238,517 | ||||||||||||
|
|
|
|
|
|
|
| |||||||||
Total | $ | 1,857,227 | $ | 2,365,545 | $ | 1 | $ | 4,222,773 | ||||||||
|
|
|
|
|
|
|
| |||||||||
| 262 | American Funds Insurance Series |
Table of Contents
| Other investments† | ||||||||||||||||
| Level 1 | Level 2 | Level 3 | Total | |||||||||||||
Assets: | ||||||||||||||||
Unrealized appreciation on futures contracts | $ | 3 | $ | — | $ | — | $ | 3 | ||||||||
Liabilities: | ||||||||||||||||
Unrealized depreciation on futures contracts | (13 | ) | — | — | (13 | ) | ||||||||||
Unrealized depreciation on open forward currency contracts | — | (54 | ) | — | (54 | ) | ||||||||||
|
|
|
|
|
|
|
| |||||||||
Total | $ | (10 | ) | $ | (54 | ) | $ | — | $ | (64 | ) | |||||
|
|
|
|
|
|
|
| |||||||||
| * | Amount less than one thousand. |
| † | Futures contracts and forward currency contracts are not included in the investment portfolio. |
Blue Chip Income and Growth Fund
| Investment securities | ||||||||||||||||
| Level 1 | Level 2 | Level 3 | Total | |||||||||||||
Assets: | ||||||||||||||||
Common stocks: | ||||||||||||||||
Health care | $ | 1,660,102 | $ | — | $ | — | $ | 1,660,102 | ||||||||
Information technology | 1,639,123 | — | — | 1,639,123 | ||||||||||||
Industrials | 1,299,142 | — | — | 1,299,142 | ||||||||||||
Communication services | 907,314 | — | — | 907,314 | ||||||||||||
Energy | 866,464 | — | — | 866,464 | ||||||||||||
Consumer staples | 782,008 | — | — | 782,008 | ||||||||||||
Consumer discretionary | 730,730 | — | — | 730,730 | ||||||||||||
Financials | 668,246 | — | — | 668,246 | ||||||||||||
Utilities | 327,959 | — | — | 327,959 | ||||||||||||
Materials | 246,839 | — | — | 246,839 | ||||||||||||
Real estate | 167,648 | — | — | 167,648 | ||||||||||||
Rights & warrants | 138 | — | — | 138 | ||||||||||||
Convertible stocks | 85,580 | — | — | 85,580 | ||||||||||||
Convertible bonds & notes | — | 13,651 | — | 13,651 | ||||||||||||
Short-term securities | 181,762 | — | — | 181,762 | ||||||||||||
|
|
|
|
|
|
|
| |||||||||
Total | $ | 9,563,055 | $ | 13,651 | $ | — | $ | 9,576,706 | ||||||||
|
|
|
|
|
|
|
| |||||||||
Global Growth and Income Fund
| Investment securities | ||||||||||||||||
| Level 1 | Level 2 | Level 3 | Total | |||||||||||||
Assets: | ||||||||||||||||
Common stocks: | ||||||||||||||||
Information technology | $ | 221,121 | $ | 181,276 | $ | — | $ | 402,397 | ||||||||
Financials | 141,374 | 202,553 | — | 343,927 | ||||||||||||
Industrials | 126,976 | 119,227 | — | 246,203 | ||||||||||||
Health care | 128,044 | 70,127 | — | 198,171 | ||||||||||||
Consumer discretionary | 85,765 | 111,886 | — | 197,651 | ||||||||||||
Communication services | 145,542 | 20,262 | — | 165,804 | ||||||||||||
Utilities | 27,113 | 104,117 | — | 131,230 | ||||||||||||
Materials | 42,123 | 83,017 | — | 125,140 | ||||||||||||
Energy | 39,179 | 61,420 | — | 100,599 | ||||||||||||
Consumer staples | 32,426 | 64,723 | — | 97,149 | ||||||||||||
Real estate | 28,798 | 25,958 | — | 54,756 | ||||||||||||
Bonds, notes & other debt instruments | — | 34,378 | — | 34,378 | ||||||||||||
Short-term securities | 72,929 | — | — | 72,929 | ||||||||||||
|
|
|
|
|
|
|
| |||||||||
Total | $ | 1,091,390 | $ | 1,078,944 | $ | — | $ | 2,170,334 | ||||||||
|
|
|
|
|
|
|
| |||||||||
| American Funds Insurance Series | 263 |
Table of Contents
Growth-Income Fund
| Investment securities | ||||||||||||||||
| Level 1 | Level 2 | Level 3 | Total | |||||||||||||
Assets: | ||||||||||||||||
Common stocks: | ||||||||||||||||
Information technology | $ | 7,314,726 | $ | 372,663 | $ | — | $ | 7,687,389 | ||||||||
Communication services | 5,831,851 | 127,572 | — | 5,959,423 | ||||||||||||
Health care | 4,693,629 | 779,632 | — | 5,473,261 | ||||||||||||
Financials | 3,867,153 | 71,057 | — | 3,938,210 | ||||||||||||
Industrials | 3,235,391 | 420,599 | — | 3,655,990 | ||||||||||||
Consumer discretionary | 2,997,262 | 125,349 | — | 3,122,611 | ||||||||||||
Consumer staples | 1,207,072 | 739,995 | — | 1,947,067 | ||||||||||||
Materials | 1,780,708 | 100,975 | — | 1,881,683 | ||||||||||||
Energy | 1,316,148 | 1,473 | — | 1,317,621 | ||||||||||||
Utilities | 900,859 | 210,300 | — | 1,111,159 | ||||||||||||
Real estate | 983,845 | — | — | 983,845 | ||||||||||||
Convertible stocks | 311,050 | — | — | 311,050 | ||||||||||||
Bonds, notes & other debt instruments | — | 44,819 | — | 44,819 | ||||||||||||
Short-term securities | 1,180,227 | — | — | 1,180,227 | ||||||||||||
|
|
|
|
|
|
|
| |||||||||
Total | $ | 35,619,921 | $ | 2,994,434 | $ | — | $ | 38,614,355 | ||||||||
|
|
|
|
|
|
|
| |||||||||
International Growth and Income Fund
| Investment securities | ||||||||||||||||
| Level 1 | Level 2 | Level 3 | Total | |||||||||||||
Assets: | ||||||||||||||||
Common stocks: | ||||||||||||||||
Financials | $ | 21,452 | $ | 238,557 | $ | — | $ | 260,009 | ||||||||
Industrials | 19,686 | 168,699 | — | 188,385 | ||||||||||||
Communication services | 38,634 | 137,544 | — | 176,178 | ||||||||||||
Consumer discretionary | — | 173,323 | — | 173,323 | ||||||||||||
Health care | 6,388 | 133,573 | 4 | 139,965 | ||||||||||||
Materials | 49,909 | 51,472 | — | 101,381 | ||||||||||||
Consumer staples | 11,591 | 86,293 | — | 97,884 | ||||||||||||
Information technology | 20,812 | 57,262 | — | 78,074 | ||||||||||||
Utilities | — | 75,755 | — | 75,755 | ||||||||||||
Energy | 14,453 | 26,884 | — | 41,337 | ||||||||||||
Real estate | — | 38,742 | — | 38,742 | ||||||||||||
Preferred securities | 24,328 | — | — | 24,328 | ||||||||||||
Rights & warrants | — | 15,297 | — | 15,297 | ||||||||||||
Bonds, notes & other debt instruments | — | 8,880 | — | 8,880 | ||||||||||||
Short-term securities | 38,140 | — | — | 38,140 | ||||||||||||
|
|
|
|
|
|
|
| |||||||||
Total | $ | 245,393 | $ | 1,212,281 | $ | 4 | $ | 1,457,678 | ||||||||
|
|
|
|
|
|
|
| |||||||||
| 264 | American Funds Insurance Series |
Table of Contents
Capital Income Builder
| Investment securities | ||||||||||||||||
| Level 1 | Level 2 | Level 3 | Total | |||||||||||||
Assets: | ||||||||||||||||
Common stocks: | ||||||||||||||||
Financials | $ | 82,959 | $ | 60,554 | $ | — | $ | 143,513 | ||||||||
Information technology | 78,576 | 21,313 | — | 99,889 | ||||||||||||
Consumer staples | 53,173 | 45,939 | — | 99,112 | ||||||||||||
Health care | 64,546 | 33,275 | — | 97,821 | ||||||||||||
Utilities | 35,050 | 55,511 | — | 90,561 | ||||||||||||
Real estate | 43,561 | 18,295 | — | 61,856 | ||||||||||||
Communication services | 29,639 | 26,431 | — | 56,070 | ||||||||||||
Energy | 40,675 | 9,228 | — | 49,903 | ||||||||||||
Industrials | 26,773 | 20,099 | — | 46,872 | ||||||||||||
Materials | 19,808 | 22,725 | — | 42,533 | ||||||||||||
Consumer discretionary | 6,747 | 6,761 | — | 13,508 | ||||||||||||
Preferred securities | — | 1,987 | — | 1,987 | ||||||||||||
Rights & warrants | 2 | — | — | 2 | ||||||||||||
Convertible stocks | 13,837 | — | — | 13,837 | ||||||||||||
Convertible bonds & notes | — | 784 | — | 784 | ||||||||||||
Bonds, notes & other debt instruments: | ||||||||||||||||
U.S. Treasury bonds & notes | — | 100,873 | — | 100,873 | ||||||||||||
Corporate bonds, notes & loans | — | 65,564 | — | 65,564 | ||||||||||||
Mortgage-backed obligations | — | 55,671 | — | 55,671 | ||||||||||||
Asset-backed obligations | — | 3,801 | — | 3,801 | ||||||||||||
Bonds & notes of governments & government agencies outside the U.S. | — | 1,465 | — | 1,465 | ||||||||||||
Municipals | — | 671 | — | 671 | ||||||||||||
Short-term securities | 57,947 | — | — | 57,947 | ||||||||||||
|
|
|
|
|
|
|
| |||||||||
Total | $ | 553,293 | $ | 550,947 | $ | — | $ | 1,104,240 | ||||||||
|
|
|
|
|
|
|
| |||||||||
| Other investments* | ||||||||||||||||
| Level 1 | Level 2 | Level 3 | Total | |||||||||||||
Assets: | ||||||||||||||||
Unrealized appreciation on futures contracts | $ | 39 | $ | — | $ | — | $ | 39 | ||||||||
Unrealized appreciation on open forward currency contracts | — | 34 | — | 34 | ||||||||||||
Unrealized appreciation on interest rate swaps | — | 569 | — | 569 | ||||||||||||
Unrealized appreciation on credit default swaps | — | 152 | — | 152 | ||||||||||||
Liabilities: | ||||||||||||||||
Unrealized depreciation on futures contracts | (89 | ) | — | — | (89 | ) | ||||||||||
Unrealized depreciation on open forward currency contracts | — | (56 | ) | — | (56 | ) | ||||||||||
|
|
|
|
|
|
|
| |||||||||
Total | $ | (50 | ) | $ | 699 | $ | — | $ | 649 | |||||||
|
|
|
|
|
|
|
| |||||||||
| * | Futures contracts, forward currency contracts, interest rate swaps and credit default swaps are not included in the investment portfolio. |
| American Funds Insurance Series | 265 |
Table of Contents
Asset Allocation Fund
| Investment securities | ||||||||||||||||
| Level 1 | Level 2 | Level 3 | Total | |||||||||||||
Assets: | ||||||||||||||||
Common stocks: | ||||||||||||||||
Information technology | $ | 4,856,907 | $ | 33,828 | $ | — | $ | 4,890,735 | ||||||||
Health care | 3,027,835 | 132,799 | 13,074 | 3,173,708 | ||||||||||||
Financials | 2,855,589 | 215,356 | 482 | 3,071,427 | ||||||||||||
Consumer discretionary | 1,813,842 | 160,516 | — | 1,974,358 | ||||||||||||
Consumer staples | 1,182,011 | 393,999 | — | 1,576,010 | ||||||||||||
Communication services | 1,415,480 | 70,510 | — | 1,485,990 | ||||||||||||
Industrials | 1,133,507 | 126,186 | 10,677 | 1,270,370 | ||||||||||||
Materials | 842,103 | 93,530 | — | 935,633 | ||||||||||||
Energy | 430,949 | 21,035 | 843 | 452,827 | ||||||||||||
Real estate | 380,620 | — | — | 380,620 | ||||||||||||
Utilities | 54,107 | 242,361 | — | 296,468 | ||||||||||||
Rights & warrants | — | — | — | * | — | * | ||||||||||
Convertible stocks | 102,652 | 45,378 | — | 148,030 | ||||||||||||
Bonds, notes & other debt instruments: | ||||||||||||||||
Corporate bonds, notes & loans | — | 3,849,701 | 4,079 | 3,853,780 | ||||||||||||
U.S. Treasury bonds & notes | — | 2,511,880 | — | 2,511,880 | ||||||||||||
Mortgage-backed obligations | — | 2,198,957 | — | 2,198,957 | ||||||||||||
Asset-backed obligations | — | 235,287 | — | 235,287 | ||||||||||||
Bonds & notes of governments & government agencies outside the U.S. | — | 60,892 | — | 60,892 | ||||||||||||
Federal agency bonds & notes | — | 37,568 | — | 37,568 | ||||||||||||
Municipals | — | 33,381 | — | 33,381 | ||||||||||||
Short-term securities | 2,286,334 | — | — | 2,286,334 | ||||||||||||
|
|
|
|
|
|
|
| |||||||||
Total | $ | 20,381,936 | $ | 10,463,164 | $ | 29,155 | $ | 30,874,255 | ||||||||
|
|
|
|
|
|
|
| |||||||||
| Other investments† | ||||||||||||||||
| Level 1 | Level 2 | Level 3 | Total | |||||||||||||
Assets: | ||||||||||||||||
Unrealized appreciation on futures contracts | $ | 1,610 | $ | — | $ | — | $ | 1,610 | ||||||||
Unrealized appreciation on interest rate swaps | — | 796 | — | 796 | ||||||||||||
Unrealized appreciation on credit default swaps | — | — | * | — | — | * | ||||||||||
Liabilities: | ||||||||||||||||
Unrealized depreciation on futures contracts | (2,382 | ) | — | — | (2,382 | ) | ||||||||||
|
|
|
|
|
|
|
| |||||||||
Total | $ | (772 | ) | $ | 796 | $ | — | $ | 24 | |||||||
|
|
|
|
|
|
|
| |||||||||
| * | Amount less than one thousand. |
| † | Futures contracts, interest rate swaps and credit default swaps are not included in the investment portfolio. |
| 266 | American Funds Insurance Series |
Table of Contents
Global Balanced Fund
| Investment securities | ||||||||||||||||
| Level 1 | Level 2 | Level 3 | Total | |||||||||||||
Assets: | ||||||||||||||||
Common stocks: | ||||||||||||||||
Information technology | $ | 31,289 | $ | 35,492 | $ | — | $ | 66,781 | ||||||||
Health care | 23,553 | 16,623 | — | 40,176 | ||||||||||||
Financials | 17,316 | 15,833 | — | 33,149 | ||||||||||||
Consumer staples | 14,677 | 14,073 | — | 28,750 | ||||||||||||
Consumer discretionary | 12,713 | 11,275 | — | 23,988 | ||||||||||||
Industrials | 9,037 | 13,659 | — | 22,696 | ||||||||||||
Communication services | 6,435 | 6,573 | — | 13,008 | ||||||||||||
Materials | 3,927 | 9,077 | — | 13,004 | ||||||||||||
Real estate | 8,992 | 3,272 | — | 12,264 | ||||||||||||
Energy | 5,708 | — | — | 5,708 | ||||||||||||
Utilities | 852 | 3,696 | — | 4,548 | ||||||||||||
Preferred securities | — | 2,055 | — | 2,055 | ||||||||||||
Bonds, notes & other debt instruments: | ||||||||||||||||
Bonds & notes of governments & government agencies outside the U.S. | — | 67,135 | — | 67,135 | ||||||||||||
U.S. Treasury bonds & notes | — | 49,388 | — | 49,388 | ||||||||||||
Corporate bonds, notes & loans | — | 21,861 | — | 21,861 | ||||||||||||
Mortgage-backed obligations | — | 6,454 | — | 6,454 | ||||||||||||
Municipals | — | 186 | — | 186 | ||||||||||||
Asset-backed obligations | — | 95 | — | 95 | ||||||||||||
Short-term securities | 24,329 | 17,999 | — | 42,328 | ||||||||||||
|
|
|
|
|
|
|
| |||||||||
Total | $ | 158,828 | $ | 294,746 | $ | — | $ | 453,574 | ||||||||
|
|
|
|
|
|
|
| |||||||||
| Other investments* | ||||||||||||||||
| Level 1 | Level 2 | Level 3 | Total | |||||||||||||
Assets: | ||||||||||||||||
Unrealized appreciation on futures contracts | $ | 3 | $ | — | $ | — | $ | 3 | ||||||||
Unrealized appreciation on open forward currency contracts | — | 257 | — | 257 | ||||||||||||
Unrealized appreciation on interest rate swaps | — | 21 | — | 21 | ||||||||||||
Liabilities: | ||||||||||||||||
Unrealized depreciation on open forward currency contracts | — | (259 | ) | — | (259 | ) | ||||||||||
Unrealized depreciation on credit default swaps | — | — | † | — | — | † | ||||||||||
|
|
|
|
|
|
|
| |||||||||
Total | $ | 3 | $ | 19 | $ | — | $ | 22 | ||||||||
|
|
|
|
|
|
|
| |||||||||
| * | Futures contracts, forward currency contracts, interest rate swaps and credit default swaps are not included in the investment portfolio. |
| † | Amount less than one thousand. |
Bond Fund
| Investment securities | ||||||||||||||||
| Level 1 | Level 2 | Level 3 | Total | |||||||||||||
Assets: | ||||||||||||||||
Bonds, notes & other debt instruments: | ||||||||||||||||
Corporate bonds, notes & loans | $ | — | $ | 3,792,833 | $ | — | $ | 3,792,833 | ||||||||
Mortgage-backed obligations | — | 3,617,725 | — | 3,617,725 | ||||||||||||
U.S. Treasury bonds & notes | — | 2,783,804 | — | 2,783,804 | ||||||||||||
Bonds & notes of governments & government agencies outside the U.S. | — | 348,736 | — | 348,736 | ||||||||||||
Asset-backed obligations | — | 249,668 | — | 249,668 | ||||||||||||
Municipals | — | 226,267 | — | 226,267 | ||||||||||||
Federal agency bonds & notes | — | 12,979 | — | 12,979 | ||||||||||||
Short-term securities | 2,690,045 | — | — | 2,690,045 | ||||||||||||
|
|
|
|
|
|
|
| |||||||||
Total | $ | 2,690,045 | $ | 11,032,012 | $ | — | $ | 13,722,057 | ||||||||
|
|
|
|
|
|
|
| |||||||||
| American Funds Insurance Series | 267 |
Table of Contents
| Other investments* | ||||||||||||||||
| Level 1 | Level 2 | Level 3 | Total | |||||||||||||
Assets: | ||||||||||||||||
Unrealized appreciation on futures contracts | $ | 7,631 | $ | — | $ | — | $ | 7,631 | ||||||||
Unrealized appreciation on open forward currency contracts | — | 46 | — | 46 | ||||||||||||
Unrealized appreciation on interest rate swaps | — | 3,456 | — | 3,456 | ||||||||||||
Liabilities: | ||||||||||||||||
Unrealized depreciation on futures contracts | (824 | ) | — | — | (824 | ) | ||||||||||
Unrealized depreciation on open forward currency contracts | — | (2,653 | ) | — | (2,653 | ) | ||||||||||
Unrealized depreciation on interest rate swaps | — | (28,517 | ) | — | (28,517 | ) | ||||||||||
|
|
|
|
|
|
|
| |||||||||
Total | $ | 6,807 | $ | (27,668 | ) | $ | — | $ | (20,861 | ) | ||||||
|
|
|
|
|
|
|
| |||||||||
| * | Futures contracts, forward currency contracts and interest rate swaps are not included in the investment portfolio. |
Capital World Bond Fund
| Investment securities | ||||||||||||||||
| Level 1 | Level 2 | Level 3 | Total | |||||||||||||
Assets: | ||||||||||||||||
Bonds, notes & other debt instruments: | ||||||||||||||||
Euros | $ | — | $ | 402,906 | $ | — | $ | 402,906 | ||||||||
Japanese yen | — | 217,032 | — | 217,032 | ||||||||||||
Chinese yuan renminbi | — | 141,006 | — | 141,006 | ||||||||||||
British pounds | — | 91,115 | — | 91,115 | ||||||||||||
Danish kroner | — | 59,710 | — | 59,710 | ||||||||||||
Canadian dollars | — | 48,258 | — | 48,258 | ||||||||||||
Mexican pesos | — | 46,716 | — | 46,716 | ||||||||||||
Malaysian ringgits | — | 41,973 | — | 41,973 | ||||||||||||
Australian dollars | — | 31,305 | — | 31,305 | ||||||||||||
Russian rubles | — | 27,059 | — | 27,059 | ||||||||||||
Israeli shekels | — | 25,426 | — | 25,426 | ||||||||||||
South Korean won | — | 20,892 | — | 20,892 | ||||||||||||
Indonesian rupiah | — | 15,694 | — | 15,694 | ||||||||||||
Colombian pesos | — | 15,007 | — | 15,007 | ||||||||||||
Brazilian reais | — | 11,023 | — | 11,023 | ||||||||||||
New Zealand dollars | — | 9,638 | — | 9,638 | ||||||||||||
Thai baht | — | 9,308 | — | 9,308 | ||||||||||||
Chilean pesos | — | 8,404 | — | 8,404 | ||||||||||||
South African rand | — | 7,886 | — | 7,886 | ||||||||||||
Ukrainian hryvnia | — | 7,322 | — | 7,322 | ||||||||||||
Singapore dollars | — | 6,354 | — | 6,354 | ||||||||||||
Norwegian kroner | — | 5,980 | — | 5,980 | ||||||||||||
Peruvian nuevos soles | — | 5,639 | — | 5,639 | ||||||||||||
Indian rupees | — | 3,829 | — | 3,829 | ||||||||||||
Dominican pesos | — | 2,938 | — | 2,938 | ||||||||||||
Polish zloty | — | 1,500 | — | 1,500 | ||||||||||||
Romanian leu | — | 1,361 | — | 1,361 | ||||||||||||
U.S. dollars | — | 924,718 | — | 924,718 | ||||||||||||
Common stocks | 574 | — | 1,319 | 1,893 | ||||||||||||
Rights & warrants | — | — | — | * | — | * | ||||||||||
Short-term securities | 147,017 | 3,665 | — | 150,682 | ||||||||||||
|
|
|
|
|
|
|
| |||||||||
Total | $ | 147,591 | $ | 2,193,664 | $ | 1,319 | $ | 2,342,574 | ||||||||
|
|
|
|
|
|
|
| |||||||||
| 268 | American Funds Insurance Series |
Table of Contents
| Other investments† | ||||||||||||||||
| Level 1 | Level 2 | Level 3 | Total | |||||||||||||
Assets: | ||||||||||||||||
Unrealized appreciation on futures contracts | $ | 308 | $ | — | $ | — | $ | 308 | ||||||||
Unrealized appreciation on open forward currency contracts | — | 4,155 | — | 4,155 | ||||||||||||
Unrealized appreciation on credit default swaps | — | 31 | — | 31 | ||||||||||||
Liabilities: | ||||||||||||||||
Unrealized depreciation on futures contracts | (155 | ) | — | — | (155 | ) | ||||||||||
Unrealized depreciation on open forward currency contracts | — | (3,799 | ) | — | (3,799 | ) | ||||||||||
Unrealized depreciation on interest rate swaps | — | (64 | ) | — | (64 | ) | ||||||||||
Unrealized depreciation on credit default swaps | — | (698 | ) | — | (698 | ) | ||||||||||
|
|
|
|
|
|
|
| |||||||||
Total | $ | 153 | $ | (375 | ) | $ | — | $ | (222 | ) | ||||||
|
|
|
|
|
|
|
| |||||||||
| * | Amount less than one thousand. |
| † | Futures contracts, forward currency contracts, interest rate swaps and credit default swaps are not included in the investment portfolio. |
High-Income Bond Fund
| Investment securities | ||||||||||||||||
| Level 1 | Level 2 | Level 3 | Total | |||||||||||||
Assets: | ||||||||||||||||
Bonds, notes & other debt instruments: | ||||||||||||||||
Corporate bonds, notes & loans | $ | — | $ | 770,665 | $ | 4,354 | $ | 775,019 | ||||||||
Asset-backed obligations | — | 97 | — | 97 | ||||||||||||
Municipals | — | 5 | — | 5 | ||||||||||||
Convertible bonds & notes | — | 5,210 | 65 | 5,275 | ||||||||||||
Convertible stocks | 2,844 | 494 | — | 3,338 | ||||||||||||
Preferred securities | — | 2,841 | — | 2,841 | ||||||||||||
Common stocks | 8,366 | 2,591 | 24,364 | 35,321 | ||||||||||||
Rights & warrants | — | 76 | — | 1 | 76 | |||||||||||
Short-term securities | 33,493 | — | — | 33,493 | ||||||||||||
|
|
|
|
|
|
|
| |||||||||
Total | $ | 44,703 | $ | 781,979 | $ | 28,783 | $ | 855,465 | ||||||||
|
|
|
|
|
|
|
| |||||||||
| Other investments2 |
| ||||||||||||||
| Level 1 | Level 2 | Level 3 | Total | |||||||||||||
Assets: | ||||||||||||||||
Unrealized appreciation on futures contracts | $ | 8 | $ | — | $ | — | $ | 8 | ||||||||
Unrealized appreciation on credit default swaps | — | 7 | — | 7 | ||||||||||||
Liabilities: | ||||||||||||||||
Unrealized depreciation on futures contracts | (27 | ) | — | — | (27 | ) | ||||||||||
Unrealized depreciation on credit default swaps | — | (728 | ) | — | (728 | ) | ||||||||||
|
|
|
|
|
|
|
| |||||||||
Total | $ | (19 | ) | $ | (721 | ) | $ | — | $ | (740 | ) | |||||
|
|
|
|
|
|
|
| |||||||||
| 1 | Amount less than one thousand. |
| 2 | Futures contracts and credit default swaps are not included in the investment portfolio. |
The following table reconciles the valuation of the fund’s Level 3 investment securities and related transactions for the year ended December 31, 2020 (dollars in thousands):
| Beginning value at 1/1/2020 | Transfers into Level 33 | Purchases | Sales | Net realized loss4 | Unrealized appreciation4 | Transfers out of Level 33 | Ending value at 12/31/2020 | |||||||||||||||||||||||||
Investment securities | $ | 19,675 | $ | 5,892 | $ | 12,692 | $ | (8,614 | ) | $ | (4,424 | ) | $ | 8,405 | $ | (4,843 | ) | $ | 28,783 | |||||||||||||
Net unrealized appreciation during the period on Level 3 investment securities held at December 31, 2020 |
| $ | 7,603 | |||||||||||||||||||||||||||||
| 3 | Transfers into or out of Level 3 are based on the beginning market value of the quarter in which they occurred. These transfers are the result of changes in the availability of pricing sources and/or in the observability of significant inputs used in valuing the securities. |
| 4 | Net realized loss and unrealized appreciation are included in the related amounts on investments in the statement of operations. |
| American Funds Insurance Series | 269 |
Table of Contents
Unobservable inputs — Valuation of the fund’s Level 3 securities is based on significant unobservable inputs that reflect the investment adviser’s determination of assumptions that market participants might reasonably use in valuing the securities. The following table provides additional information used by the fund’s investment adviser to fair value the fund’s Level 3 securities (dollars in thousands):
| Value at 12/31/2020 | Valuation techniques | Unobservable inputs | Range (if applicable) | Weighted | Impact to | |||||||||
Bonds, notes & other debt instruments | $ | 4,354 |
| Estimated recovery value | Exchange terms | N/A | N/A | N/A | ||||||
| Vendor price | N/A | N/A | N/A | |||||||||||
| Par value | N/A | N/A | N/A | |||||||||||
| Yield analysis | YTM risk premium | 200 bps | 200 bps | Decrease | ||||||||||
Convertible bonds & notes | 65 | Transaction price | N/A | N/A | N/A | N/A | ||||||||
Common stocks | 24,364 | Estimated recovery value | N/A | N/A | N/A | N/A | ||||||||
| Exchange terms | N/A | N/A | N/A | |||||||||||
| Vendor price | N/A | N/A | N/A | |||||||||||
| Risk discount | 90% | 90% | Decrease | |||||||||||
| Par value | N/A | N/A | N/A | |||||||||||
| Adjustment based on market decline | 20% | 20% | Decrease | |||||||||||
Market comparable companies | EV/EBITDA multiple | 7.5x | 7.5x | Increase | ||||||||||
| EV/EBITDA less CapEx multiple | 10.2x - 23.0x | 19.2x | Increase | |||||||||||
| Discount to EV/EBITDA less CapEx multiple | 50% | 50% | Decrease | |||||||||||
| DLOM | 17%-22% | 19% | Decrease | |||||||||||
Inputs to market comparables and discounted cash flow | Weight ascribed to market | 50% | N/A | N/A | ||||||||||
| comparables | ||||||||||||||
| Weight ascribed to discounted cash flow | 50% | N/A | N/A | |||||||||||
Discounted cash flow | Proved reserves | $53.7 million | $53.7 million | Increase | ||||||||||
| Discount rate | 9% | 9% | Decrease | |||||||||||
Recent market information | Quoted price | N/A | N/A | N/A | ||||||||||
| DLOM | 30% | 30% | Decrease | |||||||||||
| Transaction price | N/A | N/A | N/A | N/A | ||||||||||
Rights & warrants | — | 3 | Black-Scholes | Implied volatility | 30% | 30% | Increase | |||||||
| Underlying share price | N/A | N/A | N/A | |||||||||||
|
| |||||||||||||
| $ | 28,783 | |||||||||||||
|
| |||||||||||||
| 1 | Weighted average is by relative fair value. |
| 2 | This column represents the directional change in fair value of the Level 3 securities that would result in an increase from the corresponding input. A decrease to the unobservable input would have the opposite effect. Significant increases and decreases in these inputs in isolation could result in significantly higher or lower fair value measurements. |
| 3 | Amount less than one thousand. |
Key to abbreviations
CapEx = Capital expenditure
DLOM = Discount for lack of marketability
EBITDA = Earnings before income taxes, depreciation and amortization
EV = Enterprise value
YTM = Yield to maturity
| 270 | American Funds Insurance Series |
Table of Contents
American Funds Mortgage Fund
| Investment securities | ||||||||||||||||
| Level 1 | Level 2 | Level 3 | Total | |||||||||||||
Assets: | ||||||||||||||||
Bonds, notes & other debt instruments: | ||||||||||||||||
Mortgage-backed obligations | $ | — | $ | 219,567 | $ | — | $ | 219,567 | ||||||||
U.S. Treasury bonds & notes | — | 25,628 | — | 25,628 | ||||||||||||
Asset-backed obligations | — | 5,546 | — | 5,546 | ||||||||||||
Federal agency bonds & notes | — | 294 | — | 294 | ||||||||||||
Short-term securities | — | 141,404 | — | 141,404 | ||||||||||||
|
|
|
|
|
|
|
| |||||||||
Total | $ | — | $ | 392,439 | $ | — | $ | 392,439 | ||||||||
|
|
|
|
|
|
|
| |||||||||
| Other investments* | ||||||||||||||||
| Level 1 | Level 2 | Level 3 | Total | |||||||||||||
Assets: | ||||||||||||||||
Unrealized appreciation on futures contracts | $ | 54 | $ | — | $ | — | $ | 54 | ||||||||
Unrealized appreciation on interest rate swaps | — | 1,218 | — | 1,218 | ||||||||||||
Liabilities: | ||||||||||||||||
Unrealized depreciation on futures contracts | (21 | ) | — | — | (21 | ) | ||||||||||
Unrealized depreciation on interest rate swaps | — | (4 | ) | — | (4 | ) | ||||||||||
|
|
|
|
|
|
|
| |||||||||
Total | $ | 33 | $ | 1,214 | $ | — | $ | 1,247 | ||||||||
|
|
|
|
|
|
|
| |||||||||
| * | Futures contracts and interest rate swaps are not included in the investment portfolio. |
Ultra-Short Bond Fund
At December 31, 2020, all of the fund’s investment securities were classified as Level 2.
U.S. Government/AAA-Rated Securities Fund
| Investment securities | ||||||||||||||||
| Level 1 | Level 2 | Level 3 | Total | |||||||||||||
Assets: | ||||||||||||||||
Bonds, notes & other debt instruments: | ||||||||||||||||
Mortgage-backed obligations | $ | — | $ | 756,975 | $ | — | $ | 756,975 | ||||||||
U.S. Treasury bonds & notes | — | 663,982 | — | 663,982 | ||||||||||||
Federal agency bonds & notes | — | 341,155 | — | 341,155 | ||||||||||||
Short-term securities | — | 731,556 | — | 731,556 | ||||||||||||
|
|
|
|
|
|
|
| |||||||||
Total | $ | — | $ | 2,493,668 | $ | — | $ | 2,493,668 | ||||||||
|
|
|
|
|
|
|
| |||||||||
| Other investments* | ||||||||||||||||
| Level 1 | Level 2 | Level 3 | Total | |||||||||||||
Assets: | ||||||||||||||||
Unrealized appreciation on futures contracts | $ | 1,235 | $ | — | $ | — | $ | 1,235 | ||||||||
Unrealized appreciation on interest rate swaps | — | 34,726 | — | 34,726 | ||||||||||||
Liabilities: | ||||||||||||||||
Unrealized depreciation on futures contracts | (1,275 | ) | — | — | (1,275 | ) | ||||||||||
Unrealized depreciation on interest rate swaps | — | (7,246 | ) | — | (7,246 | ) | ||||||||||
|
|
|
|
|
|
|
| |||||||||
Total | $ | (40 | ) | $ | 27,480 | $ | — | $ | 27,440 | |||||||
|
|
|
|
|
|
|
| |||||||||
| * | Futures contracts and interest rate swaps are not included in the investment portfolio. |
Managed Risk Growth Fund
At December 31, 2020, all of the fund’s investments were classified as Level 1.
Managed Risk International Fund
At December 31, 2020, all of the fund’s investments were classified as Level 1.
| American Funds Insurance Series | 271 |
Table of Contents
Managed Risk Blue Chip Income and Growth Fund
At December 31, 2020, all of the fund’s investments were classified as Level 1.
Managed Risk Growth-Income Fund
At December 31, 2020, all of the fund’s investments were classified as Level 1.
Managed Risk Asset Allocation Fund
At December 31, 2020, all of the fund’s investments were classified as Level 1.
4. Risk factors
Investing in the funds may involve certain risks including, but not limited to, those described below.
Market conditions — The prices of, and the income generated by, the common stocks, bonds and other securities held by a fund may decline — sometimes rapidly or unpredictably — due to various factors, including events or conditions affecting the general economy or particular industries; overall market changes; local, regional or global political, social or economic instability; governmental, governmental agency or central bank responses to economic conditions; and currency exchange rate, interest rate and commodity price fluctuations.
Economies and financial markets throughout the world are highly interconnected. Economic, financial or political events, trading and tariff arrangements, wars, terrorism, cybersecurity events, natural disasters, public health emergencies (such as the spread of infectious disease) and other circumstances in one country or region, including actions taken by governmental or quasi-governmental authorities in response to any of the foregoing, could have impacts on global economies or markets. As a result, whether or not a fund invests in securities of issuers located in or with significant exposure to the countries affected, the value and liquidity of a fund’s investments may be negatively affected by developments in other countries and regions.
Issuer risks — The prices of, and the income generated by, securities held by a fund may decline in response to various factors directly related to the issuers of such securities, including reduced demand for an issuer’s goods or services, poor management performance, major litigation, investigations or other controversies related to the issuer, changes in government regulations affecting the issuer or its competitive environment and strategic initiatives such as mergers, acquisitions or dispositions and the market response to any such initiatives.
Investing in income-oriented stocks — The value of a fund’s securities and income provided by a fund may be reduced by changes in the dividend policies of, and the capital resources available for dividend payments at, the companies in which the fund invests.
Investing in growth-oriented stocks — Growth-oriented common stocks and other equity-type securities (such as preferred stocks, convertible preferred stocks and convertible bonds) may involve larger price swings and greater potential for loss than other types of investments. These risks may be even greater in the case of smaller capitalization stocks.
Investing in small companies — Investing in smaller companies may pose additional risks. For example, it is often more difficult to value or dispose of small company stocks and more difficult to obtain information about smaller companies than about larger companies. Furthermore, smaller companies often have limited product lines, operating histories, markets and/or financial resources, may be dependent on one or a few key persons for management, and can be more susceptible to losses. Moreover, the prices of their stocks may be more volatile than stocks of larger, more established companies, particularly during times of market turmoil.
Investing outside the U.S. — Securities of issuers domiciled outside the U.S., or with significant operations or revenues outside the U.S., may lose value because of adverse political, social, economic or market developments (including social instability, regional conflicts, terrorism and war) in the countries or regions in which the issuers operate or generate revenue. These securities may also lose value due to changes in foreign currency exchange rates against the U.S. dollar and/or currencies of other countries. Issuers of these securities may be more susceptible to actions of foreign governments, such as nationalization, currency blockage or the imposition of price controls or punitive taxes, each of which could adversely impact the value of these securities. Securities markets in certain countries may be more volatile and/or less liquid than those in the U.S. Investments outside the U.S. may also be subject to different accounting practices and different regulatory, legal and reporting standards and practices, and may be more difficult to value, than those in the U.S. In addition, the value of investments outside the U.S. may be reduced by foreign taxes, including foreign withholding taxes on interest and dividends. Further, there may be increased risks of delayed settlement of securities purchased or sold by the fund. The risks of investing outside the U.S. may be heightened in connection with investments in emerging markets.
| 272 | American Funds Insurance Series |
Table of Contents
Investing in developing countries — Investing in countries with developing economies and/or markets may involve risks in addition to and greater than those generally associated with investing in developed countries. For instance, emerging market countries may have less developed legal and accounting systems than those in developed countries. The governments of these countries may be less stable and more likely to impose capital controls, nationalize a company or industry, place restrictions on foreign ownership and on withdrawing sale proceeds of securities from the country, and/or impose punitive taxes that could adversely affect the prices of securities. In addition, the economies of these countries may be dependent on relatively few industries that are more susceptible to local and global changes. Securities markets in these countries can also be relatively small and have substantially lower trading volumes. As a result, securities issued in these countries may be more volatile and less liquid, and may be more difficult to value, than securities issued in countries with more developed economies and/or markets. Less certainty with respect to security valuations may lead to additional challenges and risks in calculating a fund’s net asset value. Additionally, emerging markets are more likely to experience problems with the clearing and settling of trades and the holding of securities by banks, agents and depositories that are less established than those in developed countries.
Investing in emerging markets — Investing in emerging markets may involve risks in addition to and greater than those generally associated with investing in the securities markets of developed countries. For instance, emerging market countries may have less developed legal and accounting systems than those in developed countries. The governments of these countries may be less stable and more likely to impose capital controls, nationalize a company or industry, place restrictions on foreign ownership and on withdrawing sale proceeds of securities from the country, and/or impose punitive taxes that could adversely affect the prices of securities. In addition, the economies of these countries may be dependent on relatively few industries that are more susceptible to local and global changes. Securities markets in these countries can also be relatively small and have substantially lower trading volumes. As a result, securities issued in these countries may be more volatile and less liquid, and may be more difficult to value, than securities issued in countries with more developed economies and/or markets. Less certainty with respect to security valuations may lead to additional challenges and risks in calculating a fund’s net asset value. Additionally, emerging markets are more likely to experience problems with the clearing and settling of trades and the holding of securities by banks, agents and depositories that are less established than those in developed countries.
Investing in debt instruments — The prices of, and the income generated by, bonds and other debt securities held by a fund may be affected by factors such as the interest rates, maturities and credit ratings of these securities.
Rising interest rates will generally cause the prices of bonds and other debt securities to fall. A general rise in interest rates may cause investors to sell debt securities on a large scale, which could also adversely affect the price and liquidity of debt securities and could also result in increased redemptions from a fund. Falling interest rates may cause an issuer to redeem, call or refinance a debt security before its stated maturity, which may result in a fund failing to recoup the full amount of its initial investment and having to reinvest the proceeds in lower yielding securities. Longer maturity debt securities generally have greater sensitivity to changes in interest rates and may be subject to greater price fluctuations than shorter maturity debt securities.
Bonds and other debt securities are also subject to credit risk, which is the possibility that the credit strength of an issuer or guarantor will weaken or be perceived to be weaker, and/or an issuer of a debt security will fail to make timely payments of principal or interest and the security will go into default. A downgrade or default affecting any of a fund’s securities could cause the value of a fund’s shares to decrease. Lower quality debt securities generally have higher rates of interest and may be subject to greater price fluctuations than higher quality debt securities. Credit risk is gauged, in part, by the credit ratings of the debt securities in which a fund invests. However, ratings are only the opinions of the rating agencies issuing them and are not guarantees as to credit quality or an evaluation of market risk. The fund’s investment adviser relies on its own credit analysts to research issuers and issues in seeking to assess credit and default risks.
Investing in lower rated debt instruments — Lower rated bonds and other lower rated debt securities generally have higher rates of interest and involve greater risk of default or price declines due to changes in the issuer’s creditworthiness than those of higher quality debt securities. The market prices of these securities may fluctuate more than the prices of higher quality debt securities and may decline significantly in periods of general economic difficulty. These risks may be increased with respect to investments in junk bonds.
Investing in derivatives — The use of derivatives involves a variety of risks, which may be different from, or greater than, the risks associated with investing in traditional securities, such as stocks and bonds. Changes in the value of a derivative may not correlate perfectly with, and may be more sensitive to market events than, the underlying asset, rate or index, and a derivative instrument may
| American Funds Insurance Series | 273 |
Table of Contents
expose a fund to losses in excess of its initial investment. Derivatives may be difficult to value, difficult for a fund to buy or sell at an opportune time or price and difficult, or even impossible, to terminate or otherwise offset. A fund’s use of derivatives may result in losses to the fund, and investing in derivatives may reduce a fund’s returns and increase a fund’s price volatility. A fund’s counterparty to a derivative transaction (including, if applicable, the fund’s clearing broker, the derivatives exchange or the clearinghouse) may be unable or unwilling to honor its financial obligations in respect of the transaction. In certain cases, the fund may be hindered or delayed in exercising remedies against or closing out derivative instruments with a counterparty, which may result in additional losses.
Currency — The prices of, and the income generated by, many debt securities held by a fund may also be affected by changes in relative currency values. If the U.S. dollar appreciates against foreign currencies, the value in U.S. dollars of a fund’s securities denominated in such currencies would generally fall and vice versa. U.S. dollar-denominated securities of foreign issuers may also be affected by changes in relative currency values.
Investing in mortgage-related and other asset-backed securities — Mortgage-related securities, such as mortgage-backed securities, and other asset-backed securities, include debt obligations that represent interests in pools of mortgages or other income-bearing assets, such as consumer loans or receivables. While such securities are subject to the risks associated with investments in debt instruments generally (for example, credit, extension and interest rate risks), they are also subject to other and different risks.
Mortgage-backed and other asset-backed securities are subject to changes in the payment patterns of borrowers of the underlying debt, potentially increasing the volatility of the securities and a fund’s net asset value. When interest rates fall, borrowers are more likely to refinance or prepay their debt before its stated maturity. This may result in a fund having to reinvest the proceeds in lower yielding securities, effectively reducing a fund’s income. Conversely, if interest rates rise and borrowers repay their debt more slowly than expected, the time in which the mortgage-backed and other asset-backed securities are paid off could be extended, reducing a fund’s cash available for reinvestment in higher yielding securities. Mortgage-backed securities are also subject to the risk that underlying borrowers will be unable to meet their obligations and the value of property that secures the mortgages may decline in value and be insufficient, upon foreclosure, to repay the associated loans. Investments in asset-backed securities are subject to similar risks.
Investing in future delivery contracts — A fund may enter into contracts, such as to-be-announced contracts and mortgage dollar rolls, that involve a fund selling mortgage-related securities and simultaneously contracting to repurchase similar securities for delivery at a future date at a predetermined price. This can increase a fund’s market exposure, and the market price of the securities that the fund contracts to repurchase could drop below their purchase price. While a fund can preserve and generate capital through the use of such contracts by, for example, realizing the difference between the sale price and the future purchase price, the income generated by the fund may be reduced by engaging in such transactions. In addition, these transactions increase the turnover rate of a fund.
Investing in inflation-linked bonds — The values of inflation-linked bonds generally fluctuate in response to changes in real interest rates — i.e., rates of interest after factoring in inflation. A rise in real interest rates may cause the prices of inflation-linked securities to fall, while a decline in real interest rates may cause the prices to increase. Inflation-linked bonds may experience greater losses than other debt securities with similar durations when real interest rates rise faster than nominal interest rates. There can be no assurance that the value of an inflation-linked security will be directly correlated to changes in interest rates; for example, if interest rates rise for reasons other than inflation, the increase may not be reflected in the security’s inflation measure.
Investing in inflation-linked bonds may also reduce a fund’s distributable income during periods of deflation. If prices for goods and services decline throughout the economy, the principal and income on inflation-linked securities may decline and result in losses to a fund.
Investing in securities backed by the U.S. government — Securities backed by the U.S. Treasury or the full faith and credit of the U.S. government are guaranteed only as to the timely payment of interest and principal when held to maturity. Accordingly, the current market values for these securities will fluctuate with changes in interest rates and the credit rating of the U.S. government. Securities issued by government-sponsored entities and federal agencies and instrumentalities that are not backed by the full faith and credit of the U.S. government are neither issued nor guaranteed by the U.S. government.
Investing in repurchase agreements — Upon entering into a repurchase agreement, a fund purchases a security from a bank or broker-dealer, which simultaneously commits to repurchase the security within a specified time at the fund’s cost with interest. The security purchased by the fund constitutes collateral for the seller’s repurchase obligation. If the party agreeing to repurchase should default, the fund may seek to sell the security it holds as collateral. The fund may incur a loss if the value of the collateral securing the repurchase obligation falls below the repurchase price. The fund may also incur disposition costs and encounter procedural delays in connection with liquidating the collateral.
| 274 | American Funds Insurance Series |
Table of Contents
Interest rate risk — The values and liquidity of the securities held by a fund may be affected by changing interest rates. For example, the values of these securities may decline when interest rates rise and increase when interest rates fall. Longer maturity debt securities generally have greater sensitivity to changes in interest rates and may be subject to greater price fluctuations than shorter maturity debt securities. A fund may invest in variable and floating rate securities. When a fund holds variable or floating rate securities, a decrease in market interest rates will adversely affect the income received from such securities and the net asset value of a fund’s shares. Although the values of such securities are generally less sensitive to interest rate changes than those of other debt securities, the value of variable and floating rate securities may decline if their interest rates do not rise as quickly, or as much, as market interest rates. Conversely, floating rate securities will not generally increase in value if interest rates decline. During periods of extremely low short-term interest rates, a fund may not be able to maintain a positive yield and, given the current low interest rate environment, risks associated with rising rates are currently heightened.
Credit and liquidity support — Changes in the credit quality of banks and financial institutions providing credit and liquidity support features with respect to securities held by a fund could cause the values of these securities to decline.
Asset allocation — A fund’s percentage allocation to equity securities, debt securities and money market instruments could cause the fund to underperform relative to relevant benchmarks and other funds with similar investment objectives.
Nondiversification risk— As nondiversified funds, certain funds have the ability to invest a larger percentage of their assets in the securities of a smaller number of issuers than diversified funds. Although the funds do not intend to limit their investments to the securities of a small number of issuers, if they were to do so, poor performance by a single large holding could adversely impact the funds’ investment results more than if the funds were invested in a larger number of issuers.
Liquidity risk — Certain fund holdings may be or may become difficult or impossible to sell, particularly during times of market turmoil. Liquidity may be impacted by the lack of an active market for a holding, legal or contractual restrictions on resale, or the reduced number and capacity of market participants to make a market in such holding. Market prices for less liquid or illiquid holdings may be volatile, and reduced liquidity may have an adverse impact on the market price of such holdings. Additionally, the sale of less liquid or illiquid holdings may involve substantial delays (including delays in settlement) and additional costs and the fund may be unable to sell such holdings when necessary to meet its liquidity needs or may be forced to sell at a loss.
Management — The investment adviser to the funds actively manages the funds’ investments. Consequently, the funds are subject to the risk that the methods and analyses, including models, tools and data, employed by the investment adviser in this process may be flawed or incorrect and may not produce the desired results. This could cause the funds to lose value or their investment results to lag relevant benchmarks or other funds with similar objectives.
Investing in the managed risk funds may involve additional risks including, but not limited to, those described below.
Fund structure — The managed risk funds invest in underlying funds and incur expenses related to those underlying funds. In addition, investors in the managed risk funds will incur fees to pay for certain expenses related to the operations of the managed risk funds. An investor holding the underlying fund directly would incur lower overall expenses but would not receive the benefit of the managed risk strategy. Additionally, in accordance with an exemption under the Investment Company Act of 1940, as amended, the investment adviser considers only proprietary funds when selecting underlying investment options and allocations. This means that the fund’s investment adviser did not, nor does it expect to, consider any unaffiliated funds as underlying investment options for the fund. This strategy could raise certain conflicts of interest when choosing underlying investments for the fund, including the selection of funds that result in greater compensation to the adviser or funds with relatively lower historical investment results. The investment adviser has policies and procedures designed to mitigate material conflicts of interest that may arise in connection with its management of the fund.
Management — The managed risk funds are subject to the risk that the managed risk strategy or the methods employed by the subadviser in implementing the managed risk strategy may not produce the desired results. This could cause the managed risk funds to lose value or their investment results to lag relevant benchmarks or other funds with similar objectives.
Underlying fund risks — Because the managed risk funds’ investments consist of investments in underlying funds, the managed risk funds’ risks are directly related to the risks of the respective underlying fund in which each managed risk fund invests. For this reason, it is important to understand the risks associated with investing both in the managed risk fund and in each of the underlying funds.
| American Funds Insurance Series | 275 |
Table of Contents
Investing in options and futures contracts — In addition to the risks generally associated with investing in derivative instruments, options and futures contracts are subject to the creditworthiness of the clearing organizations, exchanges and, in the case of futures, futures commission merchants with which a fund transacts. Additionally, although futures require only a small initial investment in the form of a deposit of initial margin, the amount of a potential loss on a futures contract could greatly exceed the initial amount invested. While both options and futures contracts are generally liquid instruments, under certain market conditions, options and futures may be deemed to be illiquid. For example, a fund may be temporarily prohibited from closing out its position in an options or futures contract if intraday price change limits or limits on trading volume imposed by the applicable exchange are triggered. If a fund is unable to close out a position on an options or futures contract, the fund would remain subject to the risk of adverse price movements until the fund is able to close out the position in question. The ability of a fund to successfully utilize options and futures contracts may depend in part upon the ability of the fund’s investment adviser or subadviser to accurately forecast interest rates and other economic factors and to assess and predict the impact of such economic factors on the options and futures in which the fund invests. If the investment adviser or subadviser incorrectly forecasts economic developments or incorrectly predicts the impact of such developments on the options and futures in which it invests, a fund could be exposed to the risk of loss. Whereas the risk of loss on a put option purchased by the fund is limited to the initial cost of the option, the amount of a potential loss on a futures contract could greatly exceed the relatively small initial amount invested in entering the futures position.
Hedging — There may be imperfect or even negative correlation between the prices of the options and futures contracts in which a fund invests and the prices of the underlying securities or indexes which the fund seeks to hedge. For example, options and futures contracts may not provide an effective hedge because changes in options and futures contract prices may not track those of the underlying securities or indexes they are intended to hedge. In addition, there are significant differences between the securities market, on the one hand, and the options and futures markets, on the other, that could result in an imperfect correlation between the markets, causing a given hedge not to achieve its objectives. The degree of imperfection of correlation depends on circumstances such as variations in speculative market demand for options and futures, including technical influences in options and futures trading, and differences between the financial instruments being hedged and the instruments underlying the standard contracts available for trading. A decision as to whether, when and how to hedge involves the exercise of skill and judgment, and even a well-conceived hedge may be unsuccessful to some degree because of market behavior or unexpected interest rate trends. In addition, the fund’s investment in exchange-traded options and futures and their resulting costs could limit the fund’s gains in rising markets relative to those of the underlying funds, or to those of unhedged funds in general.
Short positions — Losses from short positions in futures contracts occur when the underlying index increases in value. As the underlying index increases in value, the holder of the short position in the corresponding futures contract is required to pay the difference in value of the futures contract resulting from the increase in the index on a daily basis. Losses from a short position in an index futures contract could potentially be very large if the value of the underlying index rises dramatically in a short period of time.
5. Certain investment techniques
Securities lending — Some of the funds have entered into securities lending transactions in which the funds earn income by lending investment securities to brokers, dealers or other institutions. Each transaction involves three parties: the fund, acting as the lender of the securities, a borrower, and a lending agent that acts as an intermediary.
Securities lending transactions are entered into by the fund under the securities lending agreement with the lending agent. The lending agent facilitates the exchange of securities between the lender and the borrower, generally provides protection from borrower default, marks to market the value of collateral daily, secures additional collateral from the borrower if it falls below preset terms, and may reinvest the collateral on behalf of the fund according to agreed parameters. The lending agent has indemnified the fund against losses resulting from borrower default. Although risk is mitigated by the collateral and indemnification, the fund could experience a delay in recovering its securities and a potential loss of income or value if the borrower fails to return the securities, collateral investments decline in value or the lending agent fails to perform.
The borrower is required to post highly liquid assets, such as cash or U.S. government securities, as collateral for the loan in an amount at least equal to the value of the securities loaned. Investments made with cash collateral are recognized as assets in the fund’s investment portfolio. The same amount is recorded as a liability in the fund’s statement of assets and liabilities. While securities are on loan, the fund will continue to receive the equivalent of the interest, dividends or other distributions paid by the issuer, as well as a portion of the interest on the investment of the collateral. Additionally, although the fund does not have the right to vote on securities while they are on loan, the fund has a right to consent on corporate actions and a right to recall loaned securities to vote on proposals affecting them. The borrower is obligated to return the loaned security at the conclusion of the loan or, during the pendency of the loan, on demand from the fund.
| 276 | American Funds Insurance Series |
Table of Contents
The following table presents the value of the securities on loan, the type and value of collateral received and the value of the investment securities purchased, if any, from the cash collateral received by each fund (dollars in thousands):
| Collateral type | ||||||||||||||||
Funds | Values of securities loan | Cash | U.S. government securities | Value of investment securities purchased | ||||||||||||
Global Growth Fund | $ | 21,446 | $ | 20,305 | $ | 1,985 | $ | 18,274 | ||||||||
Global Small Capitalization Fund | 77,648 | 79,709 | 66 | 71,738 | ||||||||||||
Growth Fund | 7,302 | 7,559 | — | 6,803 | ||||||||||||
International Fund | 83,899 | 15,528 | 72,363 | 13,975 | ||||||||||||
New World Fund | 18,411 | 15,578 | 3,469 | 14,020 | ||||||||||||
Blue Chip Income and Growth Fund | 3,447 | 3,589 | — | 3,230 | ||||||||||||
Global Growth and Income Fund | 6,890 | 7,156 | — | * | 6,440 | |||||||||||
Growth-Income Fund | 188,806 | 193,847 | — | 174,463 | ||||||||||||
International Growth and Income Fund | 6,820 | 7,095 | 14 | 6,385 | ||||||||||||
Capital Income Builder | 5,528 | 1,316 | 4,462 | 1,185 | ||||||||||||
Asset Allocation Fund | 13,741 | 14,048 | — | 12,643 | ||||||||||||
| * | Amount less than one thousand. |
Investment securities purchased from cash collateral are disclosed in the investment portfolio as short-term securities. Securities received as collateral, if any, are not recognized as fund assets. The contractual maturity of collateral received under the securities lending agreement is classified as overnight and continuous.
Index-linked bonds — Some of the funds have invested in index-linked bonds, which are fixed-income securities whose principal value is periodically adjusted to a government price index. Over the life of an index-linked bond, interest is paid on the adjusted principal value. Increases or decreases in the principal value of index-linked bonds are recorded as interest income in the fund’s statement of operations.
Mortgage dollar rolls — Some of the funds have entered into mortgage dollar roll transactions in which the fund sells a mortgage-backed security to a counterparty and simultaneously enters into an agreement with the same counterparty to buy back a similar security on a specific future date at a predetermined price. Mortgage dollar rolls are accounted for as purchase and sale transactions, which may increase the funds’ portfolio turnover rates.
Loan transactions — Some of the funds have entered into loan transactions in which the fund acquires a loan either through an agent, by assignment from another holder, or as a participation interest in another holder’s portion of a loan. The loan is often administered by a financial institution that acts as agent for the holders of the loan, and the fund may be required to receive approval from the agent and/or borrower prior to the sale of the investment. The loan’s interest rate and maturity date may change based on the terms of the loan, including potential early payments of principal.
Short-term securities — The managed risk funds hold shares of State Street Institutional U.S. Government Money Market Fund, a cash management vehicle offered and managed by State Street Bank and Trust Company.
Unfunded commitments — Asset Allocation Fund and High-Income Bond Fund have participated in transactions that involve unfunded commitments, which may obligate each fund to purchase new or additional bonds and/or purchase additional shares of the applicable issuer if certain contingencies are met. As of December 31, 2020, the maximum exposure from these unfunded commitments for Asset Allocation Fund and High-Income Bond Fund was $3,543,000 and $1,481,000, respectively, which would represent 0.01% and 0.17%, respectively, of the net assets of each fund should such commitments become due. Unrealized appreciation on these unfunded commitments for Asset Allocation Fund and High-Income Bond Fund was $740,000 and $323,000, respectively, which is disclosed as a receivable for unrealized appreciation on unfunded commitments in each fund’s statement of assets and liabilities and is included in net unrealized appreciation on investments in unaffiliated issuers in each fund’s statement of operations.
| American Funds Insurance Series | 277 |
Table of Contents
Options contracts — The Managed Risk Growth-Income Fund has entered into options contracts, which give the holder of the option, in return for a premium payment, the right to buy from (in the case of a call) or sell to (in the case of a put) the writer of the option, the security underlying the option (or the cash value of the index underlying the option) at a specified price. As part of its managed risk strategy, the Managed Risk Growth-Income Fund will at times purchase put options on equity indexes in standardized contracts traded on foreign or domestic securities exchanges, boards of trade, or similar entities. By purchasing a put option on an equity index, the fund obtains the right (but not the obligation) to sell the cash value of the index underlying the option at a specified exercise price, and in return for this right, the fund pays the current market price, or the option premium, for the option.
The fund may terminate its position in a put option by allowing the option to expire or by exercising the option. If the option is allowed to expire, the fund will lose the entire premium. If the option is exercised, the fund completes the sale of the underlying instrument (or delivers the cash value of the index underlying the option) at the exercise price. The fund may also terminate a put option position by entering into opposing close-out transactions in advance of the option expiration date.
Premiums paid on options purchased, as well as the daily fluctuation in market value, are included in investment securities from unaffiliated issuers in the fund’s statement of assets and liabilities. Realized gains or losses are recorded at the time the option contract is closed or expires. Net realized gains or losses and net unrealized appreciation or depreciation from options contracts are recorded in investments in unaffiliated issuers in the fund’s statement of operations.
Futures contracts — Some of the funds have entered into futures contracts, which provide for the future sale by one party and purchase by another party of a specified amount of a specific financial instrument for a specified price, date, time and place designated at the time the contract is made. Futures contracts are used to strategically manage the fund’s interest rate sensitivity by increasing or decreasing the duration of the fund or a portion of the fund’s portfolio. For the managed risk funds, futures contracts are used to strategically manage portfolio volatility and downside equity risk.
Upon entering into futures contracts, and to maintain the fund’s open positions in futures contracts, the fund is required to deposit with a futures broker, known as a futures commission merchant (“FCM“), in a segregated account in the name of the FCM an amount of cash, U.S. government securities or other liquid securities, known as initial margin. The margin required for a particular futures contract is set by the exchange on which the contract is traded to serve as collateral, and may be significantly modified from time to time by the exchange during the term of the contract.
On a daily basis, each fund pays or receives variation margin based on the increase or decrease in the value of the futures contracts and records variation margin on futures contracts in each fund’s statement of assets and liabilities. In addition, each fund segregates liquid assets equivalent to the fund’s outstanding obligations under the contract in excess of the initial margin and variation margin, if any. Futures contracts may involve a risk of loss in excess of the variation margin shown on each fund’s statement of assets and liabilities. Each fund records realized gains or losses at the time the futures contract is closed or expires. Net realized gains or losses and net unrealized appreciation or depreciation from futures contracts are recorded in each fund’s statement of operations.
Forward currency contracts — Some of the funds have entered into forward currency contracts, which represent agreements to exchange currencies on specific future dates at predetermined rates. The series’ investment adviser uses forward currency contracts to manage the fund’s exposure to changes in exchange rates. Upon entering into these contracts, risks may arise from the potential inability of counterparties to meet the terms of their contracts and from possible movements in exchange rates.
On a daily basis, the series’ investment adviser values forward currency contracts based on the applicable exchange rates and records unrealized appreciation or depreciation for open forward currency contracts in each fund’s statement of assets and liabilities. Realized gains or losses are recorded at the time the forward contract is closed or offset by another contract with the same broker for the same settlement date and currency. Closed forward currency contracts that have not reached their settlement date are included in the respective receivables or payables for closed forward currency contracts in each fund’s statement of assets and liabilities. Net realized gains or losses from closed forward currency contracts and net unrealized appreciation or depreciation from open forward currency contracts are recorded in each fund’s statement of operations.
Interest rate swaps — Some of the funds have entered into interest rate swaps, which are agreements to exchange one stream of future interest payments for another based on a specified notional amount. Typically, interest rate swaps exchange a fixed interest rate for a payment that floats relative to a benchmark or vice versa. The series’ investment adviser uses interest rate swaps to manage the interest rate sensitivity of the fund by increasing or decreasing the duration of the fund or a portion of the fund’s portfolio. Risks may arise as a result of the series’ investment adviser incorrectly anticipating changes in interest rates, increased volatility, reduced liquidity and the potential inability of counterparties to meet the terms of their agreements.
| 278 | American Funds Insurance Series |
Table of Contents
Upon entering into an interest rate swap contract, the fund is required to deposit cash, U.S. government securities or other liquid securities, which is known as initial margin. Generally, the initial margin required for a particular interest rate swap is set and held as collateral by the clearinghouse on which the contract is cleared. The amount of initial margin required may be significantly modified from time to time by the clearinghouse during the term of the contract.
On a daily basis, the series’ investment adviser records daily interest accruals related to the exchange of future payments as a receivable and payable in each fund’s statement of assets and liabilities. Each fund also pays or receives a variation margin based on the increase or decrease in the value of the interest rate swaps, including accrued interest, and records variation margin on interest rate swaps in each fund’s statement of assets and liabilities. Each fund records realized gains and losses on both the net accrued interest and any gain or loss recognized at the time the interest rate swap is closed or expires. Net realized gains or losses, as well as any net unrealized appreciation or depreciation, from interest rate swaps are recorded in each fund’s statement of operations.
Credit default swap indices — Some of the funds have entered into centrally cleared credit default swap agreements on credit indices (“CDSI”) that involve one party (the protection buyer) making a stream of payments to another party (the protection seller) in exchange for the right to receive a specified return upon the occurrence of a credit event, such as a default or restructuring, with respect to any of the underlying issuers (reference obligations) in the referenced index. The series’ investment adviser uses credit default swaps to assume exposure to a diversified portfolio of credits or to hedge against existing credit risks.
CDSI are portfolios of credit instruments or exposures designed to be representative of some part of the credit market, such as the high-yield or investment-grade credit market. CDSI are generally traded using standardized terms, including a fixed spread and standard maturity dates, and reference all the names in the index. If there is a credit event, it is settled based on that name’s weight in the index. The composition of the underlying issuers or obligations within a particular index may change periodically, usually every six months. A specified credit event may affect all or individual underlying reference obligations included in the index, and will be settled based upon the relative weighting of the affected obligation(s) within the index. The value of each CDSI can be used as a measure of the current payment/performance risk of the CDSI and represents the likelihood of an expected liability or profit should the notional amount of the CDSI be closed or sold as of the period end. An increasing value, as compared to the notional amount of the CDSI, represents a deterioration of the referenced indices’ credit soundness and a greater likelihood of risk of default or other credit event occurring as defined under the terms of the agreement. When a fund provides sell protection, its maximum exposure is the notional amount of the credit default swap agreement.
Upon entering into a centrally cleared CDSI contract, the fund is required to deposit with a derivatives clearing member (“DCM”) in a segregated account in the name of the DCM an amount of cash, U.S. government securities or other liquid securities, which is known as initial margin. Generally, the initial margin required for a particular credit default swap is set and held as collateral by the clearinghouse on which the contract is cleared. The amount of initial margin required may be significantly modified from time to time by the clearinghouse during the term of the contract. Securities deposited as initial margin are designated on the investment portfolio.
On a daily basis, interest accruals related to the exchange of future payments are recorded as a receivable and payable in each fund’s statement of assets and liabilities. Each fund also pays or receives a variation margin based on the increase or decrease in the value of the centrally cleared swaps, and records variation margin in each fund’s statement of assets and liabilities. Each fund records realized gains and losses on both the net accrued interest and any gain or loss recognized at the time the swap is closed or expires. Net realized gains or losses, as well as any net unrealized appreciation or depreciation, from credit default swaps are recorded in each fund’s statement of operations.
| American Funds Insurance Series | 279 |
Table of Contents
The following table presents the average month-end notional amounts of options contracts purchased, futures contracts, forward currency contracts, interest rate swaps and credit default swaps while held for each fund (dollars in thousands):
| Options contracts purchased | Futures contracts | Forward currency contracts | Interest rate swaps | Credit default swaps | ||||||||||||||||
International Fund | Not applicable | Not applicable | $ | 41,887 | Not applicable | Not applicable | ||||||||||||||
New World Fund | Not applicable | $ | 1,829 | 5,742 | Not applicable | Not applicable | ||||||||||||||
Global Growth and Income Fund | Not applicable | Not applicable | 6,973 | * | Not applicable | Not applicable | ||||||||||||||
International Growth and Income Fund | Not applicable | Not applicable | 3,200 | * | Not applicable | Not applicable | ||||||||||||||
Capital Income Builder | Not applicable | 71,475 | 965 | $ | 112,369 | $ | 3,389 | |||||||||||||
Asset Allocation Fund | Not applicable | 1,175,025 | Not applicable | 227,086 | 46,073 | |||||||||||||||
Global Balanced Fund | Not applicable | 4,858 | 30,295 | 7,507 | 3,800 | |||||||||||||||
Bond Fund | Not applicable | 3,685,113 | 491,051 | 823,870 | 173,850 | * | ||||||||||||||
Capital World Bond Fund | Not applicable | 139,493 | 657,769 | 121,529 | 80,050 | |||||||||||||||
High-Income Bond Fund | Not applicable | 10,600 | Not applicable | Not applicable | 31,310 | |||||||||||||||
Mortgage Fund | Not applicable | 88,917 | Not applicable | 268,075 | Not applicable | |||||||||||||||
U.S. Government/AAA-Rated Securities Fund | Not applicable | 1,922,908 | Not applicable | 3,696,916 | Not applicable | |||||||||||||||
Managed Risk Growth Fund | Not applicable | 178,037 | Not applicable | Not applicable | Not applicable | |||||||||||||||
Managed Risk International Fund | Not applicable | 716,661 | Not applicable | Not applicable | Not applicable | |||||||||||||||
Managed Risk Blue Chip Income and Growth Fund | Not applicable | 119,174 | Not applicable | Not applicable | Not applicable | |||||||||||||||
Managed Risk Growth-Income Fund | $ | 36,373 | 741,450 | Not applicable | Not applicable | Not applicable | ||||||||||||||
Managed Risk Asset Allocation Fund | Not applicable | 735,724 | Not applicable | Not applicable | Not applicable | |||||||||||||||
| * | No contracts were held at the end of the reporting period; amount represents the average month-end notional amount of contracts while they were held. |
The following tables identify the location and fair value amounts on the funds’ statements of assets and liabilities and the effect on the funds’ statements of operations resulting from the funds’ use of options, futures contracts, forward currency contracts, interest rate swaps and/or credit default swaps as of, or for the year ended, December 31, 2020 (dollars in thousands):
International Fund
Assets | Liabilities | |||||||||||||
Contracts | Risk type | Location on statement of assets and liabilities | Value | Location on statement of assets and liabilities | Value | |||||||||
Forward currency | Currency | Unrealized appreciation on open forward currency contracts | $ | 309 | Unrealized depreciation on open forward currency contracts | $ | 395 | |||||||
Net realized gain | Net unrealized appreciation | |||||||||||||
Contracts | Risk type | Location on statement of operations | Value | Location on statement of operations | Value | |||||||||
Forward currency | Currency | Net realized gain on forward currency contracts | $ | 182 | Net unrealized appreciation on forward currency contracts | $ | 45 | |||||||
New World Fund
Assets | Liabilities | |||||||||||||
Contracts | Risk type | Location on statement of assets and liabilities | Value | Location on statement of assets and liabilities | Value | |||||||||
Futures | Interest | Unrealized appreciation1 | $ | 3 | Unrealized depreciation1 | $ | 13 | |||||||
Forward currency | Currency | Unrealized appreciation on open forward currency contracts | — | Unrealized depreciation on open forward currency contracts | 54 | |||||||||
|
|
|
| |||||||||||
| $ | 3 | $ | 67 | |||||||||||
|
|
|
| |||||||||||
See end of tables for footnotes.
| 280 | American Funds Insurance Series |
Table of Contents
Net realized gain (loss) | Net unrealized depreciation | |||||||||||||
Contracts | Risk type | Location on statement of operations | Value | Location on statement of operations | Value | |||||||||
Futures | Interest | Net realized gain on futures contracts | $ | 140 | Net unrealized depreciation on futures contracts | $ | (10 | ) | ||||||
Forward currency | Currency | Net realized loss on forward currency contracts | �� | (245 | ) | Net unrealized depreciation on forward currency contracts | (54 | ) | ||||||
|
|
|
| |||||||||||
| $ | (105 | ) | $ | (64 | ) | |||||||||
|
|
|
| |||||||||||
Global Growth and Income Fund
Net realized loss | Net unrealized appreciation | |||||||||||||
Contracts | Risk type | Location on statement of operations | Value | Location on statement of operations | Value | |||||||||
Forward currency | Currency | Net realized loss on forward currency contracts | $ | (521) | Net unrealized appreciation on forward currency contracts | $ | 137 | |||||||
International Growth and Income Fund
Net realized gain | Net unrealized appreciation | |||||||||||||
Contracts | Risk type | Location on statement of operations | Value | Location on statement of operations | Value | |||||||||
Forward currency | Currency | Net realized gain on forward currency contracts | $ | 18 | Net unrealized appreciation on forward currency contracts | $ | 12 | |||||||
Capital Income Builder
Assets | Liabilities | |||||||||||||
Contracts | Risk type | Location on statement of assets and liabilities | Value | Location on statement of assets and liabilities | Value | |||||||||
Futures | Interest | Unrealized appreciation1 | $ | 39 | Unrealized depreciation1 | $ | 89 | |||||||
Forward currency | Currency | Unrealized appreciation on open forward currency contracts | 34 | Unrealized depreciation on open forward currency contracts | 56 | |||||||||
Swap | Interest | Unrealized appreciation1 | 569 | Unrealized depreciation1 | — | |||||||||
Swap | Credit | Unrealized appreciation1 | 152 | Unrealized depreciation1 | — | |||||||||
|
|
|
| |||||||||||
| $ | 794 | $ | 145 | |||||||||||
|
|
|
| |||||||||||
Net realized gain | Net unrealized appreciation (depreciation) | |||||||||||||
Contracts | Risk type | Location on statement of operations | Value | Location on statement of operations | Value | |||||||||
Futures | Interest | Net realized gain on futures contracts | $ | 3,606 | Net unrealized appreciation on futures contracts | $ | 281 | |||||||
Forward currency | Currency | Net realized gain on forward currency contracts | 38 | Net unrealized depreciation on forward currency contracts | (22 | ) | ||||||||
Swap | Interest | Net realized gain on swap contracts | 2,280 | Net unrealized depreciation on swap contracts | (260 | ) | ||||||||
Swap | Credit | Net realized gain on swap contracts | 406 | Net unrealized appreciation on swap contracts | 152 | |||||||||
|
|
|
| |||||||||||
| $ | 6,330 | $ | 151 | |||||||||||
|
|
|
| |||||||||||
See end of tables for footnotes.
| American Funds Insurance Series | 281 |
Table of Contents
Asset Allocation Fund
Assets | Liabilities | |||||||||||||
Contracts | Risk type | Location on statement of assets and liabilities | Value | Location on statement of assets and liabilities | Value | |||||||||
Futures | Interest | Unrealized appreciation1 | $ | 1,610 | Unrealized depreciation1 | $ | 2,382 | |||||||
Swap | Interest | Unrealized appreciation1 | 796 | Unrealized depreciation1 | — | |||||||||
Swap | Credit | Unrealized appreciation1 | — | 2 | Unrealized depreciation1 | — | ||||||||
|
|
|
| |||||||||||
| $ | 2,406 | $ | 2,382 | |||||||||||
|
|
|
| |||||||||||
Net realized gain (loss) | Net unrealized appreciation | |||||||||||||
Contracts | Risk type | Location on statement of operations | Value | Location on statement of operations | Value | |||||||||
Futures | Interest | Net realized gain on futures contracts | $ | 36,747 | Net unrealized appreciation on futures contracts | $ | 2,190 | |||||||
Swap | Interest | Net realized loss on swap contracts | (13,556 | ) | Net unrealized appreciation on swap contracts | 4,608 | ||||||||
Swap | Credit | Net realized gain on swap contracts | 2,725 | Net unrealized appreciation on swap contracts | — | 2 | ||||||||
|
|
|
| |||||||||||
| $ | 25,916 | $ | 6,798 | |||||||||||
|
|
|
| |||||||||||
Global Balanced Fund
Assets | Liabilities | |||||||||||||
Contracts | Risk type | Location on statement of assets and liabilities | Value | Location on statement of assets and liabilities | Value | |||||||||
Futures | Interest | Unrealized appreciation1 | $ | 3 | Unrealized depreciation1 | $ | — | |||||||
Forward currency | Currency | Unrealized appreciation on open forward currency contracts | 257 | Unrealized depreciation on open forward currency contracts | 259 | |||||||||
Swap | Interest | Unrealized appreciation1 | 21 | Unrealized depreciation1 | — | |||||||||
Swap | Credit | Unrealized appreciation1 | — | Unrealized depreciation1 | — | 2 | ||||||||
|
|
|
| |||||||||||
| $ | 281 | $ | 259 | |||||||||||
|
|
|
| |||||||||||
Net realized gain (loss) | Net unrealized appreciation (depreciation) | |||||||||||||
Contracts | Risk type | Location on statement of operations | Value | Location on statement of operations | Value | |||||||||
Futures | Interest | Net realized gain on futures contracts | $ | 442 | Net unrealized appreciation on futures contracts | $ | 19 | |||||||
Forward currency | Currency | Net realized gain on forward currency contracts | 801 | Net unrealized appreciation on forward currency contracts | 97 | |||||||||
Swap | Interest | Net realized loss on swap contracts | (126 | ) | Net unrealized appreciation on swap contracts | 23 | ||||||||
Swap | Credit | Net realized gain on swap contracts | 3 | Net unrealized depreciation on swap contracts | — | 2 | ||||||||
|
|
|
| |||||||||||
| $ | 1,120 | $ | 139 | |||||||||||
|
|
|
| |||||||||||
See end of tables for footnotes.
| 282 | American Funds Insurance Series |
Table of Contents
Bond Fund
Assets | Liabilities | |||||||||||||
Contracts | Risk type | Location on statement of assets and liabilities | Value | Location on statement of assets and liabilities | Value | |||||||||
Futures | Interest | Unrealized appreciation1 | $ | 7,631 | Unrealized depreciation1 | $ | 824 | |||||||
Forward currency | Currency | Unrealized appreciation on open forward currency contracts | 46 | Unrealized depreciation on open forward currency contracts | 2,653 | |||||||||
Swap | Interest | Unrealized appreciation1 | 3,456 | Unrealized depreciation1 | 28,517 | |||||||||
|
|
|
| |||||||||||
| $ | 11,133 | $ | 31,994 | |||||||||||
|
|
|
| |||||||||||
Net realized gain (loss) | Net unrealized appreciation (depreciation) | |||||||||||||
Contracts | Risk type | Location on statement of operations | Value | Location on statement of operations | Value | |||||||||
Futures | Interest | Net realized gain on futures contracts | $ | 89,071 | Net unrealized appreciation on futures contracts | $ | 10,886 | |||||||
Forward currency | Currency | Net realized loss on forward currency contracts | (15,906 | ) | Net unrealized depreciation on forward currency contracts | (1,417 | ) | |||||||
Swap | Interest | Net realized loss on swap contracts | (22,499 | ) | Net unrealized depreciation on swap contracts | (18,955 | ) | |||||||
Swap | Credit | Net realized gain on swap contracts | 22,543 | Net unrealized appreciation on swap contracts | — | |||||||||
|
|
|
| |||||||||||
| $ | 73,209 | $ | (9,486 | ) | ||||||||||
|
|
|
| |||||||||||
Capital World Bond Fund
Assets | Liabilities | |||||||||||||
Contracts | Risk type | Location on statement of assets and liabilities | Value | Location on statement of assets and liabilities | Value | |||||||||
Futures | Interest | Unrealized appreciation1 | $ | 308 | Unrealized depreciation1 | $ | 155 | |||||||
Forward currency | Currency | Unrealized appreciation on open forward currency contracts | 4,155 | Unrealized depreciation on open forward currency contracts | 3,799 | |||||||||
Swap | Interest | Unrealized appreciation1 | — | Unrealized depreciation1 | 64 | |||||||||
Swap | Credit | Unrealized appreciation1 | 31 | Unrealized depreciation1 | 698 | |||||||||
|
|
|
| |||||||||||
| $ | 4,494 | $ | 4,716 | |||||||||||
|
|
|
| |||||||||||
Net realized (loss) gain | Net unrealized appreciation (depreciation) | |||||||||||||
Contracts | Risk type | Location on statement of operations | Value | Location on statement of operations | Value | |||||||||
Futures | Interest | Net realized loss on futures contracts | $ | (180 | ) | Net unrealized appreciation on futures contracts | $ | 958 | ||||||
Forward currency | Currency | Net realized gain on forward currency contracts | 16,206 | Net unrealized appreciation on forward currency contracts | 2,566 | |||||||||
Swap | Interest | Net realized loss on swap contracts | (2,548 | ) | Net unrealized appreciation on swap contracts | 475 | ||||||||
Swap | Credit | Net realized loss on swap contracts | (357 | ) | Net unrealized depreciation on swap contracts | (1,398 | ) | |||||||
|
|
|
| |||||||||||
| $ | 13,121 | $ | 2,601 | |||||||||||
|
|
|
| |||||||||||
See end of tables for footnotes.
| American Funds Insurance Series | 283 |
Table of Contents
High-Income Bond Fund
Assets | Liabilities | |||||||||||||
Contracts | Risk type | Location on statement of assets and liabilities | Value | Location on statement of assets and liabilities | Value | |||||||||
Futures | Interest | Unrealized appreciation1 | $ | 8 | Unrealized depreciation1 | $ | 27 | |||||||
Swap | Credit | Unrealized appreciation1 | 7 | Unrealized depreciation1 | 728 | |||||||||
|
|
|
| |||||||||||
| $ | 15 | $ | 755 | |||||||||||
|
|
|
| |||||||||||
Net realized (loss) gain | Net unrealized (depreciation) appreciation | |||||||||||||
Contracts | Risk type | Location on statement of operations | Value | Location on statement of operations | Value | |||||||||
Futures | Interest | Net realized loss on futures contracts | $ | (166 | ) | Net unrealized depreciation on futures contracts | $ | (178 | ) | |||||
Swap | Interest | Net realized gain on swap contracts | 1 | Net unrealized appreciation on swap contracts | — | |||||||||
Swap | Credit | Net realized gain on swap contracts | 3,841 | Net unrealized appreciation on swap contracts | 857 | |||||||||
|
|
|
| |||||||||||
| $ | 3,676 | $ | 679 | |||||||||||
|
|
|
| |||||||||||
American Funds Mortgage Fund
Assets | Liabilities | |||||||||||||
Contracts | Risk type | Location on statement of assets and liabilities | Value | Location on statement of assets and liabilities | Value | |||||||||
Futures | Interest | Unrealized appreciation1 | $ | 54 | Unrealized depreciation1 | $ | 21 | |||||||
Swap | Interest | Unrealized appreciation1 | 1,218 | Unrealized depreciation1 | 4 | |||||||||
|
|
|
| |||||||||||
| $ | 1,272 | $ | 25 | |||||||||||
|
|
|
| |||||||||||
Net realized gain (loss) | Net unrealized appreciation | |||||||||||||
Contracts | Risk type | Location on statement of operations | Value | Location on statement of operations | Value | |||||||||
Futures | Interest | Net realized gain on futures contracts | $ | 8,696 | Net unrealized appreciation on futures contracts | $ | 779 | |||||||
Swap | Interest | Net realized loss on swap contracts | (8,505 | ) | Net unrealized appreciation on swap contracts | 4,046 | ||||||||
|
|
|
| |||||||||||
| $ | 191 | $ | 4,825 | |||||||||||
|
|
|
| |||||||||||
U.S. Government/AAA-Rated Securities Fund
Assets | Liabilities | |||||||||||||
Contracts | Risk type | Location on statement of assets and liabilities | Value | Location on statement of assets and liabilities | Value | |||||||||
Futures | Interest | Unrealized appreciation1 | $ | 1,235 | Unrealized depreciation1 | $ | 1,275 | |||||||
Swap | Interest | Unrealized appreciation1 | 34,726 | Unrealized depreciation1 | 7,246 | |||||||||
|
|
|
| |||||||||||
| $ | 35,961 | $ | 8,521 | |||||||||||
|
|
|
| |||||||||||
See end of tables for footnotes.
| 284 | American Funds Insurance Series |
Table of Contents
Net realized gain (loss) | Net unrealized appreciation | |||||||||||||
Contracts | Risk type | Location on statement of operations | Value | Location on statement of operations | Value | |||||||||
Futures | Interest | Net realized gain on futures contracts | $ | 89,336 | Net unrealized appreciation on futures contracts | $ | 7,908 | |||||||
Swap | Interest | Net realized loss on swap contracts | (46,704 | ) | Net unrealized appreciation on swap contracts | 47,782 | ||||||||
|
|
|
| |||||||||||
| $ | 42,632 | $ | 55,690 | |||||||||||
|
|
|
| |||||||||||
Managed Risk Growth Fund
Assets | Liabilities | |||||||||||||
Contracts | Risk type | Location on statement of assets and liabilities | Value | Location on statement of assets and liabilities | Value | |||||||||
Futures | Interest | Unrealized appreciation1 | $ | 69 | Unrealized depreciation1 | $ | — | |||||||
Net realized (loss) gain | Net unrealized appreciation | |||||||||||||
Contracts | Risk type | Location on statement of operations | Value | Location on statement of operations | Value | |||||||||
Futures | Currency | Net realized loss on futures contracts | $ | (323 | ) | Net unrealized appreciation on futures contracts | $ | — | ||||||
Futures | Equity | Net realized loss on futures contracts | (40,633 | ) | Net unrealized appreciation on futures contracts | — | ||||||||
Futures | Interest | Net realized gain on futures contracts | 5,618 | Net unrealized appreciation on futures contracts | 130 | |||||||||
|
|
|
| |||||||||||
| $ | (35,338 | ) | $ | 130 | ||||||||||
|
|
|
| |||||||||||
Managed Risk International Fund
Assets | Liabilities | |||||||||||||
Contracts | Risk type | Location on statement of assets and liabilities | Value | Location on statement of assets and liabilities | Value | |||||||||
Futures | Interest | Unrealized appreciation1 | $ | 21 | Unrealized depreciation1 | $ | — | |||||||
Net realized (loss) gain | Net unrealized appreciation | |||||||||||||
Contracts | Risk type | Location on statement of operations | Value | Location on statement of operations | Value | |||||||||
Futures | Currency | Net realized loss on futures contracts | $ | (689 | ) | Net unrealized appreciation on futures contracts | $ | — | ||||||
Futures | Equity | Net realized loss on futures contracts | (14,445 | ) | Net unrealized appreciation on futures contracts | — | ||||||||
Futures | Interest | Net realized gain on futures contracts | 1,083 | Net unrealized appreciation on futures contracts | 51 | |||||||||
|
|
|
| |||||||||||
| $ | (14,051 | ) | $ | 51 | ||||||||||
|
|
|
| |||||||||||
See end of tables for footnotes.
| American Funds Insurance Series | 285 |
Table of Contents
Managed Risk Blue Chip Income and Growth Fund
Assets | Liabilities | |||||||||||||
Contracts | Risk type | Location on statement of assets and liabilities | Value | Location on statement of assets and liabilities | Value | |||||||||
Futures | Interest | Unrealized appreciation1 | $ | 38 | Unrealized depreciation1 | $ | — | |||||||
Net realized (loss) gain | Net unrealized appreciation | |||||||||||||
Contracts | Risk type | Location on statement of operations | Value | Location on statement of operations | Value | |||||||||
Futures | Currency | Net realized loss on futures contracts | $ | (112 | ) | Net unrealized appreciation on futures contracts | $ | — | ||||||
Futures | Equity | Net realized loss on futures contracts | (36,178 | ) | Net unrealized appreciation on futures contracts | — | ||||||||
Futures | Interest | Net realized gain on futures contracts | 3,606 | Net unrealized appreciation on futures contracts | 90 | |||||||||
|
|
|
| |||||||||||
| $ | (32,684 | ) | $ | 90 | ||||||||||
|
|
|
| |||||||||||
Managed Risk Growth-Income Fund
Assets | Liabilities | |||||||||||||
Contracts | Risk type | Location on statement of assets and liabilities | Value | Location on statement of assets and liabilities | Value | |||||||||
Options purchased | Equity | Investment securities from unaffiliated issuers3 | $ | 12,028 | Investment securities from unaffiliated issuers | $ | — | |||||||
Futures | Equity | Unrealized appreciation1 | 2,637 | Unrealized depreciation1 | — | |||||||||
Futures | Interest | Unrealized appreciation1 | 341 | Unrealized depreciation1 | — | |||||||||
|
|
|
| |||||||||||
| $ | 15,006 | $ | — | |||||||||||
|
|
|
| |||||||||||
Net realized (loss) gain | Net unrealized appreciation | |||||||||||||
Contracts | Risk type | Location on statement of operations | Value | Location on statement of operations | Value | |||||||||
Options purchased | Equity | Net realized loss on options purchased contracts4 | $ | (22,888 | ) | Net unrealized appreciation on options purchased contracts5 | $ | — | ||||||
Futures | Currency | Net realized loss on futures contracts | (563 | ) | Net unrealized appreciation on futures contracts | — | ||||||||
Futures | Equity | Net realized loss on futures contracts | (44,738 | ) | Net unrealized appreciation on futures contracts | 1,592 | ||||||||
Futures | Interest | Net realized gain on futures contracts | 24,706 | Net unrealized appreciation on futures contracts | 716 | |||||||||
|
|
|
| |||||||||||
| $ | (43,483 | ) | $ | 2,308 | ||||||||||
|
|
|
| |||||||||||
See end of tables for footnotes.
| 286 | American Funds Insurance Series |
Table of Contents
Managed Risk Asset Allocation Fund
Assets | Liabilities | |||||||||||||
Contracts | Risk type | Location on statement of assets and liabilities | Value | Location on statement of assets and liabilities | Value | |||||||||
Futures | Interest | Unrealized appreciation1 | $ | 358 | Unrealized depreciation1 | $ | — | |||||||
Net realized (loss) gain | Net unrealized appreciation | |||||||||||||
Contracts | Risk type | Location on statement of operations | Value | Location on statement of operations | Value | |||||||||
Futures | Currency | Net realized loss on futures contracts | $ | (82 | ) | Net unrealized appreciation on futures contracts | $ | — | ||||||
Futures | Equity | Net realized loss on futures contracts | (141,847 | ) | Net unrealized appreciation on futures contracts | — | ||||||||
Futures | Interest | Net realized gain on futures contracts | 22,678 | Net unrealized appreciation on futures contracts | 883 | |||||||||
|
|
|
| |||||||||||
| $ | (119,251 | ) | $ | 883 | ||||||||||
|
|
|
| |||||||||||
| 1 | Includes cumulative appreciation/depreciation on futures contracts, interest rate swaps and/or credit default swaps as reported in the applicable table following each fund’s investment portfolio. Only current day’s variation margin is reported within each fund’s statement of assets and liabilities. |
| 2 | Amount less than one thousand. |
| 3 | Includes options purchased as reported in the fund’s investment portfolio. |
| 4 | Options purchased are included in net realized gain (loss) on investments in unaffiliated issuers. |
| 5 | Options purchased are included in net unrealized appreciation (depreciation) on investments in unaffiliated issuers. |
Collateral — Some funds participate in a collateral program that calls for the funds to either receive or pledge highly liquid assets, such as cash or U.S. government securities, as collateral due to securities lending and/or their use of futures contracts, forward currency contracts, interest rate swaps, credit default swaps and/or future delivery contracts. For securities lending, each participating fund receives collateral in exchange for lending investment securities. The lending agent may reinvest collateral from securities lending transactions according to agreed parameters. For futures contracts, interest rate swaps and credit default swaps, the program calls for each participating fund to pledge collateral for initial and variation margin by contract. For forward currency contracts, the program calls for each participating fund to either receive or pledge collateral based on the net gain or loss on unsettled forward currency contracts by counterparty. For future delivery contracts, the program calls for each participating fund to either receive or pledge collateral based on the net gain or loss on unsettled contracts by certain counterparties. The purpose of the collateral is to cover potential losses that could occur in the event that either party cannot meet its contractual obligation. Non-cash collateral pledged by each participating fund, if any, is disclosed in each fund’s investment portfolio, and cash collateral pledged by each participating fund, if any, is held in a segregated account with the fund’s custodian, which is reflected as pledged cash collateral in each fund’s statement of assets and liabilities.
Rights of offset — Funds that hold forward currency contracts have enforceable master netting agreements with certain counterparties, where amounts payable by each party to the other in the same currency (with the same settlement date and with the same counter-party) are settled net of each party’s payment obligation. If an early termination date occurs under these agreements following an event of default or termination event, all obligations of each party to its counterparty are settled net through a single payment in a single currency (“close-out netting“). For financial reporting purposes, the funds do not offset financial assets and financial liabilities that are subject to these master netting arrangements in the statements of assets and liabilities.
| American Funds Insurance Series | 287 |
Table of Contents
The following tables present each fund’s forward currency contracts by counterparty that are subject to master netting agreements but that are not offset in the funds’ statements of assets and liabilities. The net amount column shows the impact of offsetting on the funds’ statement of assets and liabilities as of December 31, 2020, if close-out netting was exercised (dollars in thousands):
International Fund
| Gross amounts not offset in the statement of assets and liabilities and subject to a master netting agreement | ||||||||||||||||||||
Counterparty | Gross amounts recognized in the statement of assets and liabilities | Available to offset | Non-cash collateral* | Cash collateral* | Net amount | |||||||||||||||
Assets: | ||||||||||||||||||||
Citibank | $ | 309 | $ | (309 | ) | $ | — | $ | — | $ | — | |||||||||
Liabilities: | ||||||||||||||||||||
Citibank | $ | 395 | $ | (309 | ) | $ | — | $ | — | $ | 86 | |||||||||
New World Fund
| Gross amounts not offset in the statement of assets and liabilities and subject to a master netting agreement | ||||||||||||||||||||
Counterparty | Gross amounts recognized in the statement of assets and liabilities | Available to offset | Non-cash collateral* | Cash collateral* | Net amount | |||||||||||||||
Liabilities: | ||||||||||||||||||||
Bank of New York Mellon | $ | 54 | $ | — | $ | — | $ | — | $ | 54 | ||||||||||
Capital Income Builder
| Gross amounts not offset in the statement of assets and liabilities and subject to a master netting agreement | ||||||||||||||||||||
Counterparty | Gross amounts recognized in the statement of assets and liabilities | Available to offset | Non-cash collateral* | Cash collateral* | Net amount | |||||||||||||||
Assets: | ||||||||||||||||||||
Bank of New York Mellon | $ | 29 | $ | (4 | ) | $ | — | $ | — | $ | 25 | |||||||||
Goldman Sachs | 4 | — | — | — | 4 | |||||||||||||||
HSBC Bank | 1 | — | — | — | 1 | |||||||||||||||
|
|
|
|
|
|
|
|
|
| |||||||||||
Total | $ | 34 | $ | (4 | ) | $ | — | $ | — | $ | 30 | |||||||||
|
|
|
|
|
|
|
|
|
| |||||||||||
Liabilities: | ||||||||||||||||||||
Bank of New York Mellon | $ | 4 | $ | (4 | ) | $ | — | $ | — | $ | — | |||||||||
Standard Chartered Bank | 52 | — | — | — | 52 | |||||||||||||||
|
|
|
|
|
|
|
|
|
| |||||||||||
Total | $ | 56 | $ | (4 | ) | $ | — | $ | — | $ | 52 | |||||||||
|
|
|
|
|
|
|
|
|
| |||||||||||
See end of tables for footnote.
| 288 | American Funds Insurance Series |
Table of Contents
Global Balanced Fund
| Gross amounts not offset in the statement of assets and liabilities and subject to a master netting agreement | ||||||||||||||||||||
Counterparty | Gross amounts recognized in the statement of assets and liabilities | Available to offset | Non-cash collateral* | Cash collateral* | Net amount | |||||||||||||||
Assets: | ||||||||||||||||||||
Bank of New York Mellon | $ | 14 | $ | — | $ | — | $ | — | $ | 14 | ||||||||||
Barclays Bank PLC | 21 | (1 | ) | — | — | 20 | ||||||||||||||
Citibank | 61 | (61 | ) | — | — | — | ||||||||||||||
Goldman Sachs | 44 | (14 | ) | — | — | 30 | ||||||||||||||
HSBC Bank | 38 | (19 | ) | — | — | 19 | ||||||||||||||
JPMorgan Chase | 12 | (11 | ) | — | — | 1 | ||||||||||||||
Morgan Stanley | 54 | (48 | ) | — | — | 6 | ||||||||||||||
Standard Chartered Bank | 11 | (11 | ) | — | — | — | ||||||||||||||
UBS AG | 2 | — | — | — | 2 | |||||||||||||||
|
|
|
|
|
|
|
|
|
| |||||||||||
Total | $ | 257 | $ | (165 | ) | $ | — | $ | — | $ | 92 | |||||||||
|
|
|
|
|
|
|
|
|
| |||||||||||
Liabilities: | ||||||||||||||||||||
Bank of America | $ | 21 | $ | — | $ | — | $ | — | $ | 21 | ||||||||||
Barclays Bank PLC | 1 | (1 | ) | — | — | — | ||||||||||||||
Citibank | 115 | (61 | ) | — | — | 54 | ||||||||||||||
Goldman Sachs | 14 | (14 | ) | — | — | — | ||||||||||||||
HSBC Bank | 19 | (19 | ) | — | — | — | ||||||||||||||
JPMorgan Chase | 11 | (11 | ) | — | — | — | ||||||||||||||
Morgan Stanley | 48 | (48 | ) | — | — | — | ||||||||||||||
Standard Chartered Bank | 30 | (11 | ) | — | — | 19 | ||||||||||||||
|
|
|
|
|
|
|
|
|
| |||||||||||
Total | $ | 259 | $ | (165 | ) | $ | — | $ | — | $ | 94 | |||||||||
|
|
|
|
|
|
|
|
|
| |||||||||||
Bond Fund
| Gross amounts not offset in the statement of assets and liabilities and subject to a master netting agreement | ||||||||||||||||||||
Counterparty | Gross amounts recognized in the statement of assets and liabilities | Available to offset | Non-cash collateral* | Cash collateral* | Net amount | |||||||||||||||
Assets: | ||||||||||||||||||||
Morgan Stanley | $ | 46 | $ | — | $ | — | $ | (46 | ) | $ | — | |||||||||
Liabilities: | ||||||||||||||||||||
Bank of New York Mellon | $ | 877 | $ | — | $ | (877 | ) | $ | — | $ | — | |||||||||
HSBC Bank | 1,714 | — | (1,714 | ) | — | — | ||||||||||||||
UBS AG | 62 | — | — | — | 62 | |||||||||||||||
|
|
|
|
|
|
|
|
|
| |||||||||||
Total | $ | 2,653 | $ | — | $ | (2,591 | ) | $ | — | $ | 62 | |||||||||
|
|
|
|
|
|
|
|
|
| |||||||||||
See end of tables for footnote.
| American Funds Insurance Series | 289 |
Table of Contents
Capital World Bond Fund
Counterparty | Gross amounts not offset in the statement of assets and liabilities and subject to a master netting agreement | |||||||||||||||||||
| Gross amounts recognized in the statement of assets and liabilities | Available to offset | Non-cash collateral* | Cash collateral* | Net amount | ||||||||||||||||
Assets: | ||||||||||||||||||||
Bank of America | $ | 439 | $ | (439 | ) | $ | — | $ | — | $ | — | |||||||||
Bank of New York Mellon | 109 | (2 | ) | — | — | 107 | ||||||||||||||
Citibank | 281 | (281 | ) | — | — | — | ||||||||||||||
Goldman Sachs | 1,536 | (359 | ) | — | (1,110 | ) | 67 | |||||||||||||
HSBC Bank | 319 | (97 | ) | (108 | ) | — | 114 | |||||||||||||
JPMorgan Chase | 924 | — | (924 | ) | — | — | ||||||||||||||
Standard Chartered Bank | 202 | (8 | ) | (194 | ) | — | — | |||||||||||||
UBS AG | 345 | (345 | ) | — | — | — | ||||||||||||||
|
|
|
|
|
|
|
|
|
| |||||||||||
Total | $ | 4,155 | $ | (1,531 | ) | $ | (1,226 | ) | $ | (1,110 | ) | $ | 288 | |||||||
|
|
|
|
|
|
|
|
|
| |||||||||||
Liabilities: | ||||||||||||||||||||
Bank of America | $ | 551 | $ | (439 | ) | $ | (63 | ) | $ | — | $ | 49 | ||||||||
Bank of New York Mellon | 2 | (2 | ) | — | — | — | ||||||||||||||
Citibank | 1,691 | (281 | ) | (1,312 | ) | — | 98 | |||||||||||||
Goldman Sachs | 359 | (359 | ) | — | — | — | ||||||||||||||
HSBC Bank | 97 | (97 | ) | — | — | — | ||||||||||||||
Morgan Stanley | 560 | — | (466 | ) | — | 94 | ||||||||||||||
Standard Chartered Bank | 8 | (8 | ) | — | — | — | ||||||||||||||
UBS AG | 531 | (345 | ) | — | — | 186 | ||||||||||||||
|
|
|
|
|
|
|
|
|
| |||||||||||
Total | $ | 3,799 | $ | (1,531 | ) | $ | (1,841 | ) | $ | — | $ | 427 | ||||||||
|
|
|
|
|
|
|
|
|
| |||||||||||
| * | Collateral is shown on a settlement basis. |
6. Taxation and distributions
Federal income taxation — Each fund complies with the requirements under Subchapter M of the Internal Revenue Code applicable to mutual funds and intends to distribute substantially all of its net taxable income and net capital gains each year. The funds are not subject to income taxes to the extent such distributions are made. Therefore, no federal income tax provision is required.
As of and during the period ended December 31, 2020, none of the funds had a liability for any unrecognized tax benefits. Each fund recognizes interest and penalties, if any, related to unrecognized tax benefits as income tax expense in their respective statements of operations. During the period, none of the funds incurred any significant interest or penalties.
Each fund’s tax returns are not subject to examination by federal, state and, if applicable, non-U.S. tax authorities after the expiration of each jurisdiction’s statute of limitations, which is generally three years after the date of filing but can be extended in certain jurisdictions.
Non-U.S. taxation — Dividend and interest income, if any, are recorded net of non-U.S. taxes paid. The funds may file withholding tax reclaims in certain jurisdictions to recover a portion of amounts previously withheld. As a result of rulings from European courts, the funds filed for additional reclaims related to prior years. These reclaims are recorded when the amount is known and there are no significant uncertainties on collectability. Gains realized by the funds on the sale of securities in certain countries, if any, may be subject to non-U.S. taxes. If applicable, the funds record an estimated deferred tax liability based on unrealized gains to provide for potential non-U.S. taxes payable upon the sale of these securities.
Distributions — Distributions paid to shareholders are based on each fund’s net investment income and net realized gains determined on a tax basis, which may differ from net investment income and net realized gains for financial reporting purposes. These differences are due primarily to different treatment for items such as currency gains and losses; short-term capital gains and losses; capital losses related to sales of certain securities within 30 days of purchase; unrealized appreciation of certain investments in securities outside the U.S.; deferred expenses; cost of investments sold; paydowns on fixed-income securities; net capital losses; net operating losses; non-U.S. taxes on capital gains; amortization of premiums and discounts and income on certain investments. The fiscal year in which amounts are distributed may differ from the year in which the net investment income and net realized gains are recorded by the funds for financial reporting purposes.
| 290 | American Funds Insurance Series |
Table of Contents
Additional tax basis disclosures for each fund as of December 31, 2020, were as follows (dollars in thousands):
| Global Growth Fund | Global Small Capitalization Fund | Growth Fund | International Fund | New World Fund | Blue Chip Income and Growth Fund | |||||||||||||||||||
Undistributed ordinary income | $ | 23,610 | $ | — | $ | 276,979 | $ | 4,878 | $ | 10,741 | $ | 38,218 | ||||||||||||
Undistributed long-term capital gains | 445,512 | 123,145 | 5,068,501 | — | 143,589 | — | ||||||||||||||||||
Capital loss carryforward* | — | — | — | (136,440 | ) | — | (63,496 | ) | ||||||||||||||||
Capital loss carryforward utilized | — | — | — | 13,382 | — | — | ||||||||||||||||||
|
|
|
|
|
|
|
|
|
|
|
| |||||||||||||
Gross unrealized appreciation on investments | 4,449,917 | 2,433,892 | 21,167,676 | 4,059,818 | 1,659,058 | 3,361,319 | ||||||||||||||||||
Gross unrealized depreciation on investments | (135,394 | ) | (86,045 | ) | (234,902 | ) | (340,845 | ) | (33,325 | ) | (539,186 | ) | ||||||||||||
Net unrealized appreciation (depreciation) on investments | 4,314,523 | 2,347,847 | 20,932,774 | 3,718,973 | 1,625,733 | 2,822,133 | ||||||||||||||||||
|
|
|
|
|
|
|
|
|
|
|
| |||||||||||||
Cost of investments | 3,966,775 | 3,047,816 | 17,944,956 | 6,940,513 | 2,596,976 | 6,754,573 | ||||||||||||||||||
|
|
|
|
|
|
|
|
|
|
|
| |||||||||||||
Reclassification from (to) total distributable earnings/accumulated loss to (from) capital paid in on shares of beneficial interest | — | (13,829 | ) | 6 | — | (1 | ) | — | ||||||||||||||||
|
|
|
|
|
|
|
|
|
|
|
| |||||||||||||
| Global Growth and Income Fund | Growth- Income Fund | International Growth and Income Fund | Capital Income Builder | Asset Allocation Fund | Global Balanced Fund | |||||||||||||||||||
Undistributed ordinary income | $ | 4,517 | $ | 161,308 | $ | 5,778 | $ | 3,530 | $ | 248,732 | $ | 646 | ||||||||||||
Undistributed long-term capital gains | 51,479 | 403,490 | — | — | 899,471 | 1,975 | ||||||||||||||||||
Capital loss carryforward* | — | — | (76,870 | ) | (62,945 | ) | — | — | ||||||||||||||||
|
|
|
|
|
|
|
|
|
|
|
| |||||||||||||
Gross unrealized appreciation on investments | 784,941 | 15,269,066 | 428,729 | 168,138 | 8,710,090 | 103,417 | ||||||||||||||||||
Gross unrealized depreciation on investments | (35,268 | ) | (859,941 | ) | (46,994 | ) | (16,334 | ) | (257,151 | ) | (3,408 | ) | ||||||||||||
Net unrealized appreciation (depreciation) on investments | 749,673 | 14,409,125 | 381,735 | 151,804 | 8,452,939 | 100,009 | ||||||||||||||||||
|
|
|
|
|
|
|
|
|
|
|
| |||||||||||||
Cost of investments | 1,420,661 | 24,205,230 | 1,075,943 | 952,928 | 22,421,338 | 353,494 | ||||||||||||||||||
|
|
|
|
|
|
|
|
|
|
|
| |||||||||||||
Reclassification from (to) total distributable earnings/accumulated loss to (from) capital paid in on shares of beneficial interest | — | (822 | ) | (1 | ) | 1 | 18 | 2 | ||||||||||||||||
|
|
|
|
|
|
|
|
|
|
|
| |||||||||||||
See end of tables for footnote.
| American Funds Insurance Series | 291 |
Table of Contents
| Bond Fund | Capital World Bond Fund | High-Income Bond Fund | American Funds Mortgage Fund | Ultra-Short Bond Fund | U.S. Government/ AAA-Rated Securities Fund | |||||||||||||||||||
Undistributed ordinary income | $ | 293,413 | $ | 42,838 | $ | 6,554 | $ | 7,215 | $ | — | $ | 133,505 | ||||||||||||
Undistributed long-term capital gains | 218,389 | 21,745 | — | 4,438 | — | 51,890 | ||||||||||||||||||
Capital loss carryforward* | — | — | (247,718 | ) | — | (1 | ) | — | ||||||||||||||||
|
|
|
|
|
|
|
|
|
|
|
| |||||||||||||
Gross unrealized appreciation on investments | 648,591 | 188,721 | 54,124 | 6,536 | 8 | 88,168 | ||||||||||||||||||
Gross unrealized depreciation on investments | (47,722 | ) | (20,385 | ) | (55,153 | ) | (625 | ) | (2 | ) | (16,204 | ) | ||||||||||||
Net unrealized appreciation (depreciation) on investments | 600,869 | 168,336 | (1,029 | ) | 5,911 | 6 | 71,964 | |||||||||||||||||
|
|
|
|
|
|
|
|
|
|
|
| |||||||||||||
Cost of investments | 13,100,327 | 2,172,394 | 857,316 | 387,737 | 372,351 | 2,449,196 | ||||||||||||||||||
|
|
|
|
|
|
|
|
|
|
|
| |||||||||||||
Reclassification from (to) total distributable earnings/accumulated loss to (from) capital paid in on shares of beneficial interest | 1 | — | 7,377 | — | (172 | ) | — | |||||||||||||||||
|
|
|
|
|
|
|
|
|
|
|
| |||||||||||||
| Managed Risk Growth Fund | Managed Risk International Fund | Managed Risk Blue Chip Income and Growth Fund | Managed Risk Growth- Income Fund | Managed Risk Asset Allocation Fund | ||||||||||||||||
Undistributed ordinary income | $ | 1,371 | $ | 929 | $ | 4,349 | $ | 25,029 | $ | 31,041 | ||||||||||
Undistributed long-term capital gains | 24,118 | — | — | 33,730 | — | |||||||||||||||
Capital loss carryforward* | — | (11,769 | ) | (22,483 | ) | — | (31,551 | ) | ||||||||||||
|
|
|
|
|
|
|
|
|
| |||||||||||
Gross unrealized appreciation on investments | 156,525 | 33,827 | 62,066 | 380,437 | 403,906 | |||||||||||||||
Gross unrealized depreciation on investments | (4,202 | ) | (8,961 | ) | (45,409 | ) | (58,764 | ) | (17,089 | ) | ||||||||||
Net unrealized appreciation (depreciation) on investments | 152,323 | 24,866 | 16,657 | 321,673 | 386,817 | |||||||||||||||
|
|
|
|
|
|
|
|
|
| |||||||||||
Cost of investments | 412,543 | 144,392 | 339,936 | 2,110,156 | 2,394,223 | |||||||||||||||
|
|
|
|
|
|
|
|
|
| |||||||||||
| * | Capital loss carryforwards will be used to offset any capital gains realized by the funds in future years. The funds will not make distributions from capital gains while a capital loss carryforward remains. |
Distributions paid by each fund were characterized for tax purposes as follows (dollars in thousands):
Global Growth Fund
| Year ended December 31, 2020 | Year ended December 31, 2019 | |||||||||||||||||||||||
Share class | Ordinary income | Long-term capital gains | Total distributions paid | Ordinary income | Long-term capital gains | Total distributions paid | ||||||||||||||||||
Class 1 | $ | 16,383 | $ | 73,033 | $ | 89,416 | $ | 31,022 | $ | 121,251 | $ | 152,273 | ||||||||||||
Class 1A | 29 | 205 | 234 | 82 | 367 | 449 | ||||||||||||||||||
Class 2 | 13,463 | 109,286 | 122,749 | 40,119 | 204,481 | 244,600 | ||||||||||||||||||
Class 4 | 653 | 11,537 | 12,190 | 3,204 | 17,408 | 20,612 | ||||||||||||||||||
|
|
|
|
|
|
|
|
|
|
|
| |||||||||||||
Total | $ | 30,528 | $ | 194,061 | $ | 224,589 | $ | 74,427 | $ | 343,507 | $ | 417,934 | ||||||||||||
|
|
|
|
|
|
|
|
|
|
|
| |||||||||||||
See end of tables for footnote.
| 292 | American Funds Insurance Series |
Table of Contents
Global Small Capitalization Fund
| Year ended December 31, 2020 | Year ended December 31, 2019 | |||||||||||||||||||||||
Share class | Ordinary income | Long-term capital gains | Total distributions paid | Ordinary income | Long-term capital gains | Total distributions paid | ||||||||||||||||||
Class 1 | $ | 5,414 | $ | 120,074 | $ | 125,488 | $ | 28,009 | $ | 97,912 | $ | 125,921 | ||||||||||||
Class 1A | 2 | 42 | 44 | 6 | 23 | 29 | ||||||||||||||||||
Class 2 | 5,373 | 140,495 | 145,868 | 28,406 | 119,280 | 147,686 | ||||||||||||||||||
Class 4 | 408 | 12,682 | 13,090 | 1,932 | 9,184 | 11,116 | ||||||||||||||||||
|
|
|
|
|
|
|
|
|
|
|
| |||||||||||||
Total | $ | 11,197 | $ | 273,293 | $ | 284,490 | $ | 58,353 | $ | 226,399 | $ | 284,752 | ||||||||||||
|
|
|
|
|
|
|
|
|
|
|
| |||||||||||||
Growth Fund
| Year ended December 31, 2020 | Year ended December 31, 2019 | |||||||||||||||||||||||
Share class | Ordinary income | Long-term capital gains | Total distributions paid | Ordinary income | Long-term capital gains | Total distributions paid | ||||||||||||||||||
Class 1 | $ | 68,600 | $ | 285,315 | $ | 353,915 | $ | 150,838 | $ | 964,757 | $ | 1,115,595 | ||||||||||||
Class 1A | 141 | 547 | 688 | 193 | 1,290 | 1,483 | ||||||||||||||||||
Class 2 | 53,722 | 404,657 | 458,379 | 192,058 | 1,500,212 | 1,692,270 | ||||||||||||||||||
Class 3 | 860 | 5,433 | 6,293 | 2,713 | 20,442 | 23,155 | ||||||||||||||||||
Class 4 | 3,629 | 42,241 | 45,870 | 14,770 | 130,929 | 145,699 | ||||||||||||||||||
|
|
|
|
|
|
|
|
|
|
|
| |||||||||||||
Total | $ | 126,952 | $ | 738,193 | $ | 865,145 | $ | 360,572 | $ | 2,617,630 | $ | 2,978,202 | ||||||||||||
|
|
|
|
|
|
|
|
|
|
|
| |||||||||||||
International Fund
| Year ended December 31, 2020 | Year ended December 31, 2019 | |||||||||||||||||||||||
Share class | Ordinary income | Long-term capital gains | Total distributions paid | Ordinary income | Long-term capital gains | Total distributions paid | ||||||||||||||||||
Class 1 | $ | 44,223 | $ | — | $ | 44,223 | $ | 85,943 | $ | 130,060 | $ | 216,003 | ||||||||||||
Class 1A | 56 | — | 56 | 95 | 141 | 236 | ||||||||||||||||||
Class 2 | 25,688 | — | 25,688 | 59,246 | 104,778 | 164,024 | ||||||||||||||||||
Class 3 | 157 | — | 157 | 354 | 637 | 991 | ||||||||||||||||||
Class 4 | 1,591 | — | 1,591 | 4,496 | 8,870 | 13,366 | ||||||||||||||||||
|
|
|
|
|
|
|
|
|
|
|
| |||||||||||||
Total | $ | 71,715 | $ | — | $ | 71,715 | $ | 150,134 | $ | 244,486 | $ | 394,620 | ||||||||||||
|
|
|
|
|
|
|
|
|
|
|
| |||||||||||||
New World Fund
| Year ended December 31, 2020 | Year ended December 31, 2019 | |||||||||||||||||||||||
Share class | Ordinary income | Long-term capital gains | Total distributions paid | Ordinary income | Long-term capital gains | Total distributions paid | ||||||||||||||||||
Class 1 | $ | 16,847 | $ | 8,752 | $ | 25,599 | $ | 23,315 | $ | 71,500 | $ | 94,815 | ||||||||||||
Class 1A | 48 | 26 | 74 | 39 | 132 | 171 | ||||||||||||||||||
Class 2 | 6,570 | 4,233 | 10,803 | 8,693 | 34,958 | 43,651 | ||||||||||||||||||
Class 4 | 4,454 | 3,019 | 7,473 | 4,452 | 21,103 | 25,555 | ||||||||||||||||||
|
|
|
|
|
|
|
|
|
|
|
| |||||||||||||
Total | $ | 27,919 | $ | 16,030 | $ | 43,949 | $ | 36,499 | $ | 127,693 | $ | 164,192 | ||||||||||||
|
|
|
|
|
|
|
|
|
|
|
| |||||||||||||
See end of tables for footnote.
American Funds Insurance Series 293
Table of Contents
Blue Chip Income and Growth Fund
| Year ended December 31, 2020 | Year ended December 31, 2019 | |||||||||||||||||||||||
Share class | Ordinary income | Long-term capital gains | Total distributions paid | Ordinary income | Long-term capital gains | Total distributions paid | ||||||||||||||||||
Class 1 | $ | 100,756 | $ | 61,517 | $ | 162,273 | $ | 118,657 | $ | 410,713 | $ | 529,370 | ||||||||||||
Class 1A | 350 | 134 | 484 | 163 | 435 | 598 | ||||||||||||||||||
Class 2 | 48,936 | 34,662 | 83,598 | 60,118 | 238,793 | 298,911 | ||||||||||||||||||
Class 4 | 10,866 | 7,992 | 18,858 | 10,646 | 38,700 | 49,346 | ||||||||||||||||||
|
|
|
|
|
|
|
|
|
|
|
| |||||||||||||
Total | $ | 160,908 | $ | 104,305 | $ | 265,213 | $ | 189,584 | $ | 688,641 | $ | 878,225 | ||||||||||||
|
|
|
|
|
|
|
|
|
|
|
| |||||||||||||
Global Growth and Income Fund
| Year ended December 31, 2020 | Year ended December 31, 2019 | |||||||||||||||||||||||
Share class | Ordinary income | Long-term capital gains | Total distributions paid | Ordinary income | Long-term capital gains | Total distributions paid | ||||||||||||||||||
Class 1 | $ | 8,987 | $ | 15,679 | $ | 24,666 | $ | 12,475 | $ | 27,971 | $ | 40,446 | ||||||||||||
Class 1A | 28 | 53 | 81 | 33 | 66 | 99 | ||||||||||||||||||
Class 2 | 15,537 | 32,112 | 47,649 | 24,591 | 66,794 | 91,385 | ||||||||||||||||||
Class 4 | 1,576 | 3,612 | 5,188 | 2,298 | 5,970 | 8,268 | ||||||||||||||||||
|
|
|
|
|
|
|
|
|
|
|
| |||||||||||||
Total | $ | 26,128 | $ | 51,456 | $ | 77,584 | $ | 39,397 | $ | 100,801 | $ | 140,198 | ||||||||||||
|
|
|
|
|
|
|
|
|
|
|
| |||||||||||||
Growth-Income Fund
| Year ended December 31, 2020 | Year ended December 31, 2019 | |||||||||||||||||||||||
Share class | Ordinary income | Long-term capital gains | Total distributions paid | Ordinary income | Long-term capital gains | Total distributions paid | ||||||||||||||||||
Class 1 | $ | 381,174 | $ | 482,142 | $ | 863,316 | $ | 455,391 | $ | 1,825,184 | $ | 2,280,575 | ||||||||||||
Class 1A | 211 | 265 | 476 | 206 | 825 | 1,031 | ||||||||||||||||||
Class 2 | 207,651 | 305,445 | 513,096 | 272,097 | 1,260,360 | 1,532,457 | ||||||||||||||||||
Class 3 | 2,378 | 3,413 | 5,791 | 3,204 | 14,500 | 17,704 | ||||||||||||||||||
Class 4 | 17,727 | 29,072 | 46,799 | 21,474 | 103,934 | 125,408 | ||||||||||||||||||
|
|
|
|
|
|
|
|
|
|
|
| |||||||||||||
Total | $ | 609,141 | $ | 820,337 | $ | 1,429,478 | $ | 752,372 | $ | 3,204,803 | $ | 3,957,175 | ||||||||||||
|
|
|
|
|
|
|
|
|
|
|
| |||||||||||||
International Growth and Income Fund
| Year ended December 31, 2020 | Year ended December 31, 2019 | |||||||||||||||||||||||
Share class | Ordinary income | Long-term capital gains | Total distributions paid | Ordinary income | Long-term capital gains | Total distributions paid | ||||||||||||||||||
Class 1 | $ | 17,264 | $ | — | $ | 17,264 | $ | 41,626 | $ | — | $ | 41,626 | ||||||||||||
Class 1A | 38 | — | 38 | 84 | — | 84 | ||||||||||||||||||
Class 2 | 2,910 | — | 2,910 | 8,726 | — | 8,726 | ||||||||||||||||||
Class 4 | 1,255 | — | 1,255 | 3,112 | — | 3,112 | ||||||||||||||||||
|
|
|
|
|
|
|
|
|
|
|
| |||||||||||||
Total | $ | 21,467 | $ | — | $ | 21,467 | $ | 53,548 | $ | — | $ | 53,548 | ||||||||||||
|
|
|
|
|
|
|
|
|
|
|
| |||||||||||||
See end of tables for footnote.
294 American Funds Insurance Series
Table of Contents
Capital Income Builder
| Year ended December 31, 2020 | Year ended December 31, 2019 | |||||||||||||||||||||||
Share class | Ordinary income | Long-term capital gains | Total distributions paid | Ordinary income | Long-term capital gains | Total distributions paid | ||||||||||||||||||
Class 1 | $ | 17,286 | $ | — | $ | 17,286 | $ | 13,476 | $ | — | $ | 13,476 | ||||||||||||
Class 1A | 161 | — | 161 | 126 | — | 126 | ||||||||||||||||||
Class 2 | 181 | — | 181 | 137 | — | 137 | ||||||||||||||||||
Class 4 | 11,369 | — | 11,369 | 10,875 | — | 10,875 | ||||||||||||||||||
|
|
|
|
|
|
|
|
|
|
|
| |||||||||||||
Total | $ | 28,997 | $ | — | $ | 28,997 | $ | 24,614 | $ | — | $ | 24,614 | ||||||||||||
|
|
|
|
|
|
|
|
|
|
|
| |||||||||||||
Asset Allocation Fund
| Year ended December 31, 2020 | Year ended December 31, 2019 | |||||||||||||||||||||||
Share class | Ordinary income | Long-term capital gains | Total distributions paid | Ordinary income | Long-term capital gains | Total distributions paid | ||||||||||||||||||
Class 1 | $ | 333,238 | $ | 79,610 | $ | 412,848 | $ | 356,589 | $ | 816,841 | $ | 1,173,430 | ||||||||||||
Class 1A | 213 | 51 | 264 | 189 | 416 | 605 | ||||||||||||||||||
Class 2 | 80,906 | 22,747 | 103,653 | 94,178 | 253,101 | 347,279 | ||||||||||||||||||
Class 3 | 520 | 141 | 661 | 608 | 1,581 | 2,189 | ||||||||||||||||||
Class 4 | 67,789 | 21,221 | 89,010 | 71,682 | 206,152 | 277,834 | ||||||||||||||||||
|
|
|
|
|
|
|
|
|
|
|
| |||||||||||||
Total | $ | 482,666 | $ | 123,770 | $ | 606,436 | $ | 523,246 | $ | 1,278,091 | $ | 1,801,337 | ||||||||||||
|
|
|
|
|
|
|
|
|
|
|
| |||||||||||||
Global Balanced Fund
| Year ended December 31, 2020 | Year ended December 31, 2019 | |||||||||||||||||||||||
Share class | Ordinary income | Long-term capital gains | Total distributions paid | Ordinary income | Long-term capital gains | Total distributions paid | ||||||||||||||||||
Class 1 | $ | 1,746 | $ | 5,085 | $ | 6,831 | $ | 1,912 | $ | 3,479 | $ | 5,391 | ||||||||||||
Class 1A | 29 | 99 | 128 | 28 | 61 | 89 | ||||||||||||||||||
Class 2 | 2,128 | 7,631 | 9,759 | 2,521 | 5,487 | 8,008 | ||||||||||||||||||
Class 4 | 844 | 3,811 | 4,655 | 954 | 2,492 | 3,446 | ||||||||||||||||||
|
|
|
|
|
|
|
|
|
|
|
| |||||||||||||
Total | $ | 4,747 | $ | 16,626 | �� | $ | 21,373 | $ | 5,415 | $ | 11,519 | $ | 16,934 | |||||||||||
|
|
|
|
|
|
|
|
|
|
|
| |||||||||||||
Bond Fund
| Year ended December 31, 2020 | Year ended December 31, 2019 | |||||||||||||||||||||||
Share class | Ordinary income | Long-term capital gains | Total distributions paid | Ordinary income | Long-term capital gains | Total distributions paid | ||||||||||||||||||
Class 1 | $ | 185,412 | $ | 25,238 | $ | 210,650 | $ | 177,855 | $ | — | $ | 177,855 | ||||||||||||
Class 1A | 224 | 31 | 255 | 165 | — | 165 | ||||||||||||||||||
Class 2 | 96,166 | 14,478 | 110,644 | 90,796 | — | 90,796 | ||||||||||||||||||
Class 4 | 15,659 | 2,303 | 17,962 | 11,384 | — | 11,384 | ||||||||||||||||||
|
|
|
|
|
|
|
|
|
|
|
| |||||||||||||
Total | $ | 297,461 | $ | 42,050 | $ | 339,511 | $ | 280,200 | $ | — | $ | 280,200 | ||||||||||||
|
|
|
|
|
|
|
|
|
|
|
| |||||||||||||
See end of tables for footnote.
American Funds Insurance Series 295
Table of Contents
Capital World Bond Fund
| Year ended December 31, 2020 | Year ended December 31, 2019 | |||||||||||||||||||||||
Share class | Ordinary income | Long-term capital gains | Total distributions paid | Ordinary income | Long-term capital gains | Total distributions paid | ||||||||||||||||||
Class 1 | $ | 30,575 | $ | 4,335 | $ | 34,910 | $ | 19,173 | $ | — | $ | 19,173 | ||||||||||||
Class 1A | 16 | 3 | 19 | 7 | — | 7 | ||||||||||||||||||
Class 2 | 24,602 | 3,871 | 28,473 | 15,927 | — | 15,927 | ||||||||||||||||||
Class 4 | 1,252 | 206 | 1,458 | 649 | — | 649 | ||||||||||||||||||
|
|
|
|
|
|
|
|
|
|
|
| |||||||||||||
Total | $ | 56,445 | $ | 8,415 | $ | 64,860 | $ | 35,756 | $ | — | $ | 35,756 | ||||||||||||
|
|
|
|
|
|
|
|
|
|
|
| |||||||||||||
High-Income Bond Fund
| Year ended December 31, 2020 | Year ended December 31, 2019 | |||||||||||||||||||||||
Share class | Ordinary income | Long-term capital gains | Total distributions paid | Ordinary income | Long-term capital gains | Total distributions paid | ||||||||||||||||||
Class 1 | $ | 10,071 | $ | — | $ | 10,071 | $ | 33,304 | $ | — | $ | 33,304 | ||||||||||||
Class 1A | 78 | — | 78 | 45 | — | 45 | ||||||||||||||||||
Class 2 | 54,086 | — | 54,086 | 41,753 | — | 41,753 | ||||||||||||||||||
Class 3 | 799 | — | 799 | 611 | — | 611 | ||||||||||||||||||
Class 4 | 4,806 | — | 4,806 | 3,353 | — | 3,353 | ||||||||||||||||||
|
|
|
|
|
|
|
|
|
|
|
| |||||||||||||
Total | $ | 69,840 | $ | — | $ | 69,840 | $ | 79,066 | $ | — | $ | 79,066 | ||||||||||||
|
|
|
|
|
|
|
|
|
|
|
| |||||||||||||
American Funds Mortgage Fund
| Year ended December 31, 2020 | Year ended December 31, 2019 | |||||||||||||||||||||||
Share class | Ordinary income | Long-term capital gains | Total distributions paid | Ordinary income | Long-term capital gains | Total distributions paid | ||||||||||||||||||
Class 1 | $ | 3,288 | $ | 263 | $ | 3,551 | $ | 5,573 | $ | — | $ | 5,573 | ||||||||||||
Class 1A | 13 | 1 | 14 | 12 | — | 12 | ||||||||||||||||||
Class 2 | 722 | 75 | 797 | 1,355 | — | 1,355 | ||||||||||||||||||
Class 4 | 406 | 52 | 458 | 585 | — | 585 | ||||||||||||||||||
|
|
|
|
|
|
|
|
|
|
|
| |||||||||||||
Total | $ | 4,429 | $ | 391 | $ | 4,820 | $ | 7,525 | $ | — | $ | 7,525 | ||||||||||||
|
|
|
|
|
|
|
|
|
|
|
| |||||||||||||
Ultra-Short Bond Fund
| Year ended December 31, 2020 | Year ended December 31, 2019 | |||||||||||||||||||||||
Share class | Ordinary income | Long-term capital gains | Total distributions paid | Ordinary income | Long-term capital gains | Total distributions paid | ||||||||||||||||||
Class 1 | $ | 104 | $ | — | $ | 104 | $ | 604 | $ | — | $ | 604 | ||||||||||||
Class 1A | — | * | — | — | * | — | * | — | — | * | ||||||||||||||
Class 2 | 558 | — | 558 | 4,088 | — | 4,088 | ||||||||||||||||||
Class 3 | 8 | — | 8 | 59 | — | 59 | ||||||||||||||||||
Class 4 | 67 | — | 67 | 342 | — | 342 | ||||||||||||||||||
|
|
|
|
|
|
|
|
|
|
|
| |||||||||||||
Total | $ | 737 | $ | — | $ | 737 | $ | 5,093 | $ | — | $ | 5,093 | ||||||||||||
|
|
|
|
|
|
|
|
|
|
|
| |||||||||||||
See end of tables for footnote.
296 American Funds Insurance Series
Table of Contents
U.S. Government/AAA-Rated Securities Fund
| Year ended December 31, 2020 | Year ended December 31, 2019 | |||||||||||||||||||||||
Share class | Ordinary income | Long-term capital gains | Total distributions paid | Ordinary income | Long-term capital gains | Total distributions paid | ||||||||||||||||||
Class 1 | $ | 12,901 | $ | 3,231 | $ | 16,132 | $ | 31,700 | $ | — | $ | 31,700 | ||||||||||||
Class 1A | 107 | 29 | 136 | 50 | — | 50 | ||||||||||||||||||
Class 2 | 40,852 | 11,067 | 51,919 | 26,790 | — | 26,790 | ||||||||||||||||||
Class 3 | 318 | 89 | 407 | 180 | — | 180 | ||||||||||||||||||
Class 4 | 7,195 | 1,992 | 9,187 | 2,241 | — | 2,241 | ||||||||||||||||||
|
|
|
|
|
|
|
|
|
|
|
| |||||||||||||
Total | $ | 61,373 | $ | 16,408 | $ | 77,781 | $ | 60,961 | $ | — | $ | 60,961 | ||||||||||||
|
|
|
|
|
|
|
|
|
|
|
| |||||||||||||
Managed Risk Growth Fund
| Year ended December 31, 2020 | Year ended December 31, 2019 | |||||||||||||||||||||||
Share class | Ordinary income | Long-term capital gains | Total distributions paid | Ordinary income | Long-term capital gains | Total distributions paid | ||||||||||||||||||
Class P1 | $ | 64 | $ | 374 | $ | 438 | $ | 61 | $ | 256 | $ | 317 | ||||||||||||
Class P2 | 3,441 | 21,395 | 24,836 | 3,581 | 26,324 | 29,905 | ||||||||||||||||||
|
|
|
|
|
|
|
|
|
|
|
| |||||||||||||
Total | $ | 3,505 | $ | 21,769 | $ | 25,274 | $ | 3,642 | $ | 26,580 | $ | 30,222 | ||||||||||||
|
|
|
|
|
|
|
|
|
|
|
| |||||||||||||
Managed Risk International Fund
| Year ended December 31, 2020 | Year ended December 31, 2019 | |||||||||||||||||||||||
Share class | Ordinary income | Long-term capital gains | Total distributions paid | Ordinary income | Long-term capital gains | Total distributions paid | ||||||||||||||||||
Class P1 | $ | 21 | $ | 10 | $ | 31 | $ | 11 | $ | 16 | $ | 27 | ||||||||||||
Class P2 | 1,913 | 1,303 | 3,216 | 2,974 | 4,795 | 7,769 | ||||||||||||||||||
|
|
|
|
|
|
|
|
|
|
|
| |||||||||||||
Total | $ | 1,934 | $ | 1,313 | $ | 3,247 | $ | 2,985 | $ | 4,811 | $ | 7,796 | ||||||||||||
|
|
|
|
|
|
|
|
|
|
|
| |||||||||||||
Managed Risk Blue Chip Income and Growth Fund
| Year ended December 31, 2020 | Year ended December 31, 2019 | |||||||||||||||||||||||
Share class | Ordinary income | Long-term capital gains | Total distributions paid | Ordinary income | Long-term capital gains | Total distributions paid | ||||||||||||||||||
Class P1 | $ | 29 | $ | 37 | $ | 66 | $ | 13 | $ | 40 | $ | 53 | ||||||||||||
Class P2 | 6,006 | 10,828 | 16,834 | 5,566 | 17,796 | 23,362 | ||||||||||||||||||
|
|
|
|
|
|
|
|
|
|
|
| |||||||||||||
Total | $ | 6,035 | $ | 10,865 | $ | 16,900 | $ | 5,579 | $ | 17,836 | $ | 23,415 | ||||||||||||
|
|
|
|
|
|
|
|
|
|
|
| |||||||||||||
Managed Risk Growth-Income Fund
| Year ended December 31, 2020 | Year ended December 31, 2019 | |||||||||||||||||||||||
Share class | Ordinary income | Long-term capital gains | Total distributions paid | Ordinary income | Long-term capital gains | Total distributions paid | ||||||||||||||||||
Class P1 | $ | 37,519 | $ | 103,175 | $ | 140,694 | $ | 14,564 | $ | 14,505 | $ | 29,069 | ||||||||||||
Class P2 | 4,874 | 15,199 | 20,073 | 1,352 | 2,019 | 3,371 | ||||||||||||||||||
|
|
|
|
|
|
|
|
|
|
|
| |||||||||||||
Total | $ | 42,393 | $ | 118,374 | $ | 160,767 | $ | 15,916 | $ | 16,524 | $ | 32,440 | ||||||||||||
|
|
|
|
|
|
|
|
|
|
|
| |||||||||||||
See end of tables for footnote.
American Funds Insurance Series 297
Table of Contents
Managed Risk Asset Allocation Fund
| Year ended December 31, 2020 | Year ended December 31, 2019 | |||||||||||||||||||||||
Share class | Ordinary income | Long-term capital gains | Total distributions paid | Ordinary income | Long-term capital gains | Total distributions paid | ||||||||||||||||||
Class P1 | $ | 58 | $ | 146 | $ | 204 | $ | 5 | $ | 65 | $ | 70 | ||||||||||||
Class P2 | 40,641 | 105,833 | 146,474 | 62,691 | 115,050 | 177,741 | ||||||||||||||||||
|
|
|
|
|
|
|
|
|
|
|
| |||||||||||||
Total | $ | 40,699 | $ | 105,979 | $ | 146,678 | $ | 62,696 | $ | 115,115 | $ | 177,811 | ||||||||||||
|
|
|
|
|
|
|
|
|
|
|
| |||||||||||||
| * | Amount less than one thousand. |
7. Fees and transactions
CRMC, the series’ investment adviser, is the parent company of American Funds Distributors®, Inc. (“AFD”), the distributor of the series’ shares, and American Funds Service Company® (“AFS”), the series’ transfer agent. CRMC, AFD and AFS are considered related parties to the series.
Investment advisory services — The series has an investment advisory and service agreement with CRMC that provides for monthly fees accrued daily. These fees are based on annual rates that generally decrease as net asset levels increase. CRMC receives investment advisory fees from the underlying funds held by the managed risk funds. These fees are included in the net effective expense ratios that are provided as additional information in the financial highlights tables. Subadvisory fees for the managed risk funds are paid by CRMC to Milliman FRM. The managed risk funds are not responsible for paying any subadvisory fees.
Investment advisory services waivers — CRMC is waiving a portion of its investment advisory services fees for some of the funds. During the year ended December 31, 2020, CRMC voluntarily waived to proposed rates for Global Growth in advance of the next investment advisory and service agreement that will become effective May 1, 2021. In addition, CRMC waived a portion of its investment advisory services fees at the rate of 0.05% of the daily net assets of each of the managed risk funds. The waiver for each of the managed risk funds will be in effect through at least May 1, 2021, and may only be modified or terminated with the approval of the series’ board.
Effective May 1, 2020, CRMC began to waive a portion of its investment advisory fees at the rates of 0.18%, 0.26%, 0.10% and 0.18% of the daily net assets of New World Fund, Capital Income Builder, Capital World Bond Fund and American Funds Mortgage Fund, respectively. These waivers will be in effect through at least May 1, 2021, and may only be modified or terminated with the approval of the series’ board.
Investment advisory services fees are presented in each fund’s statement of operations gross of the waivers from CRMC. CRMC does not intend to recoup these waivers. For the year ended December 31, 2020, total investment advisory services fees waived by CRMC were $10,896,000.
298 American Funds Insurance Series
Table of Contents
The range of rates, net asset levels and the current annualized rates of average daily net assets for each fund before and after any investment advisory services waivers (if applicable), are as follows:
| Rates | Net asset level (in billions) | For the year ended December 31, 2020, | For the year ended December 31, 2020, | |||||||||||||||||||||
Fund | Beginning with | Ending with | Up to | In excess of | before waiver | after waiver | ||||||||||||||||||
Global Growth Fund | .690 | % | .460 | % | $ | .6 | $ | 5.0 | .511 | % | .511 | % | ||||||||||||
Global Small Capitalization Fund | .800 | .635 | .6 | 5.0 | .694 | .694 | ||||||||||||||||||
Growth Fund | .500 | .280 | .6 | 34.0 | .316 | .316 | ||||||||||||||||||
International Fund | .690 | .430 | .5 | 21.0 | .494 | .494 | ||||||||||||||||||
New World Fund | .850 | .580 | .5 | 4.0 | .698 | .574 | ||||||||||||||||||
Blue Chip Income and Growth Fund | .500 | .350 | .6 | 10.5 | .390 | .390 | ||||||||||||||||||
Global Growth and Income Fund | .690 | .480 | .6 | 3.0 | .597 | .597 | ||||||||||||||||||
Growth-Income Fund | .500 | .219 | .6 | 34.0 | .255 | .255 | ||||||||||||||||||
International Growth and Income Fund | .690 | .500 | .5 | 1.5 | .613 | .613 | ||||||||||||||||||
Capital Income Builder | .500 | .410 | .6 | 1.0 | .480 | .303 | ||||||||||||||||||
Asset Allocation Fund | .500 | .240 | .6 | 21.0 | .265 | .265 | ||||||||||||||||||
Global Balanced Fund | .660 | .510 | .5 | 1.0 | .660 | .660 | ||||||||||||||||||
Bond Fund | .480 | .320 | .6 | 13.0 | .362 | .362 | ||||||||||||||||||
Capital World Bond Fund | .570 | .450 | 1.0 | 3.0 | .533 | .465 | ||||||||||||||||||
High-Income Bond Fund | .500 | .420 | .6 | 2.0 | .484 | .484 | ||||||||||||||||||
American Funds Mortgage Fund | .420 | .290 | .6 | 3.0 | .420 | .299 | ||||||||||||||||||
Ultra-Short Bond Fund | .320 | .270 | 1.0 | 2.0 | .320 | .320 | ||||||||||||||||||
U.S. Government/AAA-Rated Securities Fund | .420 | .290 | .6 | 3.0 | .349 | .349 | ||||||||||||||||||
Managed Risk Growth Fund | .150 | all | .150 | .100 | ||||||||||||||||||||
Managed Risk International Fund | .150 | all | .150 | .100 | ||||||||||||||||||||
Managed Risk Blue Chip Income and Growth Fund | .150 | all | .150 | .100 | ||||||||||||||||||||
Managed Risk Growth-Income Fund | .150 | all | .150 | .100 | ||||||||||||||||||||
Managed Risk Asset Allocation Fund | .150 | all | .150 | .100 | ||||||||||||||||||||
Class-specific fees and expenses — Expenses that are specific to individual share classes are accrued directly to the respective share class. The principal class-specific fees and expenses are further described below:
Distribution services — The series has plans of distribution for all share classes except Class 1. Under the plans, the board of trustees approves certain categories of expenses that are used to finance activities primarily intended to sell fund shares. The plans provide for payments to pay service fees to firms that have entered into agreements with the series. These payments, based on an annualized percentage of average daily net assets, range from 0.18% to 0.50% as noted in the table below. In some cases, the board of trustees has limited the amounts that may be paid to less than the maximum allowed by the plans.
Share class | Currently approved limits | Plan limits | ||||||
Class 1A | 0.00 | % | 0.25 | % | ||||
Class 2 | 0.25 | 0.25 | ||||||
Class 3 | 0.18 | 0.18 | ||||||
Class 4 | 0.25 | 0.25 | ||||||
Class P1 | 0.00 | 0.25 | ||||||
Class P2 | 0.25 | 0.50 | ||||||
Insurance administrative services — The series has an insurance administrative services plan for Class 1A, 4, P1 and P2 shares. Under the plan, these share classes pay 0.25% of each insurance company’s respective average daily net assets in each share class to compensate the insurance companies for services provided to their separate accounts and contractholders for which the shares of the fund are beneficially owned as underlying investments of such contractholders’ annuities. These services include, but are not limited to, maintenance, shareholder communications and transactional services. The insurance companies are not related parties to the series.
Transfer agent services — The series has a shareholder services agreement with AFS under which the funds compensate AFS for providing transfer agent services to all of the funds’ share classes. These services include recordkeeping, shareholder communications and transaction processing. In addition, the managed risk funds reimburse AFS for amounts paid to third parties for performing transfer agent services on behalf of fund shareholders.
American Funds Insurance Series 299
Table of Contents
Administrative services — The series has an administrative services agreement with CRMC under which each fund compensates CRMC for providing administrative services to all of the funds’ share classes except Class P1 and P2 shares. Administrative services are provided by CRMC and its affiliates to help assist third parties providing non-distribution services to fund shareholders. These services include providing in-depth information on each fund and market developments that impact fund investments.
Administrative services also include, but are not limited to, coordinating, monitoring and overseeing third parties that provide services to fund shareholders. The agreement provides each fund, other than the managed risk funds, the ability to charge an administrative services fee at the annual rate of 0.05% of average daily net assets attributable to each share class. Currently each fund, other than the managed-risk funds, pays CRMC an administrative services fee at the annual rate of 0.03% of average daily net assets of each share class for CRMC’s provision of administrative services. For the managed risk funds, CRMC receives administrative services fees at an annual rate of 0.03% of average daily net assets from Class 1 shares of the underlying funds for administrative services provided to the series.
Accounting and administrative services — The managed risk funds have a subadministration agreement with Bank of New York Mellon (“BNY Mellon“) under which the fund compensates BNY Mellon for providing accounting and administrative services to each of the managed risk funds’ share classes. These services include, but are not limited to, fund accounting (including calculation of net asset value), financial reporting and tax services. BNY Mellon is not a related party to the managed risk funds.
Class-specific expenses under the agreements described above were as follows (dollars in thousands):
Global Growth Fund
Share class | Distribution services | Insurance administrative services | Administrative services | |||||||||
Class 1 | Not applicable | Not applicable | $ | 791 | ||||||||
Class 1A | $ | — | $ | 19 | 2 | |||||||
Class 2 | 9,578 | Not applicable | 1,150 | |||||||||
Class 4 | 1,044 | 1,044 | 125 | |||||||||
|
|
|
|
|
| |||||||
Total class-specific expenses | $ | 10,622 | $ | 1,063 | $ | 2,068 | ||||||
|
|
|
|
|
| |||||||
Global Small Capitalization Fund
Share class | Distribution services | Insurance administrative services | Administrative services | |||||||||
Class 1 | Not applicable | Not applicable | $ | 594 | ||||||||
Class 1A | $ | — | $ | 2 | — | * | ||||||
Class 2 | 5,567 | Not applicable | 668 | |||||||||
Class 4 | 517 | 516 | 62 | |||||||||
|
|
|
|
|
| |||||||
Total class-specific expenses | $ | 6,084 | $ | 518 | $ | 1,324 | ||||||
|
|
|
|
|
| |||||||
Growth Fund
Share class | Distribution services | Insurance administrative services | Administrative services | |||||||||
Class 1 | Not applicable | Not applicable | $ | 3,640 | ||||||||
Class 1A | $ | — | $ | 74 | 9 | |||||||
Class 2 | 42,263 | Not applicable | 5,071 | |||||||||
Class 3 | 414 | Not applicable | 69 | |||||||||
Class 4 | 4,410 | 4,410 | 529 | |||||||||
|
|
|
|
|
| |||||||
Total class-specific expenses | $ | 47,087 | $ | 4,484 | $ | 9,318 | ||||||
|
|
|
|
|
| |||||||
International Fund
Share class | Distribution services | Insurance administrative services | Administrative services | |||||||||
Class 1 | Not applicable | Not applicable | $ | 1,462 | ||||||||
Class 1A | $ | — | $ | 19 | 2 | |||||||
Class 2 | 9,793 | Not applicable | 1,175 | |||||||||
Class 3 | 39 | Not applicable | 7 | |||||||||
Class 4 | 886 | 886 | 106 | |||||||||
|
|
|
|
|
| |||||||
Total class-specific expenses | $ | 10,718 | $ | 905 | $ | 2,752 | ||||||
|
|
|
|
|
| |||||||
New World Fund
Share class | Distribution services | Insurance administrative services | Administrative services | |||||||||
Class 1 | Not applicable | Not applicable | $ | 588 | ||||||||
Class 1A | $ | — | $ | 20 | 2 | |||||||
Class 2 | 2,298 | Not applicable | 276 | |||||||||
Class 4 | 1,633 | 1,633 | 196 | |||||||||
|
|
|
|
|
| |||||||
Total class-specific expenses | $ | 3,931 | $ | 1,653 | $ | 1,062 | ||||||
|
|
|
|
|
| |||||||
See end of tables for footnote.
Blue Chip Income and Growth Fund
Share class | Distribution services | Insurance administrative services | Administrative services | |||||||||
Class 1 | Not applicable | Not applicable | $ | 1,537 | ||||||||
Class 1A | $ | — | $ | 34 | 4 | |||||||
Class 2 | 7,027 | Not applicable | 843 | |||||||||
Class 4 | 1,627 | 1,626 | 195 | |||||||||
|
|
|
|
|
| |||||||
Total class-specific expenses | $ | 8,654 | $ | 1,660 | $ | 2,579 | ||||||
|
|
|
|
|
| |||||||
300 American Funds Insurance Series
Table of Contents
Global Growth and Income Fund
Share class | Distribution services | Insurance administrative services | Administrative services | |||||||||
Class 1 | Not applicable | Not applicable | $ | 180 | ||||||||
Class 1A | $ | — | $ | 5 | — | * | ||||||
Class 2 | 3,032 | Not applicable | 364 | |||||||||
Class 4 | 343 | 343 | 41 | |||||||||
|
|
|
|
|
| |||||||
Total class-specific expenses | $ | 3,375 | $ | 348 | $ | 585 | ||||||
|
|
|
|
|
| |||||||
Growth-Income Fund
Share class | Distribution services | Insurance administrative services | Administrative services | |||||||||
Class 1 | Not applicable | Not applicable | $ | 6,099 | ||||||||
Class 1A | $ | — | $ | 29 | 4 | |||||||
Class 2 | 31,824 | Not applicable | 3,819 | |||||||||
Class 3 | 260 | Not applicable | 43 | |||||||||
Class 4 | 3,025 | 3,025 | 363 | |||||||||
|
|
|
|
|
| |||||||
Total class-specific expenses | $ | 35,109 | $ | 3,054 | $ | 10,328 | ||||||
|
|
|
|
|
| |||||||
International Growth and Income Fund
Share class | Distribution services | Insurance administrative services | Administrative services | |||||||||
Class 1 | Not applicable | Not applicable | $ | 310 | ||||||||
Class 1A | $ | — | $ | 6 | 1 | |||||||
Class 2 | 494 | Not applicable | 59 | |||||||||
Class 4 | 233 | 233 | 28 | |||||||||
|
|
|
|
|
| |||||||
Total class-specific expenses | $ | 727 | $ | 239 | $ | 398 | ||||||
|
|
|
|
|
| |||||||
Capital Income Builder
Share class | Distribution services | Insurance administrative services | Administrative services | |||||||||
Class 1 | Not applicable | Not applicable | $ | 163 | ||||||||
Class 1A | $ | — | $ | 14 | 1 | |||||||
Class 2 | 15 | Not applicable | 2 | |||||||||
Class 4 | 1,069 | 1,069 | 128 | |||||||||
|
|
|
|
|
| |||||||
Total class-specific expenses | $ | 1,084 | $ | 1,083 | $ | 294 | ||||||
|
|
|
|
|
| |||||||
Asset Allocation Fund
Share class | Distribution services | Insurance administrative services | Administrative services | |||||||||
Class 1 | Not applicable | Not applicable | $ | 5,209 | ||||||||
Class 1A | $ | — | $ | 29 | 4 | |||||||
Class 2 | 12,220 | Not applicable | 1,466 | |||||||||
Class 3 | 56 | Not applicable | 9 | |||||||||
Class 4 | 11,373 | 11,373 | 1,365 | |||||||||
|
|
|
|
|
| |||||||
Total class-specific expenses | $ | 23,649 | $ | 11,402 | $ | 8,053 | ||||||
|
|
|
|
|
| |||||||
Global Balanced Fund
Share class | Distribution services | Insurance administrative services | Administrative services | |||||||||
Class 1 | Not applicable | Not applicable | $ | 39 | ||||||||
Class 1A | $ | — | $ | 5 | 1 | |||||||
Class 2 | 487 | Not applicable | 58 | |||||||||
Class 4 | 234 | 234 | 28 | |||||||||
|
|
|
|
|
| |||||||
Total class-specific expenses | $ | 721 | $ | 239 | $ | 126 | ||||||
|
|
|
|
|
| |||||||
Bond Fund
Share class | Distribution services | Insurance administrative services | Administrative services | |||||||||
Class 1 | Not applicable | Not applicable | $ | 1,950 | ||||||||
Class 1A | $ | — | $ | 20 | 2 | |||||||
Class 2 | 9,104 | Not applicable | 1,093 | |||||||||
Class 4 | 1,484 | 1,484 | 178 | |||||||||
|
|
|
|
|
| |||||||
Total class-specific expenses | $ | 10,588 | $ | 1,504 | $ | 3,223 | ||||||
|
|
|
|
|
| |||||||
Capital World Bond Fund
Share class | Distribution services | Insurance administrative services | Administrative services | |||||||||
Class 1 | Not applicable | Not applicable | $ | 329 | ||||||||
Class 1A | $ | — | $ | 1 | — | * | ||||||
Class 2 | 2,480 | Not applicable | 298 | |||||||||
Class 4 | 129 | 130 | 15 | |||||||||
|
|
|
|
|
| |||||||
Total class-specific expenses | $ | 2,609 | $ | 131 | $ | 642 | ||||||
|
|
|
|
|
| |||||||
See end of tables for footnote.
American Funds Insurance Series 301
Table of Contents
High-Income Bond Fund
Share class | Distribution services | Insurance administrative services | Administrative services | |||||||||
Class 1 | Not applicable | Not applicable | $ | 73 | ||||||||
Class 1A | $ | — | $ | 2 | — | * | ||||||
Class 2 | 1,571 | Not applicable | 188 | |||||||||
Class 3 | 17 | Not applicable | 3 | |||||||||
Class 4 | 138 | 138 | 17 | |||||||||
|
|
|
|
|
| |||||||
Total class-specific expenses | $ | 1,726 | $ | 140 | $ | 281 | ||||||
|
|
|
|
|
| |||||||
American Funds Mortgage Fund
Share class | Distribution services | Insurance administrative services | Administrative services | |||||||||
Class 1 | Not applicable | Not applicable | $ | 61 | ||||||||
Class 1A | $ | — | $ | 2 | — | * | ||||||
Class 2 | 142 | Not applicable | 17 | |||||||||
Class 4 | 88 | 88 | 11 | |||||||||
|
|
|
|
|
| |||||||
Total class-specific expenses | $ | 230 | $ | 90 | $ | 89 | ||||||
|
|
|
|
|
| |||||||
Ultra-Short Bond Fund
Share class | Distribution services | Insurance administrative services | Administrative services | |||||||||
Class 1 | Not applicable | Not applicable | $ | 12 | ||||||||
Class 1A | $ | — | $ | — | * | — | * | |||||
Class 2 | 662 | Not applicable | 80 | |||||||||
Class 3 | 7 | Not applicable | 1 | |||||||||
Class 4 | 85 | 85 | 10 | |||||||||
|
|
|
|
|
| |||||||
Total class-specific expenses | $ | 754 | $ | 85 | $ | 103 | ||||||
|
|
|
|
|
| |||||||
U.S. Government/AAA-Rated Securities Fund
Share class | Distribution services | Insurance administrative services | Administrative services | |||||||||
Class 1 | Not applicable | Not applicable | $ | 223 | ||||||||
Class 1A | $ | — | $ | 9 | 1 | |||||||
Class 2 | 3,460 | Not applicable | 415 | |||||||||
Class 3 | 18 | Not applicable | 3 | |||||||||
Class 4 | 578 | 578 | 70 | |||||||||
|
|
|
|
|
| |||||||
Total class-specific expenses | $ | 4,056 | $ | 587 | $ | 712 | ||||||
|
|
|
|
|
| |||||||
Managed Risk Growth Fund
Share class | Distribution services | Insurance administrative services | ||||||
Class P1 | Not applicable | $ | 21 | |||||
Class P2 | $ | 1,177 | 1,177 | |||||
|
|
|
| |||||
Total class-specific expenses | $ | 1,177 | $ | 1,198 | ||||
|
|
|
| |||||
Managed Risk International Fund
Share class | Distribution services | Insurance administrative services | ||||||
Class P1 | Not applicable | $ | 3 | |||||
Class P2 | $ | 389 | 389 | |||||
|
|
|
| |||||
Total class-specific expenses | $ | 389 | $ | 392 | ||||
|
|
|
| |||||
Managed Risk Blue Chip Income and Growth Fund
Share class | Distribution services | Insurance administrative services | ||||||
Class P1 | Not applicable | $ | 3 | |||||
Class P2 | $ | 861 | 861 | |||||
|
|
|
| |||||
Total class-specific expenses | $ | 861 | $ | 864 | ||||
|
|
|
| |||||
Managed Risk Growth-Income Fund
Share class | Distribution services | Insurance administrative services | ||||||
Class P1 | Not applicable | $ | 4,911 | |||||
Class P2 | $ | 718 | 719 | |||||
|
|
|
| |||||
Total class-specific expenses | $ | 718 | $ | 5,630 | ||||
|
|
|
| |||||
Managed Risk Asset Allocation Fund
Share class | Distribution services | Insurance administrative services | ||||||
Class P1 | Not applicable | $ | 9 | |||||
Class P2 | $ | 6,703 | 6,703 | |||||
|
|
|
| |||||
Total class-specific expenses | $ | 6,703 | $ | 6,712 | ||||
|
|
|
| |||||
| * | Amount less than one thousand. |
302 American Funds Insurance Series
Table of Contents
Miscellaneous fee reimbursements — CRMC has agreed to reimburse a portion of miscellaneous fees and expenses for Managed Risk International Fund. Miscellaneous expenses exclude investment advisory services fees and distribution services fees. This reimbursement may be adjusted or discontinued by CRMC, subject to any restrictions in the series’ prospectus. For the year ended December 31, 2020, total fees and expenses reimbursed by CRMC were $41,000. CRMC does not intend to recoup this reimbursement. Fees and expenses in the fund’s statement of operations are presented gross of any reimbursements from CRMC.
Trustees’ deferred compensation — Trustees who are unaffiliated with CRMC may elect to defer the cash payment of part or all of their compensation. These deferred amounts, which remain as liabilities of the funds, are treated as if invested in one or more of the American Funds. These amounts represent general, unsecured liabilities of the funds and vary according to the total returns of the selected funds. Trustees’ compensation, shown on the accompanying financial statements, reflects current fees (either paid in cash or deferred) and a net decrease in the value of the deferred amounts as follows (dollars in thousands):
Fund | Current fees | Increase in value of deferred amounts | Total trustees’ compensation | |||||||||
Global Growth Fund | $ | 22 | $ | 14 | $ | 36 | ||||||
Global Small Capitalization Fund | 14 | 9 | 23 | |||||||||
Growth Fund | 96 | 66 | 162 | |||||||||
International Fund | 30 | 17 | 47 | |||||||||
New World Fund | 11 | 7 | 18 | |||||||||
Blue Chip Income and Growth Fund | 27 | 17 | 44 | |||||||||
Global Growth and Income Fund | 6 | 4 | 10 | |||||||||
Growth-Income Fund | 111 | 66 | 177 | |||||||||
International Growth and Income Fund | 4 | 3 | 7 | |||||||||
Capital Income Builder | 3 | 2 | 5 | |||||||||
Asset Allocation Fund | 86 | 49 | 135 | |||||||||
Global Balanced Fund | 1 | 1 | 2 | |||||||||
Bond Fund | 34 | 17 | 51 | |||||||||
Capital World Bond Fund | 7 | 4 | 11 | |||||||||
High-Income Bond Fund | 3 | 1 | 4 | |||||||||
American Funds Mortgage Fund | 1 | — | * | 1 | ||||||||
Ultra-Short Bond Fund | 1 | 1 | 2 | |||||||||
U.S. Government/AAA-Rated Securities Fund | 8 | 1 | 9 | |||||||||
Managed Risk Growth Fund | 2 | 1 | 3 | |||||||||
Managed Risk International Fund | 1 | — | * | 1 | ||||||||
Managed Risk Blue Chip Income and Growth Fund | 1 | 1 | 2 | |||||||||
Managed Risk Growth-Income Fund | 7 | 4 | 11 | |||||||||
Managed Risk Asset Allocation Fund | 8 | 5 | 13 | |||||||||
| * | Amount less than one thousand. |
Affiliated officers and trustees — Officers and certain trustees of the series are or may be considered to be affiliated with CRMC, AFD and AFS. No affiliated officers or trustees received any compensation directly from any fund in the series.
Investment in CCF — Some of the funds hold shares of CCF, an institutional prime money market fund managed by CRMC. CCF invests in high-quality, short-term money market instruments. CCF is used as the primary investment vehicle for each fund’s short-term investments. CCF shares are only available for purchase by CRMC, its affiliates, and other funds managed by CRMC. CCF shares are not available to the public. CRMC does not receive an investment advisory services fee from CCF.
Security transactions with related funds — The funds may purchase from, or sell securities to, other CRMC-managed funds (or funds managed by certain affiliates of CRMC) under procedures adopted by the fund’s board of trustees. The funds involved in such transactions are considered related by virtue of having a common investment adviser (or affiliated investment advisers), common trustees and/or common officers. When such transactions occur, each transaction is executed at the current market price of the security and no brokerage commissions or fees are paid in accordance with Rule 17a-7 of the 1940 Act.
American Funds Insurance Series 303
Table of Contents
The following table presents purchase and sale transactions between each fund and related funds, and net realized gain or loss from such sales, if any, as of December 31, 2020 (dollars in thousands):
Fund | Purchases | Sales | Net realized gain (loss) | |||||||||
Global Growth Fund | $ | 139,989 | $ | 85,866 | $ | 21,004 | ||||||
Global Small Capitalization Fund | 56,497 | 146,865 | 24,912 | |||||||||
Growth Fund | 569,889 | 816,449 | 267,011 | |||||||||
International Fund | 118,996 | 128,534 | 14,532 | |||||||||
New World Fund | 53,097 | 61,321 | 2,932 | |||||||||
Blue Chip Income and Growth Fund | 150,238 | 75,751 | 590 | |||||||||
Global Growth and Income Fund | 24,156 | 52,461 | (6,576 | ) | ||||||||
Growth-Income Fund | 471,004 | 714,281 | 60,282 | |||||||||
International Growth and Income Fund | 16,646 | 26,076 | 874 | |||||||||
Capital Income Builder | 82,136 | 47,478 | (9,672 | ) | ||||||||
Asset Allocation Fund | 262,721 | 379,296 | 62,547 | |||||||||
Bond Fund | 88,459 | 33,704 | 2,473 | |||||||||
Capital World Bond Fund | 11,945 | 12,762 | (51 | ) | ||||||||
High-Income Bond Fund | 6,251 | 371,551 | (18,424 | ) | ||||||||
U.S. Government/AAA-Rated Securities Fund | — | 444,556 | 22,675 | |||||||||
8. Committed line of credit
Global Small Capitalization Fund, New World Fund and High-Income Bond Fund participate with other funds managed by CRMC in a $1.5 billion credit facility (the “line of credit”) to be utilized for temporary purposes to fund shareholder redemptions. Each fund has agreed to pay commitment fees on its pro-rata portion of the line of credit, which are reflected in other expenses in each fund’s statement of operations. None of the funds borrowed on this line of credit at any time during the year ended December 31, 2020.
9. Capital share transactions
Capital share transactions in the funds were as follows (dollars and shares in thousands):
Global Growth Fund
| Sales* | Reinvestments of distributions | Repurchases* | Net increase (decrease) | |||||||||||||||||||||||||||||
Share class | Amount | Shares | Amount | Shares | Amount | Shares | Amount | Shares | ||||||||||||||||||||||||
Year ended December 31, 2020 | ||||||||||||||||||||||||||||||||
Class 1 | $ | 402,110 | 11,550 | $ | 89,416 | 2,661 | $ | (365,952 | ) | (11,056 | ) | $ | 125,574 | 3,155 | ||||||||||||||||||
Class 1A | 4,330 | 121 | 234 | 7 | (2,564 | ) | (87 | ) | 2,000 | 41 | ||||||||||||||||||||||
Class 2 | 46,502 | 1,410 | 122,749 | 3,738 | (613,644 | ) | (18,242 | ) | (444,393 | ) | (13,094 | ) | ||||||||||||||||||||
Class 4 | 96,748 | 2,812 | 12,190 | 377 | (63,324 | ) | (1,924 | ) | 45,614 | 1,265 | ||||||||||||||||||||||
|
|
|
|
|
|
|
|
|
|
|
|
|
|
|
| |||||||||||||||||
Total net increase (decrease) | $ | 549,690 | 15,893 | $ | 224,589 | 6,783 | $ | (1,045,484 | ) | (31,309 | ) | $ | (271,205 | ) | (8,633 | ) | ||||||||||||||||
|
|
|
|
|
|
|
|
|
|
|
|
|
|
|
| |||||||||||||||||
Year ended December 31, 2019 | ||||||||||||||||||||||||||||||||
Class 1 | $ | 230,089 | 7,777 | $ | 152,273 | 5,192 | $ | (333,318 | ) | (11,180 | ) | $ | 49,044 | 1,789 | ||||||||||||||||||
Class 1A | 1,744 | 62 | 449 | 15 | (572 | ) | (19 | ) | 1,621 | 58 | ||||||||||||||||||||||
Class 2 | 44,842 | 1,552 | 244,600 | 8,453 | (555,704 | ) | (18,803 | ) | (266,262 | ) | (8,798 | ) | ||||||||||||||||||||
Class 4 | 70,615 | 2,415 | 20,612 | 716 | (29,399 | ) | (1,009 | ) | 61,828 | 2,122 | ||||||||||||||||||||||
|
|
|
|
|
|
|
|
|
|
|
|
|
|
|
| |||||||||||||||||
Total net increase (decrease) | $ | 347,290 | 11,806 | $ | 417,934 | 14,376 | $ | (918,993 | ) | (31,011 | ) | $ | (153,769 | ) | (4,829 | ) | ||||||||||||||||
|
|
|
|
|
|
|
|
|
|
|
|
|
|
|
| |||||||||||||||||
See end of tables for footnotes.
304 American Funds Insurance Series
Table of Contents
Global Small Capitalization Fund
| Sales* | Reinvestments of distributions | Repurchases* | Net (decrease) increase | |||||||||||||||||||||||||||||
Share class | Amount | Shares | Amount | Shares | Amount | Shares | Amount | Shares | ||||||||||||||||||||||||
Year ended December 31, 2020 | ||||||||||||||||||||||||||||||||
Class 1 | $ | 223,000 | 10,191 | $ | 125,091 | 5,146 | $ | (466,963 | ) | (18,580 | ) | $ | (118,872 | ) | (3,243 | ) | ||||||||||||||||
Class 1A | 627 | 24 | 43 | 2 | (268 | ) | (10 | ) | 402 | 16 | ||||||||||||||||||||||
Class 2 | 60,922 | 2,877 | 145,869 | 6,194 | (409,129 | ) | (15,839 | ) | (202,338 | ) | (6,768 | ) | ||||||||||||||||||||
Class 4 | 35,430 | 1,424 | 13,089 | 554 | (34,957 | ) | (1,396 | ) | 13,562 | 582 | ||||||||||||||||||||||
|
|
|
|
|
|
|
|
|
|
|
|
|
|
|
| |||||||||||||||||
Total net increase (decrease) | $ | 319,979 | 14,516 | $ | 284,092 | 11,896 | $ | (911,317 | ) | (35,825 | ) | $ | (307,246 | ) | (9,413 | ) | ||||||||||||||||
|
|
|
|
|
|
|
|
|
|
|
|
|
|
|
| |||||||||||||||||
Year ended December 31, 2019 | ||||||||||||||||||||||||||||||||
Class 1 | $ | 337,817 | 13,612 | $ | 125,498 | 5,216 | $ | (226,381 | ) | (9,119 | ) | $ | 236,934 | 9,709 | ||||||||||||||||||
Class 1A | 196 | 8 | 28 | 2 | (96 | ) | (4 | ) | 128 | 6 | ||||||||||||||||||||||
Class 2 | 21,553 | 917 | 147,687 | 6,340 | (327,909 | ) | (13,596 | ) | (158,669 | ) | (6,339 | ) | ||||||||||||||||||||
Class 4 | 35,449 | 1,468 | 11,115 | 475 | (22,005 | ) | (911 | ) | 24,559 | 1,032 | ||||||||||||||||||||||
|
|
|
|
|
|
|
|
|
|
|
|
|
|
|
| |||||||||||||||||
Total net increase (decrease) | $ | 395,015 | 16,005 | $ | 284,328 | 12,033 | $ | (576,391 | ) | (23,630 | ) | $ | 102,952 | 4,408 | ||||||||||||||||||
|
|
|
|
|
|
|
|
|
|
|
|
|
|
|
| |||||||||||||||||
Growth Fund
| Sales* | Reinvestments of distributions | Repurchases* | Net (decrease) increase | |||||||||||||||||||||||||||||
Share class | Amount | Shares | Amount | Shares | Amount | Shares | Amount | Shares | ||||||||||||||||||||||||
Year ended December 31, 2020 | ||||||||||||||||||||||||||||||||
Class 1 | $ | 2,322,779 | 26,334 | $ | 353,232 | 3,917 | $ | (2,999,100 | ) | (33,591 | ) | $ | (323,089 | ) | (3,340 | ) | ||||||||||||||||
Class 1A | 33,301 | 338 | 688 | 8 | (5,835 | ) | (64 | ) | 28,154 | 282 | ||||||||||||||||||||||
Class 2 | 437,349 | 4,937 | 458,379 | 5,218 | (3,162,923 | ) | (34,505 | ) | (2,267,195 | ) | (24,350 | ) | ||||||||||||||||||||
Class 3 | 1,333 | 17 | 6,293 | 70 | (37,446 | ) | (395 | ) | (29,820 | ) | (308 | ) | ||||||||||||||||||||
Class 4 | 325,002 | 3,612 | 45,870 | 534 | (283,912 | ) | (3,180 | ) | 86,960 | 966 | ||||||||||||||||||||||
|
|
|
|
|
|
|
|
|
|
|
|
|
|
|
| |||||||||||||||||
Total net increase (decrease) | $ | 3,119,764 | 35,238 | $ | 864,462 | 9,747 | $ | (6,489,216 | ) | (71,735 | ) | $ | (2,504,990 | ) | (26,750 | ) | ||||||||||||||||
|
|
|
|
|
|
|
|
|
|
|
|
|
|
|
| |||||||||||||||||
Year ended December 31, 2019 | ||||||||||||||||||||||||||||||||
Class 1 | $ | 896,700 | 11,839 | $ | 1,112,851 | 15,532 | $ | (1,155,174 | ) | (15,026 | ) | $ | 854,377 | 12,345 | ||||||||||||||||||
Class 1A | 6,106 | 81 | 1,482 | 21 | (1,574 | ) | (20 | ) | 6,014 | 82 | ||||||||||||||||||||||
Class 2 | 294,401 | 3,907 | 1,692,272 | 23,866 | (2,108,133 | ) | (27,828 | ) | (121,460 | ) | (55 | ) | ||||||||||||||||||||
Class 3 | 1,763 | 23 | 23,154 | 321 | (29,706 | ) | (390 | ) | (4,789 | ) | (46 | ) | ||||||||||||||||||||
Class 4 | 227,023 | 3,055 | 145,699 | 2,087 | (131,942 | ) | (1,767 | ) | 240,780 | 3,375 | ||||||||||||||||||||||
|
|
|
|
|
|
|
|
|
|
|
|
|
|
|
| |||||||||||||||||
Total net increase (decrease) | $ | 1,425,993 | 18,905 | $ | 2,975,458 | 41,827 | $ | (3,426,529 | ) | (45,031 | ) | $ | 974,922 | 15,701 | ||||||||||||||||||
|
|
|
|
|
|
|
|
|
|
|
|
|
|
|
| |||||||||||||||||
See end of tables for footnotes.
American Funds Insurance Series 305
Table of Contents
International Fund
| Sales* | Reinvestments of distributions | Repurchases* | Net (decrease) increase | |||||||||||||||||||||||||||||
Share class | Amount | Shares | Amount | Shares | Amount | Shares | Amount | Shares | ||||||||||||||||||||||||
Year ended December 31, 2020 | ||||||||||||||||||||||||||||||||
Class 1 | $ | 535,603 | 30,721 | $ | 44,223 | 2,049 | $ | (963,355 | ) | (50,229 | ) | $ | (383,529 | ) | (17,459 | ) | ||||||||||||||||
Class 1A | 2,754 | 147 | 56 | 2 | (1,389 | ) | (70 | ) | 1,421 | 79 | ||||||||||||||||||||||
Class 2 | 271,356 | 15,425 | 25,688 | 1,204 | (667,572 | ) | (33,696 | ) | (370,528 | ) | (17,067 | ) | ||||||||||||||||||||
Class 3 | 226 | 12 | 157 | 7 | (3,148 | ) | (157 | ) | (2,765 | ) | (138 | ) | ||||||||||||||||||||
Class 4 | 52,233 | 2,881 | 1,591 | 76 | (62,187 | ) | (3,226 | ) | (8,363 | ) | (269 | ) | ||||||||||||||||||||
|
|
|
|
|
|
|
|
|
|
|
|
|
|
|
| |||||||||||||||||
Total net increase (decrease) | $ | 862,172 | 49,186 | $ | 71,715 | 3,338 | $ | (1,697,651 | ) | (87,378 | ) | $ | (763,764 | ) | (34,854 | ) | ||||||||||||||||
|
|
|
|
|
|
|
|
|
|
|
|
|
|
|
| |||||||||||||||||
Year ended December 31, 2019 | ||||||||||||||||||||||||||||||||
Class 1 | $ | 171,233 | 8,812 | $ | 215,640 | 10,988 | $ | (699,395 | ) | (35,642 | ) | $ | (312,522 | ) | (15,842 | ) | ||||||||||||||||
Class 1A | 2,060 | 106 | 236 | 12 | (1,174 | ) | (59 | ) | 1,122 | 59 | ||||||||||||||||||||||
Class 2 | 175,514 | 9,064 | 164,024 | 8,407 | (591,706 | ) | (30,261 | ) | (252,168 | ) | (12,790 | ) | ||||||||||||||||||||
Class 3 | 238 | 13 | 991 | 50 | (4,348 | ) | (224 | ) | (3,119 | ) | (161 | ) | ||||||||||||||||||||
Class 4 | 60,129 | 3,112 | 13,366 | 694 | (43,609 | ) | (2,263 | ) | 29,886 | 1,543 | ||||||||||||||||||||||
|
|
|
|
|
|
|
|
|
|
|
|
|
|
|
| |||||||||||||||||
Total net increase (decrease) | $ | 409,174 | 21,107 | $ | 394,257 | 20,151 | $ | (1,340,232 | ) | (68,449 | ) | $ | (536,801 | ) | (27,191 | ) | ||||||||||||||||
|
|
|
|
|
|
|
|
|
|
|
|
|
|
|
| |||||||||||||||||
New World Fund
| Sales* | Reinvestments of distributions | Repurchases* | Net (decrease) increase | |||||||||||||||||||||||||||||
Share class | Amount | Shares | Amount | Shares | Amount | Shares | Amount | Shares | ||||||||||||||||||||||||
Year ended December 31, 2020 | ||||||||||||||||||||||||||||||||
Class 1 | $ | 80,299 | 3,402 | $ | 25,570 | 1,027 | $ | (337,036 | ) | (13,731 | ) | $ | (231,167 | ) | (9,302 | ) | ||||||||||||||||
Class 1A | 12,129 | 461 | 73 | 3 | (1,703 | ) | (71 | ) | 10,499 | 393 | ||||||||||||||||||||||
Class 2 | 102,697 | 3,915 | 10,803 | 447 | (184,643 | ) | (7,218 | ) | (71,143 | ) | (2,856 | ) | ||||||||||||||||||||
Class 4 | 89,140 | 3,662 | 7,473 | 310 | (84,462 | ) | (3,316 | ) | 12,151 | 656 | ||||||||||||||||||||||
|
|
|
|
|
|
|
|
|
|
|
|
|
|
|
| |||||||||||||||||
Total net increase (decrease) | $ | 284,265 | 11,440 | $ | 43,919 | 1,787 | $ | (607,844 | ) | (24,336 | ) | $ | (279,660 | ) | (11,109 | ) | ||||||||||||||||
|
|
|
|
|
|
|
|
|
|
|
|
|
|
|
| |||||||||||||||||
Year ended December 31, 2019 | ||||||||||||||||||||||||||||||||
Class 1 | $ | 149,338 | 6,057 | $ | 94,601 | 3,981 | $ | (207,841 | ) | (8,743 | ) | $ | 36,098 | 1,295 | ||||||||||||||||||
Class 1A | 1,685 | 70 | 171 | 7 | (408 | ) | (17 | ) | 1,448 | 60 | ||||||||||||||||||||||
Class 2 | 68,793 | 2,911 | 43,651 | 1,861 | (165,106 | ) | (6,991 | ) | (52,662 | ) | (2,219 | ) | ||||||||||||||||||||
Class 4 | 83,946 | 3,576 | 25,555 | 1,096 | (39,744 | ) | (1,687 | ) | 69,757 | 2,985 | ||||||||||||||||||||||
|
|
|
|
|
|
|
|
|
|
|
|
|
|
|
| |||||||||||||||||
Total net increase (decrease) | $ | 303,762 | 12,614 | $ | 163,978 | 6,945 | $ | (413,099 | ) | (17,438 | ) | $ | 54,641 | 2,121 | ||||||||||||||||||
|
|
|
|
|
|
|
|
|
|
|
|
|
|
|
| |||||||||||||||||
See end of tables for footnotes.
306 American Funds Insurance Series
Table of Contents
Blue Chip Income and Growth Fund
| Sales* | Reinvestments of distributions | Repurchases* | Net (decrease) increase | |||||||||||||||||||||||||||||
Share class | Amount | Shares | Amount | Shares | Amount | Shares | Amount | Shares | ||||||||||||||||||||||||
Year ended December 31, 2020 | ||||||||||||||||||||||||||||||||
Class 1 | $ | 474,186 | 41,847 | $ | 161,061 | 11,902 | $ | (825,919 | ) | (67,505 | ) | $ | (190,672 | ) | (13,756 | ) | ||||||||||||||||
Class 1A | 15,517 | 1,215 | 484 | 35 | (2,556 | ) | (194 | ) | 13,445 | 1,056 | ||||||||||||||||||||||
Class 2 | 75,893 | 6,771 | 83,599 | 6,287 | (337,510 | ) | (26,379 | ) | (178,018 | ) | (13,321 | ) | ||||||||||||||||||||
Class 4 | 148,645 | 12,358 | 18,858 | 1,428 | (54,754 | ) | (4,444 | ) | 112,749 | 9,342 | ||||||||||||||||||||||
|
|
|
|
|
|
|
|
|
|
|
|
|
|
|
| |||||||||||||||||
Total net increase (decrease) | $ | 714,241 | 62,191 | $ | 264,002 | 19,652 | $ | (1,220,739 | ) | (98,522 | ) | $ | (242,496 | ) | (16,679 | ) | ||||||||||||||||
|
|
|
|
|
|
|
|
|
|
|
|
|
|
|
| |||||||||||||||||
Year ended December 31, 2019 | ||||||||||||||||||||||||||||||||
Class 1 | $ | 213,624 | 16,737 | $ | 525,212 | 41,913 | $ | (484,978 | ) | (37,271 | ) | $ | 253,858 | 21,379 | ||||||||||||||||||
Class 1A | 5,177 | 403 | 598 | 47 | (451 | ) | (35 | ) | 5,324 | 415 | ||||||||||||||||||||||
Class 2 | 28,815 | 2,244 | 298,911 | 24,211 | (366,595 | ) | (28,328 | ) | (38,869 | ) | (1,873 | ) | ||||||||||||||||||||
Class 4 | 198,327 | 15,485 | 49,345 | 4,013 | (38,161 | ) | (2,979 | ) | 209,511 | 16,519 | ||||||||||||||||||||||
|
|
|
|
|
|
|
|
|
|
|
|
|
|
|
| |||||||||||||||||
Total net increase (decrease) | $ | 445,943 | 34,869 | $ | 874,066 | 70,184 | $ | (890,185 | ) | (68,613 | ) | $ | 429,824 | 36,440 | ||||||||||||||||||
|
|
|
|
|
|
|
|
|
|
|
|
|
|
|
| |||||||||||||||||
Global Growth and Income Fund
| Sales* | Reinvestments of distributions | Repurchases* | Net (decrease) increase | |||||||||||||||||||||||||||||
Share class | Amount | Shares | Amount | Shares | Amount | Shares | Amount | Shares | ||||||||||||||||||||||||
Year ended December 31, 2020 | ||||||||||||||||||||||||||||||||
Class 1 | $ | 274,643 | 21,210 | $ | 23,674 | 1,607 | $ | (306,092 | ) | (22,650 | ) | $ | (7,775 | ) | 167 | |||||||||||||||||
Class 1A | 474 | 35 | 81 | 6 | (266 | ) | (18 | ) | 289 | 23 | ||||||||||||||||||||||
Class 2 | 48,178 | 3,670 | 47,647 | 3,258 | (175,562 | ) | (11,876 | ) | (79,737 | ) | (4,948 | ) | ||||||||||||||||||||
Class 4 | 26,989 | 1,950 | 5,189 | 362 | (19,540 | ) | (1,418 | ) | 12,638 | 894 | ||||||||||||||||||||||
|
|
|
|
|
|
|
|
|
|
|
|
|
|
|
| |||||||||||||||||
Total net increase (decrease) | $ | 350,284 | 26,865 | $ | 76,591 | 5,233 | $ | (501,460 | ) | (35,962 | ) | $ | (74,585 | ) | (3,864 | ) | ||||||||||||||||
|
|
|
|
|
|
|
|
|
|
|
|
|
|
|
| |||||||||||||||||
Year ended December 31, 2019 | ||||||||||||||||||||||||||||||||
Class 1 | $ | 43,801 | 2,986 | $ | 38,762 | 2,639 | $ | (61,157 | ) | (4,174 | ) | $ | 21,406 | 1,451 | ||||||||||||||||||
Class 1A | 809 | 55 | 100 | 7 | (205 | ) | (14 | ) | 704 | 48 | ||||||||||||||||||||||
Class 2 | 15,277 | 1,057 | 91,385 | 6,251 | (232,647 | ) | (15,758 | ) | (125,985 | ) | (8,450 | ) | ||||||||||||||||||||
Class 4 | 34,845 | 2,405 | 8,268 | 574 | (16,175 | ) | (1,116 | ) | 26,938 | 1,863 | ||||||||||||||||||||||
|
|
|
|
|
|
|
|
|
|
|
|
|
|
|
| |||||||||||||||||
Total net increase (decrease) | $ | 94,732 | 6,503 | $ | 138,515 | 9,471 | $ | (310,184 | ) | (21,062 | ) | $ | (76,937 | ) | (5,088 | ) | ||||||||||||||||
|
|
|
|
|
|
|
|
|
|
|
|
|
|
|
| |||||||||||||||||
See end of tables for footnotes.
American Funds Insurance Series 307
Table of Contents
Growth-Income Fund
| Sales* | Reinvestments of distributions | Repurchases* | Net (decrease) increase | |||||||||||||||||||||||||||||
Share class | Amount | Shares | Amount | Shares | Amount | Shares | Amount | Shares | ||||||||||||||||||||||||
Year ended December 31, 2020 | ||||||||||||||||||||||||||||||||
Class 1 | $ | 1,892,111 | 42,172 | $ | 862,018 | 17,198 | $ | (2,883,447 | ) | (61,087 | ) | $ | (129,318 | ) | (1,717 | ) | ||||||||||||||||
Class 1A | 4,637 | 94 | 476 | 9 | (1,475 | ) | (30 | ) | 3,638 | 73 | ||||||||||||||||||||||
Class 2 | 252,743 | 5,452 | 513,097 | 10,416 | (1,497,209 | ) | (30,770 | ) | (731,369 | ) | (14,902 | ) | ||||||||||||||||||||
Class 3 | 2,002 | 41 | 5,790 | 116 | (23,231 | ) | (465 | ) | (15,439 | ) | (308 | ) | ||||||||||||||||||||
Class 4 | 174,576 | 3,682 | 46,799 | 965 | (148,613 | ) | (3,153 | ) | 72,762 | 1,494 | ||||||||||||||||||||||
|
|
|
|
|
|
|
|
|
|
|
|
|
|
|
| |||||||||||||||||
Total net increase (decrease) | $ | 2,326,069 | 51,441 | $ | 1,428,180 | 28,704 | $ | (4,553,975 | ) | (95,505 | ) | $ | (799,726 | ) | (15,360 | ) | ||||||||||||||||
|
|
|
|
|
|
|
|
|
|
|
|
|
|
|
| |||||||||||||||||
Year ended December 31, 2019 | ||||||||||||||||||||||||||||||||
Class 1 | $ | 1,061,581 | 21,810 | $ | 2,276,758 | 48,690 | $ | (1,229,398 | ) | (25,018 | ) | $ | 2,108,941 | 45,482 | ||||||||||||||||||
Class 1A | 3,121 | 63 | 1,031 | 22 | (929 | ) | (19 | ) | 3,223 | 66 | ||||||||||||||||||||||
Class 2 | 173,237 | 3,593 | 1,532,457 | 33,240 | (1,626,668 | ) | (33,632 | ) | 79,026 | 3,201 | ||||||||||||||||||||||
Class 3 | 2,080 | 42 | 17,705 | 379 | (21,190 | ) | (431 | ) | (1,405 | ) | (10 | ) | ||||||||||||||||||||
Class 4 | 180,857 | 3,787 | 125,407 | 2,752 | (103,759 | ) | (2,175 | ) | 202,505 | 4,364 | ||||||||||||||||||||||
|
|
|
|
|
|
|
|
|
|
|
|
|
|
|
| |||||||||||||||||
Total net increase (decrease) | $ | 1,420,876 | 29,295 | $ | 3,953,358 | 85,083 | $ | (2,981,944 | ) | (61,275 | ) | $ | 2,392,290 | 53,103 | ||||||||||||||||||
|
|
|
|
|
|
|
|
|
|
|
|
|
|
|
| |||||||||||||||||
International Growth and Income Fund
| Sales* | Reinvestments of distributions | Repurchases* | Net (decrease) increase | |||||||||||||||||||||||||||||
Share class | Amount | Shares | Amount | Shares | Amount | Shares | Amount | Shares | ||||||||||||||||||||||||
Year ended December 31, 2020 | ||||||||||||||||||||||||||||||||
Class 1 | $ | 78,373 | 5,478 | $ | 17,128 | 948 | $ | (179,914 | ) | (10,267 | ) | $ | (84,413 | ) | (3,841 | ) | ||||||||||||||||
Class 1A | 977 | 66 | 38 | 2 | (791 | ) | (49 | ) | 224 | 19 | ||||||||||||||||||||||
Class 2 | 13,943 | 970 | 2,909 | 161 | (63,267 | ) | (3,635 | ) | (46,415 | ) | (2,504 | ) | ||||||||||||||||||||
Class 4 | 17,701 | 1,130 | 1,255 | 70 | (13,000 | ) | (825 | ) | 5,956 | 375 | ||||||||||||||||||||||
|
|
|
|
|
|
|
|
|
|
|
|
|
|
|
| |||||||||||||||||
Total net increase (decrease) | $ | 110,994 | 7,644 | $ | 21,330 | 1,181 | $ | (256,972 | ) | (14,776 | ) | $ | (124,648 | ) | (5,951 | ) | ||||||||||||||||
|
|
|
|
|
|
|
|
|
|
|
|
|
|
|
| |||||||||||||||||
Year ended December 31, 2019 | ||||||||||||||||||||||||||||||||
Class 1 | $ | 9,331 | 555 | $ | 41,626 | 2,406 | $ | (130,370 | ) | (7,620 | ) | $ | (79,413 | ) | (4,659 | ) | ||||||||||||||||
Class 1A | 364 | 22 | 83 | 5 | (75 | ) | (4 | ) | 372 | 23 | ||||||||||||||||||||||
Class 2 | 14,448 | 831 | 8,726 | 507 | (37,612 | ) | (2,202 | ) | (14,438 | ) | (864 | ) | ||||||||||||||||||||
Class 4 | 20,154 | 1,195 | 3,113 | 182 | (7,857 | ) | (466 | ) | 15,410 | 911 | ||||||||||||||||||||||
|
|
|
|
|
|
|
|
|
|
|
|
|
|
|
| |||||||||||||||||
Total net increase (decrease) | $ | 44,297 | 2,603 | $ | 53,548 | 3,100 | $ | (175,914 | ) | (10,292 | ) | $ | (78,069 | ) | (4,589 | ) | ||||||||||||||||
|
|
|
|
|
|
|
|
|
|
|
|
|
|
|
| |||||||||||||||||
See end of tables for footnotes.
308 American Funds Insurance Series
Table of Contents
Capital Income Builder
| Sales* | Reinvestments of distributions | Repurchases* | Net increase | |||||||||||||||||||||||||||||
Share class | Amount | Shares | Amount | Shares | Amount | Shares | Amount | Shares | ||||||||||||||||||||||||
Year ended December 31, 2020 | ||||||||||||||||||||||||||||||||
Class 1 | $ | 237,195 | 24,206 | $ | 17,285 | 1,757 | $ | (178,753 | ) | (18,572 | ) | $ | 75,727 | 7,391 | ||||||||||||||||||
Class 1A | 809 | 80 | 161 | 16 | (340 | ) | (34 | ) | 630 | 62 | ||||||||||||||||||||||
Class 2 | 2,017 | 200 | 181 | 18 | (286 | ) | (28 | ) | 1,912 | 190 | ||||||||||||||||||||||
Class 4 | 49,099 | 4,860 | 11,369 | 1,158 | (58,009 | ) | (5,855 | ) | 2,459 | 163 | ||||||||||||||||||||||
|
|
|
|
|
|
|
|
|
|
|
|
|
|
|
| |||||||||||||||||
Total net increase (decrease) | $ | 289,120 | 29,346 | $ | 28,996 | 2,949 | $ | (237,388 | ) | (24,489 | ) | $ | 80,728 | 7,806 | ||||||||||||||||||
|
|
|
|
|
|
|
|
|
|
|
|
|
|
|
| |||||||||||||||||
Year ended December 31, 2019 | ||||||||||||||||||||||||||||||||
Class 1 | $ | 160,592 | 15,806 | $ | 13,476 | 1,322 | $ | (12,510 | ) | (1,240 | ) | $ | 161,558 | 15,888 | ||||||||||||||||||
Class 1A | 2,709 | 268 | 126 | 12 | (345 | ) | (34 | ) | 2,490 | 246 | ||||||||||||||||||||||
Class 2 | 1,661 | 165 | 137 | 13 | (567 | ) | (56 | ) | 1,231 | 122 | ||||||||||||||||||||||
Class 4 | 66,462 | 6,575 | 10,875 | 1,070 | (29,407 | ) | (2,903 | ) | 47,930 | 4,742 | ||||||||||||||||||||||
|
|
|
|
|
|
|
|
|
|
|
|
|
|
|
| |||||||||||||||||
Total net increase (decrease) | $ | 231,424 | 22,814 | $ | 24,614 | 2,417 | $ | (42,829 | ) | (4,233 | ) | $ | 213,209 | 20,998 | ||||||||||||||||||
|
|
|
|
|
|
|
|
|
|
|
|
|
|
|
| |||||||||||||||||
Asset Allocation Fund
| Sales* | Reinvestments of distributions | Repurchases* | Net (decrease) increase | |||||||||||||||||||||||||||||
Share class | Amount | Shares | Amount | Shares | Amount | Shares | Amount | Shares | ||||||||||||||||||||||||
Year ended December 31, 2020 | ||||||||||||||||||||||||||||||||
Class 1 | $ | 1,817,230 | 79,909 | $ | 412,849 | 16,378 | $ | (2,437,918 | ) | (107,604 | ) | $ | (207,839 | ) | (11,317 | ) | ||||||||||||||||
Class 1A | 4,177 | 174 | 264 | 10 | (1,862 | ) | (81 | ) | 2,579 | 103 | ||||||||||||||||||||||
Class 2 | 109,553 | 4,668 | 103,653 | 4,169 | (595,244 | ) | (25,445 | ) | (382,038 | ) | (16,608 | ) | ||||||||||||||||||||
Class 3 | 914 | 38 | 661 | 26 | (4,390 | ) | (184 | ) | (2,815 | ) | (120 | ) | ||||||||||||||||||||
Class 4 | 410,135 | 17,490 | 89,009 | 3,606 | (327,826 | ) | (14,043 | ) | 171,318 | 7,053 | ||||||||||||||||||||||
|
|
|
|
|
|
|
|
|
|
|
|
|
|
|
| |||||||||||||||||
Total net increase (decrease) | $ | 2,342,009 | 102,279 | $ | 606,436 | 24,189 | $ | (3,367,240 | ) | (147,357 | ) | $ | (418,795 | ) | (20,889 | ) | ||||||||||||||||
|
|
|
|
|
|
|
|
|
|
|
|
|
|
|
| |||||||||||||||||
Year ended December 31, 2019 | ||||||||||||||||||||||||||||||||
Class 1 | $ | 1,081,611 | 47,062 | $ | 1,173,430 | 52,076 | $ | (1,121,605 | ) | (48,857 | ) | $ | 1,133,436 | 50,281 | ||||||||||||||||||
Class 1A | 2,765 | 122 | 605 | 27 | (689 | ) | (30 | ) | 2,681 | 119 | ||||||||||||||||||||||
Class 2 | 111,154 | 4,871 | 347,279 | 15,613 | (575,603 | ) | (25,266 | ) | (117,170 | ) | (4,782 | ) | ||||||||||||||||||||
Class 3 | 991 | 43 | 2,189 | 97 | (4,150 | ) | (180 | ) | (970 | ) | (40 | ) | ||||||||||||||||||||
Class 4 | 356,681 | 15,732 | 277,834 | 12,559 | (218,378 | ) | (9,706 | ) | 416,137 | 18,585 | ||||||||||||||||||||||
|
|
|
|
|
|
|
|
|
|
|
|
|
|
|
| |||||||||||||||||
Total net increase (decrease) | $ | 1,553,202 | 67,830 | $ | 1,801,337 | 80,372 | $ | (1,920,425 | ) | (84,039 | ) | $ | 1,434,114 | 64,163 | ||||||||||||||||||
|
|
|
|
|
|
|
|
|
|
|
|
|
|
|
| |||||||||||||||||
See end of tables for footnotes.
American Funds Insurance Series 309
Table of Contents
Global Balanced Fund
| Sales* | Reinvestments of distributions | Repurchases* | Net increase (decrease) | |||||||||||||||||||||||||||||
Share class | Amount | Shares | Amount | Shares | Amount | Shares | Amount | Shares | ||||||||||||||||||||||||
Year ended December 31, 2020 | ||||||||||||||||||||||||||||||||
Class 1 | $ | 29,379 | 2,319 | $ | 6,831 | 491 | $ | (35,963 | ) | (2,860 | ) | $ | 247 | (50 | ) | |||||||||||||||||
Class 1A | 379 | 27 | 127 | 9 | (183 | ) | (13 | ) | 323 | 23 | ||||||||||||||||||||||
Class 2 | 10,289 | 792 | 9,760 | 704 | (28,821 | ) | (2,185 | ) | (8,772 | ) | (689 | ) | ||||||||||||||||||||
Class 4 | 11,783 | 881 | 4,655 | 339 | (10,044 | ) | (767 | ) | 6,394 | 453 | ||||||||||||||||||||||
|
|
|
|
|
|
|
|
|
|
|
|
|
|
|
| |||||||||||||||||
Total net increase (decrease) | $ | 51,830 | 4,019 | $ | 21,373 | 1,543 | $ | (75,011 | ) | (5,825 | ) | $ | (1,808 | ) | (263 | ) | ||||||||||||||||
|
|
|
|
|
|
|
|
|
|
|
|
|
|
|
| |||||||||||||||||
Year ended December 31, 2019 | ||||||||||||||||||||||||||||||||
Class 1 | $ | 10,073 | 777 | $ | 5,390 | 408 | $ | (9,768 | ) | (718 | ) | $ | 5,695 | 467 | ||||||||||||||||||
Class 1A | 111 | 9 | 89 | 7 | (237 | ) | (19 | ) | (37 | ) | (3 | ) | ||||||||||||||||||||
Class 2 | 7,858 | 607 | 8,009 | 608 | (22,255 | ) | (1,722 | ) | (6,388 | ) | (507 | ) | ||||||||||||||||||||
Class 4 | 15,727 | 1,225 | 3,446 | 264 | (6,014 | ) | (470 | ) | 13,159 | 1,019 | ||||||||||||||||||||||
|
|
|
|
|
|
|
|
|
|
|
|
|
|
|
| |||||||||||||||||
Total net increase (decrease) | $ | 33,769 | 2,618 | $ | 16,934 | 1,287 | $ | (38,274 | ) | (2,929 | ) | $ | 12,429 | 976 | ||||||||||||||||||
|
|
|
|
|
|
|
|
|
|
|
|
|
|
|
| |||||||||||||||||
Bond Fund
| Sales* | Reinvestments of distributions | Repurchases* | Net (decrease) increase | |||||||||||||||||||||||||||||
Share class | Amount | Shares | Amount | Shares | Amount | Shares | Amount | Shares | ||||||||||||||||||||||||
Year ended December 31, 2020 | ||||||||||||||||||||||||||||||||
Class 1 | $ | 1,499,439 | 128,201 | $ | 208,932 | 17,767 | $ | (1,735,112 | ) | (150,736 | ) | $ | (26,741 | ) | (4,768 | ) | ||||||||||||||||
Class 1A | 3,563 | 306 | 255 | 22 | (1,431 | ) | (124 | ) | 2,387 | 204 | ||||||||||||||||||||||
Class 2 | 397,055 | 34,256 | 110,645 | 9,541 | (449,029 | ) | (39,506 | ) | 58,671 | 4,291 | ||||||||||||||||||||||
Class 4 | 242,089 | 20,999 | 17,962 | 1,553 | (81,119 | ) | (7,132 | ) | 178,932 | 15,420 | ||||||||||||||||||||||
|
|
|
|
|
|
|
|
|
|
|
|
|
|
|
| |||||||||||||||||
Total net increase (decrease) | $ | 2,142,146 | 183,762 | $ | 337,794 | 28,883 | $ | (2,266,691 | ) | (197,498 | ) | $ | 213,249 | 15,147 | ||||||||||||||||||
|
|
|
|
|
|
|
|
|
|
|
|
|
|
|
| |||||||||||||||||
Year ended December 31, 2019 | ||||||||||||||||||||||||||||||||
Class 1 | $ | 562,508 | 51,468 | $ | 176,372 | 15,842 | $ | (614,303 | ) | (56,025 | ) | $ | 124,577 | 11,285 | ||||||||||||||||||
Class 1A | 3,719 | 336 | 165 | 15 | (744 | ) | (67 | ) | 3,140 | 284 | ||||||||||||||||||||||
Class 2 | 133,036 | 12,239 | 90,797 | 8,262 | (413,489 | ) | (38,133 | ) | (189,656 | ) | (17,632 | ) | ||||||||||||||||||||
Class 4 | 149,767 | 13,753 | 11,384 | 1,037 | (49,519 | ) | (4,574 | ) | 111,632 | 10,216 | ||||||||||||||||||||||
|
|
|
|
|
|
|
|
|
|
|
|
|
|
|
| |||||||||||||||||
Total net increase (decrease) | $ | 849,030 | 77,796 | $ | 278,718 | 25,156 | $ | (1,078,055 | ) | (98,799 | ) | $ | 49,693 | 4,153 | ||||||||||||||||||
|
|
|
|
|
|
|
|
|
|
|
|
|
|
|
| |||||||||||||||||
Capital World Bond Fund
| Sales* | Reinvestments of distributions | Repurchases* | Net increase (decrease) | |||||||||||||||||||||||||||||
Share class | Amount | Shares | Amount | Shares | Amount | Shares | Amount | Shares | ||||||||||||||||||||||||
Year ended December 31, 2020 | ||||||||||||||||||||||||||||||||
Class 1 | $ | 279,297 | 22,900 | $ | 34,711 | 2,801 | $ | (244,497 | ) | (20,428 | ) | $ | 69,511 | 5,273 | ||||||||||||||||||
Class 1A | 323 | 26 | 18 | 1 | (135 | ) | (11 | ) | 206 | 16 | ||||||||||||||||||||||
Class 2 | 104,127 | 8,595 | 28,474 | 2,321 | (140,860 | ) | (11,802 | ) | (8,259 | ) | (886 | ) | ||||||||||||||||||||
Class 4 | 21,389 | 1,754 | 1,457 | 120 | (13,943 | ) | (1,171 | ) | 8,903 | 703 | ||||||||||||||||||||||
|
|
|
|
|
|
|
|
|
|
|
|
|
|
|
| |||||||||||||||||
Total net increase (decrease) | $ | 405,136 | 33,275 | $ | 64,660 | 5,243 | $ | (399,435 | ) | (33,412 | ) | $ | 70,361 | 5,106 | ||||||||||||||||||
|
|
|
|
|
|
|
|
|
|
|
|
|
|
|
| |||||||||||||||||
Year ended December 31, 2019 | ||||||||||||||||||||||||||||||||
Class 1 | $ | 94,035 | 7,945 | $ | 19,056 | 1,588 | $ | (113,011 | ) | (9,529 | ) | $ | 80 | 4 | ||||||||||||||||||
Class 1A | 84 | 7 | 7 | 1 | (59 | ) | (5 | ) | 32 | 3 | ||||||||||||||||||||||
Class 2 | 33,181 | 2,816 | 15,927 | 1,338 | (140,715 | ) | (11,911 | ) | (91,607 | ) | (7,757 | ) | ||||||||||||||||||||
Class 4 | 13,230 | 1,132 | 649 | 55 | (7,381 | ) | (629 | ) | 6,498 | 558 | ||||||||||||||||||||||
|
|
|
|
|
|
|
|
|
|
|
|
|
|
|
| |||||||||||||||||
Total net increase (decrease) | $ | 140,530 | 11,900 | $ | 35,639 | 2,982 | $ | (261,166 | ) | (22,074 | ) | $ | (84,997 | ) | (7,192 | ) | ||||||||||||||||
|
|
|
|
|
|
|
|
|
|
|
|
|
|
|
| |||||||||||||||||
See end of tables for footnotes.
310 American Funds Insurance Series
Table of Contents
High-Income Bond Fund
| Sales* | Reinvestments of distributions | Repurchases* | Net (decrease) increase | |||||||||||||||||||||||||||||
Share class | Amount | Shares | Amount | Shares | Amount | Shares | Amount | Shares | ||||||||||||||||||||||||
Year ended December 31, 2020 | ||||||||||||||||||||||||||||||||
Class 1 | $ | 18,985 | 2,117 | $ | 9,529 | 992 | $ | (390,999 | ) | (43,725 | ) | $ | (362,485 | ) | (40,616 | ) | ||||||||||||||||
Class 1A | 408 | 43 | 78 | 8 | (220 | ) | (23 | ) | 266 | 28 | ||||||||||||||||||||||
Class 2 | 18,520 | 1,972 | 54,086 | 5,739 | (68,277 | ) | (7,320 | ) | 4,329 | 391 | ||||||||||||||||||||||
Class 3 | 733 | 76 | 799 | 83 | (1,434 | ) | (151 | ) | 98 | 8 | ||||||||||||||||||||||
Class 4 | 103,183 | 9,989 | 4,806 | 465 | (102,765 | ) | (9,921 | ) | 5,224 | 533 | ||||||||||||||||||||||
|
|
|
|
|
|
|
|
|
|
|
|
|
|
|
| |||||||||||||||||
Total net increase (decrease) | $ | 141,829 | 14,197 | $ | 69,298 | 7,287 | $ | (563,695 | ) | (61,140 | ) | $ | (352,568 | ) | (39,656 | ) | ||||||||||||||||
|
|
|
|
|
|
|
|
|
|
|
|
|
|
|
| |||||||||||||||||
Year ended December 31, 2019 | ||||||||||||||||||||||||||||||||
Class 1 | $ | 9,412 | 933 | $ | 33,027 | 3,374 | $ | (48,250 | ) | (4,826 | ) | $ | (5,811 | ) | (519 | ) | ||||||||||||||||
Class 1A | 353 | 35 | 45 | 5 | (350 | ) | (35 | ) | 48 | 5 | ||||||||||||||||||||||
Class 2 | 10,165 | 1,039 | 41,753 | 4,340 | (84,344 | ) | (8,552 | ) | (32,426 | ) | (3,173 | ) | ||||||||||||||||||||
Class 3 | 613 | 61 | 611 | 62 | (1,328 | ) | (132 | ) | (104 | ) | (9 | ) | ||||||||||||||||||||
Class 4 | 64,302 | 6,070 | 3,353 | 321 | (37,801 | ) | (3,523 | ) | 29,854 | 2,868 | ||||||||||||||||||||||
|
|
|
|
|
|
|
|
|
|
|
|
|
|
|
| |||||||||||||||||
Total net increase (decrease) | $ | 84,845 | 8,138 | $ | 78,789 | 8,102 | $ | (172,073 | ) | (17,068 | ) | $ | (8,439 | ) | (828 | ) | ||||||||||||||||
|
|
|
|
|
|
|
|
|
|
|
|
|
|
|
| |||||||||||||||||
Mortgage Fund
| Sales* | Reinvestments of distributions | Repurchases* | Net increase (decrease) | |||||||||||||||||||||||||||||
Share class | Amount | Shares | Amount | Shares | Amount | Shares | Amount | Shares | ||||||||||||||||||||||||
Year ended December 31, 2020 | ||||||||||||||||||||||||||||||||
Class 1 | $ | 68,523 | 6,189 | $ | 3,551 | 321 | $ | (68,907 | ) | (6,295 | ) | $ | 3,167 | 215 | ||||||||||||||||||
Class 1A | 899 | 81 | 14 | 1 | (274 | ) | (24 | ) | 639 | 58 | ||||||||||||||||||||||
Class 2 | 7,728 | 703 | 797 | 72 | (9,799 | ) | (891 | ) | (1,274 | ) | (116 | ) | ||||||||||||||||||||
Class 4 | 24,189 | 2,227 | 458 | 42 | (16,769 | ) | (1,535 | ) | 7,878 | 734 | ||||||||||||||||||||||
|
|
|
|
|
|
|
|
|
|
|
|
|
|
|
| |||||||||||||||||
Total net increase (decrease) | $ | 101,339 | 9,200 | $ | 4,820 | 436 | $ | (95,749 | ) | (8,745 | ) | $ | 10,410 | 891 | ||||||||||||||||||
|
|
|
|
|
|
|
|
|
|
|
|
|
|
|
| |||||||||||||||||
Year ended December 31, 2019 | ||||||||||||||||||||||||||||||||
Class 1 | $ | 31,595 | 3,007 | $ | 5,573 | 528 | $ | (41,843 | ) | (3,959 | ) | $ | (4,675 | ) | (424 | ) | ||||||||||||||||
Class 1A | 166 | 16 | 12 | 1 | (444 | ) | (42 | ) | (266 | ) | (25 | ) | ||||||||||||||||||||
Class 2 | 4,351 | 413 | 1,355 | 129 | (7,802 | ) | (738 | ) | (2,096 | ) | (196 | ) | ||||||||||||||||||||
Class 4 | 11,996 | 1,146 | 585 | 56 | (9,761 | ) | (944 | ) | 2,820 | 258 | ||||||||||||||||||||||
|
|
|
|
|
|
|
|
|
|
|
|
|
|
|
| |||||||||||||||||
Total net increase (decrease) | $ | 48,108 | 4,582 | $ | 7,525 | 714 | $ | (59,850 | ) | (5,683 | ) | $ | (4,217 | ) | (387 | ) | ||||||||||||||||
|
|
|
|
|
|
|
|
|
|
|
|
|
|
|
| |||||||||||||||||
See end of tables for footnotes.
American Funds Insurance Series 311
Table of Contents
Ultra-Short Bond Fund
| Sales* | Reinvestments of distributions | Repurchases* | Net increase (decrease) | |||||||||||||||||||||||||||||
Share class | Amount | Shares | Amount | Shares | Amount | Shares | Amount | Shares | ||||||||||||||||||||||||
Year ended December 31, 2020 | ||||||||||||||||||||||||||||||||
Class 1 | $ | 32,173 | 2,840 | $ | 104 | 9 | $ | (17,960 | ) | (1,586 | ) | $ | 14,317 | 1,263 | ||||||||||||||||||
Class 1A | — | — | — | † | — | † | — | — | — | † | — | † | ||||||||||||||||||||
Class 2 | 162,780 | 14,772 | 558 | 50 | (104,954 | ) | (9,527 | ) | 58,384 | 5,295 | ||||||||||||||||||||||
Class 3 | 2,553 | 229 | 8 | 1 | (1,439 | ) | (129 | ) | 1,122 | 101 | ||||||||||||||||||||||
Class 4 | 51,028 | 4,586 | 67 | 6 | (32,890 | ) | (2,958 | ) | 18,205 | 1,634 | ||||||||||||||||||||||
|
|
|
|
|
|
|
|
|
|
|
|
|
|
|
| |||||||||||||||||
Total net increase (decrease) | $ | 248,534 | 22,427 | $ | 737 | 66 | $ | (157,243 | ) | (14,200 | ) | $ | 92,028 | 8,293 | ||||||||||||||||||
|
|
|
|
|
|
|
|
|
|
|
|
|
|
|
| |||||||||||||||||
Year ended December 31, 2019 | ||||||||||||||||||||||||||||||||
Class 1 | $ | 9,753 | 856 | $ | 604 | 53 | $ | (17,930 | ) | (1,576 | ) | $ | (7,573 | ) | (667 | ) | ||||||||||||||||
Class 1A | — | — | — | † | — | † | — | — | — | † | — | † | ||||||||||||||||||||
Class 2 | 85,259 | 7,676 | 4,088 | 371 | (106,127 | ) | (9,561 | ) | (16,780 | ) | (1,514 | ) | ||||||||||||||||||||
Class 3 | 714 | 64 | 59 | 5 | (2,101 | ) | (188 | ) | (1,328 | ) | (119 | ) | ||||||||||||||||||||
Class 4 | 21,513 | 1,920 | 342 | 31 | (17,702 | ) | (1,580 | ) | 4,153 | 371 | ||||||||||||||||||||||
|
|
|
|
|
|
|
|
|
|
|
|
|
|
|
| |||||||||||||||||
Total net increase (decrease) | $ | 117,239 | 10,516 | $ | 5,093 | 460 | $ | (143,860 | ) | (12,905 | ) | $ | (21,528 | ) | (1,929 | ) | ||||||||||||||||
|
|
|
|
|
|
|
|
|
|
|
|
|
|
|
| |||||||||||||||||
U.S. Government/AAA-Rated Securities Fund
| Sales* | Reinvestments of distributions | Repurchases* | Net (decrease) increase | |||||||||||||||||||||||||||||
Share class | Amount | Shares | Amount | Shares | Amount | Shares | Amount | Shares | ||||||||||||||||||||||||
Year ended December 31, 2020 | ||||||||||||||||||||||||||||||||
Class 1 | $ | 194,142 | 14,793 | $ | 15,787 | 1,214 | $ | (1,305,241 | ) | (98,066 | ) | $ | (1,095,312 | ) | (82,059 | ) | ||||||||||||||||
Class 1A | 3,400 | 259 | 136 | 11 | (2,557 | ) | (195 | ) | 979 | 75 | ||||||||||||||||||||||
Class 2 | 211,715 | 16,419 | 51,919 | 4,038 | (245,761 | ) | (18,789 | ) | 17,873 | 1,668 | ||||||||||||||||||||||
Class 3 | 2,382 | 183 | 407 | 31 | (1,812 | ) | (139 | ) | 977 | 75 | ||||||||||||||||||||||
Class 4 | 301,535 | 23,299 | 9,187 | 715 | (169,936 | ) | (13,051 | ) | 140,786 | 10,963 | ||||||||||||||||||||||
|
|
|
|
|
|
|
|
|
|
|
|
|
|
|
| |||||||||||||||||
Total net increase (decrease) | $ | 713,174 | 54,953 | $ | 77,436 | 6,009 | $ | (1,725,307 | ) | (130,240 | ) | $ | (934,697 | ) | (69,278 | ) | ||||||||||||||||
|
|
|
|
|
|
|
|
|
|
|
|
|
|
|
| |||||||||||||||||
Year ended December 31, 2019 | ||||||||||||||||||||||||||||||||
Class 1 | $ | 63,401 | 5,184 | $ | 31,462 | 2,550 | $ | (170,411 | ) | (13,819 | ) | $ | (75,548 | ) | (6,085 | ) | ||||||||||||||||
Class 1A | 1,348 | 110 | 50 | 4 | (488 | ) | (40 | ) | 910 | 74 | ||||||||||||||||||||||
Class 2 | 105,457 | 8,638 | 26,789 | 2,193 | (155,177 | ) | (12,760 | ) | (22,931 | ) | (1,929 | ) | ||||||||||||||||||||
Class 3 | 975 | 79 | 180 | 15 | (1,521 | ) | (124 | ) | (366 | ) | (30 | ) | ||||||||||||||||||||
Class 4 | 69,032 | 5,652 | 2,241 | 183 | (41,016 | ) | (3,366 | ) | 30,257 | 2,469 | ||||||||||||||||||||||
|
|
|
|
|
|
|
|
|
|
|
|
|
|
|
| |||||||||||||||||
Total net increase (decrease) | $ | 240,213 | 19,663 | $ | 60,722 | 4,945 | $ | (368,613 | ) | (30,109 | ) | $ | (67,678 | ) | (5,501 | ) | ||||||||||||||||
|
|
|
|
|
|
|
|
|
|
|
|
|
|
|
| |||||||||||||||||
Managed Risk Growth Fund
| Sales* | Reinvestments of distributions | Repurchases* | Net increase | |||||||||||||||||||||||||||||
Share class | Amount | Shares | Amount | Shares | Amount | Shares | Amount | Shares | ||||||||||||||||||||||||
Year ended December 31, 2020 | ||||||||||||||||||||||||||||||||
Class P1 | $ | 3,987 | 282 | $ | 438 | 32 | $ | (1,595 | ) | (110 | ) | $ | 2,830 | 204 | ||||||||||||||||||
Class P2 | 54,142 | 3,714 | 24,836 | 1,828 | (71,110 | ) | (4,841 | ) | 7,868 | 701 | ||||||||||||||||||||||
|
|
|
|
|
|
|
|
|
|
|
|
|
|
|
| |||||||||||||||||
Total net increase (decrease) | $ | 58,129 | 3,996 | $ | 25,274 | 1,860 | $ | (72,705 | ) | (4,951 | ) | $ | 10,698 | 905 | ||||||||||||||||||
|
|
|
|
|
|
|
|
|
|
|
|
|
|
|
| |||||||||||||||||
Year ended December 31, 2019 | ||||||||||||||||||||||||||||||||
Class P1 | $ | 2,619 | 201 | $ | 317 | 25 | $ | (523 | ) | (41 | ) | $ | 2,413 | 185 | ||||||||||||||||||
Class P2 | 47,485 | 3,690 | 29,905 | 2,419 | (30,455 | ) | (2,336 | ) | 46,935 | 3,773 | ||||||||||||||||||||||
|
|
|
|
|
|
|
|
|
|
|
|
|
|
|
| |||||||||||||||||
Total net increase (decrease) | $ | 50,104 | 3,891 | $ | 30,222 | 2,444 | $ | (30,978 | ) | (2,377 | ) | $ | 49,348 | 3,958 | ||||||||||||||||||
|
|
|
|
|
|
|
|
|
|
|
|
|
|
|
| |||||||||||||||||
See end of tables for footnotes.
312 American Funds Insurance Series
Table of Contents
Managed Risk International Fund
| Sales* | Reinvestments of distributions | Repurchases* | Net increase (decrease) | |||||||||||||||||||||||||||||
Share class | Amount | Shares | Amount | Shares | Amount | Shares | Amount | Shares | ||||||||||||||||||||||||
Year ended December 31, 2020 | ||||||||||||||||||||||||||||||||
Class P1 | $ | 1,063 | 104 | $ | 31 | 3 | $ | (311 | ) | (30 | ) | $ | 783 | 77 | ||||||||||||||||||
Class P2 | 14,905 | 1,575 | 3,216 | 348 | (17,706 | ) | (1,759 | ) | 415 | 164 | ||||||||||||||||||||||
|
|
|
|
|
|
|
|
|
|
|
|
|
|
|
| |||||||||||||||||
Total net increase (decrease) | $ | 15,968 | 1,679 | $ | 3,247 | 351 | $ | (18,017 | ) | (1,789 | ) | $ | 1,198 | 241 | ||||||||||||||||||
|
|
|
|
|
|
|
|
|
|
|
|
|
|
|
| |||||||||||||||||
Year ended December 31, 2019 | ||||||||||||||||||||||||||||||||
Class P1 | $ | 357 | 34 | $ | 27 | 3 | $ | (140 | ) | (14 | ) | $ | 244 | 23 | ||||||||||||||||||
Class P2 | 7,251 | 702 | 7,769 | 772 | (18,389 | ) | (1,773 | ) | (3,369 | ) | (299 | ) | ||||||||||||||||||||
|
|
|
|
|
|
|
|
|
|
|
|
|
|
|
| |||||||||||||||||
Total net increase (decrease) | $ | 7,608 | 736 | $ | 7,796 | 775 | $ | (18,529 | ) | (1,787 | ) | $ | (3,125 | ) | (276 | ) | ||||||||||||||||
|
|
|
|
|
|
|
|
|
|
|
|
|
|
|
| |||||||||||||||||
Managed Risk Blue Chip Income and Growth Fund
| Sales* | Reinvestments of distributions | Repurchases* | Net increase | |||||||||||||||||||||||||||||
Share class | Amount | Shares | Amount | Shares | Amount | Shares | Amount | Shares | ||||||||||||||||||||||||
Year ended December 31, 2020 | ||||||||||||||||||||||||||||||||
Class P1 | $ | 947 | 85 | $ | 66 | 7 | $ | (241 | ) | (23 | ) | $ | 772 | 69 | ||||||||||||||||||
Class P2 | 24,832 | 2,333 | 16,834 | 1,640 | (31,353 | ) | (2,866 | ) | 10,313 | 1,107 | ||||||||||||||||||||||
|
|
|
|
|
|
|
|
|
|
|
|
|
|
|
| |||||||||||||||||
Total net increase (decrease) | $ | 25,779 | 2,418 | $ | 16,900 | 1,647 | $ | (31,594 | ) | (2,889 | ) | $ | 11,085 | 1,176 | ||||||||||||||||||
|
|
|
|
|
|
|
|
|
|
|
|
|
|
|
| |||||||||||||||||
Year ended December 31, 2019 | ||||||||||||||||||||||||||||||||
Class P1 | $ | 547 | 46 | $ | 53 | 5 | $ | (313 | ) | (28 | ) | $ | 287 | 23 | ||||||||||||||||||
Class P2 | 16,518 | 1,448 | 23,362 | 2,128 | (33,614 | ) | (2,932 | ) | 6,266 | 644 | ||||||||||||||||||||||
|
|
|
|
|
|
|
|
|
|
|
|
|
|
|
| |||||||||||||||||
Total net increase (decrease) | $ | 17,065 | 1,494 | $ | 23,415 | 2,133 | $ | (33,927 | ) | (2,960 | ) | $ | 6,553 | 667 | ||||||||||||||||||
|
|
|
|
|
|
|
|
|
|
|
|
|
|
|
| |||||||||||||||||
Managed Risk Growth-Income Fund
| Sales* | Reinvestments of distributions | Repurchases* | Net increase | |||||||||||||||||||||||||||||
Share class | Amount | Shares | Amount | Shares | Amount | Shares | Amount | Shares | ||||||||||||||||||||||||
Year ended December 31, 2020 | ||||||||||||||||||||||||||||||||
Class P1 | $ | 92,644 | 6,852 | $ | 140,694 | 11,020 | $ | (143,917 | ) | (10,953 | ) | $ | 89,421 | 6,919 | ||||||||||||||||||
Class P2 | 24,533 | 1,843 | 20,073 | 1,584 | (19,990 | ) | (1,489 | ) | 24,616 | 1,938 | ||||||||||||||||||||||
|
|
|
|
|
|
|
|
|
|
|
|
|
|
|
| |||||||||||||||||
Total net increase (decrease) | $ | 117,177 | 8,695 | $ | 160,767 | 12,604 | $ | (163,907 | ) | (12,442 | ) | $ | 114,037 | 8,857 | ||||||||||||||||||
|
|
|
|
|
|
|
|
|
|
|
|
|
|
|
| |||||||||||||||||
Year ended December 31, 2019 | ||||||||||||||||||||||||||||||||
Class P1 | $ | 86,511 | 6,809 | $ | 29,069 | 2,244 | $ | (82,465 | ) | (6,312 | ) | $ | 33,115 | 2,741 | ||||||||||||||||||
Class P2 | 28,190 | 2,218 | 3,371 | 263 | (20,033 | ) | (1,562 | ) | 11,528 | 919 | ||||||||||||||||||||||
|
|
|
|
|
|
|
|
|
|
|
|
|
|
|
| |||||||||||||||||
Total net increase (decrease) | $ | 114,701 | 9,027 | $ | 32,440 | 2,507 | $ | (102,498 | ) | (7,874 | ) | $ | 44,643 | 3,660 | ||||||||||||||||||
|
|
|
|
|
|
|
|
|
|
|
|
|
|
|
| |||||||||||||||||
See end of tables for footnotes.
American Funds Insurance Series 313
Table of Contents
Managed Risk Asset Allocation Fund
| Sales* | Reinvestments of distributions | Repurchases* | Net increase (decrease) | |||||||||||||||||||||||||||||
Share class | Amount | Shares | Amount | Shares | Amount | Shares | Amount | Shares | ||||||||||||||||||||||||
Year ended December 31, 2020 | ||||||||||||||||||||||||||||||||
Class P1 | $ | 3,275 | 256 | $ | 204 | 16 | $ | (622 | ) | (45 | ) | $ | 2,857 | 227 | ||||||||||||||||||
Class P2 | 73,918 | 5,805 | 146,474 | 12,155 | (280,685 | ) | (21,952 | ) | (60,293 | ) | (3,992 | ) | ||||||||||||||||||||
|
|
|
|
|
|
|
|
|
|
|
|
|
|
|
| |||||||||||||||||
Total net increase (decrease) | $ | 77,193 | 6,061 | $ | 146,678 | 12,171 | $ | (281,307 | ) | (21,997 | ) | $ | (57,436 | ) | (3,765 | ) | ||||||||||||||||
|
|
|
|
|
|
|
|
|
|
|
|
|
|
|
| |||||||||||||||||
Year ended December 31, 2019 | ||||||||||||||||||||||||||||||||
Class P1 | $ | 626 | 47 | $ | 70 | 5 | $ | (334 | ) | (25 | ) | $ | 362 | 27 | ||||||||||||||||||
Class P2 | 106,039 | 8,229 | 177,741 | 14,380 | (260,413 | ) | (20,223 | ) | 23,367 | 2,386 | ||||||||||||||||||||||
|
|
|
|
|
|
|
|
|
|
|
|
|
|
|
| |||||||||||||||||
Total net increase (decrease) | $ | 106,665 | 8,276 | $ | 177,811 | 14,385 | $ | (260,747 | ) | (20,248 | ) | $ | 23,729 | 2,413 | ||||||||||||||||||
|
|
|
|
|
|
|
|
|
|
|
|
|
|
|
| |||||||||||||||||
| * | Includes exchanges between share classes of the fund. |
| † | Amount less than one thousand. |
10. Ownership concentration
At December 31, 2020, Managed Risk Growth and Income Portfolio held 31% and 13% of the outstanding shares of American Funds Insurance Series - Capital Income Builder and American Funds Insurance Series - Global Growth and Income Fund, respectively. In addition, Managed Risk Global Allocation Portfolio held 23% of the outstanding shares of American Funds Insurance Series - Global Balanced Fund.
314 American Funds Insurance Series
Table of Contents
11. Investment transactions and other disclosures
The following tables present additional information for each of the funds for the year ended December 31, 2020 (dollars in thousands):
| Global Growth Fund | Global Small Capitalization Fund | Growth Fund | International Fund | New World Fund | Blue Chip Income and Growth Fund | |||||||||||||||||||
Purchases of investment securities* | $ | 1,120,770 | $ | 1,594,529 | $ | 9,567,139 | $ | 3,388,922 | $ | 2,260,974 | $ | 3,267,025 | ||||||||||||
Sales of investment securities* | 1,767,373 | 2,143,797 | 13,469,567 | 4,123,935 | 2,596,083 | 3,472,007 | ||||||||||||||||||
Non-U.S. taxes paid on dividend income | 5,330 | 2,026 | 6,921 | 10,822 | 2,631 | 477 | ||||||||||||||||||
Non-U.S. taxes paid on interest income | — | 11 | — | — | 4 | — | ||||||||||||||||||
Non-U.S. taxes paid on realized gains | — | — | — | — | 1,590 | — | ||||||||||||||||||
Non-U.S. taxes provided on unrealized appreciation | 7,807 | 7,041 | — | 26,706 | 15,681 | — | ||||||||||||||||||
| Global Growth and Income Fund | Growth- Income Fund | International Growth and Income Fund | Capital Income Builder | Asset Allocation Fund | Global Balanced Fund | |||||||||||||||||||
Purchases of investment securities* | $ | 649,244 | $ | 10,784,043 | $ | 686,636 | $ | 1,656,908 | $ | 33,575,749 | $ | 245,807 | ||||||||||||
Sales of investment securities* | 827,330 | 11,639,765 | 721,131 | 1,524,398 | 32,845,643 | 287,182 | ||||||||||||||||||
Non-U.S. taxes paid on dividend income | 2,597 | 10,403 | 2,725 | 831 | 7,494 | 278 | ||||||||||||||||||
Non-U.S. taxes paid on interest income | — | — | — | 2 | — | 15 | ||||||||||||||||||
Non-U.S. taxes paid on realized gains | 179 | 165 | — | 1 | 27 | 3 | ||||||||||||||||||
Non-U.S. taxes provided on unrealized appreciation | 3,738 | — | — | 101 | 5,162 | 20 | ||||||||||||||||||
| Bond Fund | Capital World Bond Fund | High- Income Bond Fund | American Funds Mortgage Fund | Ultra-Short Bond Fund | U.S. Government/ AAA-Rated Securities Fund | |||||||||||||||||||
Purchases of investment securities* | $ | 44,831,898 | $ | 2,806,381 | $ | 706,463 | $ | 2,995,459 | $ | — | $ | 18,179,150 | ||||||||||||
Sales of investment securities* | 44,287,472 | 2,562,406 | 1,079,778 | 2,991,216 | — | 18,466,598 | ||||||||||||||||||
Non-U.S. taxes paid on interest income | — | 215 | — | — | — | — | ||||||||||||||||||
Non-U.S. taxes paid on realized gains | — | 72 | — | — | — | — | ||||||||||||||||||
Non-U.S. taxes provided on unrealized appreciation | — | 63 | — | — | — | — | ||||||||||||||||||
| Managed Risk Growth Fund | Managed Risk International Fund | Managed Risk Blue Chip Income and Growth Fund | Managed Risk Growth- Income Fund | Managed Risk Asset Allocation Fund | ||||||||||||||||
Purchases of investment securities* | $ | 360,912 | $ | 102,655 | $ | 324,969 | $ | 807,885 | $ | 748,623 | ||||||||||
Sales of investment securities* | 412,406 | 118,616 | 359,913 | 882,591 | 1,032,662 | |||||||||||||||
| * | Excludes short-term securities and U.S. government obligations, if any. |
American Funds Insurance Series 315
Table of Contents
Financial highlights
| Income (loss) from investment operations1 | Dividends and distributions | |||||||||||||||||||||||||||||||||||||||||||||||
| Period ended | Net asset value, beginning of period | Net investment income (loss) | Net gains (losses) on securities (both realized and unrealized) | Total from investment operations | Dividends (from net investment income) | Distributions (from capital gains) | Total dividends and distributions | Net asset value, end of period | Total return | Net assets, end of period (in millions) | Ratio of expenses to average net assets2 | Ratio of net income (loss) to average net assets | ||||||||||||||||||||||||||||||||||||
Global Growth Fund |
| |||||||||||||||||||||||||||||||||||||||||||||||
Class 1: | ||||||||||||||||||||||||||||||||||||||||||||||||
12/31/2020 | $ | 32.57 | $ | .20 | $ | 9.56 | $ | 9.76 | $ | (.21 | ) | $ | (.96 | ) | $ | (1.17 | ) | $ | 41.16 | 30.79 | % | $ | 3,309 | .56 | % | .59 | % | |||||||||||||||||||||
12/31/2019 | 25.74 | .32 | 8.60 | 8.92 | (.41 | ) | (1.68 | ) | (2.09 | ) | 32.57 | 35.61 | 2,515 | .56 | 1.07 | |||||||||||||||||||||||||||||||||
12/31/2018 | 30.51 | .29 | (2.65 | ) | (2.36 | ) | (.28 | ) | (2.13 | ) | (2.41 | ) | 25.74 | (8.81 | ) | 1,942 | .55 | .98 | ||||||||||||||||||||||||||||||
12/31/2017 | 24.05 | .26 | 7.30 | 7.56 | (.26 | ) | (.84 | ) | (1.10 | ) | 30.51 | 31.80 | 2,010 | .55 | .94 | |||||||||||||||||||||||||||||||||
12/31/2016 | 26.39 | .25 | (.14 | ) | .11 | (.29 | ) | (2.16 | ) | (2.45 | ) | 24.05 | .87 | 1,630 | .56 | 1.00 | ||||||||||||||||||||||||||||||||
Class 1A: | ||||||||||||||||||||||||||||||||||||||||||||||||
12/31/2020 | 32.47 | .12 | 9.52 | 9.64 | (.13 | ) | (.96 | ) | (1.09 | ) | 41.02 | 30.49 | 12 | .81 | .34 | |||||||||||||||||||||||||||||||||
12/31/2019 | 25.69 | .25 | 8.55 | 8.80 | (.34 | ) | (1.68 | ) | (2.02 | ) | 32.47 | 35.22 | 8 | .81 | .83 | |||||||||||||||||||||||||||||||||
12/31/2018 | 30.46 | .23 | (2.66 | ) | (2.43 | ) | (.21 | ) | (2.13 | ) | (2.34 | )�� | 25.69 | (9.02 | ) | 5 | .80 | .77 | ||||||||||||||||||||||||||||||
12/31/20173,4 | 24.50 | .11 | 6.94 | 7.05 | (.25 | ) | (.84 | ) | (1.09 | ) | 30.46 | 29.13 | 5 | 2 | .80 | 6 | .39 | 6 | ||||||||||||||||||||||||||||||
Class 2: | ||||||||||||||||||||||||||||||||||||||||||||||||
12/31/2020 | 32.24 | .12 | 9.44 | 9.56 | (.12 | ) | (.96 | ) | (1.08 | ) | 40.72 | 30.47 | 4,387 | .81 | .34 | |||||||||||||||||||||||||||||||||
12/31/2019 | 25.50 | .24 | 8.51 | 8.75 | (.33 | ) | (1.68 | ) | (2.01 | ) | 32.24 | 35.28 | 3,895 | .81 | .83 | |||||||||||||||||||||||||||||||||
12/31/2018 | 30.24 | .22 | (2.63 | ) | (2.41 | ) | (.20 | ) | (2.13 | ) | (2.33 | ) | 25.50 | (9.04 | ) | 3,306 | .80 | .73 | ||||||||||||||||||||||||||||||
12/31/2017 | 23.85 | .19 | 7.23 | 7.42 | (.19 | ) | (.84 | ) | (1.03 | ) | 30.24 | 31.47 | 4,012 | .80 | .69 | |||||||||||||||||||||||||||||||||
12/31/2016 | 26.19 | .18 | (.14 | ) | .04 | (.22 | ) | (2.16 | ) | (2.38 | ) | 23.85 | .62 | 3,483 | .81 | .76 | ||||||||||||||||||||||||||||||||
Class 4: | ||||||||||||||||||||||||||||||||||||||||||||||||
12/31/2020 | 32.05 | .03 | 9.38 | 9.41 | (.05 | ) | (.96 | ) | (1.01 | ) | 40.45 | 30.17 | 533 | 1.06 | .09 | |||||||||||||||||||||||||||||||||
12/31/2019 | 25.39 | .17 | 8.45 | 8.62 | (.28 | ) | (1.68 | ) | (1.96 | ) | 32.05 | 34.87 | 382 | 1.06 | .57 | |||||||||||||||||||||||||||||||||
12/31/2018 | 30.13 | .14 | (2.60 | ) | (2.46 | ) | (.15 | ) | (2.13 | ) | (2.28 | ) | 25.39 | (9.24 | ) | 249 | 1.05 | .47 | ||||||||||||||||||||||||||||||
12/31/2017 | 23.81 | .10 | 7.22 | 7.32 | (.16 | ) | (.84 | ) | (1.00 | ) | 30.13 | 31.11 | 211 | 1.05 | .37 | |||||||||||||||||||||||||||||||||
12/31/2016 | 26.16 | .12 | (.14 | ) | (.02 | ) | (.17 | ) | (2.16 | ) | (2.33 | ) | 23.81 | .37 | 94 | 1.06 | .50 | |||||||||||||||||||||||||||||||
Global Small Capitalization Fund |
| |||||||||||||||||||||||||||||||||||||||||||||||
Class 1: | ||||||||||||||||||||||||||||||||||||||||||||||||
12/31/2020 | $ | 26.80 | $ | (.01 | ) | $ | 7.49 | $ | 7.48 | $ | (.05 | ) | $ | (1.59 | ) | $ | (1.64 | ) | $ | 32.64 | 30.04 | % | $ | 2,391 | .75 | % | (.06 | )% | ||||||||||||||||||||
12/31/2019 | 21.75 | .12 | 6.61 | 6.73 | (.10 | ) | (1.58 | ) | (1.68 | ) | 26.80 | 31.84 | 2,050 | .75 | .48 | |||||||||||||||||||||||||||||||||
12/31/2018 | 25.38 | .11 | (2.51 | ) | (2.40 | ) | (.09 | ) | (1.14 | ) | (1.23 | ) | 21.75 | (10.31 | ) | 1,453 | .73 | .42 | ||||||||||||||||||||||||||||||
12/31/2017 | 20.24 | .12 | 5.17 | 5.29 | (.15 | ) | — | (.15 | ) | 25.38 | 26.22 | 1,639 | .73 | .54 | ||||||||||||||||||||||||||||||||||
12/31/2016 | 24.41 | .12 | .17 | .29 | (.11 | ) | (4.35 | ) | (4.46 | ) | 20.24 | 2.35 | 1,532 | .74 | .57 | |||||||||||||||||||||||||||||||||
Class 1A: | ||||||||||||||||||||||||||||||||||||||||||||||||
12/31/2020 | 26.74 | (.09 | ) | 7.48 | 7.39 | (.05 | ) | (1.59 | ) | (1.64 | ) | 32.49 | 29.72 | 1 | .99 | (.33 | ) | |||||||||||||||||||||||||||||||
12/31/2019 | 21.71 | .05 | 6.61 | 6.66 | (.05 | ) | (1.58 | ) | (1.63 | ) | 26.74 | 31.56 | 1 | .99 | .22 | |||||||||||||||||||||||||||||||||
12/31/2018 | 25.36 | .05 | (2.52 | ) | (2.47 | ) | (.04 | ) | (1.14 | ) | (1.18 | ) | 21.71 | (10.56 | ) | — | 7 | .98 | .21 | |||||||||||||||||||||||||||||
12/31/20173,4 | 20.70 | .08 | 4.71 | 4.79 | (.13 | ) | — | (.13 | ) | 25.36 | 23.19 | 5 | — | 7 | .96 | 6 | .35 | 6 | ||||||||||||||||||||||||||||||
Class 2: | ||||||||||||||||||||||||||||||||||||||||||||||||
12/31/2020 | 26.02 | (.08 | ) | 7.25 | 7.17 | (.04 | ) | (1.59 | ) | (1.63 | ) | 31.56 | 29.72 | 2,653 | 1.00 | (.31 | ) | |||||||||||||||||||||||||||||||
12/31/2019 | 21.16 | .05 | 6.43 | 6.48 | (.04 | ) | (1.58 | ) | (1.62 | ) | 26.02 | 31.52 | 2,363 | 1.00 | .22 | |||||||||||||||||||||||||||||||||
12/31/2018 | 24.72 | .04 | (2.44 | ) | (2.40 | ) | (.02 | ) | (1.14 | ) | (1.16 | ) | 21.16 | (10.55 | ) | 2,056 | .98 | .17 | ||||||||||||||||||||||||||||||
12/31/2017 | 19.72 | .06 | 5.04 | 5.10 | (.10 | ) | — | (.10 | ) | 24.72 | 25.89 | 2,551 | .98 | .27 | ||||||||||||||||||||||||||||||||||
12/31/2016 | 23.90 | .07 | .15 | .22 | (.05 | ) | (4.35 | ) | (4.40 | ) | 19.72 | 2.10 | 2,303 | .99 | .31 | |||||||||||||||||||||||||||||||||
Class 4: | ||||||||||||||||||||||||||||||||||||||||||||||||
12/31/2020 | 26.16 | (.14 | ) | 7.27 | 7.13 | (.03 | ) | (1.59 | ) | (1.62 | ) | 31.67 | 29.39 | 268 | 1.25 | (.56 | ) | |||||||||||||||||||||||||||||||
12/31/2019 | 21.28 | (.01 | ) | 6.47 | 6.46 | — | 8 | (1.58 | ) | (1.58 | ) | 26.16 | 31.24 | 206 | 1.25 | (.04 | ) | |||||||||||||||||||||||||||||||
12/31/2018 | 24.91 | (.02 | ) | (2.46 | ) | (2.48 | ) | (.01 | ) | (1.14 | ) | (1.15 | ) | 21.28 | (10.80 | ) | 146 | 1.24 | (.08 | ) | ||||||||||||||||||||||||||||
12/31/2017 | 19.91 | — | 8 | 5.09 | 5.09 | (.09 | ) | — | (.09 | ) | 24.91 | 25.62 | 125 | 1.23 | — | 9 | ||||||||||||||||||||||||||||||||
12/31/2016 | 24.11 | .01 | .16 | .17 | (.02 | ) | (4.35 | ) | (4.37 | ) | 19.91 | 1.85 | 42 | 1.24 | .03 | |||||||||||||||||||||||||||||||||
See end of tables for footnotes.
316 American Funds Insurance Series
Table of Contents
Financial highlights (continued)
| Income (loss) from investment operations1 | Dividends and distributions | |||||||||||||||||||||||||||||||||||||||||||||||
| Period ended | Net asset value, beginning of period | Net investment income (loss) | Net gains (losses) on securities (both realized and unrealized) | Total from investment operations | Dividends (from net investment income) | Distributions (from capital gains) | Total dividends and distributions | Net asset value, end of period | Total return | Net assets, end of period (in millions) | Ratio of expenses to average net assets2 | Ratio of net income (loss) to average net assets | ||||||||||||||||||||||||||||||||||||
Growth Fund |
| |||||||||||||||||||||||||||||||||||||||||||||||
Class 1: | ||||||||||||||||||||||||||||||||||||||||||||||||
12/31/2020 | $ | 81.22 | $ | .43 | $ | 41.28 | $ | 41.71 | $ | (.53 | ) | $ | (2.18 | ) | $ | (2.71 | ) | $ | 120.22 | 52.45 | % | $ | 15,644 | .35 | % | .46 | % | |||||||||||||||||||||
12/31/2019 | 69.96 | .83 | 19.63 | 20.46 | (.76 | ) | (8.44 | ) | (9.20 | ) | 81.22 | 31.11 | 10,841 | .35 | 1.09 | |||||||||||||||||||||||||||||||||
12/31/2018 | 77.85 | .64 | .25 | .89 | (.54 | ) | (8.24 | ) | (8.78 | ) | 69.96 | (.01 | ) | 8,474 | .34 | .81 | ||||||||||||||||||||||||||||||||
12/31/2017 | 67.29 | .55 | 17.89 | 18.44 | (.55 | ) | (7.33 | ) | (7.88 | ) | 77.85 | 28.62 | 8,100 | .35 | .75 | |||||||||||||||||||||||||||||||||
12/31/2016 | 68.02 | .67 | 5.40 | 6.07 | (.67 | ) | (6.13 | ) | (6.80 | ) | 67.29 | 9.77 | 6,931 | .35 | 1.03 | |||||||||||||||||||||||||||||||||
Class 1A: | ||||||||||||||||||||||||||||||||||||||||||||||||
12/31/2020 | 80.92 | .20 | 41.05 | 41.25 | (.40 | ) | (2.18 | ) | (2.58 | ) | 119.59 | 52.07 | 60 | .60 | .21 | |||||||||||||||||||||||||||||||||
12/31/2019 | 69.77 | .65 | 19.55 | 20.20 | (.61 | ) | (8.44 | ) | (9.05 | ) | 80.92 | 30.79 | 18 | .60 | .85 | |||||||||||||||||||||||||||||||||
12/31/2018 | 77.74 | .47 | .24 | .71 | (.44 | ) | (8.24 | ) | (8.68 | ) | 69.77 | (.26 | ) | 10 | .59 | .60 | ||||||||||||||||||||||||||||||||
12/31/20173,4 | 68.84 | .35 | 16.38 | 16.73 | (.50 | ) | (7.33 | ) | (7.83 | ) | 77.74 | 25.47 | 5 | 3 | .59 | 6 | .47 | 6 | ||||||||||||||||||||||||||||||
Class 2: | ||||||||||||||||||||||||||||||||||||||||||||||||
12/31/2020 | 80.57 | .19 | 40.89 | 41.08 | (.29 | ) | (2.18 | ) | (2.47 | ) | 119.18 | 52.10 | 20,594 | .60 | .21 | |||||||||||||||||||||||||||||||||
12/31/2019 | 69.48 | .63 | 19.47 | 20.10 | (.57 | ) | (8.44 | ) | (9.01 | ) | 80.57 | 30.77 | 15,885 | .60 | .83 | |||||||||||||||||||||||||||||||||
12/31/2018 | 77.35 | .44 | .27 | .71 | (.34 | ) | (8.24 | ) | (8.58 | ) | 69.48 | (.25 | ) | 13,701 | .59 | .55 | ||||||||||||||||||||||||||||||||
12/31/2017 | 66.92 | .37 | 17.76 | 18.13 | (.37 | ) | (7.33 | ) | (7.70 | ) | 77.35 | 28.28 | 15,716 | .60 | .50 | |||||||||||||||||||||||||||||||||
12/31/2016 | 67.69 | .51 | 5.36 | 5.87 | (.51 | ) | (6.13 | ) | (6.64 | ) | 66.92 | 9.49 | 13,978 | .60 | .78 | |||||||||||||||||||||||||||||||||
Class 3: | ||||||||||||||||||||||||||||||||||||||||||||||||
12/31/2020 | 81.84 | .26 | 41.56 | 41.82 | (.35 | ) | (2.18 | ) | (2.53 | ) | 121.13 | 52.20 | 279 | .53 | .28 | |||||||||||||||||||||||||||||||||
12/31/2019 | 70.44 | .69 | 19.77 | 20.46 | (.62 | ) | (8.44 | ) | (9.06 | ) | 81.84 | 30.86 | 213 | .53 | .90 | |||||||||||||||||||||||||||||||||
12/31/2018 | 78.32 | .50 | .26 | .76 | (.40 | ) | (8.24 | ) | (8.64 | ) | 70.44 | (.18 | ) | 187 | .52 | .62 | ||||||||||||||||||||||||||||||||
12/31/2017 | 67.67 | .42 | 17.98 | 18.40 | (.42 | ) | (7.33 | ) | (7.75 | ) | 78.32 | 28.39 | 212 | .53 | .57 | |||||||||||||||||||||||||||||||||
12/31/2016 | 68.37 | .56 | 5.42 | 5.98 | (.55 | ) | (6.13 | ) | (6.68 | ) | 67.67 | 9.56 | 183 | .53 | .85 | |||||||||||||||||||||||||||||||||
Class 4: | ||||||||||||||||||||||||||||||||||||||||||||||||
12/31/2020 | 79.41 | (.04 | ) | 40.24 | 40.20 | (.19 | ) | (2.18 | ) | (2.37 | ) | 117.24 | 51.71 | 2,347 | .85 | (.04 | ) | |||||||||||||||||||||||||||||||
12/31/2019 | 68.64 | .44 | 19.19 | 19.63 | (.42 | ) | (8.44 | ) | (8.86 | ) | 79.41 | 30.44 | 1,513 | .85 | .59 | |||||||||||||||||||||||||||||||||
12/31/2018 | 76.56 | .24 | .28 | .52 | (.20 | ) | (8.24 | ) | (8.44 | ) | 68.64 | (.50 | ) | 1,076 | .84 | .31 | ||||||||||||||||||||||||||||||||
12/31/2017 | 66.41 | .18 | 17.61 | 17.79 | (.31 | ) | (7.33 | ) | (7.64 | ) | 76.56 | 27.99 | 954 | .85 | .25 | |||||||||||||||||||||||||||||||||
12/31/2016 | 67.26 | .34 | 5.32 | 5.66 | (.38 | ) | (6.13 | ) | (6.51 | ) | 66.41 | 9.22 | 458 | .85 | .53 | |||||||||||||||||||||||||||||||||
See end of tables for footnotes.
American Funds Insurance Series 317
Table of Contents
Financial highlights (continued)
| Income (loss) from investment operations1 | Dividends and distributions | |||||||||||||||||||||||||||||||||||||||||||||||
| Period ended | Net asset value, beginning of period | Net investment income (loss) | Net gains (losses) on securities (both realized and unrealized) | Total from investment operations | Dividends (from net investment income) | Distributions (from capital gains) | Total dividends and distributions | Net asset value, end of period | Total return | Net assets, (in millions) | Ratio of expenses | Ratio of to average | ||||||||||||||||||||||||||||||||||||
International Fund |
| |||||||||||||||||||||||||||||||||||||||||||||||
Class 1: | ||||||||||||||||||||||||||||||||||||||||||||||||
12/31/2020 | $ | 20.86 | $ | .14 | $ | 2.82 | $ | 2.96 | $ | (.18 | ) | $ | — | $ | (.18 | ) | $ | 23.64 | 14.28 | % | $ | 5,652 | .55 | % | .71 | % | ||||||||||||||||||||||
12/31/2019 | 17.66 | .30 | 3.74 | 4.04 | (.34 | ) | (.50 | ) | (.84 | ) | 20.86 | 23.21 | 5,353 | .54 | 1.54 | |||||||||||||||||||||||||||||||||
12/31/2018 | 21.71 | .34 | (2.97 | ) | (2.63 | ) | (.40 | ) | (1.02 | ) | (1.42 | ) | 17.66 | (12.94 | ) | 4,811 | .53 | 1.62 | ||||||||||||||||||||||||||||||
12/31/2017 | 16.82 | .26 | 5.16 | 5.42 | (.30 | ) | (.23 | ) | (.53 | ) | 21.71 | 32.46 | 5,014 | .53 | 1.33 | |||||||||||||||||||||||||||||||||
12/31/2016 | 18.08 | .27 | .30 | .57 | (.28 | ) | (1.55 | ) | (1.83 | ) | 16.82 | 3.78 | 3,652 | .54 | 1.57 | |||||||||||||||||||||||||||||||||
Class 1A: | ||||||||||||||||||||||||||||||||||||||||||||||||
12/31/2020 | 20.80 | .08 | 2.81 | 2.89 | (.14 | ) | — | (.14 | ) | 23.55 | 13.96 | 10 | .80 | .43 | ||||||||||||||||||||||||||||||||||
12/31/2019 | 17.62 | .25 | 3.72 | 3.97 | (.29 | ) | (.50 | ) | (.79 | ) | 20.80 | 22.90 | 7 | .79 | 1.27 | |||||||||||||||||||||||||||||||||
12/31/2018 | 21.67 | .27 | (2.93 | ) | (2.66 | ) | (.37 | ) | (1.02 | ) | (1.39 | ) | 17.62 | (13.11 | ) | 5 | .78 | 1.32 | ||||||||||||||||||||||||||||||
12/31/20173,4 | 17.17 | .09 | 4.93 | 5.02 | (.29 | ) | (.23 | ) | (.52 | ) | 21.67 | 29.46 | 5 | 2 | .77 | 6 | .43 | 6 | ||||||||||||||||||||||||||||||
Class 2: | ||||||||||||||||||||||||||||||||||||||||||||||||
12/31/2020 | 20.78 | .09 | 2.80 | 2.89 | (.13 | ) | — | (.13 | ) | 23.54 | 13.97 | 4,481 | .80 | .46 | ||||||||||||||||||||||||||||||||||
12/31/2019 | 17.60 | .25 | 3.72 | 3.97 | (.29 | ) | (.50 | ) | (.79 | ) | 20.78 | 22.88 | 4,311 | .79 | 1.29 | |||||||||||||||||||||||||||||||||
12/31/2018 | 21.63 | .29 | (2.95 | ) | (2.66 | ) | (.35 | ) | (1.02 | ) | (1.37 | ) | 17.60 | (13.13 | ) | 3,875 | .78 | 1.40 | ||||||||||||||||||||||||||||||
12/31/2017 | 16.76 | .22 | 5.13 | 5.35 | (.25 | ) | (.23 | ) | (.48 | ) | 21.63 | 32.14 | 4,422 | .78 | 1.10 | |||||||||||||||||||||||||||||||||
12/31/2016 | 18.02 | .23 | .30 | .53 | (.24 | ) | (1.55 | ) | (1.79 | ) | 16.76 | 3.53 | 3,710 | .79 | 1.35 | |||||||||||||||||||||||||||||||||
Class 3: | ||||||||||||||||||||||||||||||||||||||||||||||||
12/31/2020 | 20.92 | .10 | 2.81 | 2.91 | (.14 | ) | — | (.14 | ) | 23.69 | 14.00 | 25 | .73 | .53 | ||||||||||||||||||||||||||||||||||
12/31/2019 | 17.70 | .27 | 3.75 | 4.02 | (.30 | ) | (.50 | ) | (.80 | ) | 20.92 | 23.05 | 25 | .72 | 1.37 | |||||||||||||||||||||||||||||||||
12/31/2018 | 21.75 | .31 | (2.98 | ) | (2.67 | ) | (.36 | ) | (1.02 | ) | (1.38 | ) | 17.70 | (13.10 | ) | 24 | .71 | 1.48 | ||||||||||||||||||||||||||||||
12/31/2017 | 16.85 | .23 | 5.17 | 5.40 | (.27 | ) | (.23 | ) | (.50 | ) | 21.75 | 32.23 | 31 | .71 | 1.17 | |||||||||||||||||||||||||||||||||
12/31/2016 | 18.11 | .24 | .30 | .54 | (.25 | ) | (1.55 | ) | (1.80 | ) | 16.85 | 3.57 | 27 | .72 | 1.42 | |||||||||||||||||||||||||||||||||
Class 4: | ||||||||||||||||||||||||||||||||||||||||||||||||
12/31/2020 | 20.54 | .04 | 2.76 | 2.80 | (.09 | ) | — | (.09 | ) | 23.25 | 13.66 | 423 | 1.05 | .21 | ||||||||||||||||||||||||||||||||||
12/31/2019 | 17.40 | .20 | 3.69 | 3.89 | (.25 | ) | (.50 | ) | (.75 | ) | 20.54 | 22.67 | 379 | 1.04 | 1.03 | |||||||||||||||||||||||||||||||||
12/31/2018 | 21.42 | .23 | (2.93 | ) | (2.70 | ) | (.30 | ) | (1.02 | ) | (1.32 | ) | 17.40 | (13.41 | ) | 295 | 1.03 | 1.13 | ||||||||||||||||||||||||||||||
12/31/2017 | 16.64 | .11 | 5.16 | 5.27 | (.26 | ) | (.23 | ) | (.49 | ) | 21.42 | 31.89 | 289 | 1.03 | .55 | |||||||||||||||||||||||||||||||||
12/31/2016 | 17.93 | .18 | .29 | .47 | (.21 | ) | (1.55 | ) | (1.76 | ) | 16.64 | 3.21 | 66 | 1.04 | 1.03 | |||||||||||||||||||||||||||||||||
See end of tables for footnotes.
318 American Funds Insurance Series
Table of Contents
Financial highlights (continued)
| Income (loss) from investment operations1 | Dividends and distributions | |||||||||||||||||||||||||||||||||||||||||||||||||||
| Period ended | Net asset value, beginning of period | Net investment income (loss) | Net gains (losses) on securities (both realized and unrealized) | Total from investment operations | Dividends (from net investment income) | Distributions (from capital gains) | Total dividends and distributions | Net asset value, end of period | Total return10 | Net assets, (in millions) | Ratio of expenses to average net assets before waivers2 | Ratio of expenses to average net assets after waivers2,10 | Ratio of to average net assets10 | |||||||||||||||||||||||||||||||||||||||
New World Fund |
| |||||||||||||||||||||||||||||||||||||||||||||||||||
Class 1: | ||||||||||||||||||||||||||||||||||||||||||||||||||||
12/31/2020 | $ | 25.84 | $ | .15 | $ | 5.93 | $ | 6.08 | $ | (.06 | ) | $ | (.27 | ) | $ | (.33 | ) | $ | 31.59 | 23.89 | % | $ | 2,309 | .76 | % | .64 | % | .58 | % | |||||||||||||||||||||||
12/31/2019 | 20.98 | .28 | 5.79 | 6.07 | (.29 | ) | (.92 | ) | (1.21 | ) | 25.84 | 29.47 | 2,129 | .76 | .76 | 1.18 | ||||||||||||||||||||||||||||||||||||
12/31/2018 | 25.30 | .27 | (3.65 | ) | (3.38 | ) | (.27 | ) | (.67 | ) | (.94 | ) | 20.98 | (13.83 | ) | 1,702 | .77 | .77 | 1.11 | |||||||||||||||||||||||||||||||||
12/31/2017 | 19.72 | .26 | 5.59 | 5.85 | (.27 | ) | — | (.27 | ) | 25.30 | 29.73 | 2,050 | .77 | .77 | 1.14 | |||||||||||||||||||||||||||||||||||||
12/31/2016 | 18.87 | .24 | .81 | 1.05 | (.20 | ) | — | (.20 | ) | 19.72 | 5.59 | 1,743 | .78 | .78 | 1.25 | |||||||||||||||||||||||||||||||||||||
Class 1A: | ||||||||||||||||||||||||||||||||||||||||||||||||||||
12/31/2020 | 25.74 | .07 | 5.92 | 5.99 | (.03 | ) | (.27 | ) | (.30 | ) | 31.43 | 23.63 | 18 | 1.01 | .87 | .26 | ||||||||||||||||||||||||||||||||||||
12/31/2019 | 20.92 | .22 | 5.76 | 5.98 | (.24 | ) | (.92 | ) | (1.16 | ) | 25.74 | 29.11 | 4 | 1.01 | 1.01 | .92 | ||||||||||||||||||||||||||||||||||||
12/31/2018 | 25.25 | .21 | (3.64 | ) | (3.43 | ) | (.23 | ) | (.67 | ) | (.90 | ) | 20.92 | (14.02 | ) | 2 | 1.02 | 1.02 | .91 | |||||||||||||||||||||||||||||||||
12/31/20173,4 | 20.14 | .13 | 5.24 | 5.37 | (.26 | ) | — | (.26 | ) | 25.25 | 26.72 | 5 | 1 | 1.00 | 6 | 1.00 | 6 | .53 | 6 | |||||||||||||||||||||||||||||||||
Class 2: | ||||||||||||||||||||||||||||||||||||||||||||||||||||
12/31/2020 | 25.59 | .08 | 5.87 | 5.95 | (.02 | ) | (.27 | ) | (.29 | ) | 31.25 | 23.58 | 1,109 | 1.01 | .89 | .34 | ||||||||||||||||||||||||||||||||||||
12/31/2019 | 20.79 | .22 | 5.73 | 5.95 | (.23 | ) | (.92 | ) | (1.15 | ) | 25.59 | 29.15 | 981 | 1.01 | 1.01 | .93 | ||||||||||||||||||||||||||||||||||||
12/31/2018 | 25.07 | .20 | (3.61 | ) | (3.41 | ) | (.20 | ) | (.67 | ) | (.87 | ) | 20.79 | (14.04 | ) | 843 | 1.02 | 1.02 | .85 | |||||||||||||||||||||||||||||||||
12/31/2017 | 19.54 | .20 | 5.55 | 5.75 | (.22 | ) | — | (.22 | ) | 25.07 | 29.44 | 1,055 | 1.02 | 1.02 | .89 | |||||||||||||||||||||||||||||||||||||
12/31/2016 | 18.71 | .19 | .79 | .98 | (.15 | ) | — | (.15 | ) | 19.54 | 5.26 | 911 | 1.03 | 1.03 | 1.00 | |||||||||||||||||||||||||||||||||||||
Class 4: | ||||||||||||||||||||||||||||||||||||||||||||||||||||
12/31/2020 | 25.47 | .02 | 5.83 | 5.85 | (.01 | ) | (.27 | ) | (.28 | ) | 31.04 | 23.29 | 807 | 1.26 | 1.14 | .08 | ||||||||||||||||||||||||||||||||||||
12/31/2019 | 20.71 | .16 | 5.70 | 5.86 | (.18 | ) | (.92 | ) | (1.10 | ) | 25.47 | 28.82 | 646 | 1.26 | 1.26 | .67 | ||||||||||||||||||||||||||||||||||||
12/31/2018 | 24.99 | .14 | (3.59 | ) | (3.45 | ) | (.16 | ) | (.67 | ) | (.83 | ) | 20.71 | (14.25 | ) | 464 | 1.27 | 1.27 | .61 | |||||||||||||||||||||||||||||||||
12/31/2017 | 19.51 | .14 | 5.52 | 5.66 | (.18 | ) | — | (.18 | ) | 24.99 | 29.06 | 427 | 1.27 | 1.27 | .61 | |||||||||||||||||||||||||||||||||||||
12/31/2016 | 18.69 | .14 | .80 | .94 | (.12 | ) | — | (.12 | ) | 19.51 | 5.04 | 240 | 1.28 | 1.28 | .75 | |||||||||||||||||||||||||||||||||||||
See end of tables for footnotes.
American Funds Insurance Series 319
Table of Contents
Financial highlights (continued)
| Income (loss) from investment operations1 | Dividends and distributions | |||||||||||||||||||||||||||||||||||||||||||||||
| Period ended | Net asset value, beginning of period | Net investment income (loss) | Net gains (losses) on securities (both realized and unrealized) | Total from investment operations | Dividends investment income) | Distributions gains) | Total dividends and distributions | Net asset value, end of period | Total return | Net assets, end of period (in millions) | Ratio of expenses to average net assets2 | Ratio of to average | ||||||||||||||||||||||||||||||||||||
Blue Chip Income and Growth Fund |
| |||||||||||||||||||||||||||||||||||||||||||||||
Class 1: | ||||||||||||||||||||||||||||||||||||||||||||||||
12/31/2020 | $ | 13.56 | $ | .25 | $ | .95 | $ | 1.20 | $ | (.26 | ) | $ | (.15 | ) | $ | (.41 | ) | $ | 14.35 | 9.04 | % | $ | 5,684 | .43 | % | 2.00 | % | |||||||||||||||||||||
12/31/2019 | 12.38 | .30 | 2.25 | 2.55 | (.30 | ) | (1.07 | ) | (1.37 | ) | 13.56 | 21.66 | 5,559 | .42 | 2.28 | |||||||||||||||||||||||||||||||||
12/31/2018 | 14.96 | .31 | (1.44 | ) | (1.13 | ) | (.31 | ) | (1.14 | ) | (1.45 | ) | 12.38 | (8.45 | ) | 4,810 | .41 | 2.13 | ||||||||||||||||||||||||||||||
12/31/2017 | 13.53 | .32 | 1.96 | 2.28 | (.32 | ) | (.53 | ) | (.85 | ) | 14.96 | 17.30 | 5,581 | .41 | 2.27 | |||||||||||||||||||||||||||||||||
12/31/2016 | 12.62 | .31 | 1.97 | 2.28 | (.29 | ) | (1.08 | ) | (1.37 | ) | 13.53 | 19.06 | 5,099 | .41 | 2.39 | |||||||||||||||||||||||||||||||||
Class 1A: | ||||||||||||||||||||||||||||||||||||||||||||||||
12/31/2020 | 13.51 | .23 | .93 | 1.16 | (.24 | ) | (.15 | ) | (.39 | ) | 14.28 | 8.79 | 25 | .67 | 1.78 | |||||||||||||||||||||||||||||||||
12/31/2019 | 12.35 | .26 | 2.24 | 2.50 | (.27 | ) | (1.07 | ) | (1.34 | ) | 13.51 | 21.35 | 9 | .67 | 2.03 | |||||||||||||||||||||||||||||||||
12/31/2018 | 14.94 | .26 | (1.42 | ) | (1.16 | ) | (.29 | ) | (1.14 | ) | (1.43 | ) | 12.35 | (8.67 | ) | 3 | .66 | 1.84 | ||||||||||||||||||||||||||||||
12/31/20173,4 | 13.75 | .28 | 1.75 | 2.03 | (.31 | ) | (.53 | ) | (.84 | ) | 14.94 | 15.21 | 5 | 1 | .65 | 6 | 2.01 | 6 | ||||||||||||||||||||||||||||||
Class 2: | ||||||||||||||||||||||||||||||||||||||||||||||||
12/31/2020 | 13.39 | .22 | .91 | 1.13 | (.22 | ) | (.15 | ) | (.37 | ) | 14.15 | 8.68 | 3,082 | .68 | 1.75 | |||||||||||||||||||||||||||||||||
12/31/2019 | 12.24 | .26 | 2.22 | 2.48 | (.26 | ) | (1.07 | ) | (1.33 | ) | 13.39 | 21.38 | 3,093 | .67 | 2.03 | |||||||||||||||||||||||||||||||||
12/31/2018 | 14.80 | .27 | (1.42 | ) | (1.15 | ) | (.27 | ) | (1.14 | ) | (1.41 | ) | 12.24 | (8.66 | ) | 2,850 | .66 | 1.88 | ||||||||||||||||||||||||||||||
12/31/2017 | 13.39 | .28 | 1.94 | 2.22 | (.28 | ) | (.53 | ) | (.81 | ) | 14.80 | 17.04 | 3,551 | .66 | 2.02 | |||||||||||||||||||||||||||||||||
12/31/2016 | 12.51 | .28 | 1.94 | 2.22 | (.26 | ) | (1.08 | ) | (1.34 | ) | 13.39 | 18.70 | 3,412 | .66 | 2.16 | |||||||||||||||||||||||||||||||||
Class 4: | ||||||||||||||||||||||||||||||||||||||||||||||||
12/31/2020 | 13.31 | .19 | .91 | 1.10 | (.20 | ) | (.15 | ) | (.35 | ) | 14.06 | 8.47 | 788 | .93 | 1.51 | |||||||||||||||||||||||||||||||||
12/31/2019 | 12.19 | .23 | 2.20 | 2.43 | (.24 | ) | (1.07 | ) | (1.31 | ) | 13.31 | 21.03 | 621 | .92 | 1.78 | |||||||||||||||||||||||||||||||||
12/31/2018 | 14.77 | .23 | (1.42 | ) | (1.19 | ) | (.25 | ) | (1.14 | ) | (1.39 | ) | 12.19 | (8.92 | ) | 368 | .91 | 1.62 | ||||||||||||||||||||||||||||||
12/31/2017 | 13.39 | .25 | 1.93 | 2.18 | (.27 | ) | (.53 | ) | (.80 | ) | 14.77 | 16.70 | 247 | .91 | 1.76 | |||||||||||||||||||||||||||||||||
12/31/2016 | 12.53 | .24 | 1.96 | 2.20 | (.26 | ) | (1.08 | ) | (1.34 | ) | 13.39 | 18.49 | 132 | .91 | 1.81 | |||||||||||||||||||||||||||||||||
Global Growth and Income Fund |
| |||||||||||||||||||||||||||||||||||||||||||||||
Class 1: | ||||||||||||||||||||||||||||||||||||||||||||||||
12/31/2020 | $ | 15.92 | $ | .22 | $ | 1.14 | $ | 1.36 | $ | (.23 | ) | $ | (.38 | ) | $ | (.61 | ) | $ | 16.67 | 9.03 | % | $ | 657 | .66 | % | 1.49 | % | |||||||||||||||||||||
12/31/2019 | 13.02 | .31 | 3.67 | 3.98 | (.32 | ) | (.76 | ) | (1.08 | ) | 15.92 | 31.39 | 625 | .65 | 2.08 | |||||||||||||||||||||||||||||||||
12/31/2018 | 15.81 | .29 | (1.62 | ) | (1.33 | ) | (.28 | ) | (1.18 | ) | (1.46 | ) | 13.02 | (9.36 | ) | 492 | .63 | 1.94 | ||||||||||||||||||||||||||||||
12/31/2017 | 13.02 | .35 | 3.06 | 3.41 | (.36 | ) | (.26 | ) | (.62 | ) | 15.81 | 26.40 | 485 | .63 | 2.43 | |||||||||||||||||||||||||||||||||
12/31/2016 | 12.35 | .28 | .66 | .94 | (.27 | ) | — | (.27 | ) | 13.02 | 7.61 | 571 | .63 | 2.18 | ||||||||||||||||||||||||||||||||||
Class 1A: | ||||||||||||||||||||||||||||||||||||||||||||||||
12/31/2020 | 15.88 | .18 | 1.13 | 1.31 | (.19 | ) | (.38 | ) | (.57 | ) | 16.62 | 8.78 | 2 | .90 | 1.23 | |||||||||||||||||||||||||||||||||
12/31/2019 | 13.00 | .26 | 3.68 | 3.94 | (.30 | ) | (.76 | ) | (1.06 | ) | 15.88 | 31.04 | 2 | .90 | 1.77 | |||||||||||||||||||||||||||||||||
12/31/2018 | 15.81 | .26 | (1.63 | ) | (1.37 | ) | (.26 | ) | (1.18 | ) | (1.44 | ) | 13.00 | (9.62 | ) | 1 | .88 | 1.74 | ||||||||||||||||||||||||||||||
12/31/20173,4 | 13.21 | .18 | 3.03 | 3.21 | (.35 | ) | (.26 | ) | (.61 | ) | 15.81 | 24.54 | 5 | — | 7 | .84 | 6 | 1.20 | 6 | |||||||||||||||||||||||||||||
Class 2: | ||||||||||||||||||||||||||||||||||||||||||||||||
12/31/2020 | 15.89 | .18 | 1.13 | 1.31 | (.19 | ) | (.38 | ) | (.57 | ) | 16.63 | 8.73 | 1,349 | .91 | 1.23 | |||||||||||||||||||||||||||||||||
12/31/2019 | 12.99 | .27 | 3.68 | 3.95 | (.29 | ) | (.76 | ) | (1.05 | ) | 15.89 | 31.14 | 1,366 | .90 | 1.84 | |||||||||||||||||||||||||||||||||
12/31/2018 | 15.78 | .26 | (1.63 | ) | (1.37 | ) | (.24 | ) | (1.18 | ) | (1.42 | ) | 12.99 | (9.63 | ) | 1,228 | .88 | 1.70 | ||||||||||||||||||||||||||||||
12/31/2017 | 13.00 | .31 | 3.05 | 3.36 | (.32 | ) | (.26 | ) | (.58 | ) | 15.78 | 26.06 | 1,538 | .88 | 2.11 | |||||||||||||||||||||||||||||||||
12/31/2016 | 12.33 | .25 | .65 | .90 | (.23 | ) | — | (.23 | ) | 13.00 | 7.34 | 1,405 | .88 | 1.98 | ||||||||||||||||||||||||||||||||||
Class 4: | ||||||||||||||||||||||||||||||||||||||||||||||||
12/31/2020 | 15.63 | .14 | 1.12 | 1.26 | (.16 | ) | (.38 | ) | (.54 | ) | 16.35 | 8.55 | 166 | 1.16 | .97 | |||||||||||||||||||||||||||||||||
12/31/2019 | 12.81 | .23 | 3.61 | 3.84 | (.26 | ) | (.76 | ) | (1.02 | ) | 15.63 | 30.73 | 145 | 1.15 | 1.56 | |||||||||||||||||||||||||||||||||
12/31/2018 | 15.60 | .21 | (1.60 | ) | (1.39 | ) | (.22 | ) | (1.18 | ) | (1.40 | ) | 12.81 | (9.89 | ) | 95 | 1.13 | 1.43 | ||||||||||||||||||||||||||||||
12/31/2017 | 12.89 | .22 | 3.08 | 3.30 | (.33 | ) | (.26 | ) | (.59 | ) | 15.60 | 25.83 | 79 | 1.14 | 1.49 | |||||||||||||||||||||||||||||||||
12/31/2016 | 12.26 | .21 | .65 | .86 | (.23 | ) | — | (.23 | ) | 12.89 | 7.04 | 16 | 1.13 | 1.63 | ||||||||||||||||||||||||||||||||||
See end of tables for footnotes.
320 American Funds Insurance Series
Table of Contents
Financial highlights (continued)
| Income (loss) from investment operations1 | Dividends and distributions | |||||||||||||||||||||||||||||||||||||||||||||
| Period ended | Net asset value, beginning of period | Net investment income (loss) | Net gains (losses) on securities (both realized and unrealized) | Total from investment operations | Dividends (from net investment income) | Distributions (from capital gains) | Total dividends and distributions | Net asset value, end of period | Total return | Net assets, end of period (in millions) | Ratio of expenses to average net assets2 | Ratio of to average | ||||||||||||||||||||||||||||||||||
Growth-Income Fund |
| |||||||||||||||||||||||||||||||||||||||||||||
Class 1: | ||||||||||||||||||||||||||||||||||||||||||||||
12/31/2020 | $ | 50.71 | $ | .75 | $ | 6.02 | $ | 6.77 | $ | (.80 | ) | $ | (1.30 | ) | $ | (2.10 | ) | $ | 55.38 | 13.81 | % | $ | 22,903 | .29 | % | 1.52% | ||||||||||||||||||||
12/31/2019 | 45.39 | 1.00 | 10.40 | 11.40 | (.92 | ) | (5.16 | ) | (6.08 | ) | 50.71 | 26.46 | 21,057 | .29 | 2.05 | |||||||||||||||||||||||||||||||
12/31/2018 | 50.22 | .84 | (1.25 | ) | (.41 | ) | (.84 | ) | (3.58 | ) | (4.42 | ) | 45.39 | (1.55 | ) | 16,783 | .28 | 1.65 | ||||||||||||||||||||||||||||
12/31/2017 | 44.41 | .81 | 8.89 | 9.70 | (.78 | ) | (3.11 | ) | (3.89 | ) | 50.22 | 22.68 | 15,765 | .28 | 1.69 | |||||||||||||||||||||||||||||||
12/31/2016 | 45.40 | .79 | 4.09 | 4.88 | (.75 | ) | (5.12 | ) | (5.87 | ) | 44.41 | 11.80 | 12,588 | .29 | 1.79 | |||||||||||||||||||||||||||||||
Class 1A: | ||||||||||||||||||||||||||||||||||||||||||||||
12/31/2020 | 50.54 | .63 | 5.99 | 6.62 | (.70 | ) | (1.30 | ) | (2.00 | ) | 55.16 | 13.55 | 16 | .54 | 1.28 | |||||||||||||||||||||||||||||||
12/31/2019 | 45.28 | .89 | 10.36 | 11.25 | (.83 | ) | (5.16 | ) | (5.99 | ) | 50.54 | 26.14 | 11 | .54 | 1.82 | |||||||||||||||||||||||||||||||
12/31/2018 | 50.15 | .72 | (1.25 | ) | (.53 | ) | (.76 | ) | (3.58 | ) | (4.34 | ) | 45.28 | (1.78 | ) | 7 | .53 | 1.43 | ||||||||||||||||||||||||||||
12/31/20173,4 | 45.39 | .67 | 7.96 | 8.63 | (.76 | ) | (3.11 | ) | (3.87 | ) | 50.15 | 19.83 | 5 | 2 | .52 | 6 | 1.416 | |||||||||||||||||||||||||||||
Class 2: | ||||||||||||||||||||||||||||||||||||||||||||||
12/31/2020 | 50.08 | .62 | 5.93 | 6.55 | (.67 | ) | (1.30 | ) | (1.97 | ) | 54.66 | 13.54 | 14,012 | .54 | 1.27 | |||||||||||||||||||||||||||||||
12/31/2019 | 44.90 | .87 | 10.27 | 11.14 | (.80 | ) | (5.16 | ) | (5.96 | ) | 50.08 | 26.14 | 13,586 | .53 | 1.80 | |||||||||||||||||||||||||||||||
12/31/2018 | 49.71 | .71 | (1.23 | ) | (.52 | ) | (.71 | ) | (3.58 | ) | (4.29 | ) | 44.90 | (1.79 | ) | 12,035 | .53 | 1.40 | ||||||||||||||||||||||||||||
12/31/2017 | 44.00 | .68 | 8.80 | 9.48 | (.66 | ) | (3.11 | ) | (3.77 | ) | 49.71 | 22.38 | 13,930 | .53 | 1.45 | |||||||||||||||||||||||||||||||
12/31/2016 | 45.04 | .67 | 4.05 | 4.72 | (.64 | ) | (5.12 | ) | (5.76 | ) | 44.00 | 11.51 | 12,854 | .54 | 1.54 | |||||||||||||||||||||||||||||||
Class 3: | ||||||||||||||||||||||||||||||||||||||||||||||
12/31/2020 | 50.81 | .66 | 6.02 | 6.68 | (.70 | ) | (1.30 | ) | (2.00 | ) | 55.49 | 13.60 | 154 | .47 | 1.34 | |||||||||||||||||||||||||||||||
12/31/2019 | 45.47 | .91 | 10.43 | 11.34 | (.84 | ) | (5.16 | ) | (6.00 | ) | 50.81 | 26.24 | 156 | .46 | 1.87 | |||||||||||||||||||||||||||||||
12/31/2018 | 50.29 | .75 | (1.25 | ) | (.50 | ) | (.74 | ) | (3.58 | ) | (4.32 | ) | 45.47 | (1.72 | ) | 140 | .46 | 1.47 | ||||||||||||||||||||||||||||
12/31/2017 | 44.47 | .72 | 8.90 | 9.62 | (.69 | ) | (3.11 | ) | (3.80 | ) | 50.29 | 22.47 | 168 | .46 | 1.52 | |||||||||||||||||||||||||||||||
12/31/2016 | 45.46 | .71 | 4.09 | 4.80 | (.67 | ) | (5.12 | ) | (5.79 | ) | 44.47 | 11.59 | 156 | .47 | 1.61 | |||||||||||||||||||||||||||||||
Class 4: | ||||||||||||||||||||||||||||||||||||||||||||||
12/31/2020 | 49.52 | .49 | 5.85 | 6.34 | (.57 | ) | (1.30 | ) | (1.87 | ) | 53.99 | 13.25 | 1,407 | .79 | 1.02 | |||||||||||||||||||||||||||||||
12/31/2019 | 44.47 | .74 | 10.18 | 10.92 | (.71 | ) | (5.16 | ) | (5.87 | ) | 49.52 | 25.86 | 1,216 | .79 | 1.56 | |||||||||||||||||||||||||||||||
12/31/2018 | 49.31 | .58 | (1.23 | ) | (.65 | ) | (.61 | ) | (3.58 | ) | (4.19 | ) | 44.47 | (2.05 | ) | 899 | .78 | 1.15 | ||||||||||||||||||||||||||||
12/31/2017 | 43.73 | .56 | 8.73 | 9.29 | (.60 | ) | (3.11 | ) | (3.71 | ) | 49.31 | 22.08 | 827 | .78 | 1.19 | |||||||||||||||||||||||||||||||
12/31/2016 | 44.82 | .56 | 4.02 | 4.58 | (.55 | ) | (5.12 | ) | (5.67 | ) | 43.73 | 11.25 | 495 | .79 | 1.29 | |||||||||||||||||||||||||||||||
See end of tables for footnotes.
American Funds Insurance Series 321
Table of Contents
Financial highlights (continued)
| Income (loss) from investment operations1 | Dividends and distributions | |||||||||||||||||||||||||||||||||||||||||||||||
| Period ended | Net asset value, beginning of period | Net investment income (loss) | Net gains (losses) on securities (both realized and unrealized) | Total from investment operations | Dividends (from net investment income) | Distributions (from capital gains) | Total dividends and distributions | Net asset value, end of period | Total return | Net assets, end of period (in millions) | Ratio of expenses to average net assets2 | Ratio of to average | ||||||||||||||||||||||||||||||||||||
International Growth and Income Fund |
| |||||||||||||||||||||||||||||||||||||||||||||||
Class 1: | ||||||||||||||||||||||||||||||||||||||||||||||||
12/31/2020 | $ | 18.18 | $ | .27 | $ | .85 | $ | 1.12 | $ | (.29 | ) | $ | — | $ | (.29 | ) | $ | 19.01 | 6.24 | % | $ | 1,120 | .68 | % | 1.70 | % | ||||||||||||||||||||||
12/31/2019 | 15.35 | .46 | 3.03 | 3.49 | (.47 | ) | (.19 | ) | (.66 | ) | 18.18 | 23.06 | 1,140 | .66 | 2.73 | |||||||||||||||||||||||||||||||||
12/31/2018 | 17.72 | .45 | (2.39 | ) | (1.94 | ) | (.43 | ) | — | (.43 | ) | 15.35 | (11.00 | ) | 1,034 | .65 | 2.62 | |||||||||||||||||||||||||||||||
12/31/2017 | 14.48 | .46 | 3.20 | 3.66 | (.42 | ) | — | (.42 | ) | 17.72 | 25.31 | 1,121 | .66 | 2.75 | ||||||||||||||||||||||||||||||||||
12/31/2016 | 14.72 | .43 | (.19 | ) | .24 | (.42 | ) | (.06 | ) | (.48 | ) | 14.48 | 1.71 | 820 | .68 | 2.93 | ||||||||||||||||||||||||||||||||
Class 1A: | ||||||||||||||||||||||||||||||||||||||||||||||||
12/31/2020 | 18.15 | .22 | .85 | 1.07 | (.25 | ) | — | (.25 | ) | 18.97 | 5.98 | 3 | .93 | 1.38 | ||||||||||||||||||||||||||||||||||
12/31/2019 | 15.33 | .41 | 3.04 | 3.45 | (.44 | ) | (.19 | ) | (.63 | ) | 18.15 | 22.76 | 2 | .91 | 2.41 | |||||||||||||||||||||||||||||||||
12/31/2018 | 17.70 | .41 | (2.39 | ) | (1.98 | ) | (.39 | ) | — | (.39 | ) | 15.33 | (11.24 | ) | 2 | .90 | 2.35 | |||||||||||||||||||||||||||||||
12/31/20173,4 | 14.69 | .34 | 3.08 | 3.42 | (.41 | ) | — | (.41 | ) | 17.70 | 23.36 | 5 | 2 | .91 | 6 | 1.99 | 6 | |||||||||||||||||||||||||||||||
Class 2: | ||||||||||||||||||||||||||||||||||||||||||||||||
12/31/2020 | 18.12 | .23 | .85 | 1.08 | (.25 | ) | — | (.25 | ) | 18.95 | 6.01 | 221 | .93 | 1.43 | ||||||||||||||||||||||||||||||||||
12/31/2019 | 15.30 | .42 | 3.02 | 3.44 | (.43 | ) | (.19 | ) | (.62 | ) | 18.12 | 22.76 | 257 | .91 | 2.49 | |||||||||||||||||||||||||||||||||
12/31/2018 | 17.66 | .41 | (2.38 | ) | (1.97 | ) | (.39 | ) | — | (.39 | ) | 15.30 | (11.23 | ) | 230 | .90 | 2.38 | |||||||||||||||||||||||||||||||
12/31/2017 | 14.43 | .43 | 3.17 | 3.60 | (.37 | ) | — | (.37 | ) | 17.66 | 25.03 | 276 | .91 | 2.60 | ||||||||||||||||||||||||||||||||||
12/31/2016 | 14.68 | .40 | (.21 | ) | .19 | (.38 | ) | (.06 | ) | (.44 | ) | 14.43 | 1.44 | 244 | .93 | 2.72 | ||||||||||||||||||||||||||||||||
Class 4: | ||||||||||||||||||||||||||||||||||||||||||||||||
12/31/2020 | 18.01 | .19 | .83 | 1.02 | (.21 | ) | — | (.21 | ) | 18.82 | 5.73 | 112 | 1.18 | 1.19 | ||||||||||||||||||||||||||||||||||
12/31/2019 | 15.22 | .37 | 3.01 | 3.38 | (.40 | ) | (.19 | ) | (.59 | ) | 18.01 | 22.47 | 101 | 1.16 | 2.18 | |||||||||||||||||||||||||||||||||
12/31/2018 | 17.58 | .36 | (2.36 | ) | (2.00 | ) | (.36 | ) | — | (.36 | ) | 15.22 | (11.46 | ) | 71 | 1.15 | 2.10 | |||||||||||||||||||||||||||||||
12/31/2017 | 14.38 | .37 | 3.18 | 3.55 | (.35 | ) | — | (.35 | ) | 17.58 | 24.72 | 63 | 1.16 | 2.24 | ||||||||||||||||||||||||||||||||||
12/31/2016 | 14.63 | .36 | (.19 | ) | .17 | (.36 | ) | (.06 | ) | (.42 | ) | 14.38 | 1.18 | 37 | 1.18 | 2.43 | ||||||||||||||||||||||||||||||||
See end of tables for footnotes.
322 American Funds Insurance Series
Table of Contents
Financial highlights (continued)
| Income (loss) from investment operations1 | Dividends and distributions | |||||||||||||||||||||||||||||||||||||||||||||||||||
| Period ended | Net asset value, beginning of period | Net investment income (loss) | Net gains (losses) on securities (both realized and unrealized) | Total from investment operations | Dividends (from net investment income) | Distributions (from capital gains) | Total dividends and distributions | Net asset value, end of period | Total return10 | Net assets, end of period (in millions) | Ratio of average net | Ratio of expenses to average net assets after waivers2,10 | Ratio of to average | |||||||||||||||||||||||||||||||||||||||
Capital Income Builder |
| |||||||||||||||||||||||||||||||||||||||||||||||||||
Class 1: | ||||||||||||||||||||||||||||||||||||||||||||||||||||
12/31/2020 | $ | 10.73 | $ | .31 | $ | .15 | $ | .46 | $ | (.32 | ) | $ | — | $ | (.32 | ) | $ | 10.87 | 4.64 | % | $ | 621 | .53 | % | .35 | % | 3.07 | % | ||||||||||||||||||||||||
12/31/2019 | 9.37 | .32 | 1.36 | 1.68 | (.32 | ) | — | (.32 | ) | 10.73 | 18.16 | 533 | .53 | .53 | 3.17 | |||||||||||||||||||||||||||||||||||||
12/31/2018 | 10.40 | .31 | (1.00 | ) | (.69 | ) | (.32 | ) | (.02 | ) | (.34 | ) | 9.37 | (6.77 | ) | 317 | .54 | .54 | 3.08 | |||||||||||||||||||||||||||||||||
12/31/2017 | 9.46 | .32 | .93 | 1.25 | (.31 | ) | — | (.31 | ) | 10.40 | 13.29 | 254 | .54 | .54 | 3.21 | |||||||||||||||||||||||||||||||||||||
12/31/2016 | 9.40 | .32 | .07 | .39 | (.33 | ) | — | (.33 | ) | 9.46 | 4.17 | 156 | .54 | .54 | 3.39 | |||||||||||||||||||||||||||||||||||||
Class 1A: | ||||||||||||||||||||||||||||||||||||||||||||||||||||
12/31/2020 | 10.72 | .28 | .16 | .44 | (.30 | ) | — | (.30 | ) | 10.86 | 4.38 | 6 | .78 | .60 | 2.81 | |||||||||||||||||||||||||||||||||||||
12/31/2019 | 9.36 | .29 | 1.37 | 1.66 | (.30 | ) | — | (.30 | ) | 10.72 | 17.90 | 6 | .78 | .78 | 2.84 | |||||||||||||||||||||||||||||||||||||
12/31/2018 | 10.39 | .28 | (.99 | ) | (.71 | ) | (.30 | ) | (.02 | ) | (.32 | ) | 9.36 | (7.01 | ) | 2 | .79 | .79 | 2.82 | |||||||||||||||||||||||||||||||||
12/31/20173,4 | 9.57 | .27 | .84 | 1.11 | (.29 | ) | — | (.29 | ) | 10.39 | 11.72 | 5 | 1 | .79 | 6 | .79 | 6 | 2.63 | 6 | |||||||||||||||||||||||||||||||||
Class 2: | ||||||||||||||||||||||||||||||||||||||||||||||||||||
12/31/2020 | 10.72 | .29 | .16 | .45 | (.30 | ) | — | (.30 | ) | 10.87 | 4.48 | 8 | .78 | .60 | 2.83 | |||||||||||||||||||||||||||||||||||||
12/31/2019 | 9.36 | .30 | 1.35 | 1.65 | (.29 | ) | — | (.29 | ) | 10.72 | 17.89 | 6 | .78 | .78 | 2.91 | |||||||||||||||||||||||||||||||||||||
12/31/2018 | 10.40 | .28 | (1.00 | ) | (.72 | ) | (.30 | ) | (.02 | ) | (.32 | ) | 9.36 | (7.08 | ) | 4 | .79 | .79 | 2.83 | |||||||||||||||||||||||||||||||||
12/31/2017 | 9.46 | .29 | .93 | 1.22 | (.28 | ) | — | (.28 | ) | 10.40 | 13.04 | 1 | .79 | .79 | 2.82 | |||||||||||||||||||||||||||||||||||||
12/31/2016 | 9.40 | .27 | .11 | .38 | (.32 | ) | — | (.32 | ) | 9.46 | 4.08 | — | 7 | .80 | .80 | 2.82 | ||||||||||||||||||||||||||||||||||||
Class 4: | ||||||||||||||||||||||||||||||||||||||||||||||||||||
12/31/2020 | 10.71 | .26 | .15 | .41 | (.27 | ) | — | (.27 | ) | 10.85 | 4.11 | 462 | 1.03 | .85 | 2.55 | |||||||||||||||||||||||||||||||||||||
12/31/2019 | 9.35 | .27 | 1.36 | 1.63 | (.27 | ) | — | (.27 | ) | 10.71 | 17.62 | 454 | 1.03 | 1.03 | 2.68 | |||||||||||||||||||||||||||||||||||||
12/31/2018 | 10.38 | .26 | (1.00 | ) | (.74 | ) | (.27 | ) | (.02 | ) | (.29 | ) | 9.35 | (7.25 | ) | 352 | 1.04 | 1.04 | 2.58 | |||||||||||||||||||||||||||||||||
12/31/2017 | 9.45 | .27 | .92 | 1.19 | (.26 | ) | — | (.26 | ) | 10.38 | 12.65 | 338 | 1.04 | 1.04 | 2.72 | |||||||||||||||||||||||||||||||||||||
12/31/2016 | 9.38 | .27 | .08 | .35 | (.28 | ) | — | (.28 | ) | 9.45 | 3.78 | 256 | 1.04 | 1.04 | 2.88 | |||||||||||||||||||||||||||||||||||||
See end of tables for footnotes.
American Funds Insurance Series 323
Table of Contents
Financial highlights (continued)
| Income (loss) from investment operations1 | Dividends and distributions | |||||||||||||||||||||||||||||||||||||||||||||||
| Period ended | Net asset value, beginning of period | Net investment income (loss) | Net gains (losses) on securities (both realized and unrealized) | Total from investment operations | Dividends (from net investment income) | Distributions (from capital gains) | Total dividends and distributions | Net asset value, end of period | Total return | Net assets, end of period (in millions) | Ratio of expenses to average net assets2 | Ratio of to average | ||||||||||||||||||||||||||||||||||||
Asset Allocation Fund |
| |||||||||||||||||||||||||||||||||||||||||||||||
Class 1: | ||||||||||||||||||||||||||||||||||||||||||||||||
12/31/2020 | $ | 24.05 | $ | .43 | $ | 2.59 | $ | 3.02 | $ | (.46 | ) | $ | (.11 | ) | $ | (.57 | ) | $ | 26.50 | 12.71 | % | $ | 19,238 | .30 | % | 1.80 | % | |||||||||||||||||||||
12/31/2019 | 21.29 | .51 | 3.94 | 4.45 | (.50 | ) | (1.19 | ) | (1.69 | ) | 24.05 | 21.54 | 17,730 | .29 | 2.21 | |||||||||||||||||||||||||||||||||
12/31/2018 | 23.71 | .48 | (1.43 | ) | (.95 | ) | (.44 | ) | (1.03 | ) | (1.47 | ) | 21.29 | (4.35 | ) | 14,627 | .28 | 2.04 | ||||||||||||||||||||||||||||||
12/31/2017 | 21.68 | .44 | 3.06 | 3.50 | (.41 | ) | (1.06 | ) | (1.47 | ) | 23.71 | 16.51 | 16,556 | .29 | 1.90 | |||||||||||||||||||||||||||||||||
12/31/2016 | 20.62 | .42 | 1.54 | 1.96 | (.39 | ) | (.51 | ) | (.90 | ) | 21.68 | 9.69 | 13,008 | .29 | 1.97 | |||||||||||||||||||||||||||||||||
Class 1A: | ||||||||||||||||||||||||||||||||||||||||||||||||
12/31/2020 | 23.99 | .37 | 2.58 | 2.95 | (.41 | ) | (.11 | ) | (.52 | ) | 26.42 | 12.43 | 14 | .55 | 1.56 | |||||||||||||||||||||||||||||||||
12/31/2019 | 21.26 | .45 | 3.92 | 4.37 | (.45 | ) | (1.19 | ) | (1.64 | ) | 23.99 | 21.19 | 11 | .54 | 1.95 | |||||||||||||||||||||||||||||||||
12/31/2018 | 23.69 | .42 | (1.42 | ) | (1.00 | ) | (.40 | ) | (1.03 | ) | (1.43 | ) | 21.26 | (4.58 | ) | 7 | .53 | 1.82 | ||||||||||||||||||||||||||||||
12/31/20173,4 | 21.97 | .39 | 2.78 | 3.17 | (.39 | ) | (1.06 | ) | (1.45 | ) | 23.69 | 14.78 | 5 | 4 | .53 | 6 | 1.69 | 6 | ||||||||||||||||||||||||||||||
Class 2: | ||||||||||||||||||||||||||||||||||||||||||||||||
12/31/2020 | 23.79 | .37 | 2.56 | 2.93 | (.40 | ) | (.11 | ) | (.51 | ) | 26.21 | 12.46 | 5,242 | .55 | 1.55 | |||||||||||||||||||||||||||||||||
12/31/2019 | 21.08 | .45 | 3.89 | 4.34 | (.44 | ) | (1.19 | ) | (1.63 | ) | 23.79 | 21.23 | 5,154 | .54 | 1.96 | |||||||||||||||||||||||||||||||||
12/31/2018 | 23.49 | .41 | (1.41 | ) | (1.00 | ) | (.38 | ) | (1.03 | ) | (1.41 | ) | 21.08 | (4.60 | ) | 4,668 | .53 | 1.78 | ||||||||||||||||||||||||||||||
12/31/2017 | 21.49 | .37 | 3.04 | 3.41 | (.35 | ) | (1.06 | ) | (1.41 | ) | 23.49 | 16.23 | 5,480 | .54 | 1.64 | |||||||||||||||||||||||||||||||||
12/31/2016 | 20.45 | .36 | 1.53 | 1.89 | (.34 | ) | (.51 | ) | (.85 | ) | 21.49 | 9.41 | 5,144 | .54 | 1.72 | |||||||||||||||||||||||||||||||||
Class 3: | ||||||||||||||||||||||||||||||||||||||||||||||||
12/31/2020 | 24.08 | .39 | 2.59 | 2.98 | (.42 | ) | (.11 | ) | (.53 | ) | 26.53 | 12.50 | 33 | .48 | 1.62 | |||||||||||||||||||||||||||||||||
12/31/2019 | 21.32 | .47 | 3.93 | 4.40 | (.45 | ) | (1.19 | ) | (1.64 | ) | 24.08 | 21.30 | 32 | .47 | 2.02 | |||||||||||||||||||||||||||||||||
12/31/2018 | 23.73 | .43 | (1.41 | ) | (.98 | ) | (.40 | ) | (1.03 | ) | (1.43 | ) | 21.32 | (4.49 | ) | 29 | .46 | 1.85 | ||||||||||||||||||||||||||||||
12/31/2017 | 21.70 | .39 | 3.07 | 3.46 | (.37 | ) | (1.06 | ) | (1.43 | ) | 23.73 | 16.29 | 38 | .47 | 1.72 | |||||||||||||||||||||||||||||||||
12/31/2016 | 20.64 | .38 | 1.54 | 1.92 | (.35 | ) | (.51 | ) | (.86 | ) | 21.70 | 9.49 | 35 | .47 | 1.79 | |||||||||||||||||||||||||||||||||
Class 4: | ||||||||||||||||||||||||||||||||||||||||||||||||
12/31/2020 | 23.67 | .31 | 2.54 | 2.85 | (.35 | ) | (.11 | ) | (.46 | ) | 26.06 | 12.16 | 5,131 | .80 | 1.30 | |||||||||||||||||||||||||||||||||
12/31/2019 | 20.99 | .39 | 3.87 | 4.26 | (.39 | ) | (1.19 | ) | (1.58 | ) | 23.67 | 20.92 | 4,493 | .79 | 1.71 | |||||||||||||||||||||||||||||||||
12/31/2018 | 23.40 | .35 | (1.40 | ) | (1.05 | ) | (.33 | ) | (1.03 | ) | (1.36 | ) | 20.99 | (4.83 | ) | 3,594 | .78 | 1.54 | ||||||||||||||||||||||||||||||
12/31/2017 | 21.43 | .32 | 3.02 | 3.34 | (.31 | ) | (1.06 | ) | (1.37 | ) | 23.40 | 15.91 | 3,582 | .79 | 1.40 | |||||||||||||||||||||||||||||||||
12/31/2016 | 20.40 | .31 | 1.53 | 1.84 | (.30 | ) | (.51 | ) | (.81 | ) | 21.43 | 9.16 | 2,861 | .79 | 1.47 | |||||||||||||||||||||||||||||||||
See end of tables for footnotes.
324 American Funds Insurance Series
Table of Contents
Financial highlights (continued)
| Income (loss) from investment operations1 | Dividends and distributions | |||||||||||||||||||||||||||||||||||||||||||||||
| Period ended | Net asset value, beginning of period | Net investment income (loss) | Net gains (losses) on securities (both realized and unrealized) | Total from investment operations | Dividends (from net investment income) | Distributions (from capital gains) | Total dividends and distributions | Net asset value, end of period | Total return | Net assets, end of period (in millions) | Ratio of expenses to average net assets2 | Ratio of to average | ||||||||||||||||||||||||||||||||||||
Global Balanced Fund |
| |||||||||||||||||||||||||||||||||||||||||||||||
Class 1: | ||||||||||||||||||||||||||||||||||||||||||||||||
12/31/2020 | $ | 13.51 | $ | .17 | $ | 1.24 | $ | 1.41 | $ | (.19 | ) | $ | (.54 | ) | $ | (.73 | ) | $ | 14.19 | 10.53 | % | $ | 139 | .72 | % | 1.29 | % | |||||||||||||||||||||
12/31/2019 | 11.67 | .24 | 2.17 | 2.41 | (.20 | ) | (.37 | ) | (.57 | ) | 13.51 | 20.79 | 134 | .72 | 1.88 | |||||||||||||||||||||||||||||||||
12/31/2018 | 12.75 | .23 | (.96 | ) | (.73 | ) | (.20 | ) | (.15 | ) | (.35 | ) | 11.67 | (5.81 | ) | 110 | .72 | 1.82 | ||||||||||||||||||||||||||||||
12/31/2017 | 11.08 | .21 | 1.99 | 2.20 | (.15 | ) | (.38 | ) | (.53 | ) | 12.75 | 19.91 | 93 | .72 | 1.68 | |||||||||||||||||||||||||||||||||
12/31/2016 | 10.74 | .19 | .32 | .51 | (.17 | ) | — | (.17 | ) | 11.08 | 4.73 | 64 | .72 | 1.73 | ||||||||||||||||||||||||||||||||||
Class 1A: | ||||||||||||||||||||||||||||||||||||||||||||||||
12/31/2020 | 13.49 | .14 | 1.23 | 1.37 | (.16 | ) | (.54 | ) | (.70 | ) | 14.16 | 10.25 | 3 | .97 | 1.03 | |||||||||||||||||||||||||||||||||
12/31/2019 | 11.65 | .21 | 2.17 | 2.38 | (.17 | ) | (.37 | ) | (.54 | ) | 13.49 | 20.54 | 2 | .97 | 1.63 | |||||||||||||||||||||||||||||||||
12/31/2018 | 12.74 | .18 | (.94 | ) | (.76 | ) | (.18 | ) | (.15 | ) | (.33 | ) | 11.65 | (6.03 | ) | 2 | .98 | 1.44 | ||||||||||||||||||||||||||||||
12/31/20173,4 | 11.18 | .16 | 1.92 | 2.08 | (.14 | ) | (.38 | ) | (.52 | ) | 12.74 | 18.71 | 5 | — | 7 | .94 | 6 | 1.27 | 6 | |||||||||||||||||||||||||||||
Class 2: | ||||||||||||||||||||||||||||||||||||||||||||||||
12/31/2020 | 13.48 | .14 | 1.23 | 1.37 | (.15 | ) | (.54 | ) | (.69 | ) | 14.16 | 10.30 | 208 | .97 | 1.03 | |||||||||||||||||||||||||||||||||
12/31/2019 | 11.65 | .21 | 2.16 | 2.37 | (.17 | ) | (.37 | ) | (.54 | ) | 13.48 | 20.44 | 207 | .97 | 1.64 | |||||||||||||||||||||||||||||||||
12/31/2018 | 12.72 | .20 | (.96 | ) | (.76 | ) | (.16 | ) | (.15 | ) | (.31 | ) | 11.65 | (6.01 | ) | 185 | .97 | 1.57 | ||||||||||||||||||||||||||||||
12/31/2017 | 11.06 | .18 | 1.98 | 2.16 | (.12 | ) | (.38 | ) | (.50 | ) | 12.72 | 19.57 | 210 | .96 | 1.43 | |||||||||||||||||||||||||||||||||
12/31/2016 | 10.72 | .16 | .32 | .48 | (.14 | ) | — | (.14 | ) | 11.06 | 4.48 | 178 | .97 | 1.48 | ||||||||||||||||||||||||||||||||||
Class 4: | ||||||||||||||||||||||||||||||||||||||||||||||||
12/31/2020 | 13.36 | .10 | 1.22 | 1.32 | (.12 | ) | (.54 | ) | (.66 | ) | 14.02 | 10.00 | 105 | 1.22 | .78 | |||||||||||||||||||||||||||||||||
12/31/2019 | 11.55 | .18 | 2.14 | 2.32 | (.14 | ) | (.37 | ) | (.51 | ) | 13.36 | 20.21 | 94 | 1.22 | 1.37 | |||||||||||||||||||||||||||||||||
12/31/2018 | 12.63 | .17 | (.96 | ) | (.79 | ) | (.14 | ) | (.15 | ) | (.29 | ) | 11.55 | (6.31 | ) | 69 | 1.22 | 1.34 | ||||||||||||||||||||||||||||||
12/31/2017 | 11.00 | .13 | 1.99 | 2.12 | (.11 | ) | (.38 | ) | (.49 | ) | 12.63 | 19.38 | 51 | 1.22 | 1.07 | |||||||||||||||||||||||||||||||||
12/31/2016 | 10.69 | .12 | .33 | .45 | (.14 | ) | — | (.14 | ) | 11.00 | 4.21 | 10 | 1.24 | 1.12 | ||||||||||||||||||||||||||||||||||
Bond Fund | ||||||||||||||||||||||||||||||||||||||||||||||||
Class 1: | ||||||||||||||||||||||||||||||||||||||||||||||||
12/31/2020 | $ | 11.17 | $ | .23 | $ | .87 | $ | 1.10 | $ | (.27 | ) | $ | (.11 | ) | $ | (.38 | ) | $ | 11.89 | 9.96 | % | $ | 6,844 | .40 | % | 2.00 | % | |||||||||||||||||||||
12/31/2019 | 10.47 | .30 | .71 | 1.01 | (.31 | ) | — | (.31 | ) | 11.17 | 9.70 | 6,481 | .39 | 2.76 | ||||||||||||||||||||||||||||||||||
12/31/2018 | 10.82 | .29 | (.35 | ) | (.06 | ) | (.28 | ) | (.01 | ) | (.29 | ) | 10.47 | (.45 | ) | 5,962 | .38 | 2.70 | ||||||||||||||||||||||||||||||
12/31/2017 | 10.80 | .24 | .18 | .42 | (.24 | ) | (.16 | ) | (.40 | ) | 10.82 | 3.88 | 6,434 | .38 | 2.19 | |||||||||||||||||||||||||||||||||
12/31/2016 | 10.70 | .21 | .14 | .35 | (.21 | ) | (.04 | ) | (.25 | ) | 10.80 | 3.27 | 6,829 | .38 | 1.91 | |||||||||||||||||||||||||||||||||
Class 1A: | ||||||||||||||||||||||||||||||||||||||||||||||||
12/31/2020 | 11.13 | .20 | .87 | 1.07 | (.25 | ) | (.11 | ) | (.36 | ) | 11.84 | 9.68 | 9 | .65 | 1.74 | |||||||||||||||||||||||||||||||||
12/31/2019 | 10.45 | .27 | .71 | .98 | (.30 | ) | — | (.30 | ) | 11.13 | 9.36 | 7 | .64 | 2.48 | ||||||||||||||||||||||||||||||||||
12/31/2018 | 10.80 | .26 | (.33 | ) | (.07 | ) | (.27 | ) | (.01 | ) | (.28 | ) | 10.45 | (.60 | ) | 3 | .63 | 2.50 | ||||||||||||||||||||||||||||||
12/31/20173,4 | 10.82 | .22 | .15 | .37 | (.23 | ) | (.16 | ) | (.39 | ) | 10.80 | 3.46 | 5 | 1 | .62 | 6 | 2.01 | 6 | ||||||||||||||||||||||||||||||
Class 2: | ||||||||||||||||||||||||||||||||||||||||||||||||
12/31/2020 | 11.02 | .20 | .86 | 1.06 | (.24 | ) | (.11 | ) | (.35 | ) | 11.73 | 9.73 | 3,840 | .65 | 1.75 | |||||||||||||||||||||||||||||||||
12/31/2019 | 10.34 | .27 | .70 | .97 | (.29 | ) | — | (.29 | ) | 11.02 | 9.36 | 3,561 | .64 | 2.51 | ||||||||||||||||||||||||||||||||||
12/31/2018 | 10.69 | .26 | (.34 | ) | (.08 | ) | (.26 | ) | (.01 | ) | (.27 | ) | 10.34 | (.71 | ) | 3,524 | .63 | 2.45 | ||||||||||||||||||||||||||||||
12/31/2017 | 10.67 | .21 | .18 | .39 | (.21 | ) | (.16 | ) | (.37 | ) | 10.69 | 3.67 | 3,966 | .63 | 1.94 | |||||||||||||||||||||||||||||||||
12/31/2016 | 10.58 | .18 | .13 | .31 | (.18 | ) | (.04 | ) | (.22 | ) | 10.67 | 2.95 | 3,959 | .63 | 1.65 | |||||||||||||||||||||||||||||||||
Class 4: | ||||||||||||||||||||||||||||||||||||||||||||||||
12/31/2020 | 11.00 | .17 | .85 | 1.02 | (.22 | ) | (.11 | ) | (.33 | ) | 11.69 | 9.38 | 714 | .90 | 1.48 | |||||||||||||||||||||||||||||||||
12/31/2019 | 10.33 | .24 | .70 | .94 | (.27 | ) | — | (.27 | ) | 11.00 | 9.08 | 502 | .89 | 2.25 | ||||||||||||||||||||||||||||||||||
12/31/2018 | 10.68 | .23 | (.33 | ) | (.10 | ) | (.24 | ) | (.01 | ) | (.25 | ) | 10.33 | (.89 | ) | 366 | .88 | 2.22 | ||||||||||||||||||||||||||||||
12/31/2017 | 10.70 | .19 | .16 | .35 | (.21 | ) | (.16 | ) | (.37 | ) | 10.68 | 3.29 | 297 | .88 | 1.72 | |||||||||||||||||||||||||||||||||
12/31/2016 | 10.61 | .15 | .15 | .30 | (.17 | ) | (.04 | ) | (.21 | ) | 10.70 | 2.80 | 102 | .88 | 1.41 | |||||||||||||||||||||||||||||||||
See end of tables for footnotes.
American Funds Insurance Series 325
Table of Contents
Financial highlights (continued)
| Income (loss) from investment operations1 | Dividends and distributions | |||||||||||||||||||||||||||||||||||||||||||||||||||
| Period ended | Net asset value, beginning of period | Net investment income (loss) | Net gains (losses) on securities (both realized and unrealized) | Total from investment operations | Dividends (from net investment income) | Distributions (from capital gains) | Total dividends and distributions | Net asset value, end of period | Total return10 | Net assets, end of period (in millions) | Ratio of to average net assets before | Ratio of to average | Ratio of to average | |||||||||||||||||||||||||||||||||||||||
Capital World Bond Fund |
| |||||||||||||||||||||||||||||||||||||||||||||||||||
Class 1: | ||||||||||||||||||||||||||||||||||||||||||||||||||||
12/31/2020 | $ | 12.12 | $ | .26 | $ | .95 | $ | 1.21 | $ | (.18 | ) | $ | (.21 | ) | $ | (.39 | ) | $ | 12.94 | 10.17 | % | $ | 1,219 | .59 | % | .52 | % | 2.08 | % | |||||||||||||||||||||||
12/31/2019 | 11.42 | .31 | .61 | .92 | (.22 | ) | — | (.22 | ) | 12.12 | 8.08 | 1,077 | .58 | .58 | 2.60 | |||||||||||||||||||||||||||||||||||||
12/31/2018 | 11.88 | .30 | (.44 | ) | (.14 | ) | (.28 | ) | (.04 | ) | (.32 | ) | 11.42 | (1.14 | ) | 1,015 | .57 | .57 | 2.56 | |||||||||||||||||||||||||||||||||
12/31/2017 | 11.22 | .28 | .52 | .80 | (.07 | ) | (.07 | ) | (.14 | ) | 11.88 | 7.11 | 1,273 | .56 | .56 | 2.37 | ||||||||||||||||||||||||||||||||||||
12/31/2016 | 11.01 | .26 | .06 | .32 | (.09 | ) | (.02 | ) | (.11 | ) | 11.22 | 2.92 | 1,115 | .57 | .57 | 2.26 | ||||||||||||||||||||||||||||||||||||
Class 1A: | ||||||||||||||||||||||||||||||||||||||||||||||||||||
12/31/2020 | 12.10 | .23 | .95 | 1.18 | (.16 | ) | (.21 | ) | (.37 | ) | 12.91 | 9.89 | 1 | .83 | .76 | 1.83 | ||||||||||||||||||||||||||||||||||||
12/31/2019 | 11.41 | .28 | .60 | .88 | (.19 | ) | — | (.19 | ) | 12.10 | 7.75 | 1 | .83 | .83 | 2.35 | |||||||||||||||||||||||||||||||||||||
12/31/2018 | 11.87 | .27 | (.43 | ) | (.16 | ) | (.26 | ) | (.04 | ) | (.30 | ) | 11.41 | (1.29 | ) | 1 | .82 | .82 | 2.36 | |||||||||||||||||||||||||||||||||
12/31/20173,4 | 11.22 | .26 | .52 | .78 | (.06 | ) | (.07 | ) | (.13 | ) | 11.87 | 7.00 | 5 | — | 7 | .72 | 6 | .72 | 6 | 2.27 | 6 | |||||||||||||||||||||||||||||||
Class 2: | ||||||||||||||||||||||||||||||||||||||||||||||||||||
12/31/2020 | 12.03 | .22 | .95 | 1.17 | (.15 | ) | (.21 | ) | (.36 | ) | 12.84 | 9.90 | 1,058 | .84 | .77 | 1.83 | ||||||||||||||||||||||||||||||||||||
12/31/2019 | 11.34 | .28 | .60 | .88 | (.19 | ) | — | (.19 | ) | 12.03 | 7.77 | 1,002 | .83 | .83 | 2.35 | |||||||||||||||||||||||||||||||||||||
12/31/2018 | 11.79 | .27 | (.43 | ) | (.16 | ) | (.25 | ) | (.04 | ) | (.29 | ) | 11.34 | (1.33 | ) | 1,032 | .82 | .82 | 2.32 | |||||||||||||||||||||||||||||||||
12/31/2017 | 11.14 | .25 | .51 | .76 | (.04 | ) | (.07 | ) | (.11 | ) | 11.79 | 6.86 | 1,164 | .81 | .81 | 2.12 | ||||||||||||||||||||||||||||||||||||
12/31/2016 | 10.93 | .23 | .07 | .30 | (.07 | ) | (.02 | ) | (.09 | ) | 11.14 | 2.71 | 1,121 | .82 | .82 | 2.01 | ||||||||||||||||||||||||||||||||||||
Class 4: | ||||||||||||||||||||||||||||||||||||||||||||||||||||
12/31/2020 | 11.92 | .19 | .94 | 1.13 | (.13 | ) | (.21 | ) | (.34 | ) | 12.71 | 9.62 | 61 | 1.09 | 1.02 | 1.58 | ||||||||||||||||||||||||||||||||||||
12/31/2019 | 11.24 | .24 | .60 | .84 | (.16 | ) | — | (.16 | ) | 11.92 | 7.54 | 49 | 1.08 | 1.08 | 2.09 | |||||||||||||||||||||||||||||||||||||
12/31/2018 | 11.70 | .24 | (.43 | ) | (.19 | ) | (.23 | ) | (.04 | ) | (.27 | ) | 11.24 | (1.61 | ) | 40 | 1.07 | 1.07 | 2.09 | |||||||||||||||||||||||||||||||||
12/31/2017 | 11.08 | .22 | .51 | .73 | (.04 | ) | (.07 | ) | (.11 | ) | 11.70 | 6.63 | 31 | 1.06 | 1.06 | 1.89 | ||||||||||||||||||||||||||||||||||||
12/31/2016 | 10.89 | .20 | .06 | .26 | (.05 | ) | (.02 | ) | (.07 | ) | 11.08 | 2.42 | 12 | 1.07 | 1.07 | 1.76 | ||||||||||||||||||||||||||||||||||||
See end of tables for footnotes.
326 American Funds Insurance Series
Table of Contents
Financial highlights (continued)
| Income (loss) from investment operations1 | Dividends and distributions | |||||||||||||||||||||||||||||||||||||||||||||||
| Period ended | Net asset value, beginning of period | Net investment income (loss) | Net gains (losses) on securities (both realized and unrealized) | Total from investment operations | Dividends (from net investment income) | Distributions (from capital gains) | Total dividends and distributions | Net asset value, end of period | Total return | Net assets, end of period (in millions) | Ratio of expenses to average net assets2 | Ratio of (loss) to average net assets | ||||||||||||||||||||||||||||||||||||
High-Income Bond Fund |
| |||||||||||||||||||||||||||||||||||||||||||||||
Class 1: | ||||||||||||||||||||||||||||||||||||||||||||||||
12/31/2020 | $ | 9.87 | $ | .61 | $ | .17 | $ | .78 | $ | (.85 | ) | $ | — | $ | (.85 | ) | $ | 9.80 | 8.21 | % | $ | 123 | .52 | % | 6.46 | % | ||||||||||||||||||||||
12/31/2019 | 9.34 | .67 | .52 | 1.19 | (.66 | ) | — | (.66 | ) | 9.87 | 12.85 | 525 | .51 | 6.71 | ||||||||||||||||||||||||||||||||||
12/31/2018 | 10.19 | .64 | (.84 | ) | (.20 | ) | (.65 | ) | — | (.65 | ) | 9.34 | (2.15 | ) | 501 | .50 | 6.32 | |||||||||||||||||||||||||||||||
12/31/2017 | 10.18 | .63 | .10 | .73 | (.72 | ) | — | (.72 | ) | 10.19 | 7.25 | 632 | .49 | 5.98 | ||||||||||||||||||||||||||||||||||
12/31/2016 | 9.19 | .61 | 1.02 | 1.63 | (.64 | ) | — | (.64 | ) | 10.18 | 17.83 | 949 | .49 | 6.18 | ||||||||||||||||||||||||||||||||||
Class 1A: | ||||||||||||||||||||||||||||||||||||||||||||||||
12/31/2020 | 9.86 | .56 | .20 | .76 | (.84 | ) | — | (.84 | ) | 9.78 | 7.94 | 1 | .78 | 5.85 | ||||||||||||||||||||||||||||||||||
12/31/2019 | 9.33 | .65 | .51 | 1.16 | (.63 | ) | — | (.63 | ) | 9.86 | 12.61 | 1 | .75 | 6.47 | ||||||||||||||||||||||||||||||||||
12/31/2018 | 10.18 | .62 | (.84 | ) | (.22 | ) | (.63 | ) | — | (.63 | ) | 9.33 | (2.35 | ) | 1 | .75 | 6.11 | |||||||||||||||||||||||||||||||
12/31/20173,4 | 10.28 | .60 | .02 | .62 | (.72 | ) | — | (.72 | ) | 10.18 | 6.02 | 5 | — | 7 | .72 | 6 | 5.74 | 6 | ||||||||||||||||||||||||||||||
Class 2: | ||||||||||||||||||||||||||||||||||||||||||||||||
12/31/2020 | 9.70 | .55 | .19 | .74 | (.83 | ) | — | (.83 | ) | 9.61 | 7.94 | 665 | .78 | 5.88 | ||||||||||||||||||||||||||||||||||
12/31/2019 | 9.19 | .64 | .50 | 1.14 | (.63 | ) | — | (.63 | ) | 9.70 | 12.55 | 667 | .76 | 6.45 | ||||||||||||||||||||||||||||||||||
12/31/2018 | 10.03 | .61 | (.83 | ) | (.22 | ) | (.62 | ) | — | (.62 | ) | 9.19 | (2.34 | ) | 661 | .75 | 6.07 | |||||||||||||||||||||||||||||||
12/31/2017 | 10.04 | .59 | .10 | .69 | (.70 | ) | — | (.70 | ) | 10.03 | 6.89 | 776 | .74 | 5.72 | ||||||||||||||||||||||||||||||||||
12/31/2016 | 9.06 | .58 | 1.01 | 1.59 | (.61 | ) | — | (.61 | ) | 10.04 | 17.69 | 799 | .74 | 5.92 | ||||||||||||||||||||||||||||||||||
Class 3: | ||||||||||||||||||||||||||||||||||||||||||||||||
12/31/2020 | 9.92 | .57 | .19 | .76 | (.84 | ) | — | (.84 | ) | 9.84 | 7.93 | 10 | .71 | 5.94 | ||||||||||||||||||||||||||||||||||
12/31/2019 | 9.38 | .66 | .52 | 1.18 | (.64 | ) | — | (.64 | ) | 9.92 | 12.70 | 10 | .69 | 6.52 | ||||||||||||||||||||||||||||||||||
12/31/2018 | 10.23 | .63 | (.85 | ) | (.22 | ) | (.63 | ) | — | (.63 | ) | 9.38 | (2.33 | ) | 10 | .68 | 6.14 | |||||||||||||||||||||||||||||||
12/31/2017 | 10.22 | .61 | .10 | .71 | (.70 | ) | — | (.70 | ) | 10.23 | 7.02 | 12 | .67 | 5.79 | ||||||||||||||||||||||||||||||||||
12/31/2016 | 9.22 | .59 | 1.03 | 1.62 | (.62 | ) | — | (.62 | ) | 10.22 | 17.68 | 13 | .67 | 5.99 | ||||||||||||||||||||||||||||||||||
Class 4: | ||||||||||||||||||||||||||||||||||||||||||||||||
12/31/2020 | 10.56 | .57 | .22 | .79 | (.81 | ) | — | (.81 | ) | 10.54 | 7.74 | 69 | 1.03 | 5.58 | ||||||||||||||||||||||||||||||||||
12/31/2019 | 9.96 | .67 | .54 | 1.21 | (.61 | ) | — | (.61 | ) | 10.56 | 12.27 | 63 | 1.01 | 6.21 | ||||||||||||||||||||||||||||||||||
12/31/2018 | 10.82 | .63 | (.90 | ) | (.27 | ) | (.59 | ) | — | (.59 | ) | 9.96 | (2.64 | ) | 31 | 1.00 | 5.83 | |||||||||||||||||||||||||||||||
12/31/2017 | 10.79 | .61 | .10 | .71 | (.68 | ) | — | (.68 | ) | 10.82 | 6.63 | 34 | .99 | 5.46 | ||||||||||||||||||||||||||||||||||
12/31/2016 | 9.73 | .60 | 1.07 | 1.67 | (.61 | ) | — | (.61 | ) | 10.79 | 17.29 | 21 | .99 | 5.55 | ||||||||||||||||||||||||||||||||||
See end of tables for footnotes.
American Funds Insurance Series 327
Table of Contents
Financial highlights (continued)
| Income (loss) from investment operations1 | Dividends and distributions | |||||||||||||||||||||||||||||||||||||||||||||||||||
| Period ended | Net asset value, beginning of period | Net investment income (loss) | Net gains (losses) on securities (both realized and unrealized) | Total from investment operations | Dividends (from net investment income) | Distributions (from capital gains) | Total dividends and distributions | Net asset value, end of period | Total return10 | Net assets, end of period (in millions) | Ratio of expenses to average net assets before waivers2 | Ratio of to average net assets after waivers2,10 | Ratio of net income (loss) to average net assets10 | |||||||||||||||||||||||||||||||||||||||
American Funds Mortgage Fund |
| |||||||||||||||||||||||||||||||||||||||||||||||||||
Class 1: | ||||||||||||||||||||||||||||||||||||||||||||||||||||
12/31/2020 | $ | 10.56 | $ | .10 | $ | .64 | $ | .74 | $ | (.17 | ) | $ | (.02 | ) | $ | (.19 | ) | $ | 11.11 | 6.98 | % | $ | 224 | .48 | % | .36 | % | .93 | % | |||||||||||||||||||||||
12/31/2019 | 10.30 | .24 | .30 | .54 | (.28 | ) | — | (.28 | ) | 10.56 | 5.30 | 210 | .47 | .47 | 2.26 | |||||||||||||||||||||||||||||||||||||
12/31/2018 | 10.47 | .20 | (.14 | ) | .06 | (.23 | ) | — | (.23 | ) | 10.30 | .58 | 209 | .48 | .48 | 1.97 | ||||||||||||||||||||||||||||||||||||
12/31/2017 | 10.56 | .16 | — | 8 | .16 | (.18 | ) | (.07 | ) | (.25 | ) | 10.47 | 1.47 | 265 | .47 | .47 | 1.52 | |||||||||||||||||||||||||||||||||||
12/31/2016 | 10.61 | .15 | .11 | .26 | (.20 | ) | (.11 | ) | (.31 | ) | 10.56 | 2.50 | 269 | .46 | .46 | 1.39 | ||||||||||||||||||||||||||||||||||||
Class 1A: | ||||||||||||||||||||||||||||||||||||||||||||||||||||
12/31/2020 | 10.55 | .07 | .63 | .70 | (.15 | ) | (.02 | ) | (.17 | ) | 11.08 | 6.63 | 1 | .73 | .59 | .61 | ||||||||||||||||||||||||||||||||||||
12/31/2019 | 10.28 | .22 | .30 | .52 | (.25 | ) | — | (.25 | ) | 10.55 | 5.09 | 1 | .71 | .71 | 2.04 | |||||||||||||||||||||||||||||||||||||
12/31/2018 | 10.46 | .18 | (.14 | ) | .04 | (.22 | ) | — | (.22 | ) | 10.28 | .36 | 1 | .73 | .73 | 1.77 | ||||||||||||||||||||||||||||||||||||
12/31/20173,4 | 10.55 | .14 | — | 8 | .14 | (.16 | ) | (.07 | ) | (.23 | ) | 10.46 | 1.31 | 5 | — | 7 | .70 | 6 | .70 | 6 | 1.38 | 6 | ||||||||||||||||||||||||||||||
Class 2: | ||||||||||||||||||||||||||||||||||||||||||||||||||||
12/31/2020 | 10.54 | .08 | .63 | .71 | (.14 | ) | (.02 | ) | (.16 | ) | 11.09 | 6.72 | 58 | .73 | .60 | .68 | ||||||||||||||||||||||||||||||||||||
12/31/2019 | 10.28 | .21 | .31 | .52 | (.26 | ) | — | (.26 | ) | 10.54 | 5.04 | 56 | .72 | .72 | 2.01 | |||||||||||||||||||||||||||||||||||||
12/31/2018 | 10.45 | .18 | (.15 | ) | .03 | (.20 | ) | — | (.20 | ) | 10.28 | .32 | 57 | .73 | .73 | 1.72 | ||||||||||||||||||||||||||||||||||||
12/31/2017 | 10.54 | .14 | (.01 | ) | .13 | (.15 | ) | (.07 | ) | (.22 | ) | 10.45 | 1.22 | 63 | .72 | .72 | 1.27 | |||||||||||||||||||||||||||||||||||
12/31/2016 | 10.59 | .12 | .12 | .24 | (.18 | ) | (.11 | ) | (.29 | ) | 10.54 | 2.25 | 63 | .71 | .71 | 1.14 | ||||||||||||||||||||||||||||||||||||
Class 4: | ||||||||||||||||||||||||||||||||||||||||||||||||||||
12/31/2020 | 10.44 | .04 | .63 | .67 | (.12 | ) | (.02 | ) | (.14 | ) | 10.97 | 6.38 | 37 | .98 | .85 | .41 | ||||||||||||||||||||||||||||||||||||
12/31/2019 | 10.19 | .18 | .31 | .49 | (.24 | ) | — | (.24 | ) | 10.44 | 4.80 | 28 | .97 | .97 | 1.71 | |||||||||||||||||||||||||||||||||||||
12/31/2018 | 10.38 | .15 | (.15 | ) | — | 8 | (.19 | ) | — | (.19 | ) | 10.19 | .07 | 24 | .98 | .98 | 1.49 | |||||||||||||||||||||||||||||||||||
12/31/2017 | 10.48 | .11 | — | 8 | .11 | (.14 | ) | (.07 | ) | (.21 | ) | 10.38 | .97 | 12 | .97 | .97 | 1.03 | |||||||||||||||||||||||||||||||||||
12/31/2016 | 10.52 | .09 | .12 | .21 | (.14 | ) | (.11 | ) | (.25 | ) | 10.48 | 2.01 | 8 | .96 | .96 | .86 | ||||||||||||||||||||||||||||||||||||
See end of tables for footnotes.
328 American Funds Insurance Series
Table of Contents
Financial highlights (continued)
| Income (loss) from investment operations1 | Dividends and distributions | |||||||||||||||||||||||||||||||||||||||||||||||
| Period ended | Net asset value, beginning of period | Net investment income (loss) | Net gains (losses) on securities (both realized and unrealized) | Total from investment operations | Dividends (from net investment income) | Distributions (from capital gains) | Total dividends and distributions | Net asset value, end of period | Total return | Net assets, end of period | Ratio of expenses to average net assets | Ratio of net income (loss) to average net assets | ||||||||||||||||||||||||||||||||||||
Ultra-Short Bond Fund |
| |||||||||||||||||||||||||||||||||||||||||||||||
Class 1: | ||||||||||||||||||||||||||||||||||||||||||||||||
12/31/2020 | $ | 11.30 | $ | .02 | $ | .02 | $ | .04 | $ | (.03 | ) | $ | — | $ | (.03 | ) | $ | 11.31 | .34 | % | $ | 44 | .37 | % | .16 | % | ||||||||||||||||||||||
12/31/2019 | 11.31 | .22 | — | 8 | .22 | (.23 | ) | — | (.23 | ) | 11.30 | 1.92 | 30 | .36 | 1.92 | |||||||||||||||||||||||||||||||||
12/31/2018 | 11.29 | .18 | — | 8 | .18 | (.16 | ) | — | (.16 | ) | 11.31 | 1.58 | 37 | .35 | 1.60 | |||||||||||||||||||||||||||||||||
12/31/2017 | 11.27 | .08 | (.01 | ) | .07 | (.05 | ) | — | (.05 | ) | 11.29 | .66 | 37 | .35 | .68 | |||||||||||||||||||||||||||||||||
12/31/201611 | 11.26 | .01 | — | 8 | .01 | — | — | — | 11.27 | .09 | 37 | .35 | .11 | |||||||||||||||||||||||||||||||||||
Class 1A: | ||||||||||||||||||||||||||||||||||||||||||||||||
12/31/2020 | 11.30 | .03 | .01 | .04 | (.03 | ) | — | (.03 | ) | 11.31 | .32 | 12 | — | 7 | .35 | 12 | .26 | 12 | ||||||||||||||||||||||||||||||
12/31/2019 | 11.31 | .22 | — | 8 | .22 | (.23 | ) | — | (.23 | ) | 11.30 | 1.92 | 12 | — | 7 | .37 | 12 | 1.90 | 12 | |||||||||||||||||||||||||||||
12/31/2018 | 11.29 | .18 | — | 8 | .18 | (.16 | ) | — | (.16 | ) | 11.31 | 1.58 | 12 | — | 7 | .35 | 12 | 1.60 | 12 | |||||||||||||||||||||||||||||
12/31/20173,4 | 11.27 | .08 | — | 8 | .08 | (.06 | ) | — | (.06 | ) | 11.29 | .67 | 5,12 | — | 7 | .34 | 6,12 | .69 | 6,12 | |||||||||||||||||||||||||||||
Class 2: | ||||||||||||||||||||||||||||||||||||||||||||||||
12/31/2020 | 11.01 | — | 8 | — | 8 | — | 8 | (.02 | ) | — | (.02 | ) | 10.99 | .03 | 288 | .62 | (.05 | ) | ||||||||||||||||||||||||||||||
12/31/2019 | 11.03 | .18 | — | 8 | .18 | (.20 | ) | — | (.20 | ) | 11.01 | 1.62 | 230 | .61 | 1.66 | |||||||||||||||||||||||||||||||||
12/31/2018 | 11.01 | .15 | — | 8 | .15 | (.13 | ) | — | (.13 | ) | 11.03 | 1.36 | 247 | .60 | 1.34 | |||||||||||||||||||||||||||||||||
12/31/2017 | 10.99 | .05 | — | 8 | .05 | (.03 | ) | — | (.03 | ) | 11.01 | .46 | 249 | .60 | .42 | |||||||||||||||||||||||||||||||||
12/31/201611 | 11.01 | (.02 | ) | — | 8 | (.02 | ) | — | — | — | 10.99 | (.18 | ) | 297 | .60 | (.14 | ) | |||||||||||||||||||||||||||||||
Class 3: | ||||||||||||||||||||||||||||||||||||||||||||||||
12/31/2020 | 11.13 | — | 8 | .02 | .02 | (.03 | ) | — | (.03 | ) | 11.12 | .13 | 4 | .55 | .03 | |||||||||||||||||||||||||||||||||
12/31/2019 | 11.14 | .20 | — | 8 | .20 | (.21 | ) | — | (.21 | ) | 11.13 | 1.76 | 3 | .54 | 1.74 | |||||||||||||||||||||||||||||||||
12/31/2018 | 11.12 | .16 | (.01 | ) | .15 | (.13 | ) | — | (.13 | ) | 11.14 | 1.38 | 4 | .53 | 1.42 | |||||||||||||||||||||||||||||||||
12/31/2017 | 11.10 | .06 | — | 8 | .06 | (.04 | ) | — | (.04 | ) | 11.12 | .54 | 4 | .53 | .50 | |||||||||||||||||||||||||||||||||
12/31/201611 | 11.11 | (.01 | ) | — | 8 | (.01 | ) | — | — | — | 11.10 | (.09 | ) | 4 | .53 | (.08 | ) | |||||||||||||||||||||||||||||||
Class 4: | ||||||||||||||||||||||||||||||||||||||||||||||||
12/31/2020 | 11.13 | (.04 | ) | .01 | (.03 | ) | (.02 | ) | — | (.02 | ) | 11.08 | (.25 | ) | 40 | .87 | (.35 | ) | ||||||||||||||||||||||||||||||
12/31/2019 | 11.15 | .16 | — | 8 | .16 | (.18 | ) | — | (.18 | ) | 11.13 | 1.40 | 22 | .86 | 1.40 | |||||||||||||||||||||||||||||||||
12/31/2018 | 11.13 | .12 | .01 | .13 | (.11 | ) | — | (.11 | ) | 11.15 | 1.14 | 18 | .86 | 1.11 | ||||||||||||||||||||||||||||||||||
12/31/2017 | 11.12 | .02 | — | 8 | .02 | (.01 | ) | — | (.01 | ) | 11.13 | .16 | 15 | .85 | .19 | |||||||||||||||||||||||||||||||||
12/31/201611 | 11.17 | (.04 | ) | (.01 | ) | (.05 | ) | — | — | — | 11.12 | (.45 | ) | 13 | .85 | (.40 | ) | |||||||||||||||||||||||||||||||
See end of tables for footnotes.
American Funds Insurance Series 329
Table of Contents
Financial highlights (continued)
| Income (loss) from investment operations1 | Dividends and distributions | |||||||||||||||||||||||||||||||||||||||||||||||
| Period ended | Net asset value, beginning of period | Net investment income (loss) | Net gains (losses) on securities (both realized and unrealized) | Total from investment | Dividends (from net investment income) | Distributions (from capital gains) | Total dividends and distributions | Net asset value, end of period | Total return | Net assets, end of period (in millions) | Ratio of expenses to average net assets | Ratio of net income (loss) to average net assets | ||||||||||||||||||||||||||||||||||||
U.S. Government/AAA-Rated Securities Fund |
| |||||||||||||||||||||||||||||||||||||||||||||||
Class 1: | ||||||||||||||||||||||||||||||||||||||||||||||||
12/31/2020 | $ | 12.34 | $ | .16 | $ | 1.07 | $ | 1.23 | $ | (.26 | ) | $ | (.27 | ) | $ | (.53 | ) | $ | 13.04 | 10.09 | % | $ | 429 | .38 | % | 1.21 | % | |||||||||||||||||||||
12/31/2019 | 11.94 | .25 | .43 | .68 | (.28 | ) | — | (.28 | ) | 12.34 | 5.69 | 1,418 | .37 | 2.07 | ||||||||||||||||||||||||||||||||||
12/31/2018 | 12.08 | .24 | (.13 | ) | .11 | (.25 | ) | — | (.25 | ) | 11.94 | .91 | 1,445 | .36 | 2.02 | |||||||||||||||||||||||||||||||||
12/31/2017 | 12.05 | .21 | .01 | .22 | (.19 | ) | — | (.19 | ) | 12.08 | 1.83 | 1,558 | .36 | 1.68 | ||||||||||||||||||||||||||||||||||
12/31/2016 | 12.31 | .16 | .03 | .19 | (.20 | ) | (.25 | ) | (.45 | ) | 12.05 | 1.44 | 1,467 | .36 | 1.31 | |||||||||||||||||||||||||||||||||
Class 1A: | ||||||||||||||||||||||||||||||||||||||||||||||||
12/31/2020 | 12.32 | .09 | 1.10 | 1.19 | (.24 | ) | (.27 | ) | (.51 | ) | 13.00 | 9.75 | 4 | .64 | .69 | |||||||||||||||||||||||||||||||||
12/31/2019 | 11.93 | .22 | .43 | .65 | (.26 | ) | — | (.26 | ) | 12.32 | 5.42 | 2 | .62 | 1.82 | ||||||||||||||||||||||||||||||||||
12/31/2018 | 12.08 | .22 | (.14 | ) | .08 | (.23 | ) | — | (.23 | ) | 11.93 | .70 | 1 | .61 | 1.82 | |||||||||||||||||||||||||||||||||
12/31/20173,4 | 12.05 | .18 | .03 | .21 | (.18 | ) | — | (.18 | ) | 12.08 | 1.73 | 5 | — | 7 | .58 | 6 | 1.53 | 6 | ||||||||||||||||||||||||||||||
Class 2: | ||||||||||||||||||||||||||||||||||||||||||||||||
12/31/2020 | 12.21 | .09 | 1.10 | 1.19 | (.24 | ) | (.27 | ) | (.51 | ) | 12.89 | 9.80 | 1,439 | .64 | .73 | |||||||||||||||||||||||||||||||||
12/31/2019 | 11.82 | .22 | .42 | .64 | (.25 | ) | — | (.25 | ) | 12.21 | 5.31 | 1,343 | .62 | 1.82 | ||||||||||||||||||||||||||||||||||
12/31/2018 | 11.96 | .21 | (.14 | ) | .07 | (.21 | ) | — | (.21 | ) | 11.82 | .73 | 1,323 | .61 | 1.77 | |||||||||||||||||||||||||||||||||
12/31/2017 | 11.93 | .17 | .02 | .19 | (.16 | ) | — | (.16 | ) | 11.96 | 1.59 | 1,473 | .61 | 1.43 | ||||||||||||||||||||||||||||||||||
12/31/2016 | 12.20 | .13 | .02 | .15 | (.17 | ) | (.25 | ) | (.42 | ) | 11.93 | 1.19 | 1,503 | .61 | 1.05 | |||||||||||||||||||||||||||||||||
Class 3: | ||||||||||||||||||||||||||||||||||||||||||||||||
12/31/2020 | 12.37 | .10 | 1.12 | 1.22 | (.25 | ) | (.27 | ) | (.52 | ) | 13.07 | 9.91 | 10 | .57 | .78 | |||||||||||||||||||||||||||||||||
12/31/2019 | 11.97 | .23 | .43 | .66 | (.26 | ) | — | (.26 | ) | 12.37 | 5.49 | 9 | .55 | 1.88 | ||||||||||||||||||||||||||||||||||
12/31/2018 | 12.11 | .22 | (.14 | ) | .08 | (.22 | ) | — | (.22 | ) | 11.97 | .71 | 9 | .54 | 1.84 | |||||||||||||||||||||||||||||||||
12/31/2017 | 12.07 | .18 | .03 | .21 | (.17 | ) | — | (.17 | ) | 12.11 | 1.72 | 10 | .54 | 1.50 | ||||||||||||||||||||||||||||||||||
12/31/2016 | 12.34 | .14 | .02 | .16 | (.18 | ) | (.25 | ) | (.43 | ) | 12.07 | 1.24 | 11 | .54 | 1.12 | |||||||||||||||||||||||||||||||||
Class 4: | ||||||||||||||||||||||||||||||||||||||||||||||||
12/31/2020 | 12.22 | .05 | 1.10 | 1.15 | (.22 | ) | (.27 | ) | (.49 | ) | 12.88 | 9.48 | 272 | .89 | .42 | |||||||||||||||||||||||||||||||||
12/31/2019 | 11.84 | .19 | .42 | .61 | (.23 | ) | — | (.23 | ) | 12.22 | 5.14 | 124 | .87 | 1.56 | ||||||||||||||||||||||||||||||||||
12/31/2018 | 11.98 | .18 | (.12 | ) | .06 | (.20 | ) | — | (.20 | ) | 11.84 | .50 | 91 | .86 | 1.53 | |||||||||||||||||||||||||||||||||
12/31/2017 | 11.96 | .14 | .01 | .15 | (.13 | ) | — | (.13 | ) | 11.98 | 1.28 | 62 | .86 | 1.18 | ||||||||||||||||||||||||||||||||||
12/31/2016 | 12.22 | .10 | .03 | .13 | (.14 | ) | (.25 | ) | (.39 | ) | 11.96 | .99 | 57 | .86 | .82 | |||||||||||||||||||||||||||||||||
See end of tables for footnotes.
330 American Funds Insurance Series
Table of Contents
Financial highlights (continued)
| Income (loss) from investment operations1 | Dividends and distributions | |||||||||||||||||||||||||||||||||||||||||||||||||||||||
| Period ended | Net asset value, | Net investment income (loss) | Net gains (losses) on securities (both realized and unrealized) | Total from investment operations | Dividends (from net investment income) | Distributions (from capital gains) | Total dividends and distributions | Net asset value, end of period | Total return10 | Net assets, end of period (in millions) | Ratio of expenses to average net assets before waivers/ reimburse- ments13 | Ratio of expenses to average net assets after waivers/ reimburse- ments10,13 | Net effective expense ratio10,14 | Ratio of net income (loss) to average net assets10 | ||||||||||||||||||||||||||||||||||||||||||
Managed Risk Growth Fund |
| |||||||||||||||||||||||||||||||||||||||||||||||||||||||
Class P1: | ||||||||||||||||||||||||||||||||||||||||||||||||||||||||
12/31/2020 | $ | 13.78 | $ | .07 | $ | 4.20 | $ | 4.27 | $ | (.12 | ) | $ | (.68 | ) | $ | (.80 | ) | $ | 17.25 | 32.45 | % | $ | 11 | .42 | % | .37 | % | .72 | % | .49 | % | |||||||||||||||||||||||||
12/31/2019 | 12.30 | .15 | 2.44 | 2.59 | (.19 | ) | (.92 | ) | (1.11 | ) | 13.78 | 22.01 | 6 | .42 | .37 | .73 | 1.19 | |||||||||||||||||||||||||||||||||||||||
12/31/2018 | 13.22 | .11 | (.04 | ) | .07 | (.10 | ) | (.89 | ) | (.99 | ) | 12.30 | (.04 | )12 | 3 | .42 | 12 | .37 | 12 | .71 | 12 | .82 | 12 | |||||||||||||||||||||||||||||||||
12/31/2017 | 10.71 | .08 | 2.70 | 2.78 | (.07 | ) | (.20 | ) | (.27 | ) | 13.22 | 26.23 | 12 | 2 | .42 | 12 | .36 | 12 | .70 | 12 | .69 | 12 | ||||||||||||||||||||||||||||||||||
12/31/2016 | 11.49 | .08 | .20 | .28 | (.05 | ) | (1.01 | ) | (1.06 | ) | 10.71 | 2.89 | 12 | 1 | .50 | 12 | .34 | 12 | .68 | 12 | .79 | 12 | ||||||||||||||||||||||||||||||||||
Class P2: | ||||||||||||||||||||||||||||||||||||||||||||||||||||||||
12/31/2020 | 13.71 | .03 | 4.16 | 4.19 | (.11 | ) | (.68 | ) | (.79 | ) | 17.11 | 32.03 | 554 | .67 | .62 | .97 | .20 | |||||||||||||||||||||||||||||||||||||||
12/31/2019 | 12.21 | .09 | 2.45 | 2.54 | (.12 | ) | (.92 | ) | (1.04 | ) | 13.71 | 21.74 | 434 | .68 | .63 | .99 | .73 | |||||||||||||||||||||||||||||||||||||||
12/31/2018 | 13.14 | .06 | (.04 | ) | .02 | (.06 | ) | (.89 | ) | (.95 | ) | 12.21 | (.37 | ) | 340 | .68 | .63 | .97 | .46 | |||||||||||||||||||||||||||||||||||||
12/31/2017 | 10.64 | .04 | 2.70 | 2.74 | (.04 | ) | (.20 | ) | (.24 | ) | 13.14 | 25.99 | 286 | .69 | .63 | .97 | .34 | |||||||||||||||||||||||||||||||||||||||
12/31/2016 | 11.43 | .05 | .19 | .24 | (.02 | ) | (1.01 | ) | (1.03 | ) | 10.64 | 2.52 | 200 | .79 | .63 | .97 | .43 | |||||||||||||||||||||||||||||||||||||||
Managed Risk International Fund |
| |||||||||||||||||||||||||||||||||||||||||||||||||||||||
Class P1: | ||||||||||||||||||||||||||||||||||||||||||||||||||||||||
12/31/2020 | $ | 11.01 | $ | .08 | $ | .22 | $ | .30 | $ | (.16 | ) | $ | (.08 | ) | $ | (.24 | ) | $ | 11.07 | 3.13 | %12 | $ | 2 | .43 | %12 | .35 | %12 | .86 | %12 | .82 | %12 | |||||||||||||||||||||||||
12/31/2019 | 9.82 | .17 | 1.54 | 1.71 | (.20 | ) | (.32 | ) | (.52 | ) | 11.01 | 17.91 | 12 | 1 | .41 | 12 | .33 | 12 | .84 | 12 | 1.64 | 12 | ||||||||||||||||||||||||||||||||||
12/31/2018 | 11.25 | .32 | (1.44 | ) | (1.12 | ) | (.26 | ) | (.05 | ) | (.31 | ) | 9.82 | (10.11 | )12 | — | 7 | .33 | 12 | .28 | 12 | .77 | 12 | 3.02 | 12 | |||||||||||||||||||||||||||||||
12/31/2017 | 8.89 | .11 | 2.47 | 2.58 | (.10 | ) | (.12 | ) | (.22 | ) | 11.25 | 29.28 | 12 | — | 7 | .28 | 12 | .20 | 12 | .69 | 12 | 1.13 | 12 | |||||||||||||||||||||||||||||||||
12/31/2016 | 9.48 | .10 | (.35 | ) | (.25 | ) | (.12 | ) | (.22 | ) | (.34 | ) | 8.89 | (2.59 | )12 | — | 7 | .39 | 12 | .23 | 12 | .74 | 12 | 1.15 | 12 | |||||||||||||||||||||||||||||||
Class P2: | ||||||||||||||||||||||||||||||||||||||||||||||||||||||||
12/31/2020 | 10.92 | .04 | .23 | .27 | (.12 | ) | (.08 | ) | (.20 | ) | 10.99 | 2.80 | 168 | .71 | .63 | 1.14 | .42 | |||||||||||||||||||||||||||||||||||||||
12/31/2019 | 9.76 | .13 | 1.55 | 1.68 | (.20 | ) | (.32 | ) | (.52 | ) | 10.92 | 17.64 | 165 | .71 | .63 | 1.14 | 1.21 | |||||||||||||||||||||||||||||||||||||||
12/31/2018 | 11.15 | .16 | (1.32 | ) | (1.16 | ) | (.18 | ) | (.05 | ) | (.23 | ) | 9.76 | (10.50 | ) | 151 | .69 | .64 | 1.13 | 1.49 | ||||||||||||||||||||||||||||||||||||
12/31/2017 | 8.83 | .11 | 2.41 | 2.52 | (.08 | ) | (.12 | ) | (.20 | ) | 11.15 | 28.69 | 148 | .71 | .63 | 1.12 | 1.03 | |||||||||||||||||||||||||||||||||||||||
12/31/2016 | 9.43 | .09 | (.38 | ) | (.29 | ) | (.09 | ) | (.22 | ) | (.31 | ) | 8.83 | (3.05 | ) | 97 | .79 | .63 | 1.14 | .97 | ||||||||||||||||||||||||||||||||||||
Managed Risk Blue Chip Income and Growth Fund |
| |||||||||||||||||||||||||||||||||||||||||||||||||||||||
Class P1: | ||||||||||||||||||||||||||||||||||||||||||||||||||||||||
12/31/2020 | $ | 12.01 | $ | .18 | $ | (.35 | ) | $ | (.17 | ) | $ | (.26 | ) | $ | (.34 | ) | $ | (.60 | ) | $ | 11.24 | (.93 | )%12 | $ | 2 | .40 | %12 | .35 | %12 | .76 | %12 | 1.66 | %12 | |||||||||||||||||||||||
12/31/2019 | 11.28 | .25 | 1.28 | 1.53 | (.20 | ) | (.60 | ) | (.80 | ) | 12.01 | 14.14 | 12 | 1 | .38 | 12 | .33 | 12 | .74 | 12 | 2.14 | 12 | ||||||||||||||||||||||||||||||||||
12/31/2018 | 13.04 | .40 | (1.27 | ) | (.87 | ) | (.45 | ) | (.44 | ) | (.89 | ) | 11.28 | (6.99 | )12 | — | 7 | .33 | 12 | .28 | 12 | .67 | 12 | 3.21 | 12 | |||||||||||||||||||||||||||||||
12/31/2017 | 11.67 | .19 | 1.59 | 1.78 | (.22 | ) | (.19 | ) | (.41 | ) | 13.04 | 15.48 | 12 | — | 7 | .30 | 12 | .25 | 12 | .64 | 12 | 1.59 | 12 | |||||||||||||||||||||||||||||||||
12/31/2016 | 10.80 | .20 | 1.25 | 1.45 | (.21 | ) | (.37 | ) | (.58 | ) | 11.67 | 13.77 | 12 | — | 7 | .43 | 12 | .27 | 12 | .67 | 12 | 1.83 | 12 | |||||||||||||||||||||||||||||||||
Class P2: | ||||||||||||||||||||||||||||||||||||||||||||||||||||||||
12/31/2020 | 11.91 | .13 | (.33 | ) | (.20 | ) | (.19 | ) | (.34 | ) | (.53 | ) | 11.18 | (1.25 | ) | 355 | .68 | .63 | 1.04 | 1.18 | ||||||||||||||||||||||||||||||||||||
12/31/2019 | 11.21 | .18 | 1.31 | 1.49 | (.19 | ) | (.60 | ) | (.79 | ) | 11.91 | 13.88 | 365 | .68 | .63 | 1.04 | 1.62 | |||||||||||||||||||||||||||||||||||||||
12/31/2018 | 12.96 | .19 | (1.10 | ) | (.91 | ) | (.40 | ) | (.44 | ) | (.84 | ) | 11.21 | (7.38 | ) | 336 | .68 | .63 | 1.02 | 1.49 | ||||||||||||||||||||||||||||||||||||
12/31/2017 | 11.61 | .17 | 1.55 | 1.72 | (.18 | ) | (.19 | ) | (.37 | ) | 12.96 | 15.03 | 367 | .68 | .63 | 1.02 | 1.43 | |||||||||||||||||||||||||||||||||||||||
12/31/2016 | 10.76 | .23 | 1.18 | 1.41 | (.19 | ) | (.37 | ) | (.56 | ) | 11.61 | 13.39 | 291 | .79 | .63 | 1.03 | 2.04 | |||||||||||||||||||||||||||||||||||||||
See end of tables for footnotes.
American Funds Insurance Series 331
Table of Contents
Financial highlights (continued)
| Income (loss) from investment operations1 | Dividends and distributions | |||||||||||||||||||||||||||||||||||||||||||||||||||||||
| Period ended | Net asset value, beginning of period | Net investment income (loss) | Net gains (losses) on securities (both realized and unrealized) | Total from investment operations | Dividends (from net investment income) | Distribu-tions (from capital gains) | Total dividends and distribu-tions | Net asset value, end of period | Total return10 | Net assets, end of period (in millions) | Ratio of to average | Ratio of to average | Net effective expense ratio10,14 | Ratio of net income (loss) to average net assets10 | ||||||||||||||||||||||||||||||||||||||||||
Managed Risk Growth-Income Fund |
| |||||||||||||||||||||||||||||||||||||||||||||||||||||||
Class P1: | ||||||||||||||||||||||||||||||||||||||||||||||||||||||||
12/31/2020 | $ | 13.76 | $ | .17 | $ | 1.08 | $ | 1.25 | $ | (.26 | ) | $ | (.74 | ) | $ | (1.00 | ) | $ | 14.01 | 9.85 | % | $ | 2,120 | .41 | % | .36 | % | .66 | % | 1.24 | % | |||||||||||||||||||||||||
12/31/2019 | 11.73 | .22 | 2.01 | 2.23 | (.10 | ) | (.10 | ) | (.20 | ) | 13.76 | 19.14 | 1,987 | .42 | .37 | .67 | 1.71 | |||||||||||||||||||||||||||||||||||||||
12/31/2018 | 12.66 | (.02 | ) | (.15 | ) | (.17 | ) | (.19 | ) | (.57 | ) | (.76 | ) | 11.73 | (1.66 | ) | 1,662 | .40 | .35 | .64 | (.20 | ) | ||||||||||||||||||||||||||||||||||
12/31/2017 | 11.07 | .19 | 2.03 | 2.22 | (.13 | ) | (.50 | ) | (.63 | ) | 12.66 | 20.64 | 12 | 2 | .44 | 12 | .37 | 12 | .66 | 12 | 1.61 | 12 | ||||||||||||||||||||||||||||||||||
12/31/2016 | 11.25 | .16 | .52 | .68 | (.16 | ) | (.70 | ) | (.86 | ) | 11.07 | 6.49 | 12 | 1 | .52 | 12 | .36 | 12 | .64 | 12 | 1.46 | 12 | ||||||||||||||||||||||||||||||||||
Class P2: | ||||||||||||||||||||||||||||||||||||||||||||||||||||||||
12/31/2020 | 13.69 | .14 | 1.07 | 1.21 | (.23 | ) | (.74 | ) | (.97 | ) | 13.93 | 9.58 | 315 | .66 | .61 | .91 | 1.02 | |||||||||||||||||||||||||||||||||||||||
12/31/2019 | 11.67 | .19 | 2.00 | 2.19 | (.07 | ) | (.10 | ) | (.17 | ) | 13.69 | 18.84 | 283 | .67 | .62 | .92 | 1.47 | |||||||||||||||||||||||||||||||||||||||
12/31/2018 | 12.58 | .16 | (.36 | ) | (.20 | ) | (.14 | ) | (.57 | ) | (.71 | ) | 11.67 | (1.97 | ) | 230 | .69 | .64 | .93 | 1.25 | ||||||||||||||||||||||||||||||||||||
12/31/2017 | 11.02 | .13 | 2.05 | 2.18 | (.12 | ) | (.50 | ) | (.62 | ) | 12.58 | 20.40 | 206 | .70 | .63 | .92 | 1.08 | |||||||||||||||||||||||||||||||||||||||
12/31/2016 | 11.22 | .12 | .52 | .64 | (.14 | ) | (.70 | ) | (.84 | ) | 11.02 | 6.08 | 160 | .79 | .63 | .91 | 1.13 | |||||||||||||||||||||||||||||||||||||||
Managed Risk Asset Allocation Fund |
| |||||||||||||||||||||||||||||||||||||||||||||||||||||||
Class P1: | ||||||||||||||||||||||||||||||||||||||||||||||||||||||||
12/31/2020 | $ | 13.81 | $ | .25 | $ | .51 | $ | .76 | $ | (.21 | ) | $ | (.52 | ) | $ | (.73 | ) | $ | 13.84 | 6.10 | % | $ | 5 | .41 | % | .36 | % | .66 | % | 1.91 | % | |||||||||||||||||||||||||
12/31/2019 | 12.23 | .26 | 1.92 | 2.18 | (.03 | ) | (.57 | ) | (.60 | ) | 13.81 | 18.25 | 2 | .41 | .36 | .65 | 2.01 | |||||||||||||||||||||||||||||||||||||||
12/31/2018 | 13.59 | .22 | (.80 | ) | (.58 | ) | (.25 | ) | (.53 | ) | (.78 | ) | 12.23 | (4.63 | ) | 2 | .37 | .32 | .59 | 1.67 | ||||||||||||||||||||||||||||||||||||
12/31/2017 | 12.02 | .19 | 1.60 | 1.79 | (.10 | ) | (.12 | ) | (.22 | ) | 13.59 | 15.06 | 1,656 | .43 | .38 | .66 | 1.45 | |||||||||||||||||||||||||||||||||||||||
12/31/2016 | 11.72 | .19 | .67 | .86 | (.19 | ) | (.37 | ) | (.56 | ) | 12.02 | 7.57 | 1,217 | .43 | .38 | .66 | 1.65 | |||||||||||||||||||||||||||||||||||||||
Class P2: | ||||||||||||||||||||||||||||||||||||||||||||||||||||||||
12/31/2020 | 13.46 | .15 | .56 | .71 | (.20 | ) | (.52 | ) | (.72 | ) | 13.45 | 5.88 | 2,773 | .66 | .61 | .91 | 1.15 | |||||||||||||||||||||||||||||||||||||||
12/31/2019 | 12.22 | .19 | 1.93 | 2.12 | (.31 | ) | (.57 | ) | (.88 | ) | 13.46 | 17.98 | 2,830 | .66 | .61 | .90 | 1.51 | |||||||||||||||||||||||||||||||||||||||
12/31/2018 | 13.55 | .17 | (.79 | ) | (.62 | ) | (.18 | ) | (.53 | ) | (.71 | ) | 12.22 | (4.89 | ) | 2,541 | .62 | .57 | .84 | 1.27 | ||||||||||||||||||||||||||||||||||||
12/31/2017 | 12.01 | .15 | 1.61 | 1.76 | (.10 | ) | (.12 | ) | (.22 | ) | 13.55 | 14.80 | 2,798 | .68 | .63 | .91 | 1.13 | |||||||||||||||||||||||||||||||||||||||
12/31/2016 | 11.71 | .14 | .69 | .83 | (.16 | ) | (.37 | ) | (.53 | ) | 12.01 | 7.27 | 2,342 | .68 | .63 | .91 | 1.20 | |||||||||||||||||||||||||||||||||||||||
See end of tables for footnotes.
332 American Funds Insurance Series
Table of Contents
Financial highlights (continued)
Portfolio turnover rate for all share classes excluding mortgage dollar roll transactions15,16 | Year ended December 31, | |||||||||||||||||||
| 2020 | 2019 | 2018 | 2017 | 2016 | ||||||||||||||||
Capital Income Builder | 110 | % | 44 | % | 42 | % | 59 | % | 41 | % | ||||||||||
Asset Allocation Fund | 49 | 47 | 34 | 39 | 43 | |||||||||||||||
Global Balanced Fund | 68 | 60 | 30 | 28 | 43 | |||||||||||||||
Bond Fund | 72 | 146 | 98 | 153 | 108 | |||||||||||||||
Capital World Bond Fund | 88 | 110 | 78 | 74 | 70 | |||||||||||||||
American Funds Mortgage Fund | 123 | 84 | 60 | 98 | 113 | |||||||||||||||
U.S. Government/AAA-Rated Securities Fund | 112 | 103 | 76 | 120 | 273 | |||||||||||||||
Portfolio turnover rate for all share classes including mortgage dollar roll15,16 | Year ended December 31, | |||||||||||||||||||
| 2020 | 2019 | 2018 | 2017 | 2016 | ||||||||||||||||
Global Growth Fund | 17 | % | 14 | % | 25 | % | 31 | % | 27 | % | ||||||||||
Global Small Capitalization Fund | 38 | 50 | 43 | 33 | 40 | |||||||||||||||
Growth Fund | 32 | 21 | 35 | 24 | 26 | |||||||||||||||
International Fund | 40 | 32 | 29 | 29 | 31 | |||||||||||||||
New World Fund | 70 | 38 | 58 | 56 | 32 | |||||||||||||||
Blue Chip Income and Growth Fund | 40 | 37 | 49 | 34 | 30 | |||||||||||||||
Global Growth and Income Fund | 36 | 29 | 49 | 41 | 57 | |||||||||||||||
Growth-Income Fund | 33 | 27 | 39 | 27 | 27 | |||||||||||||||
International Growth and Income Fund | 56 | 28 | 38 | 51 | 32 | |||||||||||||||
Capital Income Builder Fund | 184 | 72 | 98 | 88 | 53 | |||||||||||||||
Asset Allocation Fund | 145 | 79 | 86 | 85 | 83 | |||||||||||||||
Global Balanced Fund | 86 | 74 | 51 | 41 | 65 | |||||||||||||||
Bond Fund | 461 | 373 | 514 | 502 | 375 | |||||||||||||||
Capital World Bond Fund | 145 | 159 | 125 | 105 | 154 | |||||||||||||||
High-Income Bond Fund | 78 | 58 | 67 | 78 | 89 | |||||||||||||||
American Funds Mortgage Fund | 1143 | 350 | 811 | 680 | 713 | |||||||||||||||
U.S. Government/AAA-Rated Securities Fund | 867 | 277 | 446 | 551 | 539 | |||||||||||||||
Ultra-Short Bond Fund | — | 17 | — | 17 | — | 17 | — | 17 | — | 11,17 | ||||||||||
Managed Risk Growth Fund | 80 | 10 | 7 | 25 | 15 | |||||||||||||||
Managed Risk International Fund | 71 | 8 | 8 | 25 | 26 | |||||||||||||||
Managed Risk Blue Chip Income and Growth Fund | 101 | 13 | 11 | 32 | 9 | |||||||||||||||
Managed Risk Growth-Income Fund | 38 | 6 | 14 | 26 | 14 | |||||||||||||||
Managed Risk Asset Allocation Fund | 30 | 8 | 12 | 1 | 3 | |||||||||||||||
| 1 | Based on average shares outstanding. |
| 2 | Ratios do not include expenses of any Central Funds. The fund indirectly bears its proportionate share of the expenses of any Central Funds, if applicable. |
| 3 | Based on operations for a period that is less than a full year. |
| 4 | Class 1A shares began investment operations on January 6, 2017. |
| 5 | Not annualized. |
| 6 | Annualized. |
| 7 | Amount less than $1 million. |
| 8 | Amount less than $.01. |
| 9 | Amount less than .01%. |
| 10 | This column reflects the impact of certain waivers/reimbursements from CRMC. During some of the periods shown, CRMC waived a portion of investment advisory services fees on some funds, including each of the managed risk funds. In addition, during some of the periods shown, CRMC reimbursed a portion of miscellaneous fees and expenses for some of the managed risk funds. |
| 11 | On May 1, 2016, the fund converted from a cash fund to an ultra-short-term bond fund and changed its name from Cash Management Fund to Ultra-Short Bond Fund. |
| 12 | All or a significant portion of assets in this class consisted of seed capital invested by CRMC and/or its affiliates. Certain fees (including, where applicable, fees for distribution services) are not charged or accrued on these seed capital assets. If such fees were paid by the fund on seed capital assets, fund expenses would have been higher and net income and total return would have been lower. |
| 13 | This column does not include expenses of the underlying funds in which each fund invests. |
| 14 | This column reflects the net effective expense ratios for each fund and class, which are unaudited. These ratios include each class’s expense ratio combined with the weighted average net expense ratio of the underlying funds for the years presented. See expense example for further information regarding fees and expenses. |
| 15 | Refer to Note 5 for further information on mortgage dollar rolls. |
| 16 | Rates do not include the fund’s portfolio activity with respect to any Central Funds, if applicable. |
| 17 | Amount is either less than 1% or there is no turnover. |
See notes to financial statements.
American Funds Insurance Series 333
Table of Contents
Report of Independent Registered Public Accounting Firm
To the Board of Trustees of American Funds Insurance Series and Shareholders of Global Growth Fund, Global Small Capitalization Fund, Growth Fund, International Fund, New World Fund®, Blue Chip Income and Growth Fund, Global Growth and Income Fund, Growth-Income Fund, International Growth and Income Fund, Capital Income Builder®, Asset Allocation Fund, Global Balanced Fund, Bond Fund, Capital World Bond Fund®, High-Income Bond Fund, American Funds Mortgage Fund®, Ultra-Short Bond Fund, U.S. Government/AAA-Rated Securities Fund, Managed Risk Growth Fund, Managed Risk International Fund, Managed Risk Blue Chip Income and Growth Fund, Managed Risk Growth-Income Fund and Managed Risk Asset Allocation Fund
Opinions on the Financial Statements
We have audited the accompanying statements of assets and liabilities, including the investment portfolios, of Global Growth Fund, Global Small Capitalization Fund, Growth Fund, International Fund, New World Fund®, Blue Chip Income and Growth Fund, Global Growth and Income Fund, Growth-Income Fund, International Growth and Income Fund, Capital Income Builder®, Asset Allocation Fund, Global Balanced Fund, Bond Fund, Capital World Bond Fund® (formerly Global Bond Fund), High-Income Bond Fund, American Funds Mortgage Fund® (formerly Mortgage Fund), Ultra-Short Bond Fund, U.S. Government/AAA-Rated Securities Fund, Managed Risk Growth Fund, Managed Risk International Fund, Managed Risk Blue Chip Income and Growth Fund, Managed Risk Growth-Income Fund and Managed Risk Asset Allocation Fund (twenty-three of the funds constituting American Funds Insurance Series, hereafter collectively referred to as the “Funds“) as of December 31, 2020, the related statements of operations for the year ended December 31, 2020, the statements of changes in net assets for each of the two years in the period ended December 31, 2020, including the related notes, and the financial highlights for each of the periods indicated therein (collectively referred to as the “financial statements”). In our opinion, the financial statements present fairly, in all material respects, the financial position of each of the Funds as of December 31, 2020, the results of each of their operations for the year then ended, the changes in each of their net assets for each of the two years in the period ended December 31, 2020 and each of the financial highlights for each of the periods indicated therein in conformity with accounting principles generally accepted in the United States of America.
Basis for Opinions
These financial statements are the responsibility of the Funds’ management. Our responsibility is to express an opinion on the Funds’ financial statements based on our audits. We are a public accounting firm registered with the Public Company Accounting Oversight Board (United States) (PCAOB) and are required to be independent with respect to the Funds in accordance with the U.S. federal securities laws and the applicable rules and regulations of the Securities and Exchange Commission and the PCAOB.
We conducted our audits of these financial statements in accordance with the standards of the PCAOB. Those standards require that we plan and perform the audit to obtain reasonable assurance about whether the financial statements are free of material misstatement, whether due to error or fraud.
Our audits included performing procedures to assess the risks of material misstatement of the financial statements, whether due to error or fraud, and performing procedures that respond to those risks. Such procedures included examining, on a test basis, evidence regarding the amounts and disclosures in the financial statements. Our audits also included evaluating the accounting principles used and significant estimates made by management, as well as evaluating the overall presentation of the financial statements. Our procedures included confirmation of securities owned as of December 31, 2020 by correspondence with the custodians, transfer agent and brokers; when replies were not received from brokers, we performed other auditing procedures. We believe that our audits provide a reasonable basis for our opinions.
/s/PricewaterhouseCoopers LLP
Los Angeles, California
February 12, 2021
We have served as the auditor of one or more investment companies in The Capital Group Companies Investment Company Complex since 1934.
334 American Funds Insurance Series
Table of Contents
| Expense example | unaudited |
The funds in American Funds Insurance Series serve as the underlying investment vehicle for various insurance products. As an owner of an insurance contract that invests in one of the funds in the series, you incur two types of costs: (1) transaction costs, such as initial sales charges on purchase payments and contingent deferred sales charges on redemptions (loads), and (2) ongoing costs, including management fees, distribution and service (12b-1) fees, and other expenses. Additional fees are charged by the insurance companies related to the various benefits they provide. This example is intended to help you understand your ongoing costs (in dollars) of investing in the underlying funds so you can compare these costs with the ongoing costs of investing in other mutual funds that serve a similar function in other annuity products. The example is based on an investment of $1,000 invested at the beginning of the period and held for the entire six-month period (July 1, 2020, through December 31, 2020).
Actual expenses:
The first line of each share class in the tables on the following pages provides information about actual account values and actual expenses. You may use the information in this line, together with the amount you invested, to estimate the expenses that you paid over the period. Simply divide your account value by $1,000 (for example, an $8,600 account value divided by $1,000 = 8.6), then multiply the result by the number in the first line under the heading titled “Expenses paid during period” to estimate the expenses you paid on your account during this period.
Hypothetical example for comparison purposes:
The second line of each share class in the tables on the following pages provides information about hypothetical account values and hypothetical expenses based on the actual expense ratio for the share class and an assumed rate of return of 5.00% per year before expenses, which is not the actual return of the share class. The hypothetical account values and expenses may not be used to estimate the actual ending account balance or expenses you paid for the period. You may use this information to compare the ongoing costs of investing in the fund and other funds. To do so, compare this 5.00% hypothetical example with the 5.00% hypothetical examples that appear in the shareholder reports of the other funds.
Notes:
Additional fees are charged by the insurance companies related to the various benefits they provide. You can estimate the impact of these fees by adding the amount of the fees to the total estimated expenses you paid on your account during the period as calculated above. In addition, your ending account value would be lower by the amount of these fees.
Note that the expenses shown in the tables on the following pages are meant to highlight your ongoing costs only and do not reflect any transactional costs. Therefore, the second line of each share class in the tables is useful in comparing ongoing costs only and will not help you determine the relative total costs of owning different funds. In addition, if these transactional costs were included, your costs would have been higher.
American Funds Insurance Series 335
Table of Contents
Expense example (continued)
| Beginning account value 7/1/2020 | Ending account value 12/31/2020 | Expenses paid during period1 | Annualized expense ratio | |||||||||||||
Global Growth Fund | ||||||||||||||||
Class 1 — actual return | $ | 1,000.00 | $ | 1,254.84 | $ | 3.13 | .55 | % | ||||||||
Class 1 — assumed 5% return | 1,000.00 | 1,022.43 | 2.80 | .55 | ||||||||||||
Class 1A — actual return | 1,000.00 | 1,253.16 | 4.54 | .80 | ||||||||||||
Class 1A — assumed 5% return | 1,000.00 | 1,021.17 | 4.08 | .80 | ||||||||||||
Class 2 — actual return | 1,000.00 | 1,253.28 | 4.54 | .80 | ||||||||||||
Class 2 — assumed 5% return | 1,000.00 | 1,021.17 | 4.08 | .80 | ||||||||||||
Class 4 — actual return | 1,000.00 | 1,251.73 | 5.96 | 1.05 | ||||||||||||
Class 4 — assumed 5% return | 1,000.00 | 1,019.91 | 5.35 | 1.05 | ||||||||||||
Global Small Capitalization Fund | ||||||||||||||||
Class 1 — actual return | $ | 1,000.00 | $ | 1,343.20 | $ | 4.37 | .74 | % | ||||||||
Class 1 — assumed 5% return | 1,000.00 | 1,021.48 | 3.77 | .74 | ||||||||||||
Class 1A — actual return | 1,000.00 | 1,341.45 | 5.84 | .99 | ||||||||||||
Class 1A — assumed 5% return | 1,000.00 | 1,020.21 | 5.04 | .99 | ||||||||||||
Class 2 — actual return | 1,000.00 | 1,341.27 | 5.84 | .99 | ||||||||||||
Class 2 — assumed 5% return | 1,000.00 | 1,020.21 | 5.04 | .99 | ||||||||||||
Class 4 — actual return | 1,000.00 | 1,340.24 | 7.31 | 1.24 | ||||||||||||
Class 4 — assumed 5% return | 1,000.00 | 1,018.95 | 6.31 | 1.24 | ||||||||||||
Growth Fund | ||||||||||||||||
Class 1 — actual return | $ | 1,000.00 | $ | 1,360.06 | $ | 2.08 | .35 | % | ||||||||
Class 1 — assumed 5% return | 1,000.00 | 1,023.44 | 1.79 | .35 | ||||||||||||
Class 1A — actual return | 1,000.00 | 1,358.42 | 3.57 | .60 | ||||||||||||
Class 1A — assumed 5% return | 1,000.00 | 1,022.18 | 3.06 | .60 | ||||||||||||
Class 2 — actual return | 1,000.00 | 1,358.42 | 3.57 | .60 | ||||||||||||
Class 2 — assumed 5% return | 1,000.00 | 1,022.18 | 3.06 | .60 | ||||||||||||
Class 3 — actual return | 1,000.00 | 1,358.84 | 3.15 | .53 | ||||||||||||
Class 3 — assumed 5% return | 1,000.00 | 1,022.53 | 2.70 | .53 | ||||||||||||
Class 4 — actual return | 1,000.00 | 1,356.82 | 5.05 | .85 | ||||||||||||
Class 4 — assumed 5% return | 1,000.00 | 1,020.92 | 4.33 | .85 | ||||||||||||
International Fund | ||||||||||||||||
Class 1 — actual return | $ | 1,000.00 | $ | 1,286.94 | $ | 3.17 | .55 | % | ||||||||
Class 1 — assumed 5% return | 1,000.00 | 1,022.43 | 2.80 | .55 | ||||||||||||
Class 1A — actual return | 1,000.00 | 1,284.98 | 4.61 | .80 | ||||||||||||
Class 1A — assumed 5% return | 1,000.00 | 1,021.17 | 4.08 | .80 | ||||||||||||
Class 2 — actual return | 1,000.00 | 1,285.43 | 4.61 | .80 | ||||||||||||
Class 2 — assumed 5% return | 1,000.00 | 1,021.17 | 4.08 | .80 | ||||||||||||
Class 3 — actual return | 1,000.00 | 1,285.16 | 4.20 | .73 | ||||||||||||
Class 3 — assumed 5% return | 1,000.00 | 1,021.53 | 3.72 | .73 | ||||||||||||
Class 4 — actual return | 1,000.00 | 1,283.63 | 6.04 | 1.05 | ||||||||||||
Class 4 — assumed 5% return | 1,000.00 | 1,019.91 | 5.35 | 1.05 | ||||||||||||
New World Fund | ||||||||||||||||
Class 1 — actual return | $ | 1,000.00 | $ | 1,291.34 | $ | 3.35 | .58 | % | ||||||||
Class 1 — assumed 5% return | 1,000.00 | 1,022.28 | 2.96 | .58 | ||||||||||||
Class 1A — actual return | 1,000.00 | 1,290.17 | 4.79 | .83 | ||||||||||||
Class 1A — assumed 5% return | 1,000.00 | 1,021.02 | 4.23 | .83 | ||||||||||||
Class 2 — actual return | 1,000.00 | 1,289.72 | 4.79 | .83 | ||||||||||||
Class 2 — assumed 5% return | 1,000.00 | 1,021.02 | �� | 4.23 | .83 | |||||||||||
Class 4 — actual return | 1,000.00 | 1,288.50 | 6.23 | 1.08 | ||||||||||||
Class 4 — assumed 5% return | 1,000.00 | 1,019.76 | 5.50 | 1.08 | ||||||||||||
See end of tables for footnotes.
336 American Funds Insurance Series
Table of Contents
Expense example (continued)
| Beginning account value 7/1/2020 | Ending account value 12/31/2020 | Expenses paid during period1 | Annualized expense ratio | |||||||||||||
Blue Chip Income and Growth Fund | ||||||||||||||||
Class 1 — actual return | $ | 1,000.00 | $ | 1,188.67 | $ | 2.32 | .42 | % | ||||||||
Class 1 — assumed 5% return | 1,000.00 | 1,023.09 | 2.14 | .42 | ||||||||||||
Class 1A — actual return | 1,000.00 | 1,187.68 | 3.69 | .67 | ||||||||||||
Class 1A — assumed 5% return | 1,000.00 | 1,021.83 | 3.41 | .67 | ||||||||||||
Class 2 — actual return | 1,000.00 | 1,186.62 | 3.69 | .67 | ||||||||||||
Class 2 — assumed 5% return | 1,000.00 | 1,021.83 | 3.41 | .67 | ||||||||||||
Class 4 — actual return | 1,000.00 | 1,185.33 | 5.07 | .92 | ||||||||||||
Class 4 — assumed 5% return | 1,000.00 | 1,020.57 | 4.69 | .92 | ||||||||||||
Global Growth and Income Fund | ||||||||||||||||
Class 1 — actual return | $ | 1,000.00 | $ | 1,226.11 | $ | 3.70 | .66 | % | ||||||||
Class 1 — assumed 5% return | 1,000.00 | 1,021.88 | 3.36 | .66 | ||||||||||||
Class 1A — actual return | 1,000.00 | 1,224.98 | 5.10 | .91 | ||||||||||||
Class 1A — assumed 5% return | 1,000.00 | 1,020.62 | 4.63 | .91 | ||||||||||||
Class 2 — actual return | 1,000.00 | 1,224.48 | 5.10 | .91 | ||||||||||||
Class 2 — assumed 5% return | 1,000.00 | 1,020.62 | 4.63 | .91 | ||||||||||||
Class 4 — actual return | 1,000.00 | 1,223.67 | 6.50 | 1.16 | ||||||||||||
Class 4 — assumed 5% return | 1,000.00 | 1,019.36 | 5.90 | 1.16 | ||||||||||||
Growth-Income Fund | ||||||||||||||||
Class 1 — actual return | $ | 1,000.00 | $ | 1,180.81 | $ | 1.59 | .29 | % | ||||||||
Class 1 — assumed 5% return | 1,000.00 | 1,023.74 | 1.48 | .29 | ||||||||||||
Class 1A — actual return | 1,000.00 | 1,179.38 | 2.97 | .54 | ||||||||||||
Class 1A — assumed 5% return | 1,000.00 | 1,022.48 | 2.75 | .54 | ||||||||||||
Class 2 — actual return | 1,000.00 | 1,179.40 | 2.97 | .54 | ||||||||||||
Class 2 — assumed 5% return | 1,000.00 | 1,022.48 | 2.75 | .54 | ||||||||||||
Class 3 — actual return | 1,000.00 | 1,179.77 | 2.58 | .47 | ||||||||||||
Class 3 — assumed 5% return | 1,000.00 | 1,022.84 | 2.40 | .47 | ||||||||||||
Class 4 — actual return | 1,000.00 | 1,177.95 | 4.34 | .79 | ||||||||||||
Class 4 — assumed 5% return | 1,000.00 | 1,021.22 | 4.02 | .79 | ||||||||||||
International Growth and Income Fund | ||||||||||||||||
Class 1 — actual return | $ | 1,000.00 | $ | 1,250.95 | $ | 3.86 | .68 | % | ||||||||
Class 1 — assumed 5% return | 1,000.00 | 1,021.78 | 3.47 | .68 | ||||||||||||
Class 1A — actual return | 1,000.00 | 1,249.71 | 5.27 | .93 | ||||||||||||
Class 1A — assumed 5% return | 1,000.00 | 1,020.52 | 4.74 | .93 | ||||||||||||
Class 2 — actual return | 1,000.00 | 1,249.64 | 5.27 | .93 | ||||||||||||
Class 2 — assumed 5% return | 1,000.00 | 1,020.52 | 4.74 | .93 | ||||||||||||
Class 4 — actual return | 1,000.00 | 1,248.18 | 6.69 | 1.18 | ||||||||||||
Class 4 — assumed 5% return | 1,000.00 | 1,019.26 | 6.01 | 1.18 | ||||||||||||
Capital Income Builder | ||||||||||||||||
Class 1 — actual return | $ | 1,000.00 | $ | 1,115.95 | $ | 1.44 | .27 | % | ||||||||
Class 1 — assumed 5% return | 1,000.00 | 1,023.84 | 1.38 | .27 | ||||||||||||
Class 1A — actual return | 1,000.00 | 1,114.72 | 2.77 | .52 | ||||||||||||
Class 1A — assumed 5% return | 1,000.00 | 1,022.58 | 2.65 | .52 | ||||||||||||
Class 2 — actual return | 1,000.00 | 1,115.75 | 2.77 | .52 | ||||||||||||
Class 2 — assumed 5% return | 1,000.00 | 1,022.58 | 2.65 | .52 | ||||||||||||
Class 4 — actual return | 1,000.00 | 1,113.43 | 4.10 | .77 | ||||||||||||
Class 4 — assumed 5% return | 1,000.00 | 1,021.32 | 3.92 | .77 | ||||||||||||
See end of tables for footnotes.
American Funds Insurance Series 337
Table of Contents
Expense example (continued)
| Beginning account value 7/1/2020 | Ending account value 12/31/2020 | Expenses paid during period1 | Annualized expense ratio | |||||||||||||
Asset Allocation Fund | ||||||||||||||||
Class 1 — actual return | $ | 1,000.00 | $ | 1,143.93 | $ | 1.62 | .30 | % | ||||||||
Class 1 — assumed 5% return | 1,000.00 | 1,023.69 | 1.53 | .30 | ||||||||||||
Class 1A — actual return | 1,000.00 | 1,142.08 | 2.97 | .55 | ||||||||||||
Class 1A — assumed 5% return | 1,000.00 | 1,022.43 | 2.80 | .55 | ||||||||||||
Class 2 — actual return | 1,000.00 | 1,142.52 | 2.97 | .55 | ||||||||||||
Class 2 — assumed 5% return | 1,000.00 | 1,022.43 | 2.80 | .55 | ||||||||||||
Class 3 — actual return | 1,000.00 | 1,142.59 | 2.59 | .48 | ||||||||||||
Class 3 — assumed 5% return | 1,000.00 | 1,022.79 | 2.45 | .48 | ||||||||||||
Class 4 — actual return | 1,000.00 | 1,140.96 | 4.32 | .80 | ||||||||||||
Class 4 — assumed 5% return | 1,000.00 | 1,021.17 | 4.08 | .80 | ||||||||||||
Global Balanced Fund | ||||||||||||||||
Class 1 — actual return | $ | 1,000.00 | $ | 1,137.75 | $ | 3.93 | .73 | % | ||||||||
Class 1 — assumed 5% return | 1,000.00 | 1,021.53 | 3.72 | .73 | ||||||||||||
Class 1A — actual return | 1,000.00 | 1,136.55 | 5.28 | .98 | ||||||||||||
Class 1A — assumed 5% return | 1,000.00 | 1,020.27 | 4.99 | .98 | ||||||||||||
Class 2 — actual return | 1,000.00 | 1,136.23 | 5.28 | .98 | ||||||||||||
Class 2 — assumed 5% return | 1,000.00 | 1,020.27 | 4.99 | .98 | ||||||||||||
Class 4 — actual return | 1,000.00 | 1,135.20 | 6.62 | 1.23 | ||||||||||||
Class 4 — assumed 5% return | 1,000.00 | 1,019.00 | 6.26 | 1.23 | ||||||||||||
Bond Fund | ||||||||||||||||
Class 1 — actual return | $ | 1,000.00 | $ | 1,031.42 | $ | 2.05 | .40 | % | ||||||||
Class 1 — assumed 5% return | 1,000.00 | 1,023.19 | 2.04 | .40 | ||||||||||||
Class 1A — actual return | 1,000.00 | 1,029.77 | 3.27 | .64 | ||||||||||||
Class 1A — assumed 5% return | 1,000.00 | 1,021.98 | 3.26 | .64 | ||||||||||||
Class 2 — actual return | 1,000.00 | 1,029.81 | 3.27 | .64 | ||||||||||||
Class 2 — assumed 5% return | 1,000.00 | 1,021.98 | 3.26 | .64 | ||||||||||||
Class 4 — actual return | 1,000.00 | 1,028.42 | 4.55 | .89 | ||||||||||||
Class 4 — assumed 5% return | 1,000.00 | 1,020.72 | 4.53 | .89 | ||||||||||||
Capital World Bond Fund | ||||||||||||||||
Class 1 — actual return | $ | 1,000.00 | $ | 1,078.63 | $ | 2.57 | .49 | % | ||||||||
Class 1 — assumed 5% return | 1,000.00 | 1,022.74 | 2.50 | .49 | ||||||||||||
Class 1A — actual return | 1,000.00 | 1,077.00 | 3.82 | .73 | ||||||||||||
Class 1A — assumed 5% return | 1,000.00 | 1,021.53 | 3.72 | .73 | ||||||||||||
Class 2 — actual return | 1,000.00 | 1,077.13 | 3.87 | .74 | ||||||||||||
Class 2 — assumed 5% return | 1,000.00 | 1,021.48 | 3.77 | .74 | ||||||||||||
Class 4 — actual return | 1,000.00 | 1,075.46 | 5.13 | .98 | ||||||||||||
Class 4 — assumed 5% return | 1,000.00 | 1,020.27 | 4.99 | .98 | ||||||||||||
High-Income Bond Fund | ||||||||||||||||
Class 1 — actual return | $ | 1,000.00 | $ | 1,135.96 | $ | 2.85 | .53 | % | ||||||||
Class 1 — assumed 5% return | 1,000.00 | 1,022.53 | 2.70 | .53 | ||||||||||||
Class 1A — actual return | 1,000.00 | 1,134.62 | 4.20 | .78 | ||||||||||||
Class 1A — assumed 5% return | 1,000.00 | 1,021.27 | 3.97 | .78 | ||||||||||||
Class 2 — actual return | 1,000.00 | 1,134.44 | 4.20 | .78 | ||||||||||||
Class 2 — assumed 5% return | 1,000.00 | 1,021.27 | 3.97 | .78 | ||||||||||||
Class 3 — actual return | 1,000.00 | 1,134.15 | 3.82 | .71 | ||||||||||||
Class 3 — assumed 5% return | 1,000.00 | 1,021.63 | 3.62 | .71 | ||||||||||||
Class 4 — actual return | 1,000.00 | 1,132.72 | 5.54 | 1.03 | ||||||||||||
Class 4 — assumed 5% return | 1,000.00 | 1,020.01 | 5.24 | 1.03 | ||||||||||||
See end of tables for footnotes.
338 American Funds Insurance Series
Table of Contents
Expense example (continued)
Beginning account value 7/1/2020 | Ending account value 12/31/2020 | Expenses paid during period1 | Annualized expense ratio | |||||||||||||
American Funds Mortgage Fund | ||||||||||||||||
Class 1 — actual return | $ | 1,000.00 | $ | 1,011.01 | $ | 1.57 | .31 | % | ||||||||
Class 1 — assumed 5% return | 1,000.00 | 1,023.64 | 1.58 | .31 | ||||||||||||
Class 1A — actual return | 1,000.00 | 1,009.84 | 2.84 | .56 | ||||||||||||
Class 1A — assumed 5% return | 1,000.00 | 1,022.38 | 2.85 | .56 | ||||||||||||
Class 2 — actual return | 1,000.00 | 1,009.83 | 2.84 | .56 | ||||||||||||
Class 2 — assumed 5% return | 1,000.00 | 1,022.38 | 2.85 | .56 | ||||||||||||
Class 4 — actual return | 1,000.00 | 1,008.07 | 4.10 | .81 | ||||||||||||
Class 4 — assumed 5% return | 1,000.00 | 1,021.12 | 4.13 | .81 | ||||||||||||
Ultra-Short Bond Fund | ||||||||||||||||
Class 1 — actual return | $ | 1,000.00 | $ | 999.11 | $ | 1.91 | .38 | % | ||||||||
Class 1 — assumed 5% return | 1,000.00 | 1,023.29 | 1.94 | .38 | ||||||||||||
Class 1A — actual return | 1,000.00 | 999.11 | 1.86 | .37 | ||||||||||||
Class 1A — assumed 5% return | 1,000.00 | 1,023.34 | 1.89 | .37 | ||||||||||||
Class 2 — actual return | 1,000.00 | 997.28 | 3.12 | .62 | ||||||||||||
Class 2 — assumed 5% return | 1,000.00 | 1,022.08 | 3.16 | .62 | ||||||||||||
Class 3 — actual return | 1,000.00 | 998.21 | 2.77 | .55 | ||||||||||||
Class 3 — assumed 5% return | 1,000.00 | 1,022.43 | 2.80 | .55 | ||||||||||||
Class 4 — actual return | 1,000.00 | 996.40 | 4.38 | .87 | ||||||||||||
Class 4 — assumed 5% return | 1,000.00 | 1,020.82 | 4.43 | .87 | ||||||||||||
U.S. Government/AAA-Rated Securities Fund | ||||||||||||||||
Class 1 — actual return | $ | 1,000.00 | $ | 1,011.80 | $ | 1.98 | .39 | % | ||||||||
Class 1 — assumed 5% return | 1,000.00 | 1,023.24 | 1.99 | .39 | ||||||||||||
Class 1A — actual return | 1,000.00 | 1,010.17 | 3.24 | .64 | ||||||||||||
Class 1A — assumed 5% return | 1,000.00 | 1,021.98 | 3.26 | .64 | ||||||||||||
Class 2 — actual return | 1,000.00 | 1,010.14 | 3.24 | .64 | ||||||||||||
Class 2 — assumed 5% return | 1,000.00 | 1,021.98 | 3.26 | .64 | ||||||||||||
Class 3 — actual return | 1,000.00 | 1,010.51 | 2.89 | .57 | ||||||||||||
Class 3 — assumed 5% return | 1,000.00 | 1,022.33 | 2.91 | .57 | ||||||||||||
Class 4 — actual return | 1,000.00 | 1,008.75 | 4.51 | .89 | ||||||||||||
Class 4 — assumed 5% return | 1,000.00 | 1,020.72 | 4.53 | .89 | ||||||||||||
See end of tables for footnotes.
American Funds Insurance Series 339
Table of Contents
Expense example (continued)
Beginning account value 7/1/2020 | Ending account value 12/31/2020 | Expenses paid during period1,2 | Annualized expense ratio2 | Effective expenses paid during period3 | Effective annualized expense ratio4 | |||||||||||||||||||
Managed Risk Growth Fund |
| |||||||||||||||||||||||
Class P1 — actual return | $ | 1,000.00 | $ | 1,219.94 | $ | 2.01 | .36 | % | $ | 4.02 | .72 | % | ||||||||||||
Class P1 — assumed 5% return | 1,000.00 | 1,023.33 | 1.83 | .36 | 3.66 | .72 | ||||||||||||||||||
Class P2 — actual return | 1,000.00 | 1,217.79 | 3.46 | .62 | 5.41 | .97 | ||||||||||||||||||
Class P2 — assumed 5% return | 1,000.00 | 1,022.02 | 3.15 | .62 | 4.93 | .97 | ||||||||||||||||||
Managed Risk International Fund |
| |||||||||||||||||||||||
Class P1 — actual return | $ | 1,000.00 | $ | 1,176.41 | $ | 1.81 | .33 | % | $ | 4.70 | .86 | % | ||||||||||||
Class P1 — assumed 5% return | 1,000.00 | 1,023.48 | 1.68 | .33 | 4.37 | .86 | ||||||||||||||||||
Class P2 — actual return | 1,000.00 | 1,174.15 | 3.28 | .60 | 6.23 | 1.14 | ||||||||||||||||||
Class P2 — assumed 5% return | 1,000.00 | 1,022.12 | 3.05 | .60 | 5.79 | 1.14 | ||||||||||||||||||
Managed Risk Blue Chip Income and Growth Fund |
| |||||||||||||||||||||||
Class P1 — actual return | $ | 1,000.00 | $ | 1,080.32 | $ | 1.83 | .35 | % | $ | 3.97 | .76 | % | ||||||||||||
Class P1 — assumed 5% return | 1,000.00 | 1,023.38 | 1.78 | .35 | 3.86 | .76 | ||||||||||||||||||
Class P2 — actual return | 1,000.00 | 1,079.10 | 3.24 | .62 | 5.44 | 1.04 | ||||||||||||||||||
Class P2 — assumed 5% return | 1,000.00 | 1,022.02 | 3.15 | .62 | 5.28 | 1.04 | ||||||||||||||||||
Managed Risk Growth-Income Fund |
| |||||||||||||||||||||||
Class P1 — actual return | $ | 1,000.00 | $ | 1,091.34 | $ | 1.89 | .36 | % | $ | 3.47 | .66 | % | ||||||||||||
Class P1 — assumed 5% return | 1,000.00 | 1,023.33 | 1.83 | .36 | 3.35 | .66 | ||||||||||||||||||
Class P2 — actual return | 1,000.00 | 1,089.02 | 3.20 | .61 | 4.78 | .91 | ||||||||||||||||||
Class P2 — assumed 5% return | 1,000.00 | 1,022.07 | 3.10 | .61 | 4.62 | .91 | ||||||||||||||||||
Managed Risk Asset Allocation Fund |
| |||||||||||||||||||||||
Class P1 — actual return | $ | 1,000.00 | $ | 1,101.91 | $ | 1.90 | .36 | % | $ | 3.49 | .66 | % | ||||||||||||
Class P1 — assumed 5% return | 1,000.00 | 1,023.33 | 1.83 | .36 | 3.35 | .66 | ||||||||||||||||||
Class P2 — actual return | 1,000.00 | 1,100.65 | 3.22 | .61 | 4.81 | .91 | ||||||||||||||||||
Class P2 — assumed 5% return | 1,000.00 | 1,022.07 | 3.10 | .61 | 4.62 | .91 | ||||||||||||||||||
| 1 | The “expenses paid during period” are equal to the “annualized expense ratio,” multiplied by the average account value over the period, multiplied by the number of days in the period, and divided by 365 (to reflect the one-half year period). |
| 2 | The “expenses paid during period” and “annualized expense ratio” do not include the expenses of the underlying funds in which each fund invests. |
| 3 | The “effective expenses paid during period” are equal to the “effective annualized expense ratio,” multiplied by the average account value over the period, multiplied by the number of days in the period, and divided by 365 (to reflect the period). |
| 4 | The “effective annualized expense ratio” reflects the net annualized expense ratio of the class plus the class’s pro-rata share of the weighted average expense ratio of the underlying funds in which it invests. |
340 American Funds Insurance Series
Table of Contents
Liquidity Risk Management Program
The series has adopted a liquidity risk management program (the “program”). The series’ board has designated Capital Research and Management Company (“CRMC”) as the administrator of the program. Personnel of CRMC or its affiliates conduct the day-today operation of the program pursuant to policies and procedures administered by the Capital Group Liquidity Risk Management Committee.
Under the program, CRMC manages each fund’s liquidity risk, which is the risk that the fund could not meet shareholder redemption requests without significant dilution of remaining shareholders’ interests in the fund. This risk is managed by monitoring the degree of liquidity of each fund’s investments, limiting the amount of each fund’s illiquid investments, and utilizing various risk management tools and facilities available to each fund for meeting shareholder redemptions, among other means. CRMC’s process of determining the degree of liquidity of each fund’s investments is supported by one or more third-party liquidity assessment vendors.
The series’ board reviewed a report prepared by CRMC regarding the operation and effectiveness of the program for the period October 1, 2019, through September 30, 2020. No significant liquidity events impacting any of the funds were noted in the report. In addition, CRMC provided its assessment that the program had been effective in managing each fund’s liquidity risk.
American Funds Insurance Series 341
Table of Contents
Board of trustees and other officers
Independent trustees1
Name and year of birth | Year first | Principal occupation(s) during past five years | Number of | Other directorships3 | ||||
William H. Baribault, 1945 | 2009 | Chairman of the Board and CEO, Oakwood Advisors (private investment and consulting); former CEO and President, Richard Nixon Foundation | 89 | General Finance Corporation | ||||
James G. Ellis, 1947 | 2010 | Professor of Marketing and former Dean, Marshall School of Business, University of Southern California | 99 | Mercury General Corporation | ||||
Nariman Farvardin, 1956 | 2018 | President, Stevens Institute of Technology | 87 | None | ||||
Mary Davis Holt, 1950 | 2015–2016; 2017 | Principal, Mary Davis Holt Enterprises, LLC (leadership development consulting); former Partner, Flynn Heath Holt Leadership, LLC (leadership consulting); former COO, Time Life Inc. (1993–2003) | 87 | None | ||||
R. Clark Hooper, 1946 | 2010 | Private investor | 90 | None | ||||
Merit E. Janow, 1958 | 2007 | Dean and Professor, Columbia University, School of International and Public Affairs | 89 | Mastercard Incorporated; Trimble Inc. | ||||
| Margaret Spellings, 1957 Chairman of the Board (Independent and Non-Executive) | 2010 | President and CEO, Texas 2036; former President, Margaret Spellings & Company (public policy and strategic consulting); former President, The University of North Carolina; former President, George W. Bush Foundation | 91 | None | ||||
Alexandra Trower, 1964 | 2018 | Executive Vice President, Global Communications and Corporate Officer, The Estée Lauder Companies | 86 | None | ||||
Paul S. Williams, 1959 | 2020 | Former Partner/Managing Director, Major, Lindsey & Africa (executive recruiting firm) | 86 | Compass Minerals, Inc. (producer of salt and specialty fertilizers); Public Storage, Inc. | ||||
Interested trustees4,5
Name, year of birth and | Year first | Principal occupation(s) during past five years | Number of | Other directorships3 | ||||
| Donald D. O’Neal, 1960 Co-President | 1998 | Partner — Capital International Investors, Capital Research and Management Company; Partner — Capital International Investors, Capital Bank and Trust Company6 | 35 | None | ||||
Michael C. Gitlin, 1970 | 2019 | Vice Chairman and Director, Capital Research and Management Company; Partner — Capital Fixed Income Investors, Capital Research and Management Company; Director, The Capital Group Companies, Inc.6; served as Head of Fixed Income at a large investment management firm prior to joining Capital Research and Management Company in 2015 | 86 | None | ||||
The series statement of additional information includes further details about the series trustees and is available without charge upon request by calling American Funds Service Company at (800) 421-4225 or by visiting the Capital Group website at capitalgroup.com. The address for all trustees and officers of the series is 333 South Hope Street, Los Angeles, CA 90071. Attention: Secretary.
342 American Funds Insurance Series
Table of Contents
Other officers5
Name, year of birth and position with series | Year first of the series2 | Principal occupation(s) during past five years and positions held with affiliated entities or the principal underwriter of the series | ||
Alan N. Berro, 1960 Co-President | 1998 | Partner — Capital World Investors, Capital Research and Management Company; Partner — Capital World Investors, Capital Bank and Trust Company6; Director, The Capital Group Companies, Inc.6 | ||
Maria Manotok, 1974 Executive Vice President | 2012 | Senior Vice President and Senior Counsel — Fund Business Management Group, Capital Research and Management Company; Senior Vice President, Senior Counsel and Director, Capital International, Inc.6; Director, Capital Group Investment Management Limited6 | ||
Martin Jacobs, 1962 Vice President | 2016 | Partner — Capital Research Global Investors, Capital Research and Management Company | ||
Carl M. Kawaja, 1964 Vice President | 2008 | Partner — Capital World Investors, Capital Research and Management Company; Chairman and Director, Capital Research and Management Company; Partner — Capital World Investors, Capital Bank and Trust Company6 | ||
Sung Lee, 1966 Vice President | 2008 | Partner — Capital Research Global Investors, Capital International, Inc.6; Director, The Capital Group Companies, Inc.6 | ||
Keiko McKibben, 1969 Vice President | 2010 | Partner — Capital Research Global Investors, Capital Research and Management Company | ||
Renaud H. Samyn, 1974 Vice President | 2010 | Partner — Capital Research Global Investors, Capital International, Inc.6 | ||
Steven I. Koszalka, 1964 Secretary | 2003 | Vice President — Fund Business Management Group, Capital Research and Management Company | ||
Gregory F. Niland, 1971 Treasurer | 2008 | Vice President — Investment Operations, Capital Research and Management Company | ||
Susan K. Countess, 1966 Assistant Secretary | 2014 | Associate — Fund Business Management Group, Capital Research and Management Company | ||
Sandra Chuon, 1972 Assistant Treasurer | 2019 | Assistant Vice President — Investment Operations, Capital Research and Management Company | ||
Brian C. Janssen, 1972 Assistant Treasurer | 2015 | Vice President — Investment Operations, Capital Research and Management Company | ||
| 1 | The term independent trustee refers to a trustee who is not an “interested person” of the series within the meaning of the Investment Company Act of 1940. |
| 2 | Trustees and officers of the series serve until their resignation, removal or retirement. |
| 3 | This includes all directorships/trusteeships (other than those in the American Funds or other funds managed by Capital Research and Management Company or its affiliates) that are held by each trustee as a trustee or director of a public company or a registered investment company. |
| 4 | The term interested trustee refers to a trustee who is an “interested person” within the meaning of the Investment Company Act of 1940, on the basis of their affiliation with the series investment adviser, Capital Research and Management Company, or affiliated entities (including the series principal underwriter). |
| 5 | All of the trustees and/or officers listed, with the exception of Martin Jacobs and Keiko McKibben, are officers and/or directors/trustees of one or more of the other funds for which Capital Research and Management Company serves as investment adviser. |
| 6 | Company affiliated with Capital Research and Management Company. |
American Funds Insurance Series 343
Table of Contents
Office of the series
333 South Hope Street
Los Angeles, CA 90071-1406
Investment adviser
Capital Research and Management Company
333 South Hope Street
Los Angeles, CA 90071-1406
Investment subadviser
Milliman Financial Risk Management
LLC (Managed Risk Funds only)
71 South Wacker Drive, 31st Floor
Chicago, IL 60606
Custodian of assets
State Street Bank and Trust Company
One Lincoln Street
Boston, MA 02111
Counsel
Morgan, Lewis & Bockius LLP
One Federal Street
Boston, MA 02110-1726
Independent registered public accounting firm
PricewaterhouseCoopers LLP
601 South Figueroa Street
Los Angeles, CA 90017-3874
344 American Funds Insurance Series
Table of Contents
Investors should carefully consider investment objectives, risks, charges and expenses. This and other important information is contained in the series prospectuses and summary prospectuses, which can be obtained from your financial professional and should be read carefully before investing. You may also call American Funds Service Company (AFS) at (800) 421-4225 or visit the Capital Group website at capitalgroup.com.
“American Funds Proxy Voting Procedures and Principles” — which describes how we vote proxies relating to portfolio securities — is available on the Capital Group website or upon request by calling AFS. The series files its proxy voting record with the U.S. Securities and Exchange Commission (SEC) for the 12 months ended June 30 by August 31. The proxy voting record is available free of charge on the SEC website at sec.gov and on the Capital Group website.
American Funds Insurance Series files a complete list of its portfolio holdings with the SEC for the first and third quarters of each fiscal year on Form NPORT-P. This filing is available free of charge on the SEC website and our website.
This report is for the information of American Funds Insurance Series investors, but it also may be used as sales literature when preceded or accompanied by the current prospectuses or summary prospectuses for American Funds Insurance Series and the prospectus for the applicable insurance contract, which give details about charges, expenses, investment objectives and operating policies of the series. If used as sales material after March 31, 2021, this report must be accompanied by a statistical update for the most recently completed calendar quarter.
Fund attribution data was produced using FactSet, a third-party software system, based on daily portfolios. Securities in their initial period of acquisition may not be included in this analysis. The analysis includes equity investments only and excludes forward contracts and fixed income investments, if applicable. It does not account for buy-and-sell transactions that might have occurred intraday. As a result, average portfolio weight percentages are approximate, and the actual average portfolio weight percentages might be higher or lower. Data elements, such as pricing, income, market cap, etc., were provided by FactSet. The indexes provided for attribution are based on FactSet’s methodology. The indexes are broad-based market benchmarks and may not be used by Capital Group® as the sole comparative index for the funds. Capital Group believes the software and information from FactSet to be reliable. However, Capital Group cannot be responsible for inaccuracies, incomplete information or updating of information by FactSet.
Futures may not provide an effective hedge of the underlying securities because changes in the prices of futures may not track those of the securities they are intended to hedge. In addition, the managed risk strategy may not effectively protect the fund from market declines and will limit the fund’s participation in market gains. The use of the managed risk strategy could cause the fund’s return to lag that of the underlying fund in certain market conditions.
Bloomberg® is a trademark and service mark of Bloomberg Finance L.P. (collectively with its affiliates, “Bloomberg”). Barclays® is a trademark and service mark of Barclays Bank Plc (collectively with its affiliates, “Barclays”), used under license. Bloomberg or Bloomberg’s licensors, including Barclays, own all proprietary rights in the Bloomberg Barclays Indices. Neither Bloomberg nor Barclays approve or endorse this material, or guarantees the accuracy or completeness of any information herein, or makes any warranty, express or implied, as to the results to be obtained therefrom and, to the maximum extent allowed by law, neither shall have any liability or responsibility for injury or damages arising in connection therewith. This report, and any product, index or fund referred to herein, is not sponsored, endorsed or promoted in any way by J.P. Morgan or any of its affiliates who provide no warranties whatsoever, express or implied, and shall have no liability to any prospective investor in connection with this report. J.P. Morgan disclaimer: http://www.jpmorgan.com/pages/jpmorgan/ib/girg. MSCI has not approved, reviewed or produced this report, makes no express or implied warranties or representations and is not liable whatsoever for any data in the report. You may not redistribute the MSCI data or use it as a basis for other indices or investment products. The S&P 500 is a product of S&P Dow Jones Indices LLC and/or its affiliates and has been licensed for use by Capital Group. Copyright © 2020 S&P Dow Jones Indices LLC, a division of S&P Global, and/or its affiliates. All rights reserved. Redistribution or reproduction in whole or in part is prohibited without written permission of S&P Dow Jones Indices LLC.
American Funds Distributors, Inc., member FINRA.
Table of Contents
The Capital Advantage®
Since 1931, Capital Group, home of American Funds, has helped investors pursue long-term investment success. Our consistent approach — in combination with The Capital SystemSM — has resulted in superior outcomes.
| Aligned with investor success | The Capital System | American Funds Insurance Series superior outcomes | ||
| We base our decisions on a long-term perspective, which we believe aligns our goals with the interests of our clients. American Funds Insurance Series portfolio managers average 28 years of investment experience, including 23 years at our company, reflecting a career commitment to our long-term approach.1 | The Capital System combines individual accountability with teamwork. Funds using The Capital System are divided into portions that are managed independently by investment professionals with diverse backgrounds, ages and investment approaches. An extensive global research effort is the backbone of our system. | American Funds Insurance Series equity funds have beaten their comparable Lipper indexes in 90% of 10-year periods and 100% of 20-year periods.2 Our fixed income funds have helped investors achieve diversification through attention to correlation between bonds and equities.3 We strive to keep management fees competitive. Over the past 20 years, most funds’ fees have been below industry averages.4 | ||
| 1 | Portfolio manager experience as of the American Funds Insurance Series prospectus dated May 1, 2020. |
| 2 | Based on Class 1 share results for rolling periods through December 31, 2019. Periods covered are the shorter of the fund’s lifetime or since the inception date of the comparable Lipper index or average. The comparable Lipper indexes are: Global Funds Index (Global Growth Fund, Global Growth and Income Fund), Growth Funds Index (Growth Fund), International Funds Index (International Fund), Emerging Markets Funds Index (New World Fund), Growth & Income Funds Index (Blue Chip Income and Growth Fund, Growth-Income Fund) and Balanced Funds Index (Asset Allocation Fund). The Lipper Global Small-/Mid-Cap Funds Average was used for Global Small Capitalization Fund. Lipper source: Refinitiv Lipper. There have been periods when the fund has lagged the index. |
| 3 | Based on Class 1 share results as of December 31, 2019. Four of our five fixed income funds showed a three-year correlation below 0.1. Standard & Poor’s 500 Composite Index was used as an equity market proxy. Correlation based on monthly total returns. Correlation is a statistical measure of how two securities move in relation to each other. A correlation ranges from –1 to 1. A positive correlation close to 1 implies that as one security moves, either up or down, the other security will move in “lockstep,” in the same direction. A negative correlation close to –1 indicates that the securities have moved in the opposite direction. |
| 4 | Based on management fees for the 20-year period ended December 31, 2019, versus comparable Lipper categories, excluding funds of funds. |
All Capital Group trademarks mentioned are owned by The Capital Group Companies, Inc., an affiliated company or fund. All other company and product names mentioned are the property of their respective companies. |
Lit. No. INGEARX-998-0221P Litho in USA RCG/RRD/8074-S78548 © 2021 Capital Group. All rights reserved.
Table of Contents
Item 2. Code of Ethics.
SunAmerica Series Trust (“the registrant”) has adopted a Code of Ethics applicable to its Principal Executive and Principal Accounting Officers pursuant to Section 406 of the Sarbanes-Oxley Act of 2002 (the “Code”). During the fiscal year ended December 31, 2020, there were no reportable waivers or implicit waivers to a provision of the Code that applies to the registrant’s Principal Executive and Principal Accounting Officers (the “Covered Officers”).
Item 3. Audit Committee Financial Expert.
The registrant’s Board of Trustees has determined that Allan Sher, Garrett Bouton and Jane Jelenko each qualify as audit committee financial experts, as defined in Item 3(b) of Form N-CSR. Mr. Sher, Mr. Bouton and Ms. Jelenko are considered “independent” for purposes of Item 3(a)(2) of Form N-CSR.
Item 4. Principal Accountant Fees and Services.
| (a)-(d) | Aggregate fees billed to the registrant for the last two fiscal years for services rendered by the registrant’s principal accountant were as follows: |
| 2019 | 2020 | |||||||
(a) Audit Fees | $ | 108,167 | $ | 109,247 | ||||
(b) Audit-Related Fees | $ | 0 | $ | 0 | ||||
(c) Tax Fees | $ | 52,197 | $ | 52,718 | ||||
(d) All Other Fees | $ | 0 | $ | 0 | ||||
Audit Fees include amounts related to the audit of the registrant’s annual financial statements and services normally provided by the principal accountant in connection with statutory and regulatory filings. Tax Fees principally include tax compliance, tax advice, tax planning and preparation of tax returns.
Aggregate fees billed to the investment adviser and Adviser Affiliates (as defined below in Item 4 (e)) that are required to be pre-approved pursuant to paragraph (c)(7)(ii) of Rule 2-01 of Regulation S-X for the last two fiscal years for services rendered by the registrant’s principal accountant were as follows:
| 2019 | 2020 | |||||||
(b) Audit-Related Fees | $ | 0 | $ | 0 | ||||
(c) Tax Fees | $ | 0 | $ | 0 | ||||
(d) All Other Fees | $ | 87,316 | $ | 309,361 | ||||
| (e) | (1) The registrant’s audit committee pre-approves all audit services provided by the registrant’s principal accountant for the registrant and all non-audit services provided by the registrant’s principal accountant for the registrant, its investment adviser and any entity controlling, controlled by, or under common control with the investment adviser (“Adviser Affiliates”) that provides ongoing services to the registrant, if the engagement by the investment adviser or Adviser Affiliates relates directly to the operations and financial reporting of the registrant. The audit committee has not presently established any pre-approval policies and procedures that permit the pre-approval of the above services other than by the full audit committee. Certain de minimis exceptions are allowed for non-audit services in accordance with Rule 2-01(c)(7)(i)(C) of Regulation S-X as set forth in the registrant’s audit committee minutes. |
(2) No services included in (b)-(d) above in connection with fees billed to the registrant or the investment adviser or Adviser Affiliates were approved pursuant to paragraph (c)(7)(i)(C) of Rule 2-01 of Regulation S-X.
| (f) | Not applicable. |
| (g) | The aggregate fees billed for the most recent fiscal year and the preceding fiscal year by the registrant’s principal accountant for non-audit services rendered to the registrant, its investment adviser, and Adviser Affiliates that provides ongoing services to the registrant for 2019 and 2020 were $149,215 and $362,079, respectively. |
| (h) | Non-audit services rendered to the registrant’s investment adviser and any Adviser Affiliates that provides ongoing services to the registrant that were not pre-approved pursuant to paragraph (c)(7)(ii) of Rule 2-01 of Regulation S-X were considered by the registrant’s audit committee as to whether they were compatible with maintaining the principal accountant’s independence. |
Item 5. Audit Committee of Listed Registrants.
Not applicable.
Item 6. Investments.
Included in Item 1 to the Form.
Table of Contents
Item 7. Disclosure of Proxy Voting Policies and Procedures for Closed-End Management Investment Companies.
Not applicable.
Item 8. Portfolio Managers of Closed-End Management Investment Companies.
Not applicable.
Item 9. Purchases of Equity Securities by Closed-End Management Investment Company and Affiliated Purchasers.
Not applicable.
Item 10. Submission of Matters to a Vote of Security Holders.
There were no material changes to the procedures by which shareholders may recommend nominees to the registrant’s Board of Trustees that were implemented after the registrant last provided disclosure in response to the requirements of Item 407(c)(2)(iv) of Regulation S-K (17 CFR 229.407) (as required by item 22(b)(15)) of Schedule 14A (17 CFR 240.14a-101), or this Item 10.
Item 11. Controls and Procedures.
(a) An evaluation was performed within 90 days of the filing of this report, under the supervision and with the participation of the registrant’s management, including the President and Treasurer, of the effectiveness of the design and operation of the registrant’s disclosure controls and procedures (as defined under Rule 30a-3(c) under the Investment Company Act of 1940 (17 CFR 270.30a-3(c))). Based on that evaluation, the registrant’s management, including the President and Treasurer, concluded that the registrant’s disclosure controls and procedures are effective.
(b) There was no change in the registrant’s internal control over financial reporting (as defined in Rule 30a-3(d) under the Investment Company Act of 1940 (17 CFR 270.30a-3(d))) that occurred during the most recent fiscal-half year that has materially affected, or is reasonably likely to materially affect, the registrant’s internal control over financial reporting.
Table of Contents
Item 12. Disclosure of Securities Lending Activities for Closed-End Management Investment Companies.
Not applicable. |
Item 13. Exhibits.
| (a) |
(3) Not applicable.
(4) Not applicable.
| (b) |
SIGNATURES
Pursuant to the requirements of the Securities Exchange Act of 1934 and the Investment Company Act of 1940, the registrant has duly caused this report to be signed on its behalf by the undersigned, thereunto duly authorized.
| SunAmerica Series Trust | ||
| By: | /s/ John T. Genoy | |
| John T. Genoy | ||
| President | ||
Date: March 9, 2021
Pursuant to the requirements of the Securities Exchange Act of 1934 and the Investment Company Act of 1940, this report has been signed below by the following persons on behalf of the registrant and in the capacities and on the dates indicated.
| By: | /s/ John T. Genoy | |
| John T. Genoy | ||
| President | ||
Date: March 9, 2021
| By: | /s/ Gregory R. Kingston | |
Gregory R. Kingston | ||
| Treasurer | ||
Date: March 9, 2021