| OMB APPROVAL | |
OMB Number: 3235-0570
|
UNITED STATES
SECURITIES AND EXCHANGE COMMISSION
Washington, D.C. 20549
FORM N-CSR
CERTIFIED SHAREHOLDER REPORT OF REGISTERED
MANAGEMENT INVESTMENT COMPANIES
| Investment Company Act file number | 811-07242 |
| The Cutler Trust |
| (Exact name of registrant as specified in charter) |
| 525 Bigham Knoll Jacksonville, Oregon | 97530 |
| (Address of principal executive offices) | (Zip code) |
Matthew C. Patten
| Cutler Investment Counsel, LLC 525 Bigham Knoll Jacksonville, Oregon 97530 |
| (Name and address of agent for service) |
| Registrant's telephone number, including area code: | (541) 770-9000 |
| Date of fiscal year end: | June 30 | |
| Date of reporting period: | December 31, 2018 |
Form N-CSR is to be used by management investment companies to file reports with the Commission not later than 10 days after the transmission to stockholders of any report that is required to be transmitted to stockholders under Rule 30e-1 under the Investment Company Act of 1940 (17 CFR 270.30e-1). The Commission may use the information provided on Form N-CSR in its regulatory, disclosure review, inspection, and policymaking roles.
A registrant is required to disclose the information specified by Form N-CSR, and the Commission will make this information public. A registrant is not required to respond to the collection of information contained in Form N-CSR unless the Form displays a currently valid Office of Management and Budget ("OMB") control number. Please direct comments concerning the accuracy of the information collection burden estimate and any suggestions for reducing the burden to the Secretary, Securities and Exchange Commission, 450 Fifth Street, NW, Washington, DC 20549-0609. The OMB has reviewed this collection of information under the clearance requirements of 44 U.S.C. § 3507.
Item 1. Reports to Stockholders.
| The Cutler Trust |
|

CUTLER EQUITY FUND
CUTLER FIXED INCOME FUND
CUTLER EMERGING MARKETS FUND
SEMI-ANNUAL REPORT
December 31, 2018
(Unaudited)
Beginning on January 1, 2021, as permitted by regulations adopted by the U.S. Securities and Exchange Commission, paper copies of the Funds’ shareholder reports like this one will no longer be sent by mail, unless you specifically request paper copies of the reports from the Funds or from your financial intermediary, such as a broker-dealer or bank. Instead, the reports will be made available on a website, and you will be notified by mail each time a report is posted and provided with a website link to access the report.
If you already elected to receive shareholder reports electronically, you will not be affected by this change and you need not take any action. You may elect to receive shareholder reports and other communications from the Funds electronically by contacting the Funds at 1-800-228-8537 or, if you own these shares through a financial intermediary, by contacting your financial intermediary.
You may elect to receive all future reports in paper free of charge. You can inform the Funds that you wish to continue receiving paper copies of your shareholder reports by contacting the Fund at 1-800-228-8537. If you own shares through a financial intermediary, you may contact your financial intermediary or follow instructions included with this document to elect to continue to receive paper copies of your shareholder reports. Your election to receive reports in paper will apply to all funds held with the fund complex or at your financial intermediary.
THE CUTLER TRUST
TABLE OF CONTENTS
Page | |
Letter to Shareholders | 2 |
Performance Information | 4 |
Portfolio Information | 8 |
Schedules of Investments | 11 |
Statements of Assets and Liabilities | 21 |
Statements of Operations | 22 |
Statements of Changes in Net Assets | 23 |
Financial Highlights | 26 |
Notes to Financial Statements | 29 |
About Your Fund’s Expenses | 40 |
Additional Information | 42 |
1
THE CUTLER TRUST
LETTER TO SHAREHOLDERS
To Cutler Trust Shareholders:
Enclosed is the Semi-Annual Report for the Cutler Trust for the period ended December 31, 2018. The Cutler Trust includes the Cutler Equity Fund, the Cutler Fixed Income Fund, and the Cutler Emerging Markets Fund. Please take a few minutes to review this information, which includes performance, holdings, and other important information regarding your investment.
Most asset classes have enjoyed a relentless bull market since the Great Recession, however 2018 represented somewhat of a “give back.” Two major developments impacted the global investment markets: trade tensions between the two largest economies, and hawkish posturing by the Federal Reserve.
The S&P 500 flirted with a bear market at the end of 2018, which is defined as a 20% drop from the cyclical highs. While the S&P 500 Index did not officially reach this milestone, most equity asset classes did exceed this threshold. Emerging markets achieved bear market status earlier in the year, as negative economic data from China was a drag on global growth. The market stress contributed to Federal Reserve Chairman Jerome Powell changing Fed course and taking a more dovish stance. If progress on global trade can be made, the primary negative factors from 2018 can be resolved in 2019, providing some opportunity for investors going forward.
The Cutler Trust represents asset classes that we feel are diversified representations of global markets. Correlations of domestic large cap stocks, intermediate fixed income and emerging markets should vary. This means that each Fund may be in favor at different times and in different markets. We believe this is a strength in the composition of the Trust assets. Our dividend-based philosophy is a bedrock of our equity investments, with our belief that investments with these income characteristics may provide attractive downside risk protection and total return potential. As we move into a mature phase of this extended bull market, finding return from dividends and traditional value metrics may prove to patient investors an effective way to balance risk and return.
2
THE CUTLER TRUST
LETTER TO SHAREHOLDERS (Continued)
Thank you for your continued confidence in Cutler. We continue to provide periodic market updates and commentary on our website www.cutler.com. There you can also find sign-up options for our newsletter or periodic webinars. And as always, feel free to call us anytime with questions about your investments.
Best regards,
|
|
Erich Patten | Matthew Patten |
Chief Investment Officer | Chief Executive Officer |


Before investing you should carefully consider the Cutler Funds’ investment objectives, risks, charges and expenses. This and other information is in the prospectus, a copy of which may be obtained by calling 1-800-228-8537. Please read the prospectus carefully before you invest.
The views in this report were those of the Cutler Funds’ investment adviser as of December 31, 2018 and may not reflect its views on the date this report is first published or anytime thereafter. These views are intended to assist shareholders in understanding their investment in the Cutler Funds and do not constitute investment advice.
3
CUTLER EQUITY FUND
PERFORMANCE INFORMATION
December 31, 2018 (Unaudited)
Comparison of the Change in Value of a $10,000 Investment in
Cutler Equity Fund and S&P 500 Total Return Index

Average Annual Total Returns | |||||
1 Year | 5 Years | 10 Years | |||
Cutler Equity Fund(a) | (6.40%) | 6.22% | 11.19% | ||
S&P 500 Total Return Index(b) | (4.38%) | 8.49% | 13.12% | ||
(a) | Returns shown do not reflect the deduction of taxes a shareholder would pay on Fund distributions or the redemption of Fund shares. | ||||
(b) | The S&P 500 Total Return Index is a market capitalization weighted index that is widely used as a barometer of U.S. stock market performance. The index is unmanaged and shown for illustration purposes only. An investor cannot invest in an index and its returns are not indicative of the performance of any specific investment. | ||||
4
CUTLER FIXED INCOME FUND
PERFORMANCE INFORMATION
December 31, 2018 (Unaudited)
Comparison of the Change in Value of a $10,000 Investment in
Cutler Fixed Income Fund, Bloomberg Barclays Intermediate U.S. Government/Credit Index
and Bloomberg Barclays Short-Term U.S. Government Index
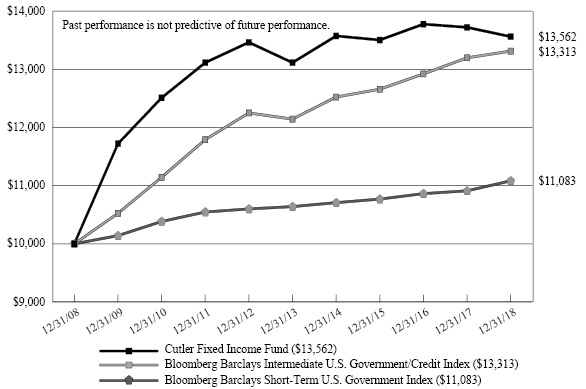
Average Annual Total Returns | |||||
1 Year | 5 Years | 10 Years | |||
Cutler Fixed Income Fund(a) | (1.17%) | 0.67% | 3.09% | ||
Bloomberg Barclays Intermediate U.S. Government/Credit Index(b) | 0.88% | 1.86% | 2.90% | ||
Bloomberg Barclays Short-Term U.S. Government Index(b) | 1.58% | 0.82% | 1.03% | ||
(a) | Returns shown do not reflect the deduction of taxes a shareholder would pay on Fund distributions or the redemption of Fund shares. | ||||
(b) | The Bloomberg Barclays Intermediate U.S. Government/Credit Index and the Bloomberg Barclays Short-Term U.S. Government Index cover intermediate and short-term, respectively, fixed income securities of the U.S government and publicly-issued U.S. corporate and foreign debentures and secured notes that meet specified maturity, liquidity, and quality requirements. The indices are unmanaged and shown for illustration purposes only. An investor cannot invest in an index and its returns are not indicative of the performance of any specific investment. | ||||
5
CUTLER EMERGING MARKETS FUND
PERFORMANCE INFORMATION
December 31, 2018 (Unaudited)
Comparison of the Change in Value of a $10,000 Investment in
Cutler Emerging Markets Fund, S&P Emerging BMI Total Return Index*
and MSCI Emerging Markets Index
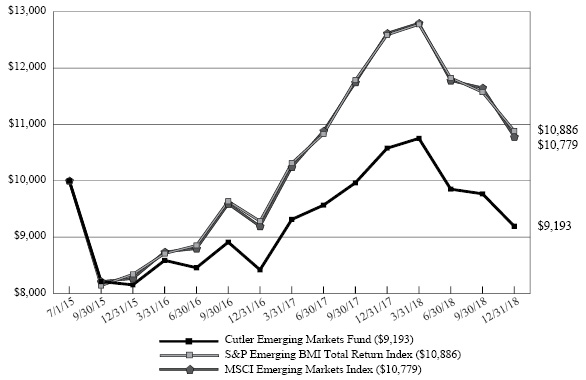
* | Effective December 31, 2018, the Fund changed its benchmark from the MSCI Emerging Markets Index to the S&P Emerging BMI Total Return Index. This benchmark change was made because the S&P Emerging BMI Total Return Index more precisely reflects the market in which the Fund invests. |
6
CUTLER EMERGING MARKETS FUND
PERFORMANCE INFORMATION
December 31, 2018 (Unaudited)
Average Annual Total Returns | |||||
1 Year | 3 Years | Since | |||
Cutler Emerging Markets Fund(b) | (13.09%) | 4.08% | (2.37%) | ||
S&P Emerging BMI Total Return Index(c) | (13.53%) | 9.28% | 2.45% | ||
MSCI Emerging Markets Index(d) | (14.57%) | 9.25% | 2.17% | ||
(a) | The Fund commenced operations on July 1, 2015. | ||||
(b) | Returns shown do not reflect the deduction of taxes a shareholder would pay on Fund distributions or the redemption of Fund shares. | ||||
(c) | The S&P Emerging BMI Total Return Index captures all companies domiciled in the emerging markets within the S&P Global BMI with a float-adjusted market capitalization of at least USD 100 million meeting 6- and 12-month median value traded requirements. The index is segmented by country/region, size (large, mid and small), style (value and growth), and GICS (sectors/industry groups). The index is unmanaged and shown for illustration purposes only. An investor cannot invest in an index and its returns are not indicative of the performance of any specific investment. | ||||
(d) | The MSCI Emerging Markets Index captures large and mid cap representation across 24 emerging markets: Brazil, Chile, China, Colombia, Czech Republic, Egypt, Greece, Hungary, India, Indonesia, Korea, Malaysia, Mexico, Pakistan, Peru, Philippines, Poland, Russia, Qatar, South Africa, Taiwan, Thailand, Turkey and United Arab Emirates. The index is unmanaged and shown for illustration purposes only. An investor cannot invest in an index and its returns are not indicative of the performance of any specific investment. | ||||
7
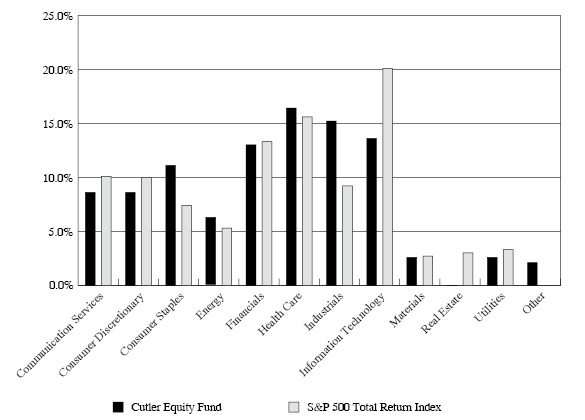
CUTLER EQUITY FUND
PORTFOLIO INFORMATION
December 31, 2018 (Unaudited)
Sector Allocation (% of Net Assets)
8
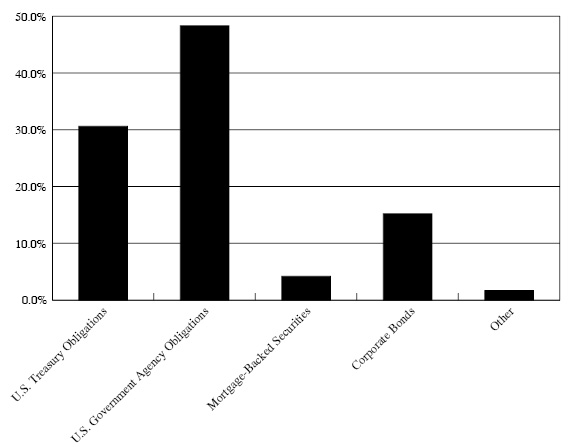
CUTLER FIXED INCOME FUND
PORTFOLIO INFORMATION
December 31, 2018 (Unaudited)
Asset Allocation (% of Net Assets)
9
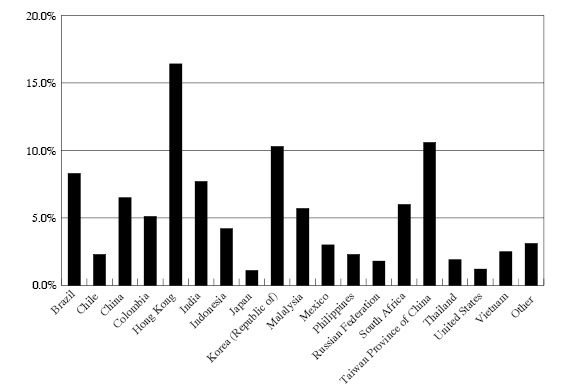
CUTLER EMERGING MARKETS FUND
PORTFOLIO INFORMATION
December 31, 2018 (Unaudited)
Country Allocation (% of Net Assets)
10
CUTLER EQUITY FUND | ||||||||
COMMON STOCKS — 97.9% | Shares | Value | ||||||
Communication Services — 8.6% | ||||||||
Diversified Telecommunication Services — 4.8% | ||||||||
AT&T, Inc. | 96,903 | $ | 2,765,611 | |||||
Verizon Communications, Inc. | 70,786 | 3,979,589 | ||||||
| 6,745,200 | ||||||||
Entertainment — 3.8% | ||||||||
Walt Disney Company (The) | 48,992 | 5,371,973 | ||||||
Consumer Discretionary — 8.6% | ||||||||
Hotels, Restaurants & Leisure — 4.4% | ||||||||
McDonald's Corporation | 34,655 | 6,153,688 | ||||||
Specialty Retail — 4.2% | ||||||||
Home Depot, Inc. (The) | 34,575 | 5,940,677 | ||||||
Consumer Staples — 11.1% | ||||||||
Beverages — 2.6% | ||||||||
PepsiCo, Inc. | 33,995 | 3,755,767 | ||||||
Food & Staples Retailing — 5.7% | ||||||||
Kroger Company (The) | 117,971 | 3,244,202 | ||||||
Walmart, Inc. | 51,677 | 4,813,713 | ||||||
| 8,057,915 | ||||||||
Household Products — 2.8% | ||||||||
Procter & Gamble Company (The) | 42,630 | 3,918,550 | ||||||
Energy — 6.2% | ||||||||
Energy Equipment & Services — 0.6% | ||||||||
Schlumberger Ltd. | 25,000 | 902,000 | ||||||
Oil, Gas & Consumable Fuels — 5.6% | ||||||||
Chevron Corporation | 41,320 | 4,495,203 | ||||||
Exxon Mobil Corporation | 49,563 | 3,379,701 | ||||||
| 7,874,904 | ||||||||
Financials — 13.0% | ||||||||
Banks — 2.9% | ||||||||
M&T Bank Corporation | 28,340 | 4,056,304 | ||||||
Capital Markets — 5.7% | ||||||||
BlackRock, Inc. | 13,284 | 5,218,221 | ||||||
11
CUTLER EQUITY FUND | ||||||||
COMMON STOCKS — 97.9% (Continued) | Shares | Value | ||||||
Financials — 13.0% (Continued) | ||||||||
Capital Markets — 5.7% (Continued) | �� | |||||||
Northern Trust Corporation | 34,000 | $ | 2,842,060 | |||||
| 8,060,281 | ||||||||
Insurance — 4.4% | ||||||||
Marsh & McLennan Companies, Inc. | 41,500 | 3,309,625 | ||||||
Prudential Financial, Inc. | 35,500 | 2,895,025 | ||||||
| 6,204,650 | ||||||||
Health Care — 16.4% | ||||||||
Health Care Equipment & Supplies — 7.3% | ||||||||
Becton, Dickinson and Company | 27,525 | 6,201,933 | ||||||
Medtronic plc | 46,000 | 4,184,160 | ||||||
| 10,386,093 | ||||||||
Pharmaceuticals — 9.1% | ||||||||
Bristol-Myers Squibb Company | 71,490 | 3,716,050 | ||||||
Johnson & Johnson | 34,670 | 4,474,164 | ||||||
Merck & Company, Inc. | 60,290 | 4,606,759 | ||||||
| 12,796,973 | ||||||||
Industrials — 15.2% | ||||||||
Aerospace & Defense — 2.4% | ||||||||
United Technologies Corporation | 32,010 | 3,408,425 | ||||||
Commercial Services & Supplies — 2.4% | ||||||||
Republic Services, Inc. | 48,000 | 3,460,320 | ||||||
Machinery — 8.3% | ||||||||
Caterpillar, Inc. | 41,780 | 5,308,985 | ||||||
Deere & Company | 43,444 | 6,480,541 | ||||||
| 11,789,526 | ||||||||
Road & Rail — 2.1% | ||||||||
Union Pacific Corporation | 21,000 | 2,902,830 | ||||||
Information Technology — 13.6% | ||||||||
Semiconductors & Semiconductor Equipment — 9.5% | ||||||||
Intel Corporation | 102,465 | 4,808,682 | ||||||
QUALCOMM, Inc. | 61,964 | 3,526,371 | ||||||
Texas Instruments, Inc. | 53,365 | 5,042,993 | ||||||
| 13,378,046 | ||||||||
Software — 4.1% | ||||||||
Microsoft Corporation | 56,925 | 5,781,872 | ||||||
12
CUTLER EQUITY FUND | ||||||||
COMMON STOCKS — 97.9% (Continued) | Shares | Value | ||||||
Materials — 2.6% | ||||||||
Chemicals — 2.6% | ||||||||
DowDuPont, Inc. | 69,875 | $ | 3,736,915 | |||||
Utilities — 2.6% | ||||||||
Multi-Utilities — 2.6% | ||||||||
Dominion Energy, Inc. | 50,743 | 3,626,095 | ||||||
Total Common Stocks (Cost $94,950,595) | $ | 138,309,004 | ||||||
MONEY MARKET FUNDS — 2.0% | Shares | Value | ||||||
Invesco STIT Government & Agency Portfolio - Institutional Class, 2.30%(a) (Cost $2,859,331) | 2,859,331 | $ | 2,859,331 | |||||
Total Investments at Value — 99.9% (Cost $97,809,926) | $ | 141,168,335 | ||||||
Other Assets in Excess of Liabilities — 0.1% | 136,932 | |||||||
Net Assets — 100.0% | $ | 141,305,267 | ||||||
(a) | The rate shown is the 7-day effective yield as of December 31, 2018. |
See accompanying notes to financial statements. | |
13
CUTLER FIXED INCOME FUND | ||||||||||||||||
U.S. TREASURY OBLIGATIONS — 30.6% | Coupon | Maturity | Par Value | Value | ||||||||||||
U.S. Treasury Notes | 1.750 | % | 11/30/19 | $ | 250,000 | $ | 248,037 | |||||||||
U.S. Treasury Notes | 1.875 | % | 12/15/20 | 250,000 | 247,022 | |||||||||||
U.S. Treasury Notes | 2.375 | % | 03/15/21 | 250,000 | 249,336 | |||||||||||
U.S. Treasury Notes | 1.625 | % | 02/15/26 | 700,000 | 655,266 | |||||||||||
U.S. Treasury Notes | 1.625 | % | 05/15/26 | 650,000 | 606,988 | |||||||||||
U.S. Treasury Notes | 2.000 | % | 11/15/26 | 500,000 | 477,285 | |||||||||||
U.S. Treasury Notes | 2.125 | % | 06/30/22 | 1,000,000 | 988,125 | |||||||||||
Total U.S. Treasury Obligations (Cost $3,518,134) | $ | 3,472,059 | ||||||||||||||
| ||||||||||||||||
U.S. GOVERNMENT AGENCY OBLIGATIONS — 48.3% | Coupon | Maturity | Par Value | Value | ||||||||||||
Federal Farm Credit Bank — 21.9% | ||||||||||||||||
Federal Farm Credit Bank | 2.750 | % | 06/26/23 | $ | 500,000 | $ | 500,375 | |||||||||
Federal Farm Credit Bank | 2.040 | % | 02/10/25 | 100,000 | 93,692 | |||||||||||
Federal Farm Credit Bank | 2.370 | % | 05/01/25 | 300,000 | 290,834 | |||||||||||
Federal Farm Credit Bank | 2.360 | % | 06/16/25 | 310,000 | 296,367 | |||||||||||
Federal Farm Credit Bank | 2.240 | % | 07/06/27 | 1,150,000 | 1,074,168 | |||||||||||
Federal Farm Credit Bank | 2.500 | % | 07/12/27 | 250,000 | 235,868 | |||||||||||
| 2,491,304 | ||||||||||||||||
Federal Home Loan Bank — 20.5% | ||||||||||||||||
Federal Home Loan Bank | 1.750 | % | 03/29/22 | 250,000 | 246,797 | |||||||||||
Federal Home Loan Bank | 1.500 | % | 10/27/22 | 500,000 | 494,282 | |||||||||||
Federal Home Loan Bank | 2.125 | % | 03/10/23 | 350,000 | 342,828 | |||||||||||
Federal Home Loan Bank | 1.500 | % | 07/27/28 | 1,000,000 | 928,679 | |||||||||||
Federal Home Loan Bank | 2.570 | % | 10/06/31 | 345,000 | 316,935 | |||||||||||
| 2,329,521 | ||||||||||||||||
Federal Home Loan Mortgage Corporation — 1.3% | ||||||||||||||||
Federal Home Loan Mortgage Corporation | 1.500 | % | 10/27/23 | 150,000 | 146,364 | |||||||||||
Private Export Funding Corporation — 3.2% | ||||||||||||||||
Private Export Funding Corporation | 4.300 | % | 12/15/21 | 350,000 | 365,675 | |||||||||||
U.S. Department of Housing and Urban Development — 1.4% | ||||||||||||||||
U.S. Department of Housing and Urban Development | 4.130 | % | 08/01/25 | 150,000 | 153,672 | |||||||||||
Total U.S. Government Agency Obligations(Cost $5,628,053) | $ | 5,486,536 | ||||||||||||||
14
CUTLER FIXED INCOME FUND | ||||||||||||||||
MORTGAGE-BACKED SECURITIES — 4.2% | Coupon | Maturity | Par Value | Value | ||||||||||||
Commercial — 0.4% | ||||||||||||||||
Banc of America Commercial Mortgage Trust, IO, Series 2004-4 | 0.415 | %(a) | 07/01/42 | $ | 269,827 | $ | 3 | |||||||||
Bear Stearns Commercial Mortgage Securities Trust, Series 2005-T20 | 4.471 | %(a) | 10/12/42 | 200,000 | 43,651 | |||||||||||
Wachovia Bank Commercial Mortgage Trust, IO, Series 2005-C21 | 0.000 | %(a) | 10/01/44 | 106,885,948 | 3,687 | |||||||||||
| 47,341 | ||||||||||||||||
Federal Home Loan Mortgage Corporation — 0.3% | ||||||||||||||||
FHLMC, Pool #J13584 | 3.500 | % | 11/01/25 | 21,235 | 21,524 | |||||||||||
FHLMC, Series 1963 | 7.500 | % | 01/01/27 | 12,766 | 14,237 | |||||||||||
| 35,761 | ||||||||||||||||
Federal National Mortgage Association — 2.0% | ||||||||||||||||
FANNIEMAE-ACES, IO, Series 2015-M4 | 0.374 | %(a) | 07/25/22 | 12,701,033 | 134,597 | |||||||||||
FANNIEMAE-ACES, IO, Series 2014-M13 | 0.121 | %(a) | 08/25/24 | 11,605,517 | 76,758 | |||||||||||
FNMA, Pool #899237 | 5.000 | % | 03/01/22 | 2,100 | 2,137 | |||||||||||
FNMA, Series 2002-93 | 6.500 | % | 03/01/32 | 15,423 | 17,276 | |||||||||||
| 230,768 | ||||||||||||||||
Government National Mortgage Association — 1.5% | ||||||||||||||||
GNMA, IO, Series 2012-114 | 0.765 | %(a) | 01/16/53 | 3,257,779 | 164,827 | |||||||||||
Total Mortgage-Backed Securities (Cost $767,297) | $ | 478,697 | ||||||||||||||
| ||||||||||||||||
CORPORATE BONDS — 15.2% | Coupon | Maturity | Par Value | Value | ||||||||||||
Consumer Discretionary — 3.8% | ||||||||||||||||
Dollar General Corporation | 4.125 | % | 05/01/28 | $ | 150,000 | $ | 145,584 | |||||||||
Dollar Tree, Inc. | 4.000 | % | 05/15/25 | 150,000 | 144,203 | |||||||||||
NVR, Inc. | 3.950 | % | 09/15/22 | 150,000 | 147,483 | |||||||||||
| 437,270 | ||||||||||||||||
Financials — 4.9% | ||||||||||||||||
Citigroup, Inc. | 2.700 | % | 10/27/22 | 150,000 | 144,593 | |||||||||||
Finial Holdings, Inc. | 7.125 | % | 10/15/23 | 250,000 | 282,649 | |||||||||||
First American Financial Advisors, Inc. | 4.300 | % | 02/01/23 | 125,000 | 125,490 | |||||||||||
| 552,732 | ||||||||||||||||
15
CUTLER FIXED INCOME FUND | ||||||||||||||||
CORPORATE BONDS — 15.2% (Continued) | Coupon | Maturity | Par Value | Value | ||||||||||||
Health Care — 1.3% | ||||||||||||||||
Cigna Corporation | 3.250 | % | 04/15/25 | $ | 150,000 | $ | 142,553 | |||||||||
Industrials — 2.5% | ||||||||||||||||
Mueller Industries, Inc. | 6.000 | % | 03/01/27 | 150,000 | 139,500 | |||||||||||
Textron, Inc. (3MO LIBOR +55) | 2.891 | %(a) | 11/10/20 | 150,000 | 148,708 | |||||||||||
| 288,208 | ||||||||||||||||
Information Technology — 1.4% | ||||||||||||||||
S&P Global, Inc. | 4.400 | % | 02/15/26 | 150,000 | 154,761 | |||||||||||
Materials — 1.3% | ||||||||||||||||
Mosaic Company | 3.250 | % | 11/15/22 | 150,000 | 146,471 | |||||||||||
Total Corporate Bonds(Cost $1,762,393) | $ | 1,721,995 | ||||||||||||||
| ||||||||
MONEY MARKET FUNDS — 1.3% | Shares | Value | ||||||
Invesco STIT Government & Agency Portfolio - Institutional Class, 2.30%(b) (Cost $150,404) | 150,404 | $ | 150,404 | |||||
Total Investments at Value — 99.6% (Cost $11,826,281) | $ | 11,309,691 | ||||||
Other Assets in Excess of Liabilities — 0.4% | 49,600 | |||||||
Net Assets — 100.0% | $ | 11,359,291 | ||||||
IO – Interest only strip. Par value shown is notional value, not a true par value (Note 6). | |
LIBOR – London interbank offered rate | |
(a) | Variable rate security. The rate shown is the effective interest rate as of December 31, 2018. For securities based on a published reference rate and spread, the reference rate and spread (in basis points) are indicated parenthetically. Certain variable rate securites are not based on a published reference rate and spread but are determined by the issuer or agent and are based on current market conditions. The securities, therefore, do not indicate a reference rate and spread. |
(b) | The rate shown is the 7-day effective yield as of December 31, 2018. |
See accompanying notes to financial statements. | |
16
CUTLER EMERGING MARKETS FUND | ||||||||
COMMON STOCKS — 71.5% | Shares | Value | ||||||
Brazil — 3.3% | ||||||||
Ambev S.A. - ADR | 32,010 | $ | 125,479 | |||||
Banco Bradesco S.A. - ADR | 17,319 | 171,285 | ||||||
TIM Participacoes S.A. - ADR | 7,700 | 118,118 | ||||||
| 414,882 | ||||||||
Chile — 2.3% | ||||||||
Empresa Nacional de Telecomunicaciones S.A.(a) | 17,614 | 136,980 | ||||||
Viña Concha y Toro S.A. | 79,500 | 155,192 | ||||||
| 292,172 | ||||||||
China — 4.2% | ||||||||
China Petroleum & Chemical Corporation - ADR | 1,600 | 112,960 | ||||||
PetroChina Company Ltd. - ADR | 4,176 | 257,033 | ||||||
Sinopec Shanghai Petrochemical Company Ltd. - ADR | 3,704 | 159,864 | ||||||
| 529,857 | ||||||||
Colombia — 1.2% | ||||||||
Grupo de Inversiones Suramericana S.A. | 14,983 | 148,192 | ||||||
Hong Kong — 16.4% | ||||||||
Beijing Enterprises Holdings Ltd.(a) | 41,000 | 217,398 | ||||||
China Overseas Land & Investment Ltd.(a) | 59,000 | 203,419 | ||||||
China Overseas Property Holdings Ltd.(a) | 15,666 | 4,576 | ||||||
China Resources Beer Holdings Company Ltd.(a) | 104,000 | 363,601 | ||||||
China Resources Land Ltd.(a) | 68,000 | 261,572 | ||||||
CITIC Ltd.(a) | 107,000 | 167,901 | ||||||
COSCO SHIPPING Ports Ltd.(a) | 12,754 | 12,539 | ||||||
Hengan International Group Company Ltd.(a) | 39,000 | 283,152 | ||||||
Lenovo Group Ltd. - ADR | 8,206 | 109,960 | ||||||
Shanghai Industrial Holdings Ltd.(a) | 69,000 | 139,495 | ||||||
Sino Biopharmaceutical Ltd.(a) | 148,500 | 97,755 | ||||||
Tingyi (Cayman Islands) Holding Corporation(a) | 148,000 | 198,216 | ||||||
| 2,059,584 | ||||||||
Indonesia — 4.2% | ||||||||
Indofood Sukses Makmur Tbk.(a) | 277,700 | 143,676 | ||||||
Semen Indonesia Persero Tbk.(a) | 263,100 | 210,149 | ||||||
Telekomunikasi Indonesia Persero Tbk. - ADR | 6,514 | 170,732 | ||||||
| 524,557 | ||||||||
Korea (Republic of) — 10.3% | ||||||||
AmorePacific Group(a)(b) | 710 | 46,437 | ||||||
Dongbu Insurance Company Ltd.(a) | 2,159 | 136,285 | ||||||
Korea Gas Corporation(a)(b) | 3,880 | 168,093 | ||||||
KT Corporation - ADR | 11,956 | 170,014 | ||||||
LG Corporation(a) | 3,275 | 205,578 | ||||||
17
CUTLER EMERGING MARKETS FUND | ||||||||
COMMON STOCKS — 71.5% (Continued) | Shares | Value | ||||||
Korea (Republic of) — 10.3% (Continued) | ||||||||
POSCO - ADR | 2,676 | $ | 147,020 | |||||
Samsung Electronics Company Ltd.(a) | 9,400 | 327,983 | ||||||
Samsung Fire & Marine Insurance Company Ltd.(a)(b) | 370 | 89,175 | ||||||
| 1,290,585 | ||||||||
Malaysia — 5.7% | ||||||||
CIMB Group Holdings Berhad(a) | 233,288 | 322,046 | ||||||
Genting Berhad(a) | 84,200 | 124,189 | ||||||
Malayan Banking Berhad(a) | 117,176 | 269,106 | ||||||
| 715,341 | ||||||||
Mexico — 3.0% | ||||||||
América Móvil S.A.B. de C.V. - Series L - ADR | 15,817 | 225,392 | ||||||
Coca-Cola Femsa S.A.B. de C.V. - Series L | 23,837 | 144,748 | ||||||
| 370,140 | ||||||||
Philippines — 2.3% | ||||||||
Aboitiz Equity Ventures, Inc.(a) | 87,350 | 91,395 | ||||||
Robinsons Land Corporation(a) | 228,364 | 88,205 | ||||||
Universal Robina Corporation(a) | 45,370 | 109,751 | ||||||
| 289,351 | ||||||||
South Africa — 6.0% | ||||||||
Liberty Holdings Ltd. | 16,865 | 128,793 | ||||||
Naspers Ltd. - Class N - ADR | 6,285 | 249,232 | ||||||
Sasol Ltd. - ADR | 4,502 | 131,863 | ||||||
Shoprite Holdings Ltd. - ADR | 8,803 | 117,168 | ||||||
Shoprite Holdings Ltd.(a) | 10,000 | 131,944 | ||||||
| 759,000 | ||||||||
Taiwan Province of China — 9.5% | ||||||||
Cheng Shin Rubber Industry Company Ltd.(a) | 54,000 | 72,126 | ||||||
Compal Electronics, Inc.(a) | 238,000 | 135,540 | ||||||
CTCI Corporation(a) | 156,000 | 226,570 | ||||||
Delta Electronics, Inc.(a) | 39,100 | 165,248 | ||||||
Giant Manufacturing Company Ltd.(a) | 21,000 | 98,974 | ||||||
President Chain Store Corporation(a) | 29,000 | 293,387 | ||||||
Taiwan Semiconductor Manufacturing Company Ltd. - ADR | 5,575 | 205,773 | ||||||
| 1,197,618 | ||||||||
Thailand — 1.9% | ||||||||
Charoen Pokphand Foods plc(a) | 309,000 | 235,121 | ||||||
United States — 1.2% | ||||||||
Southern Copper Corporation | 4,890 | 150,465 | ||||||
Total Common Stocks (Cost $8,694,538) | $ | 8,976,865 | ||||||
18
CUTLER EMERGING MARKETS FUND | ||||||||
PREFERRED STOCKS — 6.8% | Shares | Value | ||||||
Brazil — 5.0% | ||||||||
Companhia Brasileira de Distribuição - ADR(c) | 7,000 | $ | 145,390 | |||||
Companhia Paranaense de Energia-Copel - ADR(c) | 15,000 | 117,450 | ||||||
Itau Unibanco Holding S.A. - ADR(c) | 28,905 | 264,192 | ||||||
Telefonica Brasil S.A. - ADR(c) | 8,850 | 105,581 | ||||||
| 632,613 | ||||||||
Colombia — 0.0%(d) | ||||||||
Grupo de Inversiones Suramericana S.A(c) | 183 | 1,752 | ||||||
Russian Federation — 1.8% | ||||||||
Surgutneftegaz OJSC - ADR(c) | 39,980 | 219,490 | ||||||
Total Preferred Stocks (Cost $753,993) | $ | 853,855 | ||||||
| ||||||||
EXCHANGE-TRADED FUNDS — 18.6% | Shares | Value | ||||||
Columbia India Consumer ETF | 11,000 | $ | 486,248 | |||||
iShares China Large-Cap ETF | 7,500 | 293,100 | ||||||
iShares MSCI India ETF | 26,800 | 893,512 | ||||||
iShares MSCI Japan ETF | 2,750 | 139,398 | ||||||
iShares MSCI Taiwan ETF | 4,429 | 140,045 | ||||||
VanEck Vectors India Small-Cap Index ETF | 1,890 | 80,136 | ||||||
VanEck Vectors Vietnam ETF | 20,900 | 308,275 | ||||||
Total Exchange-Traded Funds (Cost $2,349,450) | $ | 2,340,714 | ||||||
| ||||||||
MONEY MARKET FUNDS — 2.8% | Shares | Value | ||||||
Invesco STIT Government & Agency Portfolio - Institutional Class, 2.30%(e) (Cost $345,644) | 345,644 | $ | 345,644 | |||||
Total Investments at Value — 99.7%(Cost $12,143,625) | $ | 12,517,078 | ||||||
Other Assets in Excess of Liabilities — 0.3% | 42,854 | |||||||
Net Assets — 100.0% | $ | 12,559,932 | ||||||
ADR - American Depositary Receipt. | |
(a) | Level 2 security (Note 2) |
(b) | Non-income producing security. |
(c) | Security has a perpetual maturity date. |
(d) | Percentage rounds to less than 0.1%. |
(e) | The rate shown is the 7-day effective yield as of December 31, 2018. |
See accompanying notes to financial statements. | |
19
CUTLER EMERGING MARKETS FUND | |
Sector/Industry | % of Net Assets |
Communication Services — 9.4% | |
Diversified Telecommunication Services | 3.5% |
Media | 2.0% |
Wireless Telecommunication Services | 3.9% |
Consumer Discretionary — 2.3% | |
Auto Components | 0.5% |
Hotels, Restaurants & Leisure | 1.0% |
Leisure Products | 0.8% |
Consumer Staples — 19.8% | |
Beverages | 3.4% |
Food & Staples Retailing | 8.3% |
Food Products | 5.5% |
Personal Products | 2.6% |
Energy — 4.7% | |
Oil, Gas & Consumable Fuels | 4.7% |
Financials — 12.2% | |
Banks | 6.1% |
Diversified Financial Services | 3.3% |
Insurance | 2.8% |
Health Care — 0.8% | |
Pharmaceuticals | 0.8% |
Industrials – 6.8% | |
Construction & Engineering | 1.8% |
Industrial Conglomerates | 4.9% |
Transportation Infrastructure | 0.1% |
Information Technology — 7.5% | |
Electronic Equipment, Instruments & Components | 1.3% |
Semiconductors & Semiconductor Equipment | 1.6% |
Technology Hardware, Storage & Peripherals | 4.6% |
Materials – 6.4% | |
Chemicals | 2.4% |
Construction Materials | 1.7% |
Metals & Mining | 2.3% |
Real Estate — 4.4% | |
Real Estate Management & Development | 4.4% |
Utilities — 4.0% | |
Gas Utilities | 4.0% |
78.3% | |
See accompanying notes to financial statements. |
20
THE CUTLER TRUST | ||||||||||||
| Cutler | Cutler Fixed | Cutler | |||||||||
ASSETS | ||||||||||||
Investments in securities: | ||||||||||||
At cost | $ | 97,809,926 | $ | 11,826,281 | $ | 12,143,625 | ||||||
At value (Note 2) | $ | 141,168,335 | $ | 11,309,691 | $ | 12,517,078 | ||||||
Cash denominated in foreign currency (Cost $26,650) | — | — | 26,797 | |||||||||
Receivable due from Adviser (Note 3) | — | — | 1,509 | |||||||||
Receivable for capital shares sold | 13,075 | 609 | 1,481 | |||||||||
Dividends and interest receivable | 250,147 | 71,253 | 33,631 | |||||||||
Other assets | 18,867 | 6,731 | 3,334 | |||||||||
Total assets | 141,450,424 | 11,388,284 | 12,583,830 | |||||||||
LIABILITIES | ||||||||||||
Payable for capital shares redeemed | 9,911 | 7,962 | 1,378 | |||||||||
Payable to Adviser (Note 3) | 83,591 | 2,401 | — | |||||||||
Payable to administrator (Note 3) | 18,400 | 6,000 | 6,500 | |||||||||
Other accrued expenses | 33,255 | 12,630 | 16,020 | |||||||||
Total liabilities | 145,157 | 28,993 | 23,898 | |||||||||
NET ASSETS | $ | 141,305,267 | $ | 11,359,291 | $ | 12,559,932 | ||||||
NET ASSETS CONSIST OF: | ||||||||||||
Paid-in capital | $ | 97,544,468 | $ | 14,379,591 | $ | 12,418,866 | ||||||
Accumulated earnings (deficit) | 43,760,799 | (3,020,300 | ) | 141,066 | ||||||||
NET ASSETS | $ | 141,305,267 | $ | 11,359,291 | $ | 12,559,932 | ||||||
Shares of beneficial interest outstanding (unlimited number of shares authorized, no par value) | 7,735,243 | 1,340,267 | 1,417,491 | |||||||||
Net asset value, offering price and redemption price per share (Note 2) | $ | 18.27 | $ | 8.48 | $ | 8.86 | ||||||
See accompanying notes to financial statements. |
21
THE CUTLER TRUST | ||||||||||||
| Cutler | Cutler Fixed | Cutler | |||||||||
INVESTMENT INCOME | ||||||||||||
Dividend income | $ | 2,096,135 | $ | 6,194 | $ | 227,971 | ||||||
Interest income | — | 148,073 | (a) | — | ||||||||
Foreign withholding taxes on dividends | — | — | (23,829 | ) | ||||||||
Total investment income | 2,096,135 | 154,267 | 204,142 | |||||||||
EXPENSES | ||||||||||||
Investment advisory fees (Note 3) | 572,656 | 29,421 | 58,216 | |||||||||
Administration fees (Note 3) | 114,511 | 36,000 | 39,000 | |||||||||
Shareholder servicing fees (Note 4) | 109,863 | 1 | — | |||||||||
Professional fees | 26,729 | 12,218 | 12,629 | |||||||||
Registration and filing fees | 11,945 | 7,756 | 4,662 | |||||||||
Custody and bank service fees | 8,181 | 2,566 | 10,875 | |||||||||
Trustees’ fees and expenses (Note 3) | 16,039 | 1,237 | 1,474 | |||||||||
Pricing costs | 604 | 4,717 | 7,497 | |||||||||
Insurance expense | 8,485 | 840 | 958 | |||||||||
Postage and supplies | 5,910 | 1,891 | 1,872 | |||||||||
Printing of shareholder reports | 3,769 | 2,708 | 2,456 | |||||||||
Other expenses | 7,626 | 6,036 | 10,834 | |||||||||
Total expenses | 886,318 | 105,391 | 150,473 | |||||||||
Less fee reductions by the Adviser (Note 3) | (8,025 | ) | — | (44,315 | ) | |||||||
Fees voluntarily waived by the Adviser (Note 3) | — | (10,771 | ) | — | ||||||||
Net expenses | 878,293 | 94,620 | 106,158 | |||||||||
NET INVESTMENT INCOME | 1,217,842 | 59,647 | 97,984 | |||||||||
REALIZED AND UNREALIZED GAINS (LOSSES) ON INVESTMENTS AND FOREIGN CURRENCIES | ||||||||||||
Net realized gains (losses) from: | ||||||||||||
Investment transactions | 3,697,023 | (393,297 | ) | 28,232 | ||||||||
Foreign currency transactions | — | — | (1,895 | ) | ||||||||
Net change in unrealized appreciation (depreciation) on: | ||||||||||||
Investments | (9,311,271 | ) | 314,681 | (1,078,957 | ) | |||||||
Foreign currency translation | — | — | 541 | |||||||||
NET REALIZED AND UNREALIZED LOSSES ON INVESTMENTS AND FOREIGN CURRENCIES | (5,614,248 | ) | (78,616 | ) | (1,052,079 | ) | ||||||
NET DECREASE IN NET ASSETS FROM OPERATIONS | $ | (4,396,406 | ) | $ | (18,969 | ) | $ | (954,095 | ) | |||
(a) | Includes income received from prepayment penalties for IO securities (Note 7). |
See accompanying notes to financial statements. | |
22
CUTLER EQUITY FUND | ||||||||
| Six Months | Year | ||||||
FROM OPERATIONS | ||||||||
Net investment income | $ | 1,217,842 | $ | 2,149,746 | ||||
Net realized gains from investment transactions | 3,697,023 | 3,144,331 | ||||||
Net change in unrealized appreciation (depreciation) on investments | (9,311,271 | ) | 9,752,282 | |||||
Net increase (decrease) in net assets from operations | (4,396,406 | ) | 15,046,359 | |||||
DISTRIBUTIONS TO SHAREHOLDERS (Note 2) | (6,947,751 | ) | (4,038,093 | ) | ||||
CAPITAL SHARE TRANSACTIONS | ||||||||
Proceeds from shares sold | 4,724,302 | 13,365,712 | ||||||
Net asset value of shares issued in reinvestment of distributions to shareholders | 6,916,739 | 4,010,459 | ||||||
Payments for shares redeemed | (9,588,947 | ) | (19,372,054 | ) | ||||
Net increase (decrease) from capital share transactions | 2,052,094 | (1,995,883 | ) | |||||
TOTAL INCREASE (DECREASE) IN NET ASSETS | (9,292,063 | ) | 9,012,383 | |||||
NET ASSETS | ||||||||
Beginning of period | 150,597,330 | 141,584,947 | ||||||
End of period | $ | 141,305,267 | $ | 150,597,330 | ||||
CAPITAL SHARE ACTIVITY | ||||||||
Shares sold | 246,398 | 670,098 | ||||||
Shares reinvested | 372,156 | 199,637 | ||||||
Shares redeemed | (481,302 | ) | (972,289 | ) | ||||
Net incerease (decrease) in shares outstanding | 137,252 | (102,554 | ) | |||||
Shares outstanding at beginning of period | 7,597,991 | 7,700,545 | ||||||
Shares outstanding at end of period | 7,735,243 | 7,597,991 | ||||||
(a) | The presentation of Distributions to Shareholders has been updated to reflect the changes prescribed in amendments to Regulations S-X, effective November 5, 2018 (Note 2). For the year ended June 30, 2018, distributions to shareholders from net investment income were $2,190,013 and from net realized gains were $1,318,085. As of June 30, 2018, undistributed net investment income was $34,512. |
See accompanying notes to financial statements. | |
23
CUTLER FIXED INCOME FUND | ||||||||
| Six Months | Year | ||||||
FROM OPERATIONS | ||||||||
Net investment income (loss) | $ | 59,647 | $ | (143,847 | ) | |||
Net realized losses from investment transactions | (393,297 | ) | (1,056,814 | ) | ||||
Net change in unrealized appreciation (depreciation) on investments | 314,681 | 1,111,041 | ||||||
Net decrease in net assets from operations | (18,969 | ) | (89,620 | ) | ||||
CAPITAL SHARE TRANSACTIONS | ||||||||
Proceeds from shares sold | 131,247 | 820,313 | ||||||
Payments for shares redeemed | (1,067,478 | ) | (3,486,876 | ) | ||||
Net decrease from capital share transactions | (936,231 | ) | (2,666,563 | ) | ||||
TOTAL DECREASE IN NET ASSETS | (955,200 | ) | (2,756,183 | ) | ||||
NET ASSETS | ||||||||
Beginning of period | 12,314,491 | 15,070,674 | ||||||
End of period | $ | 11,359,291 | $ | 12,314,491 | ||||
CAPITAL SHARE ACTIVITY | ||||||||
Shares sold | 15,681 | 95,575 | ||||||
Shares redeemed | (127,361 | ) | (409,663 | ) | ||||
Net decrease in shares outstanding | (111,680 | ) | (314,088 | ) | ||||
Shares outstanding at beginning of period | 1,451,947 | 1,766,035 | ||||||
Shares outstanding at end of period | 1,340,267 | 1,451,947 | ||||||
(a) | As of June 30, 2018, accumulated net investment loss was ($140,288). |
See accompanying notes to financial statements. | |
24
CUTLER EMERGING MARKETS FUND | ||||||||
| Six Months | Year | ||||||
FROM OPERATIONS | ||||||||
Net investment income | $ | 97,984 | $ | 111,957 | ||||
Net realized gains (losses) from: | ||||||||
Investment transactions | 28,232 | (57,515 | ) | |||||
Foreign currency transactions | (1,895 | ) | (1,155 | ) | ||||
Net change in unrealized appreciation (depreciation) on: | ||||||||
Investments | (1,078,957 | ) | 302,541 | |||||
Foreign currency translation | 541 | (197 | ) | |||||
Net increase (decrease) in net assets from operations | (954,095 | ) | 355,631 | |||||
DISTRIBUTIONS TO SHAREHOLDERS | (171,021 | ) | (116,500 | ) | ||||
CAPITAL SHARE TRANSACTIONS | ||||||||
Proceeds from shares sold | 829,885 | 3,604,397 | ||||||
Net asset value of shares issued in reinvestment of distributions to shareholders | 171,021 | 116,500 | ||||||
Payments for shares redeemed | (1,269,232 | ) | (2,118,397 | ) | ||||
Net increase (decrease) from capital share transactions | (268,326 | ) | 1,602,500 | |||||
TOTAL INCREASE (DECREASE) IN NET ASSETS | (1,393,442 | ) | 1,841,631 | |||||
NET ASSETS | ||||||||
Beginning of period | 13,953,374 | 12,111,743 | ||||||
End of period | $ | 12,559,932 | $ | 13,953,374 | ||||
CAPITAL SHARE ACTIVITY | ||||||||
Shares sold | 87,811 | 355,893 | ||||||
Shares reinvested | 19,346 | 11,708 | ||||||
Shares redeemed | (139,537 | ) | (203,910 | ) | ||||
Net increase (decrease) in shares outstanding | (32,380 | ) | 163,691 | |||||
Shares outstanding at beginning of period | 1,449,871 | 1,286,180 | ||||||
Shares outstanding at end of period | 1,417,491 | 1,449,871 | ||||||
(a) | The presentation of Distributions to Shareholders has been updated to reflect the changes prescribed in amendments to Regulations S-X, effective November 5, 2018 (Note 2). For the year ended June 30, 2018, distributions to shareholders from net investment income were $116,500. As of June 30, 2018, undistributed net investment income was $21,783. |
See accompanying notes to financial statements. | |
25
CUTLER EQUITY FUND | ||||||||||||||||||||||||
Per Share Data for a Share Outstanding Throughout Each Period | ||||||||||||||||||||||||
Six Months | Years Ended June 30, | |||||||||||||||||||||||
| (Unaudited) | 2018 | 2017 | 2016 | 2015 | 2014 | ||||||||||||||||||
Net asset value at beginning of period | $ | 19.82 | $ | 18.39 | $ | 17.15 | $ | 17.06 | $ | 17.33 | $ | 14.94 | ||||||||||||
Income (loss) from investment operations: | ||||||||||||||||||||||||
Net investment income | 0.16 | 0.28 | 0.28 | 0.30 | 0.25 | 0.22 | ||||||||||||||||||
Net realized and unrealized gains (losses) on investments | (0.77 | ) | 1.68 | 1.42 | 0.88 | 0.02 | 2.47 | |||||||||||||||||
Total from investment operations | (0.61 | ) | 1.96 | 1.70 | 1.18 | 0.27 | 2.69 | |||||||||||||||||
Less distributions from: | ||||||||||||||||||||||||
Net investment income | (0.17 | ) | (0.28 | ) | (0.29 | ) | (0.28 | ) | (0.25 | ) | (0.22 | ) | ||||||||||||
Net realized gains | (0.77 | ) | (0.25 | ) | (0.17 | ) | (0.81 | ) | (0.29 | ) | (0.08 | ) | ||||||||||||
Total distributions | (0.94 | ) | (0.53 | ) | (0.46 | ) | (1.09 | ) | (0.54 | ) | (0.30 | ) | ||||||||||||
Net asset value at end of period | $ | 18.27 | $ | 19.82 | $ | 18.39 | $ | 17.15 | $ | 17.06 | $ | 17.33 | ||||||||||||
Total return(a) | (3.15 | %)(b) | 10.63 | % | 9.97 | % | 7.40 | % | 1.49 | % | 18.13 | % | ||||||||||||
Net assets at end of period (000’s) | $ | 141,305 | $ | 150,597 | $ | 141,585 | $ | 132,136 | $ | 122,739 | $ | 122,230 | ||||||||||||
Ratios/supplementary data: | ||||||||||||||||||||||||
Ratio of net expenses to | 1.15 | %(c)(d) | 1.15 | %(d) | 1.14 | % | 1.15 | % | 1.15 | % | 1.15 | % | ||||||||||||
Ratio of net investment income to average net assets | 1.60 | %(c) | 1.41 | % | 1.54 | % | 1.79 | % | 1.42 | % | 1.37 | % | ||||||||||||
Portfolio turnover rate | 3 | %(b) | 10 | % | 5 | % | 11 | % | 14 | % | 8 | % | ||||||||||||
(a) | Total return is a measure of the change in value of an investment in the Fund over the period covered, which assumes any dividends or capital gains distributions are reinvested in shares of the Fund. Returns shown do not reflect the deduction of taxes a shareholder would pay on Fund distributions or the redemption of Fund shares. |
(b) | Not annualized. |
(c) | Annualized. |
(d) | Absent advisory fee reductions, the ratio of expenses to net assets would have been 1.16%(c)and 1.16% for the periods ended December 31, 2018 and June 30, 2018, respectively (Note 3). |
See accompanying notes to financial statements. | |
26
CUTLER FIXED INCOME FUND | ||||||||||||||||||||||||
Per Share Data for a Share Outstanding Throughout Each Period | ||||||||||||||||||||||||
Six Months | Years Ended June 30, | |||||||||||||||||||||||
| (Unaudited) | 2018 | 2017 | 2016 | 2015 | 2014 | ||||||||||||||||||
Net asset value at beginning of period | $ | 8.48 | $ | 8.53 | $ | 9.69 | $ | 10.18 | $ | 10.01 | $ | 9.98 | ||||||||||||
Income (loss) from investment operations: | ||||||||||||||||||||||||
Net investment income (loss) | 0.05 | (0.11 | ) | 0.25 | 0.79 | 0.49 | 0.05 | |||||||||||||||||
Net realized and unrealized gains (losses) on investments | (0.05 | ) | 0.06 | (0.72 | ) | (0.50 | ) | (0.12 | ) | 0.17 | ||||||||||||||
Total from investment operations | 0.00 | (0.05 | ) | (0.47 | ) | 0.29 | 0.37 | 0.22 | ||||||||||||||||
Less distributions from: | ||||||||||||||||||||||||
Net investment income | — | — | (0.69 | ) | (0.78 | ) | (0.20 | ) | (0.14 | ) | ||||||||||||||
Net realized gains | — | — | — | — | — | (0.05 | ) | |||||||||||||||||
Total distributions | — | — | (0.69 | ) | (0.78 | ) | (0.20 | ) | (0.19 | ) | ||||||||||||||
Net asset value at end of period | $ | 8.48 | $ | 8.48 | $ | 8.53 | $ | 9.69 | $ | 10.18 | $ | 10.01 | ||||||||||||
Total return(a) | 0.00 | %(b) | (0.59 | %) | (5.02 | %) | 2.91 | % | 3.65 | % | 2.26 | % | ||||||||||||
Net assets at end of period (000’s) | $ | 11,359 | $ | 12,314 | $ | 15,071 | $ | 18,289 | $ | 17,431 | $ | 14,941 | ||||||||||||
Ratios/supplementary data: | ||||||||||||||||||||||||
Ratio of net expenses to | 1.61 | %(c)(d) | 1.65 | %(d) | 1.46 | % | 1.36 | % | 1.41 | % | 1.52 | % | ||||||||||||
Ratio of net investment income (loss) to average net assets | 1.01 | %(c)(e) | (1.04 | %)(e) | 2.91 | %(e) | 8.42 | %(e) | 4.95 | %(e) | 0.61 | % | ||||||||||||
Portfolio turnover rate | 11 | %(b) | 36 | % | 24 | % | 71 | % | 85 | % | 55 | % | ||||||||||||
(a) | Total return is a measure of the change in value of an investment in the Fund over the period covered, which assumes any dividends or capital gains distributions are reinvested in shares of the Fund. Returns shown do not reflect the deduction of taxes a shareholder would pay on Fund distributions or the redemption of Fund shares. |
(b) | Not annualized. |
(c) | Annualized. |
(d) | Ratio was determined after voluntary advisory fee waivers by the Adviser. If such fee waivers had not occurred, the ratio would have been 1.79%(c) and 1.65% for the periods ended December 31, 2018 and June 30, 2018, respectively (Note 3). |
(e) | Ratio includes income from prepayment penalties received for IO securities of 0.91%(c), 3.75%, 11.29%, 6.90% and 4.57% of average daily net assets for the periods ended December 31, 2018, June 30, 2018, 2017, 2016 and 2015, respectively (Note 7). |
See accompanying notes to financial statements. | |
27
CUTLER EMERGING MARKETS FUND | ||||||||||||||||
Per Share Data for a Share Outstanding Throughout Each Period | ||||||||||||||||
| Six Months | Year | Year | Period | ||||||||||||
Net asset value at beginning of period | $ | 9.62 | $ | 9.42 | $ | 8.38 | $ | 10.00 | ||||||||
Income (loss) from investment operations: | ||||||||||||||||
Net investment income | 0.07 | 0.07 | 0.06 | 0.10 | ||||||||||||
Net realized and unrealized gains (losses) on investments | (0.71 | ) | 0.21 | 1.03 | (1.65 | ) | ||||||||||
Total from investment operations | (0.64 | ) | 0.28 | 1.09 | (1.55 | ) | ||||||||||
Less distributions from: | ||||||||||||||||
Net investment income | (0.12 | ) | (0.08 | ) | (0.05 | ) | (0.07 | ) | ||||||||
Net asset value at end of period | $ | 8.86 | $ | 9.62 | $ | 9.42 | $ | 8.38 | ||||||||
Total return(b) | (6.68 | %)(c) | 2.95 | % | 13.14 | % | (15.43 | %)(c) | ||||||||
Net assets at end of period (000’s) | $ | 12,560 | $ | 13,953 | $ | 12,112 | $ | 8,128 | ||||||||
Ratios/supplementary data: | ||||||||||||||||
Ratio of total expenses to average net assets | 2.20 | %(e) | 2.07 | % | 2.60 | % | 3.85 | %(e) | ||||||||
Ratio of net expenses to average net assets(d) | 1.55 | %(e) | 1.55 | % | 1.56 | %(f) | 1.55 | %(e) | ||||||||
Ratio of net investment income to average net assets(d) | 1.43 | %(e) | 0.78 | % | 0.72 | % | 1.56 | %(e) | ||||||||
Portfolio turnover rate | 5 | %(c) | 2 | % | 15 | % | 10 | %(c) | ||||||||
(a) | Represents the period from the commencement of operations (July 2, 2015) through June 30, 2016. |
(b) | Total return is a measure of the change in value of an investment in the Fund over the period covered, which assumes any dividends or capital gains distributions are reinvested in shares of the Fund. Returns shown do not reflect the deduction of taxes a shareholder would pay on Fund distributions or the redemption of Fund shares. |
(c) | Not annualized. |
(d) | Ratio was determined after advisory fee reductions and expense reimbursements (Note 3). |
(e) | Annualized. |
(f) | Includes federal excise taxes of 0.01% of average net assets with respect to the year ended June 30, 2017. |
See accompanying notes to financial statements. | |
28
THE CUTLER TRUST
NOTES TO FINANCIAL STATEMENTS
December 31, 2018 (Unaudited)
1. Organization
Cutler Equity Fund, Cutler Fixed Income Fund and Cutler Emerging Markets Fund (individually, a “Fund” and collectively, the “Funds”) are each a diversified series of The Cutler Trust (the “Trust”). The Trust is a Delaware statutory trust that is registered as an open-end management investment company under the Investment Company Act of 1940, as amended (the “1940 Act”). Under its Trust Instrument, the Trust is authorized to issue an unlimited number of Fund shares of beneficial interest without par value.
Cutler Equity Fund seeks current income and long-term capital appreciation.
Cutler Fixed Income Fund seeks to achieve high income over the long-term.
Cutler Emerging Markets Fund seeks current income and long-term capital appreciation.
2. Significant Accounting Policies
In August 2018, the U.S. Securities and Exchange Commission (the “SEC”) adopted regulations that eliminated or amended disclosure requirements that were redundant or outdated in light of changes in SEC requirements, accounting principles generally accepted in the United States of America (“GAAP”), International Financial Reporting Standards or changes in technology or the business environment. These regulations were effective November 5, 2018, and the Funds are complying with them effective with these financial statements.
The Funds follow accounting and reporting guidance under Financial Accounting Standards Board (“FASB”) Accounting Standards Codification (“ASC”) Topic 946, “Financial Services – Investment Companies.” The following is a summary of significant accounting policies followed by the Funds. These policies are in conformity with GAAP.
New Accounting Pronouncements— In March 2017, FASB issued Accounting Standards Update No. 2017-08 (“ASU 2017-08”), “Receivables – Nonrefundable Fees and Other Costs (Subtopic 310-20): Premium Amortization on Purchased Callable Debt Securities.”ASU 2017-08 shortens the amortization period for certain callable debt securities, held at a premium, to be amortized to the earliest call date.ASU 2017-18 does not require an accounting change for securities held at a discount, which continues to accrete to maturity.ASU 2017-08 is effective for fiscal years and interim periods within those fiscal years beginning after December 15, 2018.Management is currently evaluating the impact, if any, of applying ASU 2017-08.
In August 2018, FASB issued Accounting Standards Update No. 2018-13 (“ASU 2018-13”), “Disclosure Framework – Changes to the Disclosure Requirements for Fair Value Measurement,” which amends the fair value measurement disclosure requirements of ASC Topic 820 (“ASC 820”), “Fair Value Measurement.” ASU 2018-13 includes new, eliminated, and modified disclosure requirements for ASC 820. In addition, ASU 2018-13 clarifies that materiality is an appropriate
29
THE CUTLER TRUST
NOTES TO FINANCIAL STATEMENTS (Continued)
consideration when evaluating disclosure requirements. ASU 2018-13 is effective for fiscal years beginning after December 15, 2019, including interim periods therein. Early adoption is permitted and the Funds have adopted ASU 2018-13 with these financial statements.
Securities Valuation — Portfolio securities are valued as of the close of regular trading on the New York Stock Exchange (“NYSE”) (normally, 4:00 p.m., Eastern time) on each day the NYSE is open. Exchange traded securities are valued using the last reported sales price on the exchanges on which they are primarily traded. When using the last sales price and when the market is considered to be active, the security will be classified within Level 1 of the fair value hierarchy (see below). In the absence of a sale, such securities are valued at the mean of the last bid and asked price. Securities which are quoted by NASDAQ are valued at the NASDAQ Official Closing Price. Securities principally traded in non-U.S. markets that may close at different times than U.S. markets are typically fair valued by an independent pricing service and translated from the local currency into U.S. dollars using currency exchange rates supplied by an independent pricing quotation service. Non-exchange traded securities for which over-the-counter quotations are available are generally valued at the closing bid price. Fixed income securities are generally valued using prices provided by an independent pricing service. The independent pricing service uses information with respect to transactions in bonds, quotations from bond dealers, market transactions in comparable securities, and various relationships between securities in determining the prices. Investments in shares of other open-end investment companies are valued at their net asset value (“NAV”) as reported by such companies.
The Funds value securities at fair value pursuant to procedures adopted by the Trust’s Board of Trustees (the “Board”) if (1) market quotations are insufficient or not readily available or (2) the Funds’ investment adviser believes that the prices or values available are unreliable due to, among other things, the occurrence of events after the close of the securities markets on which the Funds’ securities primarily trade but before the time as of which the Funds calculate their NAVs. In instances where the investment adviser believes that the prices received from the independent pricing service are unreliable, proprietary valuation models may be used that consider benchmark yield curves, estimated default rates, coupon rates, anticipated timing of principal repayments and other unique security features to estimate the relevant cash flows, which are discounted to calculate the fair values. Fair valued securities will be classified as Level 2 or 3 within the fair value hierarchy, depending on the inputs used.
The Board approves the independent pricing services used by the Funds.
GAAP establishes a single authoritative definition of fair value, sets out a framework for measuring fair value and requires disclosures about fair value measurements.
30
THE CUTLER TRUST
NOTES TO FINANCIAL STATEMENTS (Continued)
Various inputs are used in determining the value of each Fund’s investments. These inputs are summarized in the three broad levels listed below:
● | Level 1 – quoted unadjusted prices for identical instruments in active markets to which the Fund has access at the date of measurement. |
● | Level 2 – quoted prices for similar instruments in active markets; quoted prices for identical or similar instruments in markets that are not active; and model derived valuations in which all significant inputs and significant value drivers are observable. Level 2 inputs are those in markets for which there are few transactions, the prices are not current, little public information exists or instances where prices vary substantially over time or among brokered market makers. |
● | Level 3 – model derived valuations in which one or more significant inputs or significant value drivers are unobservable. Unobservable inputs are those inputs that reflect the Fund’s own assumptions that market participants would use to price the asset or liability based on the best available information. |
Fixed income securities held by Cutler Fixed Income Fund are classified as Level 2 because the values for the fixed income securities are based on prices that utilize various “other significant observable inputs” including bid and ask quotations, prices of similar securities and interest rates, among other factors.
Securities of Cutler Emerging Markets Fund traded in foreign markets may be classified as Level 2 despite the availability of closing prices because such securities are typically fair valued by an independent pricing service approved by the Board. These foreign securities may be priced at their fair value because the value of the securities may be materially affected by events occurring before the Fund’s pricing time but after the close of the primary markets or exchanges on which such foreign securities are traded. These intervening events might be country-specific (e.g., natural disaster, economic or political developments, interest rate change); issuer-specific (e.g., earnings report, merger announcement); or U.S. markets-specific (such as a significant movement in the U.S. markets that is deemed to affect the value of foreign securities). The pricing service uses an automated system incorporating a model based on multiple parameters, including a security’s local closing price, relevant general and sector indices, currency fluctuations, trading in depositary receipts and futures, if applicable, and/or research valuations by its staff, in determining what it believes is the fair value of the securities.
The inputs or methodology used for valuing securities are not necessarily an indication of the risks associated with investing in those securities. The inputs used to measure fair value may fall into different levels of the fair value hierarchy. In such cases, for disclosure purposes, the level in the fair value hierarchy within which the fair value measurement falls in its entirety is determined based on the lowest level input that is significant to the fair value measurement.
31
THE CUTLER TRUST
NOTES TO FINANCIAL STATEMENTS (Continued)
The following is a summary of the inputs used to value each Fund’s investments as of December 31, 2018 by security type:
Cutler Equity Fund | Level 1 | Level 2 | Level 3 | Total | ||||||||||||
Common Stocks | $ | 138,309,004 | $ | — | $ | — | $ | 138,309,004 | ||||||||
Money Market Funds | 2,859,331 | — | — | 2,859,331 | ||||||||||||
Total | $ | 141,168,335 | $ | — | $ | — | $ | 141,168,335 | ||||||||
Cutler Fixed Income Fund | Level 1 | Level 2 | Level 3 | Total | ||||||||||||
U.S. Treasury Obligations | $ | — | $ | 3,472,059 | $ | — | $ | 3,472,059 | ||||||||
U.S. Government Agency Obligations | — | 5,486,536 | — | 5,486,536 | ||||||||||||
Mortgage-Backed Securities | — | 478,697 | — | 478,697 | ||||||||||||
Corporate Bonds | — | 1,721,995 | — | 1,721,995 | ||||||||||||
Money Market Funds | 150,404 | — | — | 150,404 | ||||||||||||
Total | $ | 150,404 | $ | 11,159,287 | $ | — | $ | 11,309,691 | ||||||||
Cutler Emerging Markets Fund | Level 1 | Level 2 | Level 3 | Total | ||||||||||||
Common Stocks | $ | 3,199,283 | $ | 5,777,582 | $ | — | $ | 8,976,865 | ||||||||
Preferred Stocks | 835,855 | — | — | 835,855 | ||||||||||||
Exchange-Traded Funds | 2,340,714 | — | — | 2,340,714 | ||||||||||||
Money Market Funds | 345,644 | — | — | 345,644 | ||||||||||||
Total | $ | 6,739,496 | $ | 5,777,582 | $ | — | $ | 12,517,078 | ||||||||
Refer to each Fund’s Schedule of Investments for a listing of the securities by security type and sector or industry type. There were no Level 3 securities held by the Funds as of December 31, 2018.
Share valuation — The NAV per share of each Fund is calculated daily by dividing the total value of its assets, less liabilities, by the number of shares outstanding. The offering price and redemption price per share of each Fund is equal to its NAV per share.
Common Expenses— Expenses of the Trust not attributable solely to one of the Funds are allocated among the Funds based on relative net assets of each Fund or the nature of the expense and the relative applicability to each Fund.
32
THE CUTLER TRUST
NOTES TO FINANCIAL STATEMENTS (Continued)
Estimates — The preparation of financial statements in conformity with GAAP requires management to make estimates and assumptions that affect the reported amounts of assets and liabilities and disclosures of contingent assets and liabilities at the date of the financial statements and the reported amounts of increases and decreases in net assets from operations during the reporting period. Actual results could differ from those estimates.
Investment Transactions, Investment Income and Realized Gains and Losses — Investment transactions are accounted for on trade date. Dividend income is recorded on the ex-dividend date. Interest income is recorded as earned and prepayment fee income, if any, is recorded upon receipt of such income, as that is when information surrounding these transactions become known. Discounts and premiums on fixed income securities are amortized using the effective interest method over the estimated lives of the securities. Realized gains and losses on investments sold are determined on a specific identification basis. Withholding taxes on foreign dividends and foreign capital gains taxes, when applicable, have been recorded in accordance with the Trust’s understanding of the applicable country’s tax rules and rates.
Foreign Currency Translation — Assets and securities denominated in or expected to settle in foreign currencies are translated into U.S. dollars based on exchange rates on the following basis:
A. | The values of investment securities and other assets and liabilities are translated as of the close of the NYSE each day. |
B. | Purchases and sales of investment securities and income and expenses are translated at the rate of exchange prevailing as of 4:00 p.m. on the respective date of such transactions. |
C. | The Funds do not isolate that portion of the results of operations caused by fluctuations in foreign exchange rates on investments from those caused by changes in market prices of securities held. Such fluctuations are included with the net realized and unrealized gains or losses on investments. |
Reported net realized foreign exchange gains or losses arise from: (1) purchases and sales of foreign currencies; (2) currency gains or losses realized between the trade and settlement dates on securities transactions; and (3) the difference between the amounts of dividends, interest and foreign withholding taxes recorded on the Fund’s books and the U.S. dollar equivalent of the amounts actually received or paid. Reported net unrealized foreign exchange gains and losses arise from changes in the value of assets and liabilities, excluding changes in foreign exchange rates on investments as discussed in Note 2. C. above, that result from changes in exchange rates.
Distributions to Shareholders — Dividends from net investment income, if any, are declared and paid quarterly to shareholders of Cutler Equity Fund and Cutler Fixed Income Fund and are declared and paid annually to shareholders of Cutler Emerging Markets Fund. Capital gain distributions, if any, are distributed to shareholders annually. Distributions are based on amounts calculated in accordance with applicable federal income tax regulations, which may differ from GAAP. These differences are due primarily to differing treatments of income and gains on various investment securities held by the Funds, timing differences and differing characterizations of
33
THE CUTLER TRUST
NOTES TO FINANCIAL STATEMENTS (Continued)
distributions made by the Funds. Dividends and distributions are recorded on the ex-dividend date. The tax character of distributions paid by the Funds during the periods ended December 31, 2018 and June 30, 2018 was as follows:
| Period | Ordinary | Long-Term | Total | ||||||||||||
Cutler Equity Fund | 12/31/2018 | $ | 1,243,956 | $ | 5,703,795 | $ | 6,947,751 | |||||||||
| 6/30/2018 | $ | 2,123,374 | $ | 1,915,091 | $ | 4,038,465 | ||||||||||
Cutler Emerging Markets Fund | 12/31/2018 | $ | 171,021 | $ | — | $ | 171,021 | |||||||||
| 6/30/2018 | $ | 157,460 | $ | — | $ | 157,460 | ||||||||||
Cutler Fixed Income Fund did not pay any distributions during the periods ended December 31, 2018 and June 30, 2018.
Federal income tax — Each Fund has qualified and intends to continue to qualify each year as a “regulated investment company” under Subchapter M of the Internal Revenue Code of 1986, as amended (the “Code”). By so qualifying, the Funds will not be subject to federal income taxes to the extent that they distribute their net investment income and any net realized capital gains in accordance with the Code.
In order to avoid imposition of the excise tax applicable to regulated investment companies, it is also each Fund’s intention to declare as dividends in each calendar year at least 98% of its net investment income (earned during the calendar year) and 98.2% of its net realized capital gains (earned during the twelve months ended October 31) plus undistributed amounts from prior years.
The following information is computed on a tax basis for each item as of December 31, 2018:
| Cutler Equity | Cutler Fixed | Cutler | |||||||||
Tax cost of portfolio investments | $ | 97,824,102 | $ | 11,986,495 | $ | 12,171,262 | ||||||
Gross unrealized appreciation | $ | 48,212,467 | $ | 39,056 | $ | 1,299,669 | ||||||
Gross unrealized depreciation | (4,868,234 | ) | (715,860 | ) | (953,853 | ) | ||||||
Net unrealized appreciation (depreciation) on investments | 43,344,233 | (676,804 | ) | 345,816 | ||||||||
Accumulated ordinary income (loss) | 8,398 | (21,891 | ) | (31,355 | ) | |||||||
Capital loss carryforwards | — | (1,971,173 | ) | (201,628 | ) | |||||||
Other gains (losses) | 408,168 | (350,432 | ) | 28,233 | ||||||||
Accumulated earnings (deficit) | $ | 43,760,799 | $ | (3,020,300 | ) | $ | 141,066 | |||||
34
THE CUTLER TRUST
NOTES TO FINANCIAL STATEMENTS (Continued)
The difference between the federal income tax cost of portfolio investments and the financial statement cost for each Fund is due to certain differences in the recognition of capital gains and losses under income tax regulations and GAAP. These “book/tax” differences are temporary in nature and are related to losses deferred due to wash sales for Cutler Equity Fund, losses deferred due to wash sales and amortization of bond premiums and discounts for Cutler Fixed Income Fund and losses deferred due to wash sales and holdings classified as passive foreign investment companies (PFICs) for Cutler Emerging Markets Fund.
As of June 30, 2018, Cutler Fixed Income Fund had short-term and long-term capital loss carryforwards, with no expiration date, of $296,359 and $1,674,814, respectively. As of June 30, 2018, Cutler Emerging Markets Fund had short-term and long-term capital loss carryforwards, with no expiration date, of $103,849 and $97,779, respectively. These capital loss carryforwards may be utilized in the current and future years to offset net realized capital gains, if any, prior to distributing such gains to shareholders.
The Funds recognize the tax benefits or expenses of uncertain tax positions only when the position is “more-likely-than-not” to be sustained assuming examination by tax authorities. Management has reviewed the tax positions taken on Federal income tax returns for the current and all open tax years (generally, three years) and has concluded that no provision for unrecognized tax benefits or expenses is required in these financial statements.
3. Transactions with Related Parties
Investment Adviser— Cutler Investment Counsel, LLC (the “Adviser”) is the investment adviser to the Funds. Pursuant to Investment Advisory Agreements, Cutler Equity Fund, Cutler Fixed Income Fund and Cutler Emerging Markets Fund pay the Adviser a fee, which is accrued daily and paid monthly, at an annual rate of 0.75%, 0.50% and 0.85%, respectively, of average daily net assets.
The Adviser has entered into an Expense Limitation Agreement under which it has contractually agreed, until October 31, 2019, to reduce its advisory fees and to pay the ordinary operating expenses of Cutler Equity Fund and Cutler Emerging Markets Fund to the extent necessary to limit annual ordinary operating expenses to 1.15% and 1.55%, respectively, of average daily net assets. (Ordinary operating expenses exclude brokerage costs, taxes, interest, acquired fund fees and expenses and extraordinary expenses.) Any such fee reductions by the Adviser, or payments by the Adviser of expenses which are the Funds’ obligation, are subject to repayment by the Funds, provided that the repayment does not cause the ordinary operating expenses of Cutler Equity Fund and Cutler Emerging Markets Fund to exceed the annual expense limit of 1.15% and 1.55%, respectively, and provided further that the fees and expenses which are the subject of the repayment were incurred within three years of the repayment. During the period ended December 31, 2018, the Adviser reduced its advisory fees by $8,025 and $44,315 for Cutler Equity Fund
35
THE CUTLER TRUST
NOTES TO FINANCIAL STATEMENTS (Continued)
and Cutler Emerging Markets Fund, respectively. During the period ended December 31, 2018, the Adviser voluntarily waived $10,771 of its investment advisory fees from Cutler Fixed Income Fund. This amount is not subject to recapture in future periods.
As of December 31, 2018, the Adviser may seek repayment of investment advisory fee reductions and expense reimbursements no later than the dates as stated below:
| June 30, | June 30, | June 30, | December 31, | Total | |||||||||||||||
Cutler Equity Fund | $ | — | $ | — | $ | 12,154 | $ | 8,025 | $ | 20,179 | ||||||||||
Cutler Emerging Markets Fund | 56,290 | 100,955 | 74,399 | 44,315 | 275,959 | |||||||||||||||
Certain officers of the Trust are also officers of the Adviser.
Other Service Providers — Ultimus Fund Solutions, LLC (“Ultimus”) provides administration, fund accounting and transfer agency services to the Funds. Each Fund pays Ultimus fees in accordance with the agreements for such services. In addition, the Funds pay out of-pocket expenses including, but not limited to, postage, supplies and costs of pricing the Funds’ portfolio securities. Certain officers of the Trust are also officers of Ultimus, or of Ultimus Fund Distributors, LLC (the “Distributor”), the principal underwriter of the Funds. The Distributor is a wholly-owned subsidiary of Ultimus.
Compensation of Trustees — Trustees and officers affiliated with the Adviser or Ultimus are not compensated by the Trust for their services. Each Trustee who is not an affiliated person of the Adviser or Ultimus receives from the Trust an annual retainer of $7,500, payable quarterly, plus a fee of $1,250 for attendance at each meeting of the Board, in addition to reimbursement of travel and other expenses incurred in attending the meetings.
4. Shareholder Service Plan
Each Fund may pay shareholder servicing fees not to exceed an annual rate of 0.25% of its average daily net assets. These fees may be paid to various financial institutions that provide shareholder and account maintenance services. During the period ended December 31, 2018, Cutler Equity Fund, Cutler Fixed Income Fund and Cutler Emerging Markets Fund paid $109,863, $1 and $0, respectively, for such services.
5. Securities Transactions
During the period ended December 31, 2018, cost of purchases and proceeds from sales and maturities of investment securities, other than short-term investments and U.S. government securities, totaled $4,029,586 and $9,563,534, respectively, for Cutler Equity Fund; $294,997
36
THE CUTLER TRUST
NOTES TO FINANCIAL STATEMENTS (Continued)
and $1,399,030, respectively, for Cutler Fixed Income Fund; and $607,989 and $755,073, respectively, for Cutler Emerging Markets Fund. During the period ended December 31, 2018, cost of purchases and proceeds from sales and maturities of U.S. government securities totaled $972,344 and $7,251, respectively, for Cutler Fixed Income Fund.
6. Contingencies and Commitments
The Funds indemnify the Trust’s officers and Trustees for certain liabilities that might arise from their performance of their duties to the Funds. Additionally, in the normal course of business the Funds enter into contracts that contain a variety of representations and warranties and which provide general indemnifications. The Funds’ maximum exposure under these arrangements is unknown, as this would involve future claims that may be made against the Funds that have not yet occurred. However, based on experience, the Trust expects the risk of loss to be remote.
7. Risks Associated with Mortgage-Backed Securities
Cutler Fixed Income Fund invests in mortgage-backed securities, which are subject to default risk and prepayment risk, especially when interest rates decline. Prepayment risk is the risk that the principal on mortgage-backed securities may be prepaid at any time, which could reduce yield and market value. This could reduce the effective maturity of a mortgage-backed security and cause the Fund to reinvest its assets at a lower prevailing interest rate. Mortgage-backed securities are also subject to extension risk, which is the risk that rising interest rates will increase the effective maturity of mortgage-backed securities due to the deceleration of prepayments. Mortgage-backed securities may also be subject to risks unique to the housing industry, including mortgage lending practices, defaults, foreclosures and changes in real estate values.
Stripped Mortgage-Backed Securities (“SMBS”) are derivative multi-class mortgage-backed securities. SMBS are usually structured with two classes that receive different proportions of the interest and principal distributions on a pool of mortgage assets. An SMBS will have one class that will receive all of the interest (the interest-only or “IO” class), while the other class will receive the entire principal (the principal-only or “PO” class). IOs are more volatile and sensitive to the rate of prepayments than other types of mortgage-backed securities, and their value can fall dramatically in response to rapid or unexpected changes in the mortgage, interest rate or economic environment. As of December 31, 2018, 3.3% of the value of Cutler Fixed Income Fund’s net assets were invested in IO classes of various SMBS. Payments received from IOs are included in interest income on the Fund’s Statement of Operations. Because no principal will be received at the maturity of an IO, adjustments are made to the cost of the security on a monthly basis until maturity. These adjustments are included in interest income on the Fund’s Statement of Operations. Additionally, any prepayment penalties received from an IO are included in interest income on the Fund’s Statement of Operations. During the period ended December 31, 2018, $53,550 of prepayment penalties on IOs was received by Cutler Fixed Income Fund.
37
THE CUTLER TRUST
NOTES TO FINANCIAL STATEMENTS (Continued)
8. Risks Associated with Emerging Markets
In seeking to meet its investment objective, under normal conditions, at least 80% of Cutler Emerging Markets Fund’s assets will be invested in a diversified portfolio of securities of issuers whose principal activities are in, or economically tied to, emerging markets countries selected in accordance with the Adviser’s long standing dividend focused investment philosophy. Accordingly, Cutler Emerging Markets Fund is subject to the following investment risks:
Foreign Investment Risk — Investments in foreign securities involve different risks than U.S. investments, including fluctuations in currency exchange rates, potentially unstable political and economic structures, less efficient trade settlement practices, reduced availability of public information, and lack of uniform financial reporting and regulatory practices similar to those that apply to U.S. issuers. Foreign stock markets may also be less liquid and more volatile than U.S. stock markets.
Emerging Markets Risk— The economies of emerging market countries may be more dependent on relatively few industries that may be highly vulnerable to local and global changes. The governments of emerging market countries may be less stable than the governments of more developed countries. Countries in the emerging markets generally have less developed securities markets or exchanges, and less developed legal and accounting systems, reduced availability of public information, and lack of uniform financial reporting and regulatory practices, which in turn may adversely impact Cutler Emerging Markets Fund’s ability to calculate accurately the intrinsic value of the securities. Securities of emerging market companies may be less liquid and more volatile than securities in countries with more mature markets. The value of emerging market currencies may fluctuate more than the currencies of countries with more mature markets. Investments in emerging market countries may be subject to greater risks of government restrictions, including confiscatory taxation, expropriation or nationalization of a company’s assets, restrictions on foreign ownership of local companies and restrictions on withdrawing assets from the country. Investments in securities of issuers in emerging market countries may be considered speculative and higher risk.
Currency Risk — Because Cutler Emerging Markets Fund holds securities valued in foreign currencies and holds foreign currencies when it purchases and sells foreign securities, changes in exchange rates will impact the value of the Fund’s assets. Thus, investments in foreign securities involve currency risk, which is the risk that the values of the foreign securities and other assets denominated in foreign currencies will decrease due to adverse changes in the value of the U.S. dollar relative to the value of foreign currencies.
38
THE CUTLER TRUST
NOTES TO FINANCIAL STATEMENTS (Continued)
9. Subsequent Events
The Funds are required to recognize in the financial statements the effects of all subsequent events that provide additional evidence about conditions that existed as of the date of the Statements of Assets and Liabilities. For non-recognized subsequent events that must be disclosed to keep the financial statements from being misleading, the Funds are required to disclose the nature of the event as well as an estimate of its financial effect, or a statement that such an estimate cannot be made. Management has evaluated subsequent events through the issuance of these financial statements and has noted no such events.
39
THE CUTLER TRUST
ABOUT YOUR FUND’S EXPENSES (Unaudited)
We believe it is important for you to understand the impact of costs on your investment. All mutual funds have operating expenses. As a shareholder of the Funds, you incur ongoing costs, including management fees and other operating expenses. These ongoing costs, which are deducted from each Fund’s gross income, directly reduce the investment return of the Funds.
A mutual fund’s ongoing costs are expressed as a percentage of its average net assets. This figure is known as the expense ratio. The following examples are intended to help you understand the ongoing costs (in dollars) of investing in the Funds and to compare these costs with the ongoing costs of investing in other mutual funds. The examples below are based on an investment of $1,000 made at the beginning of the period shown and held for the entire period (July 1, 2018 through December 31, 2018).
The table below illustrates each Fund’s ongoing costs in two ways:
Actual fund return – This section helps you to estimate the actual expenses that you paid over the period. The “Ending Account Value” shown is derived from each Fund’s actual return, and the fourth column shows the dollar amount of operating expenses that would have been paid by an investor who started with $1,000 in the Funds. You may use the information here, together with the amount you invested, to estimate the expenses that you paid over the period.
To do so, simply divide your account value by $1,000 (for example, an $8,600 account value divided by $1,000 = 8.6), then multiply the result by the number given for the Funds under the heading “Expenses Paid During Period.”
Hypothetical 5% return – This section is intended to help you compare the Funds’ ongoing costs with those of other mutual funds. It assumes that each Fund had an annual return of 5% before expenses during the period shown, but that the expense ratio is unchanged. In this case, because the returns used are not the Funds’ actual returns, the results do not apply to your investment. The example is useful in making comparisons because the SEC requires all mutual funds to calculate expenses based on a 5% return. You can assess each Fund’s ongoing costs by comparing this hypothetical example with the hypothetical examples that appear in shareholder reports of other funds.
Note that expenses shown in the table are meant to highlight and help you compare ongoing costs only. The Funds do not charge transaction fees, such as purchase or redemption fees, nor do they impose any sales loads.
The calculations assume no shares were bought or sold during the period. Your actual costs may have been higher or lower, depending on the amount of your investment and the timing of any purchases or redemptions.
40
THE CUTLER TRUST
ABOUT YOUR FUND’S EXPENSES (Unaudited) (Continued)
More information about the Funds’ expenses, including annual expense ratios for the past five fiscal years, can be found in this report. For additional information on operating expenses and other shareholder costs, please refer to each Fund’s prospectus.
| Beginning | Ending | Net | Expenses |
Cutler Equity Fund | ||||
Based on Actual | $ 1,000.00 | $ 968.50 | 1.15% | $ 5.71 |
Based on Hypothetical 5% Return (before expenses) | $ 1,000.00 | $ 1,019.41 | 1.15% | $ 5.85 |
Cutler Fixed Income Fund | ||||
Based on Actual | $ 1,000.00 | $ 1,000.00 | 1.61% | $ 8.12 |
Based on Hypothetical 5% Return (before expenses) | $ 1,000.00 | $ 1,017.09 | 1.61% | $ 8.19 |
Cutler Emerging Markets Fund | ||||
Based on Actual | $ 1,000.00 | $ 933.20 | 1.55% | $ 7.55 |
Based on Hypothetical 5% Return (before expenses) | $ 1,000.00 | $ 1,017.39 | 1.55% | $ 7.88 |
(a) | Annualized, based on each Fund’s most recent one-half year expenses. |
(b) | Expenses are equal to each Fund’s annualized expense ratio multiplied by the average account value over the period, muliplied by 184/365 (to reflect the one-half year period). |
41
THE CUTLER TRUST
ADDITIONAL INFORMATION (Unaudited)
Proxy Voting Information
A description of the policies and procedures that the Funds use to determine how to vote proxies relating to securities held in the Funds’ portfolios is available without charge, upon request, by calling 1-800-228-8537 or on the SEC’s website at http://www.sec.gov. Information regarding how the Funds voted proxies relating to portfolio securities during the most recent 12-month period ended June 30 is also available without charge upon request by calling 1-800-228-8537 or on the SEC’s website at http://www.sec.gov.
Form N-Q Information
The Trust files a complete listing of the Funds’ portfolio holdings with the SEC as of the end of the first and third quarters of each fiscal year on Form N-Q. The filings are available without charge, upon request, by calling 1-800-228-8537. Furthermore, you may obtain a copy of the filings on the SEC’s website at http://www.sec.gov.
42
Rev. August 2010
Privacy Notice |
FACTS | WHAT DOES THE CUTLER TRUST DO WITH YOUR PERSONAL INFORMATION? | ||
Why? | Financial companies choose how they share your personal information. Federal law gives consumers the right to limit some but not all sharing. Federal law also requires us to tell you how we collect, share, and protect your personal information. Please read this notice carefully to understand what we do. | ||
What? | The types of personal information we collect and share depend on the product or service you have with us. This information can include: ■ Social Security number ■ Assets ■ Retirement Assets ■ Transaction History ■ Checking Account Information ■ Purchase History ■ Account Balances ■ Account Transactions ■ Wire Transfer Instructions
When you areno longer our customer, we continue to share your information as described in this notice. | ||
How? | All financial companies need to share your personal information to run their everyday business. In the section below, we list the reasons financial companies can share their customers’ personal information; the reasons The Cutler Trust chooses to share; and whether you can limit this sharing. | ||
Reasons we can share your personal information | Does The Cutler Trust share? | Can you limit this sharing? | |
For our everyday business purposes – Such as to process your transactions, maintain your account(s), respond to court orders and legal investigations, or report to credit bureaus | Yes | No | |
For our marketing purposes – to offer our products and services to you | No | We don’t share | |
For joint marketing with other financial companies | No | We don’t share | |
For our affiliates’ everyday business purposes – information about your transactions and experiences | No | We don’t share | |
For our affiliates’ everyday business purposes – information about your creditworthiness | No | We don’t share | |
For nonaffiliates to market to you | No | We don’t share | |
Questions? | Call 1-888-288-5374 | ||
43
Who we are | |
Who is providing this notice? | The Cutler Trust Ultimus Fund Distributors, LLC (Distributor) Ultimus Fund Solutions, LLC (Administrator) |
What we do | |
How does The Cutler Trust protect my personal information? | To protect your personal information from unauthorized access and use, we use security measures that comply with federal law. These measures include computer safeguards and secured files and buildings. Our service providers are held accountable for adhering to strict policies and procedures to prevent any misuse of your nonpublic personal information. |
How does The Cutler Trust collect my personal information? | We collect your personal information, for example, when you ■ Open an account ■ Provide account information ■ Give us your contact information ■ Make deposits or withdrawals from your account ■ Make a wire transfer ■ Tell us where to send the money ■ Tell us who receives the money ■ Show your government-issued ID ■ Show your driver’s license
We also collect your personal information from other companies. |
Why can’t I limit all sharing? | Federal law gives you the right to limit only ■ Sharing for affiliates’ everyday business purposes – information about your creditworthiness ■ Affiliates from using your information to market to you ■ Sharing for nonaffiliates to market to you
State laws and individual companies may give you additional rights to limit sharing. |
Definitions | |
Affiliates | Companies related by common ownership or control. They can be financial and nonfinancial companies. ■Cutler Investment Counsel, LLC, the investment adviser to The Cutler Trust, could be deemed to be an affiliate. |
Nonaffiliates | Companies not related by common ownership or control. They can be financial and nonfinancial companies ■The Cutler Trust does not share with nonaffiliates so they can market to you. |
Joint marketing | A formal agreement between nonaffiliated financial companies that together market financial products or services to you. ■The Cutler Trust does not jointly market. |
44
This page intentionally left blank.
CUTLER INVESTMENT COUNSEL, LLC
INVESTMENT ADVISER TO THE TRUST
525 Bigham Knoll
Jacksonville, OR 97530
(800)228-8537 ● (541)770-9000
Fax:(541)779-0006
info@cutler.com
| Item 2. | Code of Ethics. |
Not required
| Item 3. | Audit Committee Financial Expert. |
Not required
| Item 4. | Principal Accountant Fees and Services. |
Not required
| Item 5. | Audit Committee of Listed Registrants. |
Not applicable
| Item 6. | Schedule of Investments. |
(a) Not applicable [schedule filed with Item 1]
(b) Not applicable
| Item 7. | Disclosure of Proxy Voting Policies and Procedures for Closed-End Management Investment Companies. |
Not applicable
| Item 8. | Portfolio Managers of Closed-End Management Investment Companies. |
Not applicable
| Item 9. | Purchases of Equity Securities by Closed-End Management Investment Company and Affiliated Purchasers. |
Not applicable
| Item 10. | Submission of Matters to a Vote of Security Holders. |
The registrant has not adopted procedures by which shareholders may recommend nominees to the registrant’s board of trustees.
| Item 11. | Controls and Procedures. |
(a) Based on their evaluation of the registrant’s disclosure controls and procedures (as defined in Rule 30a-3(c) under the Investment Company Act of 1940) as of a date within 90 days of the filing date of this report, the registrant’s principal executive officer and principal financial officer have concluded that such disclosure controls and procedures are reasonably designed and are operating effectively to ensure that material information relating to the registrant, including its consolidated subsidiaries, is made known to them by others within those entities, particularly during the period in which this report is being prepared, and that the information required in filings on Form N-CSR is recorded, processed, summarized, and reported on a timely basis.
(b) There were no changes in the registrant’s internal control over financial reporting (as defined in Rule 30a-3(d) under the Investment Company Act of 1940) that occurred during the second fiscal quarter of the period covered by this report that have materially affected, or are reasonably likely to materially affect, the registrant’s internal control over financial reporting.
| Item 12. | Disclosure of Securities Lending Activities for Closed-End Management Investment Companies. |
Not applicable
| Item 13. | Exhibits. |
File the exhibits listed below as part of this Form. Letter or number the exhibits in the sequence indicated.
(a)(1) Any code of ethics, or amendment thereto, that is the subject of the disclosure required by Item 2, to the extent that the registrant intends to satisfy the Item 2 requirements through filing of an exhibit: Not required
(a)(2) A separate certification for each principal executive officer and principal financial officer of the registrant as required by Rule 30a-2(a) under the Act (17 CFR 270.30a-2(a)): Attached hereto
(a)(3) Any written solicitation to purchase securities under Rule 23c-1 under the Act (17 CFR 270.23c-1) sent or given during the period covered by the report by or on behalf of the registrant to 10 or more persons: Not applicable
(a)(4) Change in the registrant’s independent public accountants. Not applicable
(b) Certifications required by Rule 30a-2(b) under the Act (17 CFR 270.30a-2(b)): Attached hereto
| Exhibit 99.CERT | Certifications required by Rule 30a-2(a) under the Act |
| Exhibit 99.906CERT | Certifications required by Rule 30a-2(b) under the Act |
SIGNATURES
Pursuant to the requirements of the Securities Exchange Act of 1934 and the Investment Company Act of 1940, the registrant has duly caused this report to be signed on its behalf by the undersigned, thereunto duly authorized.
| (Registrant) | The Cutler Trust |
| By (Signature and Title)* | /s/ Erich M. Patten | ||
| Erich M. Patten, President | |||
| Date | March 6, 2019 | ||
Pursuant to the requirements of the Securities Exchange Act of 1934 and the Investment Company Act of 1940, this report has been signed below by the following persons on behalf of the registrant and in the capacities and on the dates indicated.
| By (Signature and Title)* | /s/ Erich M. Patten | ||
| Erich M. Patten, President | |||
| Date | March 6, 2019 | ||
| By (Signature and Title)* | /s/ Matthew C. Patten | ||
| Matthew C. Patten, Treasurer, Principal Financial Officer and Principal Accounting Officer | |||
| Date | March 6, 2019 | ||
| * | Print the name and title of each signing officer under his or her signature. |