UNITED STATES
SECURITIES AND EXCHANGE COMMISSION
WASHINGTON, D. C. 20549
Form 10-Q
| x | QUARTERLY REPORT PURSUANT TO SECTION 13 OR 15 (d) OF THE SECURITIES EXCHANGE ACT OF 1934 |
For the quarterly period ended September 30, 2007
| o | TRANSITION REPORT PURSUANT TO SECTION 13 OR 15 (d) OF THE SECURITIES EXCHANGE ACT OF 1934 |
For the transition period from ____________ to _____________
Commission file number: 0-11576
HARRIS & HARRIS GROUP, INC.
(Exact Name of Registrant as Specified in Its Charter)
New York | 13-3119827 | |
| (State or Other Jurisdiction of | (I.R.S. Employer Identification No.) | |
| Incorporation or Organization) | ||
111 West 57th Street, New York, New York | 10019 | |
| (Address of Principal Executive Offices) | (Zip Code) |
(212) 582-0900
(Registrant's Telephone Number, Including Area Code)
Indicate by check mark whether the registrant: (1) has filed all reports required to be filed by Section 13 or 15(d) of the Securities Exchange Act of 1934 during the preceding 12 months (or for such shorter period that the registrant was required to file such reports), and (2) has been subject to such filing requirements for the past 90 days.
Yes x No o
Indicate by check mark whether the registrant is a large accelerated filer, an accelerated filer or a non-accelerated filer. See definition of "accelerated filer and large accelerated filer" in Rule 12b-2 of the Exchange Act. (Check one):
Large Accelerated Filer o Accelerated Filer x Non-Accelerated Filer o
Indicate by check mark whether the registrant is a shell company (as defined in Rule 12b-2 of the Exchange Act).
Yes o No x
Indicate the number of shares outstanding of each of the issuer's classes of common stock, as of the latest practicable date.
| Class | Outstanding at November 8, 2007 | |
| Common Stock, $0.01 par value per share | 23,309,148 shares |
Harris & Harris Group, Inc.
Form 10-Q, September 30, 2007
Page Number | ||
PART I. FINANCIAL INFORMATION | ||
Item 1. Consolidated Financial Statements | 1 | |
| Consolidated Statements of Assets and Liabilities | 2 | |
| Consolidated Statements of Operations | 3 | |
| Consolidated Statements of Cash Flows | 4 | |
| Consolidated Statements of Changes in Net Assets | 5 | |
| Consolidated Schedule of Investments | 6 | |
| Notes to Consolidated Financial Statements | 18 | |
| Financial Highlights | 27 | |
Item 2. Management's Discussion and Analysis of Financial Condition and Results of Operations | 28 | |
| Background and Overview | 28 | |
| Results of Operations | 31 | |
| Financial Condition | 35 | |
| Liquidity | 37 | |
| Capital Resources | 37 | |
| Critical Accounting Policies | 38 | |
| Recent Developments - Portfolio Companies | 39 | |
| Forward Looking Statements | 40 | |
Item 3. Quantitative and Qualitative Disclosures About Market Risk | 40 | |
Item 4. Controls and Procedures | 42 | |
PART II. OTHER INFORMATION | ||
Item 1A. Risk Factors | 43 | |
Item 6. Exhibits | 43 | |
Signatures | 45 | |
Exhibit Index | 46 |
PART I. FINANCIAL INFORMATION
Item 1. Consolidated Financial Statements
The information furnished in the accompanying consolidated financial statements reflects all adjustments that are, in the opinion of management, necessary for a fair statement of the results for the interim period presented.
Harris & Harris Group, Inc.® (the "Company," "us," "our" and "we"), is an internally managed venture capital company that has elected to operate as a business development company under the Investment Company Act of 1940 (the "1940 Act"). Certain information and disclosures normally included in the consolidated financial statements in accordance with Generally Accepted Accounting Principles have been condensed or omitted as permitted by Regulation S-X and Regulation S-K. The accompanying consolidated financial statements should be read in conjunction with the audited consolidated financial statements and notes thereto for the year ended December 31, 2006, contained in our Annual Report on Form 10-K for the year ended December 31, 2006.
On September 25, 1997, our Board of Directors approved a proposal to seek qualification as a regulated investment company ("RIC") under Subchapter M of the Internal Revenue Code (the "Code"). At that time, we were taxable under Subchapter C of the Code (a "C Corporation"). We filed for the 1999 tax year to elect treatment as a RIC. In order to qualify as a RIC, we must, in general, (1) annually, derive at least 90 percent of our gross income from dividends, interest, gains from the sale of securities and similar sources; (2) quarterly, meet certain investment diversification requirements; and (3) annually, distribute at least 90 percent of our investment company taxable income as a dividend. In addition to the requirement that we must annually distribute at least 90 percent of our investment company taxable income, we may either distribute or retain our taxable net capital gains from investments, but any net capital gains not distributed could be subject to corporate level tax. Further, we could be subject to a four percent excise tax to the extent we fail to distribute at least 98 percent of our annual investment company taxable income and would be subject to income tax to the extent we fail to distribute 100 percent of our investment company taxable income.
Because of the specialized nature of our investment portfolio, we generally can satisfy the diversification requirements under Subchapter M of the Code if we receive a certification from the Securities and Exchange Commission (“SEC”) that we are "principally engaged in the furnishing of capital to other corporations which are principally engaged in the development or exploitation of inventions, technological improvements, new processes, or products not previously generally available."
On June 20, 2007, we received SEC certification for 2006, permitting us to qualify for RIC treatment for 2006 (as we had for the years 1999 through 2005) pursuant to Section 851(e) of the Code. Although the SEC certification for 2006 was issued, there can be no assurance that we will qualify for or receive such certification for subsequent years (to the extent we need additional certification as a result of changes in our portfolio) or that we will actually qualify for Subchapter M treatment in subsequent years. In addition, under certain circumstances, even if we qualified for Subchapter M treatment in a given year, we might take action in a subsequent year to ensure that we would be taxed in that subsequent year as a C Corporation, rather than as a RIC. Because Subchapter M does not permit deduction of operating expenses against long-term capital gains, it is not clear that the Company and its shareholders have paid less taxes since 1999 than they would have paid had the Company remained a C Corporation.
1
HARRIS & HARRIS GROUP, INC.
CONSOLIDATED STATEMENTS OF ASSETS AND LIABILITIES
September 30, 2007 | December 31, 2006 | ||||||
(Unaudited) | |||||||
ASSETS | |||||||
| Investments, at value (Cost: $143,074,052 at 9/30/07, | |||||||
| $121,331,398 at 12/31/06) | $ | 132,946,492 | $ | 112,323,978 | |||
| Cash and cash equivalents | 288,397 | 2,071,788 | |||||
| Restricted funds | 2,533,929 | 2,149,785 | |||||
| Receivable from broker | 0 | 819,905 | |||||
| Interest receivable | 499,079 | 625,372 | |||||
| Prepaid expenses | 142,459 | 10,945 | |||||
| Other assets | 286,123 | 326,817 | |||||
Total assets | $ | 136,696,479 | $ | 118,328,590 | |||
LIABILITIES & NET ASSETS | |||||||
| Accounts payable and accrued liabilities | $ | 4,237,657 | $ | 4,115,300 | |||
| Accrued profit sharing (Note 5) | 0 | 261,661 | |||||
| Deferred rent | 16,225 | 21,326 | |||||
Total liabilities | 4,253,882 | 4,398,287 | |||||
Net assets | $ | 132,442,597 | $ | 113,930,303 | |||
Net assets are comprised of: | |||||||
| Preferred stock, $0.10 par value, | |||||||
| 2,000,000 shares authorized; none issued | $ | 0 | $ | 0 | |||
| Common stock, $0.01 par value, 45,000,000 shares authorized at | |||||||
| 9/30/07 and 12/31/06; 25,100,598 issued at 9/30/07 and | |||||||
| 22,843,757 issued at 12/31/06 | 251,006 | 228,438 | |||||
| Additional paid-in capital (Note 7) | 158,170,494 | 129,801,201 | |||||
| Accumulated net realized loss | (12,507,339 | ) | (3,747,912 | ) | |||
| Accumulated unrealized depreciation of investments | (10,127,560 | ) | (9,007,420 | ) | |||
| Unrecognized net gain on retirement benefit plans | 61,527 | 61,527 | |||||
| Treasury stock, at cost (1,828,740 shares at 9/30/07 | |||||||
| and 12/31/06) | (3,405,531 | ) | (3,405,531 | ) | |||
Net assets | $ | 132,442,597 | $ | 113,930,303 | |||
Shares outstanding | 23,271,858 | 21,015,017 | |||||
Net asset value per outstanding share | $ | 5.69 | $ | 5.42 | |||
The accompanying notes are an integral part of these consolidated financial statements.
2
HARRIS & HARRIS GROUP, INC.
CONSOLIDATED STATEMENTS OF OPERATIONS
(Unaudited)
Three Months Ended Sept. 30 | Nine Months Ended Sept. 30 | ||||||||||||
2007 | 2006 | 2007 | 2006 | ||||||||||
Investment income: | |||||||||||||
| Interest from: | |||||||||||||
| Fixed-income securities | $ | 743,375 | $ | 719,619 | $ | 2,033,574 | $ | 2,302,246 | |||||
| Miscellaneous income | 39 | 0 | 39 | 7,500 | |||||||||
Total investment income | 743,414 | 719,619 | 2,033,613 | 2,309,746 | |||||||||
Expenses: | |||||||||||||
| Salaries, benefits and stock-based | |||||||||||||
| compensation (Note 4) | 3,230,838 | 3,151,338 | 8,409,888 | 4,741,850 | |||||||||
| Administration and operations | 311,332 | 242,930 | 1,049,375 | 971,471 | |||||||||
| Profit-sharing provision (Note 5) | 0 | 51,545 | 0 | 51,545 | |||||||||
| Professional fees | 155,999 | 95,742 | 673,261 | 483,567 | |||||||||
| Rent | 60,314 | 59,310 | 178,634 | 177,929 | |||||||||
| Directors’ fees and expenses | 80,364 | 85,287 | 333,717 | 266,089 | |||||||||
| Depreciation | 16,734 | 16,201 | 47,955 | 49,097 | |||||||||
| Custodian fees | 5,428 | 6,056 | 17,163 | 18,618 | |||||||||
Total expenses | 3,861,009 | 3,708,409 | 10,709,993 | 6,760,166 | |||||||||
Net operating loss | (3,117,595 | ) | (2,988,790 | ) | (8,676,380 | ) | (4,450,420 | ) | |||||
Net realized gain (loss) from investments: | |||||||||||||
| Realized gain from investments | 14,828 | 6,420 | 5,941 | 19,873 | |||||||||
| Income tax expense (benefit) (Note 6) | 4,083 | (242,352 | ) | 88,988 | (222,815 | ) | |||||||
Net realized gain (loss) from | |||||||||||||
investments | 10,745 | 248,772 | (83,047 | ) | 242,688 | ||||||||
Net decrease (increase) in unrealized | |||||||||||||
depreciation on investments: | |||||||||||||
| Change on investments held | 3,711,087 | 151,926 | (1,120,140 | ) | (1,317,347 | ) | |||||||
Net decrease (increase) in unrealized | |||||||||||||
depreciation on investments | 3,711,087 | 151,926 | (1,120,140 | ) | (1,317,347 | ) | |||||||
Net realized and unrealized gain (loss) | |||||||||||||
from investments | 3,721,832 | 400,698 | (1,203,187 | ) | (1,074,659 | ) | |||||||
Net increase (decrease) in net assets | |||||||||||||
resulting from operations | $ | 604,237 | $ | (2,588,092 | ) | $ | (9,879,567 | ) | $ | (5,525,079 | ) | ||
Per average basic and diluted outstanding share | $ | 0.03 | $ | (0.12 | ) | $ | (0.45 | ) | $ | (0.27 | ) | ||
Average outstanding shares | 23,235,023 | 20,756,345 | 22,084,893 | 20,756,345 | |||||||||
The accompanying notes are an integral part of these consolidated financial statements.
3
HARRIS & HARRIS GROUP, INC.
CONSOLIDATED STATEMENTS OF CASH FLOWS
(Unaudited)
Nine Months Ended | Nine Months Ended | ||||||
September 30, 2007 | September 30, 2006 | ||||||
Cash flows used in operating activities: | |||||||
| Net decrease in net assets resulting from operations | $ | (9,879,567 | ) | $ | (5,525,079 | ) | |
| Adjustments to reconcile net decrease in net | |||||||
| assets resulting from operations to net cash | |||||||
| used in operating activities: | |||||||
| Net realized and unrealized loss on investments | 1,114,199 | 1,297,473 | |||||
| Depreciation and amortization | 31,425 | (351,229 | ) | ||||
| Stock-based compensation expense | 5,725,031 | 2,585,680 | |||||
| Changes in assets and liabilities: | |||||||
| Restricted funds | (384,144 | ) | (282,806 | ) | |||
| Receivable from portfolio company | (5,000 | ) | 75,000 | ||||
| Receivable from broker | 819,905 | 0 | |||||
| Interest receivable | 126,292 | (317,199 | ) | ||||
| Income tax receivable | 7,209 | (159,199 | ) | ||||
| Prepaid expenses | (131,514 | ) | (138,258 | ) | |||
| Other assets | 25,630 | 0 | |||||
| Accounts payable and accrued liabilities | 122,356 | 268,980 | |||||
| Accrued profit sharing | (261,661 | ) | (1,845,527 | ) | |||
| Deferred rent | (5,101 | ) | (7,976 | ) | |||
| Current income tax liability | 0 | (9,438,827 | ) | ||||
Net cash used in operating activities | (2,694,940 | ) | (13,838,967 | ) | |||
Cash flows from investing activities: | |||||||
| Purchase of short-term investments and marketable securities | (60,744,292 | ) | (56,380,294 | ) | |||
| Sale of short-term investments and marketable securities | 56,454,594 | 96,174,284 | |||||
| Investment in private placements and loans | (17,480,885 | ) | (20,252,341 | ) | |||
| Proceeds from sale of investments | 51,669 | 28,295 | |||||
| Purchase of fixed assets | (36,367 | ) | (11,762 | ) | |||
Net cash (used in) provided by investing activities | (21,755,281 | ) | 19,558,182 | ||||
Cash flows from financing activities: | |||||||
| Proceeds from stock option exercises (Note 4) | 9,673,662 | 0 | |||||
| Proceeds from stock offering (Note 7) | 12,993,168 | 0 | |||||
Net cash provided by financing activities | 22,666,830 | 0 | |||||
Net (decrease) increase in cash and cash equivalents: | |||||||
| Cash and cash equivalents at beginning of the period | 2,071,788 | 1,213,289 | |||||
| Cash and cash equivalents at end of the period | 288,397 | 6,932,504 | |||||
Net (decrease) increase in cash and cash equivalents | $ | (1,783,391 | ) | $ | 5,719,215 | ||
Supplemental disclosures of cash flow information: | |||||||
| Income taxes paid | $ | 87,920 | $ | 9,354,653 | |||
The accompanying notes are an integral part of these consolidated financial statements.
4
HARRIS & HARRIS GROUP, INC.
CONSOLIDATED STATEMENTS OF CHANGES IN NET ASSETS
Nine Months Ended | Year Ended | ||||||
September 30, 2007 | December 31, 2006 | ||||||
(Unaudited) | |||||||
Changes in net assets from operations: | |||||||
| Net operating loss | $ | (8,676,380 | ) | $ | (7,612,935 | ) | |
| Net realized (loss) gain on investments | (83,047 | ) | 258,693 | ||||
| Net increase in unrealized depreciation | |||||||
| on investments held | (1,120,140 | ) | (4,418,870 | ) | |||
Net decrease in net assets resulting | |||||||
from operations | (9,879,567 | ) | (11,773,112 | ) | |||
Changes in net assets from capital | |||||||
stock transactions: | |||||||
| Issuance of common stock on offering | 13,000 | 0 | |||||
| Issuance of common stock upon the | |||||||
| exercise of stock options | 9,568 | 2,587 | |||||
| Additional paid-in capital on common | |||||||
| stock issued | 22,644,262 | 2,612,603 | |||||
| Stock-based compensation expense | 5,725,031 | 5,038,956 | |||||
Net increase in net assets resulting from | |||||||
capital stock transactions | 28,391,861 | 7,654,146 | |||||
Changes in net assets from adoption | |||||||
of SFAS No. 158 | 0 | 61,527 | |||||
Net increase (decrease) in net assets | 18,512,294 | (4,057,439 | ) | ||||
Net assets: | |||||||
| Beginning of the period | 113,930,303 | 117,987,742 | |||||
| End of the period | $ | 132,442,597 | $ | 113,930,303 | |||
The accompanying notes are an integral part of these consolidated financial statements.
5
HARRIS & HARRIS GROUP, INC.
CONSOLIDATED SCHEDULE OF INVESTMENTS AS OF SEPTEMBER 30, 2007
(Unaudited)
Method of | Shares/ | |||||||||
Valuation (1) | Principal | Value | ||||||||
Investments in Unaffiliated Companies (2)(3) - 15.98% of | ||||||||||
net assets at value | ||||||||||
Private Placement Portfolio (Illiquid) - 15.98% of net assets | ||||||||||
at value | ||||||||||
| AlphaSimplex Group, LLC (4)(5) -- Investment management company | ||||||||||
| headed by Dr. Andrew W. Lo, holder of the Harris & Harris Group | ||||||||||
| Chair at MIT | ||||||||||
| Limited Liability Company Interest | (B | ) | 1 | $ | 125,000 | |||||
| BioVex Group, Inc. (4)(6)(7)(8) - Developing novel biologics | ||||||||||
| for treatment of cancer and infectious disease | ||||||||||
| Series E Convertible Preferred Stock | (A | ) | 2,799,552 | 2,500,000 | ||||||
| Exponential Business Development Company (4)(6) -- Venture | ||||||||||
| capital partnership focused on early stage companies | ||||||||||
| Limited Partnership Interest | (B | ) | 1 | 1,973 | ||||||
| Molecular Imprints, Inc. (4)(6) -- Manufacturing nanoimprint | ||||||||||
| lithography capital equipment | ||||||||||
| Series B Convertible Preferred Stock | (B | ) | 1,333,333 | 2,000,000 | ||||||
| Series C Convertible Preferred Stock | (B | ) | 1,250,000 | 2,500,000 | ||||||
| Warrants at $2.00 expiring 12/31/11 | (B | ) | 125,000 | 0 | ||||||
| 4,500,000 | ||||||||||
| Nanosys, Inc. (4)(6)(8) -- Developing zero and one-dimensional | ||||||||||
| inorganic nanometer-scale materials and devices | ||||||||||
| Series C Convertible Preferred Stock | (C | ) | 803,428 | 2,370,113 | ||||||
| Series D Convertible Preferred Stock | (C | ) | 1,016,950 | 3,000,003 | ||||||
| 5,370,116 | ||||||||||
| Nantero, Inc. (4)(6)(8) -- Developing a high-density, nonvolatile, | ||||||||||
| random access memory chip, enabled by carbon nanotubes | ||||||||||
| Series A Convertible Preferred Stock | (C | ) | 345,070 | 1,046,908 | ||||||
| Series B Convertible Preferred Stock | (C | ) | 207,051 | 628,172 | ||||||
| Series C Convertible Preferred Stock | (C | ) | 188,315 | 571,329 | ||||||
| 2,246,409 | ||||||||||
The accompanying notes are an integral part of these consolidated financial statements.
6
HARRIS & HARRIS GROUP, INC.
CONSOLIDATED SCHEDULE OF INVESTMENTS AS OF SEPTEMBER 30, 2007
(Unaudited)
Method of | Shares/ | |||||||||
Valuation (1) | Principal | Value | ||||||||
Investments in Unaffiliated Companies (2)(3) - 15.98% of | ||||||||||
net assets at value (cont.) | ||||||||||
Private Placement Portfolio (Illiquid) - 15.98% of net assets | ||||||||||
at value (cont.) | ||||||||||
| NeoPhotonics Corporation (4)(6) -- Developing and manufacturing | ||||||||||
| optical devices and components | ||||||||||
| Common Stock | (B | ) | 716,195 | $ | 133,141 | |||||
| Series 1 Convertible Preferred Stock | (B | ) | 1,831,256 | 1,831,256 | ||||||
| Series 2 Convertible Preferred Stock | (B | ) | 741,898 | 741,898 | ||||||
| Series 3 Convertible Preferred Stock | (B | ) | 2,750,000 | 2,750,000 | ||||||
| Warrants at $0.15 expiring 01/26/10 | (B | ) | 16,364 | 164 | ||||||
| Warrants at $0.15 expiring 12/05/10 | (B | ) | 14,063 | 140 | ||||||
| 5,456,599 | ||||||||||
| Polatis, Inc. (4)(6)(8)(9) -- Developing MEMS-based optical | ||||||||||
| networking components | ||||||||||
| Series A-1 Convertible Preferred Stock | (B | ) | 16,775 | 0 | ||||||
| Series A-2 Convertible Preferred Stock | (B | ) | 71,611 | 132,653 | ||||||
| Series A-4 Convertible Preferred Stock | (B | ) | 4,774 | 8,768 | ||||||
| Series A-5 Convertible Preferred Stock | (B | ) | 9,311 | 76,523 | ||||||
| 217,944 | ||||||||||
| Starfire Systems, Inc. (4)(6)(8) -- Producing ceramic-forming polymers | ||||||||||
| Common Stock | (B | ) | 375,000 | 150,000 | ||||||
| Series A-1 Convertible Preferred Stock | (C | ) | 600,000 | 600,000 | ||||||
| 750,000 | ||||||||||
Total Unaffiliated Private Placement Portfolio (cost: $21,387,846) | $ | 21,168,041 | ||||||||
Total Investments in Unaffiliated Companies (cost: $21,387,846) | $ | 21,168,041 | ||||||||
The accompanying notes are an integral part of these consolidated financial statements.
7
HARRIS & HARRIS GROUP, INC.
CONSOLIDATED SCHEDULE OF INVESTMENTS AS OF SEPTEMBER 30, 2007
(Unaudited)
Method of | Shares/ | |||||||||
Valuation (1) | Principal | Value | ||||||||
Investments in Non-Controlled Affiliated Companies (2)(10) - | ||||||||||
33.07% of net assets at value | ||||||||||
Private Placement Portfolio (Illiquid) - 33.07% of net assets | ||||||||||
at value | ||||||||||
| Adesto Technologies Corporation (4)(6)(7)(8) -- Developing | ||||||||||
| semiconductor-related products enabled at the nanoscale | ||||||||||
| Series A Convertible Preferred Stock | (A | ) | 3,416,149 | $ | 1,147,826 | |||||
| Ancora Pharmaceuticals Inc. (4)(6)(7)(8) - Developing synthetic | ||||||||||
| carbohydrates for pharmaceutical markets and for internal | ||||||||||
| drug development programs | ||||||||||
| Series B Convertible Preferred Stock | (A | ) | 909,091 | 800,000 | ||||||
| Warrants at $1.06 expiring 05/01/08 | (B | ) | 754,717 | 0 | ||||||
| 800,000 | ||||||||||
| BridgeLux, Inc. (4)(6)(11) -- Manufacturing high-power light | ||||||||||
| emitting diodes | ||||||||||
| Series B Convertible Preferred Stock | (C | ) | 1,861,504 | 1,328,369 | ||||||
| Series C Convertible Preferred Stock | (C | ) | 2,130,699 | 1,520,466 | ||||||
| Warrants at $0.7136 expiring 02/02/2017 | (B | ) | 98,340 | 0 | ||||||
| Warrants at $0.7136 expiring 04/26/2017 | (B | ) | 65,560 | 0 | ||||||
| 2,848,835 | ||||||||||
| Cambrios Technologies Corporation (4)(6)(8) -- Developing | ||||||||||
| nanowire-enabled electronic materials for the display industry | ||||||||||
| Series B Convertible Preferred Stock | (C | ) | 1,294,025 | 1,294,025 | ||||||
| Series C Convertible Preferred Stock | (C | ) | 1,300,000 | 1,300,000 | ||||||
| 2,594,025 | ||||||||||
| Chlorogen, Inc. (4)(6)(8) -- Developed patented chloroplast | ||||||||||
| technology to produce plant-made proteins | ||||||||||
| Series A Convertible Preferred Stock | (B | ) | 4,478,038 | 0 | ||||||
| Series B Convertible Preferred Stock | (B | ) | 2,077,930 | 0 | ||||||
| Secured Convertible Bridge Note (including interest) | (B | ) | $ | 176,811 | 0 | |||||
| 0 | ||||||||||
| Crystal IS, Inc. (4)(6)(8) -- Developing single-crystal | ||||||||||
| aluminum nitride substrates for optoelectronic devices | ||||||||||
| Series A Convertible Preferred Stock | (C | ) | 391,571 | 305,425 | ||||||
| Series A-1 Convertible Preferred Stock | (C | ) | 1,300,376 | 1,014,294 | ||||||
| Warrants at $0.78 expiring 05/05/2013 | (B | ) | 15,231 | 0 | ||||||
| Warrants at $0.78 expiring 05/12/2013 | (B | ) | 2,350 | 0 | ||||||
| Warrants at $0.78 expiring 08/08/2013 | (B | ) | 4,396 | 0 | ||||||
| 1,319,719 | ||||||||||
The accompanying notes are an integral part of these consolidated financial statements.
8
HARRIS & HARRIS GROUP, INC. CONSOLIDATED SCHEDULE OF INVESTMENTS AS OF SEPTEMBER 30, 2007 (Unaudited) |
Method of Valuation (1) | Shares/ Principal | Value | |||||||||
Investments in Non-Controlled Affiliated Companies (2)(10) - 33.07% of net assets at value (cont.) | |||||||||||
Private Placement Portfolio (Illiquid) - 33.07% of net assets at value (cont.) | |||||||||||
| CSwitch, Inc. (4)(6)(8) -- Developing next-generation, system-on- a-chip solutions for communications-based platforms | |||||||||||
| Series A-1 Convertible Preferred Stock | (B) | 6,863,118 | $ | 3,431,559 | |||||||
| Secured Convertible Bridge Note (including interest) | (A) | $ | 529,852 | 531,129 | |||||||
| 3,962,688 | |||||||||||
| D-Wave Systems, Inc. (4)(6)(8)(12) -- Developing high- performance quantum computing systems | |||||||||||
| Series B Convertible Preferred Stock | (A) | 2,000,000 | 2,008,240 | ||||||||
| Warrants at $0.85 expiring 10/19/07 | (B) | 1,800,000 | 0 | ||||||||
| 2,008,240 | |||||||||||
Ensemble Discovery Corporation (4)(6)(7)(8) - Developing DNA Programmed Chemistry for the discovery of new classes of therapeutics and bioassays | |||||||||||
| Series B Convertible Preferred Stock | (A) | 1,449,275 | 2,000,000 | ||||||||
| Innovalight, Inc. (4)(6)(8) - Developing renewable energy products enabled by silicon-based nanomaterials | |||||||||||
| Series B Convertible Preferred Stock | (B) | 16,666,666 | 5,718,216 | ||||||||
| Kereos, Inc. (4)(6)(8) -- Developing emulsion-based imaging agents and targeted therapeutics to image and treat cancer and cardiovascular disease | |||||||||||
| Series B Convertible Preferred Stock | (B) | 545,456 | 1,500,000 | ||||||||
| Kovio, Inc. (4)(6)(8) -- Developing semiconductor products using printed electronics and thin-film technologies | |||||||||||
| Series C Convertible Preferred Stock | (C) | 2,500,000 | 3,125,000 | ||||||||
| Series D Convertible Preferred Stock | (C) | 800,000 | 1,000,000 | ||||||||
| 4,125,000 | |||||||||||
| Lifco, Inc. (4)(6)(7)(8) -- Developing energy solutions using nanostructured materials | |||||||||||
| Series A Convertible Preferred Stock | (A) | 1,208,262 | 946,528 | ||||||||
The accompanying notes are an integral part of these consolidated financial statements.
9
HARRIS & HARRIS GROUP, INC. CONSOLIDATED SCHEDULE OF INVESTMENTS AS OF SEPTEMBER 30, 2007 (Unaudited) |
Method of Valuation (1) | Shares/ Principal | Value | ||||||||
Investments in Non-Controlled Affiliated Companies (2)(10) - 33.07% of net assets at value (cont.) | ||||||||||
Private Placement Portfolio (Illiquid) - 33.07% of net assets at value (cont.) | ||||||||||
| Mersana Therapeutics, Inc. (4)(6)(8)(13) -- Developing advanced polymers for drug delivery | ||||||||||
| Series A Convertible Preferred Stock | (B) | 68,451 | $ | 136,902 | ||||||
| Series B Convertible Preferred Stock | (B) | 866,500 | 1,733,000 | |||||||
| Warrants at $2.00 expiring 10/21/10 | (B) | 91,625 | 0 | |||||||
| 1,869,902 | ||||||||||
| Metabolon, Inc. (4)(6)(8) - Discovering biomarkers through the use of metabolomics | ||||||||||
| Series B Convertible Preferred Stock | (B) | 2,173,913 | 2,500,000 | |||||||
| NanoGram Corporation (4)(6)(8) -- Developing a broad suite of intellectual property utilizing nanoscale materials | ||||||||||
| Series I Convertible Preferred Stock | (B) | 63,210 | 64,259 | |||||||
| Series II Convertible Preferred Stock | (B) | 1,250,904 | 1,271,670 | |||||||
| Series III Convertible Preferred Stock | (B) | 1,242,144 | 1,262,764 | |||||||
| 2,598,693 | ||||||||||
| Nanomix, Inc. (4)(6)(8) -- Producing nanoelectronic sensors that integrate carbon nanotube electronics with silicon microstructures | ||||||||||
| Series C Convertible Preferred Stock | (B) | 977,918 | 57,905 | |||||||
| Series D Convertible Preferred Stock | (B) | 6,802,398 | 402,789 | |||||||
| 460,694 | ||||||||||
| NanoOpto Corporation (4)(6)(8)(14) -- Manufactured discrete and integrated optical communications sub-components on a chip by utilizing nano manufacturing and nano coating technology | ||||||||||
| Series A-1 Convertible Preferred Stock | (B) | 267,857 | 0 | |||||||
| Series B Convertible Preferred Stock | (B) | 3,819,935 | 0 | |||||||
| Series C Convertible Preferred Stock | (B) | 1,932,789 | 0 | |||||||
| Series D Convertible Preferred Stock | (B) | 1,397,218 | 0 | |||||||
| Warrants at $0.4359 expiring 03/15/10 | (B) | 193,279 | 0 | |||||||
| Secured Convertible Bridge Note (including interest) | (B) | $ | 268,654 | 0 | ||||||
| 0 | ||||||||||
The accompanying notes are an integral part of these consolidated financial statements.
10
HARRIS & HARRIS GROUP, INC. CONSOLIDATED SCHEDULE OF INVESTMENTS AS OF SEPTEMBER 30, 2007 (Unaudited) |
Method of Valuation (1) | Shares/ Principal | Value | ||||||||
Investments in Non-Controlled Affiliated Companies (2)(10) - 33.07% of net assets at value (cont.) | ||||||||||
Private Placement Portfolio (Illiquid) - 33.07% of net assets at value (cont.) | ||||||||||
| Nextreme Thermal Solutions, Inc. (4)(6)(8) -- Developing thin-film thermoelectric devices for cooling and energy conversion | ||||||||||
| Series A Convertible Preferred Stock | (B) | 1,750,000 | 1,750,000 | |||||||
| Questech Corporation (4)(6) -- Manufacturing and marketing proprietary metal and stone decorative tiles | ||||||||||
| Common Stock | (B) | 655,454 | $ | 747,217 | ||||||
| Warrants at $1.50 expiring 11/21/07 | (B) | 3,750 | 0 | |||||||
| Warrants at $1.50 expiring 11/19/08 | (B) | 5,000 | 0 | |||||||
| Warrants at $1.50 expiring 11/19/09 | (B) | 5,000 | 0 | |||||||
| 747,217 | ||||||||||
| Solazyme, Inc. (4)(6)(8) -- Developing energy-harvesting machinery of photosynthetic microbes to produce industrial and pharmaceutical molecules | ||||||||||
| Series A Convertible Preferred Stock | (B) | 988,204 | 385,400 | |||||||
| Series B Convertible Preferred Stock | (B) | 495,246 | 500,000 | |||||||
| 885,400 | ||||||||||
Xradia, Inc. (4)(6) - Designing, manufacturing and selling ultra high resolution 3D x-ray microscopes and fluorescence imaging systems | ||||||||||
| Series D Convertible Preferred Stock | (A) | 3,121,099 | 4,000,000 | |||||||
| Zia Laser, Inc. (4)(6)(8)(15) -- Developed quantum dot semiconductor lasers | ||||||||||
| Series C Convertible Preferred Stock | (B) | 1,500,000 | 15,000 | |||||||
Total Non-Controlled Private Placement Portfolio (cost: $51,290,257) | $ | 43,797,983 | ||||||||
Total Investments in Non-Controlled Affiliated Companies (cost: $51,290,257) | $ | 43,797,983 | ||||||||
The accompanying notes are an integral part of these consolidated financial statements.
11
HARRIS & HARRIS GROUP, INC. CONSOLIDATED SCHEDULE OF INVESTMENTS AS OF SEPTEMBER 30, 2007 (Unaudited) |
Method of Valuation (1) | Shares/ Principal | Value | ||||||||
Investments in Controlled Affiliated Companies (2)(16) - 3.25% of net assets at value | ||||||||||
Private Placement Portfolio (Illiquid) - 3.25% of net assets at value | ||||||||||
| Evolved Nanomaterial Sciences, Inc. (4)(6)(8)(17) -- Developed nanoscale-enhanced approaches for the resolution of chiral molecules | ||||||||||
| Series A Convertible Preferred Stock | (B) | 5,870,021 | $ | 0 | ||||||
| SiOnyx, Inc. (4)(6)(8) -- Developing silicon-based optoelectronic products enabled by its proprietary "Black Silicon" | ||||||||||
| Series A Convertible Preferred Stock | (C) | 233,499 | 135,686 | |||||||
| Series A-1 Convertible Preferred Stock | (C) | 2,966,667 | 1,723,930 | |||||||
| Series A-2 Convertible Preferred Stock | (C) | 4,207,537 | 2,445,000 | |||||||
| 4,304,616 | ||||||||||
Total Controlled Private Placement Portfolio (cost: $6,885,000) | $ | 4,304,616 | ||||||||
Total Investments in Controlled Affiliated Companies (cost: $6,885,000) | $ | 4,304,616 | ||||||||
Total Private Placement Portfolio (cost: $79,563,103) | $ | 69,270,640 | ||||||||
U.S. Government and Agency Securities - 48.08% of net assets at value | ||||||||||
| U.S. Treasury Bill -- due date 11/23/07 | (J) | 380,000 | $ | 377,971 | ||||||
| U.S. Treasury Bill -- due date 02/21/08 | (J) | 6,500,000 | 6,399,835 | |||||||
| U.S. Treasury Notes -- due date 02/15/08, coupon 3.375% | (H) | 15,005,000 | 14,962,836 | |||||||
| U.S. Treasury Notes -- due date 05/15/08, coupon 3.75% | (H) | 9,000,000 | 8,976,780 | |||||||
| U.S. Treasury Notes -- due date 09/15/08, coupon 3.125% | (H) | 5,000,000 | 4,956,650 | |||||||
| U.S. Treasury Notes -- due date 01/15/09, coupon 3.25% | (H) | 3,000,000 | 2,973,990 | |||||||
| U.S. Treasury Notes -- due date 02/15/09, coupon 4.50% | (H) | 5,100,000 | 5,134,680 | |||||||
| U.S. Treasury Notes -- due date 04/15/09, coupon 3.125% | (H) | 3,000,000 | 2,963,190 | |||||||
| U.S. Treasury Notes -- due date 07/15/09, coupon 3.625% | (H) | 3,000,000 | 2,982,900 | |||||||
| U.S. Treasury Notes -- due date 10/15/09, coupon 3.375% | (H) | 3,000,000 | 2,965,770 | |||||||
| U.S. Treasury Notes -- due date 01/15/10, coupon 3.625% | (H) | 3,000,000 | 2,977,020 | |||||||
| U.S. Treasury Notes -- due date 04/15/10, coupon 4.00% | (H) | 3,000,000 | 3,000,240 | |||||||
| U.S. Treasury Notes -- due date 07/15/10, coupon 3.875% | (H) | 3,000,000 | 2,991,330 | |||||||
| U.S. Treasury Notes -- due date 10/15/10, coupon 4.25% | (H) | 2,000,000 | 2,012,660 | |||||||
Total Investments in U.S. Government and Agency Securities (cost: $63,510,949) | $ | 63,675,852 | ||||||||
Total Investments (cost: $143,074,052) | $ | 132,946,492 | ||||||||
The accompanying notes are an integral part of these consolidated financial statements.
12
HARRIS & HARRIS GROUP, INC. CONSOLIDATED SCHEDULE OF INVESTMENTS AS OF SEPTEMBER 30, 2007 (Unaudited) |
Notes to Consolidated Schedule of Investments
| (1) | See Footnote to Consolidated Schedule of Investments on page 14 for a description of the Valuation Procedures. |
| (2) | Investments in unaffiliated companies consist of investments in which we own less than five percent of the voting shares of the portfolio company. Investments in non-controlled affiliated companies consist of investments in which we own five percent or more, but less than 25 percent, of the voting shares of the portfolio company, or where we hold one or more seats on the portfolio company’s Board of Directors but do not control the company. Investments in controlled affiliated companies consist of investments in which we own 25 percent or more of the voting shares of the portfolio company or otherwise control the company. |
| (3) | The aggregate cost for federal income tax purposes of investments in unaffiliated companies is $21,387,846. The gross unrealized appreciation based on the tax cost for these securities is $1,846,158. The gross unrealized depreciation based on the tax cost for these securities is $2,065,963. |
| (4) | Legal restrictions on sale of investment. |
| (5) | On October 30, 2007, AlphaSimplex Group, LLC, was acquired by Natixis Global Asset Management. |
| (6) | Represents a non-income producing security. Equity investments that have not paid dividends within the last 12 months are considered to be non-income producing. |
| (7) | Initial investment was made during 2007. |
| (8) | These investments are development stage companies. A development stage company is defined as a company that is devoting substantially all of its efforts to establishing a new business, and either it has not yet commenced its planned principal operations, or it has commenced such operations but has not realized significant revenue from them. |
| (9) | Continuum Photonics, Inc., merged with Polatis, Ltd., to form Polatis, Inc. |
| (10) | The aggregate cost for federal income tax purposes of investments in non-controlled affiliated companies is $51,290,257. The gross unrealized appreciation based on the tax cost for these securities is $4,262,547. The gross unrealized depreciation based on the tax cost for these securities is $11,754,821. |
| (11) | BridgeLux, Inc., was previously named eLite Optoelectronics, Inc. |
| (12) | D-Wave Systems, Inc., is located and is doing business primarily in Canada. We invested in D-Wave Systems, Inc., through D-Wave USA, a Delaware company. Our investment is denominated in Canadian dollars and is subject to foreign currency translation. See "Note 3. Summary of Significant Accounting Policies." |
| (13) | Mersana Therapeutics, Inc., was previously named Nanopharma Corp. |
| (14) | On July 19, 2007, NanoOpto Corporation sold its assets to API Nanotronics, Inc. |
| (15) | On November 30, 2006, the assets of Zia Laser, Inc., were acquired by Innolume, Inc. |
| (16) | The aggregate cost for federal income tax purposes of investments in controlled affiliated companies is $6,885,000. The gross unrealized appreciation based on the tax cost for these securities is $219,616. The gross unrealized depreciation based on the tax cost for these securities is $2,800,000. |
| (17) | On September 30, 2007, Evolved Nanomaterial Sciences, Inc., filed for Chapter 7 bankruptcy. |
The accompanying notes are an integral part of this consolidated schedule.
13
HARRIS & HARRIS GROUP, INC. FOOTNOTE TO CONSOLIDATED SCHEDULE OF INVESTMENTS (Unaudited) |
VALUATION PROCEDURES
Our investments can be classified into five broad categories for valuation purposes:
Equity-Related Securities;
Investments in Intellectual Property or Patents or Research and Development in Technology or Product Development;
Long-Term Fixed-Income Securities;
Short-Term Fixed-Income Investments; and
All Other Investments.
The 1940 Act requires periodic valuation of each investment in our portfolio to determine net asset value. Under the 1940 Act, unrestricted securities with readily available market quotations are to be valued at the current market value; all other assets must be valued at "fair value" as determined in good faith by or under the direction of the Board of Directors.
Our Board of Directors is responsible for (1) determining overall valuation guidelines and (2) ensuring the valuation of investments within the prescribed guidelines.
Our Valuation Committee, comprised of all of our independent Board members, is responsible for reviewing and approving the valuation of our assets within the guidelines established by the Board of Directors.
Fair value is generally defined as the amount that an investment could be sold for in an orderly disposition over a reasonable time. Generally, to increase objectivity in valuing our assets, external measures of value, such as public markets or third-party transactions, are utilized whenever possible. Valuation is not based on long-term work-out value, nor immediate liquidation value, nor incremental value for potential changes that may take place in the future.
The values assigned to these investments are based on available information and do not necessarily represent amounts that might ultimately be realized, as these amounts depend on future circumstances and cannot reasonably be determined until the individual investments are actually liquidated or become marketable.
14
Our valuation policy with respect to the five broad investment categories is as follows:
Equity-Related Securities
Equity-related securities are valued using one or more of the following basic methods of valuation:
A. Cost. The cost method is based on our original cost. This method is generally used in the early stages of a company’s development until significant positive or negative events occur subsequent to the date of the original investment that dictate a change to another valuation method. Some examples of these events are: (1) a major recapitalization; (2) a major refinancing; (3) a significant third-party transaction; (4) the development of a meaningful public market for the company’s common stock; and (5) significant positive or negative changes in a company’s business.
B. Analytical Method. The analytical method is generally used to value an investment position when there is no established public or private market in the company’s securities or when the factual information available to us dictates that an investment should no longer be valued under either the cost or private market method. This valuation method is inherently imprecise and ultimately the result of reconciling the judgments of our Valuation Committee members, based on the data available to them. The resulting valuation, although stated as a precise number, is necessarily within a range of values that vary depending upon the significance attributed to the various factors being considered. Some of the factors considered may include the financial condition and operating results of the company, the long-term potential of the business of the company, the values of similar securities issued by companies in similar businesses, the proportion of the company’s securities we own and the nature of any rights to require the company to register restricted securities under applicable securities laws.
C. Private Market. The private market method uses actual, executed, historical transactions in a company’s securities by responsible third parties as a basis for valuation. The private market method may also use, where applicable, unconditional firm offers by responsible third parties as a basis for valuation.
D. Public Market. The public market method is used when there is an established public market for the class of the company’s securities held by us or into which our securities are convertible. We discount market value for securities that are subject to significant legal and contractual restrictions. Other securities, for which market quotations are readily available, are carried at market value as of the time of valuation. Market value for securities traded on securities exchanges or on the Nasdaq Global Market is the last reported sales price on the day of valuation. For other securities traded in the over-the-counter market and listed securities for which no sale was reported on that day, market value is the mean of the closing bid price and asked price on that day. This method is the preferred method of valuation when there is an established public market for a company’s securities, as that market provides the most objective basis for valuation.
Investments in Intellectual Property or Patents or Research and Development in Technology or Product Development
These investments are carried at fair value using the following basic methods of valuation:
E. Cost. The cost method is based on our original cost. This method is generally used in the early stages of commercializing or developing intellectual property or patents or research and development in technology or product development until significant positive or adverse events occur subsequent to the date of the original investment that dictate a change to another valuation method.
15
F. Analytical Method. The analytical method is used to value an investment after analysis of the best available outside information where the factual information available to us dictates that an investment should no longer be valued under either the cost or private market method. This valuation method is inherently imprecise and ultimately the result of reconciling the judgments of our Valuation Committee members. The resulting valuation, although stated as a precise number, is necessarily within a range of values that vary depending upon the significance attributed to the various factors being considered. Some of the factors considered may include the results of research and development, product development progress, commercial prospects, term of patent and projected markets.
G. Private Market. The private market method uses actual third-party investments in intellectual property or patents or research and development in technology or product development as a basis for valuation, using actual executed historical transactions by responsible third parties. The private market method may also use, where applicable, unconditional firm offers by responsible third parties as a basis for valuation.
As of September 30, 2007, we do not have any investments in intellectual property or patents or research and development in technologies or products.
Long-Term Fixed-Income Securities
H. Readily Marketable. Fixed-income securities for which market quotations are readily available are carried at market value as of the time of valuation using the most recent bid quotations when available.
I. Not Readily Marketable. Securities for which market quotations are not readily available are carried at fair value using one or more of the following basic methods of valuation:
Fixed-income securities are valued by independent pricing services that provide market quotations based primarily on quotations from dealers and brokers, market transactions, and other sources.
Other fixed-income securities that are not readily marketable are valued at fair value by our Valuation Committee.
Short-Term Fixed-Income Investments
J. Short-term fixed-income investments are valued at market value at the time of valuation. We value short-term debt with remaining maturity of 60 days or less at amortized cost.
16
All Other Investments
K. All other investments are reported at fair value as determined in good faith by the Valuation Committee. As of September 30, 2007, we do not have any of these investments.
The reported values of securities for which market quotations are not readily available and for other assets reflect the Valuation Committee’s judgment of fair values as of the valuation date using the outlined basic methods of valuation. They do not necessarily represent an amount of money that would be realized if we had to sell the securities in an immediate liquidation. Thus, valuations as of any particular date are not necessarily indicative of amounts that we may ultimately realize as a result of future sales or other dispositions of investments we hold.
17
NOTES TO CONSOLIDATED FINANCIAL STATEMENTS (Unaudited) |
NOTE 1. THE COMPANY
Harris & Harris Group, Inc. (the "Company," "us," "our" and "we"), is a venture capital company operating as a business development company ("BDC") under the Investment Company Act of 1940 ("1940 Act"). We operate as an internally managed company whereby our officers and employees, under the general supervision of our Board of Directors, conduct our operations.
We elected to become a BDC on July 26, 1995, after receiving the necessary shareholder approvals. From September 30, 1992, until the election of BDC status, we operated as a closed-end, non-diversified investment company under the 1940 Act. Upon commencement of operations as an investment company, we revalued all of our assets and liabilities in accordance with the 1940 Act. Prior to September 30, 1992, we were registered and filed under the reporting requirements of the Securities Exchange Act of 1934 (the "1934 Act") as an operating company and, while an operating company, operated directly and through subsidiaries.
Harris & Harris Enterprises, Inc.,SM is a 100 percent wholly owned subsidiary of the Company. Harris & Harris Enterprises, Inc., is a partner in Harris Partners I, L.P.,SM and is taxed under Subchapter C of the Code (a “C Corporation”). Harris Partners I, L.P, is a limited partnership and owns our interest in AlphaSimplex Group, LLC. The partners of Harris Partners I, L.P., are Harris & Harris Enterprises, Inc., (sole general partner) and Harris & Harris Group, Inc., (sole limited partner). Harris & Harris Enterprises, Inc., pays taxes on any non-passive investment income generated by Harris Partners I, L.P. The Company consolidates the results of its subsidiaries for financial reporting purposes.
NOTE 2. INTERIM FINANCIAL STATEMENTS
Our interim financial statements have been prepared in accordance with the instructions to Form 10-Q and Article 10 of Regulation S-X and in conformity with generally accepted accounting principles applicable to interim financial information. Accordingly, they do not include all information and disclosures necessary for a presentation of our financial position, results of operations and cash flows in conformity with generally accepted accounting principles in the United States of America. In the opinion of management, these financial statements reflect all adjustments, consisting only of normal recurring accruals, necessary for a fair presentation of our financial position, results of operations and cash flows for such periods. The results of operations for any interim period are not necessarily indicative of the results for the full year. These financial statements should be read in conjunction with the financial statements and notes thereto contained in our Annual Report on Form 10-K for the fiscal year ended December 31, 2006.
NOTE 3. SUMMARY OF SIGNIFICANT ACCOUNTING POLICIES
The following is a summary of significant accounting policies followed in the preparation of the consolidated financial statements:
Principles of Consolidation. The consolidated financial statements have been prepared in accordance with accounting principles generally accepted in the United States of America for investment companies and include the accounts of the Company and its wholly owned subsidiaries. All significant inter-company accounts and transactions have been eliminated in consolidation.
18
Use of Estimates. The preparation of the consolidated financial statements in conformity with accounting principles generally accepted in the United States of America requires management to make estimates and assumptions that affect the reported amounts of assets and liabilities and contingent assets and liabilities as of September 30, 2007 and December 31, 2006, and the reported amounts of revenues and expenses for the three months and nine months ended September 30, 2007 and 2006. The most significant estimates relate to the fair valuations of certain of our investments. Actual results could differ from these estimates.
Cash and Cash Equivalents. Cash and cash equivalents include money market instruments with maturities of less than three months.
Portfolio Investment Valuations. Investments are stated at "value" as defined in the 1940 Act and in the applicable regulations of the SEC. Value, as defined in Section 2(a)(41) of the 1940 Act, is (i) the market price for those securities for which a market quotation is readily available and (ii) the fair value as determined in good faith by, or under the direction of, the Board of Directors for all other assets. (See "Valuation Procedures" in the "Footnote to Consolidated Schedule of Investments.") At September 30, 2007, our financial statements include private venture capital investments valued at $69,270,640, the fair values of which were determined in good faith by, or under the direction, of the Board of Directors. Upon sale of investments, the values that are ultimately realized may be different from what is presently estimated. The difference could be material.
Foreign Currency Translation. The accounting records of the Company are maintained in U.S. dollars. All assets and liabilities denominated in foreign currencies are translated into U.S. dollars based on the rate of exchange of such currencies against U.S. dollars on the date of valuation. For the nine months ended September 30, 2007, included in the net decrease in unrealized depreciation on investments was a $291,796 gain resulting from foreign currency translation.
Securities Transactions. Securities transactions are accounted for on the date the securities are purchased or sold (trade date); dividend income is recorded on the ex-dividend date; and interest income is accrued as earned. The Company ceases accruing interest when securities are determined to be non-income producing and writes off any previously accrued interest. Realized gains and losses on investment transactions are determined by specific identification for financial reporting and tax reporting.
Stock-Based Compensation. The Company has a stock-based employee compensation plan. The Company accounts for the plan in accordance with the provisions of Statement of Financial Accounting Standards ("SFAS") No. 123(R), "Share-Based Payment." See Note 4 for further discussion.
Income Taxes. As we intend to qualify as a RIC under Subchapter M of the Internal Revenue Code, the Company does not provide for income taxes. Our taxes are accounted for in accordance with SFAS No. 109, "Accounting for Income Taxes."
19
However, we pay federal, state and local income taxes on behalf of our wholly owned subsidiary, Harris & Harris Enterprises, Inc., which is a C corporation. See "Note 6. Income Taxes."
In June 2006, the FASB issued Interpretation 48, "Accounting for Uncertainty in Income Taxes" (“FIN 48”), an interpretation of SFAS No. 109. FIN 48 clarifies the accounting and reporting for income taxes where interpretation of the law is uncertain. FIN 48 prescribes a comprehensive model for the financial statement recognition, measurement, presentation and disclosure of income tax uncertainties with respect to positions taken or expected to be taken in income tax returns. FIN 48 is effective for fiscal years beginning after December 15, 2006. The Company adopted FIN 48 on January 1, 2007, which had no effect on the Company's financial statements. The Company recognizes interest and penalties in income tax expense. See Note 6 for further discussion.
Restricted Funds. The Company maintains a rabbi trust for the purposes of accumulating funds to satisfy the obligations incurred by us for the Supplemental Executive Retirement Plan ("SERP") under the employment agreement with Charles E. Harris.
Property and Equipment. Property and equipment are included in "Other Assets" and are carried at cost, less accumulated depreciation of $319,140. Depreciation is provided using the straight-line method over the estimated useful lives of the premises and equipment.
Recent Accounting Pronouncements. In February 2007, the FASB issued Statement No. 159, "The Fair Value Option for Financial Assets and Financial Liabilities" (“SFAS No. 159”). SFAS No. 159 would allow the Company an irrevocable election to measure certain financial assets and liabilities at fair value, with unrealized gains and losses on the elected items recognized in earnings at each reporting period. The fair value option may only be elected at the time of initial recognition of a financial asset or financial liability or upon the occurrence of certain specified events. The election is applied on an instrument-by-instrument basis, with a few exceptions, and is applied only to entire instruments and not to portions of instruments. SFAS No. 159 also provides expanded disclosure requirements regarding the effects of electing the fair value option on the financial statements. SFAS No. 159 is effective prospectively for fiscal years beginning after November 15, 2007. The Company is currently evaluating this Statement. However, as investments are carried at fair value, the Company does not anticipate that this Statement will have a significant impact on the consolidated financial statements.
NOTE 4. STOCK-BASED COMPENSATION
On March 23, 2006, the Board of Directors of the Company voted to terminate the Employee Profit-Sharing Plan and establish the Harris & Harris Group, Inc., 2006 Equity Incentive Plan (the “Stock Plan”), subject to shareholder approval. This proposal was approved at the May 4, 2006, Annual Meeting of Shareholders. The Stock Plan provides for the grant of equity-based awards of stock options and restricted stock (subject to receipt of an exemption order described below) to our directors, officers and employees who are selected by our Compensation Committee for participation in the plan and subject to compliance with the 1940 Act.
20
On July 11, 2006, the Company filed an application with the SEC regarding certain provisions of the Stock Plan, and on July 11, 2007, the Company responded to comments from the SEC on the application. In the event that the SEC provides the exemptive relief requested by the application, and we receive any additional stockholder approval required by the SEC, the Compensation Committee may, in the future, authorize awards under the Stock Plan to non-employee directors of the Company and authorize grants of restricted stock to employees.
A maximum of 20 percent of our total shares of our common stock issued and outstanding are available for awards under the Stock Plan. Under the Stock Plan, no more than 25 percent of the shares of stock reserved for the grant of the awards under the Stock Plan may be restricted stock awards at any time during the term of the Stock Plan. If any shares of restricted stock are awarded, such awards will reduce on a percentage basis the total number of shares of stock for which options may be awarded. If the Company does not receive exemptive relief from the SEC to issue restricted stock, all shares granted under the Stock Plan may be subject to stock options. No more than 1,000,000 shares of our common stock may be made subject to awards under the Stock Plan to any individual in any year.
On June 26, 2006, the Compensation Committee of the Board of Directors of the Company approved individual stock option awards for certain officers and employees of the Company. Both non-qualified stock options ("NQSOs") and incentive stock options ("ISOs"), subject to the limitations of Section 422 of the Internal Revenue Code, were awarded under the Stock Plan. The terms and conditions of the stock options granted were determined by the Compensation Committee and set forth in award agreements between the Company and each award recipient. Options to purchase a total of 3,958,283 shares of stock were granted with vesting periods ranging from December 2006 to June 2014 and with an exercise price of $10.11. Upon exercise, the shares will be issued from our previously authorized shares. The full Board of Directors ratified and approved the grants on August 3, 2006, on which date the Company's common stock price fluctuated between $9.76 and $10.00.
On June 27, 2007, the Compensation Committee of the Board of Directors of the Company approved a new grant of individual NQSO awards for certain officers and employees of the Company. The grant and exercise price were approved by the full Board of Directors on June 27, 2007. The terms and conditions of the stock options granted were determined by the Compensation Committee and set forth in award agreements between the Company and each award recipient entered into on that date. Options to purchase a total of 1,700,609 shares of stock were granted with vesting periods ranging from December 2007 to June 2014 and with an exercise price of $11.11, which was the closing volume weighted average price of our shares of common stock on June 27, 2007. Upon exercise, the shares would be issued from our previously authorized but unissued shares.
The Company accounts for the Stock Plan in accordance with the provisions of SFAS No. 123(R), “Share-Based Payment,” which requires that we determine the fair value of all share-based payments to employees, including the fair value of grants of employee stock options, and record these amounts as an expense in the Statement of Operations over the vesting period with a corresponding increase to our additional paid-in capital. At September 30, 2007, the increase to our operating expenses was offset by the increase to our additional paid-in capital, resulting in no net impact to our net asset value. Additionally, the Company does not record the tax benefits associated with the expensing of stock options, because the Company currently intends to qualify as a RIC under Subchapter M of the Code.
21
The amount of stock-based compensation expense recognized in the Consolidated Statements of Operations is based on the fair value of the awards the Company expects to vest, recognized over the vesting period on a straight-line basis for each award, and adjusted for actual forfeitures that occur before vesting. The forfeiture rate is estimated at the time of grant and revised, if necessary, in subsequent periods if the actual forfeiture rate differs from the estimated rate.
The fair value of each stock option award is estimated on the date of grant using the Black-Scholes option pricing model. The stock options granted on June 27, 2007, were awarded in four different grant types, each with different contractual terms. The assumptions used in the calculation of fair value of the stock options granted on June 27, 2007, using the Black-Scholes model for each contract term were as follows:
Number | Expected | Expected | Expected | Risk-free | Fair | |||||||||||||||||
Contractual | of Options | Term | Volatility | Dividend | Interest | Value | ||||||||||||||||
Type of Award | Term | Granted | in Yrs | Factor | Yield | Rates | Per Share | |||||||||||||||
| Non-qualified stock options | 1.5 Years | 380,000 | 1 | 42.6 | % | 0 | % | 4.93 | % | $ | 2.11 | |||||||||||
| Non-qualified stock options | 2.5 Years | 600,540 | 2 | 40.1 | % | 0 | % | 4.91 | % | $ | 2.92 | |||||||||||
| Non-qualified stock options | 3.5 Years | 338,403 | 3 | 44.7 | % | 0 | % | 4.93 | % | $ | 3.94 | |||||||||||
| Non-qualified stock options | 9 Years | 381,666 | Ranging from 4.75- 6.28 | Ranging from 57.8% to 59.9% | 0 | % | Ranging from 4.97% to 5.01% | Ranging from $5.92 to $6.85 | ||||||||||||||
| Total | 1,700,609 | |||||||||||||||||||||
For the three months and nine months ended September 30, 2007, the Company recognized $2,302,394 and $5,725,031 of compensation expense in the Consolidated Statements of Operations, respectively. As of September 30, 2007, there was approximately $10,137,379 of unrecognized compensation cost related to unvested stock option awards. This cost is expected to be recognized over a weighted-average period of approximately 1.6 years.
For the three months ended September 30, 2007, a total of 129,934 options were exercised for total proceeds to the Company of $1,313,633. For the nine months ended September 30, 2007, a total of 956,841 options were exercised for total proceeds to the Company of $9,673,662.
For the three months and nine months ended September 30, 2007, the calculation of the net decrease in net assets resulting from operations per share excludes the stock options because such options were anti-dilutive. The options may be dilutive in future periods in which there is a net increase in net assets resulting from operations, in the event that there is a significant increase in the average stock price in the stock market or significant decreases in the amount of unrecognized compensation cost.
22
A summary of the changes in outstanding stock options is as follows:
Weighted | ||||||||||||||||
Weighted | Weighted | Average | ||||||||||||||
Average | Average | Remaining | Aggregate | |||||||||||||
Exercise | Grant Date | Contractual | Intrinsic | |||||||||||||
Shares | Price | Fair Value | Term (Yrs) | Value | ||||||||||||
| Options Outstanding at January 1, 2007 | 3,699,611 | $ | 10.11 | $ | 4.43 | |||||||||||
| Granted | 1,700,609 | $ | 11.11 | $ | 3.68 | 3.68 | ||||||||||
| Exercised | (956,841 | ) | $ | 10.11 | $ | 1.94 | ||||||||||
| Forfeited or Expired | - . | |||||||||||||||
| Options Outstanding at September 30, 2007 | 4,443,379 | $ | 10.49 | $ | 4.68 | 4.58 | $ | 1,453,668 | ||||||||
| Options Exercisable at September 30, 2007 | 1,062,195 | $ | 10.11 | $ | 5.34 | 5.42 | $ | 562,963 | ||||||||
Options Exercisable and Expected to be Exercisable at September 30, 2007 | 4,060,974 | $ | 10.52 | $ | 4.63 | 4.56 | $ | 1,259,697 | ||||||||
The aggregate intrinsic value in the table above with respect to options outstanding, exercisable and expected to be exercisable, is calculated as the difference between the Company's closing stock price of $10.64 on the last trading day of the third quarter of 2007 and the exercise price, multiplied by the number of in-the-money options. This represents the total pre-tax intrinsic value that would have been received by the option holders had all options been fully vested and all option holders exercised their awards on September 30, 2007.
For the nine months ended September 30, 2007, the aggregate intrinsic value of the 956,841 options exercised was $1,674,126.
Unless earlier terminated by our Board of Directors, the Stock Plan will expire on May 4, 2016. The expiration of the Stock Plan will not by itself adversely affect the rights of plan participants under awards that are outstanding at the time the Stock Plan expires. Our Board of Directors may terminate, modify or suspend the plan at any time, provided that no modification of the plan will be effective unless and until any required shareholder approval has been obtained. The Compensation Committee may terminate, modify or amend any outstanding award under the Stock Plan at any time, provided that in such event, the award holder may exercise any vested options prior to such termination of the Stock Plan or award.
NOTE 5. EMPLOYEE PROFIT-SHARING PLAN
Prior to the adoption of the Stock Plan, the Company operated the Amended and Restated Harris & Harris Group, Inc. Employee Profit-Sharing Plan (the "2002 Plan"). Effective May 4, 2006, the 2002 Plan was terminated.
23
The 2002 Plan (and its predecessor) provided for profit sharing by our officers and employees equal to 20 percent of our "qualifying income" for that plan year.
As soon as practicable following the year-end, the Compensation Committee determined whether, and if so how much, qualifying income existed for a plan year. Approximately 90 percent of the amount determined by the Compensation Committee was then paid out to plan participants pursuant to the distribution percentages set forth in the 2002 Plan. The remaining payment was paid out after we finalized our tax returns for that plan year.
At September 30, 2007, and December 31, 2006, we accrued $0 and $261,661, respectively, for profit sharing. On March 1, 2006, the Company paid $1,897,072 to plan participants (employees and former employees), which represented approximately 90 percent of the total estimated profit-sharing payment for 2005. The balance of $261,661 was paid on January 31, 2007, upon finalization of our tax returns.
NOTE 6. INCOME TAXES
We filed for the 1999 tax year to elect treatment as a regulated investment company ("RIC") under Subchapter M of the Internal Revenue Code of 1986 (the "Code") and qualified for the same treatment for the years 2000 through 2006. On June 20, 2007, we received SEC certification for 2006 pursuant to Section 851(e) of the Code. However, there can be no assurance that we will qualify as a RIC for 2007 or subsequent years. In addition, under certain circumstances, even if we qualified for Subchapter M treatment for a given year, we might take action in a subsequent year to ensure that we would be taxed in that subsequent year as a C Corporation, rather than as a RIC. As a RIC, we must, among other things, distribute at least 90 percent of our investment company taxable income and may either distribute or retain our realized net capital gains on investments.
Provided that a proper election is made, a corporation taxable under Subchapter C of the Code or a C Corporation that elects to qualify as a RIC continues to be taxable as a C Corporation on any gains realized within 10 years of its qualification as a RIC (the "Inclusion Period") from sales of assets that were held by the corporation on the effective date of the RIC election ("C Corporation Assets"), to the extent of any gain built into the assets on such date ("Built-In Gain"). If the corporation fails to make a proper election, it is taxable on its Built-In Gain as of the effective date of its RIC election. We had Built-In Gains at the time of our qualification as a RIC and made the election to be taxed on any Built-In Gain realized during the Inclusion Period.
We adopted FIN 48 as of January 1, 2007, the beginning of our fiscal year. As of January 1, 2007, we had unrecognized tax benefits of $0 and did not record any cumulative effect adjustment to net assets as a result of adopting FIN 48.
For federal tax purposes, the Company’s 2004 through 2006 tax years remain open for examination by the tax authorities under the normal three year statute of limitations. Generally, for state tax purposes, the Company’s 2004 through 2006 tax years remain open for examination by the tax authorities under a four year statute of limitations.
24
For the nine months ended September 30, 2007, we paid $74,454 in federal income tax interest and penalties related to the Built-In Gains recognized in the Company's 2005 tax year, which is included in income tax expense. During the third quarter of 2007, we paid $851 in federal, state and local income taxes. At September 30, 2007, we had $0 accrued for federal, state and local taxes payable by the Company.
We pay federal, state and local taxes on behalf of our wholly owned subsidiary, Harris & Harris Enterprises, Inc., which is taxed as a C Corporation. For the three months ended September 30, 2007, our income tax expense for Harris & Harris Enterprises, Inc., was $3,232. For the three months ended September 30, 2006, our income tax benefit for Harris & Harris Enterprises, Inc., was $7,571. For the nine months ended September 30, 2007, and 2006, our income tax expense for Harris & Harris Enterprises, Inc., was $3,232 and $9,475, respectively.
Continued qualification as a RIC requires us to satisfy certain investment asset diversification requirements in future years. Our ability to satisfy those requirements may not be controllable by us. There can be no assurance that we will qualify as a RIC in subsequent years.
NOTE 7. CAPITAL TRANSACTIONS
On November 29, 2006, we filed a registration statement with the SEC on Form N-2 to register 4,000,000 shares of our common stock. On December 11, 2006, and on April 23, 2007, we filed amended registration statements with the SEC. On May 11, 2007, the SEC declared the registration statement effective. The common stock may be sold at prices and on terms to be set forth in one or more supplements to the prospectus from time to time.
On June 25, 2007, we completed the sale of 1,300,000 shares of our common stock for gross proceeds of $14,027,000; net proceeds of this offering, after placement agent fees and offering costs of $1,033,832, were $12,993,168.
NOTE 8. CHANGE IN NET ASSETS PER SHARE
The following table sets forth the computation of basic and diluted per share net increases in net assets resulting from operations for the three and nine months ended September 30, 2007, and September 30, 2006, respectively.
For the Three Months Ended September 30 | For the Nine Months Ended September 30 | ||||||||||||
2007 | 2006 | 2007 | 2006 | ||||||||||
| Numerator for increase (decrease) in net assets per share | $ | 604,237 | $ | (2,588,092 | ) | $ | (9,879,567 | ) | $ | (5,525,079 | ) | ||
| Denominator for basic and diluted weighted average shares | 23,235,023 | 20,756,345 | 22,084,893 | 20,756,345 | |||||||||
| Basic and diluted net increase (decrease) in net assets per share resulting from operations | $ | 0.03 | $ | (0.12 | ) | $ | (0.45 | ) | $ | (0.27 | ) | ||
25
NOTE 9. SUBSEQUENT EVENTS
On October 11, 2007, we made a $1,993,568 follow-on investment in Innovalight, Inc.
On October 16, 2007, we made a $58,582 follow-on investment that has not yet been announced in a privately held tiny technology portfolio company.
On October 17, 2007, we made a $160,723 new investment that has not yet been announced in a privately held tiny technology portfolio company.
On October 24, 2007, we made a $50,000 new investment that has not yet been announced in a privately held tiny technology portfolio company.
On October 30, 2007, we received proceeds of $123,000 from the sale of the assets of AlphaSimplex Group, LLC, to Natixis Global Asset Management.
On November 7, 2007, we made an $851,393 follow-on investment that has not yet been announced in a privately held tiny technology portfolio company.
26
HARRIS & HARRIS GROUP, INC. FINANCIAL HIGHLIGHTS (Unaudited) |
Three Months Ended Sept. 30 | Nine Months Ended Sept. 30 | ||||||||||||
2007 | 2006 | 2007 | 2006 | ||||||||||
| Per Share Operating Performance | |||||||||||||
| Net asset value per share, beginning | |||||||||||||
| of period | $ | 5.54 | $ | 5.54 | $ | 5.42 | $ | 5.68 | |||||
| Net operating (loss)* | (0.13 | ) | (0.14 | ) | (0.39 | ) | (0.22 | ) | |||||
| Net realized income (loss) | |||||||||||||
| on investments* | 0.00 | 0.01 | (0.01 | ) | 0.01 | ||||||||
| Net (increase) decrease in unrealized | |||||||||||||
| depreciation as a result of sales* | 0.00 | 0.00 | (0.00 | ) | 0.00 | ||||||||
| Net decrease (increase) in unrealized | |||||||||||||
| depreciation on investments held* | 0.16 | 0.01 | (0.05 | ) | (0.06 | ) | |||||||
| Total from investment operations* | 0.03 | (0.12 | ) | (0.45 | ) | (0.27 | ) | ||||||
| Net increase as a result of stock- | |||||||||||||
| based compensation* | 0.10 | 0.12 | 0.26 | 0.13 | |||||||||
| Net increase as a result of stock- | |||||||||||||
| offering | 0.00 | 0.00 | 0.26 | 0.00 | |||||||||
| Net increase as a result of proceeds | |||||||||||||
| from exercise of options | 0.02 | 0.00 | 0.20 | 0.00 | |||||||||
| Total increase from capital | |||||||||||||
| stock transactions | 0.12 | 0.12 | 0.72 | 0.13 | |||||||||
| Net asset value per share, end | |||||||||||||
| of period | $ | 5.69 | $ | 5.54 | $ | 5.69 | $ | 5.54 | |||||
| Stock price per share, end | |||||||||||||
| of period | $ | 10.64 | $ | 12.28 | $ | 10.64 | $ | 12.28 | |||||
Total return based on stock price (1) | (5.00 | )% | 11.23 | % | (11.99 | )% | (11.65 | )% | |||||
Supplemental Data: | |||||||||||||
| Net assets, end of period | $ | 132,442,597 | $ | 115,048,343 | $ | 132,442,597 | $ | 115,048,343 | |||||
| Ratio of expenses to average | |||||||||||||
net assets (1) | 3.0 | % | 3.2 | % | 8.8 | % | 5.8 | % | |||||
| Ratio of net operating income (loss) to | |||||||||||||
average net assets (1) | (2.4 | )% | (2.6 | )% | (7.1 | )% | (3.8 | )% | |||||
| Cash dividend paid per share | $ | 0.00 | $ | 0.00 | $ | 0.00 | $ | 0.00 | |||||
| Deemed dividend per share | $ | 0.00 | $ | 0.00 | $ | 0.00 | $ | 0.00 | |||||
| Number of shares outstanding, | |||||||||||||
| end of period | 23,271,858 | 20,756,345 | 23,271,858 | 20,756,345 | |||||||||
* Based on Average Shares Outstanding
(1) Not annualized
The accompanying notes are an integral part of this schedule.
27
| Item 2. | Management's Discussion and Analysis of Financial Condition and Results of Operations |
The information contained in this section should be read in conjunction with the Company's unaudited September 30, 2007 Consolidated Financial Statements and the Company's audited 2006 Consolidated Financial Statements and notes thereto.
Background and Overview
We incorporated under the laws of the state of New York in August 1981. In 1983, we completed an initial public offering and invested $406,936 in Otisville BioTech, Inc., which also completed an initial public offering later that year. In 1984, Charles E. Harris purchased a controlling interest in us, which also made him the control person of Otisville. We then divested our other assets and became a financial services company, with the investment in Otisville as the initial focus of our business activity.
In 1992, we registered as an investment company under the 1940 Act, commencing operations as a closed-end, non-diversified investment company. In 1995, we elected to become a business development company subject to the provisions of Sections 55 through 65 of the 1940 Act.
Throughout our corporate history, we have made early stage venture capital investments in private and public companies in a variety of industries. We define venture capital investments as investments in start-up firms and small businesses with exceptional growth potential. We have invested a substantial portion of our assets in venture capital investments of development stage or start-up companies. These businesses tend to be thinly capitalized, unproven, small companies that lack management depth, have little or no history of operations and are developing unproven technologies. At September 30, 2007, $69,270,640, or 52.30 percent, of our net assets at fair value consisted of private venture capital investments, net of unrealized depreciation of $10,292,463. At December 31, 2006, $53,667,831, or 47.1 percent, of our net assets at fair value consisted of private venture capital investments, net of unrealized depreciation of $8,450,969.
Since our investment in Otisville in 1983 through September 30, 2007, we have made a total of 78 venture capital investments, including four private placement investments in securities of publicly traded companies. We have sold 44 of these 78 investments, realizing total proceeds of $143,614,382 on our invested capital of $51,229,202. As measured from first dollar in to last dollar out, the average and median holding periods for these 44 investments were 3.63 years and 3.19 years, respectively. As measured by the 149 separate rounds of investment within these 44 investments, the average and median holding periods for the 149 separate rounds of investment were 2.84 years and 2.44 years, respectively.
In 1994, we made our first tiny technology investment. From August 2001 through September 30, 2007, all 36 of our initial investments have been in tiny technology. From August 2001 through September 30, 2007, we have invested a total (before any subsequent write-ups, write-downs or dispositions) of $83,520,974 in tiny technology.
28
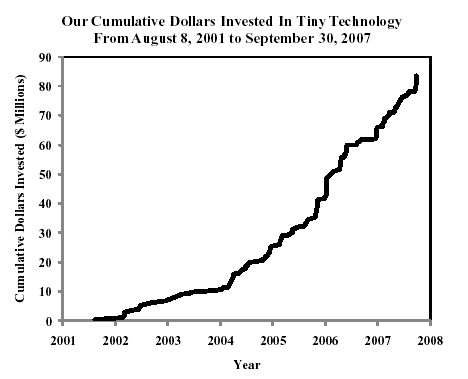
The following is a summary of our initial and follow-on investments in tiny technology from 2001 to the present. We consider a "round led" to be a round where we were the new investor or the leader of a set of new investors in an investee company. Typically, but not always, the lead investor negotiates the price and terms of a deal with the investee company.
2001 | 2002 | 2003 | 2004 | 2005 | 2006 | YTD 9/30/07 | ||||||||||||||||
| Total Incremental Investments | $ | 489,999 | $ | 6,240,118 | $ | 3,812,600 | $ | 14,837,846 | $ | 16,251,339 | $ | 24,408,187 | $ | 17,480,885 | ||||||||
| No. of New Investments | 1 | 7 | 5 | 8 | 4 | 6 | 5 | |||||||||||||||
| No. of Follow-On Investment Rounds | 0 | 1 | 5 | 21 | 13 | 14 | 17 | |||||||||||||||
| No. of Rounds Led | 0 | 1 | 0 | 2 | 0 | 7 | 2 | |||||||||||||||
| Average Dollar Amount - Initial | $ | 489,999 | $ | 784,303 | $ | 437,156 | $ | 911,625 | $ | 1,575,000 | $ | 2,383,424 | $ | 1,478,871 | ||||||||
| Average Dollar Amount - Follow-On | N/A | $ | 750,000 | $ | 325,364 | $ | 359,278 | $ | 765,488 | $ | 721,974 | $ | 593,325 | |||||||||
29
We currently have 32 tiny technology companies in our portfolio, including one tiny technology company we invested in prior to August 2001. At September 30, 2007, from first dollar in, the average and median holding periods for these 32 venture capital investments were 3.03 years and 2.80 years, respectively.
We currently have in our portfolio 28 tiny technology companies that we define as going concerns. At September 30, 2007, from first dollar in, the average and median holding periods for these 28 venture capital investments were 2.96 and 2.80 years, respectively.
We have disposed of five of our initial investments made between August 2001 and September 30, 2007. We sold one, NanoGram Devices Corp., for a gain of $1,936,745, and we sold four for a total loss of $5,048,043.
We value our private venture capital investments each quarter as determined in good faith by our Valuation Committee, a committee of all of our independent directors, within guidelines established by our Board of Directors in accordance with the 1940 Act. (See "Footnote to Consolidated Schedule of Investments" contained in "Consolidated Financial Statements.")
In the years 2001 through September 30, 2007, the Company recorded the following gross write-ups in privately held securities as a percentage of net assets at the beginning of the year ("BOY"), gross write-downs in privately held securities as a percentage of net assets at the beginning of the year, and net write-ups/(write-downs) in privately held securities as a percentage of net assets at the beginning of the year.
2001 | 2002 | 2003 | 2004 | 2005 | 2006 | YTD 9/30/07 | ||||||||||||||||
| Net Asset Value, ("BOY") | $ | 31,833,475 | $ | 24,334,770 | $ | 27,256,046 | $ | 40,682,738 | $ | 74,744,799 | $ | 117,987,742 | $ | 113,930,303 | ||||||||
| Gross Write-Downs During Year | $ | (2,532,730 | ) | $ | (5,400,005 | ) | $ | (1,256,102 | ) | $ | (5,711,229 | ) | $ | (3,450,236 | ) | $ | (4,211,323 | ) | $ | (6,870,501 | ) | |
| Gross Write-Ups During Year | $ | 1,528,866 | $ | 285 | $ | 847,578 | $ | 6,288,397 | $ | 23,485,176 | $ | 279,363 | $ | 5,029,008 | ||||||||
| Gross Write-Downs as a Percentage of Net Asset Value, BOY | -7.96 | % | -22.19 | % | -4.61 | % | -14.04 | % | -4.62 | % | -3.57 | % | -6.03 | % | ||||||||
| Gross Write-Ups as a Percentage of Net Asset Value, BOY | 4.80 | % | 0 | % | 3.11 | % | 15.46 | % | 31.42 | % | 0.24 | % | 4.41 | % | ||||||||
| Net Write-Downs/Write-Ups as a Percentage of Net Asset Value, BOY | -3.15 | % | -22.19 | % | -1.49 | % | 1.42 | % | 26.8 | % | -3.33 | % | -1.62 | % | ||||||||
30
We have discretion in the investment of our capital. However, we invest primarily in illiquid equity securities of private companies. Generally, these investments take the form of preferred stock, are subject to restrictions on resale and have no established trading market. Our principal objective is to achieve long-term capital appreciation. Therefore, a significant portion of our investment portfolio provides little or no income in the form of dividends or interest. We earn interest income from fixed-income securities, including U.S. government and agency securities. The amount of interest income we earn varies with the average balance of our fixed-income portfolio and the average yield on this portfolio. Interest income is secondary to capital gains and losses in our results of operations.
We present the financial results of our operations utilizing accounting principles generally accepted in the United States for investment companies. On this basis, the principal measure of our financial performance during any period is the net increase/(decrease) in our net assets resulting from our operating activities, which is the sum of the following three elements:
Net Operating Income / (Loss) - the difference between our income from interest, dividends, and fees and our operating expenses.
Net Realized Income / (Loss) on Investments - the difference between the net proceeds of sales of portfolio securities and their stated cost, plus income from interests in limited liability companies.
Net Increase / (Decrease) in Unrealized Appreciation or Depreciation on Investments - the net unrealized change in the value of our investment portfolio.
Owing to the structure and objectives of our business, we generally expect to experience net operating losses and seek to generate increases in our net assets from operations through the long-term appreciation of our venture capital investments. We have relied, and continue to rely, on proceeds from sales of investments and on sales of additional shares, rather than on investment income, to defray a significant portion of our operating expenses. Because such sales are unpredictable, we attempt to maintain adequate working capital to provide for fiscal periods when there are no such sales.
Results of Operations
Three months ended September 30, 2007, as compared to the three months ended September 30, 2006
In the three months ended September 30, 2007, we had a net increase in net assets resulting from operations of $604,237. In the three months ended September 30, 2006, we had a net decrease in net assets resulting from operations of $2,588,092.
Investment Income and Expenses:
We had net operating losses of $3,117,595 and $2,988,790 for the three months ended September 30, 2007, and September 30, 2006, respectively. The variation in these results is primarily owing to the changes in investment income and operating expenses, including non-cash expenses for stock-based compensation. During the three months ended September 30, 2007, and 2006, total investment income was $743,414 and $719,619, respectively. During the three months ended September 30, 2007, and 2006, total operating expenses were $3,861,009 and $3,708,409, respectively, including $2,302,394 and $2,470,135 in non-cash expenses for stock-based compensation.
31
During the three months ended September 30, 2007, as compared with the same period in 2006, investment income increased from $719,619 to $743,414, owing to an increase in our average holdings of U.S. government and agency securities. During the three months ended September 30, 2007, our average holdings of such securities were $67,656,776, as compared with $63,533,891 at September 30, 2006.
Operating expenses, including non-cash, stock-based compensation expenses, were $3,861,009 and $3,708,409 for the three months ended September 30, 2007, and September 30, 2006, respectively. The increase in operating expenses for the three months ended September 30, 2007, as compared to the three months ended September 30, 2006, was primarily owing to increases in salaries, benefits and stock-based compensation expense, increases in administration and operations expense and professional fees. Salaries, benefits and stock-based compensation expense increased by $79,500, or 2.5 percent, through September 30, 2007, as compared to September 30, 2006, owing to an increase in our head count as compared with that of the same period in 2006. At September 30, 2007, we had 13 full-time employees and one part-time employee, as compared with 10 full-time employees and one part-time employee at September 30, 2006. Administration and operations expense increased by $68,402, or 28.2 percent, through September 30, 2007, as compared to September 30, 2006, owing to an increase in NASDAQ Global Market fees of approximately $15,000 related to the increase in our number of outstanding shares, as well as to an increase in office and travel expenses related to the increase in headcount. Professional fees increased by $60,257, or 62.9 percent, primarily as a result of an increase in legal, accounting and consulting fees.
Realized Income and Losses on Investments:
We had realized net gains on investments of $14,828 and $6,420 during the three months ended September 30, 2007, and September 30, 2006, respectively.
During the three months ended September 30, 2007, we realized net gains of $14,828, consisting primarily of realized gains on the sale of U.S. government and agency securities and a gain realized from a distribution from Exponential Business Development Company.
During the three months ended September 30, 2006, we realized net gains of $6,420, consisting of income from our investments in AlphaSimplex Group, LLC and Exponential Business Development Company. During the three months ended September 30, 2006, we realized a net tax benefit of $242,352 related to taxes incurred in 2005.
Net Unrealized Appreciation and Depreciation on Portfolio Securities:
During the three months ended September 30, 2007, net unrealized depreciation on total investments decreased by $3,711,087, or 26.8 percent, from net unrealized depreciation of $13,838,647 at June 30, 2007, to net unrealized depreciation of $10,127,560 at September 30, 2007. Net unrealized depreciation on total investments decreased by $151,928, or 2.5 percent, during the three months ended September 30, 2006, from net unrealized depreciation of $6,057,825 at June 30, 2006, to net unrealized depreciation of $5,905,897 at September 30, 2006.
32
During the three months ended September 30, 2007, net unrealized depreciation on our venture capital investments decreased by $3,028,058, from $13,320,521 to $10,292,463, owing primarily to increases in the valuations of our investments in AlphaSimplex Group, LLC, of $113,964, CSwitch, Inc., of $48,935, Exponential Business Development Company of $1,973, Innovalight, Inc., of $3,218,216 and SiOnyx, Inc., of $899,566, partially offset by decreases in the valuations of our investments in BridgeLux, Inc., of $41,605, Chlorogen, Inc., of $23,122, Evolved Nanomaterial Sciences, Inc., of $438,042, Nanomix, Inc., of $549,774, NanoOpto Corporation of $60,000, Polatis, Inc., of $184,323 and Questech Corporation of $85,210. We also had an increase in the value of our investment in D-Wave Systems, Inc., of $127,480 owing to foreign currency translation. Unrealized depreciation on our U.S. government and agency securities portfolio decreased from $518,126 at June 30, 2007, to an unrealized appreciation of $164,903 at September 30, 2007.
During the three months ended September 30, 2006, net unrealized depreciation on our venture capital investments increased by $509,596, from $4,930,090 to $5,439,686, owing primarily to decreases in the valuation of our investments in Polatis, Inc., of $105,503 and SiOnyx, Inc., of $679,950 and increases in the valuations of our investments in NeoPhotonics Corporation of $65,405 and Questech Corporation of $190,875. We also had an unrealized loss on our investment in D-Wave Systems, Inc., of $160, because of foreign currency translation gains or losses. Unrealized depreciation on our U.S. government and agency securities portfolio decreased by $661,524, from $1,127,735 at June 30, 2006, to $466,211 at September 30, 2006.
Nine months ended September 30, 2007, as compared to the nine months ended September 30, 2006
In the nine months ended September 30, 2007, we had a net decrease in net assets resulting from operations of $9,879,567. In the nine months ended September 30, 2006, we had a net decrease in net assets resulting from operations of $5,525,079.
Investment Income and Expenses:
We had net operating losses of $8,676,380 and $4,450,420 for the nine months ended September 30, 2007, and September 30, 2006, respectively. The variation in these results is primarily owing to the changes in investment income and operating expenses, including non-cash, stock-based compensation expenses. During the nine months ended September 30, 2007, and 2006, total investment income was $2,033,613 and $2,309,746, respectively. During the nine months ended September 30, 2007, and 2006, total operating expenses were $10,709,993 and $6,760,166, respectively, including non-cash, stock-based compensation expenses.
During the first nine months of 2007, as compared with the same period in 2006, investment income decreased from $2,309,746 to $2,033,613, owing to a decrease in our average holdings throughout the period of U.S. government and agency securities. During the nine months ended September 30, 2007, our average holdings of such securities were $62,541,791, as compared with $71,843,823 at September 30, 2006.
Operating expenses, including non-cash, stock-based compensation expenses, were $10,709,993 and $6,760,166 for the nine months ended September 30, 2007, and September 30, 2006, respectively. The increase in operating expenses for the nine months ended September 30, 2007, as compared to the nine months ended September 30, 2006, was primarily owing to increases in salaries, benefits and stock-based compensation expense and increases in administration and operations expense, professional fees and directors' fees and expenses. Salaries, benefits and non-cash, stock-based compensation expense increased by $3,668,038, or 77.4 percent, through September 30, 2007, as compared to September 30, 2006, primarily as a result of an increase in non-cash expense of $3,139,351 through September 30, 2007, associated with the Stock Plan. While the non-cash, stock-based, compensation expense for the Stock Plan increased our operating expenses by $5,725,031, this increase was offset by a corresponding increase to our additional paid-in capital, resulting in no net impact to our net asset value. The non-cash, stock-based, compensation expense and corresponding increase to our additional paid-in capital may increase in future quarters. Salaries and benefits also increased for the nine months ended September 30, 2007, owing to an increase in our head count as compared with that of the same period in 2006. At September 30, 2007, we had 13 full-time employees and one part-time employee, as compared with 10 full-time employees and one part-time employee at September 30, 2006. Administration and operations expense increased by $77,904, or 8.0 percent, for the nine months ended September 30, 2007, as compared with the same period in 2006 owing to increased office-related expenses and travel costs. Professional fees increased by $189,694, or 39.2 percent, primarily as a result of an increase in legal fees, an increase in audit fees and corporate consulting costs for the audit of our compliance program. Directors' fees and expenses increased by $67,628, or 25.4 percent, primarily as a result of additional meetings held in the period ended September 30, 2007, as compared with the period ended September 30, 2006, as well as an increase in the monthly retainers paid to Committee Chairs and the Lead Independent Director.
33
Realized Income and Losses on Investments:
During the nine months ended September 30, 2007, we realized net gains on investments of $5,941. During the nine months ended September 30, 2006, we realized net gains on investments of $19,873.
During the nine months ended September 30, 2007, we realized net gains of $5,941, consisting primarily of net realized losses on the sale of U.S. government and agency securities, offset by income from our investments in AlphaSimplex Group, LLC and Exponential Business Development Company.
During the nine months ended September 30, 2006, we realized net gains of $19,873, consisting primarily of proceeds received from the liquidation of Optiva, Inc., and proceeds received from Exponential Business Development Company, offset by net losses realized on our investment in AlphaSimplex Group, LLC. During 2005, we deemed the securities we held in Optiva, Inc., to be worthless and realized a loss of $1,619,245. At December 31, 2005, we recorded a $75,000 receivable for estimated proceeds from the final payment on Optiva, Inc., bridge notes. During the first quarter of 2006, we received payment of $95,688 from these bridge notes, resulting in the realized gain of $20,688 on Optiva, Inc. These gains were offset by a net reduction in value of $10,757 of our investment in AlphaSimplex Group, LLC. During the nine months ended September 30, 2006, we realized tax benefits of $222,815 for 2005 taxes.
Net Unrealized Appreciation and Depreciation on Investments:
During the nine months ended September 30, 2007, net unrealized depreciation on total investments increased by $1,120,140, or 12.44 percent, from net unrealized depreciation of $9,007,420 at December 31, 2006, to net unrealized depreciation of $10,127,560 at September 30, 2007. During the nine months ended September 30, 2006, net unrealized depreciation on total investments increased by $1,317,347, or 28.7 percent, from net unrealized depreciation of $4,588,550 at December 31, 2005, to net unrealized depreciation of $5,905,897 at September 30, 2006.
34
During the nine months ended September 30, 2007, net unrealized depreciation on our venture capital investments increased by $1,841,494, from $8,450,969 to $10,292,463, owing primarily to decreases in the valuations of our investments in Chlorogen, Inc., of $1,326,073, Evolved Nanomaterial Sciences, Inc., of $2,800,000, Nanomix, Inc., of $1,009,546, NanoOpto Corporation of $1,475,599, Polatis, Inc., of $9,534 and Questech Corporation of $249,749, offset partially by increases in the valuation of our investments in AlphaSimplex Group, LLC, of $113,964, BridgeLux, Inc., of $328,369, CSwitch, Inc., of $48,935, Exponential Business Development Company of $1,973, Innovalight, Inc., of $3,218,216, Kovio, Inc., of $125,000 and SiOnyx, Inc., of $899,566. We also had an increase owing to foreign currency translation of $291,796 on our investment in D-Wave Systems, Inc. Unrealized depreciation on our U.S. government and agency securities portfolio decreased from $556,451 at December 31, 2006, to unrealized appreciation of $164,903 at September 30, 2007.
During the nine months ended September 30, 2006, net unrealized depreciation on our venture capital investments increased by $920,677, from $4,519,009 to $5,439,686, owing primarily to decreases in the valuation of our investments in NeoPhotonics Corporation of $254,238, Polatis, Inc., of $105,503, SiOnyx, Inc., of $679,950 and Zia Laser, Inc., of $187,500, and an increase in the valuations of our investments in Crystal IS of $19,735 and Questech Corporation of $247,809. We also had an increase, owing to foreign currency translation, of $43,015 on our investment in D-Wave Systems, Inc. Unrealized depreciation on our U.S. government and agency securities portfolio increased from $69,541 at December 31, 2005, to $466,211 at September 30, 2006.
Financial Condition
Nine Months ended September 30, 2007
At September 30, 2007, our total assets and net assets were $136,696,479 and $132,442,597, respectively. At December 31, 2006, they were $118,328,590 and $113,930,303, respectively.
At September 30, 2007, net asset value per share was $5.69, as compared with $5.42 at December 31, 2006. At September 30, 2007, our shares outstanding increased to 23,271,858, as compared with 21,015,017 at December 31, 2006.
Significant developments in the nine months ended September 30, 2007, included an increase in the value of our venture capital investments of $15,602,809 and an increase in the value of our investment in U.S. government and agency obligations of $5,019,705. The increase in the value of our venture capital investments, from $53,667,831 at December 31, 2006, to $69,270,640 at September 30, 2007, resulted primarily from five new and 17 follow-on investments, partially offset by a net decrease of $1,841,494 in the net value of our venture capital investments. The increase in the value of our U.S. government and agency obligations, from $58,656,147 at December 31, 2006, to $63,675,852 at September 30, 2007, is primarily owing to the use of net proceeds of $12,993,168 received through a registered stock offering and proceeds received from stock option exercises of $9,673,662, offset by a payment of $74,454 for federal tax interest and penalties, profit sharing payments of $261,661, net operating expenses and by new and follow-on venture capital investments totaling $17,480,885.
35
The following table is a summary of additions to our portfolio of venture capital investments during the nine months ended September 30, 2007:
| New Investment | Amount | |||
| Adesto Technologies Corporation | $ | 1,147,826 | ||
| Ancora Pharmaceuticals, Inc. | $ | 800,000 | ||
| BioVex Group, Inc. | $ | 2,500,000 | ||
| Ensemble Discovery Corporation | $ | 2,000,000 | ||
| Lifco, Inc. | $ | 946,528 | ||
| BridgeLux, Inc. | $ | 350,877 | ||
| BridgeLux, Inc. | $ | 233,918 | ||
| BridgeLux, Inc. | $ | 916,928 | ||
| Cambrios Technologies Corporation | $ | 1,300,000 | ||
| Chlorogen, Inc. | $ | 7,042 | ||
| CSwitch, Inc. | $ | 32,624 | ||
| CSwitch, Inc. | $ | 529,852 | ||
| Kereos, Inc. | $ | 540,000 | ||
| Kovio, Inc. | $ | 1,000,000 | ||
| Mersana Therapeutics, Inc. | $ | 500,000 | ||
| Nanomix, Inc. | $ | 680,240 | ||
| NanoOpto Corporation | $ | 268,654 | ||
| Nextreme Thermal Solutions, Inc. | $ | 750,000 | ||
| Polatis, Inc. | $ | 17,942 | ||
| Polatis, Inc. | $ | 13,454 | ||
| SiOnyx, Inc. | $ | 2,445,000 | ||
| Solazyme, Inc. | $ | 500,000 | ||
| Total | $ | 17,480,885 | ||
The following tables summarize the fair values of our portfolios of venture capital investments and U.S. government and agency obligations, as compared with their cost, at September 30, 2007, and December 31, 2006:
September 30, 2007 | December 31, 2006 | ||||||
| Venture capital investments, | |||||||
| at cost | $ | 79,563,103 | $ | 62,118,800 | |||
Net unrealized depreciation (1) | 10,292,463 | 8,450,969 | |||||
at value | $ | 69,270,640 | $ | 53,667,831 | |||
36
September 30, 2007 | December 31, 2006 | ||||||
| U.S. government and agency | |||||||
| obligations, at cost | $ | 63,510,949 | $ | 59,212,598 | |||
| Net unrealized appreciation | |||||||
(depreciation) (1) | 164,903 | (556,451 | ) | ||||
obligations, at value | $ | 63,675,852 | $ | 58,656,147 | |||
1)At September 30, 2007, and December 31, 2006, the net accumulated unrealized depreciation on investments was $10,127,560 and $9,007,420, respectively.
The following table summarizes the fair value composition of our venture capital investment portfolio at September 30, 2007, and December 31, 2006.
September 30, 2007 | December 31, 2006 | ||||||
Category | |||||||
| Tiny Technology | 99.9 | % | 99.9 | % | |||
| 0.1 | % | 0.1 | % | ||||
Total Venture Capital Investments | 100.0 | % | 100.0 | % | |||
Liquidity
Our primary sources of liquidity are cash, receivables and freely marketable securities, net of short-term indebtedness. Our secondary sources of liquidity are restricted securities of companies that are publicly traded.
At September 30, 2007, and December 31, 2006, our total net primary liquidity was $64,463,083 and $61,323,306, respectively, and our secondary liquidity was $0 and $0, respectively.
The increase in our primary liquidity from December 31, 2006, to September 30, 2007, is primarily owing to the proceeds received through a registered direct stock offering from a shelf registration statement and proceeds received from stock option exercises, offset by the use of funds for investments and payment of net operating expenses. In the future, we may sell additional shares registered pursuant to our shelf registration statement.
Capital Resources
On November 29, 2006, we filed a shelf registration statement with the SEC on Form N-2 to register 4,000,000 shares of our common stock. On December 11, 2006, and on April 23, 2007, we filed amended registration statements with the SEC. On May 11, 2007, the SEC declared the registration statement effective. The common stock may be sold at prices and on terms to be set forth in one or more supplements to the prospectus from time to time.
37
On June 25, 2007, we completed the sale of 1,300,000 shares of our common stock from our shelf registration statement for gross proceeds of $14,027,000; net proceeds of this offering, after placement agent fees and offering costs of $1,033,832, were $12,993,168. We intend to use, and have been using, the net proceeds of this offering to make new investments in tiny technology, as well as for follow-on investments in our existing venture capital investments and for working capital. Through September 30, 2007, we have used $4,464,486 of the net proceeds from this offering for these purposes.
Critical Accounting Policies
The Company's significant accounting policies are described in Note 3 to the Consolidated Financial Statements and in the Footnote to the Consolidated Schedule of Investments. Critical accounting policies are those that are both important to the presentation of our financial condition and results of operations and those that require management’s most difficult, complex or subjective judgments. The Company considers the following accounting policies and related estimates to be critical:
Stock-Based Compensation
Determining the appropriate fair-value model and calculating the fair value of share-based awards at the date of grant requires judgment. We use the Black-Scholes option pricing model to estimate the fair value of employee stock options, consistent with the provisions of SFAS No. 123(R). Management uses the Black-Scholes option pricing model because of the lack of the historical option data that is required for use in other, more complex models. Other models may yield fair values that are significantly different from those calculated by the Black-Scholes option pricing model.
Option pricing models, including the Black-Scholes model, require the use of subjective input assumptions, including expected volatility, expected life, expected dividend rate, and expected risk-free rate of return. In the Black-Scholes model, variations in the expected volatility or expected term assumptions have a significant impact on fair value. As the volatility or expected term assumptions increase, the fair value of the stock option increases. In the Black-Scholes model, the expected dividend rate and expected risk-free rate of return are not as significant to the calculation of fair value. A higher assumed dividend rate yields a lower fair value, whereas higher assumed interest rates yield higher fair values for stock options.
We use the simplified calculation of expected life described in the SEC’s Staff Accounting Bulletin 107 because of the lack of historical information about option exercise patterns. Future exercise behavior could be materially different than that which is assumed by the model.
Expected volatility is based on the historical fluctuations in the Company's stock. The Company's stock has historically been volatile, which increases the fair value.
SFAS No. 123(R) requires us to develop an estimate of the number of share-based awards that will be forfeited owing to employee turnover. Quarterly changes in the estimated forfeiture rate can have a significant effect on reported share-based compensation, as the effect of adjusting the rate for all expense amortization after the grant date is recognized in the period the forfeiture estimate is changed. If the actual forfeiture rate proves to be higher than the estimated forfeiture rate, then an adjustment will be made to increase the estimated forfeiture rate, which would result in a decrease to the expense recognized in the financial statements. If the actual forfeiture rate proves to be lower than the estimated forfeiture rate, then an adjustment will be made to decrease the estimated forfeiture rate, which would result in an increase to the expense recognized in the financial statements. Such adjustments would affect our operating expenses and additional paid-in capital, but would have no effect on our net asset value.
38
Valuation of Portfolio Investments
As a business development company, we invest in illiquid securities including debt and equity securities of private companies. These investments are generally subject to restrictions on resale and generally have no established trading market. We value substantially all of our equity investments at fair value as determined in good faith by our Valuation Committee on a quarterly basis. The Valuation Committee, comprised of all of our non-interested Board members, reviews and approves the valuation of our investments within the valuation procedures established by the Board of Directors. Fair value is generally defined as the amount that an investment could be sold for in an orderly disposition over a reasonable time. Generally, to increase objectivity in valuing our assets, external measures of value, such as public markets or third-party transactions, are utilized whenever possible. Valuation is not based on long-term work-out value, nor immediate liquidation value, nor incremental value for potential changes that may take place in the future. Upon sale of investments, the values that are ultimately realized may be different from what is presently estimated. This difference could be material.
Pension and Post-Retirement Benefit Plan Assumptions
The Company provides a Retiree Medical Benefit Plan for employees who meet certain eligibility requirements. Several statistical and other factors that attempt to anticipate future events are used in calculating the expense and liability values related to our post-retirement benefit plans. These factors include assumptions we make about the discount rate, the rate of increase in healthcare costs, and mortality, among others.
The discount rate reflects the current rate at which the post-retirement benefit liabilities could be effectively settled considering the timing of expected payments for plan participants. In estimating this rate, we consider rates of return on high quality fixed-income investments included in published bond indexes. We consider the Moody’s Aa Corporate Bond Index and the Citigroup Pension Liability Index in the determination of the appropriate discount rate assumptions. The weighted average rate we utilized to measure our post retirement benefit obligation as of December 31, 2006, and to calculate our 2007 expense was 5.75 percent, which is an increase from the 5.5 percent rate used in determining the 2006 expense.
Recent Developments — Portfolio Companies
On October 11, 2007, we made a $1,993,568 follow-on investment in Innovalight, Inc.
On October 16, 2007, we made a $58,582 follow-on investment that has not yet been announced in a privately held tiny technology portfolio company.
On October 17, 2007, we made a $160,723 new investment that has not yet been announced in a privately held tiny technology portfolio company.
39
On October 24, 2007, we made a $50,000 new investment that has not yet been announced in a privately held tiny technology portfolio company.
On October 30, 2007, we received proceeds of $123,000 from the sale of the assets of AlphaSimplex Group, LLC, to Natixis Global Asset Management.
On November 7, 2007, we made an $851,393 follow-on investment that has not yet been announced in a privately held tiny technology portfolio company.
Forward-Looking Statements
The information contained herein contains certain forward-looking statements. These statements include the plans and objectives of management for future operations and financial objectives, portfolio growth and availability of funds. These forward-looking statements are subject to the inherent uncertainties in predicting future results and conditions. Certain factors that could cause actual results and conditions to differ materially from those projected in these forward-looking statements are set forth herein. Other factors that could cause actual results to differ materially include the uncertainties of economic, competitive and market conditions, and future business decisions, all of which are difficult or impossible to predict accurately and many of which are beyond our control. Although we believe that the assumptions underlying the forward-looking statements included herein are reasonable, any of the assumptions could be inaccurate and, therefore, there can be no assurance that the forward-looking statements included or incorporated by reference herein will prove to be accurate. Therefore, the inclusion of such information should not be regarded as a representation by us or any other person that our plans will be achieved.
Item 3. Quantitative and Qualitative Disclosures About Market Risk
Our business activities contain elements of risk. We consider the principal types of market risk to be valuation risk and the risk associated with fluctuations in interest rates. Although we are risk-seeking rather than risk-averse in our investments, we consider the management of risk to be essential to our business.
Value, as defined in Section 2(a)(41) of the 1940 Act, is (i) the market price for those securities for which market quotations are readily available and (ii) fair value as determined in good faith by, or under the direction of, the Board of Directors for all other assets. (See the "Valuation Procedures" in the "Footnote to Consolidated Schedule of Investments" contained in "Item 1. Consolidated Financial Statements.")
40
Neither our investments nor an investment in us is intended to constitute a balanced investment program.
We have invested a substantial portion of our assets in private development stage or start-up companies. These private businesses tend to be based on new technology and to be thinly capitalized, unproven, small companies that lack management depth and have not attained profitability or have no history of operations. Because of the speculative nature and the lack of a public market for these investments, there is significantly greater risk of loss than is the case with traditional investment securities. We expect that some of our venture capital investments will be a complete loss or will be unprofitable and that some will appear to be likely to become successful but never realize their potential. Even when our private equity investments complete initial public offerings (IPOs), we are normally subject to lock-up agreements for a period of time, and thereafter, the market for the unseasoned publicly traded securities may be relatively illiquid.
Because there is typically no public market for our interests in the small privately held companies in which we invest, the valuation of the equity interests in that portion of our portfolio is determined in good faith by our Valuation Committee, comprised of the independent members of our Board of Directors, in accordance with our Valuation Procedures. In the absence of a readily ascertainable market value, the determined value of our portfolio of equity interests may differ significantly from the values that would be placed on the portfolio if a ready market for the equity interests existed. Any changes in valuation are recorded in our consolidated statements of operations as "Net increase (decrease) in unrealized appreciation on investments." Changes in valuation of any of our investments in privately held companies from one period to another may be volatile.
We also invest in short-term money market instruments, and both short and long-term U.S. government and agency securities. To the extent that we invest in short and long-term U.S. government and agency securities, changes in interest rates result in changes in the value of these obligations which result in an increase or decrease of our net asset value. The level of interest rate risk exposure at any given point in time depends on the market environment, the expectations of future price and market movements, and the quantity and duration of both the short and long-term U.S. government and agency securities held by the Company, and it will vary from period to period. If the average interest rate on U.S. government and agency securities at September 30, 2007, were to increase by 25, 75 and 150 basis points, the weighted average value of these securities held by us at September 30, 2007, would decrease by approximately $180,364, $541,091 and $1,082,182, respectively, and our net asset value would decrease correspondingly.
Most of our investments are denominated in U.S. dollars. We currently have one investment denominated in Canadian dollars. We are exposed to foreign currency risk related to potential changes in foreign currency exchange rates. The potential loss in fair value on this investment resulting from a 10 percent adverse change in quoted foreign currency exchange rates is $200,824 at September 30, 2007.
In addition, in the future, we may from time to time opt to borrow money to make investments. Our net investment income will be dependent upon the difference between the rate at which we borrow funds and the rate at which we invest such funds. As a result, there can be no assurance that a significant change in market interest rates will not have a material adverse effect on our net investment income in the event we choose to borrow funds for investing purposes.
41
Item 4. Controls and Procedures
(a) Disclosure Controls and Procedures. As of the end of the period covered by this report, the Company’s management, under the supervision and with the participation of our chief executive officer and chief financial officer, conducted an evaluation of the effectiveness of the design and operation of our disclosure controls and procedures (as required by Rules 13a-15 of the 1934 Act). Disclosure controls and procedures means controls and other procedures of an issuer that are designed to ensure that information required to be disclosed by the issuer in the reports that it files or submits under the 1934 Act is recorded, processed, summarized and reported, within time periods specified in the SEC's rules and forms, and that such information is accumulated and communicated to the issuer's management, as appropriate, to allow timely decisions regarding required disclosures. As of September 30, 2007, based upon this evaluation of our disclosure controls and procedures, our chief executive officer and chief financial officer concluded that our disclosure controls and procedures were effective.
(b) Changes in Internal Control Over Financial Reporting. There have not been any changes in the Company's internal control over financial reporting (as such term is defined in Rules 13a-15(f) and 15d-15(f) under the Exchange Act) during the third quarter of 2007 to which this report relates that have materially affected, or are reasonably likely to materially affect, the Company’s internal control over financial reporting.
42
PART II. OTHER INFORMATION
Item 1A. Risk Factors
Investing in our common stock involves significant risks relating to our business and investment objective. You should carefully consider the risks and uncertainties described in our Annual Report on Form 10-K for the year ended December 31, 2006, before you purchase any of our common stock. The risks described in our Annual Report on Form 10-K are not the only risks facing our Company. Unknown additional risks and uncertainties, or ones that we currently consider immaterial, may also impair our business. If any of these risks or uncertainties materialize, our business, financial condition or results of operations could be materially adversely affected. In this event, the trading price of our common stock could decline, and you could lose all or part of your investment.
Our portfolio companies may generate revenues from the sale of non-tiny technology-enabled products.
We consider a company to be a tiny technology company if a product or products, or intellectual property covering a product or products, that we consider to be at the microscale or smaller is material to its business plan. The core business of some of these companies may not be tiny technology-enabled products, and, therefore, their success or failure may not be dependent upon the tiny technology aspects of their business. In addition to developing products that we consider tiny technology, some of these companies may also develop products that we do not consider enabled by tiny technology. Some of these companies will generate revenues from the sale of non-tiny technology-enabled products. Additionally, it is possible that a portfolio company may decide to change its business focus after our initial investment and decide to develop and commercialize non-tiny technology-enabled products.
Item 6. Exhibits
| 10.1 | Amended and Restated Employment Agreement between Harris & Harris Group, Inc. and Charles E. Harris, dated August 2, 2007, incorporated by reference as Exhibit 10.1 to the Company's Form 8-K filed on August 3, 2007. |
| 10.2 | Amended and Restated Severance Compensation Agreement, dated August 2, 2007, incorporated by reference as Exhibit 10.2 to the Company's Form 8-K filed on August 3, 2007. |
| 10.3 | Amended and Restated Supplemental Executive Retirement Plan, dated August 2, 2007, incorporated by reference as Exhibit 10.3 to the Company's Form 8-K filed on August 3, 2007. |
| 10.4 | Amended and Restated Harris & Harris Group, Inc. Executive Mandatory Retirement Benefit Plan, incorporated by reference as Exhibit 10.4 to the Company's Form 8-K filed on August 3, 2007. |
43
| 31.01* | Certification of CEO pursuant to Section 302 of the Sarbanes-Oxley Act of 2002. |
| 31.02* | Certification of CFO pursuant to Section 302 of the Sarbanes-Oxley Act of 2002. |
| 32.01* | Certification of CEO and CFO pursuant to 18 U.S.C. Section 1350, as adopted pursuant to Section 906 of the Sarbanes-Oxley Act of 2002. |
*filed herewith
44
SIGNATURES
Pursuant to the requirements of the Securities Exchange Act of 1934, the Registrant has duly caused this report to be signed on its behalf by the undersigned thereunto duly authorized.
| Harris & Harris Group, Inc. | ||
| | | |
| By: | /s/ Douglas W. Jamison | |
Douglas W. Jamison | ||
| President and | ||
| Chief Financial Officer | ||
| By: | /s/ Patricia N. Egan | |
Patricia N. Egan | ||
| Chief Accounting Officer | ||
| and Vice President | ||
Date: November 8, 2007
45
EXHIBIT INDEX
Exhibit No. | Description | |
| 31.01 | Certification of CEO pursuant to Section 302 of the Sarbanes-Oxley Act of 2002. | |
| 31.02 | Certification of CFO pursuant to Section 302 of the Sarbanes-Oxley Act of 2002. | |
| Certification of CEO and CFO pursuant to 18 U.S.C. Section 1350, as adopted pursuant to Section 906 of the Sarbanes-Oxley Act of 2002. |
46