UNITED STATES
SECURITIES AND EXCHANGE COMMISSION
Washington, D.C. 20549
SECURITIES AND EXCHANGE COMMISSION
Washington, D.C. 20549
FORM N-CSR
CERTIFIED SHAREHOLDER REPORT OF REGISTERED
MANAGEMENT INVESTMENT COMPANIES
Investment Company Act file number 811-07360
Monetta Trust
(Exact name of registrant as specified in charter)
(Exact name of registrant as specified in charter)
1776-A S. Naperville Road, Suite 100
Wheaton, IL 60189-5831
(Address of principal executive offices) (Zip code)
(Address of principal executive offices) (Zip code)
Robert S. Bacarella
1776-A S. Naperville Road, Suite 100
Wheaton, IL 60189-5831
(Name and address of agent for service)
(Name and address of agent for service)
(630) 462-9800
Registrant's telephone number, including area code
Date of fiscal year end: December 31, 2017
Date of reporting period: December 31, 2017
Item 1. Reports to Stockholders.
Annual Report
December 31, 2017
| Monetta Mutual Funds (No-Load) | ||
| Monetta Trust: | ||
Monetta Fund | ||
Monetta Young Investor Fund |
| 1-800-MONETTA | www.monetta.com |
This Page Intentionally Left Blank
Page 2
TABLE OF CONTENTS
| Letter to Shareholders | 5 | ||
| Performance Highlights | |||
| Monetta Fund | 6 | ||
| Monetta Young Investor Fund | 7 | ||
| Disclosure of Fund Expenses | 8 | ||
| Schedules of Investments | |||
| Monetta Fund | 9 | ||
| Monetta Young Investor Fund | 11 | ||
| Financial Statements | |||
| Statements of Assets & Liabilities | 13 | ||
| Statements of Operations | 14 | ||
| Statements of Changes in Net Assets | 15 | ||
| Financial Highlights | 16 | ||
| Notes to Financial Statements | 18 | ||
| Report of Independent Registered Public Accounting Firm | 22 | ||
| Other Information | 23 | ||
| Trustees & Officers | 25 | ||
| Notice to Shareholders | 26 |
Page 3
Principal Risks:
Mutual fund investing involves risk. Principal loss is possible. The Funds may make short-term investments, without limitation, for defensive purposes, which may provide lower returns than other types of investments. The portion of the Monetta Young Investor Fund that invests in underlying ETFs that track the S&P 500® Index (the “Index”) will be subject to certain risks which are unique to tracking the Index. By investing in ETFs, you will indirectly bear your share of any fees and expenses charged by the underlying funds, in addition to indirectly bearing the principal risks of the funds. The Monetta Young Investor Fund will invest approximately 50% of its net assets in funds that track the Index or other broad-based market indices that primarily include stocks of large capitalization U.S. companies, and your cost of investing will generally be higher than the cost of investing directly in the shares of the mutual funds that track an index, which will be subject to certain risks which are unique to tracking the Index. Growth stocks typically are more volatile than value stocks; however, value stocks have a lower expected growth rate in earnings and sales. Investments in smaller companies involve additional risks such as limited liquidity and greater volatility than larger companies. Please refer to the Funds’ prospectus for further details.
While the Funds are no-load, management and other expenses still apply.
Past performance is not a guarantee of future results.
Monetta Financial Services, Inc. (“MFSI” or the “Adviser”) is the investment adviser to the Monetta Funds. References to individual securities are the views of the Adviser at the date of this report and are subject to change. References are not a recommendation to buy or sell any security. Fund holdings and compositions are subject to change. MFSI and its affiliated officers, directors and employees may, from time to time, have long or short positions in, and buy or sell, the securities of companies held, purchased or sold by the Monetta Funds. Current and future portfolio holdings are subject to risk. Please refer to the Schedules of Investments in this report for a complete list of Fund holdings.
Diversification does not assure a profit, nor does it protect against a loss in a declining market.
The S&P 500® Index is a broad based unmanaged index of 500 stocks, which is widely recognized as representative of the equity market in general. It is not possible to invest directly in an index.
Earnings growth is not a measure of the Funds’ future performance.
The Funds’ investment objectives, risks, charges and expenses must be considered carefully before investing. The summary and statutory prospectuses contains this and other important information about the investment company, and may be obtained by calling 1-866-964-4683, or visiting www.monetta.com. Read it carefully before investing.
Opinions expressed are those of the fund managers and are not intended to be a forecast of future events, a guarantee of future results, nor investment advice.
Distributor: Quasar Distributors, LLC.
Page 4
| Dear Fellow Shareholders: | January 29, 2018 |
I am pleased to enclose your Fund’s annual report for the year ended December 31, 2017. The year 2017 will go down as one of the most remarkable years on record. Few investors expected the S&P 500® Index to post a 21.83% return with near-record-low volatility and no significant market corrections. It was a historic year of uninterrupted monthly gains supported by increases in both actual and estimated corporate earnings. Waiting for a market pullback proved to be a missed opportunity as the market propelled to a series of record-setting highs.
It appears that the U.S. presidential election outcome heralded in a pro-growth economic environment. Investors responded positively to the increased probability of deregulation, corporate tax reform, repatriation opportunities and the possibility of higher infrastructure spending. The increase in equity valuations was driven by a combination of healthy fundamentals, rock-bottom interest rate levels, and a higher corporate growth outlook.
Among all industry sectors, the technology sector contributed most to the S&P 500® Index performance, followed by the materials and industrial sectors. The energy sector was the worst-performing sector, posting negative returns primarily due to excess inventory levels that propelled oil prices lower.
Fixed income markets had a more volatile year than equities. Early fixed income outperformance was offset by rising rates, as the Federal Reserve increased the federal funds rate three times in 2017.
2018 Market Outlook
At eight years and counting, this bull market could become the longest ever, surpassing the great technology-fueled advance of the 1990s. Market valuations are supported by the pro-business agenda in Washington, lower corporate tax rates and fewer regulations. In addition, consumer confidence remains high, the current 4.4% unemployment rate is the lowest since May 2007, and wages are ticking higher.
A better-than-expected 2017 appears to be morphing into a solid start to 2018. Although stock valuations appear stretched, we believe prices can advance higher primarily due to sustained global economic expansion. Due to elevated stock valuations levels, we expect the market to be more volatile in 2018.
Factors that could derail a market advance include heightened political uncertainty, slowing economic growth, a misstep by the Federal Reserve, and/or an escalating conflict in Syria or North Korea.
We expect the Federal Reserve to raise interest rates modestly in 2018, assuming that inflation remains below 2%. A more aggressive monetary policy could lower economic growth prospects propelling stock prices lower.
Typically, the sectors that tend to thrive in a sustained economic expansion period include the financial, energy, technology, and industrial sectors. In addition, those U.S. companies benefitting from the lower corporate tax rate and repatriation opportunities could result in higher consensus earnings expectations, propelling these stocks higher and/or sparking a new wave of company stock buyback programs.
We believe that any market pullback or correction would be a healthy development in the context of this ongoing secular bull market.
Following is detailed information summarizing each Fund’s performance, major security holdings and investment strategy. We thank you for being a valued shareholder and for providing us with the opportunity to help you achieve your long-term investment goals.
Respectfully,

Robert S. Bacarella
President, Founder and Portfolio Manager
Page 5
| Monetta Fund (Unaudited) | Year ended December 31, 2017 | |
Investment Objective: | Average Market Capitalization: | Total Net Assets: |
| Long-Term Capital Growth | $261.6 billion | $57.96 million |
PERFORMANCE: | Average Annual Total Return | |||
1 Year | 3 Year | 5 Year | 10 Year | |
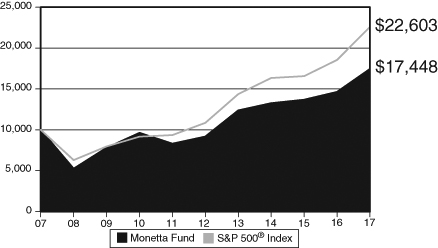
| Monetta Fund | 19.19% | 9.58% | 13.72% | 5.72% |
S&P 500® Index | 21.83% | 11.41% | 15.79% | 8.50% |
| Total Annual Operating Expenses* | 1.46% | |||
| * Source Prospectus dated April 30, 2017. Expense Ratio of 1.46% includes Acquired Fund Fees and Expenses of 0.01%. For the Fund’s current Expense Ratio, please refer to Page 16 of this Annual Report. |
Performance data quoted represents past performance; past performance does not guarantee future results. The investment return and principal value of an investment will fluctuate so that an investor’s shares, when redeemed, may be worth more or less than their original cost. The total returns do not reflect the deduction of taxes that a shareholder would pay on Fund distributions or the redemption of Fund shares. Current performance of the Fund may be lower or higher than the performance quoted. Performance data current to the most recent month end may be obtained by calling 1-800-MONETTA or visiting www.Monetta.com.
The hypothetical graph above compares the change in value of a $10,000 investment in the Monetta Fund and the S&P 500® Index, for the 10-year period ending December 31, 2017, with dividend and capital gains reinvested.
Portfolio Weightings(a): |
| Retail | 25.3 | % | ||
| Technology | 20.7 | % | ||
| Financial | 16.0 | % | ||
| Healthcare | 7.4 | % | ||
| Capital Equipment | 6.4 | % | ||
| Energy | 5.1 | % | ||
| Transportation | 4.6 | % | ||
| Consumer Cyclical | 4.6 | % | ||
| Basic Material | 2.0 | % | ||
| Consumer Staple | 0.9 | % | ||
Other(b) | 7.0 | % |
(a) | Portfolio weightings are subject to change daily and are calculated as a percentage of net assets. |
(b) | Includes Money Market Funds and liabilities in excess of other assets. |
| Top 5 Equity Holdings: |
% of Net Assets | ||||
| Apple, Inc. | 5.5 | % | ||
| Amazon.com, Inc. | 5.4 | % | ||
| Facebook, Inc. - CL A | 4.6 | % | ||
| Alphabet, Inc. - CL C | 4.5 | % | ||
| Citigroup, Inc. | 3.9 | % | ||
| Total Top 5 Equity Holdings: | 23.9 | % | ||
| Commentary |
The Monetta Fund gained 19.19% for the year ended December 31, 2017, slightly below its benchmark, the S&P 500® Index, which rose 21.83%. The variance was primarily due to the Fund’s energy holdings and select healthcare holdings.
Specific holdings that enhanced Fund performance included Amazon.com, Inc., Alibaba Group Holding Ltd., Facebook, Inc., and UnitedHealthcare Group, Inc. representing 5.45%, 3.57%, 4.57%, and 3.80%, respectively of the year-end portfolio. Detracting from Fund performance were healthcare holdings Celgene Corp. and Bristol-Myers Squibb Co., as well as energy holding Anadarko Petroleum Corp. These securities were sold in the fourth quarter as earnings estimates were lowered and price levels violated key technical support levels.
During the year, the Fund’s portfolio management team was active in identifying and investing in growth companies that demonstrated improving revenue/earnings growth and favorable technical trends. Recent stock purchases include Ulta Beauty, Inc., Take-Two Interactive Software, Inc., and Honeywell International, Inc. representing 2.32%, 2.27%, and 1.85%, respectively, of the year-end portfolio.
As long as economic and corporate earnings growth continue to rise next year, stock prices should trend higher. We appear to be entering an extended business cycle period of a kind that tends to end when inflation pressures increase and lead the Federal Reserve to enact tighter monetary policy.
Our investment strategy focuses on large-capitalization growth companies that would benefit from higher interest rates, late-stage economic growth, and lower corporate tax rates.
We expect the markets to be more volatile during 2018 as current valuation levels reflect elevated investor expectations and sentiment. We believe that any pullback or correction would be a healthy development in the context of an ongoing secular bull market.
Page 6
| Monetta Young Investor Fund (Unaudited) | Year ended December 31, 2017 | |
Investment Objective: | Average Market Capitalization: | Total Net Assets: |
| Long-Term Capital Growth | $316.6 billion | $145.84 million |
| PERFORMANCE: | Average Annual Total Return | |||
1 Year | 3 Year | 5 Year | 10 Year | |
| Monetta Young Investor Fund | 23.10% | 11.20% | 14.90% | 12.20% |
S&P 500® Index | 21.83% | 11.41% | 15.79% | 8.50% |
| Total Annual Operating Expenses* | 1.26% | |||
| * Source Prospectus dated April 30, 2017. Expense Ratio of 1.26% includes Acquired Fund Fees and Expenses of 0.04%. For the Fund’s current Expense Ratio, please refer to Page 17 of this Annual report. |

Performance data quoted represents past performance; past performance does not guarantee future results. The investment return and principal value of an investment will fluctuate so that an investor’s shares, when redeemed, may be worth more or less than their original cost. The total returns do not reflect the deduction of taxes that a shareholder would pay on Fund distributions or the redemption of Fund shares. Current performance of the Fund may be lower or higher than the performance quoted. Performance data current to the most recent month end may be obtained by calling 1-800-MONETTA or visiting www.Monetta.com.
The hypothetical graph above compares the change in value of a $10,000 investment in the Monetta Young Investor Fund and the S&P 500® Index, for the 10-year period ending December 31, 2017, with dividend and capital gains reinvested.
Portfolio Weightings(a): |
| Exchange Traded Funds | 52.4 | % | ||
| Technology | 10.4 | % | ||
| Retail | 10.3 | % | ||
| Financial | 9.5 | % | ||
| Healthcare | 4.2 | % | ||
| Transportation | 2.6 | % | ||
| Consumer Cyclical | 2.0 | % | ||
| Capital Equipment | 1.9 | % | ||
| Energy | 1.5 | % | ||
| Consumer Staple | 0.4 | % | ||
Other(b) | 4.8 | % |
(a) | Portfolio weightings are subject to change daily and are calculated as a percentage of net assets. |
(b) | Includes Money Market Funds and liabilities in excess of other assets. |
| Top 5 Equity Holdings: |
% of Net Assets | ||||
| Apple, Inc. | 3.3 | % | ||
| Alibaba Group Holding Ltd. - ADR | 3.0 | % | ||
| MasterCard, Inc. - CL A | 2.6 | % | ||
| UnitedHealth Group, Inc. | 2.6 | % | ||
| Alphabet, Inc. - CL C | 2.5 | % | ||
| Total Top 5 Equity Holdings: | 13.9 | % | ||
| Commentary |
The Monetta Young Investor Fund was up 23.10% for the year ending December 31, 2017. The return compared favorably to that of its benchmark, the S&P 500® Index, which was up 21.83%. The Fund’s passive component (which makes up 52.44% of the portfolio) kept pace with the overall market, while the active portion slightly outperformed, benefiting from holdings primarily in the technology and financial sectors.
Specific holdings that enhanced Fund performance included Amazon.com Inc., Apple Inc., and MasterCard Inc., representing 2.41%, 3.25%, and 2.60%, respectively, of the year-end portfolio. Detracting from Fund performance were energy holdings, including Devon Energy Corp., Apache Corp., and Chevron Corp. These securities were sold during the year as the energy sector was impacted by oversupply issues, lower growth prospects, and delayed production decisions by OPEC.
Throughout the year, we closely monitored quarterly earnings reports and company guidance for current holdings and stocks on our watch list, as positive performance was driven by higher earnings growth expectations. Recent stock purchases demonstrating solid growth prospects include Walt Disney Co. and Waste Management, Inc. representing 1.11% and 1.89% respectively of the year-end portfolio.
We believe that synchronized global expansion could result in a stable and sustained period of growth in 2018. Although current investor expectations and sentiment are elevated, we believe stock prices can advance further as a result of increased earnings, sales, and other measures of corporate performance. Historically, the companies that have benefitted the most in this type of environment include those in the financial, energy, and technology sectors. We intend to concentrate the active portion of the Fund in these sectors, monitoring closely each company’s quarterly growth results and longer-term prospects.
We also track the relative strength of a company’s stock price relative to its sector and the overall market. New stock purchases are primarily focused on lower-beta securities that we believe will hold up better during periods of increased volatility. We intend to use market pullbacks as opportunities to adjust portfolio sector and/or stock weightings.
Page 7
| Disclosure of Fund Expenses (Unaudited) | Period Ended December 31, 2017 |
As a shareholder of a mutual fund, you incur ongoing costs, including investment advisory fees; distribution expense (Monetta Young Investor Fund); and other Fund expenses. This Example is intended to help you understand your ongoing costs (in dollars) of investing in the Funds and to compare these costs with the ongoing costs of investing in other mutual funds. The Example is based on an investment of $1,000 invested at the beginning of the period and held for the most recent semi-annual period, July 1, 2017 - December 31, 2017.
ACTUAL EXPENSES
The table below provides information about actual account values and actual expenses. The Example below includes, but is not limited to, investment advisory fees, distribution expense, accounting, custodian and transfer agent fees. However, the Example below does not include portfolio trading commissions and related expenses. You may use the information in this table, together with the amount you invested, to estimate the expenses that you paid over the period. Simply divide your account value by $1,000 (for example, an $8,600 account value divided by $1,000 = 8.6), then multiply the result by the number in the table under the heading entitled “Expenses Paid During Period” to estimate the expenses you paid on your account during this period.
HYPOTHETICAL EXAMPLE FOR COMPARISON PURPOSES
The table below also provides information about hypothetical account values and hypothetical expenses based on the Funds’ actual expense ratio and an assumed rate of return of 5% per year before expenses, which is not the Funds’ actual return. The hypothetical account values and expenses may not be used to estimate the actual ending account balance or expenses you paid for the period. You may use this information to compare the ongoing costs of investing in the Funds and other funds. To do so, compare this 5% hypothetical example with the 5% hypothetical examples that appear in the shareholder reports of the other funds.
| BEGINNING | ENDING | EXPENSES PAID | ||
| ACCOUNT VALUE | ACCOUNT VALUE | DURING PERIOD(a) | ANNUALIZED | |
| 7/1/17 | 12/31/17 | 7/1/17-12/31/17 | EXPENSE RATIO | |
| ACTUAL | ||||
| Monetta Fund | $1,000.00 | $1,102.00 | $7.36 | 1.39% |
| Monetta Young Investor Fund | 1,000.00 | 1,126.00 | 6.11 | 1.14% |
| HYPOTHETICAL (5% ANNUAL RETURN BEFORE EXPENSES) | ||||
| Monetta Fund | $1,000.00 | $1,018.20 | $7.07 | 1.39% |
| Monetta Young Investor Fund | 1,000.00 | 1,019.46 | 5.80 | 1.14% |
| (a) Expenses are equal to each Fund’s annualized expense ratio, multiplied by the average account value over the period, multiplied by 184 (days in most recent fiscal half year)/365 (to reflect the one-half year period). |
Page 8
| Schedule of Investments | December 31, 2017 |
| Monetta Fund |
| COMMON STOCKS - 93.0% | |||||||
| NUMBER OF SHARES | VALUE | ||||||
| Basic Material - 2.0% | |||||||
| Chemical-2.0% | |||||||
| 16,000 | DowDuPont, Inc. | $ | 1,139,520 | ||||
| Capital Equipment - 6.4% | |||||||
| Diversified Operation-3.9% | |||||||
| 5,000 | 3M Co. | 1,176,850 | |||||
| 7,000 | Honeywell | ||||||
| International, Inc. | 1,073,520 | ||||||
| 2,250,370 | |||||||
| Pollution Control-2.5% | |||||||
| 17,000 | Waste Management, Inc. | 1,467,100 | |||||
| Consumer Cyclical - 4.6% | |||||||
| Automobile-1.8% | |||||||
| 25,000 | General Motors Co. | 1,024,750 | |||||
| Media-Radio/TV-2.8% | |||||||
| 15,000 | Walt Disney Co. | 1,612,650 | |||||
| Consumer Staple - 0.9% | |||||||
| Food-0.9% | |||||||
| 12,500 | Hain Celestial | ||||||
| Group, Inc. * | 529,875 | ||||||
| Energy - 5.1% | |||||||
| Oil & Gas-Exploration & Production-5.1% | |||||||
| 32,000 | Devon Energy Corp. | 1,324,800 | |||||
| 15,000 | EOG Resources, Inc. | 1,618,650 | |||||
| 2,943,450 | |||||||
| Financial - 16.0% | |||||||
| Bank-Money Center-10.2% | |||||||
| 70,000 | Bank of America Corp. | 2,066,400 | |||||
| 30,000 | Citigroup, Inc. | 2,232,300 | |||||
| 15,000 | JPMorgan Chase & Co. | 1,604,100 | |||||
| 5,902,800 | |||||||
| Finance-Miscellaneous-5.8% | |||||||
| 14,000 | MasterCard, Inc. - CL A | 2,119,040 | |||||
| 11,000 | Visa, Inc. - CL A | 1,254,220 | |||||
| 3,373,260 | |||||||
| Healthcare - 7.4% | |||||||
| Healthcare-Drug/Diversified-3.6% | |||||||
| 15,000 | Johnson & Johnson | 2,095,800 | |||||
| Healthcare-Patient Care-3.8% | |||||||
| 10,000 | UnitedHealth Group, Inc. | 2,204,600 | |||||
| Retail - 25.3% # | |||||||
| Retail-Department Store-2.4% | |||||||
| 55,000 | Macy’s, Inc. | 1,385,450 | |||||
| Retail-Discount & Variety-2.6% | |||||||
| 14,000 | Dollar Tree, Inc. * | 1,502,340 | |||||
| Retail-Drug Store-2.2% | |||||||
| 18,000 | CVS Health Corp. | 1,305,000 | |||||
| Retail-Major Chain-5.8% | |||||||
| 10,000 | Costco Wholesale Corp. | 1,861,200 | |||||
| 15,000 | Wal-Mart Stores, Inc. | 1,481,250 | |||||
| 3,342,450 | |||||||
| Retail-Restaurant-1.0% | |||||||
| 10,000 | Starbucks Corp. | 574,300 | |||||
| Retail-Specialty-11.3% | |||||||
| 12,000 | Alibaba Group | ||||||
| Holding Ltd. (a) * | 2,069,160 | ||||||
| 2,700 | Amazon.com, Inc. * | 3,157,569 | |||||
| 6,000 | Ulta Beauty, Inc. * | 1,341,960 | |||||
| 6,568,689 | |||||||
| Technology - 20.7% | |||||||
| Computer Data Storage-5.5% | |||||||
| 19,000 | Apple, Inc. | 3,215,370 | |||||
| Computer-Software-4.5% | |||||||
| 15,000 | Microsoft Corp. | 1,283,100 | |||||
| 12,000 | Take-Two Interactive | ||||||
| Software, Inc. * | 1,317,360 | ||||||
| 2,600,460 | |||||||
| Electronic-Semiconductor-1.6% | |||||||
| 20,000 | Intel Corp. | 923,200 | |||||
The accompanying notes are an integral part of these financial statements.
Page 9
| Schedule of Investments | December 31, 2017 |
| Monetta Fund (Continued) |
| NUMBER OF SHARES | VALUE | ||||||
| Technology - 20.7% (Cont’d) | |||||||
| Internet-9.1% | |||||||
| 2,500 | Alphabet, Inc. - CL C * | $ | 2,616,000 | ||||
| 15,000 | Facebook, Inc. - CL A * | 2,646,900 | |||||
| 5,262,900 | |||||||
| Transportation - 4.6% | |||||||
| Airline-2.3% | |||||||
| 20,000 | Southwest Airlines Co. | 1,309,000 | |||||
| Railroad-2.3% | |||||||
| 10,000 | Union Pacific Corp. | 1,341,000 | |||||
| Total Common Stocks | |||||||
| (Cost $39,850,892) | 53,874,334 | ||||||
| MONEY MARKET FUNDS - 7.1% | |||||||
| 4,119,738 | Morgan Stanley Institutional | ||||||
| Liquidity Fund - | |||||||
| Government Portfolio - | |||||||
| Institutional Class, | |||||||
| 1.202% ^ | 4,119,738 | ||||||
| Total Money Market Funds | |||||||
| (Cost $4,119,738) | 4,119,738 | ||||||
| Total Investments | |||||||
| (Cost $43,970,630) (b) - 100.1% | 57,994,072 | ||||||
| Liabilities in Excess of | |||||||
| Other Assets - (0.1)% | (30,895 | ) | |||||
| TOTAL NET ASSETS - 100.0% | $ | 57,963,177 | |||||
(a) ADR - American Depositary Receipt | |
(b) Cost for tax purposes is $43,978,865. The aggregate gross unrealized appreciation is $14,189,129, and the aggregate gross unrealized depreciation is $173,922, resulting in net unrealized appreciation of $14,015,207. The difference between book cost and tax cost is attributable primarily to the deferral of wash sale losses. | |
* Non-income producing security. | |
# As of December 31, 2017, the Monetta Fund had a significant portion of its assets invested in this sector and therefore is subject to additional risk. See Note 6 in Notes to Financial Statements. | |
| ^ Rate shown is the seven day effective yield at December 31, 2017. | |
| Industry classification provided by William O’Neil & Co., Inc. | |
The accompanying notes are an integral part of these financial statements.
Page 10
| Schedule of Investments | December 31, 2017 |
| Monetta Young Investor Fund |
| COMMON STOCKS - 42.8% | |||||||
| NUMBER OF SHARES | VALUE | ||||||
| Capital Equipment - 1.9% | |||||||
| Pollution Control-1.9% | |||||||
| 32,000 | Waste Management, Inc. | $ | 2,761,600 | ||||
| Consumer Cyclical - 2.0% | |||||||
| Leisure Service-0.9% | |||||||
| 8,000 | Wynn Resorts Ltd. | 1,348,720 | |||||
| Media-Radio/TV-1.1% | |||||||
| 15,000 | Walt Disney Co. | 1,612,650 | |||||
| Consumer Staple - 0.4% | |||||||
| Food-0.4% | |||||||
| 14,500 | Hain Celestial | ||||||
| Group, Inc. * | 614,655 | ||||||
| Energy - 1.5% | |||||||
| Oil & Gas-Exploration & Production-1.5% | |||||||
| 20,000 | EOG Resources, Inc. | 2,158,200 | |||||
| Financial - 9.5% | |||||||
| Bank-Money Center-5.4% | |||||||
| 100,000 | Bank of America Corp. | 2,952,000 | |||||
| 30,000 | Citigroup, Inc. | 2,232,300 | |||||
| 25,000 | JPMorgan Chase & Co. | 2,673,500 | |||||
| 7,857,800 | |||||||
| Finance-Miscellaneous-4.1% | |||||||
| 25,000 | MasterCard, Inc. - CL A | 3,784,000 | |||||
| 19,000 | Visa, Inc. - CL A | 2,166,380 | |||||
| 5,950,380 | |||||||
| Healthcare - 4.2% | |||||||
| Healthcare-Drug/Diversified-1.6% | |||||||
| 17,000 | Johnson & Johnson | 2,375,240 | |||||
| Healthcare-Patient Care-2.6% | |||||||
| 17,000 | UnitedHealth Group, Inc. | 3,747,820 | |||||
| Retail - 10.3% | |||||||
| Retail-Discount & Variety-1.1% | |||||||
| 15,000 | Dollar Tree, Inc. * | 1,609,650 | |||||
| Retail-Major Chain-3.3% | |||||||
| 15,000 | Costco Wholesale Corp. | 2,791,800 | |||||
| 20,000 | Wal-Mart Stores, Inc. | 1,975,000 | |||||
| 4,766,800 | |||||||
| Retail-Restaurant-0.5% | |||||||
| 13,000 | Starbucks Corp. | 746,590 | |||||
| Retail-Specialty-5.4% | |||||||
| 25,000 | Alibaba Group | ||||||
| Holding Ltd. (a) * | 4,310,750 | ||||||
| 3,000 | Amazon.com, Inc. * | 3,508,410 | |||||
| 7,819,160 | |||||||
| Technology - 10.4% | |||||||
| Computer Data Storage-3.3% | |||||||
| 28,000 | Apple, Inc. | 4,738,440 | |||||
| Computer-Software-2.3% | |||||||
| 40,000 | Microsoft Corp. | 3,421,600 | |||||
| Internet-4.8% | |||||||
| 3,500 | Alphabet, Inc. - CL C * | 3,662,400 | |||||
| 19,000 | Facebook, Inc. - CL A * | 3,352,740 | |||||
| 7,015,140 | |||||||
| Transportation - 2.6% | |||||||
| Airline-1.3% | |||||||
| 30,000 | Southwest Airlines Co. | 1,963,500 | |||||
| Railroad-1.3% | |||||||
| 14,000 | Union Pacific Corp. | 1,877,400 | |||||
| Total Common Stocks | |||||||
| (Cost $41,012,432) | 62,385,345 | ||||||
The accompanying notes are an integral part of these financial statements.
Page 11
| Schedule of Investments | December 31, 2017 |
| Monetta Young Investor Fund (Continued) |
| NUMBER OF SHARES | VALUE | ||||||
| EXCHANGE TRADED FUNDS - 52.4% | |||||||
| 70,000 | iShares Core | ||||||
| S&P 500 | $ | 18,819,500 | |||||
| 120,000 | Schwab Strategic | ||||||
| Trust Large-Cap | 7,653,600 | ||||||
| 55,000 | SPDR S&P 500 Trust | 14,677,300 | |||||
| 63,000 | Vanguard Growth | 8,860,950 | |||||
| 76,000 | Vanguard Large-Cap | 9,316,080 | |||||
| 37,000 | Vanguard S&P 500 | 9,075,730 | |||||
| 76,000 | Vanguard Value | 8,080,320 | |||||
| Total Exchange Traded Funds | |||||||
| (Cost $46,229,723) | 76,483,480 | ||||||
| MONEY MARKET FUNDS - 4.8% | |||||||
| 7,016,851 | Morgan Stanley | ||||||
| Institutional Liquidity | |||||||
| Fund - Government | |||||||
| Portfolio - Institutional | |||||||
| Class, 1.202% ^ | 7,016,851 | ||||||
| Total Money Market Funds | |||||||
| (Cost $7,016,851) | 7,016,851 | ||||||
| Total Investments | |||||||
| (Cost $94,259,006) (b) - 100.0% | 145,885,676 | ||||||
| Liabilities in Excess | |||||||
| of Other Assets - (0.0)% | (40,756 | ) | |||||
| TOTAL NET ASSETS - 100.0% | $ | 145,844,920 | |||||
(a) ADR - American Depositary Receipt | |
(b) Cost for tax purposes is $94,274,365. The aggregate gross unrealized appreciation is $51,654,107, and the aggregate gross unrealized depreciation is $42,796, resulting in net unrealized appreciation of $51,611,311. The difference between book cost and tax cost is attributable primarily to the deferral of wash sale losses. | |
* Non-income producing security. | |
| ^ Rate shown is the seven day effective yield at December 31, 2017. | |
| Industry classification provided by William O’Neil & Co., Inc. | |
The accompanying notes are an integral part of these financial statements.
Page 12
| Statements of Assets and Liabilities | December 31, 2017 |
| Monetta Young | ||||||||
| Monetta Fund | Investor Fund | |||||||
| Assets: | ||||||||
Investments at value (a) | $ | 57,994,072 | $ | 145,885,676 | ||||
| Receivables: | ||||||||
| Interest and dividends | 45,761 | 94,562 | ||||||
| Fund shares sold | 9,780 | 307,972 | ||||||
| Prepaid expenses | 10,558 | 18,005 | ||||||
| Total Assets | 58,060,171 | 146,306,215 | ||||||
| Liabilities: | ||||||||
| Payables: | ||||||||
| Investment advisory fees (Note 2) | 46,866 | 67,872 | ||||||
| Distribution expense (Note 5) | — | 136,233 | ||||||
| Fund shares redeemed | 100 | 168,967 | ||||||
| Accrued trustee fees | 3,768 | 8,273 | ||||||
| Accrued compliance fees | 998 | 2,504 | ||||||
| Accrued other expenses | 45,262 | 77,446 | ||||||
| Total Liabilities | 96,994 | 461,295 | ||||||
| Net Assets | $ | 57,963,177 | $ | 145,844,920 | ||||
| Analysis of net assets: | ||||||||
| Paid in capital | 41,908,701 | 93,471,986 | ||||||
| Accumulated undistributed net investment income | — | 628 | ||||||
| Accumulated undistributed net realized gain on investments | 2,031,034 | 745,636 | ||||||
| Net unrealized appreciation on investments | 14,023,442 | 51,626,670 | ||||||
| Net Assets | $ | 57,963,177 | $ | 145,844,920 | ||||
| (a) Investments at cost | $ | 43,970,630 | $ | 94,259,006 | ||||
| Shares of beneficial interest issued outstanding | 3,068,767 | 6,075,861 | ||||||
| Net asset value, offering price and redemption price per share | $ | 18.89 | $ | 24.00 | ||||
The accompanying notes are an integral part of these financial statements.
Page 13
| Statements of Operations | For The Year Ended |
| December 31, 2017 |
| Monetta Young | ||||||||
| Monetta Fund | Investor Fund | |||||||
| Investment income and expenses: | ||||||||
| Investment income: | ||||||||
| Interest | $ | 35,783 | $ | 50,861 | ||||
| Dividends | 567,341 | 1,923,838 | ||||||
| Total investment income | 603,124 | 1,974,699 | ||||||
| Expenses: | ||||||||
| Investment advisory fees (Note 2) | 533,445 | 730,725 | ||||||
| Distribution expense (Note 5) | — | 332,147 | ||||||
| Transfer and shareholder servicing agent fee | 85,730 | 210,943 | ||||||
| Administration expense | 36,924 | 65,234 | ||||||
| Accounting fees | 27,991 | 27,689 | ||||||
| State registration fees | 25,940 | 28,355 | ||||||
| Audit fees | 15,004 | 15,004 | ||||||
| Custodian fees | 13,775 | 28,435 | ||||||
| Compliance expense | 12,835 | 30,113 | ||||||
| Trustee fees | 12,542 | 28,466 | ||||||
| Printing and postage fees | 9,505 | 18,372 | ||||||
| Legal fees | 6,328 | 14,696 | ||||||
| Other expenses | 6,328 | 10,207 | ||||||
| Total expenses | 786,347 | 1,540,386 | ||||||
| Net investment income (loss) | (183,223 | ) | 434,313 | |||||
| Realized and unrealized gain on investments: | ||||||||
| Net realized gain on investments | 4,559,628 | 4,027,598 | ||||||
| Net change in unrealized appreciation of investments | 5,458,966 | 23,135,996 | ||||||
| Net gain on investments | 10,018,594 | 27,163,594 | ||||||
| Net increase in net assets from operations | $ | 9,835,371 | $ | 27,597,907 | ||||
The accompanying notes are an integral part of these financial statements.
Page 14
| Statements of Changes in Net Assets | For The Years Ended |
| December 31, 2017 |
| Monetta Young | ||||||||||||||||
| Monetta Fund | Investor Fund | |||||||||||||||
| 2017 | 2016 | 2017 | 2016 | |||||||||||||
| Operations: | ||||||||||||||||
| Net investment income (loss) | $ | (183,223 | ) | $ | 6,600 | $ | 434,313 | $ | 670,854 | |||||||
| Net realized gain on investments | 4,559,628 | 2,771,169 | 4,027,598 | 4,085,982 | ||||||||||||
| Net change in unrealized appreciation | ||||||||||||||||
| of investments | 5,458,966 | 670,734 | 23,135,996 | 6,187,128 | ||||||||||||
| Net increase in net assets | ||||||||||||||||
| from operations | 9,835,371 | 3,448,503 | 27,597,907 | 10,943,964 | ||||||||||||
| Distributions paid from: | ||||||||||||||||
| Net investment income | — | (6,582 | ) | (434,265 | ) | (670,739 | ) | |||||||||
| Net realized gain | (3,665,938 | ) | (1,473,155 | ) | (5,080,694 | ) | (3,030,898 | ) | ||||||||
| Total distributions to shareholders | (3,665,938 | ) | (1,479,737 | ) | (5,514,959 | ) | (3,701,637 | ) | ||||||||
| From capital transactions (Note 3): | ||||||||||||||||
| Proceeds from shares sold | 436,052 | 1,976,865 | 40,173,296 | 42,992,868 | ||||||||||||
| Net asset value of shares issued | ||||||||||||||||
| through dividend reinvestment | 3,569,437 | 1,450,526 | 5,220,113 | 3,346,296 | ||||||||||||
| Cost of shares redeemed | (6,709,004 | ) | (4,607,470 | ) | (38,603,791 | ) | (56,759,351 | ) | ||||||||
| Increase (Decrease) in net assets | ||||||||||||||||
| from capital transactions | (2,703,515 | ) | (1,180,079 | ) | 6,789,618 | (10,420,187 | ) | |||||||||
| Total increase (decrease) | ||||||||||||||||
| in net assets | 3,465,918 | 788,687 | 28,872,566 | (3,177,860 | ) | |||||||||||
| Net assets at beginning of year | $ | 54,497,259 | $ | 53,708,572 | $ | 116,972,354 | $ | 120,150,214 | ||||||||
| Net assets at end of year | $ | 57,963,177 | $ | 54,497,259 | $ | 145,844,920 | $ | 116,972,354 | ||||||||
| Accumulated undistributed | ||||||||||||||||
| net investment income | $ | — | $ | 18 | $ | 628 | $ | 580 | ||||||||
The accompanying notes are an integral part of these financial statements.
Page 15
| Financial Highlights |
| Monetta Fund | ||||||||||||||||||||
| Year Ended | Year Ended | Year Ended | Year Ended | Year Ended | ||||||||||||||||
| For a share outstanding throughout | December 31, | December 31, | December 31, | December 31, | December 31, | |||||||||||||||
| the year are as follows: | 2017 | 2016 | 2015 | 2014 | 2013 | |||||||||||||||
| Net asset value at beginning of year | $ | 16.93 | $ | 16.28 | $ | 17.68 | $ | 18.45 | $ | 14.87 | ||||||||||
| Investment Operations: | ||||||||||||||||||||
| Net investment income (loss) | (0.06 | ) | 0.00 | (b) | (0.02 | ) | (0.04 | ) | (0.00 | )(b) | ||||||||||
| Net realized and unrealized gain | ||||||||||||||||||||
| on investments | 3.28 | 1.13 | 0.64 | 1.39 | 5.18 | |||||||||||||||
| Total from investment operations | 3.22 | 1.13 | 0.62 | 1.35 | 5.18 | |||||||||||||||
| Less Distributions: | ||||||||||||||||||||
| From net investment income | — | (0.00 | )(b) | — | — | — | ||||||||||||||
| From net realized gains | (1.26 | ) | (0.48 | ) | (2.02 | ) | (2.12 | ) | (1.60 | ) | ||||||||||
| Total distributions | (1.26 | ) | (0.48 | ) | (2.02 | ) | (2.12 | ) | (1.60 | ) | ||||||||||
| Net asset value at end of year | $ | 18.89 | $ | 16.93 | $ | 16.28 | $ | 17.68 | $ | 18.45 | ||||||||||
| Total return | 19.19 | % | 6.98 | % | 3.19 | % | 7.15 | % | 34.89 | % | ||||||||||
| Ratios to average net assets: | ||||||||||||||||||||
| Expenses - Net | 1.40 | % | 1.45 | % | 1.40 | % | 1.44 | % | 1.51 | % | ||||||||||
| Expenses - Gross | 1.40 | % | 1.45 | % | 1.40 | % | 1.44 | % | 1.53 | %(a) | ||||||||||
| Net investment income (loss) | (0.33 | )% | 0.01 | % | (0.11 | )% | (0.24 | )% | (0.02 | )% | ||||||||||
| Portfolio turnover | 122.9 | % | 120.2 | % | 146.2 | % | 137.2 | % | 96.3 | % | ||||||||||
| Net assets ($in thousands) | $ | 57,963 | $ | 54,497 | $ | 53,709 | $ | 55,368 | $ | 54,480 | ||||||||||
(a) The gross expense ratio excludes fees paid indirectly. Prior to 2014, certain Fund expenses (e.g. legal fees, transfer agent fees) were paid for indirectly using commission credits accrued by the Fund from portfolio brokerage transactions. | |
(b) Rounds to zero. | |
The per share amounts are calculated using the weighted average number of shares outstanding during the year, except for distributions, which are based on shares outstanding at record date. | |
The accompanying notes are an integral part of these financial statements.
Page 16
| Financial Highlights |
| Monetta Young Investor Fund | ||||||||||||||||||||
| Year Ended | Year Ended | Year Ended | Year Ended | Year Ended | ||||||||||||||||
| For a share outstanding throughout | December 31, | December 31, | December 31, | December 31, | December 31, | |||||||||||||||
| the year are as follows: | 2017 | 2016 | 2015 | 2014 | 2013 | |||||||||||||||
| Net asset value at beginning of year | $ | 20.26 | $ | 18.99 | $ | 20.65 | $ | 19.31 | $ | 14.91 | ||||||||||
| Investment Operations: | ||||||||||||||||||||
| Net investment income | 0.07 | 0.11 | 0.09 | 0.09 | 0.15 | |||||||||||||||
| Net realized and unrealized gain | ||||||||||||||||||||
| on investments | 4.58 | 1.81 | 0.25 | 1.79 | 4.74 | |||||||||||||||
| Total from investment operations | 4.65 | 1.92 | 0.34 | 1.88 | 4.89 | |||||||||||||||
| Less Distributions: | ||||||||||||||||||||
| From net investment income | (0.07 | ) | (0.12 | ) | (0.09 | ) | (0.09 | ) | (0.10 | ) | ||||||||||
| From net realized gains | (0.84 | ) | (0.53 | ) | (1.91 | ) | (0.45 | ) | (0.39 | ) | ||||||||||
| Total distributions | (0.91 | ) | (0.65 | ) | (2.00 | ) | (0.54 | ) | (0.49 | ) | ||||||||||
| Net asset value at end of year | $ | 24.00 | $ | 20.26 | $ | 18.99 | $ | 20.65 | $ | 19.31 | ||||||||||
| Total return | 23.10 | % | 10.16 | % | 1.40 | % | 9.67 | % | 32.78 | % | ||||||||||
| Ratios to average net assets: | ||||||||||||||||||||
Expenses - Net(b) | 1.16 | % | 1.22 | % | 1.18 | % | 1.16 | % | 1.00 | % | ||||||||||
Expenses - Gross(b) | 1.16 | % | 1.22 | % | 1.18 | % | 1.19 | % | 1.24 | %(a) | ||||||||||
Net investment income(b)(c) | 0.33 | % | 0.58 | % | 0.42 | % | 0.42 | % | 0.82 | % | ||||||||||
| Portfolio turnover | 36.1 | % | 41.9 | % | 51.1 | % | 54.3 | % | 37.0 | % | ||||||||||
| Net assets ($in thousands) | $ | 145,845 | $ | 116,972 | $ | 120,150 | $ | 142,821 | $ | 127,002 | ||||||||||
(a) The gross expense ratio excludes fees waived/reimbursed, as well as fees paid indirectly. The gross expense ratio excluding only the fees waived/reimbursed was 1.22% for the year ended December 31, 2013. Prior to 2014, certain Fund expenses (e.g. legal fees, transfer agent fees) were paid for indirectly using commission credits accrued by the Fund from portfolio brokerage transactions. | |
(b) The ratios of expenses and net investment income do not include the Fund’s proportionate share of expense and income of the underlying investment companies in which it invests. | |
| (c) Recognition of net investment income by the Fund is affected by the timing of the declaration of dividends by the underlying investment companies in which it invests. | |
| The per share amounts are calculated using the weighted average number of shares outstanding during the year, except for distributions, which are based on shares outstanding at record date. | |
The accompanying notes are an integral part of these financial statements.
Page 17
| Notes to Financial Statements | December 31, 2017 |
| 1. | SIGNIFICANT ACCOUNTING POLICIES: |
| Monetta Trust (the “Trust”) is an open-end diversified management investment company registered under the Investment Company Act of 1940, as amended (the “1940 Act”). The following funds, collectively referred to as the Funds, are series of the Trust: | |
Monetta Fund. The primary objective of this Fund is long-term capital growth. The Fund seeks this objective by investing primarily in equity securities believed to have growth potential. The Fund presently invests primarily in large capitalization growth companies. | |
Monetta Young Investor Fund. The objective of this Fund is long-term capital growth. The Fund seeks this objective by investing approximately 50% of its assets in exchange traded funds (“ETFs”) and other funds seeking to track the S&P 500® Index or other broad-based market indices that primarily include stocks of large capitalization U.S. companies and the remainder of its assets in common stocks of individual companies that Monetta Financial Services, Inc., (the “Adviser”) considers to be high quality well-known companies that produce products or provide services that are recognized by many investors. | |
| The Funds are investment companies and accordingly follow the investment company accounting and reporting guidance of the Financial Accounting Standards Board (“FASB”) Accounting Standards Codification Topic 946 Financial Services – Investment Companies. | |
| The following is a summary of significant accounting policies followed by the Funds in the preparation of their financial statements in accordance with accounting principles generally accepted in the United States of America (“U.S. GAAP”). | |
| (a) Securities Valuation | |
| Equity securities and ETFs are stated at fair value, based on the official closing price as of the time of valuation. If there is no official closing price of a security on the valuation date, the security is valued at the mean between the most recent bid and ask quotation, in each case on the principal exchange or market on which that security is traded. If there are no reported sales and no reported bid quotations for a security on a valuation date, or it is not traded on an exchange, the securities are “fair valued” in accordance with the Funds’ Fair Value Procedures. To the extent these securities are actively traded, and valuation adjustments are not applied, they are categorized in Level 1 of the fair value hierarchy. Other securities traded over-the-counter shall be valued at the official closing price. If there is no official closing price, the security is valued at the most recent mean quotation. Investments in registered open-end management companies, including money market funds, will be valued based on the net asset value (“NAV”) of such investments and are categorized as Level 1 of the fair value hierarchy. | |
| Securities for which market quotations are not readily available or are deemed unreliable are valued at their fair value in accordance with procedures established by the Board of Trustees (“Board”). In determining the fair value of a security, the Adviser and the Board shall take into account the relevant factors and surrounding circumstances, which may include: (i) the nature and duration of restrictions, if any, on the disposition of the security; (ii) fundamental analytical data relating to the security; (iii) evaluation of the forces that influence the market in which the security is traded; (iv) information as to any transactions in or offers for the security; (v) the existence of any merger proposal, tender offer or other extraordinary events relating to the security; (vi) the price and extent of public trading in similar securities of the issuer or of comparable companies; and (vii) any other methodologies and factors that they consider appropriate. | |
| (b) Use of Estimates | |
| The preparation of financial statements, in conformity with U.S. GAAP, requires the Funds’ management to make estimates and assumptions that affect reported amounts of assets and liabilities and disclosures of contingent assets and liabilities at the date of the financial statements and the results of operations during the reporting period. Actual results could differ from those estimates. | |
| (c) General | |
| Security transactions are accounted for on a trade date basis. Daily realized gains and losses from security transactions are reported on the specific lot identification basis. Interest income is recorded daily on the accrual basis and dividend income on the ex-dividend date. Withholding taxes on foreign dividends have been provided for in accordance with the Funds’ understanding of the applicable country’s tax rules and regulations. |
Page 18
| Notes to Financial Statements | December 31, 2017 |
| (d) Expenses | |
| Expenses that are directly related to one of the Funds are charged directly to that Fund. Other operating expenses are allocated to the Funds on several bases, including relative net assets of all the Funds within the Monetta Trust. | |
| (e) Federal Income Taxes | |
| It is each Fund’s policy to comply with the requirements of the Internal Revenue Code applicable to regulated investment companies and to distribute substantially all of their taxable income to their shareholders. Accordingly, no provision for federal income taxes is required. The Funds will utilize capital loss carry forwards, if any, as allowable, to minimize certain distributions of capital gains. | |
| The Funds intend to utilize provisions of the federal income tax laws which allow them to carry a realized loss forward indefinitely and retain their character as either short-term or long-term capital losses. At December 31, 2017, there were no capital loss carryforwards. | |
| Net realized gains or losses differ for financial reporting and tax purposes as a result of losses from wash sales. At December 31, 2017, the Funds had no post-October capital losses which were realized after October 31, 2017, and deferred for tax purposes to January 1, 2018. The Funds recognize interest and penalties, if any, related to unrecognized tax benefits on certain tax positions as income tax expense in the Statements of Operations. During the fiscal year ended December 31, 2017, the Funds did not incur any interest or penalties. | |
| (f) Distributions of Incomes and Gains | |
| Distributions to shareholders are recorded by the Funds on the ex-dividend date. Due to inherent differences in the characterization of short-term capital gains under U.S. GAAP, and for federal income tax purposes, the amount of distributable net investment income for book and federal income tax purposes may differ. | |
| Additionally, U.S. GAAP requires that certain components of net assets relating to permanent difference be reclassified between financial and tax reporting. These reclassifications have no effect on net assets or net asset value per share. For the fiscal year ended December 31, 2017, the Monetta Fund decreased accumulated undistributed net investment loss by $183,205, and decreased accumulated undistributed net realized gain by $183,205. These adjustments were made due to the Fund’s net operating loss. The Monetta Young Investor Fund had no such reclassifications. | |
| As of December 31, 2017, the components of accumulated earnings on a tax basis were as follows: |
| Monetta | Monetta Young | ||||||||
| Fund | Investor Fund | ||||||||
| Undistributed Ordinary Income | $ | 1,663,706 | $ | 761,623 | |||||
| Undistributed Long-Term Capital Gain | 375,563 | — | |||||||
| Net Unrealized Appreciation | 14,015,207 | 51,611,311 | |||||||
| Total Accumulated Earnings | $ | 16,054,476 | $ | 52,372,934 | |||||
| The tax character of distributions paid during the years ended December 31, 2017 and 2016, were as follows: |
| Monetta | Monetta Young | ||||||||
| 2017 | Fund | Investor Fund | |||||||
| Ordinary Income* | $ | 138,783 | $ | 2,056,652 | |||||
| Long-Term Capital Gain | 3,527,155 | 3,458,307 | |||||||
| Total Distributions to Shareholders | $ | 3,665,938 | $ | 5,514,959 | |||||
| Monetta | Monetta Young | ||||||||
| 2016 | Fund | Investor Fund | |||||||
| Ordinary Income* | $ | 6,582 | $ | 670,739 | |||||
| Long-Term Capital Gain | 1,473,155 | 3,030,898 | |||||||
| Total Distributions to Shareholders | $ | 1,479,737 | $ | 3,701,637 | |||||
| * For federal income tax purposes, distributions of short-term capital gains are treated as ordinary income distributions. |
Page 19
| Notes to Financial Statements | December 31, 2017 |
| (g) Fair Value Measurements | |
| In accordance with ASC 820-10, fair value is defined as the price that a Fund would receive to sell an investment or pay to transfer a liability in an orderly transaction with an independent buyer in the principal market or, in the absence of a principal market, the most advantageous market for the investment or liability. ASC 820-10 establishes a three-tier hierarchy to distinguish between (1) inputs that reflect the assumptions market participants would use in pricing an asset or liability developed based on market data obtained from sources independent of the reporting entity (observable inputs) and (2) inputs that reflect the reporting entity’s own assumptions about the assumptions market participants would use in pricing an asset or liability developed based on the best information available in the circumstances (unobservable inputs) and to establish classification of fair value measurements for disclosure purposes. Various inputs are used in determining the value of each Fund’s investments. The inputs are summarized in the three broad Levels listed below. |
| • | Level 1 - | quoted prices in active markets for identical investments; | |
| • | Level 2 - | other significant observable inputs (including quoted prices for similar investments, interest rates, prepayment speeds, credit risk, etc.); | |
| • | Level 3 - | significant unobservable inputs (including each Fund’s own assumptions in determining the fair value of investments). |
| The inputs or methodology used for valuing securities are not necessarily an indication of the risk associated with investing in those securities. | |
| The following table summarizes each respective Fund’s investments at December 31, 2017, based on the inputs used to value them: |
| INVESTMENTS IN SECURITIES | |||||||||||||||||
| Type of Investments | Level 1 | Level 2 | Level 3 | Total | |||||||||||||
| Monetta Fund | |||||||||||||||||
| Common Stocks | $ | 53,874,334 | $ | — | $ | — | $ | 53,874,334 | |||||||||
| Money Market Funds | $ | 4,119,738 | $ | — | $ | — | $ | 4,119,738 | |||||||||
| FUND TOTAL | $ | 57,994,072 | $ | — | $ | — | $ | 57,994,072 | |||||||||
| Monetta Young Investor Fund | |||||||||||||||||
| Common Stocks | $ | 62,385,345 | $ | — | $ | — | $ | 62,385,345 | |||||||||
| Exchange Traded Funds | $ | 76,483,480 | $ | — | $ | — | $ | 76,483,480 | |||||||||
| Money Market Funds | $ | 7,016,851 | $ | — | $ | — | $ | 7,016,851 | |||||||||
| FUND TOTAL | $ | 145,885,676 | $ | — | $ | — | $ | 145,885,676 | |||||||||
| Refer to the Funds’ Schedules of Investments for industry classifications. | |
| Transfers are recognized at the end of the reporting period. There were no transfers between valuation Levels during the fiscal year ended December 31, 2017. | |
| 2. | RELATED PARTIES: |
| Robert S. Bacarella is an officer and trustee of the Funds and also an officer, director and majority shareholder of the Adviser. Robert J. Bacarella is an officer of the Funds and also an officer of the Adviser. For the year ended December 31, 2017, remunerations required to be paid to all interested trustees have been directly paid by the Adviser. Fees paid to independent trustees have been directly paid by the Funds. | |
| Each Fund pays an investment advisory fee to the Adviser monthly based on that Fund’s individual net assets. | |
| The Monetta Fund pays the Adviser based on an annual rate of 0.95% for the first $300 million in net assets, 0.90% for the next $200 million in net assets, and 0.85% for net assets over $500 million. The Monetta Young Investor Fund pays the Adviser based on an annual rate of 0.55% on all net assets. From these fees the Adviser pays for all necessary office facilities, equipment and personnel for managing the assets of each Fund. |
Page 20
| Notes to Financial Statements | December 31, 2017 |
| 3. | CAPITAL STOCK AND SHARE UNITS: |
| There is an unlimited number of “no par value” shares of beneficial interest authorized for each series of the Trust. |
| Monetta | Monetta Young | ||||||||
| Fund | Investor Fund | ||||||||
| 2016 Beginning Shares | 3,298,201 | 6,327,457 | |||||||
| Shares sold | 118,427 | 2,270,042 | |||||||
| Shares issued upon dividend reinvestment | 86,900 | 166,793 | |||||||
| Shares redeemed | (285,441 | ) | (2,990,660 | ) | |||||
| Net decrease in shares outstanding | (80,441 | ) | (553,825 | ) | |||||
| 2017 Beginning Shares | 3,218,087 | 5,773,632 | |||||||
| Shares sold | 23,713 | 1,788,321 | |||||||
| Shares issued upon dividend reinvestment | 192,593 | 222,916 | |||||||
| Shares redeemed | (365,626 | ) | (1,709,008 | ) | |||||
| Net increase (decrease) in shares outstanding | (149,320 | ) | 302,229 | ||||||
| 2017 Ending Shares | 3,068,767 | 6,075,861 | |||||||
| 4. | PURCHASES AND SALES OF INVESTMENT SECURITIES: |
| The cost of purchases and proceeds from sales of securities for the year ended December 31, 2017, excluding short-term securities were: |
| U.S. Government | Other Investment | ||||||||||||||||
| Securities | Securities | ||||||||||||||||
| Purchases | Sales | Purchases | Sales | ||||||||||||||
| Monetta Fund | $ | — | $ | — | $ | 63,384,619 | $ | 69,650,716 | |||||||||
| Monetta Young Investor Fund | — | — | 45,704,339 | 46,221,390 | |||||||||||||
| 5. | DISTRIBUTION PLAN: |
| The Trust and its shareholders have adopted a service and distribution plan (the “Plan”) pursuant to Rule 12b-1 under the 1940 Act. The Plan permits the participating Fund to pay certain expenses associated with the distribution of its shares. Annual fees under the Plan up to 0.25% for the Monetta Young Investor Fund are accrued daily. The Fund distributor is Quasar Distributors, LLC. | |
| 6. | SECTOR RISK: |
| As of December 31, 2017, the Monetta Fund had a significant portion of its assets invested in the retail sector. The retail sector may be greatly impacted by changes in domestic and international economies, interest rates, competition, consumer confidence, consumer spending, government regulations, marketing, and supply and demand. | |
| 7. | ETF RISK: |
| As of December 31, 2017, the Monetta Young Investor Fund had a significant portion of its assets invested in ETFs. ETFs are a type of index fund bought and sold on a securities exchange. An ETF trades like a common stock and represents a fixed portfolio of securities designed to track the performance and dividend yield of a particular domestic or foreign market index. The Fund may purchase an ETF to gain exposure to a portion of the U.S. or a foreign market. The risks of owning an ETF generally reflect the risks of owning the underlying securities they are designed to track, although the lack of liquidity on an ETF could result in it being more volatile. Additionally, ETFs have fees and expenses that reduce their value. | |
| 8. | CONTROL OWNERSHIP: |
| The beneficial ownership, either directly or indirectly, of more than 25% of the voting securities of a fund creates a presumption of control of the fund, under Section 2(a)(9) of the 1940 Act. As of December 31, 2017, Charles Schwab & Co., for the benefit of its customers, owned 39.10% of the outstanding shares of the Monetta Young Investor Fund. |
Page 21
| Report of Independent Registered Public Accounting Firm | December 31, 2017 |
To the Shareholders and Board of Trustees of
Monetta Trust
Opinion on the Financial Statements
We have audited the accompanying statements of assets and liabilities, including the schedules of investments, of Monetta Trust comprising Monetta Fund and Monetta Young Investor Fund (the “Funds”) as of December 31, 2017, and the related statements of operations for the year then ended, the statements of changes in net assets for each of the two years in the period then ended, including the related notes, and the financial highlights for each of the five years in the period then ended (collectively referred to as the “financial statements”). In our opinion, the financial statements present fairly, in all material respects, the financial position of each of the Funds as of December 31, 2017, the results of their operations for the year then ended, the changes in their net assets for each of the two years in the period then ended, and the financial highlights for each of the five years in the period then ended, in conformity with accounting principles generally accepted in the United States of America.
Basis for Opinion
These financial statements are the responsibility of the Funds’ management. Our responsibility is to express an opinion on the Funds’ financial statements based on our audits. We are a public accounting firm registered with the Public Company Accounting Oversight Board (United States) (“PCAOB”) and are required to be independent with respect to the Funds in accordance with the U.S. federal securities laws and the applicable rules and regulations of the Securities and Exchange Commission and the PCAOB.
We conducted our audits in accordance with the standards of the PCAOB. Those standards require that we plan and perform the audit to obtain reasonable assurance about whether the financial statements are free of material misstatement, whether due to error or fraud.
Our audits include performing procedures to assess the risks of material misstatement of the financial statements, whether due to error or fraud, and performing procedures that respond to those risks. Such procedures include examining, on a test basis, evidence regarding the amounts and disclosures in the financial statements and confirmation of securities owned as of December 31, 2017, by correspondence with the custodian. Our audits also included evaluating the accounting principles used and significant estimates made by management, as well as evaluating the overall presentation of the financial statements. We believe that our audits provide a reasonable basis for our opinion.
We have served as the Funds’ auditor since 2013.

COHEN & COMPANY, LTD.
Cleveland, Ohio
February 23, 2018
Page 22
| Other Information (Unaudited) | December 31, 2017 |
BOARD APPROVAL OF ADVISORY AGREEMENTS
At an in-person meeting held on November 13, 2017, the Board considered the renewal of two separate investment advisory agreements. One between the Trust, on behalf of the Monetta Fund and the Adviser, and another between the Trust, on behalf of the Monetta Young Investor Fund (the “Young Investor Fund”) and the Adviser. Both advisory agreements are required to be renewed annually on or before December 2, 2017, by a majority of the Trustees who are not interested persons of the Funds, voting in person, and at a meeting called for the specific purpose of approving each agreement.
The Board was presented with relative performance, fees, expenses, asset size and other information in connection with the continuation of each advisory agreement. The Board received a memorandum from Thompson Hine outlining the legal standards applicable to the renewal and continuation of an investment advisory agreement under the 1940 Act. The Board was informed that Thompson Hine had submitted a request for information from the Adviser, on behalf of the Board, pursuant to Section 15(c) of the 1940 Act, a copy of which is included with the Materials. Furthermore, the Board was provided with responsive information from the Adviser regarding each Fund prior to the Meeting being held. The Board fully reviewed the advisory agreements and materials considered relevant in connection with the renewal of each agreement, as set forth below.
In the approval of the advisory fees and other expenses to be paid by the Funds, and the advisory agreements themselves, the Board considered the following factors (no single one of which was determinative): the management and advisory needs of the Funds, the nature and quality of the services provided by the Adviser in relation to the fee paid, the profitability to the Adviser (including an analysis of the Adviser’s cost of providing services), whether the Adviser is enjoying economies of scale and are sharing the benefits of such economies with fund shareholders, whether comparative expense ratios and fee rates are higher or lower than those of other similar funds, and the fall-out benefits to the Adviser from managing the Funds (i.e. indirect revenues to the Adviser attributable in some way to the existence of the Funds).
The Board discussed the nature, extent, and quality of services provided by the Adviser. Andrew Davalla, Thompson Hine LLP, noted there were no changes to Adviser personnel, key risks to the Funds remained static, the Funds had an insurance policy and there were no regulatory or compliance issues with the Funds. Mr. Davalla mentioned the Adviser had instituted additional procedures in the past year with respect to price comparison testing.
The Board was presented with performance information for each Fund in comparison to each Fund’s benchmark, Morningstar category average and peer grouping. A summary of the results for each Fund as of September 30, 2017 is below. Mr. Davalla stated the performance was in line with their large-cap growth peers.
1‐Year | 3‐Years | 5‐Years | 10‐Years | |
| Monetta Fund | 17.46% | 8.70% | 13.06% | 5.51% |
S&P 500® Index | 18.61% | 10.81% | 14.22% | 7.44% |
| US OE Large Growth | 19.87% | 10.50% | 13.79% | 7.60% |
| Peer Group | 17.46% | 9.24% | 12.54% | 6.36% |
1‐Year | 3‐Years | 5‐Years | 10‐Years | |
| Young Investor Fund | 19.07% | 9.66% | 13.23% | 11.08% |
S&P 500® Index | 18.61% | 10.81% | 14.22% | 7.44% |
| US OE Large Growth | 19.87% | 10.50% | 13.79% | 7.60% |
| Peer Group | 19.31% | 9.66% | 13.23% | 7.54% |
The Board was also presented with information in connection with the advisory fee and net expense ratios for each Fund versus their respective peer grouping as represented in the Materials and below.
| Monetta Fund | Peer Median | Peer Average | |
| Advisory Fee | 0.95% | 0.75% | 0.76% |
| Net Expense | 1.41% | 1.20% | 1.11% |
| Young Investor | |||
| Fund | Peer Median | Peer Average | |
| Advisory Fee | 0.55% | 0.70% | 0.70% |
| Net Expense | 1.17% | 1.23% | 1.33% |
Page 23
| Other Information (Unaudited) | December 31, 2017 |
The Board reviewed the cost of services and profitability of the Adviser, giving consideration to the Adviser’s continued ability to provide quality investment management services to the Funds in view of the total net assets of the Fund complex. The Board discussed the total revenue and fall-out benefits to the Adviser from the Advisory Agreements in place and noted the two Funds were the only clients of the Adviser. Mr. Davalla reminded the Board that the advisory fee schedule for the Young Investor Fund does not contain break points, whereas the fee schedule for the Monetta Fund does contain break points. He also pointed out that the Adviser had been reimbursed in February 2017 with 12b-1 fees from the Young Investor Fund for various distribution and marketing payments made by the Adviser in 2016. Mr. Bacarella confirmed the Adviser continues to perform its own independent analysis with regard to stock selection for the Funds and does not rely on a “model” or algorithm during stock selection.
The Board determined the revenue and profits of the Adviser were both reasonable and appropriate. They found the advisory fee for each Fund to be reasonable in light of the nature, quality and extent of the services being provided to each Fund, the size of each Fund and the costs incurred by the Adviser in providing such services. They also found the fee structure for the Young Investor Fund reasonable given the nature and type of securities held by the Fund. The Board determined the break points in the fee schedule for the Monetta Fund were reasonably likely to allow the shareholders of the Fund to share in economies of scale as the Fund grows.
No single factor was determinative of the Board’s decision to approve the renewal of the Advisory Agreements; rather, the Board based its determination on the total mix of information available. Based on a consideration of all the factors in their totality, the Board, including a majority of the Independent Trustees, determined that the renewal of the Advisory Agreements, including the compensation payable under the agreements, were fair and reasonable to the Funds. The Board, including a majority of the Independent Trustees, therefore determined that the approval of the renewal of the Advisory Agreements was in the best interest of the Funds and their shareholders.
Page 24
| Trustees & Officers (Unaudited) | December 31, 2017 |
| Name (Year of Birth) | Principal Occupation(s) | Other Directorships |
| Position(s) with Funds | During Past Five Years | and Affiliations |
| Independent (“disinterested”) Trustees: | ||
| John L. Guy (1952) | EVP/Director of Business Banking, | Ambassador Funds, |
| Independent Chairman since May 19, 2014 | Webster Bank, since Dec. 2010 | 2010-2012 |
| Trustee since 1993 | Monetta Fund, Inc. | |
| 1998-2013 | ||
| Marlene Z. Hodges (1948) | Founder and CEO of Marlene Z. Hodges, | Ambassador Funds, |
| Trustee since 2001 | LLC, a consultancy providing financial | 2010-2012 |
| guidance to non-profits, since Oct. 2011 | Monetta Fund, Inc. | |
| EVP and CFO, Orchard Village since 2012 | 2001-2013 | |
| Patricia J. Luscombe (1961) | Managing Director of the Valuations and | Northern Lights |
| Trustee since November 13, 2015 | Opinions Group, Lincoln International, | Fund Trust III |
| LLC since 2007. | 2015-present | |
Inside (“Interested”) Trustee(1) | ||
| Robert S. Bacarella (1949) | Chief Executive Officer, President and | Ambassador Funds, |
| Trustee and President since 1993 | Director of Monetta Financial | 2010-2012 |
| Principal Executive Officer since 2002 | Services, Inc. since 1984. | Monetta Fund, Inc. |
| 1985-2013 | ||
| Officers Who Are Not Trustees | ||
| Robert J. Bacarella* (1977) | Vice President, Treasurer, Chief Financial | Not Applicable |
| Vice President since 2009 | Officer, and Director of Monetta Financial | |
| Treasurer since 2010 | Services Inc. since 2009. | |
| Secretary, Chief Financial Officer, | ||
| Principal Financial Officer and | ||
| Principal Accounting Officer since 2012 | ||
| Douglas N. Tyre (1980) | Chief Compliance Officer for the Adviser since | Not Applicable |
| Chief Compliance Officer | March 2016; Vice President, Chief Compliance | |
| c/o Cipperman Compliance Services LLC | Officer, Cipperman Compliance Services LLC | |
| 480 E. Swedesford Road, Suite 300 | (2014-present), Formerly, Client Services & | |
| Wayne, PA 19087 | Operations Specialist-Senior Associate of | |
| Echo Point Investment Management LLC | ||
| (2010-2014). | ||
(1) Trustees who are employees or officers of the Adviser receive no compensation from the Trust. | |
* Mr. Robert J. Bacarella is the son of Mr. Robert S. Bacarella, President and Founder of the Adviser. | |
The Address for each Trustee and officer, unless otherwise indicated, is the Adviser’s office.
Additional information about the Trustees is available in the Trust’s Statement of Additional Information (“SAI”), which is available, without charge, by calling 1-800-MONETTA.
Page 25
| Notice to Shareholders (Unaudited) | December 31, 2017 |
Tax Information
For the fiscal year ended December 31, 2017, certain dividends paid by the Funds may be subject to a maximum tax rate of 23.8%, as provided for by the Taxpayer Relief Act of 2012. The percentage of dividends declared from ordinary income designed as qualified dividend income was 30.83% and 67.06% for the Monetta Fund and Monetta Young Investor Fund, respectively.
For corporate shareholders, the percent of ordinary income distributions qualifying for the corporate dividends received deduction for the fiscal year ended December 31, 2017 was 30.46% and 28.62% for the Monetta Fund and Monetta Young Investor Fund, respectively.
The percentage of taxable ordinary income distributions that are designated as short-term capital gain distributions under Internal Revenue Section 871(k)(2)(c) was 99.99% and 78.88% for the Monetta Fund and Monetta Young Investor Fund, respectively.
Proxy Voting Policies and Proxy Voting Record
The Funds’ proxy voting policies and procedures, as well as its proxy voting record for the most recent 12-month period ended June 30, are available without charge, upon request, by contacting the Adviser at 1-800-MONETTA, or by writing to Monetta Financial Services, Inc., 1776-A South Naperville Rd., Suite 100, Wheaton, IL 60189. The Funds’ proxy voting record is also available on the U.S. Securities and Exchange Commission’s website at www.sec.gov.
Form N-Q Holdings Information
The Funds file their complete schedule of portfolio holdings with the U.S. Securities and Exchange Commission for the first and third quarters of each fiscal year on Form N-Q. The Funds’ Forms N-Q are available on the Commission’s website at www.sec.gov and may be reviewed and copied at the Commission’s Public Reference Room in Washington, DC. Information on the operation of the Public Reference Room may be obtained by calling (800) SEC-0330.
Householding
In an effort to decrease costs, the Funds intend to reduce the number of duplicate prospectuses and annual and semi-annual reports you receive by sending only one copy of each to those addresses shared by two or more accounts and to shareholders we reasonably believe are from the same family or household (“householding”). If you would like to opt out of householding or, once implemented, if you would like to discontinue householding for your accounts, please call toll-free at 1-800-241-9772 to request individual copies of these documents. Once the Funds receive notice to stop householding, we will begin sending individual copies 30 days after receiving your request. This policy does not apply to account statements.
Information about the Funds’ Trustees
The Statement of Additional Information (“SAI”) includes information about the Funds’ Trustees and is available without charge, upon request, by calling 1-800-MONETTA.
Page 26
Privacy Policy (Unaudited)
In order to provide the products and services of the Funds, we may collect nonpublic, personal information from you. We consider such information to be private and confidential and are committed to respecting your privacy and protecting your information.
We may collect nonpublic, personal information about you from the following sources:
• information that you provide us on applications and other forms;
• information that we generate to service your account, such as account statements; and
• information that we may receive from third parties.
We do not disclose nonpublic, personal information about you without your authorization, except as permitted by law or in response to inquiries from governmental authorities. We may share information with affiliated and unaffiliated third parties with whom we have contracts for servicing the Funds, including transfer agents and mailing services. We will provide unaffiliated third parties with only the information necessary to carry out their assigned responsibilities and require third parties to treat your non-public personal information with the same high degree of confidentiality.
We restrict access to your nonpublic, personal information to those employees who need to know such information to provide products or services to you. We maintain certain physical, electronic and procedural safeguards that are designed to protect your nonpublic, personal information.
In the event that you hold shares of the Funds through a financial intermediary, including, but not limited to, a broker-dealer, bank, or trust company, the privacy policy of your financial intermediary would govern how your non-public personal information would be shared with non-affiliated third parties.
Page 27
Monetta Mutual Funds
1776-A South Naperville Road
Suite 100
Wheaton, IL 60189-5831
Item 2. Code of Ethics.
The registrant has adopted a code of ethics that applies to the registrant’s principal executive officer and principal financial officer. The registrant has not made any amendments to its code of ethics during the period covered by this report. The registrant has not granted any waivers from any provisions of the code of ethics during the period covered by this report.
A copy of the registrant’s Code of Ethics is filed herewith.
Item 3. Audit Committee Financial Expert.
The registrant’s board of trustees has determined that there is at least one audit committee financial expert serving on its audit committee. Marlene Z. Hodges and John L. Guy are the “audit committee financial experts” and are considered to be “independent” as each term is defined in Item 3 of Form N‑CSR.
Item 4. Principal Accountant Fees and Services.
The registrant has engaged its principal accountant to perform audit services, audit-related services, tax services and other services during the past two fiscal years. “Audit services” refer to performing an audit of the registrant's annual financial statements or services that are normally provided by the accountant in connection with statutory and regulatory filings or engagements for those fiscal years. “Audit-related services” refer to the assurance and related services by the principal accountant that are reasonably related to the performance of the audit. “Tax services” refer to professional services rendered by the principal accountant for tax compliance, tax advice, and tax planning; including reviewing the Fund’s tax returns and distributions calculations. There were no “other services” provided by the principal accountant. For the fiscal years ended December 31, 2017 and December 31, 2016, the Fund’s principal accountant was Cohen & Company, Ltd. The following table details the aggregate fees billed or expected to be billed for each of the last two fiscal years for audit fees, audit-related fees, tax fees and other fees by the principal accountant.
| FYE 12/31/2017 | FYE 12/31/2016 | |
| Audit Fees | $24,000 | $24,000 |
| Audit-Related Fees | $0 | $0 |
| Tax Fees | $6,000 | $6,000 |
| All Other Fees | $- | $- |
The audit committee has adopted pre-approval policies and procedures that require the audit committee to pre‑approve all audit and non‑audit services of the registrant, including services provided to any entity affiliated with the registrant.
The percentage of fees billed by Cohen & Company, Ltd applicable to non-audit services pursuant to waiver of pre-approval requirement were as follows:
| FYE 12/31/2017 | FYE 12/31/2016 | |
| Audit-Related Fees | 0% | 0% |
| Tax Fees | 0% | 0% |
| All Other Fees | 0% | 0% |
All of the principal accountant’s hours spent on auditing the registrant’s financial statements were attributed to work performed by full‑time permanent employees of the principal accountant.
The following table indicates the non-audit fees billed or expected to be billed by the registrant’s accountant for services to the registrant and to the registrant’s investment adviser (and any other controlling entity, etc.—not sub-adviser) for the last two years. The audit committee of the board of trustees/directors has considered whether the provision of non-audit services that were rendered to the registrant's investment adviser is compatible with maintaining the principal accountant's independence and has concluded that the provision of such non-audit services by the accountant has not compromised the accountant’s independence.
| Non-Audit Related Fees | FYE 12/31/2017 | FYE 12/31/2016 |
| Registrant | N/A | N/A |
| Registrant’s Investment Adviser | N/A | N/A |
Item 5. Audit Committee of Listed Registrants.
Not applicable to registrants who are not listed issuers (as defined in Rule 10A-3 under the Securities Exchange Act of 1934).
Item 6. Investments.
(a) Schedule of Investments is included as part of the report to shareholders filed under Item 1 of this form.
(b) Not applicable
Item 7. Disclosure of Proxy Voting Policies and Procedures for Closed-End Management Investment Companies.
Not applicable to open-end investment companies.
Item 8. Portfolio Managers of Closed-End Management Investment Companies.
Not applicable to open-end investment companies.
Item 9. Purchases of Equity Securities by Closed‑End Management Investment Company and Affiliated Purchasers.
Not applicable to open-end investment companies.
Item 10. Submission of Matters to a Vote of Security Holders.
Not applicable.
Item 11. Controls and Procedures.
| (a) | The Registrant’s principal executive officer and principal financial officer have reviewed the Registrant's disclosure controls and procedures (as defined in Rule 30a-3(c) under the Investment Company Act of 1940 (the “Act”)) as of a date within 90 days of the filing of this report, as required by Rule 30a-3(b) under the Act and Rules 13a-15(b) or 15d‑15(b) under the Securities Exchange Act of 1934. Based on their review, such officers have concluded that the disclosure controls and procedures are effective in ensuring that information required to be disclosed in this report is appropriately recorded, processed, summarized and reported and made known to them by others within the Registrant and by the Registrant’s service provider. |
| (b) | There were no significant changes in the Registrant's internal control over financial reporting (as defined in Rule 30a-3(d) under the Act) that occurred during the second fiscal quarter of the period covered by this report that has materially affected, or is reasonably likely to materially affect, the Registrant's internal control over financial reporting. |
Item 12. Disclosure of Securities Lending Activities for Closed-End Management Investment Companies
Not applicable to open-end investment companies.
Item 13. Exhibits.
| (a) | (1) Any code of ethics or amendment thereto, that is the subject of the disclosure required by Item 2, to the extent that the registrant intends to satisfy Item 2 requirements through filing an exhibit. Filed herewith. |
(2) A separate certification for each principal executive and principal financial officer pursuant to Section 302 of the Sarbanes-Oxley Act of 2002. Filed herewith.
(3) Any written solicitation to purchase securities under Rule 23c‑1 under the Act sent or given during the period covered by the report by or on behalf of the registrant to 10 or more persons. Not applicable to open-end investment companies.
| (b) | Certifications pursuant to Section 906 of the Sarbanes‑Oxley Act of 2002. Furnished herewith. |
SIGNATURES
Pursuant to the requirements of the Securities Exchange Act of 1934 and the Investment Company Act of 1940, the registrant has duly caused this report to be signed on its behalf by the undersigned, thereunto duly authorized.
(Registrant) Monetta Trust
By (Signature and Title)* /s/Robert S. Bacarella
Robert S. Bacarella, Chief Executive Officer
Date March 5, 2018
Pursuant to the requirements of the Securities Exchange Act of 1934 and the Investment Company Act of 1940, this report has been signed below by the following persons on behalf of the registrant and in the capacities and on the dates indicated.
By (Signature and Title)* /s/Robert S. Bacarella
Robert S. Bacarella, Chief Executive Officer
Date March 5, 2018
By (Signature and Title)* /s/Robert J. Bacarella
Robert J. Bacarella, Chief Financial Officer
Date March 5, 2018
* Print the name and title of each signing officer under his or her signature.