| Loans maturing or repricing after one year with: | |
Variable interest rates | | $ | 238,869 | |
Fixed interest rates | | | 230,920 | |
Total | | $ | 469,789 | |
(1) Includes commercial and industrial and commercial real estate loans.
(2) Includes automobile, home equity and other consumer loans.
adequate at December 31, 2016 to absorb probable losses in the portfolio. There can be no assurance, however, that adjustments to the allowance for loan losses will not be required in the future. Changes in the circumstances of particular borrowers, as well as adverse developments in the economy, are factors that could change and make adjustments to the allowance for loan losses necessary. Asset quality will continue to remain a key focus, as management continues to stress not just loan growth, but quality in loan underwriting as well. Future provisions to the allowance for loan losses will continue to be based on management's quarterly in-depth evaluation that is discussed in further detail under the caption "Critical Accounting Policies - Allowance for Loan Losses" within this Management's Discussion and Analysis.
DEPOSITS
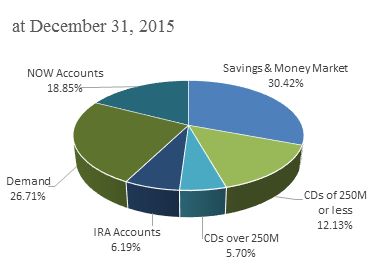
Deposits are used as part of the Company's liquidity management strategy to meet obligations for depositor withdrawals, to fund the borrowing needs of loan customers, and to fund ongoing operations. Deposits, both interest- and noninterest-bearing, continue to be the most significant source of funds used by the Company to support earning assets. Deposits are attractive sources of funding because of their stability and generally low cost as compared with other funding sources. The Company seeks to maintain a proper balance of core deposit relationships on hand while also utilizing various wholesale deposit sources, such as brokered and internet CD balances, as an alternative funding source to manage efficiently the net interest margin. Deposits are influenced by changes in interest rates, economic conditions and competition from other banks. The accompanying table VII shows the composition of total deposits as of December 31, 2016, 2015 and 2014. Total deposits increased $129,706, or 19.6%, from the end of 2015 to $790,452 at December 31, 2016. This deposit growth was largely impacted by the $119,669 in deposits acquired from Milton Bank. The acquired deposits consisted of $46,736 in time deposits, $45,688 in savings, NOW and money market accounts, and $27,245 in noninterest-bearing demand deposits. At December 31, 2016, the growth in deposit balances came mostly from the Company's "core" deposits, which include noninterest-bearing deposits, as well as interest-bearing demand, savings, and money market deposits. The Company believes core deposits from local consumers who can maintain multiple accounts and services at the Bank are more stable and less sensitive to changing interest rates and other economic factors. The Company also benefited from a lesser percentage of total deposits being held in brokered and retail time deposits at December 31, 2016 than at December 31, 2015.
FINANCIAL CONDITION AND RESULTS OF OPERATIONS
Contributing most to the 2016 growth in deposits was the Company's interest-bearing NOW accounts, which increased $30,527, or 24.5%, during the twelve months ended 2016, as compared to year-end 2015. This increase was largely driven by growth in public fund account balances. While the Company feels confident in the relationships it has with its public fund customers, these balances will continue to experience larger fluctuations than other deposit account relationships due to the nature of the account activity. Larger public fund account balance fluctuations are, at times, seasonal and can be predicted while most other large fluctuations are outside of management's control. The Company values these public fund relationships it has secured and will continue to market and service these accounts to maintain its long-term relationships.
Further increases in the Company's deposit balances came from savings account balances, which increased $35,378, or 52.0%, from year-end 2015, coming primarily from the statement savings product.
Deposit balances were also impacted by the Company's interest-free funding source, noninterest-bearing demand deposits, which were up $33,077, or 18.7%, from year-end 2015. Demand deposit growth came primarily from the Company's business checking accounts and other noninterest-bearing products, particularly those offering incentive rewards to customers.
The Company's time deposits increased $29,317, or 18.5%, from year-end 2015. Excluding deposits from the Milton Bank acquisition, the Company's time deposits would have decreased from year-end 2015. This decreasing effect in time deposits from year-end 2015 fits within management's strategy of focusing on more "core" deposit balances and has caused time deposits to represent a smaller percentage of total deposits, finishing at 23.8% of total deposits at December 31, 2016 compared to 24.0% of total deposits at December 31, 2015. Historically, time deposits, particularly CD's, had been the most significant source of funding for the Company's earning assets. Based on the minimal spread between a short-term CD rate and a statement savings rate, many customers choose to invest balances into a more liquid product, perhaps hoping for rising rates in the near future. Furthermore, the Company's preference of core deposit funding sources has created a lesser reliance on brokered and internet CD issuances in recent years. As a result, wholesale CD balances decreased $7,503, or 23.8%, during 2016. The Company will continue to evaluate its use of brokered CD's to manage the Company's liquidity position and interest rate risk associated with longer-term, fixed-rate asset loan demand.
FINANCIAL CONDITION AND RESULTS OF OPERATIONS
| | | As of December 31 | |
| (dollars in thousands) | | 2016 | | | 2015 | | | 2014 | |
| Interest-bearing deposits: | | | | | | | | | |
| NOW accounts | | $ | 155,051 | | | $ | 124,524 | | | $ | 112,571 | |
| Money market | | | 134,308 | | | | 132,901 | | | | 137,076 | |
| Savings accounts | | | 103,453 | | | | 68,075 | | | | 61,712 | |
| IRA accounts | | | 47,099 | | | | 40,930 | | | | 42,406 | |
| Certificates of deposit | | | 140,965 | | | | 117,817 | | | | 131,271 | |
| | | | 580,876 | | | | 484,247 | | | | 485,036 | |
| Noninterest-bearing deposits: | | | | | | | | | | | | |
| Demand deposits | | | 209,576 | | | | 176,499 | | | | 161,794 | |
| Total deposits | | $ | 790,452 | | | $ | 660,746 | | | $ | 646,830 | |
The Company will continue to experience increased competition for deposits in its market areas, which should challenge its net growth. The Company will continue to emphasize growth and retention within its core deposit relationships during 2016, reflecting the Company's efforts to reduce its reliance on higher cost funding and improving net interest income.
OTHER BORROWED FUNDS
The Company also accesses other funding sources, including short-term and long-term borrowings, to fund potential asset growth and satisfy short-term liquidity needs. Other borrowed funds consist primarily of FHLB advances and promissory notes. During 2016, other borrowed funds were up $13,139, or 54.9%, from year-end 2015. The increase was related to management's decision to fund specific fixed-rate loans with like-term FHLB advances during the first and second quarters of 2016. Furthermore, the Company issued a $5,000 promissory note to a bank during the third quarter of 2016 to help finance the cash disbursements related to the Milton Bancorp acquisition. The note has a 10-year maturity that is fixed for 5 years. While deposits continue to be the primary source of funding for growth in earning assets, management will continue to utilize FHLB advances and promissory notes to help manage interest rate sensitivity and liquidity.
SUBORDINATED DEBENTURES
The Company received proceeds from the issuance of one trust preferred security on March 22, 2007 totaling $8,500 at a fixed rate of 6.58%. The trust preferred security is now at an adjustable rate equal to the 3-month LIBOR plus 1.68%. The Company does not report the securities issued by the trust as a liability, but instead, reports as a liability the subordinated debenture issued by the Company and held by the trust.
FINANCIAL CONDITION AND RESULTS OF OPERATIONS
OFF-BALANCE SHEET ARRANGEMENTS
As discussed in Notes I and L, the Company engages in certain off-balance sheet credit-related activities, including commitments to extend credit and standby letters of credit, which could require the Company to make cash payments in the event that specified future events occur. Commitments to extend credit are agreements to lend to a customer as long as there is no violation of any condition established in the contract. Commitments generally have fixed expiration dates or other termination clauses and may require payment of a fee. Standby letters of credit are conditional commitments to guarantee the performance of a customer to a third party. While these commitments are necessary to meet the financing needs of the Company's customers, many of these commitments are expected to expire without being drawn upon. Therefore, the total amount of commitments does not necessarily represent future cash requirements.Management does not anticipate that the Company's current off-balance sheet activities will have a material impact on the results of operations and financial condition.
CAPITAL RESOURCES
The Company maintains a capital level that exceeds regulatory requirements as a margin of safety for its depositors. As detailed in Note P to the financial statements at December 31, 2016, the Bank's capital exceeded the requirements to be deemed "well capitalized" under applicable prompt corrective action regulations. Total shareholders' equity at December 31, 2016 of $104,528 was up $14,058, or 15.5%, as compared to the balance of $90,470 at December 31, 2015. Shareholders' equity at December 31, 2016 included $11,444 from the 523,518 shares of common stock that were issued in conjunction with the acquisition of Milton Bancorp. Further contributing to capital growth was year-to-date net income of $6,920, partially offset by cash dividends paid of $3,585, or $.82 per share.
INTEREST RATE SENSITIVITY AND LIQUIDITY
The Company's goal for interest rate sensitivity management is to maintain a balance between steady net interest income growth and the risks associated with interest rate fluctuations. Interest rate risk ("IRR") is the exposure of the Company's financial condition to adverse movements in interest rates. Accepting this risk can be an important source of profitability, but excessive levels of IRR can threaten the Company's earnings and capital.
The Company evaluates IRR through the use of an earnings simulation model to analyze net interest income sensitivity to changing interest rates. The modeling process starts with a base case simulation, which assumes a static balance sheet and flat interest rates. The base case scenario is compared to rising and falling interest rate scenarios assuming a parallel shift in all interest rates. Comparisons of net interest income and net income fluctuations from the flat rate scenario illustrate the risks associated with the current balance sheet structure.
The Company's Asset/Liability Committee monitors and manages IRR within Board approved policy limits. The current IRR policy limits anticipated changes in net interest income to an instantaneous increase or decrease in market interest rates over a 12 month horizon to +/- 5% for a 100 basis point rate shock, +/- 7.5% for a 200 basis point rate shock and +/- 10% for a 300 basis point rate shock. Based on the level of interest rates, management did not test interest rates down 200 or 300 basis points.
FINANCIAL CONDITION AND RESULTS OF OPERATIONS
The following table presents the Company's estimated net interest income sensitivity:
INTEREST RATE SENSITIVITY | | | | |
Table VIII | | | | |
| | | | |
Change in Interest Rates Basis Points | | December 31, 2016 % Change in Net Interest Income | | December 31, 2015 % Change in Net Interest Income |
| | | | |
| +300 | | (.39%) | | (.03%) |
| +200 | | (.05%) | | .18% |
| +100 | | .09% | | .19% |
| -100 | | (1.72%) | | (2.48%) |
The estimated percentage change in net interest income due to a change in interest rates was within the policy guidelines established by the Board. With the historical low interest rate environment, management generally has been focused on limiting the duration of assets, while trying to extend the duration of our funding sources to the extent customer preferences will permit the Company to do so. At December 31, 2016, the interest rate risk profile reflects limited exposure to an increase in interest rates, which is consistent with the interest rate risk profile at December 31, 2015. In a declining rate environment, net interest income is impacted by the interest rate on many deposit accounts not being able to adjust downward. With interest rates so low, deposit accounts are perceived to be at or near an interest rate floor. As a result, net interest income decreases in a declining interest rate environment. Overall, management is comfortable with the current interest rate risk profile, which reflects minimal exposure to interest rate changes.
Liquidity relates to the Company's ability to meet the cash demands and credit needs of its customers and is provided by the ability to readily convert assets to cash and raise funds in the market place. Total cash and cash equivalents, held to maturity securities maturing within one year and available for sale securities, totaling $136,928, represented 14.3% of total assets at December 31, 2016. In addition, the FHLB offers advances to the Bank, which further enhances the Bank's ability to meet liquidity demands. At December 31, 2016, the Bank could borrow an additional $147,627 from the FHLB, of which $75,000 could be used for short-term, cash management advances. Furthermore, the Bank has established a borrowing line with the Federal Reserve. At December 31, 2016, this line had total availability of $45,105. Lastly, the Bank also has the ability to purchase federal funds from a correspondent bank. For further cash flow information, see the condensed consolidated statement of cash flows. Management does not rely on any single source of liquidity and monitors the level of liquidity based on many factors affecting the Company's financial condition.
INFLATION
Consolidated financial data included herein has been prepared in accordance with US GAAP. Presently, US GAAP requires the Company to measure financial position and operating results in terms of historical dollars with the exception of securities available for sale, which are carried at fair value. Changes in the relative value of money due to inflation or deflation are generally not considered.
In management's opinion, changes in interest rates affect the financial institution to a far greater degree than changes in the inflation rate. While interest rates are greatly influenced by changes in the inflation rate, they do not change at the same rate or in the same magnitude as the inflation rate. Rather, interest rate volatility is based on changes in the expected rate of inflation, as well as monetary and fiscal policies. A financial institution's ability to be relatively unaffected by changes in interest rates is a good indicator of its capability to perform in today's volatile economic environment. The Company seeks to insulate itself from interest rate volatility by ensuring that rate sensitive assets and rate sensitive liabilities respond to changes in interest rates in a similar time frame and to a similar degree.
FINANCIAL CONDITION AND RESULTS OF OPERATIONS
CRITICAL ACCOUNTING POLICIES
The most significant accounting policies followed by the Company are presented in Note A to the consolidated financial statements. These policies, along with the disclosures presented in the other financial statement notes, provide information on how significant assets and liabilities are valued in the financial statements and how those values are determined. Management views critical accounting policies to be those that are highly dependent on subjective or complex judgments, estimates and assumptions, and where changes in those estimates and assumptions could have a significant impact on the financial statements. Management currently views the adequacy of the allowance for loan losses and business combinations to be critical accounting policies.
Allowance for Loan Losses:
The allowance for loan losses is a valuation allowance for probable incurred credit losses. Loan losses are charged against the allowance when management believes the uncollectibility of a loan balance is confirmed. Subsequent recoveries, if any, are credited to the allowance. Management estimates the allowance balance required using past loan loss experience, the nature and volume of the portfolio, information about specific borrower situations and estimated collateral values, economic conditions, and other factors. Allocations of the allowance may be made for specific loans, but the entire allowance is available for any loan that, in management's judgment, should be charged off.
The allowance consists of specific and general components. The specific component relates to loans that are individually classified as impaired. A loan is impaired when, based on current information and events, it is probable that the Company will be unable to collect all amounts due according to the contractual terms of the loan agreement. Impaired loans generally consist of loans with balances of $200 or more on nonaccrual status or nonperforming in nature. Loans for which the terms have been modified, and for which the borrower is experiencing financial difficulties, are considered troubled debt restructurings and classified as impaired.
Factors considered by management in determining impairment include payment status, collateral value, and the probability of collecting scheduled principal and interest payments when due. Loans that experience insignificant payment delays and payment shortfalls generally are not classified as impaired. Management determines the significance of payment delays and payment shortfalls on a case-by-case basis, taking into consideration all of the circumstances surrounding the loan and the borrower, including the length and reasons for the delay, the borrower's prior payment record, and the amount of shortfall in relation to the principal and interest owed.
Commercial and commercial real estate loans are individually evaluated for impairment. If a loan is impaired, a portion of the allowance is allocated so that the loan is reported, net, at the present value of estimated future cash flows using the loan's existing rate or at the fair value of collateral if repayment is expected solely from the collateral. Smaller balance homogeneous loans, such as consumer and most residential real estate, are collectively evaluated for impairment, and accordingly, they are not separately identified for impairment disclosure. Troubled debt restructurings are measured at the present value of estimated future cash flows using the loan's effective rate at inception. If a troubled debt restructuring is considered to be a collateral dependent loan, the loan is reported, net, at the fair value of the collateral. For troubled debt restructurings that subsequently default, the Company determines the amount of reserve in accordance with the accounting policy for the allowance for loan losses.
FINANCIAL CONDITION AND RESULTS OF OPERATIONS
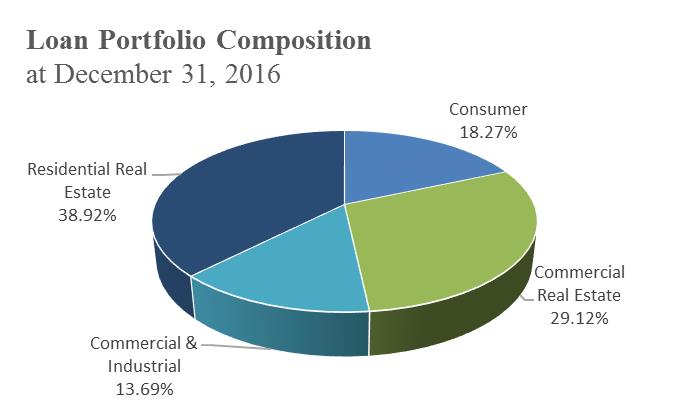
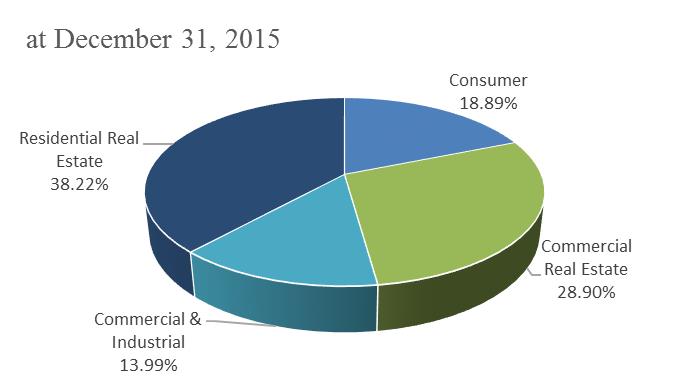
The general component covers non‑impaired loans and impaired loans that are not individually reviewed for impairment and is based on historical loss experience adjusted for current factors. The historical loss experience is determined by portfolio segment and is based on the actual loss history experienced by the Company over the most recent 3 years for the consumer and real estate portfolio segment and 5 years for the commercial portfolio segment. Prior to 2014, the commercial portfolio's historical loss factor was based on a period of 3 years. During the first quarter of 2014, management extended the loan loss history to 5 years due to the significant decline in net charge-offs that have been experienced since the first quarter of 2012. By extending the historical loan loss period to 5 years, management feels the historical factor is more representative of the expected losses to be incurred on commercial loans. The total loan portfolio's actual loss experience is supplemented with other economic factors based on the risks present for each portfolio segment. These economic factors include consideration of the following: levels of and trends in delinquencies and impaired loans; levels of and trends in charge-offs and recoveries; trends in volume and terms of loans; effects of any changes in risk selection and underwriting standards; other changes in lending policies, procedures, and practices; experience, ability, and depth of lending management and other relevant staff; national and local economic trends and conditions; industry conditions; and effects of changes in credit concentrations. The following portfolio segments have been identified: Commercial Real Estate, Commercial and Industrial, Residential Real Estate, and Consumer.
Commercial and industrial loans consist of borrowings for commercial purposes by individuals, corporations, partnerships, sole proprietorships, and other business enterprises. Commercial and industrial loans are generally secured by business assets, such as equipment, accounts receivable, inventory, or any other asset excluding real estate, and are generally made to finance capital expenditures or operations. The Company's risk exposure is related to deterioration in the value of collateral securing the loan should foreclosure become necessary. Generally, business assets used or produced in operations do not maintain their value upon foreclosure, which may require the Company to write down the value significantly to sell.
Commercial real estate consists of nonfarm, nonresidential loans secured by owner-occupied and nonowner-occupied commercial real estate as well as commercial construction loans. An owner-occupied loan relates to a borrower purchased building or space for which the repayment of principal is dependent upon cash flows from the ongoing business operations conducted by the party, or an affiliate of the party, who owns the property. Owner-occupied loans that are dependent on cash flows from operations can be adversely affected by current market conditions for their product or service. A nonowner-occupied loan is a property loan for which the repayment of principal is dependent upon rental income associated with the property or the subsequent sale of the property. Nonowner-occupied loans that are dependent upon rental income are primarily impacted by local economic conditions which dictate occupancy rates and the amount of rent charged. Commercial construction loans consist of borrowings to purchase and develop raw land into one-to-four family residential properties. Construction loans are extended to individuals as well as corporations for the construction of an individual or multiple properties and are secured by raw land and the subsequent improvements. Repayment of the loans to real estate developers is dependent upon the sale of properties to third parties in a timely fashion upon completion. Should there be delays in construction or a downturn in the market for those properties, there may be significant erosion in value which may be absorbed by the Company
CONTRACTUAL OBLIGATIONS
Table IX
The following table presents, as of December 31, 2016, significant fixed and determinable contractual obligations to third parties by payment date. Further discussion of the nature of each obligation is included in the referenced note to the consolidated financial statements.
| | | Payments Due In | |
| (dollars in thousands) | | Note Reference | | | One Year or Less | | | One to Three Years | | | Three to Five Years | | | Over Five Years | | | Total | |
| Deposits without a stated maturity | | | G | | | $ | 602,388 | | | $ | ---- | | | $ | ---- | | | $ | ---- | | | $ | 602,388 | |
| Consumer and brokered time deposits | | | G | | | | 100,447 | | | | 71,170 | | | | 15,971 | | | | 476 | | | | 188,064 | |
Other borrowed funds | | | I | | | | 7,625 | | | | 7,881 | | | | 4,975 | | | | 16,604 | | | | 37,085 | |
Subordinated debentures | | | J | | | | ---- | | | | ---- | | | | ---- | | | | 8,500 | | | | 8,500 | |
Lease obligations | | | E | | | | 332 | | | | 235 | | | | 74 | | | | ---- | | | | 641 | |
.
FINANCIAL CONDITION AND RESULTS OF OPERATIONS
Residential real estate loans consist of loans to individuals for the purchase of one- to four-family primary residences with repayment primarily through wage or other income sources of the individual borrower. The Company's loss exposure to these loans is dependent on local market conditions for residential properties as loan amounts are determined, in part, by the fair value of the property at origination.
Consumer loans are comprised of loans to individuals secured by automobiles, open-end home equity loans and other loans to individuals for household, family, and other personal expenditures, both secured and unsecured. These loans typically have maturities of 6 years or less with repayment dependent on individual wages and income. The risk of loss on consumer loans is elevated as the collateral securing these loans, if any, rapidly depreciate in value or may be worthless and/or difficult to locate if repossession is necessary. During the last several years, one of the most significant portions of the Company's net loan charge-offs have been from consumer loans. Nevertheless, the Company has allocated the highest percentage of its allowance for loan losses as a percentage of loans to the other identified loan portfolio segments due to the larger dollar balances associated with such portfolios.
Business Combinations:
Business combinations are accounted for using the acquisition method. The cost of an acquisition is measured as the aggregate of the consideration transferred and the amount of any noncontrolling interest in the acquiree. Acquisition related transaction costs are expensed and included in other operational results. When a business is acquired, the Company assesses the financial assets and liabilities assumed for appropriate classification and designation in accordance with the contractual terms, economic circumstances and pertinent conditions as of the acquisition date. We are required to record the assets acquired, including identified intangible assets, and the liabilities assumed at their fair value. These often involve estimates based on third party valuations, such as appraisals, or internal valuations based on discounted cash flow analyses or other valuation techniques that may include estimates of attrition, inflation, asset growth rates, or other relevant factors. In addition, the determination of the useful lives over which an intangible asset will be amortized is subjective. Under FASB ASC 350 (SFAS No. 142 Goodwill and Other Intangible Assets), goodwill and indefinite-lived assets recorded must be reviewed for impairment on an annual basis, as well as on an interim basis if events or changes indicate that the asset might be impaired. An impairment loss must be recognized for any excess of carrying value over fair value of the goodwill or the indefinite-lived intangible asset.
| | | 2016 | | | 2015 | | | 2014 | | | 2013 | | | 2012 | |
| | | | | | | | | | | | | | | | |
Return on average assets | | | .77 | % | | | 1.03 | % | | | 1.01 | % | | | 1.04 | % | | | .86 | % |
Return on average equity | | | 7.05 | % | | | 9.66 | % | | | 9.62 | % | | | 10.40 | % | | | 9.53 | % |
Dividend payout ratio | | | 51.79 | % | | | 42.74 | % | | | 42.62 | % | | | 36.56 | % | | | 62.29 | % |
| Average equity to average assets | | | 10.91 | % | | | 10.71 | % | | | 10.49 | % | | | 10.01 | % | | | 9.00 | % |
FINANCIAL CONDITION AND RESULTS OF OPERATIONS
CONCENTRATIONS OF CREDIT RISK
The Company maintains a diversified credit portfolio, with residential real estate loans currently comprising the most significant portion. Credit risk is primarily subject to loans made to businesses and individuals in southeastern Ohio and western West Virginia. Management believes this risk to be general in nature, as there are no material concentrations of loans to any industry or consumer group. To the extent possible, the Company diversifies its loan portfolio to limit credit risk by avoiding industry concentrations.