EXHIBIT 99.1 (i)

EXHIBIT 99.1(i)

Amedisys, Inc.
(Nasdaq: AMED)
Forward-Looking Statements
Statements contained in this presentation which are not historical facts are forward-looking statements. These forward-looking statements and all other statements that may be contained in this presentation that are not historical facts are subject to a number of risks and uncertainties, and actual results may differ materially than those forecasted. Such forward-looking statements are estimates reflecting the best judgment of Amedisys, Inc. management based upon currently available information. Certain factors which could affect the accuracy of such forward-looking statements are identified in the public filings made by Amedisys, Inc. with the Securities and Exchange Commission, and forward-looking statements contained herein, or other public statements of Amedisys, Inc. or its management should be considered in light of those factors.

Investment Considerations
• Large and rapidly growing industry
• Focus on Medicare reimbursement
• Operating leverage
• Technology focus
• Regional growth strategy
• Successful acquisition record

Corporate Overview
Corporate Overview
• Amedisys is a leading provider of home health care nursing services
• Operates 90 home care locations in the southern and southeastern United States1
• Medicare accounts for 90% of revenue
1 As of May 2004
Corporate Overview
Our Purpose
To assist patients in maintaining and improving their quality of life
Our Strategy
To offer low-cost, outcome-driven health care at home
Our Mission
To provide cost-efficient, quality health care services to the patients entrusted to our care
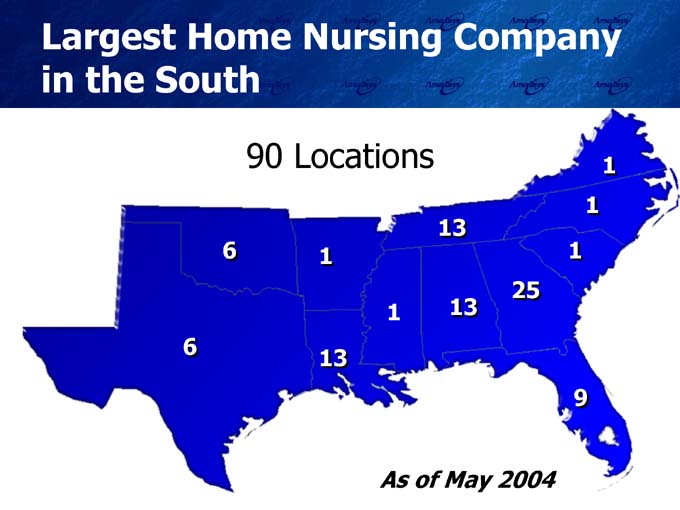
Largest Home Nursing Company in the South
90 Locations
As of May 2004

Leadership Team
Executive Team Board of Directors
William F. Borne William F. Borne, Chairman
Founder, Chief Executive Officer
Ronald A. LaBorde
Gregory H. Browne Jake L. Netterville
Chief Financial Officer
David R. Pitts
Larry R. Graham
Peter R. Ricchiuti
Chief Operating Officer

Market Opportunity
What is Home Health Care?
“Medical care delivered to a homebound patient by licensed professionals supervised by the patient’s physician.”
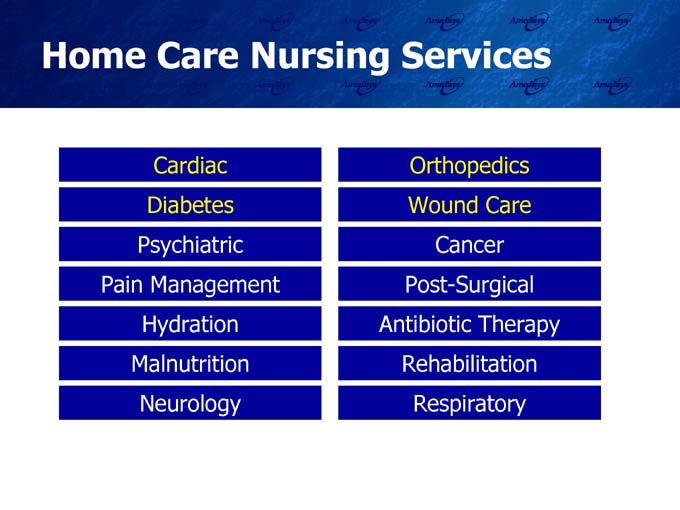
Home Care Nursing Services
Cardiac Orthopedics
Diabetes Wound Care
Psychiatric Cancer
Pain Management Post-Surgical
Hydration Antibiotic Therapy
Malnutrition Rehabilitation
Neurology Respiratory
Home Care Growth Drivers
• Trend from facility to non-facility based care
– Lower cost
– Consumer preference
– Technology
• Aging population
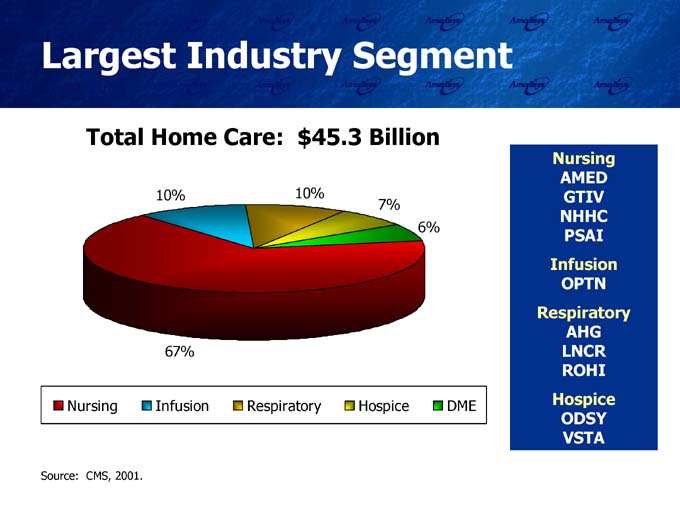
Largest Industry Segment
Total Home Care: $45.3 Billion
Nursing AMED
GTIV NHHC PSAI
Infusion OPTN
Respiratory AHG
LNCR ROHI Hospice ODSY
VSTA
Nursing Infusion Respiratory Hospice DME
Source: CMS, 2001.
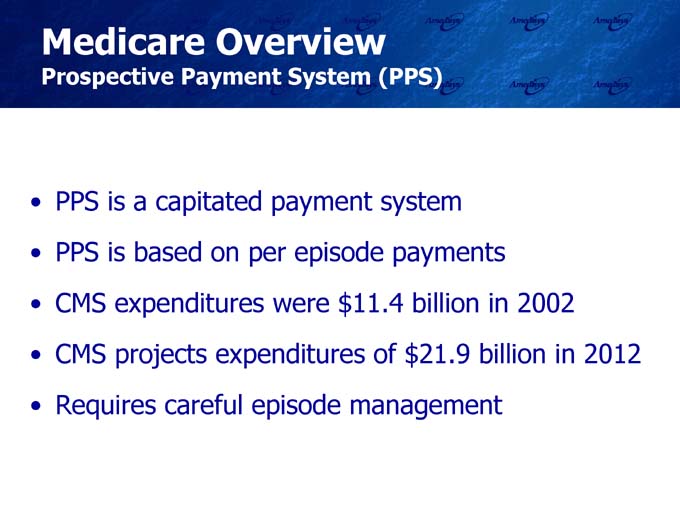
Medicare Overview
Prospective Payment System (PPS)
• PPS is a capitated payment system
• PPS is based on per episode payments
• CMS expenditures were $11.4 billion in 2002
• CMS projects expenditures of $21.9 billion in 2012
• Requires careful episode management
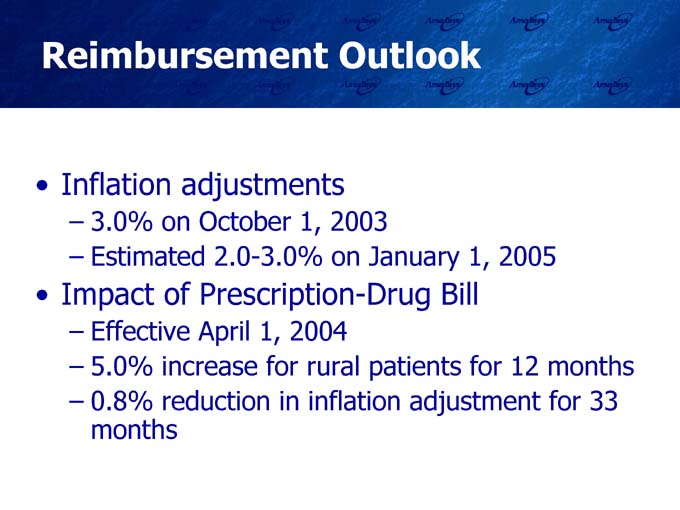
Reimbursement Outlook
• Inflation adjustments
– 3.0% on October 1, 2003
– Estimated 2.0-3.0% on January 1, 2005
• Impact of Prescription-Drug Bill
– Effective April 1, 2004
– 5.0% increase for rural patients for 12 months
– 0.8% reduction in inflation adjustment for 33 months

Strategic Focus
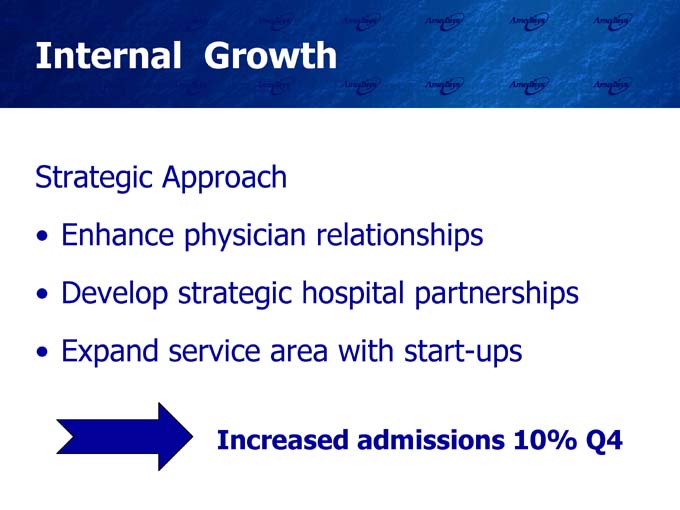
Internal Growth
Strategic Approach
• Enhance physician relationships
• Develop strategic hospital partnerships
• Expand service area with start-ups
Increased admissions 10% Q4
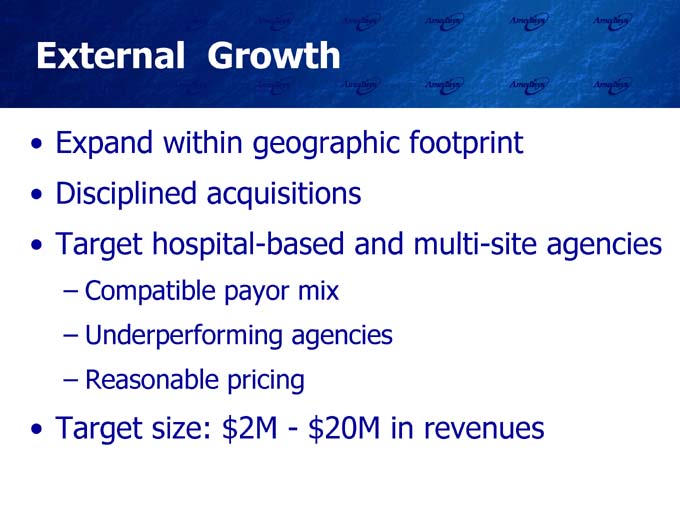
External Growth
• Expand within geographic footprint
• Disciplined acquisitions
• Target hospital-based and multi-site agencies
– Compatible payor mix
– Underperforming agencies
– Reasonable pricing
• Target size: $2M—$20M in revenues
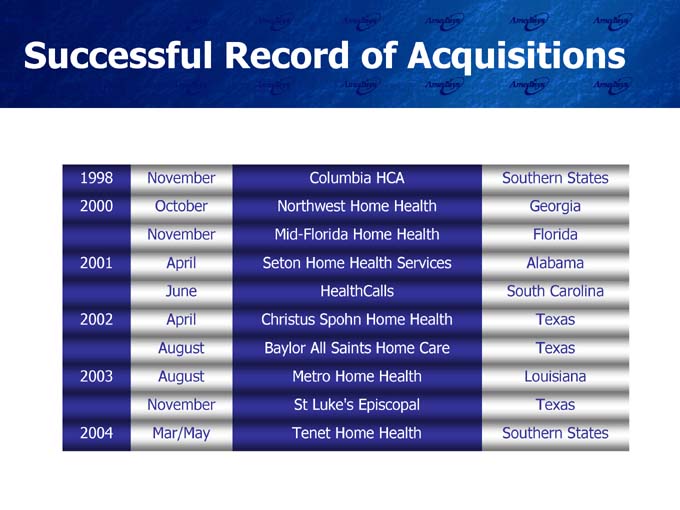
Successful Record of Acquisitions
1998 November Columbia HCA Southern States
2000 October Northwest Home Health Georgia
November Mid-Florida Home Health Florida
2001 April Seton Home Health Services Alabama
June HealthCalls South Carolina
2002 April Christus Spohn Home Health Texas
August Baylor All Saints Home Care Texas
2003 August Metro Home Health Louisiana
November St Luke’s Episcopal Texas
2004 Mar/May Tenet Home Health Southern States
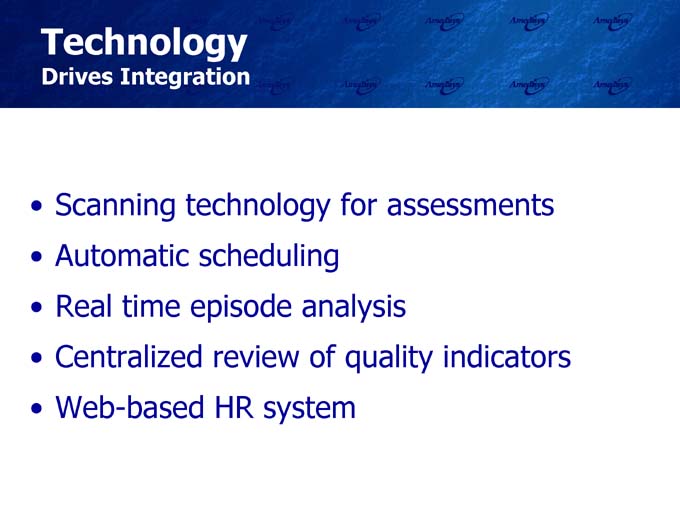
Technology
Drives Integration
• Scanning technology for assessments
• Automatic scheduling
• Real time episode analysis
• Centralized review of quality indicators
• Web-based HR system

Financial Performance
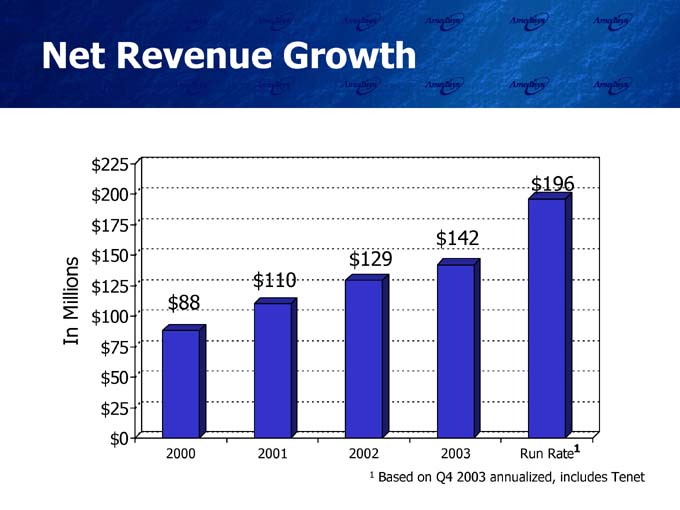
Net Revenue Growth
In Millions
$ 225
$ 196
$ 200
$ 175
$ 142
$ 150 $ 129
$ 125 $ 110
$ 88
$ 100
$ 75
$ 50
$ 25
$ 0
2000 2001 2002 2003 Run Rate1
1 Based on Q4 2003 annualized, includes Tenet
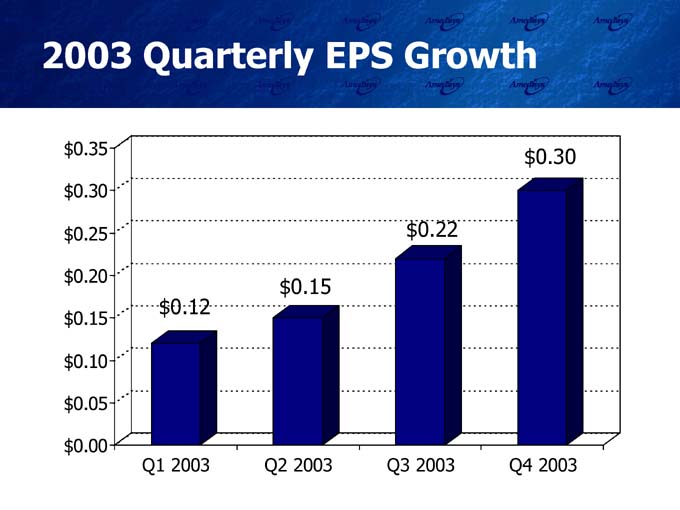
2003 Quarterly EPS Growth
$ 0.35 $ 0.30
$ 0.30
$ 0.25 $ 0.22
$ 0.20 $ 0.15
$ 0.12
$ 0.15
$ 0.10
$ 0.05
$ 0.00
Q1 2003 Q2 2003 Q3 2003 Q4 2003
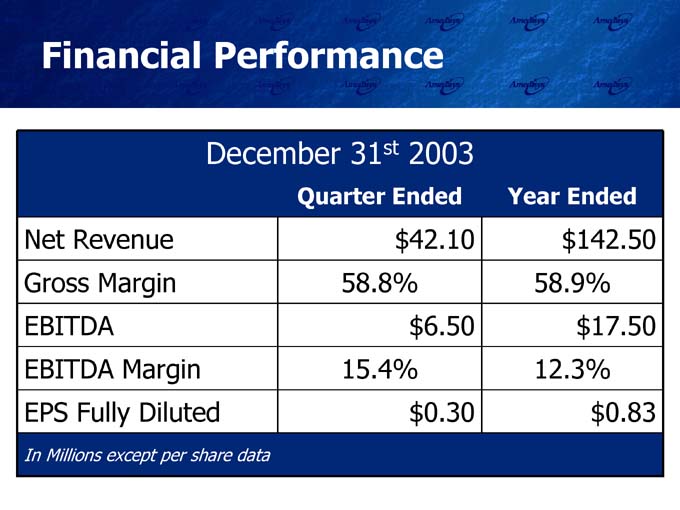
Financial Performance
December 31st 2003
Quarter Ended Year Ended
Net Revenue $ 42.10 $ 142.50
Gross Margin 58.8% 58.9%
EBITDA $ 6.50 $17.50
EBITDA Margin 15.4% 12.3%
EPS Fully Diluted $ 0.30 $0.83
In Millions except per share data
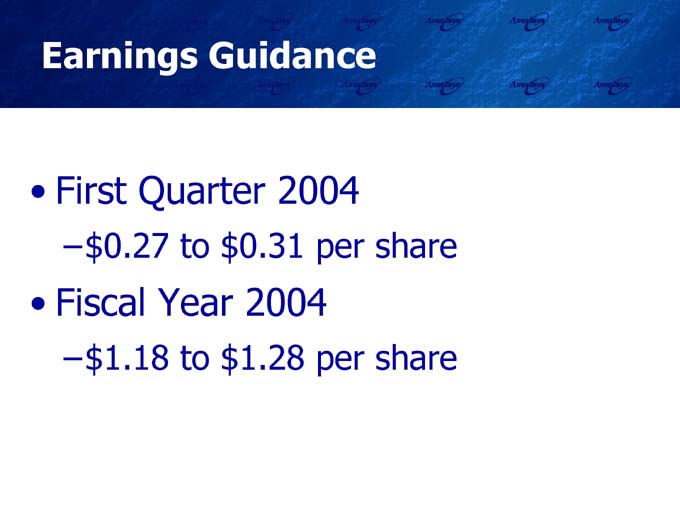
Earnings Guidance
• First Quarter 2004
–$ 0.27 to $0.31 per share
• Fiscal Year 2004
–$ 1.18 to $1.28 per share
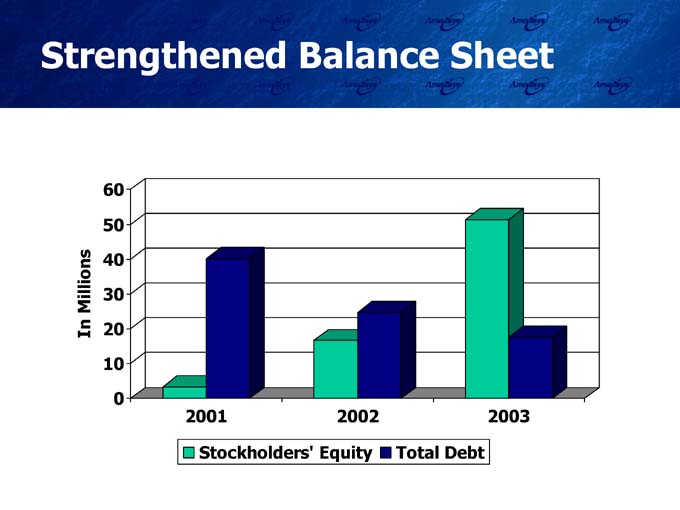
Strengthened Balance Sheet
In Millions
60
50
40
30
20
10
0
2001 2002 2003
Stockholders’ Equity Total Debt

Investment Considerations
Investment Considerations
• Large and rapidly growing industry
• Focus on Medicare reimbursement
• Operating leverage
• Technology focus
• Regional growth strategy
• Successful acquisition record

Amedisys, Inc.
(Nasdaq: AMED)