UNITED STATES
SECURITIES AND EXCHANGE COMMISSION
Washington, DC 20549
FORM 10-K
x ANNUAL REPORT PURSUANT TO SECTION 13 OR 15(d) OF THE SECURITIES EXCHANGE ACT OF 1934
For the fiscal year ended December 31, 2006
OR
o TRANSITION REPORT PURSUANT TO SECTION 13 OR 15(d) OF THE SECURITIES EXCHANGE ACT OF 1934
FOR THE TRANSITION PERIOD FROM _____________ TO _____________
Commission file number: 0-21202
Firstwave Technologies, Inc.
(Exact name of Registrant as Specified in its Charter)
Georgia | 58-1588291 |
(I.R.S. Employer | |
Incorporation or Organization) | Identification No.) |
5775 Glenridge Drive, Building E,
Suite 400, Atlanta, Georgia, 30328
(Address of Principal Executive Offices including Zip Code)
(770) 250-0360
(Registrant’s Telephone Number, Including Area Code)
Securities registered pursuant to Section 12(b) of the Act: None
Securities registered pursuant to Section 12(g) of the Act:
COMMON STOCK, $.0019 PAR VALUE
(Title of Class)
Indicate by check mark if the registrant is a well-known seasoned issuer, as defined in Rule 405 of the Securities Act. Yes o No x
Indicate by check mark if the registrant is not required to file reports pursuant to Section 13 or Section 15(d) of the Act. Yes o No x
Indicate by check mark whether the registrant (1) has filed all reports required to be filed by Section 13 or 15(d) of the Securities Exchange Act of 1934 during the preceding 12 months (or for such shorter period that the registrant was required to file such reports), and (2) has been subject to such filing requirements for the past 90 days. Yes x No o
Indicate by check mark if disclosure of delinquent filers pursuant to Item 405 of Regulation S-K is not contained herein, and will not be contained, to the best of the Registrant’s knowledge, in definitive proxy or information statements incorporated by reference in Part III of this Form 10-K or any amendment to this Form 10-K. o
Indicate by check mark whether the registrant is a large accelerated filer, an accelerated filer or a non-accelerated filer.
Large accelerated filer o Accelerated filer o Non-accelerated filer x
Indicate by check mark whether the registrant is a shell company (as defined in Rule 12b-2 of the Act). Yes o No x
Aggregate market value of the Common Stock held by non-affiliates of the Registrant, based on the closing price as quoted on the NASDAQ Small Cap Market on June 30, 2006: $5,666,709
Number of shares of Common Stock outstanding as of March 20, 2007: 2,868,302
DOCUMENTS INCORPORATED BY REFERENCE
Portions of the Company’s definitive Proxy Statement for its 2007 Annual Meeting of Shareholders to be held are incorporated by reference into Part III of this Report.
FIRSTWAVE TECHNOLOGIES, INC.
ANNUAL REPORT ON FORM 10-K
FOR THE YEAR ENDED DECEMBER 31, 2006
TABLE OF CONTENTS
Part I | Page | |||
| 1 | ||||
| 5 | ||||
| 11 | ||||
| 11 | ||||
| 11 | ||||
Part II | ||||
| 12 | ||||
| 14 | ||||
| 14 | ||||
| 25 | ||||
| 25 | ||||
| 43 | ||||
| 44 | ||||
| 44 | ||||
Part III | ||||
| 45 | ||||
| 45 | ||||
| 45 | ||||
| 45 | ||||
| 45 | ||||
Part IV | ||||
| 46 | ||||
| 50 |
PART I
| ITEM 1. | BUSINESS |
Safe Harbor for Forward Looking Statements
Except for historical information contained herein, this section and other parts of this Form 10-K contain “forward-looking statements” within the meaning of various provisions of the Securities Act of 1933 and the Securities Exchange Act of 1934. Such forward-looking statements can generally be identified by words such as “will”, “expect”, “intends”, “believes”, “anticipates”, “should” and words of similar meaning. Firstwave Technologies, Inc. (“Firstwave” or “the Company”) notes that the forward-looking statements involve a number of risks and uncertainties that could cause actual results to differ materially from any such statement, such as potential fluctuations in quarterly results due to factors including delays in purchase decisions and other adverse market conditions, whether the Company will be able to continue diversification of its revenues, competition and technological developments, the Company’s capital requirements and other liquidity concerns, the Company’s ability to continue to comply with NASDAQ listing requirements, and the size, timing, and contractual terms of orders, and also the risks and uncertainties discussed under the caption “Risk Factors” in this Annual Report on Form 10-K. The information set forth herein is provided as of the date hereof.
General
Headquartered in Atlanta, Georgia, Firstwave is a provider of lead generation, lead nurturing and customer management and tracking solutions built upon a suite of Customer Relationship Management (CRM) products. Firstwave’s solutions help customers find new prospects, continuously engage these prospects throughout the sales cycle and maintain contact with customers throughout their lifecycle. Firstwave’s modular internet marketing, sales lead, and customer management solutions help customers achieve results. The Company was incorporated in October of 1984 in the State of Georgia, and has one subsidiary, Connect-Care, Inc., acquired in March of 2003, which is incorporated under the laws of the State of Georgia. Our product solutions include client-server based CRM products, web-based (on demand or behind the firewall) CRM products and a series of marketing products and services integrated with our CRM product suite.
Firstwave CRM Solutions
Firstwave CRM
Firstwave provides enterprise-wide CRM software solutions in both client/server and web-based architectures. This allows our customers tremendous flexibility in determining how they would like to purchase, implement and support their CRM system. By embracing a customer-focused business strategy, Firstwave’s CRM solutions help improve an organization’s efficiency enabling revenue growth, cost containment and customer retention.
Firstwave CRM handles the collaboration and interaction between workforce, customers and prospects. Through the use of Firstwave CRM, companies have the ability to increase revenue growth, customer retention and employee productivity.
Firstwave offers a variety of tools, applications and access options designed to enhance the customer experience across the entire enterprise. Firstwave client-server CRM consists of the following modules:
First-Sales™ – Manage sales cycle for increased revenue and efficiency
First-Market™ – Marketing campaign and content management
First-Support™ – Increase customer satisfaction, retention and loyalty
First-Survey™ – Keep a pulse on customer preferences through poll and survey management
First-Project™ – Streamline service delivery and project management
First-Quality™ – Close the customer feedback loop and quickly identify product issues
1
First-Web™ – Reduce customer support costs and improve communication through customized web portal
DataWave – Help maintain a quality database
Firstwave’s web-based (.NET architecture) CRM consists of the following modules:
Sales - Manage sales cycles for increased revenue and efficiency
Marketing – Marketing campaign tracking and management
Customer Support – Increase customer satisfaction, retention and loyalty
Quality – Close the customer feedback loop and quickly identify product issues
Customer Portal – Reduce customer support costs and improve communication through customer web portal
Firstwave Marketing services and products:
Email Marketing Service
Firstwave’s technology delivers a very high percentage of email to decision makers’ in-boxes. With Firstwave, it is not just about the list, or the delivery mechanism or the tracking, it is about results. Through technology, process and expertise, Firstwave is able to help our customers deliver the most effective message to the right buyer.
Features include:
| · | Real-time metric dashboard |
| · | Behavioral Tracking |
| · | Real-time lead quality scoring on each prospect |
| · | Automatic unsubscribe accumulation and management |
| · | Integration with Firstwave sales and marketing modules or third party tools |
Lead Nurturing email module
Our lead nurturing email module consists of the following components:
| · | Newsletters: Email-based publications, custom communications and promotional announcements |
| · | Surveys: Instant, online market research into customer satisfaction, member interests, or employee preference |
| · | Invitations: RSVP tracking and event management for trade shows, meetings, or other events |
Together, these modules make “coordinated contact” possible. Our customers can touch their target audiences multiple times, in multiple ways because Firstwave provides a vehicle for recurring, meaningful contact with prospects or customers.
Personalization solutions: These solutions allow marketers to send out personalized emails or post cards to prospects with a complete loop to a personal URL.
PURL (Personal URLs) – These dynamically derived web pages are personal to the prospect and provide a connection to the outbound direct mail post card or email that was received. As well, full tracking allows the customer to track interest for all outbound marketing campaigns including direct mail. Additionally, prospects’ interests are scored based on their behavior on the website.
Variable Data Printing – through a web-based interface, a marketing person can put together a fully integrated campaign targeted at specific prospects catering to their specific interests and printing post cards with personalized information, including the prospect’s name.
2
Firstwave Technology™
Firstwave Technology is an enterprise-wide CRM solution specifically designed for today’s fast-paced software and hardware companies. Maintaining our customer-first commitment, Firstwave Technology gives high technology companies the tools to improve operational efficiency, maximize revenue and legacy investments, and increase customer satisfaction, loyalty and retention.
Firstwave Technology handles the collaboration and interaction between a company’s workforce, customers and prospects.
Firstwave’s CRM product suite is built on Microsoft technologies and includes support for multiple databases, including Oracle and Microsoft SQL. The web-based CRM suite is built on .NET technologies allowing for strong web-based functionality. In addition to offering support for multiple database technologies, Firstwave offers a plug-in based architecture allowing for a flexible approach to changing business logic and new data sources.
TakeControl™
The TakeControl suite consists of CRM systems designed to optimize sales, marketing and customer service operations through delivering highly functional solutions.
TakeControl Sales creates a virtual sales environment through linking field and office personnel into a powerful sales team by automating account and opportunity management procedures. Management tools include a report writing facility, scheduling features, full account and contact details, and graphical analysis tools.
TakeControl Marketing pinpoints marketing opportunities to support and enhance differing marketing campaigns. Specializing on capturing the information required from prospects and customers, it delivers key facilities such as call scripting, mail merge, order taking, and activity scheduling to provide a compilation of simplified, yet precise, information.
TakeControl Customer Support establishes a support center that builds customer satisfaction and loyalty by providing support team members with instant access to customer information to quickly log and trouble-shoot problems while shortening response times. It also identifies the trends of calls received within the support center to enable future improvements based on customer feedback.
Leveraging Strategic Alliances
We market and support our CRM solutions through a combination of limited direct sales channels and the efforts of our strategic alliance partners, including M1 Global Solutions, Inc. (“M1 Global”). Our relationship with M1 Global is based on a three-year OEM/Outsourcing Agreement and a Licensing Agreement. M1 Global has licensed the Firstwave CRM database schema to develop its future products, and is a non-exclusive reseller of Firstwave products. During the first six months of 2006, M1 Global handled most of the professional services and paid a commission of 20% of services revenues to Firstwave. Commissions received from M1 Global for professional services for 2006 were $72,259. As we have increased our professional services staff since July of 2006, the amount of professional services provided by M1 Global to our customers, and the commissions received from M1 Global, have declined. In addition, during the first six months of 2006, M1 Global provided most of the maintenance services for our customers in exchange for a quarterly fee of $154,315 per quarter. Since July of 2006, we have hired additional personnel for customer support and the support services provided by M1 Global have also been reduced. The quarterly fees to M1 Global were approximately $90,000 in the third quarter and $78,000 in the fourth quarter of 2006. For 2007, there have been no fees paid or payable to M1Global through March 31, 2007.
On June 3, 2005, Firstwave entered into a Stock Purchase Agreement with AllAboutTickets LLC, now operating as First Sports International (“First Sports”). Under the terms of the Agreement, the Company sold all of the issued share capital of Firstwave Technologies U.K., Ltd., a subsidiary of the Company, to First Sports. The total purchase price was $2,214,000, of which $256,000 was paid at closing, $1,620,000 was agreed to be paid pursuant to a Promissory Note, and $338,000 was agreed to be paid as software revenues are achieved to reimburse the Company for certain prepaid royalties. As of December 31, 2006, the Company has received $445,000 in payments on the promissory note and $104,051 as payments against the prepaid royalties.
3
On July 1, 2005, we entered into a consulting arrangement with First Sports to provide service and maintenance to our existing U.K. CRM customers. These CRM customers remain customers of Firstwave, but First Sports provides the services to support these customers. If First Sports were not to provide the services, we would either provide the support services ourselves or would contract with another third party in the U.K. to provide such services. These customers are not associated with the sports customers acquired by First Sports as part of the sale of the U.K. Subsidiary on June 3, 2005, and they are part of the continuing operations of Firstwave described in this Form 10-K. Under the terms of this outsourcing arrangement, we pay First Sports a fee of 20% of the maintenance revenues upon collection, for providing local support. The agreement was renewed for one year under the same terms and conditions in July of 2006, except that Firstwave now pays First Sports a fee of 15% of the maintenance revenues upon collection.
Sources of Revenues, Pricing and Material Terms for Licensing Agreements
The first component of revenue is software license revenues. The Company’s technology solutions are generally licensed on a per-user model, except for hosting services. Customers generally pay a license fee for the software based upon the number of licensed users for the application as well as for the tool set. Hosting allows organizations to deploy the applications without the need for internal hardware infrastructure, system administrative capabilities or large capital outlays. All license fees are fixed and determinable, whether under the per-user model or hosting model. On sales made by M1 Global, Firstwave receives 33% of the license fees.
The second component of revenue is services revenues, including hosting revenues, which consist of professional consulting, technical services, email services, and training services. Consulting and technical services are charged on an hourly basis and may be billed in advance or weekly, pursuant to customer work orders. Email services are charged by volume of contacts that are sent emails, pursuant to customer order forms. Training services are charged on a per training session charge. For classes conducted at customer sites, we charge a per-day rate for a set number of attendees. Actual travel expenses are billed as incurred. Hosting services are priced as a monthly or yearly amount based upon the number of users and are recognized as services revenues ratably by month over the period of services. During the first six months of 2006, M1 Global handled most of the professional services for our customers and paid Firstwave a commission of 20% on professional services revenues received. Commissions received from M1 Global for 2006 were $72,259. As we have increased our professional services staff since July of 2006, the amount of professional services provided by M1 Global to our customers, and the commissions received from M1 Global, have declined.
The third component of revenue is maintenance revenues, which are derived from the provision of: (1) customer support in the form of customer services via communication channels, and (2) updates and enhancements of products and related documentation provided on a when and if available basis. Customers are provided maintenance and support for an annual fee. This fee is billed monthly, quarterly, or annually and is subject to changes in pricing upon 90 days’ written notice to the customer. During the first six months of 2006, M1 Global handled most of the maintenance services for our customers in exchange for a quarterly fee of $154,315 per quarter. Since July of 2006, we have hired additional personnel for customer support and the services provided by M1 Global have been reduced. The quarterly fees to M1 Global were approximately $90,000 in the third quarter and $78,000 in the fourth quarter of 2006. For 2007, there have been no fees paid or payable to M1Global through March 31, 2007.
Customers
Firstwave’s customers operate in many industries. We have an industry-focused solution developed specifically for companies in the technology industry, taking into consideration their unique needs, revenue sources and customer demands. During 2006, we continued to pursue strategies to transition our revenue stream to a more diverse customer base.
The table below identifies the customer who contributed more than 10% of total revenue in 2006, 2005, or 2004.
Year ended December 31, | ||||||||||
2006 | 2005 | 2004 | ||||||||
| Electronic Data Systems, Ltd | 4.3 | % | 6.2 | % | 11.8 | % | ||||
| Galactus Software | 18.8 | % | 0.0 | % | 0.0 | % | ||||
4
Competition
The competition in our high technology vertical comes from a multitude of software vendors, including existing CRM vendors, new web-based CRM vendors and ERP vendors who have penetrated the CRM industry through acquisitions or product development. Firstwave’s solutions help customers find new prospects, continuously engage these prospects throughout the sales cycle and maintain contact with customers throughout their lifecycle. Firstwave’s modular internet marketing, sales lead, and customer management solutions help customers achieve results.
Companies that offer competing products include Salesforce.com, Peoplesoft, Epiphany, Onyx, Microsoft, Seibel On Demand (now part of Oracle), Pivotal, SAP, and SalesLogix. These companies offer comprehensive packages, which include marketing, sales, and service. These companies also have integrated some Internet technology into their products and have customization capabilities within their product sets. In our new market spaces, we compete with Eloqua Corporation, Genius.com, Inc., iCentera Corporation, Market2Lead, Inc., and Vtrenz, Inc. There are also hundreds of vendors addressing the needs evident in this industry, including specialists who provide cross-industry solutions and vertically focused solutions, such as for pharmaceutical companies or financial institutions.
Our biggest competitive advantage is our demonstrated expertise in modular internet marketing, sales lead, and customer management solutions, our interactive web-based marketing capabilities, and high customer satisfaction, as well as providing a unique combination of list, delivery, and metrics capability. Although we frequently compete favorably with respect to these factors, there can be no assurance that we will be able to achieve the innovation, product development and market share necessary to maintain competitive advantage. Associated risks and uncertainties are discussed under the caption “Risk Factors” in this Annual Report on Form 10-K.
Proprietary Rights and Licenses
We depend upon a combination of trade secrets, copyright and trademark laws, license agreements, non-disclosure and other contractual provisions with customers and employees to protect our proprietary rights in our products. We also maintain confidentiality agreements with our employees. Because our solutions allow customers to customize their applications without altering the source code, the source code for our products is neither licensed nor provided to customers, although we have contractually agreed in certain instances to have our source code held in escrow by a third party. Notwithstanding these precautions, it may be possible for unauthorized persons to copy aspects of the products or to obtain information that we regard as proprietary. There can be no assurance that these protections will be adequate or that competitors will not independently develop technologies that are substantially equivalent or superior to our technology.
Employees
As of March 1, 2007, the Company employed 16 individuals, including 3 executive and administrative personnel, 2 sales and marketing personnel, 4 professional services personnel, 2 customer support personnel, and 5 persons involved in product innovation and development.
| ITEM 1A. | RISK FACTORS |
An investment in our common stock involves a significant degree of risk. Prospective investors should carefully consider the following factors that may affect our current and future operations and prospects. If any of the following risks actually occur, our business, financial condition or results of operations could be materially adversely affected, the trading price of our common stock could decline, and you may lose all or part of your investment.
Negative cash flow and the difficulty of raising additional capital may adversely affect our operations and the price of our common stock.
In the past, we have experienced negative cash flows and may experience negative cash flow in the future. Our ability to maintain and develop our revenue sources will directly impact our ability to raise capital needed to grow our business. We do not expect to incur any material capital costs in connection with the subleasing of new furnished office space in June of 2007.
5
In the past, we have funded our operating losses and working capital needs through existing cash balances and cash flows from operations and from the proceeds of equity offerings and debt financings. If we raise additional funds through the issuance of equity, equity-linked or debt securities, those securities may have rights, preferences or privileges senior to those of the rights of our common stock and, in light of our current market capitalization, our shareholders may experience substantial dilution.
We are reliant upon our new lead generation and web-based marketing solutions, expertise in the CRM software market, and future business strategy, the loss of which could affect our ability to successfully grow or maintain our business.
We depend upon not only our existing CRM products but also our lead generation and web-based products and our ability to successfully market, sell, service and support these products. The loss of key personnel or an inability to penetrate the web-based marketing industry would likely harm our operations significantly. Our revenues could suffer, and we may experience a material adverse impact on our business, operating results, and financial condition.
We are reliant upon First Sports’ expertise in the CRM software market and with our U.K. customers; the loss of which could affect our ability to successfully support our U.K. customers and retain the maintenance revenues associated therewith.
Outside of the discontinued operations associated with the sale of the U.K. Subsidiary to First Sports on June 3, 2005, we depend upon First Sports and its ability to successfully support and maintain our U.K. CRM customers. If First Sports were to no longer provide such local support, we would need to support these customers ourselves or contract with another third party to provide the support services, or our maintenance revenues from the U.K. CRM customers would suffer, and we may experience an adverse impact on our revenues, operating results, and financial condition.
We have in the past and may in the future experience significant fluctuations in our operating results and rate of growth, and the price of our common stock may be adversely affected by these fluctuations.
Our quarterly and annual operating results have in the past and may in the future vary or decrease significantly depending on factors such as:
| · | the effect of past and future acquisitions, |
| · | the dependence on the efforts of others, such as ListK and First Sports, |
| · | changes in operating expenses, |
| · | changes in our strategy, |
| · | key personnel departures, |
| · | the size and timing of significant orders, |
| · | the impact of estimates of our future operating results published by third parties, |
| · | the timing of revenue from software sales and professional services, |
| · | the timing of new product and service announcements, |
| · | changes in pricing policies by us and our competitors, |
| · | market acceptance of new and enhanced versions of our products, |
| · | the introduction of alternative technologies, and |
| · | general economic factors. |
We have limited or no control over many of these factors. Investors are cautioned that as a matter of policy we do not provide earnings projections or guidance to any financial analysts or other publishers of financial reports. If we change this policy, which we do not anticipate, we will make a public announcement regarding such change. Until such time, if it occurs, you should not rely upon any such information, reports, statements, estimates or projections of financial analysts, publishers of financial reports or others as having been provided or endorsed by us. We expressly do not adopt or endorse, and expressly disclaim, any and all such independent third party information, reports, statements, estimates and projections.
6
We believe that period-to-period comparisons of our results of operations are not necessarily meaningful and should not be relied upon as indications of future performance. Due to all these factors, it is likely that in some future quarter our operating results will be below the expectations of investors. In that event, the price of our common stock will likely be adversely affected.
Our stock price has been and may continue to be highly volatile, and our stock is thinly traded.
The trading price of our common stock fluctuates significantly for a variety of reasons, including the fact that on a typical day, less than 10,000 shares of stock are traded. Trading prices of our common stock may fluctuate in response to a number of events and factors such as:
| · | general economic conditions, |
| · | conditions or trends in the CRM industry, |
| · | fluctuations in the stock market in general, and |
| · | quarterly variations in operating results. |
Decreases or delays in our target customers’ information technology spending and other circumstances that result from poor economic conditions may harm our revenues; if general economic conditions do not improve or if they worsen, our revenues may be materially harmed.
Some of our customers and prospective customers have indicated that they have reduced their budgets available for spending on outsourced technology applications or have delayed purchase decisions for information technology products like ours due, in part, to difficult economic conditions. If the economy does not improve or if it worsens, our customers may continue to delay or reduce their spending on CRM software and customization. When economic conditions weaken, sales cycles for sales of software products tend to lengthen and companies’ information technology budgets tend to be reduced. Accordingly, our business has suffered and could continue to suffer. The impact of these reduced budgets and delays in purchase decisions is not possible to measure or quantify.
The market for our CRM software and services is subject to rapid change stemming from customer requirements and changes in related technologies, including hardware, operating systems and telecommunications; if we fail to improve our products in response to these changes, our sales may decline.
The market for our CRM software and services is subject to rapid change, including technological advances, changes in customer requirements and frequent new product introductions and enhancements. Our future success depends upon our ability to enhance our current products and continue to develop and market new products that address the increasingly sophisticated needs of customers and achieve market acceptance. In particular, we believe that we must continue to respond quickly to customer needs for additional functionality and to ongoing advances in hardware, operating systems and telecommunications. Any failure by us to anticipate or respond rapidly to technological advances, new products and enhancements and changes in customer requirements could have a material adverse effect on our competitive position or render some of our products obsolete or less desirable than available alternatives.
With any new product release, we are subject to the risks generally associated with new product introductions and applications, including lack of market acceptance, delays in development and implementation, and failure of products to perform as expected. In order to introduce and market new or enhanced products successfully with minimal disruption in customer purchasing patterns, we must manage the transition from existing products. There can be no assurance that we will be successful in developing and marketing, on a timely basis, product enhancements or products that respond to technological advances by others, that our new products will adequately address the changing needs of the market or that we will successfully manage product transitions. Further, failure to generate sufficient cash from operations or financing activities to develop or obtain improved products and technologies could have a material adverse effect on our results of operations and financial condition.
7
To grow our business, we may acquire additional companies, including by issuing shares of our stock, which may subject us to additional risks and may dilute your ownership.
To initiate our growth strategies, we acquired Connect-Care, Inc. in March 2003, and we may acquire other businesses. An inability to identify, acquire and integrate businesses, products or services that complement our business may negatively affect our ability to grow. We cannot guarantee that we will be able to identify and acquire suitable candidates on acceptable terms. We also cannot provide any assurance that we will be able to arrange adequate financing, complete additional transactions or successfully integrate the acquired businesses. As in the case of the Connect-Care merger, we may issue shares of stock in future acquisitions or in financing transactions, which would dilute the ownership percentages of our existing shareholders. Acquisitions and stock offerings may also distract management and result in the incurrence of debt, expenses and unforeseen liabilities, all of which could have a material adverse effect on our business and financial condition. In addition, we may not be able to successfully compete with other companies for acquisition candidates. In order for any acquisition to be successful, we would have to successfully and quickly integrate the new business with our business, including:
| · | cross-market and sell our services and products to the new business’ customers; |
| · | minimize duplicative managerial, sales and marketing efforts and eliminate redundant costs of our operations; and |
| · | make the new business’ personnel operate together with our personnel in a cost-effective manner. |
If we do not integrate our operations successfully, we may fail to achieve our business goals. This would likely cause a slow-down in our growth rate that may result in a decrease in the value of your investment.
Our software products, like most software products of a complex nature, may contain undetected errors; as a result, we could experience delays, additional expenses or lost revenues.
Software products as complex as those we offer may contain undetected errors. We could experience delays or lost revenues during the period required to correct those errors. There can be no assurance that, despite testing by us and by current and potential customers, errors will not be found in our software. If our products are found to contain errors, the result to us could be:
| · | a loss of or delay in market acceptance, |
| · | additional and unexpected expenses to fund further product development, |
| · | additional and unexpected expenses to add programming personnel to complete a development project, |
| · | loss of revenue because of the inability to sell the new product on a timely basis, and |
| · | loss of revenue due to adverse effect on our reputation, |
any one or more of which could have a material adverse effect on us.
Like most providers of complex software, our most valuable asset is an intangible, intellectual property; protection of our proprietary rights can be difficult, complex and expensive; if we are unable to protect our proprietary rights, then our competitive position could be weakened, which may reduce our revenues.
We derive a significant portion of our revenues from license, service and maintenance fees generated from our software. We do not have any patents on our software; rather we rely on a combination of trade secrets, copyright and trademark laws, non-disclosure and other contractual provisions and technical measures to protect our proprietary rights. We may be required to spend significant resources to monitor and police our proprietary rights. There can be no assurance that these protections will be adequate or that our competitors will not independently develop technologies that are substantially equivalent or superior to our technologies.
Other software providers could copy or otherwise obtain and use our products or technology without authorization. We may not be able to detect infringement and may lose a competitive position in the market before we do so. In addition, competitors may design around our technology or develop competing technologies. The laws of some foreign countries do not protect proprietary rights to the same extent as the laws of the United States. If we fail to successfully enforce our proprietary rights, our competitive position may be harmed.
8
Because it is not difficult to enter our industry, we expect increased competition from the introduction of superior products or by pricing pressure from competitors, all of which could harm our business.
The market for our products is characterized by significant price competition, and we expect that we will face increasing pricing pressures from our current competitors. In addition, some of our competitors may have significant advantages including the ability to adapt quickly to new technologies and changes in customer demands, and substantially greater resources and market presence. Moreover, because there are low barriers to entry into the software market, we believe that competition will increase in the future. Accordingly, there can be no assurance that we will be able to provide products that compare favorably with the products of our competitors or that competitive pressures will not require us to reduce our prices. Any material reduction in the price of our products would negatively affect gross margins as a percentage of new revenue and would require us to increase software unit sales in order to maintain net revenues.
The terms of our preferred stock include dividend payments, preferences over our common stock, and anti-dilution provisions that may have a material adverse effect on the market value of our common stock.
Our board of directors has the authority to issue up to 1,000,000 shares of preferred stock and to fix the rights, preferences, privileges and restrictions, including voting rights, of these shares without any further vote or action by our shareholders. At December 31, 2006, shares of outstanding preferred stock were as follows:
| · | 10,000 shares of Series A Convertible Preferred Stock |
| · | 7,020 shares of Series B Convertible Preferred Stock |
| · | 10,000 shares of Series C Convertible Preferred Stock |
| · | 6,700 shares of Series D Convertible Preferred Stock |
The rights of the holders of the common stock are subject to, and may be adversely affected by, the rights of the holders of Series A, Series B, Series C and Series D Convertible Preferred Stock and any other preferred stock that may be issued in the future. The issuance of the Series A, Series B, Series C and Series D Convertible Preferred Stock and any future issuances of other classes of preferred stock, while providing desirable flexibility in connection with possible acquisitions and other corporate purposes, could have the effect of making it more difficult for a third party to acquire a majority of our outstanding voting stock, thereby delaying, deferring or preventing a change in control of our company. Furthermore, the Series A, Series B, Series C and Series D Convertible Preferred Stock have other rights, including dividend rights and economic rights, senior to the common stock and, as a result, the existence of our preferred stock may have a material adverse effect on the market value of our common stock. Any future issuances of other classes of preferred stock may have other rights, including dividend rights and economic rights, senior to the common stock, and as a result, the issuance of new preferred stock could have a material adverse effect on the market value of our common stock. We may, in the future, adopt other measures that may have the effect of delaying, deferring or preventing a change in control of our company. Some of these measures may be adopted without any further vote or action by our shareholders. We have no present plans to adopt any of those types of measures.
We are reliant upon certain key personnel for expertise in the CRM software market and in the technical aspects of the CRM software product; the loss of such key personnel could affect our ability to successfully grow our business.
We depend in large part upon the continued service of our chief executive officer and key engineering and technical staff with expertise in our industry and products. The loss of the services of our executive officer and/or key personnel could harm our operations. Currently, none of our personnel are bound by an employment agreement, and we do not maintain key person insurance on any of our employees. We would also be harmed if one or more of our key employees decided to join a competitor or otherwise compete with us.
The market for CRM software has fluctuated over the past several years, and we are uncertain as to its future; if the market for CRM software does not grow, our revenues may be reduced.
9
The CRM software market is fluctuating, and our success depends on its growth. If the market for CRM software does not grow as quickly or become as large as anticipated, our revenues may be reduced. Our potential customers may:
| · | not understand or see the benefits of using these products, |
| · | not achieve favorable results using these products, |
| · | experience technical difficulty in implementing or using these products, or |
| · | use alternative methods to solve the same business problems. |
Our products can have long sales cycles which make it difficult to plan expenses and forecast results.
It takes between three and six months to complete the majority of our sales, and some sales take longer to complete. Therefore, it is difficult to predict the quarter in which a particular sale will occur and to plan expenditures accordingly. The length of the period between initial contact with a potential customer and their purchase of products and services is due to several factors, including:
| · | the complex nature of our products, |
| · | our need to educate potential customers about the uses and benefits of our products, |
| · | the purchase of our products may require a significant investment of resources by a customer, |
| · | customer budget cycles which affect the timing of purchases, |
| · | uncertainty regarding future economic conditions, |
| · | customer requirements for competitive evaluation and internal approval before purchasing our products, |
| · | customer delay of purchases due to announcements or planned introductions of new products by us or our competitors, and |
| · | large customer purchasing procedures, which may require a longer time to make decisions. |
The delay or failure to complete sales in a particular quarter could reduce our revenues in that quarter, as well as subsequent quarters over which revenues for the sale would likely be recognized. If our sales cycle unexpectedly lengthens in general or for one or more large orders, it would adversely affect the timing of our revenues.
Because our business involves the electronic transmission and storage of data, privacy and security concerns, particularly related to the use of our software on the internet, may limit the effectiveness of and reduce the demand for our products.
The effectiveness of our software products relies on the storage and use of customer data collected from various sources, including information collected on web sites, as well as other data derived from customer registrations, billings, purchase transactions and surveys. Our collection and use of that data for customer profiling may raise privacy and security concerns. Our customers generally have implemented security measures to protect customer data from disclosure or interception by third parties. However, these security measures may not be effective against all potential security threats. If a well-publicized breach of customer data security were to occur, our software products may be perceived as less desirable, impacting our future sales and profitability.
In addition, due to privacy concerns, some internet commentators, consumer advocates, and governmental or legislative bodies have suggested legislation to limit the use of customer profiling technologies. The European Union and some European countries have already adopted some restrictions on the use of customer profiling data. In addition, internet users can, if they choose, configure their web browsers to limit the collection of user data for customer profiling. Should many internet users choose to limit the use of customer profiling technologies, or if major countries or regions adopt legislation or other restrictions on the use of customer profiling data, our software would be less useful to customers, our sales could decrease and our results of operations could be materially adversely affected.
The requirements of Section 404 of the Sarbanes-Oxley Act of 2002 require that we undertake an evaluation of our internal controls that may identify internal control weaknesses.
The Sarbanes-Oxley Act of 2002 imposes new duties on us and our executives, directors, attorneys and independent registered public accounting firm. In order to comply with the Sarbanes-Oxley Act, we are evaluating our internal controls systems to allow management to report on, and our independent auditors to attest to, our internal controls. We have initiated establishing the procedures for performing the system and process evaluation and testing required in an effort to comply with the management certification and auditor attestation requirements of Section 404 of the Sarbanes-Oxley Act. As the Securities and Exchange Commission has extended the deadline for non-accelerated filers, such as Firstwave, until December 31, 2007, we anticipate being able to fully implement the requirements relating to reporting on internal controls and all other aspects of Section 404 in a timely fashion. If we are not able to implement the reporting requirements of Section 404 in a timely manner or with adequate compliance, our management and/or our auditors may not be able to render the required certification and/or attestation concerning the effectiveness of the internal controls over financial reporting, we may be subject to investigation and/or sanctions by regulatory authorities, such as the Securities and Exchange Commission or The NASDAQ Stock Market, and our reputation may be harmed. Any such action could adversely affect our financial results and the market price of our common stock.
10
| ITEM 2. | PROPERTIES |
As of December 31, 2006, the Company’s headquarters and principal operations were located in approximately 5,000 square feet of office space sublet from M1 Global in metropolitan Atlanta, Georgia. The sublease expires on June 30, 2007. The total amount of base rent ($10.00 per square foot) is being charged to rent expense. As of April 1, 2007, the Company will move its headquarters to 7000 Central Parkway, Suite 330, Atlanta, GA 30328, in approximately 4,200 square feet of furnished subleased office space at a rate of $16.50 per square foot. The term of the new subleased office space expires in June of 2009.
| ITEM 3. | LEGAL PROCEEDINGS |
From time to time, the Company may be involved in litigation relating to claims arising out of its operations in the normal course of business. As of the date of this Report, the Company was not engaged in any legal proceedings that are expected, individually or in the aggregate, to have a material adverse effect on the Company.
| ITEM 4. | SUBMISSION OF MATTERS TO A VOTE OF SECURITY HOLDERS |
None
11
PART II
| ITEM 5. | MARKET FOR REGISTRANT’S COMMON EQUITY, RELATED STOCKHOLDER MATTERS, AND ISSUER PURCHASES OF EQUITY SECURITIES |
Our common stock is traded on the NASDAQ SmallCap Market under the symbol “FSTW”. The following table sets forth, for the calendar quarters indicated, the high and low close prices of the Company’s common stock. Note that prices set forth below reflect inter-dealer prices without retail mark-ups, markdowns, or commissions and may not necessarily reflect actual transactions.
Period | High | Low | |||||
| Fiscal 2006: | |||||||
| First Quarter | $ | 2.18 | $ | 1.65 | |||
| Second Quarter | $ | 2.15 | $ | 1.66 | |||
| Third Quarter | $ | 2.29 | $ | 2.00 | |||
| Fourth Quarter | $ | 2.47 | $ | 2.08 | |||
| Fiscal 2005: | |||||||
| First Quarter | $ | 2.57 | $ | 1.55 | |||
| Second Quarter | $ | 3.07 | $ | 1.62 | |||
| Third Quarter | $ | 1.99 | $ | 1.57 | |||
| Fourth Quarter | $ | 2.45 | $ | 1.23 | |||
As of March 20, 2007, there were approximately 75 shareholders of record and approximately 1700 persons or entities that hold common stock in nominee name. There were no common stock dividends declared during 2006 or 2005. The Company does not plan to pay dividends on its common stock in the future. Pursuant to a merger agreement, on March 3, 2003. Firstwave issued 200,000 shares of common stock to the shareholders of Connect-Care, Inc. in exchange for all outstanding shares of Connect-Care stock. These 200,000 shares, valued at $2,630,000, were registered effective July 25, 2003. On August 12, 2004, the Company filed a Post-Effective Amendment No 1 to Registration Statement on Form S-3, File No. 333-103903, to remove from registration 198,925 shares originally registered related to the Connect-Care acquisition that remained unsold by the former Connect-Care shareholders at the termination of the offering.
12
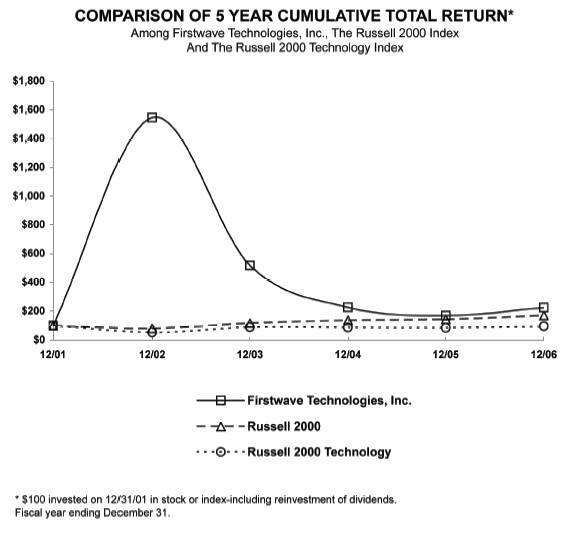
STOCK PERFORMANCE GRAPH
The following indexed line graph indicates the Company’s total return to shareholders from December 31, 2001 to December 31, 2006, as compared to total return for the Russell 2000 and Russell 2000-Technology indices for the same period. The Russell 2000 index is comprised of the 2,000 publicly traded companies with market capitalizations (in terms of number of shares outstanding) ranked immediately below the 1,000 companies with the highest market capitalizations. The Russell 2000-Technology index is comprised of the 2,000 publicly traded companies in the high-technology industry with market capitalizations (in terms of number of shares outstanding) ranked immediately below the 1,000 companies in the high-technology industry with the highest market capitalizations.
13
| ITEM 6. | SELECTED FINANCIAL DATA |
For the Year Ended December 31, | ||||||||||||||||
(in thousands, except per share amounts) | ||||||||||||||||
2006 | 2005** | 2004*** | 2003**** | 2002 | ||||||||||||
| Net revenues from continuing operations | $ | 2,694 | $ | 3,224 | $ | 4,526 | $ | 11,169 | $ | 13,200 | ||||||
| Income/(loss) from continuing operations | ||||||||||||||||
| before income tax | 172 | (1,578 | ) | (5,048 | ) | (1,212 | ) | 2,679 | ||||||||
| Income tax | — | — | — | — | — | |||||||||||
| Net income/(loss) from continuing operations | 172 | (1,578 | ) | (5,048 | ) | (1,212 | ) | 2,679 | ||||||||
| Income/(loss) from discontinued operations | — | (457 | ) | 410 | 437 | 346 | ||||||||||
| Gain/(loss) on sale of discontinued operations | — | 327 | — | — | — | |||||||||||
| Net income/(loss) applicable to common | ||||||||||||||||
| shareholders | (111 | ) | (1,992 | ) | (4,893 | ) | (996 | ) | 2,773 | |||||||
| Basic & diluted earnings per share | ||||||||||||||||
| Earnings/(loss) from continuing operations | (0.04 | ) | (0.69 | ) | (1.98 | ) | (0.56 | ) | 1.13 | |||||||
| Earnings/(loss) from discontinued operations | — | (0.05 | ) | 0.15 | 0.17 | 0.16 | ||||||||||
| Net income/(loss) per common share | (0.04 | ) | (0.74 | ) | (1.82 | ) | (0.39 | ) | 1.29 | |||||||
| Total assets | 3,824 | 4,259 | 6,273 | 11,807 | 9,803 | |||||||||||
| Basic and diluted weighted average shares | ||||||||||||||||
| outstanding* | 2,792 | 2,709 | 2,682 | 2,572 | 2,150 | |||||||||||
| * | Stock options and convertible preferred stock are not included in the diluted earnings per share if they are antidilutive. |
| ** | 2005 includes a charge for Goodwill Impairment of $528,000, the gain on sale of discontinued operations was reduced by an allocation of Goodwill totaling $488,000. |
| *** | 2004 includes the one-time write-off of certain amounts of capitalized software and a charge for Goodwill Impairment of $750,000. |
| **** | 2003 includes the acquisition of Connect-Care in March of 2003. |
| ITEM 7. | MANAGEMENT’S DISCUSSION AND ANALYSIS OF FINANCIAL CONDITION AND RESULTS OF OPERATIONS |
The following discussion should be read in conjunction with the Financial Statements and Notes thereto presented elsewhere herein. This section contains forward-looking statements that reflect the Company’s management’s expectations, estimates, and projections for future periods. These statements may be identified by the use of forward-looking words such as “may”, “will”, “believe”, “anticipate”, “estimate”, “expect”, “projects”, or “intends”. Actual events and results may differ from the results anticipated by the forward-looking statements. Factors that might cause such differences include, but are not limited to, those items discussed previously under the caption “Risk Factors” and the discussion below in “Management’s Discussion and Analysis of Financial Condition and Results of Operations”.
Overview
Headquartered in Atlanta, Georgia, Firstwave is a provider of lead generation, lead nurturing and customer management and tracking solutions built upon a suite of Customer Relationship Management (CRM) products. Firstwave’s solutions help customers find new prospects, continuously engage these prospects throughout the sales cycle and maintain contact with customers throughout their lifecycle. Firstwave’s modular internet marketing, sales lead, and customer management solutions help customers achieve results.
On October 10, 2005, the Company entered into a three-year OEM/Outsourcing Agreement and a Licensing Agreement with M1 Global, an Atlanta-based technology company. Under the terms of the agreements, M1 Global has licensed the Firstwave CRM database schema to develop its future products, and is a non-exclusive reseller of Firstwave products. Although the agreements included the outsourcing of Firstwave’s Professional Services and Support functions to M1 Global, Firstwave is currently providing its own coverage in those areas and no longer pays M1 Global for these services. The agreements provide that M1 Global also pays royalty commissions to Firstwave as follows: 33% on licenses and 20% on services. During the first six months of 2006, M1 Global handled most of the professional services and paid a commission of 20% of services revenues to Firstwave. Commissions received from M1 Global for professional services for 2006 were $72,259. As we have increased our professional services staff since July of 2006, the amount of professional services provided by M1 Global to our customers, and the commissions received from M1 Global, have declined. In addition, during the first six months of 2006, M1 Global provided most of the maintenance services for our customers in exchange for a quarterly fee of $154,315 per quarter. Since July of 2006, we have hired additional personnel for customer support and the support services provided by M1 Global have also been reduced. The quarterly fees to M1 Global were approximately $90,000 in the third quarter and $78,000 in the fourth quarter of 2006. For 2007, there have been no fees paid or payable to M1Global through March 31, 2007.
14
On May 5, 2006, the Company entered into an Intellectual Property Assignment Agreement with Galactus Software LLP (“Galactus”), a Florida-based software application company. Under the terms of the agreement, Galactus assumes ownership of the .Net Integrated Development Environment (IDE) that Firstwave developed to use in writing applications in the CRM Market. Firstwave retains exclusive use of the technology in the CRM Market, and Galactus will use the technology in the software application marketplace. The purchase price for the assignment was Five Hundred Thousand Dollars ($500,000.00) and, as directed by the agreement, paid by cashier’s check on the Assignment Effective Date, May 2, 2006, when Galactus gave notice to Firstwave that it had accepted the software.
Results of Continuing Operations
On June 3, 2005, Firstwave entered into a Stock Purchase Agreement (the “Agreement”) with AllAboutTickets LLC, now doing business as First Sports International (“First Sports”). Pursuant to the Agreement, the Company sold to First Sports all of the issued share capital of Firstwave Technologies U.K., Ltd., a subsidiary of the Company. The Company sold its U.K. Subsidiary to re-focus on the high technology market and to direct its efforts away from the Sports business that was concentrated in the U.K. market. This Management’s Discussion and Analysis of Financial Condition compares the Company’s results from continuing operations, not including the operations from the discontinued business.
15
The following table sets forth for the periods indicated selected financial data and the percentages of our net revenues represented by each line item presented. It also sets forth the percentage change in each line item presented from 2005 to 2006. Certain percentage columns do not add to 100% due to rounding.
Year Ended | Year Ended | % Change | ||||||||||||||
December 31, 2006 | December 31, 2005 | 2005 to 2006 | ||||||||||||||
| Revenues: | ||||||||||||||||
| Software | $ | 743 | 27.6 | % | $ | 551 | 17.1 | % | 34.8 | |||||||
| Services | 291 | 10.8 | 623 | 19.3 | (53.3 | ) | ||||||||||
| Maintenance | 1,651 | 61.3 | 2,002 | 62.1 | (17.5 | ) | ||||||||||
| Other | 9 | 0.3 | 48 | 1.5 | (81.2 | ) | ||||||||||
| Net revenues | 2,694 | 100.0 | 3,224 | 100.0 | (16.4 | ) | ||||||||||
| Costs and expenses: | ||||||||||||||||
| Cost of revenues | ||||||||||||||||
| Software | 411 | 15.3 | 803 | 24.9 | (48.8 | ) | ||||||||||
| Services | 159 | 5.9 | 578 | 17.9 | (72.5 | ) | ||||||||||
| Maintenance | 563 | 20.9 | 422 | 13.1 | 33.4 | |||||||||||
| Other | 14 | 0.5 | 32 | 1.0 | (56.3 | ) | ||||||||||
| Sales and marketing | 339 | 12.6 | 506 | 15.7 | (33.0 | ) | ||||||||||
| Product development | 317 | 11.8 | 631 | 19.6 | (49.8 | ) | ||||||||||
| General and administrative | 768 | 28.5 | 1,410 | 43.7 | (45.5 | ) | ||||||||||
| Goodwill impairment | — | — | 528 | 16.4 | (100.0 | ) | ||||||||||
| Total operating cost and expenses | 2,571 | 95.4 | 4,910 | 152.3 | (47.6 | ) | ||||||||||
| Operating income/(loss) | 123 | 4.6 | (1,686 | ) | (52.3 | ) | (107.3 | ) | ||||||||
| Gain/(loss) on investment | (57 | ) | (2.1 | ) | ||||||||||||
| Interest income, net | 106 | 3.9 | 108 | 3.3 | (1.9 | ) | ||||||||||
| Income/(loss) from continuing operations | $ | 172 | 6.4 | $ | (1,578 | ) | (48.9 | ) | (110.9 | ) | ||||||
| Loss from discontinued operations | — | — | (457 | ) | (14.2 | ) | (100.0 | ) | ||||||||
| Gain on sale of discontinued operations | — | — | 327 | 10.1 | ||||||||||||
| Net loss from discontinued operations | — | — | (130 | ) | (4.0 | ) | (100.0 | ) | ||||||||
| Net income/(loss) before/after income taxes | $ | 172 | 6.4 | $ | (1,708 | ) | (53.0 | ) | (110.1 | ) | ||||||
In general, competition in the software industry has increasingly been characterized by shortening product cycles, and we are not immune to this trend. If the product cycle for our systems proves to be shorter than management anticipates, our pricing structure and revenues could be impaired. In addition, in order to remain competitive, we may be required to expend a greater percentage of our revenues on product innovation and development than has historically been the case. In either case, our gross profit margins and results of operations could be materially adversely affected. See “Risk Factors” in Part I, Item 1A of this Annual Report.
2006 COMPARED TO 2005
The information presented below compares the Company’s results from continuing operations, after consideration of discontinued operations from the sale of the U.K. Subsidiary on June 3, 2005.
Revenue
Total revenues, which include software license fees, services, and maintenance revenues, decreased 16.4% from $3,224,000 in 2005 to $2,694,000 in 2006 due to decreases in services and maintenance revenues, offset by an increase in software license revenues. Software revenues increased 34.8% from $551,000 in 2005 to $743,000 in 2006, primarily due to the assignment of the Company’s .Net Integrated Development Environment to Galactus Software in the second quarter of fiscal 2006. Our software revenues are significantly dependent upon the timing of closing of license agreements. Total revenues from international sources decreased from 24% of total revenues in 2005 to 16% in 2006 primarily due to decreased maintenance revenue from our U.K. CRM customers.
16
Services revenues decreased 53.3% from $623,000 in 2005 to $291,000 in 2006. Our services revenues are subject to fluctuations based on variations in the length of and number of active service engagements in a given quarter. Professional services revenues from the M1 Global relationship were lower than anticipated in 2006. We have, therefore, increased our professional services staff in an effort to expand those services ourselves.
Maintenance revenues decreased 17.5% from $2,002,000 in 2005 to $1,651,000 in 2006. The decrease is due to cancellations of $240,000 from existing customers and reductions of $105,000 in maintenance for existing customers, offset by additional maintenance revenues of $9,000 associated with new and existing customers. Maintenance revenues are primarily the result of renewal agreements from previous software license agreements as well as new license agreements.
Cost of Revenue
Cost of software revenues decreased 48.8% from $803,000 in 2005 to $411,000 in 2006. Cost of software revenues includes amortization of capitalized software costs, costs of third party software, media costs, and documentation materials. The decrease is due to a decrease in amortization expense related to the assignment of the .Net Integrated Development Environment technology to Galactus and final amortization of the remaining capitalized software. Cost of software revenues as a percentage of software revenues decreased from 145.7% in 2005 to 55.3% in 2006, primarily due to a decrease in amortization expense.
Cost of revenues for services decreased 72.5% from $578,000 in 2005 to $159,000 in 2006. The decrease is primarily due to decreases in payroll, resulting from a reduction in the number of services personnel, and payroll related costs, including travel expenses, consistent with decreased services revenues. As we reduced the services outsourced to M1 Global after July of 2006 and increased our personnel providing these services, costs of revenues for services increased. The cost of revenues for services as a percentage of services revenues decreased from 92.8% in 2005 to 54.6% in 2006, due to reduction in personnel and personnel-related expenses.
Cost of revenues for maintenance increased 33.4% from $422,000 in 2005 to $563,000 in 2006. The increase is primarily due to the outsourcing arrangement with M1 Global as to which we paid $476,925 in 2006 and the fees paid to First Sports of $68,908 for the support of our U.K. CRM customers. The reduction of the maintenance and support services outsourced to M1 Global after July of 2006 reduced our quarterly fees to M1 Global and increased our personnel related expenses. Costs of revenues for maintenance as a percentage of maintenance revenues increased from 21.1% in 2005 to 34.1% in 2006, primarily due to the outsourcing of personnel to M1 Global.
Sales and Marketing Expense
Sales and marketing expense decreased 33.0% from $506,000 in 2005 to $339,000 in 2006, and decreased as a percentage of total revenues from 15.7% in 2005 to 12.6% in 2006. The decreases are the result of lower payroll expenses associated with a reduction in the number of personnel and lower marketing expenses. However, we added a Chief Sales and Marketing Officer in August of 2006 and other sales personnel to focus on lead generation and to begin our new marketing efforts.
Product Development Expense
The Company’s product innovation and development expenditures decreased 49.8% from $631,000 in 2005 to $317,000 in 2006. The decrease is primarily related to decreases in payroll costs associated with staff reductions, and reductions associated with fewer outside contractors. There were no software development costs capitalized during either 2005 or 2006. We have added to our personnel in product development in late 2006.
General and Administrative Expense
General and administrative expenses decreased 45.5% from $1,410,000 in 2005 to $768,000 in 2006. These changes were primarily due to $791,000 in reduced payroll costs associated with a reduction in personnel and $183,806 of decreased rent expense. Management anticipates that general and administrative expenses will not increase materially with the new facilities in April 2007.
17
Goodwill Impairment
In accordance with SFAS No. 142 “Goodwill and Other Intangible Assets”, intangible assets with indefinite useful lives must be tested periodically for impairment. Examples of Management’s judgment regarding the existence of impairment of an intangible asset and the resulting fair value, would include management’s estimates of future net cash flows and assessment of adverse changes in legal factors, market conditions, or loss of key personnel. If the fair value of the intangible asset is determined to be less than the carrying value, the Company would record an impairment loss. SFAS No. 142 prescribes a two-phase approach for impairment testing of goodwill. The first phase screens for impairment; while the second phase (if necessary) measures the amount of the impairment.
Goodwill was evaluated for impairment quarterly throughout 2006 and 2005 in accordance with SFAS No. 142. The fair value was estimated using the expected net present value of future cash flows. The analysis for the third quarter of 2005 identified lower-than-expected operating results, and the Company revised the anticipated future earnings projections. As a result of these reviews, it was determined that there was an impairment of goodwill, and the second phase was required. The second phase resulted in the Company recording a non-cash impairment charge of $528,000 during the third quarter of 2005 to write-off a portion of the carrying value of goodwill. Additionally, as a result of the sale of the U.K. Subsidiary, goodwill was written down by $488,000 in June of 2005 to account for the allocation of goodwill to the U.K. Subsidiary. Based on the quarterly analyses conducted in 2006, it was determined that there was no further instance of impairment of the remaining recorded goodwill. Therefore, the second phase of the testing was not required.
Net Interest Income
Interest income decreased 1.9% from $108,000 in 2005 to $106,000 in 2006 primarily from imputed interest recognized on the note receivable from First Sports, explained in “Discontinued Operations.” In 2006 and 2005, there was no interest expense, as the Company carried no debt during those years.
Income Tax Expense
There was no income tax expense in either 2006 or 2005. As of December 31, 2006, the Company had a net operating loss carryforward in the United States of approximately $25,600,000, which expires in years 2009 through 2019. A valuation allowance has been established for all deferred tax assets as of December 31, 2006 and 2005, respectively.
2005 COMPARED TO 2004
The information presented below compares the Company’s results from continuing operations, after consideration of discontinued operations from the sale of the U.K. Subsidiary on June 3, 2005.
Revenue
Total revenues, which include software license fees, services, and maintenance revenues, decreased 29% from $4,526,000 in 2004 to $3,224,000 in 2005 due to decreases in software license, services and maintenance revenues. The decrease in total revenues was primarily attributable to lower revenues from our relationship with Electronic Data Systems, Ltd. (“EDS”), which contributed 12%, or $874,000, of total revenues during 2004, compared to 6%, or $222,000, of total revenues for 2005.
Software revenues decreased 37% from $876,000 in 2004 to $551,000 in 2005. During 2004, we recognized three large software license agreements with Manhattan Associates, Inc., SmartMail, LLC, and Northrop Grumman; while in 2005 we recognized just one large software license with M1 Global Solutions.
Total revenues from international sources decreased from 33% of total revenues in 2004 to 24% in 2005 primarily due to decreased services revenue from our U.K. CRM customers, including revenue from the EDS relationship that decreased from $874,000 in 2004 to $222,000 in 2005.
Services revenues decreased 46% from $1,145,000 in 2004 to $623,000 in 2005, primarily due to decreased services revenue from EDS. The service revenues from EDS were $358,000 in 2004 compared to only $11,000 in 2005. Our services revenues decreased from 2004 levels because the services revenues we derived from the multi-year contract with EDS have not been replaced with other customer accounts.
18
Maintenance revenues decreased 19% from $2,457,000 in 2004 to $2,002,000 in 2005. The decrease was due to cancellations from existing customers offset by additional maintenance revenues associated with new and expansion customers.
Cost of Revenue
Cost of software revenues decreased 61% from $2,032,000 in 2004 to $803,000 in 2005. The decrease was primarily due to a decrease in amortization expense related to the write-off of two product lines in the fourth quarter of 2004, resulting in lower amortization expense in 2005. Cost of software revenues as a percentage of software revenues decreased from 232% in 2004 to 146% in 2005, primarily due to a decrease in amortization expense. Amortization of capitalized software represented 97% of total cost of software revenues during 2004, compared to 91% in 2005.
Cost of revenues for services decreased 52% from $1,193,000 in 2004 to $578,000 in 2005. The decrease was primarily due to decreases in payroll, resulting from a reduction in the number of services personnel, and payroll related costs, including travel expenses, consistent with decreased services revenues. The cost of revenues for services as a percentage of services revenues decreased from 104% in 2004 to 93% in 2005.
Cost of revenues for maintenance increased 4% from $405,000 in 2004 to $422,000 in 2005. The increase was primarily due to the launch of our outsourcing arrangement with M1 Global Solutions, Inc. and the fees paid to First Sports for the support of our U.K. CRM customers. Costs of revenues for maintenance as a percentage of maintenance revenues increased from 16% in 2004 to 21% in 2005.
Sales and Marketing Expense
Sales and marketing expense decreased 73% from $1,903,000 in 2004 to $506,000 in 2005, and decreased as a percentage of total revenues from 42% in 2004 to 16% in 2005. The decreases were the result of decreases in payroll expenses associated with a reduction in the number of personnel, telemarketing costs, and costs relating to sports sponsorships in the U.S.
Product Development Expense
The Company’s product innovation and development expenditures, which includes amounts capitalized, decreased 47% from $1,188,000 in 2004 to $631,000 in 2005. The decrease was primarily related to decreases in payroll costs associated with staff reductions, and reductions associated with fewer outside contractors. Software development costs capitalized during 2004 were $94,000; there were no software development costs capitalized during 2005.
A net realizable analysis of capitalized software development costs was performed as of December 31, 2005 in accordance with SFAS 86 “Accounting for the Costs of Computer Software to be Sold, Leased, or Otherwise Marketed.” Based on the results of the analysis, a determination was made that the carrying amount of the unamortized capitalized software costs does not exceed their net realizable value; therefore, no impairment loss was recorded.
General and Administrative Expense
General and administrative expenses decreased 32% from $2,082,000 in 2004 to $1,410,000 in 2005. These changes were primarily due to reduced payroll costs associated with a reduction in personnel and decreased rent expense.
Goodwill Impairment
In accordance with SFAS No. 142 “Goodwill and Other Intangible Assets”, intangible assets with indefinite useful lives must be tested periodically for impairment. Examples of Management’s judgment regarding the existence of impairment of an intangible asset and the resulting fair value, would include management’s estimates of future net cash flows and assessment of adverse changes in legal factors, market conditions, or loss of key personnel. If the fair value of the intangible asset is determined to be less than the carrying value, the Company would record an impairment loss. SFAS No. 142 prescribes a two-phase approach for impairment testing of goodwill. The first phase screens for impairment; while the second phase (if necessary) measures the impairment.
19
Goodwill was evaluated for impairment quarterly throughout 2005 and 2004 in accordance with SFAS No. 142. The fair value was estimated using the expected net present value of future cash flows. The analysis for the third quarter of 2005 and the fourth quarter of 2004, identified lower than previously expected operating results, and the Company revised the anticipated future earnings projections at the end of each of those quarters. As a result of these reviews, it was determined that there was an impairment of goodwill, and the second phase was required. The second phase resulted in the Company recording non-cash impairment charges of $528,000 at September 30, 2005, and $750,000 at December 31, 2004, to write-off a portion of the carrying value of goodwill. Additionally, as a result of the sale of the U.K. Subsidiary, goodwill was written down by $488,000 in the second quarter of 2005 to account for the allocation of goodwill to the U.K. Subsidiary. From the analysis conducted at December 31, 2005, it was determined that there was no further instance of impairment of the remaining recorded goodwill. Therefore, the second phase of the testing was not required.
Net Interest Income
Interest income increased 151% from $43,000 in 2004 to $108,000 in 2005 primarily from imputed interest recognized on the note receivable from First Sports, explained in “Discontinued Operations.” Interest expense of $26,000 in 2004 was related to the Company’s line of credit with RBC Centura that was paid off December 30, 2004. In 2005, there was no interest expense, as the Company carried no debt during the year. The above factors resulted in a net increase in net interest income of 535.0% from $17,000 in 2004 to $108,000 in 2005.
Income Tax Expense
There was no income tax expense in either 2005 or 2004. As of December 31, 2005, the Company had a net operating loss carryforward in the United States of approximately $25,600,000, which expires in years 2009 through 2019. A valuation allowance has been established for all deferred tax assets as of December 31, 2005 and 2004, respectively.
BALANCE SHEET
Net accounts receivable decreased 37.8% from $399,000 at December 31, 2005 to $248,000 at December 31, 2006 consistent with lower total revenues. The allowance for doubtful accounts decreased 53.5% from $43,000 at December 31, 2005 to $20,000 at December 31, 2006 consistent with the decrease in accounts receivable. As a result of the sale of the U.K. Subsidiary explained below in “Discontinued Operations,” a note receivable in the amount of $1,620,000 was received. At December 31, 2006, the portion of the note receivable due within twelve months is $500,000 and is classified as a current asset on the Balance Sheet. Other assets decreased 10.5% from $475,000 at December 31, 2005 to $425,000 at December 31, 2006, primarily due to reimbursement of prepaid royalty expenses by First Sports International. Property and equipment decreased 32.9% from $82,000 at December 31, 2005 to $55,000 at December 31, 2006 due to fixed asset purchases of $20,000 offset by year-to-date depreciation and disposals totaling $47,000.
Goodwill remained at $593,000 at December 31, 2005 and December 31, 2006. Other intangible assets decreased 26.9% from $572,000 at December 31, 2005 to $418,000 at December 31, 2006, as a result of amortization expense of $154,000. There was no capitalized software at December 31, 2006, as compared to $363,000 at December 31, 2005, as a result of amortization expense of $363,000.
As a result of the sale of the U.K. Subsidiary, a note receivable in the amount of $1,620,000 was received in June of 2005. The initial long-term portion of the note was $1,250,000, payable in installments, and is classified as a non-current asset on the Balance Sheet. In accordance with APB 21 “Interest on Receivables and Payables,” imputed interest, which was calculated at 8%, resulted in an unamortized discount at May 31, 2005 totaling $233,000 and recorded as a direct reduction from the face amount of the note. Through December of 2006, $137,000 was amortized, resulting in a balance of $96,000 in imputed interest and a net non-current note receivable of $580,000 as of December 31, 2006.
20
Accounts payable decreased 54.3% from $302,000 at December 31, 2005 to $138,000 at December 31, 2006 due to certain expense reductions and the timing of payment of certain payables. Deferred revenue decreased 37.1% from $1,117,000 at December 31, 2005 to $703,000 at December 31, 2006 primarily due to customer cancellations and customer prepayments prior to 2006 recognized as revenue in 2006 Accrued employee compensation and benefits decreased 40.4% from $99,000 at December 31, 2005 to $59,000 at December 31, 2006 due to reduced vacation expense and employee incentives, consistent with reduced revenues and staff reductions. Other accrued liabilities decreased 6.3% from $32,000 at December 31, 2005 to $30,000 at December 31, 2006 primarily due to reduced sales tax.
LIQUIDITY AND CAPITAL RESOURCES
As of December 31, 2006, the Company had cash and cash equivalents of $997,000, an increase of 176.9% from the cash balance of $360,000 at December 31, 2005. The increased cash balance is primarily due to $375,000 received in payment of a portion of the promissory note with First-Sports and the assignment of the Company’s .Net Integrated Development Environment technology to Galactus Software for $500,000. The Company carries no debt. We are currently expanding our employee base and moving into new facilities. We anticipate that these new expenditures will have an impact on our operating costs, cash flows and requirements for capital. Our future capital requirements will depend on many factors, including our ability to continue to generate positive cash flows, to collect the note receivable from First Sports, to generate revenues from our new modular internet marketing and sales lead solutions, to retain our maintenance revenues from existing customers, to control expenses, and to generate additional revenues from other sources. Any projections of future cash needs and cash flows are subject to substantial uncertainty. We have no material commitments for capital expenditures. We do not believe that inflation has historically had a material effect on our Company’s results of operations.
TAXES
As of December 31, 2006, we had general business tax credit carryforwards of approximately $245,000, which will expire in years 2008 through 2011. We also have U.S. net operating loss carryforwards for federal and state income tax reporting purposes of approximately $25,600,000 which expire in years 2009 through 2019. The Internal Revenue Code contains provisions that limit the use in any future period of net operating loss and tax credit carryforwards upon the occurrence of specific events. A valuation allowance has been created for all deferred tax assets.
DISCONTINUED OPERATIONS
On June 3, 2005, Firstwave entered into the Stock Purchase Agreement with AllAboutTickets LLC, now operating as First Sports International (“First Sports”), as more fully detailed in Note 1 to the Company’s consolidated financial statements. The Company sold its U.K. Subsidiary to re-focus on the high technology market and to direct its efforts away from the Sports business that was concentrated in the U.K. market. Pursuant to the Agreement, the Company sold to First Sports all of the issued share capital of Firstwave Technologies U.K., Ltd., a subsidiary of the Company. This sale of the Company’s U.K. Subsidiary has been treated as a discontinued operation in the consolidated financial statements.
The total purchase price for the sale was $2,214,000, of which $256,000 in cash was paid at closing, $1,620,000 was agreed to be paid under a non-interest bearing Promissory Note that calls for payments to be made over a maximum of three years, and $338,000 was agreed to be paid as software revenues are achieved to reimburse the Company for certain prepaid royalties. In 2006, First Sports met the terms of the note and paid the required $300,000 in principal payment due in June. In addition, First Sports reimbursed $90,821 of the prepaid royalties mentioned above during 2006.
As a result of the sale of the U.K. Subsidiary, the Company recognized in 2005 a pre-tax gain on the disposition of the subsidiary of $327,000, which is reported as a separate component of discontinued operations in the consolidated statements of operations.
OFF BALANCE SHEET ARRANGEMENTS
The Company does not have off-balance sheet arrangements, financings, or other relationships with unconsolidated entities known as “Variable Interest Entities” (VIEs). In the ordinary course of business the Company leases certain real properties and equipment as disclosed in Note 12 in the Notes to the Company’s Consolidated Financial Statements.
21
CONTRACTUAL OBLIGATIONS
At December 31, 2006, the Company had no material outstanding contractual obligations. The sublease with M1 Global included a 30-day termination clause and expires in June of 2007. See Note 12 in the Notes to the Company’s Consolidated Financial Statements for more information.
Lease Commitments | ||||
| Less than one year | $ | 53 | ||
| Greater than one year to three years | 117 | |||
| Total | $ | 170 | ||
CRITICAL ACCOUNTING POLICIES
The Company believes that the following accounting policies are critical to understanding the consolidated financial statements.
REVENUE RECOGNITION
The Company recognizes revenue in accordance with Statement of Position (SOP) 97-2, “Software Revenue Recognition,” as amended by SOP 98-9, and related interpretations.
Revenue from software product licenses is recognized upon shipment of the product when the Company has a signed contract, the fees are fixed and determinable, no significant obligations remain and collection of the resulting receivable is probable.
The Company’s products are licensed on a per-user model, except for hosting services. In accordance with Paragraph 8 of SOP 97-2, license revenues under the per-user model are recognized under the Company’s revenue recognition polices when revenue recognition criteria are met. Hosting services are priced as a monthly or yearly fixed amount based upon number of users, and are recognized ratably by month over the period of service. Hosting services revenues are consolidated into services revenues on the Company’s financial statements.
Services revenue is recognized as services are performed. Our software product is able to function independently in a customer’s environment without additional services. Our training, implementation, email, and customization services are optional services to our customers and are not necessary for the functioning of the software product. Our software is offered as a stand-alone product. It can be implemented with minimal services. The essential functionality of the software, such as database support and maintenance, preparation of marketing campaigns, and standard workflow, is functional and can be utilized by the customer upon installation as intended by the customer. At a customer’s request, the software can also be implemented with additional services, such as data conversion and workflow modifications, which are not significant to the functionality of the software, but rather tailor features to most effectively function in the customer’s environment.
The revenue for the customization or implementation services is recognized as the services are provided and earned. Revenue is allocated to software and services based on vendor specific objective evidence of fair values. Because the software is a stand-alone product that can be used for the customer’s purpose upon installation, and because any services performed have insignificant effect on the functionality of the software, services revenues are accounted for separately in accordance with Paragraph 69 of SOP 97-2.
The Company has not recorded any unbilled receivables related to implementation and customization service revenues, and the Company has accounted for any implementation and customization service revenues that have been billed as the services were performed, in accordance with Paragraphs 65 and 66 of SOP 97-2.
The Company has arrangements with customers that provide for the delivery of multiple elements, including software licenses and services. The Company allocates and recognizes revenue related to each of the multiple elements based on vendor specific objective evidence of the fair value of each element and when there are no undelivered elements essential to the functionality of the delivered element. Vendor specific objective evidence is based on standard pricing for each of the elements in our multiple element arrangements. Revenue associated with the various elements of multiple element arrangements is based on such vendor specific objective evidence as the price charged for each element is the same as when the element would be sold separately from any other element. Standard pricing does not vary by customer or by duration, or by requirements of the arrangement.
22
Maintenance revenue is recognized on a pro-rata basis over the term of the maintenance agreements.
Advanced billings for services and maintenance contracts are recorded as deferred revenue on the Company’s balance sheet, with revenue recognized as the services are performed and on a pro-rata basis over the term of the maintenance agreements.
The Company provides an allowance for doubtful accounts based on management’s estimate of receivables that will be uncollectible. The estimate is based on historical charge-off activity and current account status.
Software Development Costs
Capitalized software development costs consist principally of salaries, contract services, and certain other expenses related to development and modifications of software products capitalized in accordance with the provisions of SFAS 86, “Accounting for the Costs of Computer Software to be Sold, Leased, or Otherwise Marketed.” Capitalization of such costs begins only upon establishment of technological feasibility as defined in SFAS 86 and ends when the resulting product is available for sale. The Company evaluates the establishment of technological feasibility based on the existence of a working model of the software product. Capitalized costs may include costs related to product enhancements resulting in new features and increased functionality as well as writing the code in a new programming language. All costs incurred to establish the technological feasibility of software products are classified as research and development and are expensed as incurred.
The Company evaluates the realizability of unamortized capitalized software costs at each balance sheet date. Software development costs which are capitalized are subsequently reported at the lower of unamortized cost or net realizable value. If the unamortized capitalized software cost exceeds the net realizable value of the asset, the amount would be written off accordingly. The net realizable value of the capitalized software development costs is the estimated future gross revenues of the software product reduced by the estimated future costs of completing and disposing of that product. Amortization of capitalized software costs is provided at the greater of the ratio of current product revenue to the total of current and anticipated product revenue or on a straight-line basis over the estimated economic life of the software, which is not more than three years. It is possible that those estimates of anticipated product revenues, the remaining estimated economic life of the product, or both could be reduced due to changing technologies. The amortization of software development costs is presented as a cost of software revenue in the Company’s financial statements.
Goodwill and Other Intangibles
In accordance with SFAS No. 142 “Goodwill and Other Intangible Assets”, intangible assets with indefinite useful lives must be tested periodically for impairment. Examples of management’s judgment regarding the existence of impairment of an intangible asset and the resulting fair value, would include management’s estimates of future net cash flows and assessment of adverse changes in legal factors, market conditions, or loss of key personnel. If the fair value of the intangible asset is determined to be less than the carrying value, the Company would record an impairment loss. SFAS No. 142 prescribes a two-phase approach for impairment testing of goodwill. The first phase screens for impairment, while the second phase (if necessary) measures the impairment.
RECENT ACCOUNTING PRONOUNCEMENTS
In February 2006, the FASB issued SFAS No. 155, Accounting for Certain Hybrid Financial Instruments, an amendment of FASB Statements No. 133 and 140. This Statement amends SFAS No. 133, Accounting for Derivative Instruments and Hedging Activities, and SFAS No. 140, Accounting for Transfers and Servicing of Financial Assets and Extinguishments of Liabilities and resolves issues in Statement No. 133 Implementation Issue No. D1, Application of Statement 133 to Beneficial Interests in Securitized Financial Assets. The provisions of this statement are effective for all financial instruments acquired or issued after the beginning of an entity’s first fiscal year that begins after September 15, 2006. The adoption of FAS No. 155 is not expected to have a material impact on the financial statements of the Company.
23
In September 2006, the SEC issued SAB No. 108, Considering the Effects of Prior Year Misstatements when Quantifying Misstatements in Current Year Financial Statements. SAB No. 108 provides guidance on how prior year misstatements should be considered when quantifying misstatements in current year financial statements for purposes of determining whether the current year’s financial statements are materially misstated. SAB No. 108 is effective for fiscal years ending after November 15, 2006. The application of SAB No. 108 did not have a material impact on the Company’s results of operations or financial position.
In July 2006, the FASB issued FASB Interpretation No. 48, Accounting for Uncertainty in Income Taxes (“FIN 48”). The interpretation clarifies the accounting for uncertainty in income taxes recognized in a company’s financial statements in accordance with SFAS No. 109, Accounting for Income Taxes. Specifically, the pronouncement prescribes a recognition threshold and a measurement attribute for the financial statement recognition and measurement of a tax position taken or expected to be taken in a tax return. The interpretation also provides guidance on the related derecognition, classification, interest and penalties, accounting for interim periods, disclosure and transition of uncertain tax positions. This interpretation was effective for the Company on January 1, 2007. The Company is currently evaluating the impact this new standard will have on its future results of operations and financial position.
In September 2006, the FASB issued SFAS No. 157, Fair Value Measurements (“SFAS 157”), which defines fair value, establishes a framework for measuring fair value in accordance with GAAP, and expands disclosures about fair value measurements. SFAS 157 applies where other accounting pronouncements require or permit fair value measurements; it does not require any new fair value measurements under GAAP. SFAS 157 is effective for the Company on January 1, 2007. The effects of adoption will be determined by the types of instruments carried at fair value in the Company’s financial statements at the time of adoption as well as the method utilized to determine their fair values prior to adoption. Based on the Company’s current use of fair value measurements, SFAS 157 is not expected to have a material effect on the results of operations or financial position of the Company.
Quarterly Financial Data (Unaudited)
The table below sets forth certain unaudited operating results for each of the eight quarters in the two-year period ended December 31, 2006. This information has been prepared on the same basis as the consolidated financial statements appearing elsewhere in this document, includes all adjustments necessary to present fairly this information when read in conjunction with the Financial Statements and Notes thereto, and includes consideration of discontinued operations from the sale of the U.K. Subsidiary on June 3, 2005. Our operating results for any one quarter are not necessarily indicative of results for any future period.
Quarter ended | |||||||||||||||||||||||||
3/31/06 | 6/30/06 | 9/30/06 | 12/31/06 | 3/31/05 | 6/30/05 | 9/30/05 | 12/31/05 | ||||||||||||||||||
(in thousands, except per share amounts) | |||||||||||||||||||||||||
| Net revenues from continuing operations | $ | 599 | $ | 958 | $ | 583 | $ | 554 | $ | 881 | $ | 793 | $ | 928 | $ | 622 | |||||||||
| Net Income/(loss) from continuing operations | (116 | ) | 281 | (44 | ) | 51 | (323 | ) | (439 | ) | (657 | ) | (159 | ) | |||||||||||
| Net Income/(loss) from continuing operations | |||||||||||||||||||||||||
| applicable to common shareholders | (187 | ) | 210 | (114 | ) | (20 | ) | (394 | ) | (510 | ) | (728 | ) | (230 | ) | ||||||||||
| Income/(loss) from discontinued operations | — | — | — | — | (428 | ) | (29 | ) | — | — | |||||||||||||||
| Gain/(loss) on sale of discontinued operations | — | — | — | — | — | 327 | — | — | |||||||||||||||||
| Basic earnings per share | |||||||||||||||||||||||||
| Earnings/(loss) from continuing operations | (0.06 | ) | 0.08 | (0.04 | ) | (0.01 | ) | (0.15 | ) | (0.19 | ) | (0.27 | ) | (0.08 | ) | ||||||||||
| Earnings/(loss) from discontinued operations | — | — | — | — | (0.16 | ) | 0.11 | — | — | ||||||||||||||||
| Net income/(loss) per common share | (0.06 | ) | 0.08 | (0.04 | ) | (0.01 | ) | (0.31 | ) | (0.08 | ) | (0.27 | ) | (0.08 | ) | ||||||||||
| Diluted earnings per share | |||||||||||||||||||||||||
| Earnings/(loss) from continuing operations | (0.06 | ) | 0.07 | (0.04 | ) | (0.01 | ) | (0.15 | ) | (0.19 | ) | (0.27 | ) | (0.08 | ) | ||||||||||
| Earnings/(loss) from discontinued operations | — | — | — | — | (0.16 | ) | 0.11 | — | — | ||||||||||||||||
| Net income/(loss) per common share | (0.06 | ) | 0.07 | (0.04 | ) | (0.01 | ) | (0.31 | ) | (0.08 | ) | (0.27 | ) | (0.08 | ) | ||||||||||
24
In accordance with SFAS No. 142 “Goodwill and Other Intangible Assets,” intangible assets with indefinite useful lives must be tested periodically for impairment. Examples of Management’s judgment regarding the existence of impairment of an intangible asset and the resulting fair value, would include management’s estimates of future net cash flows and assessment of adverse changes in legal factors, market conditions, or loss of key personnel. If the fair value of the intangible asset is determined to be less than the carrying value, the Company would record an impairment loss. SFAS No. 142 prescribes a two-phase approach for impairment testing of goodwill. The first phase screens for impairment; while the second phase (if necessary) measures the impairment.
Goodwill was evaluated for impairment quarterly throughout 2006 and 2005 in accordance with SFAS No. 142. The fair value was estimated using the expected net present value of future cash flows. The analysis for the third quarter of 2005 identified lower-than-expected operating results, and the Company revised the anticipated future earnings projections. As a result of this review, it was determined that there was an impairment of goodwill, and the second phase was required. The second phase resulted in the Company recording a non-cash impairment charge of $528,000 at September 30, 2005 to write-off a portion of the carrying value of goodwill. Additionally, as a result of the sale of the U.K. Subsidiary, goodwill was written down by $488,000 in June of 2005 to account for the allocation of goodwill to the U.K. Subsidiary. As a result of the quarterly analyses conducted in 2006, it was determined that there was no further instance of impairment of the remaining recorded goodwill. Therefore, the second phase of the testing was not required.
| ITEM 7A. | QUANTITATIVE AND QUALITATIVE DISCLOSURES ABOUT MARKET RISK |
The Company is subject to market risk exposures of varying correlations and volatilities, including interest rate risk and foreign exchange rate risk. Currently, the Company maintains its cash position primarily in money market funds and other bank accounts. The Company does not currently engage in hedging activities or otherwise use derivatives to alter the interest characteristics of its financial assets. Although a decrease in interest rates could reduce our interest income, management does not believe a change in interest rates will materially affect the Company’s financial position or results of operations in 2007.
Changes in interest rates could make it more costly to borrow money in the future and may impede our future acquisition and growth strategies if management determines that the costs associated with borrowing funds are too high to implement these strategies.
We do not engage in any hedging activities. As foreign currency exchange rates vary, the fluctuations in revenues and expenses related to our international customers may impact our consolidated financial statements. A weaker US dollar would result in an increase to revenues and expenses and a stronger US dollar would result in a decrease to revenues and expenses.
| ITEM 8. | FINANCIAL STATEMENTS AND SUPPLEMENTARY DATA |
Information included under Item 15 (a) (1) and (2)
25
REPORT OF INDEPENDENT REGISTERED PUBLIC ACCOUNTING FIRM
To The Board of Directors
Firstwave Technologies, Inc. and Subsidiary
Atlanta, Georgia
We have audited the accompanying consolidated balance sheets of Firstwave Technologies, Inc. and Subsidiary (the “Company”) as of December 31, 2006 and 2005, and the related consolidated statements of operations, changes in shareholders’ equity and cash flows for each of the years in the three-year period ended December 31, 2006. These consolidated financial statements are the responsibility of the Company’s management. Our responsibility is to express an opinion on these consolidated financial statements based on our audits.
We conducted our audits in accordance with the standards of the Public Company Accounting Oversight Board (United States). Those standards require that we plan and perform the audit to obtain reasonable assurance about whether the consolidated financial statements are free of material misstatement. We were not engaged to perform an audit of the Company’s internal control over financial reporting. Our audit included consideration of internal control over financial reporting as a basis for designing audit procedures that are appropriate in the circumstances, but not for the purpose of expressing an opinion on the effectiveness of the Company’s internal control over financial reporting. Accordingly, we express no such opinion. An audit includes examining, on a test basis, evidence supporting the amounts and disclosures in the consolidated financial statements, assessing the accounting principles used and significant estimates made by management, as well as evaluating the overall consolidated financial statement presentation. We believe that our audits provide a reasonable basis for our opinion.
In our opinion, the consolidated financial statements referred to above present fairly, in all material respects, the financial position of Firstwave Technologies, Inc. and Subsidiary as of December 31, 2006 and 2005, and the results of their operations and their cash flows for each of the years in the three-year period ended December 31, 2006, in conformity with accounting principles generally accepted in the United States of America.
Cherry, Bekaert & Holland, L.L.P.
Atlanta, Georgia
March 28, 2007
26
FIRSTWAVE TECHNOLOGIES, INC.
CONSOLIDATED BALANCE SHEETS
(IN THOUSANDS, EXCEPT PER SHARE DATA)
December 31, | |||||||
2006 | 2005 | ||||||
ASSETS | |||||||
| Current assets: | |||||||
| Cash and cash equivalents | $ | 997 | $ | 360 | |||
| Accounts receivable, less allowance for doubtful | |||||||
| accounts of $20 and $43 in 2006 and 2005, respectively | 248 | 399 | |||||
| Note receivable, current | 500 | 300 | |||||
| Prepaid expenses and other current assets | 425 | 475 | |||||
| Total current assets | 2,170 | 1,534 | |||||
| Property and equipment, net | 55 | 82 | |||||
| Investments | 8 | 50 | |||||
| Software development costs, net | — | 363 | |||||
| Intangible assets | 418 | 572 | |||||
| Goodwill | 593 | 593 | |||||
| Note receivable, net | 580 | 1,065 | |||||
| Total assets | $ | 3,824 | $ | 4,259 | |||
LIABILITIES AND SHAREHOLDERS’ EQUITY | |||||||
| Current liabilities: | |||||||
| Accounts payable | $ | 138 | $ | 302 | |||
| Sales tax payable | 28 | 30 | |||||
| Deferred revenue | 703 | 1,117 | |||||
| Accrued employee compensation and benefits | 59 | 99 | |||||
| Dividends payable | 46 | 46 | |||||
| Other accrued liabilities | 2 | 2 | |||||
| Total current liabilities | 976 | 1,596 | |||||
| Shareholders’ equity: | |||||||
| Preferred stock, no par value; 1,000,000 shares authorized; | |||||||
| 50,687 shares issued; 33,720 and 34,020 outstanding | |||||||
| at 2006 and 2005, respectively | |||||||
| 23,720 shares @$100 per share liquidation preference | |||||||
| 10,000 shares @$75 per share liquidation preference | $ | 2,981 | $ | 3,011 | |||
| Common stock, par value $.0019 per share; 10,000,000 | |||||||
| shares authorized; 2,868,302 and 2,729,135 shares issued | |||||||
| and outstanding at 2006 and 2005, respectively | 13 | 13 | |||||
| Additional paid-in capital | 25,296 | 25,269 | |||||
| Accumulated other comprehensive loss | — | (16 | ) | ||||
| Accumulated deficit | (25,442 | ) | (25,614 | ) | |||
| Total shareholders’ equity | 2,848 | 2,663 | |||||
| Total liabilities and shareholders’ equity | $ | 3,824 | $ | 4,259 | |||
The accompanying notes are an integral part of these consolidated financial statements.
27
FIRSTWAVE TECHNOLOGIES, INC.
CONSOLIDATED STATEMENTS OF OPERATIONS
(IN THOUSANDS, EXCEPT PER SHARE DATA)
For the Year Ended December 31, | ||||||||||
2006 | 2005 | 2004 | ||||||||
| Net Revenues: | ||||||||||
| Software | $ | 743 | $ | 551 | $ | 876 | ||||
| Services | 291 | 623 | 1,145 | |||||||
| Maintenance | 1,651 | 2,002 | 2,457 | |||||||
| Other | 9 | 48 | 48 | |||||||
| 2,694 | 3,224 | 4,526 | ||||||||
| Cost and Expenses: | ||||||||||
| Cost of revenues: | ||||||||||
| Software | 411 | 803 | 2,032 | |||||||
| Services | 159 | 578 | 1,193 | |||||||
| Maintenance | 563 | 422 | 405 | |||||||
| Other | 14 | 32 | 38 | |||||||
| Sales and marketing | 339 | 506 | 1,903 | |||||||
| Product development | 317 | 631 | 1,188 | |||||||
| General and administrative | 768 | 1,410 | 2,082 | |||||||
| Goodwill impairment | — | 528 | 750 | |||||||
| 2,571 | 4,910 | 9,591 | ||||||||
| Operating income/(loss) | 123 | (1,686 | ) | (5,065 | ) | |||||
| Loss on investment | (57 | ) | — | — | ||||||
| Interest income, net | 106 | 108 | 17 | |||||||
| Income/(loss) from continuing operations before income taxes | 172 | (1,578 | ) | (5,048 | ) | |||||
| Income tax provision, continuing operations | — | — | — | |||||||
| Income/(loss) from continuing operations | 172 | (1,578 | ) | (5,048 | ) | |||||
| Income/(loss) from discontinued operations | — | (457 | ) | 410 | ||||||
| Gain on sale of discontinued operations | — | 327 | — | |||||||
| Net income/(loss) from discontinued operations | — | (130 | ) | 410 | ||||||
| Net income/(loss) | 172 | (1,708 | ) | (4,638 | ) | |||||
| Dividends on preferred stock | (283 | ) | (284 | ) | (255 | ) | ||||
| Net loss applicable to common shareholders | $ | (111 | ) | $ | (1,992 | ) | $ | (4,893 | ) | |
| Basic and diluted per share: | ||||||||||
| Loss from continuing operations | $ | (0.04 | ) | $ | (0.69 | ) | $ | (1.98 | ) | |
| Earnings/(loss) from discontinued operations | — | (0.05 | ) | 0.15 | ||||||
Net loss per common share – Basic and diluted | $ | (0.04 | ) | $ | (0.74 | ) | $ | (1.82 | ) | |
| Basic and diluted weighted average shares outstanding | 2,792 | 2,709 | 2,682 | |||||||
The accompanying notes are an integral part of these condensed consolidated financial statements.
28
FIRSTWAVE TECHNOLOGIES, INC.
CONSOLIDATED STATEMENT OF CHANGES IN SHAREHOLDERS’ EQUITY
(IN THOUSANDS, EXCEPT SHARE DATA)
Common Stock | Preferred Stock | Additional paid-in | Comprehensive income | Accumulated other | Accumulated | |||||||||||||||||||||||
Shares | Amount | Shares | Amount | capital | (loss) | income/(loss) | deficit | Total | ||||||||||||||||||||
| Balance at December 31, 2003 | 2,672,728 | $ | 13 | 27,020 | $ | 2,333 | $ | 25,691 | $ | (400 | ) | $ | (19,268 | ) | $ | 8,369 | ||||||||||||
| Exercise of common stock | ||||||||||||||||||||||||||||
| options/employee stock purchases | 3,037 | — | — | — | 5 | — | — | — | 5 | |||||||||||||||||||
| Issuance of common stock | 18,228 | 44 | 44 | |||||||||||||||||||||||||
| Series D Convertible Preferred Stock | — | — | 7,000 | 678 | — | — | — | 678 | ||||||||||||||||||||
| Dividends on preferred stock | — | — | — | (255 | ) | — | — | (255 | ) | |||||||||||||||||||
| Net Income | — | — | — | — | — | (4,638 | ) | — | (4,638 | ) | (4,638 | ) | ||||||||||||||||
| Foreign currency translation adjustment | — | — | — | — | — | (354 | ) | (354 | ) | — | (354 | ) | ||||||||||||||||
| Comprehensive Income | — | — | — | — | — | (4,992 | ) | |||||||||||||||||||||
| Balance at December 31, 2004 | 2,693,993 | 13 | 34,020 | 3,011 | 25,485 | (754 | ) | (23,906 | ) | 3,849 | ||||||||||||||||||
| Exercise of common stock | ||||||||||||||||||||||||||||
| options/employee stock purchases | 5,598 | — | 9 | 9 | ||||||||||||||||||||||||
| Issuance of common stock | 29,544 | — | 59 | 59 | ||||||||||||||||||||||||
| Dividends on preferred stock | — | — | (284 | ) | (284 | ) | ||||||||||||||||||||||
| Net Income | — | — | (1,708 | ) | (1,708 | ) | (1,708 | ) | ||||||||||||||||||||
| Unrecognized loss on equity securities: | ||||||||||||||||||||||||||||
| available for sale | (16 | ) | (16 | ) | (16 | ) | ||||||||||||||||||||||
| Foreign currency translation adjustment | — | — | 754 | 754 | 754 | |||||||||||||||||||||||
| Comprehensive Income | — | — | $ | (970 | ) | |||||||||||||||||||||||
| Balance at December 31, 2005 | 2,729,135 | $ | 13 | 34,020 | $ | 3,011 | $ | 25,269 | $ | (16 | ) | $ | (25,614 | ) | $ | 2,663 | ||||||||||||
| Exercise of common stock options | 64,167 | — | 96 | 96 | ||||||||||||||||||||||||
| Issuance of common stock | 65,000 | — | 127 | 127 | ||||||||||||||||||||||||
| Conversion of preferred stock | 10,000 | (300 | ) | (30 | ) | 30 | — | |||||||||||||||||||||
| Dividends on preferred stock | — | — | (283 | ) | (283 | ) | ||||||||||||||||||||||
| Stock option expense | 57 | 57 | ||||||||||||||||||||||||||
| Net Income | — | — | 172 | 172 | 172 | |||||||||||||||||||||||
| Reclassification adjustment for realized | ||||||||||||||||||||||||||||
| loss included in net earnings | 16 | 16 | 16 | |||||||||||||||||||||||||
| Comprehensive Income | — | — | $ | 188 | ||||||||||||||||||||||||
| Balance at December 31, 2006 | 2,868,302 | $ | 13 | 33,720 | $ | 2,981 | $ | 25,296 | $ | — | $ | (25,442 | ) | $ | 2,848 | |||||||||||||
The accompanying notes are an integral part of these consolidated financial statements.
29
FIRSTWAVE TECHNOLOGIES, INC.
CONSOLIDATED STATEMENTS OF CASH FLOWS
(IN THOUSANDS)
For Year Ended December 31, | ||||||||||
2006 | 2005 | 2004 | ||||||||
| Cash flows from operating activities: | ||||||||||
| Net income/(loss) | $ | 172 | $ | (1,708 | ) | $ | (4,638 | ) | ||
| Adjustments to reconcile net income/(loss) to net cash: | ||||||||||
| Provided by/(used in) operating activities: | ||||||||||
| Depreciation and amortization | 562 | 1,130 | 1,817 | |||||||
| Non-cash interest income | (89 | ) | (42 | ) | — | |||||
| (Gain)/loss on disposal of fixed assets | — | 1 | 3 | |||||||
| Loss on investments | 57 | — | — | |||||||
| Stock proceeds from sale | — | (66 | ) | — | ||||||
| Provision for bad debts | (23 | ) | 27 | (33 | ) | |||||
| Stock compensation | 57 | 30 | 44 | |||||||
| Impairment of Goodwill | — | 569 | 750 | |||||||
| Write-off of capitalized software | — | — | 711 | |||||||
| Changes in assets and liabilities: | ||||||||||
| Accounts receivable | 174 | 193 | 658 | |||||||
| Note receivable | 375 | (300 | ) | — | ||||||
| Prepaid expenses and other assets | 50 | 25 | 426 | |||||||
| Accounts payable | (164 | ) | (277 | ) | 13 | |||||
| Sales tax payable | (2 | ) | (187 | ) | (153 | ) | ||||
| Deferred revenue | (414 | ) | (196 | ) | (78 | ) | ||||
| Accrued employee compensation and benefits | (40 | ) | (57 | ) | (212 | ) | ||||
| Other accrued liabilities | — | (68 | ) | (89 | ) | |||||
| Total adjustments | 543 | 782 | 3,857 | |||||||
| Net cash provided by/(used in) operating activities | 715 | (926 | ) | (781 | ) | |||||
| Cash flows from investing activities: | ||||||||||
| Software development costs | — | — | (94 | ) | ||||||
| Purchases of property and equipment, net | (18 | ) | (20 | ) | (108 | ) | ||||
| Sale of UK Subsidiary | — | 256 | — | |||||||
| Net cash provided by/(used in) investing activities | (18 | ) | 236 | (202 | ) | |||||
| Cash flows from financing activities: | ||||||||||
| Proceeds from issuance of convertible preferred stock, net | — | — | 678 | |||||||
| Issuance of common stock | 127 | 29 | — | |||||||
| Exercise of common stock options | 96 | 6 | 4 | |||||||
| Proceeds from employee stock purchase plan | — | 3 | 1 | |||||||
| Repayment of borrowings | — | — | (500 | ) | ||||||
| Payment of dividends on convertible preferred stock | (283 | ) | (284 | ) | (250 | ) | ||||
| Net cash used in financing activities | (60 | ) | (246 | ) | (67 | ) | ||||
| Effect of exchange rate changes on cash and cash equivalents | — | 10 | (368 | ) | ||||||
| Net increase/(decrease) in cash and cash equivalents | 637 | (926 | ) | (1,418 | ) | |||||
| Cash and cash equivalents, beginning of year | 360 | 1,286 | 2,704 | |||||||
| Cash and cash equivalents, end of year | $ | 997 | $ | 360 | $ | 1,286 | ||||
| Supplemental disclosure of cash flow information: | ||||||||||
| Cash paid for interest | $ | — | $ | — | $ | 26 | ||||
| Cash paid for income taxes | $ | — | $ | — | $ | — | ||||
The accompanying notes are an integral part of these consolidated financial statements.
30
| 1. | DESCRIPTION OF BUSINESS AND BASIS OF PRESENTATION |
Description of the Company
Headquartered in Atlanta, Georgia, Firstwave is a provider of lead generation, lead nurturing and customer management and tracking solutions built upon a suite of Customer Relationship Management (CRM) products. Firstwave’s solutions help customers find new prospects, continuously engage these prospects throughout the sales cycle and maintain contact with customers throughout their lifecycle. Firstwave’s modular internet marketing, sales lead, and customer management solutions help customers achieve results.
Basis of presentation and liquidity considerations
Fair value of financial instruments
The Company has identified cash, accounts receivable, notes receivable, investments, accounts payable and debt as financial instruments of the Company. Due to the nature of these financial instruments the Company believes that the fair value of these financial instruments approximates their carrying value.
Consolidation
The consolidated financial statements include the accounts of Firstwave Technologies, Inc. and its wholly owned subsidiary, Connect-Care, Inc. All intercompany transactions and balances have been eliminated in consolidation.
Reclassifications
Certain amounts in the 2005 and 2004 consolidated financial statements have been reclassified to conform to the 2006 presentation.
Liquidity
As of December 31, 2006, the Company had cash and cash equivalents of $997,000, an increase of 176.9% from the cash balance of $360,000 at December 31, 2005. The increased cash balance is primarily due to $375,000 received in payment of a portion of the promissory note with First-Sports and the assignment of the company’s .Net Integrated Development Environment technology to Galactus Software for $500,000. The Company carries no debt. We are currently expanding our employee base and moving into new facilities. We anticipate that these new expenditures will have an impact on our operating costs, cash flows and requirements for capital. Our future capital requirements will depend on many factors, including our ability to continue to generate positive cash flows, to collect the note receivable from First Sports, to generate revenues from our new modular internet marketing and sales lead solutions, to retain our maintenance revenues from existing customers, to control expenses, and to generate additional revenues from other sources. Any projections of future cash needs and cash flows are subject to substantial uncertainty. We have no material commitments for capital expenditures. We do not believe that inflation has historically had a material effect on our Company’s results of operations.
| 2. | USE OF ESTIMATES |
The preparation of financial statements in conformity with accounting principles generally accepted in the United States of America requires management to make estimates and assumptions that affect the reported amounts of assets and liabilities and the disclosure of contingent assets and liabilities at the date of the financial statements and the reported amounts of revenues and expenses during the reporting period. Examples of estimates which require management’s judgment include revenue recognition, accounts receivable reserve, notes receivable, investments, valuation of long-lived assets and intangible assets, and goodwill. Management bases its estimates on historical experience and on other factors which are believed to be reasonable under the circumstances. All accounting estimates and the basis for these estimates are discussed between the Company’s senior management and the Audit Committee. Actual results could differ from those estimates.
31
| 3. | SUMMARY OF SIGNIFICANT ACCOUNTING POLICIES |
Revenue recognition
The Company recognizes revenue in accordance with Statement of Position (SOP) 97-2, “Software Revenue Recognition,” as amended by SOP 98-9, and related interpretations.
Revenue from software product licenses is recognized upon shipment of the product when the Company has a signed contract, the fees are fixed and determinable, no significant obligations remain and collection of the resulting receivable is probable.
The Company’s products are licensed on a per-user model, except for hosting services. In accordance with Paragraph 8 of SOP 97-2, license revenues under the per-user model are recognized under the Company’s revenue recognition polices when revenue recognition criteria are met. Hosting services are priced as a monthly or yearly fixed amount based upon number of users, and are recognized ratably by month over the period of service. Hosting services revenues are consolidated into services revenues on the Company’s financial statements.
Services revenue is recognized as services are performed. Our software product is able to function independently in a customer’s environment without additional services. Our training, implementation, email, and customization services are optional services to our customers and are not necessary for the functioning of the software product. Our software is offered as a stand-alone product. It can be implemented with minimal services. The essential functionality of the software, such as database support and maintenance, preparation of marketing campaigns, and standard workflow, is functional and can be utilized by the customer upon installation as intended by the customer. At a customer’s request, the software can also be implemented with additional services, such as data conversion and workflow modifications, which are not significant to the functionality of the software, but rather tailor features to most effectively function in the customer’s environment.
The revenue for the customization or implementation services is recognized as the services are provided and earned. Revenue is allocated to software and services based on vendor specific objective evidence of fair values. Because the software is a stand-alone product that can be used for the customer’s purpose upon installation, and because any services performed have insignificant effect on the functionality of the software, services revenue is accounted for separately in accordance with Paragraph 69 of SOP 97-2.
The Company has not recorded any unbilled receivables related to implementation and customization service revenues, and the Company has accounted for any implementation and customization service revenues that have been billed as the services were performed, in accordance with Paragraphs 65 and 66 of SOP 97-2.
The Company has arrangements with customers that provide for the delivery of multiple elements, including software licenses and services. The Company allocates and recognizes revenue related to each of the multiple elements based on vendor specific objective evidence of the fair value of each element and when there are no undelivered elements essential to the functionality of the delivered element. Vendor specific objective evidence is based on standard pricing for each of the elements in our multiple element arrangements. Revenue associated with the various elements of multiple element arrangements is based on such vendor-specific objective evidence as the price charged for each element is the same as when the element would be sold separately from any other element. Standard pricing does not vary by customer or by duration, or by requirements of the arrangement.
Maintenance revenue is recognized on a pro rata basis over the term of the maintenance agreements.
On October 10, 2005, the Company entered into a three-year OEM/Outsourcing Agreement and a Licensing Agreement with M1 Global, an Atlanta-based technology company. Under the terms of the agreements, M1 Global has licensed the Firstwave CRM database schema to develop its future products, and is a non-exclusive reseller of Firstwave products. Although the agreements included the outsourcing of Firstwave’s Professional Services and Support functions to M1 Global, Firstwave is currently providing its own coverage in those areas and no longer pays M1 Global for these services. The agreements provide that M1 Global also pays royalty commissions to Firstwave as follows: 33% on licenses and 20% on services. During the first six months of 2006, M1 Global handled most of the professional services and paid a commission of 20% of services revenues to Firstwave. Commissions received from M1 Global for professional services for 2006 were $72,259. As we have increased our professional services staff since July of 2006, the amount of professional services provided by M1 Global to our customers, and the commissions received from M1 Global, have declined. In addition, during the first six months of 2006, M1 Global provided most of the maintenance services for our customers in exchange for a quarterly fee of $154,315 per quarter. Since July of 2006, we have hired additional personnel for customer support and the support services provided by M1 Global have also been reduced. The quarterly fees to M1 Global were approximately $90,000 in the third quarter and $78,000 in the fourth quarter of 2006. For 2007, there have been no fees paid or payable to M1Global through March 31, 2007.
32
Advanced billings for services and maintenance contracts are recorded as deferred revenue on the Company’s balance sheet, with revenue recognized as the services are performed and on a pro-rata basis over the term of the maintenance agreements.
The Company provides an allowance for doubtful accounts based on management’s estimate of receivables that will be uncollectible. The estimate is based on historical charge-off activity and current account status.
Software development costs
Capitalized software development costs consist principally of salaries, contract services, and certain other expenses related to development and modifications of software products capitalized in accordance with the provisions of SFAS 86, “Accounting for the Costs of Computer Software to be Sold, Leased, or Otherwise Marketed.” Capitalization of such costs begins only upon establishment of technological feasibility as defined in SFAS 86 and ends when the resulting product is available for sale. The Company evaluates the establishment of technological feasibility based on the existence of a working model of the software product. Capitalized costs may include costs related to product enhancements resulting in new features and increased functionality as well as writing the code in a new programming language. All costs incurred to establish the technological feasibility of software products are classified as research and development and are expensed as incurred.
The Company evaluates the realizability of unamortized capitalized software costs at each balance sheet date. Software development costs which are capitalized are subsequently reported at the lower of unamortized cost or net realizable value. If the unamortized capitalized software cost exceeds the net realizable value of the asset, the amount would be written off accordingly. The net realizable value of the capitalized software development costs is the estimated future gross revenues of the software product reduced by the estimated future costs of completing and disposing of that product. Amortization of capitalized software costs is provided at the greater of the ratio of current product revenue to the total of current and anticipated product revenue or on a straight-line basis over the estimated economic life of the software, which is not more than three years. It is possible that those estimates of anticipated product revenues, the remaining estimated economic life of the product, or both could be reduced due to changing technologies. The amortization of software development costs is presented as a cost of software revenues in the Company’s financial statements.
Goodwill and other intangibles
In accordance with SFAS No. 142 “Goodwill and Other Intangible Assets”, intangible assets with indefinite useful lives must be tested periodically for impairment. Examples of Management’s judgment regarding the existence of impairment of an intangible asset and the resulting fair value, would include management’s estimates of future net cash flows and assessment of adverse changes in legal factors, market conditions, or loss of key personnel. If the fair value of the intangible asset is determined to be less than the carrying value, the Company would record an impairment loss. SFAS No. 142 prescribes a two-phase approach for impairment testing of goodwill. The first phase screens for impairment; while the second phase (if necessary) measures the impairment.
Goodwill was evaluated for impairment quarterly throughout the three years ended December 31, 2006 in accordance with SFAS No. 142. The fair value was estimated using the expected net present value of future cash flows. The analysis for the third quarter of 2005 identified lower-than-expected operating results, and the Company revised the anticipated future earnings projections. As a result of this review, it was determined that the fair value of goodwill was less than the carrying value, and the second phase was required. The second phase resulted in the Company recording a non-cash impairment charge of $528,000 at September 30, 2005 to write-off a portion of the carrying value of goodwill. In December of 2004, the Company recorded a non-cash impairment charge of $750,000 against the carrying value of goodwill. Additionally, as a result of the sale of the U.K. Subsidiary, goodwill was written down by $488,000 in June of 2005 to account for the allocation of goodwill to the U.K. Subsidiary, and is shown in discontinued operations. Based upon the quarterly analyses conducted during 2006, it was determined that there was no further instance of impairment of the remaining recorded goodwill. Therefore, the second phase of the testing was not required.
33
Concentration of credit risk
The Company is subject to credit risk primarily due to its trade accounts receivable, primarily due to the high concentration of such receivables due from certain customers. The customer accounts receivable which represented more than 10% of total accounts receivable are shown below:
December 31, | |||||||
2006 | 2005 | ||||||
| Argos, Ltd | 0.0 | % | 16.4 | % | |||
| Barclaycard IT | 0.0 | % | 10.0 | % | |||
| CapGemini UK | 22.9 | % | 14.2 | % | |||
| Idexx Systems | 23.1 | % | 0.0 | % | |||
| M1 Global Solutions, Inc. | 1.9 | % | 10.9 | % | |||
| Sungard HTE, Inc. | 0.0 | % | 2.3 | % | |||
Significant Customers
The table below identifies the customer who contributed more than 10% of total revenue in 2006, 2005, or 2004.
Year ended December 31, | ||||||||||
2006 | 2005 | 2004 | ||||||||
| Electronic Data Systems, Ltd | 4.3 | % | 6.2 | % | 11.8 | % | ||||
| Galactus Software | 18.8 | % | 0.0 | % | 0.0 | % | ||||
As a result of the sale of its UK subsidiary, the Company is also subject to credit risk related to the $1,620,000 promissory note it holds from First Sports, the balance of such note at December 31, 2006, was $1,250,000, as discussed in detail under “Discontinued Operations.”
Stock-based compensation
Statement of Financial Accounting Standards (“SFAS”) Statement No. 123(R) Share-Based Payment, was issued in December 2004 and is effective for the year ended December 31, 2006. Accordingly, on January 1, 2006, the Company adopted SFAS No. 123 (R) which requires the measurement and recognition of compensation expense for all share-based payment awards made to employees, directors, and outside consultants including employee stock options and employee stock purchases related to the Employee Stock Purchase Plan based on estimated fair values. SFAS 123 (R) supersedes the Company’s previous accounting under Accounting Principles Board Opinion No. 25, “Accounting for Stock Issued to Employees” (“APB 25”). The Company elected the modified prospective transition method, under which the Company’s Consolidated Financial Statements for prior periods have not been restated to reflect and do not include the impact of SFAS 123 (R). SFAS 123(R) requires companies to estimate the fair value of share-based payment awards on the date of grant using an option-pricing model. Compensation expense is recognized ratably over the period of vesting. Compensation expense for all share-based payment awards granted subsequent to January 1, 2006 is being recognized using the straight-line method.
The fair value of each option grant and the employees’ purchase rights are estimated on the dates of grant using the Black-Scholes option-pricing model with the following weighted-average assumptions used in 2006, 2005 and 2004, respectively: dividend yield of 0% for all years; expected volatility of 125%, 125% and 127%, respectively; risk-free interest rate ranging from 2.96% to 5.10% and expected lives of 6 years, 4.5 years, and 4.5 years, respectively. For the year ended December 31, 2006, a forfeiture rate of 2% was used.
34
There is no tax benefit included in the stock-based employee compensation expense determined under the fair-value-based method for the twelve month periods ended December 31, 2006, December 31, 2005 and December 31, 2004, as the Company established a full valuation allowance for its net deferred tax assets.
The Company adopted the disclosure only provisions of SFAS No. 123, “Accounting for Stock-Based Compensation” for 2005 and 2004, while stock compensation expense was recorded in the Company’s Consolidated Financial Statements for 2006. The stock compensation expense for 2006 was $57,000. The following table illustrates the effect on net loss per share if the Company had applied the fair value recognition provisions of SFAS No. 123 to stock-based employee awards for 2005 and 2004 (in thousands, except for per share data).
Year Ended December 31, | |||||||
2005 | 2004 | ||||||
| Net loss applicable to common | |||||||
| shareholders as reported | $ | (1,992 | ) | $ | (4,893 | ) | |
| Stock based employee compensation, net of related | |||||||
| tax effects under the fair value based method | 774 | 943 | |||||
| Net loss as adjusted | $ | (2,766 | ) | $ | (5,836 | ) | |
| Net loss per share: | |||||||
Basic – as reported | $ | (.74 | ) | $ | (1.82 | ) | |
| Basic – as adjusted | $ | (1.02 | ) | $ | (2.18 | ) | |
| Diluted – as reported | $ | (.74 | ) | $ | (1.82 | ) | |
| Diluted – as adjusted | $ | (1.02 | ) | $ | (2.18 | ) | |
In the second quarter of 2005, the Board of Directors of the Company voted to immediately vest all outstanding unvested options held by employees and directors of the Company.
Basic and diluted net income/(loss) per common share
Basic net loss per common share is based on the weighted average number of shares of common stock outstanding during the period. Stock options and convertible preferred stock would have been included in the diluted earnings per share calculation had they not been antidilutive. Net loss applicable to common shareholders includes a charge for dividends related to the Company’s outstanding preferred stock.
Potential common shares from stock options and convertible preferred stock have been excluded from the computation of diluted earnings per share due to net losses from continuing operations in 2006, 2005, and 2004 as their effect is antidilutive. The number of common shares that could have potentially diluted earnings per share and therefore were not included in the computation of diluted earnings per share were $1,025,396 in 2006, 1,099,063 in 2005, and 830,779 in 2004. Weighted average options to purchase shares of common stock outstanding but not included in the computation of diluted EPS were 149,502 in 2006, 152,002 in 2005, and 426,975 in 2004. These options were not included in the computation of diluted EPS because the options’ exercise price was greater than the average market price of the common shares.
Advertising Expense
The Company expenses advertising costs when the advertising takes place. Advertising costs from continuing operations were $5,000 and $239,000 in 2005 and 2004, respectively, with no advertising expense in 2006.
Impairment of long-lived assets
The Company evaluates impairment of long-lived assets annually or whenever events or changes in circumstances indicate that the carrying amount of an asset may not be recoverable. If the sum of the expected future undiscounted cash flows is less than the carrying amount of the asset, an impairment loss would be recognized. Measurement of an impairment loss for long-lived assets would be based on the fair value of the asset.
35
Cash and cash equivalents
Cash and cash equivalents include all highly liquid investment instruments with an original maturity of three months or less.
Property and equipment
Property and equipment consist of furniture, computers, other office equipment, and purchased software, recorded at cost less accumulated depreciation and amortization. Depreciation and amortization for financial reporting purposes are recorded using the straight-line method over estimated useful lives ranging from three to six years. Expenditures for maintenance and repairs are charged to expense as incurred.
Income taxes
The Company accounts for income taxes utilizing the liability method and deferred income taxes are determined based on the estimated future tax effects of differences between the financial reporting and income tax bases of the related assets and liabilities under the provisions of currently enacted tax laws. A valuation allowance is provided if, based upon the weight of available evidence, it is more likely than not that some or all of the deferred tax assets will not be realized.
Comprehensive income/(loss)
Comprehensive income/(loss) consists of net income/(loss) and other gains and losses affecting shareholders’ equity that, under generally accepted accounting principles are excluded from net income/(loss).
| 4. | DISCONTINUED OPERATIONS |
On June 3, 2005, Firstwave entered into the Stock Purchase Agreement with AllAboutTickets LLC, now known as First Sports International (“First Sports”). The Company sold its U.K. Subsidiary to re-focus on the high technology market and to direct its efforts away from the Sports business that was concentrated in the U.K. market. Pursuant to the Agreement, effective May 1, 2005, the Company sold to First Sports all of the issued share capital of Firstwave Technologies U.K., Ltd., a subsidiary of the Company. This sale of the Company’s U.K. Subsidiary has been treated as a discontinued operation in the accompanying consolidated statement of operations. The total price for the stock purchase transaction was $2,214,000, of which $256,000 in cash was received at closing, $1,620,000 is due under a non-interest bearing Promissory Note that calls for payments to be made over a maximum of three years, and $338,000 is due as software revenues are achieved by the First Sports and which will reimburse the Company for certain prepaid royalties.
As of December 31, 2006, the remaining balance of the promissory note was $1,175,000 payable in installments. The short-term portion of the note is $500,000, is payable prior to December 31, 2007, and has been classified as a current asset on the Balance Sheet. The long-term portion of the note is $675,000, is payable in fiscal year 2008, and is classified as a non-current asset on the Balance Sheet. Under the License Agreement, First Sports will pay quarterly royalty amounts to the Company if such royalty amounts exceed the payments due under the Promissory Note, and such amounts will be applied to the uncollected balance of the note receivable. In accordance with APB 21,”Interest on Receivables and Payables,” imputed interest was calculated at 8%, resulting in an unamortized discount at May 31, 2005 totaling $233,000 and recorded as a direct reduction from the face amount of the note. Through December 31, 2006, $138,000 was amortized, resulting in an unamortized balance of $95,000 of imputed interest as of December 31, 2006. Additionally, as of December 31, 2006, the Company received $104,051 as payments against the prepaid royalties.
The sale of the U.K. subsidiary included $79,000 of total assets, consisting of accounts receivable, prepaid assets, furniture and equipment. The total liabilities sold were $67,000, consisting of accounts payable, taxes payable, benefits payable and deferred revenue. Net loss from discontinued operations was $130,000 for the year ended December 31, 2005. Total revenues from discontinued operations were $341,000 in 2005.
36
As a result of the sale of the U.K. Subsidiary, the Company recognized a pre-tax gain of $327,000 in 2005; this amount is included in income/(loss) from discontinued operations in the 2005 Consolidated Statement of Operations.
| 5. | PROPERTY AND EQUIPMENT |
Property and equipment are summarized as follows (in thousands):
December 31, | ||||||||||
2006 | 2005 | 2004 | ||||||||
| Computer hardware and other equipment | $ | 1,763 | $ | 1,744 | $ | 1,789 | ||||
| Furniture and fixtures | 323 | 323 | 780 | |||||||
| Purchased software | 1,803 | 1,803 | 1,796 | |||||||
| 3,889 | 3,870 | 4,365 | ||||||||
| Less: Accumulated depreciation and amortization | (3,834 | ) | (3,788 | ) | (4,101 | ) | ||||
| $ | 55 | $ | 82 | $ | 264 | |||||
Depreciation and amortization of property and equipment totaled $45,000, $170,000, and $334,000 in 2006, 2005, and 2004, respectively.
| 6. | GOODWILL AND INTANGIBLE ASSETS |
At December 31, 2006 and 2005, the Company had the following amounts recorded as goodwill and intangible assets (in thousands):
2006 | 2005 | ||||||
| Goodwill | $ | 593 | $ | 593 | |||
| Amortizable Intangible Assets: | |||||||
| Connect Care technology | $ | 300 | $ | 300 | |||
| Accumulated amortization | (300 | ) | (275 | ) | |||
| Net book value | $ | — | $ | 25 | |||
| Connect-Care customer relationships | $ | 900 | $ | 900 | |||
| Accumulated amortization | (482 | ) | (353 | ) | |||
| Net book value | $ | 418 | $ | 547 | |||
Amortization expense was $154,000 in 2006 and $229,000 in 2005.
Estimated amortization expense through 2010 is as follows (in thousands):
| 2007 | $ | 129 | ||
| 2008 | $ | 129 | ||
| 2009 | $ | 129 | ||
| 2010 | $ | 31 |
During 2005 the Company sold its U.K. subsidiary. The Company allocated $488,000 of goodwill to the basis of the subsidiary in calculating the gain on sale of the subsidiary.
During 2005 the Company recorded an impairment charge to goodwill in the amount of $528,000. Based on the Company’s fair value of the entity determination at an interim period during 2005, utilizing the expected net present value of future cash flows, it was determined that goodwill was impaired.
During 2006 the Company did not record an impairment charge to goodwill. Based on the Company’s fair value of the entity determination, utilizing the expected net present value of future cash flows, it was determined that goodwill was not impaired.
37
| 7. | PRODUCT DEVELOPMENT EXPENSES |
Product development expenses are summarized as follows (in thousands):
Year ended December 31, | ||||||||||
2006 | 2005 | 2004 | ||||||||
| Total development expenses | $ | 317 | $ | 631 | $ | 1,282 | ||||
| Less: Additions to capitalized software | ||||||||||
| development before amortization | — | — | 94 | |||||||
| Product development expenses | $ | 317 | $ | 631 | $ | 1,188 | ||||
The activity in the capitalized software development account is summarized as follows (in thousands):
Year ended December 31, | ||||||||||
2006 | 2005 | 2004 | ||||||||
| Balance at beginning of year, net | $ | 363 | $ | 1,095 | $ | 2,966 | ||||
| Additions | — | — | 94 | |||||||
| Amortization expense | (363 | ) | (732 | ) | (1,254 | ) | ||||
| Write-off of discontinued products prior to release | — | — | (136 | ) | ||||||
| Write-off of discontinued product | — | — | (575 | ) | ||||||
| Balance at end of year, net | $ | — | $ | 363 | $ | 1,095 | ||||
| 8. | BORROWINGS |
On July 29, 2003, the Company signed a “Revolving Credit Facility” loan with RBC Centura whereby the Company could borrow up to $1,000,000. The Company had borrowings of $500,000 against the line of credit as of December 31, 2003. The Revolving Facility accrued interest at a variable rate equal to the one month London Interbank Offered Rate (LIBOR) plus 300 basis points, or the “RBC Centura Prime Rate” plus 0.50%, at Borrower’s option. The assets of the Company secured the loan. The Company had to comply with certain financial covenants per the terms of the agreement.
On July 29, 2004, the Company renewed its Revolving Credit Facility with RBC Centura. The renewal was made on the same terms and conditions set forth in the original Loan Agreement dated July 29, 2003 with the following modifications: the principal amount was decreased from a maximum of $1,000,000 to a maximum of $500,000, no margin formula or certified borrowing base was required for any borrowings under the Line of Credit, and the maturity date was extended to July 27, 2005.
The weighted average interest rate for 2004 was 5.03%. The Company repaid its $500,000 of borrowings under the line of credit in full on December 30, 2004 and, on March 1, 2005, cancelled the Revolving Credit Facility. The Company currently carries no debt.
| 9. | SHAREHOLDERS’ EQUITY |
Preferred Stock
During June 2004, the Company issued 7,000 shares of Series D Convertible Preferred Stock in a private placement. The Company received $700,000 in gross proceeds and incurred approximately $22,000 in expenses related to this series. The Preferred Stock has voting rights and accumulates dividends at an annual rate of 9%, payable monthly in cash or shares of common stock, and is convertible at the holder’s option into Common Stock of the Company at any time after June 15, 2005, at a conversion rate of $3.00 per share of Common Stock. The Series D Convertible Preferred Stock has a liquidation preference of $100 per share plus all accrued and unpaid dividends but ranks junior to the Company’s Series A Convertible Preferred, Series B Convertible Preferred Stock and Series C Convertible Preferred Stock with respect to payment upon liquidation and dividends. One Series D Convertible Preferred Stock shareholder converted 300 preferred shares into 10,000 shares of common stock during 2006. At December 31, 2006, there were 6,700 shares of Series D Preferred Stock outstanding and $5,025 of dividends payable related to this series. Net loss applicable to common shareholders included a year to date charge of approximately $60,000 and $63,000 in dividends related to the Series D Convertible Preferred Stock for the years ended December 31, 2006 and 2005, respectively.
38
In September 2001, 16,667 shares of the Company’s Series C Convertible Preferred Stock were issued. The Series C Preferred Stock has voting rights and accumulates dividends at a rate of 9% payable in cash monthly and are convertible into Common Stock of the Company anytime at a conversion rate of $1.80 per share of Common Stock. The Preferred Stock has a liquidation preference of $75 per share plus all accrued and unpaid dividends. The Company incurred $119,000 in legal fees and cost related to the special proxy mailing associated with this series. These costs were netted from the proceeds received for the stock. In 2003, 2,000 shares of this series were converted to 83,333 shares of Common Stock and in 2002, 4,667 shares of this series were converted to 194,458 shares of Common Stock pursuant to the original terms of the Preferred Stock. At December 31, 2006, there were 10,000 shares of Series C Preferred Stock outstanding and $5,625 of dividends payable related to this series. Net income/(loss) applicable to common shareholders included a year to date charge of approximately $68,000 per year in dividends related to the Series C Convertible Preferred Stock for each of the three years ended December 31, 2006.
In November 2000, the Company issued 7,020 shares of Series B Convertible Preferred Stock in a private placement. The Company received $702,000 in November 2000 related to this series. The Series B Convertible Preferred Stock has voting rights and accumulates dividends at a rate of 9% payable in cash monthly, effective January 2002, and is convertible into Common Stock of the Company, at a conversion rate of $8.10 per share of Common Stock. The Preferred Stock has a liquidation preference of $100 per share plus all accrued and unpaid dividends but ranks junior to the Company’s Series A Convertible Preferred Stock and Series C Convertible Preferred Stock with respect to payment upon liquidation and dividends. At December 31, 2006, there were 7,020 shares of Series B Preferred Stock outstanding and $5,265 in dividends payable related to this series. Net income/(loss) applicable to common shareholders included a year to date charge of approximately $63,000 per year in dividends related to the Series B Convertible Preferred Stock for each of the three years ended December 31, 2006.
During the second quarter of 1999, the Company issued 20,000 shares of Series A Convertible Preferred Stock in a private placement. The Company received $2,000,000 related to this series. The Series A Convertible Preferred Stock has voting rights and accumulates dividends at a rate of 9% payable in cash monthly, effective January 2002, and is convertible into Common Stock of the Company, at a conversion rate of $6.18 per share of Common Stock. The Preferred Stock has a liquidation preference of $100 per share plus all accrued and unpaid dividends but ranks junior to the Company’s Series C Convertible Preferred Stock with respect to payment upon liquidation and dividends. During 2000, 10,000 shares of this series were converted to 161,812 shares of Common Stock pursuant to the original terms of the Preferred Stock. At December 31, 2006, there were 10,000 shares of Series A Convertible Preferred Stock outstanding and $7,500 dividends payable related to this series. Net income/(loss) applicable to common shareholders included a year to date charge of $90,000 per year in dividends related to the Series A Convertible Preferred Stock for each of the three years ended December 31, 2006.
| 10. | INCOME TAXES |
Income tax amounts are presented based on continuing operations.
The components of the provision/(benefit) for income taxes are as follows (in thousands):
Year ended December 31, | ||||||||||
2006 | 2005 | 2004 | ||||||||
| Current | $ | — | $ | — | $ | — | ||||
| Deferred | 39 | 329 | (941 | ) | ||||||
| Change in valuation allowance | (39 | ) | (329 | ) | 941 | |||||
| $ | — | $ | — | $ | — | |||||
39
The difference between the provision for income taxes at the approximate statutory income tax rate of 34% and the Company’s effective tax rate is as follows:
Year ended December 31, | ||||||||||
2006 | 2005 | 2004 | ||||||||
| Statutory income taxes | 34.0 | % | -34.0 | % | -34.0 | % | ||||
| State income taxes | 4.0 | % | -4.0 | % | -4.0 | % | ||||
| Change in valuation allowance | -38.0 | % | 38.0 | % | 38.0 | % | ||||
| 0.0 | % | 0.0 | % | 0.0 | % | |||||
At December 31, 2006 and 2005, deferred tax (assets) liabilities are comprised of the following (in thousands):
December 31, | |||||||
2006 | 2005 | ||||||
| Gross deferred tax liabilities | |||||||
| Capitalization of software development costs | $ | — | $ | 124 | |||
| Depreciation | — | 91 | |||||
| Other | — | — | |||||
| — | 215 | ||||||
| Gross deferred tax assets | |||||||
| Net operating loss carryforwards | (9,743 | ) | (10,001 | ) | |||
| Tax credit carryforwards | (93 | ) | (83 | ) | |||
| Allowance for doubtful accounts receivable | (8 | ) | (14 | ) | |||
| (9,844 | ) | (10,098 | ) | ||||
| Valuation allowance | 9,844 | 9,883 | |||||
| — | (215 | ) | |||||
| Net deferred tax assets | $ | — | $ | — | |||
Included in the deferred tax assets above are general business tax credit carryforwards of approximately $245,000 which will expire in years 2008 through 2011, and U.S. net operating loss carryforwards of approximately $25,600,000 which expire in years 2009 through 2019.
SFAS No. 109 specifies that deferred tax assets are to be reduced by a valuation allowance if it is more likely than not that some portion or all of the deferred tax assets will not be realized. A valuation allowance has been provided for those net operating loss carryforwards and foreign tax credits which are deemed more likely than note to expire before they are utilized. Management’s estimate of the valuation allowance could be affected in the near term based on results of operations in future periods.
| 11. | STOCK COMPENSATION PLANS |
In February of 1993, the Board of Directors adopted a Stock Option Plan (the “Option Plan”). In May of 2005, the shareholders of Firstwave approved the 2005 Stock Incentive Plan for the Company (the “Incentive Plan”). The Incentive Plan permits the grant and issuance of both incentive and non-qualified stock options to purchase Common Stock, restricted stock awards, restricted stock units and stock appreciation rights to directors, officers and employees of the Company (the “Awards”). The total number of shares that may be issued pursuant to the Incentive Plan shall not exceed 300,000 shares plus all shares that were reserved for issuance under the Option Plan which had not been issued. Accordingly, the Incentive Plan provides for the grant of Awards representing up to 816,667 shares of Common Stock. Pursuant to the terms of the Incentive Plan, the Compensation Committee of the Board of Directors is authorized to make stock compensation grants to employees and directors of the Company who are eligible to receive such grants under the Incentive Plan. The Compensation Committee is further authorized to establish the grant or exercise price, which for incentive stock options will be equal to the fair market value of the stock at the date of grant. Options generally vest over a three or four year period from date of grant. Options expire ten years after the date of grant.
40
At December 31, 2006, 310,841 options were available for grant and 556,919 options were outstanding related to the Incentive Plan.
A summary of stock option activity is as follows:
Shares | Exercise Price Per Share | Weighted Avg Exercise Price | Weighted Average Fair Value | ||||||||||
| Outstanding at December 31, 2003 | 384,829 | $ | 1.32 – 16.50 | $ | 8.21 | ||||||||
| Granted | 312,000 | 2.24 – 5.59 | 3.81 | $ | 3.23 | ||||||||
| Exercised | (2,292 | ) | 1.38 – 4.05 | 2.11 | |||||||||
| Canceled or expired | (114,925 | ) | 1.38 – 15.92 | 7.39 | |||||||||
| Outstanding at December 31, 2004 | 579,612 | 1.32 – 16.50 | 6.02 | ||||||||||
| Granted | 207,500 | 1.47 – 1.71 | 1.53 | 1.53 | |||||||||
| Exercised | (16,051 | ) | 1.58 – 2.72 | 2.18 | |||||||||
| Canceled or expired | (437,475 | ) | 1.38 – 15.92 | 6.32 | |||||||||
| Outstanding at December 31, 2005 | 333,586 | 1.32 – 16.50 | 3.02 | ||||||||||
| Granted | 317,000 | 1.95 – 2.18 | 2.16 | 1.91 | |||||||||
| Exercised | (64,167 | ) | 1.81 – 2.00 | 1.48 | |||||||||
| Canceled or expired | (29,500 | ) | 1.98 – 11.77 | 2.75 | |||||||||
| Outstanding at December 31, 2006 | 556,919 | 1.47 – 16.50 | 2.72 | ||||||||||
A summary of the nonvested option activity with changes during the year is as follows:
Nonvested Shares | Shares | Weighted- Average Grant Date Fair Value | |||||
| Nonvested at January 1, 2006 | — | — | |||||
| Granted | 317,000 | 1.91 | |||||
| Vested | — | — | |||||
| Forfeited or expired | 28,000 | 1.80 | |||||
| Nonvested at December 31, 2006 | 289,000 | 1.92 | |||||
The total intrinsic value of options exercised during the years ended December 31, 2006, 2005 and 2004 was $29,235, $4,273, and $5,767, respectively.
In the second quarter of 2005, the Board of Directors of the Company voted to immediately vest all outstanding nonvested options held by employees and directors of the Company. The Company would have had to record significant non-monetary compensation expense once SFAS 123(R) was adopted in 2006 which was avoided by the Company’s decision.
41
The following table summarizes information about stock options outstanding at December 31, 2006:
Options Outstanding | Options Exercisable | ||||||||||||||||||
Number Outstanding at December 31, 2006 | Weighted Average Remaining Contractual Life (years) | Weighted Average Exercise Price | Number Outstanding at December 31, 2006 | Weighted Average Remaining Contractual Life (years) | Weighted Average Exercise Price | ||||||||||||||
| $ 1.47 - $ 1.47 | 105,000 | 8.79 | $ | 1.47 | 105,000 | 8.79 | 1.47 | ||||||||||||
| $ 1.51 - $ 2.14 | 34,417 | 8.24 | 1.83 | 12,417 | 7.07 | 1.67 | |||||||||||||
| $ 2.16 - $ 2.16 | 57,500 | 9.56 | 2.16 | 0 | — | — | |||||||||||||
| $ 2.18 - $ 2.18 | 210,000 | 9.80 | 2.18 | 0 | — | — | |||||||||||||
| $ 2.24 - $ 2.24 | 500 | 7.35 | 2.24 | 500 | 7.35 | 2.24 | |||||||||||||
| $ 2.84 - $ 2.84 | 100,000 | 7.43 | 2.84 | 100,000 | 7.43 | 2.84 | |||||||||||||
| $ 5.50 - $ 8.47 | 39,168 | 4.85 | 6.72 | 39,168 | 4.85 | 6.72 | |||||||||||||
| $ 9.28 - $ 9.28 | 1,667 | 5.35 | 9.28 | 1,667 | 5.35 | 9.28 | |||||||||||||
| $15.00 - $15.00 | 1,667 | 3.35 | 15.00 | 1,667 | 3.35 | 15.00 | |||||||||||||
| $16.50 - $16.50 | 7,000 | 6.06 | 16.50 | 7,000 | 6.06 | 16.50 | |||||||||||||
| $ 1.47 - $16.50 | 556,919 | 7.96 | $ | 3.71 | 267,419 | 6.67 | $ | 4.89 | |||||||||||
A summary of the status of all nonvested shares as of December 31, 2006, and changes during the year ended is presented below:
Options | Shares | Weighted- Avg Exercise Price ($) | Weighted- Avg Remaining Contractual Term | Aggregate Intrinsic Value | |||||||||
| Outstanding at January 1, 2006 | 334,000 | 3.02 | 8.40 | 48,000 | |||||||||
| Granted | 317,000 | 2.14 | 9.64 | 51,000 | |||||||||
| Exercised | 64,000 | 1.49 | 7.99 | 29,000 | |||||||||
| Forfeited or expired | 30,000 | 4.52 | 8.67 | 6,000 | |||||||||
| Outstanding at December 31, 2006 | 557,000 | 3.71 | 7.96 | 142,000 | |||||||||
| Exercisable at December 31, 2006 | 267,000 | 4.89 | 6.67 | 97,000 | |||||||||
| 12. | COMMITMENTS AND CONTINGENCIES |
As of December 31, 2006, the Company’s headquarters and principal operations were located in office space under a sublease with M-1 Global in metropolitan Atlanta, Georgia. The sublease expires on June 30, 2007. The total amount of base rent (at $10.00 per square foot per year, effective beginning November 2006) is recorded as rent expense. At December 31, 2006, the Company’s material future rental commitments were approximately $13,000. Net rent expense under this and previous agreements were approximately $5,072, $196,000, and $628,000, for the years ended December 31, 2006, 2005 and 2004, respectively. For 2006, rent for the subleased space was $1.00 per square foot until November of 2006 when it increased to $10.00 per square foot.
Rent expense for 2005 was reduced from 2004 levels primarily due to the Company’s evaluation of its future lease commitments in its Atlanta, Georgia office during 2004. The Company determined that it was not using a portion of its leased office space and that such space would provide no economic benefit for the remaining term of the lease. In accordance with SFAS No. 146, the Company accrued $153,000 representing the remaining rent expense relating to the 9,995 square feet ($218,000) net of estimated potential sublease rental income ($65,000).
On October 10, 2005, the Company entered into a three-year OEM/Outsourcing Agreement with M1 Global Solutions, Inc. (“M1 Global”), an Atlanta-based technology company. M1 Global has licensed the Firstwave CRM database schema to develop its future products, and is a non-exclusive reseller of Firstwave products. Although the agreements included the outsourcing of Firstwave’s Professional Services and Support functions to M1 Global, Firstwave is currently providing its own coverage in those areas and no longer pays M1 Global for these services. During the first six months of 2006, M1 Global handled most of the maintenance services for our customers in exchange for a quarterly fee. Since July of 2006, we have hired additional personnel for customer support and the services provided by M1 Global have been reduced. The quarterly fees to M1 Global were approximately $90,000 in the third quarter and $78,000 in the fourth quarter of 2006. For 2007, there have been no fees paid or payable to M1Global through March 31, 2007.
42
The Company may be subject to legal proceedings and claims, which may arise, in the ordinary course of its business. In the opinion of management, the amount of the ultimate liability with respect to these actions will not materially effect the financial position of the Company.
| 13. | EMPLOYEE BENEFIT PLANS |
401(k) Plan
Effective August 1, 1990 the Company established a defined contribution plan (the “401(k) Plan”) which qualifies under Section 401(k) of the Internal Revenue Code for the benefit of eligible employees and their beneficiaries. Employees may elect to contribute to the 401(k) Plan, subject to Internal Revenue Service annual contribution limits. For each payroll period, the Company matches 30% of the lesser of (1) the participants’ contribution or (2) 7.5% of the participants’ compensation. In addition, the Company may make discretionary annual contributions. For the years ended December 31, 2006, 2005, and 2004, the Company made matching contributions of approximately $11,374, $32,000, and $46,500, respectively, to the 401(k) Plan and no discretionary contributions were made.
Employee Stock Purchase Plan
The Company has reserved 40,000 shares of common stock for issuance under its Employee Stock Purchase Plan (“ESPP”), which was effective January 31, 1995. The ESPP was designed to qualify as an employee stock purchase plan under Section 423 of the Internal Revenue Code. The ESPP provides that eligible employees may contribute up to 10% of their base earnings each quarter for an option to purchase the Company’s common stock. Effective April 1, 1998, the exercise price is 85% of the fair market value of the common stock on the last business day of each quarter. No compensation expense is recorded in connection with this plan. During 2006, no shares were issued under the ESPP. In 2005, 1,547 shares were issued under the ESPP. At December 31, 2006, 24,596 shares had been issued cumulatively under the plan, and there were no options to purchase outstanding. There was no activity in the plan in 2006. Shares purchased in 2005 and 2004, respectively, were 1,029 and 1,180.
| 14. | SEGMENT INFORMATION |
Management believes that the Company has only a single segment consisting of software sales with related services and support. The information presented in the consolidated statement of operations reflects the revenues and costs associated with this segment that management uses to make operating decisions and assess performance.
| 15. | RELATED PARTY TRANSACTIONS |
The Chairman and Chief Executive Officer of the Company is paid $16,875 monthly for dividends related to his $2,250,000 investment in Series A Convertible Preferred Stock, Series B Convertible Preferred Stock, and Series C Convertible Preferred Stock. He was paid $202,500 annually in dividends during 2006, 2005, and 2004, and $16,875 was accrued but not paid at December 31, 2006 and 2005.
The former President and Chief Operating Officer of the Company participated in the Series D Convertible Preferred Stock series during June 2004 purchasing 300 shares of Series D Convertible Preferred Stock for a total investment of $30,000. He was paid monthly dividends of $225, with approximately $1,250 paid during 2006 and $2,700 paid during 2005. He converted his shares during 2006 and no longer is paid dividends. In addition, he is the current General Manager of First Sports, the buyer of the Company’s UK Subsidiary detailed in Item 8, Note 4, “Discontinued Operations.”
| ITEM 9. | CHANGES IN AND DISAGREEMENTS WITH ACCOUNTANTS ON ACCOUNTING AND FINANCIAL DISCLOSURE |
None
43
| ITEM 9A. | CONTROLS AND PROCEDURES |
Evaluation of disclosure controls and procedures
Based on their most recent evaluation, which was completed in consultation with management within 90 days of the filing of this Form 10-K, the Company’s Chairman, Chief Executive Officer, and Principal Accounting Officer believes the design and operation of the Company’s disclosure controls and procedures (as defined in Rules 13a-15(e) and 15d-15(e) promulgated under the Securities Exchange Act of 1934, as amended (the “Exchange Act”)) were effective as of the date of such evaluation in timely alerting the Company’s management to material information required to be included in this Form 10-K and other Exchange Act filings.
Changes in internal controls
There were no significant changes (including corrective actions with regard to significant deficiencies or material weaknesses) in the Company’s internal controls or other factors that could significantly affect these controls subsequent to the date of the evaluation described above.
| ITEM 9B. | OTHER INFORMATION |
None
44
PART III
| ITEM 10. | DIRECTORS AND EXECUTIVE OFFICERS OF THE REGISTRANT |
The information required by this item is incorporated by reference to information under the captions “Corporate Governance and Board Matters,” “Proposal 1 – Election of Directors,” “Executive Officers,” and “Section 16(A) Beneficial Ownership Reporting Compliance” of the Company’s Proxy Statement for the 2007 Annual Meeting of Shareholders.
Code of Ethics
The Company has adopted a Code of Business Conduct and Ethics that applies to all of our directors, officers, and employees. The Code of Business Conduct and Ethics is posted on the Company’s web site at www.firstwave.net under the caption “Codes and Charters” under “Investor Relations.”
| ITEM 11. | EXECUTIVE COMPENSATION |
The information required by this item is incorporated by reference to information under the captions “Corporate Governance and Board Matters,” “Proposal 1 – Election of Directors,” and “Executive Compensation” (excluding the section entitled “Certain Relationships and Related Transactions”) in the Company’s Proxy Statement for the 2007 Annual Meeting of Shareholders.
| ITEM 12. | SECURITY OWNERSHIP OF CERTAIN BENEFICIAL OWNERS AND MANAGEMENT AND RELATED STOCKHOLDER MATTERS |
The information required by this item is incorporated by reference to information under the caption “Beneficial Ownership of Common Stock” in the Company’s Proxy Statement for the 2007 Annual Meeting of Shareholders.
| ITEM 13. | CERTAIN RELATIONSHIPS AND RELATED TRANSACTIONS |
The information required by this item is incorporated by reference to information under the caption “Executive Compensation – Certain Relationship and Related Transactions” in the Company’s Proxy Statement for the 2007 Annual Meeting of Shareholders.
| ITEM14. | PRINCIPAL ACCOUNTING FEES AND SERVICES |
The information required by this item is incorporated by reference to information under the caption “Independent Accountants” in the Company’s Proxy Statement for the 2007 Annual Meeting of Shareholders.
45
PART IV
| ITEM 15. | EXHIBITS AND FINANCIAL STATEMENT SCHEDULES |
| (a) | The following documents are filed as part of this report: | |||
1. | Financial Statements | |||
· | Report of Independent Registered Public Accounting Firm | |||
· | Consolidated Balance Sheet at December 31, 2006 and December 31, 2005 | |||
· | Consolidated Statement of Operations for the three years ended December 31, 2006 | |||
· | Consolidated Statement of Changes in Shareholders’ Equity for the three years ended December 31, 2006 | |||
· | Consolidated Statement of Cash Flows for the three years ended December 31, 2006 | |||
· | Notes to Financial Statements | |||
2. | Exhibits | |||
| 3.1 | Amended and Restated Articles of Incorporation of the Company. (1) | |||
| 3.2 | Amended and Restated By-laws of the Company (incorporated herein by reference to Exhibit 3(b) of the Company’s Registration Statement on Form S-8 (Registration No. 333-55939)). | |||
| 3.3 | Articles of Amendment dated April 26, 1999 setting forth the designation of the Series A Redeemable Preferred Stock. | |||
| 3.4 | Articles of Amendment dated November 15, 2000 setting forth the designation of the Series B Redeemable Preferred Stock. | |||
| 3.5 | Articles of Amendment dated July 18, 2001 setting forth the designation of the Series C Convertible Preferred Stock (4) | |||
| 3.6 | Articles of Amendment dated September 7, 2001 setting forth certain revisions to Series A and Series B Convertible Preferred Stock. (4) | |||
| 3.7 | Articles of Amendment dated September 12, 2001 setting forth the one-for-three reverse stock split. (4) | |||
| 3.8 | Articles of Amendment dated June 11, 2004 setting forth the designation of the Series D Convertible Preferred Stock (5) | |||
| 4.1 | See Exhibits 3.1 and 3.2 for provisions of the Amended and Restated Articles of Incorporation and Amended and Restated By-Laws of the Company defining rights of holders of Common Stock of the Company. | |||
| 4.9 | Second Amendment to the Firstwave Technologies, Inc. 1993 Stock Option Plan (12) | |||
| 4.10 | Third Amendment to the Firstwave Technologies, Inc. 1993 Stock Option Plan | |||
| 4.11 | Fourth Amendment to the Firstwave Technologies, Inc. 1993 Stock Option Plan | |||
| 4.14 | Second Amendment to the Firstwave Technologies, Inc. Employee Stock Purchase Plan | |||
| 4.15 | Third Amendment to the Firstwave Technologies, Inc. Employee Stock Purchase Plan | |||
| 4.16 | Fourth Amendment to the Firstwave Technologies, Inc. Employee Stock Purchase Plan | |||
| 10.1 | Form of Series D Convertible Preferred Stock Purchase Agreement (16) | |||
46
| 10.3 | Lease dated January 30, 1988 between the Company and Atlanta Overlook Associates #3 concerning the Company’s principal offices located at 2859 Paces Ferry Road, Atlanta, GA, as amended by that certain First Amendment of Office Building Lease dated as of December 27, 1988 and as further amended by that certain Second Amendment of Office Building Lease dated as of October 2, 1989. (1) | |||
| 10.4 | Firstwave Technologies, Inc. Amended and Restated 1993 Stock Option Plan (incorporated herein by reference to Exhibit 4(a) of the Company’s Registration Statement on Form S-8 (Registration No. 333-55939)). (7) | |||
| 10.5 | Tax Indemnification Agreement dated February 4, 1993 among the Company and certain of its shareholders.(2) | |||
| 10.6 | Form of Selective Distribution Agreement for International Distributors. (1) | |||
| 10.7 | Form of Software License Agreement. (1) | |||
| 10.9 | Computer Software License Marketing Agreement dated December 21, 1987 between the Company and Co-Cam Computer Services, Pty. Ltd. (1) | |||
| 10.10 | Third Amendment to Lease Agreement dated as of March 10, 1993 between the Company and State of California Public Employees Retirement System relating to the Company’s principal offices located at 2859 Paces Ferry Road, Atlanta, GA.(2) | |||
| 10.11 | Fourth Amendment to Lease Agreement dated as of June 24, 1993 between the Company and State of California Public Employees Retirement System relating to the Company’s principal offices located at 2859 Paces Ferry Road, Atlanta, GA.(2) | |||
| 10.12 | Fifth Amendment to Lease Agreement dated as of March 22, 1994 between the Company and State of California Public Employees Retirement System relating to the Company’s principal offices located at 2859 Paces Ferry Road, Atlanta, GA.(2) | |||
| 10.13 | Sixth Amendment to Lease Agreement dated as of September 22, 1994 between the Company and State of California Public Employees Retirement System relating to the Company’s principal offices located at 2859 Paces Ferry Road, Atlanta, GA.(3) | |||
| 10.14 | Firstwave Technologies, Inc. Employee Stock Purchase Plan. (incorporated herein by reference to Exhibit 4(a) of the Company’s Registration Statement on Form S-8 (Registration No. 333-55971) (7) | |||
| 10.17 | Seventh Amendment to Lease Agreement dated as of January 20, 1998 between the Company and State of California Public Employees Retirement System relating to the Company’s principal offices located at 2859 Paces Ferry Road, Atlanta, GA.(6) | |||
| 10.18 | Eighth Amendment to Lease Agreement dated as of May 8, 1998 between the Company and State of California Public Employees Retirement System relating to the Company’s principal offices located at 2859 Paces Ferry Road, Atlanta, GA. (5) | |||
| 10.19 | First Amendment to Firstwave Technologies, Inc. 1993 Stock Option Plan (incorporated herein by reference to Exhibit 4(c) of the Company’s Registration Statement on Form S-8 (Registration No. 333-55939)). (7) | |||
| 10.20 | First Amendment to Firstwave Technologies, Inc. Employee Stock Purchase Plan (incorporated herein by reference to Exhibit 4(b) of the Company’s Registration Statement on Form S-8 (Registration No. 333-55971)). (7) | |||
| 10.21 | Board of Directors Compensation Plan (incorporated herein by reference to Exhibit 4(b) of the Company’s Registration Statement on Form S-8 (Registration No. 333-55939)). (7) | |||
| 10.22 | Ninth Amendment to Lease Agreement dated as of February 3, 2000 between the Company and National Office Partners Limited Partnership relating to the Company’s principal offices located at 2859 Paces Ferry Road, Atlanta, GA.(8) |
47
| 10.23 | Tenth Amendment to Lease Agreement dated as of February 28, 2000 between the Company and National Office Partners Limited Partnership relating to the Company’s principal offices located at 2859 Paces Ferry Road, Atlanta, GA. (8) | |||
| 10.24 | Certificate of Designation of Series C Convertible Preferred Stock. (4) | |||
| 10.25 | Registration Rights Agreement dated July 18, 2001 between the Company and Mercury Fund No.1 LTD and Mercury Fund II, LTD. (4) | |||
| 10.26 | Eleventh Amendment to Lease Agreement dated as of October 28, 2002 between the Company and National Office Partners Limited Partnership relating to the Company’s principal offices located at 2859 Paces Ferry Road, Atlanta, GA. (9) | |||
| 10.27 | Software License Agreement dated July 25, 2001, by and between Firstwave Technologies U.K. Limited and Electronic Data Systems Ltd. (10) | |||
| 10.28 | Software Development and License Agreement dated December 23, 2002, by and between The Football Association Limited and Firstwave Technologies U.K. Ltd. (10)(11) | |||
| 10.29 | Software License Agreement dated September 2, 2002, between The Football Association and Firstwave Technologies U.K. Limited. (10) | |||
| 10.30 | Letter Amendment dated February 10, 2004 amending the Software Development and License Agreement dated December 23, 2002, by and between the Football Association Limited and Firstwave Technologies U.K. Ltd.(14) | |||
| 10.31 | Secured Loan Agreement in the amount of up to $1,000,000 dated July 29, 2003 by the Company in favor of RBC Centura (13) | |||
| 10.32 | Commercial Promissory Note in the amount of up to $1,000,000 dated July 29, 2003 by the Company in favor of RBC Centura (13) | |||
| 10.33 | Waiver and First Amendment to Secured Loan Agreement dated July 29, 2003, by the Company in favor of RBC Centura (14) | |||
| 10.34 | Second Amendment of Loan Agreement and Revolving Line of Credit Note by and between Firstwave Technologies, Inc. and RBC Centura Bank. (15) | |||
| 10.35 | Company 2005 Stock Incentive Plan (19) | |||
| 10.36 | License Agreement dated September 30, 2005 between the Company and M1 Global Solutions, Inc. (20) | |||
| 10.37 | OEM/Outsourcing Agreement dated October 10, 2005 between the Company and M1 Global Solutions, Inc. (20) | |||
| 10.38 | Stock Purchase Agreement dated June 3, 2005 between the Company and AllAboutTickets, LLC. (21) | |||
| 10.39 | License Agreement dated June 3, 2005 between the Company, Firstwave Technologies UK Ltd, and AllAboutTickets, LLC. (21) | |||
| 10.40 | Sublease Agreement dated October 24, 2005 between the Company and M1 Global Solutions, Inc. (22) | |||
| 10.41 | Intellectual Property Assignment Agreement dated May 5, 2006, between the Company and Galactus Software, LLP(23) | |||
| 14.1 | Firstwave Technologies, Inc. Code of Business Conduct and Ethics (17) |
48
| 21.1 | Subsidiaries of the Company. | |||
| 23.1 | Consent of Independent Registered Public Accounting Firm | |||
| 31.1 | Certification pursuant to Section 302 of the Sarbanes-Oxley Act of 2002 | |||
| 32 | Certification pursuant to Section 906 of the Sarbanes-Oxley Act of 2002 |
| (1) | Incorporated herein by reference to exhibit of the same number in the Company’s Registration Statement on Form S-1 (Registration No. 33-57984). |
| (2) | Incorporated herein by reference to exhibit of the same number in the Company’s Form 10-K for the year ended December 31, 1993. |
| (3) | Incorporated herein by reference to exhibit of the same number in the Company’s Form 10-K for the year ended December 31, 1994. |
| (4) | Incorporated by reference to exhibits of the Company’s Definitive Proxy Statement dated August 17, 2001 for special meeting of Shareholders held on September 7, 2001. |
| (5) | Incorporated by reference to Exhibit 3.1 of the Company’s current report on Form 8-K filed with the Commission on June 18, 2004. |
| (6) | Incorporated herein by reference to exhibit of the same number in the Company’s Form 10-K for the year ended December 31, 1998. |
| (7) | Incorporated herein by reference to exhibit of the same number in the Company’s Form 10-K for the year ended December 31, 1997. |
| (8) | Management contract or compensatory plan or arrangement required to be filed pursuant to Item 14(c) of Form 10-K. |
| (9) | Incorporated herein by reference to exhibit of the same number in the Company’s Form 10-K for the year ended December 31, 1999. |
| (10) | not used |
| (11) | Incorporated herein by reference to exhibits attached to the Company’s Registration Statement on Form S-3 filed with the Commission March 18, 2003. |
| (12) | Confidential treatment has been requested with respect to portions of this document pursuant to Rule 406 of the Securities Act. The redacted portions of this document were filed separately with the Securities and Exchange Commission. |
| (13) | Incorporated herein by reference to exhibits attached to the Company’s Registration Statement on Form S-8 filed with the Commission February 9, 2004. |
| (14) | Incorporated herein by reference to exhibits attached to the Company’s Form 10-Q for the quarter ended September 30, 2003. |
| (15) | Incorporated herein by reference to exhibits attached to the Company’s Form 10-Q for the quarter ended March 31, 2004. |
| (16) | Incorporated herein by reference to exhibits attached to the Company’s Form 10-Q for the quarter ended June 30, 2004. |
| (17) | Incorporated herein by reference to exhibits attached to the Company’s Current Report on Form 8-K filed with the Commission on June 14, 2004. |
| (18) | Incorporated herein by reference to exhibit of the same number in the Company’s Form 10-K for the year ended December 31, 2003. |
| (19) | Incorporated herein by reference to Annex A filed as part of the Company’s Definitive Proxy Statement dated May 6, 2005 for Special Meeting of Shareholders held on May 31, 2005. |
| (20) | Incorporated herein by reference to exhibits attached to the Company’s current report on Form 8-K filed with the Commission on October 14, 2005. |
| (21) | Incorporated herein by reference to exhibits attached to the Company’s current report on Form 8-K filed with the Commission on June 9, 2005. |
| (23) | Incorporated herein by reference to exhibits attached to the Company’s current report on Form 8-K filed with the Commission on May 5, 2006. |
49
Pursuant to the requirements of Section 13 or 15(d) of the Securities Exchange Act of 1934, the Registrant has duly caused this report to be signed on its behalf by the undersigned, thereunto duly authorized.
| FIRSTWAVE TECHNOLOGIES, INC. | ||
| | | |
| Date: March 30, 2007 | By: | /s/ RICHARD T. BROCK |
| Richard T. Brock Chairman and Chief Executive Officer | ||
Pursuant to the requirements of the Securities Exchange Act of 1934, this report has been signed below by the following persons on behalf of the Registrant and in the capacities and on the dates indicated.
Signature | Title | Date | ||
| /s/ RICHARD T. BROCK | Chairman and Chief Executive Officer | Date: March 30, 2007 | ||
| Richard T. Brock | (Principal Executive Officer) | |||
| /s/ ROGER A. BABB | Lead Director | Date: March 30, 2007 | ||
| Roger A. Babb | ||||
| /s/ I. SIGMUND MOSLEY, JR. | Director | Date: March 30, 2007 | ||
| I. Sigmund Mosley, Jr. | ||||
| /s/ JOHN N. SPENCER, JR | Director | Date: March 30, 2007 | ||
| John N. Spencer, Jr. |
50