UNITED STATES
SECURITIES AND EXCHANGE COMMISSION
Washington, D.C. 20549
FORM N-CSR
CERTIFIED SHAREHOLDER REPORT OF REGISTERED MANAGEMENT
INVESTMENT COMPANIES
Investment Company Act file number | 811- 7512 | |||||
|
| |||||
| Dreyfus Premier Worldwide Growth Fund, Inc. - Dreyfus Worldwide Growth Fund |
| ||||
| (Exact name of Registrant as specified in charter) |
| ||||
|
|
| ||||
|
c/o The Dreyfus Corporation 200 Park Avenue New York, New York 10166 |
| ||||
| (Address of principal executive offices) (Zip code) |
| ||||
|
|
| ||||
| Michael A. Rosenberg, Esq. 200 Park Avenue New York, New York 10166 |
| ||||
| (Name and address of agent for service) |
| ||||
| ||||||
Registrant's telephone number, including area code: | (212) 922-6000 | |||||
|
| |||||
Date of fiscal year end:
| 10/31 |
| ||||
Date of reporting period: | 10/31/10 |
| ||||
| Dreyfus |
| Worldwide Growth Fund |
ANNUAL REPORT October 31, 2010
Save time. Save paper. View your next shareholder report online as soon as it’s available. Log into www.dreyfus.com and sign up for Dreyfus eCommunications. It’s simple and only takes a few minutes.
The views expressed in this report reflect those of the portfolio manager only through the end of the period covered and do not necessarily represent the views of Dreyfus or any other person in the Dreyfus organization. Any such views are subject to change at any time based upon market or other conditions and Dreyfus disclaims any responsibility to update such views.These views may not be relied on as investment advice and, because investment decisions for a Dreyfus fund are based on numerous factors, may not be relied on as an indication of trading intent on behalf of any Dreyfus fund.

Contents | |
THE FUND | |
| 2 | A Letter from the Chairman and CEO |
| 3 | Discussion of Fund Performance |
| 6 | Fund Performance |
| 8 | Understanding Your Fund’s Expenses |
| 8 | Comparing Your Fund’s Expenses With Those of Other Funds |
| 9 | Statement of Investments |
| 11 | Statement of Assets and Liabilities |
| 12 | Statement of Operations |
| 13 | Statement of Changes in Net Assets |
| 16 | Financial Highlights |
| 20 | Notes to Financial Statements |
| 30 | Report of Independent Registered Public Accounting Firm |
| 31 | Important Tax Information |
| 32 | Information About the Review and Approval of the Fund’s Management Agreement |
| 37 | Board Members Information |
| 39 | Officers of the Fund |
FOR MORE INFORMATION | |
Back Cover |
Dreyfus
Worldwide Growth Fund
The Fund

A LETTER FROM THE CHAIRMAN AND CEO
Dear Shareholder:
We are pleased to present this annual report for Dreyfus Worldwide Growth Fund, covering the 12-month period from November 1, 2009, through October 31, 2010.
Although a double-dip recession has recently become an increasingly unlikely scenario in our view, persistent uncertainty regarding the breadth and strength of the U.S. and global economic recoveries led to bouts of heightened volatility for U.S. stocks during most of 2010.The spending power of the U.S. consumer, long an important catalyst for economic growth, has been diminished by concerns over job security and an inability to generate cash from home equity.The second major driver of sustainable growth, corporate investment, has been stunted to a similar extent by tight credit conditions. However, the recent announcement of additional quantitative easing (QE2) measures by the Fed, as well as improved fundamentals across many developing nations, have helped support moderate global economic growth.
Uncertainty will probably remain in the broader financial markets until we see more evidence of robust economic growth, but we remain optimistic regarding the prospects for equities. Many stocks of quality companies with healthy balance sheets, higher credit ratings and strong cash flows appear to be currently priced at a discount.With that, we strongly suggest that you meet with your financial advisor to discuss the potential opportunities which may exist in the global markets, as well as to evaluate your portfolio to help meet your individual investment needs and your future goals relative to your risk-tolerance level.
For information about how the fund performed during the reporting period, as well as general market perspectives, we provide a Discussion of Fund Performance on the pages that follow.
Thank you for your continued confidence and support.
Jonathan R. Baum
Chairman and Chief Executive Officer
The Dreyfus Corporation
November 15, 2010
2

DISCUSSION OF FUND PERFORMANCE
For the period from November 1, 2009, through October 31, 2010, as provided by Fayez Sarofim, Portfolio Manager of Fayez Sarofim & Co., Sub-Investment Adviser
Fund and Market Performance Overview
For the 12-month period ended October 31, 2010, DreyfusWorldwide Growth Fund’s Class A shares produced a total return of 14.48%, Class B shares returned 13.32%, Class C shares returned 13.66% and Class I shares returned 14.82%.1 For the same period, the fund’s benchmark, the Morgan Stanley Capital International World Index (“MSCI World Index”), produced a 12.74% total return.2 Although stocks encountered heightened volatility during the spring of 2010 when investors grew concerned regarding several global economic threats, a rally later in the reporting period erased earlier los ses. The fund produced higher returns than its benchmark, primarily due to its longstanding focus on higher-quality, multinational companies with track records of consistent growth.
Please note, as of November 2, 2010, the fund is being managed by a team of portfolio managers employed by Fayez Sarofim & Co., consisting of Fayez Sarofim, Catherine Crain, Jeff Jacobe, Gentry Lee, Christopher Sarofim and Charles Sheedy.
The Fund’s Investment Approach
The fund invests primarily in large, well-established, multinational companies that we believe are well positioned to weather difficult economic climates and thrive during favorable times. We focus on purchasing large-cap, blue-chip stocks at a price we consider to be justified by a company’s fundamentals.The result is a portfolio of stocks of prominent companies selected for their sustained patterns of profitability, strong balance sheets, expanding global presence and above-average earnings growth potential. The fund pursues a “buy-and-hold” investment strategy in which we typically buy and sell relatively few stocks during the course of the year, which may help to reduce investors’ tax liabilities and the fund’s trading costs.3
Return to Fundamentals in a Slow-Growth Economy
From October 2009 through April 2010, rising manufacturing activity and other evidence of economic recovery drove stocks higher through-
The Fund 3
DISCUSSION OF FUND PERFORMANCE (continued)
out the world. However, investors at the time continued to focus mainly on more speculative stocks, including those that had been severely beaten down during the global recession and financial crisis. In contrast, large, well-established companies continued to lag market averages.
The market’s advance was interrupted in May by renewed economic concerns, including a sovereign debt crisis in Europe and inflationary pressures in China. In the United States, investors became more cautious in light of persistently high unemployment, ongoing troubles in housing markets and the catastrophic oil spill in the Gulf of Mexico. As a result, while many stocks lost ground over the spring and summer, investors became increasingly selective, turning to companies that they believed could maintain earnings growth in a sluggish economy—including the kinds of blue-chip, multinational growth companies in which the fund invests.
Growth investors continued to favor higher-quality companies in the fall, even as global economic concerns waned, and income-oriented investors increasingly turned to dividend-paying stocks in the low interest-rate environment. Strong corporate earnings and improved economic data sparked market rallies that offset previous market weakness.
Sector Allocations and Stock Selections Bolstered Fund Results
The consumer discretionary sector provided the strongest positive contributions to the fund’s relative performance, primarily due to luxury goods seller Christian Dior, which benefited from robust spending among high-net-worth customers even as less affluent consumers continued to watch their budgets carefully.The fund’s sector allocation strategy helped it avoid general weakness in the financials sector amid concerns regarding a stricter regulatory environment and ongoing worries regarding mortgages.
The fund also achieved strong relative performance in the consumer staples sector, where overweighted exposure and strong stock selections produced favorable results among companies with a global presence, solid financial structures, ample dividends and track records of steady revenues. Some of the top performers exhibiting these characteristics included food giant Nestle, and tobacco producers Philip Morris International and Altria Group.
Disappointments during the reporting period included an overweighted position in the energy sector, which was hurt by fears of a double-dip
4
recession and concerns surrounding the Gulf oil spill. Energy giant Exxon Mobil ranked as the greatest detractor from the fund’s relative performance, as investors reacted negatively to its acquisition of natural gas producer XTO Energy.The fund’s relative performance was further dampened by an underweighted position in the industrials sector, which fared relatively well for the benchmark. Walgreen also undermined the fund’s results, due to sluggish consumer spending and company-specific issues in its pharmacy benefits business. Finally, drug developer Roche Holding lost value when U.S. regulators withheld approval of a new product.
Focused on Secular Growth Opportunities
Although the global economic rebound has been slower than historical averages, we do not expect a return to recession. Slower growth in the United States and Europe is likely to be balanced by more robust growth in other markets.Therefore, in our view, investors are likely to continue to favor large, multinational companies with solid business fundamentals.
During the reporting period, we identified a new growth opportunity in technology giant International Business Machines and added it to the portfolio. Conversely, we eliminated positions in HSBC Holdings, Italian insurer Assicurazioni Generali, General Dynamics, Microsoft and United Technologies.
November 15, 2010
| Equity funds are subject generally to market, market sector, market liquidity, issuer and investment | |
| style risks, among other factors, to varying degrees, all of which are more fully described in the | |
| fund’s prospectus. | |
| 1 | Total return includes reinvestment of dividends and any capital gains paid, and does not take into |
| consideration the maximum initial sales charge in the case of Class A shares, or the applicable | |
| contingent deferred sales charges imposed on redemptions in the case of Class B and Class C | |
| shares. Had these charges been reflected, returns would have been lower. Past performance is no | |
| guarantee of future results. Share price and investment return fluctuate such that upon redemption, | |
| fund shares may be worth more or less than their original cost. | |
| 2 | SOURCE: LIPPER INC. — Reflects reinvestment of net dividends and, where applicable, |
| capital gain distributions.The Morgan Stanley Capital International (MSCI) World Index is an | |
| unmanaged index of global stock market performance, including the United States, Canada, | |
| Europe,Australia, New Zealand and the Far East. Investors cannot invest directly in any index. | |
| 3 | Achieving tax efficiency is not a part of the fund’s investment objective, and there can be no |
| guarantee that the fund will achieve any particular level of taxable distributions in future years. In | |
| periods when the manager has to sell significant amounts of securities (e.g., during periods of | |
| significant net redemptions or changes in index components) the fund can be expected to be less | |
| tax efficient than during periods of more stable market conditions and asset flows. |
The Fund 5
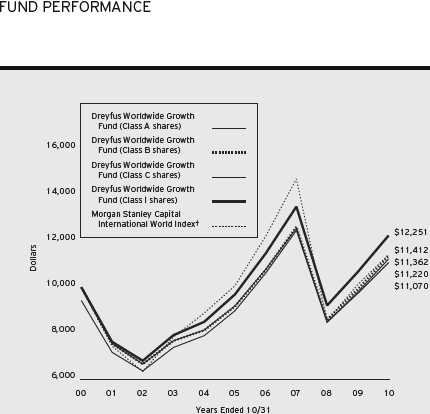
Comparison of change in value of $10,000 investment in Dreyfus Worldwide Growth Fund Class A shares, Class B shares, Class C shares and Class I shares and the Morgan Stanley Capital International World Index
† Source: Lipper Inc.
Past performance is not predictive of future performance.
The above graph compares a $10,000 investment made in each of the Class A, Class B, Class C and Class I shares of Dreyfus Worldwide Growth Fund on 10/31/00 to a $10,000 investment made in the Morgan Stanley Capital International World Index (the “Index”) on that date.All dividends and capital gain distributions are reinvested.
The fund’s performance shown in the line graph takes into account the maximum initial sales charge on Class A shares and all other applicable fees and expenses on all classes. Performance for Class B shares assumes the conversion of Class B shares to Class A shares at the end of the sixth year following the date of purchase.The Index is an unmanaged index of global stock market performance, including the United States, Canada,Australia, New Zealand and the Far East and includes net dividends reinvested. Unlike a mutual fund, the Index is not subject to charges, fees and other expenses. Investors cannot invest directly in any index. Further information relating to fund performance, including expense reimbursements, if applicable, is contained in the Financial Highlights section of the prospectus and elsewhere in this report.
6
| Average Annual Total Returns as of 10/31/10 | |||
| 1 Year | 5 Years | 10 Years | |
| Class A shares | |||
| with maximum sales charge (5.75%) | 7.90% | 3.32% | 1.16% |
| without sales charge | 14.48% | 4.55% | 1.76% |
| Class B shares | |||
| with applicable redemption charge † | 9.32% | 3.26% | 1.29% |
| without redemption | 13.32% | 3.61% | 1.29% |
| Class C shares | |||
| with applicable redemption charge †† | 12.66% | 3.79% | 1.02% |
| without redemption | 13.66% | 3.79% | 1.02% |
| Class I shares | 14.82% | 4.81% | 2.05% |
| Morgan Stanley Capital | |||
| International World Index | 12.74% | 2.54% | 1.33% |
Past performance is not predictive of future performance.The fund’s performance shown in the graph and table does not reflect the deduction of taxes that a shareholder would pay on fund distributions or the redemption of fund shares.
| † | The maximum contingent deferred sales charge for Class B shares is 4%.After six years Class B shares convert to |
| Class A shares. | |
| †† | The maximum contingent deferred sales charge for Class C shares is 1% for shares redeemed within one year of the |
| date of purchase. |
The Fund 7
UNDERSTANDING YOUR FUND’S EXPENSES (Unaudited)
As a mutual fund investor, you pay ongoing expenses, such as management fees and other expenses. Using the information below, you can estimate how these expenses affect your investment and compare them with the expenses of other funds.You also may pay one-time transaction expenses, including sales charges (loads) and redemption fees, which are not shown in this section and would have resulted in higher total expenses. For more information, see your fund’s prospectus or talk to your financial adviser.
Review your fund’s expenses
The table below shows the expenses you would have paid on a $1,000 investment in Dreyfus Worldwide Growth Fund from May 1, 2010 to October 31, 2010. It also shows how much a $1,000 investment would be worth at the close of the period, assuming actual returns and expenses.
Expenses and Value of a $1,000 Investment
assuming actual returns for the six months ended October 31, 2010
| Class A | Class B | Class C | Class I | |
| Expenses paid per $1,000† | $ 6.76 | $ 12.44 | $ 10.57 | $ 4.98 |
| Ending value (after expenses) | $1,079.30 | $1,073.60 | $1,075.50 | $1,081.30 |
COMPARING YOUR FUND’S EXPENSES
WITH THOSE OF OTHER FUNDS (Unaudited)
Using the SEC’s method to compare expenses
The Securities and Exchange Commission (SEC) has established guidelines to help investors assess fund expenses. Per these guidelines, the table below shows your fund’s expenses based on a $1,000 investment, assuming a hypothetical 5% annualized return. You can use this information to compare the ongoing expenses (but not transaction expenses or total cost) of investing in the fund with those of other funds.All mutual fund shareholder reports will provide this information to help you make this comparison. Please note that you cannot use this information to estimate your actual ending account balance and expenses paid during the period.
Expenses and Value of a $1,000 Investment
assuming a hypothetical 5% annualized return for the six months ended October 31, 2010
| Class A | Class B | Class C | Class I | |
| Expenses paid per $1,000† | $ 6.56 | $ 12.08 | $ 10.26 | $ 4.84 |
| Ending value (after expenses) | $1,018.70 | $1,013.21 | $1,015.02 | $1,020.42 |
| † Expenses are equal to the fund’s annualized expense ratio of 1.29% for Class A, 2.38% for Class B, 2.02% for |
| Class C, and .95% for Class I, multiplied by the average account value over the period, multiplied by 184/365 (to |
| reflect the one-half year period). |
8
STATEMENT OF INVESTMENTS
October 31, 2010
| Common Stocks—99.5% | Shares | Value ($) |
| Consumer Discretionary—18.4% | ||
| Christian Dior | 230,000 | 33,276,037 |
| LVMH Moet Hennessy Louis Vuitton | 15,775 | 2,472,219 |
| McDonald’s | 207,800 | 16,160,606 |
| McGraw-Hill | 75,000 | 2,823,750 |
| News, Cl. A | 436,400 | 6,310,344 |
| Procter & Gamble | 313,000 | 19,897,410 |
| 80,940,366 | ||
| Consumer Staples—38.0% | ||
| Altria Group | 552,500 | 14,044,550 |
| Coca-Cola | 403,100 | 24,718,092 |
| Danone, ADR | 722,000 | 9,212,720 |
| Diageo, ADR | 165,000 | 12,210,000 |
| L’Oreal, ADR | 965,000 | 22,667,850 |
| Nestle, ADR | 470,000 | 25,779,500 |
| PepsiCo | 168,175 | 10,981,827 |
| Philip Morris International | 552,500 | 32,321,250 |
| Walgreen | 430,000 | 14,568,400 |
| 166,504,189 | ||
| Energy—20.0% | ||
| Chevron | 263,800 | 21,792,518 |
| ConocoPhillips | 15,000 | 891,000 |
| Exxon Mobil | 411,008 | 27,319,702 |
| Royal Dutch Shell, Cl. A, ADR | 147,000 | 9,544,710 |
| Statoil, ADR | 394,068 | 8,602,504 |
| Total, ADR | 359,016 | 19,559,192 |
| 87,709,626 | ||
| Financial—2.4% | ||
| Eurazeo | 73,152 | 5,559,053 |
| JPMorgan Chase & Co. | 65,100 | 2,449,713 |
| Zurich Financial Services | 10,100 | 2,472,527 |
| 10,481,293 | ||
| Health Care—12.5% | ||
| Abbott Laboratories | 200,300 | 10,279,396 |
| Becton Dickinson & Co. | 15,000 | 1,132,800 |
| Johnson & Johnson | 228,525 | 14,550,187 |
| Novartis, ADR | 7,000 | 405,650 |
The Fund 9
STATEMENT OF INVESTMENTS (continued)
| Common Stocks (continued) | Shares | Value ($) |
| Health Care (continued) | ||
| Novo Nordisk, ADR | 50,000 | 5,240,000 |
| Roche Holding, ADR | 626,000 | 23,005,500 |
| 54,613,533 | ||
| Industrial—.4% | ||
| General Electric | 106,072 | 1,699,273 |
| Information Technology—3.6% | ||
| Apple | 16,000 a | 4,813,920 |
| Intel | 470,941 | 9,451,786 |
| International Business Machines | 11,000 | 1,579,600 |
| 15,845,306 | ||
| Materials—4.2% | ||
| Air Liquide, ADR | 708,300 | 18,309,555 |
| Total Common Stocks | ||
| (cost $208,522,277) | 436,103,141 | |
| Other Investment—.3% | ||
| Registered Investment Company; | ||
| Dreyfus Institutional Preferred | ||
| Plus Money Market Fund | ||
| (cost $1,243,000) | 1,243,000 b | 1,243,000 |
| Total Investments (cost $209,765,277) | 99.8% | 437,346,141 |
| Cash and Receivables (Net) | .2% | 710,849 |
| Net Assets | 100.0% | 438,056,990 |
ADR—American Depository Receipts
| a | Non-income producing security. |
| b | Investment in affiliated money market mutual fund. |
| Portfolio Summary (Unaudited)† | |||
| Value (%) | Value (%) | ||
| Consumer Staples | 38.0 | Information Technology | 3.6 |
| Energy | 20.0 | Financial | 2.4 |
| Consumer Discretionary | 18.4 | Industrial | .4 |
| Health Care | 12.5 | Money Market Investment | .3 |
| Materials | 4.2 | 99.8 | |
| † Based on net assets. | |||
| See notes to financial statements. | |||
10
STATEMENT OF ASSETS AND LIABILITIES
October 31, 2010
| Cost | Value | |||
| Assets ($): | ||||
| Investments in securities—See Statement of Investments: | ||||
| Unaffiliated issuers | 208,522,277 | 436,103,141 | ||
| Affiliated issuers | 1,243,000 | 1,243,000 | ||
| Receivable for investment securities sold | 1,313,553 | |||
| Dividends and interest receivable | 335,623 | |||
| Receivable for shares of Common Stock subscribed | 138,971 | |||
| Prepaid expenses | 47,741 | |||
| 439,182,029 | ||||
| Liabilities ($): | ||||
| Due to The Dreyfus Corporation and affiliates—Note 3(c) | 487,967 | |||
| Cash overdraft due to Custodian | 64,187 | |||
| Payable for shares of Common Stock redeemed | 311,741 | |||
| Accrued expenses | 261,144 | |||
| 1,125,039 | ||||
| Net Assets ($) | 438,056,990 | |||
| Composition of Net Assets ($): | ||||
| Paid-in capital | 197,811,619 | |||
| Accumulated undistributed investment income—net | 3,173,694 | |||
| Accumulated net realized gain (loss) on investments | 9,483,717 | |||
| Accumulated net unrealized appreciation (depreciation) | ||||
| on investments and foreign currency transactions | 227,587,960 | |||
| Net Assets ($) | 438,056,990 | |||
| Net Asset Value Per Share | ||||
| Class A | Class B | Class C | Class I | |
| Net Assets ($) | 378,373,841 | 6,058,991 | 49,806,213 | 3,817,945 |
| Shares Outstanding | 9,385,524 | 158,554 | 1,345,675 | 93,793 |
| Net Asset Value Per Share ($) | 40.31 | 38.21 | 37.01 | 40.71 |
| See notes to financial statements. | ||||
The Fund 11
| STATEMENT OF OPERATIONS | |
| Year Ended October 31, 2010 | |
| Investment Income ($): | |
| Income: | |
| Cash dividends(net of $851,817 foreign taxes withheld at source): | |
| Unaffiliated issuers | 12,631,670 |
| Affiliated issuers | 2,532 |
| Total Income | 12,634,202 |
| Expenses: | |
| Management fee—Note 3(a) | 3,202,067 |
| Shareholder servicing costs—Note 3(c) | 1,884,071 |
| Distribution fees—Note 3(b) | 432,548 |
| Professional fees | 78,110 |
| Custodian fees—Note 3(c) | 72,146 |
| Registration fees | 58,286 |
| Prospectus and shareholders’ reports | 38,953 |
| Directors’ fees and expenses—Note 3(d) | 27,336 |
| Loan commitment fees—Note 2 | 4,693 |
| Miscellaneous | 19,701 |
| Total Expenses | 5,817,911 |
| Less—reduction in fees due to earnings credits—Note 3(c) | (2,965) |
| Net Expenses | 5,814,946 |
| Investment Income—Net | 6,819,256 |
| Realized and Unrealized Gain (Loss) on Investments—Note 4 ($): | |
| Net realized gain (loss) on investments and foreign currency transactions | 9,478,590 |
| Net unrealized appreciation (depreciation) on | |
| investments and foreign currency transactions | 38,907,954 |
| Net Realized and Unrealized Gain (Loss) on Investments | 48,386,544 |
| Net Increase in Net Assets Resulting from Operations | 55,205,800 |
| See notes to financial statements. | |
12
STATEMENT OF CHANGES IN NET ASSETS
| Year Ended October 31, | ||
| 2010 | 2009a | |
| Operations ($): | ||
| Investment income—net | 6,819,256 | 7,866,870 |
| Net realized gain (loss) on investments | 9,478,590 | 10,108,018 |
| Net unrealized appreciation | ||
| (depreciation) on investments | 38,907,954 | 37,638,166 |
| Net Increase (Decrease) in Net Assets | ||
| Resulting from Operations | 55,205,800 | 55,613,054 |
| Dividends to Shareholders from ($): | ||
| Investment income—net: | ||
| Class A Shares | (7,114,471) | (2,245,109) |
| Class B Shares | (81,614) | — |
| Class C Shares | (725,614) | — |
| Class I Shares | (83,147) | (10,223) |
| Class T Shares | — | (3,609) |
| Net realized gain on investments: | ||
| Class A Shares | (7,474,191) | — |
| Class B Shares | (225,266) | — |
| Class C Shares | (1,130,749) | — |
| Class I Shares | (74,573) | — |
| Total Dividends | (16,909,625) | (2,258,941) |
| Capital Stock Transactions ($): | ||
| Net proceeds from shares sold: | ||
| Class A Shares | 20,652,172 | 42,554,927 |
| Class B Shares | 293,773 | 381,509 |
| Class C Shares | 2,402,480 | 2,794,043 |
| Class I Shares | 3,842,950 | 1,024,852 |
| Class T Shares | — | 49,421 |
The Fund 13
STATEMENT OF CHANGES IN NET ASSETS (continued)
| Year Ended October 31, | ||
| 2010 | 2009a | |
| Capital Stock Transactions ($) (continued): | ||
| Dividends reinvested: | ||
| Class A Shares | 12,810,519 | 1,947,328 |
| Class B Shares | 280,120 | — |
| Class C Shares | 1,327,507 | — |
| Class I Shares | 78,192 | 9,998 |
| Class T Shares | — | 3,237 |
| Cost of shares redeemed: | ||
| Class A Shares | (60,960,163) | (77,127,681) |
| Class B Shares | (6,783,595) | (9,022,417) |
| Class C Shares | (10,130,104) | (12,129,269) |
| Class I Shares | (2,304,831) | (662,033) |
| Class T Shares | — | (2,191,385) |
| Increase (Decrease) in Net Assets | ||
| from Capital Stock Transactions | (38,490,980) | (52,367,470) |
| Total Increase (Decrease) in Net Assets | (194,805) | 986,643 |
| Net Assets ($): | ||
| Beginning of Period | 438,251,795 | 437,265,152 |
| End of Period | 438,056,990 | 438,251,795 |
| Undistributed investment income—net | 3,173,694 | 4,371,398 |
14
| Year Ended October 31, | ||
| 2010 | 2009a | |
| Capital Share Transactions: | ||
| Class Ab,c | ||
| Shares sold | 516,273 | 1,402,173 |
| Shares issued for dividends reinvested | 346,137 | 64,054 |
| Shares redeemed | (1,654,944) | (2,555,044) |
| Net Increase (Decrease) in Shares Outstanding | (792,534) | (1,088,817) |
| Class Bb | ||
| Shares sold | 7,138 | 12,500 |
| Shares issued for dividends reinvested | 7,918 | — |
| Shares redeemed | (192,764) | (310,874) |
| Net Increase (Decrease) in Shares Outstanding | (177,708) | (298,374) |
| Class C | ||
| Shares sold | 63,783 | 95,843 |
| Shares issued for dividends reinvested | 38,827 | — |
| Shares redeemed | (298,367) | (427,681) |
| Net Increase (Decrease) in Shares Outstanding | (195,757) | (331,838) |
| Class I | ||
| Shares sold | 101,558 | 34,198 |
| Shares issued for dividends reinvested | 2,098 | 327 |
| Shares redeemed | (62,660) | (19,922) |
| Net Increase (Decrease) in Shares Outstanding | 40,996 | 14,603 |
| Class Tc | ||
| Shares sold | — | 1,617 |
| Shares issued for dividends reinvested | — | 107 |
| Shares redeemed | — | (76,359) |
| Net Increase (Decrease) in Shares Outstanding | — | (74,635) |
| a Effective as of the close of business on February 4, 2009, the fund no longer offers Class T shares. |
| b During the period ended October 31, 2010, 94,483 Class B shares representing $3,332,637, were automatically |
| converted to 89,963 Class A shares and during the period ended October 31, 2009, 132,897 Class B shares |
| representing $3,884,209 were automatically converted to 126,443 Class A shares. |
| c On the close of business on February 4, 2009, 58,490 Class T shares representing $1,663,461 were converted to |
| 58,021 Class A shares. |
See notes to financial statements.
The Fund 15
FINANCIAL HIGHLIGHTS
The following tables describe the performance for each share class for the fiscal periods indicated.All information (except portfolio turnover rate) reflects financial results for a single fund share.Total return shows how much your investment in the fund would have increased (or decreased) during each period, assuming you had reinvested all dividends and distributions.These figures have been derived from the fund’s financial statements.
| Year Ended October 31, | |||||
| Class A Shares | 2010 | 2009 | 2008 | 2007 | 2006 |
| Per Share Data ($): | |||||
| Net asset value, beginning of period | 36.61 | 31.89 | 47.58 | 40.85 | 35.12 |
| Investment Operations: | |||||
| Investment income—neta | .63 | .65 | .60 | .41 | .39 |
| Net realized and unrealized | |||||
| gain (loss) on investments | 4.53 | 4.26 | (15.59) | 6.68 | 5.91 |
| Total from Investment Operations | 5.16 | 4.91 | (14.99) | 7.09 | 6.30 |
| Distributions: | |||||
| Dividends from investment income—net | (.71) | (.19) | (.70) | (.36) | (.57) |
| Dividends from net realized | |||||
| gain on investments | (.75) | — | — | — | — |
| Total Distributions | (1.46) | (.19) | (.70) | (.36) | (.57) |
| Net asset value, end of period | 40.31 | 36.61 | 31.89 | 47.58 | 40.85 |
| Total Return (%)b | 14.48 | 15.50 | (31.93) | 17.47 | 18.16 |
| Ratios/Supplemental Data (%): | |||||
| Ratio of total expenses | |||||
| to average net assets | 1.26 | 1.34 | 1.23 | 1.24 | 1.23 |
| Ratio of net expenses | |||||
| to average net assets | 1.26c | 1.33 | 1.22 | 1.24c | 1.23 |
| Ratio of net investment income | |||||
| to average net assets | 1.70 | 2.08 | 1.41 | .94 | 1.04 |
| Portfolio Turnover Rate | .34 | 3.53 | 3.38 | 1.21 | .30 |
| Net Assets, end of period ($ x 1,000) | 378,374 | 372,623 | 359,328 | 615,183 | 570,586 |
| a | Based on average shares outstanding at each month end. |
| b | Exclusive of sales charge. |
| c | Expense waivers and/or reimbursements amounted to less than .01%. |
See notes to financial statements.
16
| Year Ended October 31, | |||||
| Class B Shares | 2010 | 2009 | 2008 | 2007 | 2006 |
| Per Share Data ($): | |||||
| Net asset value, beginning of period | 34.69 | 30.32 | 45.08 | 38.71 | 33.19 |
| Investment Operations: | |||||
| Investment income—neta | .26 | .34 | .21 | .05 | .08 |
| Net realized and unrealized | |||||
| gain (loss) on investments | 4.28 | 4.03 | (14.83) | 6.32 | 5.60 |
| Total from Investment Operations | 4.54 | 4.37 | (14.62) | 6.37 | 5.68 |
| Distributions: | |||||
| Dividends from investment income—net | (.27) | — | (.14) | — | (.16) |
| Dividends from net realized | |||||
| gain on investments | (.75) | — | — | — | — |
| Total Distributions | (1.02) | — | (.14) | — | (.16) |
| Net asset value, end of period | 38.21 | 34.69 | 30.32 | 45.08 | 38.71 |
| Total Return (%)b | 13.32 | 14.45 | (32.52) | 16.46 | 17.16 |
| Ratios/Supplemental Data (%): | |||||
| Ratio of total expenses | |||||
| to average net assets | 2.24 | 2.30 | 2.10 | 2.09 | 2.08 |
| Ratio of net expenses | |||||
| to average net assets | 2.24c | 2.28 | 2.09 | 2.09c | 2.08 |
| Ratio of net investment income | |||||
| to average net assets | .75 | 1.18 | .53 | .13 | .23 |
| Portfolio Turnover Rate | .34 | 3.53 | 3.38 | 1.21 | .30 |
| Net Assets, end of period ($ x 1,000) | 6,059 | 11,666 | 19,241 | 55,214 | 97,334 |
| a | Based on average shares outstanding at each month end. |
| b | Exclusive of sales charge. |
| c | Expense waivers and/or reimbursements amounted to less than .01% |
See notes to financial statements.
The Fund 17
FINANCIAL HIGHLIGHTS (continued)
| Year Ended October 31, | |||||
| Class C Shares | 2010 | 2009 | 2008 | 2007 | 2006 |
| Per Share Data ($): | |||||
| Net asset value, beginning of period | 33.74 | 29.42 | 43.96 | 38.15 | 32.82 |
| Investment Operations: | |||||
| Investment income—neta | .33 | .39 | .27 | .08 | .11 |
| Net realized and unrealized | |||||
| gain (loss) on investments | 4.17 | 3.93 | (14.42) | 6.20 | 5.53 |
| Total from Investment Operations | 4.50 | 4.32 | (14.15) | 6.28 | 5.64 |
| Distributions: | |||||
| Dividends from investment income—net | (.48) | — | (.39) | (.47) | (.31) |
| Dividends from net realized | |||||
| gain on investments | (.75) | — | — | — | — |
| Total Distributions | (1.23) | — | (.39) | (.47) | (.31) |
| Net asset value, end of period | 37.01 | 33.74 | 29.42 | 43.96 | 38.15 |
| Total Return (%)b | 13.66 | 14.68 | (32.45) | 16.61 | 17.30 |
| Ratios/Supplemental Data (%): | |||||
| Ratio of total expenses | |||||
| to average net assets | 1.99 | 2.07 | 1.95 | 1.97 | 1.96 |
| Ratio of net expenses | |||||
| to average net assets | 1.99c | 2.06 | 1.95 | 1.97c | 1.96 |
| Ratio of net investment income | |||||
| to average net assets | .97 | 1.37 | .68 | .20 | .31 |
| Portfolio Turnover Rate | .34 | 3.53 | 3.38 | 1.21 | .30 |
| Net Assets, end of period ($ x 1,000) | 49,806 | 52,011 | 55,114 | 94,893 | 87,964 |
| a | Based on average shares outstanding at each month end. |
| b | Exclusive of sales charge. |
| c | Expense waivers and/or reimbursements amounted to less than .01% |
See notes to financial statements.
18
| Year Ended October 31, | |||||
| Class I Shares | 2010 | 2009 | 2008 | 2007a | 2006 |
| Per Share Data ($): | |||||
| Net asset value, beginning of period | 36.96 | 32.21 | 48.06 | 41.27 | 35.49 |
| Investment Operations: | |||||
| Investment income—netb | .78 | .80 | .70 | .52 | .42 |
| Net realized and unrealized | |||||
| gain (loss) on investments | 4.55 | 4.24 | (15.74) | 6.75 | 6.01 |
| Total from Investment Operations | 5.33 | 5.04 | (15.04) | 7.27 | 6.43 |
| Distributions: | |||||
| Dividends from investment income—net | (.83) | (.29) | (.81) | (.48) | (.65) |
| Dividends from net realized | |||||
| gain on investments | (.75) | — | — | — | — |
| Total Distributions | (1.58) | (.29) | (.81) | (.48) | (.65) |
| Net asset value, end of period | 40.71 | 36.96 | 32.21 | 48.06 | 41.27 |
| Total Return (%) | 14.82 | 15.84 | (31.79) | 17.76 | 18.35 |
| Ratios/Supplemental Data (%): | |||||
| Ratio of total expenses | |||||
| to average net assets | .98 | 1.08 | .98 | .98 | 1.06 |
| Ratio of net expenses | |||||
| to average net assets | .98c | 1.06 | .98c | .98c | 1.06 |
| Ratio of net investment income | |||||
| to average net assets | 2.03 | 2.47 | 1.66 | 1.17 | 1.19 |
| Portfolio Turnover Rate | .34 | 3.53 | 3.38 | 1.21 | .30 |
| Net Assets, end of period ($ x 1,000) | 3,818 | 1,951 | 1,230 | 1,909 | 1,825 |
| a | Effective June 1, 2007, Class R share were redesignated as Class I shares. |
| b | Based on average shares outstanding at each month end. |
| c | Expense waivers and/or reimbursements amounted to less than .01% |
See notes to financial statements.
The Fund 19
NOTES TO FINANCIAL STATEMENTS
NOTE 1—Significant Accounting Policies:
Dreyfus Worldwide Growth Fund (the “fund”) is the sole series of Dreyfus Premier Worldwide Growth Fund, Inc. (the “Company”), which is registered under the Investment Company Act of 1940, as amended (the “Act”), as a diversified open-end management investment company.The fund’s investment objective is to seek long-term capital appreciation consistent with the preservation of capital; current income is a secondary goal.The Dreyfus Corporation (the “Manager” or “Dreyfus”), a wholly owned subsidiary of The Bank of New York Mellon Corporation (“BNY Mellon”), serves as the fund’s investment adviser. Fayez Sarofim & Co. (“Sarofim & Co.”) serves as the fund’s sub-investment adviser.
MBSC Securities Corporation (the “Distributor”), a wholly-owned subsidiary of Dreyfus, is the distributor of the fund’s shares.The fund is authorized to issue 100 million shares of $.001 par value Common Stock in each of the following classes of shares: Class A, Class B, Class C and Class I. Class A shares are subject to a sales charge imposed at the time of purchase. Class B shares are subject to a contingent deferred sales charge (“CDSC”) imposed on Class B share redemptions made within six years of purchase and automatically convert to Class A shares after six years. The fund no longer offers Class B shares, except in connection with dividend reinvestment and permitted exchanges of Class B shares. Class C shares are subject to a CDSC on Class C shares redeemed within one year of purchase. Class I shares are sold at net asset value per share only to institutional investors. Other differe nces between the classes include the services offered to and the expenses borne by each class, the allocation of certain transfer agency costs and certain voting rights. Income, expenses (other than expenses attributable to a specific class) and realized and unrealized gains or losses on investments are allocated to each class of shares based on its relative net assets.
The Financial Accounting Standards Board (“FASB”) Accounting Standards Codification (“ASC”) is the exclusive reference of authoritative U.S. generally accepted accounting principles (“GAAP”) recognized
20
by the FASB to be applied by nongovernmental entities. Rules and interpretive releases of the Securities and Exchange Commission (“SEC”) under authority of federal laws are also sources of authoritative GAAP for SEC registrants. The fund’s financial statements are prepared in accordance with GAAP, which may require the use of management estimates and assumptions.Actual results could differ from those estimates.
The Company enters into contracts that contain a variety of indemnifications.The fund’s maximum exposure under these arrangements is unknown.The fund does not anticipate recognizing any loss related to these arrangements.
(a) Portfolio valuation: Investments in securities are valued at the last sales price on the securities exchange or national securities market on which such securities are primarily traded. Securities listed on the National Market System for which market quotations are available, are valued at the official closing price or, if there is no official closing price that day, at the last sales price. Securities not listed on an exchange or the national securities market, or securities for which there were no transactions, are valued at the average of the most recent bid and asked prices, except for open short positions, where the asked price is used for valuation purposes. Bid price is used when no asked price is available. Registered investment companies that are not traded on an exchange are valued at their net asset value.When market quotations or official closing prices are not readily available, or are determined not to reflect accurately fair value, such as when the value of a security has been significantly affected by events after the close of the exchange or market on which the security is principally traded (for example, a foreign exchange or market), but before the fund calculates its net asset value, the fund may value these investments at fair value as determined in accordance with the procedures approved by the Board of Directors. Fair valuing of securities may be determined with the assistance of a pricing service using calculations based on indices of domestic securities and other appropriate indicators, such as prices of relevant ADR’s and futures contracts. For other securities that are fair valued by the Board of
The Fund 21
NOTES TO FINANCIAL STATEMENTS (continued)
Directors, certain factors may be considered such as: fundamental analytical data, the nature and duration of restrictions on disposition, an evaluation of the forces that influence the market in which the securities are purchased and sold, and public trading in similar securities of the issuer or comparable issuers. Investments denominated in foreign currencies are translated to U.S. dollars at the prevailing rates of exchange.
The fair value of a financial instrument is the amount that would be received to sell an asset or paid to transfer a liability in an orderly transaction between market participants at the measurement date (i.e. the exit price). GAAP establishes a fair value hierarchy that prioritizes the inputs of valuation techniques used to measure fair value.This hierarchy gives the highest priority to unadjusted quoted prices in active markets for identical assets or liabilities (Level 1 measurements) and the lowest priority to unobservable inputs (Level 3 measurements).
Additionally, GAAP provides guidance on determining whether the volume and activity in a market has decreased significantly and whether such a decrease in activity results in transactions that are not orderly. GAAP requires enhanced disclosures around valuation inputs and techniques used during annual and interim periods.
Various inputs are used in determining the value of the fund’s investments relating to fair value measurements.These inputs are summarized in the three broad levels listed below:
Level 1—unadjusted quoted prices in active markets for
identical investments.
Level 2—other significant observable inputs (including quoted
prices for similar investments, interest rates, prepayment speeds,
credit risk, etc.).
Level 3—significant unobservable inputs (including the fund’s
own assumptions in determining the fair value of investments).
The inputs or methodology used for valuing securities are not necessar ily an indication of the risk associated with investing in those securities
22
The following is a summary of the inputs used as of October 31, 2010 in valuing the fund’s investments:
| Level 2—Other | Level 3— | |||
| Level 1— | Significant | Significant | ||
| Unadjusted | Observable | Unobservable | ||
| Quoted Prices | Inputs | Inputs | Total | |
| Assets ($) | ||||
| Investments in Securities: | ||||
| Equity Securities— | ||||
| Domestic† | 237,786,124 | — | — | 237,786,124 |
| Equity Securities— | ||||
| Foreign† | 198,317,017 | — | — | 198,317,017 |
| Mutual Funds | 1,243,000 | — | — | 1,243,000 |
| † See Statement of Investments for industry classification. | ||||
In January 2010, FASB issued Accounting Standards Update (“ASU”) No. 2010-06 “Improving Disclosures about FairValue Measurements”. The portions of ASU No. 2010-06 which require reporting entities to prepare new disclosures surrounding amounts and reasons for significant transfers in and out of Level 1 and Level 2 fair value measurements as well as inputs and valuation techniques used to measure fair value for both recurring and nonrecurring fair value measurements that fall in either Level 2 or Level 3 have been adopted by the fund. No significant transfers between Level 1 or Level 2 fair value measurements occurred at October 31, 2010. The remaining portion of ASU No. 2010-06 requires reporting entities to make new disclosures about information on purchases, sales, issuances and settlements on a gross basis in the reconciliation of activity in Level 3 fair value measurements. These new and rev ised disclosures are required to be implemented for fiscal years beginning after December 15, 2010. Management is currently evaluating the impact that the adoption of this remaining portion of ASU No. 2010-06 may have on the fund’s financial statement disclosures.
(b) Foreign currency transactions: The fund does not isolate that portion of the results of operations resulting from changes in foreign
The Fund 23
NOTES TO FINANCIAL STATEMENTS (continued)
exchange rates on investments from the fluctuations arising from changes in the market prices of securities held. Such fluctuations are included with the net realized and unrealized gain or loss on investments.
Net realized foreign exchange gains or losses arise from sales of foreign currencies, currency gains or losses realized on securities transactions between trade and settlement dates and the difference between the amounts of dividends, interest and foreign withholding taxes recorded on the fund’s books and the U.S. dollar equivalent of the amounts actually received or paid. Net unrealized foreign exchange gains and losses arise from changes in the value of assets and liabilities other than investments resulting from changes in exchange rates. Foreign currency gains and losses on investments are included with net realized and unrealized gain or loss on investments.
(c) Securities transactions and investment income: Securities transactions are recorded on a trade date basis. Realized gains and losses from securities transactions are recorded on the identified cost basis. Dividend income is recognized on the ex-dividend date and interest income, including, where applicable, accretion of discount and amortization of premium on investments, is recognized on the accrual basis.
Investing in foreign markets may involve special risks and considerations not typically associated with investing in the U.S. These risks include revaluation of currencies, high rates of inflation, repatriation restrictions on income and capital, and adverse political and economic developments. Moreover, securities issued in these markets may be less liquid, subject to government ownership controls and delayed settlements, and their prices may be more volatile than those of comparable securities in the U.S.
(d) Affiliated issuers: Investments in other investment companies advised by Dreyfus are defined as “affiliated” in the Act.
24
The fund may invest in shares of certain affiliated investment companies also advised or managed by Dreyfus. Investments in affiliated investment companies for the period ended October 31, 2010 were as follows:
| Affiliated | |||||
| Investment | Value | Value | Net | ||
| Company | 10/31/2009 ($) | Purchases ($) | Sales ($) | 10/31/2010 ($) | Assets (%) |
| Dreyfus | |||||
| Institutional | |||||
| Preferred | |||||
| Plus Money | |||||
| Market Fund | 1,497,000 | 33,413,000 | 33,667,000 | 1,243,000 | .3 |
(e) Dividends to shareholders: Dividends are recorded on the ex-dividend date. Dividends from investment income-net and dividends from net realized capital gains are normally declared and paid annually, but the fund may make distributions on a more frequent basis to comply with the distribution requirements of the Internal Revenue Code of 1986, as amended (the “Code”).To the extent that net realized capital gains can be offset by capital loss carryovers, it is the policy of the fund not to distribute such gains. Income and capital gain distributions are determined in accordance with income tax regulations, which may differ from GAAP.
(f) Federal income taxes: It is the policy of the fund to continue to qualify as a regulated investment company, if such qualification is in the best interests of its shareholders, by complying with the applicable provisions of the Code, and to make distributions of taxable income sufficient to relieve it from substantially all federal income and excise taxes.
As of and during the period ended October 31, 2010, the fund did not have any liabilities for any uncertain tax positions.The fund recognizes interest and penalties, if any, related to uncertain tax positions as income tax expense in the Statement of Operations. During the period, the fund did not incur any interest or penalties.
The Fund 25
NOTES TO FINANCIAL STATEMENTS (continued)
Each of the tax years in the four-year period ended October 31, 2010 remains subject to examination by the Internal Revenue Service and state taxing authorities.
At October 31, 2010, the components of accumulated earnings on a tax basis were as follows: undistributed ordinary income $6,979,554, undistributed capital gains $9,423,234 and unrealized appreciation $223,842,583.
The tax character of distributions paid to shareholders during the fiscal periods ended October 31, 2010 and October 31, 2009, were as follows: ordinary income $8,004,846 and $2,258,941 and long-term capital gains $8,904,779 and $0, respectively.
During the period ended October 31, 2010, as a result of permanent book to tax differences, primarily due to the tax treatment for foreign currency gains and losses, the fund decreased accumulated undistributed investment income-net by $12,114 and increased accumulated net realized gain (loss) on investments by the same amount. Net assets and net asset value per share were not affected by this reclassification.
NOTE 2—Bank Lines of Credit:
The fund participates with other Dreyfus-managed funds in a $225 million unsecured credit facility led by Citibank, N.A. and a $300 million unsecured credit facility provided by The Bank of New York Mellon, a subsidiary of BNY Mellon and an affiliate of Dreyfus (each, a “Facility”), each to be utilized primarily for temporary or emergency purposes, including the financing of redemptions. In connection therewith, the fund has agreed to pay its pro rata portion of commitment fees for each Facility. Interest is charged to the fund based on rates determined pursuant to the terms of the respective Facility at the time of borrowing. During the period ended October 31, 2010, the fund did not borrow under the Facilities.
26
NOTE 3—Management Fee, Sub-Investment Advisory Fee and Other Transactions with Affiliates:
(a) Pursuant to a management agreement with Dreyfus, the management fee is computed at the annual rate of .75% of the value of the fund’s average daily net assets and is payable monthly.
Pursuant to a sub-investment advisory agreement between Dreyfus and Sarofim & Co., Dreyfus pays Sarofim & Co. a fee at the annual rate of .2175% of the value of the fund’s average daily net assets and is payable monthly.
During the period ended October 31, 2010, the Distributor retained $18,768 from commissions earned on sales of the fund’s Class A shares and $19,068 and $2,690 from CDSCs on redemptions of the fund’s Class B and Class C shares, respectively.
(b) Under the Distribution Plan (the “Plan”) adopted pursuant to Rule 12b-1 under the Act, Class B and Class C shares pay the Distributor for distributing their shares at an annual rate of .75% of the value of the average daily net assets of Class B and Class C shares. During the period ended October 31, 2010, Class B and Class C shares were charged $61,489 and $371,059, respectively, pursuant to the Plan.
(c) Under the Shareholder Services Plan, Class A, Class B and Class C shares pay the Distributor at an annual rate of .25% of the value of their average daily net assets for the provision of certain services.The services provided may include personal services relating to shareholder accounts, such as answering shareholder inquiries regarding the fund and providing reports and other information, and services related to the maintenance of shareholder accounts.The Distributor may make payments to Service Agents (a securities dealer, financial institution or other industry professional) in respect of these services.The Distributor determines the amounts to be paid to Service Agents. During the
The Fund 27
NOTES TO FINANCIAL STATEMENTS (continued)
period ended October 31, 2010, Class A, Class B and Class C shares were charged $913,278, $20,497 and $123,686, respectively, pursuant to the Shareholder Services Plan.
The fund compensates Dreyfus Transfer, Inc., a wholly-owned subsidiary of Dreyfus, under a transfer agency agreement for providing personnel and facilities to perform transfer agency services for the fund. During the period ended October 31, 2010, the fund was charged $328,227 pursuant to the transfer agency agreement, which is included in Shareholder servicing costs in the Statement of Operations.
The fund has arrangements with the custodian and cash management bank whereby the fund may receive earnings credits when positive cash balances are maintained, which are used to offset custody and cash management fees. For financial reporting purposes, the fund includes net earnings credits as an expense offset in the Statement of Operations.
The fund compensates The Bank of New York Mellon under a cash management agreement for performing cash management services related to fund subscriptions and redemptions. During the period ended October 31, 2010, the fund was charged $48,682 pursuant to the cash management agreement, which is included in Shareholder servicing costs in the Statement of Operations. These fees were partially offset by earnings credits of $2,965.
The fund also compensates The Bank of New York Mellon under a custody agreement for providing custodial services for the fund. During the period ended October 31, 2010, the fund was charged $72,146 pursuant to the custody agreement.
During the period ended October 31, 2010, the fund was charged $6,114 for services performed by the Chief Compliance Officer.
28
The components of “Due to The Dreyfus Corporation and affiliates” in the Statement of Assets and Liabilities consist of: management fees $276,844, Rule 12b-1 distribution plan fees $35,380, shareholder services plan fees $91,463, custodian fees $23,968, chief compliance officer fees $2,248 and transfer agency per account fees $58,064.
(d) Each Board member also serves as a Board member of other funds within the Dreyfus complex. Annual retainer fees and attendance fees are allocated to each fund based on net assets.
NOTE 4—Securities Transactions:
The aggregate amount of purchases and sales of investment securities, excluding short-term securities, during the period ended October 31, 2010, amounted to $1,436,801 and $49,841,616, respectively.
The provisions of ASC Topic 815 “Derivatives and Hedging” require qualitative disclosures about objectives and strategies for using derivatives, quantitative disclosures about fair value amounts of gains and losses on derivative instruments and disclosures about credit-risk-related contingent features in derivative agreements.The fund held no derivatives during the period ended October 31, 2010.
At October 31, 2010, the cost of investments for federal income tax purposes was $213,510,654; accordingly, accumulated net unrealized appreciation on investments was $223,835,487, consisting of $228,385,313 gross unrealized appreciation and $4,549,826 gross unrealized depreciation.
The Fund 29
REPORT OF INDEPENDENT REGISTERED
PUBLIC ACCOUNTING FIRM
Shareholders and Board of Directors
Dreyfus Worldwide Growth Fund
We have audited the accompanying statement of assets and liabilities, including the statement of investments, of Dreyfus Worldwide Growth Fund (the sole series comprising Dreyfus Premier Worldwide Growth Fund, Inc.) as of October 31, 2010, and the related statement of operations for the year then ended, the statement of changes in net assets for each of the two years in the period then ended and financial highlights for each of the years indicated therein. These financial statements and financial highlights are the responsibility of the Fund’s management. Our responsibility is to express an opinion on these financial statements and financial highlights based on our audits.
We conducted our audits in accordance with the standards of the Public Company Accounting Oversight Board (United States).Those standards require that we plan and perform the audit to obtain reasonable assurance about whether the financial statements and financial highlights are free of material misstatement.We were not engaged to perform an audit of the Fund’s internal control over financial reporting. Our audits included consideration of internal control over financial reporting as a basis for designing audit procedures that are appropriate in the circumstances, but not for the purpose of expressing an opinion on the effectiveness of the Fund’s internal control over financial reporting. Accordingly, we express no such opinion.An audit also includes examining, on a test basis, evidence supporting the amounts and disclosures in the financial statements and financial highlights, assessing the accounting p rinciples used and significant estimates made by management, and evaluating the overall financial statement presentation. Our procedures included confirmation of securities owned as of October 31, 2010 by correspondence with the custodian and others. We believe that our audits provide a reasonable basis for our opinion.
In our opinion, the financial statements and financial highlights referred to above present fairly, in all material respects, the financial position of DreyfusWorldwide Growth Fund at October 31, 2010, the results of its operations for the year then ended, the changes in its net assets for each of the two years in the period then ended, and the financial highlights for each of the indicated years, in conformity with U.S. generally accepted accounting principles.
New York, New York
December 28, 2010
30
IMPORTANT TAX INFORMATION (Unaudited)
In accordance with federal tax law, the fund hereby designates 93.76% of the ordinary dividends paid during the fiscal year ended October 31, 2010 as qualifying for the corporate dividends received deduction. For the fiscal year ended October 31, 2010, certain dividends paid by the fund may be subject to a maximum tax rate of 15%, as provided for by the Jobs and Growth Tax Relief Reconciliation Act of 2003. Of the distributions paid during the fiscal year, $8,004,846 represents the maximum amount that may be considered qualified dividend income. Shareholders will receive notification in early 2011 of the percentage applicable to the preparation of their 2010 income tax returns.Also, the fund hereby designates $.7480 per share as a long-term capital gain distribution paid on December 22, 2009.
| The Fund | 31 |
INFORMATION ABOUT THE REVIEW AND APPROVAL
OF THE FUND’S MANAGEMENT AGREEMENT (Unaudited)
At a meeting of the Board of Directors held on July 20, 2010, the Board considered the re-approval for an annual period of the fund’s Management Agreement (“Management Agreement”), pursuant to which the Manager provides the fund with investment advisory and administrative services, and the Sub-Investment Advisory Agreement (the “Sub-Investment Advisory Agreement”), pursuant to which Fayez Sarofim & Co. (“Sarofim & Co.”) provides day-to-day management of the fund’s investments subject to the Manager’s oversight.The Board members, none of whom are “interested persons” (as defined in the Investment Company Act of 1940, as amended) of the fund, were assisted in their review by independent legal counsel and met with counsel in executive session separate from representatives of the Manager and Sarofim & Co.
Analysis of Nature, Extent and Quality of Services Provided to the Fund.The Board members considered information previously provided to them in a presentation from representatives of the Manager regarding services provided to the fund and other funds in the Dreyfus fund complex, and representatives of the Manager confirmed that there had been no material changes in this information.The Board also discussed the nature, extent and quality of the services provided to the fund by the Manager pursuant to the Management Agreement, and by Sarofim & Co. pursuant to the Sub-Investment Advisory Agreement. The Manager’s representatives reviewed the fund’s distribution of accounts and the relationships the Manager has with various intermediaries and the different needs of each. The Manager’s representatives noted the distribut ion channels for the fund as well as the diversity of distribution among the funds in the Dreyfus fund complex, and the Manager’s corresponding need for broad, deep, and diverse resources to be able to provide ongoing shareholder services in each distribution channel, including those of the fund. The Manager provided the number of shareholder accounts in the fund, as well as the fund’s asset size.
The Board members considered Sarofim & Co.’s research and portfolio management capabilities.The Board members also considered that the Manager provides oversight of day-to-day fund operations, includ-
32
ing fund accounting and administration and assistance in meeting legal and regulatory requirements, and the Manager’s extensive administrative, accounting and compliance infrastructure, as well as the Manager’s supervisory activities over Sarofim & Co. The Board also considered Sarofim & Co.’s brokerage policies and practices, the standards applied in seeking best execution and the Manager’s and Sarofim & Co.’s policies and practices regarding soft dollars.
Comparative Analysis of the Fund’s Performance, Management Fee and Expense Ratio.The Board members reviewed the fund’s performance and comparisons to a group of comparable funds (the “Performance Group”) and to a broader group of funds (the “Performance Universe”), selected and provided by Lipper, Inc., an independent provider of investment company data.The Board was provided with a description of the methodology Lipper used to select the Performance Group and Performance Universe, as well as the Expense Group and Expense Universe (discussed below).The Board members discussed the results of the comparisons for various periods ended May 31, 2010 and noted that the fund’s total return performance was at or above the Performance Group median for each reported time period except the one- and ten-year pe riods, when it was below the median, and above the Performance Universe median for each reported time period except the one- and five-year periods, when it was below the median. The Manager also provided a comparison of the fund’s calendar year total returns to the returns of the MSCI World Index (the “Index”) for the prior ten calendar years, and the Board members noted that the fund outperformed the Index in six of the past ten calendar years.The Manager also discussed the fund’s more recent performance, noting that the fund was in the first quartile of its Lipper category for the one-, three- and six-month periods ended June 30, 2010 and had also outperformed the Index during those periods.
The Board members also discussed the fund’s contractual and actual management fee and total expense ratio as compared to a comparable group of funds (the “Expense Group”) that was composed of the same
| The Fund | 33 |
INFORMATION ABOUT THE REVIEW AND APPROVAL OF THE
FUND’S MANAGEMENT AGREEMENT (Unaudited) (continued)
funds included in the Performance Group and a broader group of funds (the “Expense Universe”), each selected and provided by Lipper. The Board noted that the fund’s contractual and actual management fees were equal to the Expense Group medians, that the fund’s actual management fee was above the Expense Universe median and that the fund’s total expense ratio was below the Expense Group and Expense Universe medians.
There were no mutual funds managed by the Manager, Sarofim & Co. or their affiliates with similar investment objectives, policies and strategies, and included in the same Lipper category, as the fund. Representatives of the Manager reviewed with the Board members the fees paid by other accounts managed by the Manager, Sarofim & Co. or their respective affiliates with similar investment objectives, policies and strategies as the fund (the “Similar Accounts”).The Manager’s representatives explained the nature of the Similar Accounts and the differences, from the Manager’s and Sarofim & Co.’s perspective, as applicable, in management of the Similar Accounts as compared to managing and providing services to the fund.The Board analyzed differences in fees paid to the Manager or Sarofim & Co. and discussed the relationship of the fees paid in light of the services provided.The Bo ard members considered the relevance of the fee information provided for the Similar Accounts to evaluate the appropriateness and reasonableness of the fund’s management fee and sub-investment advisory fee. The Board acknowledged that differences in fees paid by the Similar Accounts seemed to be consistent with the services provided.
The Board considered the fee paid to Sarofim & Co. under the Sub-Investment Advisory Agreement in relation to the fee paid to the Manager and the respective services provided by Sarofim & Co. and the Manager.The Board also noted that Sarofim & Co.’s fee is paid by the Manager and not the fund.
Analysis of Profitability and Economies of Scale.The Manager’s representatives reviewed the dollar amount of expenses allocated and profit received by the Manager and the method used to determine
34
such expenses and profit and the dollar amount of expenses allocated and profit received by Sarofim & Co.The Board previously had been provided with information prepared by an independent consulting firm regarding the Manager’s approach to allocating costs to, and determining the profitability of, individual funds and the entire Dreyfus mutual fund complex.
The Board members also had been informed that the methodology also had been reviewed by an independent registered public accounting firm which, like the consultant, found the methodology to be reasonable.The consulting firm also analyzed where any economies of scale might emerge in connection with the management of a fund. The Board members evaluated the profitability analysis in light of the relevant circumstances for the fund and the extent to which economies of scale would be realized if the fund grows and whether fee levels reflect these economies of scale for the benefit of fund shareholders.The Board members also considered potential benefits to the Manager and Sarofim & Co. and their affiliates from acting as investment adviser and sub-investment adviser, respectively, to the fund and noted that there were no soft dollar arrangements with respect to trading the fund’s portfolio.
It was noted that the Board members should consider the Manager’s profitability with respect to the fund as part of their evaluation of whether the fees under the Management Agreement bear a reasonable relationship to the mix of services provided by the Manager, including the nature, extent and quality of such services and that a discussion of economies of scale is predicated on increasing assets and that, if a fund’s assets had been decreasing, the possibility that the Manager may have realized any economies of scale would be less. Since the Manager, and not the fund, pays Sarofim & Co. pursuant to the Sub-Investment Advisory Agreement, the Board did not consider Sarofim & Co.’s profitability to be relevant to its deliberations. It was also noted that the profitability percentage for managing the fund was within the range determined by appropriate court cases to be reasonable given the serv ices rendered and generally superior service levels provided by the Manager.
| The Fund | 35 |
INFORMATION ABOUT THE REVIEW AND APPROVAL OF THE
FUND’S MANAGEMENT AGREEMENT (Unaudited) (continued)
At the conclusion of these discussions, the Board agreed that it had been furnished with sufficient information to make an informed business decision with respect to continuation of the fund’s Management Agreement and Sub-Investment Advisory Agreement. Based on the discussions and considerations as described above, the Board made the following conclusions and determinations.
The Board concluded that the nature, extent and quality of the services provided by the Manager and Sarofim & Co. to the fund are adequate and appropriate.
The Board was generally satisfied with the fund’s relative performance.
The Board concluded that the fee paid to the Manager was reason- able in light of the services to be provided, comparative performance, expense and advisory fee information, costs of the services provided and profits to be realized and benefits derived or to be derived by the Manager and Sarofim & Co. from their relationship with the fund and that the fee paid by the Manager to Sarofim & Co. is reasonable and appropriate.
The Board determined that the economies of scale which may accrue to the Manager and its affiliates in connection with the management of the fund had been adequately considered by the Manager in con- nection with the management fee rate charged to the fund and that, to the extent in the future it were to be determined that material economies of scale had not been shared with the fund, the Board would seek to have those economies of scale shared with the fund.
The Board members considered these conclusions and determinations, along with the information received on a routine and regular basis throughout the year, and, without any one factor being dispositive, the Board determined that re-approval of the fund’s Management Agreement and Sub-Investment Advisory Agreement was in the best interests of the fund and its shareholders.
36
BOARD MEMBERS INFORMATION (Unaudited)
The Fund 37
BOARD MEMBERS INFORMATION (Unaudited) (continued)
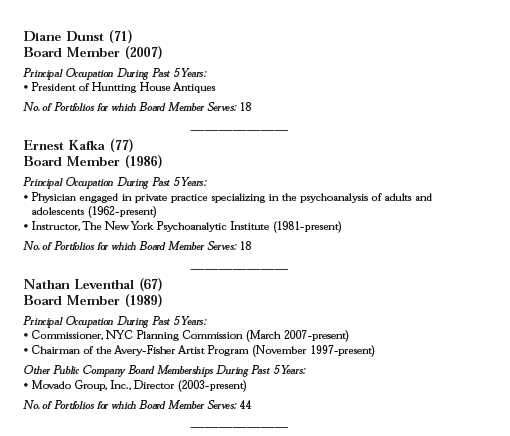
Once elected all Board Members serve for an indefinite term, but achieve Emeritus status upon reaching age 80.The address of the Board Members and Officers is in c/o The Dreyfus Corporation, 200 Park Avenue, NewYork, NewYork 10166.Additional information about the Board Members is available in the fund’s Statement of Additional Information which can be obtained from Dreyfus free of charge by calling this toll free number: 1-800-554-4611.
Jay I. Meltzer, Emeritus Board Member
Daniel Rose, Emeritus Board Member
Sander Vanocur, Emeritus Board Member
Warren B. Rudman, Emeritus Board Member
38
OFFICERS OF THE FUND (Unaudited)
BRADLEY J. SKAPYAK, President since
January 2010.
Chief Operating Officer and a director of the Manager since June 2009. From April 2003 to June 2009, Mr. Skapyak was the head of the Investment Accounting and Support Department of the Manager. He is an officer of 76 investment companies (comprised of 170 portfolios) managed by the Manager. He is 51 years old and has been an employee of the Manager since February 1988.
PHILLIP N. MAISANO, Executive Vice
President since July 2007.
Chief Investment Officer,Vice Chair and a director of the Manager, and an officer of 76 investment companies (comprised of 170 portfolios) managed by the Manager. Mr. Maisano also is an officer and/or Board member of certain other investment management subsidiaries of The Bank of New York Mellon Corporation, each of which is an affiliate of the Manager. He is 63 years old and has been an employee of the Manager since November 2006. Prior to joining the Manager, Mr. Maisano served as Chairman and Chief Executive Officer of EACM Advisors, an affiliate of the Manager, since August 2004.
MICHAEL A. ROSENBERG, Vice President
and Secretary since August 2005.
Assistant General Counsel of BNY Mellon, and an officer of 77 investment companies (comprised of 195 portfolios) managed by the Manager. He is 50 years old and has been an employee of the Manager since October 1991.
KIESHA ASTWOOD, Vice President and
Assistant Secretary since January 2010.
Counsel of BNY Mellon, and an officer of 77 investment companies (comprised of 195 portfolios) managed by the Manager. She is 37 years old and has been an employee of the Manager since July 1995.
JAMES BITETTO, Vice President and
Assistant Secretary since August 2005.
Senior Counsel of BNY Mellon and Secretary of the Manager, and an officer of 77 investment companies (comprised of 195 portfolios) managed by the Manager. He is 44 years old and has been an employee of the Manager since December 1996.
JONI LACKS CHARATAN, Vice President
and Assistant Secretary since
August 2005.
Senior Counsel of BNY Mellon, and an officer of 77 investment companies (comprised of 195 portfolios) managed by the Manager. She is 54 years old and has been an employee of the Manager since October 1988.
JOSEPH M. CHIOFFI, Vice President and
Assistant Secretary since August 2005.
Senior Counsel of BNY Mellon, and an officer of 77 investment companies (comprised of 195 portfolios) managed by the Manager. He is 48 years old and has been an employee of the Manager since June 2000.
KATHLEEN DENICHOLAS, Vice President
and Assistant Secretary since
January 2010.
Senior Counsel of BNY Mellon, and an officer of 77 investment companies (comprised of 195 portfolios) managed by the Manager. She is 36 years old and has been an employee of the Manager since February 2001.
JANETTE E. FARRAGHER, Vice President
and Assistant Secretary since
August 2005.
Assistant General Counsel of BNY Mellon, and an officer of 77 investment companies (comprised of 195 portfolios) managed by the Manager. She is 47 years old and has been an employee of the Manager since February 1984.
The Fund 39
OFFICERS OF THE FUND (Unaudited) (continued)
JOHN B. HAMMALIAN, Vice President and
Assistant Secretary since August 2005.
Managing Counsel of BNY Mellon, and an officer of 77 investment companies (comprised of 195 portfolios) managed by the Manager. He is 47 years old and has been an employee of the Manager since February 1991.
M. CRISTINA MEISER, Vice President and
Assistant Secretary since January 2010.
Senior Counsel of BNY Mellon, and an officer of 77 investment companies (comprised of 195 portfolios) managed by the Manager. She is 40 years old and has been an employee of the Manager since August 2001.
ROBERT R. MULLERY, Vice President and
Assistant Secretary since August 2005.
Managing Counsel of BNY Mellon, and an officer of 77 investment companies (comprised of 195 portfolios) managed by the Manager. He is 58 years old and has been an employee of the Manager since May 1986.
JEFF PRUSNOFSKY, Vice President and
Assistant Secretary since August 2005.
Managing Counsel of BNY Mellon, and an officer of 77 investment companies (comprised of 195 portfolios) managed by the Manager. He is 45 years old and has been an employee
JAMES WINDELS, Treasurer since
November 2001.
Director – Mutual Fund Accounting of the Manager, and an officer of 77 investment companies (comprised of 195 portfolios) managed by the Manager. He is 52 years old and has been an employee of the Manager since April 1985.
RICHARD CASSARO, Assistant Treasurer
since January 2008.
Senior Accounting Manager – Money Market and Municipal Bond Funds of the Manager, and an officer of 77 investment companies (comprised of 195 portfolios) managed by the Manager. He is 51 years old and has been an employee of the Manager since September 1982.
GAVIN C. REILLY, Assistant Treasurer
since December 2005.
Tax Manager of the Investment Accounting and Support Department of the Manager, and an officer of 77 investment companies (comprised of 195 portfolios) managed by the Manager. He is 42 years old and has been an employee of the Manager since April 1991.
ROBERT ROBOL, Assistant Treasurer
since August 2005.
Senior Accounting Manager – Fixed Income Funds of the Manager, and an officer of 77 investment companies (comprised of 195 portfolios) managed by the Manager. He is 46 years old and has been an employee of the Manager since October 1988.
ROBERT SALVIOLO, Assistant Treasurer
since July 2007.
Senior Accounting Manager – Equity Funds of the Manager, and an officer of 77 investment companies (comprised of 195 portfolios) managed by the Manager. He is 43 years old and has been an employee of the Manager since June 1989.
40
ROBERT SVAGNA, Assistant Treasurer
since December 2002.
Senior Accounting Manager – Equity Funds of the Manager, and an officer of 77 investment companies (comprised of 195 portfolios) managed by the Manager. He is 43 years old and has been an employee of the Manager since November 1990.
JOSEPH W. CONNOLLY, Chief Compliance
Officer since October 2004.
Chief Compliance Officer of the Manager and The Dreyfus Family of Funds (77 investment companies, comprised of 195 portfolios). From November 2001 through March 2004, Mr. Connolly was first Vice-President, Mutual Fund Servicing for Mellon Global Securities Services. In that capacity, Mr. Connolly was responsible for managing Mellon’s Custody, Fund Accounting and Fund Administration services to third-party mutual fund clients. He is 53 years old and has served in various capacities with the Manager since 1980, including manager of the firm’s Fund Accounting Department from 1997 through October 2001.
NATALIA GRIBAS, Anti-Money Laundering
Compliance Officer since July 2010.
Anti-Money Laundering Compliance Officer of the Distributor, and the Anti-Money Laundering Compliance Officer of 73 investment companies (comprised of 191 portfolios) managed by the Manager. She is 40 years old and has been an employee of the Distributor since September 2008.
The Fund 41
For More Information
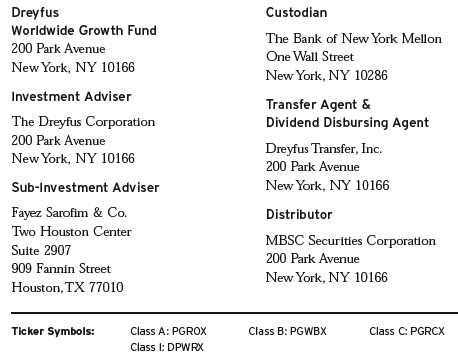
Telephone Call your financial representative or 1-800-554-4611
Mail The Dreyfus Family of Funds, 144 Glenn Curtiss Boulevard, Uniondale, NY 11556-0144
The fund files its complete schedule of portfolio holdings with the Securities and Exchange Commission (“SEC”) for the first and third quarters of each fiscal year on Form N-Q. The fund’s Forms N-Q are available on the SEC’s website at http://www.sec.gov and may be reviewed and copied at the SEC’s Public Reference Room in Washington, DC. Information on the operation of the Public Reference Room may be obtained by calling 1-800-SEC-0330.
A description of the policies and procedures that the fund uses to determine how to vote proxies relating to portfolio securities, and information regarding how the fund voted these proxies for the most recent 12-month period ended June 30 is available at http://www.dreyfus.com and on the SEC’s website at http://www.sec.gov. The description of the policies and procedures is also available without charge, upon request, by calling 1-800-645-6561.

Item 2. Code of Ethics.
The Registrant has adopted a code of ethics that applies to the Registrant's principal executive officer, principal financial officer, principal accounting officer or controller, or persons performing similar functions. There have been no amendments to, or waivers in connection with, the Code of Ethics during the period covered by this Report.
Item 3. Audit Committee Financial Expert.
The Registrant's Board has determined that Joseph S. DiMartino, a member of the Audit Committee of the Board, is an audit committee financial expert as defined by the Securities and Exchange Commission (the "SEC"). Mr. DiMartino is "independent" as defined by the SEC for purposes of audit committee financial expert determinations.
Item 4. Principal Accountant Fees and Services.
(a) Audit Fees. The aggregate fees billed for each of the last two fiscal years (the "Reporting Periods") for professional services rendered by the Registrant's principal accountant (the "Auditor") for the audit of the Registrant's annual financial statements or services that are normally provided by the Auditor in connection with the statutory and regulatory filings or engagements for the Reporting Periods, were $31,692 in 2009 and $31,692 in 2010.
(b) Audit-Related Fees. The aggregate fees billed in the Reporting Periods for assurance and related services by the Auditor that are reasonably related to the performance of the audit of the Registrant's financial statements and are not reported under paragraph (a) of this Item 4 were $5,276 in 2009 and $5,382 in 2010. These services consisted of one or more of the following: (i) agreed upon procedures related to compliance with Internal Revenue Code section 817(h), (ii) security counts required by Rule 17f-2 under the Investment Company Act of 1940, as amended, (iii) advisory services as to the accounting or disclosure treatment of Registrant transactions or events and (iv) advisory services to the accounting or disclosure treatment of the actual or potential impact to the Registrant of final or proposed rules, standards or interpretations by the Securities and Exchange Commission, the Financial Accounting Standards Boards or other regulatory or standard-setting bodies.
The aggregate fees billed in the Reporting Periods for non-audit assurance and related services by the Auditor to the Registrant's investment adviser (not including any sub-investment adviser whose role is primarily portfolio management and is subcontracted with or overseen by another investment adviser), and any entity controlling, controlled by or under common control with the investment adviser that provides ongoing services to the Registrant ("Service Affiliates"), that were reasonably related to the performance of the annual audit of the Service Affiliate, which required pre-approval by the Audit Committee were $0 in 2009 and $0 in 2010.
(c) Tax Fees. The aggregate fees billed in the Reporting Periods for professional services rendered by the Auditor for tax compliance, tax advice, and tax planning ("Tax Services") were $3,586 in 2009 and $3,948 in 2010. These services consisted of: (i) review or preparation of U.S. federal, state, local and excise tax returns; (ii) U.S. federal, state and local tax planning, advice and assistance regarding statutory, regulatory or administrative developments; (iii) tax advice regarding tax qualification matters and/or treatment of various financial instruments held or proposed to be acquired or held, and (iv) determination of Passive Foreign Investment Companies. The aggregate fees billed in the Reporting Periods for Tax Services by the Auditor to Service Affiliates, which required pre-approval by the Audit Committee were $0 in 2009 and $0 in 2010.
(d) All Other Fees. The aggregate fees billed in the Reporting Periods for products and services provided by the Auditor, other than the services reported in paragraphs (a) through (c) of this Item, were $131 in 2009 and $146 in 2010. [These services consisted of a review of the Registrant's anti-money laundering program].
The aggregate fees billed in the Reporting Periods for Non-Audit Services by the Auditor to Service Affiliates, other than the services reported in paragraphs (b) through (c) of this Item, which required pre-approval by the Audit Committee, were $0 in 2009 and $0 in 2010.
(e)(1) Audit Committee Pre-Approval Policies and Procedures. The Registrant's Audit Committee has established policies and procedures (the "Policy") for pre-approval (within specified fee limits) of the Auditor's engagements for non-audit services to the Registrant and Service Affiliates without specific case-by-case consideration. The pre-approved services in the Policy can include pre-approved audit services, pre-approved audit-related services, pre-approved tax services and pre-approved all other services. Pre-approval considerations include whether the proposed services are compatible with maintaining the Auditor's independence. Pre-approvals pursuant to the Policy are considered annually.
(e)(2) Note: None of the services described in paragraphs (b) through (d) of this Item 4 were approved by the Audit Committee pursuant to paragraph (c)(7)(i)(C) of Rule 2-01 of Regulation S-X.
(f) None of the hours expended on the principal accountant's engagement to audit the registrant's financial statements for the most recent fiscal year were attributed to work performed by persons other than the principal account's full-time, permanent employees.
Non-Audit Fees. The aggregate non-audit fees billed by the Auditor for services rendered to the Registrant, and rendered to Service Affiliates, for the Reporting Periods were $25,383,429 in 2009 and $31,544,905 in 2010.
Auditor Independence. The Registrant's Audit Committee has considered whether the provision of non-audit services that were rendered to Service Affiliates, which were not pre-approved (not requiring pre-approval), is compatible with maintaining the Auditor's independence.
Item 5. Audit Committee of Listed Registrants.
Not applicable. [CLOSED-END FUNDS ONLY]
Item 6. Investments.
(a) Not applicable.
Item 7. Disclosure of Proxy Voting Policies and Procedures for Closed-End Management Investment Companies.
Not applicable. [CLOSED-END FUNDS ONLY]
Item 8. Portfolio Managers of Closed-End Management Investment Companies.
Not applicable. [CLOSED-END FUNDS ONLY, beginning with reports for periods ended on and after December 31, 2005]
Item 9. Purchases of Equity Securities by Closed-End Management Investment Companies and Affiliated Purchasers.
Not applicable. [CLOSED-END FUNDS ONLY]
Item 10. Submission of Matters to a Vote of Security Holders.
There have been no material changes to the procedures applicable to Item 10.
Item 11. Controls and Procedures.
(a) The Registrant's principal executive and principal financial officers have concluded, based on their evaluation of the Registrant's disclosure controls and procedures as of a date within 90 days of the filing date of this report, that the Registrant's disclosure controls and procedures are reasonably designed to ensure that information required to be disclosed by the Registrant on Form N-CSR is recorded, processed, summarized and reported within the required time periods and that information required to be disclosed by the Registrant in the reports that it files or submits on Form N-CSR is accumulated and communicated to the Registrant's management, including its principal executive and principal financial officers, as appropriate to allow timely decisions regarding required disclosure.
(b) There were no changes to the Registrant's internal control over financial reporting that occurred during the second fiscal quarter of the period covered by this report that have materially affected, or are reasonably likely to materially affect, the Registrant's internal control over financial reporting.
Item 12. Exhibits.
(a)(1) Code of ethics referred to in Item 2.
(a)(2) Certifications of principal executive and principal financial officers as required by Rule 30a-2(a) under the Investment Company Act of 1940.
(a)(3) Not applicable.
(b) Certification of principal executive and principal financial officers as required by Rule 30a-2(b) under the Investment Company Act of 1940.
SIGNATURES
Pursuant to the requirements of the Securities Exchange Act of 1934 and the Investment Company Act of 1940, the Registrant has duly caused this Report to be signed on its behalf by the undersigned, thereunto duly authorized.
Dreyfus Premier Worldwide Growth Fund, Inc.
By: /s/ Bradley J. Skapyak | |
Bradley J. Skapyak, President
| |
Date: | December 23, 2010 |
| |
Pursuant to the requirements of the Securities Exchange Act of 1934 and the Investment Company Act of 1940, this Report has been signed below by the following persons on behalf of the Registrant and in the capacities and on the dates indicated. | |
| |
By: /s/ Bradley J. Skapyak | |
Bradley J. Skapyak, President
| |
Date: | December 23, 2010 |
| |
By: /s/ James Windels | |
James Windels, Treasurer
| |
Date: | December 23, 2010 |
| |
EXHIBIT INDEX
(a)(1) Code of ethics referred to in Item 2.
(a)(2) Certifications of principal executive and principal financial officers as required by Rule 30a-2(a) under the Investment Company Act of 1940. (EX-99.CERT)
(b) Certification of principal executive and principal financial officers as required by Rule 30a-2(b) under the Investment Company Act of 1940. (EX-99.906CERT)