Table of Contents
UNITED STATES
SECURITIES AND EXCHANGE COMMISSION
Washington, D.C. 20549
FORM 6-K
Report of Foreign Issuer
Pursuant to Rule 13a-16 or 15d-16
of the Securities Exchange Act of 1934
For the month of May, 2021
Commission File Number: 001-12102
YPF Sociedad Anónima
(Exact name of registrant as specified in its charter)
Macacha Güemes 515
C1106BKK Buenos Aires, Argentina
(Address of principal executive office)
Indicate by check mark whether the registrant files or will file annual reports under cover of Form 20-F or Form 40-F:
Form 20-F ☒ Form 40-F ☐
Indicate by check mark if the registrant is submitting the Form 6-K in paper as permitted by Regulation S-T Rule 101(b)(1):
Yes ☐ No ☒
Indicate by check mark if the registrant is submitting the Form 6-K in paper as permitted by Regulation S-T Rule 101(b)(7):
Yes ☐ No ☒
Table of Contents

Table of Contents

| 3 | ||||
| 4 | ||||
| 7 | ||||
| 8 | ||||
| 8 | ||||
| 11 | ||||
| 14 | ||||
| 15 | ||||
| 15 | ||||
| 16 | ||||
| 16 | ||||
| 17 | ||||
| 19 | ||||
| 19 | ||||
| 20 | ||||
| 21 | ||||
| 23 | ||||


2
Table of Contents
Basis of Presentation
From 3Q20 onwards, the Earnings Release is expressed in U.S. dollars to facilitate the reading of results. YPF has defined the U.S. dollar as its functional currency and subsidiaries having the Argentine Peso as functional currency were adjusted for inflation, corresponding to a hyperinflationary economy, in accordance with IAS guidelines. Unless otherwise indicated, the calculation of all Income Statement figures in U.S. dollars are calculated as the sum of: (1) YPF S.A. individual financial results expressed in Argentine pesos divided by the average exchange rate of the period; and (2) the financial results of YPF S.A.’s subsidiaries expressed in Argentine pesos divided by the exchange rate at the end of period. Cash Flow items were converted to U.S. dollars using the average exchange rate for each period; whereas Balance Sheet items were converted to U.S. dollars using the end of period exchange rate for each period. The accumulated financial information presented in this document is calculated as the sum of the quarters for each period.
Solid start of the year, leveraging on stronger fuels’ demand, better pricing environment, and the materialization of cost efficiencies.
Summary Consolidated Financials Unaudited Figures, in US$ million | 1Q20 | 4Q20 | 1Q21 | Q/Q D | ||||||||||||
Revenues | 2,832 | 2,270 | 2,648 | 16.6 | % | |||||||||||
EBITDA | 1,040 | 263 | 825 | N.M | ||||||||||||
Adjusted EBITDA | 851 | 183 | 767 | N.M | ||||||||||||
Operating income before impairment of assets | 241 | (273 | ) | 78 | N.M | |||||||||||
Operating income | 241 | 549 | 78 | -85.9 | % | |||||||||||
Net income before impairment of assets | 103 | (78 | ) | (25 | ) | -67.4 | % | |||||||||
Net income | 103 | 539 | (25 | ) | N.M | |||||||||||
EPS | 0.26 | 1.41 | (0.06 | ) | N.M | |||||||||||
Capex | 598 | 538 | 487 | -9.4 | % | |||||||||||
FCF | (85 | ) | 182 | 284 | 56.0 | % | ||||||||||
Cash and cash equivalents | 1,159 | 994 | 995 | 0.1 | % | |||||||||||
Total debt | 8,799 | 8,070 | 7,747 | -4.0 | % | |||||||||||
EBITDA = Operating income + Depreciation of property, plant and equipment + Depreciation of the right of use assets + Amortization of intangible assets + Unproductive exploratory drillings + (Reversal) / Deterioration of property, plant, and equipment. Adjusted EBITDA = EBITDA that excludes IFRS 16 and IAS 29 effects +/- one-off items. EPS attributable to shareholders of the parent company (basic and diluted). FCF = Cash flow from Operations less capex (Investing activities), M&A (Investing activities), and interest and leasing payments (Financing activities).
1. MAIN HIGHLIGHTS OF THE QUARTER
| • | Strong recovery in profitability with Adjusted EBITDA expanding by 318% sequentially—and only 9.9% below 1Q20 -, mainly backed by a fast recovery in demand for gasoline and diesel, higher realization prices across the board and the materialization of cost efficiencies. |
| • | Local demand for our main refined products (gasoline and diesel) improved beyond expectations increasing 5.5% q/q and 3.6% y/y, but not yet back to pre-COVID levels remaining 5.7% below 1Q19. |
| • | Prices at the pump continued recovering in dollar terms with a sequential increase in the realization price of 10.3% on average for gasoline and diesel, which permitted to pass-through the increases in biofuels’ costs and fuels’ taxes, while also leaving some room for a recovery in our margin. |
| • | Structural cost efficiencies continued to materialize on the back of the company-wide cost cutting plan implemented throughout 2020. OPEX declined 21.5% y/y with positive results on all our business segments. |
| • | Activity in our upstream operations was fully resumed reaching a new record in the number of horizontal wells completed in a quarter, totaling 34 between oil and gas wells within the unconventional segment, out of a total of 48 wells completed throughout all of our operated fields. |
| • | Oil and gas production expanded 3.3% sequentially, including a 4.3% increase in crude oil production to 207.7 Kbbld, with a remarkable 19.7% jump in shale oil production backed by our core hub where output reached its record high in March at 42.0 Kbbld. |
| • | Free cash flow ended in positive territory, allowing us to further reduce our net debt which declined by US$324 million to US$6,752 million by the end of the quarter – or US$888 million below 1Q20. |
3
Table of Contents
2. ANALYSIS OF CONSOLIDATED RESULTS
Consolidated Revenues Breakdown Unaudited Figures, in US$ million | 1Q20 | 4Q20 | 1Q21 | Y/Y D | ||||||||||||
Diesel | 996 | 826 | 921 | -7.5 | % | |||||||||||
Gasoline | 669 | 494 | 613 | -8.4 | % | |||||||||||
Natural gas as producers (third parties) | 265 | 225 | 259 | -2.0 | % | |||||||||||
Other | 503 | 503 | 552 | 9.7 | % | |||||||||||
|
|
|
|
|
|
|
| |||||||||
Total Domestic Market | 2,433 | 2,047 | 2,346 | -3.6 | % | |||||||||||
|
|
|
|
|
|
|
| |||||||||
Jet fuel | 102 | 11 | 24 | -76.4 | % | |||||||||||
Grain and flours | 61 | 78 | 114 | 85.1 | % | |||||||||||
Crude oil | 8 | 47 | 6 | -28.1 | % | |||||||||||
Petchem & Other | 227 | 86 | 158 | -30.4 | % | |||||||||||
|
|
|
|
|
|
|
| |||||||||
Total Export Market | 399 | 223 | 302 | -24.4 | % | |||||||||||
|
|
|
|
|
|
|
| |||||||||
Total Revenues | 2,832 | 2,270 | 2,648 | -6.5 | % | |||||||||||
|
|
|
|
|
|
|
| |||||||||
Revenues for 1Q21, which amounted to US$2,648 million, showed a sound recovery on a sequential basis, increasing 16.6% on both higher domestic and export sales driven by a general increase in volumes and prices. In particular, we highlight the higher revenues of diesel and gasoline, up 11.5% and 24.2%, respectively, on both higher volumes and higher prices in dollars, as cumulative increases at the pump more than compensated higher fuel taxes and the devaluation of the currency. In addition, prices for natural gas were also higher on the back of the new Plan GasAR driving a 15.3% increase in natural gas revenues as producers sold to third parties in the local market.
On a year ago basis, revenues decreased 6.5% – 1Q20 being affected by the pandemic for less than two weeks – primarily on lower average prices in dollar terms, while demand for gasoline and diesel were 3.6% y/y higher in 1Q21, on more flexible mobility restrictions. It is worth noting that demand in 1Q21 lagged 1Q19 (pandemic-free) by only 5.7%.
Diesel revenues – 35% of our total sales – decreased 7.5% y/y due to lower prices (-12.5%) partially offset by increasing volumes sold (5.2%). Gasoline sales – 23% of total revenues – followed the same trend and decreased by 8.4% also on lower prices (-10.3%) offset by higher volumes sold (1.4%).
Natural gas revenues as producers sold to third parties in the local market – 10% of consolidated sales – went down 2.0% y/y due to a reduction in volumes, despite the better pricing as 1Q21 was the first quarter under the new Plan GasAR.
Other domestic sales in 1Q21, increased 9.7% y/y mainly on higher sales of fuel oil, fertilizers, asphalts, LPG, lubricants and virgin naphtha more than offset lower sales of jet fuel and crude oil.
Export revenues decreased 24.4% y/y on lower sales of jet fuel, natural gas, fuel oil, diesel and virgin naphtha, due to lower volumes sold in most of these products. This was partially offset by higher sales of grain and flours, and petrochemical products.
4
Table of Contents
Consolidated Costs Breakdown Unaudited Figures, in US$ million | 1Q20 | 4Q20 | 1Q21 | Y/Y D | ||||||||||||
Depreciation | (679 | ) | (430 | ) | (652 | ) | -3.9 | % | ||||||||
Lifting cost | (524 | ) | (413 | ) | (411 | ) | -21.5 | % | ||||||||
Royalties | (184 | ) | (141 | ) | (171 | ) | -7.0 | % | ||||||||
Refining cost | (114 | ) | (113 | ) | (106 | ) | -6.6 | % | ||||||||
Other | (328 | ) | (274 | ) | (203 | ) | -37.9 | % | ||||||||
|
|
|
|
|
|
|
| |||||||||
Total Production Costs | (1,828 | ) | (1,371 | ) | (1,544 | ) | -15.5 | % | ||||||||
|
|
|
|
|
|
|
| |||||||||
Fuels imports | (97 | ) | (30 | ) | (75 | ) | -23.1 | % | ||||||||
Crude oil purchases to third parties | (238 | ) | (173 | ) | (252 | ) | 6.1 | % | ||||||||
Biofuel purchases | (161 | ) | (50 | ) | (108 | ) | -32.6 | % | ||||||||
Natural gas purchases to third parties | (50 | ) | (40 | ) | (32 | ) | -36.4 | % | ||||||||
Other | (171 | ) | (232 | ) | (252 | ) | 47.6 | % | ||||||||
|
|
|
|
|
|
|
| |||||||||
Total Purchases | (717 | ) | (526 | ) | (719 | ) | 0.3 | % | ||||||||
|
|
|
|
|
|
|
| |||||||||
Stock variations | 178 | (179 | ) | 25 | -85.9 | % | ||||||||||
|
|
|
|
|
|
|
| |||||||||
Total Operating Costs | (2,366 | ) | (2,076 | ) | (2,238 | ) | -5.4 | % | ||||||||
|
|
|
|
|
|
|
| |||||||||
Selling expenses | (225 | ) | (224 | ) | (225 | ) | -0.1 | % | ||||||||
Administrative expenses | (109 | ) | (135 | ) | (103 | ) | -6.1 | % | ||||||||
Exploration expenses | (12 | ) | (10 | ) | (2 | ) | -84.5 | % | ||||||||
Other operating results, net | 120 | (99 | ) | (3 | ) | N.M | ||||||||||
|
|
|
|
|
|
|
| |||||||||
Total Other Expenses | (225 | ) | (467 | ) | (332 | ) | 47.3 | % | ||||||||
|
|
|
|
|
|
|
| |||||||||
Impairment of assets | — | 822 | — | N.M | ||||||||||||
|
|
|
|
|
|
|
| |||||||||
Operating Costs + Other Expenses + Impairment of Assets | (2,592 | ) | (1,721 | ) | (2,570 | ) | -0.8 | % | ||||||||
|
|
|
|
|
|
|
| |||||||||
Stock variations include holding results of US$63 million in 1Q20, US$(40) million in 4Q20 and US$66 million for 1Q21.
Total Operating Costs were US$2,238 million, contracting 5.4% y/y driven primarily by efficiencies in operating expenses other than purchases, royalties and depreciation, on the back of the company wide cost-cutting program that we went through during 2020.
Within production costs, which decreased 15.5% y/y, the lifting cost reduction of 21.5% y/y was mainly influenced by cost-efficiencies, partially compensated with increased well activity on the back of the gradual resumption in activity, royalties went down by 7.0% y/y due to the lower production, and transportation cost (included in the “Other” category) contracted 28.9% y/y primarily on lower tariffs based on the renegotiation of contracts with suppliers.
Depreciation decreased 3.9% mainly due to the decrease in our capex program during last year, which affected the accounting value of the assets subject to depreciation when comparing to the same period of 2020.
Refining cost decreased 6.6% y/y mainly motivated by lower charges related to repair and maintenance, electricity and other supplies, personnel expenses, and consumption of materials and spare parts.
As regards to purchases, a category highly correlated with demand levels for refined products, it remained stable y/y, increasing just 0.3%, driven by:
| • | A reduction in fuel imports of 23.1% mainly driven by a decrease of 47.6% for diesel and 58.0% for jet fuel on lower volumes, partially offset by higher purchases of premium gasoline (62.5%) due to higher volumes; |
5
Table of Contents
| • | Biofuel purchases reported a reduction of 32.6% mainly due to lower purchases of biodiesel (-63.4%) driven by lower volumes acquired despite higher prices, that more than offset the increase in bioethanol purchases (5.6%) driven by higher prices; |
| • | Lower purchases of natural gas from other producers for resale in the retail distribution segment (residential customers and small businesses) and to large customers (power plants and industries) mainly due to lower volumes (-15.4%); |
| • | These effects were partially offset by an increase in crude oil purchases from third parties as prices and volumes had expanded by 2.3% and 3.6%, respectively; |
| • | An increase in purchases of fertilizers and grain receipts in the agricultural sales segment through the form of barter (included in the “Other” category) of 76.2% and 37.7%, respectively, mainly due to higher prices of these products. |
During 1Q21, a positive stock variation of US$25 million was recorded, mainly due to an increase in the cost of the company’s inventories, partially offset by a consumption of inventories. In 1Q20, this category was also positive by US$178 million, as a result of an increase in inventory’s levels and their related cost.
In 1Q21 selling expenses stood stable at US$225 million mainly since the higher export taxes, due to an increase in agricultural exports, offset the lower product transportation charges (as within the cost-cutting program we renegotiated lower rates for domestic fuel transport in dollars) and personnel expenses.
Administrative expenses dropped by 6.1% y/y mainly driven by cost efficiencies and lower personnel expenses due to the voluntary retirement program executed in 2020.
The other operating results, net, in 1Q21 were negative by US$3 million compared to the positive US$120 million recorded in 1Q20 mainly explained by the acceleration of promote of Schlumberger’s stake in Bandurria Sur for US$104 million in January 2020.
Consolidated Net Income Breakdown Unaudited Figures, in US$ million | 1Q20 | 4Q20 | 1Q21 | Y/Y D | ||||||||||||
Operating income | 241 | 549 | 78 | -67.7 | % | |||||||||||
|
|
|
|
|
|
|
| |||||||||
Interests in companies and joint ventures | 22 | 56 | 58 | N.M | ||||||||||||
Financial results, net | (172 | ) | 24 | (49 | ) | -71.7 | % | |||||||||
Income tax | 12 | (90 | ) | (112 | ) | N.M | ||||||||||
|
|
|
|
|
|
|
| |||||||||
Net Income | 103 | 539 | (25 | ) | N.M | |||||||||||
|
|
|
|
|
|
|
| |||||||||
Net Income before impairment of assets | 103 | (78 | ) | (25 | ) | N.M | ||||||||||
|
|
|
|
|
|
|
| |||||||||
Financial results, net, for 1Q21 represented a loss of US$49 million compared to the US$172 million loss posted in 1Q20, mainly driven by a 18.9% y/y decrease in net interest expense to US$194 million during 1Q21, as a result of a lower average debt compared to the same period of 2020. Also, a positive charge of US$17 million was recorded during 1Q21 for the valuation at fair value of financial assets compared to a negative charge of US$44 million in 1Q20. In contrast, net FX results were US$13 million lower y/y (US$99 million in 1Q21 versus US$112 million in 1Q20), mainly related to the impact that the devaluation had on our net liabilities.
As a whole, net income for the quarter represented a loss of US$25 million, compared to a gain of US$103 million over the same period of 2020.
6
Table of Contents
3. EBITDA AND ADJUSTED EBITDA RECONCILIATION
Reconciliation of Adjusted EBITDA Unaudited Figures, in US$ million | 1Q20 | 4Q20 | 1Q21 | Y/Y D | ||||||||||||
Net Income | 103 | 539 | (25 | ) | N.M | |||||||||||
Financial results, net | 172 | (24 | ) | 49 | -71.7 | % | ||||||||||
Interests in companies and joint ventures | (22 | ) | (56 | ) | (58 | ) | N.M | |||||||||
Income tax | (12 | ) | 90 | 112 | N.M | |||||||||||
Unproductive exploratory drillings | 0 | 0 | — | -100.0 | % | |||||||||||
Depreciation & amortization | 799 | 535 | 747 | -6.4 | % | |||||||||||
Impairment of assets | — | (822 | ) | — | N.M | |||||||||||
|
|
|
|
|
|
|
| |||||||||
EBITDA | 1,040 | 263 | 825 | -20.7 | % | |||||||||||
|
|
|
|
|
|
|
| |||||||||
Leasing | (85 | ) | (80 | ) | (61 | ) | -28.3 | % | ||||||||
Other adjustments | (105 | ) | 1 | 2 | N.M | |||||||||||
|
|
|
|
|
|
|
| |||||||||
Adjusted EBITDA | 851 | 183 | 767 | -9.9 | % | |||||||||||
|
|
|
|
|
|
|
| |||||||||
Adjusted EBITDA increased 318% q/q, resulting in a much smaller gap with 1Q20 at -9.9%. The y/y difference mainly resulted from lower prices in dollars of our main products, diesel and gasoline, in addition to the lower output for our upstream operations, partially offset by a higher diesel and gasoline volumes dispatched, and the materialization of cost efficiencies. Sequentially, the increase was backed by the fast recovery in demand for our main products, higher average prices in dollar terms, and the results of our company wide cost-cutting program. It is worth noting that Adjusted EBITDA margin reached 29%, back in line with historical levels.
The Adjusted EBITDA calculation include or exclude several items that can be considered infrequent which are the following.
| • | 1Q21: Includes stand-by costs for US$29 million. |
| • | 4Q20: Includes, primarily, stand-by costs for US$38 million, charges related to the Voluntary Retirement Program for US$40 million, and a US$118 million loss related to the early termination of the Floating LNG contract. |
| • | 1Q20: Includes stand-by costs for US$17 million, and excludes the recognition of the acceleration of the promote of Schlumberger’s stake in Bandurria Sur for US$104 million. |
The reconciliation for each one of our segments between EBITDA and Adjusted EBITDA for 1Q21 is presented in the table below.
EBITDA breadkdown by segment Unaudited Figures, in US$ million | Upstream | Downstream | Gas & Energy | Corporate & Other | Consolid. Adjustments | Total | ||||||||||||||||||
Operating income | 19 | 199 | (31 | ) | (42 | ) | (66 | ) | 78 | |||||||||||||||
Depreciation & amortization | 581 | 134 | 12 | 19 | — | 747 | ||||||||||||||||||
Unproductive exploratory drillings | — | — | — | — | — | — | ||||||||||||||||||
Impairment of assets | — | — | — | — | — | — | ||||||||||||||||||
|
|
|
|
|
|
|
|
|
|
|
| |||||||||||||
EBITDA | 600 | 333 | (19 | ) | (22 | ) | (66 | ) | 825 | |||||||||||||||
|
|
|
|
|
|
|
|
|
|
|
| |||||||||||||
Leasing | (39 | ) | (16 | ) | (6 | ) | — | — | (61 | ) | ||||||||||||||
Other adjustments | 0 | 1 | 2 | (1 | ) | — | 2 | |||||||||||||||||
|
|
|
|
|
|
|
|
|
|
|
| |||||||||||||
Adjusted EBITDA | 561 | 317 | (23 | ) | (23 | ) | (66 | ) | 767 | |||||||||||||||
|
|
|
|
|
|
|
|
|
|
|
| |||||||||||||
7
Table of Contents
4. ANALYSIS OF RESULTS BY BUSINESS SEGMENT
Upstream Financials Unaudited Figures, in US$ million | 1Q20 | 4Q20 | 1Q21 | Y/Y D | ||||||||||||
Crude oil | 1,008 | 740 | 950 | -5.7 | % | |||||||||||
Natural gas | 318 | 244 | 285 | -10.3 | % | |||||||||||
Other | (10 | ) | (9 | ) | 12 | N.M | ||||||||||
|
|
|
|
|
|
|
| |||||||||
Revenues | 1,317 | 975 | 1,247 | -5.2 | % | |||||||||||
|
|
|
|
|
|
|
| |||||||||
Depreciation | (573 | ) | (327 | ) | (550 | ) | -4.0 | % | ||||||||
Lifting cost | (524 | ) | (413 | ) | (411 | ) | -21.5 | % | ||||||||
Royalties | (184 | ) | (141 | ) | (171 | ) | -7.0 | % | ||||||||
Exploration expenses | (12 | ) | (9 | ) | (2 | ) | -84.9 | % | ||||||||
Other | (13 | ) | (158 | ) | (95 | ) | N.M | |||||||||
|
|
|
|
|
|
|
| |||||||||
Operating income before impairment of assets | 11 | (73 | ) | 19 | 69.1 | % | ||||||||||
|
|
|
|
|
|
|
| |||||||||
Impairment of assets | — | 828 | — | N.M | ||||||||||||
|
|
|
|
|
|
|
| |||||||||
Operating income | 11 | 755 | 19 | 69.1 | % | |||||||||||
|
|
|
|
|
|
|
| |||||||||
Depreciation & amortization | 616 | 356 | 581 | -5.7 | % | |||||||||||
Unproductive exploratory drillings | 0 | 0 | — | -100.0 | % | |||||||||||
Impairment of assets | — | (828 | ) | — | N.M | |||||||||||
|
|
|
|
|
|
|
| |||||||||
EBITDA | 628 | 283 | 600 | -4.4 | % | |||||||||||
|
|
|
|
|
|
|
| |||||||||
Leasing | (39 | ) | (33 | ) | (39 | ) | -0.3 | % | ||||||||
Other adjustments | (104 | ) | (0 | ) | 0 | N.M | ||||||||||
|
|
|
|
|
|
|
| |||||||||
Adjusted EBITDA | 485 | 250 | 561 | 15.7 | % | |||||||||||
|
|
|
|
|
|
|
| |||||||||
Capex | 477 | 362 | 425 | -10.9 | % | |||||||||||
|
|
|
|
|
|
|
| |||||||||
Revenues decreased by a slight 5.2% compared to 1Q20, reaching US$1,247 million, but experienced a 28.0% sequential expansion. The reason behind the y/y performance was a reduction in both crude oil and natural gas production, partially offset by higher prices for both crude oil and gas. As a result, crude oil revenues decreased 5.7% y/y as production contracted by 7.8% y/y, despite the 3.1% y/y recovery in prices in dollars. For natural gas, revenues declined 10.3% y/y as output went down by 16.8% but was partially offset by higher prices of 4.5% supported by the new Plan GasAR. Sequentially, revenues increased 28.0%, driven by a strong recovery of prices, up 25.2% and 22.8% for crude oil and natural gas, respectively, in addition to higher total production of 3.3% mainly driven by an expansion in our shale oil production.
Operating costs for the period decreased y/y mainly due to the following:
| • | Lifting costs decreased 21.5% y/y mainly due to the results of our cost-cutting program that allowed us to resume activity in a much more efficient basis, in addition to lower production levels. |
| • | Royalties went down by 7.0% y/y principally due to lower production. Royalties in connection with crude oil decreased 6.8%, while the charge related to natural gas declined by 7.7%. |
| • | Transportation costs (included in the “Other” category) of US$34 million decreased by 29.5% y/y mainly as we renegotiated contracts with service providers and due to lower activity. |
| • | Depreciation decreased 4.0% compared to 1Q21, mainly due to a decrease in our capex program in 2020, which affected the accounting value of the assets subject to depreciation when comparing to the same period of last year. |
8
Table of Contents
Exploration expenses decreased 84.9% y/y in relation to 1Q20 mainly due to lower expenses in connection to exploratory studies.
Other costs were negative US$95 million in 1Q21, compared to the negative US$13 million recorded in 1Q20, as the latter includes a positive charge of US$104 million from the acceleration of promote of Schlumberger’s stake in Bandurria Sur – following the acquisition by Shell Compañía Argentina de Petróleo S.A. and Equinor Argentina AS of the entire Schlumberger Oilfield Eastern Ltd (“SPM”) share package in Bandurria Sur in January 2020.
As a result, Adjusted EBITDA reached US$561 million during the quarter, expanding 15.7% y/y and 124.7% q/q.
Unit Cash Costs Unaudited Figures, in US$/boe | 1Q20 | 4Q20 | 1Q21 | Y/Y D | ||||||||||||
Lifting Cost | 11.4 | 10.6 | 10.5 | -8.0 | % | |||||||||||
Royalties and other taxes | 4.7 | 3.9 | 4.8 | 2.8 | % | |||||||||||
Other Costs | 1.6 | 3.3 | 1.7 | 5.6 | % | |||||||||||
|
|
|
|
|
|
|
| |||||||||
Total Cash Costs (US$/boe) | 17.7 | 17.8 | 17.0 | -3.9 | % | |||||||||||
|
|
|
|
|
|
|
| |||||||||
In 1Q21, on a per unit basis, our cash costs decreased 3.9% y/y driven by lower lifting costs of 8.0%, due to efficiency gains and the dilution of Peso denominated costs. Sequentially, unit cash costs decreased 4.8% as the higher royalties due to the increase in prices were more than offset by the lower lifting and other cost backed by the consolidation of cost efficiencies.
Upstream Operating data Unaudited Figures | 1Q20 | 4Q20 | 1Q21 | Y/Y D | ||||||||||||
Net Production Breakdown | ||||||||||||||||
|
|
|
|
|
|
|
| |||||||||
Crude Production (Kbbld) | 225.1 | 199.0 | 207.7 | -7.8 | % | |||||||||||
|
|
|
|
|
|
|
| |||||||||
Conventional | 178.2 | 157.1 | 158.3 | -11.2 | % | |||||||||||
Shale | 42.3 | 38.8 | 46.4 | 9.6 | % | |||||||||||
Tight | 4.6 | 3.2 | 3.0 | -35.6 | % | |||||||||||
|
|
|
|
|
|
|
| |||||||||
NGL Production (Kbbld) | 44.9 | 10.8 | 29.5 | -34.4 | % | |||||||||||
|
|
|
|
|
|
|
| |||||||||
Conventional | 25.0 | 7.4 | 16.3 | -34.8 | % | |||||||||||
Shale | 16.9 | 4.1 | 12.0 | -29.0 | % | |||||||||||
Tight | 3.1 | -0.7 | 1.2 | -61.0 | % | |||||||||||
|
|
|
|
|
|
|
| |||||||||
Gas Production (Mm3d) | 38.2 | 33.9 | 31.8 | -16.8 | % | |||||||||||
|
|
|
|
|
|
|
| |||||||||
Conventional | 20.0 | 19.0 | 18.0 | -9.9 | % | |||||||||||
Shale | 8.8 | 7.2 | 6.4 | -27.8 | % | |||||||||||
Tight | 9.4 | 7.6 | 7.4 | -21.3 | % | |||||||||||
|
|
|
|
|
|
|
| |||||||||
Total Production (Kboed) | 510.3 | 422.8 | 437.0 | -14.4 | % | |||||||||||
|
|
|
|
|
|
|
| |||||||||
Conventional | 329.0 | 284.3 | 288.0 | -12.5 | % | |||||||||||
Shale | 114.6 | 88.4 | 98.4 | -14.2 | % | |||||||||||
Tight | 66.7 | 50.2 | 50.6 | -24.1 | % | |||||||||||
Average realization prices | ||||||||||||||||
Crude Oil (USD/bbl) | 48.6 | 40.0 | 50.1 | 3.1 | % | |||||||||||
Natural Gas (USD/MMBTU) | 2.8 | 2.4 | 2.9 | 4.5 | % | |||||||||||
Natural gas price for 1Q20 has been restated due to the change in the accrual of the Plan Gas and the adjustments for final billing.
Total production for 1Q21 decreased 14.4% y/y to 437.0 Kboed as output was affected by the natural decline of our fields and the lower activity since April 2020 given the measures adopted in response to the pandemic, despite the partial and gradual resumption of activity since mid-3Q20. In this regard, crude oil production declined 7.8%, to 207.7 Kbbld, with a reduction in conventional production of 11.2%, partially offset by an increase in
9
Table of Contents
shale of 9.6%. In turn, natural gas decreased 16.8%, to 31.8 Mm3d mainly driven by the natural decline of our fields. NGL decreased 34.4% y/y following the lower natural gas production, lower processing levels in Mega – due to maintenance works in the Dow Chemical Complex from the end of January until mid- February –, and the reclassification between natural gas and NGL on some non-operated fields explained in the following paragraph.
Sequentially, production expanded 3.3% as a result of the increase in investments and activity, focused on our shale oil core hub. Consequently, crude oil increased by 4.3% driven by a 19.7% increase in shale with production in our core hub (Loma Campana, La Amarga Chica, and Bandurria Sur) reaching its record high in March. The sequential jump in NGL production was due to the reallocation done last quarter on how natural gas and natural gas liquids volumes were recorded for the year 2020 in certain joint operations that are not operated by the company. In contrast, natural gas production contracted 6.2% due to the aforementioned reallocation and the natural decline of the fields.
The realization price of crude oil in 1Q21 increased by 3.1% y/y, and 25.2% q/q to US$50.1/bbl partially reflecting the recovery in international prices. Although the Brent averaged US$61/bbl during the quarter, a transition scheme was agreed between local refiners and producers to set the reference Brent price for local transactions at US$55/bbl. The goal was to smooth out the evolution of crude prices, minimizing volatility and allowing for a gradual pass-through to the pump, leaving room for reasonable margins within the downstream portion of the value chain while, at same time, it should not have an impact in activity as producers’ realized prices, and thus profitability, has improved.
The average price for natural gas for the quarter was US$2.9/MMBTU, increasing 4.5% y/y and 22.8% q/q supported by the new Plan GasAR – this quarter was the first to be fully impacted by the Plan. The price for 1Q21 included US$0.23 of subsidies compared to US$0.12 in 1Q20 and US$0.17 in 4Q20.
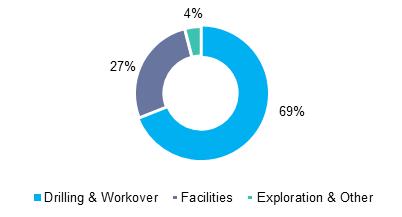
CAPEX:
In 1Q21, upstream capex totaled US$425 million, 10.9% lower y/y still affected by the lower level of activity versus the same period of the previous year and delays in execution. On a sequential basis, investments expanded 17.4% due to the gradual resumption of activity.
During 1Q21, activity was mainly focused on shale oil and shale gas, with Loma Campana, La Amarga Chica, Bandurria Sur, and Lindero Atravesado being the main blocks under development for oil, and Rincón del Mangrullo, Aguada de la Arena, La Ribera Block I, Aguada Pichana Oeste and La Calera for natural gas.
For conventional oil, activity was focused on primary recovery and development projects in Manantiales Behr blocks, Seco León, El Trébol, Cañadón Yatel, Las Heras, and Desfiladero Bayo, as well as secondary recovery projects mainly in Los Perales, Barranca Baya and Chihuido Sierra Negra blocks. At the same time, we continued with tertiary recovery projects mainly in Manantiales Behr, Los Perales and Desfiladero Bayo blocks.
Regarding exploration activity in 1Q21, the YPF.SC.AP.xp-19 well was drilled in the Province of Santa Cruz, which is currently awaiting completion.
10
Table of Contents
Downstream Financials Unaudited Figures, in US$ million | 1Q20 | 4Q20 | 1Q21 | Y/Y D | ||||||||||||
Diesel | 996 | 826 | 921 | -7.5 | % | |||||||||||
Gasoline | 669 | 494 | 613 | -8.4 | % | |||||||||||
Other domestic market | 331 | 398 | 462 | 39.5 | % | |||||||||||
Export market | 357 | 217 | 276 | -22.6 | % | |||||||||||
|
|
|
|
|
|
|
| |||||||||
Revenues | 2,353 | 1,934 | 2,273 | -3.4 | % | |||||||||||
|
|
|
|
|
|
|
| |||||||||
Depreciation | (94 | ) | (93 | ) | (90 | ) | -4.6 | % | ||||||||
Refining cost | (114 | ) | (113 | ) | (106 | ) | -6.6 | % | ||||||||
Fuels imports | (97 | ) | (30 | ) | (75 | ) | -23.1 | % | ||||||||
Crude oil purchases (intersegment + third parties) | (1,246 | ) | (912 | ) | (1,203 | ) | -3.5 | % | ||||||||
Biofuel purchases | (161 | ) | (50 | ) | (108 | ) | -32.6 | % | ||||||||
Other | (574 | ) | (626 | ) | (492 | ) | -14.3 | % | ||||||||
|
|
|
|
|
|
|
| |||||||||
Operating income before impairment of assets | 67 | 110 | 199 | N.M | ||||||||||||
|
|
|
|
|
|
|
| |||||||||
Impairment of assets | — | — | — | N.M | ||||||||||||
|
|
|
|
|
|
|
| |||||||||
Operating income | 67 | 110 | 199 | N.M | ||||||||||||
|
|
|
|
|
|
|
| |||||||||
Depreciation & amortization | 145 | 147 | 134 | -7.7 | % | |||||||||||
Impairment of assets | — | — | — | N.M | ||||||||||||
|
|
|
|
|
|
|
| |||||||||
EBITDA | 212 | 257 | 333 | 56.6 | % | |||||||||||
|
|
|
|
|
|
|
| |||||||||
Leasing | (26 | ) | (25 | ) | (16 | ) | -38.1 | % | ||||||||
Other adjustments | 0 | 1 | 1 | 62.8 | % | |||||||||||
|
|
|
|
|
|
|
| |||||||||
Adjusted EBITDA | 187 | 233 | 317 | 69.8 | % | |||||||||||
|
|
|
|
|
|
|
| |||||||||
Capex | 85 | 131 | 51 | -39.4 | % | |||||||||||
|
|
|
|
|
|
|
| |||||||||
Adjusted EBITDA includes holding results from crude oil at transfer price of US$(156) million in 1Q20, US$51 million in 4Q20, and US$108 million in 1Q21.
Revenues decreased 3.4% compared to 1Q20, reaching US$2,273 million mainly driven by lower prices for our main products. While prices contracted, the easing of mobility restrictions during 1Q21 more than offset the combination of pre-pandemic demand levels for January and February 2020 and the large drop seen in March – due to the stringent lockdown measures announced at the beginning of the outbreak –, allowing for an increase in demand for our refined products in the domestic market.
Diesel revenues in 1Q21 – 41% of the segment’s sales – decreased 7.5% y/y due to lower prices in dollars for the diesel mix of 12.5%, partially offset by higher volumes of 5.2%. In the same line, gasoline revenues – 27% of the downstream sales – decreased by 8.4% y/y due to a contraction in prices (-10.3%) partially offset by an expansion in volumes (1.4%). It is worth noting that the mix of premium products improved, with volumes increasing 7.0% and 2.4% for Infinia Diesel (premium diesel) and Nafta Infinia (premium gasoline), respectively. Other sales in the domestic market increased by 39.5% y/y mainly supported by higher sales of fuel oil, petroleum coal, lubricants, fertilizers, LPG, petrochemicals and asphalts, partially offset by lower sales of jet fuel and crude oil.
11
Table of Contents
Export revenues decreased 22.6% y/y driven by a significant reduction in jet fuel demand, lower sales of diesel and virgin naphtha, partially offset by higher sales of grain and flours.
On a sequential basis, revenues increased 17.5% driven by both higher domestic and export sales as volumes and prices of most products expanded following the recovery in international prices and our active pricing strategy at the pump. Gasoline sales jumped 24.2% q/q on a recovery in volumes (14.7%) and prices in dollars (8.9%). On the diesel side, revenues showed the same upward trend increasing 11.5% q/q on higher prices (11.4%) and stable volumes (-0.1%).
Operating costs for the segment decreased y/y mainly due to the following:
| • | Refining costs decreased by 6.6% mainly motivated by lower charges related to repair and maintenance, electricity and other supplies, personnel expenses, and consumption of materials and spare parts. |
| • | Crude oil purchases decreased by 3.5% driven by lower crude volumes transferred from the Upstream segment (-8.7%), partially offset by higher volumes bought to third parties (3.6%) and higher prices. |
| • | Biofuel purchases decreased by 32.6% due to lower purchases of biodiesel (-63.4%) driven by a contraction in volumes despite a higher price, which more than offset the increase in bioethanol purchases (5.6%) driven by higher prices. |
| • | Fuel imports decreased 23.1%, mainly driven by a decrease of 47.6% for diesel and 58.0% for jet fuel on lower volumes, partially offset by higher purchases of premium gasoline by 62.5% due to higher volumes. |
As a result, Adjusted EBITDA reached US$317 million during the quarter, expanding 69.8% y/y. However, when excluding holding results from crude oil at transfer price to better reflect the profitability of the segment, Adjusted EBITDA figure goes down to US$210 million, contracting 38.8% y/y.
12
Table of Contents
Downstream Operating data Unaudited Figures | 1Q20 | 4Q20 | 1Q21 | Y/Y D | ||||||||||||
Crude processed (Kbbld) | 275.4 | 238.2 | 273.4 | -0.7 | % | |||||||||||
Refinery utilization (%) | 86 | % | 75 | % | 83 | % | -287 | bps | ||||||||
Sales volume | ||||||||||||||||
|
|
|
|
|
|
|
| |||||||||
Sales of refined products (Km3) | 4,101 | 4,056 | 4,140 | 1.0 | % | |||||||||||
|
|
|
|
|
|
|
| |||||||||
Total domestic market | 3,541 | 3,890 | 3,901 | 10.2 | % | |||||||||||
of which Gasoline | 1,222 | 1,081 | 1,240 | 1.4 | % | |||||||||||
of which Diesel | 1,722 | 1,812 | 1,811 | 5.2 | % | |||||||||||
Total export market | 561 | 166 | 239 | -57.4 | % | |||||||||||
|
|
|
|
|
|
|
| |||||||||
Sales of petrochemical products (Ktn) | 227 | 152 | 247 | 9.1 | % | |||||||||||
|
|
|
|
|
|
|
| |||||||||
Domestic market | 166 | 116 | 166 | -0.1 | % | |||||||||||
Export market | 61 | 36 | 81 | 34.5 | % | |||||||||||
|
|
|
|
|
|
|
| |||||||||
Sales of grain, flours and oils (Ktn) | 238 | 217 | 294 | 23.9 | % | |||||||||||
|
|
|
|
|
|
|
| |||||||||
Domestic market | 33 | 29 | 11 | -67.2 | % | |||||||||||
Export market | 205 | 189 | 284 | 38.6 | % | |||||||||||
|
|
|
|
|
|
|
| |||||||||
Sales of fertilizers (Ktn) | 91 | 131 | 186 | N.M | ||||||||||||
|
|
|
|
|
|
|
| |||||||||
Domestic market | 91 | 131 | 186 | N.M | ||||||||||||
Average prices of fuels in the domestic market | ||||||||||||||||
Gasoline (USD/m3) | 533 | 439 | 478 | -10.3 | % | |||||||||||
Diesel (USD/m3) | 576 | 453 | 504 | -12.5 | % | |||||||||||
Average domestic prices for gasoline and diesel are net of taxes but include commissions and fuel bonuses. These prices are calculated as total realized revenues divided by volume sold in each period.
Nominal capacity at 328.1kbbl/d in 1Q21.
The crude oil processed during the quarter was 273.4 Kbbld, slightly down 0.7% y/y. 1Q21 utilization was affected by a scheduled stoppage at the La Plata Refinery from the end of February that continued throughout the month of March. Sequentially, the processed crude oil increased 14.8% q/q in line with the recovery in demand.
Average diesel and gasoline prices in dollars in the local market dropped 12.5% y/y and 10.3% y/y, respectively, mainly driven by the devaluation, as in Pesos, there was an y/y increase of 26.7% for the diesel mix and 30.2% for gasoline. Since demand showed signs of recovery, we started with periodic adjustments at the pump since August 2020, which allowed us to stabilize our net prices in dollars, and more recently, recover some margin. In this line, when looking on a sequential basis, average price for the diesel mix increased 11.4% in dollars, with gasoline following the uptrend at 8.9%.
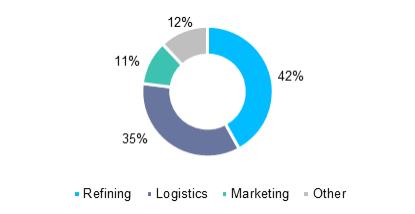
CAPEX:
Downstream capex totaled US$51 million, decreasing 39.4% y/y and 60.8% q/q. During 1Q21, we continued performing engineering developments and equipment purchases for the new diesel and gasoline hydrotreating units to comply with the new fuel specifications under Resolution 576/2019 of the Ministry of Treasury.
At the Luján de Cuyo Refinery, works to modernize the MTBE unit to ETBE continued, with completion estimated for the last quarter of 2021. In the city of Rosario, the construction on the new airplane refueling facility is being completed, which is expected to be inaugurated within the next few months.
13
Table of Contents
Despite the global context, we continued investing to maintain safety conditions for our personnel and the environment in the refining, logistics and dispatch facilities for petroleum products, taking all the necessary precautions to minimize the risk of COVID-19 spreading.
Gas & Power Financials Unaudited Figures, in US$ million | 1Q20 | 4Q20 | 1Q21 | Y/Y D | ||||||||||||
Natural gas as producers (intersegment + third parties) | 308 | 243 | 285 | -7.4 | % | |||||||||||
Natural gas retail segment | 92 | 82 | 57 | -37.4 | % | |||||||||||
Other | 71 | 16 | 27 | -61.4 | % | |||||||||||
|
|
|
|
|
|
|
| |||||||||
Revenues | 470 | 341 | 370 | -21.4 | % | |||||||||||
|
|
|
|
|
|
|
| |||||||||
Depreciation | (6 | ) | (5 | ) | (6 | ) | -0.8 | % | ||||||||
Natural gas purchases (intersegment + third parties) | (325 | ) | (247 | ) | (288 | ) | -11.3 | % | ||||||||
Other | (158 | ) | (219 | ) | (107 | ) | -32.4 | % | ||||||||
|
|
|
|
|
|
|
| |||||||||
Operating income before impairment of assets | (18 | ) | (130 | ) | (31 | ) | 69.9 | % | ||||||||
|
|
|
|
|
|
|
| |||||||||
Impairment of assets | — | (6 | ) | — | N.M | |||||||||||
|
|
|
|
|
|
|
| |||||||||
Operating income | (18 | ) | (135 | ) | (31 | ) | 69.9 | % | ||||||||
|
|
|
|
|
|
|
| |||||||||
Depreciation & amortization | 20 | 11 | 12 | -39.4 | % | |||||||||||
Impairment of assets | — | 6 | — | N.M | ||||||||||||
|
|
|
|
|
|
|
| |||||||||
EBITDA | 2 | (119 | ) | (19 | ) | N.M | ||||||||||
|
|
|
|
|
|
|
| |||||||||
Leasing | (20 | ) | (16 | ) | (6 | ) | -70.5 | % | ||||||||
Other adjustments | 0 | (1 | ) | 2 | N.M | |||||||||||
|
|
|
|
|
|
|
| |||||||||
Adjusted EBITDA | (18 | ) | (136 | ) | (23 | ) | 29.2 | % | ||||||||
|
|
|
|
|
|
|
| |||||||||
Capex | 13 | 29 | 4 | -70.2 | % | |||||||||||
|
|
|
|
|
|
|
| |||||||||
Sales of natural gas as producers include domestic and external markets.
Revenues of the segment decreased 21.4% y/y, mainly driven by a 7.4% decrease in sales of natural gas as producers in the local market and abroad – 77% of segment’s sales – given the lower volumes due to the aforementioned contraction in production. This was partially offset by better prices in dollars supported by the new Plan GasAR. Natural gas sales mainly from our controlled company Metrogas S.A. to the retail distribution segment (residential customers and small businesses) and to large customers (power plants and industries) – 16% of segment’s sales – decreased by 37.4% mainly on the back of lower gas sold to power plants and a contraction in the average price perceived through its distribution network due to the lack of tariff updates.
Total operating costs decreased y/y primarily due to a lower figure for purchases of natural gas of (-11.3% y/y) on decreased volumes – volumes transferred from the Upstream segment were down by 15.2%, while the reduction of purchases from third parties was 58.3%.
14
Table of Contents
Corporate & Other Financials Unaudited Figures, in US$ million | 1Q20 | 4Q20 | 1Q21 | Y/Y D | ||||||||||||
Revenues | 172 | 161 | 144 | -16.6 | % | |||||||||||
|
|
|
|
|
|
|
| |||||||||
Operating costs | (228 | ) | (240 | ) | (186 | ) | -18.6 | % | ||||||||
|
|
|
|
|
|
|
| |||||||||
Operating income before impairment of assets | (56 | ) | (79 | ) | (42 | ) | -24.8 | % | ||||||||
|
|
|
|
|
|
|
| |||||||||
Impairment of assets | — | (0 | ) | — | N.M | |||||||||||
Operating income | (56 | ) | (79 | ) | (42 | ) | -24.8 | % | ||||||||
Depreciation & amortization | 17 | 21 | 19 | 15.8 | % | |||||||||||
Impairment of assets | — | 0 | — | N.M | ||||||||||||
|
|
|
|
|
|
|
| |||||||||
EBITDA | (39 | ) | (58 | ) | (22 | ) | -42.3 | % | ||||||||
|
|
|
|
|
|
|
| |||||||||
Leasing | (0 | ) | (5 | ) | — | N.M | ||||||||||
Other adjustments | (2 | ) | 1 | (1 | ) | -69.1 | % | |||||||||
|
|
|
|
|
|
|
| |||||||||
Adjusted EBITDA | (41 | ) | (62 | ) | (23 | ) | -43.4 | % | ||||||||
|
|
|
|
|
|
|
| |||||||||
Capex | 23 | 16 | 7 | -69.9 | % | |||||||||||
|
|
|
|
|
|
|
| |||||||||
This business segment involves mainly corporate costs and other activities that are not reported in any of the previously mentioned business segments.
Corporate adjusted EBITDA for 1Q21 represented a loss of US$23 million, which compares favorably with a loss of US$41 million in 1Q20, mainly on cost-efficiencies due to the voluntary retirement program executed in 2020 and high expected losses from ongoing projects recorded at our controlled company A Evangelista S.A. during 1Q20.
4.5. CONSOLIDATION ADJUSTMENTS
Consolidation Adjustments Financials Unaudited Figures, in US$ million | 1Q20 | 4Q20 | 1Q21 | Y/Y D | ||||||||||||
Revenues | (1,480 | ) | (1,141 | ) | (1,386 | ) | -6.4 | % | ||||||||
|
|
|
|
|
|
|
| |||||||||
Operating costs | 1,717 | 1,040 | 1,320 | -23.1 | % | |||||||||||
|
|
|
|
|
|
|
| |||||||||
Operating income before impairment of assets | 237 | (101 | ) | (66 | ) | N.M | ||||||||||
|
|
|
|
|
|
|
| |||||||||
Impairment of assets | — | — | — | N.M | ||||||||||||
|
|
|
|
|
|
|
| |||||||||
Operating income | 237 | (101 | ) | (66 | ) | N.M | ||||||||||
|
|
|
|
|
|
|
| |||||||||
Depreciation & amortization | — | — | — | N.M | ||||||||||||
Impairment of assets | — | — | — | N.M | ||||||||||||
|
|
|
|
|
|
|
| |||||||||
EBITDA | 237 | (101 | ) | (66 | ) | N.M | ||||||||||
|
|
|
|
|
|
|
| |||||||||
Leasing | — | — | — | N.M | ||||||||||||
Other adjustments | — | — | — | N.M | ||||||||||||
|
|
|
|
|
|
|
| |||||||||
Adjusted EBITDA | 237 | (101 | ) | (66 | ) | N.M | ||||||||||
|
|
|
|
|
|
|
| |||||||||
Consolidation adjustments to eliminate results among business segments not transferred to third parties was negative US$66 million in 1Q21 versus positive US$237 million in 1Q20. In 1Q21, the gap between the transfer price across businesses and the cost of production of the company’s inventories widened mainly due to the increase in the international price of the Brent crude oil that affected transfer prices, while in 1Q20 it decreased due to the drop in Brent.
15
Table of Contents
5. LIQUIDITY AND SOURCES OF CAPITAL
Summary Consolidated Cash Flow Unaudited Figures, in US$ million | 1Q20 | 4Q20 | 1Q21 | Y/Y D | ||||||||||||
Cash BoP | 1,106 | 784 | 650 | -41.2 | % | |||||||||||
Net cash flow from operating activities | 961 | 849 | 1,054 | 9.6 | % | |||||||||||
Net cash flow from investing activities | (688 | ) | (540 | ) | (523 | ) | -23.9 | % | ||||||||
Net cash flow from financing activities | (293 | ) | (377 | ) | (522 | ) | 78.1 | % | ||||||||
FX adjustments & other | (12 | ) | (66 | ) | (46 | ) | N.M | |||||||||
|
|
|
|
|
|
|
| |||||||||
Cash EoP | 1,074 | 650 | 612 | -43.0 | % | |||||||||||
|
|
|
|
|
|
|
| |||||||||
Investment in financial assets | 85 | 344 | 382 | N.M | ||||||||||||
|
|
|
|
|
|
|
| |||||||||
Cash + short-term investments EoP | 1,159 | 994 | 995 | -14.2 | % | |||||||||||
|
|
|
|
|
|
|
| |||||||||
FCF | (85 | ) | 182 | 284 | N.M | |||||||||||
|
|
|
|
|
|
|
| |||||||||
FCF = Cash flow from Operations less capex (Investing activities), M&A (Investing activities), and interest and leasing payments (Financing activities).
BoP stands for Beginning of period / EoP stands of End of period.
Net cash flows from operating activities amounted to US$1,054 million in 1Q21, increasing 9.6% y/y compared to the positive US$961 million in 1Q20. The y/y increase was mainly due to a decrease in working capital needs mainly motivated by a decrease in inventory levels, and the collections related to the legacy Plan Gas, despite the contraction in Adjusted EBITDA and the scheduled payments related to the termination of the contract with Exmar and the voluntary retirement program.
Net cash flows from investing activities were negative US$523 million, compared to negative US$688 million in 1Q20 mainly driven by a decrease in the acquisition of PP&E, which totaled US$493 million, including purchases of materials. This was partially offset by the collection of US$104 in 1Q20 in connection to the aforementioned transaction in the Bandurria Sur block.
Net cash flows from financing activities amounted to negative US$522 million, compared to negative US$293 million in 1Q20, mainly driven by a negative net borrowing figure of US$246 million compared to a positive amount of US$69 million in 1Q20, partially compensated by a reduction in interest payments which declined about 23.7%, totaling US$200 million in 1Q21 compared to US$262 million during the same period in 2020. The net negative borrowing for the quarter was concentrated in the amortization of the 2021 Notes, net of the effects of the debt exchange as most of the other maturities were rolled over. It is worth noting that during February, right after the consummation of the Global Debt Exchange, we accessed the local capital market being able to successfully raise over US$120 million equivalent through the combination of a reopening of a 3-year dollar-linked security and a new 42-month inflation-linked note, both providing very competitive financing conditions.
Free cash flow during the quarter reached US$284 million, an improvement compared to the outflow of US$85 million registered in 1Q20 and the inflow of US$182 million registered last quarter. The improvement was related to the aforementioned recovery in profitability and lower CAPEX, which allowed for a significant reduction in our net debt.
The previously described cash generation, together with the company’s investments in Argentine sovereign bonds and Treasury notes (US$382 million at market value), resulted in a position of cash and cash equivalents of US$995 million as of March 31, 2021, almost unchanged from the liquidity position we had in 4Q20.
16
Table of Contents
The Peso portion of our cash and cash equivalents reached 76% – compared to 18% in 1Q20 and 75% in 4Q20 – as Communication “A” 7030 from the Argentine Central Bank restricts corporations from holding liquid assets abroad if they want to continue having access to the official FX market. However, as of March 31st 2021, our net FX exposure related to our liquidity position, including our peso denominated debt and FX hedge of our cash, stood at around 20%.
Net debt breakdown Unaudited Figures, in US$ million | 1Q20 | 4Q20 | 1Q21 | Q/Q D | ||||||||||||
Short-term debt | 2,797 | 1,793 | 1,187 | -33.8 | % | |||||||||||
Long-term debt | 6,002 | 6,277 | 6,560 | 4.5 | % | |||||||||||
|
|
|
|
|
|
|
| |||||||||
Total debt | 8,799 | 8,070 | 7,747 | -4.0 | % | |||||||||||
|
|
|
|
|
|
|
| |||||||||
Avg. Interest rate for AR$-debt | 36.0 | % | 34.7 | % | 34.9 | % | ||||||||||
Avg. Interest rate for US$-debt | 7.6 | % | 7.5 | % | 7.5 | % | ||||||||||
% of debt in AR$ | 9 | % | 6 | % | 6 | % | ||||||||||
|
|
|
|
|
|
|
| |||||||||
Cash + short term investments | 1,159 | 994 | 995 | 0.1 | % | |||||||||||
|
|
|
|
|
|
|
| |||||||||
% of cash in AR$ | 18 | % | 75 | % | 76 | % | ||||||||||
|
|
|
|
|
|
|
| |||||||||
Net debt | 7,640 | 7,076 | 6,752 | -4.6 | % | |||||||||||
|
|
|
|
|
|
|
| |||||||||
Average interest rates for AR$ and US$ debt refer to YPF on a stand-alone basis.
As of March 31, 2021, YPF’s consolidated net debt totaled US$6,752 million, decreasing by US$888 million y/y, and reaching a level not seen since 2015, driven by a 12.0% reduction in total debt to US$7,747 million, which more than offset a US$164 million contraction in our cash position. On a sequential basis, net debt declined by US$324 million, as net cash generated in our operations was used to reduce debt instead of building up the liquidity position given our strategy to maintain liquidity relatively stable to avoid incremental exposure to FX volatility or higher cost of carry.
Despite the lower net debt level, our net-debt-to-last-twelve-month-adjusted-EBITDA ratio was 4.9x, stable q/q but higher than the 2.2x ratio in 1Q20 due to the deterioration of our Adjusted EBITDA over the most recent quarters.
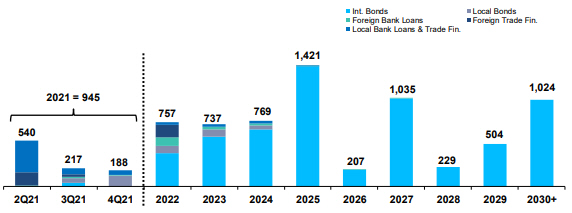
The aforementioned reduction in our indebtedness together with the cash relief for 2021 and 2022 from the Global Debt Exchange executed earlier this year, resulted in a significantly more manageable maturity profile, particularly in relation to short-term maturities. Furthermore, most maturities coming due in the remainder of this year are primarily concentrated in local loans and bonds, with just over US$250 million in cross-border maturities, most of which are trade-related.
The following chart shows the consolidated principal debt maturity profile of the company as of March 31st 2021, expressed in millions of dollars:
17
Table of Contents
YPF bonds issued during 1Q2021 are detailed below:
New Issuances Instrument | Market | Issue Date | Maturity Date | Currency | Interest Rate | Amount Issued | ||||||||
Class XVI | Global | 12-Feb-21 | 12-Feb-26 | US$ | Step-up 4%/9% | 775,782,279 | ||||||||
Class XVII | Global | 12-Feb-21 | 30-Jun-29 | US$ | Step-up 2.5%/9% | 747,833,257 | ||||||||
Class XVIII | Global | 12-Feb-21 | 30-Sep-33 | US$ | Step-up 1.5%/7% | 575,649,021 | ||||||||
Class XIX | Domestic | 26-Feb-21 | 26-Aug-24 | UVAs | 3.5% | 60,472,978 | (1) | |||||||
Additional Class XIV(2) | Domestic | 26-Feb-21 | 4-Dec-23 | US$ linked | 2.0% | 75,551,034 | ||||||||
| (1) | Equivalent to AR$ 4,128,490,208.06. |
| (2) | Reopening Class XIV issued at discount with an equivalent interest rate of 3.0%. |
18
Table of Contents
6.1. CONSOLIDATED STATEMENT OF INCOME
Income Statement | 1Q20 | 4Q20 | 1Q21 | Y/Y D | ||||||||||||
Unaudited Figures, in US$ million | ||||||||||||||||
Revenues | 2,832 | 2,270 | 2,648 | -6.5 | % | |||||||||||
|
|
|
|
|
|
|
| |||||||||
Costs | (2,366 | ) | (2,076 | ) | (2,238 | ) | -5.4 | % | ||||||||
|
|
|
|
|
|
|
| |||||||||
Gross profit | 466 | 194 | 410 | -12.1 | % | |||||||||||
|
|
|
|
|
|
|
| |||||||||
Selling expenses | (225 | ) | (224 | ) | (225 | ) | -0.1 | % | ||||||||
Administrative expenses | (109 | ) | (135 | ) | (103 | ) | -6.1 | % | ||||||||
Exploration expenses | (12 | ) | (10 | ) | (2 | ) | -84.5 | % | ||||||||
Impairment of property, plant and equipment and intangible assets | — | 822 | — | N.M | ||||||||||||
Other operating results, net | 120 | (99 | ) | (3 | ) | N.M | ||||||||||
|
|
|
|
|
|
|
| |||||||||
Operating income | 241 | 549 | 78 | -67.7 | % | |||||||||||
|
|
|
|
|
|
|
| |||||||||
Income of interests in companies and joint ventures | 22 | 56 | 58 | N.M | ||||||||||||
Financial Income | 339 | 420 | 254 | -25.1 | % | |||||||||||
Financial Cost | (489 | ) | (454 | ) | (365 | ) | -25.2 | % | ||||||||
Other financial results | (22 | ) | 59 | 63 | N.M | |||||||||||
Financial results, net | (172 | ) | 24 | (49 | ) | -71.7 | % | |||||||||
|
|
|
|
|
|
|
| |||||||||
Net profit before income tax | 91 | 629 | 87 | -4.9 | % | |||||||||||
|
|
|
|
|
|
|
| |||||||||
Income tax | 12 | (90 | ) | (112 | ) | N.M | ||||||||||
|
|
|
|
|
|
|
| |||||||||
Net profit for the period | 103 | 539 | (25 | ) | N.M | |||||||||||
|
|
|
|
|
|
|
| |||||||||
Net profit for shareholders of the parent company | 101 | 553 | (23 | ) | N.M | |||||||||||
Net profits for non-controlling interest | 2 | (14 | ) | (2 | ) | N.M | ||||||||||
Earnings per share attributable to shareholders of the parent company (basic and diluted) | 0.26 | 1.41 | (0.06 | ) | N.M | |||||||||||
Other comprehensive income | 705 | 765 | 742 | 5.3 | % | |||||||||||
|
|
|
|
|
|
|
| |||||||||
Total comprehensive income for the period | 808 | 1,304 | 716 | -11.3 | % | |||||||||||
|
|
|
|
|
|
|
| |||||||||
Income Statement | 1Q20 | 4Q20 | 1Q21 | Y/Y D | ||||||||||||
Unaudited Figures, in AR$ million | ||||||||||||||||
Revenues | 174,670 | 187,473 | 234,890 | 34.5 | % | |||||||||||
|
|
|
|
|
|
|
| |||||||||
Costs | (145,914 | ) | (171,123 | ) | (198,531 | ) | 36.1 | % | ||||||||
|
|
|
|
|
|
|
| |||||||||
Gross profit | 28,756 | 16,350 | 36,359 | 26.4 | % | |||||||||||
|
|
|
|
|
|
|
| |||||||||
Selling expenses | (13,876 | ) | (18,433 | ) | (19,945 | ) | 43.7 | % | ||||||||
Administrative expenses | (6,749 | ) | (11,214 | ) | (9,125 | ) | 35.2 | % | ||||||||
Exploration expenses | (716 | ) | (772 | ) | (159 | ) | -77.8 | % | ||||||||
Impairment of property, plant and equipment and intangible assets | — | 65,685 | — | N.M | ||||||||||||
Other operating results, net | 7,383 | (7,878 | ) | (276 | ) | N.M | ||||||||||
|
|
|
|
|
|
|
| |||||||||
Operating income | 14,798 | 43,738 | 6,854 | -53.7 | % | |||||||||||
|
|
|
|
|
|
|
| |||||||||
Income of interests in companies and joint ventures | 1,420 | 5,020 | 5,116 | N.M | ||||||||||||
Financial Income | 20,806 | 33,729 | 22,347 | 7.4 | % | |||||||||||
Financial Cost | (30,134 | ) | (37,553 | ) | (32,323 | ) | 7.3 | % | ||||||||
Other financial results | (1,293 | ) | 5,382 | 5,685 | N.M | |||||||||||
Financial results, net | (10,621 | ) | 1,558 | (4,291 | ) | -59.6 | % | |||||||||
|
|
|
|
|
|
|
| |||||||||
Net profit before income tax | 5,597 | 50,316 | 7,679 | 37.2 | % | |||||||||||
|
|
|
|
|
|
|
| |||||||||
Income tax | 754 | (7,304 | ) | (9,926 | ) | N.M | ||||||||||
|
|
|
|
|
|
|
| |||||||||
Net profit for the period | 6,351 | 43,012 | (2,247 | ) | N.M | |||||||||||
|
|
|
|
|
|
|
| |||||||||
Net profit for shareholders of the parent company | 6,212 | 44,235 | (2,066 | ) | N.M | |||||||||||
Net profits for non-controlling interest | 139 | (1,223 | ) | (181 | ) | N.M | ||||||||||
Earnings per share attributable to shareholders of the parent company (basic and diluted) | 15.83 | 112.71 | (5.26 | ) | N.M | |||||||||||
Other comprehensive income | 43,274 | 61,303 | 65,658 | 51.7 | % | |||||||||||
|
|
|
|
|
|
|
| |||||||||
Total comprehensive income for the period | 49,625 | 104,315 | 63,411 | 27.8 | % | |||||||||||
|
|
|
|
|
|
|
| |||||||||
Note: Information reported in accordance with International Financial Reporting Standards (IFRS).
19
Table of Contents
6.2. CONSOLIDATED BALANCE SHEET
| Consolidated Balance Sheet | In US$ million | In AR$ million | ||||||||||||||
Unaudited Figures | 31-Dec-20 | 31-Mar-21 | 31-Dec-20 | 31-Mar-21 | ||||||||||||
Non-current Assets | ||||||||||||||||
Intangible assets | 465 | 460 | 39,119 | 42,266 | ||||||||||||
Properties, plant and equipment | 16,413 | 16,129 | 1,379,527 | 1,482,277 | ||||||||||||
Assets for leasing | 524 | 526 | 44,081 | 48,384 | ||||||||||||
Investments in companies and joint ventures | 1,274 | 1,302 | 107,112 | 119,669 | ||||||||||||
Deferred tax assets, net | 31 | 29 | 2,629 | 2,690 | ||||||||||||
Other receivables | 174 | 163 | 14,657 | 14,952 | ||||||||||||
Trade receivables | 101 | 56 | 8,531 | 5,179 | ||||||||||||
|
|
|
|
|
|
|
| |||||||||
Total Non-current Assets | 18,985 | 18,666 | 1,595,656 | 1,715,417 | ||||||||||||
|
|
|
|
|
|
|
| |||||||||
Current Assets | ||||||||||||||||
Assets held for disposal | 6 | 6 | 494 | 540 | ||||||||||||
Inventories | 1,191 | 1,212 | 100,137 | 111,343 | ||||||||||||
Contract assets | 10 | 4 | 871 | 394 | ||||||||||||
Other receivables | 409 | 516 | 34,369 | 47,419 | ||||||||||||
Trade receivables | 1,287 | 1,293 | 108,146 | 118,795 | ||||||||||||
Investment in financial assets | 344 | 382 | 28,934 | 35,127 | ||||||||||||
Cash and cash equivalents | 650 | 612 | 54,618 | 56,276 | ||||||||||||
|
|
|
|
|
|
|
| |||||||||
Total Current Assets | 3,897 | 4,025 | 327,569 | 369,894 | ||||||||||||
|
|
|
|
|
|
|
| |||||||||
Total Assets | 22,882 | 22,691 | 1,923,225 | 2,085,311 | ||||||||||||
|
|
|
|
|
|
|
| |||||||||
Shareholders’ Equity | ||||||||||||||||
Shareholders’ contributions | 124 | 114 | 10,385 | 10,467 | ||||||||||||
Reserves, other comprehensive income and retained earnings | 7,934 | 7,940 | 666,845 | 729,649 | ||||||||||||
Non-controlling interest | 73 | 74 | 6,165 | 6,772 | ||||||||||||
|
|
|
|
|
|
|
| |||||||||
Total Shareholders’ Equity | 8,131 | 8,127 | 683,395 | 746,888 | ||||||||||||
|
|
|
|
|
|
|
| |||||||||
Non-current Liabilities | ||||||||||||||||
Provisions | 2,219 | 2,240 | 186,488 | 205,867 | ||||||||||||
Deferred tax liabilities, net | 1,423 | 1,416 | 119,609 | 130,144 | ||||||||||||
Income tax payable | 42 | 37 | 3,571 | 3,442 | ||||||||||||
Other taxes payable | 3 | 2 | 215 | 201 | ||||||||||||
Salaries and social security | 46 | 46 | 3,860 | 4,203 | ||||||||||||
Liabilities from leasing | 288 | 298 | 24,172 | 27,387 | ||||||||||||
Loans | 6,277 | 6,560 | 527,575 | 602,830 | ||||||||||||
Other liabilities | 35 | 16 | 2,961 | 1,429 | ||||||||||||
Accounts payable | 8 | 10 | 710 | 958 | ||||||||||||
|
|
|
|
|
|
|
| |||||||||
Total non-current Liabilities | 10,341 | 10,625 | 869,161 | 976,461 | ||||||||||||
|
|
|
|
|
|
|
| |||||||||
Current Liabilities | ||||||||||||||||
Provisions | 73 | 72 | 6,133 | 6,652 | ||||||||||||
Contract liabilities | 81 | 63 | 6,824 | 5,799 | ||||||||||||
Income tax payable | 9 | 10 | 740 | 946 | ||||||||||||
Other taxes payable | 188 | 268 | 15,764 | 24,671 | ||||||||||||
Salaries and social security | 178 | 150 | 14,934 | 13,769 | ||||||||||||
Liabilities from leasing | 263 | 250 | 22,098 | 23,015 | ||||||||||||
Loans | 1,793 | 1,187 | 150,731 | 109,085 | ||||||||||||
Other liabilities | 108 | 99 | 9,062 | 9,087 | ||||||||||||
Accounts payable | 1,718 | 1,838 | 144,383 | 168,938 | ||||||||||||
|
|
|
|
|
|
|
| |||||||||
Total Current Liabilities | 4,410 | 3,939 | 370,669 | 361,962 | ||||||||||||
|
|
|
|
|
|
|
| |||||||||
Total Liabilities | 14,751 | 14,564 | 1,239,830 | 1,338,423 | ||||||||||||
|
|
|
|
|
|
|
| |||||||||
Total Liabilities and Shareholders’ Equity | 22,882 | 22,691 | 1,923,225 | 2,085,311 | ||||||||||||
|
|
|
|
|
|
|
| |||||||||
Note: Information reported in accordance with International Financial Reporting Standards (IFRS).
20
Table of Contents
6.3. CONSOLIDATED STATEMENT OF CASH FLOW
Cash Flow Statement | 1Q20 | 4Q20 | 1Q21 | Y/YD | ||||||||||||
Unaudited Figures, in US$ million | ||||||||||||||||
Operating activities | ||||||||||||||||
Net income | 103 | 539 | (25 | ) | N.M | |||||||||||
Income of interests in companies and joint ventures | (22 | ) | (56 | ) | (58 | ) | N.M | |||||||||
Depreciation of property, plant and equipment | 710 | 466 | 688 | -3.2 | % | |||||||||||
Depreciation of the right-of-use assets | 77 | 56 | 48 | -38.4 | % | |||||||||||
Amortization of intangible assets | 11 | 12 | 12 | 8.1 | % | |||||||||||
Losses of property, plant and equipment and intangible assets and consumption of materials | 77 | 86 | 83 | 7.8 | % | |||||||||||
Income tax charge | (12 | ) | 90 | 112 | N.M | |||||||||||
Net increase in provisions | 63 | 56 | 65 | 2.7 | % | |||||||||||
Impairment of property, plant and equipment and intangible assets | — | (822 | ) | — | N.M | |||||||||||
Interest, exchange differences and others | 161 | (76 | ) | 43 | -73.0 | % | ||||||||||
Stock compensation plans | 2 | 2 | 1 | -43.9 | % | |||||||||||
Accrued insurance | (7 | ) | (6 | ) | — | N.M | ||||||||||
Results for assignment of participation in areas | (104 | ) | — | — | N.M | |||||||||||
Results from exchange of debt instruments | — | — | (21 | ) | N.M | |||||||||||
Changes in assets and liabilities | ||||||||||||||||
Trade receivables | 251 | 207 | 21 | -91.8 | % | |||||||||||
Other receivables | (65 | ) | (46 | ) | (93 | ) | 43.4 | % | ||||||||
Inventories | (179 | ) | 178 | (25 | ) | -85.8 | % | |||||||||
Accounts payable | (56 | ) | 54 | 191 | N.M | |||||||||||
Other taxes payable | 6 | (15 | ) | 91 | N.M | |||||||||||
Salaries and Social Security | (29 | ) | 42 | (28 | ) | -4.4 | % | |||||||||
Other liabilities | 3 | 110 | (27 | ) | N.M | |||||||||||
Decrease in provisions included in liabilities for payments / utilization | (22 | ) | (11 | ) | (21 | ) | -6.6 | % | ||||||||
Contract Assets | (8 | ) | (6 | ) | 5 | N.M | ||||||||||
Contract Liabilities | 1 | (17 | ) | (7 | ) | N.M | ||||||||||
Dividends received | 2 | 2 | 0 | -85.1 | % | |||||||||||
Insurance charge for loss of profit | 4 | 9 | 0 | -96.6 | % | |||||||||||
Income tax payments | (7 | ) | (7 | ) | (1 | ) | -80.0 | % | ||||||||
|
|
|
|
|
|
|
| |||||||||
Net cash flow from operating activities | 961 | 849 | 1,054 | 9.6 | % | |||||||||||
|
|
|
|
|
|
|
| |||||||||
Investing activities | ||||||||||||||||
Acquisitions of property, plant and equipment and intangible assets | (792 | ) | (410 | ) | (493 | ) | -37.7 | % | ||||||||
Contributions and acquisitions of interests in companies and joint ventures | — | — | — | N.M | ||||||||||||
Proceeds from sales of financial assets | — | 93 | 105 | N.M | ||||||||||||
Payments for the acquisition of financial assets | — | (224 | ) | (148 | ) | N.M | ||||||||||
Interest received from financial assets | — | 0 | 13 | N.M | ||||||||||||
Collection for assignment of participation in areas | 104 | — | — | -100.0 | % | |||||||||||
|
|
|
|
|
|
|
| |||||||||
Net cash flow from investing activities | (688 | ) | (540 | ) | (523 | ) | -23.9 | % | ||||||||
|
|
|
|
|
|
|
| |||||||||
Financing activities | ||||||||||||||||
Payment of loans | (342 | ) | (566 | ) | (537 | ) | 56.9 | % | ||||||||
Payment of interests | (262 | ) | (159 | ) | (200 | ) | -23.7 | % | ||||||||
Proceeds from loans | 411 | 455 | 291 | -29.3 | % | |||||||||||
Acquisition of own shares | — | (7 | ) | — | N.M | |||||||||||
Payment of leasing | (97 | ) | (98 | ) | (77 | ) | -20.8 | % | ||||||||
Payment of interests related to income tax | (4 | ) | (1 | ) | (0 | ) | -98.2 | % | ||||||||
Payment of dividends | — | — | — | N.M | ||||||||||||
|
|
|
|
|
|
|
| |||||||||
Net cash flow from financing activities | (293 | ) | (377 | ) | (522 | ) | 78.1 | % | ||||||||
|
|
|
|
|
|
|
| |||||||||
Effect of changes in exchange rates on cash and cash equivalents | 69 | 5 | 10 | -85.0 | % | |||||||||||
Translation adjustments | (81 | ) | (71 | ) | (56 | ) | -30.6 | % | ||||||||
Increase (decrease) in cash and cash equivalents | (32 | ) | (134 | ) | (37 | ) | 18.8 | % | ||||||||
Cash and cash equivalents at the beginning of the period | 1,106 | 784 | 650 | -41.2 | % | |||||||||||
|
|
|
|
|
|
|
| |||||||||
Cash and cash equivalents at the end of the period | 1,074 | 650 | 612 | -43.0 | % | |||||||||||
|
|
|
|
|
|
|
| |||||||||
21
Table of Contents
Cash Flow Statement | 1Q20 | 4Q20 | 1Q21 | Y/YD | ||||||||||||
Unaudited Figures, in AR$ million | ||||||||||||||||
Operating activities | ||||||||||||||||
Net income | 6,351 | 43,012 | (2,247 | ) | N.M | |||||||||||
Income of interests in companies and joint ventures | (1,420 | ) | (5,020 | ) | (5,116 | ) | N.M | |||||||||
Depreciation of property, plant and equipment | 43,636 | 37,505 | 60,875 | 39.5 | % | |||||||||||
Depreciation of the right-of-use assets | 4,752 | 4,491 | 4,214 | -11.3 | % | |||||||||||
Amortization of intangible assets | 669 | 1,019 | 1,042 | 55.8 | % | |||||||||||
Losses of property, plant and equipment and intangible assets and consumption of materials | 4,737 | 6,892 | 7,369 | 55.6 | % | |||||||||||
Income tax charge | (754 | ) | 7,304 | 9,926 | N.M | |||||||||||
Net increase in provisions | 3,862 | 4,485 | 5,723 | 48.2 | % | |||||||||||
Impairment of property, plant and equipment and intangible assets | — | (65,685 | ) | — | N.M | |||||||||||
Interest, exchange differences and others | 9,840 | (5,787 | ) | 3,814 | -61.2 | % | ||||||||||
Stock compensation plans | 147 | 173 | 119 | -19.0 | % | |||||||||||
Accrued insurance | (458 | ) | (454 | ) | — | N.M | ||||||||||
Results for assignment of participation in areas | (6,356 | ) | — | — | N.M | |||||||||||
Results from exchange of debt instruments | — | — | (1,855 | ) | N.M | |||||||||||
Changes in assets and liabilities | ||||||||||||||||
Trade receivables | 15,390 | 16,563 | 1,816 | -88.2 | % | |||||||||||
Other receivables | (3,995 | ) | (3,665 | ) | (8,263 | ) | N.M | |||||||||
Inventories | (10,952 | ) | 14,261 | (2,247 | ) | -79.5 | % | |||||||||
Accounts payable | (3,406 | ) | 4,314 | 16,880 | N.M | |||||||||||
Other taxes payable | 365 | (1,180 | ) | 8,067 | N.M | |||||||||||
Salaries and Social Security | (1,775 | ) | 3,341 | (2,449 | ) | 38.0 | % | |||||||||
Other liabilities | 173 | 8,776 | (2,377 | ) | N.M | |||||||||||
Decrease in provisions included in liabilities for payments / utilization | (1,351 | ) | (884 | ) | (1,821 | ) | 34.8 | % | ||||||||
Contract Assets | (517 | ) | (498 | ) | 480 | N.M | ||||||||||
Contract Liabilities | 86 | (1,396 | ) | (611 | ) | N.M | ||||||||||
Dividends received | 130 | 122 | 28 | -78.5 | % | |||||||||||
Insurance charge for loss of profit | 247 | 722 | 12 | -95.1 | % | |||||||||||
Income tax payments | (446 | ) | (542 | ) | (129 | ) | -71.1 | % | ||||||||
|
|
|
|
|
|
|
| |||||||||
Net cash flow from operating activities | 58,955 | 67,869 | 93,250 | 58.2 | % | |||||||||||
|
|
|
|
|
|
|
| |||||||||
Investing activities | ||||||||||||||||
Acquisitions of property, plant and equipment and intangible assets | (48,540 | ) | (32,736 | ) | (43,640 | ) | -10.1 | % | ||||||||
Contributions and acquisitions of interests in companies and joint ventures | — | — | — | N.M | ||||||||||||
Proceeds from sales of financial assets | — | 7,447 | 9,256 | N.M | ||||||||||||
Payments for the acquisition of financial assets | — | (17,921 | ) | (13,094 | ) | N.M | ||||||||||
Interest received from financial assets | — | 3 | 1,172 | N.M | ||||||||||||
Collection for assignment of participation in areas | 6,356 | — | — | -100.0 | % | |||||||||||
|
|
|
|
|
|
|
| |||||||||
Net cash flow from investing activities | (42,184 | ) | (43,207 | ) | (46,306 | ) | 9.8 | % | ||||||||
|
|
|
|
|
|
|
| |||||||||
Financing activities | ||||||||||||||||
Payment of loans | (20,964 | ) | (45,245 | ) | (47,468 | ) | N.M | |||||||||
Payment of interests | (16,043 | ) | (12,740 | ) | (17,663 | ) | 10.1 | % | ||||||||
Proceeds from loans | 25,221 | 36,334 | 25,713 | 2.0 | % | |||||||||||
Acquisition of own shares | — | (550 | ) | — | N.M | |||||||||||
Payment of leasing | (5,936 | ) | (7,820 | ) | (6,783 | ) | 14.3 | % | ||||||||
Payment of interests related to income tax | (264 | ) | (88 | ) | (7 | ) | -97.3 | % | ||||||||
Payment of dividends | — | — | — | N.M | ||||||||||||
|
|
|
|
|
|
|
| |||||||||
Net cash flow from financing activities | (17,986 | ) | (30,109 | ) | (46,208 | ) | N.M | |||||||||
|
|
|
|
|
|
|
| |||||||||
Effect of changes in exchange rates on cash and cash equivalents | 4,247 | 424 | 922 | -78.3 | % | |||||||||||
Increase (decrease) in cash and cash equivalents | 3,032 | (5,023 | ) | 1,658 | -45.3 | % | ||||||||||
Cash and cash equivalents at the beginning of the period | 66,100 | 59,641 | 54,618 | -17.4 | % | |||||||||||
|
|
|
|
|
|
|
| |||||||||
Cash and cash equivalents at the end of the period | 69,132 | 54,618 | 56,276 | -18.6 | % | |||||||||||
|
|
|
|
|
|
|
| |||||||||
Note: Information reported in accordance with International Financial Reporting Standards (IFRS).
22
Table of Contents
| Main physical magnitudes | ||||||||||||||||||||||||||
Unaudited Figures | Unit | 1Q20 | 2Q20 | 3Q20 | 4Q20 | Cum. 2020 | 1Q21 | |||||||||||||||||||
Total Production | Kboe | 46,439 | 42,480 | 43,101 | 38,901 | 170,920 | 39,330 | |||||||||||||||||||
|
|
|
|
|
|
|
|
|
|
|
|
| ||||||||||||||
Crude oil production | Kbbl | 20,488 | 18,274 | 18,621 | 18,311 | 75,693 | 18,691 | |||||||||||||||||||
NGL production | Kbbl | 4,090 | 4,162 | 4,121 | 995 | 13,369 | 2,653 | |||||||||||||||||||
Gas production | Mm3 | 3,476 | 3,187 | 3,237 | 3,116 | 13,015 | 2,860 | |||||||||||||||||||
Henry Hub | USD/MMBTU | 2.0 | 1.6 | 2.2 | 2.7 | 2.1 | 2.7 | |||||||||||||||||||
Brent | USD/bbl | 50.4 | 29.3 | 43.0 | 44.3 | 41.8 | 60.8 | |||||||||||||||||||
Sales volume (YPF stand alone) | ||||||||||||||||||||||||||
|
|
|
|
|
|
|
|
|
|
|
|
| ||||||||||||||
Sales of refined products | Km3 | 4,101 | 3,041 | 3,771 | 4,056 | 14,970 | 4,140 | |||||||||||||||||||
|
|
|
|
|
|
|
|
|
|
|
|
| ||||||||||||||
Domestic market | Km3 | 3,541 | 2,679 | 3,495 | 3,890 | 13,606 | 3,901 | |||||||||||||||||||
Gasoline | Km3 | 1,222 | 579 | 816 | 1,081 | 3,698 | 1,240 | |||||||||||||||||||
Diesel | Km3 | 1,722 | 1,578 | 1,931 | 1,812 | 7,044 | 1,811 | |||||||||||||||||||
Jet fuel and kerosene | Km3 | 126 | 13 | 14 | 27 | 180 | 65 | |||||||||||||||||||
Fuel Oil | Km3 | 4 | 29 | 157 | 85 | 275 | 102 | |||||||||||||||||||
LPG | Km3 | 136 | 182 | 229 | 122 | 670 | 130 | |||||||||||||||||||
Other (*) | Km3 | 330 | 298 | 348 | 763 | 1,739 | 553 | |||||||||||||||||||
Export market | Km3 | 561 | 362 | 275 | 166 | 1,364 | 239 | |||||||||||||||||||
Petrochemical naphtha | Km3 | 86 | 104 | 52 | 24 | 266 | 0 | |||||||||||||||||||
Jet fuel and kerosene | Km3 | 124 | 10 | 10 | 22 | 165 | 25 | |||||||||||||||||||
LPG | Km3 | 141 | 23 | 33 | 38 | 235 | 74 | |||||||||||||||||||
Bunker (Diesel and Fuel Oil) | Km3 | 103 | 103 | 94 | 51 | 350 | 52 | |||||||||||||||||||
Other (*) | Km3 | 107 | 122 | 87 | 31 | 347 | 88 | |||||||||||||||||||
|
|
|
|
|
|
|
|
|
|
|
|
| ||||||||||||||
Sales of petrochemical products | Ktn | 227 | 147 | 192 | 152 | 717 | 247 | |||||||||||||||||||
|
|
|
|
|
|
|
|
|
|
|
|
| ||||||||||||||
Domestic market | Ktn | 166 | 95 | 147 | 116 | 524 | 166 | |||||||||||||||||||
Methanol | Ktn | 55 | 22 | 36 | 14 | 129 | 43 | |||||||||||||||||||
Other | Ktn | 111 | 72 | 110 | 102 | 395 | 123 | |||||||||||||||||||
Export market | Ktn | 61 | 52 | 45 | 36 | 193 | 81 | |||||||||||||||||||
Methanol | Ktn | 27 | 6 | 2 | 15 | 50 | 45 | |||||||||||||||||||
Other | Ktn | 33 | 46 | 43 | 21 | 143 | 37 | |||||||||||||||||||
|
|
|
|
|
|
|
|
|
|
|
|
| ||||||||||||||
Grain, flours and oils | Ktn | 238 | 523 | 459 | 217 | 1,438 | 294 | |||||||||||||||||||
|
|
|
|
|
|
|
|
|
|
|
|
| ||||||||||||||
Domestic market | Ktn | 33 | 97 | 57 | 29 | 216 | 11 | |||||||||||||||||||
Export market | Ktn | 205 | 427 | 401 | 189 | 1,221 | 284 | |||||||||||||||||||
|
|
|
|
|
|
|
|
|
|
|
|
| ||||||||||||||
Fertilizers | Ktn | 91 | 227 | 233 | 131 | 682 | 186 | |||||||||||||||||||
|
|
|
|
|
|
|
|
|
|
|
|
| ||||||||||||||
Domestic market | Ktn | 91 | 227 | 233 | 131 | 682 | 186 | |||||||||||||||||||
Main products imported (YPF stand alone) | ||||||||||||||||||||||||||
Gasolines | Km3 | 51 | 0 | 0 | 0 | 51 | 82 | |||||||||||||||||||
Jet Fuel | Km3 | 0 | 0 | 0 | 8 | 8 | 0 | |||||||||||||||||||
Diesel | Km3 | 78 | 150 | 82 | 61 | 371 | 46 | |||||||||||||||||||
Brent: The Brent price has been restated for 1Q20.
Other (*): Principally includes sales of oil and lubricant bases, grease, asphalt, and residual carbon, among others.
23
Table of Contents
This document contains statements that YPF believes constitute forward-looking statements within the meaning of the US Private Securities Litigation Reform Act of 1995.
These forward-looking statements may include statements regarding the intent, belief, plans, current expectations or objectives as of the date hereof of YPF and its management, including statements with respect to trends affecting YPF’s future financial condition, financial, operating, reserve replacement and other ratios, results of operations, business strategy, geographic concentration, business concentration, production and marketed volumes and reserves, as well as YPF’s plans, expectations or objectives with respect to future capital expenditures, investments, expansion and other projects, exploration activities, ownership interests, divestments, cost savings and dividend payout policies. These forward-looking statements may also include assumptions regarding future economic and other conditions, such as the future price of petroleum and petroleum products, refining and marketing margins and exchange rates. These statements are not guarantees of future performance, prices, margins, exchange rates or other events and are subject to material risks, uncertainties, changes in circumstances and other factors that may be beyond YPF’s control or may be difficult to predict.
YPF’s actual future financial condition, financial, operating, reserve replacement and other ratios, results of operations, business strategy, geographic concentration, business concentration, production and marketed volumes, reserves, capital expenditures, investments, expansion and other projects, exploration activities, ownership interests, divestments, cost savings and dividend payout policies, as well as actual future economic and other conditions, such as the future price of petroleum and petroleum products, refining margins and exchange rates, could differ materially from those expressed or implied in any such forward-looking statements. Important factors that could cause such differences include, but are not limited to fluctuations in the price of petroleum and petroleum products, supply and demand levels, currency fluctuations, exploration, drilling and production results, changes in reserves estimates, success in partnering with third parties, loss of market share, industry competition, environmental risks, physical risks, the risks of doing business in developing countries, legislative, tax, legal and regulatory developments, economic and financial market conditions in various countries and regions, political risks, wars and acts of terrorism, natural disasters, project delays or advancements and lack of approvals, as well as those factors described in the filings made by YPF and its affiliates before the Comisión Nacional de Valores in Argentina and with the U.S. Securities and Exchange Commission, in particular, those described in “Item 3. Key Information—Risk Factors” and “Item 5. Operating and Financial Review and Prospects” in YPF’s Annual Report on Form 20-F for the fiscal year ended December 31, 2020 filed with the Securities and Exchange Commission. In light of the foregoing, the forward-looking statements included in this document may not occur.
Except as required by law, YPF does not undertake to publicly update or revise these forward-looking statements even if experience or future changes make it clear that the projected performance, conditions, or events expressed or implied therein will not be realized. These materials do not constitute an offer for sale of YPF S.A. bonds, shares or ADRs in the United States or elsewhere.
The information contained herein has been prepared to assist interested parties in making their own evaluations of YPF.
24
Table of Contents

Table of Contents
SIGNATURE
Pursuant to the requirements of the Securities Exchange Act of 1934, the registrant has duly caused this report to be signed on its behalf by the undersigned, thereunto duly authorized.
| YPF Sociedad Anónima | ||||
| Date: May 11, 2021 | By: | /s/ Santiago Wesenack | ||
| Name: | Santiago Wesenack | |||
| Title: | Market Relations Officer | |||