|
| OMB APPROVAL | ||
|
| OMB Number: | 3235-0570 | |
|
| Expires: | September 30, 2007 | |
| UNITED STATES | Estimated average burden hours per response. . . . . . . . . . . . . . . . .19.4 | ||
| SECURITIES AND EXCHANGE COMMISSION |
| ||
| Washington, D.C. 20549 |
| ||
FORM N-CSR
CERTIFIED SHAREHOLDER REPORT OF REGISTERED
MANAGEMENT INVESTMENT COMPANIES
Investment Company Act file number | 811-7736 | ||||||
| |||||||
Janus Aspen Series | |||||||
(Exact name of registrant as specified in charter) | |||||||
| |||||||
151 Detroit Street, Denver, Colorado |
| 80206 | |||||
(Address of principal executive offices) |
| (Zip code) | |||||
| |||||||
Kelley Abbott Howes, 151 Detroit Street, Denver, Colorado 80206 | |||||||
(Name and address of agent for service) | |||||||
| |||||||
Registrant’s telephone number, including area code: | 303-333-3863 |
| |||||
| |||||||
Date of fiscal year end: | 12/31 |
| |||||
| |||||||
Date of reporting period: | 12/31/06 |
| |||||
Item 1 - Reports to Shareholders
2006 Annual Report
Janus Aspen Series
Janus Aspen Balanced Portfolio
Look Inside. . .
• Portfolio management perspective
• Investment strategy behind your portfolio
• Portfolio performance, characteristics and holdings

Table of Contents
| Useful Information About Your Portfolio Report | 1 | ||||||
| Management Commentary and Schedule of Investments | 2 | ||||||
| Statement of Assets and Liabilities | 10 | ||||||
| Statement of Operations | 11 | ||||||
| Statements of Changes in Net Assets | 12 | ||||||
| Financial Highlights | 13 | ||||||
| Notes to Schedule of Investments | 14 | ||||||
| Notes to Financial Statements | 15 | ||||||
| Report of Independent Registered Public Accounting Firm | 23 | ||||||
| Additional Information | 24 | ||||||
| Explanations of Charts, Tables and Financial Statements | 27 | ||||||
| Designation Requirements | 29 | ||||||
| Trustees and Officers | 30 | ||||||
Please consider the charges, risks, expenses and investment objectives carefully before investing. For a prospectus containing this and other information, please call Janus at 1-800-525-0020 or download the file from www.janus.com/info. Read it carefully before you invest or send money.
Useful Information About Your Portfolio Report
Management Commentary
The Management Commentary in this report includes valuable insight from the Portfolio's managers as well as statistical information to help you understand how your Portfolio's performance and characteristics stack up against those of comparable indices.
Please keep in mind that the opinions expressed by the Portfolio's managers in the Management Commentary are just that: opinions. They are a reflection of the managers' best judgment at the time this report was compiled, which was December 31, 2006. As the investing environment changes, so could their opinions. The views are unique to the managers and aren't necessarily shared by their fellow employees or by Janus in general.
Portfolio Expenses
We believe it's important for our shareholders to have a clear understanding of Portfolio expenses and the impact they have on investment return.
The following is important information regarding the Portfolio's Expense Example, which appears in the Management Commentary within this Annual Report. Please refer to this information when reviewing the Expense Example for the Portfolio.
Example
As a shareholder of a Portfolio, you incur two types of costs: (1) transaction costs, including redemption fees (where applicable) (and any related exchange fees) and (2) ongoing costs, including management fees; distribution and shareholder servicing (12b-1) fees (applicable to Service Shares only); and other Portfolio expenses. The example is intended to help you understand your ongoing costs (in dollars) of investing in a Portfolio and to compare these costs with the ongoing costs of investing in other mutual funds. To do so, compare this 5% hypothetical example with the 5% hypothetical examples that appear in the shareholder reports of the other funds. The example is based upon an investment of $1,000 invested at the beginning of the period and held for the six-month period from July 1, 2006 to December 31, 2006.
Actual Expenses
The first line of the table in each example provides information about actual account values and actual expenses. You may use the information in this line, together with the amount you invested, to estimate the expenses that you paid over the period. Simply divide your account value by $1,000 (for example, an $8,600 account value divided by $1,000 = 8.6), then multiply the result by the number in the first line under the heading entitled "Expenses Paid During Period" to estimate the expenses you paid on your account during the period.
Hypothetical Example for Comparison Purposes
The second line of the table in each example provides information about hypothetical account values and hypothetical expenses based upon the Portfolio's actual expense ratio and an assumed rate of return of 5% per year before expenses, which is not the Portfolio's actual return. The hypothetical account values and expenses may not be used to estimate the actual ending account balance or expenses you paid for the period. You may use this information to compare the ongoing costs of investing in the Portfolio and other funds. To do so, compare this 5% hypothetical example with the 5% hypothetical examples that appear in the shareholder reports of the other funds.
Please note that the expenses shown in the tables are meant to highlight your ongoing costs only and do not reflect any transaction costs, such as redemption fees (where applicable) and any charges at the separate account level or contract level. Redemption fees are fully described in the prospectus. Therefore, the second line of each table is useful in comparing ongoing costs only, and will not help you determine the relative total costs of owning different funds. In addition, if these transaction costs and separate account or contract level charges were included, your costs would have been higher.
Janus Aspen Series December 31, 2006 1
Janus Aspen Balanced Portfolio (unaudited)
Portfolio Snapshot
The portfolio combines the growth potential of stocks with the balance of bonds.

Marc Pinto
co-portfolio
manager

Gibson Smith
co-portfolio
manager
Performance Overview
Despite concerns over the direction of interest rates, the equity market enjoyed substantial gains during the 12-month period ended December 31, 2006. The market made significant strides in the second half of the year in particular, fueled in part by the Federal Reserve Board's (Fed) decision to leave interest rates unchanged in August through December – the first pause in Fed credit tightening in more than two years. This news – along with signs throughout the year of relatively solid, if moderating, U.S. economic growth and healthy corporate profits – heartened investors. Easing energy prices also helped to support investor confidence late in the year.
The bond market, meanwhile, proved volatile during the period. The yield on the benchmark 10-year Treasury bond rose more than 74 basis points in the first half of the year to reach 5.14% by late June, amid concerns over surging energy prices and uncertainty over Fed monetary policy. Yields subsequently declined in the third quarter as the bond market managed to rally alongside equities, responding well to a repricing of inflation expectations and the pause in Fed credit tightening. Yields backed up slightly in the fourth quarter, as bonds had a harder time competing for yield-hungry investors. Nonetheless, the 10-year Treasury bond yield ended December at 4.70%, up roughly 30 basis points from the start of the year, but well below its June peak.
Against this backdrop, Janus Aspen Balanced Portfolio's Institutional Shares and Service Shares gained 10.72% and 10.46%, respectively, for the period to outdistance the Balanced Index, a hypothetical, internally-calculated secondary benchmark, which returned 10.28%. The Balanced Index is composed of a 55% weighting in the S&P 500® Index, the Portfolio's primary benchmark, and a 45% weighting in the Lehman Brothers Government/Credit Index, the Portfolio's other secondary benchmark, which returned 15.80% and 3.78%, respectively. An effective investment strategy on the fixed-income side of the Portfolio as well as strong stock selection in the majority of the sectors in which we invest worked to our advantage. Additionally, we held overweight positions relative to the S&P 500® Index in areas that performed especially well for us, such as materials, pharmaceuticals and biotechnology, consumer services and f inancial services. On the downside, our overweight positions in semiconductors and healthcare equipment and services detracted from performance.
Financial and Biopharmaceutical Holdings Contributed to Performance
The Portfolio's largest holding, Merrill Lynch, was the most significant individual contributor to our performance. Strong initial public offering (IPO) and mergers and acquisitions
(M&A) activity boosted Merrill's business, as did the Fed's decision in late summer to hold off on more interest rate hikes. We have long believed that Merrill is positioned to narrow the gap between itself and its peers in terms of returns on equity, mainly because the company is shifting its resources to areas in which it has historically been weaker. It is also taking steps to expand overseas in regions primed for growth, such as Asia. We were pleased to see this investment thesis take flight during the year.
Among our biopharmaceutical holdings, Celgene continued to distinguish itself. Another top performer for the year, Celgene continued to benefit from its innovative cancer treatments, especially its breakthrough drug Revlimid. Revlimid treats blood-borne cancers and was approved by the Food and Drug Administration in late 2005. Another pharmaceutical holding working in our favor, Roche Holding, boasts a lineup of blockbuster drugs to help treat cancer, AIDS, and other major diseases. Over the past year, the stock gained ground as Roche is also the world's top producer of Tamiflu, a well-regarded potential treatment for the bird flu virus.
Turning to the fixed-income portion of the Portfolio, performance benefited from our decision in the latter half of the year to extend the duration of our holdings, increasing their responsiveness to interest rate changes. Additionally, while we remain skeptical of the low level of yields in the market, we were able to use the 10-year Treasury's back-up to 5.14% in June as a buying opportunity – enabling us to capitalize on the subsequent decline in yields.
Health Insurers and Yahoo! Weighed on Performance
While our biopharmaceutical holdings flourished, health insurers were less prosperous during the year. Following strong showings in 2005, Aetna and UnitedHealth Group both
2 Janus Aspen Series December 31, 2006
(unaudited)
dampened the Portfolio's returns over the past year, hampered by profit taking and investor concerns that industry margins could face pressure if medical costs accelerate at a faster rate than pricing. Although we believe that the market may have overreacted, we reduced our stake in Aetna and eliminated our position in UnitedHealth Group.
Our worst performer during the period was global Internet service provider Yahoo!, which experienced a number of setbacks during the period. The news was particularly negative in the second half of the year, when earnings were consistently reported below expectations. More importantly, the company experienced a highly publicized delay in the release of its much-anticipated replacement search algorithm. This algorithm, known as "Project Panama," finally came to market in the fourth quarter. It is expected to help Yahoo! place advertisements more effectively on its site, which in turn would lead more consumers to "click through" ads, generating higher revenues for Yahoo!. Despite its recent challenges, we have maintained our conviction that Yahoo! is on a path to improving both its search and advertising businesses over time.
Looking Ahead
Despite concerns over the inverted yield curve (i.e., long-term Treasury bonds yielding at prices below short-term Treasury yields), and uncertainty over how quickly or dramatically growth might slow in 2007, we continue to believe that the risk of recession remains relatively low, and that the economy is headed for a soft landing marked by low inflation, stable growth and stability in earnings. Nonetheless, uncertainty over the economic outlook and its impact on inflation, Fed policy and bond yields, could keep markets volatile as we head into the coming year.
Regardless of what lies ahead, we remain confident in our strategy of individual security selection. We will continue to take a balanced approach to investing, seeking to uncover what we believe are the best opportunities in both the stock and bond markets.
Thank you for your investment in Janus Aspen Balanced Portfolio.
Janus Aspen Balanced Portfolio At a Glance
5 Largest Contributors to Performance – Holdings
| Equity Contribution | |||||||
| Merrill Lynch & Company, Inc. Investment banking services - U.S. | 2.07 | % | |||||
| Exxon Mobil Corp. Petroleum and petrochemical business operator - U.S. | 1.50 | % | |||||
| Celgene Corp. Biopharmaceutical company - U.S. | 1.07 | % | |||||
| J P Morgan Chase & Co. Financial products and services provider - U.S. | 1.02 | % | |||||
| Marriott International, Inc. – Class A Worldwide hotel operator and franchisor - U.S. | 0.97 | % | |||||
5 Largest Detractors from Performance – Holdings
| Equity Contribution | |||||||
| Yahoo!, Inc. Global Internet media company - U.S. | (1.01 | )% | |||||
| Aetna, Inc. Healthcare and related benefits provider - U.S. | (0.75 | )% | |||||
| Expedia, Inc. Online travel services provider - U.S. | (0.37 | )% | |||||
| Texas Instruments, Inc. Global semiconductor company - U.S. | (0.33 | )% | |||||
| Advanced Micro Devices Integrated circuits provider - U.S. | (0.22 | )% | |||||
5 Largest Contributors to Performance – Sectors
| Group | Equity Contribution | Portfolio Weighting (% of Net Assets) | S&P 500® Index Weighting | ||||||||||||
| Diversified Financials | 3.47 | % | 13.28 | % | 9.48 | % | |||||||||
| Pharmaceuticals & Biotechnology | 2.66 | % | 12.17 | % | 8.07 | % | |||||||||
| Energy | 2.10 | % | 9.92 | % | 9.84 | % | |||||||||
| Materials | 1.99 | % | 3.43 | % | 2.99 | % | |||||||||
| Consumer Services | 1.88 | % | 5.57 | % | 1.66 | % | |||||||||
5 Largest Detractors from Performance – Sectors
| Group | Equity Contribution | Portfolio Weighting (% of Net Assets) | S&P 500® Index Weighting | ||||||||||||
| Healthcare Equipment & Services | (0.90 | )% | 5.45 | % | 4.57 | % | |||||||||
| Software & Services | (0.50 | )% | 4.64 | % | 5.53 | % | |||||||||
| Semiconductors & Semiconductor Equipment | (0.50 | )% | 5.87 | % | 2.82 | % | |||||||||
| Consumer Durables & Apparel | (0.20 | )% | 0.33 | % | 1.22 | % | |||||||||
| Other* | (0.01 | )% | 0.01 | % | 0.00 | % | |||||||||
* Industry not classified by Global Industry Classification Standard.
Janus Aspen Series December 31, 2006 3
Janus Aspen Balanced Portfolio (unaudited)
5 Largest Equity Holdings – (% of Net Assets)
| As of December 31, 2006 | |||
| Merrill Lynch & Company, Inc. Finance - Investment Bankers/Brokers | 3.8 | % | |||||
| Roche Holding A.G. Medical - Drugs | 3.3 | % | |||||
| JP Morgan Chase & Co. Finance - Investment Bankers/Brokers | 2.9 | % | |||||
| General Electric Co. Diversified Operations | 2.8 | % | |||||
| Altria Group, Inc. Tobacco | 1.9 | % | |||||
| 14.7 | % | ||||||
Asset Allocation – (% of Net Assets)
| As of December 31, 2006 | |||
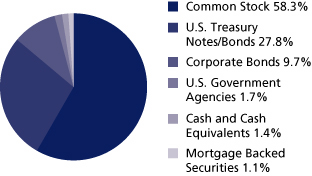
Emerging markets comprised 2.0% of total net assets.
Top Country Allocations – (% of Investment Securities)
| As of December 31, 2006 | As of December 31, 2005 | ||||||
 |  | ||||||
4 Janus Aspen Series December 31, 2006
Performance
(unaudited)

Average Annual Total Return – for the periods ended December 31, 2006
| One Year | Five Year | Ten Year | Since Inception* | ||||||||||||||||
| Janus Aspen Balanced Portfolio - Institutional Shares | 10.72 | % | 6.72 | % | 10.36 | % | 11.40 | % | |||||||||||
| Janus Aspen Balanced Portfolio - Service Shares | 10.46 | % | 6.44 | % | 10.19 | % | 11.30 | % | |||||||||||
| S&P 500® Index | 15.80 | % | 6.19 | % | 8.42 | % | 10.81 | % | |||||||||||
| Lehman Brothers Government/Credit Index | 3.78 | % | 5.17 | % | 6.26 | % | 5.93 | % | |||||||||||
| Balanced Index | 10.28 | % | 6.00 | % | 7.80 | % | 8.88 | % | |||||||||||
| Lipper Quartile - Institutional Shares | 3 | rd | 2 | nd | 1 | st | 1 | st | |||||||||||
| Lipper Ranking - Institutional Shares based on total returns for Variable Annuity Balanced Funds | 56/106 | 25/63 | 1/25 | 1/19 | |||||||||||||||
Data presented represents past performance, which is no guarantee of future results. Investment results and principal value will fluctuate so that shares, when redeemed, may be worth more or less than their original cost. Due to market volatility, current performance may be higher or lower than the performance shown. Call 877.33JANUS or visit www.janus.com/info for performance current to the most recent month-end.
See Notes to Schedule of Investments for index definitions.
Total return includes reinvestment of dividends from net investment income and distributions from capital gains. The returns shown do not reflect the deduction of taxes that a shareholder would pay on Portfolio distributions or the redemption of Portfolio shares.
Returns shown for Service Shares for periods prior to December 31, 1999 are derived from the historical performance of Institutional Shares, adjusted to reflect the higher operating expenses of Service Shares.
These returns do not reflect the charges and expenses of any particular insurance product or qualified plan. Returns shown would have been lower had they included insurance charges.
The Portfolio may differ significantly from the securities held in the indices. The indices are not available for direct investment; therefore their performance does not reflect the expenses associated with the active management of an actual Portfolio.
Portfolios that invest in bonds have the same interest rate, inflation and credit risks that are associated with the underlying bonds owned by the Portfolio. Unlike owning individual bonds, there are ongoing fees and expenses associated with owning shares of bonds. The return of principal is not guaranteed due to net asset value fluctuation that is caused by changes in the price of specific bonds held in the Portfolio and selling of bonds within the Portfolio by the Portfolio's managers.
There is no assurance that the investment process will consistently lead to successful investing.
Lipper Inc. - A Reuters Company, is a nationally recognized organization that ranks the performance of mutual funds within a universe of funds that have similar investment objectives. Rankings are historical with capital gains and dividends reinvested.
The Portfolio's performance may be affected by risks that include those associated with nondiversification, non-investment grade debt securities, undervalued or overlooked companies, investments in specific industries or countries and potential conflicts of interest with Janus Smart Portfolios. Additional risks to the Portfolio may include those associated with investing in foreign securities, emerging markets, initial public offerings, derivatives and companies with relatively small market capitalizations. Please see a Janus prospectus or www.janus.com/info for more information about risk, fund holdings and details.
Ranking is for the Institutional share class only; other classes may have different performance characteristics.
The date of the since-inception Lipper ranking is slightly different from when the Portfolio began operations since Lipper provides fund rankings as of the last day of the month or the first Thursday after fund inception.
See "Explanations of Charts, Tables and Financial Statements."
*The Portfolio's inception date – September 13, 1993
Portfolio Expenses
The example below shows you the ongoing costs (in dollars) of investing in your Portfolio and allows you to compare these costs with those of other mutual funds. Please refer to page 1 for a detailed explanation of the information presented in these charts.
| Expense Example - Institutional Shares | Beginning Account Value (7/1/06) | Ending Account Value (12/31/06) | Expenses Paid During Period (7/1/06-12/31/06)* | ||||||||||||
| Actual | $ | 1,000.00 | $ | 1,088.50 | $ | 3.00 | |||||||||
| Hypothetical (5% return before expenses) | $ | 1,000.00 | $ | 1,022.33 | $ | 2.91 | |||||||||
| Expense Example - Service Shares | Beginning Account Value (7/1/06) | Ending Account Value (12/31/06) | Expenses Paid During Period (7/1/06-12/31/06)* | ||||||||||||
| Actual | $ | 1,000.00 | $ | 1,087.00 | $ | 4.31 | |||||||||
| Hypothetical (5% return before expenses) | $ | 1,000.00 | $ | 1,021.07 | $ | 4.18 | |||||||||
*Expenses are equal to the annualized expense ratio of 0.57% for Institutional Shares and 0.82% for Service Shares, multiplied by the average account value over the period, multiplied by 184/365 (to reflect the one-half year period).
Janus Aspen Series December 31, 2006 5
Janus Aspen Balanced Portfolio
Schedule of Investments
As of December 31, 2006
| Shares or Principal Amount | Value | ||||||||||
| Common Stock - 58.3% | |||||||||||
| Advertising Sales - 0.9% | |||||||||||
| 270,310 | Lamar Advertising Co.* | $ | 17,675,571 | ||||||||
| Aerospace and Defense - 0.3% | |||||||||||
| 61,441 | Lockheed Martin Corp. | 5,656,873 | |||||||||
| Agricultural Chemicals - 3.4% | |||||||||||
| 132,320 | Potash Corporation of Saskatchewan, Inc. (U.S. Shares) | 18,985,274 | |||||||||
| 155,010 | Syngenta A.G.* | 28,839,365 | |||||||||
| 542,154 | Syngenta A.G. (ADR) | 20,135,600 | |||||||||
| 67,960,239 | |||||||||||
| Automotive - Cars and Light Trucks - 0.7% | |||||||||||
| 255,873 | BMW A.G.** | 14,726,504 | |||||||||
| Beverages - Non-Alcoholic - 1.0% | |||||||||||
| 304,391 | PepsiCo, Inc. | 19,039,657 | |||||||||
| Brewery - 0.4% | |||||||||||
| 131,575 | Interbrew S.A.** | 8,673,824 | |||||||||
| Casino Hotels - 0.9% | |||||||||||
| 216,027 | Harrah's Entertainment, Inc. | 17,869,753 | |||||||||
| Computers - 0.8% | |||||||||||
| 373,735 | Hewlett-Packard Co. | 15,394,145 | |||||||||
| Computers - Memory Devices - 1.0% | |||||||||||
| 1,535,723 | EMC Corp.*,# | 20,271,544 | |||||||||
| Cosmetics and Toiletries - 1.6% | |||||||||||
| 490,855 | Procter & Gamble Co. | 31,547,251 | |||||||||
| Diversified Operations - 3.5% | |||||||||||
| 1,510,610 | General Electric Co. | 56,209,797 | |||||||||
| 127,503 | Honeywell International, Inc. | 5,768,236 | |||||||||
| 2,736,000 | Melco International Development, Ltd. | 6,486,230 | |||||||||
| 68,464,263 | |||||||||||
| E-Commerce/Services - 0.4% | |||||||||||
| 229,290 | IAC/InterActiveCorp*,# | 8,520,416 | |||||||||
| Electronic Components - Semiconductors - 2.9% | |||||||||||
| 38,478 | Samsung Electronics Company, Ltd.** | 25,362,381 | |||||||||
| 1,122,414 | Texas Instruments, Inc. | 32,325,523 | |||||||||
| 57,687,904 | |||||||||||
| Enterprise Software/Services - 1.0% | |||||||||||
| 1,145,225 | Oracle Corp.* | 19,629,157 | |||||||||
| Finance - Consumer Loans - 0.5% | |||||||||||
| 185,915 | SLM Corp. | 9,067,075 | |||||||||
| Finance - Credit Card - 1.4% | |||||||||||
| 473,838 | American Express Co. | 28,747,751 | |||||||||
| Finance - Investment Bankers/Brokers - 7.9% | |||||||||||
| 1,185,449 | JP Morgan Chase & Co. | 57,257,187 | |||||||||
| 809,690 | Merrill Lynch & Company, Inc. | 75,382,138 | |||||||||
| 617,000 | Mitsubishi UFJ Securities Company, Ltd.** | 6,854,115 | |||||||||
| 293,450 | UBS A.G. (U.S. Shares) | 17,703,839 | |||||||||
| 157,197,279 | |||||||||||
| Finance - Mortgage Loan Banker - 1.2% | |||||||||||
| 401,830 | Fannie Mae | 23,864,684 | |||||||||
| Food - Diversified - 0.7% | |||||||||||
| 37,745 | Nestle S.A. | 13,412,872 | |||||||||
| Hotels and Motels - 2.3% | |||||||||||
| 467,513 | Marriott International, Inc. - Class A | 22,309,720 | |||||||||
| 367,307 | Starwood Hotels & Resorts Worldwide, Inc. | 22,956,688 | |||||||||
| 45,266,408 | |||||||||||
| Shares or Principal Amount | Value | ||||||||||
| Medical - Biomedical and Genetic - 0.9% | |||||||||||
| 131,360 | Amgen, Inc.* | $ | 8,973,202 | ||||||||
| 144,155 | Celgene Corp.* | 8,293,237 | |||||||||
| 17,266,439 | |||||||||||
| Medical - Drugs - 5.0% | |||||||||||
| 185,805 | Merck & Company, Inc. | 8,101,098 | |||||||||
| 186,915 | Pfizer, Inc. | 4,841,099 | |||||||||
| 362,016 | Roche Holding A.G. | 64,916,286 | |||||||||
| 227,972 | Sanofi-Aventis** | 21,050,282 | |||||||||
| 98,908,765 | |||||||||||
| Medical - HMO - 0.3% | |||||||||||
| 159,281 | Aetna, Inc. | 6,877,754 | |||||||||
| Medical Products - 1.3% | |||||||||||
| 310,565 | Johnson & Johnson | 20,503,502 | |||||||||
| 75,990 | Zimmer Holdings, Inc.*,# | 5,956,096 | |||||||||
| 26,459,598 | |||||||||||
| Oil Companies - Exploration and Production - 1.3% | |||||||||||
| 580,575 | EnCana Corp. (U.S. Shares) | 26,677,421 | |||||||||
| Oil Companies - Integrated - 2.9% | |||||||||||
| 371,165 | ConocoPhillips | 26,705,321 | |||||||||
| 195,963 | Exxon Mobil Corp. | 15,016,645 | |||||||||
| 209,237 | Suncor Energy, Inc. | 16,469,463 | |||||||||
| 58,191,429 | |||||||||||
| Optical Supplies - 0.2% | |||||||||||
| 32,290 | Alcon, Inc. (U.S. Shares) | 3,609,053 | |||||||||
| Pharmacy Services - 0.9% | |||||||||||
| 309,797 | Caremark Rx, Inc. | 17,692,507 | |||||||||
| Real Estate Operating/Development - 0.7% | |||||||||||
| 6,756,200 | Guangzhou R&F Properties Company, Ltd.# | 14,592,412 | |||||||||
| Retail - Regional Department Stores - 1.4% | |||||||||||
| 747,254 | Federated Department Stores, Inc. | 28,492,795 | |||||||||
| Soap and Cleaning Preparations - 1.8% | |||||||||||
| 775,777 | Reckitt Benckiser PLC** | 35,452,461 | |||||||||
| Telecommunication Equipment - Fiber Optics - 0.6% | |||||||||||
| 616,506 | Corning, Inc.* | 11,534,827 | |||||||||
| Therapeutics - 1.0% | |||||||||||
| 306,596 | Gilead Sciences, Inc.* | 19,907,278 | |||||||||
| Tobacco - 1.9% | |||||||||||
| 440,890 | Altria Group, Inc. | 37,837,180 | |||||||||
| Transportation - Railroad - 2.5% | |||||||||||
| 689,616 | Canadian National Railway Co. (U.S. Shares) | 29,674,176 | |||||||||
| 222,447 | Union Pacific Corp. | 20,469,573 | |||||||||
| 50,143,749 | |||||||||||
| Transportation - Services - 0.5% | |||||||||||
| 88,914 | FedEx Corp. | 9,657,839 | |||||||||
| Web Portals/Internet Service Providers - 1.7% | |||||||||||
| 12,220 | Google, Inc. - Class A* | 5,627,066 | |||||||||
| 1,090,930 | Yahoo!, Inc.* | 27,862,352 | |||||||||
| 33,489,418 | |||||||||||
| Wireless Equipment - 0.6% | |||||||||||
| 317,675 | QUALCOMM, Inc. | 12,004,938 | |||||||||
| Total Common Stock (cost $863,190,612) | 1,159,469,033 | ||||||||||
See Notes to Schedule of Investments and Financial Statements.
6 Janus Aspen Series December 31, 2006
Schedule of Investments
As of December 31, 2006
| Shares or Principal Amount | Value | ||||||||||
| Corporate Bonds - 9.7% | |||||||||||
| Automotive - Cars and Light Trucks - 0.1% | |||||||||||
| $ | 2,070,000 | General Motors Nova Financial Corp. 6.85%, company guaranteed notes due 10/15/08 | $ | 2,059,650 | |||||||
| Cable Television - 0.9% | |||||||||||
| Comcast Corp.: | |||||||||||
| 3,155,000 | 5.80031%, company guaranteed notes due 7/14/09‡ | 3,162,020 | |||||||||
| 3,755,000 | 6.50%, company guaranteed notes due 1/15/17 | 3,918,425 | |||||||||
| 6,410,000 | 6.45%, company guaranteed notes due 3/15/37 | 6,413,461 | |||||||||
| CSC Holdings, Inc.: | |||||||||||
| 12,386 | 7.11%, bank loan, due 3/29/13‡ | 12,389 | |||||||||
| 1,415,589 | 7.12%, bank loan, due 3/29/13‡ | 1,415,886 | |||||||||
| 270,731 | 7.12063%, bank loan, due 3/29/13‡ | 270,788 | |||||||||
| 1,132,471 | 7.12163%, bank loan, due 3/29/13‡ | 1,132,709 | |||||||||
| 2,098,610 | 7.12563%, bank loan, due 3/29/13‡ | 2,099,051 | |||||||||
| 18,424,729 | |||||||||||
| Cellular Telecommunications - 0.2% | |||||||||||
| 3,715,000 | Nextel Communications, Inc., 5.95% company guaranteed notes, due 3/15/14 | 3,617,726 | |||||||||
| Commercial Banks - 0.2% | |||||||||||
| 4,265,000 | US Bank, 5.70% subordinated notes, due 12/15/08 | 4,303,517 | |||||||||
| Containers - Metal and Glass - 0.7% | |||||||||||
| 7,480,000 | Owens-Brockway Glass Container, Inc. 8.875%, company guaranteed notes due 2/15/09 | 7,648,300 | |||||||||
| 6,585,000 | Owens-Illinois, Inc., 7.35% senior notes, due 5/15/08 | 6,626,156 | |||||||||
| 14,274,456 | |||||||||||
| Diversified Financial Services - 0.2% | |||||||||||
| 2,835,000 | General Electric Capital Corp., 6.75% notes, due 3/15/32 | 3,246,863 | |||||||||
| Electric - Integrated - 0.8% | |||||||||||
| 2,020,000 | CMS Energy Corp., 7.50% senior notes, due 1/15/09 | 2,083,125 | |||||||||
| 6,655,000 | MidAmerican Energy Holdings Co., 3.50% senior notes, due 5/15/08 | 6,488,845 | |||||||||
| Pacific Gas and Electric Co.: | |||||||||||
| 495,000 | 3.60%, unsecured notes, due 3/1/09 | 478,132 | |||||||||
| 1,740,000 | 4.20%, unsecured notes, due 3/1/11 | 1,665,965 | |||||||||
| TXU Corp.: | |||||||||||
| 4,100,000 | 5.55%, senior notes, due 11/15/14 | 3,892,298 | |||||||||
| 1,440,000 | 6.50%, senior notes, due 11/15/24 | 1,356,611 | |||||||||
| 15,964,976 | |||||||||||
| Finance - Auto Loans - 0.9% | |||||||||||
| Ford Motor Credit Co.: | |||||||||||
| 3,460,000 | 9.95688%, notes, due 4/15/12‡ | 3,666,700 | |||||||||
| 5,700,000 | 8.00%, senior unsecured notes due 12/15/16 | 5,632,455 | |||||||||
| General Motors Acceptance Corp.: | |||||||||||
| 1,855,000 | 6.15%, bonds, due 4/5/07 | 1,855,058 | |||||||||
| 2,785,000 | 4.375%, notes, due 12/10/07 | 2,746,241 | |||||||||
| 4,860,000 | 7.25%, notes, due 3/2/11 | 5,054,079 | |||||||||
| 18,954,533 | |||||||||||
| Shares or Principal Amount | Value | ||||||||||
| Finance - Consumer Loans - 0.3% | |||||||||||
| $ | 5,495,000 | Household Finance Corp., 4.75% notes, due 5/15/09 | $ | 5,435,555 | |||||||
| Finance - Investment Bankers/Brokers - 1.1% | |||||||||||
| 7,814,000 | Citigroup, Inc., 5.00% subordinated notes, due 9/15/14 | 7,629,567 | |||||||||
| 8,015,000 | Credit Suisse First Boston USA, Inc., 3.875% notes, due 1/15/09 | 7,813,151 | |||||||||
| 5,720,000 | JP Morgan Chase & Co., 3.80% notes, due 10/2/09 | 5,520,160 | |||||||||
| 20,962,878 | |||||||||||
| Food - Diversified - 0.3% | |||||||||||
| 5,315,000 | Kellogg Co., 2.875% senior notes, due 6/1/08 | 5,130,027 | |||||||||
| Gas - Distribution - 0.2% | |||||||||||
| 3,825,000 | Oneok, Inc., 5.20% notes, due 6/15/15 | 3,607,981 | |||||||||
| Independent Power Producer - 0.1% | |||||||||||
| 1,050,000 | NRG Energy, Inc., 7.375% company guaranteed notes, due 1/15/17 | 1,052,625 | |||||||||
| Medical - HMO - 0.1% | |||||||||||
| 2,055,000 | UnitedHealth Group, Inc., 5.20% senior unsecured notes, due 1/17/07 | 2,054,786 | |||||||||
| Medical - Hospitals - 0.3% | |||||||||||
| HCA, Inc.: | |||||||||||
| 2,370,000 | 8.1138%, bank loan, due 11/1/13‡ | 2,395,193 | |||||||||
| 3,215,000 | 9.25%, secured notes due 11/15/16 (144A) | 3,444,069 | |||||||||
| 5,839,262 | |||||||||||
| Multimedia - 0.4% | |||||||||||
| Viacom, Inc.: | |||||||||||
| 3,785,000 | 6.25%, senior notes, due 4/30/16 | 3,758,781 | |||||||||
| 3,785,000 | 6.875%, senior notes, due 4/30/36 | 3,742,150 | |||||||||
| 7,500,931 | |||||||||||
| Non-Hazardous Waste Disposal - 0.1% | |||||||||||
| Allied Waste Industries, Inc.: | |||||||||||
| 513,223 | 5.3225%, bank loan, due 1/15/12‡ | 514,250 | |||||||||
| 241,345 | 7.12%, bank loan, due 1/15/12‡ | 241,760 | |||||||||
| 206,867 | 7.13%, bank loan, due 1/15/12‡ | 207,223 | |||||||||
| 189,628 | 7.17%, bank loan, due 1/15/12‡ | 189,954 | |||||||||
| 517,168 | 7.17%, bank loan, due 1/15/12‡ | 518,058 | |||||||||
| 114,890 | 7.21%, bank loan, due 1/15/12‡ | 115,087 | |||||||||
| 1,786,332 | |||||||||||
| Office Supplies and Forms - 0.1% | |||||||||||
| 1,915,000 | Acco Brands Corp., 7.625% company guaranteed notes, due 8/15/15 | 1,881,488 | |||||||||
| Oil Companies - Exploration and Production - 0.1% | |||||||||||
| Sabine Production Partners L.P.: | |||||||||||
| 1,200,000 | 7.25%, secured notes, due 11/30/13 (144A) | 1,195,500 | |||||||||
| 1,100,000 | 7.50%, secured notes, due 11/30/16 (144A) | 1,093,125 | |||||||||
| 2,288,625 | |||||||||||
| Oil Companies - Integrated - 0.3% | |||||||||||
| ConocoPhillips Co.: | |||||||||||
| 3,740,000 | 5.625%, company guaranteed notes due 10/15/16 | 3,757,780 | |||||||||
| 2,245,000 | 5.95%, company guaranteed notes due 10/15/36 | 2,276,237 | |||||||||
| 6,034,017 | |||||||||||
See Notes to Schedule of Investments and Financial Statements.
Janus Aspen Series December 31, 2006 7
Janus Aspen Balanced Portfolio
Schedule of Investments
As of December 31, 2006
| Shares or Principal Amount | Value | ||||||||||
| Photo Equipment and Supplies - 0.1% | |||||||||||
| Eastman Kodak Co.: | |||||||||||
| $ | 687,941 | 0%, bank loan, due 10/18/12‡ | $ | 689,593 | |||||||
| 603,458 | 7.60%, bank loan, due 10/18/12‡ | 604,906 | |||||||||
| 600,440 | 7.60%, bank loan, due 10/18/12‡ | 601,881 | |||||||||
| 1,896,380 | |||||||||||
| Pipelines - 0.6% | |||||||||||
| El Paso Corp.: | |||||||||||
| 930,000 | 7.625%, senior notes, due 9/1/08 | 957,900 | |||||||||
| 11,500,000 | 7.00%, senior notes, due 5/15/11 | 11,931,250 | |||||||||
| 12,889,150 | |||||||||||
| Publishing - Periodicals - 0.1% | |||||||||||
| 2,491,000 | Idearc, Inc., 7.35% bank loan, due 11/1/14‡ | 2,503,903 | |||||||||
| Rental Auto/Equipment - 0.1% | |||||||||||
| 3,031,035 | Avis Rent A Car Systems, Inc., 6.63% bank loan, due 4/19/12‡ | 3,012,849 | |||||||||
| Retail - Building Products - 0.1% | |||||||||||
| 2,065,000 | Home Depot, Inc., 5.875% senior unsecured notes, due 12/16/36 | 2,026,434 | |||||||||
| Retail - Major Department Stores - 0.2% | |||||||||||
| 3,530,000 | May Department Stores Co., 4.80% notes, due 7/15/09 | 3,473,679 | |||||||||
| Retail - Regional Department Stores - 0.1% | |||||||||||
| Neiman Marcus Group, Inc.: | |||||||||||
| 182,177 | 7.60%, bank loan, due 4/6/13‡ | 183,372 | |||||||||
| 1,525,734 | 7.60250%, bank loan, due 4/6/13‡ | 1,535,743 | |||||||||
| 1,719,115 | |||||||||||
| Telecommunication Services - 0.8% | |||||||||||
| 7,505,000 | Embarq Corp., 7.082% senior unsecured notes, due 6/1/16 | 7,640,241 | |||||||||
| 7,710,000 | Verizon Global Funding Corp., 4.00% senior unsecured notes, due 1/15/08 | 7,606,832 | |||||||||
| 15,247,073 | |||||||||||
| Transportation - Railroad - 0.2% | |||||||||||
| Canadian National Railway Co.: | |||||||||||
| 1,445,000 | 4.25%, notes, due 8/1/09 | 1,412,262 | |||||||||
| 3,050,000 | 6.25%, bonds, due 8/1/34 | 3,257,284 | |||||||||
| 4,669,546 | |||||||||||
| Total Corporate Bonds (cost $190,493,832) | 191,859,086 | ||||||||||
| Mortgage Backed Securities - 1.1% | |||||||||||
| U.S. Government Agencies - 1.1% | |||||||||||
| 12,030,947 | Federal Home Loan Bank System, 5.27% due 12/28/12 | 11,977,843 | |||||||||
| 9,147,497 | Freddie Mac, 5.75%, due 12/15/18 | 9,154,785 | |||||||||
| Total Mortgage Backed Securities (cost $21,264,294) | 21,132,628 | ||||||||||
| U.S. Government Agencies - 1.7% | |||||||||||
| Fannie Mae: | |||||||||||
| 10,060,000 | 5.00%, due 1/15/07 | 10,059,135 | |||||||||
| 4,705,000 | 5.25%, due 12/3/07 | 4,705,259 | |||||||||
| 1,885,000 | 2.50%, due 6/15/08 | 1,817,161 | |||||||||
| 3,120,000 | 5.25%, due 1/15/09 | 3,133,347 | |||||||||
| 655,000 | 6.375%, due 6/15/09 | 675,773 | |||||||||
| 5,122,000 | 5.375%, due 11/15/11 | 5,219,825 | |||||||||
| Freddie Mac: | |||||||||||
| 4,095,000 | 5.75%, due 4/15/08 | 4,125,266 | |||||||||
| 1,665,000 | 5.75%, due 3/15/09 | 1,690,634 | |||||||||
| 1,565,000 | 7.00%, due 3/15/10 | 1,659,387 | |||||||||
| Total U.S. Government Agencies (cost $33,470,812) | 33,085,787 | ||||||||||
| Shares or Principal Amount | Value | ||||||||||
| U.S. Treasury Notes/Bonds - 27.8% | |||||||||||
| $ | 38,880,000 | 3.625%, due 4/30/07# | $ | 38,703,835 | |||||||
| 7,110,000 | 3.875%, due 7/31/07# | 7,062,782 | |||||||||
| 1,410,000 | 4.00%, due 9/30/07# | 1,399,095 | |||||||||
| 4,200,000 | 3.00%, due 11/15/07# | 4,127,978 | |||||||||
| 8,514,183 | 3.625%, due 1/15/08‡‡ | 8,604,979 | |||||||||
| 13,380,000 | 3.375%, due 2/15/08# | 13,146,372 | |||||||||
| 9,005,000 | 3.75%, due 5/15/08# | 8,867,115 | |||||||||
| 13,831,000 | 5.625%, due 5/15/08# | 13,957,429 | |||||||||
| 43,555,000 | 4.875%, due 5/31/08# | 43,534,574 | |||||||||
| 15,470,000 | 4.375%, due 11/15/08# | 15,345,513 | |||||||||
| 20,618,000 | 4.50%, due 2/15/09# | 20,493,158 | |||||||||
| 15,480,000 | 3.125%, due 4/15/09# | 14,932,147 | |||||||||
| 1,805,000 | 4.875%, due 5/15/09# | 1,808,949 | |||||||||
| 16,406,000 | 6.00%, due 8/15/09# | 16,901,379 | |||||||||
| 20,420,000 | 4.00%, due 4/15/10# | 19,981,297 | |||||||||
| 9,450,000 | 3.625%, due 6/15/10# | 9,128,114 | |||||||||
| 7,205,000 | 3.875%, due 7/15/10# | 7,014,183 | |||||||||
| 2,480,000 | 4.125%, due 8/15/10# | 2,432,920 | |||||||||
| 4,315,000 | 5.75%, due 8/15/10# | 4,463,833 | |||||||||
| 6,510,000 | 4.25%, due 10/15/10# | 6,409,297 | |||||||||
| 21,805,000 | 4.50%, due 11/15/10# | 21,649,988 | |||||||||
| 6,865,000 | 4.375%, due 12/15/10# | 6,785,895 | |||||||||
| 14,845,000 | 4.50%, due 2/28/11# | 14,735,399 | |||||||||
| 17,100,000 | 4.875%, due 4/30/11# | 17,210,876 | |||||||||
| 8,100,000 | 4.875%, due 7/31/11# | 8,156,951 | |||||||||
| 16,505,000 | 5.00%, due 8/15/11# | 16,735,806 | |||||||||
| 3,745,000 | 4.625%, due 8/31/11# | 3,733,151 | |||||||||
| 5,185,000 | 4.50%, due 9/30/11# | 5,139,429 | |||||||||
| 1,130,000 | 4.50%, due 11/30/11# | 1,119,936 | |||||||||
| 11,095,000 | 4.25%, due 8/15/14# | 10,769,950 | |||||||||
| 19,902,318 | 1.875%, due 7/15/15#,‡‡ | 19,072,790 | |||||||||
| 17,228,000 | 4.25%, due 8/15/15# | 16,670,778 | |||||||||
| 12,390,000 | 4.50%, due 2/15/16# | 12,192,528 | |||||||||
| 28,325,000 | 5.125%, due 5/15/16# | 29,175,855 | |||||||||
| 12,616,000 | 7.25%, due 5/15/16# | 14,996,778 | |||||||||
| 3,742,828 | 2.50%, due 7/15/16‡‡ | 3,771,191 | |||||||||
| 22,065,000 | 4.875%, due 8/15/16# | 22,328,743 | |||||||||
| 676,000 | 4.625%, due 11/15/16 | 671,564 | |||||||||
| 3,855,000 | 7.875%, due 2/15/21# | 5,020,235 | |||||||||
| 10,038,000 | 7.25%, due 8/15/22# | 12,589,067 | |||||||||
| 11,686,000 | 6.00%, due 2/15/26# | 13,253,572 | |||||||||
| 4,269,810 | 3.375%, due 4/15/32#,‡‡ | 5,157,799 | |||||||||
| 34,148,000 | 4.50%, due 2/15/36# | 32,472,631 | |||||||||
| Total U.S. Treasury Notes/Bonds (cost $554,302,930) | 551,725,861 | ||||||||||
| Money Markets - 0.5% | |||||||||||
| 1,911,500 | Janus Institutional Cash Reserves Fund 5.29% | 1,911,500 | |||||||||
| 7,561,500 | Janus Money Market Fund, 5.24% | 7,561,500 | |||||||||
| Total Money Markets (cost $9,473,000) | 9,473,000 | ||||||||||
| Other Securities - 21.8% | |||||||||||
| 431,991,165 | State Street Navigator Securities Lending Prime Portfolio† (cost $431,991,165) | 431,991,165 | |||||||||
| Total Investments (total cost $2,104,186,645) – 120.9% | 2,398,736,560 | ||||||||||
| Liabilities, net of Cash, Receivables and Other Assets – (20.9)% | (414,299,387 | ) | |||||||||
| Net Assets – 100.0% | $ | 1,984,437,173 | |||||||||
See Notes to Schedule of Investments and Financial Statements.
8 Janus Aspen Series December 31, 2006
Schedule of Investments
As of December 31, 2006
Summary of Investments by Country
| Country | Value | % of Investment Securities | |||||||||
| Belgium | $ | 8,673,824 | 0.4 | % | |||||||
| Canada | 104,569,547 | 4.3 | % | ||||||||
| China | 14,592,412 | 0.6 | % | ||||||||
| France | 21,050,282 | 0.9 | % | ||||||||
| Germany | 14,726,504 | 0.6 | % | ||||||||
| Hong Kong | 6,486,230 | 0.3 | % | ||||||||
| Japan | 6,854,115 | 0.3 | % | ||||||||
| South Korea | 25,362,381 | 1.0 | % | ||||||||
| Switzerland | 148,617,015 | 6.2 | % | ||||||||
| United Kingdom | 35,452,461 | 1.5 | % | ||||||||
| United States†† | 2,012,351,789 | 83.9 | % | ||||||||
| Total | $ | 2,398,736,560 | 100.0 | % | |||||||
††Includes Short-Term Securities and Other Securities (65.5% excluding Short-Term Securities and Other Securities)
Forward Currency Contracts, Open
| Currency Sold and Settlement Date | Currency Units Sold | Currency Value in $U.S. | Unrealized Gain/(Loss) | ||||||||||||
| British Pound 3/14/07 | 1,400,000 | $ | 2,741,523 | $ | (150,221 | ) | |||||||||
| British Pound 3/15/07 | 8,500,000 | 16,644,974 | (777,939 | ) | |||||||||||
| Euro 1/11/07 | 13,350,000 | 17,633,501 | (612,251 | ) | |||||||||||
| Japanese Yen 3/14/07 | 390,000,000 | 3,310,053 | 128,191 | ||||||||||||
| South Korean Won 3/14/07 | 4,675,000,000 | 5,039,888 | (108,453 | ) | |||||||||||
| South Korean Won 3/15/07 | 2,125,000,000 | 2,290,924 | (64,861 | ) | |||||||||||
| Total | $ | 47,660,863 | $ | (1,585,534 | ) | ||||||||||
See Notes to Schedule of Investments and Financial Statements.
Janus Aspen Series December 31, 2006 9
Statement of Assets and Liabilities
| As of December 31, 2006 (all numbers in thousands except net asset value per share) | Janus Aspen Balanced Portfolio | ||||||
| Assets: | |||||||
| Investments at cost(1) | $ | 2,104,187 | |||||
| Investments at value(1) | $ | 2,398,737 | |||||
| Cash | 8,305 | ||||||
| Cash denominated in foreign currency (cost $12) | 12 | ||||||
| Receivables: | |||||||
| Investments sold | 8,424 | ||||||
| Portfolio shares sold | 138 | ||||||
| Dividends | 1,617 | ||||||
| Interest | 9,582 | ||||||
| Other assets | 177 | ||||||
| Forward currency contracts | 128 | ||||||
| Total Assets | 2,427,120 | ||||||
| Liabilities: | |||||||
| Payables: | |||||||
| Collateral for securities loaned (Note 1) | 431,991 | ||||||
| Investments purchased | 6,530 | ||||||
| Portfolio shares repurchased | 1,308 | ||||||
| Advisory fees | 933 | ||||||
| Transfer agent fees and expenses | 1 | ||||||
| Distribution fees - Service Shares | 108 | ||||||
| Non-interested Trustees' fees and expenses | 17 | ||||||
| Accrued expenses | 81 | ||||||
| Forward currency contracts | 1,714 | ||||||
| Total Liabilities | 442,683 | ||||||
| Net Assets | $ | 1,984,437 | |||||
| Net Assets Consist of: | |||||||
| Capital (par value and paid-in-surplus)* | $ | 1,694,376 | |||||
| Undistributed net investment income/(loss)* | 5,348 | ||||||
| Undistributed net realized gain/(loss) from investments and foreign currency transactions* | (8,254 | ) | |||||
| Unrealized net appreciation/(depreciation) of investments and foreign currency translations | 292,967 | ||||||
| Total Net Assets | $ | 1,984,437 | |||||
| Net Assets - Institutional Shares | $ | 1,475,350 | |||||
| Shares Outstanding, $0.001 Par Value (unlimited shares authorized) | 52,905 | ||||||
| Net Asset Value Per Share | $ | 27.89 | |||||
| Net Assets - Service Shares | $ | 509,087 | |||||
| Shares Outstanding, $0.001 Par Value (unlimited shares authorized) | 17,657 | ||||||
| Net Asset Value Per Share | $ | 28.83 | |||||
*See Note 3 in Notes to Financial Statements.
(1) Investments at cost and value include $423,008,276 of securities loaned for Janus Aspen Balanced Portfolio (Note 1).
See Notes to Financial Statements.
10 Janus Aspen Series December 31, 2006
Statement of Operations
| For the fiscal year ended December 31, 2006 (all numbers in thousands) | Janus Aspen Balanced Portfolio | ||||||
| Investment Income: | |||||||
| Interest | $ | 35,679 | |||||
| Securities lending income | 634 | ||||||
| Dividends | 17,547 | ||||||
| Dividends from affiliates | 655 | ||||||
| Foreign tax withheld | (425 | ) | |||||
| Total Investment Income | 54,090 | ||||||
| Expenses: | |||||||
| Advisory fees | 11,369 | ||||||
| Transfer agent expenses | 5 | ||||||
| Registration fees | 29 | ||||||
| Custodian fees | 70 | ||||||
| Professional fees | 20 | ||||||
| Non-interested Trustees' fees and expenses | 75 | ||||||
| Distribution fees - Service Shares | 1,288 | ||||||
| Other expenses | 350 | ||||||
| Non-recurring costs (Note 2) | 1 | ||||||
| Costs assumed by Janus Capital Management LLC (Note 2) | (1 | ) | |||||
| Total Expenses | 13,206 | ||||||
| Expense and Fee Offset | (27 | ) | |||||
| Net Expenses | 13,179 | ||||||
| Net Investment Income/(Loss) | 40,911 | ||||||
| Net Realized and Unrealized Gain/(Loss) on Investments: | |||||||
| Net realized gain/(loss) from securities transactions | 185,830 | ||||||
| Net realized gain/(loss) from foreign currency transactions | (2,738 | ) | |||||
| Change in unrealized net appreciation/(depreciation) of investments and foreign currency translations | (14,566 | ) | |||||
| Payment from affiliate (Note 2) | 1 | ||||||
| Net Gain/(Loss) on Investments | 168,527 | ||||||
| Net Increase/(Decrease) in Net Assets Resulting from Operations | $ | 209,438 | |||||
See Notes to Financial Statements.
Janus Aspen Series December 31, 2006 11
Statements of Changes in Net Assets
| For the fiscal year ended December 31 | Janus Aspen Balanced Portfolio | ||||||||||
| (all numbers in thousands) | 2006 | 2005 | |||||||||
| Operations: | |||||||||||
| Net investment income/(loss) | $ | 40,911 | $ | 47,220 | |||||||
| Net realized gain/(loss) from investment and foreign currency transactions | 183,092 | 163,922 | |||||||||
| Change in unrealized net appreciation/(depreciation) of investments and foreign currency translations | (14,566 | ) | (59,681 | ) | |||||||
| Payment from affiliate (Note 2) | 1 | 28 | |||||||||
| Net Increase/(Decrease) in Net Assets Resulting from Operations | 209,438 | 151,489 | |||||||||
| Dividends and Distributions to Shareholders: | |||||||||||
| Net investment income* | |||||||||||
| Institutional Shares | (32,008 | ) | (38,512 | ) | |||||||
| Service Shares | (9,453 | ) | (11,099 | ) | |||||||
| Net realized gain from investment transactions* | |||||||||||
| Institutional Shares | – | – | |||||||||
| Service Shares | – | – | |||||||||
| Net Decrease from Dividends and Distributions | (41,461 | ) | (49,611 | ) | |||||||
| Capital Share Transactions: | |||||||||||
| Shares sold | |||||||||||
| Institutional Shares | 31,534 | 34,712 | |||||||||
| Service Shares | 71,520 | 80,333 | |||||||||
| Reinvested dividends and distributions | |||||||||||
| Institutional Shares | 32,008 | 38,512 | |||||||||
| Service Shares | 9,453 | 11,099 | |||||||||
| Shares repurchased(1) | |||||||||||
| Institutional Shares | (395,655 | ) | (860,239 | ) | |||||||
| Service Shares | (173,852 | ) | (74,540 | ) | |||||||
| Net Increase/(Decrease) from Capital Share Transactions | (424,992 | ) | (770,123 | ) | |||||||
| Net Increase/(Decrease) in Net Assets | (257,015 | ) | (668,245 | ) | |||||||
| Net Assets: | |||||||||||
| Beginning of period | 2,241,452 | 2,909,697 | |||||||||
| End of period | $ | 1,984,437 | $ | 2,241,452 | |||||||
| Undistributed net investment income/(loss)* | $ | 5,348 | $ | 5,866 | |||||||
*See Note 3 in Notes to Financial Statements.
(1) During the fiscal year ended December 31, 2005, Janus Aspen Balanced Portfolio disbursed to a redeeming shareholder portfolio securities and cash valued at $469,428,721 on the date of redemption.
See Notes to Financial Statements.
12 Janus Aspen Series December 31, 2006
Financial Highlights
Institutional Shares
| For a share outstanding during each fiscal year ended December 31 | Janus Aspen Balanced Portfolio | ||||||||||||||||||||||
| 2006 | 2005 | 2004 | 2003 | 2002 | |||||||||||||||||||
| Net Asset Value, Beginning of Period | $ | 25.74 | $ | 24.39 | $ | 22.98 | $ | 20.59 | $ | 22.57 | |||||||||||||
| Income from Investment Operations: | |||||||||||||||||||||||
| Net investment income/(loss) | .61 | .61 | .60 | .47 | .55 | ||||||||||||||||||
| Net gain/(loss) on securities (both realized and unrealized) | 2.12 | 1.31 | 1.35 | 2.40 | (2.00 | ) | |||||||||||||||||
| Total from Investment Operations | 2.73 | 1.92 | 1.95 | 2.87 | (1.45 | ) | |||||||||||||||||
| Less Distributions and Other: | |||||||||||||||||||||||
| Dividends (from net investment income)* | (.58 | ) | (.57 | ) | (.54 | ) | (.48 | ) | (.53 | ) | |||||||||||||
| Distributions (from capital gains)* | – | – | – | – | – | ||||||||||||||||||
| Payment from affiliate | – | (1) | – | (1) | – | – | – | ||||||||||||||||
| Total Distributions and Other | (.58 | ) | (.57 | ) | (.54 | ) | (.48 | ) | (.53 | ) | |||||||||||||
| Net Asset Value, End of Period | $ | 27.89 | $ | 25.74 | $ | 24.39 | $ | 22.98 | $ | 20.59 | |||||||||||||
| Total Return | 10.72 | %(2) | 7.95 | %(2) | 8.53 | % | 14.05 | % | (6.44 | )% | |||||||||||||
| Net Assets, End of Period (in thousands) | $ | 1,475,350 | $ | 1,681,985 | $ | 2,395,562 | $ | 3,253,664 | $ | 3,141,601 | |||||||||||||
| Average Net Assets for the Period (in thousands) | $ | 1,554,032 | $ | 1,887,185 | $ | 3,012,164 | $ | 3,183,585 | $ | 3,327,140 | |||||||||||||
| Ratio of Gross Expenses to Average Net Assets(3)(4) | 0.58 | % | 0.57 | % | 0.61 | % | 0.67 | % | 0.67 | % | |||||||||||||
| Ratio of Net Expenses to Average Net Assets(4) | 0.57 | % | 0.56 | % | 0.61 | % | 0.67 | % | 0.67 | % | |||||||||||||
| Ratio of Net Investment Income/(Loss) to Average Net Assets | 2.04 | % | 2.01 | % | 2.08 | % | 2.12 | % | 2.53 | % | |||||||||||||
| Portfolio Turnover Rate | 52 | % | 52 | % | 64 | % | 69 | % | 94 | % | |||||||||||||
Service Shares
| For a share outstanding during each fiscal year ended December 31 | Janus Aspen Balanced Portfolio | ||||||||||||||||||||||
| 2006 | 2005 | 2004 | 2003 | 2002 | |||||||||||||||||||
| Net Asset Value, Beginning of Period | $ | 26.61 | $ | 25.24 | $ | 23.82 | $ | 21.32 | $ | 23.31 | |||||||||||||
| Income from Investment Operations: | |||||||||||||||||||||||
| Net investment income/(loss) | .49 | .45 | .44 | .39 | .45 | ||||||||||||||||||
| Net gain/(loss) on securities (both realized and unrealized) | 2.27 | 1.46 | 1.52 | 2.52 | (2.00 | ) | |||||||||||||||||
| Total from Investment Operations | 2.76 | 1.91 | 1.96 | 2.91 | (1.55 | ) | |||||||||||||||||
| Less Distributions and Other: | |||||||||||||||||||||||
| Dividends (from net investment income)* | (.54 | ) | (.54 | ) | (.54 | ) | (.41 | ) | (.44 | ) | |||||||||||||
| Distributions (from capital gains)* | – | – | – | – | – | ||||||||||||||||||
| Payment from affiliate | – | (1) | – | (1) | – | – | – | ||||||||||||||||
| Total Distributions and Other | (.54 | ) | (.54 | ) | (.54 | ) | (.41 | ) | (.44 | ) | |||||||||||||
| Net Asset Value, End of Period | $ | 28.83 | $ | 26.61 | $ | 25.24 | $ | 23.82 | $ | 21.32 | |||||||||||||
| Total Return | 10.46 | %(2) | 7.62 | %(2) | 8.29 | % | 13.72 | % | (6.67 | )% | |||||||||||||
| Net Assets, End of Period (in thousands) | $ | 509,087 | $ | 559,467 | $ | 514,135 | $ | 431,044 | $ | 282,367 | |||||||||||||
| Average Net Assets for the Period (in thousands) | $ | 515,319 | $ | 526,693 | $ | 465,719 | $ | 349,871 | $ | 237,813 | |||||||||||||
| Ratio of Gross Expenses to Average Net Assets(3)(4) | 0.83 | % | 0.82 | % | 0.86 | % | 0.92 | % | 0.92 | % | |||||||||||||
| Ratio of Net Expenses to Average Net Assets(4) | 0.82 | % | 0.82 | % | 0.86 | % | 0.92 | % | 0.92 | % | |||||||||||||
| Ratio of Net Investment Income/(Loss) to Average Net Assets | 1.79 | % | 1.77 | % | 1.85 | % | 1.86 | % | 2.28 | % | |||||||||||||
| Portfolio Turnover Rate | 52 | % | 52 | % | 64 | % | 69 | % | 94 | % | |||||||||||||
*See Note 3 in Notes to Financial Statements.
(1) Payment from affiliate aggregated less than $.01 on a per share basis for the fiscal year ended.
(2) During the fiscal year ended, Janus Capital and/or Janus Services LLC fully reimbursed the Portfolio for a loss on a transaction resulting from certain trading, pricing and/or shareholder activity errors, which otherwise would have reduced total return by less than 0.01%.
(3) The effect of non-recurring costs assumed by Janus Capital (Note 2) is included in the ratio of gross expenses to average net assets and was less than 0.01%.
(4) See "Explanations of Charts, Tables and Financial Statements."
See Notes to Financial Statements.
Janus Aspen Series December 31, 2006 13
Notes to Schedule of Investments
| Balanced Index | An internally-calculated, hypothetical combination of unmanaged indices that combines total returns from the S&P 500® Index (55%) and Lehman Brothers Government/Credit Index (45%). | ||||||
| Lehman Brothers Government/Credit Index | Is composed of all bonds that are investment grade with at least one year until maturity. | ||||||
| Lipper Variable Annuity Balanced Funds | Funds whose primary objective is to conserve principal by maintaining at all times a balanced portfolio of both stocks and bonds. Typically, the stock/bond ratio ranges around 60%/40%. | ||||||
| S&P 500® Index | The Standard & Poor's Composite Index of 500 stocks, a widely recognized, unmanaged index of common stock prices. | ||||||
| 144A | Securities sold under Rule 144A of the Securities Act of 1933 are subject to legal and/or contractual restrictions on resale and may not be publicly sold without registration under the 1933 Act. | ||||||
| ADR | American Depositary Receipt | ||||||
| PLC | Public Limited Company | ||||||
| U.S. Shares | Securities of foreign companies trading on an American Stock Exchange. | ||||||
* Non-income-producing security.
** A portion of this security has been segregated by the custodian to cover margin or segregation requirements on open futures contracts, forward currency contracts, options contracts, short sales and/or securities with extended settlement dates..
‡ Rate is subject to change. Rate shown reflects rate as of December 31, 2006.
‡‡ Security is a U.S. Treasury Inflation-Protected Security (TIPS).
# Loaned security; a portion or all of the security is on loan at December 31, 2006.
† The security is purchased with the cash collateral received from securities on loan (Note 1).
Aggregate collateral segregated to cover margin or segregation requirements on open futures contracts, forward currency contracts, options contracts, short sales and/or securities with extended settlement dates as of December 31, 2006 are noted below.
| Portfolio | Aggregate Value | ||||||
| Janus Aspen Balanced Portfolio | $ | 112,119,567 | |||||
The interest rate for variable rate notes is based upon an index or market interest rates and is subject to change. Rates in the security description are as of December 31, 2006.
14 Janus Aspen Series December 31, 2006
Notes to Financial Statements
The following section describes the organization and significant accounting policies and provides more detailed information about the schedules and tables that appear throughout this report. In addition, the Notes to Financial Statements explain the methods used in preparing and presenting this report.
1. ORGANIZATION AND SIGNIFICANT ACCOUNTING POLICIES
Janus Aspen Balanced Portfolio (the "Portfolio") is a series fund. The Portfolio is part of Janus Aspen Series (the "Trust"), which is organized as a Delaware statutory trust and is registered under the Investment Company Act of 1940 (the "1940 Act") as an open-end management investment company. The Trust offers seventeen Portfolios, which include multiple series of shares, with differing investment objectives and policies. The Portfolio invests primarily in equity securities. The Portfolio is classified as diversified, as defined in the 1940 Act. The Portfolio is a no-load investment.
The Portfolio currently offers two classes of shares: Institutional Shares and Service Shares. Institutional Shares are offered only in connection with investment in and payments under variable insurance contracts and to qualified retirement plans. Service Shares are offered only in connection with investment in and payments under variable insurance contracts and to qualified retirement plans that require a fee from Portfolio assets to procure distribution and administrative services to contract owners and plan participants.
The following accounting policies have been consistently followed by the Portfolio and are in conformity with accounting principles generally accepted in the United States of America in the investment company industry.
Investment Valuation
Securities are valued at the last sales price or the official closing price for securities traded on a principal securities exchange (U.S. or foreign) and on the NASDAQ National Market. Securities traded on over-the-counter markets and listed securities for which no sales are reported are valued at the latest bid price (or yield equivalent thereof) obtained from one or more dealers transacting in a market for such securities or by a pricing service approved by the Portfolio's Trustees. Short-term securities with maturities of 60 days or less may be valued at amortized cost, which approximates market value. Debt securities with a remaining maturity of greater than 60 days are valued in accordance with the evaluated bid price supplied by the pricing service. The evaluated bid price supplied by the pricing service is an evaluation that reflects such factors as security prices, yields, maturities and ratings. Foreign securities and currencies ar e converted to U.S. dollars using the applicable exchange rate in effect as of the daily close of the New York Stock Exchange ("NYSE"). When market quotations are not readily available or deemed unreliable, or events or circumstances that may affect the value of portfolio securities held by the Portfolio are identified between the closing of their principal markets and the time the net asset value ("NAV") is determined, securities may be valued at fair value as determined in good faith under procedures established by and under the supervision of the Portfolio's Trustees. The Portfolio may use a systematic fair valuation model provided by an independent third party to value international equity securities in order to adjust for stale pricing, which may occur between the close of certain foreign exchanges and the NYSE.
Investment Transactions and Investment Income
Investment transactions are accounted for as of the date purchased or sold (trade date). Dividend income is recorded on the ex-dividend date. Certain dividends from foreign securities will be recorded as soon as the Trust is informed of the dividend if such information is obtained subsequent to the ex-dividend date and may be subject to withholding taxes in these jurisdictions. Interest income is recorded on the accrual basis and includes amortization of premiums and accretion of discounts. Gains and losses are determined on the identified cost basis, which is the same basis used for federal income tax purposes. Income, as well as gains and losses, both realized and unrealized, are allocated daily to each class of shares based upon the ratio of net assets represented by each class as a percentage of total net assets.
Expenses
The Portfolio bears expenses incurred specifically on its behalf as well as a portion of general expenses. Each class of shares bears expenses incurred specifically on its behalf and, in addition, each class bears a portion of general expenses, which may be based upon relative net assets of each class. Expenses are allocated daily to each class of shares based upon the ratio of net assets represented by each class as a percentage of total net assets. Expenses directly attributable to a specific class of shares are charged against the operations of such class.
Securities Lending
Under procedures adopted by the Trustees, the Portfolio may lend securities to qualified parties (typically brokers or other financial institutions) who need to borrow securities in order to complete certain transactions such as covering short sales, avoiding failures to deliver securities or completing arbitrage activities. The Portfolio may seek to earn additional income through securities lending. There is the risk of delay in recovering a loaned security or the risk of loss in collateral rights if the borrower fails financially. In addition, Janus Capital Management LLC ("Janus Capital") makes efforts to balance the benefits and risks from granting such loans.
The Portfolio does not have the right to vote on securities while they are being lent; however, the Portfolio may attempt to call back the loan and vote the proxy. All loans will be continuously secured by collateral which may consist of cash, U.S. Government securities, domestic and foreign short-term
Janus Aspen Series December 31, 2006 15
Notes to Financial Statements (continued)
debt instruments, letters of credit, money market mutual funds or other money market accounts, or such other collateral permitted by the Securities and Exchange Commission ("SEC"). Cash collateral may be invested in affiliated money market funds or other accounts advised by Janus Capital to the extent consistent with exemptive relief obtained from the SEC or as permitted by the 1940 Act and rules promulgated thereunder. Cash collateral may also be invested in unaffiliated money market funds or other accounts advised by Janus Capital to the extent consistent with exemptive relief obtained from the SEC or as permitted by the 1940 Act and rules promulgated thereunder. Cash collateral may also be invested in unaffiliated money market funds or other accounts.
State Street Bank and Trust Company (the "Lending Agent") may also invest the cash collateral in the State Street Navigator Securities Lending Prime Portfolio or investments in unaffiliated money market funds or accounts, mutually agreed to by the Portfolio and the Lending Agent, that comply with Rule 2a-7 under the 1940 Act relating to money market funds.
As of December 31, 2006, the Portfolio had on loan securities valued as indicated:
| Portfolio | Value at December 31, 2006 | ||||||
| Janus Aspen Balanced Portfolio | $ | 423,008,276 | |||||
As of December 31, 2006, the Portfolio received cash collateral for securities lending activity as indicated:
| Portfolio | Cash Collateral at December 31, 2006 | ||||||
| Janus Aspen Balanced Portfolio | $ | 431,991,165 | |||||
As of December 31, 2006, all cash collateral received by the Portfolio was invested in the State Street Navigator Securities Lending Prime Portfolio.
The value of the collateral must be at least 102% of the market value of the loaned securities that are denominated in U.S. dollars and 105% of the market value of the loaned securities that are not denominated in U.S. dollars. Loaned securities and related collateral are marked-to-market each business day based upon the market value of the respective securities at the close of business, employing the most recent available pricing information. Collateral levels are then adjusted based upon this mark-to-market evaluation.
The borrower pays fees at the Portfolio's direction to its Lending Agent. The Lending Agent may retain a portion of the interest earned. The cash collateral invested by the Lending Agent is disclosed in the Schedule of Investments. The lending fees and the Portfolio's portion of the interest income earned on cash collateral are included on the Statement of Operations (if applicable).
Interfund Lending
Pursuant to an exemptive order received from the SEC, the Portfolio may be party to an interfund lending agreement between the Portfolio and other Janus Capital sponsored mutual funds, which permits it to borrow or lend cash at a rate beneficial to both the borrowing and lending funds. Outstanding borrowings from all sources totaling 10% or more of the borrowing Portfolio's total assets must be collateralized at 102% of the outstanding principal value of the loan; loans of less than 10% may be unsecured. During the fiscal year ended December 31, 2006, there were no outstanding interfund borrowing or lending arrangements for the Portfolio.
Forward Currency Transactions
The Portfolio may enter into forward currency contracts in order to reduce its exposure to changes in foreign currency exchange rates on its foreign portfolio holdings and to lock in the U.S. dollar cost of firm purchase and sale commitments for securities denominated in or exposed to foreign currencies. A forward currency exchange contract is a commitment to purchase or sell a foreign currency at a future date at a negotiated rate. The gain or loss arising from the difference between the U.S. dollar cost of the original contract and the value of the foreign currency in U.S. dollars upon closing a contract is included in "Net realized gain/(loss) from foreign currency transactions" on the Statement of Operations (if applicable).
Forward currency contracts held by the Portfolio are fully collateralized by other securities, which are denoted in the accompanying Schedule of Investments (if applicable). The collateral is evaluated daily to ensure its market value equals or exceeds the current market value of the corresponding forward currency contracts.
Futures Contracts
The Portfolio may enter into futures contracts. The Portfolio intends to use such derivative instruments primarily to hedge or protect from adverse movements in securities prices, currency rates or interest rates. The use of futures contracts may involve risks such as the possibility of illiquid markets or imperfect correlation between the value of the contracts and the underlying securities, or that the counterparty will fail to perform its obligations.
Futures contracts are marked-to-market daily, and the daily variation margin is recorded as a receivable or payable on the Statement of Assets and Liabilities (if applicable). When a contract is closed, a realized gain or loss is recorded on the Statement of Operations equal to the difference between the opening and closing value of the contract. Generally, futures contracts are marked-to-market (i.e., treated as realized and subject to distribution) for federal income tax purposes at fiscal year end. Securities designated as collateral for market value on futures contracts are noted in the Schedule of Investments. Such collateral is in the possession of the Portfolio's custodian. As of December 31, 2006, the Portfolio was not invested in futures contracts.
16 Janus Aspen Series December 31, 2006
Bank Loans
The Portfolio may invest in bank loans, which include institutionally-traded floating rate securities generally acquired as an assignment or participation interest in loans originated by a bank or financial institution (the "Lender") that acts as agent for all holders. The agent administers the terms of the loan, as specified in the loan agreement. When investing in a loan participation, a Portfolio has the right to receive payments of principal, interest and any fees to which it is entitled only from the Lender selling the loan agreement and only upon receipt by the Lender of payments from the borrower. The Portfolio generally has no right to enforce compliance with the terms of the loan agreement with the borrower. Assignments and participations involve credit, interest rate, and liquidity risk. Interest rates on floating rate securities adjust with general interest rate changes and/or issuer credit quality. The interest rates paid on a fl oating rate security in which the Portfolio invests generally are readjusted periodically to an increment over a designated benchmark rate, such as the one-month, three-month, six-month, or one-year London Interbank Offered Rate ("LIBOR").
The Portfolio may have difficulty trading assignments and participations to third parties. There may be restrictions on transfer and only limited opportunities may exist to sell such securities in secondary markets. As a result, the Portfolio may be unable to sell assignments or participations at the desired time or may be able to sell only at a price less than fair market value. The Portfolio utilizes an independent third party to value individual bank loans on a daily basis. The average monthly borrowings outstanding under bank loan arrangements and the related rate range during the fiscal year ended December 31, 2006 are noted in the table below.
| Portfolio | Average Monthly Borrowings | Rates | |||||||||
| Janus Aspen Balanced Portfolio | $ | 14,788,082 | 5.32 | %-7.89% | |||||||
Short Sales
The Portfolio may engage in "short sales against the box." Short sales against the box involve selling either a security that the Portfolio owns, or a security equivalent in kind and amount to the security sold short that the Portfolio has the right to obtain, for delivery at a specified date in the future. The Portfolio may enter into a short sale against the box to hedge against anticipated declines in the market price of portfolio securities. If the value of the securities sold short increases prior to the scheduled delivery date, the Portfolio loses the opportunity to participate in the gain.
The Portfolio may also engage in "naked" short sales. Naked short sales involve the Portfolio selling a security it does not own to a purchaser at a specified price. To complete the transaction, the Portfolio must borrow the security to deliver it to the purchaser and buy that same security in the market to return it to the lender. Although the potential for gain is limited to the difference between the price at which the Portfolio sold the security short and the cost of borrowing the security, its potential for loss could be unlimited because there is no limit to the replacement cost of the borrowed security. There is no assurance that the Portfolio will be able to close out a short position at any particular time or at an acceptable price. A gain or a loss will be recognized upon termination of a short sale. There is no limit on the size of any loss that the Portfolio may recognize upon termination of a short sale. Short sales held by the Portfolio are fully collateralized by other securities, which are denoted in the accompanying Schedule of Investments (if applicable). As of December 31, 2006, the Portfolio was not invested in short sales.
Foreign Currency Translations
The Portfolio does not isolate that portion of the results of operations resulting from changes in foreign exchange rates on investments from the fluctuations arising from changes in market prices of securities held at the date of the financial statements. Net unrealized appreciation or depreciation on investments and foreign currency translation arise from changes in the value of assets and liabilities, including investments in securities held at the date of the financial statements, resulting from changes in the exchange rates and changes in market prices of securities held.
Currency gains and losses are also calculated on payables and receivables that are denominated in foreign currencies. The payables and receivables are generally related to security transactions and income.
Foreign currency-denominated assets and forward currency contracts may involve more risks than domestic transactions, including currency risk, political and economic risk, regulatory risk and market risk. Risks may arise from the potential inability of a counterparty to meet the terms of a contract and from unanticipated movements in the value of foreign currencies relative to the U.S. dollar.
When-issued Securities
The Portfolio may purchase or sell securities on a when-issued or forward commitment basis. The price of the underlying securities and date when the securities will be delivered and paid for are fixed at the time the transaction is negotiated. Losses may arise due to changes in the market value of the securities or from the inability of counterparties to meet the terms of the contract. In connection with such purchases, the Portfolio may hold liquid assets as collateral with the Portfolio's custodian sufficient to cover the purchase price. As of December 31, 2006, the Portfolio was not invested in when-issued securities.
Equity-Linked Structured Notes
The Portfolio may invest in equity-linked structured notes. Equity-linked structured notes are derivative securities which are specially designed to combine the characteristics of one or more underlying securities and their equity derivatives in a single note form. The return and/or yield or income component may be based on the performance of the underlying equity securities, an equity index, and/or option
Janus Aspen Series December 31, 2006 17
Notes to Financial Statements (continued)
positions. Equity-linked structured notes are typically offered in limited transactions by financial institutions in either registered or nonregistered form. An investment in equity-linked structured notes creates exposure to the credit risk of the issuing financial institution, as well as to the market risk of the underlying securities. There is no guaranteed return of principal with these securities and the appreciation potential of these securities may be limited by a maximum payment or call right. In certain cases, equity-linked structured notes may be more volatile and less liquid than less complex securities or other types of fixed-income securities. Such securities may exhibit price behavior that does not correlate with other fixed-income securities. As of December 31, 2006, the Portfolio was not invested in equity-linked structured notes.
Initial Public Offerings
The Portfolio may invest in initial public offerings ("IPOs"). IPOs and other investment techniques may have a magnified performance impact on a fund with a small asset base. The Portfolio may not experience similar performance as its assets grow.
Additional Investment Risk
The Portfolio may be invested in lower-rated debt securities that have a higher risk of default or loss of value since these securities may be sensitive to economic changes, political changes or adverse developments specific to the issuer.
Restricted Security Transactions
Restricted securities held by the Portfolio may not be sold except in exempt transactions or in a public offering registered under the Securities Act of 1933. The risk of investing in such securities is generally greater than the risk of investing in the securities of widely held, publicly traded companies. Lack of a secondary market and resale restrictions may result in the inability of the Portfolio to sell a security at a fair price and may substantially delay the sale of the security. In addition, these securities may exhibit greater price volatility than securities for which secondary markets exist.
Dividend Distributions
The Portfolio generally makes semiannual distributions of substantially all of its investment income and an annual distribution of its net realized capital gains (if any). The majority of dividends and net realized capital gains distributions from the Portfolio may be automatically reinvested into additional shares of the Portfolio, based upon the discretion of the shareholder.
Estimates
The preparation of financial statements in conformity with accounting principles generally accepted in the United States of America requires management to make estimates and assumptions that affect the reported amount of assets and liabilities and disclosure of contingent assets and liabilities at the date of the financial statements and the reported amounts of income and expenses during the reporting period. Actual results could differ from those estimates.
Federal Income Taxes
No provision for income taxes is included in the accompanying financial statements, as the Portfolio intends to distribute to shareholders all taxable investment income and realized gains and otherwise comply with Subchapter M of the Internal Revenue Code applicable to regulated investment companies.
New Accounting Pronouncements
In July 2006, the Financial Accounting Standards Board ("FASB") issued Interpretation No. 48, "Accounting for Uncertainty in Income Taxes – an Interpretation of FASB Statement No. 109" (the "Interpretation"). The Interpretation establishes for all entities, including pass-through entities such as the Portfolio, a minimum threshold for financial statement recognition of the benefit of positions taken in filing tax returns (including whether an entity is taxable in a particular jurisdiction), and requires certain expanded tax disclosures. A calendar year open-end or closed-end fund would implement the interpretation no later than June 29, 2007 (the last business day of the semi-annual reporting period) and will also apply to all open tax years as of the date of effectiveness. Management has recently begun to evaluate the application of the Interpretation to the Portfolio, and is not in a position at this time to estimate the significance of its impact, if any, on the Portfolio's financial statements.
In September 2006, the FASB issued Statement of Financial Accounting Standards No. 157, "Fair Value Measurements" ("SFAS No. 157"), which defines fair value, establishes a framework for measuring fair value in generally accepted accounting principles, and expands disclosures about fair value measurements. SFAS No. 157 does not require new fair value measurements, but is applied to the extent that other accounting pronouncements require or permit fair value measurements. SFAS No. 157 emphasizes that fair value is a market-based measurement that should be determined based on the assumptions that market participants would use in pricing an asset or liability. Companies will be required to disclose the extent to which fair value is used to measure assets and liabilities, the inputs used to develop the measurements, and the effect for fiscal years beginning after November 15, 2007. Management is currently evaluating the potential impact the adopt ion of SFAS No. 157 will have on the Portfolio's financial condition and results of operations.
2. INVESTMENT ADVISORY AGREEMENTS AND OTHER TRANSACTIONS WITH AFFILIATES
The Portfolio pays a monthly advisory fee to Janus Capital based upon average daily net assets and calculated at the annual rate of 0.55%.
Janus Services LLC ("Janus Services"), a wholly-owned subsidiary of Janus Capital, is the Portfolio's transfer agent. Janus Services receives certain out-of-pocket expenses for transfer agent services.
Certain officers of the Portfolio may also be officers and/or directors of Janus Capital. Such officers receive no compensation from the Portfolio, except for the Portfolio's Chief Compliance Officer. Effective January 1, 2006, the Portfolio began reimbursing the adviser for a portion of the compensation paid to the Chief Compliance Officer of the
18 Janus Aspen Series December 31, 2006
Trust. Total compensation of $3,234 was paid by the Portfolio during the fiscal year ended December 31, 2006. The Portfolio's portion is reported as part of "Other Expenses" on the Statement of Operations.
The Board of Trustees has adopted a deferred compensation plan (the "Deferred Plan") for independent Trustees to elect to defer receipt of all or a portion of the annual compensation they are entitled to receive from the Portfolio. All deferred fees are credited to an account established in the name of the Trustees. The amounts credited to the account then increase or decrease, as the case may be, in accordance with the performance of one or more of the Janus funds that are selected by the Trustees. The account balance continues to fluctuate in accordance with the performance of the selected fund or funds until final payment of all amounts credited to the account. Trustees are allowed to change their designation of mutual funds from time to time. Amounts will be deferred until distributed in accordance to the Deferred Plan. No deferred fees were paid to any Trustee under the Deferred Plan during the fiscal year ended December 31, 2006.
For the fiscal year ended December 31, 2006, Janus Capital assumed $21,288 of legal, consulting and Trustee costs and fees incurred by the funds in Janus Investment Fund, Janus Aspen Series and Janus Adviser Series (the "Funds") in connection with the regulatory and civil litigation matters discussed in Note 6. These non-recurring costs were allocated to all Funds based upon the Funds' respective net assets as of July 31, 2004. Additionally, all future non-recurring costs will be allocated based upon the Funds' respective net assets on July 31, 2004. These non-recurring costs and costs assumed by Janus Capital are shown on the Statement of Operations.
During the fiscal year ended December 31, 2006, Janus Services reimbursed the Portfolio $623 for Service Shares, as a result of dilutions caused by incorrectly processed shareholder activity. Reimbursements are included in "Payment from affiliate" on the Statements of Changes in Net Assets.
During the fiscal year ended December 31, 2006, Janus Capital reimbursed the Portfolio $25 for Institutional Shares and $9 for Service Shares, as a result of dilutions caused by certain trading and/or pricing errors. Reimbursements are included in "Payment from affiliate" on the Statements of Changes in Net Assets.
During the fiscal year ended December 31, 2005, Janus Services reimbursed the Portfolio $576 for Institutional Shares, as a result of dilutions caused by incorrectly processed shareholder activity. Reimbursements are included in "Payment from affiliate" on the Statements of Changes in Net Assets.
During the fiscal year ended December 31, 2005, Janus Capital reimbursed the Portfolio $20,944 for Institutional Shares and $6,289 for Service Shares, as a result of dilutions caused by certain trading and/or pricing errors. Reimbursements are included in "Payment from affiliate" on the Statements of Changes in Net Assets.
Janus Distributors LLC, a wholly-owned subsidiary of Janus Capital, is a distributor of the Portfolio. Service Shares have adopted a Distribution and Shareholder Servicing Plan (the "Plan") pursuant to Rule 12b-1 under The 1940 Act. The Plan authorizes payments by the Portfolio in connection with the distribution of Service Shares at an annual rate of up to 0.25% of Service Shares' average daily net assets.
The Portfolio's expenses may be reduced by expense offsets from an unaffiliated custodian and/or transfer agent. Such credits or offsets are included in Expense and Fee Offset on the Statement of Operations. The transfer agent fee offsets received during the period reduce Transfer Agent Fees and Expenses. Custodian offsets received reduce Custodian Fees. The Portfolio could have employed the assets used by the custodian and/or transfer agent to produce income if it had not entered into an expense offset arrangement.
The Portfolio may invest in money market funds, including funds managed by Janus Capital. During the fiscal year ended December 31, 2006, the Portfolio recorded distributions from affiliated investment companies as affiliated dividend income, and had the following affiliated purchases and sales:
| Purchases Shares/Cost | Sales Shares/Cost | Dividend Income | Value at 12/31/06 | ||||||||||||||||
| Janus Aspen Balanced Portfolio Janus Government Money Market Fund | $ | 21,108,266 | $ | 21,108,266 | $ | 16,303 | $ | – | |||||||||||
| Janus Institutional Cash Reserves Fund | 248,153,266 | 246,241,766 | 281,628 | 1,911,500 | |||||||||||||||
| Janus Money Market Fund | 131,643,001 | 124,081,501 | 356,741 | 7,561,500 | |||||||||||||||
| $ | 400,904,533 | $ | 391,431,533 | $ | 654,672 | $ | 9,473,000 | ||||||||||||
3. FEDERAL INCOME TAX
The tax components of capital shown in the table on the next page represent: (1) distribution requirements the Portfolio must satisfy under the income tax regulations; (2) losses or deductions the Portfolio may be able to offset against income and gains realized in future years; and (3) unrealized appreciation or depreciation of investments for federal income tax purposes.
In 2006, the Portfolio incurred "Post-October" losses during the period from November 1, 2006 through December 31, 2006. These losses will be deferred for tax purposes and recognized in 2007.
Other book to tax differences in the current year primarily consist of foreign currency contract adjustments. The Portfolio has elected to treat gains and losses on forward foreign currency contracts as capital gains and losses. Other foreign
Janus Aspen Series December 31, 2006 19
Notes to Financial Statements (continued)
currency gains and losses on debt instruments are treated as ordinary income for federal income tax purposes pursuant to Section 988 of the Internal Revenue Code.
Accumulated capital losses noted below represent net capital loss carryovers, as of December 31, 2006, that may be available to offset future realized capital gains and thereby reduce future taxable gains distributions.
| Portfolio | Undistributed Ordinary Income | Undistributed Long-Term Gains | Accumulated Capital Losses | Post-October Deferral | Other Book to Tax Differences | Net Tax Appreciation/ (Depreciation) | |||||||||||||||||||||
| Janus Aspen Balanced Portfolio | $ | 5,348,799 | $ | – | $ | (7,667,345 | ) | $ | (534 | ) | $ | (105,959 | ) | $ | 292,485,739 | ||||||||||||
The table below shows the expiration dates of the carryovers.
| Capital Loss Carryover Expiration Schedule For the year ended December 31, 2006 Portfolio | December 31, 2011 | ||||||
| Janus Aspen Balanced Portfolio | $ | (7,667,345 | ) | ||||
During the year ended December 31, 2006, the following capital loss carryover was utilized by the Portfolio as indicated in the table below.
| Portfolio | Capital Loss Carryover Utilized | ||||||
| Janus Aspen Balanced Portfolio | $ | 177,442,868 | |||||
The aggregate cost of investments and the composition of unrealized appreciation and depreciation of investment securities for federal income tax purposes as of December 31, 2006 are noted below.
Unrealized appreciation and unrealized depreciation in the table below exclude appreciation/depreciation on foreign currency translations. The primary difference between book and tax appreciation or depreciation of investments is wash sale loss deferrals.
| Portfolio | Federal Tax Cost | Unrealized Appreciation | Unrealized (Depreciation) | ||||||||||||
| Janus Aspen Balanced Portfolio | $ | 2,106,250,821 | $ | 307,910,732 | $ | (15,424,993 | ) | ||||||||
Income and capital gains distributions are determined in accordance with income tax regulations that may differ from accounting principles generally accepted in the United States of America. These differences are due to differing treatments for items such as net short-term gains, deferral of wash sale losses, foreign currency transactions, net investment losses and capital loss carryovers. Certain permanent differences such as tax returns of capital and net investment losses noted below have been reclassified to paid-in capital.
| For the fiscal year ended December 31, 2006 | Distributions | ||||||||||||||||||
| Portfolio | From Ordinary Income | From Long-Term Capital Gains | Tax Return of Capital | Net Investment Loss | |||||||||||||||
| Janus Aspen Balanced Portfolio | $ | 41,461,260 | $ | – | $ | – | $ | – | |||||||||||
| For the fiscal year ended December 31, 2005 | Distributions | ||||||||||||||||||
| Portfolio | From Ordinary Income | From Long-Term Capital Gains | Tax Return of Capital | Net Investment Loss | |||||||||||||||
| Janus Aspen Balanced Portfolio | $ | 49,611,813 | $ | – | $ | – | $ | – | |||||||||||
20 Janus Aspen Series December 31, 2006
4. CAPITAL SHARE TRANSACTIONS
For the fiscal year ended December 31 | Janus Aspen Balanced Portfolio | ||||||||||
| (all numbers in thousands) | 2006 | 2005 | |||||||||
| Transactions in Portfolio Shares – Institutional Shares | |||||||||||
| Shares sold | 1,187 | 1,408 | |||||||||
| Reinvested dividends and distributions | 1,196 | 1,538 | |||||||||
| Shares repurchased | (14,834 | ) | (35,799 | ) | |||||||
| Net Increase/(Decrease) in Portfolio Shares | (12,451 | ) | (32,853 | ) | |||||||
| Shares Outstanding, Beginning of Period | 65,356 | 98,209 | |||||||||
| Shares Outstanding, End of Period | 52,905 | 65,356 | |||||||||
| Transactions in Portfolio Shares – Service Shares | |||||||||||
| Shares sold | 2,603 | 3,157 | |||||||||
| Reinvested dividends and distributions | 340 | 428 | |||||||||
| Shares repurchased | (6,307 | ) | (2,935 | ) | |||||||
| Net Increase/(Decrease) in Portfolio Shares | (3,364 | ) | 650 | ||||||||
| Shares Outstanding, Beginning of Period | 21,021 | 20,371 | |||||||||
| Shares Outstanding, End of Period | 17,657 | 21,021 | |||||||||
5. PURCHASES AND SALES OF INVESTMENT SECURITIES
For the fiscal year ended December 31, 2006, the aggregate cost of purchases and proceeds from sales of investment securities (excluding short-term securities and mortgage dollar rolls) were as follows:
| Portfolio | Purchases of Securities | Proceeds from Sales of Securities | Purchases of Long-Term U.S. Government Obligations | Proceeds from Sales of Long-Term U.S. Government Obligations | |||||||||||||||
| Janus Aspen Balanced Portfolio | $ | 553,369,109 | $ | 974,891,115 | $ | 511,301,543 | $ | 442,789,955 | |||||||||||
6. PENDING LEGAL MATTERS
In the fall of 2003, the Securities and Exchange Commission ("SEC"), the Office of the New York State Attorney General ("NYAG"), the Colorado Attorney General ("COAG"), and the Colorado Division of Securities ("CDS") announced that they were investigating alleged frequent trading practices in the mutual fund industry. On August 18, 2004, Janus Capital announced that it had reached final settlements with the SEC, the NYAG, the COAG, and the CDS related to such regulators' investigations into Janus Capital's frequent trading arrangements.
A number of civil lawsuits were brought against Janus Capital and certain of its affiliates, the Janus funds, and related entities and individuals based on allegations similar to those announced by the above regulators and were filed in several state and federal jurisdictions. Such lawsuits alleged a variety of theories for recovery including, but not limited to, the federal securities laws, other federal statutes (including ERISA), and various common law doctrines. The Judicial Panel on Multidistrict Litigation transferred these actions to the U.S. District Court for the District of Maryland (the "Court") for coordinated proceedings. On September 29, 2004, five consolidated amended complaints were filed with the Court that generally include: (i) claims by a putative class of investors in certain Janus funds asserting claims on behalf of the investor class (Marini, et al. v. Janus Investment Fund, et al., U.S. District Court, District of Maryland, Case No. 04-CV-00497); (ii) derivative claims by investors in certain Janus funds ostensibly on behalf of such funds (Steinberg et al. v. Janus Capital Management, LLC et al., U.S. District Court, District of Maryland, Case No. 04-CV-00518); (iii) claims on behalf of participants in the Janus 401(k) plan (Wangberger v. Janus Capital Group Inc., 401(k) Advisory Committee, et al., U.S. District Court, District of Maryland, Case No. JFM-05-2711); ( iv) claims brought on behalf of shareholders of Janus Capital Group Inc. ("JCGI") on a derivative basis against the Board of Directors of JCGI (Chasen v. Whiston, et al., U.S. District Court, District of Maryland, Case No. 04-MD-00855); and (v) claims by a putative class of shareholders of JCGI asserting claims on behalf of the shareholders (Wiggins, et al. v. Janus Capital Group, Inc., et al., U.S. District Court, District of Maryland, Case No. 04-CV-00818). In addition, the following were also named as defendants in one or more of the action s: Janus Investment Fund ("JIF"), Janus Aspen Series ("JAS"), Janus Adviser Series ("JAD"), Janus
Janus Aspen Series December 31, 2006 21
Notes to Financial Statements (continued)
Distributors LLC, Enhanced Investment Technologies, LLC ("INTECH"), Bay Isle Financial LLC ("Bay Isle"), Perkins, Wolf, McDonnell and Company, LLC ("Perkins"), the Advisory Committee of the Janus 401(k) plan, and the current or former directors of JCGI.
On August 25, 2005, the Court entered orders dismissing most of the claims asserted against Janus Capital and its affiliates by fund investors (actions (i) and (ii) described above), except certain claims under Section 10(b) of the Securities Exchange Act of 1934 and under Section 36(b) of the Investment Company Act of 1940, as amended (the "1940 Act"). On August 15, 2006, the complaint in the 401(k) plan class action (action (iii) described above) was dismissed by the district court with prejudice; the plaintiff has appealed that dismissal decision to the United States Court of Appeals for the Fourth Circuit. The Court also dismissed the action against JCGI's Board of Directors without leave to amend (action (iv) described above). Finally, a Motion to Dismiss the action brought by JCGI shareholders (action (v) described above) is fully briefed and pending before the Court.
In addition to the lawsuits described above, the Auditor of the State of West Virginia ("Auditor"), in his capacity as securities commissioner, has initiated administrative proceedings against many of the defendants in the market timing cases (including JCGI and Janus Capital) and, as a part of its relief, is seeking disgorgement and other monetary relief based on similar market timing allegations (In the Matter of Janus Capital Group Inc. et al., Before the Securities Commissioner, State of West Virginia, Summary Order No. 05-1320). The respondents in these proceedings collectively sought a Writ of Prohibition in state court, which was denied. Their subsequent Petition for Appeal was also denied. Consequently, in September 2006, JCGI and Janus Capital filed their answer to the A uditor's summary order instituting proceedings and requested a hearing. JCGI and Janus Capital, as well as other similarly situated defendants, continue to challenge the statutory authority of the Auditor to bring such an action. No further proceedings are currently scheduled.
In addition to the "market timing" actions described above, Janus Capital is a defendant in a consolidated lawsuit in the U.S. District Court for the District of Colorado challenging the investment advisory fees charged by Janus Capital to certain Janus funds (Walter Sins, et al. v. Janus Capital Management LLC, U.S. District Court, District of Colorado, Case No. 04-CV-01647-WDM-MEH; Michael Fleisher, et al. v. Janus Capital Management, LLC, 04-CV-02395-MSK-CBS). The action was filed in 2004 by fund investors asserting breach of fiduciary duty under Section 36(b) of the 1940 Act. The plaintiffs seek declaratory and injunctive relief and an unspecified amount of damages. The trial is scheduled to commence on May 21, 2007.
In 2001, Janus Capital's predecessor was also named as a defendant in a class action suit in the U.S. District Court for the Southern District of New York, alleging that certain underwriting firms and institutional investors violated antitrust laws in connection with initial public offerings (Pfeiffer v. Credit Suisse First Boston aka In re Initial Public Offering Antitrust Litigation, U.S. District Court, Southern District of New York, Case No. 01-CV-2014). The U.S. District Court dismissed the plaintiff's antitrust claims in November 2003; however, the U.S. Court of Appeals vacated that decision and remanded it for further proceedings. In March 2006, the defendants, including Janus Capital, filed a Petition for a Writ of Certiorari with the U.S. Supreme Court to review the decision of the U. S. Court of Appeals. In June 2006, the U.S. Supreme Court invited the U.S. Solicitor General to file a brief expressing the view of the United States, and in November 2006, the Solicitor General filed a brief expressing its view on the matter. The U.S. Supreme Court has granted the Petition for a Writ of Certiorari and the parties are in the process of briefing the matter for the U.S. Supreme Court.
Additional lawsuits may be filed against certain of the Janus funds, Janus Capital, and related parties in the future. Janus Capital does not currently believe that these pending actions will materially affect its ability to continue providing services it has agreed to provide to the Janus funds.
22 Janus Aspen Series December 31, 2006
Report of Independent Registered Public Accounting Firm
To the Trustees and Shareholders
of Janus Aspen Balanced Portfolio
In our opinion, the accompanying statement of assets and liabilities, including the schedule of investments, and the related statements of operations and of changes in net assets and the financial highlights present fairly, in all material respects, the financial position of Janus Aspen Balanced Portfolio (one of the portfolios constituting Janus Aspen Series, hereafter referred to as the "Portfolio") at December 31, 2006, the results of its operations for the year then ended, the changes in its net assets for each of the two years in the period then ended, and the financial highlights for each of the five years in the period then ended, in conformity with accounting principles generally accepted in the United States of America. These financial statements and financial highlights (hereafter referred to as "financial statements") are the responsibility of the Portfolio's management; our responsibility is to express an opinion on these financi al statements based on our audits. We conducted our audits of these financial statements in accordance with the standards of the Public Company Accounting Oversight Board (United States). Those standards require that we plan and perform the audit to obtain reasonable assurance about whether the financial statements are free of material misstatement. An audit includes examining, on a test basis, evidence supporting the amounts and disclosures in the financial statements, assessing the accounting principles used and significant estimates made by management, and evaluating the overall financial statement presentation. We believe that our audits, which included confirmation of securities at December 31, 2006 by correspondence with the custodian, transfer agent and brokers, and the application of alternative auditing procedures where securities purchased had not been received, provide a reasonable basis for our opinion.

PricewaterhouseCoopers LLP
Denver, Colorado
February 12, 2007
Janus Aspen Series December 31, 2006 23
Additional Information (unaudited)
PROXY VOTING POLICIES AND VOTING RECORD
A description of the policies and procedures that the Portfolio uses to determine how to vote proxies relating to its portfolio securities is available: (i) without charge, upon request, by calling 1-800-525-0020 (toll free); (ii) on the Portfolio's website at www.janus.com/proxyvoting; and (iii) on the SEC's website at http://www.sec.gov. Additionally, information regarding the Portfolio's proxy voting record for the most recent twelve- month period ended June 30 is also available, free of charge, through www.janus.com/proxyvoting and from the SEC's website at http://www.sec.gov.
QUARTERLY PORTFOLIO HOLDINGS
The Portfolio files its complete portfolio holdings (schedule of investments) with the SEC for the first and third quarters of each fiscal year on Form N-Q within 60 days of the end of such fiscal quarter. The Portfolio's Form N-Q: (i) is available on the SEC's website at http://www.sec.gov; (ii) may be reviewed and copied at the SEC's Public Reference Room in Washington, D.C. (information on the Public Reference Room may be obtained by calling 1-800-SEC-0330); and (iii) is available without charge, upon request, by calling Janus at 1-800-525-0020 (toll free).
APPROVAL OF ADVISORY AGREEMENTS DURING THE PERIOD
The Trustees of Janus Aspen Series, more than eighty-five percent of whom have never been affiliated with the Adviser ("Independent Trustees"), oversee the management of each of the Portfolios and, as required by law, determine annually whether to continue the investment advisory agreement for each Portfolio and the subadvisory agreements for the three Portfolios that utilize subadvisers.
In connection with their most recent consideration of those agreements for each of the Portfolios, the Trustees received and reviewed a substantial amount of information provided by Janus Capital (the "Adviser") and the respective subadvisers in response to requests of the Independent Trustees and their independent legal counsel. They also received and reviewed a considerable amount of information and analysis provided to the Trustees by their independent fee consultant. Throughout their consideration of the agreements the Independent Trustees were advised by their independent legal counsel. The Independent Trustees met on two separate occasions with management to consider the agreements, and at each of those meetings they also met separately in executive session with their independent legal counsel.
At a meeting held on December 20, 2006, based on their evaluation of the information provided by the Adviser, the subadvisers and the independent fee consultant and other information, the Trustees determined that the overall arrangements between each Portfolio and the Adviser were fair and reasonable in light of the nature, extent and quality of the services provided by the Adviser, its affiliates and the subadvisers, the fees charged for those services, and other matters that the Trustees considered relevant in the exercise of their business judgment. At that meeting all of the Trustees unanimously approved the continuation of the investment advisory agreement for each Portfolio, and the subadvisory agreement for each subadvised Portfolio, for the period from February 1, 2007 through February 1, 2008, subject to earlier termination as provided in each agreement.
In considering the continuation of those agreements, the Trustees reviewed and analyzed various factors that they determined were relevant, including the factors described below, none of which by itself was considered dispositive. However, the material factors and conclusions that formed basis for the Trustees' determination to approve the continuation of the agreements are discussed separately below.
Nature, Extent and Quality of Services
The Trustees reviewed the nature, extent and quality of the services of Janus Capital and the subadvisers to the Funds, taking into account the investment objective and strategy of each Portfolio and the knowledge the Trustees gained from their regular meetings with management on at least a quarterly basis and their ongoing review of information related to the Funds. In addition, the Trustees reviewed the resources and key personnel of Janus Capital and each subadviser, especially those who provide investment management services to the Portfolios. The Trustees also considered other services provided to the Portfolios by Janus Capital or the subadvisers, such as managing the execution of portfolio transactions and the selection of broker-dealers for those transactions, serving as the Portfolios' administrator, monitoring adherence to the Portfolios' investment restrictions, producing shareholder reports, providing support services for the Tru stees and Trustee committees, communicating with shareholders and overseeing the activities of other service providers, including monitoring compliance with various policies and procedures of the Portfolios and with applicable securities laws and regulations.
The Trustees concluded that: the nature, extent and quality of the services provided by Janus Capital or the subadviser to each Portfolio were appropriate and consistent with the terms of the respective advisory and subadvisory agreements; that, taking into account steps taken to address a small portion of the Portfolios whose performance lagged that of their peers for certain periods, the quality of those services had been consistent with or superior to quality norms in the industry; and that the Portfolios were likely to benefit from the continued provision of those services. They also concluded that each of Janus Capital and each subadviser had sufficient personnel, with the appropriate education and experience, to serve the Portfolios effectively and had demonstrated its
24 Janus Aspen Series December 31, 2006
continuing ability to attract and retain well-qualified personnel.
Performance of the Funds
The Trustees considered the performance results of each Portfolio over various time periods. They reviewed information comparing each Portfolio's performance with the performance of comparable funds and peer groups identified by Lipper Inc., an independent provider of investment company data, and with the Portfolio's benchmark. They concluded that the performance of most Portfolios was good to very good. Although the performance of some Portfolios lagged that of their peers for certain periods, the Trustees also concluded that Janus Capital had taken appropriate steps to address those instances of under-performance and that the more recent performance of most of those Portfolios had been improving.
Costs of Services Provided
The Trustees examined information on the fees and expenses of each Portfolio in comparison to similar information for other comparable funds as provided by Lipper. They also reviewed an analysis of that information provided by their independent fee consultant and noted that the rate of management (investment advisory and administrative) fees for most of the Portfolios, after contractual expense limitations, was below the mean management fee rate of the respective peer group of funds selected by Lipper.
The Trustees considered the methodology used by Janus Capital and each subadviser in determining compensation payable to portfolio managers, the competitive environment for investment management talent and the competitive market for mutual funds in different distribution channels. They concluded that the compensation methodology provided a good alignment of the interests of the portfolio managers with the interests of Portfolio shareholders.
The Trustees also reviewed management fees charged by Janus Capital to its separate account clients and to its subadvised funds (for which Janus Capital provides only portfolio management services). Although in most instances subadvisory and separate account fee rates for various investment strategies were lower than management fees for Portfolios having a similar strategy, the Trustees noted that Janus Capital performs significant additional services for the Portfolios that it does not provide to those other clients, including administrative services, oversight of the Portfolios' other service providers, trustee support, regulatory compliance and numerous other services, and that, in serving the Portfolios, Janus Capital assumes many legal risks that it does not assume in servicing its other clients. Moreover, they noted that the spread between the average fees charged to the Portfolios and the fees that Janus Capital charged to its separate account clients was significantly smaller than the average spread for such fees of other advisers, based on publicly available data and research conducted by their independent fee consultant.
In considering the fees charged by Janus Capital, the Trustees had previously negotiated with Janus Capital a temporary contingent waiver of a portion the investment advisory fee paid by Janus Aspen Worldwide Growth Portfolio to Janus Capital to provide for a possible reduction in the rate of advisory fee payable by the Portfolio for the period July 1, 2006 through January 31, 2007 if the investment performance of the Fund should lag that of its benchmark performance over the applicable performance measurement period. Commencing in February 2007, the previously approved performance-based fee schedule will become operative.
The Trustees reviewed information on the profitability of Janus Capital and its affiliates of their relationships with each Portfolio, as well as an explanation of the methodology utilized in allocating various expenses among the Portfolios and other clients. The Trustees also reviewed the financial statements of Janus Capital's parent company and its corporate structure. In their review, the Trustees considered whether Janus Capital and each subadviser receive adequate incentives to manage the Portfolios effectively. The Trustees recognized that profitability comparisons among fund managers are difficult because very little comparative information is publicly available and profitability of any manager is affected by numerous factors, including the organizational structure of the particular manager, the types of funds and other accounts it manages, possible other lines of business, the methodology for allocating expenses and the manager's ca pital structure and cost of capital. However, based on the information available and taking those factors into account, the Trustees concluded that Janus Capital's profitability with respect to each Portfolio in relation to the services rendered was not unreasonable.
The Trustees concluded that the management fees and other compensation payable by each Fund to Janus Capital and its affiliates, as well as the fees paid by Janus Capital to the subadvisers of subadvised Portfolios, were reasonable in relation to the nature and quality of the services provided, taking into account the fees charged by other advisers for managing comparable mutual funds with similar strategies and the fees Janus Capital and the subadviser charges to other clients. The Trustees also concluded that the overall expense ratio of each Portfolio was reasonable, taking into account the size of the Portfolio, the quality of services provided by Janus Capital and any subadviser, the investment performance of the Portfolio and any expense limitations agreed to by Janus Capital.
Janus Aspen Series December 31, 2006 25
Additional Information (unaudited) (continued)
Economies of Scale
The Trustees considered information about the potential for Janus Capital to realize economies of scale as the assets of the Portfolios increase. They noted that, although most Portfolios pay advisory fees at a fixed rate as a percentage of net assets, without any breakpoints, the management fee paid by each Portfolio, after any contractual expense limitations, was below the mean management fee rate of the Portfolio's peer group selected by Lipper; and, for those Portfolios whose expenses are being reduced by the contractual expense limitations of Janus Capital, Janus Capital is subsidizing the Portfolios because they have not reached adequate scale. Moreover, as the assets of many of the Portfolios have declined in the past few years, the Portfolios have benefited from having advisory fee rates that have remained constant rather than increasing as assets decline. In addition, performance fee structures have been implemented for several Port folios that will cause the effective rate of advisory fees payable by such a Portfolio to vary depending on the investment performance of the Portfolio relative to its benchmark; and a few Portfolios have fee schedules with breakpoints and reduced fee rates above certain asset levels. The Trustees also noted that the Portfolios share directly in economies of scale through lower charges of third-party service providers based on the combined scale of all of the Portfolios. Based on all of the information they reviewed, the Trustees concluded that the current fee structure of each Portfolio was reasonable and that the current rates of fees do reflect a sharing between Janus Capital and the Portfolio of economies of scale at the current asset level of the Portfolio.
Other Benefits to Janus Capital
The Trustees also considered benefits that accrue to Janus Capital and its affiliates from their relationships with the Portfolios. They recognized that two affiliates of Janus Capital separately serve the Portfolios as transfer agent and distributor, respectively, and that the transfer agent receives compensation from the non-money market Portfolios for services provided. The Trustees also considered Janus Capital's use of commissions paid by Portfolios on their portfolio brokerage transactions to obtain proprietary research products and services benefiting the Portfolios and/or other clients of Janus Capital, as well as Janus Capital's agreement not to use any Portfolio's brokerage transactions to obtain third party research products or services. The Trustees concluded that Janus Capital's use of "soft" commission dollars to obtain proprietary research products and services was consistent with regulatory requirements and guidelines and was likely to benefit each Portfolio. The Trustees also concluded that, other than the services provided by Janus Capital and its affiliates pursuant to the agreements and the fees to be paid by each Portfolio therefor, the Portfolios and Janus Capital may potentially benefit from their relationship with each other in other ways. They concluded that Janus Capital benefits from the receipt of proprietary research products and services acquired through commissions paid on portfolio transactions of the Portfolios and that the Portfolios benefit from Janus Capital's receipt of those products and services as well as research products and services acquired through commissions paid by other clients of Janus Capital. They further concluded that success of any Portfolio could attract other business to Janus Capital or other Janus Funds and that the success of Janus Capital could enhance Janus Capital's ability to serve the Portfolios.
After full consideration of the above factors as well as other factors, all of the Trustees, including all of the Independent Trustees, concluded that the proposed continuation of the investment advisory agreement for each applicable Portfolio were in the best interest of the respective Portfolios and their shareholders.
26 Janus Aspen Series December 31, 2006
Explanations of Charts, Tables and
Financial Statements (unaudited)
1. PERFORMANCE OVERVIEWS
The performance overview graph compares the performance of a hypothetical $10,000 investment in the Portfolio with one or more widely used market indices. The hypothetical example does not represent the returns of any particular investment.
When comparing the performance of the Portfolio with an index, keep in mind that market indices do not include brokerage commissions that would be incurred if you purchased the individual securities in the index. They also do not include taxes payable on dividends and interest or operating expenses incurred if you maintained a Portfolio invested in the index.
Average annual total returns are quoted for each class of the Portfolio. Average annual total return is calculated by taking the growth or decline in value of an investment over a period of time, including reinvestment of any dividends, distributions and capital gains, then calculating the annual compounded percentage rate that would have produced the same result had the rate of growth been constant throughout the period. Average annual total return does not reflect the deduction of taxes that a shareholder would pay on Portfolio distributions or redemptions of Portfolio shares.
2. SCHEDULE OF INVESTMENTS
Following the performance overview section is the Portfolio's Schedule of Investments. This schedule reports the industry concentrations and types of securities held in the Portfolio on the last day of the reporting period. Securities are usually listed by type (common stock, corporate bonds, U.S. Government obligations, etc.) and by industry classification (banking, communications, insurance, etc.). Holdings are subject to change without notice.
The value of each security is quoted as of the last day of the reporting period. The value of securities denominated in foreign currencies is converted into U.S. dollars. Certain short-term investments maturing within 60 days are valued at amortized cost, which approximates market value.
A summary of investments by country is provided if the Portfolio invested in foreign securities. This summary reports the Portfolio's exposure to different countries by providing the percentage of securities invested in each country. The country of each security represents the country in which the company is incorporated.
2A. FORWARD CURRENCY CONTRACTS
A table listing forward currency contracts follows the Portfolio's Schedule of Investments (if applicable). Forward currency contracts are agreements to deliver or receive a preset amount of currency at a future date. Forward currency contracts are used to hedge against foreign currency risk in the Portfolio's long-term holdings. The table provides the name of the foreign currency, the settlement date of the contract, the amount of the contract, the value of the currency in U.S. dollars and the amount of unrealized gain or loss. The amount of unrealized gain or loss reflects the change in currency exchange rates from the time the contract was opened to the last day of the reporting period.
2B. FUTURES
A table listing futures contracts follows the Portfolio's Schedule of Investments (if applicable). Futures contracts are contracts that obligate the buyer to receive and the seller to deliver an instrument or money at a specified price on a specified date. Futures are used to hedge against adverse movements in securities prices, currency risk or interest rates.
The table provides the name of the contract, number of contracts held, the expiration date, the principal amount, value and the amount of unrealized gain or loss. The amount of unrealized gain or loss reflects the marked-to-market amount for the last day of the reporting period.
3. STATEMENT OF ASSETS AND LIABILITIES
This statement is often referred to as the "balance sheet." It lists the assets and liabilities of the Portfolio on the last day of the reporting period.
The Portfolio's assets are calculated by adding the value of the securities owned, the receivable for securities sold but not yet settled, the receivable for dividends declared but not yet received on stocks owned and the receivable for Portfolio shares sold to investors but not yet settled. The Portfolio's liabilities include payables for securities purchased but not yet settled, Portfolio shares redeemed but not yet paid and expenses owed but not yet paid. Additionally, there may be other assets and liabilities such as unrealized gain or loss on forward currency contracts.
The section entitled "Net Assets Consist of" breaks down the components of the Portfolio's net assets. Because the Portfolio must distribute substantially all earnings, you will notice that a significant portion of net assets is shareholder capital.
The last section of this statement reports the net asset value ("NAV") per share on the last day of the reporting period for each class of the Portfolio. The NAV is calculated by dividing the Portfolio's net assets (assets minus liabilities) by the number of shares outstanding.
Janus Aspen Series December 31, 2006 27
Explanations of Charts, Tables and
Financial Statements (unaudited) (continued)
4. STATEMENT OF OPERATIONS
This statement details the Portfolio's income, expenses, gains and losses on securities and currency transactions, and appreciation or depreciation of current Portfolio holdings.
The first section in this statement, entitled "Investment Income," reports the dividends earned from stocks and interest earned from interest-bearing securities in the Portfolio.
The next section reports the expenses and expense offsets incurred by the Portfolio, including the advisory fee paid to the investment adviser and transfer agent fees and expenses, and printing and postage for mailing statements, financial reports and prospectuses. Expense offsets, if any, are also shown.
The last section lists the increase or decrease in the value of securities held in the Portfolio. The Portfolio realizes a gain (or loss) when it sells its position in a particular security. An unrealized gain (or loss) refers to the change in net appreciation or depreciation of the Portfolio during the reporting period. "Net Realized and Unrealized Gain/(Loss) on Investments" is affected both by changes in the market value of Portfolio holdings and by gains (or losses) realized during the reporting period.
5. STATEMENT OF CHANGES IN NET ASSETS
This statement reports the increase or decrease in the Portfolio's net assets during the reporting period. Changes in the Portfolio's net assets are attributable to investment operations, dividends, distributions and capital share transactions. This is important to investors because it shows exactly what caused the Portfolio's net asset size to change during the period.
The first section summarizes the information from the Statement of Operations regarding changes in net assets due to the Portfolio's investment performance. The Portfolio's net assets may also change as a result of dividend and capital gains distributions to investors. If investors receive their dividends in cash, money is taken out of the Portfolio to pay the distribution. If investors reinvest their dividends, the Portfolio's net assets will not be affected. If you compare the Portfolio's "Net Decrease from Dividends and Distributions" to the "Reinvested dividends and distributions," you will notice that dividend distributions had little effect on the Portfolio's net assets. This is because the majority of Janus investors reinvest their distributions.
The reinvestment of dividends is included under "Capital Share Transactions." "Capital Shares" refers to the money investors contribute to the Portfolio through purchases or withdraw via redemptions. The Portfolio's net assets will increase and decrease in value as investors purchase and redeem shares from the Portfolio.
6. FINANCIAL HIGHLIGHTS
This schedule provides a per-share breakdown of the components that affect the Portfolio's NAV for current and past reporting periods for each class of the Portfolio. Not only does this table provide you with total return, it also reports total distributions, asset size, expense ratios and portfolio turnover rate.
The first line in the table reflects the NAV per share at the beginning of the reporting period. The next line reports the net investment income per share, which comprises dividends and interest income earned on securities held by the Portfolio. Following is the total of gains/(losses), realized and unrealized. Dividends and distributions are then subtracted to arrive at the NAV per share at the end of the period. The next line reflects the average annual total return reported the last day of the period.
Also included are the expense ratios, or the percentage of net assets that are used to cover operating expenses during the period. Expense ratios vary for a number of reasons, including the differences in management fees, the average shareholder account size and the extent of foreign investments, which entail greater transaction costs.
The Portfolio's expenses may be reduced through expense reduction arrangements. These arrangements may include the use of balance credits or transfer agent fee offsets. The Statement of Operations reflects total expenses before any such offset, the amount of offset and the net expenses. The expense ratios listed in the Financial Highlights reflect total expenses prior to any expense offsets (gross expense ratio) and after the expense offsets (net expense ratio). Both expense ratios reflect expenses after waivers (reimbursements), if applicable.
The ratio of net investment income/(loss) summarizes the income earned less expenses, divided by the average net assets of the Portfolio during the reporting period. Don't confuse this ratio with the Portfolio's yield. The net investment income ratio is not a true measure of the Portfolio's yield because it doesn't take into account the dividends distributed to the Portfolio's investors.
The next ratio is the portfolio turnover rate, which measures the buying and selling activity in a Portfolio. Portfolio turnover is affected by market conditions, changes in the asset size of a Portfolio, the nature of the Portfolio's investments and the investment style of the portfolio manager. A 100% rate implies that an amount equal to the value of the entire portfolio is turned over in a year; a 50% rate means that an amount equal to the value of half the portfolio is traded in a year; and a 200% rate means that an amount equal to the value of the portfolio is traded every six months.
28 Janus Aspen Series December 31, 2006
Designation Requirements (unaudited)
For federal income tax purposes, the Portfolio designated the following for the year ended December 31, 2006:
Dividends Received Deduction Percentage
| Portfolio | |||||||
| Janus Aspen Balanced Portfolio | 28 | % | |||||
Janus Aspen Series December 31, 2006 29
Trustees and Officers (unaudited)
The Portfolio's Statement of Additional Information includes additional information about the Trustees and officers and is available, without charge, by calling 1-800-525-0020.
The following are the Trustees and officers of the Trust, together with a brief description of their principal occupations during the last five years (principal occupations for certain Trustees may include periods over five years).
Each Trustee has served in that capacity since he or she was originally elected or appointed. The Trustees do not serve a specified term of office. Each Trustee will hold office until the termination of the Trust or his or her earlier death, resignation, retirement, incapacity or removal. The retirement age for Trustees is 72. The Portfolio's Nominating and Governance Committee will consider nominees for the position of Trustee recommended by shareholders. Shareholders may submit the name of a candidate for consideration by the Committee by submitting their recommendations to the Trust's Secretary. Each Trustee is currently a Trustee of two other registered investment companies advised by Janus Capital: Janus Investment Fund and Janus Adviser Series. As of the date of this report, collectively, these three registered investment companies consist of 69 series or funds.
The Trust's officers are elected annually by the Trustees for a one-year term. Certain officers also serve as officers of Janus Investment Fund and Janus Adviser Series. Certain officers of the Portfolio may also be officers and/or directors of Janus Capital. Portfolio officers receive no compensation from the Portfolio, except for the Portfolio's Chief Compliance Officer, as authorized by the Trustees.
Trustees
| Name, Age and Address | Positions Held with Portfolio | Length of Time Served | Principal Occupations During the Past Five Years | Number of Portfolios in Fund Complex Overseen by Trustee | Other Directorships Held by Trustee | ||||||||||||||||||
| Independent Trustees | |||||||||||||||||||||||
| Dennis B. Mullen 151 Detroit Street Denver, CO 80206 Age 63 | Chairman Trustee | 3/04-Present 9/93-Present | Chief Executive Officer of Red Robin Gourmet Burgers, Inc. (since 2005). Formerly, private investor. | 69 | * | Chairman of the Board (since 2005) and Director of Red Robin Gourmet Burgers, Inc.; and Director of Janus Capital Funds Plc (Dublin-based, non-U.S. funds). | |||||||||||||||||
| Jerome S. Contro 151 Detroit Street Denver, CO 80206 Age 50 | Trustee | 12/05-Present | Partner of Tango Group, a private investment firm (since 1999). | 69 | Trustee and Chairman of RS Investment Trust (since 2001); Director of IZZE Beverages and MyFamily.com, Inc. (genealogical research website). | ||||||||||||||||||
| William F. McCalpin 151 Detroit Street Denver, CO 80206 Age 49 | Trustee | 6/02-Present | Private Investor. Formerly, Vice President of Asian Cultural Council and Executive Vice President and Chief Operating Officer of The Rockefeller Brothers Fund (a private family foundation). | 69 | Director of the F.B. Heron Foundation (a private grantmaking foundation). | ||||||||||||||||||
| John W. McCarter, Jr. 151 Detroit Street Denver, CO 80206 Age 68 | Trustee | 6/02-Present | President and Chief Executive Officer of The Field Museum of Natural History (Chicago, IL). | 69 | Chairman of the Board and Director of Divergence Inc. (biotechnology firm); Director of W.W. Grainger, Inc. (industrial distributor); and Trustee of WTTW (Chicago public television station) and the University of Chicago. | ||||||||||||||||||
30 Janus Aspen Series December 31, 2006
Trustees (continued)
| Name, Age and Address | Positions Held with Portfolio | Length of Time Served | Principal Occupations During the Past Five Years | Number of Portfolios in Fund Complex Overseen by Trustee | Other Directorships Held by Trustee | ||||||||||||||||||
| Independent Trustees (cont.) | |||||||||||||||||||||||
| James T. Rothe 151 Detroit Street Denver, CO 80206 Age 63 | Trustee | 1/97-Present | Co-founder and Managing Director of Roaring Fork Capital Management, LLC (private investment in public equity firm); and Professor Emeritus of Business of the University of Colorado, Colorado Springs, CO (since 2004). Formerly, Professor of Business of the University of Colorado (2002-2004); and Distinguished Visiting Professor of Business (2001-2002) of Thunderbird University (American Graduate School of International Management), Glendale, AZ. | 69 | Director of Red Robin Gourmet Burgers, Inc. | ||||||||||||||||||
| William D. Stewart 151 Detroit Street Denver, CO 80206 Age 62 | Trustee | 9/93-Present | Corporate Vice President and General Manager of MKS Instruments – HPS Products, Boulder, CO (a manufacturer of vacuum fittings and valves). | 69 | N/A | ||||||||||||||||||
| Martin H. Waldinger 151 Detroit Street Denver, CO 80206 Age 68 | Trustee | 9/93-Present | Private Investor and Consultant to California Planned Unit Developments. Formerly, CEO and President of Marwal, Inc. (homeowner association management company). | 69 | N/A | ||||||||||||||||||
| Linda S. Wolf 151 Detroit Street Denver, CO 80206 Age 59 | Trustee | 12/05-Present | Retired. Formerly, Chairman and Chief Executive Officer of Leo Burnett (Worldwide) (advertising agency) (2001-2005). | 69 | Director of Wal-Mart, The Field Museum of Natural History (Chicago, IL), Children's Memorial Hospital (Chicago, IL), Chicago Council on Foreign Relations, Economic Club of Chicago, and InnerWorkings (a provider of print procurement solutions). | ||||||||||||||||||
| Interested Trustee | |||||||||||||||||||||||
| Thomas H. Bailey** 151 Detroit Street Denver, CO 80206 Age 69 | Trustee | 5/93-Present | Retired. Formerly, President (1978-2002) and Chief Executive Officer (1994-2002) of Janus Capital or Janus Capital Corporation; Chairman and Director (1978-2002) of Janus Capital Corporation; President and Director (1994-2002) of The Janus Foundation. | 69 | N/A | ||||||||||||||||||
* Mr. Mullen also serves as director of Janus Capital Funds Plc, consisting of 22 funds. Including Janus Capital Funds Plc and the 69 funds comprising the Janus Funds, Mr. Mullen oversees 91 funds.
** The Portfolio is treating Mr. Bailey as an "interested person" of the Trust by virtue of his past positions and continuing relationships with Janus Capital and ownership of shares of Janus Capital's parent company.
Janus Aspen Series December 31, 2006 31
Trustees and Officers (unaudited) (continued)
Officers
| Name, Age and Address | Positions Held with Portfolio | Term of Office* and Length of Time Served | Principal Occupations During the Past Five Years | ||||||||||||
| Marc Pinto 151 Detroit Street Denver, CO 80206 Age 45 | Executive Vice President and Co-Portfolio Manager Janus Aspen Balanced Portfolio | 5/05-Present | Vice President of Janus Capital and Portfolio Manager for other Janus accounts. | ||||||||||||
| Gibson Smith 151 Detroit Street Denver, CO 80206 Age 38 | Executive Vice President and Co-Portfolio Manager Janus Aspen Balanced Portfolio | 5/05-Present | Co-Chief Investment Officer and Executive Vice President of Janus Capital, and Portfolio Manager for other Janus accounts. Formerly, Analyst (2001-2003) for Janus Capital Corporation. | ||||||||||||
| Stephanie Grauerholz-Lofton 151 Detroit Street Denver, CO 80206 Age 36 | Chief Legal Counsel and Secretary Vice President | 1/06-Present 3/06-Present | Assistant Vice President of Janus Capital and Janus Distributors LLC; and Associate Counsel of Janus Capital. Formerly, Associate of Vedder, Price, Kaufman & Kammholz, P.C. (1999-2003). | ||||||||||||
| Kelley Abbott Howes 151 Detroit Street Denver, CO 80206 Age 41 | President and Chief Executive Officer | 1/06-Present | President of Janus Services LLC; Senior Vice President and General Counsel of Janus Capital; and Senior Vice President and Assistant General Counsel of Janus Distributors LLC. Formerly, Vice President (1999-2005) of Janus Distributors LLC; Senior Vice President and General Counsel (2004-2006), Vice President (2000-2004), and Assistant General Counsel (2002-2004) of Janus Services LLC; and Vice President and Assistant General Counsel (1999-2004) of Janus Capital. | ||||||||||||
| David R. Kowalski 151 Detroit Street Denver, CO 80206 Age 49 | Vice President and Chief Compliance Officer | 6/02-Present | Senior Vice President and Chief Compliance Officer of Janus Capital, Janus Distributors LLC, and Janus Services LLC; Chief Compliance Officer of Bay Isle Financial LLC; and Vice President of Enhanced Investment Technologies LLC. Formerly, Chief Compliance Officer of Enhanced Investment Technologies, LLC (2003-2005); Vice President of Janus Capital (2000-2005), Janus Distributors LLC (2000-2001), and Janus Services LLC (2004-2005); and Assistant Vice President of Janus Services LLC (2002-2004). | ||||||||||||
| Jesper Nergaard 151 Detroit Street Denver, CO 80206 Age 44 | Chief Financial Officer Vice President, Treasurer, and Principal Accounting Officer | 3/05-Present 2/05-Present | Vice President of Janus Capital. Formerly, Director of Financial Reporting for OppenheimerFunds, Inc. (2004-2005); Site Manager and First Vice President of Mellon Global Securities Services (2003); and Director of Fund Accounting, Project Development, and Training of INVESCO Funds Group (1994-2003). | ||||||||||||
* Officers are elected at least annually for a one-year term and may also be elected from time to time by the Trustees for an interim period.
32 Janus Aspen Series December 31, 2006
Notes
Janus Aspen Series December 31, 2006 33
Janus provides access to a wide range of investment disciplines.
Growth
Janus growth portfolios focus on companies believed to be the leaders in their respective industries, with solid management teams, expanding market share, margins and efficiencies.
Core
Janus core portfolios seek investments in more stable and predictable companies. These portfolios look for a strategic combination of steady growth and for certain portfolios, some degree of income.
Risk-Managed
Our risk-managed portfolios seek to outperform their respective indices while maintaining a risk profile equal to or lower than the index itself. Managed by INTECH (a Janus subsidiary), these portfolios use a mathematical process in an attempt to build a more "efficient" portfolio than the index.
Value
Janus value portfolios invest in companies they believe are poised for a turnaround or are trading at a significant discount to fair value. The goal is to gain unique insight into a company's true value and identify and evaluate potential catalysts that may unlock shareholder value.
International & Global
Janus international and global portfolios seek to leverage Janus' research capabilities by taking advantage of inefficiencies in foreign markets, where accurate information and analytical insight are often at a premium.
Bond & Money Market
Janus bond portfolios attempt to provide less risk relative to equities while seeking to deliver a competitive total return through high current income and appreciation. Janus money market portfolios seek maximum current income consistent with stability of capital.
For more information about our funds, contact your investment professional or go to www.janus.com/info
Please consider the charges, risks, expenses and investment objectives carefully before investing. For a prospectus containing this and other information, please call Janus at 1-800-525-0020 or download the file from www.janus.com/info. Read it carefully before you invest or send money.
An investment in a money market portfolio is not insured or guaranteed by the Federal Deposit Insurance Corporation or any other government agency. Although the Portfolio seeks to preserve the value of your investment at $1.00 per share, it is possible to lose money by investing in the Portfolio.

151 Detroit Street
Denver, CO 80206
1-800-525-0020
Portfolio distributed by Janus Distributors LLC (1/07)
C-0207-169 109-02-704 01-07
2006 Annual Report
Janus Aspen Series
Janus Aspen Flexible Bond Portfolio
Look Inside. . .
• Portfolio management perspective
• Investment strategy behind your portfolio
• Portfolio performance, characteristics and holdings

Table of Contents
| Useful Information About Your Portfolio Report | 1 | ||||||
| Management Commentary and Schedule of Investments | 2 | ||||||
| Statement of Assets and Liabilities | 12 | ||||||
| Statement of Operations | 13 | ||||||
| Statements of Changes in Net Assets | 14 | ||||||
| Financial Highlights | 15 | ||||||
| Notes to Schedule of Investments | 16 | ||||||
| Notes to Financial Statements | 17 | ||||||
| Report of Independent Registered Public Accounting Firm | 26 | ||||||
| Additional Information | 27 | ||||||
| Explanations of Charts, Tables and Financial Statements | 30 | ||||||
| Designation Requirements | 33 | ||||||
| Trustees and Officers | 34 | ||||||
Please consider the charges, risks, expenses and investment objectives carefully before investing. For a prospectus containing this and other information, please call Janus at 1-800-525-0020 or download the file from www.janus.com/info. Read it carefully before you invest or send money.
Useful Information About Your Portfolio Report
Management Commentary
The Management Commentary in this report includes valuable insight from the Portfolio's manager as well as statistical information to help you understand how your Portfolio's performance and characteristics stack up against those of comparable indices.
Please keep in mind that the opinions expressed by the Portfolio's manager in the Management Commentary are just that: opinions. They are a reflection of the manager's best judgment at the time this report was compiled, which was December 31, 2006. As the investing environment changes, so could the manager's opinions. The views are unique to the manager and aren't necessarily shared by his fellow employees or by Janus in general.
Portfolio Expenses
We believe it's important for our shareholders to have a clear understanding of Portfolio expenses and the impact they have on investment return.
The following is important information regarding the Portfolio's Expense Example, which appears in the Management Commentary within this Annual Report. Please refer to this information when reviewing the Expense Example for the Portfolio.
Example
As a shareholder of a Portfolio, you incur two types of costs: (1) transaction costs, including redemption fees (where applicable) (and any related exchange fees) and (2) ongoing costs, including management fees; distribution and shareholder servicing (12b-1) fees (applicable to Service Shares only); and other Portfolio expenses. The example is intended to help you understand your ongoing costs (in dollars) of investing in a Portfolio and to compare these costs with the ongoing costs of investing in other mutual funds. To do so, compare this 5% hypothetical example with the 5% hypothetical examples that appear in the shareholder reports of the other funds. The example is based upon an investment of $1,000 invested at the beginning of the period and held for the six-month period from July 1, 2006 to December 31, 2006.
Actual Expenses
The first line of the table in each example provides information about actual account values and actual expenses. You may use the information in this line, together with the amount you invested, to estimate the expenses that you paid over the period. Simply divide your account value by $1,000 (for example, an $8,600 account value divided by $1,000 = 8.6), then multiply the result by the number in the first line under the heading entitled "Expenses Paid During Period" to estimate the expenses you paid on your account during the period.
Hypothetical Example for Comparison Purposes
The second line of the table in each example provides information about hypothetical account values and hypothetical expenses based upon the Portfolio's actual expense ratio and an assumed rate of return of 5% per year before expenses. This is not the Portfolio's actual return. The hypothetical account values and expenses may not be used to estimate the actual ending account balance or expenses you paid for the period. You may use this information to compare the ongoing costs of investing in the Portfolio and other funds. To do so, compare this 5% hypothetical example with the 5% hypothetical examples that appear in the shareholder reports of the other funds.
Janus Capital Management LLC ("Janus Capital") has contractually agreed to waive the Portfolio's total operating expenses, excluding the distribution and shareholder servicing (12b-1) fees applicable to Service Shares, brokerage commissions, interest, taxes and extraordinary expenses to certain limits until at least May 1, 2008. More information regarding the waivers is available in the Portfolio's prospectus.
Please note that the expenses shown in the tables are meant to highlight your ongoing costs only and do not reflect any transaction costs, such as redemption fees (where applicable) and any charges at the separate account level or contract level. Redemption fees are fully described in the prospectus. Therefore, the second line of each table is useful in comparing ongoing costs only, and will not help you determine the relative total costs of owning different funds. In addition, if these transaction costs and separate account or contract level charges were included, your costs would have been higher.
Janus Aspen Series December 31, 2006 1
Janus Aspen Flexible Bond Portfolio (unaudited)
Portfolio Snapshot
This bond portfolio continually adjusts its allocations among different types of bond investments in an attempt to take advantage of ever-changing market conditions.

Ron Speaker
portfolio manager
Performance Overview
For the 12-month period ended December 31, 2006, Janus Aspen Flexible Bond Portfolio's Institutional Shares and Service Shares returned 4.22% and 3.98%, respectively, modestly underperforming the Portfolio's benchmark, the Lehman Brothers Aggregate Bond Index, which returned 4.33%.
Interest rate volatility contributed to market turbulence through much of the period, as investors tried to assess the strength of the economy, the risks of higher inflation and the likely direction of Federal Reserve (Fed) monetary policy. The Fed continued to tighten credit conditions through the first half of the year, raising the overnight Federal Funds rate by 100 basis points to 5.25% by the end of June, the highest level since January 2001. Meanwhile, concerns over elevated commodity prices and associated inflation pressures kept upward pressure on bond yields. The 10-year Treasury yield, which stood at 4.40% at the end of 2005, increased roughly 74 basis points to peak at around 5.14% in late June.
Market volatility during this period was aggravated by uncertainty over the inflation-fighting acumen of new Fed Chairman Ben Bernanke, who took office in February. Bernanke faced a tough challenge – trying to quell inflation pressures without derailing the economic expansion. While Bernanke initially appeared to follow the play book of predecessor Alan Greenspan, he began to show his independence in the late summer when signs of moderating housing market activity and a retreat in energy prices persuaded Fed policymakers to return to the sidelines. In August, the Federal Reserve Open Market Committee (FOMC) voted to leave the overnight lending rate unchanged, the first pause in credit tightening since June 2004. The Fed continued to hold its fire at the next three FOMC meetings, with the Federal Funds rate remaining unchanged at 5.25% through the end of the year. As investors began to speculate about the possibility of rate cuts in the foreseeable future, bond yields dropped sharply in the third quarter. The 10-year Treasury bond yield declined to below 4.50% in November. Late in the year, however, the bond market gave back some of its third quarter gains as some positive economic data eased recession fears and dampened hopes for a near-term Fed rate cut. As a result, the 10-year Treasury yield ended 2006 at 4.70%, up roughly 30 basis points from the start of the year, and the yield curve remained slightly inverted.
Against this backdrop, the corporate credit market gained support from generally healthy earnings growth, sound credit quality and a strengthening equity market. Spreads continued to narrow, particularly in the high-yield sector, which outperformed other areas of the fixed-income category. While healthy economic growth kept the overall default risk low, bond investors have become increasingly concerned over a rash of shareholder-friendly activities, including stock repurchase initiatives and leveraged buy-outs, that have added to corporate debt levels in recent months.
Strategy in This Environment
Our performance over the past 12 months benefited from our flexible investment approach, which enabled us to respond to changing market dynamics even as we remained committed to careful credit selection and rigorous fundamental research. Through much of the period, we maintained a market-neutral duration relative to our benchmark, which helped to mitigate exposure to rising interest rates. As we saw growing evidence of moderating economic growth, however, we shifted to a more overweight duration, which helped the Portfolio to more fully participate in the third quarter rally.
At the same time, we moved to a more overweight position in corporate bonds, as we pursued better yields and risk/return opportunities. We also traded some Treasury holdings for agency-backed bonds which offered more attractive carry and yield opportunities. Moreover, we also increased our stake in mortgage-backed securities, which now account for an above-market share of Portfolio assets.
Government Bonds and Select Corporate Securities Hindered Performance
In the first half of the year, performance was dampened by pressure on our Treasury and government-backed holdings, which proved vulnerable to rising interest rates. Despite regaining some ground with the bond market rally of the third quarter, these holdings nonetheless hindered our overall performance.
A number of corporate bond holdings detracted from performance during the period. For example, our investment in TEVA Pharmaceuticals was in a longer-dated 30-year security and with some delays in drug approvals,
2 Janus Aspen Series December 31, 2006
(unaudited)
the bond widened in spread. Another detractor from performance was our position in Hospital Corporation of America, known as HCA. HCA is a credit we had followed for years with several on-site company visits. The company started to pursue the more shareholder-friendly action of buying back stock and as a result, we sold our bonds at a small loss. Subsequently, the company continued to favor equity shareholders over bondholders and in July initiated one of the largest leveraged buyouts in history, which further harmed bondholders. We view this type of "going private" transaction as a danger to underperforming companies in a healthy financing environment, and one key risk we focus on in our bond investments.
Select Corporate Bonds Benefited Performance
Aiding our results was solid performance by a number of corporate bonds. One standout was our stake in Liberty Mutual, a property and casualty underwriter which benefited from a much milder hurricane season, and thus lower losses, as compared to last year. The company also has launched a new secure online management system to help workers track their compensation claims. Another casualty underwriter that contributed to performance was Kingsway America, a company that focuses on non-standard auto insurance. Kingsway America benefited from continued solid earnings growth and similar low losses as those experienced by Liberty Mutual.
We also benefited from our decision to take advantage of last winter's sell-off in bonds issued by General Motors Acceptance Corporation (GMAC), the financing arm of struggling automaker General Motors. We were able to invest in these bonds at an advantageous price, allowing us to benefit from GMAC's sale to Cerberus Capital Management, a private equity group, which was completed in November. Investors have hoped that this sale will allow GMAC to raise capital at a more profitable rate. We remain positive on the outlook for GMAC given its tremendous liquidity profile, global footprint and strong presence in the consumer lending market.
Strategy in the Months Ahead
As we look ahead, we caution that the outlook for the economy and Fed monetary policy has reached an inflection point. On one hand, if economic growth remains relatively solid, the Fed will likely maintain a "wait and see" approach. On the other hand, a dramatic slowdown in economic growth could prompt the Fed to cut rates, but also could raise concerns over corporate earnings performance and credit quality. So far, the economic data has been mixed, making it difficult to project the near-term direction of the economy and the likely Fed response. Policymakers and investors alike will be scrutinizing economic and inflation reports over the coming months as they try to gain more certainty on the outlook.
Nonetheless, we are heartened to find ourselves in a lower interest rate environment backed by relatively healthy corporate earnings growth and credit quality. This is a constructive investment environment, as the demand for credit (bonds) from U.S. and international investors continues to create good liquidity in the corporate bond market. The need for yield and the ability to put large amounts of money to work in the U.S. bond market makes our corporate market the most sought after of all global bond markets. We believe that the Portfolio is well positioned to capitalize on this period with our intensive credit research, and we continue to look to our flexible investment mandate to help us navigate the changing market dynamics.
Thank you for your investment and trust in Janus Aspen Flexible Bond Portfolio.
Janus Aspen Series December 31, 2006 3
Janus Aspen Flexible Bond Portfolio (unaudited)
Janus Aspen Flexible Bond Portfolio At a Glance
Portfolio Profile
| December 31, 2006 | |||||||
| Weighted Average Maturity | 7.1 Years | ||||||
| Average Modified Duration* | 4.4 Years | ||||||
| 30-Day Current Yield** Institutional Shares Service Shares | 5.07% 4.78% | ||||||
| Weighted Average Fixed Income Credit Rating | AA | ||||||
| Number of Bonds/Notes | 292 | ||||||
*A theoretical measure of price volatility
**Yield will fluctuate
Ratings† Summary – (% of Net Assets)
| December 31, 2006 | |||||||
| AAA | 64.1 | % | |||||
| AA | 5.6 | % | |||||
| A | 4.5 | % | |||||
| BBB | 12.2 | % | |||||
| BB | 5.0 | % | |||||
| B | 3.5 | % | |||||
| Other | 5.1 | % | |||||
†Rated by Standard & Poor's
| Significant Areas of Investment – (% of Net Assets) | Asset Allocation – (% of Net Assets) | ||||||
| As of December 31, 2006 | As of December 31, 2006 | ||||||
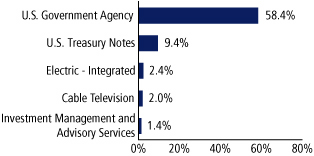 |  | ||||||
Emerging markets comprised 0.8% of total net assets.
4 Janus Aspen Series December 31, 2006
(unaudited)
Performance

Average Annual Total Return – for the periods ended December 31, 2006
| One Year | Five Year | Ten Year | Since Inception* | ||||||||||||||||
| Janus Aspen Flexible Bond Portfolio - Institutional Shares | 4.22 | % | 5.37 | % | 6.30 | % | 7.09 | % | |||||||||||
| Janus Aspen Flexible Bond Portfolio - Service Shares | 3.98 | % | 5.11 | % | 6.04 | % | 6.89 | % | |||||||||||
| Lehman Brothers Aggregate Bond Index | 4.33 | % | 5.06 | % | 6.24 | % | 6.01 | % | |||||||||||
| Lipper Quartile - Institutional Shares | 2 | nd | 1 | st | 1 | st | 1 | st | |||||||||||
| Lipper Ranking - Institutional Shares based on total returns for Variable Annuity Intermediate Investment Grade Debt Funds | 21/58 | 6/39 | 4/16 | 1/11 | |||||||||||||||
Data presented represents past performance, which is no guarantee of future results. Investment results and principal value will fluctuate so that shares, when redeemed, may be worth more or less than their original cost. Due to market volatility, current performance may be higher or lower than the performance shown. Call 877.33JANUS or visit www.janus.com/info for performance current to the most recent month-end.
See Notes to Schedule of Investments for index definitions.
Total return includes reinvestment of dividends from net investment income and distributions from capital gains. The returns shown do not reflect the deduction of taxes that a shareholder would pay on Portfolio distributions or the redemption of Portfolio shares.
Returns shown for Service Shares for periods prior to December 31, 1999 are derived from the historical performance of Institutional Shares, adjusted to reflect the higher operating expenses of Service Shares.
These returns do not reflect the charges and expenses of any particular insurance product or qualified plan. Returns shown would have been lower had they included insurance charges.
The Portfolio may differ significantly from the securities held in the index. The index is not available for direct investment; therefore its performance does not reflect the expenses associated with the active management of an actual Portfolio.
Bond portfolios have the same interest rate, inflation, and credit risks that are associated with the underlying bonds owned by the Portfolio. Unlike owning individual bonds, there are ongoing fees and expenses associated with owning shares of bond portfolios.
The return of principal is not guaranteed due to net asset value fluctuation that is caused by changes in the price of specific bonds held in the Portfolio and selling of bonds within the Portfolio by the Portfolio's manager.
There is no assurance that the investment process will consistently lead to successful investing.
High-yield bonds involve a greater risk of default and price volatility than U.S. Government and other high quality bonds. High-yield/high-risk bonds can experience sudden and sharp price swings which will affect net asset value.
The Portfolio's performance may be affected by risks that include those associated with nondiversification, non-investment grade debt securities, undervalued or overlooked companies, investments in specific industries or countries and potential conflicts of interest with Janus Smart Portfolios. Additional risks to the Portfolio may include those associated with investing in foreign securities, emerging markets, initial public offerings, derivatives and companies with relatively small market capitalizations. Please see a Janus prospectus or janus.com/info for more information about risk, fund holdings and details.
Lipper Inc. - A Reuters Company, is a nationally recognized organization that ranks the performance of mutual funds within a universe of funds that have similar investment objectives. Rankings are historical with capital gains and dividends reinvested.
The date of the since-inception Lipper ranking is slightly different from when the Portfolio began operations since Lipper provides fund rankings as of the last day of the month or the first Thursday after fund inception.
Ranking is for the Institutional share class only; other classes may have different performance characteristics.
The Portfolio's prospectus allows for investment in non-investment grade securities.
The Portfolio will invest at least 80% of its net assets in the type of securities described by its name.
Janus Capital has contractually agreed to waive the Portfolio's total operating expenses to the levels indicated in the prospectus until at least May 1, 2008. Total returns shown include fee waivers, if any, and without such waivers total returns would have been lower.
See "Explanations of Charts, Tables and Financial Statements."
* The Portfolio's inception date – September 13, 1993
Portfolio Expenses
The example below shows you the ongoing costs (in dollars) of investing in your Portfolio and allows you to compare these costs with those of other mutual funds. Please refer to page 1 for a detailed explanation of the information presented in these charts.
| Expense Example - Institutional Shares | Beginning Account Value (7/1/06) | Ending Account Value (12/31/06) | Expenses Paid During Period (7/1/06-12/31/06)* | ||||||||||||
| Actual | $ | 1,000.00 | $ | 1,050.60 | $ | 3.26 | |||||||||
| Hypothetical (5% return before expenses) | $ | 1,000.00 | $ | 1,022.03 | $ | 3.21 | |||||||||
| Expense Example - Service Shares | Beginning Account Value (7/1/06) | Ending Account Value (12/31/06) | Expenses Paid During Period (7/1/06-12/31/06)* | ||||||||||||
| Actual | $ | 1,000.00 | $ | 1,050.00 | $ | 4.50 | |||||||||
| Hypothetical (5% return before expenses) | $ | 1,000.00 | $ | 1,020.82 | $ | 4.43 | |||||||||
*Expenses are equal to the annualized expense ratio of 0.63% for Institutional Shares and 0.87% for Service Shares, multiplied by the average account value over the period, multiplied by 184/365 (to reflect the one-half year period). Expenses may include effect of contractual waivers by Janus Capital.
Janus Aspen Series December 31, 2006 5
Janus Aspen Flexible Bond Portfolio
Schedule of Investments
As of December 31, 2006
| Shares or Principal Amount | Value | ||||||||||
| Corporate Bonds - 27.4% | |||||||||||
| Agricultural Operations - 0.2% | |||||||||||
| $ | 537,000 | Bunge Limited Finance Corp., 4.375% company guaranteed notes, due 12/15/08 | $ | 525,683 | |||||||
| Automotive - Cars and Light Trucks - 0.1% | |||||||||||
| 300,000 | General Motors Corp., 7.745% bank loan, due 11/29/13‡ | 300,042 | |||||||||
| Beverages - Wine and Spirits - 0.1% | |||||||||||
| 410,000 | Diageo Capital PLC, 5.875% company guaranteed notes, due 9/30/36 | 401,069 | |||||||||
| Building and Construction Products - Miscellaneous - 0.3% | |||||||||||
| 810,000 | CRH America, Inc., 6.00% company guaranteed notes, due 9/30/16 | 817,610 | |||||||||
| Building Products - Cement and Aggregate - 0.6% | |||||||||||
| 500,000 | C5 Capital S.P.V., Ltd. 6.196%, debentures due, 12/29/49 (144A)‡,§ | 501,089 | |||||||||
| 700,000 | C10 Capital S.P.V., Ltd. 6.722%, debentures due, 12/29/49 (144A)‡,§ | 703,545 | |||||||||
| Lafarge S.A.: | |||||||||||
| 315,000 | 6.50%, notes, due 7/15/16** | 328,898 | |||||||||
| 315,000 | 7.125%, notes, due 7/15/36** | 342,235 | |||||||||
| 1,875,767 | |||||||||||
| Cable Television - 1.9% | |||||||||||
| Comcast Corp.: | |||||||||||
| 1,050,000 | 5.85%, company guaranteed notes due 1/15/10 | 1,064,652 | |||||||||
| 1,295,000 | 6.50%, company guaranteed notes due 1/15/17 | 1,351,360 | |||||||||
| 500,000 | 6.45%, company guaranteed notes due 3/15/37 | 500,270 | |||||||||
| 1,270,000 | Cox Communications, Inc., 4.625% notes, due 1/15/10 | 1,243,111 | |||||||||
| CSC Holdings, Inc.: | |||||||||||
| 2,810 | 7.11%, bank loan, due 3/29/13‡ | 2,811 | |||||||||
| 321,155 | 7.12%, bank loan, due 3/29/13‡ | 321,223 | |||||||||
| 61,421 | 7.12063%, bank loan, due 3/29/13‡ | 61,434 | |||||||||
| 256,924 | 7.12163%, bank loan, due 3/29/13‡ | 256,978 | |||||||||
| 476,112 | 7.12563%, bank loan, due 3/29/13‡ | 476,212 | |||||||||
| 5,278,051 | |||||||||||
| Casino Hotels - 0.3% | |||||||||||
| 815,000 | Hard Rock Hotel, Inc., 8.875% notes, due 6/1/13 | 885,294 | |||||||||
| Cellular Telecommunications - 0.7% | |||||||||||
| Nextel Communications, Inc.: | |||||||||||
| 755,000 | 6.875%, company guaranteed notes due 10/31/13 | 762,799 | |||||||||
| 440,000 | 7.375%, company guaranteed notes due 8/1/15 | 451,187 | |||||||||
| 755,000 | Rogers Wireless Communications, Inc. 7.61625%, secured notes, due 12/15/10‡ | 770,100 | |||||||||
| 1,984,086 | |||||||||||
| Shares or Principal Amount | Value | ||||||||||
| Commercial Banks - 0.9% | |||||||||||
| $ | 1,160,000 | ICICI Bank, Ltd., 7.25%, bonds due 10/31/16 (144A)‡ | $ | 1,198,978 | |||||||
| 330,000 | PartnerRe Finance,6.44% company guaranteed notes, due 12/1/66‡ | 331,220 | |||||||||
| 820,000 | Shinsei Bank, Ltd., 6.418% bonds, due 1/20/49 (144A)‡ | 819,054 | |||||||||
| 410,000 | Standard Chartered PLC, 6.409% subordinated notes, due 12/29/49 (144A)‡,§ | 406,747 | |||||||||
| 2,755,999 | |||||||||||
| Commercial Services - 0.1% | |||||||||||
| 320,000 | Iron Mountain, Inc., 8.625% company guaranteed notes, due 4/1/13 | 330,400 | |||||||||
| Computer Services - 0.2% | |||||||||||
| 435,000 | SunGard Data Systems, Inc., 9.125% company guaranteed notes, due 8/15/13 | 456,750 | |||||||||
| Computers - Memory Devices - 0.1% | |||||||||||
| 320,000 | Seagate Technology HDD Holdings 6.375%, company guaranteed notes due 10/1/11 | 320,000 | |||||||||
| Computers - Peripheral Equipment - 0% | |||||||||||
| 996,000 | Candescent Technologies Corp., 8.00% convertible senior subordinated debentures due 5/1/03 (144A)‡,º,ºº,§ | 0 | |||||||||
| Consumer Products - Miscellaneous - 0.1% | |||||||||||
| 330,000 | Visant Holding Corp.,8.75% senior notes, due 12/1/13 | 339,900 | |||||||||
| Containers - Metal and Glass - 0.5% | |||||||||||
| 833,000 | Owens-Brockway Glass Container, Inc. 8.875%, company guaranteed notes due 2/15/09 | 851,742 | |||||||||
| 570,000 | Owens-Illinois, Inc., 7.35% senior notes, due 5/15/08 | 573,563 | |||||||||
| 1,425,305 | |||||||||||
| Diversified Financial Services - 1.2% | |||||||||||
| General Electric Capital Corp.: | |||||||||||
| 1,965,000 | 4.875%, notes, due 10/21/10 | 1,944,328 | |||||||||
| 980,000 | 4.375%, notes, due 11/21/11 | 946,111 | |||||||||
| 500,000 | Zurich Financial Services USA, 6.45% bonds, due 12/15/65 (144A)‡ | 509,956 | |||||||||
| 3,400,395 | |||||||||||
| Diversified Minerals - 0.2% | |||||||||||
| 490,000 | Vale Overseas, Ltd., 6.875% company guaranteed notes, due 11/21/36 | 502,567 | |||||||||
| Diversified Operations - 0.4% | |||||||||||
| 160,000 | 3M Co., 5.125% notes, due 11/6/09 | 160,016 | |||||||||
| 1,025,000 | Textron, Inc., 6.375% notes, due 11/15/08 | 1,044,385 | |||||||||
| 1,204,401 | |||||||||||
| E-Commerce/Services - 0.1% | |||||||||||
| 245,000 | Expedia, Inc., 7.456% bonds, due 8/15/18 (144A) | 254,024 | |||||||||
| Electric - Generation - 0.2% | |||||||||||
| 550,000 | Edison Mission Energy, 7.75% senior unsecured notes, due 6/15/16 | 583,000 | |||||||||
See Notes to Schedule of Investments and Financial Statements.
6 Janus Aspen Series December 31, 2006
Schedule of Investments
As of December 31, 2006
| Shares or Principal Amount | Value | ||||||||||
| Electric - Integrated - 2.4% | |||||||||||
| $ | 490,000 | Consolidated Edison, Inc., 5.50% debentures, due 9/15/16 | $ | 489,301 | |||||||
| 635,000 | MidAmerican Energy Holdings Co. 3.50%, senior notes, due 5/15/08 | 619,146 | |||||||||
| 1,310,000 | Monongahela Power Co., 6.70% first mortgage notes, due 6/15/14 | 1,391,942 | |||||||||
| 690,000 | Pacific Gas and Electric Co., 4.80% unsecured notes, due 3/1/14 | 661,381 | |||||||||
| Southern California Edison Co.: | |||||||||||
| 1,680,000 | 7.625%, notes, due 1/15/10 | 1,781,118 | |||||||||
| 550,000 | 6.00%, first mortgage notes, due 1/15/34 | 560,745 | |||||||||
| TXU Corp.: | |||||||||||
| 885,000 | 4.80%, senior notes, due 11/15/09 | 863,706 | |||||||||
| 405,000 | 6.50%, senior notes, due 11/15/24 | 381,547 | |||||||||
| 6,748,886 | |||||||||||
| Electronic Components - Semiconductors - 0.3% | |||||||||||
| 283,678 | Advanced Micro Devices, Inc., 7.62% bank loan, due 12/31/13‡ | 284,977 | |||||||||
| 190,000 | Freescale Semiconductor, Inc., 7.36940% bank loan, due 12/2/13‡ | 190,933 | |||||||||
| 270,000 | Spansion LLC, 8.37531% bank loan, due 11/1/12‡ | 270,562 | |||||||||
| 746,472 | |||||||||||
| Finance - Auto Loans - 0.8% | |||||||||||
| Ford Motor Credit Co.: | |||||||||||
| 321,000 | 9.75%, senior unsecured notes due 9/15/10 (144A) | 341,483 | |||||||||
| 940,000 | 9.823%, notes, due 4/15/12‡ | 996,156 | |||||||||
| General Motors Acceptance Corp.: | |||||||||||
| 690,000 | 6.125%, notes, due 8/28/07 | 690,135 | |||||||||
| 330,000 | 6.75%, notes, due 12/1/14 | 338,954 | |||||||||
| 2,366,728 | |||||||||||
| Finance - Consumer Loans - 0.2% | |||||||||||
| 605,000 | John Deere Capital Corp., 4.875% notes, due 10/15/10 | 594,448 | |||||||||
| Finance - Investment Bankers/Brokers - 1.2% | |||||||||||
| E*Trade Financial Corp.: | |||||||||||
| 285,000 | 8.005%, senior notes, due 6/15/11 | 297,825 | |||||||||
| 820,000 | 7.375%, senior notes, due 9/15/13 | 852,801 | |||||||||
| Goldman Sachs Group, Inc.: | |||||||||||
| 650,000 | 5.75%, senior notes, due 10/1/16 | 660,178 | |||||||||
| 305,000 | 6.45%, subordinated notes, due 5/1/36 | 317,326 | |||||||||
| Jefferies Group, Inc.: | |||||||||||
| 235,000 | 5.50%, senior notes, due 3/15/16 | 228,831 | |||||||||
| 840,000 | 6.25%, senior unsecured notes due 1/15/36 | 814,843 | |||||||||
| 375,000 | Merrill Lynch & Company, Inc., 6.05% subordinated notes, due 5/16/16 | 388,140 | |||||||||
| 3,559,944 | |||||||||||
| Finance - Leasing Companies - 0.4% | |||||||||||
| 1,310,000 | Orix Corp., 5.48% unsubordinated notes, due 11/22/11 | 1,307,474 | |||||||||
| Financial Guarantee Insurance - 0.3% | |||||||||||
| 830,000 | Financial Security Assurance Holdings, Ltd. 6.40%, junior subordinated debentures due 12/15/66 (144A)‡ | 833,824 | |||||||||
| Shares or Principal Amount | Value | ||||||||||
| Food - Confectionary - 0.2% | |||||||||||
| $ | 490,000 | Hershey Co., 5.45% notes, due 9/1/16 | $ | 491,419 | |||||||
| Food - Retail - 0.1% | |||||||||||
| 385,000 | Stater Brothers Holdings, Inc., 8.125% senior notes, due 6/15/12 | 390,775 | |||||||||
| Foreign Government - 0.4% | |||||||||||
| 1,190,000 | Quebec Province, 6.125% unsecured notes, due 1/22/11 | 1,229,497 | |||||||||
| Gas - Distribution - 0.1% | |||||||||||
| 400,000 | Southern Star Central Corp., 6.00% notes, due 6/1/16 (144A) | 402,500 | |||||||||
| Independent Power Producer - 0.4% | |||||||||||
| NRG Energy, Inc.: | |||||||||||
| 80,482 | 7.36375%, bank loan, due 2/1/13‡ | 80,820 | |||||||||
| 961,875 | 7.36375%, bank loan, due 2/1/13‡ | 967,242 | |||||||||
| 1,048,062 | |||||||||||
| Investment Management and Advisory Services - 1.4% | |||||||||||
| 1,130,000 | Ameriprise Financial, Inc., 7.5185% junior subordinated notes, due 6/1/66‡ | 1,240,932 | |||||||||
| 1,030,000 | Franklin Resources, Inc., 3.70% notes, due 4/15/08 | 1,008,802 | |||||||||
| Nuveen Investments: | |||||||||||
| 675,000 | 5.00%, senior notes, due 9/15/10 | 664,046 | |||||||||
| 1,035,000 | 5.50%, senior notes, due 9/15/15 | 1,013,237 | |||||||||
| 3,927,017 | |||||||||||
| Life and Health Insurance - 0.5% | |||||||||||
| 500,000 | Americo Life, Inc., 7.875% notes, due 5/1/13 (144A)§ | 501,561 | |||||||||
| 995,000 | StanCorp Financial Group, Inc., 6.875% senior notes, due 10/1/12 | 1,047,159 | |||||||||
| 1,548,720 | |||||||||||
| Medical - Hospitals - 0.6% | |||||||||||
| 1,610,000 | HCA, Inc., 9.25% secured notes, due 11/15/16 (144A) | 1,724,713 | |||||||||
| Multi-Line Insurance - 0.2% | |||||||||||
| 500,000 | Metlife, Inc., 6.40% junior subordinated notes, due 12/15/36 | 502,304 | |||||||||
| Multimedia - 0.4% | |||||||||||
| Time Warner, Inc.: | |||||||||||
| 490,000 | 5.875%, company guaranteed notes due 11/15/16 | 488,763 | |||||||||
| 420,000 | 6.50%, company guaranteed notes due 11/15/36 | 418,037 | |||||||||
| 320,000 | Viacom, Inc.,6.25% senior notes, due 4/30/16 | 317,783 | |||||||||
| 1,224,583 | |||||||||||
| Mutual Insurance - 0.3% | |||||||||||
| 810,000 | Liberty Mutual Group, 7.50% bonds, due 8/15/36 (144A)§ | 886,199 | |||||||||
| Non-Hazardous Waste Disposal - 0.7% | |||||||||||
| 1,075,000 | Allied Waste Industries, Inc., 6.50% secured notes, due 11/15/10 | 1,077,688 | |||||||||
| 805,000 | Waste Management, Inc., 7.375% senior notes, due 8/1/10 | 856,284 | |||||||||
| 1,933,972 | |||||||||||
| Office Automation and Equipment - 0.5% | |||||||||||
| 1,480,000 | Xerox Corp., 6.75% senior unsecured notes, due 2/1/17 | 1,546,600 | |||||||||
See Notes to Schedule of Investments and Financial Statements.
Janus Aspen Series December 31, 2006 7
Janus Aspen Flexible Bond Portfolio
Schedule of Investments
As of December 31, 2006
| Shares or Principal Amount | Value | ||||||||||
| Office Supplies and Forms - 0.1% | |||||||||||
| $ | 330,000 | Acco Brands Corp., 7.625% company guaranteed notes, due 8/15/15 | $ | 324,225 | |||||||
| Oil Companies - Exploration and Production - 0.9% | |||||||||||
| 795,000 | Kerr-McGee Corp., 6.875% secured notes, due 9/15/11 | 839,960 | |||||||||
| 327,000 | Magnum Hunter Resources, Inc., 9.60% company guaranteed notes, due 3/15/12 | 343,759 | |||||||||
| Pemex Project Funding Master Trust: | |||||||||||
| 200,000 | 5.75%, company guaranteed notes due 12/15/15 | 198,600 | |||||||||
| 195,000 | 8.625%, company guaranteed notes due 2/1/22‡ | 241,020 | |||||||||
| 325,000 | Ras Laffan LNG III, 5.838% bonds, due 9/30/27 (144A) | 312,202 | |||||||||
| 800,000 | Sabine Production Partners L.P., 7.50% secured notes, due 11/30/16 (144A) | 797,000 | |||||||||
| 2,732,541 | |||||||||||
| Oil Companies - Integrated - 0.2% | |||||||||||
| 500,000 | Marathon Oil Corp., 6.85% notes, due 3/1/08 | 507,618 | |||||||||
| Paper and Related Products - 0.2% | |||||||||||
| Georgia Pacific Corporation, Inc.: | |||||||||||
| 559,058 | 7.35313%, bank loan, due 12/20/12‡ | 561,439 | |||||||||
| 69,882 | 7.36375%, bank loan, due 12/20/12‡ | 70,180 | |||||||||
| 62,544 | 7.36375%, bank loan, due 12/20/12‡ | 62,811 | |||||||||
| 34,941 | 7.37563%, bank loan, due 12/20/12‡ | 35,090 | |||||||||
| 729,520 | |||||||||||
| Photo Equipment and Supplies - 0.2% | |||||||||||
| Eastman Kodak Co.: | |||||||||||
| 168,841 | 0%, bank loan, due 10/18/12‡ | 169,246 | |||||||||
| 148,105 | 7.60%, bank loan, due 10/18/12‡ | 148,461 | |||||||||
| 147,364 | 7.60%, bank loan, due 10/18/12‡ | 147,718 | |||||||||
| 465,425 | |||||||||||
| Pipelines - 0.8% | |||||||||||
| 1,205,000 | El Paso Corp., 7.625% senior notes, due 9/1/08 | 1,241,150 | |||||||||
| 716 | Kern River Funding Corp., 4.893% company guaranteed notes, due 4/30/18 | 695 | |||||||||
| 305,000 | Kinder Morgan Finance Co., 5.70% company guaranteed notes, due 1/5/16 | 279,843 | |||||||||
| ONEOK Partners, L.P.: | |||||||||||
| 490,000 | 6.15%, company guaranteed notes due 10/1/16 | 497,183 | |||||||||
| 400,000 | 6.65%, company guaranteed notes due 10/1/36 | 409,133 | |||||||||
| 2,428,004 | |||||||||||
| Property and Casualty Insurance - 0.5% | |||||||||||
| 1,190,000 | Kingsway America, Inc., 7.50% senior notes, due 2/1/14 | 1,206,733 | |||||||||
| 330,000 | Markel Corp., 7.35% senior notes, due 8/15/34 | 356,134 | |||||||||
| 1,562,867 | |||||||||||
| Shares or Principal Amount | Value | ||||||||||
| Publishing - Periodicals - 0.5% | |||||||||||
| $ | 523,000 | Dex Media East LLC, 12.125% company guaranteed notes, due 11/15/12 | $ | 575,954 | |||||||
| Idearc, Inc.: | |||||||||||
| 400,000 | 7.35%, bank loan, due 11/17/14‡ | 402,072 | |||||||||
| 320,000 | 8.00%, senior notes, due 11/15/16 (144A)§ | 324,800 | |||||||||
| 1,302,826 | |||||||||||
| Reinsurance - 0.1% | |||||||||||
| 440,000 | Berkshire Hathaway, Inc., 4.625% company guaranteed notes, due 10/15/13 | 422,898 | |||||||||
| Retail - Building Products - 0.2% | |||||||||||
| Home Depot, Inc.: | |||||||||||
| 280,000 | 5.25%, senior unsecured notes due 12/16/13 | 277,918 | |||||||||
| 410,000 | 5.875%, senior unsecured notes due 12/16/36 | 402,342 | |||||||||
| 680,260 | |||||||||||
| Retail - Drug Store - 0.2% | |||||||||||
| 490,000 | CVS Corp., 5.75% senior unsecured notes, due 8/15/11 | 495,893 | |||||||||
| Retail - Pet Food and Supplies - 0% | |||||||||||
| 130,000 | Petco Animal Supplies, Inc., 8.10% bank loan, due 10/28/13‡ | 130,732 | |||||||||
| Retail - Regional Department Stores - 0% | |||||||||||
| Neiman Marcus Group, Inc.: | |||||||||||
| 13,266 | 7.60%, bank loan, due 3/13/13‡ | 13,353 | |||||||||
| 111,101 | 7.60250%, bank loan, due 4/6/13‡ | 111,830 | |||||||||
| 125,183 | |||||||||||
| Rubber - Tires - 0.1% | |||||||||||
| 220,000 | Goodyear Tire & Rubber Co., 8.625% senior notes, due 12/1/11 (144A) | 227,150 | |||||||||
| Satellite Telecommunications - 0.3% | |||||||||||
| INTELSAT Bermuda, Ltd.: | |||||||||||
| 330,000 | 6.50% notes, due 11/1/13 | 280,500 | |||||||||
| 650,000 | 11.25%, senior notes, due 6/15/16 (144A) | 713,375 | |||||||||
| 993,875 | |||||||||||
| Savings/Loan/Thrifts - 0.4% | |||||||||||
| 200,000 | Sovereign Bancorp, Inc., 4.80% senior notes, due 9/1/10 (144A) | 195,704 | |||||||||
| 725,000 | Webster Bank, 5.875% subordinated notes, due 1/15/13 | 726,330 | |||||||||
| 310,000 | Webster Capital Trust II, 10.00% company guaranteed notes, due 4/1/27 | 327,515 | |||||||||
| 1,249,549 | |||||||||||
| Schools - 0.4% | |||||||||||
| Education Management LLC: | |||||||||||
| 231,118 | 7.875%, bank loan, due 6/1/13‡ | 232,562 | |||||||||
| 910,000 | 10.25%, senior subordinated notes due 6/1/16 (144A) | 962,325 | |||||||||
| 1,194,887 | |||||||||||
| Special Purpose Entity - 1.2% | |||||||||||
| 650,000 | JPMorgan Chase Capital XX, 6.55% junior subordinated notes, due 9/29/36 | 671,195 | |||||||||
| 1,185,000 | OneAmerica Financial Partners, 7.00% bonds, due 10/15/33 (144A) | 1,225,797 | |||||||||
See Notes to Schedule of Investments and Financial Statements.
8 Janus Aspen Series December 31, 2006
Schedule of Investments
As of December 31, 2006
| Shares or Principal Amount | Value | ||||||||||
| Special Purpose Entity (continued) | |||||||||||
| $ | 1,610,000 | Resona Preferred Securities, Ltd., 7.191% bonds, due 12/29/49 (144A)‡ | $ | 1,679,927 | |||||||
| 3,576,919 | |||||||||||
| Telecommunication Services - 0.1% | |||||||||||
| 385,000 | Embarq Corp., 7.082% senior unsecured notes, due 6/1/16 | 391,938 | |||||||||
| Telephone - Integrated - 0.6% | |||||||||||
| 1,000,000 | BellSouth Corp., 4.75% senior unsecured notes, due 11/15/12 | 965,021 | |||||||||
| 255,000 | Qwest Corp., 7.74125% senior notes, due 6/15/13‡ | 276,038 | |||||||||
| 450,000 | Telefonica Emisiones S.A.U., 5.984% company guaranteed notes, due 6/20/11** | 458,068 | |||||||||
| 1,699,127 | |||||||||||
| Transportation - Equipment and Leasing - 0.3% | |||||||||||
| 810,000 | GATX Corp., 5.50%, senior notes due 2/15/12 | 804,750 | |||||||||
| Transportation - Railroad - 0.3% | |||||||||||
| 970,000 | Kansas City Southern, 7.50% company guaranteed notes, due 6/15/09 | 978,488 | |||||||||
| Transportation - Services - 0.2% | |||||||||||
| 490,000 | Fedex Corp., 5.50% company guaranteed notes, due 8/15/09 | 491,861 | |||||||||
| Total Corporate Bonds (cost $79,409,621) | 80,171,016 | ||||||||||
| Foreign Bonds - 0.1% | |||||||||||
| Cable Television - 0.1% | |||||||||||
| EUR | 253,980 | Telenet Communications N.V., 9.00% senior notes, due 12/15/13** (cost $325,821) | 367,953 | ||||||||
| Mortgage Backed Securities - 41.8% | |||||||||||
| U.S. Government Agencies - 41.8% | |||||||||||
| Fannie Mae: | |||||||||||
| $ | 1,155,729 | 7.00%, due 9/1/14 | 1,189,237 | ||||||||
| 315,469 | 6.50%, due 11/1/17 | 323,099 | |||||||||
| 774,439 | 5.00%, due 11/1/18 | 763,043 | |||||||||
| 724,217 | 4.50%, due 5/1/19 | 699,494 | |||||||||
| 1,429,749 | 4.50%, due 5/1/19 | 1,380,941 | |||||||||
| 1,709,777 | 4.50%, due 5/1/19 | 1,651,410 | |||||||||
| 307,328 | 5.50%, due 8/1/19 | 307,549 | |||||||||
| 1,543,873 | 5.00%, due 8/1/19 | 1,519,423 | |||||||||
| 169,656 | 5.50%, due 9/1/19 | 169,902 | |||||||||
| 917,635 | 5.50%, due 9/1/19 | 918,296 | |||||||||
| 494,917 | 4.50%, due 4/1/20 | 477,494 | |||||||||
| 141,280 | 4.50%, due 7/1/20 | 136,307 | |||||||||
| 41,807 | 4.00%, due 9/1/20 | 39,363 | |||||||||
| 167,393 | 5.00%, due 10/1/20 | 164,564 | |||||||||
| 71,924 | 5.50%, due 12/1/20 | 71,911 | |||||||||
| 20,576 | 5.00%, due 6/1/21 | 20,226 | |||||||||
| 1,003,487 | 6.00%, due 10/1/21 | 1,017,620 | |||||||||
| 1,849,895 | 5.50%, due 9/1/24 | 1,840,044 | |||||||||
| 1,342,117 | 5.00%, due 5/1/25 | 1,306,024 | |||||||||
| 310,674 | 7.00%, due 11/1/28 | 320,848 | |||||||||
| 362,963 | 6.50%, due 2/1/31 | 373,111 | |||||||||
| 675,812 | 7.00%, due 2/1/32 | 697,945 | |||||||||
| 634,167 | 6.50%, due 5/1/32 | 650,196 | |||||||||
| 305,899 | 6.50%, due 7/1/32 | 312,910 | |||||||||
| 2,315,379 | 6.00%, due 10/1/32 | 2,336,508 | |||||||||
| Shares or Principal Amount | Value | ||||||||||
| Fannie Mae: (continued) | |||||||||||
| $ | 2,623,823 | 5.50%, due 2/1/33 | $ | 2,597,615 | |||||||
| 526,832 | 6.50%, due 3/1/33 | 538,907 | |||||||||
| 1,095,624 | 5.50%, due 11/1/33 | 1,084,456 | |||||||||
| 1,390,143 | 5.00%, due 11/1/33 | 1,344,726 | |||||||||
| 3,342,061 | 5.00%, due 3/1/34 | 3,232,871 | |||||||||
| 590,784 | 5.00%, due 4/1/34 | 571,483 | |||||||||
| 1,324,163 | 5.00%, due 4/1/34 | 1,280,028 | |||||||||
| 1,319,540 | 5.00%, due 6/1/34 | 1,275,559 | |||||||||
| 2,084,824 | 6.00%, due 7/1/34 | 2,104,683 | |||||||||
| 566,749 | 5.00%, due 7/1/34 | 547,859 | |||||||||
| 764,430 | 6.50%, due 8/1/34 | 782,590 | |||||||||
| 157,978 | 6.50%, due 9/1/34 | 162,300 | |||||||||
| 2,288,448 | 5.50%, due 11/1/34 | 2,263,914 | |||||||||
| 296,125 | 5.50%, due 11/1/34 | 292,950 | |||||||||
| 1,396,824 | 5.50%, due 3/1/35 | 1,380,870 | |||||||||
| 1,833,587 | 5.00%, due 5/1/35 | 1,770,772 | |||||||||
| 1,042,003 | 4.50%, due 6/1/35 | 976,749 | |||||||||
| 1,365,820 | 5.50%, due 7/1/35 | 1,350,220 | |||||||||
| 541,461 | 5.00%, due 7/1/35 | 522,912 | |||||||||
| 225,559 | 5.00%, due 8/1/35 | 217,832 | |||||||||
| 70,470 | 4.50%, due 8/1/35 | 66,057 | |||||||||
| 1,183,464 | 6.00%, due 9/1/35 | 1,193,547 | |||||||||
| 2,821,245 | 5.50%, due 9/1/35 | 2,789,021 | |||||||||
| 674,342 | 5.00%, due 9/1/35 | 651,241 | |||||||||
| 990,843 | 4.50%, due 9/1/35 | 928,792 | |||||||||
| 1,144,175 | 4.50%, due 9/1/35 | 1,072,522 | |||||||||
| 1,509,707 | 6.00%, due 12/1/35 | 1,520,258 | |||||||||
| 1,529,678 | 5.50%, due 12/1/35 | 1,512,207 | |||||||||
| 295,574 | 4.50%, due 12/1/35 | 277,064 | |||||||||
| 120,546 | 7.00%, due 1/1/36 | 123,735 | |||||||||
| 1,094,250 | 6.50%, due 1/1/36 | 1,114,881 | |||||||||
| 909,487 | 5.50%, due 1/1/36 | 899,099 | |||||||||
| 1,271,768 | 5.50%, due 2/1/36 | 1,257,243 | |||||||||
| 306,359 | 5.50%, due 2/1/36 | 302,753 | |||||||||
| 2,036,320 | 5.00%, due 2/1/36 | 1,966,560 | |||||||||
| 1,869,948 | 6.00%, due 3/1/36 | 1,882,609 | |||||||||
| 1,156,905 | 5.50%, due 3/1/36 | 1,143,691 | |||||||||
| 2,167,897 | 5.50%, due 4/1/36 | 2,143,136 | |||||||||
| 133,216 | 7.00%, due 5/1/36 | 136,741 | |||||||||
| 2,045,778 | 5.00%, due 5/1/36 | 1,975,694 | |||||||||
| 172,953 | 7.00%, due 7/1/36 | 177,529 | |||||||||
| 284,545 | 6.50%, due 7/1/36 | 289,910 | |||||||||
| 654,635 | 5.50%, due 7/1/36 | 646,930 | |||||||||
| 1,607,078 | 6.50%, due 8/1/36 | 1,637,379 | |||||||||
| 783,062 | 6.50%, due 8/1/36 | 797,826 | |||||||||
| 1,302,121 | 6.00%, due 8/1/36 | 1,310,938 | |||||||||
| 547,664 | 6.00%, due 8/1/36 | 551,372 | |||||||||
| 315,074 | 6.50%, due 9/1/36 | 321,014 | |||||||||
| 916,163 | 6.00%, due 10/1/36 | 922,366 | |||||||||
| 2,040,149 | 6.00%, due 11/1/36 | 2,053,962 | |||||||||
| 1,322,570 | 5.50%, due 11/1/36 | 1,307,002 | |||||||||
| 793,552 | 5.50%, due 12/1/36 | 784,211 | |||||||||
| Federal Home Loan Bank System: | |||||||||||
| 1,548,623 | 5.27%, due 12/28/12 | 1,541,788 | |||||||||
| 892,820 | 5.50%, due 12/1/34 | 883,888 | |||||||||
| 1,088,292 | 5.50%, due 12/1/34 | 1,077,404 | |||||||||
| 755,465 | 5.00%, due 10/1/35 | 729,188 | |||||||||
| 924,069 | 6.00%, due 12/1/36 | 930,903 | |||||||||
See Notes to Schedule of Investments and Financial Statements.
Janus Aspen Series December 31, 2006 9
Janus Aspen Flexible Bond Portfolio
Schedule of Investments
As of December 31, 2006
| Shares or Principal Amount | Value | ||||||||||
| Freddie Mac: | |||||||||||
| $ | 451,946 | 5.50%, due 1/1/16 | $ | 452,964 | |||||||
| 656,740 | 5.50%, due 1/1/18 | 657,867 | |||||||||
| 2,107,518 | 4.50%, due 2/1/18 | 2,037,492 | |||||||||
| 1,182,763 | 5.00%, due 9/1/18 | 1,164,632 | |||||||||
| 2,420,387 | 5.75%, due 12/15/18 | 2,422,316 | |||||||||
| 1,121,709 | 4.00%, due 4/1/19 | 1,055,791 | |||||||||
| 747,567 | 5.00%, due 2/1/20 | 734,500 | |||||||||
| 281,721 | 4.00%, due 9/1/20 | 264,915 | |||||||||
| 161,764 | 5.00%, due 12/1/20 | 158,936 | |||||||||
| 383,640 | 5.00%, due 1/1/21 | 376,870 | |||||||||
| 95,607 | 5.50%, due 2/1/21 | 95,529 | |||||||||
| 533,874 | 5.50%, due 2/1/21 | 533,463 | |||||||||
| 49,699 | 5.00%, due 3/1/21 | 48,822 | |||||||||
| 20,909 | 5.50%, due 5/1/21 | 20,893 | |||||||||
| 116,486 | 6.00%, due 6/1/21 | 118,054 | |||||||||
| 592,506 | 6.00%, due 11/1/33 | 597,881 | |||||||||
| 714,206 | 5.50%, due 11/1/33 | 707,374 | |||||||||
| 1,139,665 | 6.00%, due 2/1/34 | 1,150,427 | |||||||||
| 491,025 | 5.00%, due 5/1/34 | 474,286 | |||||||||
| 714,435 | 5.00%, due 5/1/34 | 690,478 | |||||||||
| 245,490 | 3.928%, due 5/1/34 | 239,363 | |||||||||
| 267,831 | 6.50%, due 7/1/34 | 273,919 | |||||||||
| 124,382 | 6.50%, due 7/1/34 | 127,198 | |||||||||
| 143,659 | 6.50%, due 6/1/35 | 146,462 | |||||||||
| 2,114,555 | 5.50%, due 6/1/35 | 2,093,400 | |||||||||
| 2,291,257 | 5.00%, due 7/1/35 | 2,211,560 | |||||||||
| 230,579 | 6.00%, due 8/1/35 | 232,336 | |||||||||
| 1,208,315 | 5.50%, due 9/1/35 | 1,195,212 | |||||||||
| 321,572 | 5.50%, due 9/1/35 | 318,085 | |||||||||
| 2,034,916 | 5.00%, due 9/1/35 | 1,964,136 | |||||||||
| 1,336,778 | 5.50%, due 10/1/35 | 1,322,725 | |||||||||
| 613,289 | 5.50%, due 4/1/36 | 606,453 | |||||||||
| 946,269 | 5.00%, due 4/1/36 | 913,355 | |||||||||
| 11,681 | 6.50%, due 6/1/36 | 11,897 | |||||||||
| 168,512 | 5.00%, due 6/1/36 | 162,579 | |||||||||
| 1,036,617 | 5.00%, due 6/1/36 | 1,000,561 | |||||||||
| 474,761 | 5.50%, due 7/1/36 | 469,469 | |||||||||
| 539,532 | 6.50%, due 8/1/36 | 549,536 | |||||||||
| 1,637,417 | 5.00%, due 10/1/36 | 1,579,767 | |||||||||
| Ginnie Mae: | |||||||||||
| 540,161 | 6.00%, due 2/15/33 | 548,219 | |||||||||
| 1,600,598 | 6.00%, due 10/20/34 | 1,619,873 | |||||||||
| 579,360 | 6.50%, due 2/20/35 | 592,273 | |||||||||
| 515,304 | 5.50%, due 3/15/35 | 512,950 | |||||||||
| 1,732,403 | 5.50%, due 3/20/35 | 1,720,160 | |||||||||
| 1,245,649 | 5.50%, due 5/20/35 | 1,236,846 | |||||||||
| 2,261,444 | 5.00%, due 10/15/35 | 2,199,583 | |||||||||
| 290,726 | 5.00%, due 12/15/35 | 282,774 | |||||||||
| 1,334,021 | 5.50%, due 3/15/36 | 1,327,608 | |||||||||
| 104,043 | 6.50%, due 6/15/36 | 106,750 | |||||||||
| 288,686 | 5.50%, due 6/15/36 | 287,298 | |||||||||
| 402,044 | 6.00%, due 7/15/36 | 407,650 | |||||||||
| Total Mortgage Backed Securities (cost $123,136,254) | 121,930,709 | ||||||||||
| Shares or Principal Amount | Value | ||||||||||
| Preferred Stock - 0.7% | |||||||||||
| Finance - Other Services - 0.2% | |||||||||||
| 11,098 | Chevy Chase Preferred Capital Corp. Series A, convertible, 10.375% | $ | 583,755 | ||||||||
| REIT - Diversified - 0.3% | |||||||||||
| 31,150 | iStar Financial, Inc., 7.875% | 806,981 | |||||||||
| Savings/Loan/Thrifts - 0.2% | |||||||||||
| 26,020 | Chevy Chase Bank FSB, 8.00% | 681,984 | |||||||||
| Total Preferred Stock (cost $2,094,197) | 2,072,720 | ||||||||||
| U.S. Government Agencies - 16.6% | |||||||||||
| Fannie Mae: | |||||||||||
| $ | 13,410,000 | 5.50%, due 3/15/11 | 13,693,770 | ||||||||
| 7,895,000 | 5.25%, due 8/1/12 | 7,933,385 | |||||||||
| 2,775,000 | 5.25%, due 9/15/16 | 2,825,166 | |||||||||
| 1,795,000 | 6.625%, due 11/15/30 | 2,141,970 | |||||||||
| 5,545,000 | Federal Home Loan Bank System 5.625%, due 6/13/16 | 5,706,820 | |||||||||
| Freddie Mac: | |||||||||||
| 2,489,000 | 4.875%, due 2/17/09 | 2,482,354 | |||||||||
| 11,480,000 | 5.25%, due 5/21/09 | 11,548,099 | |||||||||
| 2,260,000 | 5.50%, due 9/15/11 | 2,310,597 | |||||||||
| Total U.S. Government Agencies (cost $48,189,469) | 48,642,161 | ||||||||||
| U.S. Treasury Notes - 9.4% | |||||||||||
| U.S. Treasury Notes: | |||||||||||
| 1,395,000 | 5.125%, due 6/30/08# | 1,399,359 | |||||||||
| 1,650,000 | 4.75%, due 11/15/08# | 1,647,873 | |||||||||
| 3,185,000 | 5.125%, due 6/30/11# | 3,238,747 | |||||||||
| 200,000 | 4.625%, due 10/31/11# | 199,273 | |||||||||
| 1,520,000 | 4.50%, due 11/30/11# | 1,506,463 | |||||||||
| 2,066,000 | 5.125%, due 5/15/16# | 2,128,061 | |||||||||
| 715,000 | 4.625%, due 11/15/16# | 710,308 | |||||||||
| 1,890,000 | 8.875%, due 8/15/17# | 2,528,317 | |||||||||
| 2,505,000 | 8.875%, due 2/15/19# | 3,425,197 | |||||||||
| 2,565,000 | 7.25%, due 8/15/22# | 3,216,872 | |||||||||
| 3,734,000 | 6.25%, due 8/15/23# | 4,297,893 | |||||||||
| 1,144,000 | 5.25%, due 2/15/29# | 1,199,770 | |||||||||
| 1,295,000 | 6.25%, due 5/15/30# | 1,542,669 | |||||||||
| 455,000 | 4.50%, due 2/15/36# | 432,677 | |||||||||
| Total U.S. Treasury Notes (cost $27,657,228) | 27,473,479 | ||||||||||
| Money Markets - 2.8% | |||||||||||
| 1,633,027 | Janus Institutional Cash Reserves Fund, 5.29% | 1,633,027 | |||||||||
| 6,665,000 | Janus Money Market Fund, 5.24% | 6,665,000 | |||||||||
| Total Money Markets (cost $8,298,027) | 8,298,027 | ||||||||||
| Other Securities - 7.5% | |||||||||||
| 21,858,370 | State Street Navigator Securities Lending Prime Portfolio† (cost $21,858,370) | 21,858,370 | |||||||||
| Total Investments (total cost $310,968,987) – 106.3% | 310,814,435 | ||||||||||
| Liabilities, net of Cash, Receivables and Other Assets – (6.3)% | (18,528,275 | ) | |||||||||
| Net Assets – 100% | $ | 292,286,160 | |||||||||
See Notes to Schedules of Investments and Financial Statements.
10 Janus Aspen Series December 31, 2006
Schedule of Investments
As of December 31, 2006
Summary of Investments by Country
| Country | Value | % of Investment Securities | |||||||||
| Belgium | $ | 367,953 | 0.1 | % | |||||||
| Bermuda | 280,500 | 0.1 | % | ||||||||
| Canada | 2,279,440 | 0.7 | % | ||||||||
| Cayman Islands | 2,498,981 | 0.8 | % | ||||||||
| France | 671,133 | 0.2 | % | ||||||||
| India | 1,198,978 | 0.4 | % | ||||||||
| Japan | 1,307,474 | 0.4 | % | ||||||||
| Mexico | 1,204,634 | 0.4 | % | ||||||||
| Qatar | 312,202 | 0.1 | % | ||||||||
| Spain | 458,068 | 0.2 | % | ||||||||
| United Kingdom | 406,747 | 0.1 | % | ||||||||
| United States†† | 299,828,325 | 96.5 | % | ||||||||
| Total | $ | 310,814,435 | 100.0 | % | |||||||
†† Includes Short-Term Securities and Other Securities (86.8% excluding Short-Term Securities and Other Securities)
Forward Currency Contracts, Open
| Currency Sold and Settlement Date | Currency Units Sold | Currency Value in $U.S. | Unrealized Gain/(Loss) | ||||||||||||
| Euro 1/11/07 | 268,000 | $ | 353,991 | $ | (12,291 | ) | |||||||||
See Notes to Schedules of Investments and Financial Statements.
Janus Aspen Series December 31, 2006 11
Statement of Assets and Liabilities
| As of December 31, 2006 (all numbers in thousands except net asset value per share) | Janus Aspen Flexible Bond Portfolio | ||||||
| Assets: | |||||||
| Investments at cost(1) | $ | 310,969 | |||||
| Investments at value(1) | $ | 310,814 | |||||
| Cash denominated in foreign currency (cost $15) | 15 | ||||||
| Receivables: | |||||||
| Investments sold | 1,480 | ||||||
| Portfolio shares sold | 426 | ||||||
| Dividends | 14 | ||||||
| Interest | 2,931 | ||||||
| Other assets | 139 | ||||||
| Total Assets | 315,819 | ||||||
| Liabilities: | |||||||
| Payables: | |||||||
| Due to Custodian | 1,014 | ||||||
| Collateral for securities loaned (Note 1) | 21,858 | ||||||
| Investments purchased | 169 | ||||||
| Portfolio shares repurchased | 282 | ||||||
| Advisory fees | 136 | ||||||
| Transfer agent fees and expenses | 1 | ||||||
| Distribution fees - Service Shares | 6 | ||||||
| Non-interested Trustees' fees and expenses | 3 | ||||||
| Accrued expenses | 52 | ||||||
| Forward currency contracts | 12 | ||||||
| Total Liabilities | 23,533 | ||||||
| Net Assets | $ | 292,286 | |||||
| Net Assets Consist of: | |||||||
| Capital (par value and paid-in-surplus)* | $ | 296,546 | |||||
| Undistributed net investment income/(loss)* | 757 | ||||||
| Undistributed net realized gain/(loss) from investments and foreign currency transactions* | (4,850 | ) | |||||
| Unrealized net appreciation/(depreciation) of investments and foreign currency translations | (167 | ) | |||||
| Total Net Assets | $ | 292,286 | |||||
| Net Assets - Institutional Shares | $ | 264,656 | |||||
| Shares Outstanding, $0.001 Par Value (unlimited shares authorized) | 23,538 | ||||||
| Net Asset Value Per Share | $ | 11.24 | |||||
| Net Assets - Service Shares | $ | 27,630 | |||||
| Shares Outstanding, $0.001 Par Value (unlimited shares authorized) | 2,329 | ||||||
| Net Asset Value Per Share | $ | 11.86 | |||||
*See Note 3 in Notes to Financial Statements.
(1) Investments at cost and value include $21,418,685 of securities loaned for Janus Aspen Flexible Bond Portfolio.
See Notes to Financial Statements.
12 Janus Aspen Series December 31, 2006
Statement of Operations
| For the fiscal year ended December 31, 2006 (all numbers in thousands) | Janus Aspen Flexible Bond Portfolio | ||||||
| Investment Income: | |||||||
| Interest | $ | 15,267 | |||||
| Securities lending income | 68 | ||||||
| Dividends | 166 | ||||||
| Dividends from affiliates | 93 | ||||||
| Total Investment Income | 15,594 | ||||||
| Expenses: | |||||||
| Advisory fees | 1,624 | ||||||
| Transfer agent expenses | 4 | ||||||
| Registration fees | 27 | ||||||
| Custodian fees | 21 | ||||||
| Professional fees | 20 | ||||||
| Non-interested Trustees' fees and expenses | 13 | ||||||
| Printing expenses | 79 | ||||||
| Proxy expense | 51 | ||||||
| Distribution fees - Service Shares | 77 | ||||||
| Other expenses | 62 | ||||||
| Non-recurring costs (Note 2) | – | ||||||
| Costs assumed by Janus Capital Management LLC (Note 2) | – | ||||||
| Total Expenses | 1,978 | ||||||
| Expense and Fee Offset | (2 | ) | |||||
| Net Expenses | 1,976 | ||||||
| Net Investment Income/(Loss) | 13,618 | ||||||
| Net Realized and Unrealized Gain/(Loss) on Investments: | |||||||
| Net realized gain/(loss) from securities transactions | (3,627 | ) | |||||
| Net realized gain/(loss) from foreign currency transactions | 50 | ||||||
| Net realized gain/(loss) from futures contracts | (19 | ) | |||||
| Net realized gain/(loss) from short sales | (2 | ) | |||||
| Change in unrealized net appreciation/(depreciation) of investments and foreign currency translations | 2,168 | ||||||
| Net Gain/(Loss) on Investments | (1,430 | ) | |||||
| Net Increase/(Decrease) in Net Assets Resulting from Operations | $ | 12,188 | |||||
See Notes to Financial Statements.
Janus Aspen Series December 31, 2006 13
Statements of Changes in Net Assets
| For the fiscal years ended December 31 | Janus Aspen Flexible Bond Portfolio | ||||||||||
| (all numbers in thousands) | 2006 | 2005 | |||||||||
| Operations: | |||||||||||
| Net investment income/(loss) | $ | 13,618 | $ | 14,768 | |||||||
| Net realized gain/(loss) from investment and foreign currency transactions | (3,577 | ) | 56 | ||||||||
| Net realized gain/(loss) from futures contracts | (19 | ) | 153 | ||||||||
| Net realized gain/(loss) from short sales | (2 | ) | – | ||||||||
| Change in unrealized net appreciation/(depreciation) of investments and foreign currency translations | 2,168 | (8,676 | ) | ||||||||
| Payment from affiliate (Note 2) | – | 1 | |||||||||
| Net Increase/(Decrease) in Net Assets Resulting from Operations | 12,188 | 6,302 | |||||||||
| Dividends and Distributions to Shareholders: | |||||||||||
| Net investment income* | |||||||||||
| Institutional Shares | (12,918 | ) | (14,320 | ) | |||||||
| Service Shares | (1,216 | ) | (1,528 | ) | |||||||
| Net realized gain from investment transactions* | |||||||||||
| Institutional Shares | (554 | ) | (10,411 | ) | |||||||
| Service Shares | (64 | ) | (1,096 | ) | |||||||
| Net Decrease from Dividends and Distributions | (14,752 | ) | (27,355 | ) | |||||||
| Capital Share Transactions: | |||||||||||
| Shares sold | |||||||||||
| Institutional Shares | 36,889 | 40,020 | |||||||||
| Service Shares | 5,987 | 5,204 | |||||||||
| Reinvested dividends and distributions | |||||||||||
| Institutional Shares | 13,472 | 24,732 | |||||||||
| Service Shares | 1,280 | 2,623 | |||||||||
| Shares repurchased(1) | |||||||||||
| Institutional Shares | (61,602 | ) | (171,955 | ) | |||||||
| Service Shares | (12,409 | ) | (7,727 | ) | |||||||
| Net Increase/(Decrease) from Capital Share Transactions | (16,383 | ) | (107,103 | ) | |||||||
| Net Increase/(Decrease) in Net Assets | (18,947 | ) | (128,156 | ) | |||||||
| Net Assets: | |||||||||||
| Beginning of period | 311,233 | 439,389 | |||||||||
| End of period | $ | 292,286 | $ | 311,233 | |||||||
| Undistributed net investment income/(loss)* | $ | 757 | $ | 1,043 | |||||||
* See Note 3 in Notes to Financial Statements.
(1) During the fiscal year ended December 31, 2005, Janus Aspen Flexible Bond Portfolio disbursed to a redeeming shareholder portfolio securities and cash valued at $83,965,396 on the date of redemption.
See Notes to Financial Statements.
14 Janus Aspen Series December 31, 2006
Financial Highlights
| Institutional Shares | |||||||||||||||||||||||
| For a share outstanding during each fiscal year ended December 31 | |||||||||||||||||||||||
| Janus Aspen Flexible Bond Portfolio | |||||||||||||||||||||||
| 2006 | 2005 | 2004 | 2003 | 2002 | |||||||||||||||||||
| Net Asset Value, Beginning of Period | $ | 11.36 | $ | 12.14 | $ | 12.49 | $ | 12.30 | $ | 11.66 | |||||||||||||
| Income from Investment Operations: | |||||||||||||||||||||||
| Net investment income/(loss) | .54 | .60 | .66 | .63 | .55 | ||||||||||||||||||
| Net gain/(loss) on securities (both realized and unrealized) | (.08 | ) | (.36 | ) | (.18 | ) | .15 | .65 | |||||||||||||||
| Total from Investment Operations | .46 | .24 | .48 | .78 | 1.20 | ||||||||||||||||||
| Less Distributions and Other: | |||||||||||||||||||||||
| Dividends (from net investment income)* | (.56 | ) | (.59 | ) | (.68 | ) | (.59 | ) | (.56 | ) | |||||||||||||
| Distributions (from capital gains)* | (.02 | ) | (.43 | ) | (.15 | ) | – | – | |||||||||||||||
| Payment from affiliate | – | – | (1) | – | (1) | – | – | ||||||||||||||||
| Total Distributions and Other | (.58 | ) | (1.02 | ) | (.83 | ) | (.59 | ) | (.56 | ) | |||||||||||||
| Net Asset Value, End of Period | $ | 11.24 | $ | 11.36 | $ | 12.14 | $ | 12.49 | $ | 12.30 | |||||||||||||
| Total Return | 4.22 | % | 2.00 | %(2) | 3.97 | %(2) | 6.39 | % | 10.48 | % | |||||||||||||
| Net Assets, End of Period (in thousands) | $ | 264,656 | $ | 278,324 | $ | 404,522 | $ | 576,021 | $ | 591,189 | |||||||||||||
| Average Net Assets for the Period (in thousands) | $ | 264,990 | $ | 321,856 | $ | 525,932 | $ | 623,513 | $ | 466,274 | |||||||||||||
| Ratio of Gross Expenses to Average Net Assets(3) | 0.64 | % | 0.57 | % | 0.59 | % | 0.64 | % | 0.66 | % | |||||||||||||
| Ratio of Net Expenses to Average Net Assets(3) | 0.64 | % | 0.57 | % | 0.59 | % | 0.64 | % | 0.66 | % | |||||||||||||
| Ratio of Net Investment Income/(Loss) to Average Net Assets | 4.63 | % | 4.18 | % | 4.28 | % | 4.51 | % | 5.02 | % | |||||||||||||
| Portfolio Turnover Rate | 163 | %(4) | 171 | %(4) | 171 | % | 154 | % | 229 | % | |||||||||||||
| Service Shares | |||||||||||||||||||||||
| For a share outstanding during each fiscal year ended December 31 | |||||||||||||||||||||||
| Janus Aspen Flexible Bond Portfolio | |||||||||||||||||||||||
| 2006 | 2005 | 2004 | 2003 | 2002 | |||||||||||||||||||
| Net Asset Value, Beginning of Period | $ | 11.91 | $ | 12.70 | $ | 13.11 | $ | 12.82 | $ | 11.98 | |||||||||||||
| Income from Investment Operations: | |||||||||||||||||||||||
| Net investment income/(loss) | .51 | .53 | .54 | .53 | .34 | ||||||||||||||||||
| Net gain/(loss) on securities (both realized and unrealized) | (.05 | ) | (.31 | ) | (.07 | ) | .26 | .87 | |||||||||||||||
| Total from Investment Operations | .46 | .22 | .47 | .79 | 1.21 | ||||||||||||||||||
| Less Distributions and Other: | |||||||||||||||||||||||
| Dividends (from net investment income)* | (.49 | ) | (.58 | ) | (.73 | ) | (.50 | ) | (.37 | ) | |||||||||||||
| Distributions (from capital gains)* | (.02 | ) | (.43 | ) | (.15 | ) | – | – | |||||||||||||||
| Payment from affiliate | – | – | (1) | – | (1) | – | – | ||||||||||||||||
| Total Distributions and Other | (.51 | ) | (1.01 | ) | (.88 | ) | (.50 | ) | (.37 | ) | |||||||||||||
| Net Asset Value, End of Period | $ | 11.86 | $ | 11.91 | $ | 12.70 | $ | 13.11 | $ | 12.82 | |||||||||||||
| Total Return | 3.98 | % | 1.76 | %(2) | 3.70 | %(2) | 6.17 | % | 10.16 | % | |||||||||||||
| Net Assets, End of Period (in thousands) | $ | 27,630 | $ | 32,909 | $ | 34,867 | $ | 31,272 | $ | 14,025 | |||||||||||||
| Average Net Assets for the Period (in thousands) | $ | 30,780 | $ | 33,352 | $ | 33,840 | $ | 23,523 | $ | 7,218 | |||||||||||||
| Ratio of Gross Expenses to Average Net Assets(3) | 0.89 | % | 0.83 | % | 0.84 | % | 0.89 | % | 0.91 | % | |||||||||||||
| Ratio of Net Expenses to Average Net Assets(3) | 0.89 | % | 0.82 | % | 0.84 | % | 0.89 | % | 0.91 | % | |||||||||||||
| Ratio of Net Investment Income/(Loss) to Average Net Assets | 4.36 | % | 3.94 | % | 4.03 | % | 4.26 | % | 4.61 | % | |||||||||||||
| Portfolio Turnover Rate | 163 | %(4) | 171 | %(4) | 171 | % | 154 | % | 229 | % | |||||||||||||
* See Note 3 in Notes to Financial Statements.
(1) Payment from affiliate aggregated less than $.01 on a per share basis for fiscal year ended.
(2) During the fiscal year ended, Janus Capital and/or Janus Services LLC fully reimbursed the Portfolio for a loss on a transaction resulting from certain trading, pricing and/or shareholder activity errors, which otherwise would have reduced total return by less than 0.01%
(3) See Note 4 in Notes to Financial Statements.
(4) Excluding mortgage dollar roll transactions. If mortgage dollar roll transactions had been included, the Portfolio turnover rate would have been 165% in 2006 and 177% in 2005.
See Notes to Financial Statements.
Janus Aspen Series December 31, 2006 15
Notes to Schedule of Investments
| Lehman Brothers Aggregate Bond Index | The Lehman Brothers Aggregate Bond Index is made up of the Lehman Brothers Government/Corporate Bond Index, Mortgage-Backed Securities Index and Asset-Based Securities Index, including securities that are of investment grade quality or better, have at least one year to maturity and have an outstanding par value of at least $100 million. | ||||||
| Lipper Variable Annuity Intermediate Investment Grade Debt Funds | Funds that invest at least 65% of their assets in investment grade debt issues (rated in top four grades) with dollar-weighted average maturities of five to ten years. | ||||||
| 144A | Securities sold under Rule 144A of the Securities Act of 1933 are subject to legal and/or contractual restrictions on resale and may not be publicly sold without registration under the 1933 Act. | ||||||
| PLC | Public Limited Company | ||||||
| REIT | Real Estate Investment Trust | ||||||
** A portion of this security has been segregated by the custodian to cover margin or segregation requirements on open futures contracts, forward currency contracts, options contracts, short sales and/or securities with extended settlement dates.
‡ Rate is subject to change. Rate shown reflects rate as of December 31, 2006.
º Security is a defaulted security with accrued interest in the amount of $39,840 that was written-off December 10, 2001.
# Loaned security; a portion or all of the security is on loan at December 31, 2006.
† The security is purchased with the cash collateral received from securities on loan (Note 1).
ºº Schedule of Fair Valued Securities (as of December 31, 2006)
| Value | Value as a % of Net Assets | ||||||||||
| Janus Aspen Flexible Bond Portfolio | |||||||||||
| Candescent Technologies Corp., 8.00% convertible senior subordinated debentures due 5/1/03 (144A) | $ | – | 0.0 | % | |||||||
Securities are valued at "fair value" pursuant to procedures adopted by the Portfolio's Trustees. The Schedule of Fair Valued Securities does not include international activities fair valued pursuant to a systematic fair valuation model.
§Schedule of Restricted and Illiquid Securities (as of December 31, 2006)
| Acquisition Date | Acquisition Cost | Value | Value as % of Net Assets | ||||||||||||||||
| Janus Aspen Flexible Bond Portfolio | |||||||||||||||||||
| Americo Life, Inc., 7.875% notes, due 5/1/13 (144A) | 4/25/03 - 5/21/03 | $ | 508,640 | $ | 501,561 | 0.2 | % | ||||||||||||
| C5 Capital S.P.V., Ltd, 6.196% debentures, due 12/29/49 (144A) | 12/11/06 | 500,000 | 501,089 | 0.2 | % | ||||||||||||||
| C10 Capital S.P.V., Ltd, 6.722% debentures, due 12/29/49 (144A) | 12/11/06 | 700,000 | 703,545 | 0.2 | % | ||||||||||||||
| Candescent Technologies Corp., 8.00% convertible senior subordinated debentures, due 5/1/03 (144A) ºº | 3/6/00 | 85,975 | – | 0.0 | % | ||||||||||||||
| Idearc, Inc., 8.00% senior notes, due 11/15/16 (144A) | 11/1/06 | 320,000 | 324,800 | 0.1 | % | ||||||||||||||
| Liberty Mutual Group, 7.50% bonds, due 8/15/36 (144A) | 8/10/06 - 9/12/06 | 813,206 | 886,199 | 0.3 | % | ||||||||||||||
| Standard Chartered PLC, 6.409% subordinated notes, due 12/29/49 (144A) | 12/1/06 | 410,000 | 406,747 | 0.1 | % | ||||||||||||||
| $ | 3,337,821 | $ | 3,323,941 | 1.1 | % | ||||||||||||||
The Portfolio has registration rights for certain restricted securities held as of December 31, 2006. The issuer incurs all registration costs.
Aggregate collateral segregated to cover margin or segregation requirements on open futures contracts, forward currency contracts, options contracts, short sales and/or securities with extended settlement dates as of December 31, 2006 are noted below.
| Portfolio | Aggregate Value | ||||||
| Janus Aspen Flexible Bond Portfolio | $ | 1,497,154 | |||||
The interest rate for variable rate notes is based upon an index or market interest rates and is subject to change. Rates in the security description are as of December 31, 2006.
16 Janus Aspen Series December 31, 2006
Notes to Financial Statements
The following section describes the organization and significant accounting policies and provides more detailed information about the schedules and tables that appear throughout this report. In addition, the Notes to Financial Statements explain the methods used in preparing and presenting this report.
1. ORGANIZATION AND SIGNIFICANT ACCOUNTING POLICIES
Janus Aspen Flexible Bond Portfolio (the "Portfolio") is a series fund. The Portfolio is part of Janus Aspen Series (the "Trust"), which is organized as a Delaware statutory trust and is registered under the Investment Company Act of 1940 (the "1940 Act") as an open-end management investment company. The Trust offers seventeen Portfolios, which include multiple series of shares, with differing investment objectives and policies. The Portfolio invests primarily in income-producing securities. The Portfolio is classified as diversified, as defined in the 1940 Act. The Portfolio is a no-load investment.
The Portfolio currently offers two classes of shares: Institutional Shares and Service Shares. Institutional Shares are offered only in connection with investment in and payments under variable insurance contracts and to qualified retirement plans. Service Shares are offered only in connection with investment in and payments under variable insurance contracts and to qualified retirement plans that require a fee from Portfolio assets to procure distribution and administrative services to contract owners and plan participants.
The following accounting policies have been consistently followed by the Portfolio and are in conformity with accounting principles generally accepted in the United States of America in the investment company industry.
Investment Valuation
Securities are valued at the last sales price or the official closing price for securities traded on a principal securities exchange (U.S. or foreign) and on the NASDAQ National Market. Securities traded on over-the-counter markets and listed securities for which no sales are reported are valued at the latest bid price (or yield equivalent thereof) obtained from one or more dealers transacting in a market for such securities or by a pricing service approved by the Portfolio's Trustees. Short-term securities with maturities of 60 days or less may be valued at amortized cost, which approximates market value. Debt securities with a remaining maturity of greater than 60 days are valued in accordance with the evaluated bid price supplied by the pricing service. The evaluated bid price supplied by the pricing service is an evaluation that reflects such factors as security prices, yields, maturities and ratings. Foreign securities and currencies ar e converted to U.S. dollars using the applicable exchange rate in effect as of the daily close of the New York Stock Exchange ("NYSE"). When market quotations are not readily available or deemed unreliable, or events or circumstances that may affect the value of portfolio securities held by the Portfolio are identified between the closing of their principal markets and the time the net asset value ("NAV") is determined, securities may be valued at fair value as determined in good faith under procedures established by and under the supervision of the Portfolio's Trustees. The Portfolio may use a systematic fair valuation model provided by an independent third party to value international equity securities in order to adjust for stale pricing, which may occur between the close of certain foreign exchanges and the NYSE.
Investment Transactions and Investment Income
Investment transactions are accounted for as of the date purchased or sold (trade date). Dividend income is recorded on the ex-dividend date. Certain dividends from foreign securities will be recorded as soon as the Trust is informed of the dividend if such information is obtained subsequent to the ex-dividend date and may be subject to withholding taxes in these jurisdictions. Interest income is recorded on the accrual basis and includes amortization of premiums and accretion of discounts. Gains and losses are determined on the identified cost basis, which is the same basis used for federal income tax purposes. Income, as well as gains and losses, both realized and unrealized, are allocated daily to each class of shares based upon the ratio of net assets represented by each class as a percentage of total net assets.
Expenses
The Portfolio bears expenses incurred specifically on its behalf as well as a portion of general expenses. Each class of shares bears expenses incurred specifically on its behalf and, in addition, each class bears a portion of general expenses, which may be based upon relative net assets of each class. Expenses are allocated daily to each class of shares based upon the ratio of net assets represented by each class as a percentage of total net assets. Expenses directly attributable to a specific class of shares are charged against the operations of such class.
Securities Lending
Under procedures adopted by the Trustees, the Portfolio may lend securities to qualified parties (typically brokers or other financial institutions) who need to borrow securities in order to complete certain transactions such as covering short sales, avoiding failures to deliver securities or completing arbitrage activities. The Portfolio may seek to earn additional income through securities lending. There is the risk of delay in recovering a loaned security or the risk of loss in collateral rights if the borrower fails financially. In addition, Janus Capital Management LLC ("Janus Capital") makes efforts to balance the benefits and risks from granting such loans.
The Portfolio does not have the right to vote on securities while they are being lent; however, the Portfolio may attempt to call back the loan and vote the proxy. All loans will be continuously
Janus Aspen Series December 31, 2006 17
Notes to Financial Statements (continued)
secured by collateral which may consist of cash, U.S. Government securities, domestic and foreign short-term debt instruments, letters of credit, money market mutual funds or other money market accounts, or such other collateral permitted by the Securities and Exchange Commission ("SEC"). Cash collateral may be invested in affiliated money market funds or other accounts advised by Janus Capital to the extent consistent with exemptive relief obtained from the SEC or as permitted by the 1940 Act and rules promulgated thereunder. Cash collateral may also be invested in unaffiliated money market funds or other accounts advised by Janus Capital to the extent consistent with exemptive relief obtained from the SEC or as permitted by the 1940 Act and rules promulgated thereunder. Cash collateral may also be invested in unaffiliated money market funds or other accounts.
State Street Bank and Trust Company (the "Lending Agent") may also invest the cash collateral in the State Street Navigator Securities Lending Prime Portfolio or investments in unaffiliated money market funds or accounts, mutually agreed to by the Portfolio and the Lending Agent, that comply with Rule 2a-7 under the 1940 Act relating to money market funds.
As of December 31, 2006, the Portfolio had on loan securities valued as indicated:
| Portfolio | Value at December 31, 2006 | ||||||
| Janus Aspen Flexible Bond Portfolio | $ | 21,418,685 | |||||
As of December 31, 2006, the Portfolio received cash collateral for securities lending activity as indicated:
| Portfolio | Cash Collateral at December 31, 2006 | ||||||
| Janus Aspen Flexible Bond Portfolio | $ | 21,858,370 | |||||
As of December 31, 2006, all cash collateral received by the Portfolio was invested in the State Street Navigator Securities Lending Prime Portfolio.
The value of the collateral must be at least 102% of the market value of the loaned securities that are denominated in U.S. dollars and 105% of the market value of the loaned securities that are not denominated in U.S. dollars. Loaned securities and related collateral are marked-to-market each business day based upon the market value of the respective securities at the close of business, employing the most recent available pricing information. Collateral levels are then adjusted based upon this mark-to-market evaluation.
The borrower pays fees at the Portfolio's direction to its Lending Agent. The Lending Agent may retain a portion of the interest earned. The cash collateral invested by the Lending Agent is disclosed in the Schedule of Investments. The lending fees and the Portfolio's portion of the interest income earned on cash collateral are included on the Statement of Operations (if applicable).
Interfund Lending
Pursuant to an exemptive order received from the SEC, the Portfolio may be party to an interfund lending agreement between the Portfolio and other Janus Capital sponsored mutual funds, which permits it to borrow or lend cash at a rate beneficial to both the borrowing and lending funds. Outstanding borrowings from all sources totaling 10% or more of the borrowing Portfolio's total assets must be collateralized at 102% of the outstanding principal value of the loan; loans of less than 10% may be unsecured. During the fiscal year ended December 31, 2006, there were no outstanding interfund borrowing or lending arrangements for the Portfolio.
Forward Currency Transactions
The Portfolio may enter into forward currency contracts in order to reduce its exposure to changes in foreign currency exchange rates on its foreign portfolio holdings and to lock in the U.S. dollar cost of firm purchase and sale commitments for securities denominated in or exposed to foreign currencies. A forward currency exchange contract is a commitment to purchase or sell a foreign currency at a future date at a negotiated rate. The gain or loss arising from the difference between the U.S. dollar cost of the original contract and the value of the foreign currency in U.S. dollars upon closing a contract is included in "Net realized gain/(loss) from foreign currency transactions" on the Statement of Operations (if applicable).
Forward currency contracts held by the Portfolio are fully collateralized by other securities, which are denoted in the accompanying Schedule of Investments (if applicable). The collateral is evaluated daily to ensure its market value equals or exceeds the current market value of the corresponding forward currency contracts.
Futures Contracts
The Portfolio may enter into futures contracts. The Portfolio intends to use such derivative instruments primarily to hedge or protect from adverse movements in securities prices, currency rates or interest rates. The use of futures contracts may involve risks such as the possibility of illiquid markets or imperfect correlation between the value of the contracts and the underlying securities, or that the counterparty will fail to perform its obligations.
Futures contracts are marked-to-market daily, and the daily variation margin is recorded as a receivable or payable on the Statement of Assets and Liabilities (if applicable). When a contract is closed, a realized gain or loss is recorded on the Statement of Operations equal to the difference between the opening and closing value of the contract. Generally, futures contracts are marked-to-market (i.e., treated as realized and subject to distribution) for federal income tax purposes at fiscal year end. Securities designated as collateral for market value on futures contracts are noted in the Schedule of Investments. Such collateral is in the possession of the
18 Janus Aspen Series December 31, 2006
Portfolio's custodian. As of December 31, 2006, the Portfolio was not invested in futures contracts.
Mortgage Dollar Rolls
The Portfolio may enter into "mortgage dollar rolls." In a "mortgage dollar roll" transaction, the Portfolio sells a mortgage-related security (such as a Government National Mortgage Association ("GNMA") security) to a dealer and simultaneously agrees to repurchase a similar security (but not the same security) in the future at a pre-determined price. The Portfolio will not be entitled to receive interest and principal payments while the dealer holds the security. The difference between the sale price and the future purchase price is recorded as an adjustment to investment income. During the fiscal year ended December 31, 2006, the Portfolio recorded interest income of $10,529 related to such mortgage dollar roll transactions.
The Portfolio's obligations under a dollar roll agreement must be covered by cash, U.S. Government securities or other liquid high-grade debt obligations equal in value to the securities subject to repurchase by the Portfolio, maintained in a segregated account. To the extent that the Portfolio collateralizes its obligations under a dollar roll agreement, the asset coverage requirements of the 1940 Act will not apply to such transactions. Furthermore, under certain circumstances, an underlying mortgage-backed security that is part of a dollar roll transaction may be considered illiquid.
Successful use of mortgage dollar rolls depends on the Portfolio's ability to predict interest rates and mortgage payments. Dollar roll transactions involve the risk that the market value of the securities the Portfolio is required to purchase may decline below the agreed upon repurchase price.
The average balance of mortgage dollar rolls outstanding during the fiscal year ended December 31, 2006 was $751,747 for the Portfolio. At December 31, 2006, the Portfolio was not invested in mortgage dollar rolls.
Securities Traded on a To-Be-Announced Basis
The Portfolio may trade securities on a to-be-announced ("TBA") basis. In a TBA transaction, the Portfolio commits to purchasing or selling securities for which specific information is not yet known at the time of the trade, particularly the face amount and maturity date in GNMA, Federal National Mortgage Association ("FNMA") and/or Federal Home Loan Mortgage Corporation ("FHLMC") transactions. Securities purchased on a TBA basis are not settled until they are delivered to the Portfolio, normally 15 to 45 days later. Beginning on the date the Portfolio enters into a TBA transaction, cash, U.S. Government securities or other liquid high-grade debt obligations are segregated in an amount equal in value to the purchase price of the TBA security. These transactions are subject to market fluctuations and their current value is determined in the same manner as for other securi ties. At December 31, 2006, the Portfolio was not invested in TBA securities.
Bank Loans
The Portfolio may invest in bank loans, which include institutionally-traded floating rate securities generally acquired as an assignment or participation interest in loans originated by a bank or financial institution (the "Lender") that acts as agent for all holders. The agent administers the terms of the loan, as specified in the loan agreement. When investing in a loan participation, the Portfolio has the right to receive payments of principal, interest and any fees to which it is entitled only from the Lender selling the loan agreement and only upon receipt by the Lender of payments from the borrower. The Portfolio generally has no right to enforce compliance with the terms of the loan agreement with the borrower. Assignments and participations involve credit, interest rate, and liquidity risk. Interest rates on floating rate securities adjust with general interest rate changes and/or issuer credit quality. The interest rates paid on a floating rate security in which the Portfolio invests generally are readjusted periodically to an increment over a designated benchmark rate, such as the one-month, three-month, six-month, or one-year London Interbank Offered Rate ("LIBOR").
The Portfolio may have difficulty trading assignments and participations to third parties. There may be restrictions on transfer and only limited opportunities may exist to sell such securities in secondary markets. As a result, the Portfolio may be unable to sell assignments or participations at the desired time or may be able to sell only at a price less than fair market value. The Portfolio utilizes an independent third party to value individual bank loans on a daily basis. The average borrowings outstanding under bank loan arrangements and the related rate range during the fiscal year ended December 31, 2006 are noted in the table below.
| Portfolio | Average Borrowings | Rates | |||||||||
| Janus Aspen Flexible Bond Portfolio | $4,751,187 | 4.92%-9.75% | |||||||||
Short Sales
The Portfolio may engage in "short sales against the box." Short sales against the box involve selling either a security that the Portfolio owns, or a security equivalent in kind and amount to the security sold short that the Portfolio has the right to obtain, for delivery at a specified date in the future. The Portfolio may enter into a short sale against the box to hedge against anticipated declines in the market price of portfolio securities. If the value of the securities sold short increases prior to the scheduled delivery date, the Portfolio loses the opportunity to participate in the gain. As of December 31, 2006, the Portfolio was not invested in short sales.
Janus Aspen Series December 31, 2006 19
Notes to Financial Statements (continued)
Foreign Currency Translations
The Portfolio does not isolate that portion of the results of operations resulting from changes in foreign exchange rates on investments from the fluctuations arising from changes in market prices of securities held at the date of the financial statements. Net unrealized appreciation or depreciation on investments and foreign currency translation arise from changes in the value of assets and liabilities, including investments in securities held at the date of the financial statements, resulting from changes in the exchange rates and changes in market prices of securities held.
Currency gains and losses are also calculated on payables and receivables that are denominated in foreign currencies. The payables and receivables are generally related to security transactions and income.
Foreign currency-denominated assets and forward currency contracts may involve more risks than domestic transactions, including currency risk, political and economic risk, regulatory risk and market risk. Risks may arise from the potential inability of a counterparty to meet the terms of a contract and from unanticipated movements in the value of foreign currencies relative to the U.S. dollar.
When-issued Securities
The Portfolio may purchase or sell securities on a when-issued or forward commitment basis. The price of the underlying securities and date when the securities will be delivered and paid for are fixed at the time the transaction is negotiated. Losses may arise due to changes in the market value of the securities or from the inability of counterparties to meet the terms of the contract. In connection with such purchases, the Portfolio may hold liquid assets as collateral with the Portfolio's custodian sufficient to cover the purchase price. As of December 31, 2006, the Portfolio was not invested in when-issued securities.
Equity-Linked Structured Notes
The Portfolio may invest in equity-linked structured notes. Equity-linked structured notes are derivative securities which are specially designed to combine the characteristics of one or more underlying securities and their equity derivatives in a single note form. The return and/or yield or income component may be based on the performance of the underlying equity securities, an equity index, and/or option positions. Equity-linked structured notes are typically offered in limited transactions by financial institutions in either registered or nonregistered form. An investment in equity-linked structured notes creates exposure to the credit risk of the issuing financial institution, as well as to the market risk of the underlying securities. There is no guaranteed return of principal with these securities and the appreciation potential of these securities may be limited by a maximum payment or call right. In certain cases, equity-linked struct ured notes may be more volatile and less liquid than less complex securities or other types of fixed-income securities. Such securities may exhibit price behavior that does not correlate with other fixed-income securities. As of December 31, 2006, the Portfolio was not invested in equity-linked structured notes.
Initial Public Offerings
The Portfolio may invest in initial public offerings ("IPOs"). IPOs and other investment techniques may have a magnified performance impact on a fund with a small asset base. The Portfolio may not experience similar performance as its assets grow.
Additional Investment Risk
The Portfolio may be invested in lower-rated debt securities that have a higher risk of default or loss of value since these securities may be sensitive to economic changes, political changes or adverse developments specific to the issuer.
Restricted Security Transactions
Restricted securities held by the Portfolio may not be sold except in exempt transactions or in a public offering registered under the Securities Act of 1933. The risk of investing in such securities is generally greater than the risk of investing in the securities of widely held, publicly traded companies. Lack of a secondary market and resale restrictions may result in the inability of the Portfolio to sell a security at a fair price and may substantially delay the sale of the security. In addition, these securities may exhibit greater price volatility than securities for which secondary markets exist.
Dividend Distributions
The Portfolio generally makes semiannual distributions of substantially all of its investment income and an annual distribution of its net realized capital gains (if any). The majority of dividends and net realized capital gains distributions from the Portfolio may be automatically reinvested into additional shares of the Portfolio, based upon the discretion of the shareholder.
Estimates
The preparation of financial statements in conformity with accounting principles generally accepted in the United States of America requires management to make estimates and assumptions that affect the reported amount of assets and liabilities and disclosure of contingent assets and liabilities at the date of the financial statements and the reported amounts of income and expenses during the reporting period. Actual results could differ from those estimates.
Federal Income Taxes
No provision for income taxes is included in the accompanying financial statements, as the Portfolio intends to distribute to shareholders all taxable investment income and realized gains
20 Janus Aspen Series December 31, 2006
and otherwise comply with Subchapter M of the Internal Revenue Code applicable to regulated investment companies.
New Accounting Pronouncements
In July 2006, the Financial Accounting Standards Board ("FASB") issued Interpretation No. 48, "Accounting for Uncertainty in Income Taxes – an Interpretation of FASB Statement No. 109" (the "Interpretation"). The Interpretation establishes for all entities, including pass-through entities such as the Portfolio, a minimum threshold for financial statement recognition of the benefit of positions taken in filing tax returns (including whether an entity is taxable in a particular jurisdiction), and requires certain expanded tax disclosures. A calendar year open-end or closed-end fund would implement the Interpretation no later than June 29, 2007 (the last business day of the semi-annual reporting period), and will also apply to all open tax years as of the date of effectiveness. Management has recently begun to evaluate the application of the Interpretation to the Portfolio, and is not in a position at this time to estimate the significanc e of its impact, if any, on the Portfolio's financial statements.
In September 2006, the FASB issued Statement of Financial Accounting Standards No. 157, "Fair Value Measurements" ("SFAS No. 157"), which defines fair value, establishes a framework for measuring fair value in generally accepted accounting principles, and expands disclosures about fair value measurements. SFAS No. 157 does not require new fair value measurements, but is applied to the extent that other accounting pronouncements require or permit fair value measurements. SFAS No. 157 emphasizes that fair value is a market-based measurement that should be determined based on the assumptions that market participants would use in pricing an asset or liability. Companies will be required to disclose the extent to which fair value is used to measure assets and liabilities, the inputs used to develop the measurements, and the effect for fiscal years beginning after November 15, 2007. Management is currently evaluating the potential impact the adopt ion of SFAS No. 157 will have on the Portfolio's financial condition and results of operations.
2. INVESTMENT ADVISORY AGREEMENTS AND OTHER TRANSACTIONS WITH AFFILIATES
The Portfolio pays a monthly advisory fee to Janus Capital based upon rates of 0.55% of the first $300 million of average daily net assets plus 0.45% of average daily nets assets in excess of $300 million.
Janus Capital has agreed until at least May 1, 2008 to reimburse the Portfolio by the amount, if any, that the normal operating expenses in any fiscal year, including the investment advisory fee but excluding the distribution and shareholder servicing (12b-1) fees applicable to Service Shares, brokerage commissions, interest, taxes and extraordinary expenses, exceed an annual rate of 0.90% of the average daily net assets of the Portfolio. The Portfolio is not required to repay any such waived fees in future years to Janus Capital.
Janus Services LLC ("Janus Services"), a wholly-owned subsidiary of Janus Capital, is the Portfolio's transfer agent. Janus Services receives certain out-of-pocket expenses for transfer agent services.
Certain officers of the Portfolio may also be officers and/or directors of Janus Capital. Such officers receive no compensation from the Portfolio, except for the Portfolio's Chief Compliance Officer. Effective January 1, 2006, the Portfolio began reimbursing the adviser for a portion of the compensation paid to the Chief Compliance Officer of the Trust. Total compensation of $489 was paid by the Portfolio during the fiscal year ended December 31, 2006. The Portfolio's portion is reported as part of "Other Expenses" on the Statement of Operations.
During the fiscal year ended December 31, 2005, Janus Capital reimbursed the Portfolio $779 for Institutional Shares and $86 for Service Shares as a result of dilutions caused by certain trading and/or pricing errors. Reimbursements are included in "Payment from affiliate" on the Statements of Changes in Net Assets.
The Board of Trustees has adopted a deferred compensation plan (the "Deferred Plan") for independent Trustees to elect to defer receipt of all or a portion of the annual compensation they are entitled to receive from the Portfolio. All deferred fees are credited to an account established in the name of the Trustees. The amounts credited to the account then increase or decrease, as the case may be, in accordance with the performance of one or more of the Janus funds that are selected by the Trustees. The account balance continues to fluctuate in accordance with the performance of the selected fund or funds until final payment of all amounts credited to the account. Trustees are allowed to change their designation of mutual funds from time to time. Amounts will be deferred until distributed in accordance to the Deferred Plan. No deferred fees were paid to any Trustee under the Deferred Plan during the fiscal year ended December 31, 2006.
For the fiscal year ended December 31, 2006, Janus Capital assumed $21,288 of legal, consulting and Trustee costs and fees incurred by the funds in Janus Investment Fund, Janus Aspen Series and Janus Adviser Series (the "Funds") in connection with the regulatory and civil litigation matters discussed in Note 7. These non-recurring costs were allocated to all Funds based upon the Funds' respective net assets as of July 31, 2004. Additionally, all future non-recurring costs will be allocated based upon the Funds' respective net assets on July 31, 2004. These non-recurring costs and costs assumed by Janus Capital are shown on the Statement of Operations.
Janus Aspen Series December 31, 2006 21
Notes to Financial Statements (continued)
Janus Distributors LLC, a wholly-owned subsidiary of Janus Capital, is a distributor of the Portfolio. Service Shares have adopted a Distribution and Shareholder Servicing Plan (the "Plan") pursuant to Rule 12b-1 under The 1940 Act. The Plan authorizes payments by the Portfolio in connection with the distribution of Service Shares at an annual rate of up to 0.25% of Service Shares' average daily net assets.
The Portfolio's expenses may be reduced by expense offsets from an unaffiliated custodian and/or transfer agent. Such credits or offsets are included in Expense and Fee Offset on the Statement of Operations. The transfer agent fee offsets received during the period reduce Transfer Agent Fees and Expenses. Custodian offsets received reduce Custodian Fees. The Portfolio could have employed the assets used by the custodian and/or transfer agent to produce income if it had not entered into an expense offset arrangement.
The Portfolio may invest in money market funds, including funds managed by Janus Capital. During the fiscal year ended December 31, 2006, the Portfolio recorded distributions from affiliated investment companies as affiliated dividend income, and had the following affiliated purchases and sales:
| Purchases Shares/Cost | Sales Shares/Cost | Dividend Income | Value at 12/31/06 | ||||||||||||||||
| Janus Aspen Flexible Bond Portfolio | |||||||||||||||||||
| Janus Government Money Market Fund | $ | 2,390,652 | $ | 2,390,652 | $ | 2,470 | $ | – | |||||||||||
| Janus Institutional Cash Reserves Fund | 40,206,224 | 38,573,197 | 42,175 | 1,633,027 | |||||||||||||||
| Janus Money Market Fund | 36,405,679 | 29,740,679 | 48,531 | 6,665,000 | |||||||||||||||
| $ | 79,002,555 | $ | 70,704,528 | $ | 93,176 | $ | 8,298,027 | ||||||||||||
3. FEDERAL INCOME TAX
The tax components of capital shown in the table below represent: (1) distribution requirements the Portfolio must satisfy under the income tax regulations; (2) losses or deductions the Portfolio may be able to offset against income and gains realized in future years; and (3) unrealized appreciation or depreciation of investments for federal income tax purposes.
Other book to tax differences in the current year primarily consist of foreign currency contract adjustments. The Portfolio has elected to treat gains and losses on forward foreign currency contracts as capital gains and losses. Other foreign currency gains and losses on debt instruments are treated as ordinary income for federal income tax purposes pursuant to Section 988 of the Internal Revenue Code.
| Portfolio | Undistributed Ordinary Income | Undistributed Long–Term Gains | Accumulated Capital Losses | Post-October Deferral | Other Book to Tax Differences | Net Tax Appreciation/ (Depreciation) | |||||||||||||||||||||
| Janus Aspen Flexible Bond Portfolio | $ | 756,534 | $ | – | $ | (4,575,184 | ) | $ | – | $ | 498 | $ | (441,707 | ) | |||||||||||||
The table below shows the expiration dates of the carryovers.
| Capital Loss Carryover Expiration Schedule For the year ended December 31, 2006 | |||
| Portfolio | December 31, 2014 | ||||||
| Janus Aspen Flexible Bond Portfolio | $ | (4,575,184 | ) | ||||
The aggregate cost of investments and the composition of unrealized appreciation and depreciation of investment securities for federal income tax purposes as of December 31, 2006 are noted below.
Unrealized appreciation and unrealized depreciation in the table below exclude appreciation/depreciation on foreign currency translations. The primary difference between book and tax appreciation or depreciation of investments is wash sale loss deferrals.
| Portfolio | Federal Tax Cost | Unrealized Appreciation | Unrealized (Depreciation) | ||||||||||||
| Janus Aspen Flexible Bond Portfolio | $ | 311,256,142 | $ | 2,309,919 | $ | (2,751,626 | ) | ||||||||
22 Janus Aspen Series December 31, 2006
Income and capital gains distributions are determined in accordance with income tax regulations that may differ from accounting principles generally accepted in the United States of America. These differences are due to differing treatments for items such as net short-term gains, deferral of wash sale losses, foreign currency transactions, net investment losses and capital loss carryovers. Certain permanent differences such as tax returns of capital and net investment losses noted below have been reclassified to paid-in capital.
| For the fiscal year ended December 31, 2006 | Distributions | ||||||||||||||||||
| Portfolio | From Ordinary Income | From Long-Term Capital Gains | Tax Return of Capital | Net Investment Loss | |||||||||||||||
| Janus Aspen Flexible Bond Portfolio | $ | 14,133,909 | $ | 617,929 | $ | – | $ | – | |||||||||||
| For the fiscal year ended December 31, 2005 | Distributions | ||||||||||||||||||
| Portfolio | From Ordinary Income | From Long-Term Capital Gains | Tax Return of Capital | Net Investment Loss | |||||||||||||||
| Janus Aspen Flexible Bond Portfolio | $ | 17,481,278 | $ | 9,873,272 | $ | – | $ | – | |||||||||||
4. EXPENSE RATIOS
The expense ratios listed in the Financial Highlights reflect expenses prior to any expense offsets (gross expense ratio) and after expense offsets (net expense ratio). Both expense ratios reflect expenses after waivers (reimbursement). Listed below are the gross expense ratios for the Portfolio that would be in effect, absent the waiver of certain fees and offsets.
| For each fiscal year ended December 31 | Institutional Shares | Service Shares | |||||||||||||||||||||||||||||||||||||||||
| Portfolio | 2006(1) | 2005(1) | 2004(1) | 2003 | 2002 | 2006(1) | 2005(1) | 2004(1) | 2003 | 2002 | |||||||||||||||||||||||||||||||||
| Janus Aspen Flexible Bond Portfolio | 0.64 | % | 0.57 | % | 0.59 | % | 0.64 | % | 0.66 | % | 0.89 | % | 0.83 | % | 0.84 | % | 0.89 | % | 0.91 | % | |||||||||||||||||||||||
(1) The effect of non-recurring costs assumed by Janus Capital (Note 2) is included in the ratio of operating expenses to average net assets without waivers and/or expense reimbursements and was less than 0.01%.
5. CAPITAL SHARE TRANSACTIONS
| For the fiscal year ended December 31 | Janus Aspen Flexible Bond Portfolio | ||||||||||
| (all numbers are in thousands) | 2006 | 2005 | |||||||||
| Transactions in Portfolio Shares – Institutional Shares | |||||||||||
| Shares sold | 3,266 | 3,357 | |||||||||
| Reinvested dividends and distributions | 1,216 | 2,144 | |||||||||
| Shares repurchased | (5,450 | ) | (14,317 | ) | |||||||
| Net Increase/(Decrease) in Portfolio Shares | (968 | ) | (8,816 | ) | |||||||
| Shares Outstanding, Beginning of Period | 24,506 | 33,322 | |||||||||
| Shares Outstanding, End of Period | 23,538 | 24,506 | |||||||||
| Transactions in Portfolio Shares – Service Shares | |||||||||||
| Shares sold | 504 | 419 | |||||||||
| Reinvested dividends and distributions | 110 | 217 | |||||||||
| Shares repurchased | (1,048 | ) | (618 | ) | |||||||
| Net Increase/(Decrease) in Portfolio Shares | (434 | ) | 18 | ||||||||
| Shares Outstanding, Beginning of Period | 2,763 | 2,745 | |||||||||
| Shares Outstanding, End of Period | 2,329 | 2,763 | |||||||||
6. PURCHASES AND SALES OF INVESTMENT SECURITIES
For the fiscal year ended December 31, 2006, the aggregate cost of purchases and proceeds from sales of investment securities (excluding short-term securities and mortgage dollar rolls) were as follows:
| Portfolio | Purchases of Securities | Proceeds from Sales of Securities | Purchases of Long- Term U.S. Government Obligations | Proceeds from Sales of Long-Term U.S. Government Obligations | |||||||||||||||
| Janus Aspen Flexible Bond Portfolio | $ | 169,447,138 | $ | 179,533,435 | $ | 303,083,150 | $ | 301,048,354 | |||||||||||
Janus Aspen Series December 31, 2006 23
Notes to Financial Statements (continued)
7. PENDING LEGAL MATTERS
In the fall of 2003, the Securities and Exchange Commission ("SEC"), the Office of the New York State Attorney General ("NYAG"), the Colorado Attorney General ("COAG"), and the Colorado Division of Securities ("CDS") announced that they were investigating alleged frequent trading practices in the mutual fund industry. On August 18, 2004, Janus Capital announced that it had reached final settlements with the SEC, the NYAG, the COAG, and the CDS related to such regulators' investigations into Janus Capital's frequent trading arrangements.
A number of civil lawsuits were brought against Janus Capital and certain of its affiliates, the Janus funds, and related entities and individuals based on allegations similar to those announced by the above regulators and were filed in several state and federal jurisdictions. Such lawsuits alleged a variety of theories for recovery including, but not limited to, the federal securities laws, other federal statutes (including ERISA), and various common law doctrines. The Judicial Panel on Multidistrict Litigation transferred these actions to the U.S. District Court for the District of Maryland (the "Court") for coordinated proceedings. On September 29, 2004, five consolidated amended complaints were filed with the Court that generally include: (i) claims by a putative class of investors in certain Janus funds asserting claims on behalf of the investor class ( Marini, et al. v. Janus Investment Fund, et al., U.S. District Court, District of Maryland, Case No. 04-CV-00497); (ii) derivative claims by investors in certain Janus funds ostensibly on behalf of such funds (Steinberg et al. v. Janus Capital Management, LLC et al., U.S. District Court, District of Maryland, Case No. 04-CV-00518); (iii) claims on behalf of participants in the Janus 401(k) plan (Wangberger v. Janus Capital Group Inc., 401(k) Advisory Committee, et al., U.S. District Court, District of Maryland, Case No. JFM-05-2711); (iv) claims brought on behalf of shareholders of Janus Capital Group Inc. ("JCGI") on a derivative basis against the Board of Directors of JCGI (Chasen v. Whiston, et al., U.S. District Court, District of Maryland, Case No. 04-MD-00855); and (v) claims by a putative class of shareholders of JCGI asserting claims on behalf of the shareholders (Wiggins, et al. v. J anus Capital Group, Inc., et al., U.S. District Court, District of Maryland, Case No. 04-CV-00818). In addition, the following were also named as defendants in one or more of the actions: Janus Investment Fund ("JIF"), Janus Aspen Series ("JAS"), Janus Adviser Series ("JAD"), Janus Distributors LLC, Enhanced Investment Technologies, LLC ("INTECH"), Bay Isle Financial LLC ("Bay Isle"), Perkins, Wolf, McDonnell and Company, LLC ("Perkins"), the Advisory Committee of the Janus 401(k) plan, and the current or former directors of JCGI.
On August 25, 2005, the Court entered orders dismissing most of the claims asserted against Janus Capital and its affiliates by fund investors (actions (i) and (ii) described above), except certain claims under Section 10(b) of the Securities Exchange Act of 1934 and under Section 36(b) of the Investment Company Act of 1940, as amended (the "1940 Act"). On August 15, 2006, the complaint in the 401(k) plan class action (action (iii) described above) was dismissed by the district court with prejudice; the plaintiff has appealed that dismissal decision to the United States Court of Appeals for the Fourth Circuit. The Court also dismissed the action against JCGI's Board of Directors without leave to amend (action (iv) described above). Finally, a Motion to Dismiss the action brought by JCGI shareholders (action (v) described above) is fully briefed and pending before the Court.
In addition to the lawsuits described above, the Auditor of the State of West Virginia ("Auditor"), in his capacity as securities commissioner, has initiated administrative proceedings against many of the defendants in the market timing cases (including JCGI and Janus Capital) and, as a part of its relief, is seeking disgorgement and other monetary relief based on similar market timing allegations (In the Matter of Janus Capital Group Inc. et al., Before the Securities Commissioner, State of West Virginia, Summary Order No. 05-1320). The respondents in these proceedings collectively sought a Writ of Prohibition in state court, which was denied. Their subsequent Petition for Appeal was also denied. Consequently, in September 2006, JCGI and Janus Capital filed their answer t o the Auditor's summary order instituting proceedings and requested a hearing. JCGI and Janus Capital, as well as other similarly situated defendants, continue to challenge the statutory authority of the Auditor to bring such an action. No further proceedings are currently scheduled.
In addition to the "market timing" actions described above, Janus Capital is a defendant in a consolidated lawsuit in the U.S. District Court for the District of Colorado challenging the investment advisory fees charged by Janus Capital to certain Janus funds (Walter Sins, et al. v. Janus Capital Management LLC, U.S. District Court, District of Colorado, Case No. 04-CV-01647-WDM-MEH; Michael Fleisher, et al. v. Janus Capital Management, LLC, 04-CV-02395-MSK-CBS). The action was filed in 2004 by fund investors asserting breach of fiduciary duty under Section 36(b) of the 1940 Act. The plaintiffs seek declaratory and injunctive relief and an unspecified amount of damages. The trial is scheduled to commence on May 21, 2007.
In 2001, Janus Capital's predecessor was also named as a defendant in a class action suit in the U.S. District Court for the
24 Janus Aspen Series December 31, 2006
Southern District of New York, alleging that certain underwriting firms and institutional investors violated antitrust laws in connection with initial public offerings (Pfeiffer v. Credit Suisse First Boston aka In re Initial Public Offering Antitrust Litigation, U.S. District Court, Southern District of New York, Case No. 01-CV-2014). The U.S. District Court dismissed the plaintiff's antitrust claims in November 2003; however, the U.S. Court of Appeals vacated that decision and remanded it for further proceedings. In March 2006, the defendants, including Janus Capital, filed a Petition for a Writ of Certiorari with the U.S. Supreme Court to review the decision of the U.S. Court of Appeals. In June 2006, the U.S. Supreme Court invited the U.S. Solicitor General to file a brief expressing the v iew of the United States, and in November 2006, the Solicitor General filed a brief expressing its view on the matter. The U.S. Supreme Court has granted the Petition for a Writ of Certiorari and the parties are in the process of briefing the matter for the U.S. Supreme Court.
Additional lawsuits may be filed against certain of the Janus funds, Janus Capital, and related parties in the future. Janus Capital does not currently believe that these pending actions will materially affect its ability to continue providing services it has agreed to provide to the Janus funds.
Janus Aspen Series December 31, 2006 25
Report of Independent Registered Public Accounting Firm
To the Trustees and Shareholders
of Janus Aspen Flexible Bond Portfolio
In our opinion, the accompanying statement of assets and liabilities, including the schedule of investments, and the related statements of operations and of changes in net assets and the financial highlights present fairly, in all material respects, the financial position of Janus Aspen Flexible Bond Portfolio (one of the portfolios constituting Janus Aspen Series, hereafter referred to as the "Portfolio") at December 31, 2006, the results of its operations for the year then ended, the changes in its net assets for each of the two years in the period then ended, and the financial highlights for each of the five years in the period then ended, in conformity with accounting principles generally accepted in the United States of America. These financial statements and financial highlights (hereafter referred to as "financial statements") are the responsibility of the Portfolio's management; our responsibility is to express an opinion on these fi nancial statements based on our audits. We conducted our audits of these financial statements in accordance with the standards of the Public Company Accounting Oversight Board (United States). Those standards require that we plan and perform the audit to obtain reasonable assurance about whether the financial statements are free of material misstatement. An audit includes examining, on a test basis, evidence supporting the amounts and disclosures in the financial statements, assessing the accounting principles used and significant estimates made by management, and evaluating the overall financial statement presentation. We believe that our audits, which included confirmation of securities at December 31, 2006 by correspondence with the custodian, transfer agent and brokers, and the application of alternative auditing procedures where securities purchased had not been received, provide a reasonable basis for our opinion.

PricewaterhouseCoopers LLP
Denver, Colorado
February 12, 2007
26 Janus Aspen Series December 31, 2006
Additional Information (unaudited)
PROXY VOTING POLICIES AND VOTING RECORD
A description of the policies and procedures that the Portfolio uses to determine how to vote proxies relating to its portfolio securities is available: (i) without charge, upon request, by calling 1-800-525-0020 (toll free); (ii) on the Portfolio's website at www.janus.com/proxyvoting; and (iii) on the SEC's website at http://www.sec.gov. Additionally, information regarding the Portfolio's proxy voting record for the most recent twelve- month period ended June 30 is also available, free of charge, through www.janus.com/proxyvoting and from the SEC's website at http://www.sec.gov.
QUARTERLY PORTFOLIO HOLDINGS
The Portfolio files its complete portfolio holdings (schedule of investments) with the SEC for the first and third quarters of each fiscal year on Form N-Q within 60 days of the end of such fiscal quarter. The Portfolio's Form N-Q: (i) is available on the SEC's website at http://www.sec.gov; (ii) may be reviewed and copied at the SEC's Public Reference Room in Washington, D.C. (information on the Public Reference Room may be obtained by calling 1-800-SEC-0330); and (iii) is available without charge, upon request, by calling Janus at 1-800-525-0020 (toll free).
APPROVAL OF ADVISORY AGREEMENTS DURING THE PERIOD
The Trustees of Janus Aspen Series, more than eighty-five percent of whom have never been affiliated with the Adviser ("Independent Trustees"), oversee the management of each of the Portfolios and, as required by law, determine annually whether to continue the investment advisory agreement for each Portfolio and the subadvisory agreements for the three Portfolios that utilize subadvisers.
In connection with their most recent consideration of those agreements for each of the Portfolios, the Trustees received and reviewed a substantial amount of information provided by Janus Capital (the "Adviser") and the respective subadvisers in response to requests of the Independent Trustees and their independent legal counsel. They also received and reviewed a considerable amount of information and analysis provided to the Trustees by their independent fee consultant. Throughout their consideration of the agreements the Independent Trustees were advised by their independent legal counsel. The Independent Trustees met on two separate occasions with management to consider the agreements, and at each of those meetings they also met separately in executive session with their independent legal counsel.
At a meeting held on December 20, 2006, based on their evaluation of the information provided by the Adviser, the subadvisers and the independent fee consultant and other information, the Trustees determined that the overall arrangements between each Portfolio and the Adviser were fair and reasonable in light of the nature, extent and quality of the services provided by the Adviser, its affiliates and the subadvisers, the fees charged for those services, and other matters that the Trustees considered relevant in the exercise of their business judgment. At that meeting all of the Trustees unanimously approved the continuation of the investment advisory agreement for each Portfolio, and the subadvisory agreement for each subadvised Portfolio, for the period from February 1, 2007 through February 1, 2008, subject to earlier termination as provided in each agreement.
In considering the continuation of those agreements, the Trustees reviewed and analyzed various factors that they determined were relevant, including the factors described below, none of which by itself was considered dispositive. However, the material factors and conclusions that formed basis for the Trustees' determination to approve the continuation of the agreements are discussed separately below.
Nature, Extent and Quality of Services
The Trustees reviewed the nature, extent and quality of the services of Janus Capital and the subadvisers to the Funds, taking into account the investment objective and strategy of each Portfolio and the knowledge the Trustees gained from their regular meetings with management on at least a quarterly basis and their ongoing review of information related to the Funds. In addition, the Trustees reviewed the resources and key personnel of Janus Capital and each subadviser, especially those who provide investment management services to the Portfolios. The Trustees also considered other services provided to the Portfolios by Janus Capital or the subadvisers, such as managing the execution of portfolio transactions and the selection of broker-dealers for those transactions, serving as the Portfolios' administrator, monitoring adherence to the Portfolios' investment restrictions, producing shareholder reports, providing support services for the Tru stees and Trustee committees, communicating with shareholders and overseeing the activities of other service providers, including monitoring compliance with various policies and procedures of the Portfolios and with applicable securities laws and regulations.
The Trustees concluded that: the nature, extent and quality of the services provided by Janus Capital or the subadviser to each Portfolio were appropriate and consistent with the terms of the respective advisory and subadvisory agreements; that, taking into account steps taken to address a small portion of the Portfolios whose performance lagged that of their peers for certain periods, the quality of those services had been consistent with or superior to quality norms in the industry; and that the Portfolios were likely to benefit from the continued provision of those services. They also concluded that each of Janus Capital and each subadviser had sufficient
Janus Aspen Series December 31, 2006 27
Additional Information (unaudited) (continued)
personnel, with the appropriate education and experience, to serve the Portfolios effectively and had demonstrated its continuing ability to attract and retain well-qualified personnel.
Performance of the Funds
The Trustees considered the performance results of each Portfolio over various time periods. They reviewed information comparing each Portfolio's performance with the performance of comparable funds and peer groups identified by Lipper Inc., an independent provider of investment company data, and with the Portfolio's benchmark. They concluded that the performance of most Portfolios was good to very good. Although the performance of some Portfolios lagged that of their peers for certain periods, the Trustees also concluded that Janus Capital had taken appropriate steps to address those instances of under-performance and that the more recent performance of most of those Portfolios had been improving.
Costs of Services Provided
The Trustees examined information on the fees and expenses of each Portfolio in comparison to similar information for other comparable funds as provided by Lipper. They also reviewed an analysis of that information provided by their independent fee consultant and noted that the rate of management (investment advisory and administrative) fees for most of the Portfolios, after contractual expense limitations, was below the mean management fee rate of the respective peer group of funds selected by Lipper.
The Trustees considered the methodology used by Janus Capital and each subadviser in determining compensation payable to portfolio managers, the competitive environment for investment management talent and the competitive market for mutual funds in different distribution channels. They concluded that the compensation methodology provided a good alignment of the interests of the portfolio managers with the interests of Portfolio shareholders.
The Trustees also reviewed management fees charged by Janus Capital to its separate account clients and to its subadvised funds (for which Janus Capital provides only portfolio management services). Although in most instances subadvisory and separate account fee rates for various investment strategies were lower than management fees for Portfolios having a similar strategy, the Trustees noted that Janus Capital performs significant additional services for the Portfolios that it does not provide to those other clients, including administrative services, oversight of the Portfolios' other service providers, trustee support, regulatory compliance and numerous other services, and that, in serving the Portfolios, Janus Capital assumes many legal risks that it does not assume in servicing its other clients. Moreover, they noted that the spread between the average fees charged to the Portfolios and the fees that Janus Capital charged to its separate account clients was significantly smaller than the average spread for such fees of other advisers, based on publicly available data and research conducted by their independent fee consultant.
In considering the fees charged by Janus Capital, the Trustees had previously negotiated with Janus Capital a temporary contingent waiver of a portion the investment advisory fee paid by Janus Aspen Worldwide Growth Portfolio to Janus Capital to provide for a possible reduction in the rate of advisory fee payable by the Portfolio for the period July 1, 2006 through January 31, 2007 if the investment performance of the Fund should lag that of its benchmark performance over the applicable performance measurement period. Commencing in February 2007, the previously approved performance-based fee schedule will become operative.
The Trustees reviewed information on the profitability of Janus Capital and its affiliates of their relationships with each Portfolio, as well as an explanation of the methodology utilized in allocating various expenses among the Portfolios and other clients. The Trustees also reviewed the financial statements of Janus Capital's parent company and its corporate structure. In their review, the Trustees considered whether Janus Capital and each subadviser receive adequate incentives to manage the Portfolios effectively. The Trustees recognized that profitability comparisons among fund managers are difficult because very little comparative information is publicly available and profitability of any manager is affected by numerous factors, including the organizational structure of the particular manager, the types of funds and other accounts it manages, possible other lines of business, the methodology for allocating expenses and the manager's ca pital structure and cost of capital. However, based on the information available and taking those factors into account, the Trustees concluded that Janus Capital's profitability with respect to each Portfolio in relation to the services rendered was not unreasonable.
The Trustees concluded that the management fees and other compensation payable by each Fund to Janus Capital and its affiliates, as well as the fees paid by Janus Capital to the subadvisers of subadvised Portfolios, were reasonable in relation to the nature and quality of the services provided, taking into account the fees charged by other advisers for managing comparable mutual funds with similar strategies and the fees Janus Capital and the subadviser charges to other clients. The Trustees also concluded that the overall expense ratio of each Portfolio was reasonable, taking into account the size of the Portfolio, the quality of services provided by Janus Capital and any subadviser, the investment performance of the Portfolio and any expense limitations agreed to by Janus Capital.
28 Janus Aspen Series December 31, 2006
Economies of Scale
The Trustees considered information about the potential for Janus Capital to realize economies of scale as the assets of the Portfolios increase. They noted that, although most Portfolios pay advisory fees at a fixed rate as a percentage of net assets, without any breakpoints, the management fee paid by each Portfolio, after any contractual expense limitations, was below the mean management fee rate of the Portfolio's peer group selected by Lipper; and, for those Portfolios whose expenses are being reduced by the contractual expense limitations of Janus Capital, Janus Capital is subsidizing the Portfolios because they have not reached adequate scale. Moreover, as the assets of many of the Portfolios have declined in the past few years, the Portfolios have benefited from having advisory fee rates that have remained constant rather than increasing as assets decline. In addition, performance fee structures have been implemented for several Port folios that will cause the effective rate of advisory fees payable by such a Portfolio to vary depending on the investment performance of the Portfolio relative to its benchmark; and a few Portfolios have fee schedules with breakpoints and reduced fee rates above certain asset levels. The Trustees also noted that the Portfolios share directly in economies of scale through lower charges of third-party service providers based on the combined scale of all of the Portfolios. Based on all of the information they reviewed, the Trustees concluded that the current fee structure of each Portfolio was reasonable and that the current rates of fees do reflect a sharing between Janus Capital and the Portfolio of economies of scale at the current asset level of the Portfolio.
Other Benefits to Janus Capital
The Trustees also considered benefits that accrue to Janus Capital and its affiliates from their relationships with the Portfolios. They recognized that two affiliates of Janus Capital separately serve the Portfolios as transfer agent and distributor, respectively, and that the transfer agent receives compensation from the non-money market Portfolios for services provided. The Trustees also considered Janus Capital's use of commissions paid by Portfolios on their portfolio brokerage transactions to obtain proprietary research products and services benefiting the Portfolios and/or other clients of Janus Capital, as well as Janus Capital's agreement not to use any Portfolio's brokerage transactions to obtain third party research products or services. The Trustees concluded that Janus Capital's use of "soft" commission dollars to obtain proprietary research products and services was consistent with regulatory requirements and guidelines and was likely to benefit each Portfolio. The Trustees also concluded that, other than the services provided by Janus Capital and its affiliates pursuant to the agreements and the fees to be paid by each Portfolio therefor, the Portfolios and Janus Capital may potentially benefit from their relationship with each other in other ways. They concluded that Janus Capital benefits from the receipt of proprietary research products and services acquired through commissions paid on portfolio transactions of the Portfolios and that the Portfolios benefit from Janus Capital's receipt of those products and services as well as research products and services acquired through commissions paid by other clients of Janus Capital. They further concluded that success of any Portfolio could attract other business to Janus Capital or other Janus Funds and that the success of Janus Capital could enhance Janus Capital's ability to serve the Portfolios.
After full consideration of the above factors as well as other factors, all of the Trustees, including all of the Independent Trustees, concluded that the proposed continuation of the investment advisory agreement for each applicable Portfolio were in the best interest of the respective Portfolios and their shareholders.
Janus Aspen Series December 31, 2006 29
Explanations of Charts, Tables and Financial Statements (unaudited)
1. PERFORMANCE OVERVIEWS
The performance overview graph compares the performance of a hypothetical $10,000 investment in the Portfolio with one or more widely used market indices. The hypothetical example does not represent the returns of any particular investment.
When comparing the performance of the Portfolio with an index, keep in mind that market indices do not include brokerage commissions that would be incurred if you purchased the individual securities in the index. They also do not include taxes payable on dividends and interest or operating expenses incurred if you maintained a Portfolio invested in the index.
Average annual total returns are quoted for each class of the Portfolio. Average annual total return is calculated by taking the growth or decline in value of an investment over a period of time, including reinvestment of any dividends, distributions and capital gains, then calculating the annual compounded percentage rate that would have produced the same result had the rate of growth been constant throughout the period. Average annual total return does not reflect the deduction of taxes that a shareholder would pay on Portfolio distributions or redemptions of Portfolio shares.
2. SCHEDULE OF INVESTMENTS
Following the performance overview section is the Portfolio's Schedule of Investments. This schedule reports the industry concentrations and types of securities held in the Portfolio on the last day of the reporting period. Securities are usually listed by type (common stock, corporate bonds, U.S. Government obligations, etc.) and by industry classification (banking, communications, insurance, etc.). Holdings are subject to change without notice.
The value of each security is quoted as of the last day of the reporting period. The value of securities denominated in foreign currencies is converted into U.S. dollars. Certain short-term investments maturing within 60 days are valued at amortized cost, which approximates market value.
A summary of investments by country is provided if the Portfolio invested in foreign securities. This summary reports the Portfolio's exposure to different countries by providing the percentage of securities invested in each country. The country of each security represents the country in which the company
is incorporated.
2A. FORWARD CURRENCY CONTRACTS
A table listing forward currency contracts follows the Portfolio's Schedule of Investments (if applicable). Forward currency contracts are agreements to deliver or receive a preset amount of currency at a future date. Forward currency contracts are used to hedge against foreign currency risk in the Portfolio's long-term holdings. The table provides the name of the foreign currency, the settlement date of the contract, the amount of the contract, the value of the currency in U.S. dollars and the amount of unrealized gain or loss. The amount of unrealized gain or loss reflects the change in currency exchange rates from the time the contract was opened to the last day of the reporting period.
2B. FUTURES
A table listing futures contracts follows the Portfolio's Schedule of Investments (if applicable). Futures contracts are contracts that obligate the buyer to receive and the seller to deliver an instrument or money at a specified price on a specified date. Futures are used to hedge against adverse movements in securities prices, currency risk or interest rates.
The table provides the name of the contract, number of contracts held, the expiration date, the principal amount, value and the amount of unrealized gain or loss. The amount of unrealized gain or loss reflects the marked-to-market amount for the last day of the reporting period.
3. STATEMENT OF ASSETS AND LIABILITIES
This statement is often referred to as the "balance sheet." It lists the assets and liabilities of the Portfolio on the last day of the reporting period.
The Portfolio's assets are calculated by adding the value of the securities owned, the receivable for securities sold but not yet settled, the receivable for dividends declared but not yet received on stocks owned and the receivable for Portfolio shares sold to investors but not yet settled. The Portfolio's liabilities include payables for securities purchased but not yet settled, Portfolio shares redeemed but not yet paid and expenses owed but not yet paid. Additionally, there may be other assets and liabilities such as unrealized gain or loss on forward currency contracts.
The section entitled "Net Assets Consist of" breaks down the components of the Portfolio's net assets. Because the Portfolio must distribute substantially all earnings, you will notice that a significant portion of net assets is shareholder capital.
The last section of this statement reports the net asset value ("NAV") per share on the last day of the reporting period for each class of the Portfolio. The NAV is calculated by dividing the Portfolio's net assets (assets minus liabilities) by the number of shares outstanding.
30 Janus Aspen Series December 31, 2006
4. STATEMENT OF OPERATIONS
This statement details the Portfolio's income, expenses, gains and losses on securities and currency transactions, and appreciation or depreciation of current Portfolio holdings.
The first section in this statement, entitled "Investment Income," reports the dividends earned from stocks and interest earned from interest-bearing securities in the Portfolio.
The next section reports the expenses and expense offsets incurred by the Portfolio, including the advisory fee paid to the investment adviser and transfer agent fees and expenses, and printing and postage for mailing statements, financial reports and prospectuses. Expense offsets, if any, are also shown.
The last section lists the increase or decrease in the value of securities held in the Portfolio. The Portfolio realizes a gain (or loss) when it sells its position in a particular security. An unrealized gain (or loss) refers to the change in net appreciation or depreciation of the Portfolio during the reporting period. "Net Realized and Unrealized Gain/(Loss) on Investments" is affected both by changes in the market value of Portfolio holdings and by gains (or losses) realized during the reporting period.
5. STATEMENT OF CHANGES IN NET ASSETS
This statement reports the increase or decrease in the Portfolio's net assets during the reporting period. Changes in the Portfolio's net assets are attributable to investment operations, dividends, distributions and capital share transactions. This is important to investors because it shows exactly what caused the Portfolio's net asset size to change during the period.
The first section summarizes the information from the Statement of Operations regarding changes in net assets due to the Portfolio's investment performance. The Portfolio's net assets may also change as a result of dividend and capital gains distributions to investors. If investors receive their dividends in cash, money is taken out of the Portfolio to pay the distribution. If investors reinvest their dividends, the Portfolio's net assets will not be affected. If you compare the Portfolio's "Net Decrease from Dividends and Distributions" to the "Reinvested dividends and distributions," you will notice that dividend distributions had little effect on the Portfolio's net assets. This is because the majority of Janus investors reinvest their distributions.
The reinvestment of dividends is included under "Capital Share Transactions." "Capital Shares" refers to the money investors contribute to the Portfolio through purchases or withdraw via redemptions. The Portfolio's net assets will increase and decrease in value as investors purchase and redeem shares from the Portfolio.
6. FINANCIAL HIGHLIGHTS
This schedule provides a per-share breakdown of the components that affect the Portfolio's NAV for current and past reporting periods for each class of the Portfolio. Not only does this table provide you with total return, it also reports total distributions, asset size, expense ratios and portfolio turnover rate.
The first line in the table reflects the NAV per share at the beginning of the reporting period. The next line reports the net investment income per share, which comprises dividends and interest income earned on securities held by the Portfolio. Following is the total of gains/(losses), realized and unrealized. Dividends and distributions are then subtracted to arrive at the NAV per share at the end of the period. The next line reflects the average annual total return reported the last day of the period.
Also included are the expense ratios, or the percentage of net assets that are used to cover operating expenses during the period. Expense ratios vary for a number of reasons, including the differences in management fees, the average shareholder account size and the extent of foreign investments, which entail greater transaction costs.
The Portfolio's expenses may be reduced through expense reduction arrangements. These arrangements may include the use of brokerage commissions, of balance credits or transfer agent fee offsets. The Statement of Operations reflects total expenses before any such offset, the amount of offset and the net expenses. The expense ratios listed in the Financial Highlights reflect total expenses prior to any expense offsets (gross expense ratio) and after the expense offsets (net expense ratio). Both expense ratios reflect expenses after waivers (reimbursements), if applicable.
The ratio of net investment income/(loss) summarizes the income earned less expenses, divided by the average net assets of the Portfolio during the reporting period. Don't confuse this ratio with the Portfolio's yield. The net investment income ratio is not a true measure of the Portfolio's yield because it doesn't take into account the dividends distributed to the Portfolio's investors.
The next ratio is the portfolio turnover rate, which measures the buying and selling activity in a Portfolio. Portfolio turnover is affected by market conditions, changes in the asset size of a Portfolio, the nature of the Portfolio's investments and the investment style of the portfolio manager. A 100% rate implies that an amount equal to the value of the entire
Janus Aspen Series December 31, 2006 31
Explanations of Charts, Tables and Financial Statements (unaudited) (continued)
portfolio is turned over in a year; a 50% rate means that an amount equal to the value of half the portfolio is traded in a year; and a 200% rate means that an amount equal to the value of the portfolio is traded every six months.
32 Janus Aspen Series December 31, 2006
Designation Requirements (unaudited)
For federal income tax purposes, the Portfolio designated the following for the year ended December 31, 2006:
Capital Gain Distributions
| Portfolio | |||||||
| Janus Aspen Flexible Bond Portfolio | $ | 617,929 | |||||
Janus Aspen Series December 31, 2006 33
Trustees and Officers (unaudited)
The Portfolio's Statement of Additional Information includes additional information about the Trustees and officers and is available, without charge, by calling 1-800-525-0020.
The following are the Trustees and officers of the Trust, together with a brief description of their principal occupations during the last five years (principal occupations for certain Trustees may include periods over five years).
Each Trustee has served in that capacity since he or she was originally elected or appointed. The Trustees do not serve a specified term of office. Each Trustee will hold office until the termination of the Trust or his or her earlier death, resignation, retirement, incapacity or removal. The retirement age for Trustees is 72. The Portfolio's Nominating and Governance Committee will consider nominees for the position of Trustee recommended by shareholders. Shareholders may submit the name of a candidate for consideration by the Committee by submitting their recommendations to the Trust's Secretary. Each Trustee is currently a Trustee of two other registered investment companies advised by Janus Capital: Janus Investment Fund and Janus Adviser Series. As of the date of this report, collectively, these three registered investment companies consist of 69 series or funds.
The Trust's officers are elected annually by the Trustees for a one-year term. Certain officers also serve as officers of Janus Investment Fund and Janus Adviser Series. Certain officers of the Portfolio may also be officers and/or directors of Janus Capital. Portfolio officers receive no compensation from the Portfolio, except for the Portfolio's Chief Compliance Officer, as authorized by the Trustees.
Trustees
| Name, Age and Address | Positions Held with Portfolio | Length of Time Served | Principal Occupations During the Past Five Years | Number of Portfolios in Fund Complex Overseen by Trustee | Other Directorships Held by Trustee | ||||||||||||||||||
| Independent Trustees | |||||||||||||||||||||||
| Dennis B. Mullen 151 Detroit Street Denver, CO 80206 Age 63 | Chairman Trustee | 3/04-Present 9/93-Present | Chief Executive Officer of Red Robin Gourmet Burgers, Inc. (since 2005). Formerly, private investor. | 69 | * | Chairman of the Board (since 2005) and Director of Red Robin Gourmet Burgers, Inc.; and Director of Janus Capital Funds Plc (Dublin-based, non-U.S. funds). | |||||||||||||||||
| Jerome S. Contro 151 Detroit Street Denver, CO 80206 Age 50 | Trustee | 12/05-Present | Partner of Tango Group, a private investment firm (since 1999). | 69 | Trustee and Chairman of RS Investment Trust (since 2001); Director of IZZE Beverages and MyFamily.com, Inc. (genealogical research website). | ||||||||||||||||||
| William F. McCalpin 151 Detroit Street Denver, CO 80206 Age 49 | Trustee | 6/02-Present | Private Investor. Formerly, Vice President of Asian Cultural Council and Executive Vice President and Chief Operating Officer of The Rockefeller Brothers Fund (a private family foundation). | 69 | Director of the F.B. Heron Foundation (a private grantmaking foundation). | ||||||||||||||||||
| John W. McCarter, Jr. 151 Detroit Street Denver, CO 80206 Age 68 | Trustee | 6/02-Present | President and Chief Executive Officer of The Field Museum of Natural History (Chicago, IL). | 69 | Chairman of the Board and Director of Divergence Inc. (biotechnology firm); Director of W.W. Grainger, Inc. (industrial distributor): and Trustee of WTTW (Chicago public television station) and the University of Chicago. | ||||||||||||||||||
34 Janus Aspen Series December 31, 2006
Trustees (cont.)
| Name, Age and Address | Positions Held with Portfolio | Length of Time Served | Principal Occupations During the Past Five Years | Number of Portfolios in Fund Complex Overseen by Trustee | Other Directorships Held by Trustee | ||||||||||||||||||
| Independent Trustees (cont.) | |||||||||||||||||||||||
| James T. Rothe 151 Detroit Street Denver, CO 80206 Age 63 | Trustee | 1/97-Present | Co-founder and Managing Director of Roaring Fork Capital Management, LLC (private investment in public equity firm); and Professor Emeritus of Business of the University of Colorado, Colorado Springs, CO (since 2004). Formerly, Professor of Business of the University of Colorado (2002-2004); and Distinguished Visiting Professor of Business (2001-2002) of Thunderbird University (American Graduate School of International Management), Glendale, AZ. | 69 | Director of Red Robin Gourmet Burgers, Inc. | ||||||||||||||||||
| William D. Stewart 151 Detroit Street Denver, CO 80206 Age 62 | Trustee | 9/93-Present | Corporate Vice President and General Manager of MKS Instruments – HPS Products, Boulder, CO (a manufacturer of vacuum fittings and valves). | 69 | N/A | ||||||||||||||||||
| Martin H. Waldinger 151 Detroit Street Denver, CO 80206 Age 68 | Trustee | 9/93-Present | Private Investor and Consultant to California Planned Unit Developments. Formerly, CEO and President of Marwal, Inc. (homeowner association management company). | 69 | N/A | ||||||||||||||||||
| Linda S. Wolf 151 Detroit Street Denver, CO 80206 Age 59 | Trustee | 12/05-Present | Retired. Formerly, Chairman and Chief Executive Officer of Leo Burnett (Worldwide) (advertising agency) (2001-2005). | 69 | Director of Wal-Mart, The Field Museum of Natural History (Chicago, IL), Children's Memorial Hospital (Chicago, IL), Chicago Council on Foreign Relations, Economic Club of Chicago, and InnerWorkings (a provider of print procurement solutions). | ||||||||||||||||||
| Interested Trustee | |||||||||||||||||||||||
| Thomas H. Bailey** 151 Detroit Street Denver, CO 80206 Age 69 | Trustee | 5/93-Present | Retired. Formerly, President (1978-2002) and Chief Executive Officer (1994-2002) of Janus Capital or Janus Capital Corporation; Chairman and Director (1978-2002) of Janus Capital Corporation; President and Director (1994-2002) of The Janus Foundation. | 69 | N/A | ||||||||||||||||||
* Mr. Mullen also serves as director of Janus Capital Funds Plc, consisting of 22 funds. Including Janus Capital Funds Plc and the 69 funds comprising the Janus Funds, Mr. Mullen oversees 91 funds.
** The Portfolio is treating Mr. Bailey as an "interested person" of the Trust by virtue of his past positions and continuing relationships with Janus Capital and ownership of shares of Janus Capital's parent company.
Janus Aspen Series December 31, 2006 35
Trustees and Officers (unaudited) (continued)
Officers
| Name, Age and Address | Positions Held with Portfolio | Term of Office* and Length of Time Served | Principal Occupations During the Past Five Years | ||||||||||||
| Ronald V. Speaker 151 Detroit Street Denver, CO 80206 Age 42 | Executive Vice President and Portfolio Manager Janus Aspen Flexible Bond Portfolio | 5/93-Present | Vice President of Janus Capital and Portfolio Manager for other Janus accounts | ||||||||||||
| Stephanie Grauerholz-Lofton 151 Detroit Street Denver, CO 80206 Age 36 | Chief Legal Counsel and Secretary Vice President | 1/06-Present 3/06-Present | Associate Counsel of Janus Capital. Formerly, Associate of Vedder, Price, Kaufman & Kammholz, P.C. (1999-2003). | ||||||||||||
| Kelley Abbott Howes 151 Detroit Street Denver, CO 80206 Age 41 | President and Chief Executive Officer | 1/06-Present | President of Janus Services LLC; Senior Vice President and General Counsel of Janus Capital; and Senior Vice President and Assistant General Counsel of Janus Distributors LLC. Formerly, Vice President (1999-2005) of Janus Distributors LLC; Senior Vice President and General Counsel (2004-2006), Vice President (2000-2004), and Assistant General Counsel (2002-2004) of Janus Services LLC; and Vice President and Assistant General Counsel (1999-2004) of Janus Capital. | ||||||||||||
| David R. Kowalski 151 Detroit Street Denver, CO 80206 Age 49 | Vice President and Chief Compliance Officer | 6/02-Present | Senior Vice President and Chief Compliance Officer of Janus Capital, Janus Distributors LLC, and Janus Services LLC; Chief Compliance Officer of Bay Isle Financial LLC; and Vice President of Enhanced Investment Technologies LLC. Formerly, Chief Compliance Officer of Enhanced Investment Technologies, LLC (2003-2005); Vice President of Janus Capital (2000-2005), Janus Distributors LLC (2000-2001), and Janus Services LLC (2004-2005); and Assistant Vice President of Janus Services LLC (2002-2004). | ||||||||||||
| Jesper Nergaard 151 Detroit Street Denver, CO 80206 Age 44 | Chief Financial Officer Vice President, Treasurer, and Principal Accounting Officer | 3/05-Present 2/05-Present | Vice President of Janus Capital. Formerly, Director of Financial Reporting for OppenheimerFunds, Inc. (2004-2005); Site Manager and First Vice President of Mellon Global Securities Services (2003); and Director of Fund Accounting, Project Development, and Training of INVESCO Funds Group (1994-2003). | ||||||||||||
* Officers are elected at least annually for a one-year term and may also be elected from time to time by the Trustees for an interim period.
36 Janus Aspen Series December 31, 2006
Notes
Janus Aspen Series December 31, 2006 37
Janus provides access to a wide range of investment disciplines.
Growth
Janus growth portfolios focus on companies believed to be the leaders in their respective industries, with solid management teams, expanding market share, margins and efficiencies.
Core
Janus core portfolios seek investments in more stable and predictable companies. These portfolios look for a strategic combination of steady growth and for certain portfolios, some degree of income.
Risk-Managed
Our risk-managed portfolios seek to outperform their respective indices while maintaining a risk profile equal to or lower than the index itself. Managed by INTECH (a Janus subsidiary), these portfolios use a mathematical process in an attempt to build a more "efficient" portfolio than the index.
Value
Janus value portfolios invest in companies they believe are poised for a turnaround or are trading at a significant discount to fair value. The goal is to gain unique insight into a company's true value and identify and evaluate potential catalysts that may unlock
shareholder value.
International & Global
Janus international and global portfolios seek to leverage Janus' research capabilities by taking advantage of inefficiencies in foreign markets, where accurate information and analytical insight are often at a premium.
Bond & Money Market
Janus bond portfolios attempt to provide less risk relative to equities while seeking to deliver a competitive total return through high current income and appreciation. Janus money market portfolios seek maximum current income consistent with stability of capital.
For more information about our funds, contact your investment professional or go to www.janus.com/info
Please consider the charges, risks, expenses and investment objectives carefully before investing. For a prospectus containing this and other information, please call Janus at 1-800-525-0020 or download the file from www.janus.com/info. Read it carefully before you invest or send money.
An investment in a money market portfolio is not insured or guaranteed by the Federal Deposit Insurance Corporation or any other government agency. Although the Portfolio seeks to preserve the value of your investment at $1.00 per share, it is possible to lose money by investing in the Portfolio.

151 Detroit Street
Denver, CO 80206
1-800-525-0020
Portfolio distributed by Janus Distributors LLC (1/07)
C-0207-169 109-02-705 01-07
2006 Annual Report
Janus Aspen Series
Janus Aspen Foreign Stock Portfolio
Look Inside. . .
• Portfolio management perspective
• Investment strategy behind your portfolio
• Portfolio performance, characteristics and holdings

Table of Contents
| Useful Information About Your Portfolio Report | 1 | ||||||
| Management Commentary and Schedule of Investments | 2 | ||||||
| Statement of Assets and Liabilities | 8 | ||||||
| Statement of Operations | 9 | ||||||
| Statements of Changes in Net Assets | 10 | ||||||
| Financial Highlights | 11 | ||||||
| Notes to Schedule of Investments | 12 | ||||||
| Notes to Financial Statements | 13 | ||||||
| Report of Independent Registered Public Accounting Firm | 20 | ||||||
| Additional Information | 21 | ||||||
| Explanations of Charts, Tables and Financial Statements | 24 | ||||||
| Designation Requirements | 26 | ||||||
| Trustees and Officers | 27 | ||||||
Please consider the charges, risks, expenses and investment objectives carefully before investing. For a prospectus containing this and other information, please call Janus at 1-800-525-0020 or download the file from www.janus.com/info. Read it carefully before you invest or send money.
Useful Information About Your Portfolio Report
Management Commentary
The Management Commentary in this report includes valuable insight from the Portfolio's manager as well as statistical information to help you understand how your Portfolio's performance and characteristics stack up against those of comparable indices.
Please keep in mind that the opinions expressed by the Portfolio's manager in the Management Commentary are just that: opinions. They are a reflection of the manager's best judgment at the time this report was compiled, which was December 31, 2006. As the investing environment changes, so could the manager's opinions. The views are unique to the manager and aren't necessarily shared by his fellow employees or by Janus in general.
Portfolio Expenses
We believe it's important for our shareholders to have a clear understanding of Portfolio expenses and the impact they have on investment return.
The following is important information regarding the Portfolio's Expense Example, which appears in the Management Commentary within this Annual Report. Please refer to this information when reviewing the Expense Example for the Portfolio.
Example
As a shareholder of a Portfolio, you incur two types of costs: (1) transaction costs, including redemption fees (where applicable) (and any related exchange fees) and (2) ongoing costs, including management fees; distribution and shareholder servicing (12b-1) fees (applicable to Service Shares only); and other Portfolio expenses. The example is intended to help you understand your ongoing costs (in dollars) of investing in a Portfolio and to compare these costs with the ongoing costs of investing in other mutual funds. To do so, compare this 5% hypothetical example with the 5% hypothetical examples that appear in the shareholder reports of the other funds. The example is based upon an investment of $1,000 invested at the beginning of the period and held for the six-month period from July 1, 2006 to December 31, 2006.
Actual Expenses
The first line of the table in each example provides information about actual account values and actual expenses. You may use the information in this line, together with the amount you invested, to estimate the expenses that you paid over the period. Simply divide your account value by $1,000 (for example, an $8,600 account value divided by $1,000 = 8.6), then multiply the result by the number in the first line under the heading entitled "Expenses Paid During Period" to estimate the expenses you paid on your account during the period.
Hypothetical Example for Comparison Purposes
The second line of the table in each example provides information about hypothetical account values and hypothetical expenses based upon the Portfolio's actual expense ratio and an assumed rate of return of 5% per year before expenses, which is not the Portfolio's actual return. The hypothetical account values and expenses may not be used to estimate the actual ending account balance or expenses you paid for the period. You may use this information to compare the ongoing costs of investing in the Portfolio and other funds. To do so, compare this 5% hypothetical example with the 5% hypothetical examples that appear in the shareholder reports of the other funds.
Janus Capital Management LLC ("Janus Capital") has contractually agreed to waive the Portfolio's total operating expenses, excluding the distribution and shareholder servicing (12b-1) fees applicable to Service Shares, brokerage commissions, interest, taxes and extraordinary expenses to certain limits until at least May 1, 2008. More information regarding the waivers is available in the Portfolio's prospectus.
Please note that the expenses shown in the tables are meant to highlight your ongoing costs only and do not reflect any transaction costs, such as redemption fees (where applicable) and any charges at the separate account level or contract level. Redemption fees are fully described in the prospectus. Therefore, the second line of each table is useful in comparing ongoing costs only, and will not help you determine the relative total costs of owning different funds. In addition, if these transaction costs and separate account or contract level charges were included, your costs would have been higher.
Janus Aspen Series December 31, 2006 1
Janus Aspen Foreign Stock Portfolio (unaudited)
Portfolio Snapshot
This portfolio looks for companies anywhere in the world selling at a discount to what we believe is their true value.

Jason Yee
portfolio manager
Performance Overview
Janus Aspen Foreign Stock Portfolio's Service Shares advanced 18.06% over the 12-month period ended December 31, 2006. While this was reasonable performance on an absolute return basis, the Portfolio nevertheless posted disappointing results versus its benchmark, the Morgan Stanley Capital International (MSCI) EAFE® Index, which returned 26.34%.
While virtually every shareholder letter starts out with a discussion of returns, very few make even casual mention of the risks undertaken to achieve these returns. Part of the reason behind this is simply that risk is not easily measurable. While the academic world would conveniently equate risk to relative volatility, for most investors the Webster dictionary definition of risk as "possibility of loss or injury" is much more relevant and appropriate in my view. I can assure you that risk management of the Portfolio during my tenure has always focused on the latter definition – that is, minimizing this "possibility of (financial) loss or injury" – rather than hoping to tame volatility.
The lack of easy and precise measurements of risk in a portfolio is belied by the exhaustive quantitative approach traditionally found in the investment industry. In-house risk management experts, or a committee armed with fancy software and statistics galore, dissect portfolios by every factor imaginable. While this approach may be viewed as reasonable, especially in highlighting correlations within a diverse portfolio, the real crux of risk management involves more qualitative study and a common sense approach. As Warren Buffett duly noted, "Just as Justice Stewart found it impossible to formulate a test for obscenity but nevertheless asserted, 'I know it when I see it,' so also can investors – in an inexact but useful way – 'see' the risks inherent in certain investments without reference to complex equations or price histories."
The risks in a portfolio that are most easily measurable seem to be overly emphasized as important factors in explaining both risks and returns. Take geographic exposure, for instance. What do Promise, a Japanese consumer credit company, and Esprit Holdings, a Hong Kong-based apparel retailer, have in common, other than being non-U.S.-based companies? Different industries, different geographic exposure, different customers, different functional currencies ... it is not apparent to us that there is a lot in common, nor should those two businesses be particularly correlated to each another. To be fair, geographic exposure can sometimes become relevant for periods of secular growth or decline in a country, but is generally an overly simplistic risk characteristic, especially for fundamental, bottom-up investing and longer investment time horizons.
The same could be said for risk from general economic conditions, in my view. For any particular period, interest rates, inflation, employment, housing starts, consumer sentiment and other economic indicators may go up or down; how this impacts the net asset value of the Portfolio is apparent only in retrospect and not always causal. And these factors change very quickly. Like most in this profession, I am aware of economic conditions in many different parts of the world, but am generally suspicious of these conditions as the arbiter of financial markets and prices. Some current examples include the following: Are steady interest rates a good or bad indicator for the U.S. economy? Is the Federal Reserve in front of or behind the curve in terms of keeping inflation under control? How does this U.S. policy impact the economic conditions of other countries around the world? These questions are best left for the commentators and pundits to forecast, and there is certainly no agreement. Furthermore, I am unsure how these conditions (even if one could predict them) are relevant to a discussion of risk or return in the Portfolio. In my opinion, risk management is probably better done from a micro (business model, competition, etc.) perspective versus a macro (geography, economic conditions, etc.) perspective.
Many other professions outside of the investment industry also think of risk in a similar sense. My studies of mechanical engineering during college introduced me to the concept of a "safety factor." If a bridge is built to withstand a certain load, the design is often required to have a safety factor of three (actually to withstand three times this expected load). The safety factor hopes to encompass a certain margin of error and account for unforeseen and unexpected situations, to manage the risk of catastrophic failure. This concept seems quite obvious in engineering, perhaps because the consequences of failure are so high. But perhaps this concept should also be obvious with regard to investing.
Managing risk is one of the most basic concepts in investing – it defines the very nature of being an investment manager. In
2 Janus Aspen Series December 31, 2006
(unaudited)
times of high returns and frothy equity markets, it is tempting to become less vigilant on the risk equation and more focused on reward. After all, if your neighbor is making unbelievable returns in an investment or asset class, why shouldn't you be making those returns too? For many investors, the prospect of being "left behind" is often too great to bear, and unfortunately this leads to ill-timed investments at ill-advised prices. It is exactly this temptation which I hope to avoid by means of a disciplined investment and risk management process. While sometimes this means I reap less reward in any given short-term period, this discipline is more likely to be rewarded when the environment inevitably becomes less favorable. And over time, I believe this strategy should help the Portfolio achieve its goal of solid overall risk-adjusted returns.
My common sense approach to managing risk in the Portfolio manifests itself in a number of ways. First of all, through diligent fundamental research, I strive to understand the forces shaping the business, industry and competitive landscape of the investment and assess the various different potential outcomes. Secondly, I strive to invest in high quality businesses and management teams to hopefully increase the probability of successful outcomes. And finally, I strive to purchase these businesses at attractive, discounted prices in order to manage downside risk, especially if I should be incorrect in my assessments of the future. I believe these three risk management techniques, while imprecise and imperfect in nature, offer the best chance of achieving an adequate balance of risk and return for the Portfolio over the long term.
What are the risks in my investment in Promise, the largest detractor during the period? I believe the primary risk is not predicated on how the price moves up and down on a daily basis (volatility) but how sustainable and competitively advantaged a company's business model turns out to be (business risk). As equity owners in a business, albeit minority shareholders, it seems logical to equate the long-term risk of ownership to the long-term business risk of its operations, economic model and competitive positioning. The recent unfavorable changes in the Japanese regulatory environment negatively impacts our long term valuation of the business. While these changes may be illogical in my view, the fact of the matter is that the sustainability of the consumer finance business model in Japan has become much more uncertain. So despite reasonable fundamentals and a stock pric e below liquidation value, I have eliminated the position in the Portfolio to take advantage of prospects I believe have better risk/reward potential.
What are the risks involved with Esprit Holdings, the largest contributor to the Portfolio during the period? The fact that it has returned nearly 62% in the past year is very measurable, but the risk is much less quantifiable, even in retrospect. There are more possibilities (almost infinite) than there are actual outcomes (one), so a favorable outcome does not necessarily imply anything about the investment's risk profile. I would like to believe my investment and risk management process of thorough fundamental research, high quality businesses and patience contributed to this successful outcome. This case in particular highlights the importance of patience. Even when the stock price slumped in late 2005 and early 2006 as the company's reemergence in the U.S. marketplace proved challenging, I stood by the company and even increased the Portfolio's stake. As management resolved the underlying issues and got back on track for high double-dig it revenue growth, my conviction was rewarded.
Despite all these complex issues related to risk, risk management and uncertainty in investing, there is reason to be optimistic. By simply recognizing some of the risks and uncertainties associated with investing, I feel I am better prepared to adjust my thinking accordingly to become a better, more successful investor. As famed physicist Richard Feynman so eloquently stated, "The first principle is that you must not fool yourself and you are the easiest person to fool." Or as Feynman put it even more bluntly, "I'm smart enough to know that I'm dumb."
Simply put, recognizing limitations in measuring risk is the first step towards intelligent risk management. By spending a substantial portion of my time examining the risks of specific investments and the Portfolio as a whole, I hope to deliver adequate returns in the Portfolio without incurring excessive risk.
Thank you for your continued investment in Janus Aspen Foreign Stock Portfolio.
Janus Aspen Series December 31, 2006 3
Janus Aspen Foreign Stock Portfolio (unaudited)
Janus Aspen Foreign Stock Portfolio At a Glance
5 Largest Contributors to Performance – Holdings
| Contribution | |||||||
| Esprit Holdings, Ltd. High quality life-style products wholesaler - Hong Kong | 1.58% | ||||||
| Pfeiffer Vacuum Technology A.G. Pump manufacturer and servicer - Germany | 1.53% | ||||||
| Syngenta A.G. Agricultural chemicals company - Switzerland | 1.50% | ||||||
| Shaw Communications, Inc. - Class B Broadband cable television, Internet, and satellite television services provider - Canada | 1.48% | ||||||
| Diageo PLC Producer, distiller and marketer of alcoholic beverages - United Kingdom | 1.16% | ||||||
5 Lowest Contributors/Detractors to
Performance – Holdings
| Contribution | |||||||
| Promise Company, Ltd. Consumer financing company - Japan | (0.55)% | ||||||
| Acom Company, Ltd. Consumer financing company - Japan | (0.48)% | ||||||
| Tenma Corp. Rubber and plastics products producer - Japan | (0.09)% | ||||||
| Rentokil Initial PLC Diversified operations/commercial services provider - United Kingdom | (0.06)% | ||||||
| Total S.A. Industrial Chemicals - France | 0.00% | ||||||
5 Largest Contributors to Performance – Sectors
| Group | Portfolio Contribution | Portfolio Weighting (% of Net Assets) | Morgan Stanley Capital International EAFE® Index Weighting | ||||||||||||
| Media | 6.20 | % | 20.71 | % | 2.09 | % | |||||||||
| Materials | 2.88 | % | 7.14 | % | 8.28 | % | |||||||||
| Food, Beverage & Tobacco | 2.48 | % | 7.36 | % | 5.02 | % | |||||||||
| Capital Goods | 2.39 | % | 12.58 | % | 7.44 | % | |||||||||
| Consumer Durables & Apparel | 1.79 | % | 11.52 | % | 3.28 | % | |||||||||
5 Lowest Contributors/Detractors to Performance – Sectors
| Group | Portfolio Contribution | Portfolio Weighting (% of Net Assets) | Morgan Stanley Capital International EAFE® Index Weighting | ||||||||||||
| Diversified Financials | (1.03 | )% | 1.53 | % | 5.53 | % | |||||||||
| Commercial Services & Supplies | (0.06 | )% | 0.82 | % | 1.05 | % | |||||||||
| Utilities | 0.00 | % | 0.00 | % | 5.24 | % | |||||||||
| Transportation | 0.00 | % | 0.00 | % | 2.38 | % | |||||||||
| Software & Services | 0.00 | % | 0.00 | % | 1.29 | % | |||||||||
4 Janus Aspen Series December 31, 2006
(unaudited)
5 Largest Equity Holdings – (% of Net Assets)
| As of December 31, 2006 | |||
| Sony Corp. Audio and Video Products | 5.5 | % | |||||
| Nipponkoa Insurance Company, Ltd. Property and Casualty Insurance | 5.3 | % | |||||
| Willis Group Holdings, Ltd. Insurance Brokers | 5.1 | % | |||||
| Koninklijke (Royal) Philips Electronics N.V. Electronic Components - Miscellaneous | 5.0 | % | |||||
| Nokia Oyj Wireless Equipment | 5.0 | % | |||||
| 25.9 | % | ||||||
Asset Allocation – (% of Net Assets)
| As of December 31, 2006 | |||

Emerging markets comprised 1.8% of total net assets.
Top Country Allocations – (% of Investment Securities)
| As of December 31, 2006 | As of December 31, 2005 | ||||||
 | 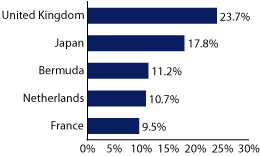 | ||||||
Janus Aspen Series December 31, 2006 5
Janus Aspen Foreign Stock Portfolio (unaudited)
Performance

Average Annual Total Return – for the periods ended December 31, 2006
| One Year | Five Year | Since Inception* | |||||||||||||
| Janus Aspen Foreign Stock Portfolio - Service Shares | 18.06 | % | 11.37 | % | 10.91 | % | |||||||||
| Morgan Stanley Capital International EAFE® Index | 26.34 | % | 14.98 | % | 9.69 | % | |||||||||
| Lipper Quartile - Service Shares | 4 | th | 4 | th | 2 | nd | |||||||||
| Lipper Ranking - Service Shares based on total returns for Variable Annuity International Funds | 209/229 | 128/164 | 48/141 | ||||||||||||
Data presented represents past performance, which is no guarantee of future results. Investment results and principal value will fluctuate so that shares, when redeemed, may be worth more or less than their original cost. Due to market volatility, current performance may be higher or lower than the performance shown. Call 877.33JANUS or visit www.janus.com/info for performance current to the most recent month-end.
See Notes to Schedule of Investments for index definitions.
Total return includes reinvestment of dividends from net investment income and distributions from capital gains. The returns shown do not reflect the deduction of taxes that a shareholder would pay on Portfolio distributions or the redemption of Portfolio shares. Net dividends reinvested are the dividends that remain to be reinvested after foreign tax obligations have been met. Such obligations vary from country to country.
These returns do not reflect the charges and expenses of any particular insurance product or qualified plan. Returns shown would have been lower had they included insurance charges.
The Portfolio may differ significantly from the securities held in the index. The index is not available for direct investment; therefore its performance does not reflect the expenses associated with the active management of an actual Portfolio.
This Portfolio is designed for long-term investors who can accept the special risks associated with value investing and having significant exposure to foreign markets (which include risks such as currency fluctuation and political uncertainty).
The Portfolio is classified as "nondiversified," meaning it has the ability to take larger positions in a smaller number of issuers than a fund that is classified as "diversified." Nondiversified funds may experience greater price volatility.
There is no assurance that the investment process will consistently lead to successful investing.
Lipper Inc. - A Reuters Company, is a nationally recognized organization that ranks the performance of mutual funds within a universe of funds that have similar investment objectives. Rankings are historical with capital gains and dividends reinvested.
The Portfolio's performance may be affected by risks that include those associated with nondiversification, non-investment grade debt securities, undervalued or overlooked companies, investments in specific industries or countries and potential conflicts of interest with Janus Smart Portfolios. Additional risks to the Portfolio may include those associated with investing in foreign securities, emerging markets, initial public offerings, derivatives and companies with relatively small market capitalizations. Please see a Janus prospectus or www.janus.com/info for more information about risk, fund holdings and details.
The date of the since-inception Lipper ranking is slightly different from when the Portfolio began operations since Lipper provides fund rankings as of the last day of the month or the first Thursday after fund inception.
Janus Capital has contractually agreed to waive the Portfolio's total operating expenses to the levels indicated in the prospectus until at least May 1, 2008. Total returns shown include fee waivers, if any, and without such waivers total returns would have been lower.
The Portfolio will invest at least 80% of its net assets in the type of securities described by its name.
See "Explanations of Charts, Tables and Financial Statements."
* The Portfolio's inception date – May 1, 2001
Portfolio Expenses
The example below shows you the ongoing costs (in dollars) of investing in your Portfolio and allows you to compare these costs with those of other mutual funds. Please refer to page 1 for a detailed explanation of the information presented in this chart.
| Expense Example - Service Shares | Beginning Account Value (7/1/06) | Ending Account Value (12/31/06) | Expenses Paid During Period (7/1/06-12/31/06)* | ||||||||||||
| Actual | $ | 1,000.00 | $ | 1,100.70 | $ | 7.84 | |||||||||
| Hypothetical (5% return before expenses) | $ | 1,000.00 | $ | 1,017.74 | $ | 7.53 | |||||||||
*Expenses are equal to the annualized expense ratio of 1.48%, multiplied by the average account value over the period, multiplied by 184/365 (to reflect the one-half year period). Expenses may include effect of contractual waivers by Janus Capital.
6 Janus Aspen Series December 31, 2006
Janus Aspen Foreign Stock Portfolio
Schedule of Investments
As of December 31, 2006
| Shares or Principal Amount | Value | ||||||||||
| Common Stock - 95.6% | |||||||||||
| Advertising Agencies - 0% | |||||||||||
| 124 | Interpublic Group of Companies, Inc.* | $ | 1,518 | ||||||||
| Advertising Services - 2.0% | |||||||||||
| 28,336 | WPP Group PLC | 383,099 | |||||||||
| Agricultural Chemicals - 3.3% | |||||||||||
| 3,325 | Syngenta A.G.* | 618,611 | |||||||||
| Audio and Video Products - 5.5% | |||||||||||
| 24,300 | Sony Corp. | 1,041,386 | |||||||||
| Beverages - Wine and Spirits - 3.0% | |||||||||||
| 29,156 | Diageo PLC | 572,296 | |||||||||
| Brewery - 1.8% | |||||||||||
| 7,021 | Heineken N.V. | 333,927 | |||||||||
| Broadcast Services and Programming - 1.8% | |||||||||||
| 12,720 | Grupo Televisa S.A. (ADR) | 343,567 | |||||||||
| Cable Television - 3.3% | |||||||||||
| 19,898 | Shaw Communications, Inc. - Class B | 629,795 | |||||||||
| Cellular Telecommunications - 2.2% | |||||||||||
| 146,586 | Vodafone Group PLC | 406,123 | |||||||||
| Chemicals - Diversified - 1.6% | |||||||||||
| 4,792 | Akzo Nobel N.V. | 292,308 | |||||||||
| 156 | Arkema* | 8,017 | |||||||||
| 300,325 | |||||||||||
| Distribution/Wholesale - 3.1% | |||||||||||
| 52,000 | Esprit Holdings, Ltd. | 580,615 | |||||||||
| Diversified Operations - 9.8% | |||||||||||
| 42,000 | Hutchison Whampoa, Ltd. | 426,841 | |||||||||
| 5,541 | Louis Vuitton Moet Hennessy S.A. | 584,785 | |||||||||
| 18,886 | Smiths Group PLC | 366,641 | |||||||||
| 15,900 | Tyco International, Ltd. (U.S. Shares) | 483,360 | |||||||||
| 1,861,627 | |||||||||||
| Electronic Components - Miscellaneous - 5.0% | |||||||||||
| 25,360 | Koninklijke (Royal) Philips Electronics N.V. | 956,419 | |||||||||
| Electronic Components - Semiconductors - 1.0% | |||||||||||
| 78,058 | ARM Holdings PLC | 192,191 | |||||||||
| Food - Diversified - 2.1% | |||||||||||
| 1,097 | Nestle S.A. | 389,824 | |||||||||
| Food - Retail - 2.0% | |||||||||||
| 6,056 | Metro A.G. | 385,240 | |||||||||
| Hotels and Motels - 1.1% | |||||||||||
| 2,803 | Accor S.A. | 217,195 | |||||||||
| Insurance Brokers - 5.1% | |||||||||||
| 24,450 | Willis Group Holdings, Ltd. | 970,910 | |||||||||
| Machinery - Pumps - 3.1% | |||||||||||
| 6,941 | Pfeiffer Vacuum Technology A.G. | 588,136 | |||||||||
| Medical - Drugs - 4.9% | |||||||||||
| 11,433 | GlaxoSmithKline PLC | 300,863 | |||||||||
| 9,200 | Takeda Pharmaceutical Company, Ltd. | 631,603 | |||||||||
| 932,466 | |||||||||||
| Multimedia - 2.9% | |||||||||||
| 13,856 | Vivendi Universal S.A. | 541,583 | |||||||||
| Oil Companies - Integrated - 4.3% | |||||||||||
| 33,354 | BP PLC | 370,615 | |||||||||
| 6,272 | Total S.A. | 452,464 | |||||||||
| 823,079 | |||||||||||
| Shares or Principal Amount | Value | ||||||||||
| Property and Casualty Insurance - 10.2% | |||||||||||
| 26,400 | Millea Holdings, Inc. | $ | 931,726 | ||||||||
| 123,000 | Nipponkoa Insurance Company, Ltd. | 997,396 | |||||||||
| 1,929,122 | |||||||||||
| Publishing - Books - 2.6% | |||||||||||
| 29,225 | Reed Elsevier N.V. | 498,432 | |||||||||
| Publishing - Newspapers - 1.4% | |||||||||||
| 67,969 | Independent News & Media PLC | 270,064 | |||||||||
| Rubber/Plastic Products - 1.4% | |||||||||||
| 15,000 | Tenma Corp. | 270,367 | |||||||||
| Semiconductor Equipment - 1.1% | |||||||||||
| 8,108 | ASML Holding N.V.* | 201,643 | |||||||||
| Television - 5.0% | |||||||||||
| 92,799 | British Sky Broadcasting Group PLC | 948,467 | |||||||||
| Wireless Equipment - 5.0% | |||||||||||
| 46,600 | Nokia Oyj | 952,238 | |||||||||
| Total Common Stock (cost $12,284,887) | 18,140,265 | ||||||||||
| Preferred Stock - 1.2% | |||||||||||
| Soap and Cleaning Preparations - 1.2% | |||||||||||
| 1,603 | Henkel KGaA (cost $101,008) | 236,149 | |||||||||
| Money Market - 3.4% | |||||||||||
| 645,986 | Janus Institutional Cash Reserves Fund 5.29% (cost $645,986) | 645,986 | |||||||||
| Total Investments (total cost $13,031,881) – 100.2% | 19,022,400 | ||||||||||
| Liabilities, net of Cash, Receivables and Other Assets – (0.2)% | (38,190 | ) | |||||||||
| Net Assets – 100% | $ | 18,984,210 | |||||||||
Summary of Investments by Country
| Country | Value | % of Investment Securities | |||||||||
| Bermuda | $ | 2,034,885 | 10.7 | % | |||||||
| Canada | 629,795 | 3.3 | % | ||||||||
| Finland | 952,238 | 5.0 | % | ||||||||
| France | 1,804,044 | 9.5 | % | ||||||||
| Germany | 1,209,525 | 6.4 | % | ||||||||
| Hong Kong | 426,841 | 2.2 | % | ||||||||
| Ireland | 270,064 | 1.4 | % | ||||||||
| Japan | 3,872,478 | 20.4 | % | ||||||||
| Mexico | 343,567 | 1.8 | % | ||||||||
| Netherlands | 2,282,729 | 12.0 | % | ||||||||
| Switzerland | 1,008,435 | 5.3 | % | ||||||||
| United Kingdom | 3,540,295 | 18.6 | % | ||||||||
| United States†† | 647,504 | 3.4 | % | ||||||||
| Total | $ | 19,022,400 | 100.0 | % | |||||||
††Includes Short-Term Securities (0% excluding Short-Term Securities)
See Notes to Schedule of Investments and Financial Statements.
Janus Aspen Series December 31, 2006 7
Statement of Assets and Liabilities
| As of December 31, 2006 (all numbers in thousands except net asset value per share) | Janus Aspen Foreign Stock Portfolio | ||||||
| Assets: | |||||||
| Investments at cost | $ | 13,032 | |||||
| Investments at value | $ | 19,022 | |||||
| Cash | 4 | ||||||
| Cash denominated in foreign currency (cost $1) | 1 | ||||||
| Receivables: | |||||||
| Portfolio shares sold | 3 | ||||||
| Dividends | 20 | ||||||
| Interest | 5 | ||||||
| Other assets | – | ||||||
| Total Assets | 19,055 | ||||||
| Liabilities: | |||||||
| Payables: | |||||||
| Portfolio shares repurchased | 17 | ||||||
| Advisory fees | 8 | ||||||
| Transfer agent fees and expenses | 1 | ||||||
| Distribution fees - Service Shares | 4 | ||||||
| Non-interested Trustees' fees and expenses | 1 | ||||||
| Printing expenses | 13 | ||||||
| Professional fees | 16 | ||||||
| System fees | 5 | ||||||
| Legal fees | 5 | ||||||
| Accrued expenses | 1 | ||||||
| Total Liabilities | 71 | ||||||
| Net Assets | $ | 18,984 | |||||
| Net Assets Consist of: | |||||||
| Capital (par value and paid-in-surplus)* | $ | 12,462 | |||||
| Undistributed net investment income/(loss)* | – | ||||||
| Undistributed net realized gain/(loss) from investments and foreign currency transactions* | 531 | ||||||
| Unrealized net appreciation/(depreciation) of investments and foreign currency translations | 5,991 | ||||||
| Total Net Assets | $ | 18,984 | |||||
| Net Assets - Service Shares | $ | 18,984 | |||||
| Shares Outstanding, $0.001 Par Value (unlimited shares authorized) | 1,133 | ||||||
| Net Asset Value Per Share | $ | 16.75 | |||||
*See Note 3 in Notes to Financial Statements.
See Notes to Financial Statements.
8 Janus Aspen Series December 31, 2006
Statement of Operations
| For the fiscal year ended December 31, 2006 (all numbers in thousands) | Janus Aspen Foreign Stock Portfolio | ||||||
| Investment Income: | |||||||
| Interest | $ | 37 | |||||
| Dividends | 387 | ||||||
| Dividends from affiliates | 47 | ||||||
| Foreign tax withheld | (21 | ) | |||||
| Total Investment Income | 450 | ||||||
| Expenses: | |||||||
| Advisory fees | 109 | ||||||
| Transfer agent expenses | 3 | ||||||
| Registration fees | – | ||||||
| Custodian fees | 15 | ||||||
| Professional fees | 23 | ||||||
| Non-interested Trustees' fees and expenses | 4 | ||||||
| Distribution fees - Service Shares | 43 | ||||||
| Printing expenses | 33 | ||||||
| Legal fees | 12 | ||||||
| System fees | 36 | ||||||
| Other expenses | 13 | ||||||
| Non-recurring costs (Note 2) | – | ||||||
| Costs assumed by Janus Capital Management LLC (Note 2) | – | ||||||
| Total Expenses | 291 | ||||||
| Expense and Fee Offset | (1 | ) | |||||
| Net Expenses | 290 | ||||||
| Less: Excess Expense Reimbursement | (34 | ) | |||||
| Net Expenses after Expense Reimbursement | 256 | ||||||
| Net Investment Income/(Loss) | 194 | ||||||
| Net Realized and Unrealized Gain/(Loss) on Investments: | |||||||
| Net realized gain/(loss) from securities transactions | 616 | ||||||
| Net realized gain/(loss) from foreign currency transactions | – | ||||||
| Change in unrealized net appreciation/(depreciation) of investments and foreign currency translations | 2,102 | ||||||
| Net Gain/(Loss) on Investments | 2,718 | ||||||
| Net Increase/(Decrease) in Net Assets Resulting from Operations | $ | 2,912 | |||||
See Notes to Financial Statements.
Janus Aspen Series December 31, 2006 9
Statements of Changes in Net Assets
| For the fiscal year ended December 31 (all numbers in thousands) | Janus Aspen Foreign Stock Portfolio | ||||||||||
| 2006 | 2005 | ||||||||||
| Operations: | |||||||||||
| Net investment income/(loss) | $ | 194 | $ | 136 | |||||||
| Net realized gain/(loss) from investment transactions and foreign currency transactions | 616 | 667 | |||||||||
| Change in unrealized net appreciation/(depreciation) of investments and foreign currency translations | 2,102 | 29 | |||||||||
| Net Increase/(Decrease) in Net Assets Resulting from Operations | 2,912 | 832 | |||||||||
| Dividends and Distributions to Shareholders: | |||||||||||
| Net investment income * | |||||||||||
| Service Shares | (278 | ) | (131 | ) | |||||||
| Net realized gain from investment transactions* | |||||||||||
| Service Shares | (490 | ) | – | ||||||||
| Net Decrease from Dividends and Distributions | (768 | ) | (131 | ) | |||||||
| Capital Share Transactions: | |||||||||||
| Shares sold | |||||||||||
| Service Shares | 3,273 | 5,525 | |||||||||
| Reinvested dividends and distributions | |||||||||||
| Service Shares | 768 | 131 | |||||||||
| Shares repurchased | |||||||||||
| Service Shares | (2,873 | ) | (7,574 | ) | |||||||
| Net Increase/(Decrease) from Capital Share Transactions | 1,168 | (1,918 | ) | ||||||||
| Net Increase/(Decrease) in Net Assets | 3,312 | (1,217 | ) | ||||||||
| Net Assets: | |||||||||||
| Beginning of period | 15,672 | 16,889 | |||||||||
| End of period | $ | 18,984 | $ | 15,672 | |||||||
| Undistributed net investment income/(loss)* | $ | – | $ | 1 | |||||||
*See Note 3 in Notes to Financial Statements.
See Notes to Financial Statements.
10 Janus Aspen Series December 31, 2006
Financial Highlights - Service Shares
| For a share outstanding during the each fiscal year ended December 31 | Janus Aspen Foreign Stock Portfolio | ||||||||||||||||||||||
| 2006 | 2005 | 2004 | 2003 | 2002 | |||||||||||||||||||
| Net Asset Value, Beginning of Period | $ | 14.85 | $ | 14.09 | $ | 11.95 | $ | 9.00 | $ | 10.49 | |||||||||||||
| Income from Investment Operations: | |||||||||||||||||||||||
| Net investment income/(loss) | .25 | .11 | .04 | .06 | – | (1) | |||||||||||||||||
| Net gain/(loss) on securities (both realized and unrealized) | 2.37 | .76 | 2.14 | 2.95 | (1.41 | ) | |||||||||||||||||
| Total from Investment Operations | 2.62 | .87 | 2.18 | 3.01 | (1.41 | ) | |||||||||||||||||
| Less Distributions: | |||||||||||||||||||||||
| Dividends (from net investment income)* | (.25 | ) | (.11 | ) | (.04 | ) | (.04 | ) | – | ||||||||||||||
| Distributions (from capital gains)* | (.47 | ) | – | – | – | (.08 | ) | ||||||||||||||||
| Tax return of capital* | – | – | – | (.02 | ) | – | |||||||||||||||||
| Total Distributions | (.72 | ) | (.11 | ) | (.04 | ) | (.06 | ) | (.08 | ) | |||||||||||||
| Net Asset Value, End of Period | $ | 16.75 | $ | 14.85 | $ | 14.09 | $ | 11.95 | $ | 9.00 | |||||||||||||
| Total Return | 18.06 | % | 6.24 | % | 18.22 | % | 33.39 | % | (13.37 | )% | |||||||||||||
| Net Assets, End of Period (in thousands) | $ | 18,984 | $ | 15,672 | $ | 16,889 | $ | 8,481 | $ | 5,969 | |||||||||||||
| Average Net Assets for the Period (in thousands) | $ | 17,224 | $ | 16,595 | $ | 13,297 | $ | 6,758 | $ | 3,989 | |||||||||||||
| Ratio of Gross Expenses to Average Net Assets(2) | 1.49 | % | 1.45 | % | 1.46 | % | 1.50 | % | 1.50 | % | |||||||||||||
| Ratio of Net Expenses to Average Net Assets(2) | 1.49 | % | 1.44 | % | 1.45 | % | 1.50 | % | 1.50 | % | |||||||||||||
| Ratio of Net Investment Income/(Loss) to Average Net Assets | 1.13 | % | 0.82 | % | 0.34 | % | 0.40 | % | (0.09 | )% | |||||||||||||
| Portfolio Turnover Rate | 16 | % | 20 | % | 14 | % | 31 | % | 106 | % | |||||||||||||
* See Note 3 in Notes to Financial Statements.
(1) Net investment income/(loss) aggregated less than $.01 on a per share basis for the fiscal year ended.
(2) See Note 4 in Notes to Financial Statements.
See Notes to Financial Statements.
Janus Aspen Series December 31, 2006 11
Notes to Schedule of Investments
| Lipper Variable Annuity International Funds | Funds that invest their assets in securities with primary trading markets outside of the United States. | ||||||
| Morgan Stanley Capital International EAFE® Index | Is a market capitalization weighted index composed of companies representative of the market structure of Developed Market countries in Europe, Australasia and the Far East. | ||||||
| ADR | American Depositary Receipt | ||||||
| PLC | Public Limited Company | ||||||
| U.S. Shares | Securities of foreign companies trading on an American Stock Exchange. | ||||||
* Non-income-producing security.
12 Janus Aspen Series December 31, 2006
Notes to Financial Statements
The following section describes the organization and significant accounting policies and provides more detailed information about the schedules and tables that appear throughout this report. In addition, the Notes to Financial Statements explain the methods used in preparing and presenting this report.
1. ORGANIZATION AND SIGNIFICANT ACCOUNTING POLICIES
Janus Aspen Foreign Stock Portfolio (the "Portfolio") is a series fund. The Portfolio is part of Janus Aspen Series (the "Trust"), which is organized as a Delaware statutory trust and is registered under the Investment Company Act of 1940 (the "1940 Act") as an open-end management investment company. The Trust offers seventeen Portfolios, which include multiple series of shares, with differing investment objectives and policies. The Portfolio invests primarily in equity securities. The Portfolio is classified as nondiversified, as defined in the 1940 Act. The Portfolio is a no-load investment.
The Portfolio currently offers one class of shares: Service Shares. Service Shares are offered only in connection with investment in and payments under variable insurance contracts and to qualified retirement plans that require a fee from Portfolio assets to procure distribution and administrative services to contract owners and plan participants.
The following accounting policies have been consistently followed by the Portfolio and are in conformity with accounting principles generally accepted in the United States of America in the investment company industry.
Investment Valuation
Securities are valued at the last sales price or the official closing price for securities traded on a principal securities exchange (U.S. or foreign) and on the NASDAQ National Market. Securities traded on over-the-counter markets and listed securities for which no sales are reported are valued at the latest bid price (or yield equivalent thereof) obtained from one or more dealers transacting in a market for such securities or by a pricing service approved by the Portfolio's Trustees. Short-term securities with maturities of 60 days or less may be valued at amortized cost, which approximates market value. Debt securities with a remaining maturity of greater than 60 days are valued in accordance with the evaluated bid price supplied by the pricing service. The evaluated bid price supplied by the pricing service is an evaluation that reflects such factors as security prices, yields, maturities and ratings. Foreign securities and currencies ar e converted to U.S. dollars using the applicable exchange rate in effect as of the daily close of the New York Stock Exchange ("NYSE"). When market quotations are not readily available or deemed unreliable, or events or circumstances that may affect the value of portfolio securities held by the Portfolio are identified between the closing of their principal markets and the time the net asset value ("NAV") is determined, securities may be valued at fair value as determined in good faith under procedures established by and under the supervision of the Portfolio's Trustees. The Portfolio may use a systematic fair valuation model provided by an independent third party to value international equity securities in order to adjust for stale pricing, which may occur between the close of certain foreign exchanges and the NYSE.
Investment Transactions and Investment Income
Investment transactions are accounted for as of the date purchased or sold (trade date). Dividend income is recorded on the ex-dividend date. Certain dividends from foreign securities will be recorded as soon as the Trust is informed of the dividend if such information is obtained subsequent to the ex-dividend date and may be subject to withholding taxes in these jurisdictions. Interest income is recorded on the accrual basis and includes amortization of premiums and accretion of discounts. Gains and losses are determined on the identified cost basis, which is the same basis used for federal income tax purposes.
Expenses
The Portfolio bears expenses incurred specifically on its behalf as well as a portion of general expenses, which may be allocated pro rata to the Portfolio.
Interfund Lending
Pursuant to an exemptive order received from the SEC, the Portfolio may be party to an interfund lending agreement between the Portfolio and other Janus Capital Management LLC ("Janus Capital") sponsored mutual funds, which permits it to borrow or lend cash at a rate beneficial to both the borrowing and lending funds. Outstanding borrowings from all sources totaling 10% or more of the borrowing Portfolio's total assets must be collateralized at 102% of the outstanding principal value of the loan; loans of less than 10% may be unsecured. During the fiscal year ended December 31, 2006, there were no outstanding interfund borrowing or lending arrangements for the Portfolio.
Forward Currency Transactions
The Portfolio may enter into forward currency contracts in order to reduce its exposure to changes in foreign currency exchange rates on its foreign portfolio holdings and to lock in the U.S. dollar cost of firm purchase and sale commitments for securities denominated in or exposed to foreign currencies. A forward currency exchange contract is a commitment to purchase or sell a foreign currency at a future date at a negotiated rate. The gain or loss arising from the difference between the U.S. dollar cost of the original contract and the value of the foreign currency in U.S. dollars upon closing a contract is included in "Net realized gain/(loss) from foreign currency transactions" on the Statement of Operations (if applicable).
Forward currency contracts held by the Portfolio are fully collateralized by other securities, which are denoted in the accompanying Schedule of Investments (if applicable). The collateral is evaluated daily to ensure its market value equals or exceeds the current market value of the corresponding forward currency contracts. As of December 31, 2006, the Portfolio was not invested in forward currency contracts.
Futures Contracts
The Portfolio may enter into futures contracts. The Portfolio intends to use such derivative instruments primarily to hedge or protect from adverse movements in securities prices, currency rates or interest rates. The use of futures contracts
Janus Aspen Series December 31, 2006 13
Notes to Financial Statements (continued)
may involve risks such as the possibility of illiquid markets or imperfect correlation between the value of the contracts and the underlying securities, or that the counterparty will fail to perform its obligations.
Futures contracts are marked-to-market daily, and the daily variation margin is recorded as a receivable or payable on the Statement of Assets and Liabilities (if applicable). When a contract is closed, a realized gain or loss is recorded on the Statement of Operations equal to the difference between the opening and closing value of the contract. Generally, futures contracts are marked-to-market (i.e., treated as realized and subject to distribution) for federal income tax purposes at fiscal year end. Securities designated as collateral for market value on futures contracts are noted in the Schedule of Investments. Such collateral is in the possession of the Portfolio's custodian. As of December 31, 2006, the Portfolio was not invested in futures contracts.
Short Sales
The Portfolio may engage in "short sales against the box." Short sales against the box involve selling either a security that the Portfolio owns, or a security equivalent in kind and amount to the security sold short that the Portfolio has the right to obtain, for delivery at a specified date in the future. The Portfolio may enter into a short sale against the box to hedge against anticipated declines in the market price of portfolio securities. If the value of the securities sold short increases prior to the scheduled delivery date, the Portfolio loses the opportunity to participate in the gain.
The Portfolio may also engage in "naked" short sales. Naked short sales involve the Portfolio selling a security it does not own to a purchaser at a specified price. To complete the transaction, the Portfolio must borrow the security to deliver it to the purchaser and buy that same security in the market to return it to the lender. Although the potential for gain is limited to the difference between the price at which the Portfolio sold the security short and the cost of borrowing the security, its potential for loss could be unlimited because there is no limit to the replacement cost of the borrowed security. There is no assurance that the Portfolio will be able to close out a short position at any particular time or at an acceptable price. A gain or a loss will be recognized upon termination of a short sale. There is no limit on the size of any loss that the Portfolio may recognize upon termination of a short sale. Short sales held by the Portfolio are fully collateralized by other securities, which are denoted in the accompanying Schedule of Investments (if applicable). As of December 31, 2006, the Portfolio was not invested in short sales.
Foreign Currency Translations
The Portfolio does not isolate that portion of the results of operations resulting from changes in foreign exchange rates on investments from the fluctuations arising from changes in market prices of securities held at the date of the financial statements. Net unrealized appreciation or depreciation on investments and foreign currency translation arise from changes in the value of assets and liabilities, including investments in securities held at the date of the financial statements, resulting from changes in the exchange rates and changes in market prices of securities held.
Currency gains and losses are also calculated on payables and receivables that are denominated in foreign currencies. The payables and receivables are generally related to security transactions and income.
Foreign currency-denominated assets and forward currency contracts may involve more risks than domestic transactions, including currency risk, political and economic risk, regulatory risk and market risk. Risks may arise from the potential inability of a counterparty to meet the terms of a contract and from unanticipated movements in the value of foreign currencies relative to the U.S. dollar.
When-issued Securities
The Portfolio may purchase or sell securities on a when-issued or forward commitment basis. The price of the underlying securities and date when the securities will be delivered and paid for are fixed at the time the transaction is negotiated. Losses may arise due to changes in the market value of the securities or from the inability of counterparties to meet the terms of the contract. In connection with such purchases, the Portfolio may hold liquid assets as collateral with the Portfolio's custodian sufficient to cover the purchase price. As of December 31, 2006, the Portfolio was not invested in when-issued securities.
Equity-Linked Structured Notes
The Portfolio may invest in equity-linked structured notes. Equity-linked structured notes are derivative securities which are specially designed to combine the characteristics of one or more underlying securities and their equity derivatives in a single note form. The return and/or yield or income component may be based on the performance of the underlying equity securities, an equity index, and/or option positions. Equity-linked structured notes are typically offered in limited transactions by financial institutions in either registered or nonregistered form. An investment in equity-linked structured notes creates exposure to the credit risk of the issuing financial institution, as well as to the market risk of the underlying securities. There is no guaranteed return of principal with these securities and the appreciation potential of these securities may be limited by a maximum payment or call right. In certain cases, equity-linked struct ured notes may be more volatile and less liquid than less complex securities or other types of fixed-income securities. Such securities may exhibit price behavior that does not correlate with other fixed-income securities. As of December 31, 2006, the Portfolio was not invested in equity-linked structured notes.
Initial Public Offerings
The Portfolio may invest in initial public offerings ("IPOs"). IPOs and other investment techniques may have a magnified performance impact on a fund with a small asset base. The Portfolio may not experience similar performance as its assets grow.
Additional Investment Risk
The Portfolio may be invested in lower-rated debt securities that have a higher risk of default or loss of value since these securities may be sensitive to economic changes, political changes or adverse developments specific to the issuer.
14 Janus Aspen Series December 31, 2006
Restricted Security Transactions
Restricted securities held by the Portfolio may not be sold except in exempt transactions or in a public offering registered under the Securities Act of 1933. The risk of investing in such securities is generally greater than the risk of investing in the securities of widely held, publicly traded companies. Lack of a secondary market and resale restrictions may result in the inability of the Portfolio to sell a security at a fair price and may substantially delay the sale of the security. In addition, these securities may exhibit greater price volatility than securities for which secondary markets exist.
Dividend Distributions
The Portfolio generally makes semiannual distributions of substantially all of its investment income and an annual distribution of its net realized capital gains (if any). The majority of dividends and net realized capital gains distributions from the Portfolio may be automatically reinvested into additional shares of the Portfolio, based upon the discretion of the shareholder.
Estimates
The preparation of financial statements in conformity with accounting principles generally accepted in the United States of America requires management to make estimates and assumptions that affect the reported amount of assets and liabilities and disclosure of contingent assets and liabilities at the date of the financial statements and the reported amounts of income and expenses during the reporting period. Actual results could differ from those estimates.
Federal Income Taxes
No provision for income taxes is included in the accompanying financial statements, as the Portfolio intends to distribute to shareholders all taxable investment income and realized gains and otherwise comply with Subchapter M of the Internal Revenue Code applicable to regulated investment companies.
New Accounting Pronouncements
In July 2006, the Financial Accounting Standards Board ("FASB") issued Interpretation No. 48, "Accounting for Uncertainty in Income Taxes – an Interpretation of FASB Statement No. 109" (the "Interpretation"). The Interpretation establishes for all entities, including pass-through entities such as the Portfolio, a minimum threshold for financial statement recognition of the benefit of positions taken in filing tax returns (including whether an entity is taxable in a particular jurisdiction), and requires certain expanded tax disclosures. A calendar year open-end or closed-end fund would implement the interpretation no later than June 29, 2007 (the last business day of the semi-annual reporting period) and will also apply to all open tax years as of the date of effectiveness. Management has recently begun to evaluate the application of the Interpretation to the Portfolio, and is not in a position at this time to estimate the significance of its impact, if any, on the Portfolio's financial statements.
In September 2006, the FASB issued Statement of Financial Accounting Standards No. 157, "Fair Value Measurements" ("SFAS No. 157"), which defines fair value, establishes a framework for measuring fair value in generally accepted accounting principles, and expands disclosures about fair value measurements. SFAS No. 157 does not require new fair value measurements, but is applied to the extent that other accounting pronouncements require or permit fair value measurements. SFAS No. 157 emphasizes that fair value is a market-based measurement that should be determined based on the assumptions that market participants would use in pricing an asset or liability. Companies will be required to disclose the extent to which fair value is used to measure assets and liabilities, the inputs used to develop the measurements, and the effect for fiscal years beginning after November 15, 2007. Management is currently evaluating the potential impact the adoption of SFAS No. 157 will have on the Portfolio's financial condition and results of operations.
2. INVESTMENT ADVISORY AGREEMENTS AND OTHER TRANSACTIONS WITH AFFILIATES
The Portfolio pays a monthly advisory fee to Janus Capital based upon average daily net assets and calculated at the annual rate of 0.64%.
Janus Capital has agreed until at least May 1, 2008 to reimburse the Portfolio by the amount, if any, that the normal operating expenses in any fiscal year, including the investment advisory fee but excluding the distribution and shareholder servicing (12b-1) fees applicable to Service Shares, brokerage commissions, interest, taxes and extraordinary expenses, exceed an annual rate of 1.24% of the average daily net assets of the Portfolio. The Portfolio is not required to repay any such waived fees in future years to Janus Capital.
Janus Services LLC ("Janus Services"), a wholly-owned subsidiary of Janus Capital, is the Portfolio's transfer agent. Janus Services receives certain out-of-pocket expenses for transfer agent services.
Certain officers of the Portfolio may also be officers and/or directors of Janus Capital. Such officers receive no compensation from the Portfolio, except for the Portfolio's Chief Compliance Officer. Effective January 1, 2006, the Portfolio began reimbursing the adviser for a portion of the compensation paid to the Chief Compliance Officer of the Trust. Total compensation of $32 was paid by the Portfolio during the fiscal year ended December 31, 2006. The Portfolio's portion is reported as part of "Other Expenses" on the Statement of Operations.
The Board of Trustees has adopted a deferred compensation plan (the "Deferred Plan") for independent Trustees to elect to defer receipt of all or a portion of the annual compensation they are entitled to receive from the Portfolio. All deferred fees are credited to an account established in the name of the Trustees. The amounts credited to the account then increase or decrease, as the case may be, in accordance with the performance of one or more of the Janus funds that are selected by the Trustees. The account balance continues to fluctuate in accordance with the performance of the selected fund or funds until final payment of all amounts credited to the account. Trustees are allowed to change their designation of mutual funds from time to time. Amounts will be deferred until distributed in accordance to the Deferred Plan. No deferred fees were paid to any Trustee under the Deferred Plan during the fiscal year ended December 31, 2006.
For the fiscal year ended December 31, Janus Capital assumed $21,288 of legal, consulting and Trustee costs and fees
Janus Aspen Series December 31, 2006 15
Notes to Financial Statements (continued)
incurred by the funds in Janus Investment Fund, Janus Aspen Series and Janus Adviser Series (the "Funds") in connection with the regulatory and civil litigation matters discussed in Note 7. These non-recurring costs were allocated to all Funds based upon the Funds' respective net assets as of July 31, 2004. Additionally, all future non-recurring costs will be allocated based upon the Funds' respective net assets on July 31, 2004. These non-recurring costs and costs assumed by Janus Capital are shown on the Statement of Operations.
Janus Distributors LLC, a wholly-owned subsidiary of Janus Capital, is a distributor of the Portfolio. Service Shares have adopted a Distribution and Shareholder Servicing Plan (the "Plan") pursuant to Rule 12b-1 under The 1940 Act. The Plan authorizes payments by the Portfolio in connection with the distribution of Service Shares at an annual rate of up to 0.25% of Service Shares' average daily net assets.
The Portfolio's expenses may be reduced by expense offsets from an unaffiliated custodian and/or transfer agent. Such credits or offsets are included in Expense and Fee Offset on the Statement of Operations. The transfer agent fee offsets received during the period reduce Transfer Agent Fees and Expenses. Custodian offsets received reduce Custodian Fees. The Portfolio could have employed the assets used by the custodian and/or transfer agent to produce income if it had not entered into an expense offset arrangement.
The Portfolio may invest in money market funds, including funds managed by Janus Capital. During the fiscal year ended December 31, 2006, the Portfolio recorded distributions from affiliated investment companies as affiliated dividend income, and had the following affiliated purchases and sales:
| Purchases Shares/Cost | Sales Shares/Cost | Dividend Income | Value at 12/31/06 | ||||||||||||||||
| Janus Aspen Foreign Stock Portfolio | |||||||||||||||||||
| Janus Government Money Market Fund | $ | 318,657 | $ | 318,657 | $ | 1,518 | $ | – | |||||||||||
| Janus Institutional Cash Reserves Fund | 2,191,659 | 1,545,673 | 29,927 | 645,986 | |||||||||||||||
| Janus Money Market Fund | 976,670 | 976,670 | 15,346 | – | |||||||||||||||
| $ | 3,486,986 | $ | 2,841,000 | $ | 46,791 | $ | 645,986 | ||||||||||||
3. FEDERAL INCOME TAX
The tax components of capital shown in the table below represent: (1) distribution requirements the Portfolio must satisfy under the income tax regulations; (2) losses or deductions the Portfolio may be able to offset against income and gains realized in future years; and (3) unrealized appreciation or depreciation of investments for federal income tax purposes.
Other book to tax differences in the current year primarily consist of foreign currency contract adjustments. The Portfolio has elected to treat gains and losses on forward foreign currency contracts as capital gains and losses. Other foreign currency gains and losses on debt instruments are treated as ordinary income for federal income tax purposes pursuant to Section 988 of the Internal Revenue Code.
| Portfolio Undistributed Ordinary Income Undistributed Long-Term Gains | Accumulated Capital Losses | Post-October Deferral | Other Book to Tax Differences | Net Tax Appreciation/ (Depreciation) | |||||||||||||||
| Janus Aspen Foreign Stock Portfolio $– $532,781 | $ | – | $ | – | $ | 433 | $ | 5,989,115 | |||||||||||
The aggregate cost of investments and the composition of unrealized appreciation and depreciation of investment securities for federal income tax purposes as of December 31, 2006 are noted below.
Unrealized appreciation and unrealized depreciation in the table below exclude appreciation/depreciation on foreign currency translations. The primary difference between book and tax appreciation or depreciation of investments is wash sale loss deferrals.
| Portfolio | Federal Tax Cost | Unrealized Appreciation | Unrealized (Depreciation) | ||||||||||||
| Janus Aspen Foreign Stock Portfolio | $ | 13,033,285 | $ | 6,054,605 | $ | (65,490 | ) | ||||||||
16 Janus Aspen Series December 31, 2006
Income and capital gains distributions are determined in accordance with income tax regulations that may differ from accounting principles generally accepted in the United States of America. These differences are due to differing treatments for items such as net short-term gains, deferral of wash sale losses, foreign currency transactions, net investment losses and capital loss carryovers. Certain permanent differences such as tax returns of capital and net investment losses noted below have been reclassified to paid-in capital.
For the fiscal year ended December 31, 2006
| Distributions | |||||||||||||||||||
| Portfolio | From Ordinary Income | From Long-Term Capital Gains | Tax Return of Capital | Net Investment Loss | |||||||||||||||
| Janus Aspen Foreign Stock Portfolio | $ | 201,653 | $ | 566,799 | $ | – | $ | – | |||||||||||
For the fiscal year ended December 31, 2005
| Distributions | |||||||||||||||||||
| Portfolio | From Ordinary Income | From Long-Term Capital Gains | Tax Return of Capital | Net Investment Loss | |||||||||||||||
| Janus Aspen Foreign Stock Portfolio | $ | 131,408 | $ | – | $ | – | $ | – | |||||||||||
4. EXPENSE RATIOS
The expense ratios listed in the Financial Highlights reflect expenses prior to any expense offsets (gross expense ratio) and after expense offsets (net expense ratio). Both expense ratios reflect expenses after waivers (reimbursement). Listed below are the gross expense ratios for the Portfolio that would be in effect, absent the waiver of certain fees and offsets.
| For each fiscal year ended December 31 | |||||||||||||||||||||||
| Service Shares | |||||||||||||||||||||||
| Portfolio | 2006(1) | 2005(1) | 2004(1) | 2003 | 2002 | ||||||||||||||||||
| Janus Aspen Foreign Stock Portfolio | 1.69 | % | 1.45 | % | 1.46 | % | 1.89 | % | 2.54 | % | |||||||||||||
(1) The effect of non-recurring costs assumed by Janus Capital (Note 2) is included in the ratio of operating expenses to average net assets without waivers and/or expense reimbursements and was less than 0.01%.
5. CAPITAL SHARE TRANSACTIONS
| Janus Aspen Foreign Stock | |||||||||||
| For the fiscal year ended December 31 | Portfolio | ||||||||||
| (all numbers are in thousands) | 2006 | 2005 | |||||||||
| Transactions in Portfolio Shares – Service Shares | |||||||||||
| Shares sold | 209 | 391 | |||||||||
| Reinvested dividends and distributions | 49 | 9 | |||||||||
| Shares repurchased | (181 | ) | (543 | ) | |||||||
| Net Increase/(Decrease) in Portfolio Shares | 77 | (143 | ) | ||||||||
| Shares Outstanding, Beginning of Period | 1,056 | 1,199 | |||||||||
| Shares Outstanding, End of Period | 1,133 | 1,056 | |||||||||
6. PURCHASES AND SALES OF INVESTMENT SECURITIES
For the fiscal year ended December 31, 2006, the aggregate cost of purchases and proceeds from sales of investment securities (excluding short-term securities) were as follows:
| Portfolio | Purchases of Securities | Proceeds from Sales of Securities | Purchases of Long-Term U.S. Government Obligations | Proceeds from Sales of Long-Term U.S. Government Obligations | |||||||||||||||
| Janus Aspen Foreign Stock Portfolio | $ | 3,391,421 | $ | 2,461,750 | $ | – | $ | – | |||||||||||
Janus Aspen Series December 31, 2006 17
Notes to Financial Statements (continued)
7. PENDING LEGAL MATTERS
In the fall of 2003, the Securities and Exchange Commission ("SEC"), the Office of the New York State Attorney General ("NYAG"), the Colorado Attorney General ("COAG"), and the Colorado Division of Securities ("CDS") announced that they were investigating alleged frequent trading practices in the mutual fund industry. On August 18, 2004, Janus Capital announced that it had reached final settlements with the SEC, the NYAG, the COAG, and the CDS related to such regulators' investigations into Janus Capital's frequent trading arrangements.
A number of civil lawsuits were brought against Janus Capital and certain of its affiliates, the Janus funds, and related entities and individuals based on allegations similar to those announced by the above regulators and were filed in several state and federal jurisdictions. Such lawsuits alleged a variety of theories for recovery including, but not limited to, the federal securities laws, other federal statutes (including ERISA), and various common law doctrines. The Judicial Panel on Multidistrict Litigation transferred these actions to the U.S. District Court for the District of Maryland (the "Court") for coordinated proceedings. On September 29, 2004, five consolidated amended complaints were filed with the Court that generally include: (i) claims by a putative class of investors in certain Janus funds asserting claims on behalf of the investor class (Marini, et al. v. Janus Investment Fund, et al., U.S. District Court, District of Maryland, Case No. 04-CV-00497); (ii) derivative claims by investors in certain Janus funds ostensibly on behalf of such funds (Steinberg et al. v. Janus Capital Management, LLC et al., U.S. District Court, District of Maryland, Case No. 04-CV-00518); (iii) claims on behalf of participants in the Janus 401(k) plan (Wangberger v. Janus Capital Group Inc., 401(k) Advisory Committee, et al., U.S. District Court, District of Maryland, Case No. JFM-05-2711); (iv) claims brought on behalf of shareholders of Janus Capital Group Inc. ("JCGI") on a derivative basis against the Board of Directors of JCGI (Chasen v. Whiston, et al., U.S. District Court, District of Maryland, Case No. 04-MD-00855); and (v) claims by a putative class of shareholders of JCGI asserting claims on behalf of the shareholders (Wiggins, et al. v. Janus Capital Group, Inc., et al., U.S. District Court, District of Maryland, Case No. 04-CV-00818). In addition, the following were also named as defendants in one or more of the actions: Janus Investment Fund ("JIF"), Janus Aspen Series ("JAS"), Janus Adviser Series ("JAD"), Janus Distributors LLC, Enhanced Investment Technologies, LLC ("INTECH"), Bay Isle F inancial LLC ("Bay Isle"), Perkins, Wolf, McDonnell and Company, LLC ("Perkins"), the Advisory Committee of the Janus 401(k) plan, and the current or former directors of JCGI.
On August 25, 2005, the Court entered orders dismissing most of the claims asserted against Janus Capital and its affiliates by fund investors (actions (i) and (ii) described above), except certain claims under Section 10(b) of the Securities Exchange Act of 1934 and under Section 36(b) of the Investment Company Act of 1940, as amended (the "1940 Act"). On August 15, 2006, the complaint in the 401(k) plan class action (action (iii) described above) was dismissed by the district court with prejudice; the plaintiff has appealed that dismissal decision to the United States Court of Appeals for the Fourth Circuit. The Court also dismissed the action against JCGI's Board of Directors without leave to amend (action (iv) described above). Finally, a Motion to Dismiss the action brought by JCGI shareholders (action (v) described above) is fully briefed and pending before the Cou rt.
In addition to the lawsuits described above, the Auditor of the State of West Virginia ("Auditor"), in his capacity as securities commissioner, has initiated administrative proceedings against many of the defendants in the market timing cases (including JCGI and Janus Capital) and, as a part of its relief, is seeking disgorgement and other monetary relief based on similar market timing allegations (In the Matter of Janus Capital Group Inc. et al., Before the Securities Commissioner, State of West Virginia, Summary Order No. 05-1320). The respondents in these proceedings collectively sought a Writ of Prohibition in state court, which was denied. Their subsequent Petition for Appeal was also denied. Consequently, in September 2006, JCGI and Janus Capital filed their answer to the A uditor's summary order instituting proceedings and requested a hearing. JCGI and Janus Capital, as well as other similarly situated defendants, continue to challenge the statutory authority of the Auditor to bring such an action. No further proceedings are currently scheduled.
In addition to the "market timing" actions described above, Janus Capital is a defendant in a consolidated lawsuit in the U.S. District Court for the District of Colorado challenging the investment advisory fees charged by Janus Capital to certain Janus funds (Walter Sins, et al. v. Janus Capital Management LLC, U.S. District Court, District of Colorado, Case No. 04-CV-01647-WDM-MEH; Michael Fleisher, et al. v. Janus Capital Management, LLC, 04-CV-02395-MSK-CBS). The action was filed in 2004 by fund investors asserting breach of fiduciary duty under Section 36(b) of the 1940 Act. The plaintiffs seek declaratory and injunctive relief and an unspecified amount of damages. The trial is scheduled to commence on May 21, 2007.
In 2001, Janus Capital's predecessor was also named as a defendant in a class action suit in the U.S. District Court for the Southern District of New York, alleging that certain underwriting firms and institutional investors violated antitrust laws in connection with initial public offerings (Pfeiffer v. Credit Suisse First Boston aka In re Initial Public Offering Antitrust Litigation, U.S. District Court, Southern District of New York, Case No. 01-CV-2014). The U.S. District Court dismissed the plaintiff's antitrust claims in November 2003; however, the U.S. Court of Appeals vacated
18 Janus Aspen Series December 31, 2006
that decision and remanded it for further proceedings. In March 2006, the defendants, including Janus Capital, filed a Petition for a Writ of Certiorari with the U.S. Supreme Court to review the decision of the U.S. Court of Appeals. In June 2006, the U.S. Supreme Court invited the U.S. Solicitor General to file a brief expressing the view of the United States, and in November 2006, the Solicitor General filed a brief expressing its view on the matter. The U.S. Supreme Court has granted the Petition for a Writ of Certiorari and the parties are in the process of briefing the matter for the U.S. Supreme Court.
Additional lawsuits may be filed against certain of the Janus funds, Janus Capital, and related parties in the future. Janus Capital does not currently believe that these pending actions will materially affect its ability to continue providing services it has agreed to provide to the Janus funds.
Janus Aspen Series December 31, 2006 19
Report of Independent Registered Public Accounting Firm
To the Trustees and Shareholders
of Janus Aspen Foreign Stock Portfolio
In our opinion, the accompanying statement of assets and liabilities, including the schedule of investments, and the related statements of operations and of changes in net assets and the financial highlights present fairly, in all material respects, the financial position of Janus Aspen Foreign Stock Portfolio (one of the portfolios constituting Janus Aspen Series, hereafter referred to as the "Portfolio") at December 31, 2006, the results of its operations for the year then ended, the changes in its net assets for each of the two years in the period then ended, and the financial highlights for each of the five years in the period then ended, in conformity with accounting principles generally accepted in the United States of America. These financial statements and financial highlights (hereafter referred to as "financial statements") are the responsibility of the Portfolio's management; our responsibility is to express an opinion on these fi nancial statements based on our audits. We conducted our audits of these financial statements in accordance with the standards of the Public Company Accounting Oversight Board (United States). Those standards require that we plan and perform the audit to obtain reasonable assurance about whether the financial statements are free of material misstatement. An audit includes examining, on a test basis, evidence supporting the amounts and disclosures in the financial statements, assessing the accounting principles used and significant estimates made by management, and evaluating the overall financial statement presentation. We believe that our audits, which included confirmation of securities at December 31, 2006 by correspondence with the custodian, transfer agent and brokers, and the application of alternative auditing procedures where securities purchased had not been received, provide a reasonable basis for our opinion.

PricewaterhouseCoopers LLP
Denver, Colorado
February 12, 2007
20 Janus Aspen Series December 31, 2006
Additional Information (unaudited)
PROXY VOTING POLICIES AND VOTING RECORD
A description of the policies and procedures that the Portfolio uses to determine how to vote proxies relating to its portfolio securities is available: (i) without charge, upon request, by calling 1-800-525-0020 (toll free); (ii) on the Portfolio's website at www.janus.com/proxyvoting; and (iii) on the SEC's website at http://www.sec.gov. Additionally, information regarding the Portfolio's proxy voting record for the most recent twelve- month period ended June 30 is also available, free of charge, through www.janus.com/proxyvoting and from the SEC's website at http://www.sec.gov.
QUARTERLY PORTFOLIO HOLDINGS
The Portfolio files its complete portfolio holdings (schedule of investments) with the SEC for the first and third quarters of each fiscal year on Form N-Q within 60 days of the end of such fiscal quarter. The Portfolio's Form N-Q: (i) is available on the SEC's website at http://www.sec.gov; (ii) may be reviewed and copied at the SEC's Public Reference Room in Washington, D.C. (information on the Public Reference Room may be obtained by calling 1-800-SEC-0330); and (iii) is available without charge, upon request, by calling Janus at 1-800-525-0020 (toll free).
APPROVAL OF ADVISORY AGREEMENTS DURING THE PERIOD
The Trustees of Janus Aspen Series, more than eighty-five percent of whom have never been affiliated with the Adviser ("Independent Trustees"), oversee the management of each of the Portfolios and, as required by law, determine annually whether to continue the investment advisory agreement for each Portfolio and the subadvisory agreements for the three Portfolios that utilize subadvisers.
In connection with their most recent consideration of those agreements for each of the Portfolios, the Trustees received and reviewed a substantial amount of information provided by Janus Capital (the "Adviser") and the respective subadvisers in response to requests of the Independent Trustees and their independent legal counsel. They also received and reviewed a considerable amount of information and analysis provided to the Trustees by their independent fee consultant. Throughout their consideration of the agreements the Independent Trustees were advised by their independent legal counsel. The Independent Trustees met on two separate occasions with management to consider the agreements, and at each of those meetings they also met separately in executive session with their independent legal counsel.
At a meeting held on December 20, 2006, based on their evaluation of the information provided by the Adviser, the subadvisers and the independent fee consultant and other information, the Trustees determined that the overall arrangements between each Portfolio and the Adviser were fair and reasonable in light of the nature, extent and quality of the services provided by the Adviser, its affiliates and the subadvisers, the fees charged for those services, and other matters that the Trustees considered relevant in the exercise of their business judgment. At that meeting all of the Trustees unanimously approved the continuation of the investment advisory agreement for each Portfolio, and the subadvisory agreement for each subadvised Portfolio, for the period from February 1, 2007 through February 1, 2008, subject to earlier termination as provided in each agreement.
In considering the continuation of those agreements, the Trustees reviewed and analyzed various factors that they determined were relevant, including the factors described below, none of which by itself was considered dispositive. However, the material factors and conclusions that formed basis for the Trustees' determination to approve the continuation of the agreements are discussed separately below.
Nature, Extent and Quality of Services
The Trustees reviewed the nature, extent and quality of the services of Janus Capital and the subadvisers to the Funds, taking into account the investment objective and strategy of each Portfolio and the knowledge the Trustees gained from their regular meetings with management on at least a quarterly basis and their ongoing review of information related to the Funds. In addition, the Trustees reviewed the resources and key personnel of Janus Capital and each subadviser, especially those who provide investment management services to the Portfolios. The Trustees also considered other services provided to the Portfolios by Janus Capital or the subadvisers, such as managing the execution of portfolio transactions and the selection of broker-dealers for those transactions, serving as the Portfolios' administrator, monitoring adherence to the Portfolios' investment restrictions, producing shareholder reports, providing support services for the Tru stees and Trustee committees, communicating with shareholders and overseeing the activities of other service providers, including monitoring compliance with various policies and procedures of the Portfolios and with applicable securities laws and regulations.
The Trustees concluded that: the nature, extent and quality of the services provided by Janus Capital or the subadviser to each Portfolio were appropriate and consistent with the terms of the respective advisory and subadvisory agreements; that, taking into account steps taken to address a small portion of the Portfolios whose performance lagged that of their peers for certain periods, the quality of those services had been consistent with or superior to quality norms in the industry; and that the Portfolios were likely to benefit from the continued provision of those services. They also concluded that each of Janus Capital and each
Janus Aspen Series December 31, 2006 21
Additional Information (continued)
subadviser had sufficient personnel, with the appropriate education and experience, to serve the Portfolios effectively and had demonstrated its continuing ability to attract and retain well-qualified personnel.
Performance of the Funds
The Trustees considered the performance results of each Portfolio over various time periods. They reviewed information comparing each Portfolio's performance with the performance of comparable funds and peer groups identified by Lipper Inc., an independent provider of investment company data, and with the Portfolio's benchmark. They concluded that the performance of most Portfolios was good to very good. Although the performance of some Portfolios lagged that of their peers for certain periods, the Trustees also concluded that Janus Capital had taken appropriate steps to address those instances of under-performance and that the more recent performance of most of those Portfolios had been improving.
Costs of Services Provided
The Trustees examined information on the fees and expenses of each Portfolio in comparison to similar information for other comparable funds as provided by Lipper. They also reviewed an analysis of that information provided by their independent fee consultant and noted that the rate of management (investment advisory and administrative) fees for most of the Portfolios, after contractual expense limitations, was below the mean management fee rate of the respective peer group of funds selected by Lipper.
The Trustees considered the methodology used by Janus Capital and each subadviser in determining compensation payable to portfolio managers, the competitive environment for investment management talent and the competitive market for mutual funds in different distribution channels. They concluded that the compensation methodology provided a good alignment of the interests of the portfolio managers with the interests of Portfolio shareholders.
The Trustees also reviewed management fees charged by Janus Capital to its separate account clients and to its subadvised funds (for which Janus Capital provides only portfolio management services). Although in most instances subadvisory and separate account fee rates for various investment strategies were lower than management fees for Portfolios having a similar strategy, the Trustees noted that Janus Capital performs significant additional services for the Portfolios that it does not provide to those other clients, including administrative services, oversight of the Portfolios' other service providers, trustee support, regulatory compliance and numerous other services, and that, in serving the Portfolios, Janus Capital assumes many legal risks that it does not assume in servicing its other clients. Moreover, they noted that the spread between the average fees charged to the Portfolios and the fees that Janus Capital charged to its separate account clients was significantly smaller than the average spread for such fees of other advisers, based on publicly available data and research conducted by their independent fee consultant.
In considering the fees charged by Janus Capital, the Trustees had previously negotiated with Janus Capital a temporary contingent waiver of a portion the investment advisory fee paid by Janus Aspen Worldwide Growth Portfolio to Janus Capital to provide for a possible reduction in the rate of advisory fee payable by the Portfolio for the period July 1, 2006 through January 31, 2007 if the investment performance of the Fund should lag that of its benchmark performance over the applicable performance measurement period. Commencing in February 2007, the previously approved performance-based fee schedule will become operative.
The Trustees reviewed information on the profitability of Janus Capital and its affiliates of their relationships with each Portfolio, as well as an explanation of the methodology utilized in allocating various expenses among the Portfolios and other clients. The Trustees also reviewed the financial statements of Janus Capital's parent company and its corporate structure. In their review, the Trustees considered whether Janus Capital and each subadviser receive adequate incentives to manage the Portfolios effectively. The Trustees recognized that profitability comparisons among fund managers are difficult because very little comparative information is publicly available and profitability of any manager is affected by numerous factors, including the organizational structure of the particular manager, the types of funds and other accounts it manages, possible other lines of business, the methodology for allocating expenses and the manager's ca pital structure and cost of capital. However, based on the information available and taking those factors into account, the Trustees concluded that Janus Capital's profitability with respect to each Portfolio in relation to the services rendered was not unreasonable.
The Trustees concluded that the management fees and other compensation payable by each Fund to Janus Capital and its affiliates, as well as the fees paid by Janus Capital to the subadvisers of subadvised Portfolios, were reasonable in relation to the nature and quality of the services provided, taking into account the fees charged by other advisers for managing comparable mutual funds with similar strategies and the fees Janus Capital and the subadviser charges to other clients. The Trustees also concluded that the overall expense ratio of each Portfolio was reasonable, taking into account the size of the Portfolio, the quality of services provided by Janus Capital and any subadviser, the
22 Janus Aspen Series December 31, 2006
investment performance of the Portfolio and any expense limitations agreed to by Janus Capital.
Economies of Scale
The Trustees considered information about the potential for Janus Capital to realize economies of scale as the assets of the Portfolios increase. They noted that, although most Portfolios pay advisory fees at a fixed rate as a percentage of net assets, without any breakpoints, the management fee paid by each Portfolio, after any contractual expense limitations, was below the mean management fee rate of the Portfolio's peer group selected by Lipper; and, for those Portfolios whose expenses are being reduced by the contractual expense limitations of Janus Capital, Janus Capital is subsidizing the Portfolios because they have not reached adequate scale. Moreover, as the assets of many of the Portfolios have declined in the past few years, the Portfolios have benefited from having advisory fee rates that have remained constant rather than increasing as assets decline. In addition, performance fee structures have been implemented for several Port folios that will cause the effective rate of advisory fees payable by such a Portfolio to vary depending on the investment performance of the Portfolio relative to its benchmark; and a few Portfolios have fee schedules with breakpoints and reduced fee rates above certain asset levels. The Trustees also noted that the Portfolios share directly in economies of scale through lower charges of third-party service providers based on the combined scale of all of the Portfolios. Based on all of the information they reviewed, the Trustees concluded that the current fee structure of each Portfolio was reasonable and that the current rates of fees do reflect a sharing between Janus Capital and the Portfolio of economies of scale at the current asset level of the Portfolio.
Other Benefits to Janus Capital
The Trustees also considered benefits that accrue to Janus Capital and its affiliates from their relationships with the Portfolios. They recognized that two affiliates of Janus Capital separately serve the Portfolios as transfer agent and distributor, respectively, and that the transfer agent receives compensation from the non-money market Portfolios for services provided. The Trustees also considered Janus Capital's use of commissions paid by Portfolios on their portfolio brokerage transactions to obtain proprietary research products and services benefiting the Portfolios and/or other clients of Janus Capital, as well as Janus Capital's agreement not to use any Portfolio's brokerage transactions to obtain third party research products or services. The Trustees concluded that Janus Capital's use of "soft" commission dollars to obtain proprietary research products and services was consistent with regulatory requirements and guidelines and was likely to benefit each Portfolio. The Trustees also concluded that, other than the services provided by Janus Capital and its affiliates pursuant to the agreements and the fees to be paid by each Portfolio therefor, the Portfolios and Janus Capital may potentially benefit from their relationship with each other in other ways. They concluded that Janus Capital benefits from the receipt of proprietary research products and services acquired through commissions paid on portfolio transactions of the Portfolios and that the Portfolios benefit from Janus Capital's receipt of those products and services as well as research products and services acquired through commissions paid by other clients of Janus Capital. They further concluded that success of any Portfolio could attract other business to Janus Capital or other Janus Funds and that the success of Janus Capital could enhance Janus Capital's ability to serve the Portfolios.
After full consideration of the above factors as well as other factors, all of the Trustees, including all of the Independent Trustees, concluded that the proposed continuation of the investment advisory agreement for each applicable Portfolio were in the best interest of the respective Portfolios and their shareholders.
Janus Aspen Series December 31, 2006 23
Explanations of Charts, Tables and
Financial Statements (unaudited)
1. PERFORMANCE OVERVIEWS
The performance overview graph compares the performance of a hypothetical $10,000 investment in the Portfolio with one or more widely used market indices. The hypothetical example does not represent the returns of any particular investment.
When comparing the performance of the Portfolio with an index, keep in mind that market indices do not include brokerage commissions that would be incurred if you purchased the individual securities in the index. They also do not include taxes payable on dividends and interest or operating expenses incurred if you maintained a Portfolio invested in the index.
Average annual total returns are quoted for each class of the Portfolio. Average annual total return is calculated by taking the growth or decline in value of an investment over a period of time, including reinvestment of any dividends, distributions and capital gains, then calculating the annual compounded percentage rate that would have produced the same result had the rate of growth been constant throughout the period. Average annual total return does not reflect the deduction of taxes that a shareholder would pay on Portfolio distributions or redemptions of Portfolio shares.
2. SCHEDULE OF INVESTMENTS
Following the performance overview section is the Portfolio's Schedule of Investments. This schedule reports the industry concentrations and types of securities held in the Portfolio on the last day of the reporting period. Securities are usually listed by type (common stock, corporate bonds, U.S. Government obligations, etc.) and by industry classification (banking, communications, insurance, etc.). Holdings are subject to change without notice.
The value of each security is quoted as of the last day of the reporting period. The value of securities denominated in foreign currencies is converted into U.S. dollars. Certain short-term investments maturing within 60 days are valued at amortized cost, which approximates market value.
A summary of investments by country is provided if the Portfolio invested in foreign securities. This summary reports the Portfolio's exposure to different countries by providing the percentage of securities invested in each country. The country of each security represents the country in which the company is incorporated.
2A. FORWARD CURRENCY CONTRACTS
A table listing forward currency contracts follows the Portfolio's Schedule of Investments (if applicable). Forward currency contracts are agreements to deliver or receive a preset amount of currency at a future date. Forward currency contracts are used to hedge against foreign currency risk in the Portfolio's long-term holdings. The table provides the name of the foreign currency, the settlement date of the contract, the amount of the contract, the value of the currency in U.S. dollars and the amount of unrealized gain or loss. The amount of unrealized gain or loss reflects the change in currency exchange rates from the time the contract was opened to the last day of the reporting period.
2B. FUTURES
A table listing futures contracts follows the Portfolio's Schedule of Investments (if applicable). Futures contracts are contracts that obligate the buyer to receive and the seller to deliver an instrument or money at a specified price on a specified date. Futures are used to hedge against adverse movements in securities prices, currency risk or interest rates.
The table provides the name of the contract, number of contracts held, the expiration date, the principal amount, value and the amount of unrealized gain or loss. The amount of unrealized gain or loss reflects the marked-to-market amount for the last day of the reporting period.
3. STATEMENT OF ASSETS AND LIABILITIES
This statement is often referred to as the "balance sheet." It lists the assets and liabilities of the Portfolio on the last day of the reporting period.
The Portfolio's assets are calculated by adding the value of the securities owned, the receivable for securities sold but not yet settled, the receivable for dividends declared but not yet received on stocks owned and the receivable for Portfolio shares sold to investors but not yet settled. The Portfolio's liabilities include payables for securities purchased but not yet settled, Portfolio shares redeemed but not yet paid and expenses owed but not yet paid. Additionally, there may be other assets and liabilities such as unrealized gain or loss on forward currency contracts.
The section entitled "Net Assets Consist of" breaks down the components of the Portfolio's net assets. Because the Portfolio must distribute substantially all earnings, you will notice that a significant portion of net assets is shareholder capital.
The last section of this statement reports the net asset value ("NAV") per share on the last day of the reporting period for each class of the Portfolio. The NAV is calculated by dividing the Portfolio's net assets (assets minus liabilities) by the number of shares outstanding.
4. STATEMENT OF OPERATIONS
This statement details the Portfolio's income, expenses, gains and losses on securities and currency transactions, and appreciation or depreciation of current Portfolio holdings.
24 Janus Aspen Series December 31, 2006
The first section in this statement, entitled "Investment Income," reports the dividends earned from stocks and interest earned from interest-bearing securities in the Portfolio.
The next section reports the expenses and expense offsets incurred by the Portfolio, including the advisory fee paid to the investment adviser and transfer agent fees and expenses, and printing and postage for mailing statements, financial reports and prospectuses. Expense offsets, if any, are also shown.
The last section lists the increase or decrease in the value of securities held in the Portfolio. The Portfolio realizes a gain (or loss) when it sells its position in a particular security. An unrealized gain (or loss) refers to the change in net appreciation or depreciation of the Portfolio during the reporting period. "Net Realized and Unrealized Gain/(Loss) on Investments" is affected both by changes in the market value of Portfolio holdings and by gains (or losses) realized during the reporting period.
5. STATEMENT OF CHANGES IN NET ASSETS
This statement reports the increase or decrease in the Portfolio's net assets during the reporting period. Changes in the Portfolio's net assets are attributable to investment operations, dividends, distributions and capital share transactions. This is important to investors because it shows exactly what caused the Portfolio's net asset size to change during the period.
The first section summarizes the information from the Statement of Operations regarding changes in net assets due to the Portfolio's investment performance. The Portfolio's net assets may also change as a result of dividend and capital gains distributions to investors. If investors receive their dividends in cash, money is taken out of the Portfolio to pay the distribution. If investors reinvest their dividends, the Portfolio's net assets will not be affected. If you compare the Portfolio's "Net Decrease from Dividends and Distributions" to the "Reinvested dividends and distributions," you will notice that dividend distributions had little effect on the Portfolio's net assets. This is because the majority of Janus investors reinvest their distributions.
The reinvestment of dividends is included under "Capital Share Transactions." "Capital Shares" refers to the money investors contribute to the Portfolio through purchases or withdraw via redemptions. The Portfolio's net assets will increase and decrease in value as investors purchase and redeem shares from the Portfolio.
6. FINANCIAL HIGHLIGHTS
This schedule provides a per-share breakdown of the components that affect the Portfolio's NAV for current and past reporting periods for each class of the Portfolio. Not only does this table provide you with total return, it also reports total distributions, asset size, expense ratios and portfolio turnover rate.
The first line in the table reflects the NAV per share at the beginning of the reporting period. The next line reports the net investment income per share, which comprises dividends and interest income earned on securities held by the Portfolio. Following is the total of gains/(losses), realized and unrealized. Dividends and distributions are then subtracted to arrive at the NAV per share at the end of the period. The next line reflects the average annual total return reported the last day of the period.
Also included are the expense ratios, or the percentage of net assets that are used to cover operating expenses during the period. Expense ratios vary for a number of reasons, including the differences in management fees, the average shareholder account size and the extent of foreign investments, which entail greater transaction costs.
The Portfolio's expenses may be reduced through expense reduction arrangements. These arrangements may include the use of balance credits or transfer agent fee offsets. The Statement of Operations reflects total expenses before any such offset, the amount of offset and the net expenses. The expense ratios listed in the Financial Highlights reflect total expenses prior to any expense offsets (gross expense ratio) and after the expense offsets (net expense ratio). Both expense ratios reflect expenses after waivers (reimbursements), if applicable.
The ratio of net investment income/(loss) summarizes the income earned less expenses, divided by the average net assets of the Portfolio during the reporting period. Don't confuse this ratio with the Portfolio's yield. The net investment income ratio is not a true measure of the Portfolio's yield because it doesn't take into account the dividends distributed to the Portfolio's investors.
The next ratio is the portfolio turnover rate, which measures the buying and selling activity in a Portfolio. Portfolio turnover is affected by market conditions, changes in the asset size of a Portfolio, the nature of the Portfolio's investments and the investment style of the portfolio manager. A 100% rate implies that an amount equal to the value of the entire portfolio is turned over in a year; a 50% rate means that an amount equal to the value of half the portfolio is traded in a year; and a 200% rate means that an amount equal to the value of the portfolio is traded every six months.
Janus Aspen Series December 31, 2006 25
Designation Requirements (unaudited)
For federal income tax purposes, the Portfolio designated the following for the year ended December 31, 2006:
Capital Gain Distributions
| Portfolio | |||||||
| Janus Aspen Foreign Stock Portfolio | $ | 566,799 | |||||
Foreign Taxes Paid and Foreign Source Income
| Portfolio | Foreign Taxes Paid | Foreign Source Income | |||||||||
| Janus Aspen Foreign Stock Portfolio | $ | 20,871 | $ | 386,827 | |||||||
26 Janus Aspen Series December 31, 2006
Trustees and Officers (unaudited)
The Portfolio's Statement of Additional Information includes additional information about the Trustees and officers and is available, without charge, by calling 1-800-525-0020.
The following are the Trustees and officers of the Trust, together with a brief description of their principal occupations during the last five years (principal occupations for certain Trustees may include periods over five years).
Each Trustee has served in that capacity since he or she was originally elected or appointed. The Trustees do not serve a specified term of office. Each Trustee will hold office until the termination of the Trust or his or her earlier death, resignation, retirement, incapacity or removal. The retirement age for Trustees is 72. The Portfolio's Nominating and Governance Committee will consider nominees for the position of Trustee
recommended by shareholders. Shareholders may submit the name of a candidate for consideration by the Committee by submitting their recommendations to the Trust's Secretary. Each Trustee is currently a Trustee of two other registered investment companies advised by Janus Capital: Janus Investment Fund and Janus Adviser Series. As of the date of this report, collectively, these three registered investment companies consist of 69 series or funds.
The Trust's officers are elected annually by the Trustees for a one-year term. Certain officers also serve as officers of Janus Investment Fund and Janus Adviser Series. Certain officers of the Portfolio may also be officers and/or directors of Janus Capital. Portfolio officers receive no compensation from the Portfolio, except for the Portfolio's Chief Compliance Officer, as authorized by the Trustees.
Trustees
| Name, Age and Address | Positions Held with Portfolio | Length of Time Served | Principal Occupations During the Past Five Years | Number of Portfolios in Fund Complex Overseen by Trustee | Other Directorships Held by Trustee | ||||||||||||||||||
| Independent Trustees | |||||||||||||||||||||||
| Dennis B. Mullen 151 Detroit Street Denver, CO 80206 Age 63 | Chairman Trustee | 3/04-Present 9/93-Present | Chief Executive Officer of Red Robin Gourmet Burgers, Inc. (since 2005). Formerly, private investor. | 69 | * | Chairman of the Board (since 2005) and Director of Red Robin Gourmet Burgers, Inc.; and Director of Janus Capital Funds Plc (Dublin-based, non-U.S. funds). | |||||||||||||||||
| Jerome S. Contro 151 Detroit Street Denver, CO 80206 Age 50 | Trustee | 12/05-Present | Partner of Tango Group, a private investment firm (since 1999). | 69 | Trustee and Chairman of RS Investment Trust (since 2001); Director of IZZE Beverages and MyFamily.com, Inc. (genealogical research website). | ||||||||||||||||||
| William F. McCalpin 151 Detroit Street Denver, CO 80206 Age 49 | Trustee | 6/02-Present | Private Investor. Formerly, Vice President of Asian Cultural Council and Executive Vice President and Chief Operating Officer of The Rockefeller Brothers Fund (a private family foundation). | 69 | Director of the F.B. Heron Foundation (a private grantmaking foundation). | ||||||||||||||||||
| John W. McCarter, Jr. 151 Detroit Street Denver, CO 80206 Age 68 | Trustee | 6/02-Present | President and Chief Executive Officer of The Field Museum of Natural History (Chicago, IL). | 69 | Chairman of the Board and Director of Divergence Inc. (biotechnology firm); Director of W.W. Grainger, Inc. (industrial distributor); and Trustee of WTTW (Chicago public television station) and the University of Chicago. | ||||||||||||||||||
Janus Aspen Series December 31, 2006 27
Trustees and Officers (unaudited) (continued)
Trustees (cont.)
| Name, Age and Address | Positions Held with Portfolio | Length of Time Served | Principal Occupations During the Past Five Years | Number of Portfolios in Fund Complex Overseen by Trustee | Other Directorships Held by Trustee | ||||||||||||||||||
| Independent Trustees (cont.) | |||||||||||||||||||||||
| James T. Rothe 151 Detroit Street Denver, CO 80206 Age 63 | Trustee | 1/97-Present | Co-founder and Managing Director of Roaring Fork Capital Management, LLC (private investment in public equity firm); and Professor Emeritus of Business of the University of Colorado, Colorado Springs, CO (since 2004). Formerly, Professor of Business of the University of Colorado (2002-2004); and Distinguished Visiting Professor of Business (2001-2002) of Thunderbird University (American Graduate School of International Management), Glendale, AZ. | 69 | Director of Red Robin Gourmet Burgers, Inc. | ||||||||||||||||||
| William D. Stewart 151 Detroit Street Denver, CO 80206 Age 62 | Trustee | 9/93-Present | Corporate Vice President and General Manager of MKS Instruments – HPS Products, Boulder, CO (a manufacturer of vacuum fittings and valves). | 69 | N/A | ||||||||||||||||||
| Martin H. Waldinger 151 Detroit Street Denver, CO 80206 Age 68 | Trustee | 9/93-Present | Private Investor and Consultant to California Planned Unit Developments. Formerly, CEO and President of Marwal, Inc. (homeowner association management company). | 69 | N/A | ||||||||||||||||||
| Linda S. Wolf 151 Detroit Street Denver, CO 80206 Age 59 | Trustee | 12/05-Present | Retired. Formerly, Chairman and Chief Executive Officer of Leo Burnett (Worldwide) (advertising agency) (2001-2005). | 69 | Director of Wal-Mart, The Field Museum of Natural History (Chicago, IL), Children's Memorial Hospital (Chicago, IL), Chicago Council on Foreign Relations, Economic Club of Chicago, and InnerWorkings (a provider of print procurement solutions). | ||||||||||||||||||
| Interested Trustee | |||||||||||||||||||||||
| Thomas H. Bailey** 151 Detroit Street Denver, CO 80206 Age 69 | Trustee | 5/93-Present | Retired. Formerly, President (1978-2002) and Chief Executive Officer (1994-2002) of Janus Capital or Janus Capital Corporation; Chairman and Director (1978-2002) of Janus Capital Corporation; President and Director (1994-2002) of The Janus Foundation. | 69 | N/A | ||||||||||||||||||
* Mr. Mullen also serves as director of Janus Capital Funds Plc, consisting of 22 funds. Including Janus Capital Funds Plc and the 69 funds comprising the Janus Funds, Mr. Mullen oversees 91 funds.
** The Portfolio is treating Mr. Bailey as an "interested person" of the Trust by virtue of his past positions and continuing relationships with Janus Capital and ownership of shares of Janus Capital's parent company.
28 Janus Aspen Series December 31, 2006
Officers
| Name, Age and Address | Positions Held with Portfolio | Term of Office* and Length of Time Served | Principal Occupations During the Past Five Years | ||||||||||||
| Jason P. Yee 151 Detroit Street Denver, CO 80206 Age 37 | Executive Vice President and Portfolio Manager Janus Aspen Foreign Stock Portfolio | 3/01-Present | Vice President of Janus Capital and Portfolio Manager for other Janus accounts. | ||||||||||||
| Stephanie Grauerholz-Lofton 151 Detroit Street Denver, CO 80206 Age 36 | Chief Legal Counsel and Secretary Vice President | 1/06-Present 03/06 - Present | Assistant Vice President of Janus Capital and Janus Distributors LLC; and Associate Counsel of Janus Capital. Formerly, Associate of Vedder, Price, Kaufman & Kammholz, P.C. (1999-2003). | ||||||||||||
| Kelley Abbott Howes 151 Detroit Street Denver, CO 80206 Age 41 | President and Chief Executive Officer | 1/06-Present | President of Janus Services LLC; Senior Vice President and General Counsel of Janus Capital; and Senior Vice President and Assistant General Counsel of Janus Distributors LLC. Formerly, Vice President (1999-2005) of Janus Distributors LLC; Senior Vice President and General Counsel (2004-2006), Vice President (2000-2004), and Assistant General Counsel (2002-2004) of Janus Services LLC; and Vice President and Assistant General Counsel (1999-2004) of Janus Capital. | ||||||||||||
| David R. Kowalski 151 Detroit Street Denver, CO 80206 Age 49 | Vice President and Chief Compliance Officer | 6/02-Present | Senior Vice President and Chief Compliance Officer of Janus Capital, Janus Distributors LLC, and Janus Services LLC; Chief Compliance Officer of Bay Isle Financial LLC; and Vice President of Enhanced Investment Technologies LLC. Formerly, Chief Compliance Officer of Enhanced Investment Technologies, LLC (2003-2005); Vice President of Janus Capital (2000-2005), Janus Distributors LLC (2000-2001), and Janus Services LLC (2004-2005); and Assistant Vice President of Janus Services LLC (2002-2004). | ||||||||||||
| Jesper Nergaard 151 Detroit Street Denver, CO 80206 Age 44 | Chief Financial Officer Vice President, Treasurer, and Principal Accounting Officer | 3/05-Present 2/05-Present | Vice President of Janus Capital. Formerly, Director of Financial Reporting for OppenheimerFunds, Inc. (2004-2005); Site Manager and First Vice President of Mellon Global Securities Services (2003); and Director of Fund Accounting, Project Development, and Training of INVESCO Funds Group (1994-2003). | ||||||||||||
* Officers are elected at least annually for a one-year term and may also be elected from time to time by the Trustees for an interim period.
Janus Aspen Series December 31, 2006 29
Janus provides access to a wide range of investment disciplines.
Growth
Janus growth portfolios focus on companies believed to be the leaders in their respective industries, with solid management teams, expanding market share, margins and efficiencies.
Core
Janus core portfolios seek investments in more stable and predictable companies. These portfolios look for a strategic combination of steady growth and for certain portfolios, some degree of income.
Risk-Managed
Our risk-managed portfolios seek to outperform their respective indices while maintaining a risk profile equal to or lower than the index itself. Managed by INTECH (a Janus subsidiary), these portfolios use a mathematical process in an attempt to build a more "efficient" portfolio than the index.
Value
Janus value portfolios invest in companies they believe are poised for a turnaround or are trading at a significant discount to fair value. The goal is to gain unique insight into a company's true value and identify and evaluate potential catalysts that may unlock shareholder value.
International & Global
Janus international and global portfolios seek to leverage Janus' research capabilities by taking advantage of inefficiencies in foreign markets, where accurate information and analytical insight are often at a premium.
Bond & Money Market
Janus bond portfolios attempt to provide less risk relative to equities while seeking to deliver a competitive total return through high current income and appreciation. Janus money market portfolios seek maximum current income consistent with stability of capital.
For more information about our funds, contact your investment professional or go to www.janus.com/info
Please consider the charges, risks, expenses and investment objectives carefully before investing. For a prospectus containing this and other information, please call Janus at 1-800-525-0020 or download the file from www.janus.com/info. Read it carefully before you invest or send money.
An investment in a money market portfolio is not insured or guaranteed by the Federal Deposit Insurance Corporation or any other government agency. Although the Portfolio seeks to preserve the value of your investment at $1.00 per share, it is possible to lose money by investing in the Portfolio.

151 Detroit Street
Denver, CO 80206
1-800-525-0020
Portfolio distributed by Janus Distributors LLC (1/07)
C-0207-169 109-02-716 01-07
2006 Annual Report
Janus Aspen Series
Janus Aspen Forty Portfolio
Look Inside. . .
• Portfolio management perspective
• Investment strategy behind your portfolio
• Portfolio performance, characteristics and holdings

Table of Contents
| Useful Information About Your Portfolio Report | 1 | ||||||
| Management Commentary and Schedule of Investments | 2 | ||||||
| Statement of Assets and Liabilities | 8 | ||||||
| Statement of Operations | 9 | ||||||
| Statements of Changes in Net Assets | 10 | ||||||
| Financial Highlights | 11 | ||||||
| Notes to Schedule of Investments | 12 | ||||||
| Notes to Financial Statements | 13 | ||||||
| Report of Independent Registered Public Accounting Firm | 21 | ||||||
| Additional Information | 22 | ||||||
| Explanations of Charts, Tables and Financial Statements | 25 | ||||||
| Designation Requirements | 27 | ||||||
| Trustees and Officers | 28 | ||||||
Please consider the charges, risks, expenses and investment objectives carefully before investing. For a prospectus containing this and other information, please call Janus at 1-800-525-0020 or download the file from www.janus.com/info. Read it carefully before you invest or send money.
Useful Information About Your Portfolio Report
Management Commentary
The Management Commentary in this report includes valuable insight from the Portfolio's manager as well as statistical information to help you understand how your Portfolio's performance and characteristics stack up against those of comparable indices.
Please keep in mind that the opinions expressed by the Portfolio's manager in the Management Commentary are just that: opinions. They are a reflection of the manager's best judgment at the time this report was compiled, which was December 31, 2006. As the investing environment changes, so could the manager's opinions. The views are unique to the manager and aren't necessarily shared by his fellow employees or by Janus in general.
Portfolio Expenses
We believe it's important for our shareholders to have a clear understanding of Portfolio expenses and the impact they have on investment return.
The following is important information regarding the Portfolio's Expense Example, which appears in the Management Commentary within this Annual Report. Please refer to this information when reviewing the Expense Example for the Portfolio.
Example
As a shareholder of a Portfolio, you incur two types of costs: (1) transaction costs, including redemption fees (where applicable) (and any related exchange fees) and (2) ongoing costs, including management fees; distribution and shareholder servicing (12b-1) fees (applicable to Service Shares only); and other Portfolio expenses. The example is intended to help you understand your ongoing costs (in dollars) of investing in a Portfolio and to compare these costs with the ongoing costs of investing in other mutual funds. To do so, compare this 5% hypothetical example with the 5% hypothetical examples that appear in the shareholder reports of the other funds. The example is based upon an investment of $1,000 invested at the beginning of the period and held for the six-month period from July 1, 2006 to December 31, 2006.
Actual Expenses
The first line of the table in each example provides information about actual account values and actual expenses. You may use the information in this line, together with the amount you invested, to estimate the expenses that you paid over the period. Simply divide your account value by $1,000 (for example, an $8,600 account value divided by $1,000 = 8.6), then multiply the result by the number in the first line under the heading entitled "Expenses Paid During Period" to estimate the expenses you paid on your account during the period.
Hypothetical Example for Comparison Purposes
The second line of the table in each example provides information about hypothetical account values and hypothetical expenses based upon the Portfolio's actual expense ratio and an assumed rate of return of 5% per year before expenses which is not the Portfolio's actual return. The hypothetical account values and expenses may not be used to estimate the actual ending account balance or expenses you paid for the period. You may use this information to compare the ongoing costs of investing in the Portfolio and other funds. To do so, compare this 5% hypothetical example with the 5% hypothetical examples that appear in the shareholder reports of the other funds.
Please note that the expenses shown in the tables are meant to highlight your ongoing costs only and do not reflect any transaction costs, such as redemption fees (where applicable) and any charges at the separate account level or contract level. Redemption fees are fully described in the prospectus. Therefore, the second line of each table is useful in comparing ongoing costs only, and will not help you determine the relative total costs of owning different funds. In addition, if these transaction costs and separate account or contract level charges were included, your costs would have been higher.
Janus Aspen Series December 31, 2006 1
Janus Aspen Forty Portfolio (unaudited)
Portfolio Snapshot
This portfolio invests primarily in a concentrated portfolio of companies of any size, including large-capitalization domestic companies and faster-growing, medium and small-sized companies.

Scott Schoelzel
portfolio manager
Performance Overview
As I begin my tenth year managing the Portfolio, I would like to first and foremost thank each of you for your continued investment and confidence in Janus Aspen Forty Portfolio; it continues to be a genuine honor to manage your investment in the Portfolio.
For the 12-month period ended December 31, 2006, Janus Aspen Forty Portfolio's Institutional Shares and Service Shares returned 9.35% and 9.12%, respectively. For the same one-year period, the Portfolio's primary benchmark, the Russell 1000® Growth Index, returned 9.07% and its secondary benchmark, the S&P 500® Index, returned 15.80%. These returns placed Janus Aspen Forty Portfolio in the top 20% of all VA Lipper Large-Cap Growth Funds for the period. When these returns are added to the returns generated in years past, the since-inception performance record is something we are proud of and is detailed in the chart below:
| As of 12/31/06 | One Year | Three Years | Five Years | Since Inception (5/97) | |||||||||||||||
| Institutional Shares | 9.35 | % | 13.42 | % | 8.20 | % | 12.70 | % | |||||||||||
| Service Shares | 9.12 | % | 13.15 | % | 7.93 | % | 12.35 | % | |||||||||||
| Russell 1000® Growth Index | 9.07 | % | 6.87 | % | 2.69 | % | 4.90 | % | |||||||||||
| Lipper Quartile1 | |||||||||||||||||||
| Institutional Shares | 1st | 1st | 1st | 1st | |||||||||||||||
| Since Inception (5/97) | (38 out of 193) | (2 out of 177) | (4 out of 130) | (1 out of 46) | |||||||||||||||
| Service Shares | 1st | 1st | 1st | N/A2 | |||||||||||||||
| Since Inception (5/97) | (44 out of 193) | (4 out of 177) | (7 out of 130) | N/A2 | |||||||||||||||
1 Rank based on total returns for the VA Lipper Large-Cap Growth funds category
2 The since-inception Lipper ranking for the Portfolio's Service Shares is not available
Data presented reflects past performance, which is no guarantee of future results. Investment results and principal value will fluctuate so that shares, when redeemed, may be worth more or less than their original cost. Due to market volatility, current performance may be higher or lower than the performance shown. Call 877.33JANUS or visit www.janus.com/info for performance current to the most recent month-end. Total return includes reinvestment of dividends and capital gains.
Stewardship
Returns only tell part of the story. We continue to be vigilant in our stewardship of the Portfolio. Continuing a long established trend, Janus Aspen Forty Portfolio's turnover rate was 44% for its Institutional Shares and Service Shares versus a peer average of 88%, which contributed to maintaining the Portfolio's low overall operating expenses of 0.70% for its Institutional Shares and 0.95% for its Service Shares when compared to its peer group average of 0.94%.
What Went Right
One of the biggest contributors to the Portfolio's performance during the period was our continued investment in Celgene. In last year's letter we introduced investors to Celgene and its raw potential. This year I would like to focus on Janus' continued management of our position in Celgene because it embodies many aspects of what I believe distinguishes Janus from its competitors.
Celgene was identified a few years ago as a potential investment for Janus Aspen Forty Portfolio. After a thorough analysis, we developed an investment thesis and initiated a "starter" position in the Portfolio. In any investment, particularly one which has the investment community sharply divided, there are times in the journey when our thesis and/or confidence are thoroughly tested. There is always a myriad of sometimes conflicting, and sometimes incomplete data that need to be deciphered, analyzed and responded to over time. As Celgene proceeded to reach a number of operating milestones, most notably the approval of its cancer-fighting drug Revlimid, which treats a number of leukemia-like blood disorders, we opportunistically added to our position. The credit goes to our healthcare team of analysts who correctly interpreted many of the intermittent data points, incorporating them into more accurate forecasts of the prospects for the compa ny and reinforcing our conviction to both hold and, in some instances, add to our investment in the company. The
2 Janus Aspen Series December 31, 2006
(unaudited)
end result, while not always typical, has been an investment that has appreciated close to 78% this past year, while at the same time the broader NASDAQ-Biotech Index has risen 1%.
Similar to our position in Celgene, our multi-year investment in Research in Motion, maker of the wildly popular Blackberry mobile computing device, is one that relied heavily on the prowess of our analysts. Like Celgene, our investment in Research in Motion was somewhat controversial. We studied the opportunity carefully and initiated a "starter" position. Of particular concern, though, was the eventual outcome of a highly visible, albeit somewhat misunderstood, patent lawsuit. In addition to our own research, we enlisted the assistance of a number of patent attorneys, who together with other third party intellectual property experts led us to believe that the likely outcome would be a far reaching financial settlement. As the controversy swirled, we took the opportunity to add to our position and, in the end, our analysis proved correct; the issue was resolved financially and the company continued to thrive in the marketplace.
In both of the examples detailed above we took a "non-consensus" view of an investment opportunity and had confidence and conviction in our analysts' work, which allowed us to opportunistically build meaningful investment positions that culminated in profitable investments for our investors. While results like these are not a guarantee of future performance and are not always typical of holdings in the Portfolio, in short, I believe it's the DNA of Janus' research process that made the difference.
What Went Wrong
In our semiannual letter in June, we discussed our decision to reduce our holdings in a couple of the Portfolio's long-held positions: health insurer UnitedHealth Group and online auctioneer eBay. Both companies had contributed outsized gains to the Portfolio's investors over the years. We began to sell both positions in the first half of 2006 and continued to do so over the past six-month period, and as of this writing, we no longer own either stock. Although both of these investments hurt the Portfolio's performance during this reporting period, they delivered sizeable gains over the duration of our ownership.
The poorest performing stock during the period, health insurer Aetna, surprised the market by reporting that medical costs had increased more than anticipated. Unsettled by this change in the company's fundamentals, we sold our position.
Outlook
As we discussed in our last two investor letters, we have been looking for the headwinds of higher interest rates and higher energy prices to begin to abate; this finally appears to be happening. Historically, such an environment has been favorable to financial assets. I believe valuations in the largest capitalization stocks are just as attractive as they have been over the past 3 to 4 years, and there are some very exciting companies being built at the low end of the large capitalization universe. I believe that our research-centric investment process is sound, and I credit the entire research and portfolio management team for the Portfolio's results.
Thank you for your continued investment and confidence in Janus Aspen Forty Portfolio.
Janus Aspen Series December 31, 2006 3
Janus Aspen Forty Portfolio (unaudited)
Janus Aspen Forty Portfolio At a Glance
5 Largest Contributors to Performance – Holdings
| Contribution | |||||||
| Las Vegas Sands Corp. Casino hotel - U.S. | 3.24% | ||||||
| Celgene Corp. Biopharmaceutical company - U.S. | 2.35% | ||||||
| Research In Motion, Ltd. Wireless solutions provider for mobile communications - Canada | 1.95% | ||||||
| Potash Corporation of Saskatchewan, Inc. Agricultural chemical producer - Canada | 1.59% | ||||||
| Goldman Sachs Group, Inc. Investment banking and securities firm - U.S. | 1.51% | ||||||
5 Largest Detractors from Performance – Holdings
| Contribution | |||||||
| Aetna U.S. Healthcare Healthcare and related benefits provider - U.S. | (1.98)% | ||||||
| UnitedHealth Group Inc. Organized health systems company - U.S. | (1.52)% | ||||||
| Advance Auto Parts, Inc. Auto parts and accessories retailer - U.S. | (0.97)% | ||||||
| XM Satellite Radio Holdings, Inc. - Class A Audio entertainment provider - U.S. | (0.93)% | ||||||
| eBay, Inc. Online marketplace - U.S. | (0.85)% | ||||||
5 Largest Contributors to Performance – Sectors
| Group | Portfolio Contribution | Portfolio Weighting (% of Net Assets) | Russell 1000® Growth Index Weighting | ||||||||||||
| Consumer Services | 3.96 | % | 9.24 | % | 2.65 | % | |||||||||
| Materials | 3.50 | % | 7.15 | % | 2.40 | % | |||||||||
| Diversified Financials | 1.97 | % | 4.30 | % | 4.48 | % | |||||||||
| Technology Hardware & Equipment | 1.92 | % | 6.28 | % | 10.62 | % | |||||||||
| Energy | 1.83 | % | 22.81 | % | 4.03 | % | |||||||||
5 Largest Detractors from Performance – Sectors
| Group | Portfolio Contribution | Portfolio Weighting (% of Net Assets) | Russell 1000® Growth Index Weighting | ||||||||||||
| Healthcare Equipment & Services | (3.92 | )% | 11.40 | % | 8.19 | % | |||||||||
| Retailing | (1.04 | )% | 4.42 | % | 6.24 | % | |||||||||
| Media | (0.94 | )% | 0.77 | % | 3.23 | % | |||||||||
| Food & Staples Retailing | (0.48 | )% | 0.78 | % | 3.44 | % | |||||||||
| Consumer Durables & Apparel | (0.29 | )% | 1.13 | % | 1.42 | % | |||||||||
4 Janus Aspen Series December 31, 2006
(unaudited)
5 Largest Equity Holdings – (% of Net Assets)
| As of December 31, 2006 | |||
| Las Vegas Sands Corp. Casino Hotels | 6.6 | % | |||||
| ConocoPhillips Oil Companies - Integrated | 5.3 | % | |||||
| Celgene Corp. Medical - Biomedical And Genetic | 5.0 | % | |||||
| Wells Fargo & Co. Super-Regional Banks | 5.0 | % | |||||
| Harrah's Entertainment, Inc. Casino Hotels | 4.8 | % | |||||
| 26.7 | % | ||||||
Asset Allocation – (% of Net Assets)
| As of December 31, 2006 | |||

Emerging markets comprised 0.8% of total net assets.
Top Country Allocations – (% of Investment Securities)
| As of December 31, 2006 | As of December 31, 2005 | ||||||

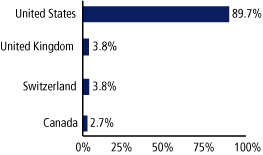
Janus Aspen Series December 31, 2006 5
Janus Aspen Forty Portfolio (unaudited)
Performance

Average Annual Total Return – for the periods ended December 31, 2006
| One Year | Five Year | Since Inception* | |||||||||||||
| Janus Aspen Forty Portfolio - Institutional Shares | 9.35 | % | 8.20 | % | 12.70 | % | |||||||||
| Janus Aspen Forty Portfolio - Service Shares | 9.12 | % | 7.93 | % | 12.35 | % | |||||||||
| Russell 1000® Growth Index | 9.07 | % | 2.69 | % | 4.90 | % | |||||||||
| S&P 500® Index | 15.80 | % | 6.19 | % | 7.82 | % | |||||||||
| Lipper Quartile - Institutional Shares | 1 | st | 1 | st | 1 | st | |||||||||
| Lipper Ranking - Institutional Shares based on total returns for Variable Annuity Large-Cap Growth Funds | 38/193 | 4/130 | 1/46 | ||||||||||||
Data presented represents past performance, which is no guarantee of future results. Investment results and principal value will fluctuate so that shares, when redeemed, may be worth more or less than their original cost. Due to market volatility, current performance may be higher or lower than the performance shown. Call 877.33JANUS or visit www.janus.com/info for performance current to the most recent month-end.
See Notes to Schedule of Investments for index definitions.
Total return includes reinvestment of dividends from net investment income and distributions from capital gains. The returns shown do not reflect the deduction of taxes that a shareholder would pay on Portfolio distributions or the redemption of Portfolio shares.
Returns shown for Service Shares for periods prior to December 31, 1999 are derived from the historical performance of Institutional Shares, adjusted to reflect the higher operating expenses of Service Shares.
These returns do not reflect the charges and expenses of any particular insurance product or qualified plan. Returns shown would have been lower had they included insurance charges.
The Portfolio may differ significantly from the securities held in the indices. The indices are not available for direct investment; therefore their performance does not reflect the expenses associated with the active management of an actual Portfolio.
The Portfolio is classified as "nondiversified," meaning it has the ability to take larger positions in a smaller number of issuers than a fund that is classified as "diversified." Nondiversified funds may experience greater price volatility.
There is no assurance that the investment process will consistently lead to successful investing.
The Portfolio's performance may be affected by risks that include those associated with nondiversification, non-investment grade debt securities, undervalued or overlooked companies, investments in specific industries or countries and potential conflicts of interest with Janus Smart Portfolios. Additional risks to the Portfolio may include those associated with investing in foreign securities, emerging markets, initial public offerings, derivatives and companies with relatively small market capitalizations. Please see a Janus prospectus or www.janus.com/info for more information about risk, fund holdings and details.
Lipper Inc. - A Reuters Company, is a nationally recognized organization that ranks the performance of mutual funds within a universe of funds that have similar investment objectives. Rankings are historical with capital gains and dividends reinvested.
The date of the since-inception Lipper ranking is slightly different from when the Portfolio began operations since Lipper provides fund rankings as of the last day of the month or the first Thursday after fund inception.
Ranking is for the Institutional share class only; other classes may have different performance characteristics.
See "Explanations of Charts, Tables and Financial Statements."
* The Portfolio's inception date - May 1, 1997
Portfolio Expenses
The example below shows you the ongoing costs (in dollars) of investing in your Portfolio and allows you to compare these costs with those of other mutual funds. Please refer to page 1 for a detailed explanation of the information presented in these charts.
| Expense Example - Institutional Shares | Beginning Account Value (7/1/06) | Ending Account Value (12/31/06) | Expenses Paid During Period (7/1/06-12/31/06)* | ||||||||||||
| Actual | $ | 1,000.00 | $ | 1,103.40 | $ | 3.66 | |||||||||
| Hypothetical (5% return before expenses) | $ | 1,000.00 | $ | 1,021.73 | $ | 3.52 | |||||||||
| Expense Example - Service Shares | Beginning Account Value (7/1/06) | Ending Account Value (12/31/06) | Expenses Paid During Period (7/1/06-12/31/06)* | ||||||||||||
| Actual | $ | 1,000.00 | $ | 1,102.40 | $ | 4.98 | |||||||||
| Hypothetical (5% return before expenses) | $ | 1,000.00 | $ | 1,020.47 | $ | 4.79 | |||||||||
*Expenses are equal to the annualized expense ratio of 0.69% for Institutional Shares and 0.94% for Service Shares, multiplied by the average account value over the period, multiplied by 184/365 (to reflect the one-half year period).
6 Janus Aspen Series December 31, 2006
Janus Aspen Forty Portfolio
Schedule of Investments
As of December 31, 2006
| Shares or Principal Amount | Value | ||||||||||
| Common Stock - 99.3% | |||||||||||
| Aerospace and Defense - 1.6% | |||||||||||
| 1,650,175 | BAE Systems PLC | $ | 13,756,036 | ||||||||
| Agricultural Chemicals - 9.5% | |||||||||||
| 232,670 | Monsanto Co. | 12,222,155 | |||||||||
| 241,590 | Potash Corporation of Saskatchewan, Inc. (U.S. Shares) | 34,663,333 | |||||||||
| 201,715 | Syngenta A.G.* | 37,528,756 | |||||||||
| 84,414,244 | |||||||||||
| Agricultural Operations - 1.7% | |||||||||||
| 213,290 | Bunge, Ltd.# | 15,465,658 | |||||||||
| Audio and Video Products - 0.6% | |||||||||||
| 133,585 | Sony Corp. (ADR) | 5,721,446 | |||||||||
| Casino Hotels - 11.4% | |||||||||||
| 510,220 | Harrah's Entertainment, Inc. | 42,205,398 | |||||||||
| 655,580 | Las Vegas Sands Corp.* | 58,661,298 | |||||||||
| 100,866,696 | |||||||||||
| Computers - 6.2% | |||||||||||
| 255,090 | Apple Computer, Inc.* | 21,641,836 | |||||||||
| 257,305 | Research In Motion, Ltd. (U.S. Shares)* | 32,878,433 | |||||||||
| 54,520,269 | |||||||||||
| Cosmetics and Toiletries - 3.7% | |||||||||||
| 510,720 | Procter & Gamble Co. | 32,823,974 | |||||||||
| Diversified Minerals - 1.7% | |||||||||||
| 180,275 | BHP Billiton, Ltd. (ADR)# | 7,165,931 | |||||||||
| 250,630 | Companhia Vale do Rio Doce (ADR) | 7,453,736 | |||||||||
| 14,619,667 | |||||||||||
| Entertainment Software - 1.5% | |||||||||||
| 256,565 | Electronic Arts, Inc.* | 12,920,613 | |||||||||
| Finance - Investment Bankers/Brokers - 8.1% | |||||||||||
| 84,025 | Bear Stearns Companies, Inc. | 13,677,590 | |||||||||
| 181,010 | Goldman Sachs Group, Inc. | 36,084,343 | |||||||||
| 160,970 | Lehman Brothers Holdings, Inc. | 12,574,976 | |||||||||
| 103,475 | Merrill Lynch & Company, Inc. | 9,633,523 | |||||||||
| 71,970,432 | |||||||||||
| Food - Retail - 0.9% | |||||||||||
| 176,360 | Whole Foods Market, Inc. | 8,276,575 | |||||||||
| Machinery - Farm - 1.2% | |||||||||||
| 111,880 | Deere & Co. | 10,636,432 | |||||||||
| Medical - Biomedical and Genetic - 8.3% | |||||||||||
| 775,740 | Celgene Corp.* | 44,628,323 | |||||||||
| 360,965 | Genentech, Inc.* | 29,285,090 | |||||||||
| 73,913,413 | |||||||||||
| Medical - Drugs - 1.1% | |||||||||||
| 56,054 | Roche Holding A.G. | 10,051,538 | |||||||||
| Medical Instruments - 2.9% | |||||||||||
| 262,900 | Intuitive Surgical, Inc.* | 25,212,110 | |||||||||
| Multimedia - 1.6% | |||||||||||
| 846,630 | Publishing & Broadcasting, Ltd. | 14,267,881 | |||||||||
| Oil Companies - Exploration and Production - 3.8% | |||||||||||
| 309,930 | Apache Corp. | 20,613,444 | |||||||||
| 209,470 | EOG Resources, Inc. | 13,081,402 | |||||||||
| 33,694,846 | |||||||||||
| Oil Companies - Integrated - 10.5% | |||||||||||
| 652,430 | ConocoPhillips | 46,942,338 | |||||||||
| 393,285 | Hess Corp.# | 19,495,137 | |||||||||
| 539,770 | Occidental Petroleum Corp. | 26,356,969 | |||||||||
| 92,794,444 | |||||||||||
| Shares or Principal Amount | Value | ||||||||||
| Oil Refining and Marketing - 1.4% | |||||||||||
| 242,705 | Valero Energy Corp. | $ | 12,416,788 | ||||||||
| Optical Supplies - 2.5% | |||||||||||
| 197,545 | Alcon, Inc. (U.S. Shares)# | 22,079,605 | |||||||||
| Retail - Apparel and Shoe - 1.1% | |||||||||||
| 173,697 | Industria de Diseno Textil S.A. | 9,357,237 | |||||||||
| Retail - Building Products - 1.6% | |||||||||||
| 455,920 | Lowe's Companies, Inc. | 14,201,908 | |||||||||
| Soap and Cleaning Preparations - 1.4% | |||||||||||
| 280,190 | Reckitt Benckiser PLC | 12,804,485 | |||||||||
| Super-Regional Banks - 5.0% | |||||||||||
| 1,238,720 | Wells Fargo & Co. | 44,048,883 | |||||||||
| Therapeutics - 3.8% | |||||||||||
| 262,336 | Amylin Pharmaceuticals, Inc.* | 9,462,460 | |||||||||
| 378,610 | Gilead Sciences, Inc.* | 24,583,147 | |||||||||
| 34,045,607 | |||||||||||
| Web Portals/Internet Service Providers - 4.7% | |||||||||||
| 90,427 | Google, Inc. - Class A* | 41,639,825 | |||||||||
| Wireless Equipment - 1.5% | |||||||||||
| 361,130 | QUALCOMM, Inc. | 13,647,103 | |||||||||
| Total Common Stock (cost $625,963,462) | 880,167,715 | ||||||||||
| Money Markets - 0.7% | |||||||||||
| 5,955,000 | Janus Money Market Fund, 5.24% (cost $5,955,000) | 5,955,000 | |||||||||
| Other Securities - 1.1% | |||||||||||
| 9,623,910 | State Street Navigator Securities Lending Prime Portfolio† (cost $9,623,910) | 9,623,910 | |||||||||
| Total Investments (total cost $641,542,372) – 101.1% | 895,746,625 | ||||||||||
| Liabilities, net of Cash, Receivables and Other Assets – (1.1)% | (9,829,121 | ) | |||||||||
| Net Assets – 100.0% | $ | 885,917,504 | |||||||||
Summary of Investments by Country
| Country | Value | % of Investment Securities | |||||||||
| Australia | $ | 21,433,812 | 2.4 | % | |||||||
| Bermuda | 15,465,658 | 1.7 | % | ||||||||
| Brazil | 7,453,736 | 0.8 | % | ||||||||
| Canada | 67,541,766 | 7.6 | % | ||||||||
| Japan | 5,721,446 | 0.6 | % | ||||||||
| Spain | 9,357,237 | 1.0 | % | ||||||||
| Switzerland | 69,659,899 | 7.8 | % | ||||||||
| United Kingdom | 26,560,521 | 3.0 | % | ||||||||
| United States†† | 672,552,550 | 75.1 | % | ||||||||
| Total | $ | 895,746,625 | 100.0 | % | |||||||
††Includes Short-Term Securities and Other Securities (73.3% excluding Short-Term Securities and Other Securities)
See Notes to Schedule of Investments and Financial Statements.
Janus Aspen Series December 31, 2006 7
Statement of Assets and Liabilities
| As of December 31, 2006 (all numbers in thousands except net asset value per share) | Janus Aspen Forty Portfolio | ||||||
| Assets: | |||||||
| Investments at cost(1) | $ | 641,542 | |||||
| Investments at value(1) | $ | 895,747 | |||||
| Cash | 1,001 | ||||||
| Receivables: | |||||||
| Investments sold | 1,923 | ||||||
| Portfolio shares sold | 200 | ||||||
| Dividends | 251 | ||||||
| Interest | 5 | ||||||
| Other assets | 22 | ||||||
| Total Assets | 899,149 | ||||||
| Liabilities: | |||||||
| Payables: | |||||||
| Collateral for securities loaned (Note 1) | 9,624 | ||||||
| Portfolio shares repurchased | 2,934 | ||||||
| Dividends | – | ||||||
| Advisory fees | 490 | ||||||
| Transfer agent fees and expenses | 1 | ||||||
| Distribution fees - Service Shares | 96 | ||||||
| Non-interested Trustees' fees and expenses | 8 | ||||||
| Accrued expenses | 78 | ||||||
| Total Liabilities | 13,231 | ||||||
| Net Assets | $ | 885,918 | |||||
| Net Assets Consist of: | |||||||
| Capital (par value and paid-in-surplus)* | $ | 1,122,996 | |||||
| Undistributed net investment income/(loss)* | 286 | ||||||
| Undistributed net realized gain/(loss) from investments and foreign currency transactions* | (491,568 | ) | |||||
| Unrealized net appreciation/(depreciation) of investments and foreign currency translations | 254,204 | ||||||
| Total Net Assets | $ | 885,918 | |||||
| Net Assets - Institutional Shares | $ | 439,009 | |||||
| Shares Outstanding, $0.001 Par Value (unlimited shares authorized) | 14,554 | ||||||
| Net Asset Value Per Share | $ | 30.16 | |||||
| Net Assets - Service Shares | $ | 446,909 | |||||
| Shares Outstanding, $0.001 Par Value (unlimited shares authorized) | 14,943 | ||||||
| Net Asset Value Per Share | $ | 29.91 | |||||
* See Note 3 in Notes to Financial Statements.
(1) Investments at cost and value include $9,403,700 of securities loaned for Janus Aspen Forty Portfolio (Note 1).
See Notes to Financial Statements.
8 Janus Aspen Series December 31, 2006
Statement of Operations
| For the fiscal year ended December 31, 2006 (all numbers in thousands) | Janus Aspen Forty Portfolio | ||||||
| Investment Income: | |||||||
| Interest | $ | 1,214 | |||||
| Securities lending income | 35 | ||||||
| Dividends | 8,199 | ||||||
| Dividends from affiliates | 468 | ||||||
| Foreign tax withheld | (99 | ) | |||||
| Total Investment Income | 9,817 | ||||||
| Expenses: | |||||||
| Advisory fees | 5,845 | ||||||
| Transfer agent expenses | 5 | ||||||
| Registration fees | 35 | ||||||
| Custodian fees | 38 | ||||||
| Professional fees | 20 | ||||||
| Non-interested Trustees' fees and expenses | 36 | ||||||
| Distribution fees - Service Shares | 1,100 | ||||||
| Printing fees | 140 | ||||||
| Short sales dividend expense | 62 | ||||||
| Other expenses | 225 | ||||||
| Non-recurring costs (Note 2) | – | ||||||
| Costs assumed by Janus Capital Management LLC (Note 2) | – | ||||||
| Total Expenses | 7,506 | ||||||
| Expense and Fee Offset | (7 | ) | |||||
| Net Expenses | 7,499 | ||||||
| Net Investment Income/(Loss) | 2,318 | ||||||
| Net Realized and Unrealized Gain/(Loss) on Investments: | |||||||
| Net realized gain/(loss) from securities transactions | 163,644 | ||||||
| Net realized gain/(loss) from foreign currency transactions | (3 | ) | |||||
| Net realized gain/(loss) from short sales | 312 | ||||||
| Change in unrealized net appreciation/(depreciation) of investments and foreign currency translations | (85,604 | ) | |||||
| Net Gain/(Loss) on Investments | 78,349 | ||||||
| Net Increase/(Decrease) in Net Assets Resulting from Operations | $ | 80,667 | |||||
See Notes to Financial Statements.
Janus Aspen Series December 31, 2006 9
Statements of Changes in Net Assets
| For the fiscal year ended December 31 | Janus Aspen Forty Portfolio | ||||||||||
| (all numbers in thousands) | 2006 | 2005 | |||||||||
| Operations: | |||||||||||
| Net investment income/(loss) | $ | 2,318 | $ | 1,160 | |||||||
| Net realized gain/(loss) from investment and foreign currency transactions | 163,641 | 98,854 | |||||||||
| Net realized gain/(loss) from short sales | 312 | – | |||||||||
| Change in unrealized net appreciation/(depreciation) of investments and foreign currency translations | (85,604 | ) | 13,317 | ||||||||
| Payment from affiliate (Note 2) | – | 1 | |||||||||
| Net Increase/(Decrease) in Net Assets Resulting from Operations | 80,667 | 113,332 | |||||||||
| Dividends and Distributions to Shareholders: | |||||||||||
| Net investment income* | |||||||||||
| Institutional Shares | (1,551 | ) | (1,104 | ) | |||||||
| Service Shares | (616 | ) | (39 | ) | |||||||
| Net realized gain from investment transactions* | |||||||||||
| Institutional Shares | – | – | |||||||||
| Service Shares | – | – | |||||||||
| Net Decrease from Dividends and Distributions | (2,167 | ) | (1,143 | ) | |||||||
| Capital Share Transactions: | |||||||||||
| Shares sold | |||||||||||
| Institutional Shares | 46,364 | 114,464 | |||||||||
| Service Shares | 57,582 | 62,797 | |||||||||
| Reinvested dividends and distributions | |||||||||||
| Institutional Shares | 1,551 | 1,104 | |||||||||
| Service Shares | 616 | 39 | |||||||||
| Shares repurchased | |||||||||||
| Institutional Shares | (210,298 | ) | (117,150 | ) | |||||||
| Service Shares | (114,240 | ) | (88,058 | ) | |||||||
| Net Increase/(Decrease) from Capital Share Transactions | (218,425 | ) | (26,804 | ) | |||||||
| Net Increase/(Decrease) in Net Assets | (139,925 | ) | 85,385 | ||||||||
| Net Assets: | |||||||||||
| Beginning of period | 1,025,843 | 940,458 | |||||||||
| End of period | $ | 885,918 | $ | 1,025,843 | |||||||
| Undistributed net investment income/(loss)* | $ | 286 | $ | 77 | |||||||
* See Note 3 in Notes to Financial Statements.
See Notes to Financial Statements.
10 Janus Aspen Series December 31, 2006
Financial Highlights
Institutional Shares
| Janus Aspen Forty Portfolio | |||||||||||||||||||||||
| For a share outstanding during each fiscal year ended December 31 | 2006 | 2005 | 2004 | 2003 | 2002 | ||||||||||||||||||
| Net Asset Value, Beginning of Period | $ | 27.68 | $ | 24.58 | $ | 20.84 | $ | 17.37 | $ | 20.72 | |||||||||||||
| Income from Investment Operations: | |||||||||||||||||||||||
| Net investment income/(loss) | .13 | .06 | .06 | .08 | .12 | ||||||||||||||||||
| Net gain/(loss) on securities (both realized and unrealized) | 2.45 | 3.10 | 3.74 | 3.48 | (3.36 | ) | |||||||||||||||||
| Total from Investment Operations | 2.58 | 3.16 | 3.80 | 3.56 | (3.24 | ) | |||||||||||||||||
| Less Distributions and Other: | |||||||||||||||||||||||
| Dividends (from net investment income)* | (.10 | ) | (.06 | ) | (.06 | ) | (.09 | ) | (.11 | ) | |||||||||||||
| Distributions (from capital gains)* | – | – | – | – | – | ||||||||||||||||||
| Payment from affiliate | – | – | (1) | – | (1) | – | – | ||||||||||||||||
| Total Distributions and Other | (.10 | ) | (.06 | ) | (.06 | ) | (.09 | ) | (.11 | ) | |||||||||||||
| Net Asset Value, End of Period | $ | 30.16 | $ | 27.68 | $ | 24.58 | $ | 20.84 | $ | 17.37 | |||||||||||||
| Total Return | 9.35 | % | 12.85 | %(2) | 18.23 | %(2) | 20.54 | % | (15.67 | )% | |||||||||||||
| Net Assets, End of Period (in thousands) | $ | 439,009 | $ | 560,842 | $ | 502,681 | $ | 530,617 | $ | 528,210 | |||||||||||||
| Average Net Assets for the Period (in thousands) | $ | 474,784 | $ | 509,092 | $ | 495,684 | $ | 509,046 | $ | 640,500 | |||||||||||||
| Ratio of Gross Expenses to Average Net Assets(3)(4) | 0.70 | %(5) | 0.67 | % | 0.67 | % | 0.68 | % | 0.67 | % | |||||||||||||
| Ratio of Net Expenses to Average Net Assets(4) | 0.70 | %(5) | 0.67 | % | 0.67 | % | 0.68 | % | 0.67 | % | |||||||||||||
| Ratio of Net Investment Income/(Loss) to Average Net Assets | 0.37 | % | 0.24 | % | 0.24 | % | 0.40 | % | 0.56 | % | |||||||||||||
| Portfolio Turnover Rate | 44 | % | 42 | % | 16 | % | 41 | % | 62 | % | |||||||||||||
Service Shares
| Janus Aspen Forty Portfolio | |||||||||||||||||||||||
| For a share outstanding during each fiscal year ended December 31 | 2006 | 2005 | 2004 | 2003 | 2002 | ||||||||||||||||||
| Net Asset Value, Beginning of Period | $ | 27.45 | $ | 24.39 | $ | 20.68 | $ | 17.24 | $ | 20.57 | |||||||||||||
| Income from Investment Operations: | |||||||||||||||||||||||
| Net investment income/(loss) | .03 | – | (6) | – | (6) | .03 | .06 | ||||||||||||||||
| Net gain/(loss) on securities (both realized and unrealized) | 2.47 | 3.06 | 3.72 | 3.46 | (3.33 | ) | |||||||||||||||||
| Total from Investment Operations | 2.50 | 3.06 | 3.72 | 3.49 | (3.27 | ) | |||||||||||||||||
| Less Distributions: | |||||||||||||||||||||||
| Dividends (from net investment income)* | (.04 | ) | – | (6) | (.01 | ) | (.05 | ) | (.06 | ) | |||||||||||||
| Distributions (from capital gains)* | – | – | – | – | – | ||||||||||||||||||
| Total Distributions | (.04 | ) | – | (.01 | ) | (.05 | ) | (.06 | ) | ||||||||||||||
| Net Asset Value, End of Period | $ | 29.91 | $ | 27.45 | $ | 24.39 | $ | 20.68 | $ | 17.24 | |||||||||||||
| Total Return | 9.12 | % | 12.56 | % | 17.97 | % | 20.23 | % | (15.93 | )% | |||||||||||||
| Net Assets, End of Period (in thousands) | $ | 446,909 | $ | 465,001 | $ | 437,777 | $ | 427,292 | $ | 367,266 | |||||||||||||
| Average Net Assets for the Period (in thousands) | $ | 439,970 | $ | 441,936 | $ | 423,061 | $ | 390,044 | $ | 432,801 | |||||||||||||
| Ratio of Gross Expenses to Average Net Assets(3)(4) | 0.95 | %(5) | 0.92 | % | 0.92 | % | 0.93 | % | 0.92 | % | |||||||||||||
| Ratio of Net Expenses to Average Net Assets(4) | 0.95 | %(5) | 0.92 | % | 0.92 | % | 0.93 | % | 0.92 | % | |||||||||||||
| Ratio of Net Investment Income/(Loss) to Average Net Assets | 0.12 | % | (0.01 | )% | 0 | % | 0.15 | % | 0.30 | % | |||||||||||||
| Portfolio Turnover Rate | 44 | % | 42 | % | 16 | % | 41 | % | 62 | % | |||||||||||||
*See Note 3 in Notes to Financial Statements.
(1) Payment from affiliate aggregated less than $.01 on a per share basis for the fiscal year ended.
(2) During the fiscal year ended, Janus Capital and/or Janus Services LLC fully reimbursed the Portfolio for a loss on a transaction resulting from certain trading, pricing and/or shareholder activity errors, which otherwise would have reduced total return by less than 0.01%
(3) The effect of non-recurring costs assumed by Janus Capital (Note 2) is included in the ratio of gross expenses to average net assets and was less than 0.01%.
(4) See "Explanations of Charts, Tables and Financial Statements."
(5) Ratio of Gross Expenses to Average Net Assets and Ratio of Net Expenses to Average Net Assets includes dividends on short positions. The ratio would be 0.70% for Institutional Shares and 0.95% for Service Shares without the inclusion of dividends on short positions.
(6) Net investment income/(loss) and/or dividends (from net investment income) aggregated less than $.01 on a per share basis for the fiscal year ended.
See Notes to Financial Statements.
Janus Aspen Series December 31, 2006 11
Notes to Schedule of Investments
| Lipper Variable Annuity Large-Cap Growth Funds | Funds that, by portfolio practice, invest at least 75% of their equity assets in companies with market capitalizations (on a three-year weighted basis) greater than 300% of the dollar-weighted median market capitalization of the middle 1,000 securities of the S&P SuperComposite 1500® Index. Large-cap growth funds typically have an above-average price-to-earnings ratio, price-to-book ratio, and three-year sales-per-share growth value, compared to the S&P 500® Index. | ||||||
| Russell 1000® Growth Index | Contains those securities in the Russell 1000® Index with a greater-than-average growth orientation. Companies in this index tend to exhibit higher price-to-book and price-earnings ratios, lower dividend yields and higher forecasted growth values. | ||||||
| S&P 500® Index | The Standard & Poor's Composite Index of 500 stocks, a widely recognized, unmanaged index of common stock prices. | ||||||
| ADR | American Depositary Receipt | ||||||
| PLC | Public Limited Company | ||||||
| U.S. Shares | Securities of foreign companies trading on an American Stock Exchange. | ||||||
* Non-income-producing security.
# Loaned security; a portion or all of the security is on loan at December 31, 2006.
† The security is purchased with the cash collateral received from securities on loan (Note 1).
12 Janus Aspen Series December 31, 2006
Notes to Financial Statements
The following section describes the organization and significant accounting policies and provides more detailed information about the schedules and tables that appear throughout this report. In addition, the Notes to Financial Statements explain the methods used in preparing and presenting this report.
1. ORGANIZATION AND SIGNIFICANT ACCOUNTING POLICIES
Janus Aspen Forty Portfolio (the "Portfolio") is a series fund. The Portfolio is part of Janus Aspen Series (the "Trust"), which is organized as a Delaware statutory trust and is registered under the Investment Company Act of 1940 (the "1940 Act") as an open-end management investment company. The Trust offers seventeen Portfolios, which include multiple series of shares, with differing investment objectives and policies. The Portfolio invests primarily in equity securities. The Portfolio is classified as nondiversified, as defined in the 1940 Act. The Portfolio is a no-load investment.
The Portfolio currently offers two classes of shares: Institutional Shares and Service Shares. Institutional Shares are offered only in connection with investment in and payments under variable insurance contracts and to qualified retirement plans. Service Shares are offered only in connection with investment in and payments under variable insurance contracts and to qualified retirement plans that require a fee from Portfolio assets to procure distribution and administrative services to contract owners and plan participants.
The following accounting policies have been consistently followed by the Portfolio and are in conformity with accounting principles generally accepted in the United States of America in the investment company industry.
Investment Valuation
Securities are valued at the last sales price or the official closing price for securities traded on a principal securities exchange (U.S. or foreign) and on the NASDAQ National Market. Securities traded on over-the-counter markets and listed securities for which no sales are reported are valued at the latest bid price (or yield equivalent thereof) obtained from one or more dealers transacting in a market for such securities or by a pricing service approved by the Portfolio's Trustees. Short-term securities with maturities of 60 days or less may be valued at amortized cost, which approximates market value. Debt securities with a remaining maturity of greater than 60 days are valued in accordance with the evaluated bid price supplied by the pricing service. The evaluated bid price supplied by the pricing service is an evaluation that reflects such factors as security prices, yields, maturities and ratings. Foreign securities and currencies ar e converted to U.S. dollars using the applicable exchange rate in effect as of the daily close of the New York Stock Exchange ("NYSE"). When market quotations are not readily available or deemed unreliable, or events or circumstances that may affect the value of portfolio securities held by the Portfolio are identified between the closing of their principal markets and the time the net asset value ("NAV") is determined, securities may be valued at fair value as determined in good faith under procedures established by and under the supervision of the Portfolio's Trustees. The Portfolio may use a systematic fair valuation model provided by an independent third party to value international equity securities in order to adjust for stale pricing, which may occur between the close of certain foreign exchanges and the NYSE.
Investment Transactions and Investment Income
Investment transactions are accounted for as of the date purchased or sold (trade date). Dividend income is recorded on the ex-dividend date. Certain dividends from foreign securities will be recorded as soon as the Trust is informed of the dividend if such information is obtained subsequent to the ex-dividend date and may be subject to withholding taxes in these jurisdictions. Interest income is recorded on the accrual basis and includes amortization of premiums and accretion of discounts. Gains and losses are determined on the identified cost basis, which is the same basis used for federal income tax purposes. Income, as well as gains and losses, both realized and unrealized, are allocated daily to each class of shares based upon the ratio of net assets represented by each class as a percentage of total net assets.
Expenses
The Portfolio bears expenses incurred specifically on its behalf as well as a portion of general expenses. Each class of shares bears expenses incurred specifically on its behalf and, in addition, each class bears a portion of general expenses, which may be based upon relative net assets of each class. Expenses are allocated daily to each class of shares based upon the ratio of net assets represented by each class as a percentage of total net assets. Expenses directly attributable to a specific class of shares are charged against the operations of such class.
Securities Lending
Under procedures adopted by the Trustees, the Portfolio may lend securities to qualified parties (typically brokers or other financial institutions) who need to borrow securities in order to complete certain transactions such as covering short sales, avoiding failures to deliver securities or completing arbitrage activities. The Portfolio may seek to earn additional income through securities lending. There is the risk of delay in recovering a loaned security or the risk of loss in collateral rights if the borrower fails financially. In addition, Janus Capital Management LLC ("Janus Capital") makes efforts to balance the benefits and risks from granting such loans.
The Portfolio does not have the right to vote on securities while they are being lent; however, the Portfolio may attempt to call back the loan and vote the proxy. All loans will be continuously secured by collateral which may consist of cash, U.S. Government securities, domestic and foreign short-term
Janus Aspen Series December 31, 2006 13
Notes to Financial Statements (continued)
debt instruments, letters of credit, money market mutual funds or other money market accounts, or such other collateral permitted by the Securities and Exchange Commission ("SEC"). Cash collateral may be invested in affiliated money market funds or other accounts advised by Janus Capital to the extent consistent with exemptive relief obtained from the SEC or as permitted by the 1940 Act and rules promulgated thereunder. Cash collateral may also be invested in unaffiliated money market funds or other accounts advised by Janus Capital to the extent consistent with exemptive relief obtained from the SEC or as permitted by the 1940 Act and rules promulgated thereunder. Cash collateral may also be invested in unaffiliated money market funds or other accounts.
State Street Bank and Trust Company (the "Lending Agent") may also invest the cash collateral in the State Street Navigator Securities Lending Prime Portfolio or investments in unaffiliated money market funds or accounts, mutually agreed to by the Portfolio and the Lending Agent, that comply with Rule 2a-7 under the 1940 Act relating to money market funds.
As of December 31, 2006, the Portfolio had on loan securities valued as indicated:
| Portfolio | Value at December 31, 2006 | ||||||
| Janus Aspen Forty Portfolio | $ | 9,403,700 | |||||
As of December 31, 2006, the Portfolio received cash collateral for securities lending activity as indicated:
| Portfolio | Cash Collateral at December 31, 2006 | ||||||
| Janus Aspen Forty Portfolio | $ | 9,623,910 | |||||
As of December 31, 2006, all cash collateral received by the Portfolio was invested in the State Street Navigator Securities Lending Prime Portfolio.
The value of the collateral must be at least 102% of the market value of the loaned securities that are denominated in U.S. dollars and 105% of the market value of the loaned securities that are not denominated in U.S. dollars. Loaned securities and related collateral are marked-to-market each business day based upon the market value of the respective securities at the close of business, employing the most recent available pricing information. Collateral levels are then adjusted based upon this mark-to-market evaluation.
The borrower pays fees at the Portfolio's direction to its Lending Agent. The Lending Agent may retain a portion of the interest earned. The cash collateral invested by the Lending Agent is disclosed in the Schedule of Investments. The lending fees and the Portfolio's portion of the interest income earned on cash collateral are included on the Statement of Operations (if applicable).
Interfund Lending
Pursuant to an exemptive order received from the SEC, the Portfolio may be party to an interfund lending agreement between the Portfolio and other Janus Capital sponsored mutual funds, which permits it to borrow or lend cash at a rate beneficial to both the borrowing and lending funds. Outstanding borrowings from all sources totaling 10% or more of the borrowing Portfolio's total assets must be collateralized at 102% of the outstanding principal value of the loan; loans of less than 10% may be unsecured. During the fiscal year ended December 31, 2006, there were no outstanding interfund borrowing or lending arrangements for the Portfolio.
Forward Currency Transactions
The Portfolio may enter into forward currency contracts in order to reduce its exposure to changes in foreign currency exchange rates on its foreign portfolio holdings and to lock in the U.S. dollar cost of firm purchase and sale commitments for securities denominated in or exposed to foreign currencies. A forward currency exchange contract is a commitment to purchase or sell a foreign currency at a future date at a negotiated rate. The gain or loss arising from the difference between the U.S. dollar cost of the original contract and the value of the foreign currency in U.S. dollars upon closing a contract is included in "Net realized gain/(loss) from foreign currency transactions" on the Statement of Operations (if applicable).
Forward currency contracts held by the Portfolio are fully collateralized by other securities, which are denoted in the accompanying Schedule of Investments (if applicable). The collateral is evaluated daily to ensure its market value equals or exceeds the current market value of the corresponding forward currency contracts. As of December 31, 2006, the Portfolio was not invested in forward currency contracts.
Futures Contracts
The Portfolio may enter into futures contracts. The Portfolio intends to use such derivative instruments primarily to hedge or protect from adverse movements in securities prices, currency rates or interest rates. The use of futures contracts may involve risks such as the possibility of illiquid markets or imperfect correlation between the value of the contracts and the underlying securities, or that the counterparty will fail to perform its obligations.
Futures contracts are marked-to-market daily, and the daily variation margin is recorded as a receivable or payable on the Statement of Assets and Liabilities (if applicable). When a contract is closed, a realized gain or loss is recorded on the Statement of Operations equal to the difference between the opening and closing value of the contract. Generally, futures contracts are marked-to-market (i.e., treated as realized and
14 Janus Aspen Series December 31, 2006
subject to distribution) for federal income tax purposes at fiscal year end. Securities designated as collateral for market value on futures contracts are noted in the Schedule of Investments. Such collateral is in the possession of the Portfolio's custodian. As of December 31, 2006, the Portfolio was not invested in futures contracts.
Short Sales
The Portfolio may engage in "short sales against the box." Short sales against the box involve selling either a security that the Portfolio owns, or a security equivalent in kind and amount to the security sold short that the Portfolio has the right to obtain, for delivery at a specified date in the future. The Portfolio may enter into a short sale against the box to hedge against anticipated declines in the market price of portfolio securities. If the value of the securities sold short increases prior to the scheduled delivery date, the Portfolio loses the opportunity to participate in the gain.
The Portfolio may also engage in "naked" short sales. Naked short sales involve the Portfolio selling a security it does not own to a purchaser at a specified price. To complete the transaction, the Portfolio must borrow the security to deliver it to the purchaser and buy that same security in the market to return it to the lender. Although the potential for gain is limited to the difference between the price at which the Portfolio sold the security short and the cost of borrowing the security, its potential for loss could be unlimited because there is no limit to the replacement cost of the borrowed security. There is no assurance that the Portfolio will be able to close out a short position at any particular time or at an acceptable price. A gain or a loss will be recognized upon termination of a short sale. There is no limit on the size of any loss that the Portfolio may recognize upon termination of a short sale. Short sales held by the Portfolio are fully collateralized by other securities, which are denoted in the accompanying Schedule of Investments (if applicable). As of December 31, 2006, the Portfolio was not invested in short sales.
Foreign Currency Translations
The Portfolio does not isolate that portion of the results of operations resulting from changes in foreign exchange rates on investments from the fluctuations arising from changes in market prices of securities held at the date of the financial statements. Net unrealized appreciation or depreciation on investments and foreign currency translation arise from changes in the value of assets and liabilities, including investments in securities held at the date of the financial statements, resulting from changes in the exchange rates and changes in market prices of securities held.
Currency gains and losses are also calculated on payables and receivables that are denominated in foreign currencies. The payables and receivables are generally related to security transactions and income.
Foreign currency-denominated assets and forward currency contracts may involve more risks than domestic transactions, including currency risk, political and economic risk, regulatory risk and market risk. Risks may arise from the potential inability of a counterparty to meet the terms of a contract and from unanticipated movements in the value of foreign currencies relative to the U.S. dollar.
When-issued Securities
The Portfolio may purchase or sell securities on a when-issued or forward commitment basis. The price of the underlying securities and date when the securities will be delivered and paid for are fixed at the time the transaction is negotiated. Losses may arise due to changes in the market value of the securities or from the inability of counterparties to meet the terms of the contract. In connection with such purchases, the Portfolio may hold liquid assets as collateral with the Portfolio's custodian sufficient to cover the purchase price. As of December 31, 2006, the Portfolio was not invested in when-issued securities.
Equity-Linked Structured Notes
The Portfolio may invest in equity-linked structured notes. Equity-linked structured notes are derivative securities which are specially designed to combine the characteristics of one or more underlying securities and their equity derivatives in a single note form. The return and/or yield or income component may be based on the performance of the underlying equity securities, an equity index, and/or option positions. Equity-linked structured notes are typically offered in limited transactions by financial institutions in either registered or nonregistered form. An investment in equity-linked structured notes creates exposure to the credit risk of the issuing financial institution, as well as to the market risk of the underlying securities. There is no guaranteed return of principal with these securities and the appreciation potential of these securities may be limited by a maximum payment or call right. In certain cases, equity-linked struct ured notes may be more volatile and less liquid than less complex securities or other types of fixed-income securities. Such securities may exhibit price behavior that does not correlate with other fixed-income securities. As of December 31, 2006, the Portfolio was not invested in equity-linked structured notes.
Initial Public Offerings
The Portfolio may invest in initial public offerings ("IPOs"). IPOs and other investment techniques may have a magnified performance impact on a fund with a small asset base. The Portfolio may not experience similar performance as its assets grow.
Additional Investment Risk
The Portfolio may be invested in lower-rated debt securities that have a higher risk of default or loss of value since these
Janus Aspen Series December 31, 2006 15
Notes to Financial Statements (continued)
securities may be sensitive to economic changes, political changes or adverse developments specific to the issuer.
Restricted Security Transactions
Restricted securities held by the Portfolio may not be sold except in exempt transactions or in a public offering registered under the Securities Act of 1933. The risk of investing in such securities is generally greater than the risk of investing in the securities of widely held, publicly traded companies. Lack of a secondary market and resale restrictions may result in the inability of the Portfolio to sell a security at a fair price and may substantially delay the sale of the security. In addition, these securities may exhibit greater price volatility than securities for which secondary markets exist.
Dividend Distributions
The Portfolio generally makes semiannual distributions of substantially all of its investment income and an annual distribution of its net realized capital gains (if any). The majority of dividends and net realized capital gains distributions from the Portfolio may be automatically reinvested into additional shares of the Portfolio, based upon the discretion of the shareholder.
Estimates
The preparation of financial statements in conformity with accounting principles generally accepted in the United States of America requires management to make estimates and assumptions that affect the reported amount of assets and liabilities and disclosure of contingent assets and liabilities at the date of the financial statements and the reported amounts of income and expenses during the reporting period. Actual results could differ from those estimates.
Federal Income Taxes
No provision for income taxes is included in the accompanying financial statements, as the Portfolio intends to distribute to shareholders all taxable investment income and realized gains and otherwise comply with Subchapter M of the Internal Revenue Code applicable to regulated investment companies.
New Accounting Pronouncements
In July 2006, the Financial Accounting Standards Board ("FASB") issued Interpretation No. 48, "Accounting for Uncertainty in Income Taxes – an Interpretation of FASB Statement No. 109" (the "Interpretation"). The Interpretation establishes for all entities, including pass-through entities such as the Portfolio, a minimum threshold for financial statement recognition of the benefit of positions taken in filing tax returns (including whether an entity is taxable in a particular jurisdiction), and requires certain expanded tax disclosures. A calendar year open-end or closed-end fund would implement the interpretation no later than June 29, 2007 (the last business day of the semi-annual reporting period) and will also apply to all open tax years as of the date of effectiveness. Management has recently begun to evaluate the application of the Interpretation to the Portfo lio, and is not in a position at this time to estimate the significance of its impact, if any, on the Portfolio's financial statements.
In September 2006, the FASB issued Statement of Financial Accounting Standards No. 157, "Fair Value Measurements" ("SFAS No. 157"), which defines fair value, establishes a framework for measuring fair value in generally accepted accounting principles, and expands disclosures about fair value measurements. SFAS No. 157 does not require new fair value measurements, but is applied to the extent that other accounting pronouncements require or permit fair value measurements. SFAS No. 157 emphasizes that fair value is a market-based measurement that should be determined based on the assumptions that market participants would use in pricing an asset or liability. Companies will be required to disclose the extent to which fair value is used to measure assets and liabilities, the inputs used to develop the measurements, and the effect for fiscal years beginning after November 15, 2007. Management is currently evaluating the potential impact the adopt ion of SFAS No. 157 will have on the Portfolio's financial condition and results of operations.
2. INVESTMENT ADVISORY AGREEMENTS AND OTHER TRANSACTIONS WITH AFFILIATES
The Portfolio pays a monthly advisory fee to Janus Capital based upon average daily net assets and calculated at the annual rate of 0.64%. Janus Services LLC ("Janus Services"), a wholly-owned subsidiary of Janus Capital, is the Portfolio's transfer agent. Janus Services receives certain out-of-pocket expenses for transfer agent services.
Certain officers of the Portfolio may also be officers and/or directors of Janus Capital. Such officers receive no compensation from the Portfolio, except for the Portfolio's Chief Compliance Officer. Effective January 1, 2006, the Portfolio began reimbursing the adviser for a portion of the compensation paid to the Chief Compliance Officer of the Trust. Total compensation of $1,487 was paid by the Portfolio during the fiscal year ended December 31, 2006. The Portfolio's portion is reported as part of "Other Expenses" on the Statement of Operations.
The Board of Trustees has adopted a deferred compensation plan (the "Deferred Plan") for independent Trustees to elect to defer receipt of all or a portion of the annual compensation they are entitled to receive from the Portfolio. All deferred fees are credited to an account established in the name of the Trustees. The amounts credited to the account then increase or decrease, as the case may be, in accordance with the performance of one or more of the Janus funds that are selected by the Trustees. The account balance continues to fluctuate in accordance with the performance of the selected fund or funds until final payment of all amounts credited to the account. Trustees are allowed to change their designation
16 Janus Aspen Series December 31, 2006
of mutual funds from time to time. Amounts will be deferred until distributed in accordance to the Deferred Plan. No deferred fees were paid to any Trustee under the Deferred Plan during the fiscal year ended December 31, 2006.
During the fiscal year ended December 31, 2005, Janus Services reimbursed the Portfolio $619 for Institutional Shares as a result of dilutions caused by incorrectly processed shareholder activity. Reimbursements are included in "Payment from affiliate" on the Statements of Changes in Net Assets.
For the fiscal year ended December 31, 2006, Janus Capital assumed $21,288 of legal, consulting and Trustee costs and fees incurred by the funds in Janus Investment Fund, Janus Aspen Series and Janus Adviser Series (the "Funds") in connection with the regulatory and civil litigation matters discussed in Note 6. These non-recurring costs were allocated to all Funds based upon the Funds' respective net assets as of July 31, 2004. Additionally, all future non-recurring costs will be allocated based upon the Funds' respective net assets on July 31, 2004. These non-recurring costs and costs assumed by Janus Capital are shown on the Statement of Operations.
Janus Distributors LLC, a wholly-owned subsidiary of Janus Capital, is a distributor of the Portfolio. Service Shares have adopted a Distribution and Shareholder Servicing Plan (the "Plan") pursuant to Rule 12b-1 under The 1940 Act. The Plan authorizes payments by the Portfolio in connection with the distribution of Service Shares at an annual rate of up to 0.25% of Service Shares' average daily net assets.
The Portfolio's expenses may be reduced by expense offsets from an unaffiliated custodian and/or transfer agent. Such credits or offsets are included in Expense and Fee Offset on the Statement of Operations. The transfer agent fee offsets received during the period reduce Transfer Agent Fees and Expenses. Custodian offsets received reduce Custodian Fees. The Portfolio could have employed the assets used by the custodian and/or transfer agent to produce income if it had not entered into an expense offset arrangement.
The Portfolio may invest in money market funds, including funds managed by Janus Capital. During the fiscal year ended December 31, 2006, the Portfolio recorded distributions from affiliated investment companies as affiliated dividend income, and had the following affiliated purchases and sales:
| Purchases Shares/Cost | Sales Shares/Cost | Dividend Income | Value at 12/31/06 | ||||||||||||||||
| Janus Aspen Forty Portfolio | |||||||||||||||||||
| Janus Government Money Market Fund | $ | 10,214,872 | $ | 10,214,872 | $ | 6,721 | $ | – | |||||||||||
| Janus Institutional Cash Reserves Fund | 55,841,063 | 55,841,063 | 188,313 | – | |||||||||||||||
| Janus Money Market Fund | 37,695,253 | 31,740,253 | 273,036 | 5,955,000 | |||||||||||||||
| $ | 103,751,188 | $ | 97,796,188 | $ | 468,070 | $ | 5,955,000 | ||||||||||||
3. FEDERAL INCOME TAX
The tax components of capital shown in the table below represent: (1) distribution requirements the Portfolio must satisfy under the income tax regulations; (2) losses or deductions the Portfolio may be able to offset against income and gains realized in future years; and (3) unrealized appreciation or depreciation of investments for federal income tax purposes.
Other book to tax differences in the current year primarily consist of foreign currency contract adjustments. The Portfolio has elected to treat gains and losses on forward foreign currency contracts as capital gains and losses. Other foreign currency gains and losses on debt instruments are treated as ordinary income for federal income tax purposes pursuant to Section 988 of the Internal Revenue Code.
Accumulated capital losses noted below represent net capital loss carryovers, as of December 31, 2006, that may be available to offset future realized capital gains and thereby reduce future taxable gains distributions.
| Portfolio | Undistributed Ordinary Income | Undistributed Long–Term Gains | Accumulated Capital Losses | Post-October Deferral | Other Book to Tax Differences | Net Tax Appreciation/ (Depreciation) | |||||||||||||||||||||
| Janus Aspen Forty Portfolio(1) | $ | 286,148 | $ | – | $ | (488,131,737 | ) | $ | – | $ | – | $ | 250,767,176 | ||||||||||||||
(1) Capital loss carryover is subject to annual limitations.
The table below shows the expiration date of the carryovers.
Capital Loss Carryover Expiration Schedule
For the year ended December 31, 2006
| Portfolio | December 31, 2009 | December 31, 2010 | December 31, 2011 | ||||||||||||
| Janus Aspen Forty Portfolio(1) | $ | (192,726,266 | ) | $ | (149,006,480 | ) | $ | (146,398,991 | ) | ||||||
(1) Capital loss carryover is subject to annual limitations.
Janus Aspen Series December 31, 2006 17
Notes to Financial Statements (continued)
During the year ended December 31, 2006, the following capital loss carryover was utilized by the Portfolio as indicated in the table below.
| Portfolio | Capital Loss Carryover Utilized | ||||||
| Janus Aspen Forty Portfolio | $ | 165,296,881 | |||||
The aggregate cost of investments and the composition of unrealized appreciation and depreciation of investment securities for federal income tax purposes as of December 31, 2006 are noted below.
Unrealized appreciation and unrealized depreciation in the table below exclude appreciation/depreciation on foreign currency translations. The primary difference between book and tax appreciation or depreciation of investments is wash sale loss deferrals.
| Portfolio | Federal Tax Cost | Unrealized Appreciation | Unrealized (Depreciation) | ||||||||||||
| Janus Aspen Forty Portfolio | $ | 644,979,449 | $ | 261,075,282 | $ | (10,308,106 | ) | ||||||||
Income and capital gains distributions are determined in accordance with income tax regulations that may differ from accounting principles generally accepted in the United States of America. These differences are due to differing treatments for items such as net short-term gains, deferral of wash sale losses, foreign currency transactions, net investment losses and capital loss carryovers. Certain permanent differences such as tax returns of capital and net investment losses noted below have been reclassified to paid-in capital.
| For the fiscal year ended December 31, 2006 | Distributions | ||||||||||||||||||
| Portfolio | From Ordinary Income | From Long-Term Capital Gains | Tax Return of Capital | Net Investment Loss | |||||||||||||||
| Janus Aspen Forty Portfolio | $ | 2,167,003 | $ | – | $ | – | $ | – | |||||||||||
| For the fiscal year ended December 31, 2005 | Distributions | ||||||||||||||||||
| Portfolio | From Ordinary Income | From Long-Term Capital Gains | Tax Return of Capital | Net Investment Loss | |||||||||||||||
| Janus Aspen Forty Portfolio | $ | 1,143,001 | $ | – | $ | – | $ | – | |||||||||||
4. CAPITAL SHARE TRANSACTIONS
| For the fiscal year ended December 31 | Janus Aspen Forty Portfolio | ||||||||||
| (all numbers are in thousands) | 2006 | 2005 | |||||||||
| Transactions in Portfolio Shares – Institutional Shares | |||||||||||
| Shares sold | 1,660 | 4,359 | |||||||||
| Reinvested dividends and distributions | 54 | 41 | |||||||||
| Shares repurchased | (7,423 | ) | (4,590 | ) | |||||||
| Net Increase(Decrease) in Portfolio Shares | (5,709 | ) | (190 | ) | |||||||
| Shares Outstanding, Beginning of Period | 20,263 | 20,453 | |||||||||
| Shares Outstanding, End of Period | 14,554 | 20,263 | |||||||||
| Transactions in Portfolio Shares – Service Shares | |||||||||||
| Shares sold | 2,070 | 2,484 | |||||||||
| Reinvested dividends and distributions | 22 | 2 | |||||||||
| Shares repurchased | (4,087 | ) | (3,497 | ) | |||||||
| Net Increase(Decrease) in Portfolio Share | (1,995 | ) | (1,011 | ) | |||||||
| Shares Outstanding, Beginning of Period | 16,938 | 17,949 | |||||||||
| Shares Outstanding, End of Period | 14,943 | 16,938 | |||||||||
18 Janus Aspen Series December 31, 2006
5. PURCHASES AND SALES OF INVESTMENT SECURITIES
For the fiscal year ended December 31, 2006, the aggregate cost of purchases and proceeds from sales of investment securities (excluding short-term securities and short sales) were as follows:
| Portfolio | Purchases of Securities | Proceeds from Sales of Securities | Purchases of Long-Term U.S. Government Obligations | Proceeds from Sales of Long-Term U.S. Government Obligations | |||||||||||||||
| Janus Aspen Forty Portfolio | $ | 386,347,611 | $ | 549,402,397 | $ | – | $ | – | |||||||||||
6. PENDING LEGAL MATTERS
In the fall of 2003, the Securities and Exchange Commission ("SEC"), the Office of the New York State Attorney General ("NYAG"), the Colorado Attorney General ("COAG"), and the Colorado Division of Securities ("CDS") announced that they were investigating alleged frequent trading practices in the mutual fund industry. On August 18, 2004, Janus Capital announced that it had reached final settlements with the SEC, the NYAG, the COAG, and the CDS related to such regulators' investigations into Janus Capital's frequent trading arrangements.
A number of civil lawsuits were brought against Janus Capital and certain of its affiliates, the Janus funds, and related entities and individuals based on allegations similar to those announced by the above regulators and were filed in several state and federal jurisdictions. Such lawsuits alleged a variety of theories for recovery including, but not limited to, the federal securities laws, other federal statutes (including ERISA), and various common law doctrines. The Judicial Panel on Multidistrict Litigation transferred these actions to the U.S. District Court for the District of Maryland (the "Court") for coordinated proceedings. On September 29, 2004, five consolidated amended complaints were filed with the Court that generally include: (i) claims by a putative class of investors in certain Janus funds asserting claims on behalf of the investor class (Marini, et al. v. Janus Investment Fund, et al., U.S. District Court, District of Maryland, Case No. 04-CV-00497); (ii) derivative claims by investors in certain Janus funds ostensibly on behalf of such funds (Steinberg et al. v. Janus Capital Management, LLC et al., U.S. District Court, District of Maryland, Case No. 04-CV-00518); (iii) claims on behalf of participants in the Janus 401(k) plan (Wangberger v. Janus Capital Group Inc., 401(k) Advisory Committee, et al., U.S. District Court, District of Maryland, Case No. JFM-05-2711); (iv) claims brought on behalf of shareholders of Janus Capital Group Inc. ("JCGI") on a derivative basis against the Board of Directors of JCGI (Chasen v. Whiston, et al., U.S. District Court, District of Maryland, Case No. 04-MD-00855); and (v) claims by a putative class of shareholders of JCGI asserting claims on behalf of the shareholders (Wiggins, et al. v. Janus Capital Group, Inc., et al., U.S. District Court, District of Maryland, Case No. 04-CV-00818). In addition, the following were also named as defendants in one or more of the actions: Janus Investment Fund ("JIF"), Janus Aspen Series ("JAS"), Janus Adviser Series ("JAD"), Janus Distributors LLC, Enhanced Investment Technologies, LLC ("INTECH"), Bay Isle Financial LLC ("Bay Isle"), Perkins, Wolf, McDonnell and Company, LLC ("Perkins"), the Advisory Committee of the Janus 401(k) plan, and the current or former directors of JCGI.
On August 25, 2005, the Court entered orders dismissing most of the claims asserted against Janus Capital and its affiliates by fund investors (actions (i) and (ii) described above), except certain claims under Section 10(b) of the Securities Exchange Act of 1934 and under Section 36(b) of the Investment Company Act of 1940, as amended (the "1940 Act"). On August 15, 2006, the complaint in the 401(k) plan class action (action (iii) described above) was dismissed by the district court with prejudice; the plaintiff has appealed that dismissal decision to the United States Court of Appeals for the Fourth Circuit. The Court also dismissed the action against JCGI's Board of Directors without leave to amend (action (iv) described above). Finally, a Motion to Dismiss the action brought by JCGI shareholders (action (v) described above) is fully briefed and pending before the Court.
In addition to the lawsuits described above, the Auditor of the State of West Virginia ("Auditor"), in his capacity as securities commissioner, has initiated administrative proceedings against many of the defendants in the market timing cases (including JCGI and Janus Capital) and, as a part of its relief, is seeking disgorgement and other monetary relief based on similar market timing allegations (In the Matter of Janus Capital Group Inc. et al., Before the Securities Commissioner, State of West Virginia, Summary Order No. 05-1320). The respondents in these proceedings collectively sought a Writ of Prohibition in state court, which was denied. Their subsequent Petition for Appeal was also denied. Consequently, in September 2006, JCGI and Janus Capital filed their answer to the A uditor's summary order instituting proceedings and requested a hearing. JCGI and Janus Capital, as well as other similarly situated defendants, continue to challenge the statutory authority of the Auditor to bring such an action. No further proceedings are currently scheduled.
Janus Aspen Series December 31, 2006 19
Notes to Financial Statements (continued)
In addition to the "market timing" actions described above, Janus Capital is a defendant in a consolidated lawsuit in the U.S. District Court for the District of Colorado challenging the investment advisory fees charged by Janus Capital to certain Janus funds (Walter Sins, et al. v. Janus Capital Management LLC, U.S. District Court, District of Colorado, Case No. 04-CV-01647-WDM-MEH; Michael Fleisher, et al. v. Janus Capital Management, LLC, 04-CV-02395-MSK-CBS). The action was filed in 2004 by fund investors asserting breach of fiduciary duty under Section 36(b) of the 1940 Act. The plaintiffs seek declaratory and injunctive relief and an unspecified amount of damages. The trial is scheduled to commence on May 21, 2007.
In 2001, Janus Capital's predecessor was also named as a defendant in a class action suit in the U.S. District Court for the Southern District of New York, alleging that certain underwriting firms and institutional investors violated antitrust laws in connection with initial public offerings (Pfeiffer v. Credit Suisse First Boston aka In re Initial Public Offering Antitrust Litigation, U.S. District Court, Southern District of New York, Case No. 01-CV-2014). The U.S. District Court dismissed the plaintiff's antitrust claims in November 2003; however, the U.S. Court of Appeals vacated that decision and remanded it for further proceedings. In March 2006, the defendants, including Janus Capital, filed a Petition for a Writ of Certiorari with the U.S. Supreme Court to review the decision of the U. S. Court of Appeals. In June 2006, the U.S. Supreme Court invited the U.S. Solicitor General to file a brief expressing the view of the United States, and in November 2006, the Solicitor General filed a brief expressing its view on the matter. The U.S. Supreme Court has granted the Petition for a Writ of Certiorari and the parties are in the process of briefing the matter for the U.S. Supreme Court.
Additional lawsuits may be filed against certain of the Janus funds, Janus Capital, and related parties in the future. Janus Capital does not currently believe that these pending actions will materially affect its ability to continue providing services it has agreed to provide to the Janus funds.
20 Janus Aspen Series December 31, 2006
Report of Independent Registered Public Accounting Firm
To the Trustees and Shareholders
of Janus Aspen Forty Portfolio
In our opinion, the accompanying statement of assets and liabilities, including the schedule of investments, and the related statements of operations and of changes in net assets and the financial highlights present fairly, in all material respects, the financial position of Janus Aspen Forty Portfolio (one of the portfolios constituting Janus Aspen Series, hereafter referred to as the "Portfolio") at December 31, 2006, the results of its operations for the year then ended, the changes in its net assets for each of the two years in the period then ended, and the financial highlights for each of the five years in the period then ended, in conformity with accounting principles generally accepted in the United States of America. These financial statements and financial highlights (hereafter referred to as "financial statements") are the responsibility of the Portfolio's management; our responsibility is to express an opinion on these financial statements based on our audits. We conducted our audits of these financial statements in accordance with the standards of the Public Company Accounting Oversight Board (United States). Those standards require that we plan and perform the audit to obtain reasonable assurance about whether the financial statements are free of material misstatement. An audit includes examining, on a test basis, evidence supporting the amounts and disclosures in the financial statements, assessing the accounting principles used and significant estimates made by management, and evaluating the overall financial statement presentation. We believe that our audits, which included confirmation of securities at December 31, 2006 by correspondence with the custodian, transfer agent and brokers, and the application of alternative auditing procedures where securities purchased had not been received, provide a reasonable basis for our opinion.

PricewaterhouseCoopers LLP
Denver, Colorado
February 12, 2007
Janus Aspen Series December 31, 2006 21
Additional Information (unaudited)
PROXY VOTING POLICIES AND VOTING RECORD
A description of the policies and procedures that the Portfolio uses to determine how to vote proxies relating to its portfolio securities is available: (i) without charge, upon request, by calling 1-800-525-0020 (toll free); (ii) on the Portfolio's website at www.janus.com/proxyvoting; and (iii) on the SEC's website at http://www.sec.gov. Additionally, information regarding the Portfolio's proxy voting record for the most recent twelve-month period ended June 30 is also available, free of charge, through www.janus.com/proxyvoting and from the SEC's website at http://www.sec.gov.
QUARTERLY PORTFOLIO HOLDINGS
The Portfolio files its complete portfolio holdings (schedule of investments) with the SEC for the first and third quarters of each fiscal year on Form N-Q within 60 days of the end of such fiscal quarter. The Portfolio's Form N-Q: (i) is available on the SEC's website at http://www.sec.gov; (ii) may be reviewed and copied at the SEC's Public Reference Room in Washington, D.C. (information on the Public Reference Room may be obtained by calling 1-800-SEC-0330); and (iii) is available without charge, upon request, by calling Janus at 1-800-525-0020 (toll free).
APPROVAL OF ADVISORY AGREEMENTS DURING THE PERIOD
The Trustees of Janus Aspen Series, more than eighty-five percent of whom have never been affiliated with the Adviser ("Independent Trustees"), oversee the management of each of the Portfolios and, as required by law, determine annually whether to continue the investment advisory agreement for each Portfolio and the subadvisory agreements for the three Portfolios that utilize subadvisers.
In connection with their most recent consideration of those agreements for each of the Portfolios, the Trustees received and reviewed a substantial amount of information provided by Janus Capital (the "Adviser") and the respective subadvisers in response to requests of the Independent Trustees and their independent legal counsel. They also received and reviewed a considerable amount of information and analysis provided to the Trustees by their independent fee consultant. Throughout their consideration of the agreements the Independent Trustees were advised by their independent legal counsel. The Independent Trustees met on two separate occasions with management to consider the agreements, and at each of those meetings they also met separately in executive session with their independent legal counsel.
At a meeting held on December 20, 2006, based on their evaluation of the information provided by the Adviser, the subadvisers and the independent fee consultant and other information, the Trustees determined that the overall arrangements between each Portfolio and the Adviser were fair and reasonable in light of the nature, extent and quality of the services provided by the Adviser, its affiliates and the subadvisers, the fees charged for those services, and other matters that the Trustees considered relevant in the exercise of their business judgment. At that meeting all of the Trustees unanimously approved the continuation of the investment advisory agreement for each Portfolio, and the subadvisory agreement for each subadvised Portfolio, for the period from February 1, 2007 through February 1, 2008, subject to earlier termination as provided in each agreement.
In considering the continuation of those agreements, the Trustees reviewed and analyzed various factors that they determined were relevant, including the factors described below, none of which by itself was considered dispositive. However, the material factors and conclusions that formed basis for the Trustees' determination to approve the continuation of the agreements are discussed separately below.
Nature, Extent and Quality of Services
The Trustees reviewed the nature, extent and quality of the services of Janus Capital and the subadvisers to the Funds, taking into account the investment objective and strategy of each Portfolio and the knowledge the Trustees gained from their regular meetings with management on at least a quarterly basis and their ongoing review of information related to the Funds. In addition, the Trustees reviewed the resources and key personnel of Janus Capital and each subadviser, especially those who provide investment management services to the Portfolios. The Trustees also considered other services provided to the Portfolios by Janus Capital or the subadvisers, such as managing the execution of portfolio transactions and the selection of broker-dealers for those transactions, serving as the Portfolios' administrator, monitoring adherence to the Portfolios' investment restrictions, producing shareholder reports, providing support services for the Tru stees and Trustee committees, communicating with shareholders and overseeing the activities of other service providers, including monitoring compliance with various policies and procedures of the Portfolios and with applicable securities laws and regulations.
The Trustees concluded that: the nature, extent and quality of the services provided by Janus Capital or the subadviser to each Portfolio were appropriate and consistent with the terms of the respective advisory and subadvisory agreements; that, taking into account steps taken to address a small portion of the Portfolios whose performance lagged that of their peers for certain periods, the quality of those services had been consistent with or superior to quality norms in the industry; and that the Portfolios were likely to benefit from the continued provision of those services. They also concluded that each of Janus Capital and each subadviser had sufficient personnel, with the appropriate education and experience, to serve the Portfolios effectively and had demonstrated its
22 Janus Aspen Series December 31, 2006
continuing ability to attract and retain well-qualified personnel.
Performance of the Funds
The Trustees considered the performance results of each Portfolio over various time periods. They reviewed information comparing each Portfolio's performance with the performance of comparable funds and peer groups identified by Lipper Inc., an independent provider of investment company data, and with the Portfolio's benchmark. They concluded that the performance of most Portfolios was good to very good. Although the performance of some Portfolios lagged that of their peers for certain periods, the Trustees also concluded that Janus Capital had taken appropriate steps to address those instances of under-performance and that the more recent performance of most of those Portfolios had been improving.
Costs of Services Provided
The Trustees examined information on the fees and expenses of each Portfolio in comparison to similar information for other comparable funds as provided by Lipper. They also reviewed an analysis of that information provided by their independent fee consultant and noted that the rate of management (investment advisory and administrative) fees for most of the Portfolios, after contractual expense limitations, was below the mean management fee rate of the respective peer group of funds selected by Lipper.
The Trustees considered the methodology used by Janus Capital and each subadviser in determining compensation payable to portfolio managers, the competitive environment for investment management talent and the competitive market for mutual funds in different distribution channels. They concluded that the compensation methodology provided a good alignment of the interests of the portfolio managers with the interests of Portfolio shareholders.
The Trustees also reviewed management fees charged by Janus Capital to its separate account clients and to its subadvised funds (for which Janus Capital provides only portfolio management services). Although in most instances subadvisory and separate account fee rates for various investment strategies were lower than management fees for Portfolios having a similar strategy, the Trustees noted that Janus Capital performs significant additional services for the Portfolios that it does not provide to those other clients, including administrative services, oversight of the Portfolios' other service providers, trustee support, regulatory compliance and numerous other services, and that, in serving the Portfolios, Janus Capital assumes many legal risks that it does not assume in servicing its other clients. Moreover, they noted that the spread between the average fees charged to the Portfolios and the fees that Janus Capital charged to its separat e account clients was significantly smaller than the average spread for such fees of other advisers, based on publicly available data and research conducted by their independent fee consultant.
In considering the fees charged by Janus Capital, the Trustees had previously negotiated with Janus Capital a temporary contingent waiver of a portion the investment advisory fee paid by Janus Aspen Worldwide Growth Portfolio to Janus Capital to provide for a possible reduction in the rate of advisory fee payable by the Portfolio for the period July 1, 2006 through January 31, 2007 if the investment performance of the Fund should lag that of its benchmark performance over the applicable performance measurement period. Commencing in February 2007, the previously approved performance-based fee schedule will become operative.
The Trustees reviewed information on the profitability of Janus Capital and its affiliates of their relationships with each Portfolio, as well as an explanation of the methodology utilized in allocating various expenses among the Portfolios and other clients. The Trustees also reviewed the financial statements of Janus Capital's parent company and its corporate structure. In their review, the Trustees considered whether Janus Capital and each subadviser receive adequate incentives to manage the Portfolios effectively. The Trustees recognized that profitability comparisons among fund managers are difficult because very little comparative information is publicly available and profitability of any manager is affected by numerous factors, including the organizational structure of the particular manager, the types of funds and other accounts it manages, possible other lines of business, the methodology for allocating expenses and the manager's ca pital structure and cost of capital. However, based on the information available and taking those factors into account, the Trustees concluded that Janus Capital's profitability with respect to each Portfolio in relation to the services rendered was not unreasonable.
The Trustees concluded that the management fees and other compensation payable by each Fund to Janus Capital and its affiliates, as well as the fees paid by Janus Capital to the subadvisers of subadvised Portfolios, were reasonable in relation to the nature and quality of the services provided, taking into account the fees charged by other advisers for managing comparable mutual funds with similar strategies and the fees Janus Capital and the subadviser charges to other clients. The Trustees also concluded that the overall expense ratio of each Portfolio was reasonable, taking into account the size of the Portfolio, the quality of services provided by Janus Capital and any subadviser, the investment performance of the Portfolio and any expense limitations agreed to by Janus Capital.
Economies of Scale
The Trustees considered information about the potential for Janus Capital to realize economies of scale as the assets of the
Janus Aspen Series December 31, 2006 23
Additional Information (unaudited) (continued)
Portfolios increase. They noted that, although most Portfolios pay advisory fees at a fixed rate as a percentage of net assets, without any breakpoints, the management fee paid by each Portfolio, after any contractual expense limitations, was below the mean management fee rate of the Portfolio's peer group selected by Lipper; and, for those Portfolios whose expenses are being reduced by the contractual expense limitations of Janus Capital, Janus Capital is subsidizing the Portfolios because they have not reached adequate scale. Moreover, as the assets of many of the Portfolios have declined in the past few years, the Portfolios have benefited from having advisory fee rates that have remained constant rather than increasing as assets decline. In addition, performance fee structures have been implemented for several Portfolios that will cause the effective rate of advisory fees payable by such a Portfolio to vary depending on the investment pe rformance of the Portfolio relative to its benchmark; and a few Portfolios have fee schedules with breakpoints and reduced fee rates above certain asset levels. The Trustees also noted that the Portfolios share directly in economies of scale through lower charges of third-party service providers based on the combined scale of all of the Portfolios. Based on all of the information they reviewed, the Trustees concluded that the current fee structure of each Portfolio was reasonable and that the current rates of fees do reflect a sharing between Janus Capital and the Portfolio of economies of scale at the current asset level of the Portfolio.
Other Benefits to Janus Capital
The Trustees also considered benefits that accrue to Janus Capital and its affiliates from their relationships with the Portfolios. They recognized that two affiliates of Janus Capital separately serve the Portfolios as transfer agent and distributor, respectively, and that the transfer agent receives compensation from the non-money market Portfolios for services provided. The Trustees also considered Janus Capital's use of commissions paid by Portfolios on their portfolio brokerage transactions to obtain proprietary research products and services benefiting the Portfolios and/or other clients of Janus Capital, as well as Janus Capital's agreement not to use any Portfolio's brokerage transactions to obtain third party research products or services. The Trustees concluded that Janus Capital's use of "soft" commission dollars to obtain proprietary research products and services was consistent with regulatory requirements and guidelines and was likely to benefit each Portfolio. The Trustees also concluded that, other than the services provided by Janus Capital and its affiliates pursuant to the agreements and the fees to be paid by each Portfolio therefor, the Portfolios and Janus Capital may potentially benefit from their relationship with each other in other ways. They concluded that Janus Capital benefits from the receipt of proprietary research products and services acquired through commissions paid on portfolio transactions of the Portfolios and that the Portfolios benefit from Janus Capital's receipt of those products and services as well as research products and services acquired through commissions paid by other clients of Janus Capital. They further concluded that success of any Portfolio could attract other business to Janus Capital or other Janus Funds and that the success of Janus Capital could enhance Janus Capital's ability to serve the Portfolios.
After full consideration of the above factors as well as other factors, all of the Trustees, including all of the Independent Trustees, concluded that the proposed continuation of the investment advisory agreement for each applicable Portfolio were in the best interest of the respective Portfolios and their shareholders.
24 Janus Aspen Series December 31, 2006
Explanations of Charts, Tables and
Financial Statements (unaudited)
1. PERFORMANCE OVERVIEWS
The performance overview graph compares the performance of a hypothetical $10,000 investment in the Portfolio with one or more widely used market indices. The hypothetical example does not represent the returns of any particular investment.
When comparing the performance of the Portfolio with an index, keep in mind that market indices do not include brokerage commissions that would be incurred if you purchased the individual securities in the index. They also do not include taxes payable on dividends and interest or operating expenses incurred if you maintained a Portfolio invested in the index.
Average annual total returns are quoted for each class of the Portfolio. Average annual total return is calculated by taking the growth or decline in value of an investment over a period of time, including reinvestment of any dividends, distributions and capital gains, then calculating the annual compounded percentage rate that would have produced the same result had the rate of growth been constant throughout the period. Average annual total return does not reflect the deduction of taxes that a shareholder would pay on Portfolio distributions or redemptions of Portfolio shares.
2. SCHEDULE OF INVESTMENTS
Following the performance overview section is the Portfolio's Schedule of Investments. This schedule reports the industry concentrations and types of securities held in the Portfolio on the last day of the reporting period. Securities are usually listed by type (common stock, corporate bonds, U.S. Government obligations, etc.) and by industry classification (banking, communications, insurance, etc.). Holdings are subject to change without notice.
The value of each security is quoted as of the last day of the reporting period. The value of securities denominated in foreign currencies is converted into U.S. dollars. Certain short-term investments maturing within 60 days are valued at amortized cost, which approximates market value.
A summary of investments by country is provided if the Portfolio invested in foreign securities. This summary reports the Portfolio's exposure to different countries by providing the percentage of securities invested in each country. The country of each security represents the country in which the company is incorporated.
2A. FORWARD CURRENCY CONTRACTS
A table listing forward currency contracts follows the Portfolio's Schedule of Investments (if applicable). Forward currency contracts are agreements to deliver or receive a preset amount of currency at a future date. Forward currency contracts are used to hedge against foreign currency risk in the Portfolio's long-term holdings. The table provides the name of the foreign currency, the settlement date of the contract, the amount of the contract, the value of the currency in U.S. dollars and the amount of unrealized gain or loss. The amount of unrealized gain or loss reflects the change in currency exchange rates from the time the contract was opened to the last day of the reporting period.
2B. FUTURES
A table listing futures contracts follows the Portfolio's Schedule of Investments (if applicable). Futures contracts are contracts that obligate the buyer to receive and the seller to deliver an instrument or money at a specified price on a specified date. Futures are used to hedge against adverse movements in securities prices, currency risk or interest rates.
The table provides the name of the contract, number of contracts held, the expiration date, the principal amount, value and the amount of unrealized gain or loss. The amount of unrealized gain or loss reflects the marked-to-market amount for the last day of the reporting period.
3. STATEMENT OF ASSETS AND LIABILITIES
This statement is often referred to as the "balance sheet." It lists the assets and liabilities of the Portfolio on the last day of the reporting period.
The Portfolio's assets are calculated by adding the value of the securities owned, the receivable for securities sold but not yet settled, the receivable for dividends declared but not yet received on stocks owned and the receivable for Portfolio shares sold to investors but not yet settled. The Portfolio's liabilities include payables for securities purchased but not yet settled, Portfolio shares redeemed but not yet paid and expenses owed but not yet paid. Additionally, there may be other assets and liabilities such as unrealized gain or loss on forward currency contracts.
The section entitled "Net Assets Consist of" breaks down the components of the Portfolio's net assets. Because the Portfolio must distribute substantially all earnings, you will notice that a significant portion of net assets is shareholder capital.
The last section of this statement reports the net asset value ("NAV") per share on the last day of the reporting period for each class of the Portfolio. The NAV is calculated by dividing the Portfolio's net assets (assets minus liabilities) by the number of shares outstanding.
Janus Aspen Series December 31, 2006 25
Explanations of Charts, Tables and
Financial Statements (unaudited) (continued)
4. STATEMENT OF OPERATIONS
This statement details the Portfolio's income, expenses, gains and losses on securities and currency transactions, and appreciation or depreciation of current Portfolio holdings.
The first section in this statement, entitled "Investment Income," reports the dividends earned from stocks and interest earned from interest-bearing securities in the Portfolio.
The next section reports the expenses and expense offsets incurred by the Portfolio, including the advisory fee paid to the investment adviser and transfer agent fees and expenses, and printing and postage for mailing statements, financial reports and prospectuses. Expense offsets, if any, are also shown.
The last section lists the increase or decrease in the value of securities held in the Portfolio. The Portfolio realizes a gain (or loss) when it sells its position in a particular security. An unrealized gain (or loss) refers to the change in net appreciation or depreciation of the Portfolio during the reporting period. "Net Realized and Unrealized Gain/(Loss) on Investments" is affected both by changes in the market value of Portfolio holdings and by gains (or losses) realized during the reporting period.
5. STATEMENT OF CHANGES IN NET ASSETS
This statement reports the increase or decrease in the Portfolio's net assets during the reporting period. Changes in the Portfolio's net assets are attributable to investment operations, dividends, distributions and capital share transactions. This is important to investors because it shows exactly what caused the Portfolio's net asset size to change during the period.
The first section summarizes the information from the Statement of Operations regarding changes in net assets due to the Portfolio's investment performance. The Portfolio's net assets may also change as a result of dividend and capital gains distributions to investors. If investors receive their dividends in cash, money is taken out of the Portfolio to pay the distribution. If investors reinvest their dividends, the Portfolio's net assets will not be affected. If you compare the Portfolio's "Net Decrease from Dividends and Distributions" to the "Reinvested dividends and distributions," you will notice that dividend distributions had little effect on the Portfolio's net assets. This is because the majority of Janus investors reinvest their distributions.
The reinvestment of dividends is included under "Capital Share Transactions." "Capital Shares" refers to the money investors contribute to the Portfolio through purchases or withdraw via redemptions. The Portfolio's net assets will increase and decrease in value as investors purchase and redeem shares from the Portfolio.
6. FINANCIAL HIGHLIGHTS
This schedule provides a per-share breakdown of the components that affect the Portfolio's NAV for current and past reporting periods for each class of the Portfolio. Not only does this table provide you with total return, it also reports total distributions, asset size, expense ratios and portfolio turnover rate.
The first line in the table reflects the NAV per share at the beginning of the reporting period. The next line reports the net investment income per share, which comprises dividends and interest income earned on securities held by the Portfolio. Following is the total of gains/(losses), realized and unrealized. Dividends and distributions are then subtracted to arrive at the NAV per share at the end of the period. The next line reflects the average annual total return reported the last day of the period.
Also included are the expense ratios, or the percentage of net assets that are used to cover operating expenses during the period. Expense ratios vary for a number of reasons, including the differences in management fees, the average shareholder account size and the extent of foreign investments, which entail greater transaction costs.
The Portfolio's expenses may be reduced through expense reduction arrangements. These arrangements may include the use of balance credits or transfer agent fee offsets. The Statement of Operations reflects total expenses before any such offset, the amount of offset and the net expenses. The expense ratios listed in the Financial Highlights reflect total expenses prior to any expense offsets (gross expense ratio) and after the expense offsets (net expense ratio). Both expense ratios reflect expenses after waivers (reimbursements), if applicable.
The ratio of net investment income/(loss) summarizes the income earned less expenses, divided by the average net assets of the Portfolio during the reporting period. Don't confuse this ratio with the Portfolio's yield. The net investment income ratio is not a true measure of the Portfolio's yield because it doesn't take into account the dividends distributed to the Portfolio's investors.
The next ratio is the portfolio turnover rate, which measures the buying and selling activity in a Portfolio. Portfolio turnover is affected by market conditions, changes in the asset size of a Portfolio, the nature of the Portfolio's investments and the investment style of the portfolio manager. A 100% rate implies that an amount equal to the value of the entire portfolio is turned over in a year; a 50% rate means that an amount equal to the value of half the portfolio is traded in a year; and a 200% rate means that an amount equal to the value of the portfolio is traded every six months.
26 Janus Aspen Series December 31, 2006
Designation Requirements (unaudited)
For federal income tax purposes, the Portfolio designated the following for the year ended December 31, 2006:
Dividends Received Deduction Percentage
| Portfolio | |||||||
| Janus Aspen Forty Portfolio | 100 | % | |||||
Janus Aspen Series December 31, 2006 27
Trustees and Officers (unaudited)
The Portfolio's Statement of Additional Information includes additional information about the Trustees and officers and is available, without charge, by calling 1-800-525-0020.
The following are the Trustees and officers of the Trust, together with a brief description of their principal occupations during the last five years (principal occupations for certain Trustees may include periods over five years).
Each Trustee has served in that capacity since he or she was originally elected or appointed. The Trustees do not serve a specified term of office. Each Trustee will hold office until the termination of the Trust or his or her earlier death, resignation, retirement, incapacity or removal. The retirement age for Trustees is 72. The Portfolio's Nominating and Governance Committee will consider nominees for the position of Trustee recommended by shareholders. Shareholders may submit the name of a candidate for consideration by the Committee by submitting their recommendations to the Trust's Secretary. Each Trustee is currently a Trustee of two other registered investment companies advised by Janus Capital: Janus Investment Fund and Janus Adviser Series. As of the date of this report, collectively, these three registered investment companies consist of 69 series or funds.
The Trust's officers are elected annually by the Trustees for a one-year term. Certain officers also serve as officers of Janus Investment Fund and Janus Adviser Series. Certain officers of the Portfolio may also be officers and/or directors of Janus Capital. Portfolio officers receive no compensation from the Portfolio, except for the Portfolio's Chief Compliance Officer, as authorized by the Trustees.
Trustees
| Name, Age and Address | Positions Held with Portfolio | Length of Time Served | Principal Occupations During the Past Five Years | Number of Portfolios in Fund Complex Overseen by Trustee | Other Directorships Held by Trustee | ||||||||||||||||||
| Independent Trustees | |||||||||||||||||||||||
| Dennis B. Mullen 151 Detroit Street Denver, CO 80206 Age 63 | Chairman Trustee | 3/04-Present 9/93-Present | Chief Executive Officer of Red Robin Gourmet Burgers, Inc. (since 2005). Formerly, private investor. | 69 | * | Chairman of the Board (since 2005) and Director of Red Robin Gourmet Burgers, Inc.; and Director of Janus Capital Funds Plc (Dublin-based, non-U.S. funds). | |||||||||||||||||
| Jerome S. Contro 151 Detroit Street Denver, CO 80206 Age 50 | Trustee | 12/05-Present | Partner of Tango Group, a private investment firm (since 1999). | 69 | Trustee and Chairman of RS Investment Trust (since 2001); Director of IZZE Beverages and MyFamily.com, Inc. (genealogical research website). | ||||||||||||||||||
| William F. McCalpin 151 Detroit Street Denver, CO 80206 Age 49 | Trustee | 6/02-Present | Private Investor. Formerly, Vice President of Asian Cultural Council and Executive Vice President and Chief Operating Officer of The Rockefeller Brothers Fund (a private family foundation). | 69 | Director of the F.B. Heron Foundation (a private grantmaking foundation). | ||||||||||||||||||
| John W. McCarter, Jr. 151 Detroit Street Denver, CO 80206 Age 68 | Trustee | 6/02-Present | President and Chief Executive Officer of The Field Museum of Natural History (Chicago, IL). | 69 | Chairman of the Board and Director of Divergence Inc. (biotechnology firm); Director of W.W. Grainger, Inc. (industrial distributor); and Trustee of WTTW (Chicago public television station) and the University of Chicago. | ||||||||||||||||||
28 Janus Aspen Series December 31, 2006
Trustees (continued)
| Name, Age and Address | Positions Held with Portfolio | Length of Time Served | Principal Occupations During the Past Five Years | Number of Portfolios in Fund Complex Overseen by Trustee | Other Directorships Held by Trustee | ||||||||||||||||||
| Independent Trustees (cont.) | |||||||||||||||||||||||
| James T. Rothe 151 Detroit Street Denver, CO 80206 Age 63 | Trustee | 1/97-Present | Co-founder and Managing Director of Roaring Fork Capital Management, LLC (private investment in public equity firm); and Professor Emeritus of Business of the University of Colorado, Colorado Springs, CO (since 2004). Formerly, Professor of Business of the University of Colorado (2002-2004); and Distinguished Visiting Professor of Business (2001-2002) of Thunderbird University (American Graduate School of International Management), Glendale, AZ. | 69 | Director of Red Robin Gourmet Burgers, Inc. | ||||||||||||||||||
| William D. Stewart 151 Detroit Street Denver, CO 80206 Age 62 | Trustee | 9/93-Present | Corporate Vice President and General Manager of MKS Instruments – HPS Products, Boulder, CO (a manufacturer of vacuum fittings and valves). | 69 | N/A | ||||||||||||||||||
| Martin H. Waldinger 151 Detroit Street Denver, CO 80206 Age 68 | Trustee | 9/93-Present | Private Investor and Consultant to California Planned Unit Developments. Formerly, CEO and President of Marwal, Inc. (homeowner association management company). | 69 | N/A | ||||||||||||||||||
| Linda S. Wolf 151 Detroit Street Denver, CO 80206 Age 59 | Trustee | 12/05-Present | Retired. Formerly, Chairman and Chief Executive Officer of Leo Burnett (Worldwide) (advertising agency) (2001-2005). | 69 | Director of Wal-Mart, The Field Museum of Natural History (Chicago, IL), Children's Memorial Hospital (Chicago, IL), Chicago Council on Foreign Relations, Economic Club of Chicago, and InnerWorkings (a provider of print procurement solutions). | ||||||||||||||||||
| Interested Trustee | |||||||||||||||||||||||
| Thomas H. Bailey** 151 Detroit Street Denver, CO 80206 Age 69 | Trustee | 5/93-Present | Retired. Formerly, President (1978-2002) and Chief Executive Officer (1994-2002) of Janus Capital or Janus Capital Corporation; Chairman and Director (1978-2002) of Janus Capital Corporation; President and Director (1994-2002) of The Janus Foundation. | 69 | N/A | ||||||||||||||||||
* Mr. Mullen also serves as director of Janus Capital Funds Plc, consisting of 22 funds. Including Janus Capital Funds Plc and the 69 funds comprising the Janus Funds, Mr. Mullen oversees 91 funds.
** The Portfolio is treating Mr. Bailey as an "interested person" of the Trust by virtue of his past positions and continuing relationships with Janus Capital and ownership of shares of Janus Capital's parent company.
Janus Aspen Series December 31, 2006 29
Trustees and Officers (unaudited) (continued)
Officers
| Name, Age and Address | Positions Held with Portfolio | Term of Office* and Length of Time Served | Principal Occupations During the Past Five Years | ||||||||||||
| Scott W. Schoelzel 151 Detroit Street Denver, CO 80206 Age 48 | Executive Vice President and Portfolio Manager Janus Aspen Forty Portfolio | 5/97-Present | Vice President of Janus Capital and Portfolio Manager for other Janus accounts. | ||||||||||||
| Stephanie Grauerholz-Lofton 151 Detroit Street Denver, CO 80206 Age 36 | Chief Legal Counsel and Secretary Vice President | 1/06-Present 3/06-Present | Assistant Vice President of Janus Capital and Janus Distributors LLC; and Associate Counsel of Janus Capital. Formerly, Associate of Vedder, Price, Kaufman & Kammholz, P.C. (1999-2003). | ||||||||||||
| Kelley Abbott Howes 151 Detroit Street Denver, CO 80206 Age 41 | President and Chief Executive Officer | 1/06-Present | President of Janus Services LLC; Senior Vice President and General Counsel of Janus Capital; and Senior Vice President and Assistant General Counsel of Janus Distributors LLC. Formerly, Vice President (1999-2005) of Janus Distributors LLC; Senior Vice President and General Counsel (2004-2006), Vice President (2000-2004), and Assistant General Counsel (2002-2004) of Janus Services LLC; and Vice President and Assistant General Counsel (1999-2004) of Janus Capital. | ||||||||||||
| David R. Kowalski 151 Detroit Street Denver, CO 80206 Age 49 | Vice President and Chief Compliance Officer | 6/02-Present | Senior Vice President and Chief Compliance Officer of Janus Capital, Janus Distributors LLC, and Janus Services LLC; Chief Compliance Officer of Bay Isle Financial LLC; and Vice President of Enhanced Investment Technologies LLC. Formerly, Chief Compliance Officer of Enhanced Investment Technologies, LLC (2003-2005); Vice President of Janus Capital (2000-2005), Janus Distributors LLC (2000-2001), and Janus Services LLC (2004-2005); and Assistant Vice President of Janus Services LLC (2002-2004). | ||||||||||||
| Jesper Nergaard 151 Detroit Street Denver, CO 80206 Age 44 | Chief Financial Officer Vice President, Treasurer, and Principal Accounting Officer | 3/05-Present 2/05-Present | Vice President of Janus Capital. Formerly, Director of Financial Reporting for OppenheimerFunds, Inc. (2004-2005); Site Manager and First Vice President of Mellon Global Securities Services (2003); and Director of Fund Accounting, Project Development, and Training of INVESCO Funds Group (1994-2003). | ||||||||||||
* Officers are elected at least annually for a one-year term and may also be elected from time to time by the Trustees for an interim period.
30 Janus Aspen Series December 31, 2006
Notes
Janus Aspen Series December 31, 2006 31
Notes
32 Janus Aspen Series December 31, 2006
Notes
Janus Aspen Series December 31, 2006 33
Janus provides access to a wide range of investment disciplines.
Growth
Janus growth portfolios focus on companies believed to be the leaders in their respective industries, with solid management teams, expanding market share, margins and efficiencies.
Core
Janus core portfolios seek investments in more stable and predictable companies. These portfolios look for a strategic combination of steady growth and for certain portfolios, some degree of income.
Risk-Managed
Our risk-managed portfolios seek to outperform their respective indices while maintaining a risk profile equal to or lower than the index itself. Managed by INTECH (a Janus subsidiary), these portfolios use a mathematical process in an attempt to build a more "efficient" portfolio than the index.
Value
Janus value portfolios invest in companies they believe are poised for a turnaround or are trading at a significant discount to fair value. The goal is to gain unique insight into a company's true value and identify and evaluate potential catalysts that may unlock shareholder value.
International & Global
Janus international and global portfolios seek to leverage Janus' research capabilities by taking advantage of inefficiencies in foreign markets, where accurate information and analytical insight are often at a premium.
Bond & Money Market
Janus bond portfolios attempt to provide less risk relative to equities while seeking to deliver a competitive total return through high current income and appreciation. Janus money market portfolios seek maximum current income consistent with stability of capital.
For more information about our funds, contact your investment professional or go to www.janus.com/info
Please consider the charges, risks, expenses and investment objectives carefully before investing. For a prospectus containing this and other information, please call Janus at 1-800-525-0020 or download the file from www.janus.com/info. Read it carefully before you invest or send money.
An investment in a money market portfolio is not insured or guaranteed by the Federal Deposit Insurance Corporation or any other government agency. Although the Portfolio seeks to preserve the value of your investment at $1.00 per share, it is possible to lose money by investing in the Portfolio.

151 Detroit Street
Denver, CO 80206
1-800-525-0020
Portfolio distributed by Janus Distributors LLC (1/07)
C-0207-169 109-02-710 01-07
2006 Annual Report
Janus Aspen Series
Janus Aspen Fundamental Equity Portfolio
Look Inside. . .
• Portfolio management perspective
• Investment strategy behind your portfolio
• Portfolio performance, characteristics and holdings

Table of Contents
| Useful Information About Your Portfolio Report | 1 | ||||||
| Management Commentary and Schedule of Investments | 2 | ||||||
| Statement of Assets and Liabilities | 8 | ||||||
| Statement of Operations | 9 | ||||||
| Statements of Changes in Net Assets | 10 | ||||||
| Financial Highlights | 11 | ||||||
| Notes to Schedule of Investments | 12 | ||||||
| Notes to Financial Statements | 13 | ||||||
| Report of Independent Registered Public Accounting Firm | 20 | ||||||
| Additional Information | 21 | ||||||
| Explanations of Charts, Tables and Financial Statements | 24 | ||||||
| Designation Requirements | 26 | ||||||
| Trustees and Officers | 27 | ||||||
Please consider the charges, risks, expenses and investment objectives carefully before investing. For a prospectus containing this and other information, please call Janus at 1-800-525-0020 or download the file from www.janus.com/info. Read it carefully before you invest or send money.
Useful Information About Your Portfolio Report
Management Commentary
The Management Commentary in this report includes valuable insight from the Portfolio's manager as well as statistical information to help you understand how your Portfolio's performance and characteristics stack up against those of comparable indices.
Please keep in mind that the opinions expressed by the Portfolio's manager in the Management Commentary are just that: opinions. They are a reflection of the manager's best judgment at the time this report was compiled, which was December 31, 2006. As the investing environment changes, so could the manager's opinions. The views are unique to the manager and aren't necessarily shared by his fellow employees or by Janus in general.
Portfolio Expenses
We believe it's important for our shareholders to have a clear understanding of Portfolio expenses and the impact they have on investment return.
The following is important information regarding the Portfolio's Expense Example, which appears in the Management Commentary within this Annual Report. Please refer to this information when reviewing the Expense Example for the Portfolio.
Example
As a shareholder of a Portfolio, you incur two types of costs: (1) transaction costs, including redemption fees (where applicable) (and any related exchange fees) and (2) ongoing costs, including management fees; distribution and shareholder servicing (12b-1) fees (applicable to Service Shares only); and other Portfolio expenses. The example is intended to help you understand your ongoing costs (in dollars) of investing in a Portfolio and to compare these costs with the ongoing costs of investing in other mutual funds. To do so, compare this 5% hypothetical example with the 5% hypothetical examples that appear in the shareholder reports of the other funds. The example is based upon an investment of $1,000 invested at the beginning of the period and held for the six-month period from July 1, 2006 to December 31, 2006.
Actual Expenses
The first line of the table in each example provides information about actual account values and actual expenses. You may use the information in this line, together with the amount you invested, to estimate the expenses that you paid over the period. Simply divide your account value by $1,000 (for example, an $8,600 account value divided by $1,000 = 8.6), then multiply the result by the number in the first line under the heading entitled "Expenses Paid During Period" to estimate the expenses you paid on your account during the period.
Hypothetical Example for Comparison Purposes
The second line of the table in each example provides information about hypothetical account values and hypothetical expenses based upon the Portfolio's actual expense ratio and an assumed rate of return of 5% per year before expenses, which is not the Portfolio's actual return. The hypothetical account values and expenses may not be used to estimate the actual ending account balance or expenses you paid for the period. You may use this information to compare the ongoing costs of investing in the Portfolio and other funds. To do so, compare this 5% hypothetical example with the 5% hypothetical examples that appear in the shareholder reports of the other funds.
Janus Capital Management LLC ("Janus Capital") has contractually agreed to waive the Portfolio's total operating expenses, excluding the distribution and shareholder servicing (12b-1) fees applicable to Service Shares, brokerage commissions, interest, taxes and extraordinary expenses to certain limits until at least May 1, 2008. Expenses in the examples reflect application of these waivers. Had the waivers not been in effect, your expenses would have been higher. More information regarding the waivers is available in the Portfolio's prospectus.
Please note that the expenses shown in the tables are meant to highlight your ongoing costs only and do not reflect any transaction costs, such as redemption fees (where applicable) and any charges at the separate account level or contract level. Redemption fees are fully described in the prospectus. Therefore, the second line of each table is useful in comparing ongoing costs only, and will not help you determine the relative total costs of owning different funds. In addition, if these transaction costs and separate account or contract level charges were included, your costs would have been higher.
Janus Aspen Series December 31, 2006 1
Janus Aspen Fundamental Equity Portfolio (unaudited)
Portfolio Snapshot
The conservative growth portfolio from Janus relies on detailed research to drive its fundamental approach to investing in core holdings and opportunistic companies.

Minyoung Sohn
portfolio manager
Performance Overview
For the 12-month period ended December 31, 2006, Janus Aspen Fundamental Equity Portfolio's Institutional Shares and Service Shares returned 9.99% and 9.69%, respectively, trailing the Portfolio's primary benchmark, the S&P 500® Index, which gained 15.80%. The Portfolio did beat the 9.07% return of the Russell 1000® Growth Index, its secondary benchmark.
Investment Philosophy and Strategy – How Stocks are Selected
The investment objective of the Portfolio is to seek long-term growth of capital. The primary difference between Janus Aspen Fundamental Equity Portfolio and Janus Aspen Growth and Income Portfolio, the other Portfolio I manage, is that Janus Aspen Fundamental Equity Portfolio does not have an income component. As such, the Portfolio is invested predominantly in stocks to seek capital appreciation. My investment strategy is built on a combination of in-depth grassroots research and rigorous quantitative analysis, and I fully use the skills and knowledge of the research team in this process. The research process begins by identifying companies we believe have sustainable competitive advantages in product manufacturing, product distribution, or research and development. Janus' analysts devote much of their time and energy in the field – interviewing suppliers, competitors and partners – in an effort to develop deep knowledge of the i ndustry ecosystem. After assessing the qualitative characteristics, we look at the financial metrics in detail to identify companies we believe are poised to deliver improving margins, returns on invested capital and free cash flow. This involves a careful review of the balance sheet and cash flow statements, and understanding how they interconnect with the income statement. Our company analysis is not complete until we test the valuation of the stock against a variety of market scenarios using discounted cash flow evaluations. Then, after assigning probabilities to each outcome, we finally derive a price target for the stock.
Weak Performers – Yahoo! and Neurocrine Biosciences
The Portfolio's holdings in Yahoo! and Neurocrine Biosciences were significant detractors from performance. Yahoo! was the biggest disappointment, with shares declining 34.81% on continued concerns over the company's long-term growth rate, as well as its competitive positioning versus rival Google. Despite these pressures, I held the position. The traditional media industry is facing formidable challenges as content
digitalization and the emergence of new distribution channels drive increased audience fragmentation and declining audiences in general. Due to its large and growing user base, I believe Yahoo! is well positioned to benefit from this trend through its multiple revenue streams in branded advertising, sponsored search, and premium subscription services. In the near-term, I am also relatively positive on prospects tied to Yahoo!'s new search platform, called "Project Panama," which may help the company to improve the growth and profitability of its search business.
Our position in Neurocrine Biosciences was one of the largest detractors, with shares down over 83% for the period. Neurocrine received a blow in the second quarter after the Food and Drug Administration (FDA) failed to approve the 15-milligram formulation of its prospective insomnia treatment Indiplon, due to concerns over certain low-level amnesia side effects. The FDA did issue approval letters for the lower 5- and 10-milligram doses of the drug. Nonetheless, in the wake of this news, pharmaceutical marketing powerhouse Pfizer abandoned its plans to help co-market Indiplon, which cast additional uncertainty on its commercial future. Then, in the fourth quarter, the stock took another tumble after Neurocrine reported a larger-than-anticipated third quarter financial loss. Meanwhile, the company announced plans to conduct additional clinical studies on Indiplon, and plans to resubmit the drug for approval in the summer of 2008. Despite thes e struggles, we maintained a stake in Neurocrine. This decision reflected our continued evaluation of the company's trial data, and our views on the efficacy of Indiplon relative to other sleep aids.
Significant Contributors Included Financial and Pharmaceutical Holdings
Portfolio performance benefited from strong advances by a number of individual financial services holdings, as well as solid stock selection in the pharmaceutical sector. Financial services powerhouse Merrill Lynch was the Portfolio's strongest performer during the period, with its shares up 39.28% for the
2 Janus Aspen Series December 31, 2006
(unaudited)
year. The investment thesis for buying Merrill Lynch was our belief that the company was poised to deliver expanding returns on equity through the combination of improving profitability across its major businesses and aggressive repurchase of its shares. Merrill has further invested in its businesses by attracting talent from competitors and enhancing capabilities in fixed-income, derivatives, commodities, investment banking and prime brokerage. Although these businesses are more capital-intensive, they leverage the company's inefficient balance sheet (too much accumulated equity capital) and should help to drive faster revenue growth and enhanced profitability and returns. We believe that better balance sheet utilization alone, provided by the enhanced focus on these businesses, will boost Merrill's returns on equity and drive higher valuation for the stock. Consequently, I continue to hold our position.
The Portfolio's holding in JP Morgan Chase was another strong contributor to performance, as the stock gained 25.60% during the period. The thesis for buying JP Morgan was that we believe new CEO Jaime Dimon will energize the profitability of the company's collection of businesses by lowering the cost structure and using its large scale to generate new business opportunities. One of our research analysts, Gabe Bodhi, has conducted extensive qualitative research and quantitative analysis on the company. He not only met with numerous top managers at JP Morgan, but he also built detailed bottom-up financial models to support his investment thesis. I believe the stock continues to trade at a relatively modest valuation relative to its potential earnings growth, and consequently provides a potentially significant margin of safety while we anticipate even better share price performance in the future.
Merck was another positive contributor, with shares gaining 36.48% for the 12-month period. When I first bought Merck at the beginning of the year, it was a contrarian investment call based on my view of improving company fundamentals against a backdrop of secular challenges to the pharmaceutical industry, as well as Merck's highly publicized problems with Vioxx. Despite the negative sentiment surrounding the stock, Janus research analyst Andy Acker championed his reasons for the contrarian view: (1) valuation support – Merck was trading at only 14 times 2006 earnings with a 4.6% dividend yield; (2) he believed that Merck was entering a new product cycle with three new vaccines, each with over $1 billion in global sales revenue potential; (3) he noted that Merck was targeting $5 billion in cost savings through 2010, which should allow product gross margins to return to the high 70s from 75% this year; and (4) he gained confidence in the company's improving late-stage pipeline with new blockbuster potential drugs for cholesterol, diabetes and HIV. Based on this research, Merck remains a top holding in the Portfolio.
Closing Comments
The challenge in the recent environment has been to provide you with attractive returns (after expenses) that reward your confidence in our investment management efforts, while at the same time managing downside risk in what has been a volatile market. I welcome this challenge, as I am supported by a talented analyst pool. I remain firm in my strategy of picking stocks one at a time and staying close to what I believe are the best ideas generated by the Janus research team.
As always, I promise you my utmost effort in the periods ahead. In addition, a portion of my personal assets are invested here at Janus in the two retail funds under my charge, Janus Growth and Income Fund and Janus Fundamental Equity Fund, and I continue to contribute every month to both.
Thank you for your investment in Janus Aspen Fundamental Equity Portfolio.
Janus Aspen Fundamental Equity Portfolio At a Glance
5 Largest Contributors to Performance – Holdings
| Contribution | |||||||
| Merrill Lynch & Company, Inc. Investment banking services – U.S. | 1.33 | % | |||||
| Exxon Mobil Corp. Petroleum and petrochemical business operator – U.S. | 1.02 | % | |||||
| Merck & Company, Inc. Global pharmaceutical company – U.S. | 0.97 | % | |||||
| JP Morgan Chase & Co. Financial products and services provider – U.S. | 0.96 | % | |||||
| Celgene Corp. Biopharmaceutical company – U.S. | 0.94 | % | |||||
5 Largest Detractors from Performance – Holdings
| Contribution | |||||||
| Yahoo!, Inc. Global Internet media company – U.S. | (1.00 | )% | |||||
| Advanced Micro Devices, Inc. Integrated circuits provider – U.S. | (0.86 | )% | |||||
| Neurocrine Biosciences, Inc. Biotechnology company – U.S. | (0.72 | )% | |||||
| Whole Foods Market, Inc. Owner and operator of a chain of natural food supermarkets – U.S. | (0.47 | )% | |||||
| Aetna, Inc. Healthcare and related benefits provider – U.S. | (0.46 | )% | |||||
Janus Aspen Series December 31, 2006 3
Janus Aspen Fundamental Equity Portfolio (unaudited)
5 Largest Contributors to Performance – Sectors
| Group | Fund Contribution | Fund Weighting (% of Net Assets) | S&P 500® Index Weighting | ||||||||||||
| Diversified Financials | 3.21 | % | 12.00 | % | 9.48 | % | |||||||||
| Energy | 3.14 | % | 17.92 | % | 9.84 | % | |||||||||
| Pharmaceuticals & Biotechnology | 2.06 | % | 10.28 | % | 8.07 | % | |||||||||
| Capital Goods | 1.68 | % | 7.47 | % | 8.72 | % | |||||||||
| Technology Hardware & Equipment | 1.44 | % | 3.70 | % | 6.87 | % | |||||||||
5 Largest Detractors from Performance – Sectors
| Group | Fund Contribution | Fund Weighting (% of Net Assets) | S&P 500® Index Weighting | ||||||||||||
| Semiconductors & Semiconductor Equipment | (1.13 | )% | 8.41 | % | 2.82 | % | |||||||||
| Healthcare Equipment & Services | (1.08 | )% | 4.65 | % | 4.57 | % | |||||||||
| Food & Staples Retailing | (0.51 | )% | 1.46 | % | 2.33 | % | |||||||||
| Materials | (0.23 | )% | 1.10 | % | 2.99 | % | |||||||||
| Software & Services | (0.01 | )% | 10.28 | % | 5.53 | % | |||||||||
5 Largest Equity Holdings – (% of Net Assets)
As of December 31, 2006
| General Electric Co. Diversified Operations | 4.2 | % | |||||
| JP Morgan Chase & Co. Finance - Investment Bankers/Brokers | 4.2 | % | |||||
| Merrill Lynch & Company, Inc. Finance - Investment Bankers/Brokers | 4.1 | % | |||||
| Citigroup, Inc. Finance - Investment Bankers/Brokers | 3.8 | % | |||||
| Roche Holding A.G. Medical - Drugs | 3.1 | % | |||||
| 19.4 | % | ||||||
Asset Allocation – (% of Net Assets)
As of December 31, 2006
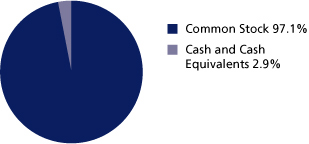
Emerging markets comprised 2.5% of total net assets.
Top Country Allocations – (% of Investment Securities)
| As of December 31, 2006 | As of December 31, 2005 | ||||||
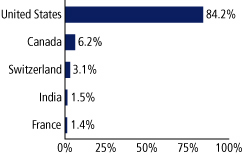 | 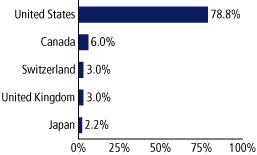 | ||||||
4 Janus Aspen Series December 31, 2006
(unaudited)
Performance

Average Annual Total Return – for the periods ended December 31, 2006
| One Year | Five Year | Since Inception* | |||||||||||||
| Janus Aspen Fundamental Equity Portfolio - Institutional Shares | 9.99 | % | 7.74 | % | 13.09 | % | |||||||||
| Janus Aspen Fundamental Equity Portfolio - Service Shares | 9.69 | % | 7.88 | % | 12.96 | % | |||||||||
| S&P 500® Index | 15.80 | % | 6.19 | % | 7.82 | % | |||||||||
| Russell 1000® Growth Index | 9.07 | % | 2.69 | % | 4.90 | % | |||||||||
| Lipper Quartile - Institutional Shares | 4 | th | 1 | st | 1 | st | |||||||||
| Lipper Ranking - Institutional Shares based on total returns for Variable Annuity Large-Cap Core Funds | 191/224 | 14/165 | 1/70 | ||||||||||||
Data presented represents past performance, which is no guarantee of future results. Investment results and principal value will fluctuate so that shares, when redeemed, may be worth more or less than their original cost. Due to market volatility, current performance may be higher or lower than the performance shown. Call 877.33JANUS or visit www.janus.com/info for performance current to the most recent month-end.
See Notes to Schedule of Investments for index definitions.
Total return includes reinvestment of dividends from net investment income and distributions from capital gains. The returns shown do not reflect the deduction of taxes that a shareholder would pay on Portfolio distributions or the redemption of Portfolio shares.
Returns shown for Service Shares for periods prior to December 31, 1999 are derived from the historical performance of Institutional Shares, adjusted to reflect the higher operating expenses of Service Shares.
These returns do not reflect the charges and expenses of any particular insurance product or qualified plan. Returns shown would have been lower had they included insurance charges.
The Portfolio may differ significantly from the securities held in the indices. The indices are not available for direct investment; therefore their performance does not reflect the expenses associated with the active management of an actual Portfolio.
There is no assurance that the investment process will consistently lead to successful investing.
The Portfolio's performance may be affected by risks that include those associated with nondiversification, non-investment grade debt securities, undervalued or overlooked companies, investments in specific industries or countries and potential conflicts of interest with Janus Smart Portfolios. Additional risks to the Portfolio may include those associated with investing in foreign securities, emerging markets, initial public offerings, derivatives and companies with relatively small market capitalizations. Please see a Janus prospectus or www.janus.com/info for more information about risk, fund holdings and details.
Lipper Inc. - A Reuters Company, is a nationally recognized organization that ranks the performance of mutual funds within a universe of funds that have similar investment objectives. Rankings are historical with capital gains and dividends reinvested.
The date of the since-inception Lipper ranking is slightly different from when the Portfolio began operations since Lipper provides fund rankings as of the last day of the month or the first Thursday after fund inception.
Ranking is for the Institutional share class only; other classes may have different performance characteristics.
Effective May 1, 2006, Janus Aspen Core Equity Portfolio changed its name to Janus Aspen Fundamental Equity Portfolio.
The Portfolio will invest at least 80% of its net assets in the type of securities described by its name.
Janus Capital has contractually agreed to waive the Portfolio's total operating expenses to the levels indicated in the prospectus until at least May 1, 2008. Total returns shown include fee waivers, if any, and without such waivers total returns would have been lower.
See "Explanations of Charts, Tables and Financial Statements."
*The Portfolio's inception date – May 1, 1997
Portfolio Expenses
The example below shows you the ongoing costs (in dollars) of investing in your Portfolio and allows you to compare these costs with those of other mutual funds. Please refer to page 1 for a detailed explanation of the information presented in these charts.
| Expense Example - Institutional Shares | Beginning Account Value (7/1/06) | Ending Account Value (12/31/06) | Expenses Paid During Period (7/1/06-12/31/06)* | ||||||||||||
| Actual | $ | 1,000.00 | $ | 1,066.10 | $ | 6.25 | |||||||||
| Hypothetical (5% return before expenses) | $ | 1,000.00 | $ | 1,019.16 | $ | 6.11 | |||||||||
| Expense Example - Service Shares | Beginning Account Value (7/1/06) | Ending Account Value (12/31/06) | Expenses Paid During Period (7/1/06-12/31/06)* | ||||||||||||
| Actual | $ | 1,000.00 | $ | 1,064.30 | $ | 7.54 | |||||||||
| Hypothetical (5% return before expenses) | $ | 1,000.00 | $ | 1,017.90 | $ | 7.37 | |||||||||
*Expenses are equal to the annualized expense ratio of 1.20% for Institutional Shares and 1.45% for Service Shares, multiplied by the average account value over the period, multiplied by 184/365 (to reflect the one-half year period). Expenses may include effect of contractual waivers by Janus Capital.
Janus Aspen Series December 31, 2006 5
Janus Aspen Fundamental Equity Portfolio
Schedule of Investments
As of December 31, 2006
| Shares or Principal Amount | Value | ||||||||||
| Common Stock - 97.1% | |||||||||||
| Advertising Sales - 1.7% | |||||||||||
| 9,040 | Clear Channel Outdoor Holdings, Inc.* | $ | 252,306 | ||||||||
| Aerospace and Defense - 2.0% | |||||||||||
| 3,480 | Boeing Co. | 309,163 | |||||||||
| Agricultural Operations - 0.8% | |||||||||||
| 3,690 | Archer-Daniels-Midland Co. | 117,932 | |||||||||
| Casino Hotels - 2.2% | |||||||||||
| 4,010 | Harrah's Entertainment, Inc. | 331,707 | |||||||||
| Coal - 0.8% | |||||||||||
| 2,860 | Peabody Energy Corp. | 115,573 | |||||||||
| Commercial Banks - 2.2% | |||||||||||
| 9,390 | Commerce Bancorp, Inc. | 331,185 | |||||||||
| Computers - 2.2% | |||||||||||
| 2,360 | Apple Computer, Inc.* | 200,222 | |||||||||
| 5,145 | Dell, Inc.* | 129,088 | |||||||||
| 329,310 | |||||||||||
| Computers - Memory Devices - 2.5% | |||||||||||
| 28,870 | EMC Corp.* | 381,084 | |||||||||
| Cosmetics and Toiletries - 2.4% | |||||||||||
| 5,700 | Procter & Gamble Co. | 366,339 | |||||||||
| Diversified Operations - 4.2% | |||||||||||
| 17,231 | General Electric Co. | 641,166 | |||||||||
| E-Commerce/Products - 0.9% | |||||||||||
| 3,300 | Amazon.com, Inc.* | 130,218 | |||||||||
| Electronic Components - Semiconductors - 5.7% | |||||||||||
| 17,165 | Advanced Micro Devices, Inc.* | 349,307 | |||||||||
| 248 | Samsung Electronics Company, Ltd. | 163,467 | |||||||||
| 7,985 | Spansion, Inc. - Class A* | 118,657 | |||||||||
| 8,215 | Texas Instruments, Inc. | 236,592 | |||||||||
| 868,023 | |||||||||||
| Electronic Forms - 2.2% | |||||||||||
| 7,960 | Adobe Systems, Inc.* | 327,315 | |||||||||
| Energy - Alternate Sources - 0.6% | |||||||||||
| 1,220 | First Solar, Inc.* | 36,356 | |||||||||
| 1,615 | Suntech Power Holdings Company, Ltd. (ADR)* | 54,926 | |||||||||
| 91,282 | |||||||||||
| Enterprise Software/Services - 2.7% | |||||||||||
| 15,035 | Oracle Corp.* | 257,700 | |||||||||
| 2,940 | SAP A.G. (ADR)** | 156,114 | |||||||||
| 413,814 | |||||||||||
| Entertainment Software - 1.1% | |||||||||||
| 3,415 | Electronic Arts, Inc.* | 171,979 | |||||||||
| Finance - Credit Card - 1.3% | |||||||||||
| 3,225 | American Express Co. | 195,661 | |||||||||
| Finance - Investment Bankers/Brokers - 12.1% | |||||||||||
| 10,406 | Citigroup, Inc. | 579,614 | |||||||||
| 12,925 | JP Morgan Chase & Co. | 624,277 | |||||||||
| 6,590 | Merrill Lynch & Company, Inc. | 613,529 | |||||||||
| 1,817,420 | |||||||||||
| Finance - Mortgage Loan Banker - 2.6% | |||||||||||
| 6,700 | Fannie Mae | 397,913 | |||||||||
| Finance - Other Services - 0.3% | |||||||||||
| 355 | Nymes Holdings, Inc.* | 44,024 | |||||||||
| Shares or Principal Amount | Value | ||||||||||
| Food - Canned - 0.7% | |||||||||||
| 3,390 | TreeHouse Foods, Inc.* | $ | 105,768 | ||||||||
| Food - Retail - 0.9% | |||||||||||
| 3,030 | Whole Foods Market, Inc. | 142,198 | |||||||||
| Hotels and Motels - 0.7% | |||||||||||
| 1,325 | Four Seasons Hotels, Inc. | 108,637 | |||||||||
| Industrial Automation and Robotics - 1.2% | |||||||||||
| 3,085 | Rockwell Automation, Inc. | 188,432 | |||||||||
| Medical - Biomedical and Genetic - 1.8% | |||||||||||
| 4,795 | Celgene Corp.* | 275,856 | |||||||||
| Medical - Drugs - 7.3% | |||||||||||
| 9,935 | Merck & Company, Inc. | 433,166 | |||||||||
| 2,612 | Roche Holding A.G. | 468,380 | |||||||||
| 2,294 | Sanofi-Aventis** | 211,821 | |||||||||
| 1,113,367 | |||||||||||
| Medical - HMO - 2.3% | |||||||||||
| 6,875 | Coventry Health Care, Inc.* | 344,094 | |||||||||
| Oil - Field Services - 0.9% | |||||||||||
| 4,250 | Halliburton Co. | 131,963 | |||||||||
| Oil and Gas Drilling - 0.6% | |||||||||||
| 1,195 | Transocean, Inc. (U.S. Shares)* | 96,664 | |||||||||
| Oil Companies - Exploration and Production - 3.2% | |||||||||||
| 2,770 | Apache Corp. | 184,233 | |||||||||
| 4,695 | EnCana Corp. (U.S. Shares) | 215,735 | |||||||||
| 1,355 | EOG Resources, Inc. | 84,620 | |||||||||
| 484,588 | |||||||||||
| Oil Companies - Integrated - 10.0% | |||||||||||
| 2,195 | ConocoPhillips | 157,930 | |||||||||
| 4,265 | Exxon Mobil Corp. | 326,827 | |||||||||
| 8,790 | Hess Corp. | 435,719 | |||||||||
| 1,935 | Marathon Oil Corp. | 178,988 | |||||||||
| 5,342 | Suncor Energy, Inc. | 420,480 | |||||||||
| 1,519,944 | |||||||||||
| Oil Refining and Marketing - 2.2% | |||||||||||
| 6,591 | Valero Energy Corp. | 337,196 | |||||||||
| Retail - Consumer Electronics - 1.0% | |||||||||||
| 3,022 | Best Buy Company, Inc. | 148,652 | |||||||||
| Retail - Drug Store - 2.2% | |||||||||||
| 10,970 | CVS Corp. | 339,083 | |||||||||
| Retail - Jewelry - 1.5% | |||||||||||
| 5,990 | Tiffany & Co. | 235,048 | |||||||||
| Retail - Regional Department Stores - 1.7% | |||||||||||
| 6,705 | Federated Department Stores, Inc. | 255,662 | |||||||||
| Steel - Producers - 1.4% | |||||||||||
| 19,709 | Tata Steel, Ltd. | 214,746 | |||||||||
| Telecommunication Equipment - Fiber Optics - 0.7% | |||||||||||
| 5,980 | Corning, Inc.* | 111,886 | |||||||||
| Therapeutics - 0.8% | |||||||||||
| 1,500 | Gilead Sciences, Inc.* | 97,395 | |||||||||
| 1,880 | Neurocrine Biosciences, Inc.* | 19,590 | |||||||||
| 116,985 | |||||||||||
| Transportation - Railroad - 2.4% | |||||||||||
| 4,255 | Canadian National Railway Co. (U.S. Shares) | 183,093 | |||||||||
| 1,960 | Union Pacific Corp. | 180,359 | |||||||||
| 363,452 | |||||||||||
See Notes to Schedule of Investments and Financial Statements.
6 Janus Aspen Series December 31, 2006
Schedule of Investments
As of December 31, 2006
| Shares/Principal/Contract Amounts | Value | ||||||||||
| Web Portals/Internet Service Providers - 2.6% | |||||||||||
| 15,385 | Yahoo!, Inc.* | $ | 392,933 | ||||||||
| Wireless Equipment - 0.5% | |||||||||||
| 3,630 | Nokia Oyj (ADR)** | 73,762 | |||||||||
| Total Common Stock (cost $12,139,418) | 14,734,330 | ||||||||||
| Money Markets - 1.7% | |||||||||||
| 137,600 | Janus Institutional Cash Reserves Fund, 5.29% | 137,600 | |||||||||
| 115,400 | Janus Money Market Fund, 5.24% | 115,400 | |||||||||
| Total Money Markets (cost $253,000) | 253,000 | ||||||||||
| Purchased Options - Calls - 0% | |||||||||||
| 13 | Procter & Gamble Co. expires January 2008 exercise price $70.00 (premiums paid $3,220) | 3,055 | |||||||||
| Total Investments (total cost $12,395,638) – 98.8% | 14,990,385 | ||||||||||
| Cash, Receivables and Other Assets, net of Liabilities** – 1.2% | 174,823 | ||||||||||
| Net Assets – 100% | $ | 15,165,208 | |||||||||
Summary of Investments by Country
| Country | Value | % of Investment Securities | |||||||||
| Canada | $ | 927,945 | 6.2 | % | |||||||
| Cayman Islands | 151,590 | 1.0 | % | ||||||||
| Finland | 73,762 | 0.5 | % | ||||||||
| France | 211,821 | 1.4 | % | ||||||||
| Germany | 156,114 | 1.0 | % | ||||||||
| India | 214,746 | 1.5 | % | ||||||||
| South Korea | 163,467 | 1.1 | % | ||||||||
| Switzerland | 468,380 | 3.1 | % | ||||||||
| United States†† | 12,622,560 | 84.2 | % | ||||||||
| Total | $ | 14,990,385 | 100.0 | % | |||||||
†† Includes Short-Term Securities (82.5% excluding Short-Term Securities)
Forward Currency Contracts, Open
| Currency Sold and Settlement Date | Currency Units Sold | Currency Value in $ U.S. | Unrealized Gain/(Loss) | ||||||||||||
| Euro 1/11/07 | 100,000 | $ | 132,086 | $ | (4,586 | ) | |||||||||
| Value | |||||||||||
| Schedule of Written Options - Puts | |||||||||||
| Proctor & Gamble Co. expires January 2008 7 contracts exercise price $55.00 | $ | (35 | ) | ||||||||
| Proctor & Gamble Co. expires January 2008 7 contracts exercise price $60.00 | $ | (1,120 | ) | ||||||||
| Total Written Options - Puts | |||||||||||
| 14 contracts (Premiums received $2,030) | $ | (1,155 | ) | ||||||||
See Notes to Schedule of Investments and Financial Statements.
Janus Aspen Series December 31, 2006 7
Statement of Assets and Liabilities
| As of December 31, 2006 (all numbers in thousands except net asset value per share) | Janus Aspen Fundamental Equity Portfolio(1) | ||||||
| Assets: | |||||||
| Investments at cost | $ | 12,396 | |||||
| Investments at value | $ | 14,990 | |||||
| Cash | 104 | ||||||
| Cash denominated in foreign currency(2) | – | ||||||
| Restricted cash (see Note 1) | 85 | ||||||
| Receivables: | |||||||
| Investments sold | 18 | ||||||
| Portfolio shares sold | 13 | ||||||
| Dividends | 14 | ||||||
| Interest | 1 | ||||||
| Due from adviser | 8 | ||||||
| Other assets | – | ||||||
| Total Assets | 15,233 | ||||||
| Liabilities: | |||||||
| Payables: | |||||||
| Options written, at value (premiums received of $2) | 1 | ||||||
| Portfolio shares repurchased | 5 | ||||||
| Advisory fees | 8 | ||||||
| Transfer agent fees and expenses | 1 | ||||||
| Distribution fees - Service Shares | – | ||||||
| Non-interested Trustees' fees and expenses | 1 | ||||||
| Printing expenses | 15 | ||||||
| Professional fees | 14 | ||||||
| Registration fees | 7 | ||||||
| System fees | 5 | ||||||
| Legal fees | 5 | ||||||
| Accrued expenses | 1 | ||||||
| Forward currency contracts | 5 | ||||||
| Total Liabilities | 68 | ||||||
| Net Assets | $ | 15,165 | |||||
| Net Assets Consist of: | |||||||
| Capital (par value and paid-in-surplus)* | $ | 12,521 | |||||
| Undistributed net investment income/(loss)* | – | ||||||
| Undistributed net realized gain/(loss) from investments and foreign currency transactions* | 53 | ||||||
| Unrealized net appreciation/(depreciation) of investments and foreign currency translations | 2,591 | ||||||
| Total Net Assets | $ | 15,165 | |||||
| Net Assets - Institutional Shares | $ | 13,331 | |||||
| Shares Outstanding, $0.001 Par Value (unlimited shares authorized) | 570 | ||||||
| Net Asset Value Per Share | $ | 23.40 | |||||
| Net Assets - Service Shares | $ | 1,834 | |||||
| Shares Outstanding, $0.001 Par Value (unlimited shares authorized) | 78 | ||||||
| Net Asset Value Per Share | $ | 23.50 | |||||
*See Note 3 in Notes to Financial Statements.
(1) Formerly named Janus Aspen Core Equity Portfolio.
(2) Includes cost of $346.
See Notes to Financial Statements.
8 Janus Aspen Series December 31, 2006
Statement of Operations
| For the fiscal year ended December 31, 2006 (all numbers in thousands) | Janus Aspen Fundamental Equity Portfolio(1) | ||||||
| Investment Income: | |||||||
| Interest | $ | 8 | |||||
| Dividends | 196 | ||||||
| Dividends from affiliates | 5 | ||||||
| Foreign tax withheld | (3 | ) | |||||
| Total Investment Income | 206 | ||||||
| Expenses: | |||||||
| Advisory fees | 92 | ||||||
| Transfer agent expenses | 4 | ||||||
| Registration fees | 26 | ||||||
| Custodian fees | 15 | ||||||
| Professional fees | 19 | ||||||
| Non-interested Trustees' fees and expenses | 4 | ||||||
| Printing expenses | 41 | ||||||
| Proxy expenses | 9 | ||||||
| System fees | 36 | ||||||
| Legal fees | 12 | ||||||
| Distribution fees - Service Shares | 5 | ||||||
| Other expenses | 6 | ||||||
| Non-recurring costs (Note 2) | – | ||||||
| Costs assumed by Janus Capital Management LLC (Note 2) | – | ||||||
| Total Expenses | 269 | ||||||
| Expense and Fee Offset | (1 | ) | |||||
| Net Expenses | 268 | ||||||
| Less: Excess Expense Reimbursement | (80 | ) | |||||
| Net Expenses after Expense Reimbursement | 188 | ||||||
| Net Investment Income/(Loss) | 18 | ||||||
| Net Realized and Unrealized Gain/(Loss) on Investments: | |||||||
| Net realized gain/(loss) from securities transactions | 1,522 | ||||||
| Net realized gain/(loss) from foreign currency transactions | (6 | ) | |||||
| Change in unrealized net appreciation/(depreciation) of investments and foreign currency translations | (161 | ) | |||||
| Net Gain/(Loss) on Investments | 1,355 | ||||||
| Net Increase/(Decrease) in Net Assets Resulting from Operations | $ | 1,373 | |||||
(1) Formerly named Janus Aspen Core Equity Portfolio.
See Notes to Financial Statements.
Janus Aspen Series December 31, 2006 9
Statements of Changes in Net Assets
| For the fiscal year ended December 31 | Janus Aspen Fundamental Equity Portfolio(1) | ||||||||||
| (all numbers in thousands) | 2006 | 2005 | |||||||||
| Operations: | |||||||||||
| Net investment income/(loss) | $ | 18 | $ | 6 | |||||||
| Net realized gain/(loss) from investment transactions | 1,516 | 1,198 | |||||||||
| Change in unrealized net appreciation/(depreciation) of investments foreign currency translations | (161 | ) | 575 | ||||||||
| Payment from affiliate (Note 2) | – | 3 | |||||||||
| Net Increase/(Decrease) in Net Assets Resulting from Operations | 1,373 | 1,782 | |||||||||
| Dividends and Distributions to Shareholders: | |||||||||||
| Net investment income* | |||||||||||
| Institutional Shares | (23 | ) | (11 | ) | |||||||
| Service Shares | (1 | ) | – | ||||||||
| Net realized gain from investment transactions* | |||||||||||
| Institutional Shares | – | – | |||||||||
| Service Shares | – | – | |||||||||
| Net Decrease from Dividends and Distributions | (24 | ) | (11 | ) | |||||||
| Capital Share Transactions: | |||||||||||
| Shares sold | |||||||||||
| Institutional Shares | 2,714 | 2,530 | |||||||||
| Service Shares | 1,497 | 837 | |||||||||
| Reinvested dividends and distributions | |||||||||||
| Institutional Shares | 23 | 11 | |||||||||
| Service Shares | 1 | – | |||||||||
| Shares repurchased | |||||||||||
| Institutional Shares | (3,407 | ) | (1,810 | ) | |||||||
| Service Shares | (859 | ) | (285 | ) | |||||||
| Net Increase/(Decrease) from Capital Share Transactions | (31 | ) | 1,283 | ||||||||
| Net Increase/(Decrease) in Net Assets | 1,318 | 3,054 | |||||||||
| Net Assets: | |||||||||||
| Beginning of period | 13,847 | 10,793 | |||||||||
| End of period | $ | 15,165 | $ | 13,847 | |||||||
| Undistributed net investment income/(loss)* | $ | – | $ | 1 | |||||||
*See Note 3 in Notes to Financial Statements.
(1) Formerly named Janus Aspen Core Equity Portfolio.
See Notes to Financial Statements.
10 Janus Aspen Series December 31, 2006
Financial Highlights
Institutional Shares
| Janus Aspen Fundamental Equity Portfolio(1) | |||||||||||||||||||||||
| For a share outstanding during each fiscal year ended December 31 | 2006 | 2005 | 2004 | 2003 | 2002 | ||||||||||||||||||
| Net Asset Value, Beginning of Period | $ | 21.31 | $ | 18.44 | $ | 16.27 | $ | 13.24 | $ | 16.26 | |||||||||||||
| Income from Investment Operations: | |||||||||||||||||||||||
| Net investment income/(loss) | .04 | .02 | .03 | .02 | .05 | ||||||||||||||||||
| Net gain/(loss) on securities (both realized and unrealized) | 2.09 | 2.87 | 2.16 | 3.04 | (3.02 | ) | |||||||||||||||||
| Total from Investment Operations | 2.13 | 2.89 | 2.19 | 3.06 | (2.97 | ) | |||||||||||||||||
| Less Distributions and Other: | |||||||||||||||||||||||
| Dividends (from net investment income)* | (.04) | (.02 | ) | (.02 | ) | (.02 | ) | (.05 | ) | ||||||||||||||
| Distributions (from capital gains)* | – | – | – | – | – | ||||||||||||||||||
| Tax return of capital* | – | – | – | (.01 | ) | – | |||||||||||||||||
| Payment from affiliate | – | – | (2) | – | – | – | |||||||||||||||||
| Total Distributions and Other | (.04 | ) | (.02 | ) | (.02 | ) | (.03 | ) | (.05 | ) | |||||||||||||
| Net Asset Value, End of Period | $ | 23.40 | $ | 21.31 | $ | 18.44 | $ | 16.27 | $ | 13.24 | |||||||||||||
| Total Return | 9.99 | % | 15.68 | %(3) | 13.44 | % | 23.10 | % | (18.27 | )% | |||||||||||||
| Net Assets, End of Period (in thousands) | $ | 13,331 | $ | 12,798 | $ | 10,414 | $ | 10,593 | $ | 9,825 | |||||||||||||
| Average Net Assets for the Period (in thousands) | $ | 13,447 | $ | 11,057 | $ | 10,039 | $ | 9,905 | $ | 11,550 | |||||||||||||
| Ratio of Gross Expenses to Average Net Assets(4) | 1.20 | % | 1.21 | % | 1.23 | % | 1.25 | % | 1.25 | % | |||||||||||||
| Ratio of Net Expenses to Average Net Assets(4) | 1.20 | % | 1.20 | % | 1.23 | % | 1.25 | % | 1.25 | % | |||||||||||||
| Ratio of Net Investment Income/(Loss) to Average Net Assets | 0.15 | % | 0.06 | % | 0.14 | % | 0.03 | % | 0.32 | % | |||||||||||||
| Portfolio Turnover Rate | 51 | % | 62 | % | 65 | % | 82 | % | 97 | % | |||||||||||||
Service Shares
| Janus Aspen Fundamental Equity Portfolio(1) | |||||||||||||||||||||||
| For a share outstanding during each fiscal year ended December 31 | 2006 | 2005 | 2004 | 2003 | 2002 | ||||||||||||||||||
| Net Asset Value, Beginning of Period | $ | 21.44 | $ | 18.59 | $ | 16.42 | $ | 13.16 | $ | 16.15 | |||||||||||||
| Income from Investment Operations: | |||||||||||||||||||||||
| Net investment income/(loss) | (.01 | ) | – | (5) | (.01 | ) | – | (5) | .01 | ||||||||||||||
| Net gain/(loss) on securities (both realized and unrealized) | 2.09 | 2.85 | 2.18 | 3.30 | (2.99 | ) | |||||||||||||||||
| Total from Investment Operations | 2.08 | 2.85 | 2.17 | 3.30 | (2.98 | ) | |||||||||||||||||
| Less Distributions and Other: | |||||||||||||||||||||||
| Dividends (from net investment income)* | (.02 | ) | – | (6) | – | (.04 | ) | (.01 | ) | ||||||||||||||
| Distributions (from capital gains)* | – | – | – | – | – | ||||||||||||||||||
| Tax return of capital* | – | – | – | – | (7) | – | |||||||||||||||||
| Payment from affiliate | – | – | (2) | – | – | – | |||||||||||||||||
| Total Distributions and Other | (.02 | ) | – | – | (.04 | ) | (.01 | ) | |||||||||||||||
| Net Asset Value, End of Period | $ | 23.50 | $ | 21.44 | $ | 18.59 | $ | 16.42 | $ | 13.16 | |||||||||||||
| Total Return | 9.69 | % | 15.35 | %(3) | 13.22 | % | 25.08 | % | (18.45 | )% | |||||||||||||
| Net Assets, End of Period (in thousands) | $ | 1,834 | $ | 1,049 | $ | 379 | $ | 289 | $ | 1,251 | |||||||||||||
| Average Net Assets for the Period (in thousands) | $ | 1,825 | $ | 667 | $ | 290 | $ | 219 | $ | 1,012 | |||||||||||||
| Ratio of Gross Expenses to Average Net Assets(4) | 1.45 | % | 1.46 | % | 1.48 | % | 1.50 | % | 1.50 | % | |||||||||||||
| Ratio of Net Expenses to Average Net Assets(4) | 1.45 | % | 1.45 | % | 1.48 | % | 1.50 | % | 1.50 | % | |||||||||||||
| Ratio of Net Investment Income/(Loss) to Average Net Assets | (0.12 | )% | (0.21 | )% | (0.09 | )% | (0.39 | )% | 0.09 | % | |||||||||||||
| Portfolio Turnover Rate | 51 | % | 62 | % | 65 | % | 82 | % | 97 | % | |||||||||||||
* See Note 3 in Notes to Financial Statements.
(1) Formerly named Janus Aspen Core Equity Portfolio.
(2) Payment from affiliate aggregated less than $.01 on a per share basis for the fiscal year ended.
(3) During the fiscal year ended, Janus Capital and/or Janus Services LLC fully reimbursed the Portfolio for a loss on a transaction resulting from certain trading, pricing and/or shareholder activity errors, which otherwise would have reduced total return by 0.03%.
(4) See Note 4 in Notes to Financial Statements.
(5) Net investment income/(loss) aggregated less than $.01 on a per share basis for the fiscal year ended.
(6) Dividends (from net investment income) aggregated less than $.01 on a per share basis for the fiscal year ended.
(7) Tax return of capital aggregated less than $.01 on a per share basis for the fiscal year ended.
See Notes to Financial Statements.
Janus Aspen Series December 31, 2006 11
Notes to Schedule of Investments
| Lipper Variable Annuity Large-Cap Core Funds | Funds that, by portfolio practice, invest at least 75% of their equity assets in companies with market capitalizations (on a three-year weighted basis) greater than 300% of the dollar-weighted median market capitalization of the middle 1,000 securities of the S&P SuperComposite 1500 Index. Large-cap core funds have more latitude in the companies in which they invest. These funds typically have an average price-to-earnings ratio, price-to-book ratio, and three-year sales-per-share growth value, compared to the S&P 500® Index. | ||||||
| Russell 1000® Growth Index | Measures the performance of those Russell 1000 companies with higher price-to-book ratios and higher forecasted growth values. | ||||||
| S&P 500® Index | The Standard & Poor's Composite Index of 500 stocks, a widely recognized, unmanaged index of common stock prices. | ||||||
| ADR | American Depositary Receipt | ||||||
| U.S. Shares | Securities of foreign companies trading on an American Stock Exchange. | ||||||
* Non-income-producing security.
** A portion of this security has been segregated by the custodian to cover margin or segregation requirements on open futures contracts, forward currency contracts, options contracts, short sales and/or securities with extended settlement dates.
Aggregate collateral segregated to cover margin or segregation requirements on open futures contracts, forward currency contracts, options contracts, short sales and/or securities with extended settlement dates as of December 31, 2006 are noted below.
| Portfolio | Aggregate Value | ||||||
| Janus Aspen Fundamental Equity Portfolio(1) | $ | 526,222 | |||||
(1) Formerly named Janus Aspen Core Equity Portfolio.
12 Janus Aspen Series December 31, 2006
Notes to Financial Statements
The following section describes the organization and significant accounting policies and provides more detailed information about the schedules and tables that appear throughout this report. In addition, the Notes to Financial Statements explain the methods used in preparing and presenting this report.
1. ORGANIZATION AND SIGNIFICANT ACCOUNTING POLICIES
Janus Aspen Fundamental Equity Portfolio (formerly named Janus Aspen Core Equity Portfolio) (the "Portfolio") is a series fund. The Portfolio is part of Janus Aspen Series (the "Trust"), which is organized as a Delaware statutory trust and is registered under the Investment Company Act of 1940 (the "1940 Act") as an open-end management investment company. The Trust offers seventeen Portfolios, which include multiple series of shares, with differing investment objectives and policies. The Portfolio invests primarily in equity securities. The Portfolio is classified as diversified, as defined in the 1940 Act. The Portfolio is a no-load investment.
The Portfolio currently offers two classes of shares: Institutional Shares and Service Shares. Institutional Shares are offered only in connection with investment in and payments under variable insurance contracts and to qualified retirement plans. Service Shares are offered only in connection with investment in and payments under variable insurance contracts and to qualified retirement plans that require a fee from Portfolio assets to procure distribution and administrative services to contract owners and plan participants.
The following accounting policies have been consistently followed by the Portfolio and are in conformity with accounting principles generally accepted in the United States of America in the investment company industry.
Investment Valuation
Securities are valued at the last sales price or the official closing price for securities traded on a principal securities exchange (U.S. or foreign) and on the NASDAQ National Market. Securities traded on over-the-counter markets and listed securities for which no sales are reported are valued at the latest bid price (or yield equivalent thereof) obtained from one or more dealers transacting in a market for such securities or by a pricing service approved by the Portfolio's Trustees. Short-term securities with maturities of 60 days or less may be valued at amortized cost, which approximates market value. Debt securities with a remaining maturity of greater than 60 days are valued in accordance with the evaluated bid price supplied by the pricing service. The evaluated bid price supplied by the pricing service is an evaluation that reflects such factors as security prices, yields, maturities and ratings. Foreign securities and currencies ar e converted to U.S. dollars using the applicable exchange rate in effect as of the daily close of the New York Stock Exchange ("NYSE"). When market quotations are not readily available or deemed unreliable, or events or circumstances that may affect the value of portfolio securities held by the Portfolio are identified between the closing of their principal markets and the time the net asset value ("NAV") is determined, securities may be valued at fair value as determined in good faith under procedures established by and under the supervision of the Portfolio's Trustees. The Portfolio may use a systematic fair valuation model provided by an independent third party to value international equity securities in order to adjust for stale pricing, which may occur between the close of certain foreign exchanges and the NYSE.
Investment Transactions and Investment Income
Investment transactions are accounted for as of the date purchased or sold (trade date). Dividend income is recorded on the ex-dividend date. Certain dividends from foreign securities will be recorded as soon as the Trust is informed of the dividend if such information is obtained subsequent to the ex-dividend date and may be subject to withholding taxes in these jurisdictions. Interest income is recorded on the accrual basis and includes amortization of premiums and accretion of discounts. Gains and losses are determined on the identified cost basis, which is the same basis used for federal income tax purposes. Income, as well as gains and losses, both realized and unrealized, are allocated daily to each class of shares based upon the ratio of net assets represented by each class as a percentage of total net assets.
Expenses
The Portfolio bears expenses incurred specifically on its behalf as well as a portion of general expenses. Each class of shares bears expenses incurred specifically on its behalf and, in addition, each class bears a portion of general expenses, which may be based upon relative net assets of each class. Expenses are allocated daily to each class of shares based upon the ratio of net assets represented by each class as a percentage of total net assets. Expenses directly attributable to a specific class of shares are charged against the operations of such class.
Interfund Lending
Pursuant to an exemptive order received from the SEC, the Portfolio may be party to an interfund lending agreement between the Portfolio and other Janus Capital Management LLC ("Janus Capital") sponsored mutual funds, which permits it to borrow or lend cash at a rate beneficial to both the borrowing and lending funds. Outstanding borrowings from all sources totaling 10% or more of the borrowing Portfolio's total assets must be collateralized at 102% of the outstanding principal value of the loan; loans of less than 10% may be unsecured. During the fiscal year ended December 31, 2006, there were no outstanding interfund borrowing or lending arrangements for the Portfolio.
Forward Currency Transactions
The Portfolio may enter into forward currency contracts in order to reduce its exposure to changes in foreign currency exchange rates on its foreign portfolio holdings and to lock in the U.S. dollar cost of firm purchase and sale commitments for securities denominated in or exposed to foreign currencies. A forward currency exchange contract is a commitment to purchase or sell a foreign currency at a future date at a negotiated rate. The gain or loss arising from the difference between the U.S. dollar cost of the original contract and the value of the foreign currency in U.S. dollars upon closing a contract is included in "Net realized gain/(loss) from foreign currency transactions" on the Statement of Operations (if applicable).
Janus Aspen Series December 31, 2006 13
Notes to Financial Statements (unaudited) (continued)
Forward currency contracts held by the Portfolio are fully collateralized by other securities, which are denoted in the accompanying Schedule of Investments (if applicable). The collateral is evaluated daily to ensure its market value equals or exceeds the current market value of the corresponding forward currency contracts.
Futures Contracts
The Portfolio may enter into futures contracts. The Portfolio intends to use such derivative instruments primarily to hedge or protect from adverse movements in securities prices, currency rates or interest rates. The use of futures contracts may involve risks such as the possibility of illiquid markets or imperfect correlation between the value of the contracts and the underlying securities, or that the counterparty will fail to perform its obligations.
Futures contracts are marked-to-market daily, and the daily variation margin is recorded as a receivable or payable on the Statement of Assets and Liabilities (if applicable). When a contract is closed, a realized gain or loss is recorded on the Statement of Operations equal to the difference between the opening and closing value of the contract. Generally, futures contracts are marked-to-market (i.e., treated as realized and subject to distribution) for federal income tax purposes at fiscal year end. Securities designated as collateral for market value on futures contracts are noted in the Schedule of Investments. Such collateral is in the possession of the Portfolio's custodian. As of December 31, 2006, the Portfolio was not invested in futures contracts.
Options Contracts
The Portfolio may purchase or write put and call options on futures contracts or foreign currencies in a manner similar to that in which futures or forward contracts on foreign currencies will be utilized, and on portfolio securities for hedging purposes or as a substitute for an investment. The Portfolio generally invests in options to hedge against adverse movements in the value of portfolio holdings.
When an option is written, the Portfolio receives a premium and becomes obligated to sell or purchase the underlying security at a fixed price, upon exercise of the option. In writing an option, the Portfolio bears the market risk of an unfavorable change in the price of the security underlying the written option. Exercise of an option written by the Portfolio could result in the Portfolio buying or selling a security at a price different from the current market value.
When an option is exercised, the proceeds on sales for a written call option, the purchase cost for a written put option, or the cost of the security for a purchased put or call option is adjusted by the amount of premium received or paid.
Holdings designated to cover outstanding written options are noted in the Schedule of Investments (if applicable). Options written are reported as a liability on the Statement of Assets and Liabilities (if applicable). Realized gains and losses are reported on the Statement of Operations (if applicable). The Portfolio did not recognize any realized gains and/or losses during the fiscal year ended December 31, 2006.
The risk in writing a call option is that the Portfolio gives up the opportunity for profit if the market price of the security increases and the option is exercised. The risk in writing a put option is that the Portfolio may incur a loss if the market price of the security decreases and the option is exercised. The risk in buying an option is that the Portfolio pays a premium whether or not the option is exercised. The use of such instruments may involve certain additional risks as a result of unanticipated movement in the market. A lack of correlation between the value of an instrument underlying an option and the asset being hedged, or unexpected adverse price movements, could render the Portfolio's hedging strategy unsuccessful. In addition, there can be no assurance that a liquid secondary market will exist for any option purchased or sold. There is no limit to the loss that the Portfolio may recognize due to written call options.
Written option activity for the fiscal year ended December 31, 2006 was as follows:
| Put Options | Number of Options Contracts | Premiums Received | |||||||||
| Janus Aspen Fundamental Equity Portfolio | |||||||||||
| Options outstanding at January 1, 2006 | – | – | |||||||||
| Options written | 14 | $ | 2,030 | ||||||||
| Options closed | – | – | |||||||||
| Options expired | – | – | |||||||||
| Options exercised | – | – | |||||||||
| Options outstanding at December 31, 2006 | 14 | $ | 2,030 | ||||||||
Short Sales
The Portfolio may engage in "short sales against the box." Short sales against the box involve selling either a security that the Portfolio owns, or a security equivalent in kind and amount to the security sold short that the Portfolio has the right to obtain, for delivery at a specified date in the future. The Portfolio may enter into a short sale against the box to hedge against anticipated declines in the market price of portfolio securities. If the value of the securities sold short increases prior to the scheduled delivery date, the Portfolio loses the opportunity to participate in the gain.
The Portfolio may also engage in "naked" short sales. Naked short sales involve the Portfolio selling a security it does not own to a purchaser at a specified price. To complete the transaction, the Portfolio must borrow the security to deliver it to the purchaser and buy that same security in the market to return it to the lender. Although the potential for gain is limited to the difference between the price at which the Portfolio sold the security short and the cost of borrowing the security, its potential for loss could be unlimited because there is no limit to the replacement cost of the borrowed security. There is no assurance that the Portfolio will be able to close out a short position at any particular time or at an acceptable price. A gain or a loss will be recognized upon termination of a short sale. There is no limit on the size of any loss that the Portfolio may recognize upon termination of a short sale. Short sales held by the Portfolio are fully collateralized by other securities, which are denoted in the accompanying Schedule of Investments (if applicable). As of December 31, 2006, the Portfolio was not invested in short sales.
14 Janus Aspen Series December 31, 2006
Foreign Currency Translations
The Portfolio does not isolate that portion of the results of operations resulting from changes in foreign exchange rates on investments from the fluctuations arising from changes in market prices of securities held at the date of the financial statements. Net unrealized appreciation or depreciation on investments and foreign currency translation arise from changes in the value of assets and liabilities, including investments in securities held at the date of the financial statements, resulting from changes in the exchange rates and changes in market prices of securities held.
Currency gains and losses are also calculated on payables and receivables that are denominated in foreign currencies. The payables and receivables are generally related to security transactions and income.
Foreign-denominated assets and forward currency contracts may involve more risks than domestic transactions, including currency risk, political and economic risk, regulatory risk and market risk. Risks may arise from the potential inability of a counterparty to meet the terms of a contract and from unanticipated movements in the value of foreign currencies relative to the U.S. dollar.
When-issued Securities
The Portfolio may purchase or sell securities on a when-issued or forward commitment basis. The price of the underlying securities and date when the securities will be delivered and paid for are fixed at the time the transaction is negotiated. Losses may arise due to changes in the market value of the securities or from the inability of counterparties to meet the terms of the contract. In connection with such purchases, the Portfolio may hold liquid assets as collateral with the Portfolio's custodian sufficient to cover the purchase price. As of December 31, 2006, the Portfolio was not invested in when-issued securities.
Equity-Linked Structured Notes
The Portfolio may invest in equity-linked structured notes. Equity-linked structured notes are derivative securities which are specially designed to combine the characteristics of one or more underlying securities and their equity derivatives in a single note form. The return and/or yield or income component may be based on the performance of the underlying equity securities, an equity index, and/or option positions. Equity-linked structured notes are typically offered in limited transactions by financial institutions in either registered or nonregistered form. An investment in equity-linked structured notes creates exposure to the credit risk of the issuing financial institution, as well as to the market risk of the underlying securities. There is no guaranteed return of principal with these securities and the appreciation potential of these securities may be limited by a maximum payment or call right. In certain cases, equity-linked struct ured notes may be more volatile and less liquid than less complex securities or other types of fixed-income securities. Such securities may exhibit price behavior that does not correlate with other fixed-income securities. As of December 31, 2006, the Portfolio was not invested in equity-linked structured notes.
Initial Public Offerings
The Portfolio may invest in initial public offerings ("IPOs"). IPOs and other investment techniques may have a magnified performance impact on a fund with a small asset base. The Portfolio may not experience similar performance as its assets grow.
Additional Investment Risk
The Portfolio may be invested in lower-rated debt securities that have a higher risk of default or loss of value since these securities may be sensitive to economic changes, political changes in the economy, political environment, or adverse developments specific to the issuer.
Restricted Security Transactions
Restricted securities held by the Portfolio may not be sold except in exempt transactions or in a public offering registered under the Securities Act of 1933. The risk of investing in such securities is generally greater than the risk of investing in the securities of widely held, publicly traded companies. Lack of a secondary market and resale restrictions may result in the inability of the Portfolio to sell a security at a fair price and may substantially delay the sale of the security. In addition, these securities may exhibit greater price volatility than securities for which secondary markets exist.
Restricted Cash
As of December 31, 2006, the Portfolio had restricted cash in the amount of $84,525. The restricted cash represents funds in relation to options contracts invested by the Portfolio at December 31, 2006. The restricted cash is held at the Portfolio's custodian, State Street Bank and Trust Company. The carrying value of the restricted cash approximates fair value.
Dividend Distributions
The Portfolio generally makes semiannual distributions of substantially all of its investment income and an annual distribution of its net realized capital gains (if any). The majority of dividends and net realized capital gains distributions from the Portfolio may be automatically reinvested into additional shares of the Portfolio, based upon the discretion of the shareholder.
Estimates
The preparation of financial statements in conformity with accounting principles generally accepted in the United States of America requires management to make estimates and assumptions that affect the reported amount of assets and liabilities and disclosure of contingent assets and liabilities at the date of the financial statements and the reported amounts of income and expenses during the reporting period. Actual results could differ from those estimates.
Federal Income Taxes
No provision for income taxes is included in the accompanying financial statements, as the Portfolio intends to distribute to shareholders all taxable investment income and realized gains and otherwise comply with Subchapter M of the Internal Revenue Code applicable to regulated investment companies.
Janus Aspen Series December 31, 2006 15
Notes to Financial Statements (continued)
New Accounting Pronouncements
In July 2006, the Financial Accounting Standards Board ("FASB") issued Interpretation No. 48, "Accounting for Uncertainty in Income Taxes – an Interpretation of FASB Statement No. 109" (the "Interpretation"). The Interpretation establishes for all entities, including pass-through entities such as the Portfolio, a minimum threshold for financial statement recognition of the benefit of positions taken in filing tax returns (including whether an entity is taxable in a particular jurisdiction), and requires certain expanded tax disclosures. A calendar year open-end or closed-end fund would implement the Interpretation no later than June 29, 2007 (the last business day of the semi-annual reporting period) and will also apply to all open tax years as of the date of effectiveness. Management has recently begun to evaluate the application of the Interpretation to the Portfolio, and is not in a position at this time to estimate the significance of its impact, if any, on the Portfolio's financial statements.
In September 2006, the FASB issued Statement of Financial Accounting Standards No. 157, "Fair Value Measurements" ("SFAS No. 157"), which defines fair value, establishes a framework for measuring fair value in generally accepted accounting principles, and expands disclosures about fair value measurements. SFAS No. 157 does not require new fair value measurements, but is applied to the extent that other accounting pronouncements require or permit fair value measurements. SFAS No. 157 emphasizes that fair value is a market-based measurement that should be determined based on the assumptions that market participants would use in pricing an asset or liability. Companies will be required to disclose the extent to which fair value is used to measure assets and liabilities, the inputs used to develop the measurements, and the effect for fiscal years beginning after November 15, 2007. Management is currently evaluating the potential impact the adopt ion of SFAS No. 157 will have on the Portfolio's financial condition and results of operations.
2. INVESTMENT ADVISORY AGREEMENTS AND OTHER TRANSACTIONS WITH AFFILIATES
The Portfolio pays a monthly advisory fee to Janus Capital based upon average daily net assets and calculated at the annual rate of 0.60%.
Janus Capital has agreed until at least May 1, 2008 to reimburse the Portfolio by the amount, if any, that the normal operating expenses in any fiscal year, including the investment advisory fee but excluding the distribution and shareholder servicing (12b-1) fees applicable to Service Shares, brokerage commissions, interest, taxes and extraordinary expenses, exceed an annual rate of 1.20% of the average daily net assets of the Portfolio.
Janus Services LLC ("Janus Services"), a wholly-owned subsidiary of Janus Capital, is the Portfolio's transfer agent. Janus Services receives certain out-of-pocket expenses for transfer agent services.
Certain officers of the Portfolio may also be officers and/or directors of Janus Capital. Such officers receive no compensation from the Portfolio, except for the Portfolio's Chief Compliance Officer. Effective January 1, 2006, the Portfolio began reimbursing the adviser for a portion of the compensation paid to the Chief Compliance Officer of the Trust. Total compensation of $25 was paid by the Portfolio during the fiscal year ended December 31, 2006. The Portfolio's portion is reported as part of "Other Expenses" on the Statement of Operations.
During the fiscal year ended December 31, 2005, Janus Capital reimbursed the Portfolio $2,556 for Institutional Shares and $204 for Service Shares as a result of dilutions caused by certain trading and/or pricing errors. Reimbursements are included in "Payment from affiliate" on the Statements of Changes in Net Assets.
The Board of Trustees has adopted a deferred compensation plan (the "Deferred Plan") for independent Trustees to elect to defer receipt of all or a portion of the annual compensation they are entitled to receive from the Portfolio. All deferred fees are credited to an account established in the name of the Trustees. The amounts credited to the account then increase or decrease, as the case may be, in accordance with the performance of one or more of the Janus funds that are selected by the Trustees. The account balance continues to fluctuate in accordance with the performance of the selected fund or funds until final payment of all amounts credited to the account. Trustees are allowed to change their designation of mutual funds from time to time. Amounts will be deferred until distributed in accordance to the Deferred Plan. No deferred fees were paid to any Trustee under the Deferred Plan during the fiscal year ended December 31, 2006.
For the fiscal year ended December 31, 2006, Janus Capital assumed $21,288 of legal, consulting and Trustee costs and fees incurred by the funds in Janus Investment Fund, Janus Aspen Series and Janus Adviser Series (the "Funds") in connection with the regulatory and civil litigation matters discussed in Note 7. These non-recurring costs were allocated to all Funds based upon the Funds' respective net assets as of July 31, 2004. Additionally, all future non-recurring costs will be allocated based upon the Funds' respective net assets on July 31, 2004. These non-recurring costs and costs assumed by Janus Capital are shown on the Statement of Operations.
Janus Distributors LLC, a wholly-owned subsidiary of Janus Capital, is a distributor of the Portfolio. Service Shares have adopted a Distribution and Shareholder Servicing Plan (the "Plan") pursuant to Rule 12b-1 under The 1940 Act. The Plan authorizes payments by the Portfolio in connection with the distribution of Service Shares at an annual rate of up to 0.25% of Service Shares' average daily net assets.
The Portfolio's expenses may be reduced by expense offsets from an unaffiliated custodian and/or transfer agent. Such credits or offsets are included in Expense and Fee Offset on the Statement of Operations. The transfer agent fee offsets
16 Janus Aspen Series December 31, 2006
received during the period reduce Transfer Agent Fees and Expenses. Custodian offsets received reduce Custodian Fees. The Portfolio could have employed the assets used by the custodian and/or transfer agent to produce income if it had not entered into an expense offset arrangement.
The Portfolio may invest in money market funds, including funds managed by Janus Capital. During the fiscal year ended December 31, 2006, the Portfolio recorded distributions from affiliated investment companies as affiliated dividend income, and had the following affiliated purchases and sales:
| Purchases Shares/Cost | Sales Shares/Cost | Dividend Income | Value at 12/31/06 | ||||||||||||||||
| Janus Aspen Fundamental Equity Portfolio | |||||||||||||||||||
| Janus Government Money Market Fund | $ | 209,183 | $ | 209,183 | $ | 142 | $ | – | |||||||||||
| Janus Institutional Cash Reserves Fund | 1,774,190 | 1,636,590 | 3,732 | 137,600 | |||||||||||||||
| Janus Money Market Fund | 1,042,377 | 926,977 | 1,578 | 115,400 | |||||||||||||||
| $ | 3,025,750 | $ | 2,772,750 | $ | 5,452 | $ | 253,000 | ||||||||||||
3. FEDERAL INCOME TAX
The tax components of capital shown in the table below represent: (1) distribution requirements the Portfolio must satisfy under the income tax regulations; (2) losses or deductions the Portfolio may be able to offset against income and gains realized in future years; and (3) unrealized appreciation or depreciation of investments for federal income tax purposes.
Other book to tax differences in the current year primarily consist of foreign currency contract adjustments. The Portfolio has elected to treat gains and losses on forward foreign currency contracts as capital gains and losses. Other foreign currency gains and losses on debt instruments are treated as ordinary income for federal income tax purposes pursuant to Section 988 of the Internal Revenue Code.
Accumulated capital losses noted below represent net capital loss carryovers, as of December 31, 2006, that may be available to offset future realized capital gains and thereby reduce future taxable gains distributions.
| Portfolio | Undistributed Ordinary Income | Undistributed Long-Term Gains | Accumulated Capital Losses | Post-October Deferral | Other Book to Tax Differences | Net Tax Appreciation/ (Depreciation) | |||||||||||||||||||||
| Janus Aspen Fundamental Equity Portfolio(1) | $ | – | $ | 90,140 | $ | – | $ | – | $ | 948 | $ | 2,552,985 | |||||||||||||||
(1) Formerly named Janus Aspen Core Equity Portfolio.
During the year ended December 31, 2006, the following capital loss carryover was utilized by the Portfolio as indicated in the table below.
| Portfolio | Capital Loss Carryover Utilized | ||||||
| Janus Aspen Fundamental Equity Portfolio(1) | $ | 1,412,502 | |||||
(1) Formerly named Janus Aspen Core Equity Portfolio.
The aggregate cost of investments and the composition of unrealized appreciation and depreciation of investment securities for federal income tax purposes as of December 31, 2006 are noted below.
Unrealized appreciation and unrealized depreciation in the table below exclude appreciation/depreciation on foreign currency translations. The primary difference between book and tax appreciation or depreciation of investments is wash sale loss deferrals.
| Portfolio | Federal Tax Cost | Unrealized Appreciation | Unrealized (Depreciation) | ||||||||||||
| Janus Aspen Fundamental Equity Portfolio(1) | $ | 12,437,400 | $ | 2,941,227 | $ | (388,242 | ) | ||||||||
(1) Formerly named Janus Aspen Core Equity Portfolio.
Income and capital gains distributions are determined in accordance with income tax regulations that may differ from accounting principles generally accepted in the United States of America. These differences are due to differing treatments for items such as net short-term gains, deferral of wash sale losses, foreign currency transactions, net investment losses and capital loss carryovers. Certain permanent differences such as tax returns of capital and net investment losses noted on the next page have been reclassified to paid-in capital.
Janus Aspen Series December 31, 2006 17
Notes to Financial Statements (unaudited) (continued)
| For the fiscal year ended December 31, 2006 | Distributions | ||||||||||||||||||
| Portfolio | From Ordinary Income | From Long-Term Capital Gains | Tax Return of Capital | Net Investment Loss | |||||||||||||||
| Janus Aspen Fundamental Equity Portfolio(1) | $ | 18,945 | $ | 4,917 | $ | – | $ | – | |||||||||||
(1) Formerly named Janus Aspen Core Equity Portfolio.
| For the fiscal year ended December 31, 2005 | Distributions | ||||||||||||||||||
| Portfolio | From Ordinary Income | From Long-Term Capital Gains | Tax Return of Capital | Net Investment Loss | |||||||||||||||
| Janus Aspen Fundamental Equity Portfolio(1) | $ | 11,023 | $ | – | $ | – | $ | – | |||||||||||
(1) Formerly named Janus Aspen Core Equity Portfolio.
4. EXPENSE RATIOS
The expense ratios listed in the Financial Highlights reflect expenses prior to any expense offsets (gross expense ratio) and after expense offsets (net expense ratio). Both expense ratios reflect expenses after waivers (reimbursement). Listed below are the gross expense ratios for the Portfolio that would be in effect, absent the waiver of certain fees and offsets.
For each fiscal year ended December 31
| Institutional Shares | Service Shares | ||||||||||||||||||||||||||||||||||||||||||
| Portfolio | 2006(1) | 2005(1) | 2004(1) | 2003 | 2002 | 2006(1) | 2005(1) | 2004(1) | 2003 | 2002 | |||||||||||||||||||||||||||||||||
| Janus Aspen Fundamental Equity Portfolio(2) | 1.73 | % | 1.44 | % | 1.52 | % | 2.08 | % | 1.87 | % | 2.00 | % | 1.73 | % | 1.76 | % | 2.35 | % | 2.12 | % | |||||||||||||||||||||||
(1) The effect of non-recurring costs assumed by Janus Capital (Note 2) is included in the ratio of operating expenses to average net assets without waivers and/or expense reimbursements and was less than 0.01%.
(2) Formerly named Janus Aspen Core Equity Portfolio.
5. CAPITAL SHARE TRANSACTIONS
| For the fiscal year ended December 31 | Janus Aspen Fundamental Equity Portfolio(1) | ||||||||||
| (all numbers are in thousands) | 2006 | 2005 | |||||||||
| Transactions in Portfolio Shares – Institutional Shares | |||||||||||
| Shares sold | 121 | 131 | |||||||||
| Reinvested dividends and distributions | 1 | 1 | |||||||||
| Shares repurchased | (153 | ) | (96 | ) | |||||||
| Net Increase (Decrease) in Portfolio Shares | (31 | ) | 36 | ||||||||
| Shares Outstanding, Beginning of Period | 601 | 565 | |||||||||
| Shares Outstanding, End of Period | 570 | 601 | |||||||||
| Transactions in Portfolio Shares – Service Shares | |||||||||||
| Shares sold | 66 | 43 | |||||||||
| Reinvested dividends and distributions | – | – | |||||||||
| Shares repurchased | (37 | ) | (14 | ) | |||||||
| Net Increase (Decrease) in Portfolio Shares | 29 | 29 | |||||||||
| Shares Outstanding, Beginning of Period | 49 | 20 | |||||||||
| Shares Outstanding, End of Period | 78 | 49 | |||||||||
(1) Formerly named Janus Aspen Core Equity Portfolio.
6. PURCHASES AND SALES OF INVESTMENT SECURITIES
For the fiscal year ended December 31, 2006, the aggregate cost of purchases and proceeds from sales of investment securities (excluding short-term securities) were as follows:
| Portfolio | Purchases of Securities | Proceeds from sales of Securities | Purchases of Long-Term U.S. Government Obligations | Proceeds from Sales of Long-Term U.S. Government Obligations | |||||||||||||||
| Janus Aspen Fundamental Equity Portfolio(1) | $ | 7,606,140 | $ | 7,627,319 | $ | – | $ | – | |||||||||||
(1) Formerly named Janus Aspen Core Equity Portfolio.
18 Janus Aspen Series December 31, 2006
7. PENDING LEGAL MATTERS
In the fall of 2003, the Securities and Exchange Commission ("SEC"), the Office of the New York State Attorney General ("NYAG"), the Colorado Attorney General ("COAG"), and the Colorado Division of Securities ("CDS") announced that they were investigating alleged frequent trading practices in the mutual fund industry. On August 18, 2004, Janus Capital announced that it had reached final settlements with the SEC, the NYAG, the COAG, and the CDS related to such regulators' investigations into Janus Capital's frequent trading arrangements.
A number of civil lawsuits were brought against Janus Capital and certain of its affiliates, the Janus funds, and related entities and individuals based on allegations similar to those announced by the above regulators and were filed in several state and federal jurisdictions. Such lawsuits alleged a variety of theories for recovery including, but not limited to, the federal securities laws, other federal statutes (including ERISA), and various common law doctrines. The Judicial Panel on Multidistrict Litigation transferred these actions to the U.S. District Court for the District of Maryland (the "Court") for coordinated proceedings. On September 29, 2004, five consolidated amended complaints were filed with the Court that generally include: (i) claims by a putative class of investors in certain Janus funds asserting claims on behalf of the investor class (Marini, et al. v. Janus Investment Fund, et al., U.S. District Court, District of Maryland, Case No. 04-CV-00497); (ii) derivative claims by investors in certain Janus funds ostensibly on behalf of such funds (Steinberg et al. v. Janus Capital Management, LLC et al., U.S. District Court, District of Maryland, Case No. 04-CV-00518); (iii) claims on behalf of participants in the Janus 401(k) plan (Wangberger v. Janus Capital Group Inc., 401(k) Advisory Committee, et al., U.S. District Court, District of Maryland, Case No. JFM-05-2711); (iv) claims brought on behalf of shareholders of Janus Capital Group Inc. ("JCGI") on a derivative basis against the Board of Directors of JCGI (Chasen v. Whiston, et al., U.S. District Court, District of Maryland, Case No. 04-MD-00855); and (v) claims by a putative class of shareholders of JCGI asserting claims on behalf of the shareholders (Wiggins, et al. v. Janus Capital Group, Inc., et al., U.S. District Court, District of Maryland, Case No. 04-CV-00818). In addition, the following were also named as defendants in one or more of the actions: Janus Investment Fund ("JIF"), Janus Aspen Series ("JAS"), Janus Adviser Series ("JAD"), Janus Distributors LLC, Enhanced Investment Technologies, LLC ("INTECH"), Bay Isle Financial LLC ("Bay Isle"), Perkins, Wolf, McDonnell and Company, LLC ("Perkins"), the Advisory Committee of the Janus 401(k) plan, and the current or former directors of JCGI.
On August 25, 2005, the Court entered orders dismissing most of the claims asserted against Janus Capital and its affiliates by fund investors (actions (i) and (ii) described above), except certain claims under Section 10(b) of the Securities Exchange Act of 1934 and under Section 36(b) of the Investment Company Act of 1940, as amended (the "1940 Act"). On August 15, 2006, the complaint in the 401(k) plan class action (action (iii) described above) was dismissed by the district court with prejudice; the plaintiff has appealed that dismissal decision to the United States Court of Appeals for the Fourth Circuit. The Court also dismissed the action against JCGI's Board of Directors without leave to amend (action (iv) described above). Finally, a Motion to Dismiss the action brought by JCGI shareholders (action (v) described above) is fully briefed and pending before the Cou rt.
In addition to the lawsuits described above, the Auditor of the State of West Virginia ("Auditor"), in his capacity as securities commissioner, has initiated administrative proceedings against many of the defendants in the market timing cases (including JCGI and Janus Capital) and, as a part of its relief, is seeking disgorgement and other monetary relief based on similar market timing allegations (In the Matter of Janus Capital Group Inc. et al., Before the Securities Commissioner, State of West Virginia, Summary Order No. 05-1320). The respondents in these proceedings collectively sought a Writ of Prohibition in state court, which was d enied. Their subsequent Petition for Appeal was also denied. Consequently, in September 2006, JCGI and Janus Capital filed their answer to the Auditor's summary order instituting proceedings and requested a hearing. JCGI and Janus Capital, as well as other similarly situated defendants, continue to challenge the statutory authority of the Auditor to bring such an action. No further proceedings are currently scheduled.
In addition to the "market timing" actions described above, Janus Capital is a defendant in a consolidated lawsuit in the U.S. District Court for the District of Colorado challenging the investment advisory fees charged by Janus Capital to certain Janus funds (Walter Sins, et al. v. Janus Capital Management LLC, U.S. District Court, District of Colorado, Case No. 04-CV-01647-WDM-MEH; Michael Fleisher, et al. v. Janus Capital Management, LLC, 04-CV-02395-MSK-CBS). The action was filed in 2004 by fund investors asserting breach of fiduciary duty under Section 36(b) of the 1940 Act. The plaintiffs seek declaratory and injunctive relief and an unspecified amount of damages. The trial is scheduled to commence on May 21, 2007.
In 2001, Janus Capital's predecessor was also named as a defendant in a class action suit in the U.S. District Court for the Southern District of New York, alleging that certain underwriting firms and institutional investors violated antitrust laws in connection with initial public offerings (Pfeiffer v. Credit Suisse First Boston aka In re Initial Public Offering Antitrust Litigation, U.S. District Court, Southern District of New York, Case No. 01-CV-2014). The U.S. District Court dismissed the plaintiff's antitrust claims in November 2003; however, the U.S. Court of Appeals vacated that decision and remanded it for further proceedings. In March 2006, the defendants, including Janus Capital, filed a Petition for a Writ of Certiorari with the U.S. Supreme Court to review the decision of the U. S. Court of Appeals. In June 2006, the U.S. Supreme Court invited the U.S. Solicitor General to file a brief expressing the view of the United States, and in November 2006, the Solicitor General filed a brief expressing its view on the matter. The U.S. Supreme Court has granted the Petition for a Writ of Certiorari and the parties are in the process of briefing the matter for the U.S. Supreme Court.
Additional lawsuits may be filed against certain of the Janus funds, Janus Capital, and related parties in the future. Janus Capital does not currently believe that these pending actions will materially affect its ability to continue providing services it has agreed to provide to the Janus funds.
Janus Aspen Series December 31, 2006 19
Report of Independent Registered Public Accounting Firm
To the Trustees and Shareholders
of Janus Aspen Fundamental Equity Portfolio
In our opinion, the accompanying statement of assets and liabilities, including the schedule of investments, and the related statements of operations and of changes in net assets and the financial highlights present fairly, in all material respects, the financial position of Janus Aspen Fundamental Equity Portfolio (formerly Janus Aspen Core Equity Portfolio) (one of the portfolios constituting Janus Aspen Series, hereafter referred to as the "Portfolio") at December 31, 2006, the results of its operations for the year then ended, the changes in its net assets for each of the two years in the period then ended, and the financial highlights for each of the five years in the period then ended, in conformity with accounting principles generally accepted in the United States of America. These financial statements and financial highlights (hereafter referred to as "financial statements") are the responsibility of the Portfolio's management; our r esponsibility is to express an opinion on these financial statements based on our audits. We conducted our audits of these financial statements in accordance with the standards of the Public Company Accounting Oversight Board (United States). Those standards require that we plan and perform the audit to obtain reasonable assurance about whether the financial statements are free of material misstatement. An audit includes examining, on a test basis, evidence supporting the amounts and disclosures in the financial statements, assessing the accounting principles used and significant estimates made by management, and evaluating the overall financial statement presentation. We believe that our audits, which included confirmation of securities at December 31, 2006 by correspondence with the custodian, transfer agent and brokers, and the application of alternative auditing procedures where securities purchased had not been received, provide a r easonable basis for our opinion.

PricewaterhouseCoopers LLP
Denver, Colorado
February 12, 2007
20 Janus Aspen Series December 31, 2006
Additional Information (unaudited)
PROXY VOTING POLICIES AND VOTING RECORD
A description of the policies and procedures that the Portfolio uses to determine how to vote proxies relating to its portfolio securities is available: (i) without charge, upon request, by calling 1-800-525-0020 (toll free); (ii) on the Portfolio's website at www.janus.com/proxyvoting; and (iii) on the SEC's website at http://www.sec.gov. Additionally, information regarding the Portfolio's proxy voting record for the most recent twelve-month period ended June 30 is also available, free of charge, through www.janus.com/proxyvoting and from the SEC's website at http://www.sec.gov.
QUARTERLY PORTFOLIO HOLDINGS
The Portfolio files its complete portfolio holdings (schedule of investments) with the SEC for the first and third quarters of each fiscal year on Form N-Q within 60 days of the end of such fiscal quarter. The Portfolio's Form N-Q: (i) is available on the SEC's website at http://www.sec.gov; (ii) may be reviewed and copied at the SEC's Public Reference Room in Washington, D.C. (information on the Public Reference Room may be obtained by calling 1-800-SEC-0330); and (iii) is available without charge, upon request, by calling Janus at 1-800-525-0020 (toll free).
APPROVAL OF ADVISORY AGREEMENTS DURING THE PERIOD
The Trustees of Janus Aspen Series, more than eighty-five percent of whom have never been affiliated with the Adviser ("Independent Trustees"), oversee the management of each of the Portfolios and, as required by law, determine annually whether to continue the investment advisory agreement for each Portfolio and the subadvisory agreements for the three Portfolios that utilize subadvisers.
In connection with their most recent consideration of those agreements for each of the Portfolios, the Trustees received and reviewed a substantial amount of information provided by Janus Capital (the "Adviser") and the respective subadvisers in response to requests of the Independent Trustees and their independent legal counsel. They also received and reviewed a considerable amount of information and analysis provided to the Trustees by their independent fee consultant. Throughout their consideration of the agreements the Independent Trustees were advised by their independent legal counsel. The Independent Trustees met on two separate occasions with management to consider the agreements, and at each of those meetings they also met separately in executive session with their independent legal counsel.
At a meeting held on December 20, 2006, based on their evaluation of the information provided by the Adviser, the subadvisers and the independent fee consultant and other information, the Trustees determined that the overall arrangements between each Portfolio and the Adviser were fair and reasonable in light of the nature, extent and quality of the services provided by the Adviser, its affiliates and the subadvisers, the fees charged for those services, and other matters that the Trustees considered relevant in the exercise of their business judgment. At that meeting all of the Trustees unanimously approved the continuation of the investment advisory agreement for each Portfolio, and the subadvisory agreement for each subadvised Portfolio, for the period from February 1, 2007 through February 1, 2008, subject to earlier termination as provided in each agreement.
In considering the continuation of those agreements, the Trustees reviewed and analyzed various factors that they determined were relevant, including the factors described below, none of which by itself was considered dispositive. However, the material factors and conclusions that formed basis for the Trustees' determination to approve the continuation of the agreements are discussed separately below.
Nature, Extent and Quality of Services
The Trustees reviewed the nature, extent and quality of the services of Janus Capital and the subadvisers to the Funds, taking into account the investment objective and strategy of each Portfolio and the knowledge the Trustees gained from their regular meetings with management on at least a quarterly basis and their ongoing review of information related to the Funds. In addition, the Trustees reviewed the resources and key personnel of Janus Capital and each subadviser, especially those who provide investment management services to the Portfolios. The Trustees also considered other services provided to the Portfolios by Janus Capital or the subadvisers, such as managing the execution of portfolio transactions and the selection of broker-dealers for those transactions, serving as the Portfolios' administrator, monitoring adherence to the Portfolios' investment restrictions, producing shareholder reports, providing support services for the Tru stees and Trustee committees, communicating with shareholders and overseeing the activities of other service providers, including monitoring compliance with various policies and procedures of the Portfolios and with applicable securities laws and regulations.
The Trustees concluded that: the nature, extent and quality of the services provided by Janus Capital or the subadviser to each Portfolio were appropriate and consistent with the terms of the respective advisory and subadvisory agreements; that, taking into account steps taken to address a small portion of the Portfolios whose performance lagged that of their peers for certain periods, the quality of those services had been consistent with or superior to quality norms in the industry; and that the Portfolios were likely to benefit from the continued provision of those services. They also concluded that each of Janus Capital and each subadviser had sufficient
Janus Aspen Series December 31, 2006 21
Additional Information (unaudited) (continued)
personnel, with the appropriate education and experience, to serve the Portfolios effectively and had demonstrated its continuing ability to attract and retain well-qualified personnel.
Performance of the Funds
The Trustees considered the performance results of each Portfolio over various time periods. They reviewed information comparing each Portfolio's performance with the performance of comparable funds and peer groups identified by Lipper Inc., an independent provider of investment company data, and with the Portfolio's benchmark. They concluded that the performance of most Portfolios was good to very good. Although the performance of some Portfolios lagged that of their peers for certain periods, the Trustees also concluded that Janus Capital had taken appropriate steps to address those instances of under-performance and that the more recent performance of most of those Portfolios had been improving.
Costs of Services Provided
The Trustees examined information on the fees and expenses of each Portfolio in comparison to similar information for other comparable funds as provided by Lipper. They also reviewed an analysis of that information provided by their independent fee consultant and noted that the rate of management (investment advisory and administrative) fees for most of the Portfolios, after contractual expense limitations, was below the mean management fee rate of the respective peer group of funds selected by Lipper.
The Trustees considered the methodology used by Janus Capital and each subadviser in determining compensation payable to portfolio managers, the competitive environment for investment management talent and the competitive market for mutual funds in different distribution channels. They concluded that the compensation methodology provided a good alignment of the interests of the portfolio managers with the interests of Portfolio shareholders.
The Trustees also reviewed management fees charged by Janus Capital to its separate account clients and to its subadvised funds (for which Janus Capital provides only portfolio management services). Although in most instances subadvisory and separate account fee rates for various investment strategies were lower than management fees for Portfolios having a similar strategy, the Trustees noted that Janus Capital performs significant additional services for the Portfolios that it does not provide to those other clients, including administrative services, oversight of the Portfolios' other service providers, trustee support, regulatory compliance and numerous other services, and that, in serving the Portfolios, Janus Capital assumes many legal risks that it does not assume in servicing its other clients. Moreover, they noted that the spread between the average fees charged to the Portfolios and the fees that Janus Capital charged to its separate account clients was significantly smaller than the average spread for such fees of other advisers, based on publicly available data and research conducted by their independent fee consultant.
In considering the fees charged by Janus Capital, the Trustees had previously negotiated with Janus Capital a temporary contingent waiver of a portion the investment advisory fee paid by Janus Aspen Worldwide Growth Portfolio to Janus Capital to provide for a possible reduction in the rate of advisory fee payable by the Portfolio for the period July 1, 2006 through January 31, 2007 if the investment performance of the Fund should lag that of its benchmark performance over the applicable performance measurement period. Commencing in February 2007, the previously approved performance-based fee schedule will become operative.
The Trustees reviewed information on the profitability of Janus Capital and its affiliates of their relationships with each Portfolio, as well as an explanation of the methodology utilized in allocating various expenses among the Portfolios and other clients. The Trustees also reviewed the financial statements of Janus Capital's parent company and its corporate structure. In their review, the Trustees considered whether Janus Capital and each subadviser receive adequate incentives to manage the Portfolios effectively. The Trustees recognized that profitability comparisons among fund managers are difficult because very little comparative information is publicly available and profitability of any manager is affected by numerous factors, including the organizational structure of the particular manager, the types of funds and other accounts it manages, possible other lines of business, the methodology for allocating expenses and the manager's ca pital structure and cost of capital. However, based on the information available and taking those factors into account, the Trustees concluded that Janus Capital's profitability with respect to each Portfolio in relation to the services rendered was not unreasonable.
The Trustees concluded that the management fees and other compensation payable by each Fund to Janus Capital and its affiliates, as well as the fees paid by Janus Capital to the subadvisers of subadvised Portfolios, were reasonable in relation to the nature and quality of the services provided, taking into account the fees charged by other advisers for managing comparable mutual funds with similar strategies and the fees Janus Capital and the subadviser charges to other clients. The Trustees also concluded that the overall expense ratio of each Portfolio was reasonable, taking into account the size of the Portfolio, the quality of services provided by Janus Capital and any subadviser, the investment performance of the
22 Janus Aspen Series December 31, 2006
Portfolio and any expense limitations agreed to by Janus Capital.
Economies of Scale
The Trustees considered information about the potential for Janus Capital to realize economies of scale as the assets of the Portfolios increase. They noted that, although most Portfolios pay advisory fees at a fixed rate as a percentage of net assets, without any breakpoints, the management fee paid by each Portfolio, after any contractual expense limitations, was below the mean management fee rate of the Portfolio's peer group selected by Lipper; and, for those Portfolios whose expenses are being reduced by the contractual expense limitations of Janus Capital, Janus Capital is subsidizing the Portfolios because they have not reached adequate scale. Moreover, as the assets of many of the Portfolios have declined in the past few years, the Portfolios have benefited from having advisory fee rates that have remained constant rather than increasing as assets decline. In addition, performance fee structures have been implemented for several Port folios that will cause the effective rate of advisory fees payable by such a Portfolio to vary depending on the investment performance of the Portfolio relative to its benchmark; and a few Portfolios have fee schedules with breakpoints and reduced fee rates above certain asset levels. The Trustees also noted that the Portfolios share directly in economies of scale through lower charges of third-party service providers based on the combined scale of all of the Portfolios. Based on all of the information they reviewed, the Trustees concluded that the current fee structure of each Portfolio was reasonable and that the current rates of fees do reflect a sharing between Janus Capital and the Portfolio of economies of scale at the current asset level of the Portfolio.
Other Benefits to Janus Capital
The Trustees also considered benefits that accrue to Janus Capital and its affiliates from their relationships with the Portfolios. They recognized that two affiliates of Janus Capital separately serve the Portfolios as transfer agent and distributor, respectively, and that the transfer agent receives compensation from the non-money market Portfolios for services provided. The Trustees also considered Janus Capital's use of commissions paid by Portfolios on their portfolio brokerage transactions to obtain proprietary research products and services benefiting the Portfolios and/or other clients of Janus Capital, as well as Janus Capital's agreement not to use any Portfolio's brokerage transactions to obtain third party research products or services. The Trustees concluded that Janus Capital's use of "soft" commission dollars to obtain proprietary research products and services was consistent with regulatory requirements and guidelines and was likely to benefit each Portfolio. The Trustees also concluded that, other than the services provided by Janus Capital and its affiliates pursuant to the agreements and the fees to be paid by each Portfolio therefor, the Portfolios and Janus Capital may potentially benefit from their relationship with each other in other ways. They concluded that Janus Capital benefits from the receipt of proprietary research products and services acquired through commissions paid on portfolio transactions of the Portfolios and that the Portfolios benefit from Janus Capital's receipt of those products and services as well as research products and services acquired through commissions paid by other clients of Janus Capital. They further concluded that success of any Portfolio could attract other business to Janus Capital or other Janus Funds and that the success of Janus Capital could enhance Janus Capital's ability to serve the Portfolios.
After full consideration of the above factors as well as other factors, all of the Trustees, including all of the Independent Trustees, concluded that the proposed continuation of the investment advisory agreement for each applicable Portfolio were in the best interest of the respective Portfolios and their shareholders.
Janus Aspen Series December 31, 2006 23
Explanations of Charts, Tables and
Financial Statements (unaudited)
1. PERFORMANCE OVERVIEWS
The performance overview graph compares the performance of a hypothetical $10,000 investment in the Portfolio with one or more widely used market indices. The hypothetical example does not represent the returns of any particular investment.
When comparing the performance of the Portfolio with an index, keep in mind that market indices do not include brokerage commissions that would be incurred if you purchased the individual securities in the index. They also do not include taxes payable on dividends and interest or operating expenses incurred if you maintained a Portfolio invested in the index.
Average annual total returns are quoted for each class of the Portfolio. Average annual total return is calculated by taking the growth or decline in value of an investment over a period of time, including reinvestment of any dividends, distributions and capital gains, then calculating the annual compounded percentage rate that would have produced the same result had the rate of growth been constant throughout the period. Average annual total return does not reflect the deduction of taxes that a shareholder would pay on Portfolio distributions or redemptions of Portfolio shares.
2. SCHEDULE OF INVESTMENTS
Following the performance overview section is the Portfolio's Schedule of Investments. This schedule reports the industry concentrations and types of securities held in the Portfolio on the last day of the reporting period. Securities are usually listed by type (common stock, corporate bonds, U.S. Government obligations, etc.) and by industry classification (banking, communications, insurance, etc.). Holdings are subject to change without notice.
The value of each security is quoted as of the last day of the reporting period. The value of securities denominated in foreign currencies is converted into U.S. dollars. Certain short-term investments maturing within 60 days are valued at amortized cost, which approximates market value.
A summary of investments by country is provided if the Portfolio invested in foreign securities. This summary reports the Portfolio's exposure to different countries by providing the percentage of securities invested in each country. The country of each security represents the country in which the company is incorporated.
2A. FORWARD CURRENCY CONTRACTS
A table listing forward currency contracts follows the Portfolio's Schedule of Investments (if applicable). Forward currency contracts are agreements to deliver or receive a preset amount of currency at a future date. Forward currency contracts are used to hedge against foreign currency risk in the Portfolio's long-term holdings. The table provides the name of the foreign currency, the settlement date of the contract, the amount of the contract, the value of the currency in U.S. dollars and the amount of unrealized gain or loss. The amount of unrealized gain or loss reflects the change in currency exchange rates from the time the contract was opened to the last day of the reporting period.
2B. FUTURES
A table listing futures contracts follows the Portfolio's Schedule of Investments (if applicable). Futures contracts are contracts that obligate the buyer to receive and the seller to deliver an instrument or money at a specified price on a specified date. Futures are used to hedge against adverse movements in securities prices, currency risk or interest rates.
The table provides the name of the contract, number of contracts held, the expiration date, the principal amount, value and the amount of unrealized gain or loss. The amount of unrealized gain or loss reflects the marked-to-market amount for the last day of the reporting period.
2C. OPTIONS
A table listing option contracts follows the Portfolio's Schedule of Investments (if applicable). Option contracts are contracts that obligate the Portfolio to sell or purchase an underlying security at a fixed price, upon exercise of the option. Options are used to hedge against adverse movements in securities prices, currency risk or interest rates.
The table provides the name of the contract, number of contracts held, the expiration date, exercise price, value and premiums received.
3. STATEMENT OF ASSETS AND LIABILITIES
This statement is often referred to as the "balance sheet." It lists the assets and liabilities of the Portfolio on the last day of the reporting period.
The Portfolio's assets are calculated by adding the value of the securities owned, the receivable for securities sold but not yet settled, the receivable for dividends declared but not yet received on stocks owned and the receivable for Portfolio shares sold to investors but not yet settled. The Portfolio's liabilities include payables for securities purchased but not yet settled, Portfolio shares redeemed but not yet paid and expenses owed but not yet paid. Additionally, there may be other assets and liabilities such as unrealized gain or loss on forward currency contracts.
The section entitled "Net Assets Consist of" breaks down the components of the Portfolio's net assets. Because the Portfolio must distribute substantially all earnings, you'll notice that a significant portion of net assets is shareholder capital.
The last section of this statement reports the net asset value ("NAV") per share on the last day of the reporting period for each class of the Portfolio. The NAV is calculated by dividing
24 Janus Aspen Series December 31, 2006
the Portfolio's net assets (assets minus liabilities) by the number of shares outstanding.
4. STATEMENT OF OPERATIONS
This statement details the Portfolio's income, expenses, gains and losses on securities and currency transactions, and appreciation or depreciation of current Portfolio holdings.
The first section in this statement, entitled "Investment Income," reports the dividends earned from stocks and interest earned from interest-bearing securities in the Portfolio.
The next section reports the expenses and expense offsets incurred by the Portfolio, including the advisory fee paid to the investment adviser and transfer agent fees and expenses, and printing and postage for mailing statements, financial reports and prospectuses. Expense offsets, if any, are also shown.
The last section lists the increase or decrease in the value of securities held in the Portfolio. The Portfolio realizes a gain (or loss) when it sells its position in a particular security. An unrealized gain (or loss) refers to the change in net appreciation or depreciation of the Portfolio during the reporting period. "Net Realized and Unrealized Gain/(Loss) on Investments" is affected both by changes in the market value of Portfolio holdings and by gains (or losses) realized during the reporting period.
5. STATEMENT OF CHANGES IN NET ASSETS
This statement reports the increase or decrease in the Portfolio's net assets during the reporting period. Changes in the Portfolio's net assets are attributable to investment operations, dividends, distributions and capital share transactions. This is important to investors because it shows exactly what caused the Portfolio's net asset size to change during the period.
The first section summarizes the information from the Statement of Operations regarding changes in net assets due to the Portfolio's investment performance. The Portfolio's net assets may also change as a result of dividend and capital gains distributions to investors. If investors receive their dividends in cash, money is taken out of the Portfolio to pay the distribution. If investors reinvest their dividends, the Portfolio's net assets will not be affected. If you compare the Portfolio's "Net Decrease from Dividends and Distributions" to the "Reinvested dividends and distributions," you will notice that dividend distributions had little effect on the Portfolio's net assets. This is because the majority of Janus investors reinvest their distributions.
The reinvestment of dividends is included under "Capital Share Transactions." "Capital Shares" refers to the money investors contribute to the Portfolio through purchases or withdraw via redemptions. The Portfolio's net assets will increase and decrease in value as investors purchase and redeem shares from the Portfolio.
6. FINANCIAL HIGHLIGHTS
This schedule provides a per-share breakdown of the components that affect the Portfolio's NAV for current and past reporting periods for each class of the Portfolio. Not only does this table provide you with total return, it also reports total distributions, asset size, expense ratios and portfolio turnover rate.
The first line in the table reflects the NAV per share at the beginning of the reporting period. The next line reports the net investment income per share, which comprises dividends and interest income earned on securities held by the Portfolio. Following is the total of gains/(losses), realized and unrealized. Dividends and distributions are then subtracted to arrive at the NAV per share at the end of the period. The next line reflects the average annual total return reported the last day of the period.
Also included are the expense ratios, or the percentage of net assets that are used to cover operating expenses during the period. Expense ratios vary for a number of reasons, including the differences in management fees, the average shareholder account size and the extent of foreign investments, which entail greater transaction costs.
The Portfolio's expenses may be reduced through expense reduction arrangements. These arrangements may include the use of balance credits or transfer agent fee offsets. The Statement of Operations reflects total expenses before any such offset, the amount of offset and the net expenses. The expense ratios listed in the Financial Highlights reflect total expenses prior to any expense offsets (gross expense ratio) and after the expense offsets (net expense ratio). Both expense ratios reflect expenses after waivers (reimbursements), if applicable.
The ratio of net investment income/(loss) summarizes the income earned less expenses, divided by the average net assets of the Portfolio during the reporting period. Don't confuse this ratio with the Portfolio's yield. The net investment income ratio is not a true measure of the Portfolio's yield because it doesn't take into account the dividends distributed to the Portfolio's investors.
The next ratio is the portfolio turnover rate, which measures the buying and selling activity in a Portfolio. Portfolio turnover is affected by market conditions, changes in the asset size of a Portfolio, the nature of the Portfolio's investments and the investment style of the portfolio manager. A 100% rate implies that an amount equal to the value of the entire portfolio is turned over in a year; a 50% rate means that an amount equal to the value of half the portfolio is traded in a year; and a 200% rate means that an amount equal to the value of the portfolio is traded every six months.
Janus Aspen Series December 31, 2006 25
Designation Requirements (unaudited)
For federal income tax purposes, the Portfolio designated the following for the year ended December 31, 2006:
Capital Gain Distributions
| Portfolio | |||||||
| Janus Aspen Fundamental Equity Portfolio(1) | $ | 4,917 | |||||
(1) Formerly named Janus Aspen Core Equity Portfolio
Dividends Received Deduction Percentage
| Portfolio | |||||||
| Janus Aspen Fundamental Equity Portfolio(1) | 100 | % | |||||
(1) Formerly named Janus Aspen Core Equity Portfolio
26 Janus Aspen Series December 31, 2006
Trustees and Officers (unaudited)
The Portfolio's Statement of Additional Information includes additional information about the Trustees and officers and is available, without charge, by calling 1-800-525-0020.
The following are the Trustees and officers of the Trust, together with a brief description of their principal occupations during the last five years (principal occupations for certain Trustees may include periods over five years).
Each Trustee has served in that capacity since he or she was originally elected or appointed. The Trustees do not serve a specified term of office. Each Trustee will hold office until the termination of the Trust or his or her earlier death, resignation, retirement, incapacity or removal. The retirement age for Trustees is 72. The Portfolio's Nominating and Governance Committee will consider nominees for the position of Trustee recommended by shareholders. Shareholders may submit the name of a candidate for consideration by the Committee by submitting their recommendations to the Trust's Secretary. Each Trustee is currently a Trustee of two other registered investment companies advised by Janus Capital: Janus Investment Fund and Janus Adviser Series. As of the date of this report, collectively, these three registered investment companies consist of 69 series or funds.
The Trust's officers are elected annually by the Trustees for a one-year term. Certain officers also serve as officers of Janus Investment Fund and Janus Adviser Series. Certain officers of the Portfolio may also be officers and/or directors of Janus Capital. Portfolio officers receive no compensation from the Portfolio, except for the Portfolio's Chief Compliance Officer, as authorized by the Trustees.
Trustees
| Name, Age and Address | Positions Held with Portfolio | Length of Time Served | Principal Occupations During the Past Five Years | Number of Portfolios in Fund Complex Overseen by Trustee | Other Directorships Held by Trustee | ||||||||||||||||||
| Independent Trustees | |||||||||||||||||||||||
| Dennis B. Mullen 151 Detroit Street Denver, CO 80206 Age 63 | Chairman Trustee | 3/04-Present 9/93-Present | Chief Executive Officer of Red Robin Gourmet Burgers, Inc. (since 2005). Formerly, private investor. | 69 | * | Chairman of the Board (since 2005) and Director of Red Robin Gourmet Burgers, Inc.; and Director of Janus Capital Funds Plc (Dublin-based, non-U.S. funds). | |||||||||||||||||
| Jerome S. Contro 151 Detroit Street Denver, CO 80206 Age 50 | Trustee | 12/05-Present | Partner of Tango Group, a private investment firm (since 1999). | 69 | Trustee and Chairman of RS Investment Trust (since 2001); Director of IZZE Beverages and MyFamily.com, Inc. (genealogical research website). | ||||||||||||||||||
| William F. McCalpin 151 Detroit Street Denver, CO 80206 Age 49 | Trustee | 6/02-Present | Private Investor. Formerly, Vice President of Asian Cultural Council and Executive Vice President and Chief Operating Officer of The Rockefeller Brothers Fund (a private family foundation). | 69 | Director of the F.B. Heron Foundation (a private grantmaking foundation). | ||||||||||||||||||
| John W. McCarter, Jr. 151 Detroit Street Denver, CO 80206 Age 68 | Trustee | 6/02-Present | President and Chief Executive Officer of The Field Museum of Natural History (Chicago, IL). | 69 | Chairman of the Board and Director of Divergence Inc. (biotechnology firm); Director of W.W. Grainger, Inc. (industrial distributor); and Trustee of WTTW (Chicago public television station) and the University of Chicago. | ||||||||||||||||||
Janus Aspen Series December 31, 2006 27
Trustees and Officers (unaudited) (continued)
Trustees (cont.)
| Name, Age and Address | Positions Held with Portfolio | Length of Time Served | Principal Occupations During the Past Five Years | Number of Portfolios in Fund Complex Overseen by Trustee | Other Directorships Held by Trustee | ||||||||||||||||||
| Independent Trustees (cont.) | |||||||||||||||||||||||
| James T. Rothe 151 Detroit Street Denver, CO 80206 Age 63 | Trustee | 1/97-Present | Co-founder and Managing Director of Roaring Fork Capital Management, LLC (private investment in public equity firm); and Professor Emeritus of Business of the University of Colorado. Formerly, Professor of Business of the University of Colorado (2002-2004); and Distinguished Visiting Professor of Business (2001-2002) of Thunderbird University (American Graduate School of International Management), Glendale, AZ. | 69 | Director of Red Robin Gourmet Burgers, Inc. | ||||||||||||||||||
| William D. Stewart 151 Detroit Street Denver, CO 80206 Age 62 | Trustee | 9/93-Present | Corporate Vice President and General Manager of MKS Instruments – HPS Products, Boulder, CO (a manufacturer of vacuum fittings and valves). | 69 | N/A | ||||||||||||||||||
| Martin H. Waldinger 151 Detroit Street Denver, CO 80206 Age 68 | Trustee | 9/93-Present | Private Investor and Consultant to California Planned Unit Developments. Formerly, CEO and President of Marwal, Inc. (homeowner association management company). | 69 | N/A | ||||||||||||||||||
| Linda S. Wolf 151 Detroit Street Denver, CO 80206 Age 59 | Trustee | 12/05-Present | Retired. Formerly, Chairman and Chief Executive Officer of Leo Burnett (Worldwide) (advertising agency) (2001-2005). | 69 | Director of Wal-Mart, The Field Museum of Natural History (Chicago, IL), Children's Memorial Hospital (Chicago, IL), Chicago Council on Foreign Relations Economic Club of Chicago, and InnerWorkings (a provider of print procurement solutions). | ||||||||||||||||||
| Interested Trustee | |||||||||||||||||||||||
| Thomas H. Bailey** 151 Detroit Street Denver, CO 80206 Age 69 | Trustee | 5/93-Present | Retired. Formerly, President (1978-2002) and Chief Executive Officer (1994-2002) of Janus Capital or Janus Capital Corporation; Chairman and Director (1978-2002) of Janus Capital Corporation; President and Director (1994-2002) of The Janus Foundation. | 69 | N/A | ||||||||||||||||||
* Mr. Mullen also serves as director of Janus Capital Funds Plc, consisting of 22 funds. Including Janus Capital Funds Plc and the 69 funds comprising the Janus Funds, Mr. Mullen oversees 91 funds.
** The Portfolio is treating Mr. Bailey as an "interested person" of the Trust by virtue of his past positions and continuing relationships with Janus Capital and ownership of shares of Janus Capital's parent company.
28 Janus Aspen Series December 31, 2006
Officers
| Name, Age and Address | Positions Held with Portfolio | Term of Office* and Length of Time Served | Principal Occupations During the Past Five Years | ||||||||||||
| Minyoung Sohn 151 Detroit Street Denver, CO 80206 Age 31 | Executive Vice President and Portfolio Manager Janus Aspen Fundamental Equity Portfolio | 5/05-Present | Vice President of Janus Capital and Portfolio Manager for other Janus accounts. Formerly, Analyst (1998-2003) for Janus Capital Corporation. | ||||||||||||
| Stephanie Grauerholz-Lofton 151 Detroit Street Denver, CO 80206 Age 36 | Chief Legal Counsel and Secretary Vice President | 1/06-Present 03/06-Present | Assistant Vice President of Janus Capital and Janus Distributors LLC; and Associate Counsel of Janus Capital. Formerly, Associate of Vedder, Price, Kaufman & Kammholz, P.C. (1999-2003). | ||||||||||||
| Kelley Abbott Howes 151 Detroit Street Denver, CO 80206 Age 41 | President and Chief Executive Officer | 1/06-Present | President of Janus Services LLC; Senior Vice President and General Counsel of Janus Capital; and Senior Vice President and Assistant General Counsel of Janus Distributors LLC. Formerly, Vice President (1999-2005) of Janus Distributors LLC; Senior Vice President and General Counsel (2004-2006), Vice President (2000-2004), and Assistant General Counsel (2002-2004) of Janus Services LLC; and Vice President and Assistant General Counsel (1999-2004) of Janus Capital. | ||||||||||||
| David R. Kowalski 151 Detroit Street Denver, CO 80206 Age 49 | Vice President and Chief Compliance Officer | 6/02-Present | Senior Vice President and Chief Compliance Officer of Janus Capital, Janus Distributors LLC, and Janus Services LLC; Chief Compliance Officer of Bay Isle Financial LLC; and Vice President of Enhanced Investment Technologies LLC. Formerly, Chief Compliance Officer of Enhanced Investment Technologies, LLC (2003-2005); Vice President of Janus Capital (2000-2005), Janus Distributors LLC (2000-2001), and Janus Services LLC (2004-2005); and Assistant Vice President of Janus Services LLC (2002-2004). | ||||||||||||
| Jesper Nergaard 151 Detroit Street Denver, CO 80206 Age 44 | Chief Financial Officer Vice President, Treasurer, and Principal Accounting Officer | 3/05-Present 2/05-Present | Vice President of Janus Capital. Formerly, Director of Financial Reporting for OppenheimerFunds, Inc. (2004-2005); Site Manager and First Vice President of Mellon Global Securities Services (2003); and Director of Fund Accounting, Project Development, and Training of INVESCO Funds Group (1994-2003). | ||||||||||||
* Officers are elected at least annually for a one-year term and may also be elected from time to time by the Trustees for an interim period.
Janus Aspen Series December 31, 2006 29
Janus provides access to a wide range of investment disciplines.
Growth
Janus growth portfolios focus on companies believed to be the leaders in their respective industries, with solid management teams, expanding market share, margins and efficiencies.
Core
Janus core portfolios seek investments in more stable and predictable companies. These portfolios look for a strategic combination of steady growth and for certain portfolios, some degree of income.
Risk-Managed
Our risk-managed portfolios seek to outperform their respective indices while maintaining a risk profile equal to or lower than the index itself. Managed by INTECH (a Janus subsidiary), these portfolios use a mathematical process in an attempt to build a more "efficient" portfolio than the index.
Value
Janus value portfolios invest in companies they believe are poised for a turnaround or are trading at a significant discount to fair value. The goal is to gain unique insight into a company's true value and identify and evaluate potential catalysts that may unlock shareholder value.
International & Global
Janus international and global portfolios seek to leverage Janus' research capabilities by taking advantage of inefficiencies in foreign markets, where accurate information and analytical insight are often at a premium.
Bond & Money Market
Janus bond portfolios attempt to provide less risk relative to equities while seeking to deliver a competitive total return through high current income and appreciation. Janus money market portfolios seek maximum current income consistent with stability of capital.
For more information about our funds, contact your investment professional or go to www.janus.com/info
Please consider the charges, risks, expenses and investment objectives carefully before investing. For a prospectus containing this and other information, please call Janus at 1-800-525-0020 or download the file from www.janus.com/info. Read it carefully before you invest or send money.
An investment in a money market portfolio is not insured or guaranteed by the Federal Deposit Insurance Corporation or any other government agency. Although the Portfolio seeks to preserve the value of your investment at $1.00 per share, it is possible to lose money by investing in the Portfolio.

151 Detroit Street
Denver, CO 80206
1-800-525-0020
Portfolio distributed by Janus Distributors LLC (1/07)
C-0207-169 109-02-711 01-07
2006 Annual Report
Janus Aspen Series
Janus Aspen Global Life Sciences Portfolio
Look Inside. . .
• Portfolio management perspective
• Investment strategy behind your portfolio
• Portfolio performance, characteristics and holdings

Table of Contents
| Useful Information About Your Portfolio Report | 1 | ||||||
| Management Commentary and Schedule of Investments | 2 | ||||||
| Statement of Assets and Liabilities | 8 | ||||||
| Statement of Operations | 9 | ||||||
| Statements of Changes in Net Assets | 10 | ||||||
| Financial Highlights | 11 | ||||||
| Notes to Schedule of Investments | 12 | ||||||
| Notes to Financial Statements | 13 | ||||||
| Report of Independent Registered Public Accounting Firm | 21 | ||||||
| Additional Information | 22 | ||||||
| Explanations of Charts, Tables and Financial Statements | 25 | ||||||
| Trustees and Officers | 27 | ||||||
Please consider the charges, risks, expenses and investment objectives carefully before investing. For a prospectus containing this and other information, please call Janus at 1-800-525-0020 or download the file from www.janus.com/info. Read it carefully before you invest or send money.
Useful Information About Your Portfolio Report
Management Commentary
The Management Commentary in this report includes valuable insight from the Portfolio's managers as well as statistical information to help you understand how your Portfolio's performance and characteristics stack up against those of comparable indices.
Please keep in mind that the opinions expressed by the Portfolio's managers in the Management Commentary are just that: opinions. They are a reflection of the managers' best judgment at the time this report was compiled, which was December 31, 2006. As the investing environment changes, so could the manager's opinions. The views are unique to the managers and aren't necessarily shared by their fellow employees or by Janus in general.
Portfolio Expenses
We believe it's important for our shareholders to have a clear understanding of Portfolio expenses and the impact they have on investment return.
The following is important information regarding the Portfolio's Expense Example, which appears in the Management Commentary within this Annual Report. Please refer to this information when reviewing the Expense Example for the Portfolio.
Example
As a shareholder of a Portfolio, you incur two types of costs: (1) transaction costs, including redemption fees (where applicable) (and any related exchange fees) and (2) ongoing costs, including management fees; distribution and shareholder servicing (12b-1) fees (applicable to Service Shares only); and other Portfolio expenses. The example is intended to help you understand your ongoing costs (in dollars) of investing in a Portfolio and to compare these costs with the ongoing costs of investing in other mutual funds. To do so, compare this 5% hypothetical example with the 5% hypothetical examples that appear in the shareholder reports of the other funds. The example is based upon an investment of $1,000 invested at the beginning of the period and held for the six-month period from July 1, 2006 to December 31, 2006.
Actual Expenses
The first line of the table in each example provides information about actual account values and actual expenses. You may use the information in this line, together with the amount you invested, to estimate the expenses that you paid over the period. Simply divide your account value by $1,000 (for example, an $8,600 account value divided by $1,000 = 8.6), then multiply the result by the number in the first line under the heading entitled "Expenses Paid During Period" to estimate the expenses you paid on your account during the period.
Hypothetical Example for Comparison Purposes
The second line of the table in each example provides information about hypothetical account values and hypothetical expenses based upon the Portfolio's actual expense ratio and an assumed rate of return of 5% per year before expenses, which is not the Portfolio's actual return. The hypothetical account values and expenses may not be used to estimate the actual ending account balance or expenses you paid for the period. You may use this information to compare the ongoing costs of investing in the Portfolio and other funds. To do so, compare this 5% hypothetical example with the 5% hypothetical examples that appear in the shareholder reports of the other funds.
Janus Capital Management LLC ("Janus Capital") has contractually agreed to waive the Portfolio's total operating expenses, excluding the distribution and shareholder servicing (12b-1) fees applicable to Service Shares, brokerage commissions, interest, taxes and extraordinary expenses to certain limits until at least May 1, 2008. More information regarding the waivers is available in the Portfolio's prospectus.
Please note that the expenses shown in the tables are meant to highlight your ongoing costs only and do not reflect any transaction costs, such as redemption fees (where applicable) and any charges at the separate account level or contract level. Redemption fees are fully described in the prospectus. Therefore, the second line of each table is useful in comparing ongoing costs only, and will not help you determine the relative total costs of owning different funds. In addition, if these transaction costs and separate account or contract level charges were included, your costs would have been higher.
Janus Aspen Series December 31, 2006 1
Janus Aspen Global Life Sciences Portfolio (unaudited)
Portfolio Snapshot
This portfolio seeks companies around the world that are dedicated to improving the quality of life for a growing and aging world.

Thomas Malley
co-portfolio
manager

Andy Acker
co-portfolio
manager
Performance Overview
Equity markets endured a wild ride through the 12-month period ended December 31, 2006. A late spring sell-off, prompted by spiking oil prices and increasing short-term interest rates, erased gains posted through the first three months of the year, especially among more speculative names. The market reversed course in July, and despite a few bumps in the road during the second half, finished the year on an up note.
Within the life sciences sector, blue-chip pharmaceutical stocks benefited from investors' renewed attraction to companies with stable and predictable earnings. Earlier in the year, select manufacturers of healthcare supplies and drug distributors had robust gains, but their overall performance sagged over the 12-month period. Health insurers weighed heavily on the sector through October, as stock option issues at industry leader UnitedHealth Group exacerbated challenges stemming from rising costs and slowing enrollment growth trends. Clinical setbacks, reduced guidance and ineffective stock selection also hindered returns. Conversely, strong picks in the biotechnology supplier group bolstered gains.
In this roller coaster year, Janus Aspen Global Life Science Portfolio's Institutional Shares and Service Shares returned 6.60% and 6.33%, respectively. These returns lagged both the Portfolio's primary and secondary benchmarks, the S&P 500® Index, which advanced 15.80%, and the Morgan Stanley Capital International World Health Care IndexSM, which gained 10.47%.
Select Biotechnology, Insurer and Managed Healthcare Stocks Weighed on Returns
Among the Portfolio's health insurance holdings, UnitedHealth Group, the second-largest health insurer in the United States and one of the largest detractors from performance during the period, fell sharply on worries that the company had manipulated the pricing on some of its options packages. Amid a review by securities regulators, shareholders were also upset about the size of the outgoing CEO's compensation. Concerned about the long-term implications of the investigation and related troubles, we significantly reduced the Portfolio's position.
Smaller biotechnology companies – especially those that are narrowly focused – can prove quite volatile in the wake of drug development news. A significant detractor during the year was Neurocrine Biosciences, which plunged on news that the Food and Drug Administration (FDA) had rejected the company's new drug application for its Indiplon sleep treatment. We chose to hold a position in Neurocrine in the belief that they would refile their New Drug Application (NDA) in 2007 for the lower dose version of the drug. We expect them to redo their phase three trials with the longer acting version, but this data may not be available before 2008.
Nuvelo also caused significant losses to the Portfolio during the period. This biotechnology company failed in its pivotal phase three trials to show benefit for its cardiovascular agent alfimerase in the treatment of catheter clots and peripheral arterial occlusion (clots in the legs). As a result, we are keeping a close eye on our position.
Another hit came from Aetna, one of the nation's leading diversified healthcare benefits companies. Aetna's disappointing first-quarter earnings, which raised concerns about trends in medical costs and reserves, were followed by lower-than-expected results in the second quarter as well. Believing that it may take several quarters for people to regain confidence that Aetna is managing risk appropriately by maintaining adequate reserves, we exited the position after a partial rebound in the stock.
Further diminishing performance was managed healthcare provider Coventry Health Care. Although the company has successfully addressed costs, analysts are worried about health maintenance organization (HMO) plan enrollment levels. We think that Coventry has been unfairly hit on misperceptions about the strength of its core business. In our opinion management is strong, and with free cash flow seeming to be growing steadily, its valuation is among the cheapest in the group on a free cash flow basis. We continue to hold a reduced stake in Coventry because we think it will perform well in the future.
Innovative Drugmakers, Agricultural Science and Blue Chip Pharmaceuticals Provided a Lift
One of the stronger performers during the period was Celgene, whose stock continued to appreciate as its new cancer agent, Revlimid, for multiple myeloma and myelodysplastic syndromes had a great launch and beat expectations. Celgene stock continued to appreciate as Revlimid also had promising phase three data in two different hematological cancers, non-Hodgkin's lymphoma (NHL) and chronic lymphocytic leukemia (CLL), which could materially increase future sales. We continue to find Celgene's story compelling, although we took advantage of the stock's run-up to take some profits.
Syngenta, a manufacturer of agricultural chemicals and agents, benefited from general strength in the agricultural industry. In addition, the company is focused on cutting costs, which should lead to great synergies over the next five years. At the same time, we anticipate increased demand for its chemicals and agricultural biotechnology products as the food needs of the world grow and continued urbanization reduces tillable acreage in China, India and other countries. While maintaining a positive outlook, we trimmed the Portfolio's exposure as the stock appreciated.
2 Janus Aspen Series December 31, 2006
(unaudited)
Strong returns also came from Gilead Sciences. We continue to be enthusiastic about future prospects for Gilead; the company is rapidly growing as a result of its portfolio of HIV medicines, including Viread, Truvada and Atripla. Gilead launched Atripla, which combines three drugs in one pill that may be used either as stand-alone therapy or in combination with other antiretroviral agents. Within weeks of its launch, Atripla gained traction for treating HIV-positive patients. Tamiflu for influenza is also accelerating due to global worries about bird flu. Additionally, Gilead has exciting early development programs that treat Hepatitis C, which could drive future growth.
Merck, a large pharmaceutical company, also aided performance. The company performed well amid optimism about the rollout of five new drugs during the period, most notably Gardasil, a vaccine that targets the virus that causes most cervical cancers. Merck also launched Januvia, which is expected to be a billion dollar drug to treat diabetes and, eventually, pre-diabetic patients.
Looking Ahead
In general, we think the new Medicare drug plan has been beneficial in terms of generating higher volumes for pharmaceutical companies, although its impact could turn negative if prices start moving down. Additionally, it has been good for drug distributors, who are handling increased volumes and tend to enjoy higher profit margins on generic drugs, which are emphasized in the plan.
The broader Medicare overhaul has been generally positive for HMO operators, who have added members formerly serviced directly by the government. It has also been somewhat beneficial for biotechnology firms because certain oral cancer and diabetes products that might not have been covered in the past now are.
Considering the impact of the government's plan, our outlook for the next 12 months is positive, despite the Portfolio's recent challenges. Overall, we see significant innovation coming in biotechnology, and we see our distributors doing well and having a good chance for margin increases. We see a continued recovery, with even more movement back towards big pharmaceutical companies. As always, our goal is strong long-term performance, so our focus will be on the steps to get us there.
Thank you for your investment in Janus Global Life Sciences Portfolio.
Janus Aspen Global Life Sciences Portfolio At a Glance
5 Largest Contributors to Performance - Holdings
| Contribution | |||||||
| Advanced Magnetics, Inc. Medical specialties manufacturer – U.S. | 1.78 | % | |||||
| Alexion Pharmaceuticals, Inc. Biopharmaceutical company – U.S. | 1.63 | % | |||||
| Pozen Inc. Pharmaceutical products developer – U.S. | 1.50 | % | |||||
| Celgene Corp. Biopharmaceutical company – U.S. | 1.34 | % | |||||
| Syngenta A.G. Agricultural chemicals company – Switzerland | 1.23 | % | |||||
5 Largest Detractors from Performance - Holdings
| Contribution | |||||||
| Nuvelo, Inc. Researcher and developer of novel biopharmaceutical products – U.S. | (2.95 | )% | |||||
| Neurocrine Biosciences, Inc. Therapeutics company – U.S. | (2.60 | )% | |||||
| Adolor Corp. Therapeutic-based biopharmaceutical company – U.S. | (0.93 | )% | |||||
| Aetna U.S. Healthcare Healthcare and related benefits provider – U.S. | (0.77 | )% | |||||
| UnitedHealth Group, Inc. Organized health systems company – U.S. | (0.68 | )% | |||||
5 Largest Contributors to Performance - Sectors
| Group | Portfolio Contribution | Portfolio Weighting (% of Net Assets) | S&P 500® Index Weighting | ||||||||||||
| Pharmaceuticals & Biotechnology | 2.94 | % | 61.82 | % | 8.07 | % | |||||||||
| Materials | 1.23 | % | 2.85 | % | 2.99 | % | |||||||||
| Household & Personal Products | 0.36 | % | 0.71 | % | 2.41 | % | |||||||||
| Food Beverage & Tobacco | 0.19 | % | 1.73 | % | 4.75 | % | |||||||||
| Diversified Financials | 0.05 | % | 0.01 | % | 9.48 | % | |||||||||
5 Lowest Contributors/Detractors to Performance - Sectors
| Group | Portfolio Contribution | Portfolio Weighting (% of Net Assets) | S&P 500® Index Weighting | ||||||||||||
| Healthcare Equipment & Services | (4.42 | )% | 32.06 | % | 4.57 | % | |||||||||
| Food & Staples Retailing | (0.23 | )% | 0.65 | % | 2.33 | % | |||||||||
| Retailing | (0.12 | )% | 0.18 | % | 3.49 | % | |||||||||
| Energy | (0.01 | )% | 0.00 | % | 9.84 | % | |||||||||
| Utilities | 0.00 | % | 0.00 | % | 3.39 | % | |||||||||
Janus Aspen Series December 31, 2006 3
Janus Aspen Global Life Sciences Portfolio (unaudited)
5 Largest Equity Holdings – (% of Net Assets)
As of December 31, 2006
| Roche Holding A.G. Medical - Drugs | 5.3 | % | |||||
| United Therapeutics Corp. Therapeutics | 4.0 | % | |||||
| Celgene Corp. Medical - Biomedical And Genetic | 3.9 | % | |||||
| Gilead Sciences, Inc. Therapeutics | 3.6 | % | |||||
| Alexion Pharmaceuticals, Inc. Medical - Biomedical And Genetic | 3.4 | % | |||||
| 20.2 | % | ||||||
Asset Allocation – (% of Net Assets)
As of December 31, 2006

Emerging markets comprised 1.0% of total net assets.
Top Country Allocations – (% of Investment Securities)
| As of December 31, 2006 | As of December 31, 2005 | ||||||
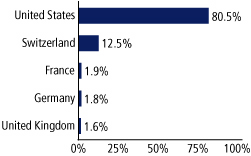 | 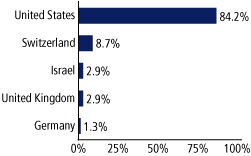 | ||||||
4 Janus Aspen Series December 31, 2006
(unaudited)
Performance

Average Annual Total Return – for the periods ended December 31, 2006
| One Year | Five Year | Since Inception* | |||||||||||||
| Janus Aspen Global Life Sciences Portfolio - Institutional Shares | 6.60 | % | 4.17 | % | (0.64 | )% | |||||||||
| Janus Aspen Global Life Sciences Portfolio - Service Shares | 6.33 | % | 3.94 | % | (0.89 | )% | |||||||||
| S&P 500® Index | 15.80 | % | 6.19 | % | 1.27 | % | |||||||||
| Morgan Stanley Capital International World Health Care IndexSM | 10.47 | % | 4.58 | % | 4.64 | %** | |||||||||
| Lipper Quartile - Institutional Shares | 2 | nd | 3 | rd | 3 | rd | |||||||||
| Lipper Ranking - Institutional Shares based on total returns for Variable Annuity Health/Biotechnology Funds | 10/29 | 13/20 | 3/4 | ||||||||||||
Data presented represents past performance, which is no guarantee of future results. Investment results and principal value will fluctuate so that shares, when redeemed, may be worth more or less than their original cost. Due to market volatility, current performance may be higher or lower than the performance shown. Call 877.33JANUS or visit www.janus.com/info for performance current to the most recent month-end.
See Notes to Schedule of Investments for index definitions.
Total return includes reinvestment of dividends from net investment income and distributions from capital gains. Net dividends reinvested are the dividends that remain to be reinvested after foreign tax obligations have been met. Such obligations vary from country to country. The returns shown do not reflect the deduction of taxes that a shareholder would pay on Portfolio distributions or the redemption of Portfolio shares.
The Portfolio may differ significantly from the securities held in the indices. The indices are not available for direct investment; therefore their performance does not reflect the expenses associated with the active management of an actual Portfolio.
These returns do not reflect the charges and expenses of any particular insurance product or qualified plan. Returns shown would have been lower had they included insurance charges.
This Portfolio concentrates in certain industry groups, which may react similarly to market developments (resulting in greater price volatility), and may have significant exposure to foreign markets (which include risks such as currency fluctuation and political uncertainty).
There is no assurance that the investment process will consistently lead to successful investing.
Lipper Inc. - A Reuters Company, is a nationally recognized organization that ranks the performance of mutual funds within a universe of funds that have similar investment objectives. Rankings are historical with capital gains and dividends reinvested.
The Portfolio's performance may be affected by risks that include those associated with nondiversification, non-investment grade debt securities, undervalued or overlooked companies, investments in specific industries or countries and potential conflicts of interest with Janus Smart Portfolios. Additional risks to the Portfolio may include those associated with investing in foreign securities, emerging markets, initial public offerings, derivatives and companies with relatively small market capitalizations. Please see a Janus prospectus or www.janus.com/info for more information about risk, fund holdings and details.
The date of the since-inception Lipper ranking is slightly different from when the Portfolio began operations since Lipper provides fund rankings as of the last day of the month or the first Thursday after fund inception.
Ranking is for the Institutional share class only; other classes may have different performance characteristics.
The Portfolio will invest at least 80% of its net assets in the type of securities described by its name.
Janus Capital has contractually agreed to waive the Portfolio's total operating expenses to the levels indicated in the prospectus until at least May 1, 2008. Total returns shown include fee waivers, if any, and without such waivers total returns would have been lower.
See "Explanations of Charts, Tables and Financial Statements."
* The Portfolio's inception date – January 18, 2000
** The Morgan Stanley Capital International World Health Care IndexSM since inception returns calculated from January 31, 2000
Portfolio Expenses
The example below shows you the ongoing costs (in dollars) of investing in your Portfolio and allows you to compare these costs with those of other mutual funds. Please refer to page 1 for a detailed explanation of the information presented in these charts.
| Expense Example - Institutional Shares | Beginning Account Value (7/1/06) | Ending Account Value (12/31/06) | Expenses Paid During Period (7/1/06-12/31/06) * | ||||||||||||
| Actual | $ | 1,000.00 | $ | 1,023.60 | $ | 5.81 | |||||||||
| Hypothetical (5% return before expenses) | $ | 1,000.00 | $ | 1,019.46 | $ | 5.80 | |||||||||
| Expense Example - Service Shares | Beginning Account Value (7/1/06) | Ending Account Value (12/31/06) | Expenses Paid During Period (7/1/06-12/31/06) * | ||||||||||||
| Actual | $ | 1,000.00 | $ | 1,022.90 | $ | 7.09 | |||||||||
| Hypothetical (5% return before expenses) | $ | 1,000.00 | $ | 1,018.20 | $ | 7.07 | |||||||||
*Expenses are equal to the annualized expense ratio of 1.14% for Institutional Shares and 1.39% for Service Shares, multiplied by the average account value over the period, multiplied by 184/365 (to reflect the one-half year period). Expenses may include effect of contractual waivers by Janus Capital.
Janus Aspen Series December 31, 2006 5
Janus Aspen Global Life Sciences Portfolio
Schedule of Investments
As of December 31, 2006
| Shares or Principal Amount | Value | ||||||||||
| Common Stock – 97.2% | |||||||||||
| Agricultural Chemicals - 3.0% | |||||||||||
| 4,849 | Syngenta A.G.*,** | $ | 902,149 | ||||||||
| Cellular Telecommunications - 0.7% | |||||||||||
| 4,935 | Hikari Tsushin, Inc. | 216,882 | |||||||||
| Diagnostic Kits - 2.1% | |||||||||||
| 15,660 | Dade Behring Holdings, Inc. | 623,425 | |||||||||
| Drug Delivery Systems - 2.6% | |||||||||||
| 22,455 | Hospira, Inc.* | 754,039 | |||||||||
| Medical - Biomedical and Genetic - 21.4% | |||||||||||
| 62,510 | Acorda Therapeutics, Inc.*,** | 990,158 | |||||||||
| 15,996 | Advanced Magnetics, Inc.* | 955,281 | |||||||||
| 1,230 | Affymax, Inc.* | 41,869 | |||||||||
| 25,155 | Alexion Pharmaceuticals, Inc.* | 1,016,011 | |||||||||
| 7,435 | Amgen, Inc.* | 507,885 | |||||||||
| 20,015 | Celgene Corp.* | 1,151,464 | |||||||||
| 22,430 | Exelixis, Inc.* | 201,870 | |||||||||
| 37,480 | Fibrogen, Inc.*,oo,§ | 281,100 | |||||||||
| 6,695 | Genentech, Inc.* | 543,165 | |||||||||
| 5,535 | Genzyme Corp.* | 340,845 | |||||||||
| 9,345 | Vertex Pharmaceuticals, Inc.* | 349,690 | |||||||||
| 6,379,338 | |||||||||||
| Medical - Drugs - 25.2% | |||||||||||
| 9,650 | Achillion Pharmaceuticals, Inc.* | 155,558 | |||||||||
| 11,455 | Adams Respiratory Therapeutics, Inc.* | 467,479 | |||||||||
| 39,570 | Adolor Corp.* | 297,566 | |||||||||
| 21,685 | Cubist Pharmaceuticals, Inc.* | 392,715 | |||||||||
| 6,510 | Eli Lilly and Co. | 339,171 | |||||||||
| 21,195 | K-V Pharmaceutical Co. - Class A* | 504,017 | |||||||||
| 21,020 | Merck & Company, Inc. | 916,472 | |||||||||
| 12,465 | New River Pharmaceuticals, Inc.* | 681,960 | |||||||||
| 12,320 | Novartis A.G.** | 710,283 | |||||||||
| 8,747 | Roche Holding A.G.** | 1,568,503 | |||||||||
| 6,049 | Sanofi-Aventis** | 558,547 | |||||||||
| 9,117 | Stada Arzneimittel A.G.** | 521,350 | |||||||||
| 7,615 | Wyeth | 387,756 | |||||||||
| 7,501,377 | |||||||||||
| Medical - Generic Drugs - 1.0% | |||||||||||
| 9,895 | Teva Pharmaceutical Industries, Ltd. (ADR) | 307,537 | |||||||||
| Medical - HMO - 7.0% | |||||||||||
| 17,012 | Coventry Health Care, Inc.* | 851,451 | |||||||||
| 11,325 | UnitedHealth Group, Inc. | 608,492 | |||||||||
| 7,925 | WellPoint, Inc.* | 623,618 | |||||||||
| 2,083,561 | |||||||||||
| Medical - Nursing Homes - 1.8% | |||||||||||
| 11,680 | Manor Care, Inc. | 548,026 | |||||||||
| Medical - Wholesale Drug Distributors - 1.7% | |||||||||||
| 7,615 | Cardinal Health, Inc. | 490,634 | |||||||||
| Medical Instruments - 3.0% | |||||||||||
| 6,440 | Medtronic, Inc. | 344,604 | |||||||||
| 15,090 | St. Jude Medical, Inc.* | 551,691 | |||||||||
| 896,295 | |||||||||||
| Medical Products - 1.7% | |||||||||||
| 10,665 | Varian Medical Systems, Inc.* | 507,334 | |||||||||
| Optical Supplies - 1.7% | |||||||||||
| 4,430 | Alcon, Inc. (U.S. Shares)** | 495,141 | |||||||||
| Shares or Principal Amount | Value | ||||||||||
| Pharmacy Services – 4.2% | |||||||||||
| 10,335 | Caremark Rx, Inc. | $ | 590,232 | ||||||||
| 12,435 | Medco Health Solutions, Inc.* | 664,526 | |||||||||
| 1,254,758 | |||||||||||
| Physical Therapy and Rehabilitation Centers - 1.3% | |||||||||||
| 16,462 | HEALTHSOUTH Corp.* | 372,864 | |||||||||
| Respiratory Products - 1.8% | |||||||||||
| 13,900 | Respironics, Inc.* | 524,725 | |||||||||
| Retail - Drug Store - 1.8% | |||||||||||
| 16,920 | CVS Corp. | 522,997 | |||||||||
| Soap and Cleaning Preparations - 1.6% | |||||||||||
| 10,163 | Reckitt Benckiser PLC** | 464,442 | |||||||||
| Therapeutics - 13.6% | |||||||||||
| 8,740 | Amylin Pharmaceuticals, Inc.* | 315,252 | |||||||||
| 16,550 | Gilead Sciences, Inc.* | 1,074,591 | |||||||||
| 19,910 | Mannkind Corp.* | 328,316 | |||||||||
| 27,150 | MGI Pharma, Inc.* | 499,832 | |||||||||
| 37,795 | Neurocrine Biosciences, Inc.* | 393,824 | |||||||||
| 61,815 | Nuvelo, Inc.* | 247,260 | |||||||||
| 21,680 | United Therapeutics Corp.* | 1,178,741 | |||||||||
| 4,037,816 | |||||||||||
| Total Common Stock (cost $24,684,321) | 28,883,340 | ||||||||||
| Preferred Stock - 1.5% | |||||||||||
| Medical - Biomedical and Genetic - 0.3% | |||||||||||
| 21,203 | Cougar Biotechnology, Inc.oo,§ | 95,498 | |||||||||
| Medical - Generic Drugs - 0.8% | |||||||||||
| 267,733 | Mediquest Therapeuticsoo,§ | 240,960 | |||||||||
| Medical Instruments - 0.4% | |||||||||||
| 1,437,443 | GMP Companies, Inc.oo,§ | 126,782 | |||||||||
| Total Preferred Stock (cost $381,269) | 463,240 | ||||||||||
| Warrants - 0.2% | |||||||||||
| Medical - Generic Drugs - 0.1% | |||||||||||
| 64,229 | Mediquest Therapeutics - expires 6/15/11oo,§ | 19,269 | |||||||||
| Medical Instruments - 0.1% | |||||||||||
| 119,524 | GMP Companies, Inc. - expires 6/1/11(144A)oo,§ | 5,737 | |||||||||
| 697,819 | GMP Companies, Inc. - expires 6/1/11oo,§ | 15,352 | |||||||||
| 21,089 | |||||||||||
| Total Warrants (cost $0) | 40,358 | ||||||||||
| Money Markets - 0.1% | |||||||||||
| 25,459 | Janus Institutional Cash Reserves Fund 5.29% (cost $25,459) | 25,459 | |||||||||
| Total Investments (total cost $25,091,049) – 99.0% | 29,412,397 | ||||||||||
| Securities Sold Short – (0.5)% | |||||||||||
| Pharmacy Services – (0.5)% | |||||||||||
| 2,205 | Express Scripts, Inc. - Class A* (proceeds $151,510) | (157,878 | ) | ||||||||
| Cash, Receivables and Other Assets, net of Liabilities – 1.5% | 461,626 | ||||||||||
| Net Assets – 100.0% | $ | 29,716,145 | |||||||||
See Notes to Schedules of Investments and Financial Statements.
6 Janus Aspen Series December 31, 2006
Schedule of Investments
As of December 31, 2006
Summary of Investments by Country
| Country | Value | % of Investment Securities | |||||||||
| France | $ | 558,547 | 1.9 | % | |||||||
| Germany | 521,350 | 1.8 | % | ||||||||
| Israel | 307,537 | 1.0 | % | ||||||||
| Japan | 216,882 | 0.7 | % | ||||||||
| Switzerland | 3,676,076 | 12.5 | % | ||||||||
| United Kingdom | 464,442 | 1.6 | % | ||||||||
| United States †† | 23,667,563 | 80.5 | % | ||||||||
| Total | $ | 29,412,397 | 100.0 | % | |||||||
| †† Includes Short-Term Securities (80.4% excluding Short-Term Securities) | |||||||||||
Forward Currency Contracts, Open
| Currency Sold and Settlement Date | Currency Units Sold | Currency Value in $ U.S. | Unrealized Gain/(Loss) | ||||||||||||
| British Pound 3/14/07 | 57,100 | $ | 111,815 | $ | (6,127 | ) | |||||||||
| Euro 3/15/07 | 195,000 | 258,265 | (11,872 | ) | |||||||||||
| Swiss Franc 1/11/07 | 620,000 | 509,525 | (285 | ) | |||||||||||
| Swiss Franc 3/14/07 | 370,000 | 305,808 | (3,187 | ) | |||||||||||
| Total | $ | 1,185,413 | $ | (21,471 | ) | ||||||||||
See Notes to Schedules of Investments and Financial Statements.
Janus Aspen Series December 31, 2006 7
Statement of Assets and Liabilities
| As of December 31, 2006 (all numbers in thousands except net asset value per share) | Janus Aspen Global Life Sciences Portfolio | ||||||
| Assets: | |||||||
| Investments at cost | $ | 25,091 | |||||
| Investments at value | $ | 29,412 | |||||
| Cash | 425 | ||||||
| Deposits with broker for short sales | 151 | ||||||
| Receivables: | |||||||
| Dividends | 16 | ||||||
| Interest | 2 | ||||||
| Other assets | 1 | ||||||
| Total Assets | 30,007 | ||||||
| Liabilities: | |||||||
| Payables: | |||||||
| Short sales, at value (proceeds $151) | 158 | ||||||
| Investments purchased | 7 | ||||||
| Portfolio shares repurchased | 40 | ||||||
| Advisory fees | 17 | ||||||
| Transfer agent fees and expenses | 1 | ||||||
| Distribution fees - Service Shares | 6 | ||||||
| Non-interested Trustees' fees and expenses | 1 | ||||||
| Professional fees | 15 | ||||||
| Printing expense | 15 | ||||||
| Accrued expenses | 10 | ||||||
| Forward currency contracts | 21 | ||||||
| Total Liabilities | 291 | ||||||
| Net Assets | $ | 29,716 | |||||
| Net Assets Consist of: | |||||||
| Capital (par value and paid-in-surplus)* | $ | 31,742 | |||||
| Undistributed net investment income/(loss)* | – | ||||||
| Undistributed net realized gain/(loss) from investments and foreign currency transactions* | (6,320 | ) | |||||
| Unrealized net appreciation/(depreciation) of investments and foreign currency translations | 4,294 | ||||||
| Total Net Assets | $ | 29,716 | |||||
| Net Assets - Institutional Shares | $ | 3,428 | |||||
| Shares Outstanding, $0.001 Par Value (unlimited shares authorized) | 360 | ||||||
| Net Asset Value Per Share | $ | 9.53 | |||||
| Net Assets - Service Shares | $ | 26,288 | |||||
| Shares Outstanding, $0.001 Par Value (unlimited shares authorized) | 2,797 | ||||||
| Net Asset Value Per Share | $ | 9.40 | |||||
* See Note 3 in Notes to Financial Statements.
See Notes to Financial Statements.
8 Janus Aspen Series December 31, 2006
Statement of Operations
| For the fiscal year ended December 31, 2006 (all numbers in thousands) | Janus Aspen Global Life Sciences Portfolio | ||||||
| Investment Income: | |||||||
| Interest | $ | 17 | |||||
| Dividends | 189 | ||||||
| Dividends from affiliates | 13 | ||||||
| Foreign tax withheld | (8 | ) | |||||
| Total Investment Income | 211 | ||||||
| Expenses: | |||||||
| Advisory fees | 219 | ||||||
| Transfer agent expenses | 4 | ||||||
| Registration fees | 4 | ||||||
| Custodian fees | 16 | ||||||
| Professional fees | 22 | ||||||
| Non-interested Trustees' fees and expenses | 5 | ||||||
| Distribution fees - Service Shares | 76 | ||||||
| Printing expenses | 45 | ||||||
| Proxy expenses | 9 | ||||||
| System fees | 36 | ||||||
| Other expenses | 17 | ||||||
| Non-recurring costs (Note 2) | – | ||||||
| Costs assumed by Janus Capital Management LLC (Note 2) | – | ||||||
| Total Expenses | 453 | ||||||
| Expense and Fee Offset | (1 | ) | |||||
| Net Expenses | 452 | ||||||
| Net Investment Income/(Loss) | (241 | ) | |||||
| Net Realized and Unrealized Gain/(Loss) on Investments: | |||||||
| Net realized gain/(loss) from securities transactions | 7,759 | ||||||
| Net realized gain/(loss) from foreign currency transactions | 13 | ||||||
| Net realized gain/(loss) from short sales | (21 | ) | |||||
| Net realized gain/(loss) from option contracts | (35 | ) | |||||
| Change in unrealized net appreciation/(depreciation) of investments and foreign currency translations | (5,322 | ) | |||||
| Net Gain/(Loss) on Investments | 2,394 | ||||||
| Net Increase/(Decrease) in Net Assets Resulting from Operations | $ | 2,153 | |||||
See Notes to Financial Statements.
Janus Aspen Series December 31, 2006 9
Statements of Changes in Net Assets
| For the fiscal year ended December 31 | Janus Aspen Global Life Sciences Portfolio | ||||||||||
| (all numbers in thousands) | 2006 | 2005 | |||||||||
| Operations: | |||||||||||
| Net investment income/(loss) | $ | (241 | ) | $ | (258 | ) | |||||
| Net realized gain/(loss) from investment and foreign currency transactions | 7,772 | 3,639 | |||||||||
| Net realized gain/(loss) from short sales | (21 | ) | – | ||||||||
| Net realized gain/(loss) from option contracts | (35 | ) | – | ||||||||
| Change in unrealized net appreciation/(depreciation) of investments and foreign currency translations | (5,322 | ) | 671 | ||||||||
| Net Increase/(Decrease) in Net Assets Resulting from Operations | 2,153 | 4,052 | |||||||||
| Dividends and Distributions to Shareholders: | |||||||||||
| Net investment income* | |||||||||||
| Institutional Shares | – | – | |||||||||
| Service Shares | – | – | |||||||||
| Net realized gain from investment transactions* | |||||||||||
| Institutional Shares | – | – | |||||||||
| Service Shares | – | – | |||||||||
| Net Decrease from Dividends and Distributions | – | – | |||||||||
| Capital Share Transactions: | |||||||||||
| Shares sold | |||||||||||
| Institutional Shares | 985 | 486 | |||||||||
| Service Shares | 4,698 | 6,591 | |||||||||
| Reinvested dividends and distributions | |||||||||||
| Institutional Shares | – | – | |||||||||
| Service Shares | – | – | |||||||||
| Shares repurchased | |||||||||||
| Institutional Shares | (1,682 | ) | (1,114 | ) | |||||||
| Service Shares | (10,839 | ) | (9,784 | ) | |||||||
| Net Increase/(Decrease) from Capital Share Transactions | (6,838 | ) | (3,821 | ) | |||||||
| Net Increase/(Decrease) in Net Assets | (4,685 | ) | 231 | ||||||||
| Net Assets: | |||||||||||
| Beginning of period | 34,401 | 34,170 | |||||||||
| End of period | $ | 29,716 | $ | 34,401 | |||||||
| Undistributed net investment income/(loss)* | $ | – | $ | – | |||||||
*See Note 3 in Notes to Financial Statements.
See Notes to Financial Statements.
10 Janus Aspen Series December 31, 2006
Financial Highlights
Institutional Shares
| For a share outstanding during each fiscal year ended December 31 | Janus Aspen Global Life Sciences Portfolio | ||||||||||||||||||||||
| 2006 | 2005 | 2004 | 2003 | 2002 | |||||||||||||||||||
| Net Asset Value, Beginning of Period | $ | 8.94 | $ | 7.94 | $ | 6.93 | $ | 5.49 | $ | 7.77 | |||||||||||||
| Income from Investment Operations: | |||||||||||||||||||||||
| Net investment income/(loss) | .05 | .03 | .02 | .02 | .02 | ||||||||||||||||||
| Net gain/(loss) on securities (both realized and unrealized) | .54 | .97 | .99 | 1.42 | (2.30 | ) | |||||||||||||||||
| Total from Investment Operations | .59 | 1.00 | 1.01 | 1.44 | (2.28 | ) | |||||||||||||||||
| Less Distributions: | |||||||||||||||||||||||
| Dividends (from net investment income)* | – | – | – | – | – | ||||||||||||||||||
| Distributions (from capital gains)* | – | – | – | – | – | ||||||||||||||||||
| Total Distributions | – | – | – | – | – | ||||||||||||||||||
| Net Asset Value, End of Period | $ | 9.53 | $ | 8.94 | $ | 7.94 | $ | 6.93 | $ | 5.49 | |||||||||||||
| Total Return | 6.60 | % | 12.59 | % | 14.57 | % | 26.23 | % | (29.34 | )% | |||||||||||||
| Net Assets, End of Period (in thousands) | $ | 3,428 | $ | 3,879 | $ | 4,088 | $ | 3,822 | $ | 3,359 | |||||||||||||
| Average Net Assets for the Period (in thousands) | $ | 3,913 | $ | 3,733 | $ | 3,998 | $ | 3,601 | $ | 4,432 | |||||||||||||
| Ratio of Gross Expenses to Average Net Assets(1) | 1.10 | % | 0.95 | % | 0.90 | % | 0.97 | % | 0.87 | % | |||||||||||||
| Ratio of Net Expenses to Average Net Assets(1) | 1.10 | % | 0.95 | % | 0.90 | % | 0.97 | % | 0.87 | % | |||||||||||||
| Ratio of Net Investment Income/(Loss) to Average Net Assets | (0.48 | )% | (0.53 | )% | (0.42 | )% | (0.34 | )% | (0.39 | )% | |||||||||||||
| Portfolio Turnover Rate | 80 | % | 89 | % | 108 | % | 110 | % | 113 | % | |||||||||||||
Service Shares
| For a share outstanding during each fiscal year ended December 31 | Janus Aspen Global Life Sciences Portfolio | ||||||||||||||||||||||
| 2006 | 2005 | 2004 | 2003 | 2002 | |||||||||||||||||||
| Net Asset Value, Beginning of Period | $ | 8.84 | $ | 7.87 | $ | 6.89 | $ | 5.46 | $ | 7.75 | |||||||||||||
| Income from Investment Operations: | |||||||||||||||||||||||
| Net investment income/(loss) | (.01 | ) | – | (2) | – | (2) | – | (2) | – | (2) | |||||||||||||
| Net gain/(loss) on securities (both realized and unrealized) | .57 | .97 | .98 | 1.43 | (2.29 | ) | |||||||||||||||||
| Total from Investment Operations | .56 | .97 | .98 | 1.43 | (2.29 | ) | |||||||||||||||||
| Less Distributions: | |||||||||||||||||||||||
| Dividends (from net investment income)* | – | – | – | – | – | ||||||||||||||||||
| Distributions (from capital gains)* | – | – | – | – | – | ||||||||||||||||||
| Total Distributions | – | – | – | – | – | ||||||||||||||||||
| Net Asset Value, End of Period | $ | 9.40 | $ | 8.84 | $ | 7.87 | $ | 6.89 | $ | 5.46 | |||||||||||||
| Total Return | 6.33 | % | 12.33 | % | 14.22 | % | 26.19 | % | (29.55 | )% | |||||||||||||
| Net Assets, End of Period (in thousands) | $ | 26,288 | $ | 30,522 | $ | 30,082 | $ | 31,282 | $ | 26,514 | |||||||||||||
| Average Net Assets for the Period (in thousands) | $ | 30,308 | $ | 30,905 | $ | 31,902 | $ | 28,604 | $ | 34,475 | |||||||||||||
| Ratio of Gross Expenses to Average Net Assets(1) | 1.35 | % | 1.20 | % | 1.15 | % | 1.22 | % | 1.12 | % | |||||||||||||
| Ratio of Net Expenses to Average Net Assets(1) | 1.35 | % | 1.20 | % | 1.15 | % | 1.22 | % | 1.12 | % | |||||||||||||
| Ratio of Net Investment Income/(Loss) to Average Net Assets | (0.73 | )% | (0.77 | )% | (0.66 | )% | (0.59 | )% | (0.63 | )% | |||||||||||||
| Portfolio Turnover Rate | 80 | % | 89 | % | 108 | % | 110 | % | 113 | % | |||||||||||||
*See Note 3 in Notes to Financial Statements.
(1) See Note 4 in Notes to Financial Statements.
(2) Net investment income/(loss) aggregated less than $.01 on a per share basis for the fiscal year ended.
See Notes to Financial Statements.
Janus Aspen Series December 31, 2006 11
Notes to Schedule of Investments
| Lipper Variable Annuity Health/Biotechnology Funds | Funds that invest primarily in the equity securities of domestic and foreign companies engaged in healthcare, medicine, and biotechnology. | ||||||
| Morgan Stanley Capital International World Health Care IndexSM | The Morgan Stanley Capital International World Health Care IndexSM is a capitalization weighted index that monitors the performance of healthcare stocks from developed market countries in North America, Europe and the Asia/Pacific Region. | ||||||
| S&P 500® Index | The Standard & Poor's Composite Index of 500 stocks, a widely recognized, unmanaged index of common stock prices. | ||||||
| ADR | American Depositary Receipt | ||||||
| PLC | Public Limited Company | ||||||
| U.S. Shares | Securities of foreign companies trading on an American Stock Exchange | ||||||
| 144A | Securities sold under Rule 144A of the Securities Act of 1933 are subject to legal and/or contractual restrictions on resale and may not be publicly sold without registration under the 1933 Act. | ||||||
* Non-income-producing security.
** A portion of this security has been segregated by the custodian to cover margin or segregation requirements on open futures contracts, forward currency contracts, options contracts, short sales and/or securities with extended settlement dates.
ºº Schedule of Fair Valued Securities (as of December 31, 2006)
| Value | Value as % of Net Assets | ||||||||||
| Janus Aspen Global Life Sciences Portfolio | |||||||||||
| Cougar Technology, Inc. | $ | 95,498 | 0.3 | % | |||||||
| Fibrogen, Inc. | 281,100 | 0.9 | % | ||||||||
| GMP Companies, Inc. | 126,782 | 0.4 | % | ||||||||
| GMP Companies, Inc. - expires 6/1/11 | 15,352 | 0.1 | % | ||||||||
| GMP Companies, Inc. - expires 6/1/11 (144A) | 5,737 | 0.0 | % | ||||||||
| Mediquest Therapeutics - expires 6/15/11 | 19,269 | 0.1 | % | ||||||||
| Mediquest Therapeutics | 240,960 | 0.8 | % | ||||||||
| $ | 784,698 | 2.6 | % | ||||||||
Securities are valued at "fair value" pursuant to procedures adopted by the Portfolio's Trustees. The Schedule of Fair Valued Securities does not include international activities fair valued pursuant to a systematic fair valuation model.
§Schedule of Restricted and Illiquid Securities (as of December 31, 2006)
| Acquisition Date | Acquisition Cost | Value | Value as % of Net Assets | ||||||||||||||||
| Janus Aspen Global Life Sciences Portfolio | |||||||||||||||||||
| Cougar Biotechnology, Inc.ºº | 3/31/06 | $ | 95,496 | $ | 95,498 | 0.3 | % | ||||||||||||
| Fibrogen, Inc.ºº | 12/28/04 - 11/08/05 | 170,534 | 281,100 | 0.9 | % | ||||||||||||||
| GMP Companies, Inc.ºº | 5/31/06 - 10/4/06 | 125,133 | 126,782 | 0.4 | % | ||||||||||||||
| GMP Companies, Inc. - expires 6/1/11ºº | 5/31/06 - 10/4/06 | – | 15,352 | 0.1 | % | ||||||||||||||
| GMP Companies, Inc. - expires 6/1/11 (144A)ºº | 5/31/06 | – | 5,737 | 0.0 | % | ||||||||||||||
| Mediquest Therapeuticsºº | 5/11/06 - 6/15/06 | 160,640 | 240,960 | 0.8 | % | ||||||||||||||
| Mediquest Therapeutics - expires 6/15/11ºº | 5/11/06 - 6/15/06 | – | 19,269 | 0.1 | % | ||||||||||||||
| $ | 551,803 | $ | 784,698 | 2.6 | % | ||||||||||||||
The Portfolio has registration rights for certain restricted securities held as of December 31, 2006. The issuer incurs all registration costs.
Aggregate collateral segregated to cover margin or segregation requirements on open futures contracts, forward currency contracts, options contracts, short sales and/or securities with extended settlement dates as of December 31, 2006 are noted below.
| Portfolio | Aggregate Value | ||||||
| Janus Aspen Global Life Sciences Portfolio | $ | 5,375,646 | |||||
12 Janus Aspen Series December 31, 2006
Notes to Financial Statements
The following section describes the organization and significant accounting policies and provides more detailed information about the schedules and tables that appear throughout this report. In addition, the Notes to Financial Statements explain the methods used in preparing and presenting this report.
1. ORGANIZATION AND SIGNIFICANT ACCOUNTING POLICIES
Janus Aspen Global Life Sciences Portfolio (the "Portfolio") is a series fund. The Portfolio is part of Janus Aspen Series (the "Trust"), which is organized as a Delaware statutory trust and is registered under the Investment Company Act of 1940 (the "1940 Act") as an open-end management investment company. The Trust offers seventeen Portfolios, which include multiple series of shares, with differing investment objectives and policies. The Portfolio invests primarily in equity securities. The Portfolio is classified as diversified, as defined in the 1940 Act. The Portfolio is a no-load investment.
The Portfolio currently offers two classes of shares: Institutional Shares and Service Shares. Institutional Shares are offered only in connection with investment in and payments under variable insurance contracts and to qualified retirement plans. Service Shares are offered only in connection with investment in and payments under variable insurance contracts and to qualified retirement plans that require a fee from Portfolio assets to procure distribution and administrative services to contract owners and plan participants.
The following accounting policies have been consistently followed by the Portfolio and are in conformity with accounting principles generally accepted in the United States of America in the investment company industry.
Investment Valuation
Securities are valued at the last sales price or the official closing price for securities traded on a principal securities exchange (U.S. or foreign) and on the NASDAQ National Market. Securities traded on over-the-counter markets and listed securities for which no sales are reported are valued at the latest bid price (or yield equivalent thereof) obtained from one or more dealers transacting in a market for such securities or by a pricing service approved by the Portfolio's Trustees. Short-term securities with maturities of 60 days or less may be valued at amortized cost, which approximates market value. Debt securities with a remaining maturity of greater than 60 days are valued in accordance with the evaluated bid price supplied by the pricing service. The evaluated bid price supplied by the pricing service is an evaluation that reflects such factors as security prices, yields, maturities and ratings. Foreign securities and currencies ar e converted to U.S. dollars using the applicable exchange rate in effect as of the daily close of the New York Stock Exchange ("NYSE"). When market quotations are not readily available or deemed unreliable, or events or circumstances that may affect the value of portfolio securities held by the Portfolio are identified between the closing of their principal markets and the time the net asset value ("NAV") is determined, securities may be valued at fair value as determined in good faith under procedures established by and under the supervision of the Portfolio's Trustees. The Portfolio may use a systematic fair valuation model provided by an independent third party to value international equity securities in order to adjust for stale pricing, which may occur between the close of certain foreign exchanges and the NYSE.
Investment Transactions and Investment Income
Investment transactions are accounted for as of the date purchased or sold (trade date). Dividend income is recorded on the ex-dividend date. Certain dividends from foreign securities will be recorded as soon as the Trust is informed of the dividend if such information is obtained subsequent to the ex-dividend date and may be subject to withholding taxes in these jurisdictions. Interest income is recorded on the accrual basis and includes amortization of premiums and accretion of discounts. Gains and losses are determined on the identified cost basis, which is the same basis used for federal income tax purposes. Income, as well as gains and losses, both realized and unrealized, are allocated daily to each class of shares based upon the ratio of net assets represented by each class as a percentage of total net assets.
Expenses
The Portfolio bears expenses incurred specifically on its behalf as well as a portion of general expenses. Each class of shares bears expenses incurred specifically on its behalf and, in addition, each class bears a portion of general expenses, which may be based upon relative net assets of each class. Expenses are allocated daily to each class of shares based upon the ratio of net assets represented by each class as a percentage of total net assets. Expenses directly attributable to a specific class of shares are charged against the operations of such class.
Interfund Lending
Pursuant to an exemptive order received from the SEC, the Portfolio may be party to an interfund lending agreement between the Portfolio and other Janus Capital Management LLC ("Janus Capital") sponsored mutual funds, which permits it to borrow or lend cash at a rate beneficial to both the borrowing and lending funds. Outstanding borrowings from all sources totaling 10% or more of the borrowing Portfolio's total assets must be collateralized at 102% of the outstanding principal value of the loan; loans of less than 10% may be unsecured. During the fiscal year ended December 31, there were no outstanding interfund borrowing or lending arrangements for the Portfolio.
Forward Currency Transactions
The Portfolio may enter into forward currency contracts in order to reduce its exposure to changes in foreign currency exchange rates on its foreign portfolio holdings and to lock in the U.S. dollar cost of firm purchase and sale commitments for securities denominated in or exposed to foreign currencies. A forward currency exchange contract is a commitment to purchase or sell a foreign currency at a future date at a negotiated rate. The gain or loss arising from the difference between the U.S. dollar cost of the original contract and the value of the foreign currency in U.S. dollars upon closing a contract is included in "Net realized gain/(loss) from foreign
Janus Aspen Series December 31, 2006 13
Notes to Financial Statements (continued)
currency transactions" on the Statement of Operations (if applicable).
Forward currency contracts held by the Portfolio are fully collateralized by other securities, which are denoted in the accompanying Schedule of Investments (if applicable). The collateral is evaluated daily to ensure its market value equals or exceeds the current market value of the corresponding forward currency contracts.
Futures Contracts
The Portfolio may enter into futures contracts. The Portfolio intends to use such derivative instruments primarily to hedge or protect from adverse movements in securities prices, currency rates or interest rates. The use of futures contracts may involve risks such as the possibility of illiquid markets or imperfect correlation between the value of the contracts and the underlying securities, or that the counterparty will fail to perform its obligations.
Futures contracts are marked-to-market daily, and the daily variation margin is recorded as a receivable or payable on the Statement of Assets and Liabilities (if applicable). When a contract is closed, a realized gain or loss is recorded on the Statement of Operations equal to the difference between the opening and closing value of the contract. Generally, futures contracts are marked-to-market (i.e., treated as realized and subject to distribution) for federal income tax purposes at fiscal year end. Securities designated as collateral for market value on futures contracts are noted in the Schedule of Investments. Such collateral is in the possession of the Portfolio's custodian. As of December 31, 2006, the Portfolio was not invested in futures contracts.
Options Contracts
The Portfolio may purchase or write put and call options on futures contracts or foreign currencies in a manner similar to that in which futures or forward contracts on foreign currencies will be utilized, and on portfolio securities for hedging purposes or as a substitute for an investment. The Portfolio generally invests in options to hedge against adverse movements in the value of portfolio holdings.
When an option is written, the Portfolio receives a premium and becomes obligated to sell or purchase the underlying security at a fixed price, upon exercise of the option. In writing an option, the Portfolio bears the market risk of an unfavorable change in the price of the security underlying the written option. Exercise of an option written by the Portfolio could result in the Portfolio buying or selling a security at a price different from the current market value.
When an option is exercised, the proceeds on sales for a written call option, the purchase cost for a written put option, or the cost of the security for a purchased put or call option is adjusted by the amount of premium received or paid.
Holdings designated to cover outstanding written options are noted in the Schedule of Investments (if applicable). Options written are reported as a liability on the Statement of Assets and Liabilities (if applicable). Gains and losses are reported on the Statement of Operations (if applicable). The Portfolio recognized realized losses for written options of $34,986 during the fiscal year ended December 31, 2006.
written are reported as a liability on the Statement of Assets and Liabilities (if applicable). Gains and losses are reported on the Statement of Operations (if applicable). The Portfolio recognized realized losses for written options of $34,986 during the fiscal year ended December 31, 2006.
The risk in writing a call option is that the Portfolio gives up the opportunity for profit if the market price of the security increases and the option is exercised. The risk in writing a put option is that the Portfolio may incur a loss if the market price of the security decreases and the option is exercised. The risk in buying an option is that the Portfolio pays a premium whether or not the option is exercised. The use of such instruments may involve certain additional risks as a result of unanticipated movement in the market. A lack of correlation between the value of an instrument underlying an option and the asset being hedged, or unexpected adverse price movements, could render the Portfolio's hedging strategy unsuccessful. In addition, there can be no assurance that a liquid secondary market will exist for any option purchased or sold. There is no limit to the loss that the Portfolio may recognize due to written call options.
Written option activity for the fiscal year ended December 31, 2006 was as follows:
| Call Options | Number of Options Contracts | Premiums Received | |||||||||
| Janus Aspen Global Life Sciences Portfolio | |||||||||||
| Options outstanding at January 1, 2006 | – | $ | – | ||||||||
| Options written | 31 | 14,078 | |||||||||
| Options closed | (31 | ) | (14,078 | ) | |||||||
| Options expired | – | – | |||||||||
| Options exercised | – | – | |||||||||
| Options outstanding at December 31, 2006 | – | – | |||||||||
| Put Options | Number of Options Contracts | Premiums Received | |||||||||
| Janus Aspen Global Life Sciences Portfolio | |||||||||||
| Options outstanding at January 1, 2006 | – | $ | – | ||||||||
| Options written | 41 | 15,132 | |||||||||
| Options closed | (10 | ) | (2,020 | ) | |||||||
| Options expired | (31 | ) | (13,112 | ) | |||||||
| Options exercised | – | – | |||||||||
| Options outstanding at December 31, 2006 | – | – | |||||||||
Short Sales
The Portfolio may engage in "short sales against the box." Short sales against the box involve selling either a security that the Portfolio owns, or a security equivalent in kind and amount to the security sold short that the Portfolio has the right to obtain, for delivery at a specified date in the future. The Portfolio may enter into a short sale against the box to hedge against anticipated declines in the market price of portfolio securities. If the value of the securities sold short increases prior to the scheduled delivery date, the Portfolio loses the opportunity to participate in the gain.
14 Janus Aspen Series December 31, 2006
The Portfolio may also engage in "naked" short sales. Naked short sales involve the Portfolio selling a security it does not own to a purchaser at a specified price. To complete the transaction, the Portfolio must borrow the security to deliver it to the purchaser and buy that same security in the market to return it to the lender. Although the potential for gain is limited to the difference between the price at which the Portfolio sold the security short and the cost of borrowing the security, its potential for loss could be unlimited because there is no limit to the replacement cost of the borrowed security. There is no assurance that the Portfolio will be able to close out a short position at any particular time or at an acceptable price. A gain or a loss will be recognized upon termination of a short sale. There is no limit on the size of any loss that the Portfolio may recognize upon termination of a short sale. Short sales held by the Portfolio are fully collateralized by other securities, which are denoted in the accompanying Schedule of Investments (if applicable).
Foreign Currency Translations
The Portfolio does not isolate that portion of the results of operations resulting from changes in foreign exchange rates on investments from the fluctuations arising from changes in market prices of securities held at the date of the financial statements. Net unrealized appreciation or depreciation on investments and foreign currency translation arise from changes in the value of assets and liabilities, including investments in securities held at the date of the financial statements, resulting from changes in the exchange rates and changes in market prices of securities held.
Currency gains and losses are also calculated on payables and receivables that are denominated in foreign currencies. The payables and receivables are generally related to security transactions and income.
Foreign currency-denominated assets and forward currency contracts may involve more risks than domestic transactions, including currency risk, political and economic risk, regulatory risk and market risk. Risks may arise from the potential inability of a counterparty to meet the terms of a contract and from unanticipated movements in the value of foreign currencies relative to the U.S. dollar.
When-issued Securities
The Portfolio may purchase or sell securities on a when-issued or forward commitment basis. The price of the underlying securities and date when the securities will be delivered and paid for are fixed at the time the transaction is negotiated. Losses may arise due to changes in the market value of the securities or from the inability of counterparties to meet the terms of the contract. In connection with such purchases, the Portfolio may hold liquid assets as collateral with the Portfolio's custodian sufficient to cover the purchase price. As of December 31, 2006, the Portfolio was not invested in when-issued securities.
Equity-Linked Structured Notes
The Portfolio may invest in equity-linked structured notes. Equity-linked structured notes are derivative securities which are specially designed to combine the characteristics of one or more underlying securities and their equity derivatives in a single note form. The return and/or yield or income component may be based on the performance of the underlying equity securities, an equity index, and/or option positions. Equity-linked structured notes are typically offered in limited transactions by financial institutions in either registered or nonregistered form. An investment in equity-linked structured notes creates exposure to the credit risk of the issuing financial institution, as well as to the market risk of the underlying securities. There is no guaranteed return of principal with these securities and the appreciation potential of these securities may be limited by a maximum payment or call right. In certain cases, equity-linked structured notes may be more volatile and less liquid than less complex securities or other types of fixed-income securities. Such securities may exhibit price behavior that does not correlate with other fixed-income securities. As of December 31, 2006, the Portfolio was not invested in equity-linked structured notes.
Initial Public Offerings
The Portfolio may invest in initial public offerings ("IPOs"). IPOs and other investment techniques may have a magnified performance impact on a fund with a small asset base. The Portfolio may not experience similar performance as its assets grow.
Additional Investment Risk
The Portfolio may be invested in lower-rated debt securities that have a higher risk of default or loss of value since these securities may be sensitive to economic changes, political changes or adverse developments specific to the issuer.
Restricted Security Transactions
Restricted securities held by the Portfolio may not be sold except in exempt transactions or in a public offering registered under the Securities Act of 1933. The risk of investing in such securities is generally greater than the risk of investing in the securities of widely held, publicly traded companies. Lack of a secondary market and resale restrictions may result in the inability of the Portfolio to sell a security at a fair price and may substantially delay the sale of the security. In addition, these securities may exhibit greater price volatility than securities for which secondary markets exist.
Dividend Distributions
The Portfolio generally makes semiannual distributions of substantially all of its investment income and an annual distribution of its net realized capital gains (if any). The majority of dividends and net realized capital gains distributions from the Portfolio may be automatically reinvested into additional shares of the Portfolio, based upon the discretion of the shareholder.
Estimates
The preparation of financial statements in conformity with accounting principles generally accepted in the United States of America requires management to make estimates and assumptions that affect the reported amount of assets and liabilities and disclosure of contingent assets and liabilities at the date of the financial statements and the reported amounts
Janus Aspen Series December 31, 2006 15
Notes to Financial Statements (continued)
of income and expenses during the reporting period. Actual results could differ from those estimates.
Federal Income Taxes
No provision for income taxes is included in the accompanying financial statements, as the Portfolio intends to distribute to shareholders all taxable investment income and realized gains and otherwise comply with Subchapter M of the Internal Revenue Code applicable to regulated investment companies.
New Accounting Pronouncements
In July 2006, the Financial Accounting Standards Board ("FASB") issued Interpretation No. 48, "Accounting for Uncertainty in Income Taxes – an Interpretation of FASB Statement No. 109" (the "Interpretation"). The Interpretation establishes for all entities, including pass-through entities such as the Portfolio, a minimum threshold for financial statement recognition of the benefit of positions taken in filing tax returns (including whether an entity is taxable in a particular jurisdiction), and requires certain expanded tax disclosures. A calendar year open-end or closed-end fund would implement the Interpretation no later than June 29, 2007 (the last business day of the semi-annual reporting period) and will also apply to all open tax years as of the date of effectiveness. Management has recently begun to evaluate the application of the Interpretation to the Portfolio, and is not in a position at this time to estimate the significance of its impact, if any, on the Portfolio's financial statements.
In September 2006, the FASB issued Statement of Financial Accounting Standards No. 157, "Fair Value Measurements" ("SFAS No. 157"), which defines fair value, establishes a framework for measuring fair value in generally accepted accounting principles, and expands disclosures about fair value measurements. SFAS No. 157 does not require new fair value measurements, but is applied to the extent that other accounting pronouncements require or permit fair value measurements. SFAS No. 157 emphasizes that fair value is a market-based measurement that should be determined based on the assumptions that market participants would use in pricing an asset or liability. Companies will be required to disclose the extent to which fair value is used to measure assets and liabilities, the inputs used to develop the measurements, and the effect for fiscal years beginning after November 15, 2007. Management is currently evaluating the potential impact the adopt ion of SFAS No. 157 will have on the Portfolio's financial condition and results of operations.
2. INVESTMENT ADVISORY AGREEMENTS AND OTHER TRANSACTIONS WITH AFFILIATES
The Portfolio pays a monthly advisory fee to Janus Capital based upon average daily net assets and calculated at the annual rate of 0.64%.
Janus Capital has agreed until at least May 1, 2008 to reimburse the Portfolio by the amount, if any, that the normal operating expenses in any fiscal year, including the investment advisory fee but excluding the distribution and shareholder servicing (12b-1) fees applicable to Service Shares, brokerage commissions, interest, taxes and extraordinary expenses, exceed an annual rate of 1.24% of the average daily net assets of the Portfolio. The Portfolio is not required to repay any such waived fees in future years to Janus Capital.
Janus Services LLC ("Janus Services"), a wholly-owned subsidiary of Janus Capital, is the Portfolio's transfer agent. Janus Services receives certain out-of-pocket expenses for transfer agent services.
Certain officers of the Portfolio may also be officers and/or directors of Janus Capital. Such officers receive no compensation from the Portfolio, except for the Portfolio's Chief Compliance Officer. Effective January 1, 2006, the Portfolio began reimbursing the adviser for a portion of the compensation paid to the Chief Compliance Officer of the Trust. Total compensation of $50 was paid by the Portfolio during the fiscal year ended December 31, 2006. The Portfolio's portion is reported as part of "Other Expenses" on the Statement of Operations.
The Board of Trustees has adopted a deferred compensation plan (the "Deferred Plan") for independent Trustees to elect to defer receipt of all or a portion of the annual compensation they are entitled to receive from the Portfolio. All deferred fees are credited to an account established in the name of the Trustees. The amounts credited to the account then increase or decrease, as the case may be, in accordance with the performance of one or more of the Janus funds that are selected by the Trustees. The account balance continues to fluctuate in accordance with the performance of the selected fund or funds until final payment of all amounts credited to the account. Trustees are allowed to change their designation of mutual funds from time to time. Amounts will be deferred until distributed in accordance to the Deferred Plan. No deferred fees were paid to any Trustee under the Deferred Plan during the fiscal year ended December 31, 2006.
For the fiscal year ended December 31, 2006. Janus Capital assumed $21,288 of legal, consulting and Trustee costs and fees incurred by the funds in Janus Investment Fund, Janus Aspen Series and Janus Adviser Series (the "Funds") in connection with the regulatory and civil litigation matters discussed in Note 7. These non-recurring costs were allocated to all Funds based upon the Funds' respective net assets as of July 31, 2004. Additionally, all future non-recurring costs will be allocated based upon the Funds' respective net assets on July 31, 2004. These non-recurring costs and costs assumed by Janus Capital are shown on the Statement of Operations.
Janus Distributors LLC, a wholly-owned subsidiary of Janus Capital, is a distributor of the Portfolio. Service Shares have adopted a Distribution and Shareholder Servicing Plan (the "Plan") pursuant to Rule 12b-1 under The 1940 Act. The Plan authorizes payments by the Portfolio in connection with the distribution of Service Shares at an annual rate of up to 0.25% of Service Shares' average daily net assets.
The Portfolio's expenses may be reduced by expense offsets from an unaffiliated custodian and/or transfer agent. Such credits or offsets are included in Expense and Fee Offset on the Statement of Operations. The transfer agent fee offsets
16 Janus Aspen Series December 31, 2006
received during the period reduce Transfer Agent Fees and Expenses. Custodian offsets received reduce Custodian Fees. The Portfolio could have employed the assets used by the custodian and/or transfer agent to produce income if it had not entered into an expense offset arrangement.
The Portfolio may invest in money market funds, including funds managed by Janus Capital. During the fiscal year ended December 31, 2006, the Portfolio recorded distributions from affiliated investment companies as affiliated dividend income, and had the following affiliated purchases and sales:
| Purchases Shares/Cost | Sales Shares/Cost | Dividend Income | Value at 12/31/06 | ||||||||||||||||
| Janus Aspen Global Life Sciences Portfolio | |||||||||||||||||||
| Janus Government Money Market Fund | $ | 1,582,121 | $ | 1,582,121 | $ | 1,146 | $ | – | |||||||||||
| Janus Institutional Cash Reserves Fund | 4,369,757 | 4,344,298 | 8,118 | 25,459 | |||||||||||||||
| Janus Money Market Fund | 2,038,140 | 2,038,140 | 3,562 | – | |||||||||||||||
| $ | 7,990,018 | $ | 7,964,559 | $ | 12,826 | $ | 25,459 | ||||||||||||
3. FEDERAL INCOME TAX
The tax components of capital shown in the table below represent: (1) distribution requirements the Portfolio must satisfy under the income tax regulations; (2) losses or deductions the Portfolio may be able to offset against income and gains realized in future years; and (3) unrealized appreciation or depreciation of investments for federal income tax purposes.
Other book to tax differences in the current year primarily consist of foreign currency contract adjustments. The Portfolio has elected to treat gains and losses on forward foreign currency contracts as capital gains and losses. Other foreign currency gains and losses on debt instruments are treated as ordinary income for federal income tax purposes pursuant to Section 988 of the Internal Revenue Code.
Accumulated capital losses noted below represent net capital loss carryovers, as of December 31, 2006, that may be available to offset future realized capital gains and thereby reduce future taxable gains distributions.
| Portfolio | Undistributed Ordinary Income | Undistributed Long–Term Gains | Accumulated Capital Losses | Post-October Deferral | Other Book to Tax Differences | Net Tax Appreciation/ (Depreciation) | |||||||||||||||||||||
| Janus Aspen Global Life Sciences Portfolio | $ | – | $ | – | $ | (6,071,316 | ) | $ | – | $ | (5,963 | ) | $ | 4,051,156 | |||||||||||||
The table below shows the expiration dates of the carryovers.
| Capital Loss Carryover Expiration Schedule For the year ended December 31, 2006 | |||||||||||
| Portfolio | December 31, 2010 | December 31, 2011 | |||||||||
| Janus Aspen Global Life Sciences Portfolio | $ | (4,184,718 | ) | $ | (1,886,598 | ) | |||||
During the year ended December 31, 2006, the following capital loss carryover was utilized by the Portfolio as indicated in the table below.
| Portfolio | Capital Loss Carryover Utilized | ||||||
| Janus Aspen Global Life Sciences Portfolio | $ | 7,509,230 | |||||
The aggregate cost of investments and the composition of unrealized appreciation and depreciation of investment securities for federal income tax purposes as of December 31, 2006 are noted below.
Unrealized appreciation and unrealized depreciation in the table below exclude appreciation/depreciation on foreign currency translations. The primary difference between book and tax appreciation or depreciation of investments is wash sale loss deferrals.
| Portfolio | Federal Tax Cost | Unrealized Appreciation | Unrealized (Depreciation) | ||||||||||||
| Janus Aspen Global Life Sciences Portfolio | $ | 25,361,241 | $ | 5,904,718 | $ | (1,853,562 | ) | ||||||||
Janus Aspen Series December 31, 2006 17
Notes to Financial Statements (continued)
Income and capital gains distributions are determined in accordance with income tax regulations that may differ from accounting principles generally accepted in the United States of America. These differences are due to differing treatments for items such as net short-term gains, deferral of wash sale losses, foreign currency transactions, net investment losses and capital loss carryovers. Certain permanent differences such as tax returns of capital and net investment losses noted below have been reclassified to paid-in capital.
| For the fiscal year ended December 31, 2006 | Distributions | ||||||||||||||||||
| Portfolio | From Ordinary Income | From Long-Term Capital Gains | Tax Return of Capital | Net Investment Loss | |||||||||||||||
| Janus Aspen Global Life Sciences Portfolio | $ | – | $ | – | $ | – | $ | (240,433 | ) | ||||||||||
| For the fiscal year ended December 31, 2005 | Distributions | ||||||||||||||||||
| Portfolio | From Ordinary Income | From Long-Term Capital Gains | Tax Return of Capital | Net Investment Loss | |||||||||||||||
| Janus Aspen Global Life Sciences Portfolio | $ | – | $ | – | $ | – | $ | (257,623 | ) | ||||||||||
4. EXPENSE RATIOS
The expense ratios listed in the Financial Highlights reflect expenses prior to any expense offsets (gross expense ratio) and after expense offsets (net expense ratio). Both expense ratios reflect expenses after waivers (reimbursement). Listed below are the gross expense ratios for the Portfolio that would be in effect, absent the waiver of certain fees and offsets.
| For each fiscal year ended December 31 | |||||||||||||||||||||||||||||||||||||||||||
| Institutional Shares | Service Shares | ||||||||||||||||||||||||||||||||||||||||||
| Portfolio | 2006(1) | 2005(1) | 2004(1) | 2003 | 2002 | 2006(1) | 2005(1) | 2004(1) | 2003 | 2002 | |||||||||||||||||||||||||||||||||
| Janus Aspen Global Life Sciences Portfolio | 1.10 | % | 0.95 | % | 0.90 | % | 0.97 | % | 0.87 | % | 1.35 | % | 1.20 | % | 1.15 | % | 1.22 | % | 1.12 | % | |||||||||||||||||||||||
(1) The effect of non-recurring costs assumed by Janus Capital (Note 2) is included in the ratio of operating expenses to average net assets without waivers and/or expense reimbursements and was less than 0.01%.
5. CAPITAL SHARE TRANSACTIONS
| For the fiscal year ended December 31 | Janus Aspen Global Life Sciences Portfolio | ||||||||||
| (all numbers are in thousands) | 2006 | 2005 | |||||||||
| Transactions in Portfolio Shares – Institutional Shares | |||||||||||
| Shares sold | 101 | 58 | |||||||||
| Reinvested dividends and distributions | – | – | |||||||||
| Shares repurchased | (175 | ) | (139 | ) | |||||||
| Net Increase(Decrease) in Portfolio Shares | (74 | ) | (81 | ) | |||||||
| Shares Outstanding, Beginning of Period | 434 | 515 | |||||||||
| Shares Outstanding, End of Period | 360 | 434 | |||||||||
| Transactions in Portfolio Shares – Service Shares | |||||||||||
| Shares sold | 484 | 829 | |||||||||
| Reinvested dividends and distributions | – | – | |||||||||
| Shares repurchased | (1,141 | ) | (1,197 | ) | |||||||
| Net Increase(Decrease) in Portfolio Shares | (657 | ) | (368 | ) | |||||||
| Shares Outstanding, Beginning of Period | 3,454 | 3,822 | |||||||||
| Shares Outstanding, End of Period | 2,797 | 3,454 | |||||||||
18 Janus Aspen Series December 31, 2006
6. PURCHASES AND SALES OF INVESTMENT SECURITIES
For the fiscal year ended December 31, 2006, the aggregate cost of purchases and proceeds from sales of investment securities (excluding short-term securities, options contracts and short sales) were as follows:
| Portfolio | Purchases of Securities | Proceeds from Sales of Securities | Purchases of Long-Term U.S. Government Obligations | Proceeds from Sales of Long-Term U.S. Government Obligations | |||||||||||||||
| Janus Aspen Global Life Sciences Portfolio | $ | 26,835,541 | $ | 31,528,489 | $ | – | $ | – | |||||||||||
7. PENDING LEGAL MATTERS
In the fall of 2003, the Securities and Exchange Commission ("SEC"), the Office of the New York State Attorney General ("NYAG"), the Colorado Attorney General ("COAG"), and the Colorado Division of Securities ("CDS") announced that they were investigating alleged frequent trading practices in the mutual fund industry. On August 18, 2004, Janus Capital announced that it had reached final settlements with the SEC, the NYAG, the COAG, and the CDS related to such regulators' investigations into Janus Capital's frequent trading arrangements.
A number of civil lawsuits were brought against Janus Capital and certain of its affiliates, the Janus funds, and related entities and individuals based on allegations similar to those announced by the above regulators and were filed in several state and federal jurisdictions. Such lawsuits alleged a variety of theories for recovery including, but not limited to, the federal securities laws, other federal statutes (including ERISA), and various common law doctrines. The Judicial Panel on Multidistrict Litigation transferred these actions to the U.S. District Court for the District of Maryland (the "Court") for coordinated proceedings. On September 29, 2004, five consolidated amended complaints were filed with the Court that generally include: (i) claims by a putative class of investors in certain Janus funds asserting claims on behalf of the investor class (Marini, et al. v. Janus Investment Fund, et al., U.S. District Court, District of Maryland, Case No. 04-CV-00497); (ii) derivative claims by investors in certain Janus funds ostensibly on behalf of such funds (Steinberg et al. v. Janus Capital Management, LLC et al., U.S. District Court, District of Maryland, Case No. 04-CV-00518); (iii) claims on behalf of participants in the Janus 401(k) plan (Wangberger v. Janus Capital Group Inc., 401(k) Advisory Committee, et al., U.S. District Court, District of Maryland, Case No. JFM-05-2711); (iv) claims brought on behalf of shareholders of Janus Capital Group Inc. ("JCGI") on a derivative basis against the Board of Directors of JCGI (Chasen v. Whiston, et al., U.S. District Court, District of Maryland, Case No. 04-MD-00855); and (v) claims by a putative class of shareholders of JCGI asserting claims on behalf of the shareholders (Wiggins, et al. v. Janus Capital Group, Inc., et al., U.S. District Court, District of Maryland, Case No. 04-CV-00818). In addition, the following were also named as defendants in one or more of the actions: Janus Investment Fund ("JIF"), Janus Aspen Series ("JAS"), Janus Adviser Series ("JAD"), Janus Distributors LLC, Enhanced Investment Technologies, LLC ("INTECH"), Bay Isle Financial LLC ("Bay Isle"), Perkins, Wolf, McDonnell and Company, LLC ("Perkins"), the Advisory Committee of the Janus 401(k) plan, and the current or former directors of JCGI.
On August 25, 2005, the Court entered orders dismissing most of the claims asserted against Janus Capital and its affiliates by fund investors (actions (i) and (ii) described above), except certain claims under Section 10(b) of the Securities Exchange Act of 1934 and under Section 36(b) of the Investment Company Act of 1940, as amended (the "1940 Act"). On August 15, 2006, the complaint in the 401(k) plan class action (action (iii) described above) was dismissed by the district court with prejudice; the plaintiff has appealed that dismissal decision to the United States Court of Appeals for the Fourth Circuit. The Court also dismissed the action against JCGI's Board of Directors without leave to amend (action (iv) described above). Finally, a Motion to Dismiss the action brought by JCGI shareholders (action (v) described above) is fully briefed and pending before the Court.
In addition to the lawsuits described above, the Auditor of the State of West Virginia ("Auditor"), in his capacity as securities commissioner, has initiated administrative proceedings against many of the defendants in the market timing cases (including JCGI and Janus Capital) and, as a part of its relief, is seeking disgorgement and other monetary relief based on similar market timing allegations (In the Matter of Janus Capital Group Inc. et al., Before the Securities Commissioner, State of West Virginia, Summary Order No. 05-1320). The respondents in these proceedings collectively sought a Writ of Prohibition in state court, which was denied. Their subsequent Petition for Appeal was also denied. Consequently, in September 2006, JCGI and Janus Capital filed their answer to the A uditor's summary order instituting proceedings and requested a hearing. JCGI and Janus Capital, as well as other similarly
Janus Aspen Series December 31, 2006 19
Notes to Financial Statements (continued)
situated defendants, continue to challenge the statutory authority of the Auditor to bring such an action. No further proceedings are currently scheduled.
In addition to the "market timing" actions described above, Janus Capital is a defendant in a consolidated lawsuit in the U.S. District Court for the District of Colorado challenging the investment advisory fees charged by Janus Capital to certain Janus funds (Walter Sins, et al. v. Janus Capital Management LLC, U.S. District Court, District of Colorado, Case No. 04-CV-01647-WDM-MEH; Michael Fleisher, et al. v. Janus Capital Management, LLC, 04-CV-02395-MSK-CBS). The action was filed in 2004 by fund investors asserting breach of fiduciary duty under Section 36(b) of the 1940 Act. The plaintiffs seek declaratory and injunctive relief and an unspecified amount of damages. The trial is scheduled to commence on May 21, 2007.
In 2001, Janus Capital's predecessor was also named as a defendant in a class action suit in the U.S. District Court for the Southern District of New York, alleging that certain underwriting firms and institutional investors violated antitrust laws in connection with initial public offerings (Pfeiffer v. Credit Suisse First Boston aka In re Initial Public Offering Antitrust Litigation, U.S. District Court, Southern District of New York, Case No. 01-CV-2014). The U.S. District Court dismissed the plaintiff's antitrust claims in November 2003; however, the U.S. Court of Appeals vacated that decision and remanded it for further proceedings. In March 2006, the defendants, including Janus Capital, filed a Petition for a Writ of Certiorari with the U.S. Supreme Court to review the decision of the U.S. Court of Appeals. In June 2006, the U.S. Supreme Court invited the U.S. Solicitor General to file a brief expressing the view of the United States, and in November 2006, the Solicitor General filed a brief expressing its view on the matter. The U.S. Supreme Court has granted the Petition for a Writ of Certiorari and the parties are in the process of briefing the matter for the U.S. Supreme Court.
Additional lawsuits may be filed against certain of the Janus funds, Janus Capital, and related parties in the future. Janus Capital does not currently believe that these pending actions will materially affect its ability to continue providing services it has agreed to provide to the Janus funds.
20 Janus Aspen Series December 31, 2006
Report of Independent Registered Public Accounting Firm
To the Trustees and Shareholders
of Janus Aspen Global Life Sciences Portfolio
In our opinion, the accompanying statement of assets and liabilities, including the schedule of investments, and the related statements of operations and of changes in net assets and the financial highlights present fairly, in all material respects, the financial position of Janus Aspen Global Life Sciences Portfolio (one of the portfolios constituting Janus Aspen Series, hereafter referred to as the "Portfolio") at December 31, 2006, the results of its operations for the year then ended, the changes in its net assets for each of the two years in the period then ended, and the financial highlights for each of the five years in the period then ended, in conformity with accounting principles generally accepted in the United States of America. These financial statements and financial highlights (hereafter referred to as "financial statements") are the responsibility of the Portfolio's management; our responsibility is to express an opinion on t hese financial statements based on our audits. We conducted our audits of these financial statements in accordance with the standards of the Public Company Accounting Oversight Board (United States). Those standards require that we plan and perform the audit to obtain reasonable assurance about whether the financial statements are free of material misstatement. An audit includes examining, on a test basis, evidence supporting the amounts and disclosures in the financial statements, assessing the accounting principles used and significant estimates made by management, and evaluating the overall financial statement presentation. We believe that our audits, which included confirmation of securities at December 31, 2006 by correspondence with the custodian, transfer agent and brokers, and the application of alternative auditing procedures where securities purchased had not been received, provide a reasonable basis for our opinion.

PricewaterhouseCoopers LLP
Denver, Colorado
February 12, 2007
Janus Aspen Series December 31, 2006 21
Additional Information (unaudited)
PROXY VOTING POLICIES AND VOTING RECORD
A description of the policies and procedures that the Portfolio uses to determine how to vote proxies relating to its portfolio securities is available: (i) without charge, upon request, by calling 1-800-525-0020 (toll free); (ii) on the Portfolio's website at www.janus.com/proxyvoting; and (iii) on the SEC's website at http://www.sec.gov. Additionally, information regarding the Portfolio's proxy voting record for the most recent twelve-month period ended June 30 is also available, free of charge, through www.janus.com/proxyvoting and from the SEC's website at http://www.sec.gov.
QUARTERLY PORTFOLIO HOLDINGS
The Portfolio files its complete portfolio holdings (schedule of investments) with the SEC for the first and third quarters of each fiscal year on Form N-Q within 60 days of the end of such fiscal quarter. The Portfolio's Form N-Q: (i) is available on the SEC's website at http://www.sec.gov; (ii) may be reviewed and copied at the SEC's Public Reference Room in Washington, D.C. (information on the Public Reference Room may be obtained by calling 1-800-SEC-0330); and (iii) is available without charge, upon request, by calling Janus at 1-800-525-0020 (toll free).
APPROVAL OF ADVISORY AGREEMENTS DURING THE PERIOD
The Trustees of Janus Aspen Series, more than eighty-five percent of whom have never been affiliated with the Adviser ("Independent Trustees"), oversee the management of each of the Portfolios and, as required by law, determine annually whether to continue the investment advisory agreement for each Portfolio and the subadvisory agreements for the three Portfolios that utilize subadvisers.
In connection with their most recent consideration of those agreements for each of the Portfolios, the Trustees received and reviewed a substantial amount of information provided by Janus Capital (the "Adviser") and the respective subadvisers in response to requests of the Independent Trustees and their independent legal counsel. They also received and reviewed a considerable amount of information and analysis provided to the Trustees by their independent fee consultant. Throughout their consideration of the agreements the Independent Trustees were advised by their independent legal counsel. The Independent Trustees met on two separate occasions with management to consider the agreements, and at each of those meetings they also met separately in executive session with their independent legal counsel.
At a meeting held on December 20, 2006, based on their evaluation of the information provided by the Adviser, the subadvisers and the independent fee consultant and other information, the Trustees determined that the overall arrangements between each Portfolio and the Adviser were fair and reasonable in light of the nature, extent and quality of the services provided by the Adviser, its affiliates and the subadvisers, the fees charged for those services, and other matters that the Trustees considered relevant in the exercise of their business judgment. At that meeting all of the Trustees unanimously approved the continuation of the investment advisory agreement for each Portfolio, and the subadvisory agreement for each subadvised Portfolio, for the period from February 1, 2007 through February 1, 2008, subject to earlier termination as provided in each agreement.
In considering the continuation of those agreements, the Trustees reviewed and analyzed various factors that they determined were relevant, including the factors described below, none of which by itself was considered dispositive. However, the material factors and conclusions that formed basis for the Trustees' determination to approve the continuation of the agreements are discussed separately below.
Nature, Extent and Quality of Services
The Trustees reviewed the nature, extent and quality of the services of Janus Capital and the subadvisers to the Funds, taking into account the investment objective and strategy of each Portfolio and the knowledge the Trustees gained from their regular meetings with management on at least a quarterly basis and their ongoing review of information related to the Funds. In addition, the Trustees reviewed the resources and key personnel of Janus Capital and each subadviser, especially those who provide investment management services to the Portfolios. The Trustees also considered other services provided to the Portfolios by Janus Capital or the subadvisers, such as managing the execution of portfolio transactions and the selection of broker-dealers for those transactions, serving as the Portfolios' administrator, monitoring adherence to the Portfolios' investment restrictions, producing shareholder reports, providing support services for the Tru stees and Trustee committees, communicating with shareholders and overseeing the activities of other service providers, including monitoring compliance with various policies and procedures of the Portfolios and with applicable securities laws and regulations.
The Trustees concluded that: the nature, extent and quality of the services provided by Janus Capital or the subadviser to each Portfolio were appropriate and consistent with the terms of the respective advisory and subadvisory agreements; that, taking into account steps taken to address a small portion of the Portfolios whose performance lagged that of their peers for certain periods, the quality of those services had been consistent with or superior to quality norms in the industry; and that the Portfolios were likely to benefit from the continued provision of those services. They also concluded that each of Janus Capital and each subadviser had sufficient
22 Janus Aspen Series December 31, 2006
personnel, with the appropriate education and experience, to serve the Portfolios effectively and had demonstrated its continuing ability to attract and retain well-qualified personnel.
Performance of the Funds
The Trustees considered the performance results of each Portfolio over various time periods. They reviewed information comparing each Portfolio's performance with the performance of comparable funds and peer groups identified by Lipper Inc., an independent provider of investment company data, and with the Portfolio's benchmark. They concluded that the performance of most Portfolios was good to very good. Although the performance of some Portfolios lagged that of their peers for certain periods, the Trustees also concluded that Janus Capital had taken appropriate steps to address those instances of under-performance and that the more recent performance of most of those Portfolios had been improving.
Costs of Services Provided
The Trustees examined information on the fees and expenses of each Portfolio in comparison to similar information for other comparable funds as provided by Lipper. They also reviewed an analysis of that information provided by their independent fee consultant and noted that the rate of management (investment advisory and administrative) fees for most of the Portfolios, after contractual expense limitations, was below the mean management fee rate of the respective peer group of funds selected by Lipper.
The Trustees considered the methodology used by Janus Capital and each subadviser in determining compensation payable to portfolio managers, the competitive environment for investment management talent and the competitive market for mutual funds in different distribution channels. They concluded that the compensation methodology provided a good alignment of the interests of the portfolio managers with the interests of Portfolio shareholders.
The Trustees also reviewed management fees charged by Janus Capital to its separate account clients and to its subadvised funds (for which Janus Capital provides only portfolio management services). Although in most instances subadvisory and separate account fee rates for various investment strategies were lower than management fees for Portfolios having a similar strategy, the Trustees noted that Janus Capital performs significant additional services for the Portfolios that it does not provide to those other clients, including administrative services, oversight of the Portfolios' other service providers, trustee support, regulatory compliance and numerous other services, and that, in serving the Portfolios, Janus Capital assumes many legal risks that it does not assume in servicing its other clients. Moreover, they noted that the spread between the average fees charged to the Portfolios and the fees that Janus Capital charged to its separate account clients was significantly smaller than the average spread for such fees of other advisers, based on publicly available data and research conducted by their independent fee consultant.
In considering the fees charged by Janus Capital, the Trustees had previously negotiated with Janus Capital a temporary contingent waiver of a portion the investment advisory fee paid by Janus Aspen Worldwide Growth Portfolio to Janus Capital to provide for a possible reduction in the rate of advisory fee payable by the Portfolio for the period July 1, 2006 through January 31, 2007 if the investment performance of the Fund should lag that of its benchmark performance over the applicable performance measurement period. Commencing in February 2007, the previously approved performance-based fee schedule will become operative.
The Trustees reviewed information on the profitability of Janus Capital and its affiliates of their relationships with each Portfolio, as well as an explanation of the methodology utilized in allocating various expenses among the Portfolios and other clients. The Trustees also reviewed the financial statements of Janus Capital's parent company and its corporate structure. In their review, the Trustees considered whether Janus Capital and each subadviser receive adequate incentives to manage the Portfolios effectively. The Trustees recognized that profitability comparisons among fund managers are difficult because very little comparative information is publicly available and profitability of any manager is affected by numerous factors, including the organizational structure of the particular manager, the types of funds and other accounts it manages, possible other lines of business, the methodology for allocating expenses and the manager's ca pital structure and cost of capital. However, based on the information available and taking those factors into account, the Trustees concluded that Janus Capital's profitability with respect to each Portfolio in relation to the services rendered was not unreasonable.
The Trustees concluded that the management fees and other compensation payable by each Fund to Janus Capital and its affiliates, as well as the fees paid by Janus Capital to the subadvisers of subadvised Portfolios, were reasonable in relation to the nature and quality of the services provided, taking into account the fees charged by other advisers for managing comparable mutual funds with similar strategies and the fees Janus Capital and the subadviser charges to other clients. The Trustees also concluded that the overall expense ratio of each Portfolio was reasonable, taking into account the size of the Portfolio, the quality of services provided by Janus Capital and any subadviser, the investment performance of the
Janus Aspen Series December 31, 2006 23
Additional Information (unaudited) (continued)
Portfolio and any expense limitations agreed to by Janus Capital.
Economies of Scale
The Trustees considered information about the potential for Janus Capital to realize economies of scale as the assets of the Portfolios increase. They noted that, although most Portfolios pay advisory fees at a fixed rate as a percentage of net assets, without any breakpoints, the management fee paid by each Portfolio, after any contractual expense limitations, was below the mean management fee rate of the Portfolio's peer group selected by Lipper; and, for those Portfolios whose expenses are being reduced by the contractual expense limitations of Janus Capital, Janus Capital is subsidizing the Portfolios because they have not reached adequate scale. Moreover, as the assets of many of the Portfolios have declined in the past few years, the Portfolios have benefited from having advisory fee rates that have remained constant rather than increasing as assets decline. In addition, performance fee structures have been implemented for several Port folios that will cause the effective rate of advisory fees payable by such a Portfolio to vary depending on the investment performance of the Portfolio relative to its benchmark; and a few Portfolios have fee schedules with breakpoints and reduced fee rates above certain asset levels. The Trustees also noted that the Portfolios share directly in economies of scale through lower charges of third-party service providers based on the combined scale of all of the Portfolios. Based on all of the information they reviewed, the Trustees concluded that the current fee structure of each Portfolio was reasonable and that the current rates of fees do reflect a sharing between Janus Capital and the Portfolio of economies of scale at the current asset level of the Portfolio.
Other Benefits to Janus Capital
The Trustees also considered benefits that accrue to Janus Capital and its affiliates from their relationships with the Portfolios. They recognized that two affiliates of Janus Capital separately serve the Portfolios as transfer agent and distributor, respectively, and that the transfer agent receives compensation from the non-money market Portfolios for services provided. The Trustees also considered Janus Capital's use of commissions paid by Portfolios on their portfolio brokerage transactions to obtain proprietary research products and services benefiting the Portfolios and/or other clients of Janus Capital, as well as Janus Capital's agreement not to use any Portfolio's brokerage transactions to obtain third party research products or services. The Trustees concluded that Janus Capital's use of "soft" commission dollars to obtain proprietary research products and services was consistent with regulatory requirements and guidelines and was likely to benefit each Portfolio. The Trustees also concluded that, other than the services provided by Janus Capital and its affiliates pursuant to the agreements and the fees to be paid by each Portfolio therefor, the Portfolios and Janus Capital may potentially benefit from their relationship with each other in other ways. They concluded that Janus Capital benefits from the receipt of proprietary research products and services acquired through commissions paid on portfolio transactions of the Portfolios and that the Portfolios benefit from Janus Capital's receipt of those products and services as well as research products and services acquired through commissions paid by other clients of Janus Capital. They further concluded that success of any Portfolio could attract other business to Janus Capital or other Janus Funds and that the success of Janus Capital could enhance Janus Capital's ability to serve the Portfolios.
After full consideration of the above factors as well as other factors, all of the Trustees, including all of the Independent Trustees, concluded that the proposed continuation of the investment advisory agreement for each applicable Portfolio were in the best interest of the respective Portfolios and their shareholders.
24 Janus Aspen Series December 31, 2006
Explanations of Charts, Tables and Financial Statements (unaudited)
1. PERFORMANCE OVERVIEWS
The performance overview graph compares the performance of a hypothetical $10,000 investment in the Portfolio with one or more widely used market indices. The hypothetical example does not represent the returns of any particular investment.
When comparing the performance of the Portfolio with an index, keep in mind that market indices do not include brokerage commissions that would be incurred if you purchased the individual securities in the index. They also do not include taxes payable on dividends and interest or operating expenses incurred if you maintained a Portfolio invested in the index.
Average annual total returns are quoted for each class of the Portfolio. Average annual total return is calculated by taking the growth or decline in value of an investment over a period of time, including reinvestment of any dividends, distributions and capital gains, then calculating the annual compounded percentage rate that would have produced the same result had the rate of growth been constant throughout the period. Average annual total return does not reflect the deduction of taxes that a shareholder would pay on Portfolio distributions or redemptions of Portfolio shares.
2. SCHEDULE OF INVESTMENTS
Following the performance overview section is the Portfolio's Schedule of Investments. This schedule reports the industry concentrations and types of securities held in the Portfolio on the last day of the reporting period. Securities are usually listed by type (common stock, corporate bonds, U.S. Government obligations, etc.) and by industry classification (banking, communications, insurance, etc.). Holdings are subject to change without notice.
The value of each security is quoted as of the last day of the reporting period. The value of securities denominated in foreign currencies is converted into U.S. dollars. Certain short-term investments maturing within 60 days are valued at amortized cost, which approximates market value.
A summary of investments by country is provided if the Portfolio invested in foreign securities. This summary reports the Portfolio's exposure to different countries by providing the percentage of securities invested in each country. The country of each security represents the country in which the company is incorporated.
2A. FORWARD CURRENCY CONTRACTS
A table listing forward currency contracts follows the Portfolio's Schedule of Investments (if applicable). Forward currency contracts are agreements to deliver or receive a preset amount of currency at a future date. Forward currency contracts are used to hedge against foreign currency risk in the Portfolio's long-term holdings. The table provides the name of the foreign currency, the settlement date of the contract, the amount of the contract, the value of the currency in U.S. dollars and the amount of unrealized gain or loss. The amount of unrealized gain or loss reflects the change in currency exchange rates from the time the contract was opened to the last day of the reporting period.
2B. FUTURES
A table listing futures contracts follows the Portfolio's Schedule of Investments (if applicable). Futures contracts are contracts that obligate the buyer to receive and the seller to deliver an instrument or money at a specified price on a specified date. Futures are used to hedge against adverse movements in securities prices, currency risk or interest rates.
The table provides the name of the contract, number of contracts held, the expiration date, the principal amount, value and the amount of unrealized gain or loss. The amount of unrealized gain or loss reflects the marked-to-market amount for the last day of the reporting period.
2C. OPTIONS
A table listing options contracts follows the Portfolio's Schedule of Investments (if applicable). Option contracts are contracts that obligate the Portfolio to sell or purchase an underlying security at a fixed price, upon exercise of the option. Options are used to hedge against adverse movements in securities prices, currency risk or interest rates.
The table provides the name of the contract, number of contracts held, the expiration date, exercise price, value and premiums received.
3. STATEMENT OF ASSETS AND LIABILITIES
This statement is often referred to as the "balance sheet." It lists the assets and liabilities of the Portfolio on the last day of the reporting period.
The Portfolio's assets are calculated by adding the value of the securities owned, the receivable for securities sold but not yet settled, the receivable for dividends declared but not yet received on stocks owned and the receivable for Portfolio shares sold to investors but not yet settled. The Portfolio's liabilities include payables for securities purchased but not yet settled, Portfolio shares redeemed but not yet paid and expenses owed but not yet paid. Additionally, there may be other assets and liabilities such as unrealized gain or loss on forward currency contracts.
The section entitled "Net Assets Consist of" breaks down the components of the Portfolio's net assets. Because the Portfolio must distribute substantially all earnings, you will notice that a significant portion of net assets is shareholder capital.
The last section of this statement reports the net asset value ("NAV") per share on the last day of the reporting period for each class of the Portfolio. The NAV is calculated by dividing the Portfolio's net assets (assets minus liabilities) by the number of shares outstanding.
Janus Aspen Series December 31, 2006 25
Explanations of Charts, Tables and Financial Statements (unaudited) (continued)
4. STATEMENT OF OPERATIONS
This statement details the Portfolio's income, expenses, gains and losses on securities and currency transactions, and appreciation or depreciation of current Portfolio holdings.
The first section in this statement, entitled "Investment Income," reports the dividends earned from stocks and interest earned from interest-bearing securities in the Portfolio.
The next section reports the expenses and expense offsets incurred by the Portfolio, including the advisory fee paid to the investment adviser and transfer agent fees and expenses, and printing and postage for mailing statements, financial reports and prospectuses. Expense offsets, if any, are also shown.
The last section lists the increase or decrease in the value of securities held in the Portfolio. The Portfolio realizes a gain (or loss) when it sells its position in a particular security. An unrealized gain (or loss) refers to the change in net appreciation or depreciation of the Portfolio during the reporting period. "Net Realized and Unrealized Gain/(Loss) on Investments" is affected both by changes in the market value of Portfolio holdings and by gains (or losses) realized during the reporting period.
5. STATEMENT OF CHANGES IN NET ASSETS
This statement reports the increase or decrease in the Portfolio's net assets during the reporting period. Changes in the Portfolio's net assets are attributable to investment operations, dividends, distributions and capital share transactions. This is important to investors because it shows exactly what caused the Portfolio's net asset size to change during the period.
The first section summarizes the information from the Statement of Operations regarding changes in net assets due to the Portfolio's investment performance. The Portfolio's net assets may also change as a result of dividend and capital gains distributions to investors. If investors receive their dividends in cash, money is taken out of the Portfolio to pay the distribution. If investors reinvest their dividends, the Portfolio's net assets will not be affected. If you compare the Portfolio's "Net Decrease from Dividends and Distributions" to the "Reinvested dividends and distributions," you will notice that dividend distributions had little effect on the Portfolio's net assets. This is because the majority of Janus investors reinvest their distributions.
The reinvestment of dividends is included under "Capital Share Transactions." "Capital Shares" refers to the money investors contribute to the Portfolio through purchases or withdraw via redemptions. The Portfolio's net assets will increase and decrease in value as investors purchase and redeem shares from the Portfolio.
6. FINANCIAL HIGHLIGHTS
This schedule provides a per-share breakdown of the components that affect the Portfolio's NAV for current and past reporting periods for each class of the Portfolio. Not only does this table provide you with total return, it also reports total distributions, asset size, expense ratios and portfolio turnover rate.
The first line in the table reflects the NAV per share at the beginning of the reporting period. The next line reports the net investment income per share, which comprises dividends and interest income earned on securities held by the Portfolio. Following is the total of gains/(losses), realized and unrealized. Dividends and distributions are then subtracted to arrive at the NAV per share at the end of the period. The next line reflects the average annual total return reported the last day of the period.
Also included are the expense ratios, or the percentage of net assets that are used to cover operating expenses during the period. Expense ratios vary for a number of reasons, including the differences in management fees, the average shareholder account size and the extent of foreign investments, which entail greater transaction costs.
The Portfolio's expenses may be reduced through expense reduction arrangements. These arrangements may include the use of balance credits or transfer agent fee offsets. The Statement of Operations reflects total expenses before any such offset, the amount of offset and the net expenses. The expense ratios listed in the Financial Highlights reflect total expenses prior to any expense offsets (gross expense ratio) and after the expense offsets (net expense ratio). Both expense ratios reflect expenses after waivers (reimbursements), if applicable.
The ratio of net investment income/(loss) summarizes the income earned less expenses, divided by the average net assets of the Portfolio during the reporting period. Don't confuse this ratio with the Portfolio's yield. The net investment income ratio is not a true measure of the Portfolio's yield because it doesn't take into account the dividends distributed to the Portfolio's investors.
The next ratio is the portfolio turnover rate, which measures the buying and selling activity in a Portfolio. Portfolio turnover is affected by market conditions, changes in the asset size of a Portfolio, the nature of the Portfolio's investments and the investment style of the portfolio manager. A 100% rate implies that an amount equal to the value of the entire portfolio is turned over in a year; a 50% rate means that an amount equal to the value of half the portfolio is traded in a year; and a 200% rate means that an amount equal to the value of the portfolio is traded every six months.
26 Janus Aspen Series December 31, 2006
Trustees and Officers (unaudited)
The Portfolio's Statement of Additional Information includes additional information about the Trustees and officers and is available, without charge, by calling 1-800-525-0020.
The following are the Trustees and officers of the Trust, together with a brief description of their principal occupations during the last five years (principal occupations for certain Trustees may include periods over five years).
Each Trustee has served in that capacity since he or she was originally elected or appointed. The Trustees do not serve a specified term of office. Each Trustee will hold office until the termination of the Trust or his or her earlier death, resignation, retirement, incapacity or removal. The retirement age for Trustees is 72. The Portfolio's Nominating and Governance Committee will consider nominees for the position of Trustee recommended by shareholders. Shareholders may submit the name of a candidate for consideration by the Committee by submitting their recommendations to the Trust's Secretary. Each Trustee is currently a Trustee of two other registered investment companies advised by Janus Capital: Janus Investment Fund and Janus Adviser Series. As of the date of this report, collectively, these three registered investment companies consist of 69 series or funds.
The Trust's officers are elected annually by the Trustees for a one-year term. Certain officers also serve as officers of Janus Investment Fund and Janus Adviser Series. Certain officers of the Portfolio may also be officers and/or directors of Janus Capital. Portfolio officers receive no compensation from the Portfolio, except for the Portfolio's Chief Compliance Officer, as authorized by the Trustees.
Trustees
| Name, Age and Address | Positions Held with Portfolio | Length of Time Served | Principal Occupations During the Past Five Years | Number of Portfolios in Fund Complex Overseen by Trustee | Other Directorships Held by Trustee | ||||||||||||||||||
| Independent Trustees | |||||||||||||||||||||||
| Dennis B. Mullen 151 Detroit Street Denver, CO 80206 Age 63 | Chairman Trustee | 3/04-Present 9/93-Present | Chief Executive Officer of Red Robin Gourmet Burgers, Inc. (since 2005). Formerly, private investor. | 69 | * | Chairman of the Board (since 2005) and Director of Red Robin Gourmet Burgers, Inc.; and Director of Janus Capital Funds Plc (Dublin-based, non-U.S. funds). | |||||||||||||||||
| Jerome S. Contro 151 Detroit Street Denver, CO 80206 Age 50 | Trustee | 12/05-Present | Partner of Tango Group, a private investment firm (since 1999). | 69 | Trustee and Chairman of RS Investment Trust (since 2001); Director of IZZE Beverages and MyFamily.com, Inc. (genealogical research website). | ||||||||||||||||||
| William F. McCalpin 151 Detroit Street Denver, CO 80206 Age 49 | Trustee | 6/02-Present | Private Investor. Formerly, Vice President of Asian Cultural Council and Executive Vice President and Chief Operating Officer of The Rockefeller Brothers Fund (a private family foundation). | 69 | Director of the F.B. Heron Foundation (a private grantmaking foundation). | ||||||||||||||||||
| John W. McCarter, Jr. 151 Detroit Street Denver, CO 80206 Age 68 | Trustee | 6/02-Present | President and Chief Executive Officer of The Field Museum of Natural History (Chicago, IL). | 69 | Chairman of the Board and Director of Divergence Inc. (biotechnology firm); Director of W.W. Grainger, Inc. (industrial distributor); and Trustee of WTTW (Chicago public television station) and the University of Chicago. | ||||||||||||||||||
Janus Aspen Series December 31, 2006 27
Trustees and Officers (unaudited) (continued)
Trustees (continued)
| Name, Age and Address | Positions Held with Portfolio | Length of Time Served | Principal Occupations During the Past Five Years | Number of Portfolios in Fund Complex Overseen by Trustee | Other Directorships Held by Trustee | ||||||||||||||||||
| Independent Trustees (cont.) | |||||||||||||||||||||||
| James T. Rothe 151 Detroit Street Denver, CO 80206 Age 63 | Trustee | 1/97-Present | Co-founder and Managing Director of Roaring Fork Capital Management, LLC (private investment in public equity firm); and Professor Emeritus of Business of the University of Colorado, Colorado Springs, CO (since 2004). Formerly, Professor of Business of the University of Colorado (2002-2004); and Distinguished Visiting Professor of Business (2001-2002) of Thunderbird University (American Graduate School of International Management), Glendale, AZ. | 69 | Director of Red Robin Gourmet Burgers, Inc. | ||||||||||||||||||
| William D. Stewart 151 Detroit Street Denver, CO 80206 Age 62 | Trustee | 9/93-Present | Corporate Vice President and General Manager of MKS Instruments – HPS Products, Boulder, CO (a manufacturer of vacuum fittings and valves). | 69 | N/A | ||||||||||||||||||
| Martin H. Waldinger 151 Detroit Street Denver, CO 80206 Age 68 | Trustee | 9/93-Present | Private Investor and Consultant to California Planned Unit Developments. Formerly, CEO and President of Marwal, Inc. (homeowner association management company). | 69 | N/A | ||||||||||||||||||
| Linda S. Wolf 151 Detroit Street Denver, CO 80206 Age 59 | Trustee | 12/05-Present | Retired. Formerly, Chairman and Chief Executive Officer of Leo Burnett (Worldwide) (advertising agency) (2001-2005). | 69 | Director of Wal-Mart, The Field Museum of Natural History (Chicago, IL), Children's Memorial Hospital (Chicago, IL), Chicago Council on Foreign Relations, Economic Club of Chicago, and InnerWorkings (a provider of print procurement solutions). | ||||||||||||||||||
| Interested Trustee | |||||||||||||||||||||||
| Thomas H. Bailey** 151 Detroit Street Denver, CO 80206 Age 69 | Trustee | 5/93-Present | Retired. Formerly, President (1978-2002) and Chief Executive Officer (1994-2002) of Janus Capital or Janus Capital Corporation; Chairman and Director (1978-2002) of Janus Capital Corporation; President and Director (1994-2002) of The Janus Foundation. | 69 | N/A | ||||||||||||||||||
* Mr. Mullen also serves as director of Janus Capital Funds Plc, consisting of 22 funds. Including Janus Capital Funds Plc and the 69 funds comprising the Janus Funds, Mr. Mullen oversees 91 funds.
** The Portfolio is treating Mr. Bailey as an "interested person" of the Trust by virtue of his past positions and continuing relationships with Janus Capital and ownership of shares of Janus Capital's parent company.
28 Janus Aspen Series December 31, 2006
Officers
| Name, Age and Address | Positions Held with Portfolio | Term of Office* and Length of Time Served | Principal Occupations During the Past Five Years | ||||||||||||
| Thomas R. Malley 151 Detroit Street Denver, CO 80206 Age 38 | Executive Vice President and Co-Portfolio Manager Janus Aspen Global Life Sciences Portfolio | 12/99-Present | Vice President of Janus Capital and Portfolio Manager for other Janus accounts. | ||||||||||||
| Stephanie Grauerholz-Lofton 151 Detroit Street Denver, CO 80206 Age 36 | Chief Legal Counsel and Secretary Vice President | 1/06-Present 03/06-Present | Assistant Vice President of Janus Capital and Janus Distributors LLC; and Associate Counsel of Janus Capital. Formerly, Associate of Vedder, Price, Kaufman & Kammholz, P.C. (1999-2003). | ||||||||||||
| Kelley Abbott Howes 151 Detroit Street Denver, CO 80206 Age 41 | President and Chief Executive Officer | 1/06-Present | President of Janus Services LLC; Senior Vice President and General Counsel of Janus Capital; and Senior Vice President and Assistant General Counsel of Janus Distributors LLC. Formerly, Vice President (1999-2005) of Janus Distributors LLC; Senior Vice President and General Counsel (2004-2006), Vice President (2000-2004), and Assistant General Counsel (2002-2004) of Janus Services LLC; and Vice President and Assistant General Counsel (1999-2004) of Janus Capital. | ||||||||||||
| David R. Kowalski 151 Detroit Street Denver, CO 80206 Age 49 | Vice President and Chief Compliance Officer | 6/02-Present | Senior Vice President and Chief Compliance Officer of Janus Capital, Janus Distributors LLC, and Janus Services LLC; Chief Compliance Officer of Bay Isle Financial LLC; and Vice President of Enhanced Investment Technologies LLC. Formerly, Chief Compliance Officer of Enhanced Investment Technologies, LLC (2003-2005); Vice President of Janus Capital (2000-2005), Janus Distributors LLC (2000-2001), and Janus Services LLC (2004-2005); and Assistant Vice President of Janus Services LLC (2002-2004). | ||||||||||||
| Jesper Nergaard 151 Detroit Street Denver, CO 80206 Age 44 | Chief Financial Officer Vice President, Treasurer, and Principal Accounting Officer | 3/05-Present 2/05-Present | Vice President of Janus Capital. Formerly, Director of Financial Reporting for OppenheimerFunds, Inc. (2004-2005); Site Manager and First Vice President of Mellon Global Securities Services (2003); and Director of Fund Accounting, Project Development, and Training of INVESCO Funds Group (1994-2003). | ||||||||||||
* Officers are elected at least annually for a one-year term and may also be elected from time to time by the Trustees for an interim period.
Janus Aspen Series December 31, 2006 29
Janus provides access to a wide range of investment disciplines.
Growth
Janus growth portfolios focus on companies believed to be the leaders in their respective industries, with solid management teams, expanding market share, margins and efficiencies.
Core
Janus core portfolios seek investments in more stable and predictable companies. These portfolios look for a strategic combination of steady growth and for certain portfolios, some degree of income.
Risk-Managed
Our risk-managed portfolios seek to outperform their respective indices while maintaining a risk profile equal to or lower than the index itself. Managed by INTECH (a Janus subsidiary), these portfolios use a mathematical process in an attempt to build a more "efficient" portfolio than the index.
Value
Janus value portfolios invest in companies they believe are poised for a turnaround or are trading at a significant discount to fair value. The goal is to gain unique insight into a company's true value and identify and evaluate potential catalysts that may unlock shareholder value.
International & Global
Janus international and global portfolios seek to leverage Janus' research capabilities by taking advantage of inefficiencies in foreign markets, where accurate information and analytical insight are often at a premium.
Bond & Money Market
Janus bond portfolios attempt to provide less risk relative to equities while seeking to deliver a competitive total return through high current income and appreciation. Janus money market portfolios seek maximum current income consistent with stability of capital.
For more information about our funds, contact your investment professional or go to www.janus.com/info
Please consider the charges, risks, expenses and investment objectives carefully before investing. For a prospectus containing this and other information, please call Janus at 1-800-525-0020 or download the file from www.janus.com/info. Read it carefully before you invest or send money.
An investment in a money market portfolio is not insured or guaranteed by the Federal Deposit Insurance Corporation or any other government agency. Although the Portfolio seeks to preserve the value of your investment at $1.00 per share, it is possible to lose money by investing in the Portfolio.

151 Detroit Street
Denver, CO 80206
1-800-525-0020
Portfolio distributed by Janus Distributors LLC (1/07)
C-0207-169 109-02-713 01-07
2006 Annual Report
Janus Aspen Series
Janus Aspen Global Technology Portfolio
Look Inside. . .
• Portfolio management perspective
• Investment strategy behind your portfolio
• Portfolio performance, characteristics and holdings

Table of Contents
| Useful Information About Your Portfolio Report | 1 | ||||||
| Management Commentary and Schedule of Investments | 2 | ||||||
| Statement of Assets and Liabilities | 8 | ||||||
| Statement of Operations | 9 | ||||||
| Statements of Changes in Net Assets | 10 | ||||||
| Financial Highlights | 11 | ||||||
| Notes to Schedule of Investments | 13 | ||||||
| Notes to Financial Statements | 14 | ||||||
| Report of Independent Registered Public Accounting Firm | 23 | ||||||
| Additional Information | 24 | ||||||
| Explanations of Charts, Tables and Financial Statements | 27 | ||||||
| Trustees and Officers | 29 | ||||||
Please consider the charges, risks, expenses and investment objectives carefully before investing. For a prospectus containing this and other information, please call Janus at 1-800-525-0020 or download the file from www.janus.com/info. Read it carefully before you invest or send money.
Useful Information About Your Portfolio Report
Management Commentary
The Management Commentary in this report includes valuable insight from the Portfolio's managers as well as statistical information to help you understand how your Portfolio's performance and characteristics stack up against those of comparable indices.
Please keep in mind that the opinions expressed by the Portfolio's managers in the Management Commentary are just that: opinions. They are a reflection of the managers' best judgment at the time this report was compiled, which was December 31, 2006. As the investing environment changes, so could the managers' opinions. The views are unique to the managers and aren't necessarily shared by their fellow employees or by Janus in general.
Portfolio Expenses
We believe it's important for our shareholders to have a clear understanding of Portfolio expenses and the impact they have on investment return.
The following is important information regarding the Portfolio's Expense Example, which appears in the Management Commentary within this Annual Report. Please refer to this information when reviewing the Expense Example for the Portfolio.
Example
As a shareholder of a Portfolio, you incur two types of costs: (1) transaction costs, including redemption fees (where applicable) (and any related exchange fees) and (2) ongoing costs, including management fees; distribution and shareholder servicing (12b-1) fees (applicable to Service Shares and Service II Shares only); and other Portfolio expenses. The example is intended to help you understand your ongoing costs (in dollars) of investing in a Portfolio and to compare these costs with the ongoing costs of investing in other mutual funds. To do so, compare this 5% hypothetical example with the 5% hypothetical examples that appear in the shareholder reports of the other funds. The example is based upon an investment of $1,000 invested at the beginning of the period and held for the six-month period from July 1, 2006 to December 31, 2006.
Actual Expenses
The first line of the table in each example provides information about actual account values and actual expenses. You may use the information in this line, together with the amount you invested, to estimate the expenses that you paid over the period. Simply divide your account value by $1,000 (for example, an $8,600 account value divided by $1,000 = 8.6), then multiply the result by the number in the first line under the heading entitled "Expenses Paid During Period" to estimate the expenses you paid on your account during the period.
Hypothetical Example for Comparison Purposes
The second line of the table in each example provides information about hypothetical account values and hypothetical expenses based upon the Portfolio's actual expense ratio and an assumed rate of return of 5% per year before expenses, which is not the Portfolio's actual return. The hypothetical account values and expenses may not be used to estimate the actual ending account balance or expenses you paid for the period. You may use this information to compare the ongoing costs of investing in the Portfolio and other funds. To do so, compare this 5% hypothetical example with the 5% hypothetical examples that appear in the shareholder reports of the other funds.
Janus Capital Management LLC ("Janus Capital") has contractually agreed to waive the Portfolio's total operating expenses, excluding the distribution and shareholder servicing (12b-1) fees applicable to Service Shares and Service II Shares, brokerage commissions, interest, taxes and extraordinary expenses to certain limits until at least May 1, 2008. More information regarding the waivers is available in the Portfolio's prospectus.
Please note that the expenses shown in the tables are meant to highlight your ongoing costs only and do not reflect any transaction costs, such as redemption fees (where applicable) and any charges at the separate account level or contract level. Redemption fees are fully described in the prospectus. Therefore, the second line of each table is useful in comparing ongoing costs only, and will not help you determine the relative total costs of owning different funds. In addition, if these transaction costs and separate account or contract level charges were included, your costs would have been higher.
Janus Aspen Series December 31, 2006 1
Janus Aspen Global Technology Portfolio (unaudited)
Portfolio Snapshot
This portfolio purses forward-thinking companies around the globe that are advancing the frontiers of technology in profitable ways.

Barney Wilson
co-portfolio manager

Brad Slingerlend
co-portfolio manager
Performance Overview
During the 12 months ended December 31, 2006, Janus Aspen Global Technology Portfolio's Institutional Shares, Service Shares and Service II Shares advanced 8.12%, 7.83% and 7.94% respectively. By comparison, the Portfolio's primary benchmark, the S&P 500® Index, returned 15.80%, while its secondary benchmark, the Morgan Stanley Capital International (MSCI) World Information Technology IndexSM, gained 9.31%.
Gains in the technology hardware and equipment, software services, and consumer durables sectors helped Portfolio performance. However, weakness in the pharmaceuticals and biotechnology and retailing sectors held returns back.
Investment Strategy
Janus Aspen Global Technology Portfolio's objective is to seek long-term growth of capital. We seek high quality and innovative technology companies that are growing in excess of market expectations. To do this, the Janus team of technology analysts scours the globe to find what we believe are the best investment opportunities for the Portfolio. While investing in the technology sector can be more volatile than a broader market index in the short term, we believe that over the long term the technology sector, if one can handle the volatility, is one of the best areas in which to seek above-average investment returns.
Earlier in the year we spoke of our intention to focus more on the Janus team of technology analysts' best ideas. We are pleased to report that the number of internally-rated "buy" and "strong buy" stocks in the Portfolio was over 90% at the end of the period. We have also accomplished our goal of reducing the number of names in the Portfolio. In the current environment of volatility, combined with macroeconomic and political uncertainty, we think it is even more important to focus on individual stock selection. Janus' team of technology analysts has found no shortage of compelling investment opportunities.
One of the exciting investment themes in the Portfolio involves the changes we are witnessing as the Internet goes through a second wave of innovation. Driven by broadband penetration levels reaching above 40% in many developed countries, we are starting to see new and compelling ways to utilize the Internet. Companies like YouTube, recently purchased by Google, are changing the way consumers view their entertainment options. This broader sector theme is borne out in the Portfolio's investments, including Akamai Technologies, Google and Submarino.
Another exciting theme in which the Portfolio is investing is the globalization of technology development and services. The Janus team of technology analysts has visited hundreds of companies around the world this year and we are enthusiastic about the rapidly developing skill sets in China and India. For example, Actions Semiconductor, based in China, is developing the next generation of low-cost chips for MP3 players – an expertise that has not previously existed in China. In India, the large and growing pool of skilled software engineers allowed us to see significant gains in our investments in Infosys Technologies and Satyam Computer. As innovation continues to evolve in these emerging markets, we continue to seek the best growth technology companies at reasonable valuations.
Detractors from Performance
Yahoo! continued to be an underperforming stock for the Portfolio. While we are disappointed in the near-term weakness in the stock, we are looking forward to the potential significant growth the company should see in the coming years through migration of advertising spending on the Internet. With consumers spending more and more time on the Internet every day, advertisers are expected to shift their marketing away from traditional television and print methods to the online community. We believe Yahoo!'s large user base provides an ideal global forum for this transition. As the Internet rapidly evolves into a more productive and entertaining experience, we think Yahoo!'s attractive valuation offers a compelling investment opportunity.
Juniper Networks also underperformed over the 12-month period. Juniper stumbled on a product introduction in early 2006, but has since released several new products and the stock has rebounded despite its 12-month loss of 15.07%. Following the theme mentioned above, the increased penetration of broadband and video-intensive Internet sites is likely to dramatically increase the need for the Internet routers and switches sold by Juniper.
Semiconductor company Microsemi also detracted from performance during the period. The company, along with the semiconductor industry in general, experienced an inventory correction driven by overcapacity in the first half of calendar year 2006. While this problem has weighed on many of the
2 Janus Aspen Series December 31, 2006
(unaudited)
semiconductor stocks in the Portfolio, we think it is temporary, and will likely be resolved in the first half of calendar 2007. The semiconductor supply chain has become leaner and more rational since the technology bubble six years ago and it can now quickly respond to the cyclicality of inventory and demand. With strong demand for consumer electronics, military and medical devices, we think Microsemi will see a rebound in sales of its integrated analog circuits.
Contributors to Portfolio Performance
Mobile e-mail device maker Research In Motion (RIM) of Canada was the Portfolio's top performer for the period, with a return of over 93% in the last 12 months. The maker of the popular BlackBerry handheld device was able to resolve legal problems and introduce new models, which have seen very strong demand. By continuing to innovate in form factor and user interface, the company has been able to grow more quickly than its larger rivals Nokia and Motorola. With more new models on the horizon and rapidly growing mobile e-mail and Internet penetration, RIM should be able to take advantage of continued strong demand for its products.
Infosys Technologies, mentioned above, saw an increase of 54.50% over the period as the company experienced strong growth and margin expansion. As companies in the Western world seek to become more globally competitive, they are increasingly turning to companies like Infosys to help them with their IT and software needs. With the pool of available software engineers growing more slowly in Europe and the United States, India is able to capitalize on the shortage of talent.
Another contributor to the Portfolio's positive performance was peripherals maker Logitech, which posted a 12-month return of 22.92%. Driven by several product launches in wireless mice and keyboards, gaming controllers, web cameras, voice over IP products, MP3 accessories, universal remote controls and other PC peripherals, the Swiss company continued to see increased acceptance of its products. With major product cycles coming in the video game sector, the new Microsoft Vista operating system and the continued proliferation of portable music, Logitech is expected to introduce many new and innovative products over the coming year.
Looking Ahead
The Janus team of technology analysts will continue to focus on spotting change before it happens. What is the next hot product? Where is innovation happening? Who is falling behind and who is gaining share? These are just some of the questions we try to answer before the rest of Wall Street. Leveraging the strong grassroots research foundation of Janus, we dig for the best companies. Using detailed models and valuation analysis, we exploit discrepancies between our view of where stocks will be in one to two years compared to the market's expectations. This strategy is particularly important in the current climate of economic and political uncertainty. We will continue to seek out what we believe are the best companies with the most upside potential for our shareholders.
Thank you for your investment in Janus Aspen Global Technology Portfolio.
Janus Aspen Global Technology Portfolio At a Glance
5 Largest Contributors to Performance – Holdings
| Contribution | |||||||
| Research in Motion, Ltd. (U.S. Shares) Wireless solutions provider for mobile communications - Canada | 1.95 | % | |||||
| Hon Hai Precision Industry Company, Ltd. Personal computer parts company - Taiwan | 0.95 | % | |||||
| Infosys Technologies, Ltd. IT consulting and software services provider - India | 0.85 | % | |||||
| Submarino S.A. Internet retail services provider - Brazil | 0.83 | % | |||||
| Oracle Corp. Enterprise software services provider - U.S. | 0.78 | % | |||||
5 Largest Detractors from Performance – Holdings
| Contribution | |||||||
| Yahoo!, Inc. Global Internet media company - U.S. | (1.54 | )% | |||||
| Advanced Micro Devices, Inc. Integrated circuits provider - U.S. | (0.75 | )% | |||||
| Amazon.com, Inc. Online retailer - U.S. | (0.69 | )% | |||||
| QUALCOMM, Inc. Wireless equipment services provider - U.S. | (0.51 | )% | |||||
| SanDisk Corp. Flash data storage products provider - U.S. | (0.51 | )% | |||||
Janus Aspen Series December 31, 2006 3
Janus Aspen Global Technology Portfolio (unaudited)
5 Largest Contributors to Performance – Sectors
| Group | Portfolio Contribution | Portfolio Weighting (% of Net Assets) | S&P 500® Index Weighting | ||||||||||||
| Technology Hardware & Equipment | 3.96 | % | 28.41 | % | 6.87 | % | |||||||||
| Software & Services | 3.34 | % | 32.38 | % | 5.53 | % | |||||||||
| Semiconductors & Semiconductor Equipment | 1.28 | % | 25.50 | % | 2.82 | % | |||||||||
| Media | 0.63 | % | 1.45 | % | 3.40 | % | |||||||||
| Consumer Durables & Apparel | 0.32 | % | 2.58 | % | 1.22 | % | |||||||||
5 Lowest Contributors/Detractors to Performance – Sectors
| Group | Portfolio Contribution | Portfolio Weighting (% of Net Assets) | S&P 500® Index Weighting | ||||||||||||
| Pharmaceuticals & Biotechnology | (0.37 | )% | 1.11 | % | 8.07 | % | |||||||||
| Retailing | (0.10 | )% | 2.97 | % | 3.49 | % | |||||||||
| Diversified Financials | (0.08 | )% | 0.06 | % | 9.48 | % | |||||||||
| Utilities | 0.00 | % | 0.00 | % | 3.39 | % | |||||||||
| Transportation | 0.00 | % | 0.00 | % | 1.84 | % | |||||||||
5 Largest Equity Holdings – (% of Net Assets)
| As of December 31, 2006 | |||
| Yahoo!, Inc. Web Portals/Internet Service Providers | 2.7 | % | |||||
| Suntech Power Holdings Company, Ltd. (ADR) Energy - Alternate Sources | 2.7 | % | |||||
| Samsung Electronics Company, Ltd. Electronic Components - Semiconductors | 2.6 | % | |||||
| ARM Holdings PLC Electronic Components - Semiconductors | 2.5 | % | |||||
| Sony Corp. Audio and Video Products | 2.4 | % | |||||
| 12.9 | % | ||||||
Asset Allocation – (% of Net Assets)
| As of December 31, 2006 | |||
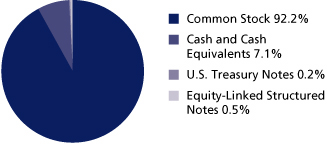
Emerging markets comprised 10.1% of total net assets.
Top Country Allocations – (% of Investment Securities)
| As of December 31, 2006 | As of December 31, 2005 | ||||||
 | 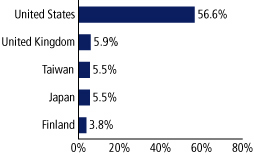 | ||||||
4 Janus Aspen Series December 31, 2006
4 Janus Aspen Series December 31, 2006
(unaudited)
Performance
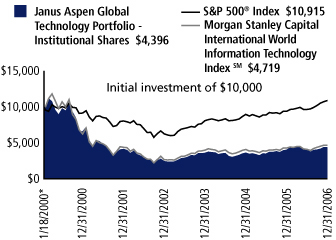
Average Annual Total Return – for the periods ended December 31, 2006
| One Year | Five Year | Since Inception* | |||||||||||||
| Janus Aspen Global Technology Portfolio - Institutional Shares | 8.12 | % | 1.15 | % | (11.15 | )% | |||||||||
| Janus Aspen Global Technology Portfolio - Service Shares | 7.83 | % | 0.91 | % | (11.36 | )% | |||||||||
| Janus Aspen Global Technology Portfolio - Service II Shares | 7.94 | % | 1.04 | % | (11.36 | )% | |||||||||
| S&P 500® Index | 15.80 | % | 6.19 | % | 1.27 | % | |||||||||
| Morgan Stanley Capital International World Information Technology IndexSM | 9.31 | % | 1.33 | % | (10.29 | )%** | |||||||||
| Lipper Quartile | 3 | rd | 2 | nd | 3 | rd | |||||||||
| Lipper Ranking - Institutional Shares based on total returns for Variable Annuity Science and Technology Funds | 27/52 | 19/42 | 10/14 | ||||||||||||
Data presented represents past performance, which is no guarantee of future results. Investment results and principal value will fluctuate so that shares, when redeemed, may be worth more or less than their original cost. Due to market volatility, current performance may be higher or lower than the performance shown. Call 877.33JANUS or visit www.janus.com/info for performance current to the most recent month-end.
See Notes to Schedule of Investments for index definitions.
Total return includes reinvestment of dividends from net investment income and distributions from capital gains. Net dividends reinvested are the dividends that remain to be reinvested after foreign tax obligations have been met. Such obligations vary from country to country. The returns shown do not reflect the deduction of taxes that a shareholder would pay on Portfolio distributions or the redemption of Portfolio shares.
Returns shown for Service II Shares for periods prior to December 31, 2001 are derived from the historical performance of Institutional Shares, adjusted to reflect the higher operating expenses of Service II Shares.
These returns do not reflect the charges and expenses of any particular insurance product or qualified plan. Returns shown would have been lower had they included insurance charges.
The Portfolio may differ significantly from the securities held in the indices. The indices are not available for direct investment; therefore their performance does not reflect the expenses associated with the active management of an actual Portfolio.
For Service II Shares, a 1% redemption fee may be imposed on shares held for 60 days or less.
This Portfolio may at times have significant exposure to certain industry groups, which may react similarly to market developments (resulting in greater price volatility). The Portfolio also may have significant exposure to foreign markets (which include risks such as currency fluctuation and political uncertainty).
There is no assurance that the investment process will consistently lead to successful investing.
This Portfolio may have significant exposure to emerging markets. In general, emerging market investments have historically been subject to significant gains and/or losses. As such, the Portfolio's returns and NAV may be subject to such volatility.
The Portfolio's performance may be affected by risks that include those associated with nondiversification, non-investment grade debt securities, undervalued or overlooked companies, investments in specific industries or countries and potential conflicts of interest with Janus Smart Portfolios. Additional risks to the Portfolio may include those associated with investing in foreign securities, emerging markets, initial public offerings, derivatives and companies with relatively small market capitalizations. Please see a Janus prospectus or www.janus.com/info for more information about risk, fund holdings and details.
Lipper Inc. - A Reuters Company, is a nationally recognized organization that ranks the performance of mutual funds within a universe of funds that have similar investment objectives. Rankings are historical with capital gains and dividends reinvested.
The date of the since-inception Lipper ranking is slightly different from when the Portfolio began operations since Lipper provides fund rankings as of the last day of the month or the first Thursday after fund inception.
Ranking is for the Institutional share class only; other classes may have different performance characteristics.
Janus Capital has contractually agreed to waive the Portfolio's total operating expenses to the levels indicated in the prospectus until at least May 1, 2008. Total returns shown include fee waivers, if any, and without such waivers total returns would have been lower.
The Portfolio will invest at least 80% of its net assets in the type of securities described by its name.
Effective February 1, 2006, Mike Lu is no longer the manager of Janus Aspen Global Technology Portfolio. Brad Slingerlend and Barney Wilson are co-portfolio managers for the Portfolio.
See "Explanations of Charts, Tables and Financial Statements."
* The Portfolio's inception date – January 18, 2000
** The Morgan Stanley Capital International World Information Technology IndexSM since inception returns calculated from January 31, 2000
Portfolio Expenses
The example below shows you the ongoing costs (in dollars) of investing in your Portfolio and allows you to compare these costs with those of other mutual funds. Please refer to page 1 for a detailed explanation of the information presented in these charts.
| Expense Example - Institutional Shares | Beginning Account Value (7/1/06) | Ending Account Value (12/31/06) | Expenses Paid During Period (7/1/06-12/31/06)* | ||||||||||||
| Actual | $ | 1,000.00 | $ | 1,098.40 | $ | 4.13 | |||||||||
| Hypothetical (5% return before expenses) | $ | 1,000.00 | $ | 1,021.27 | $ | 3.97 | |||||||||
| Expense Example - Service Shares | Beginning Account Value (7/1/06) | Ending Account Value (12/31/06) | Expenses Paid During Period (7/1/06-12/31/06)* | ||||||||||||
| Actual | $ | 1,000.00 | $ | 1,100.50 | $ | 5.45 | |||||||||
| Hypothetical (5% return before expenses) | $ | 1,000.00 | $ | 1,020.01 | $ | 5.24 | |||||||||
| Expense Example - Service II Shares | Beginning Account Value (7/1/06) | Ending Account Value (12/31/06) | Expenses Paid During Period (7/1/06-12/31/06)* | ||||||||||||
| Actual | $ | 1,000.00 | $ | 1,098.50 | $ | 5.45 | |||||||||
| Hypothetical (5% return before expenses) | $ | 1,000.00 | $ | 1,020.01 | $ | 5.24 | |||||||||
*Expenses are equal to the annualized expense ratio of 0.78% for Institutional Shares, 1.03% for Service Shares and 1.03% for Service II Shares multiplied by the average account value over the period, multiplied by 184/365 (to reflect the one-half year period). Expenses may include effect of contractual waivers by Janus Capital.
Janus Aspen Series December 31, 2006 5
Janus Aspen Global Technology Portfolio
Schedule of Investments
As of December 31, 2006
| Shares or Principal Amount | Value | ||||||||||
| Common Stock - 92.2% | |||||||||||
| Advertising Sales - 1.2% | |||||||||||
| 28,775 | Lamar Advertising Co.* | $ | 1,881,597 | ||||||||
| Aerospace and Defense - 0.5% | |||||||||||
| 94,869 | BAE Systems PLC** | 790,838 | |||||||||
| Aerospace and Defense - Equipment - 1.0% | |||||||||||
| 20,645 | Alliant Techsystems, Inc.*,# | 1,614,233 | |||||||||
| Applications Software - 4.1% | |||||||||||
| 34,838 | Infosys Technologies, Ltd. | 1,764,569 | |||||||||
| 106,280 | Quest Software, Inc.* | 1,557,002 | |||||||||
| 110,040 | Red Hat, Inc.*,# | 2,530,920 | |||||||||
| 19,295 | Salesforce.com, Inc.*,# | 703,303 | |||||||||
| 6,555,794 | |||||||||||
| Audio and Video Products - 2.4% | |||||||||||
| 91,000 | Sony Corp.** | 3,899,836 | |||||||||
| Cable Television - 1.1% | |||||||||||
| 42,240 | Comcast Corp. - Special Class A* | 1,769,011 | |||||||||
| Chemicals - Diversified - 0.9% | |||||||||||
| 22,100 | Shin-Etsu Chemical Company, Ltd.** | 1,480,081 | |||||||||
| Commercial Services - Finance - 1.4% | |||||||||||
| 55,520 | Paychex, Inc. | 2,195,261 | |||||||||
| Computer Services - 1.5% | |||||||||||
| 83,705 | Ceridian Corp.* | 2,342,066 | |||||||||
| Computers - 5.6% | |||||||||||
| 31,385 | Apple Computer, Inc.*,** | 2,662,703 | |||||||||
| 65,495 | Dell, Inc.* | 1,643,270 | |||||||||
| 69,775 | Hewlett-Packard Co. | 2,874,032 | |||||||||
| 13,370 | Research In Motion, Ltd. (U.S. Shares)* | 1,708,419 | |||||||||
| 8,888,424 | |||||||||||
| Computers - Memory Devices - 2.4% | |||||||||||
| 199,275 | EMC Corp.* | 2,630,430 | |||||||||
| 29,025 | SanDisk Corp.* | 1,248,946 | |||||||||
| 3,879,376 | |||||||||||
| Computers - Peripheral Equipment - 1.4% | |||||||||||
| 74,876 | Logitech International S.A.* | 2,159,944 | |||||||||
| Consulting Services - 0.5% | |||||||||||
| 105,185 | BearingPoint, Inc.* | 827,806 | |||||||||
| Data Processing and Management - 0.8% | |||||||||||
| 35,890 | NAVTEQ Corp.*,# | 1,255,073 | |||||||||
| E-Commerce/Products - 2.0% | |||||||||||
| 95,670 | Submarino S.A. | 3,134,071 | |||||||||
| Electronic Components - Miscellaneous - 3.3% | |||||||||||
| 300,979 | Hon Hai Precision Industry Company, Ltd.** | 2,147,541 | |||||||||
| 53,870 | Koninklijke (Royal) Philips Electronics N.V.** | 2,031,636 | |||||||||
| 36,300 | LG.Philips LCD Company, Ltd.*,** | 1,087,048 | |||||||||
| 5,266,225 | |||||||||||
| Electronic Components - Semiconductors - 13.6% | |||||||||||
| 1,614,057 | ARM Holdings PLC** | 3,974,069 | |||||||||
| 54,760 | International Rectifier Corp.* | 2,109,903 | |||||||||
| 19,430 | IPG Photonics Corp.* | 466,320 | |||||||||
| 108,545 | Microsemi Corp.* | 2,132,909 | |||||||||
| 149,519 | MIPS Technologies, Inc.*,# | 1,241,008 | |||||||||
| 6,250 | Samsung Electronics Company, Ltd.** | 4,119,623 | |||||||||
| 70,362 | Silicon-On-Insulator Technologies (SOITEC)*,** | 2,503,143 | |||||||||
| 86,855 | SiRF Technology Holdings, Inc.*,# | 2,216,540 | |||||||||
| 105,455 | Texas Instruments, Inc.** | 3,037,104 | |||||||||
| 21,800,619 | |||||||||||
| Shares or Principal Amount | Value | ||||||||||
| Electronic Forms - 1.6% | |||||||||||
| 61,793 | Adobe Systems, Inc.* | $ | 2,540,928 | ||||||||
| Electronic Measuring Instruments - 1.8% | |||||||||||
| 3,300 | Keyence Corp.** | 817,756 | |||||||||
| 39,635 | Trimble Navigation, Ltd.* | 2,010,683 | |||||||||
| 2,828,439 | |||||||||||
| Energy - Alternate Sources - 4.1% | |||||||||||
| 12,950 | First Solar, Inc.* | 385,910 | |||||||||
| 48,655 | SunPower Corp. - Class A*,# | 1,808,506 | |||||||||
| 126,480 | Suntech Power Holdings Company, Ltd. (ADR)*,# | 4,301,585 | |||||||||
| 6,496,001 | |||||||||||
| Enterprise Software/Services - 2.5% | |||||||||||
| 100,525 | Oracle Corp.* | 1,722,999 | |||||||||
| 41,632 | SAP A.G.** | 2,216,929 | |||||||||
| 3,939,928 | |||||||||||
| Entertainment Software - 2.7% | |||||||||||
| 145,649 | Activision, Inc.*,**,# | 2,510,989 | |||||||||
| 35,445 | Electronic Arts, Inc.* | 1,785,010 | |||||||||
| 4,295,999 | |||||||||||
| E-Services/Consulting - 0.5% | |||||||||||
| 47,535 | RightNow Technologies, Inc.*,# | 818,553 | |||||||||
| Internet Connectivity Services - 1.1% | |||||||||||
| 37,310 | NDS Group PLC (ADR)*,** | 1,802,446 | |||||||||
| Internet Infrastructure Software - 0.4% | |||||||||||
| 13,130 | Akamai Technologies, Inc.*,# | 697,466 | |||||||||
| Internet Security - 1.5% | |||||||||||
| 52,970 | Check Point Software Technologies, Ltd. (U.S. Shares)* | 1,161,102 | |||||||||
| 55,615 | Symantec Corp.* | 1,159,573 | |||||||||
| 2,320,675 | |||||||||||
| Medical - Drugs - 1.1% | |||||||||||
| 99,205 | Cubist Pharmaceuticals, Inc.* | 1,796,603 | |||||||||
| Medical Instruments - 1.0% | |||||||||||
| 43,215 | St. Jude Medical, Inc.* | 1,579,940 | |||||||||
| Networking Products - 1.9% | |||||||||||
| 164,075 | Juniper Networks, Inc.* | 3,107,581 | |||||||||
| Retail - Computer Equipment - 0.8% | |||||||||||
| 24,345 | GameStop Corp. - Class A* | 1,341,653 | |||||||||
| Retail - Consumer Electronics - 1.8% | |||||||||||
| 22,955 | Best Buy Company, Inc. | 1,129,156 | |||||||||
| 20,210 | Yamada Denki Company, Ltd.** | 1,715,231 | |||||||||
| 2,844,387 | |||||||||||
| Semiconductor Components/Integrated Circuits - 5.8% | |||||||||||
| 152,635 | Actions Semiconductor Company, Ltd. (ADR)* | 1,266,871 | |||||||||
| 175,360 | Cypress Semiconductor Corp.*,# | 2,958,323 | |||||||||
| 121,405 | Marvell Technology Group, Ltd.* | 2,329,762 | |||||||||
| 255,000 | Siliconware Precision Industries Co.** | 400,675 | |||||||||
| 1,133,075 | Taiwan Semiconductor Manufacturing Company, Ltd.** | 2,347,171 | |||||||||
| 9,302,802 | |||||||||||
| Semiconductor Equipment - 2.0% | |||||||||||
| 64,417 | ASM Lithography Holding N.V. (U.S. Shares)*,**,# | 1,586,590 | |||||||||
| 31,230 | KLA-Tencor Corp. | 1,553,693 | |||||||||
| 3,140,283 | |||||||||||
| Telecommunication Equipment - 1.2% | |||||||||||
| 159,694 | Arris Group, Inc.*,# | 1,997,772 | |||||||||
See Notes to Schedule of Investments and Financial Statements.
6 Janus Aspen Series December 31, 2006
Schedule of Investments
As of December 31, 2006
| Shares or Principal Amount | Value | ||||||||||
| Telecommunication Equipment - Fiber Optics - 2.4% | |||||||||||
| 154,920 | Corning, Inc.* | $ | 2,898,554 | ||||||||
| 45,215 | Oplink communications, Inc.*,# | 929,620 | |||||||||
| 3,828,174 | |||||||||||
| Telecommunication Services - 3.0% | |||||||||||
| 65,900 | Amdocs, Ltd. (U.S. Shares)*,** | 2,553,625 | |||||||||
| 70,145 | NeuStar, Inc. - Class A* | 2,275,504 | |||||||||
| 4,829,129 | |||||||||||
| Television - 0.6% | |||||||||||
| 89,884 | British Sky Broadcasting Group PLC** | 918,674 | |||||||||
| Web Hosting/Design - 1.4% | |||||||||||
| 30,225 | Equinix, Inc.* | 2,285,615 | |||||||||
| Web Portals/Internet Service Providers - 3.5% | |||||||||||
| 2,665 | Google, Inc. - Class A* | 1,227,179 | |||||||||
| 169,180 | Yahoo!, Inc.*,** | 4,320,857 | |||||||||
| 5,548,036 | |||||||||||
| Wireless Equipment - 5.8% | |||||||||||
| 35,860 | Crown Castle International Corp.* | 1,158,278 | |||||||||
| 96,450 | Nokia Oyj (ADR) | 1,959,864 | |||||||||
| 99,425 | QUALCOMM, Inc. | 3,757,270 | |||||||||
| 59,990 | Telefonaktiebolaget LM Ericsson (ADR) | 2,413,398 | |||||||||
| 9,288,810 | |||||||||||
| Total Common Stock (cost $116,006,144) | 147,290,149 | ||||||||||
| Corporate Bonds - 0% | |||||||||||
| Computers - Peripheral Equipment - 0% | |||||||||||
| $ | 1,000,000 | Candescent Technologies Corp., 8.00% convertible senior subordinated debentures due 5/1/03 (144A)‡,º,ºº,§ (cost $148,698) | 0 | ||||||||
| Equity-Linked Structured Notes - 0.5% | |||||||||||
| Finance - Investment Bankers/Brokers - 0.5% | |||||||||||
| 1,800 | Goldman Sachs Group, Inc., convertible (Google Corp.), 0% (144A)§ (cost $725,554) | 786,994 | |||||||||
| U.S. Treasury Notes - 0.2% | |||||||||||
| $ | 375,000 | U.S. Treasury Notes, 3.375% due 2/28/07** (cost $374,027) | 374,033 | ||||||||
| Money Markets - 7.4% | |||||||||||
| 3,249,357 | Janus Institutional Cash Reserves Fund, 5.29% | 3,249,357 | |||||||||
| 8,530,680 | Janus Money Market Fund, 5.24% | 8,530,680 | |||||||||
| Total Money Markets (cost $11,780,037) | 11,780,037 | ||||||||||
| Other Securities - 10.8% | |||||||||||
| 17,366,293 | State Street Navigator Securities Lending Prime Portfolio† (cost $17,366,293) | 17,366,293 | |||||||||
| Total Investments (total cost $146,400,753) – 111.1% | 177,597,506 | ||||||||||
| Securities Sold Short - (0.2)% | |||||||||||
| Computers - (0.1)% | |||||||||||
| 10,345 | Palm, Inc.* | (145,761 | ) | ||||||||
| Electronic Components – Semiconductors - (0.1)% | |||||||||||
| 10,835 | Micron Technology, Inc.* | (151,257 | ) | ||||||||
| Total Securities Sold Short (total proceeds $315,448) | (297,018 | ) | |||||||||
| Liabilities, net of Cash, Receivables and Other Assets – (10.9)% | (17,478,932 | ) | |||||||||
| Net Assets – 100% | $ | 159,821,556 | |||||||||
Summary of Investments by Country
| Country | Value | % of Investment Securities | |||||||||
| Bermuda | $ | 2,329,762 | 1.3 | % | |||||||
| Brazil | 3,134,071 | 1.8 | % | ||||||||
| Canada | 1,708,419 | 1.0 | % | ||||||||
| Cayman Islands | 5,568,456 | 3.1 | % | ||||||||
| Finland | 1,959,864 | 1.1 | % | ||||||||
| France | 2,503,143 | 1.4 | % | ||||||||
| Germany | 2,216,929 | 1.2 | % | ||||||||
| India | 1,764,569 | 1.0 | % | ||||||||
| Israel | 1,161,102 | 0.6 | % | ||||||||
| Japan | 7,912,904 | 4.5 | % | ||||||||
| Netherlands | 3,618,226 | 2.0 | % | ||||||||
| South Korea | 5,206,671 | 2.9 | % | ||||||||
| Sweden | 2,413,398 | 1.4 | % | ||||||||
| Switzerland | 2,159,944 | 1.2 | % | ||||||||
| Taiwan | 4,895,387 | 2.8 | % | ||||||||
| United Kingdom | 10,039,652 | 5.7 | % | ||||||||
| United States†† | 118,707,991 | 67.0 | % | ||||||||
| Total | $ | 177,300,488 | 100.0 | % | |||||||
†† Includes Short-Term Securities and Other Securities (50.5% excluding Short-Term Securities and Other Securities)
Forward Currency Contracts, Open
| Currency Sold and Settlement Date | Currency Units Sold | Currency Value in $U.S. | Unrealized Gain/(Loss) | ||||||||||||
| British Pound 3/15/07 | 845,000 | $ | 1,654,706 | $ | (77,336 | ) | |||||||||
| Euro 1/11/07 | 1,650,000 | 2,179,422 | (75,672 | ) | |||||||||||
| Japanese Yen 1/11/07 | 137,000,000 | 1,153,360 | 61,130 | ||||||||||||
| South Korean Won 3/15/07 | 1,270,000,000 | 1,369,164 | (38,764 | ) | |||||||||||
| Taiwan Dollar 3/15/07 | 35,000,000 | 1,082,541 | (15,793 | ) | |||||||||||
| Total | $ | 7,439,193 | $ | (146,435 | ) | ||||||||||
| Value | |||||||
| Schedule of Written Options – Calls | |||||||
| Activision, Inc. Expires May 2007 696 Contracts Exercise price $20.00 | $ | (48,720 | ) | ||||
| Apple Computers, Inc. Expires April 2007 89 contracts Exercise price $100.00 | (29,370 | ) | |||||
| Total Written Options – Calls | |||||||
| 785 contracts (premiums received $112,297) | $(78,090) | ||||||
| Schedule of Written Options – Puts | |||||||
| Apple Computers, Inc. Expires April 2007 50 contracts Exercise price $70.00 | $ | (9,750 | ) | ||||
| Total of Written Options – Puts | |||||||
| 50 contracts (premiums received $14,200) | $(9,750) | ||||||
See Notes to Schedule of Investments and Financial Statements.
Janus Aspen Series December 31, 2006 7
Statement of Assets and Liabilities
| As of December 31, 2006 (all numbers in thousands except net asset value per share) | Janus Aspen Global Technology Portfolio | ||||||
| Assets: | |||||||
| Investments at cost(1) | $ | 146,401 | |||||
| Investments at value(1) | $ | 177,598 | |||||
| Cash denominated in foreign currency (cost $58) | 57 | ||||||
| Deposits with broker for short sales | 315 | ||||||
| Receivables: | |||||||
| Investments sold | 210 | ||||||
| Portfolio shares sold | 26 | ||||||
| Dividends | 22 | ||||||
| Interest | 64 | ||||||
| Other assets | 2 | ||||||
| Forward currency contracts | 61 | ||||||
| Total Assets | 178,355 | ||||||
| Liabilities: | |||||||
| Payables: | |||||||
| Short sales, at value (premiums received of $315) | 297 | ||||||
| Options written, at value | 88 | ||||||
| Collateral for securities loaned (Note 1) | 17,366 | ||||||
| Due to custodian | 221 | ||||||
| Investments purchased | 6 | ||||||
| Portfolio shares repurchased | 154 | ||||||
| Advisory fees | 87 | ||||||
| Transfer agent fees and expenses | 1 | ||||||
| Distribution fees - Service Shares | 28 | ||||||
| Distribution fees - Service II Shares | 5 | ||||||
| Non-interested Trustees' fees and expenses | 2 | ||||||
| Foreign tax liability | 12 | ||||||
| Accrued expenses | 59 | ||||||
| Forward currency contracts | 207 | ||||||
| Total Liabilities | 18,533 | ||||||
| Net Assets | $ | 159,822 | |||||
| Net Assets Consist of: | |||||||
| Capital (par value and paid-in-surplus)* | $ | 546,571 | |||||
| Undistributed net investment income/(loss)* | (1 | ) | |||||
| Undistributed net realized gain/(loss) from investments and foreign currency transactions* | (417,848 | ) | |||||
| Unrealized net appreciation/(depreciation) of investments and foreign currency translations(2) | 31,100 | ||||||
| Total Net Assets | $ | 159,822 | |||||
| Net Assets - Institutional Shares | $ | 2,673 | |||||
| Shares Outstanding, $0.001 Par Value (unlimited shares authorized) | 647 | ||||||
| Net Asset Value Per Share | $ | 4.13 | |||||
| Net Assets - Service Shares | $ | 132,281 | |||||
| Shares Outstanding, $0.001 Par Value (unlimited shares authorized) | 31,003 | ||||||
| Net Asset Value Per Share | $ | 4.27 | |||||
| Net Assets - Service II Shares | $ | 24,868 | |||||
| Shares Outstanding, $0.001 Par Value (unlimited shares authorized) | 5,720 | ||||||
| Net Asset Value Per Share | $ | 4.35 | |||||
* See Note 3 in Notes to Financial Statements.
(1) Investments at cost and value include $16,950,231 of securities loaned for Janus Aspen Global Technology Portfolio (Note 1).
(2) Net of foreign taxes on investments of $11,918 for Janus Aspen Global Technology Portfolio.
See Notes to Financial Statements.
8 Janus Aspen Series December 31, 2006
Statement of Operations
| For the fiscal year ended December 31, 2006 (all numbers in thousands) | Janus Aspen Global Technology Portfolio | ||||||
| Investment Income: | |||||||
| Interest | $ | 163 | |||||
| Securities lending income | 48 | ||||||
| Dividends | 1,141 | ||||||
| Dividends from affiliates | 262 | ||||||
| Foreign tax withheld | (64 | ) | |||||
| Total Investment Income | 1,550 | ||||||
| Expenses: | |||||||
| Advisory fees | 1,036 | ||||||
| Transfer agent expenses | 6 | ||||||
| Registration fees | 4 | ||||||
| Custodian fees | 32 | ||||||
| Professional fees | 22 | ||||||
| Non-interested Trustees' fees and expenses | 9 | ||||||
| Distribution fees - Service Shares | 335 | ||||||
| Distribution fees - Service II Shares | 64 | ||||||
| Printing fees | 104 | ||||||
| Proxy fees | 76 | ||||||
| Other expenses | 63 | ||||||
| Non-recurring costs (Note 2) | – | ||||||
| Costs assumed by Janus Capital Management LLC (Note 2) | – | ||||||
| Total Expenses | 1,751 | ||||||
| Expense and Fee Offset | (7 | ) | |||||
| Net Expenses | 1,744 | ||||||
| Net Investment Income/(Loss) | (194 | ) | |||||
| Net Realized and Unrealized Gain/(Loss) on Investments: | |||||||
| Net realized gain/(loss) from securities transactions | 26,142 | ||||||
| Net realized gain/(loss) from foreign currency transactions | (328 | ) | |||||
| Net realized gain/(loss) from option contracts | 40 | ||||||
| Change in unrealized net appreciation/(depreciation) of investments and foreign currency translations | (13,627 | )(1) | |||||
| Net Gain/(Loss) on Investments | 12,227 | ||||||
| Net Increase/(Decrease) in Net Assets Resulting from Operations | $ | 12,033 | |||||
(1) Net of foreign taxes on investments of $11,918 for Janus Aspen Global Technology Portfolio.
See Notes to Financial Statements.
Janus Aspen Series December 31, 2006 9
Statements of Changes in Net Assets
For the fiscal year ended December 31 | Janus Aspen Global Technology Portfolio | ||||||||||
| (all numbers in thousands) | 2006 | 2005 | |||||||||
| Operations: | |||||||||||
| Net investment income/(loss) | $ | (194 | ) | $ | (377 | ) | |||||
| Net realized gain/(loss) from investment and foreign currency transactions | 25,814 | 8,888 | |||||||||
| Net realized gain/(loss) from option contracts | 40 | – | |||||||||
| Change in unrealized net appreciation/(depreciation) of investments foreign currency translations | (13,627 | ) | 7,478 | ||||||||
| Net Increase/(Decrease) in Net Assets Resulting from Operations | 12,033 | 15,989 | |||||||||
| Dividends and Distributions to Shareholders: | |||||||||||
| Net investment income * | |||||||||||
| Institutional Shares | – | – | |||||||||
| Service Shares | – | – | |||||||||
| Service II Shares | – | – | |||||||||
| Net realized gain from investment transactions* | |||||||||||
| Institutional Shares | – | – | |||||||||
| Service Shares | – | – | |||||||||
| Service II Shares | – | – | |||||||||
| Net Decrease from Dividends and Distributions | – | – | |||||||||
| Capital Share Transactions: | |||||||||||
| Shares sold | |||||||||||
| Institutional Shares | 555 | 260 | |||||||||
| Service Shares | 15,099 | 13,238 | |||||||||
| Service II Shares | 4,128 | 3,814 | |||||||||
| Redemption fees | |||||||||||
| Service II Shares | 15 | 13 | |||||||||
| Reinvested dividends and distributions | |||||||||||
| Institutional Shares | – | – | |||||||||
| Service Shares | – | – | |||||||||
| Service II Shares | – | – | |||||||||
| Shares repurchased | |||||||||||
| Institutional Shares | (1,075 | ) | (1,960 | ) | |||||||
| Service Shares | (30,917 | ) | (39,648 | ) | |||||||
| Service II Shares | (7,059 | ) | (7,844 | ) | |||||||
| Net Increase/(Decrease) from Capital Share Transactions | (19,254 | ) | (32,127 | ) | |||||||
| Net Increase/(Decrease) in Net Assets | (7,221 | ) | (16,138 | ) | |||||||
| Net Assets: | |||||||||||
| Beginning of period | 167,043 | 183,181 | |||||||||
| End of period | $ | 159,822 | $ | 167,043 | |||||||
| Undistributed net investment income/(loss)* | $ | (1 | ) | $ | (2 | ) | |||||
* See Note 3 in Notes to Financial Statements.
See Notes to Financial Statements.
10 Janus Aspen Series December 31, 2006
Financial Highlights
Institutional Shares
| Janus Aspen Global Technology Portfolio | |||||||||||||||||||||||
| For a share outstanding during each fiscal year ended December 31 | 2006 | 2005 | 2004 | 2003 | 2002 | ||||||||||||||||||
| Net Asset Value, Beginning of Period | $ | 3.82 | $ | 3.42 | $ | 3.39 | $ | 2.31 | $ | 3.90 | |||||||||||||
| Income from Investment Operations: | |||||||||||||||||||||||
| Net investment income/(loss) | .03 | .05 | .02 | (.01 | ) | .02 | |||||||||||||||||
| Net gain/(loss) on securities (both realized and unrealized) | .28 | .35 | .01 | 1.09 | (1.61 | ) | |||||||||||||||||
| Total from Investment Operations | .31 | .40 | .03 | 1.08 | (1.59 | ) | |||||||||||||||||
| Less Distributions: | |||||||||||||||||||||||
| Dividends (from net investment income)* | – | – | – | – | – | ||||||||||||||||||
| Distributions (from capital gains)* | – | – | – | – | – | ||||||||||||||||||
| Total Distributions | – | – | – | – | – | ||||||||||||||||||
| Net Asset Value, End of Period | $ | 4.13 | $ | 3.82 | $ | 3.42 | $ | 3.39 | $ | 2.31 | |||||||||||||
| Total Return | 8.12 | % | 11.70 | % | 0.88 | % | 46.75 | % | (40.77 | )% | |||||||||||||
| Net Assets, End of Period (in thousands) | $ | 2,673 | $ | 2,989 | $ | 4,423 | $ | 5,580 | $ | 2,721 | |||||||||||||
| Average Net Assets for the Period (in thousands) | $ | 2,823 | $ | 3,100 | $ | 4,887 | $ | 3,871 | $ | 3,974 | |||||||||||||
| Ratio of Gross Expenses to Average Net Assets(1) | 0.83 | % | 0.73 | % | 0.72 | % | 0.85 | % | 0.72 | % | |||||||||||||
| Ratio of Net Expenses to Average Net Assets(1) | 0.83 | % | 0.73 | % | 0.72 | % | 0.85 | % | 0.72 | % | |||||||||||||
| Ratio of Net Investment Income/(Loss) to Average Net Assets | 0.13 | % | 0.01 | % | 0.19 | % | (0.22 | )% | (0.05 | )% | |||||||||||||
| Portfolio Turnover Rate | 89 | % | 42 | % | 30 | % | 46 | % | 70 | % | |||||||||||||
Service Shares
| Janus Aspen Global Technology Portfolio | |||||||||||||||||||||||
| For a share outstanding during each fiscal year ended December 31 | 2006 | 2005 | 2004 | 2003 | 2002 | ||||||||||||||||||
| Net Asset Value, Beginning of Period | $ | 3.96 | $ | 3.55 | $ | 3.53 | $ | 2.41 | $ | 4.08 | |||||||||||||
| Income from Investment Operations: | |||||||||||||||||||||||
| Net investment income/(loss) | – | (2) | – | (2) | – | (2) | – | (2) | – | (2) | |||||||||||||
| Net gain/(loss) on securities (both realized and unrealized) | .31 | .41 | .02 | 1.12 | (1.67 | ) | |||||||||||||||||
| Total from Investment Operations | .31 | .41 | .02 | 1.12 | (1.67 | ) | |||||||||||||||||
| Less Distributions: | |||||||||||||||||||||||
| Dividends (from net investment income)* | – | – | – | – | – | ||||||||||||||||||
| Distributions (from capital gains)* | – | – | – | – | – | ||||||||||||||||||
| Total Distributions | – | – | – | – | – | ||||||||||||||||||
| Net Asset Value, End of Period | $ | 4.27 | $ | 3.96 | $ | 3.55 | $ | 3.53 | $ | 2.41 | |||||||||||||
| Total Return | 7.83 | % | 11.55 | % | 0.57 | % | 46.47 | % | (40.93 | )% | |||||||||||||
| Net Assets, End of Period (in thousands) | $ | 132,281 | $ | 138,172 | $ | 151,354 | $ | 180,513 | $ | 127,656 | |||||||||||||
| Average Net Assets for the Period (in thousands) | $ | 134,175 | $ | 134,959 | $ | 161,072 | $ | 147,151 | $ | 191,037 | |||||||||||||
| Ratio of Gross Expenses to Average Net Assets(1) | 1.08 | % | 0.98 | % | 0.97 | % | 1.10 | % | 0.97 | % | |||||||||||||
| Ratio of Net Expenses to Average Net Assets(1) | 1.08 | % | 0.98 | % | 0.97 | % | 1.10 | % | 0.97 | % | |||||||||||||
| Ratio of Net Investment Income/(Loss) to Average Net Assets | (0.12 | )% | (0.24 | )% | (0.06 | )% | (0.44 | )% | (0.29 | )% | |||||||||||||
| Portfolio Turnover Rate | 89 | % | 42 | % | 30 | % | 46 | % | 70 | % | |||||||||||||
* See Note 3 in Notes to Financial Statements.
(1) See Note 4 in Notes to Financial Statements.
(2) Net investment income/(loss) aggregated less than $.01 on a per share basis for the fiscal year ended.
See Notes to Financial Statements.
Janus Aspen Series December 31, 2006 11
Financial Highlights
Service II Shares
| Janus Aspen Global Technology Portfolio | |||||||||||||||||||||||
| For a share outstanding during each fiscal year ended December 31 | 2006 | 2005 | 2004 | 2003 | 2002(1) | ||||||||||||||||||
| Net Asset Value, Beginning of Period | $ | 4.03 | $ | 3.62 | $ | 3.59 | $ | 2.44 | $ | 4.13 | |||||||||||||
| Income from Investment Operations: | |||||||||||||||||||||||
| Net investment income/(loss) | – | (2) | – | (2) | – | (2) | – | (2) | .01 | ||||||||||||||
| Net gain/(loss) on securities (both realized and unrealized) | .32 | .41 | .03 | 1.14 | (1.71 | ) | |||||||||||||||||
| Total from Investment Operations | .32 | .41 | .03 | 1.14 | (1.70 | ) | |||||||||||||||||
| Distributions and Other: | |||||||||||||||||||||||
| Dividends (from net investment income)* | – | – | – | – | – | ||||||||||||||||||
| Distributions (from capital gains)* | – | – | – | – | – | ||||||||||||||||||
| Redemption fees | – | (3) | – | (3) | – | (3) | .01 | .01 | |||||||||||||||
| Total Distributions and Other | – | – | – | .01 | .01 | ||||||||||||||||||
| Net Asset Value, End of Period | $ | 4.35 | $ | 4.03 | $ | 3.62 | $ | 3.59 | $ | 2.44 | |||||||||||||
| Total Return | 7.94 | % | 11.33 | % | 0.84 | % | 47.13 | % | (40.92 | )% | |||||||||||||
| Net Assets, End of Period (in thousands) | $ | 24,868 | $ | 25,882 | $ | 27,404 | $ | 28,634 | $ | 13,911 | |||||||||||||
| Average Net Assets for the Period (in thousands) | $ | 25,605 | $ | 24,247 | $ | 25,926 | $ | 21,419 | $ | 6,085 | |||||||||||||
| Ratio of Gross Expenses to Average Net Assets(4) | 1.08 | % | 0.99 | % | 0.97 | % | 1.10 | % | 1.04 | % | |||||||||||||
| Ratio of Net Expenses to Average Net Assets(4) | 1.08 | % | 0.98 | % | 0.97 | % | 1.10 | % | 1.04 | % | |||||||||||||
| Ratio of Net Investment Income/(Loss) to Average Net Assets | (0.13 | )% | (0.25 | )% | (0.06 | )% | (0.44 | )% | (0.42 | )% | |||||||||||||
| Portfolio Turnover Rate | 89 | % | 42 | % | 30 | % | 46 | % | 70 | % | |||||||||||||
* See Note 3 in Notes to Financial Statements.
(1) Certain prior year amounts have been reclassified to conform to current year presentation.
(2) Net investment income/(loss) aggregated less than $.01 on a per share basis for the fiscal year ended.
(3) Redemption fees aggregated less than $.01 on a per share basis for the fiscal year ended.
(4) See Note 4 in Notes to Financial Statements.
See Notes to Financial Statements.
12 Janus Aspen Series December 31, 2006
Notes to Schedule of Investments
| Lipper Variable Annuity Science and Technology Funds | Funds that invest at least 65% of their equity portfolio in science and technology stocks. | ||||||
| Morgan Stanley Capital International World Information Technology IndexSM | A capitalization weighted index that monitors the performance of information technology stocks from around the world. | ||||||
| S&P 500® Index | The Standard & Poor's Composite Index of 500 stocks, a widely recognized, unmanaged index of common stock prices. | ||||||
| 144A | Securities sold under Rule 144A of the Securities Act of 1933 are subject to legal and/or contractual restrictions on resale and may not be publicly sold without registration under the 1933 Act. | ||||||
| ADR | American Depositary Receipt | ||||||
| PLC | Public Limited Company | ||||||
| U.S. Shares | Securities of foreign companies trading on an American Stock Exchange. | ||||||
* Non-income-producing security.
** A portion of this security has been segregated by the custodian to cover margin or segregation requirements on open futures contracts, forward currency contracts, options contracts, short sales and/or securities with extended settlement dates.
‡ Rate is subject to change. Rate shown reflects rate as of December 31, 2006.
º Security is a defaulted security in the Portfolio with accrued interest in the amount of $40,000 that was written-off December 10, 2001.
# Loaned security; a portion or all of the security is on loan at December 31, 2006.
† The security is purchased with the cash collateral received from securities on loan (Note 1).
ºº Schedule of Fair Valued Securities (as of December 31, 2006)
| Value | Value as a % of Net Assets | ||||||||||
| Janus Aspen Global Technology Portfolio | |||||||||||
| Candescent Technologies Corp., 8.00% convertible senior subordinated debentures, due 5/1/03 (144A) | $ | – | 0.0 | % | |||||||
Securities are valued at "fair value" pursuant to procedures adopted by the Portfolio's Trustees. The Schedule of Fair Valued Securities does not include international activities fair valued pursuant to a systematic fair valuation model.
§ Schedule of Restricted and Illiquid Securities (as of December 31, 2006)
| Acquisition Date | Acquisition Cost | Value | Value as % of Net Assets | ||||||||||||||||
| Janus Aspen Global Technology Portfolio | |||||||||||||||||||
| Candescent Technologies Corp., 8.00% convertible senior subordinated debentures, due 5/1/03 (144A)ºº | 3/6/00 | $ | 86,320 | $ | – | 0.0 | % | ||||||||||||
| Goldman Sachs Group, Inc. convertible, (Google Corp.), 0%, (144A) | 9/28/06 | 725,554 | 786,994 | 0.5 | % | ||||||||||||||
| $ | 811,874 | $ | 786,994 | 0.5 | % | ||||||||||||||
The Portfolio has registration rights for certain restricted securities held as of December 31, 2006. The issuer incurs all registration costs.
Aggregate collateral segregated to cover margin or segregation requirements on open futures contracts, forward currency contracts, options contracts, short sales and/or securities with extended settlement dates as of December 31, 2006 are noted below.
| Portfolio | Aggregate Value | ||||||
| Janus Aspen Global Technology Portfolio | $ | 39,796,211 | |||||
The interest rate for variable rate notes is based upon an index or market interest rates and is subject to change. Rates in the security description are as of December 31, 2006.
Janus Aspen Series December 31, 2006 13
Notes to Financial Statements
The following section describes the organization and significant accounting policies and provides more detailed information about the schedules and tables that appear throughout this report. In addition, the Notes to Financial Statements explain the methods used in preparing and presenting this report.
1.ORGANIZATION AND SIGNIFICANT ACCOUNTING POLICIES
Janus Aspen Global Technology Portfolio (the "Portfolio") is a series fund. The Portfolio is part of Janus Aspen Series (the "Trust"), which is organized as a Delaware statutory trust and is registered under the Investment Company Act of 1940 (the "1940 Act") as an open-end management investment company. The Trust offers seventeen Portfolios, which include multiple series of shares, with differing investment objectives and policies. The Portfolio invests primarily in equity securities. The Portfolio is classified as diversified, as defined in the 1940 Act. The Portfolio is a no-load investment.
The Portfolio currently offers three classes of shares: Institutional Shares, Service Shares and Service II Shares. Institutional Shares are offered only in connection with investment in and payments under variable insurance contracts and to qualified retirement plans. Service Shares and Service II Shares are offered only in connection with investment in and payments under variable insurance contracts and to qualified retirement plans that require a fee from Portfolio assets to procure distribution and administrative services to contract owners and plan participants. For Service II Shares, a redemption fee may be imposed on interests in separate accounts or plans held 60 days or less.
The following accounting policies have been consistently followed by the Portfolio and are in conformity with accounting principles generally accepted in the United States of America in the investment company industry.
Investment Valuation
Securities are valued at the last sales price or the official closing price for securities traded on a principal securities exchange (U.S. or foreign) and on the NASDAQ National Market. Securities traded on over-the-counter markets and listed securities for which no sales are reported are valued at the latest bid price (or yield equivalent thereof) obtained from one or more dealers transacting in a market for such securities or by a pricing service approved by the Portfolio's Trustees. Short-term securities with maturities of 60 days or less may be valued at amortized cost, which approximates market value. Debt securities with a remaining maturity of greater than 60 days are valued in accordance with the evaluated bid price supplied by the pricing service. The evaluated bid price supplied by the pricing service is an evaluation that reflects such factors as security prices, yields, maturities and ratings. Foreign securities and currencies are converted to U.S. dollars using the applicable exchange rate in effect as of the daily close of the New York Stock Exchange ("NYSE"). When market quotations are not readily available or deemed unreliable, or events or circumstances that may affect the value of portfolio securities held by the Portfolio are identified between the closing of their principal markets and the time the net asset value ("NAV") is determined, securities may be valued at fair value as determined in good faith under procedures established by and under the supervision of the Portfolio's Trustees. The Portfolio may use a systematic fair valuation model provided by an independent third party to value international equity securities in order to adjust for stale pricing, which may occur between the close of certain foreign exchanges and the NYSE.
Investment Transactions and Investment Income
Investment transactions are accounted for as of the date purchased or sold (trade date). Dividend income is recorded on the ex-dividend date. Certain dividends from foreign securities will be recorded as soon as the Trust is informed of the dividend if such information is obtained subsequent to the ex-dividend date and may be subject to withholding taxes in these jurisdictions. Interest income is recorded on the accrual basis and includes amortization of premiums and accretion of discounts. Gains and losses are determined on the identified cost basis, which is the same basis used for federal income tax purposes. Income, as well as gains and losses, both realized and unrealized, are allocated daily to each class of shares based upon the ratio of net assets represented by each class as a percentage of total net assets.
Expenses
The Portfolio bears expenses incurred specifically on its behalf as well as a portion of general expenses. Each class of shares bears expenses incurred specifically on its behalf and, in addition, each class bears a portion of general expenses, which may be based upon relative net assets of each class. Expenses are allocated daily to each class of shares based upon the ratio of net assets represented by each class as a percentage of total net assets. Expenses directly attributable to a specific class of shares are charged against the operations of such class.
Securities Lending
Under procedures adopted by the Trustees, the Portfolio may lend securities to qualified parties (typically brokers or other financial institutions) who need to borrow securities in order to complete certain transactions such as covering short sales, avoiding failures to deliver securities or completing arbitrage activities. The Portfolio may seek to earn additional income through securities lending. There is the risk of delay in recovering a loaned security or the risk of loss in collateral rights if the borrower fails financially. In addition, Janus Capital Management LLC ("Janus Capital") makes efforts to balance the benefits and risks from granting such loans.
14 Janus Aspen Series December 31, 2006
The Portfolio does not have the right to vote on securities while they are being lent; however, the Portfolio may attempt to call back the loan and vote the proxy. All loans will be continuously secured by collateral which may consist of cash, U.S. Government securities, domestic and foreign short-term debt instruments, letters of credit, money market mutual funds or other money market accounts, or such other collateral permitted by the Securities and Exchange Commission ("SEC"). Cash collateral may be invested in affiliated money market funds or other accounts advised by Janus Capital to the extent consistent with exemptive relief obtained from the SEC or as permitted by the 1940 Act and rules promulgated thereunder. Cash collateral may also be invested in unaffiliated money market funds or other accounts advised by Janus Capital to the extent consistent with exemptive relief obtained from the SEC or as permitted by the 1940 Act a nd rules promulgated thereunder. Cash collateral may also be invested in unaffiliated money market funds or other accounts.
State Street Bank and Trust Company (the "Lending Agent") may also invest the cash collateral in the State Street Navigator Securities Lending Prime Portfolio or investments in unaffiliated money market funds or accounts, mutually agreed to by the Portfolio and the Lending Agent, that comply with Rule 2a-7 under the 1940 Act relating to money market funds.
As of December 31, 2006, the Portfolio had on loan securities valued as indicated:
| Portfolio | Value at December 31, 2006 | ||||||
| Janus Aspen Global Technology Portfolio | $ | 16,950,231 | |||||
As of December 31, 2006, the Portfolio received cash collateral for securities lending activity as indicated:
| Portfolio | Cash Collateral at December 31, 2006 | ||||||
| Janus Aspen Global Technology Portfolio | $ | 17,366,293 | |||||
As of December 31, 2006, all cash collateral received by the Portfolio was invested in the State Street Navigator Securities Lending Prime Portfolio.
The value of the collateral must be at least 102% of the market value of the loaned securities that are denominated in U.S. dollars and 105% of the market value of the loaned securities that are not denominated in U.S. dollars. Loaned securities and related collateral are marked-to-market each business day based upon the market value of the respective securities at the close of business, employing the most recent available pricing information. Collateral levels are then adjusted based upon this mark-to-market evaluation.
The borrower pays fees at the Portfolio's direction to its Lending Agent. The Lending Agent may retain a portion of the interest earned. The cash collateral invested by the Lending Agent is disclosed in the Schedule of Investments. The lending fees and the Portfolio's portion of the interest income earned on cash collateral are included on the Statement of Operations (if applicable).
Interfund Lending
Pursuant to an exemptive order received from the SEC, the Portfolio may be party to an interfund lending agreement between the Portfolio and other Janus Capital sponsored mutual funds, which permits it to borrow or lend cash at a rate beneficial to both the borrowing and lending funds. Outstanding borrowings from all sources totaling 10% or more of the borrowing Portfolio's total assets must be collateralized at 102% of the outstanding principal value of the loan; loans of less than 10% may be unsecured. During the fiscal year ended December 31, 2006, there were no outstanding interfund borrowing or lending arrangements for the Portfolio.
Forward Currency Transactions
The Portfolio may enter into forward currency contracts in order to reduce its exposure to changes in foreign currency exchange rates on its foreign portfolio holdings and to lock in the U.S. dollar cost of firm purchase and sale commitments for securities denominated in or exposed to foreign currencies. A forward currency exchange contract is a commitment to purchase or sell a foreign currency at a future date at a negotiated rate. The gain or loss arising from the difference between the U.S. dollar cost of the original contract and the value of the foreign currency in U.S. dollars upon closing a contract is included in "Net realized gain/(loss) from foreign currency transactions" on the Statement of Operations (if applicable).
Forward currency contracts held by the Portfolio are fully collateralized by other securities, which are denoted in the accompanying Schedule of Investments (if applicable). The collateral is evaluated daily to ensure its market value equals or exceeds the current market value of the corresponding forward currency contracts.
Futures Contracts
The Portfolio may enter into futures contracts. The Portfolio intends to use such derivative instruments primarily to hedge or protect from adverse movements in securities prices, currency rates or interest rates. The use of futures contracts may involve risks such as the possibility of illiquid markets or imperfect correlation between the value of the contracts and the underlying securities, or that the counterparty will fail to perform its obligations.
Futures contracts are marked-to-market daily, and the daily variation margin is recorded as a receivable or payable on the Statement of Assets and Liabilities (if applicable). When a contract is closed, a realized gain or loss is recorded on the Statement of Operations equal to the difference between the
Janus Aspen Series December 31, 2006 15
Notes to Financial Statements (continued)
opening and closing value of the contract. Generally, futures contracts are marked-to-market (i.e., treated as realized and subject to distribution) for federal income tax purposes at fiscal year end. Securities designated as collateral for market value on futures contracts are noted in the Schedule of Investments. Such collateral is in the possession of the Portfolio's custodian. As of December 31, 2006, the Portfolio was not invested in futures contracts.
Options Contracts
The Portfolio may purchase or write put and call options on futures contracts or foreign currencies in a manner similar to that in which futures or forward contracts on foreign currencies will be utilized, and on portfolio securities for hedging purposes or as a substitute for an investment. The Portfolio generally invests in options to hedge against adverse movements in the value of portfolio holdings.
When an option is written, the Portfolio receives a premium and becomes obligated to sell or purchase the underlying security at a fixed price, upon exercise of the option. In writing an option, the Portfolio bears the market risk of an infavorable change in the price of the security underlying the written option. Exercise of an option written by the Portfolio could result in the Portfolio buying or selling a security at a price different from the current market value.
When an option is exercised, the proceeds on sales for a written call option, the purchase cost for a written put option, or the cost of the security for a purchased put or call option is adjusted by the amount of premium received or paid.
Holdings designated to cover outstanding written options are noted in the Schedule of Investments (if applicable). Options written are reported as a liability on the Statement of Assets and Liabilities (if applicable). Realized gains and losses are reported on the Statement of Operations (if applicable). The Portfolio recognized realized gains of $40,249 for written options during the fiscal year ended December 31, 2006.
The risk in writing a call option is that the Portfolio gives up the opportunity for profit if the market price of the security increases and the option is exercised. The risk in writing a put option is that the Portfolio may incur a loss if the market price of the security decreases and the option is exercised. The risk in buying an option is that the Portfolio pays a premium whether or not the option is exercised. The use of such instruments may involve certain additional risks as a result of unanticipated movement in the market. A lack of correlation between the value of an instrument underlying an option and the asset being hedged, or unexpected adverse price movements, could render the Portfolio's hedging strategy unsuccessful. In addition, there can be no assurance that a liquid secondary market will exist for any option purchased or sold. There is no limit to the loss that the Portfolio may recognize due to written call options.
Written option activity for the fiscal year ended December 31, 2006 was as follows:
| Call Options | Number of Options Contracts | Premiums Received | |||||||||
| Janus Aspen Global Technology Portfolio | |||||||||||
| Options outstanding at January 1, 2006 | – | – | |||||||||
| Options written | 957 | $ | 152,546 | ||||||||
| Options closed | – | – | |||||||||
| Options expired | (172 | ) | (40,249 | ) | |||||||
| Options exercised | – | – | |||||||||
| Options outstanding at December 31, 2006 | 785 | $ | 112,297 | ||||||||
| Put Options | Number of Options Contracts | Premiums Received | |||||||||
| Janus Aspen Global Technology Portfolio | |||||||||||
| Options outstanding at January 1, 2006 | – | – | |||||||||
| Options written | 50 | $ | 14,200 | ||||||||
| Options closed | – | – | |||||||||
| Options expired | – | – | |||||||||
| Options exercised | – | – | |||||||||
| Options outstanding at December 31, 2006 | 50 | $ | 14,200 | ||||||||
Short Sales
The Portfolio may engage in "short sales against the box." Short sales against the box involve selling either a security that the Portfolio owns, or a security equivalent in kind and amount to the security sold short that the Portfolio has the right to obtain, for delivery at a specified date in the future. The Portfolio may enter into a short sale against the box to hedge against anticipated declines in the market price of portfolio securities. If the value of the securities sold short increases prior to the scheduled delivery date, the Portfolio loses the opportunity to participate in the gain.
The Portfolio may also engage in "naked" short sales. Naked short sales involve the Portfolio selling a security it does not own to a purchaser at a specified price. To complete the transaction, the Portfolio must borrow the security to deliver it to the purchaser and buy that same security in the market to return it to the lender. Although the potential for gain is limited to the difference between the price at which the Portfolio sold the security short and the cost of borrowing the security, its potential for loss could be unlimited because there is no limit to the replacement cost of the borrowed security. There is no assurance that the Portfolio will be able to close out a short position at any particular time or at an acceptable price. A gain or a loss will be recognized upon termination of a short sale. There is no limit on the size of any loss that the Portfolio may recognize upon termination of a short sale. Short sales held by the Portfolio are fully collateralized by other securities, which are denoted in the accompanying Schedule of Investments (if applicable).
Foreign Currency Translations
The Portfolio does not isolate that portion of the results of operations resulting from changes in foreign exchange rates on investments from the fluctuations arising from changes in
16 Janus Aspen Series December 31, 2006
market prices of securities held at the date of the financial statements. Net unrealized appreciation or depreciation on investments and foreign currency translation arise from changes in the value of assets and liabilities, including investments in securities held at the date of the financial statements, resulting from changes in the exchange rates and changes in market prices of securities held.
Currency gains and losses are also calculated on payables and receivables that are denominated in foreign currencies. The payables and receivables are generally related to security transactions and income.
Foreign currency-denominated assets and forward currency contracts may involve more risks than domestic transactions, including currency risk, political and economic risk, regulatory risk and market risk. Risks may arise from the potential inability of a counterparty to meet the terms of a contract and from unanticipated movements in the value of foreign currencies relative to the U.S. dollar.
When-issued Securities
The Portfolio may purchase or sell securities on a when-issued or forward commitment basis. The price of the underlying securities and date when the securities will be delivered and paid for are fixed at the time the transaction is negotiated. Losses may arise due to changes in the market value of the securities or from the inability of counterparties to meet the terms of the contract. In connection with such purchases, the Portfolio may hold liquid assets as collateral with the Portfolio's custodian sufficient to cover the purchase price. As of December 31, 2006, the Portfolio was not invested in when-issued securities.
Equity-Linked Structured Notes
The Portfolio may invest in equity-linked structured notes. Equity-linked structured notes are derivative securities which are specially designed to combine the characteristics of one or more underlying securities and their equity derivatives in a single note form. The return and/or yield or income component may be based on the performance of the underlying equity securities, an equity index, and/or option positions. Equity-linked structured notes are typically offered in limited transactions by financial institutions in either registered or nonregistered form. An investment in equity-linked structured notes creates exposure to the credit risk of the issuing financial institution, as well as to the market risk of the underlying securities. There is no guaranteed return of principal with these securities and the appreciation potential of these securities may be limited by a maximum payment or call right. In certain cases, equity-linked struct ured notes may be more volatile and less liquid than less complex securities or other types of fixed-income securities. Such securities may exhibit price behavior that does not correlate with other fixed-income securities.
Initial Public Offerings
The Portfolio may invest in initial public offerings ("IPOs"). IPOs and other investment techniques may have a magnified performance impact on a fund with a small asset base. The Portfolio may not experience similar performance as its assets grow.
Additional Investment Risk
The Portfolio may be invested in lower-rated debt securities that have a higher risk of default or loss of value since these securities may be sensitive to economic changes, political changes or adverse developments specific to the issuer.
Restricted Security Transactions
Restricted securities held by the Portfolio may not be sold except in exempt transactions or in a public offering registered under the Securities Act of 1933. The risk of investing in such securities is generally greater than the risk of investing in the securities of widely held, publicly traded companies. Lack of a secondary market and resale restrictions may result in the inability of the Portfolio to sell a security at a fair price and may substantially delay the sale of the security. In addition, these securities may exhibit greater price volatility than securities for which secondary markets exist.
Dividend Distributions
The Portfolio generally makes semiannual distributions of substantially all of its investment income and an annual distribution of its net realized capital gains (if any). The majority of dividends and net realized capital gains distributions from the Portfolio may be automatically reinvested into additional shares of the Portfolio, based upon the discretion of the shareholder.
Estimates
The preparation of financial statements in conformity with accounting principles generally accepted in the United States of America requires management to make estimates and assumptions that affect the reported amount of assets and liabilities and disclosure of contingent assets and liabilities at the date of the financial statements and the reported amounts of income and expenses during the reporting period. Actual results could differ from those estimates.
Federal Income Taxes
No provision for income taxes is included in the accompanying financial statements, as the Portfolio intends to distribute to shareholders all taxable investment income and realized gains and otherwise comply with Subchapter M of the Internal Revenue Code applicable to regulated investment companies.
New Accounting Pronouncements
In July 2006, the Financial Accounting Standards Board ("FASB") issued interpretation No. 48, "Accounting for Uncertainty in Income Taxes – an Interpretation of FASB Statement No. 109" (the "Interpretation"). The Interpretation establishes for all entities, including pass-through entities such as the Portfolio, a minimum threshold for financial statement recognition of the benefit of positions taken in filing tax returns (including whether an entity is taxable in a particular jurisdiction), and requires certain expanded tax disclosures. A calendar year open-end or closed-end fund would implement the Interpretation not later than June 29, 2007 (the last business day of the semi-annual reporting period) and will also apply to all open tax years as of the date of effectiveness. Management has recently begun to evaluate the application of the Interpretation to the Portfolio, and is not in a position at this time to estimate the significance of its impact, if any, on the Portfolio's financial statements.
Janus Aspen Series December 31, 2006 17
Notes to Financial Statements (continued)
In September 2006, the FASB issued Statement of Financial Accounting Standards No. 157, "Fair Value Measurements" ("SFAS No. 157"), which defines fair value, establishes a framework for measuring fair value in generally accepted accounting principles, and expands disclosures about fair value measurements. SFAS No. 157 does not require new fair value measurements, but is applied to the extent that other accounting pronouncements require or permit fair value measurements. SFAS No. 157 emphasizes that fair value is a market-based measurement that should be determined based upon the assumptions that market participants would use in pricing an asset or liability. Companies will be required to disclose the extent to which fair value is used to measure assets and liabilities, the inputs used to develop the measurements, and the effect for fiscal years beginning after November 15, 2007. Management is currently evaluating the potential impact the ado ption of SFAS No. 157 will have on the Portfolio's financial condition and results of operations.
2. INVESTMENT ADVISORY AGREEMENTS AND OTHER TRANSACTIONS WITH AFFILIATES
The Portfolio pays a monthly advisory fee to Janus Capital based upon average daily net assets and calculated at the annual rate of 0.64%.
Janus Capital has agreed until at least May 1, 2008 to reimburse the Portfolio by the amount, if any, that the normal operating expenses in any fiscal year, including the investment advisory fee but excluding the distribution and shareholder servicing (12b-1) fees applicable to Service Shares and Service II Shares, brokerage commissions, interest, taxes and extraordinary expenses, exceed an annual rate of 1.24% of the average daily net assets of the Portfolio. The Portfolio is not required to repay any such waived fees in future years to Janus Capital.
Janus Services LLC ("Janus Services"), a wholly-owned subsidiary of Janus Capital, is the Portfolio's transfer agent. Janus Services receives certain out-of-pocket expenses for transfer agent services.
Certain officers of the Portfolio may also be officers and/or directors of Janus Capital. Such officers receive no compensation from the Portfolio, except for the Portfolio's Chief Compliance Officer. Effective January 1, 2006, the Portfolio began reimbursing the adviser for a portion of the compensation paid to the Chief Compliance Officer of the Trust. Total compensation of $268 was paid by the Portfolio during the fiscal year ended December 31, 2006. The Portfolio's portion is reported as part of "Other Expenses" on the Statement of Operations.
The Board of Trustees has adopted a deferred compensation plan (the "Deferred Plan") for independent Trustees to elect to defer receipt of all or a portion of the annual compensation they are entitled to receive from the Portfolio. All deferred fees are credited to an account established in the name of the Trustees. The amounts credited to the account then increase or decrease, as the case may be, in accordance with the performance of one or more of the Janus funds that are selected by the Trustees. The account balance continues to fluctuate in accordance with the performance of the selected fund or funds until final payment of all amounts credited to the account. Trustees are allowed to change their designation of mutual funds from time to time. Amounts will be deferred until distributed in accordance to the Deferred Plan. No deferred fees were paid to any Trustee under the Deferred Plan during the fiscal year ended December 31, 2006.
A 1.00% redemption fee may be imposed on Service II Shares of the Portfolio held for 60 days or less. This fee is paid to the Portfolio rather than Janus Capital, and is designed to deter excessive short-term trading and to offset the brokerage commissions, market impact, and other costs associated with changes in the Portfolio's asset level and cash flow due to short-term money movements in and out of the Portfolio. The redemption fee is accounted for as an addition to Paid-in Capital. Total redemption fees received by the Portfolio were $14,545 for the fiscal year ended December 31, 2006.
For the fiscal year ended December 31, 2006, Janus Capital assumed $21,288 of legal, consulting and Trustee costs and fees incurred by the funds in Janus Investment Fund, Janus Aspen Series and Janus Adviser Series (the "Funds") in connection with the regulatory and civil litigation matters discussed in Note 7. These non-recurring costs were allocated to all Funds based upon the Funds' respective net assets as of July 31, 2004. Additionally, all future non-recurring costs will be allocated based upon the Funds' respective net assets on July 31, 2004. These non-recurring costs and costs assumed by Janus Capital are shown on the Statement of Operations.
Janus Distributors LLC, a wholly-owned subsidiary of Janus Capital, is a distributor of the Portfolio. Service Shares and Service II Shares have adopted a Distribution and Shareholder Servicing Plan (the "Plan") pursuant to Rule 12b-1 under The 1940 Act. The Plan authorizes payments by the Portfolio in connection with the distribution of Service Shares and Service II Shares at an annual rate of up to 0.25% of Service Shares' average daily net assets.
The Portfolio's expenses may be reduced by expense offsets from an unaffiliated custodian and/or transfer agent. Such credits or offsets are included in Expense and Fee Offset on the Statement of Operations. The transfer agent fee offsets received during the period reduce Transfer Agent Fees and Expenses. Custodian offsets received reduce Custodian Fees. The Portfolio could have employed the assets used by the custodian and/or transfer agent to produce income if it had not entered into an expense offset arrangement.
The Portfolio may invest in money market funds, including funds managed by Janus Capital. During the fiscal year ended December 31, 2006, the Portfolio recorded distributions from affiliated investment companies as affiliated dividend income, and had the following purchases and sales:
| Purchases Shares/Cost | Sales Shares/Cost | Dividend Income | Value at 12/31/06 | ||||||||||||||||
| Janus Aspen Global Technology Portfolio | |||||||||||||||||||
| Janus Government Money Market Fund | $ | 2,226,583 | $ | 2,226,583 | $ | 2,225 | $ | – | |||||||||||
| Janus Institutional Cash Reserves Fund | 20,403,740 | 17,154,383 | 82,831 | 3,249,357 | |||||||||||||||
| Janus Money Market Fund | 15,974,714 | 7,444,034 | 176,797 | 8,530,680 | |||||||||||||||
| $ | 38,605,037 | $ | 26,825,000 | $ | 261,853 | $ | 11,780,037 | ||||||||||||
18 Janus Aspen Series December 31, 2006
3. FEDERAL INCOME TAX
The tax components of capital shown in the table below represent: (1) distribution requirements the Portfolio must satisfy under the income tax regulations; (2) losses or deductions the Portfolio may be able to offset against income and gains realized in future years; and (3) unrealized appreciation or depreciation of investments for federal income tax purposes (reduced by foreign tax liability).
In 2006, the Portfolio incurred "Post-October" losses during the period from November 1, 2006 through December 31, 2006. These losses will be deferred for tax purposes and recognized in 2007.
Other book to tax differences in the current year primarily consist of foreign currency contract adjustments. The Portfolio has elected to treat gains and losses on forward foreign currency contracts as capital gains and losses. Other foreign currency gains and losses on debt instruments are treated as ordinary income for federal income tax purposes pursuant to Section 988 of the Internal Revenue Code.
Accumulated capital losses noted below represent net capital loss carryovers, as of December 31, 2006, that may be available to offset future realized capital gains and thereby reduce future taxable gains distributions.
| Portfolio | Undistributed Ordinary Income | Undistributed Long–Term Gains | Accumulated Capital Losses | Post October Deferral | Other Book to Tax Differences | Net Tax Appreciation/ (Depreciation) | |||||||||||||||||||||
| Janus Aspen Global Technology Portfolio | $ | – | $ | – | $ | (417,849,737 | ) | $ | (671 | ) | $ | 41,348 | $ | 31,059,981 | |||||||||||||
The table below shows the expiration dates of the carryovers.
Capital Loss Carryover Expiration Schedule
For the year ended December 31, 2006
| Portfolio | December 31, 2008 | December 31, 2009 | December 31, 2010 | December 31, 2011 | December 31, 2012 | ||||||||||||||||||
| Janus Aspen Global Technology Portfolio | $ | (8,891,968 | ) | $ | (250,531,858 | ) | $ | (148,365,762 | ) | $ | (8,794,052 | ) | $ | (1,266,097 | ) | ||||||||
During the year ended December 31, 2005, the following capital loss carryover was utilized by the Portfolio as indicated in the table below.
| Portfolio | Capital Loss Carryover Utilized | ||||||
| Janus Aspen Global Technology Portfolio | $ | 24,155,145 | |||||
The aggregate cost of investments and the composition of unrealized appreciation and depreciation of investment securities for federal income tax purposes as of December 31, 2006 are noted below.
Unrealized appreciation and unrealized depreciation in the table below exclude appreciation/depreciation on foreign currency translations. The primary difference between book and tax appreciation or depreciation of investments is wash sale loss deferrals.
| Portfolio | Federal Tax Cost | Unrealized Appreciation | Unrealized (Depreciation) | ||||||||||||
| Janus Aspen Global Technology Portfolio | $ | 146,529,511 | $ | 36,545,573 | $ | (5,477,578 | ) | ||||||||
Income and capital gains distributions are determined in accordance with income tax regulations that may differ from accounting principles generally accepted in the United States of America. These differences are due to differing treatments for items such as net short-term gains, deferral of wash sale losses, foreign currency transactions, net investment losses and capital loss carryovers. Certain permanent differences such as tax returns of capital and net investment losses noted below have been reclassified to paid-in capital.
| Distributions | |||||||||||||||||||
| For the fiscal year ended December 31, 2006 Portfolio | From Ordinary Income | From Long-Term Capital Gains | Tax Return of Capital | Net Investment Loss | |||||||||||||||
| Janus Aspen Global Technology Portfolio | $ | – | $ | – | $ | – | $ | (249,285 | ) | ||||||||||
| Distributions | |||||||||||||||||||
| For the fiscal year ended December 31, 2005 Portfolio | From Ordinary Income | From Long-Term Capital Gains | Tax Return of Capital | Net Investment Loss | |||||||||||||||
| Janus Aspen Global Technology Portfolio | $ | – | $ | – | $ | – | $ | (392,741 | ) | ||||||||||
Janus Aspen Series December 31, 2006 19
Notes to Financial Statements (continued)
4. EXPENSE RATIOS
The expense ratios listed in the Financial Highlights reflect expenses prior to any expense offsets (gross expense ratio) and after expense offsets (net expense ratio). Both expense ratios reflect expenses after waivers (reimbursement). Listed below are the gross expense ratios for the Portfolio that would be in effect, absent the waiver of certain fees and offsets.
| For each fiscal year ended December 31 | Institutional Shares | Service Shares | Service II Shares | ||||||||||||||||||||||||||||||||||||||||||||||||||||||||||||
| Portfolio | 2006(1) | 2005(1) | 2004(1) | 2003 | 2002 | 2006(1) | 2005(1) | 2004(1) | 2003 | 2002 | 2006(1) | 2005(1) | 2004(1) | 2003 | 2002 | ||||||||||||||||||||||||||||||||||||||||||||||||
| Janus Aspen Global Technology Portfolio | 0.83 | % | 0.73 | % | 0.72 | % | 0.85 | % | 0.72 | % | 1.08 | % | 0.98 | % | 0.97 | % | 1.10 | % | 0.97 | % | 1.08 | % | 0.99 | % | 0.97 | % | 1.10 | % | 1.04 | % | |||||||||||||||||||||||||||||||||
(1) The effect of non-recurring costs assumed by Janus Capital (Note 2) is included in the ratio of operating expenses to average net assets without waivers and/or expense reimbursements and was less than 0.01%.
5. CAPITAL SHARE TRANSACTIONS
| For the fiscal year ended December 31 | Janus Aspen Global Technology Portfolio | ||||||||||
| (all numbers are in thousands) | 2006 | 2005 | |||||||||
| Transactions in Portfolio Shares – Institutional Shares | |||||||||||
| Shares sold | 137 | 76 | |||||||||
| Reinvested dividends and distributions | – | – | |||||||||
| Shares repurchased | (272 | ) | (586 | ) | |||||||
| Net Increase(Decrease) in Portfolio Shares | (135 | ) | (510 | ) | |||||||
| Shares Outstanding, Beginning of Period | 782 | 1,292 | |||||||||
| Shares Outstanding, End of Period | 647 | 782 | |||||||||
| Transactions in Portfolio Shares – Service Shares | |||||||||||
| Shares sold | 3,723 | 3,738 | |||||||||
| Reinvested dividends and distributions | – | – | |||||||||
| Shares repurchased | (7,632 | ) | (11,418 | ) | |||||||
| Net Increase(Decrease) in Portfolio Shares | (3,909 | ) | (7,680 | ) | |||||||
| Shares Outstanding, Beginning of Period | 34,912 | 42,592 | |||||||||
| Shares Outstanding, End of Period | 31,003 | 34,912 | |||||||||
| Transactions in Portfolio Shares – Service II Shares | |||||||||||
| Shares sold | 1,007 | 1,042 | |||||||||
| Reinvested dividends and distributions | – | – | |||||||||
| Shares repurchased | (1,708 | ) | (2,197 | ) | |||||||
| Net Increase(Decrease) in Portfolio Shares | (701 | ) | (1,155 | ) | |||||||
| Shares Outstanding, Beginning of Period | 6,421 | 7,576 | |||||||||
| Shares Outstanding, End of Period | 5,720 | 6,421 | |||||||||
6. PURCHASES AND SALES OF INVESTMENT SECURITIES
For the fiscal year ended December 31, 2006, the aggregate cost of purchases and proceeds from sales of investment securities (excluding short-term securities) were as follows:
| Portfolio | Purchases of Securities | Proceeds from Sales of Securities | Purchases of Long-Term U.S. Government Obligations | Proceeds from Sales of Long-Term U.S. Government Obligations | |||||||||||||||
| Janus Aspen Global Technology Portfolio | $ | 137,159,306 | $ | 163,649,308 | $ | 373,989 | $ | – | |||||||||||
20 Janus Aspen Series December 31, 2006
7. PENDING LEGAL MATTERS
In the fall of 2003, the Securities and Exchange Commission ("SEC"), the Office of the New York State Attorney General ("NYAG"), the Colorado Attorney General ("COAG"), and the Colorado Division of Securities ("CDS") announced that they were investigating alleged frequent trading practices in the mutual fund industry. On August 18, 2004, Janus Capital announced that it had reached final settlements with the SEC, the NYAG, the COAG, and the CDS related to such regulators' investigations into Janus Capital's frequent trading arrangements.
A number of civil lawsuits were brought against Janus Capital and certain of its affiliates, the Janus funds, and related entities and individuals based on allegations similar to those announced by the above regulators and were filed in several state and federal jurisdictions. Such lawsuits alleged a variety of theories for recovery including, but not limited to, the federal securities laws, other federal statutes (including ERISA), and various common law doctrines. The Judicial Panel on Multidistrict Litigation transferred these actions to the U.S. District Court for the District of Maryland (the "Court") for coordinated proceedings. On September 29, 2004, five consolidated amended complaints were filed with the Court that generally include: (i) claims by a putative class of investors in certain Janus funds asserting claims on behalf of the investor class (Marini, et al. v. Janus Investment Fund, et al., U.S. District Court, District of Maryland, Case No. 04-CV-00497); (ii) derivative claims by investors in certain Janus funds ostensibly on behalf of such funds (Steinberg et al. v. Janus Capital Management, LLC et al., U.S. District Court, District of Maryland, Case No. 04-CV-00518); (iii) claims on behalf of participants in the Janus 401(k) plan (Wangberger v. Janus Capital Group Inc., 401(k) Advisory Committee, et al., U.S. District Court, District of Maryland, Case No. JFM-05-2711); (iv) claims brought on behalf of shareholders of Janus Capital Group Inc. ("JCGI") on a derivative basis against the Board of Directors of JCGI (Chasen v. Whiston, et al., U.S. District Court, District of Maryland, Case No. 04-MD-00855); and (v) claims by a putative class of shareholders of JCGI asserting claims on behalf of the shareholders (Wiggins, et al. v. Janus Capital Group, Inc., et al., U.S. District Court, District of Maryland, Case No. 04-CV-00818). In addition, the following were also named as defendants in one or more of the actions: Janus Investment Fund ("JIF"), Janus Aspen Series ("JAS"), Janus Advi ser Series ("JAD"), Janus Distributors LLC, Enhanced Investment Technologies, LLC ("INTECH"), Bay Isle Financial LLC ("Bay Isle"), Perkins, Wolf, McDonnell and Company, LLC ("Perkins"), the Advisory Committee of the Janus 401(k) plan, and the current or former directors of JCGI.
On August 25, 2005, the Court entered orders dismissing most of the claims asserted against Janus Capital and its affiliates by fund investors (actions (i) and (ii) described above), except certain claims under Section 10(b) of the Securities Exchange Act of 1934 and under Section 36(b) of the Investment Company Act of 1940, as amended (the "1940 Act"). On August 15, 2006, the complaint in the 401(k) plan class action (action (iii) described above) was dismissed by the district court with prejudice; the plaintiff has appealed that dismissal decision to the United States Court of Appeals for the Fourth Circuit. The Court also dismissed the action against JCGI's Board of Directors without leave to amend (action (iv) described above). Finally, a Motion to Dismiss the action brought by JCGI shareholders (action (v) described above) is fully briefed and pending before the Cou rt.
In addition to the lawsuits described above, the Auditor of the State of West Virginia ("Auditor"), in his capacity as securities commissioner, has initiated administrative proceedings against many of the defendants in the market timing cases (including JCGI and Janus Capital) and, as a part of its relief, is seeking disgorgement and other monetary relief based on similar market timing allegations (In the Matter of Janus Capital Group Inc. et al., Before the Securities Commissioner, State of West Virginia, Summary Order No. 05-1320). The respondents in these proceedings collectively sought a Writ of Prohibition in state court, which was denied. Their subsequent Petition for Appeal was also denied. Consequently, in September 2006, JCGI and Janus Capital filed their answer to the A uditor's summary order instituting proceedings and requested a hearing. JCGI and Janus Capital, as well as other similarly situated defendants, continue to challenge the statutory authority of the Auditor to bring such an action. No further proceedings are currently scheduled.
In addition to the "market timing" actions described above, Janus Capital is a defendant in a consolidated lawsuit in the U.S. District Court for the District of Colorado challenging the investment advisory fees charged by Janus Capital to certain Janus funds (Walter Sins, et al. v. Janus Capital Management LLC, U.S. District Court, District of Colorado, Case No. 04-CV-01647-WDM-MEH; Michael Fleisher, et al. v. Janus Capital Management, LLC, 04-CV-02395-MSK-CBS). The action was filed in 2004 by fund investors asserting breach of fiduciary duty under Section 36(b) of the 1940 Act. The plaintiffs seek declaratory and injunctive relief and an unspecified amount of damages. The trial is scheduled to commence on May 21, 2007.
In 2001, Janus Capital's predecessor was also named as a defendant in a class action suit in the U.S. District Court for the Southern District of New York, alleging that certain underwriting firms and institutional investors violated antitrust laws in connection with initial public offerings (Pfeiffer v. Credit Suisse First Boston aka In re Initial Public Offering Antitrust Litigation, U.S. District Court, Southern District of New York, Case No. 01-CV-2014). The U.S. District Court
Janus Aspen Series December 31, 2006 21
Notes to Financial Statements (continued)
dismissed the plaintiff's antitrust claims in November 2003; however, the U.S. Court of Appeals vacated that decision and remanded it for further proceedings. In March 2006, the defendants, including Janus Capital, filed a Petition for a Writ of Certiorari with the U.S. Supreme Court to review the decision of the U.S. Court of Appeals. In June 2006, the U.S. Supreme Court invited the U.S. Solicitor General to file a brief expressing the view of the United States, and in November 2006, the Solicitor General filed a brief expressing its view on the matter. The U.S. Supreme Court has granted the Petition for a Writ of Certiorari and the parties are in the process of briefing the matter for the U.S. Supreme Court.
Additional lawsuits may be filed against certain of the Janus funds, Janus Capital, and related parties in the future. Janus Capital does not currently believe that these pending actions will materially affect its ability to continue providing services it has agreed to provide to the Janus funds.
22 Janus Aspen Series December 31, 2006
Report of Independent Registered Public Accounting Firm
To the Trustees and Shareholders of
Janus Aspen Global Technology Portfolio
In our opinion, the accompanying statement of assets and liabilities, including the schedule of investments, and the related statements of operations and of changes in net assets and the financial highlights present fairly, in all material respects, the financial position of Janus Aspen Global Technology Portfolio (one of the portfolios constituting Janus Aspen Series, hereafter referred to as the "Portfolio") at December 31, 2006, the results of its operations for the year then ended, the changes in its net assets for each of the two years in the period then ended, and the financial highlights for each of the five years in the period then ended, in conformity with accounting principles generally accepted in the United States of America. These financial statements and financial highlights (hereafter referred to as "financial statements") are the responsibility of the Portfolio's management; our responsibility is to express an opinion on thes e financial statements based on our audits. We conducted our audits of these financial statements in accordance with the standards of the Public Company Accounting Oversight Board (United States). Those standards require that we plan and perform the audit to obtain reasonable assurance about whether the financial statements are free of material misstatement. An audit includes examining, on a test basis, evidence supporting the amounts and disclosures in the financial statements, assessing the accounting principles used and significant estimates made by management, and evaluating the overall financial statement presentation. We believe that our audits, which included confirmation of securities at December 31, 2006 by correspondence with the custodian, transfer agent and brokers, and the application of alternative auditing procedures where securities purchased had not been received, provide a reasonable basis for our opinion.

PricewaterhouseCoopers LLP
Denver, Colorado
February 12, 2007
Janus Aspen Series December 31, 2006 23
Additional Information (unaudited)
PROXY VOTING POLICIES AND VOTING RECORD
A description of the policies and procedures that the Portfolio uses to determine how to vote proxies relating to its portfolio securities is available: (i) without charge, upon request, by calling 1-800-525-0020 (toll free); (ii) on the Portfolio's website at www.janus.com/proxyvoting; and (iii) on the SEC's website at http://www.sec.gov. Additionally, information regarding the Portfolio's proxy voting record for the most recent twelve-month period ended June 30 is also available, free of charge, through www.janus.com/proxyvoting and from the SEC's website at http://www.sec.gov.
QUARTERLY PORTFOLIO HOLDINGS
The Portfolio files its complete portfolio holdings (schedule of investments) with the SEC for the first and third quarters of each fiscal year on Form N-Q within 60 days of the end of such fiscal quarter. The Portfolio's Form N-Q: (i) is available on the SEC's website at http://www.sec.gov; (ii) may be reviewed and copied at the SEC's Public Reference Room in Washington, D.C. (information on the Public Reference Room may be obtained by calling 1-800-SEC-0330); and (iii) is available without charge, upon request, by calling Janus at 1-800-525-0020 (toll free).
APPROVAL OF ADVISORY AGREEMENTS DURING THE PERIOD
The Trustees of Janus Aspen Series, more than eighty-five percent of whom have never been affiliated with the Adviser ("Independent Trustees"), oversee the management of each of the Portfolios and, as required by law, determine annually whether to continue the investment advisory agreement for each Portfolio and the subadvisory agreements for the three Portfolios that utilize subadvisers.
In connection with their most recent consideration of those agreements for each of the Portfolios, the Trustees received and reviewed a substantial amount of information provided by Janus Capital (the "Adviser") and the respective subadvisers in response to requests of the Independent Trustees and their independent legal counsel. They also received and reviewed a considerable amount of information and analysis provided to the Trustees by their independent fee consultant. Throughout their consideration of the agreements the Independent Trustees were advised by their independent legal counsel. The Independent Trustees met on two separate occasions with management to consider the agreements, and at each of those meetings they also met separately in executive session with their independent legal counsel.
At a meeting held on December 20, 2006, based on their evaluation of the information provided by the Adviser, the subadvisers and the independent fee consultant and other information, the Trustees determined that the overall arrangements between each Portfolio and the Adviser were fair and reasonable in light of the nature, extent and quality of the services provided by the Adviser, its affiliates and the subadvisers, the fees charged for those services, and other matters that the Trustees considered relevant in the exercise of their business judgment. At that meeting all of the Trustees unanimously approved the continuation of the investment advisory agreement for each Portfolio, and the subadvisory agreement for each subadvised Portfolio, for the period from February 1, 2007 through February 1, 2008, subject to earlier termination as provided in each agreement.
In considering the continuation of those agreements, the Trustees reviewed and analyzed various factors that they determined were relevant, including the factors described below, none of which by itself was considered dispositive. However, the material factors and conclusions that formed basis for the Trustees' determination to approve the continuation of the agreements are discussed separately below.
Nature, Extent and Quality of Services
The Trustees reviewed the nature, extent and quality of the services of Janus Capital and the subadvisers to the Funds, taking into account the investment objective and strategy of each Portfolio and the knowledge the Trustees gained from their regular meetings with management on at least a quarterly basis and their ongoing review of information related to the Funds. In addition, the Trustees reviewed the resources and key personnel of Janus Capital and each subadviser, especially those who provide investment management services to the Portfolios. The Trustees also considered other services provided to the Portfolios by Janus Capital or the subadvisers, such as managing the execution of portfolio transactions and the selection of broker-dealers for those transactions, serving as the Portfolios' administrator, monitoring adherence to the Portfolios' investment restrictions, producing shareholder reports, providing support services for the Tru stees and Trustee committees, communicating with shareholders and overseeing the activities of other service providers, including monitoring compliance with various policies and procedures of the Portfolios and with applicable securities laws and regulations.
The Trustees concluded that: the nature, extent and quality of the services provided by Janus Capital or the subadviser to each Portfolio were appropriate and consistent with the terms of the respective advisory and subadvisory agreements; that, taking into account steps taken to address a small portion of the Portfolios whose performance lagged that of their peers for certain periods, the quality of those services had been consistent with or superior to quality norms in the industry; and that the Portfolios were likely to benefit from the continued provision of those services. They also concluded that each of Janus Capital and each subadviser had sufficient personnel, with the appropriate education and experience, to
24 Janus Aspen Series December 31, 2006
serve the Portfolios effectively and had demonstrated its continuing ability to attract and retain well-qualified personnel.
Performance of the Funds
The Trustees considered the performance results of each Portfolio over various time periods. They reviewed information comparing each Portfolio's performance with the performance of comparable funds and peer groups identified by Lipper Inc., an independent provider of investment company data, and with the Portfolio's benchmark. They concluded that the performance of most Portfolios was good to very good. Although the performance of some Portfolios lagged that of their peers for certain periods, the Trustees also concluded that Janus Capital had taken appropriate steps to address those instances of under-performance and that the more recent performance of most of those Portfolios had been improving.
Costs of Services Provided
The Trustees examined information on the fees and expenses of each Portfolio in comparison to similar information for other comparable funds as provided by Lipper. They also reviewed an analysis of that information provided by their independent fee consultant and noted that the rate of management (investment advisory and administrative) fees for most of the Portfolios, after contractual expense limitations, was below the mean management fee rate of the respective peer group of funds selected by Lipper.
The Trustees considered the methodology used by Janus Capital and each subadviser in determining compensation payable to portfolio managers, the competitive environment for investment management talent and the competitive market for mutual funds in different distribution channels. They concluded that the compensation methodology provided a good alignment of the interests of the portfolio managers with the interests of Portfolio shareholders.
The Trustees also reviewed management fees charged by Janus Capital to its separate account clients and to its subadvised funds (for which Janus Capital provides only portfolio management services). Although in most instances subadvisory and separate account fee rates for various investment strategies were lower than management fees for Portfolios having a similar strategy, the Trustees noted that Janus Capital performs significant additional services for the Portfolios that it does not provide to those other clients, including administrative services, oversight of the Portfolios' other service providers, trustee support, regulatory compliance and numerous other services, and that, in serving the Portfolios, Janus Capital assumes many legal risks that it does not assume in servicing its other clients. Moreover, they noted that the spread between the average fees charged to the Portfolios and the fees that Janus Capital charged to its separate account clients was significantly smaller than the average spread for such fees of other advisers, based on publicly available data and research conducted by their independent fee consultant.
In considering the fees charged by Janus Capital, the Trustees had previously negotiated with Janus Capital a temporary contingent waiver of a portion the investment advisory fee paid by Janus Aspen Worldwide Growth Portfolio to Janus Capital to provide for a possible reduction in the rate of advisory fee payable by the Portfolio for the period July 1, 2006 through January 31, 2007 if the investment performance of the Fund should lag that of its benchmark performance over the applicable performance measurement period. Commencing in February 2007, the previously approved performance-based fee schedule will become operative.
The Trustees reviewed information on the profitability of Janus Capital and its affiliates of their relationships with each Portfolio, as well as an explanation of the methodology utilized in allocating various expenses among the Portfolios and other clients. The Trustees also reviewed the financial statements of Janus Capital's parent company and its corporate structure. In their review, the Trustees considered whether Janus Capital and each subadviser receive adequate incentives to manage the Portfolios effectively. The Trustees recognized that profitability comparisons among fund managers are difficult because very little comparative information is publicly available and profitability of any manager is affected by numerous factors, including the organizational structure of the particular manager, the types of funds and other accounts it manages, possible other lines of business, the methodology for allocating expenses and the manager's ca pital structure and cost of capital. However, based on the information available and taking those factors into account, the Trustees concluded that Janus Capital's profitability with respect to each Portfolio in relation to the services rendered was not unreasonable.
The Trustees concluded that the management fees and other compensation payable by each Fund to Janus Capital and its affiliates, as well as the fees paid by Janus Capital to the subadvisers of subadvised Portfolios, were reasonable in relation to the nature and quality of the services provided, taking into account the fees charged by other advisers for managing comparable mutual funds with similar strategies and the fees Janus Capital and the subadviser charges to other clients. The Trustees also concluded that the overall expense ratio of each Portfolio was reasonable, taking into account the size of the Portfolio, the quality of services provided by Janus Capital and any subadviser, the investment performance of the Portfolio and any expense limitations agreed to by Janus Capital.
Janus Aspen Series December 31, 2006 25
Additional Information (unaudited) (continued)
Economies of Scale
The Trustees considered information about the potential for Janus Capital to realize economies of scale as the assets of the Portfolios increase. They noted that, although most Portfolios pay advisory fees at a fixed rate as a percentage of net assets, without any breakpoints, the management fee paid by each Portfolio, after any contractual expense limitations, was below the mean management fee rate of the Portfolio's peer group selected by Lipper; and, for those Portfolios whose expenses are being reduced by the contractual expense limitations of Janus Capital, Janus Capital is subsidizing the Portfolios because they have not reached adequate scale. Moreover, as the assets of many of the Portfolios have declined in the past few years, the Portfolios have benefited from having advisory fee rates that have remained constant rather than increasing as assets decline. In addition, performance fee structures have been implemented for several Port folios that will cause the effective rate of advisory fees payable by such a Portfolio to vary depending on the investment performance of the Portfolio relative to its benchmark; and a few Portfolios have fee schedules with breakpoints and reduced fee rates above certain asset levels. The Trustees also noted that the Portfolios share directly in economies of scale through lower charges of third-party service providers based on the combined scale of all of the Portfolios. Based on all of the information they reviewed, the Trustees concluded that the current fee structure of each Portfolio was reasonable and that the current rates of fees do reflect a sharing between Janus Capital and the Portfolio of economies of scale at the current asset level of the Portfolio.
Other Benefits to Janus Capital
The Trustees also considered benefits that accrue to Janus Capital and its affiliates from their relationships with the Portfolios. They recognized that two affiliates of Janus Capital separately serve the Portfolios as transfer agent and distributor, respectively, and that the transfer agent receives compensation from the non-money market Portfolios for services provided. The Trustees also considered Janus Capital's use of commissions paid by Portfolios on their portfolio brokerage transactions to obtain proprietary research products and services benefiting the Portfolios and/or other clients of Janus Capital, as well as Janus Capital's agreement not to use any Portfolio's brokerage transactions to obtain third party research products or services. The Trustees concluded that Janus Capital's use of "soft" commission dollars to obtain proprietary research products and services was consistent with regulatory requirements and guidelines and was likely to benefit each Portfolio. The Trustees also concluded that, other than the services provided by Janus Capital and its affiliates pursuant to the agreements and the fees to be paid by each Portfolio therefor, the Portfolios and Janus Capital may potentially benefit from their relationship with each other in other ways. They concluded that Janus Capital benefits from the receipt of proprietary research products and services acquired through commissions paid on portfolio transactions of the Portfolios and that the Portfolios benefit from Janus Capital's receipt of those products and services as well as research products and services acquired through commissions paid by other clients of Janus Capital. They further concluded that success of any Portfolio could attract other business to Janus Capital or other Janus Funds and that the success of Janus Capital could enhance Janus Capital's ability to serve the Portfolios.
After full consideration of the above factors as well as other factors, all of the Trustees, including all of the Independent Trustees, concluded that the proposed continuation of the investment advisory agreement for each applicable Portfolio were in the best interest of the respective Portfolios and their shareholders.
26 Janus Aspen Series December 31, 2006
Explanations of Charts, Tables and
Financial Statements (unaudited)
1. PERFORMANCE OVERVIEWS
The performance overview graph compares the performance of a hypothetical $10,000 investment in the Portfolio with one or more widely used market indices. The hypothetical example does not represent the returns of any particular investment.
When comparing the performance of the Portfolio with an index, keep in mind that market indices do not include brokerage commissions that would be incurred if you purchased the individual securities in the index. They also do not include taxes payable on dividends and interest or operating expenses incurred if you maintained a Portfolio invested in the index.
Average annual total returns are quoted for each class of the Portfolio. Average annual total return is calculated by taking the growth or decline in value of an investment over a period of time, including reinvestment of any dividends, distributions and capital gains, then calculating the annual compounded percentage rate that would have produced the same result had the rate of growth been constant throughout the period. Average annual total return does not reflect the deduction of taxes that a shareholder would pay on Portfolio distributions or redemptions of Portfolio shares.
2. SCHEDULE OF INVESTMENTS
Following the performance overview section is the Portfolio's Schedule of Investments. This schedule reports the industry concentrations and types of securities held in the Portfolio on the last day of the reporting period. Securities are usually listed by type (common stock, corporate bonds, U.S. Government obligations, etc.) and by industry classification (banking, communications, insurance, etc.). Holdings are subject to change without notice.
The value of each security is quoted as of the last day of the reporting period. The value of securities denominated in foreign currencies is converted into U.S. dollars. Certain short-term investments maturing within 60 days are valued at amortized cost, which approximates market value.
A summary of investments by country is provided if the Portfolio invested in foreign securities. This summary reports the Portfolio's exposure to different countries by providing the percentage of securities invested in each country. The country of each security represents the country in which the company is incorporated.
2A. FORWARD CURRENCY CONTRACTS
A table listing forward currency contracts follows the Portfolio's Schedule of Investments (if applicable). Forward currency contracts are agreements to deliver or receive a preset amount of currency at a future date. Forward currency contracts are used to hedge against foreign currency risk in the Portfolio's long-term holdings. The table provides the name of the foreign currency, the settlement date of the contract, the amount of the contract, the value of the currency in U.S. dollars and the amount of unrealized gain or loss. The amount of unrealized gain or loss reflects the change in currency exchange rates from the time the contract was opened to the last day of the reporting period.
2B. FUTURES
A table listing futures contracts follows the Portfolio's Schedule of Investments (if applicable). Futures contracts are contracts that obligate the buyer to receive and the seller to deliver an instrument or money at a specified price on a specified date. Futures are used to hedge against adverse movements in securities prices, currency risk or interest rates.
The table provides the name of the contract, number of contracts held, the expiration date, the principal amount, value and the amount of unrealized gain or loss. The amount of unrealized gain or loss reflects the marked-to-market amount for the last day of the reporting period.
2C. Options
A table listing option contracts follows the Portfolio's Schedule of Investments (if applicable). Option contracts are contracts that obligate the Portfolio to sell or purchase an underlying security at a fixed price, upon exercise of the option. Options are used to hedge against adverse movements in securities prices, currency risk or interest rates.
The table provides the name of the contract, number of contracts held, the expiration date, exercise price, value and premiums received.
3. STATEMENT OF ASSETS AND LIABILITIES
This statement is often referred to as the "balance sheet." It lists the assets and liabilities of the Portfolio on the last day of the reporting period.
The Portfolio's assets are calculated by adding the value of the securities owned, the receivable for securities sold but not yet settled, the receivable for dividends declared but not yet received on stocks owned and the receivable for Portfolio shares sold to investors but not yet settled. The Portfolio's liabilities include payables for securities purchased but not yet settled, Portfolio shares redeemed but not yet paid and expenses owed but not yet paid. Additionally, there may be other assets and liabilities such as unrealized gain or loss on forward currency contracts.
The section entitled "Net Assets Consist of" breaks down the components of the Portfolio's net assets. Because the Portfolio must distribute substantially all earnings, you will notice that a significant portion of net assets is shareholder capital.
The last section of this statement reports the net asset value ("NAV") per share on the last day of the reporting period for
Janus Aspen Series December 31, 2006 27
Explanations of Charts, Tables and
Financial Statements (unaudited) (continued)
each class of the Portfolio. The NAV is calculated by dividing the Portfolio's net assets (assets minus liabilities) by the number of shares outstanding.
4. STATEMENT OF OPERATIONS
This statement details the Portfolio's income, expenses, gains and losses on securities and currency transactions, and appreciation or depreciation of current Portfolio holdings.
The first section in this statement, entitled "Investment Income," reports the dividends earned from stocks and interest earned from interest-bearing securities in the Portfolio.
The next section reports the expenses and expense offsets incurred by the Portfolio, including the advisory fee paid to the investment adviser and transfer agent fees and expenses, and printing and postage for mailing statements, financial reports and prospectuses. Expense offsets, if any, are also shown.
The last section lists the increase or decrease in the value of securities held in the Portfolio. The Portfolio realizes a gain (or loss) when it sells its position in a particular security. An unrealized gain (or loss) refers to the change in net appreciation or depreciation of the Portfolio during the reporting period. "Net Realized and Unrealized Gain/(Loss) on Investments" is affected both by changes in the market value of Portfolio holdings and by gains (or losses) realized during the reporting period.
5. STATEMENT OF CHANGES IN NET ASSETS
This statement reports the increase or decrease in the Portfolio's net assets during the reporting period. Changes in the Portfolio's net assets are attributable to investment operations, dividends, distributions and capital share transactions. This is important to investors because it shows exactly what caused the Portfolio's net asset size to change during the period.
The first section summarizes the information from the Statement of Operations regarding changes in net assets due to the Portfolio's investment performance. The Portfolio's net assets may also change as a result of dividend and capital gains distributions to investors. If investors receive their dividends in cash, money is taken out of the Portfolio to pay the distribution. If investors reinvest their dividends, the Portfolio's net assets will not be affected. If you compare the Portfolio's "Net Decrease from Dividends and Distributions" to the "Reinvested dividends and distributions," you will notice that dividend distributions had little effect on the Portfolio's net assets. This is because the majority of Janus investors reinvest their distributions.
The reinvestment of dividends is included under "Capital Share Transactions." "Capital Shares" refers to the money investors contribute to the Portfolio through purchases or withdraw via redemptions. The "Redemption Fees" refers to the fee paid to the Portfolio for shares held for three months or less by a shareholder. The Portfolio's net assets will increase and decrease in value as investors purchase and redeem shares from the Portfolio.
6. FINANCIAL HIGHLIGHTS
This schedule provides a per-share breakdown of the components that affect the Portfolio's NAV for current and past reporting periods for each class of the Portfolio. Not only does this table provide you with total return, it also reports total distributions, asset size, expense ratios and portfolio turnover rate.
The first line in the table reflects the NAV per share at the beginning of the reporting period. The next line reports the net investment income per share, which comprises dividends and interest income earned on securities held by the Portfolio. Following is the total of gains/(losses), realized and unrealized. Dividends and distributions are then subtracted to arrive at the NAV per share at the end of the period. The next line reflects the average annual total return reported the last day of the period.
Also included are the expense ratios, or the percentage of net assets that are used to cover operating expenses during the period. Expense ratios vary for a number of reasons, including the differences in management fees, the average shareholder account size and the extent of foreign investments, which entail greater transaction costs.
The Portfolio's expenses may be reduced through expense reduction arrangements. These arrangements may include the use of balance credits or transfer agent fee offsets. The Statement of Operations reflects total expenses before any such offset, the amount of offset and the net expenses. The expense ratios listed in the Financial Highlights reflect total expenses prior to any expense offsets (gross expense ratio) and after the expense offsets (net expense ratio). Both expense ratios reflect expenses after waivers (reimbursements), if applicable.
The ratio of net investment income/(loss) summarizes the income earned less expenses, divided by the average net assets of the Portfolio during the reporting period. Don't confuse this ratio with the Portfolio's yield. The net investment income ratio is not a true measure of the Portfolio's yield because it doesn't take into account the dividends distributed to the Portfolio's investors.
The next ratio is the portfolio turnover rate, which measures the buying and selling activity in a Portfolio. Portfolio turnover is affected by market conditions, changes in the asset size of a Portfolio, the nature of the Portfolio's investments and the investment style of the portfolio manager. A 100% rate implies that an amount equal to the value of the entire portfolio is turned over in a year; a 50% rate means that an amount equal to the value of half the portfolio is traded in a year; and a 200% rate means that an amount equal to the value of the portfolio is traded every six months.
28 Janus Aspen Series December 31, 2006
Trustees and Officers (unaudited)
The Portfolio's Statement of Additional Information includes additional information about the Trustees and officers and is available, without charge, by calling 1-800-525-0020.
The following are the Trustees and officers of the Trust, together with a brief description of their principal occupations during the last five years (principal occupations for certain Trustees may include periods over five years).
Each Trustee has served in that capacity since he or she was originally elected or appointed. The Trustees do not serve a specified term of office. Each Trustee will hold office until the termination of the Trust or his or her earlier death, resignation, retirement, incapacity or removal. The retirement age for Trustees is 72. The Portfolio's Nominating and Governance Committee will consider nominees for the position of Trustee recommended by shareholders. Shareholders may submit the name of a candidate for consideration by the Committee by submitting their recommendations to the Trust's Secretary. Each Trustee is currently a Trustee of two other registered investment companies advised by Janus Capital: Janus Investment Fund and Janus Adviser Series. As of the date of this report, collectively, these three registered investment companies consist of 69 series or funds.
The Trust's officers are elected annually by the Trustees for a one-year term. Certain officers also serve as officers of Janus Investment Fund and Janus Adviser Series. Certain officers of the Portfolio may also be officers and/or directors of Janus Capital. Portfolio officers receive no compensation from the Portfolio, except for the Portfolio's Chief Compliance Officer, as authorized by the Trustees.
Trustees
| Name, Age and Address | Positions Held with Portfolio | Length of Time Served | Principal Occupations During the Past Five Years | Number of Portfolios in Fund Complex Overseen by Trustee | Other Directorships Held by Trustee | ||||||||||||||||||
| Independent Trustees | |||||||||||||||||||||||
| Dennis B. Mullen 151 Detroit Street Denver, CO 80206 Age 63 | Chairman Trustee | 3/04-Present 9/93-Present | Chief Executive Officer of Red Robin Gourmet Burgers, Inc. (since 2005). Formerly, private investor. | 69 | * | Chairman of the Board (since 2005) and Director of Red Robin Gourmet Burgers, Inc.; and Director of Janus Capital Funds Plc (Dublin-based, non-U.S. funds). | |||||||||||||||||
| Jerome S. Contro 151 Detroit Street Denver, CO 80206 Age 50 | Trustee | 12/05-Present | Partner of Tango Group, a private investment firm (since 1999). | 69 | Trustee and Chairman of RS Investment Trust (since 2001); Director of IZZE Beverages and MyFamily.com, Inc. (genealogical research website). | ||||||||||||||||||
| William F. McCalpin 151 Detroit Street Denver, CO 80206 Age 49 | Trustee | 6/02-Present | Private Investor. Formerly, Vice President of Asian Cultural Council and Executive Vice President and Chief Operating Officer of The Rockefeller Brothers Fund (a private family foundation). | 69 | Director of the F.B. Heron Foundation (a private grantmaking foundation). | ||||||||||||||||||
| John W. McCarter, Jr. 151 Detroit Street Denver, CO 80206 Age 68 | Trustee | 6/02-Present | President and Chief Executive Officer of The Field Museum of Natural History (Chicago, IL). | 69 | Chairman of the Board and Director of Divergence Inc. (biotechnology firm); Director of W.W. Grainger, Inc. (industrial distributor); and Trustee of WTTW (Chicago public television station) and the University of Chicago. | ||||||||||||||||||
Janus Aspen Series December 31, 2006 29
Trustees and Officers (unaudited) (continued)
Trustees (cont.)
| Name, Age and Address | Positions Held with Portfolio | Length of Time Served | Principal Occupations During the Past Five Years | Number of Portfolios in Fund Complex Overseen by Trustee | Other Directorships Held by Trustee | ||||||||||||||||||
| Independent Trustees (cont.) | |||||||||||||||||||||||
| James T. Rothe 151 Detroit Street Denver, CO 80206 Age 63 | Trustee | 1/97-Present | Co-founder and Managing Director of Roaring Fork Capital Management, LLC (private investment in public equity firm); and Professor Emeritus of Business of the University of Colorado, Colorado Springs, CO (since 2004). Formerly, Professor of Business of the University of Colorado (2002-2004); and Distinguished Visiting Professor of Business (2001-2002) of Thunderbird University (American Graduate School of International Management), Glendale, AZ. | 69 | Director of Red Robin Gourmet Burgers, Inc. | ||||||||||||||||||
| William D. Stewart 151 Detroit Street Denver, CO 80206 Age 62 | Trustee | 9/93-Present | Corporate Vice President and General Manager of MKS Instruments – HPS Products, Boulder, CO (a manufacturer of vacuum fittings and valves). | 69 | N/A | ||||||||||||||||||
| Martin H. Waldinger 151 Detroit Street Denver, CO 80206 Age 68 | Trustee | 9/93-Present | Private Investor and Consultant to California Planned Unit Developments. Formerly, CEO and President of Marwal, Inc. (homeowner association management company). | 69 | N/A | ||||||||||||||||||
| Linda S. Wolf 151 Detroit Street Denver, CO 80206 Age 59 | Trustee | 12/05-Present | Retired. Formerly, Chairman and Chief Executive Officer of Leo Burnett (Worldwide) (advertising agency) (2001-2005). | 69 | Director of Wal-Mart, The Field Museum of Natural History (Chicago, IL), Children's Memorial Hospital (Chicago, IL), Chicago Council on Foreign Relations, Economic Club of Chicago, and InnerWorkings (a provider of print procurement solutions). | ||||||||||||||||||
| Interested Trustee | |||||||||||||||||||||||
| Thomas H. Bailey** 151 Detroit Street Denver, CO 80206 Age 69 | Trustee | 5/93-Present | Retired. Formerly, President (1978-2002) and Chief Executive Officer (1994-2002) of Janus Capital or Janus Capital Corporation; Chairman and Director (1978-2002) of Janus Capital Corporation; President and Director (1994-2002) of The Janus Foundation. | 69 | N/A | ||||||||||||||||||
* Mr. Mullen also serves as director of Janus Capital Funds Plc, consisting of 22 funds. Including Janus Capital Funds Plc and the 69 funds comprising the Janus Funds, Mr. Mullen oversees 91 funds.
** The Portfolio is treating Mr. Bailey as an "interested person" of the Trust by virtue of his past positions and continuing relationships with Janus Capital and ownership of shares of Janus Capital's parent company
30 Janus Aspen Series December 31, 2006
Officers
| Name, Age and Address | Positions Held with Portfolio | Term of Office* and Length of Time Served | Principal Occupations During the Past Five Years | ||||||||||||
| J. Brad Slingerlend 151 Detroit Street Denver, CO 80206 Age 28 | Executive Vice President and Co-Portfolio Manager Janus Aspen Global Technology Portfolio | 2/06-Present | Portfolio Manager for other Janus accounts. | ||||||||||||
| Burton H. Wilson 151 Detroit Street Denver, CO 80206 Age 43 | Executive Vice President and Co-Portfolio Manager Janus Aspen Global Technology Portfolio | 2/06-Present | Portfolio Manager for other Janus accounts. Formerly, Research Analyst (2000-2004) for Lincoln Equity Management. | ||||||||||||
| Stephanie Grauerholz-Lofton 151 Detroit Street Denver, CO 80206 Age 36 | Chief Legal Counsel and Secretary Vice President | 1/06-Present 03/06 - Present | Assistant Vice President of Janus Capital and Janus Distributors LLC; and Associate Counsel of Janus Capital. Formerly, Associate of Vedder, Price, Kaufman & Kammholz, P.C. (1999-2003). | ||||||||||||
| Kelley Abbott Howes 151 Detroit Street Denver, CO 80206 Age 41 | President and Chief Executive Officer | 1/06-Present | President of Janus Services LLC; Senior Vice President and General Counsel of Janus Capital; and Senior Vice President and Assistant General Counsel of Janus Distributors LLC. Formerly, Vice President (1999-2005) of Janus Distributors LLC; Senior Vice President and General Counsel (2004-2006), Vice President (2000-2004), and Assistant General Counsel (2002-2004) of Janus Services LLC; and Vice President and Assistant General Counsel (1999-2004) of Janus Capital. | ||||||||||||
| David R. Kowalski 151 Detroit Street Denver, CO 80206 Age 49 | Vice President and Chief Compliance Officer | 6/02-Present | Senior Vice President and Chief Compliance Officer of Janus Capital, Janus Distributors LLC, and Janus Services LLC; Chief Compliance Officer of Bay Isle Financial LLC; and Vice President of Enhanced Investment Technologies LLC. Formerly, Chief Compliance Officer of Enhanced Investment Technologies, LLC (2003-2005); Vice President of Janus Capital (2000-2005), Janus Distributors LLC (2000-2001), and Janus Services LLC (2004-2005); and Assistant Vice President of Janus Services LLC (2002-2004). | ||||||||||||
| Jesper Nergaard 151 Detroit Street Denver, CO 80206 Age 44 | Chief Financial Officer Vice President, Treasurer, and Principal Accounting Officer | 3/05-Present 2/05-Present | Vice President of Janus Capital. Formerly, Director of Financial Reporting for OppenheimerFunds, Inc. (2004-2005); Site Manager and First Vice President of Mellon Global Securities Services (2003); and Director of Fund Accounting, Project Development, and Training of INVESCO Funds Group (1994-2003). | ||||||||||||
* Officers are elected at least annually for a one-year term and may also be elected from time to time by the Trustees for an interim period.
Janus Aspen Series December 31, 2006 31
Notes
32 Janus Aspen Series December 31, 2006
Notes
Janus Aspen Series December 31, 2006 33
Janus provides access to a wide range of investment disciplines.
Growth
Janus growth portfolios focus on companies believed to be the leaders in their respective industries, with solid management teams, expanding market share, margins and efficiencies.
Core
Janus core portfolios seek investments in more stable and predictable companies. These portfolios look for a strategic combination of steady growth and for certain portfolios, some degree of income.
Risk-Managed
Our risk-managed portfolios seek to outperform their respective indices while maintaining a risk profile equal to or lower than the index itself. Managed by INTECH (a Janus subsidiary), these portfolios use a mathematical process in an attempt to build a more "efficient" portfolio than the index.
Value
Janus value portfolios invest in companies they believe are poised for a turnaround or are trading at a significant discount to fair value. The goal is to gain unique insight into a company's true value and identify and evaluate potential catalysts that may unlock shareholder value.
International & Global
Janus international and global portfolios seek to leverage Janus' research capabilities by taking advantage of inefficiencies in foreign markets, where accurate information and analytical insight are often at a premium.
Bond & Money Market
Janus bond portfolios attempt to provide less risk relative to equities while seeking to deliver a competitive total return through high current income and appreciation. Janus money market portfolios seek maximum current income consistent with stability of capital.
For more information about our funds, contact your investment professional or go to www.janus.com/info
Please consider the charges, risks, expenses and investment objectives carefully before investing. For a prospectus containing this and other information, please call Janus at 1-800-525-0020 or download the file from www.janus.com/info. Read it carefully before you invest or send money.
An investment in a money market portfolio is not insured or guaranteed by the Federal Deposit Insurance Corporation or any other government agency. Although the Portfolio seeks to preserve the value of your investment at $1.00 per share, it is possible to lose money by investing in the Portfolio.

151 Detroit Street
Denver, CO 80206
1-800-525-0020
Portfolio distributed by Janus Distributors LLC (1/07)
C-0207-169 109-02-714 01-07
2006 Annual Report
Janus Aspen Series
Janus Aspen Growth and Income Portfolio
Look Inside. . .
• Portfolio management perspective
• Investment strategy behind your portfolio
• Portfolio performance, characteristics and holdings

Table of Contents
| Useful Information About Your Portfolio Report | 1 | ||||||
| Management Commentary and Schedule of Investments | 2 | ||||||
| Statement of Assets and Liabilities | 9 | ||||||
| Statement of Operations | 10 | ||||||
| Statements of Changes in Net Assets | 11 | ||||||
| Financial Highlights | 12 | ||||||
| Notes to Schedule of Investments | 13 | ||||||
| Notes to Financial Statements | 14 | ||||||
| Report of Independent Registered Public Accounting Firm | 23 | ||||||
| Additional Information | 24 | ||||||
| Explanations of Charts, Tables and Financial Statements | 27 | ||||||
| Designation Requirements | 29 | ||||||
| Trustees and Officers | 30 | ||||||
Please consider the charges, risks, expenses and investment objectives carefully before investing. For a prospectus containing this and other information, please call Janus at 1-800-525-0020 or download the file from www.janus.com/info. Read it carefully before you invest or send money.
Useful Information About Your Portfolio Report
Management Commentary
The Management Commentary in this report includes valuable insight from the Portfolio's manager as well as statistical information to help you understand how your Portfolio's performance and characteristics stack up against those of comparable indices.
Please keep in mind that the opinions expressed by the Portfolio's manager in the Management Commentary are just that: opinions. They are a reflection of the manager's best judgment at the time this report was compiled, which was December 31, 2006. As the investing environment changes, so could the manager's opinions. The views are unique to the manager and aren't necessarily shared by his fellow employees or by Janus in general.
Portfolio Expenses
We believe it's important for our shareholders to have a clear understanding of Portfolio expenses and the impact they have on investment return.
The following is important information regarding the Portfolio's Expense Example, which appears in the Management Commentary within this Annual Report. Please refer to this information when reviewing the Expense Example for the Portfolio.
Example
As a shareholder of a Portfolio, you incur two types of costs: (1) transaction costs, including redemption fees (where applicable) (and any related exchange fees) and (2) ongoing costs, including management fees; distribution and shareholder servicing (12b-1) fees (applicable to Service Shares only); and other Portfolio expenses. The example is intended to help you understand your ongoing costs (in dollars) of investing in a Portfolio and to compare these costs with the ongoing costs of investing in other mutual funds. To do so, compare this 5% hypothetical example with the 5% hypothetical examples that appear in the shareholder reports of the other funds. The example is based upon an investment of $1,000 invested at the beginning of the period and held for the six-month period from July 1, 2006 to December 31, 2006.
Actual Expenses
The first line of the table in each example provides information about actual account values and actual expenses. You may use the information in this line, together with the amount you invested, to estimate the expenses that you paid over the period. Simply divide your account value by $1,000 (for example, an $8,600 account value divided by $1,000 = 8.6), then multiply the result by the number in the first line under the heading entitled "Expenses Paid During Period" to estimate the expenses you paid on your account during the period.
Hypothetical Example for Comparison Purposes
The second line of the table in each example provides information about hypothetical account values and hypothetical expenses based upon the Portfolio's actual expense ratio and an assumed rate of return of 5% per year before expenses, which is not the Portfolio's actual return. The hypothetical account values and expenses may not be used to estimate the actual ending account balance or expenses you paid for the period. You may use this information to compare the ongoing costs of investing in the Portfolio and other funds. To do so, compare this 5% hypothetical example with the 5% hypothetical examples that appear in the shareholder reports of the other funds.
Please note that the expenses shown in the tables are meant to highlight your ongoing costs only and do not reflect any transaction costs, such as redemption fees (where applicable) and any charges at the separate account level or contract level. Redemption fees are fully described in the prospectus. Therefore, the second line of each table is useful in comparing ongoing costs only, and will not help you determine the relative total costs of owning different funds. In addition, if these transaction costs and separate account or contract level charges were included, your costs would have been higher.
Janus Aspen Series December 31, 2006 1
Janus Aspen Growth and Income Portfolio
(unaudited)
Portfolio Snapshot
This conservative growth portfolio from Janus combines core holdings and opportunistic companies with income oriented securities, seeking to deliver consistent returns through all types of market conditions.

Minyoung Sohn
portfolio manager
Performance Overview
For the 12-month period ended December 31, 2006, Janus Aspen Growth and Income Portfolio's Institutional Shares and Service Shares returned 8.12% and 7.83%, respectively, trailing the Portfolio's primary benchmark, the S&P 500® Index, which gained 15.80%. The Portfolio's performance also fell short of the 9.07% return of the Russell 1000® Growth Index, its secondary benchmark.
First, a Few Words on Process
Especially in light of the Portfolio's underperformance versus its benchmarks, I would like to discuss how I pick stocks and construct the Portfolio. I place strong emphasis on the synthesis of qualitative research and quantitative analysis. Deep grassroots research must be tied to balance sheet, cash flow and valuation analysis. While this is what I seek from Janus' team of research analysts, I have also made clear what they can expect from me. I will be accessible. I will read research notes and review models. I will help analysts pitch their best ideas to other portfolio managers. I believe the formula for successful investing at Janus is the close collaboration among our talented research team and I intend to leverage that research as much as possible. At the end of the period, over 70% of the Portfolio's assets were held in stocks our own analysts rated as "buy" or "strong buy."
Investment Philosophy and Strategy
The primary investment objective of the Portfolio is to seek long-term growth of capital. The Portfolio is managed for shareholders in pursuit of longer-term financial objectives such as building a retirement nest egg, buying a home or funding a college education – investors who want long-term exposure to the equity market. A traditional definition of a conservative approach to equity investing implies looking at the price volatility of the Portfolio, or its beta, relative to a benchmark. I have a broader view in which the spirit of conservatism is captured in the portfolio construction process. I attempt to control risk by monitoring the diversification of the Portfolio1 and by limiting the maximum position size to under 5%. And while I employ a bottom-up approach to picking stocks, I will keep an eye on the size of sector weightings relative to the Portfolio's benchmarks.2
Portfolio Construction
From a portfolio construction point of view, I broadly think of the Portfolio as holding two buckets of stocks. The first bucket is comprised of the core holdings. What is a core holding? In my view, any company's primary business activity – whether it is Exxon Mobil, Procter & Gamble or Yahoo! – can be boiled down to one of the following areas: manufacturing (how products and/or services are built); distribution (how products go to market); or research and development (how new products or services are developed). It is my belief that companies with sustainable competitive advantages in one or more of these areas will generate superior margins and returns on invested capital versus their peer group, and that their stock prices should accordingly outperform over time. Owning these core holdings is a bet on the status quo – the company's ability to conti nue to build value over time.
The second bucket is comprised of "special situation" stocks. This is a widely used and somewhat ambiguous term, which might imply a new management team, changes to the business portfolio – for example, selling underperforming business units, perhaps a decision triggered by new management – or changes to the way capital is allocated among businesses or returned to shareholders. A special situation may also be characterized by moments when a company is poised to benefit from a product catalyst powerful enough to enhance the complexion of its profit and cash flow structure. The key to owning a special situation stock is having confidence that change is underway and that this dynamic element has not yet been recognized or reflected in the valuation of the company.
Weak Performers Included Yahoo! and Neurocrine Biosciences
Weighing on the Portfolio investment results were lackluster performance by several technology shares. These included Yahoo!, which declined 34.81% over the 12-month period on continued concerns about the company's long-term growth rate, as well as its competitive positioning versus Google. Nonetheless, I remain constructive on the company's potential. The traditional media industry is facing formidable challenges as content digitalization and the emergence of new distribution channels drive increased audience fragmentation and declining audiences in general. Due to its large and growing user base, I believe Yahoo! is well positioned to benefit from this trend through its multiple revenue streams in branded advertising,
2 Janus Aspen Series December 31, 2006
(unaudited)
sponsored search, and premium subscription services. In the near-term, I am also relatively positive on prospects tied to Yahoo!'s new search platform, called "Project Panama," which may help the company to improve the potential growth and profitability of its search business.
Our exposure in Neurocrine Biosciences was another large detractor, with shares down over 83% in the period. Neurocrine received a blow in the second quarter after the Food and Drug Administration (FDA) failed to approve the 15-milligram formulation of its prospective insomnia treatment Indiplon, due to concerns over certain low-level amnesia side effects. The FDA did issue approvable letters for the lower 5- and 10-milligram doses of the drug. Nonetheless, in the wake of this news, pharmaceutical marketing powerhouse Pfizer abandoned its plans to help co-market Indiplon, which cast additional uncertainty on its commercial future. Then, in the fourth quarter, the stock took another tumble after Neurocrine reported a larger-than-anticipated third quarter financial loss. Meanwhile, in November 2006 the company announced plans to conduct additional clinical studies on Indiplon, and plans to resubmit the drug for approval in the summer of 2008. Despite these struggles, we maintained a stake in Neurocrine. This decision reflected our continued evaluation of the company's trial data, and our views on the efficacy of Indiplon relative to other sleep aids.
Significant Contributors Included Energy Holdings
The Portfolio's returns for the period benefited from an overweight exposure to energy stocks relative to the benchmark, which outperformed the rest of the market for much of the period. The Portfolio's investment in energy shares is based on our fundamental analysis of supply and demand for crude oil and natural gas. There are two related critical differences between the high oil prices today and those of the past. First, current prices have been driven by demand growth and not a supply disruption. In particular, strong worldwide gross domestic product (GDP) growth and the emergence of China and India have resulted in annual demand growth of 1.5% to 2.0%, which has outpaced the rate of supply growth. Second, worldwide spare production capacity is estimated to be two million barrels per day on a demand base of 85 million barrels. This tightness may see temporary relief in 2007, but we remain bullish on oil due to our analysis of long-term su pply and demand, as it is increasingly difficult to find large new sources of supply. Our research suggests that non-OPEC supply will peak in 2009 or 2010 and that OPEC will struggle to increase output meaningfully enough to the meet the world's demand growth. This will likely create a situation where the market must price out demand – at an equilibrium price that is clearly well above the $60- to $65-per-barrel price we see today.
Among individual energy shares, Exxon Mobil emerged as the Portfolio's top-performing holding for the year. The Portfolio owns Exxon due to its track record of superior returns on invested capital relative to its major integrated peer group. The company has a large resource base totaling over 72 billion barrels and should deliver accelerating production growth in the upstream business as major projects in West Africa come online. Based on projections of $60-per-barrel oil and $9 gas, we believe Exxon should generate nearly $60 billion in operating profit and $30 billion in free cash flow. On an earnings-per-share basis, Exxon will likely be approximately $6 per share next year, meaning that the shares are currently trading below the broader S&P 500® Index. I view Exxon as a solid, long-term holding in the Portfolio. As the company continues to demonstrate its earnings power and returns significant cash to shareholders thro ugh dividends and share repurchase, I believe the stock will respond.
Another strong performer, Suncor Energy, provides a leveraged play on the long-term price of oil. The company is a leading developer of oil sands in Canada. The Canadian oil sands basin near Fort McMurray, Alberta, is one of the world's largest hydrocarbon resources with over 175 billion oil-equivalent barrels. The Suncor resource base today covers 12 billion barrels of bitumen – enough to produce 10 billion barrels of oil. Although many companies have some exposure to this resource, Suncor is the only large pure play on the oil sands. I also believe the company is a highly attractive acquisition target for the major integrated oil companies (the "majors") as well as foreign government oil enterprises. The oil sands pose no exploration risk and the development cost, though large, is one which is relatively fixed and could potentially be lowered with technological advances. As it is becoming increasingly difficult to locate and develop c onventional oil resources, the fixed cost structure of the abundant oil sands should look increasingly attractive to the majors. Moreover, as the majors are forced to follow oil into politically unstable regions such as West Africa and the former Soviet Union, the relative stability of Canada should make these assets even more compelling.
Closing Comments
The challenge in the recent environment has been to provide you with attractive returns (after expenses) that reward your confidence in our investment management efforts, while at the same time managing downside risk in what has been a volatile market. I welcome this challenge, as I am supported by a
Janus Aspen Series December 31, 2006 3
Janus Aspen Growth and Income Portfolio (unaudited)
talented analyst pool. I remain firm in my strategy of picking stocks one at a time and staying close to what I believe are the best ideas generated by the Janus research team.
As always, I promise you my utmost effort in the periods ahead. In addition, a portion of my personal assets are invested here at Janus in the two retail funds under my charge, Janus Growth and Income Fund and Janus Fundamental Equity Fund, and I continue to contribute every month to both.
Thank you for your investment in Janus Aspen Growth and Income Portfolio.
1 To put some numbers around this statement: the top 10 positions will generally comprise approximately 30% of the assets and the top 20 positions will be approximately 45-55% of assets.
2 Sector weightings are compared to both the S&P 500® Index and the Russell 1000® Growth Index.
Janus Aspen Growth and Income Portfolio At a Glance
5 Largest Contributors to Performance – Holdings
| Contribution | |||||||
| Exxon Mobil Corp. Petroleum and petrochemical business operator - U.S. | 1.35 | % | |||||
| Suncor Energy, Inc. Energy company - Canada | 1.02 | % | |||||
| NVIDIA Corp. Three-dimensional (3D) graphics processors provider - U.S. | 0.86 | % | |||||
| Marvel Entertainment, Inc. Character licensing, publishing, and toy manufacturing operations company - U.S. | 0.72 | % | |||||
| Bharti Tele-Ventures, Ltd. Telecommunications services provider - India | 0.60 | % | |||||
5 Largest Detractors from Performance – Holdings
| Contribution | |||||||
| Advanced Micro Devices, Inc. Integrated circuits provider - U.S. | (1.33 | )% | |||||
| Yahoo!, Inc. Global Internet media company - U.S. | (0.88 | )% | |||||
| UnitedHealth Group, Inc. Organized health systems company - U.S. | (0.78 | )% | |||||
| Neurocrine Biosciences, Inc. Biotechnology company - U.S. | (0.76 | )% | |||||
| Tata Steel, Ltd. Steel company - India | (0.38 | )% | |||||
5 Largest Contributors to Performance – Sectors
| Group | Equity Contribution | Portfolio Weighting (% of Net Assets) | S&P 500® Index Weighting | ||||||||||||
| Energy | 2.59 | % | 18.08 | % | 9.84 | % | |||||||||
| Consumer Services | 1.58 | % | 2.74 | % | 1.66 | % | |||||||||
| Capital Goods | 1.28 | % | 8.94 | % | 8.72 | % | |||||||||
| Diversified Financials | 1.10 | % | 5.09 | % | 9.48 | % | |||||||||
| Media | 0.92 | % | 3.25 | % | 3.40 | % | |||||||||
5 Largest Detractors from Performance – Sectors
| Group | Equity Contribution | Portfolio Weighting (% of Net Assets) | S&P 500® Index Weighting | ||||||||||||
| Healthcare Equipment & Services | (0.84 | )% | 6.35 | % | 4.57 | % | |||||||||
| Software & Services | (0.68 | )% | 6.95 | % | 5.53 | % | |||||||||
| Semiconductors & Semiconductor Equipment | (0.58 | )% | 13.06 | % | 2.82 | % | |||||||||
| Materials | (0.38 | )% | 1.42 | % | 2.99 | % | |||||||||
| Food & Staples Retailing | (0.02 | )% | 0.47 | % | 2.33 | % | |||||||||
4 Janus Aspen Series December 31, 2006
(unaudited)
5 Largest Equity Holdings – (% of Net Assets)
As of December 31, 2006
| General Electric Co. Diversified Operations | 3.8 | % | |||||
| Advanced Micro Devices, Inc. Electronic Components - Semiconductors | 3.3 | % | |||||
| Suncor Energy, Inc. Oil Companies - Integrated | 3.0 | % | |||||
| Hess Corp. Oil Companies - Integrated | 2.9 | % | |||||
| EMC Corp. Computers - Memory Devices | 2.9 | % | |||||
| 15.9 | % | ||||||
Asset Allocation – (% of Net Assets)
As of December 31, 2006
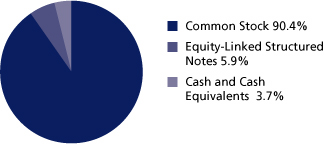
Emerging markets comprised 7.1% of total net assets.
Top Country Allocations – (% of Investment Securities)
| As of December 31, 2006 | As of December 31, 2005 | ||||||
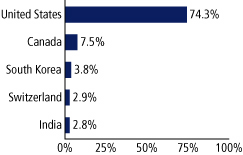 |  | ||||||
Janus Aspen Series December 31, 2006 5
Janus Aspen Growth and Income Portfolio (unaudited)
Performance

Average Annual Total Return – for the periods ended December 31, 2006
| One Year | Five Year | Since Inception* | |||||||||||||
| Janus Aspen Growth and Income Portfolio - Institutional Shares | 8.12 | % | 5.69 | % | 8.61 | % | |||||||||
| Janus Aspen Growth and Income Portfolio - Service Shares | 7.83 | % | 5.45 | % | 8.35 | % | |||||||||
| S&P 500® Index | 15.80 | % | 6.19 | % | 4.38 | % | |||||||||
| Russell 1000® Growth Index | 9.07 | % | 2.69 | % | 1.24 | % | |||||||||
| Lipper Quartile - Institutional | 4 | th | 2 | nd | 1 | st | |||||||||
| Lipper Ranking - Institutional Shares based on total returns for Variable Annuity Large-Cap Core Funds | 206/224 | 61/165 | 3/89 | ||||||||||||
Data presented represents past performance, which is no guarantee of future results. Investment results and principal value will fluctuate so that shares, when redeemed, may be worth more or less than their original cost. Due to market volatility, current performance may be higher or lower than the performance shown. Call 877.33JANUS or visit www.janus.com/info for performance current to the most recent month-end.
See Notes to Schedule of Investments for index definitions.
Total return includes reinvestment of dividends from net investment income and distributions from capital gains. The returns shown do not reflect the deduction of taxes that a shareholder would pay on Portfolio distributions or the redemption of Portfolio shares.
Returns shown for Service Shares for periods prior to December 31, 1999 are derived from the historical performance of Institutional Shares, adjusted to reflect the higher operating expenses of Service Shares.
These returns do not reflect the charges and expenses of any particular insurance product or qualified plan. Returns shown would have been lower had they included insurance charges.
The Portfolio may differ significantly from the securities held in the indices. The indices are not available for direct investment; therefore their performance does not reflect the expenses associated with the active management of an actual Portfolio.
There is no assurance that the investment process will consistently lead to successful investing.
The Portfolio's performance may be affected by risks that include those associated with nondiversification, non-investment grade debt securities, undervalued or overlooked companies, investments in specific industries or countries and potential conflicts of interest with Janus Smart Portfolios. Additional risks to the Portfolio may include those associated with investing in foreign securities, emerging markets, initial public offerings, derivatives and companies with relatively small market capitalizations. Please see a Janus prospectus or www.janus.com/info for more information about risk, fund holdings and details.
Lipper Inc. - A Reuters Company, is a nationally recognized organization that ranks the performance of mutual funds within a universe of funds that have similar investment objectives. Rankings are historical with capital gains and dividends reinvested.
The date of the since-inception Lipper ranking is slightly different from when the Portfolio began operations since Lipper provides fund rankings as of the last day of the month or the first Thursday after fund inception.
Ranking is for the Institutional share class only; other classes may have different performance characteristics.
See "Explanations of Charts, Tables and Financial Statements."
* The Portfolio's inception date – May 1, 1998
Portfolio Expenses
The example below shows you the ongoing costs (in dollars) of investing in your Portfolio and allows you to compare these costs with those of other mutual funds. Please refer to page 1 for a detailed explanation of the information presented in these charts.
| Expense Example – Institutional Shares | Beginning Account Value (7/1/06) | Ending Account Value (12/31/06) | Expenses Paid During Period (7/1/06-12/31/06)* | ||||||||||||
| Actual | $ | 1,000.00 | $ | 1,060.80 | $ | 4.42 | |||||||||
| Hypothetical (5% return before expenses) | $ | 1,000.00 | $ | 1,020.92 | $ | 4.33 | |||||||||
| Expense Example – Service Shares | Beginning Account Value (7/1/06) | Ending Account Value (12/31/06) | Expenses Paid During Period (7/1/06-12/31/06)* | ||||||||||||
| Actual | $ | 1,000.00 | $ | 1,059.60 | $ | 5.71 | |||||||||
| Hypothetical (5% return before expenses) | $ | 1,000.00 | $ | 1,019.66 | $ | 5.60 | |||||||||
*Expenses are equal to the annualized expense ratio of 0.85% for Institutional Shares and 1.10% for Service Shares, multiplied by the average account value over the period, multiplied by 184/365 (to reflect the one-half year period).
6 Janus Aspen Series December 31, 2006
Janus Aspen Growth and Income Portfolio
Schedule of Investments
As of December 31, 2006
| Shares/Principal/Contract Amounts | Value | ||||||||||
| Common Stock - 90.4% | |||||||||||
| Advertising Sales - 1.3% | |||||||||||
| 16,265 | Lamar Advertising Co.* | $ | 1,063,568 | ||||||||
| Aerospace and Defense - 1.8% | |||||||||||
| 16,885 | Boeing Co. | 1,500,063 | |||||||||
| Agricultural Operations - 0.3% | |||||||||||
| 9,070 | Archer-Daniels-Midland Co. | 289,877 | |||||||||
| Building - Residential and Commercial - 0.6% | |||||||||||
| 750 | NVR, Inc.*,# | 483,750 | |||||||||
| Casino Hotels - 2.1% | |||||||||||
| 18,805 | Boyd Gaming Corp. | 852,055 | |||||||||
| 11,030 | Harrah's Entertainment, Inc. | 912,401 | |||||||||
| 1,764,456 | |||||||||||
| Coal - 0.8% | |||||||||||
| 15,725 | Peabody Energy Corp. | 635,447 | |||||||||
| Commercial Banks - 1.2% | |||||||||||
| 29,130 | Commerce Bancorp, Inc.# | 1,027,415 | |||||||||
| Computers - 1.7% | |||||||||||
| 2,030 | Apple Computer, Inc.* | 172,225 | |||||||||
| 51,480 | Dell, Inc.* | 1,291,633 | |||||||||
| 1,463,858 | |||||||||||
| Computers - Memory Devices - 2.9% | |||||||||||
| 181,425 | EMC Corp.* | 2,394,810 | |||||||||
| Cosmetics and Toiletries - 2.6% | |||||||||||
| 34,202 | Procter & Gamble Co. | 2,198,163 | |||||||||
| Dental Supplies and Equipment - 0.6% | |||||||||||
| 37,835 | Align Technology, Inc.* | 528,555 | |||||||||
| Diversified Operations - 4.6% | |||||||||||
| 84,493 | General Electric Co. | 3,143,984 | |||||||||
| 286,000 | Melco International Development, Ltd. | 678,020 | |||||||||
| 3,822,004 | |||||||||||
| E-Commerce/Products - 0.8% | |||||||||||
| 16,550 | Amazon.com, Inc.*,# | 653,063 | |||||||||
| Electronic Components - Semiconductors - 10.1% | |||||||||||
| 135,730 | Advanced Micro Devices, Inc.* | 2,762,106 | |||||||||
| 34,305 | NVIDIA Corp.* | 1,269,628 | |||||||||
| 1,400 | Samsung Electronics Company, Ltd. | 922,796 | |||||||||
| 4,929 | Samsung Electronics Company, Ltd. (GDR) | 1,621,641 | |||||||||
| 50,905 | Spansion, Inc. - Class A*,# | 756,448 | |||||||||
| 38,286 | Texas Instruments, Inc. | 1,102,637 | |||||||||
| 8,435,256 | |||||||||||
| Energy - Alternate Sources - 0.5% | |||||||||||
| 13,180 | Suntech Power Holdings Company, Ltd. (ADR)*,# | 448,252 | |||||||||
| Entertainment Software - 1.3% | |||||||||||
| 22,405 | Electronic Arts, Inc.* | 1,128,316 | |||||||||
| Finance - Investment Bankers/Brokers - 5.0% | |||||||||||
| 41,617 | Citigroup, Inc. | 2,318,067 | |||||||||
| 37,625 | JP Morgan Chase & Co. | 1,817,288 | |||||||||
| 4,135,355 | |||||||||||
| Finance - Mortgage Loan Banker - 2.2% | |||||||||||
| 30,670 | Fannie Mae | 1,821,491 | |||||||||
| Food - Canned - 0.5% | |||||||||||
| 13,806 | TreeHouse Foods, Inc.* | 430,747 | |||||||||
| Shares/Principal/Contract Amounts | Value | ||||||||||
| Hotels and Motels - 1.0% | |||||||||||
| 10,500 | Four Seasons Hotels, Inc. | $ | 860,895 | ||||||||
| Industrial Automation and Robotics - 1.8% | |||||||||||
| 24,170 | Rockwell Automation, Inc. | 1,476,304 | |||||||||
| Investment Companies - 1.0% | |||||||||||
| 38,248 | KKR Private Equity Investors L.P. (U.S. Shares) (144A)** | 873,967 | |||||||||
| Medical - Biomedical and Genetic - 0.8% | |||||||||||
| 11,415 | Celgene Corp.* | 656,705 | |||||||||
| Medical - Drugs - 4.6% | |||||||||||
| 12,685 | Roche Holding A.G.** | 2,274,659 | |||||||||
| 17,171 | Sanofi-Aventis**,# | 1,585,521 | |||||||||
| 3,860,180 | |||||||||||
| Medical - HMO - 1.4% | |||||||||||
| 22,635 | Coventry Health Care, Inc.* | 1,132,882 | |||||||||
| Oil - Field Services - 1.3% | |||||||||||
| 35,845 | Halliburton Co. | 1,112,987 | |||||||||
| Oil Companies - Exploration and Production - 3.5% | |||||||||||
| 6,620 | Apache Corp. | 440,296 | |||||||||
| 45,938 | EnCana Corp. (U.S. Shares) | 2,110,851 | |||||||||
| 6,460 | EOG Resources, Inc. | 403,427 | |||||||||
| 2,954,574 | |||||||||||
| Oil Companies - Integrated - 9.7% | |||||||||||
| 27,315 | Exxon Mobil Corp. | 2,093,148 | |||||||||
| 49,244 | Hess Corp. | 2,441,026 | |||||||||
| 25,544 | Petro-Canada | 1,045,943 | |||||||||
| 31,801 | Suncor Energy, Inc. | 2,503,121 | |||||||||
| 8,083,238 | |||||||||||
| Oil Refining and Marketing - 1.3% | |||||||||||
| 21,385 | Valero Energy Corp. | 1,094,057 | |||||||||
| Optical Supplies - 0.4% | |||||||||||
| 2,785 | Alcon, Inc. (U.S. Shares)** | 311,279 | |||||||||
| Retail - Apparel and Shoe - 1.0% | |||||||||||
| 17,460 | Nordstrom, Inc. | 861,476 | |||||||||
| Retail - Consumer Electronics - 1.2% | |||||||||||
| 20,982 | Best Buy Company, Inc. | 1,032,105 | |||||||||
| Retail - Drug Store - 2.1% | |||||||||||
| 56,990 | CVS Corp.# | 1,761,561 | |||||||||
| Retail - Jewelry - 1.5% | |||||||||||
| 31,555 | Tiffany & Co.# | 1,238,218 | |||||||||
| Retail - Pet Food and Supplies - 1.2% | |||||||||||
| 34,005 | PETsMART, Inc. | 981,384 | |||||||||
| Shipbuilding - 1.0% | |||||||||||
| 26,800 | Daewoo Shipbuilding & Marine Engineering Company, Ltd. | 841,462 | |||||||||
| Steel - Producers - 1.7% | |||||||||||
| 128,284 | Tata Steel, Ltd. | 1,397,762 | |||||||||
| Super-Regional Banks - 1.6% | |||||||||||
| 37,960 | U.S. Bancorp | 1,373,772 | |||||||||
| Telecommunication Services - 1.4% | |||||||||||
| 80,579 | Bharti Tele-Ventures, Ltd.* | 1,146,876 | |||||||||
| Television - 1.7% | |||||||||||
| 137,771 | British Sky Broadcasting Group PLC | 1,408,111 | |||||||||
See Notes to Schedule of Investments and Financial Statements.
Janus Aspen Series December 31, 2006 7
Janus Aspen Growth and Income Portfolio
Schedule of Investments
As of December 31, 2006
| Shares/Principal/Contract Amounts | Value | ||||||||||
| Therapeutics - 1.0% | |||||||||||
| 16,775 | Amylin Pharmaceuticals, Inc.* | $ | 605,074 | ||||||||
| 20,675 | Neurocrine Biosciences, Inc.* | 215,434 | |||||||||
| 820,508 | |||||||||||
| Tobacco - 1.1% | |||||||||||
| 11,035 | Altria Group, Inc. | 947,024 | |||||||||
| Toys - 1.5% | |||||||||||
| 46,630 | Marvel Entertainment, Inc.*,# | 1,254,813 | |||||||||
| Transportation - Railroad - 0.2% | |||||||||||
| 3,516 | Canadian National Railway Co. (U.S. Shares) | 151,293 | |||||||||
| Transportation - Services - 0.9% | |||||||||||
| 10,500 | United Parcel Service, Inc. - Class B | 787,290 | |||||||||
| Web Portals/Internet Service Providers - 2.7% | |||||||||||
| 89,690 | Yahoo!, Inc.* | 2,290,683 | |||||||||
| Wireless Equipment - 0.9% | |||||||||||
| 38,100 | Nokia Oyj (ADR)** | 774,192 | |||||||||
| Total Common Stock (cost $60,936,038) | 75,710,044 | ||||||||||
| Equity-Linked Structured Notes - 5.9% | |||||||||||
| Finance - Investment Bankers/Brokers - 3.5% | |||||||||||
| 32,965 | Goldman Sachs Group, Inc., convertible (NVIDIA Corp.), 24.20% (144A)§ | 787,731 | |||||||||
| 5,800 | Goldman Sachs Group, Inc., convertible (Peabody Energy Corp., Celgene Corp. NVIDIA Corp.), 46.75% (144A)§ | 528,537 | |||||||||
| 694,000 | Lehman Brothers Holdings, Inc., convertible QUALCOMM, Inc., Lennar Corp., Suntech Power Holdings Co., Ltd.), 41.26% (144A)§ | 699,344 | |||||||||
| 18,877 | Morgan Stanley Co., convertible (QUALCOMM, Inc.), 10.01% (144A)§ | 714,683 | |||||||||
| 67,330 | Morgan Stanley Co., convertible, (Sirius Satellite Radio, Inc.), 14.00% (144A)§ | 245,755 | |||||||||
| 2,976,050 | |||||||||||
| Money Center Banks - 0.7% | |||||||||||
| 6,880 | Deutsche Bank A.G., convertible (Suncor Energy, Inc.), 20.53% (144A)§ | 556,867 | |||||||||
| Special Purpose Entity - 1.7% | |||||||||||
| 8,401 | Allegro Investment Corporation S.A. convertible, (Apple Computer, Inc.) 9.08% (144A)**,§ | 692,504 | |||||||||
| 37,665 | Allegro Investment Corporation S.A. convertible, (Corning, Inc.) 20.10% (144A)**,§ | 715,590 | |||||||||
| 1,408,094 | |||||||||||
| Total Equity-Linked Structured Notes (cost $5,033,105) | 4,941,011 | ||||||||||
| Money Markets - 2.5% | |||||||||||
| 60,000 | Janus Institutional Cash Reserves Fund, 5.29% | 60,000 | |||||||||
| 2,018,684 | Janus Money Market Fund, 5.24% | 2,018,684 | |||||||||
| Total Money Markets (cost $2,078,684) | 2,078,684 | ||||||||||
| Purchased Options - Calls - 0% | |||||||||||
| 116 | Proctor & Gamble Co., expires January 2008 exercise price $70.00 (premiums paid $28,734) | 27,260 | |||||||||
| Other Securities - 7.6% | |||||||||||
| 6,357,746 | State Street Navigator Securities Lending Prime Portfolio† (cost $6,357,746) | 6,357,746 | |||||||||
| Total Investments (total cost $74,434,307) – 106.4% | 89,114,745 | ||||||||||
| Liabilities, net of Cash, Receivables and Other Assets** – (6.4)% | (5,353,117 | ) | |||||||||
| Net Assets – 100.0% | $ | 83,761,628 | |||||||||
Summary of Investments by Country
| Country | Value | % of Investment Securities | |||||||||
| Canada | $ | 6,672,103 | 7.5 | % | |||||||
| Cayman Islands | 448,252 | 0.5 | % | ||||||||
| Finland | 774,192 | 0.9 | % | ||||||||
| France | 1,585,521 | 1.8 | % | ||||||||
| Hong Kong | 678,020 | 0.7 | % | ||||||||
| India | 2,544,638 | 2.8 | % | ||||||||
| Luxembourg | 1,408,094 | 1.6 | % | ||||||||
| Netherlands | 873,967 | 1.0 | % | ||||||||
| South Korea | 3,385,899 | 3.8 | % | ||||||||
| Switzerland | 2,585,938 | 2.9 | % | ||||||||
| United Kingdom | 1,964,978 | 2.2 | % | ||||||||
| United States†† | 66,193,143 | 74.3 | % | ||||||||
| Total | $ | 89,114,745 | 100.0 | % | |||||||
††Includes Short-Term Securities and Other Securities (64.8% excluding Short-Term Securities and Other Securities)
Forward Currency Contracts, Open
| Currency Sold and Settlement Date | Currency Units Sold | Currency Value in $U.S. | Unrealized Gain/(Loss) | ||||||||||||
| Euro 1/11/07 | 435,000 | $ | 574,575 | $ | (19,950 | ) | |||||||||
| Euro 3/15/07 | 85,000 | 112,577 | (5,175 | ) | |||||||||||
| Swiss Franc 1/11/07 | 505,000 | 415,016 | (232 | ) | |||||||||||
| Swiss Franc 3/14/07 | 390,000 | 322,338 | (3,359 | ) | |||||||||||
| Total | $ | 1,424,506 | $ | (28,716 | ) | ||||||||||
| Value | |||||||
| Schedule of Written Options - Puts | |||||||
| Procter & Gamble Co. expires January 2008 58 contracts exercise price $55.00 | $ | (292 | ) | ||||
| Procter & Gamble Co. expires January 2008 58 contracts exercise price $60.00 | (9,280 | ) | |||||
| Total Written Options - Puts | |||||||
| 116 contracts (Premiums received $16,824) | $ | (9,572 | ) | ||||
See Notes to Schedule of Investments and Financial Statements.
8 Janus Aspen Series December 31, 2006
Statement of Assets and Liabilities
| As of December 31, 2006 (all numbers in thousands except net asset value per share) | Janus Aspen Growth and Income Portfolio | ||||||
| Assets: | |||||||
| Investments at cost(1) | $ | 74,434 | |||||
| Investments at value(1) | $ | 89,115 | |||||
| Cash | 36 | ||||||
| Cash denominated in foreign currency (cost $2) | 2 | ||||||
| Restricted cash (see Note 1) | 700 | ||||||
| Receivables: | |||||||
| Investments sold | 246 | ||||||
| Portfolio shares sold | 55 | ||||||
| Dividends | 107 | ||||||
| Interest | 11 | ||||||
| Other assets | 2 | ||||||
| Total Assets | 90,274 | ||||||
| Liabilities: | |||||||
| Payables: | |||||||
| Options written (premiums received of $17) | 10 | ||||||
| Collateral for securities loaned (Note 1) | 6,358 | ||||||
| Portfolio shares repurchased | 7 | ||||||
| Advisory fees | 44 | ||||||
| Transfer agent fees and expenses | 1 | ||||||
| Distribution fees - Service Shares | 8 | ||||||
| Non-interested Trustees' fees and expenses | 2 | ||||||
| Foreign tax liability | 11 | ||||||
| Accrued expenses | 42 | ||||||
| Forward currency contracts | 29 | ||||||
| Total Liabilities | 6,512 | ||||||
| Net Assets | $ | 83,762 | |||||
| Net Assets Consist of: | |||||||
| Capital (par value and paid-in-surplus)* | $ | 122,232 | |||||
| Undistributed net investment income/(loss)* | 163 | ||||||
| Undistributed net realized gain/(loss) from investments and foreign currency transactions* | (53,281 | ) | |||||
| Unrealized net appreciation/(depreciation) of investments and foreign currency translations(2) | 14,648 | ||||||
| Total Net Assets | $ | 83,762 | |||||
| Net Assets - Institutional Shares | $ | 46,586 | |||||
| Shares Outstanding, $0.001 Par Value (unlimited shares authorized) | 2,495 | ||||||
| Net Asset Value Per Share | $ | 18.67 | |||||
| Net Assets - Service Shares | $ | 37,176 | |||||
| Shares Outstanding, $0.001 Par Value (unlimited shares authorized) | 1,979 | ||||||
| Net Asset Value Per Share | $ | 18.79 | |||||
* See Note 3 in Notes to Financial Statements.
(1) Investments at cost and value include $6,178,419 of securities loaned for Janus Aspen Growth and Income Portfolio (Note 1).
(2) Net of foreign taxes on investments of $11,065 for Janus Aspen Growth and Income Portfolio.
See Notes to Financial Statements.
Janus Aspen Series December 31, 2006 9
Statement of Operations
| For the fiscal year ended December 31, 2006 (all numbers in thousands) | Janus Aspen Growth and Income Portfolio | ||||||
| Investment Income: | |||||||
| Interest | $ | 42 | |||||
| Securities lending income | 11 | ||||||
| Dividends | 2,368 | ||||||
| Dividends from affiliates | 81 | ||||||
| Foreign tax withheld | (26 | ) | |||||
| Total Investment Income | 2,476 | ||||||
| Expenses: | |||||||
| Advisory fees | 545 | ||||||
| Transfer agent expenses | 4 | ||||||
| Registration fees | 23 | ||||||
| Custodian fees | 18 | ||||||
| Professional fees | 19 | ||||||
| Non-interested Trustees' fees and expenses | 6 | ||||||
| Distribution fees - Service Shares | 112 | ||||||
| Printing expenses | 53 | ||||||
| Proxy expenses | 26 | ||||||
| Legal fees | 12 | ||||||
| System fees | 37 | ||||||
| Other expenses | 7 | ||||||
| Non-recurring costs (Note 2) | – | ||||||
| Costs assumed by Janus Capital Management LLC (Note 2) | – | ||||||
| Total Expenses | 862 | ||||||
| Expense and Fee Offset | (2 | ) | |||||
| Net Expenses | 860 | ||||||
| Net Investment Income/(Loss) | 1,616 | ||||||
| Net Realized and Unrealized Gain/(Loss) on Investments: | |||||||
| Net realized gain/(loss) from securities transactions | 11,454 | ||||||
| Net realized gain/(loss) from foreign currency transactions | (5 | ) | |||||
| Change in unrealized net appreciation/(depreciation) of investments and foreign currency translations(1) | (5,690 | ) | |||||
| Payment from affiliate | – | ||||||
| Net Gain/(Loss) on Investments | 5,759 | ||||||
| Net Increase/(Decrease) in Net Assets Resulting from Operations | $ | 7,375 | |||||
(1) Net of foreign taxes on investments of $11,065 for the Janus Aspen Growth and Income Portfolio.
See Notes to Financial Statements.
10 Janus Aspen Series December 31, 2006
Statements of Changes in Net Assets
| For the fiscal year ended December 31 | Janus Aspen Growth and Income Portfolio | ||||||||||
| (all numbers in thousands) | 2006 | 2005 | |||||||||
| Operations: | |||||||||||
| Net investment income/(loss) | $ | 1,616 | $ | 389 | |||||||
| Net realized gain/(loss) from investment and foreign currency transactions | 11,449 | 5,263 | |||||||||
| Change in unrealized net appreciation/(depreciation) of investments and foreign currency translations | (5,690 | ) | 4,565 | ||||||||
| Payment from affiliate (Note 2) | – | 23 | |||||||||
| Net Increase/(Decrease) in Net Assets Resulting from Operations | 7,375 | 10,240 | |||||||||
| Dividends and Distributions to Shareholders: | |||||||||||
| Net investment income* | |||||||||||
| Institutional Shares | (757 | ) | (211 | ) | |||||||
| Service Shares | (513 | ) | (197 | ) | |||||||
| Net realized gain from investment transactions* | |||||||||||
| Institutional Shares | – | – | |||||||||
| Service Shares | – | – | |||||||||
| Net Decrease from Dividends and Distributions | (1,270 | ) | (408 | ) | |||||||
| Capital Share Transactions: | |||||||||||
| Shares sold | |||||||||||
| Institutional Shares | 18,074 | 13,482 | |||||||||
| Service Shares | 4,815 | 6,649 | |||||||||
| Reinvested dividends and distributions | |||||||||||
| Institutional Shares | 757 | 211 | |||||||||
| Service Shares | 513 | 197 | |||||||||
| Shares repurchased | |||||||||||
| Institutional Shares | (12,946 | ) | (7,033 | ) | |||||||
| Service Shares | (27,253 | ) | (13,021 | ) | |||||||
| Net Increase/(Decrease) from Capital Share Transactions | (16,040 | ) | 485 | ||||||||
| Net Increase/(Decrease) in Net Assets | (9,935 | ) | 10,317 | ||||||||
| Net Assets: | |||||||||||
| Beginning of period | 93,697 | 83,380 | |||||||||
| End of period | $ | 83,762 | $ | 93,697 | |||||||
| Undistributed net investment income/(loss)* | $ | 163 | $ | 106 | |||||||
* See Note 3 in Notes to Financial Statements.
See Notes to Financial Statements.
Janus Aspen Series December 31, 2006 11
Financial Highlights
Institutional Shares
| For a share outstanding during each fiscal year ended December 31 | Janus Aspen Growth and Income Portfolio | ||||||||||||||||||||||
| 2006 | 2005 | 2004 | 2003 | 2002 | |||||||||||||||||||
| Net Asset Value, Beginning of Period | $ | 17.57 | $ | 15.70 | $ | 14.11 | $ | 11.56 | $ | 14.87 | |||||||||||||
| Income from Investment Operations: | |||||||||||||||||||||||
| Net investment income/(loss) | .29 | .10 | .09 | .15 | .12 | ||||||||||||||||||
| Net gain/(loss) on securities (both realized and unrealized) | 1.13 | 1.88 | 1.60 | 2.53 | (3.32 | ) | |||||||||||||||||
| Total from Investment Operations | 1.42 | 1.98 | 1.69 | 2.68 | (3.20 | ) | |||||||||||||||||
| Less Distributions and Other: | |||||||||||||||||||||||
| Dividends (from net investment income)* | (.32 | ) | (.11 | ) | (.10 | ) | (.13 | ) | (.11 | ) | |||||||||||||
| Distributions (from capital gains)* | – | – | – | – | – | ||||||||||||||||||
| Payment from affiliate | – | (1) | – | – | – | – | |||||||||||||||||
| Total Distributions and Other | (.32 | ) | (.11 | ) | (.10 | ) | (.13 | ) | (.11 | ) | |||||||||||||
| Net Asset Value, End of Period | $ | 18.67 | $ | 17.57 | $ | 15.70 | $ | 14.11 | $ | 11.56 | |||||||||||||
| Total Return | 8.12 | %(2) | 12.62 | % | 11.97 | % | 23.34 | % | (21.54 | )% | |||||||||||||
| Net Assets, End of Period (in thousands) | $ | 46,586 | $ | 38,146 | $ | 27,784 | $ | 26,816 | $ | 55,271 | |||||||||||||
| Average Net Assets for the Period (in thousands) | $ | 43,210 | $ | 31,257 | $ | 25,658 | $ | 29,902 | $ | 72,550 | |||||||||||||
| Ratio of Gross Expenses to Average Net Assets(3)(4) | 0.86 | % | 0.74 | % | 0.77 | % | 0.83 | % | 0.76 | % | |||||||||||||
| Ratio of Net Expenses to Average Net Assets(4) | 0.86 | % | 0.74 | % | 0.77 | % | 0.83 | % | 0.76 | % | |||||||||||||
| Ratio of Net Investment Income/(Loss) to Average Net Assets | 1.97 | % | 0.62 | % | 0.63 | % | 0.85 | % | 0.81 | % | |||||||||||||
| Portfolio Turnover Rate | 58 | % | 37 | % | 48 | % | 43 | % | 54 | % | |||||||||||||
Service Shares
| For a share outstanding during each fiscal year ended December 31 | Janus Aspen Growth and Income Portfolio | ||||||||||||||||||||||
| 2006 | 2005 | 2004 | 2003 | 2002 | |||||||||||||||||||
| Net Asset Value, Beginning of Period | $ | 17.66 | $ | 15.77 | $ | 14.22 | $ | 11.56 | $ | 14.87 | |||||||||||||
| Income from Investment Operations: | |||||||||||||||||||||||
| Net investment income/(loss) | .31 | .07 | .06 | .06 | .08 | ||||||||||||||||||
| Net gain/(loss) on securities (both realized and unrealized) | 1.06 | 1.87 | 1.55 | 2.66 | (3.31 | ) | |||||||||||||||||
| Total from Investment Operations | 1.37 | 1.94 | 1.61 | 2.72 | (3.23 | ) | |||||||||||||||||
| Less Distributions and Other: | |||||||||||||||||||||||
| Dividends (from net investment income)* | (.24 | ) | (.06 | ) | (.06 | ) | (.06 | ) | (.08 | ) | |||||||||||||
| Distributions (from capital gains)* | – | – | – | – | – | ||||||||||||||||||
| Payment from affiliate | – | .01 | – | – | – | ||||||||||||||||||
| Total Distributions and Other | (.24 | ) | (.05 | ) | (.06 | ) | (.06 | ) | (.08 | ) | |||||||||||||
| Net Asset Value, End of Period | $ | 18.79 | $ | 17.66 | $ | 15.77 | $ | 14.22 | $ | 11.56 | |||||||||||||
| Total Return | 7.83 | % | 12.40 | %(5) | 11.32 | % | 23.60 | % | (21.77 | )% | |||||||||||||
| Net Assets, End of Period (in thousands) | $ | 37,176 | $ | 55,551 | $ | 55,596 | $ | 62,223 | $ | 62,087 | |||||||||||||
| Average Net Assets for the Period (in thousands) | $ | 44,953 | $ | 53,705 | $ | 56,017 | $ | 61,252 | $ | 78,089 | |||||||||||||
| Ratio of Gross Expenses to Average Net Assets(3)(4) | 1.09 | % | 0.99 | % | 1.02 | % | 1.10 | % | 1.01 | % | |||||||||||||
| Ratio of Net Expenses to Average Net Assets(4) | 1.09 | % | 0.99 | % | 1.02 | % | 1.10 | % | 1.01 | % | |||||||||||||
| Ratio of Net Investment Income/(Loss) to Average Net Assets | 1.70 | % | 0.37 | % | 0.36 | % | 0.44 | % | 0.57 | % | |||||||||||||
| Portfolio Turnover Rate | 58 | % | 37 | % | 48 | % | 43 | % | 54 | % | |||||||||||||
* See Note 3 in Notes to Financial Statements.
(1) Payment from affiliate aggregated less than $.01 on a per share basis for the fiscal year ended.
(2) During the fiscal year ended, Janus Capital and/or Janus Services LLC fully reimbursed the Portfolio for a loss on a transaction resulting from certain trading, pricing and/or shareholder activity errors, which otherwise would have reduced total return by less than 0.01%.
(3) The effect of non-recurring costs assumed by Janus Capital (Note 2) is included in the ratio of gross expenses to average net assets and was less than 0.01%.
(4) See "Explanations of Charts, Tables and Financial Statements."
(5) During the fiscal year ended, Janus Capital and/or Janus Services LLC fully reimbursed the Portfolio for a loss on a transaction resulting from certain trading, pricing and/or shareholder activity errors, which otherwise would have reduced total return by 0.05%.
See Notes to Financial Statements.
12 Janus Aspen Series December 31, 2006
Notes to Schedule of Investments
| Lipper Variable Annuity Large-Cap Core Funds | Funds that, by portfolio practice, invest at least 75% of their equity assets in companies with market capitalizations (on a three-year weighted basis) greater than 300% of the dollar-weighted median market capitalization of the middle 1,000 securities of the S&P SuperComposite 1500® Index. Large-cap core funds have more latitude in the companies in which they invest. These funds typically have an average price-to-earnings ratio, price-to-book ratio, and three-year sales-per-share growth value, compared to the S&P 500® Index. | ||||||
| Russell 1000® Growth Index | Contains those securities in the Russell 1000® Index with a greater-than-average growth orientation. Companies in this index tend to exhibit higher price-to-book and price-earnings ratios, lower dividend yields and higher forecasted growth values. | ||||||
| S&P 500® Index | The Standard & Poor's Composite Index of 500 stocks, a widely recognized, unmanaged index of common stock prices. | ||||||
| 144A | Securities sold under Rule 144A of the Securities Act of 1933 are subject to legal and/or contractual restrictions on resale and may not be publicly sold without registration under the 1933 Act. | ||||||
| ADR | American Depositary Receipt | ||||||
| GDR | Global Depositary Receipt | ||||||
| PLC | Public Limited Company | ||||||
| U.S. Shares | Securities of foreign companies trading on an American Stock Exchange. | ||||||
* Non-income-producing security.
** A portion of this security has been segregated by the custodian to cover margin or segregation requirements on open futures contracts, forward currency contracts, options contracts, short sales and/or securities with extended settlement dates.
# Loaned security; a portion or all of the security is on loan at December 31, 2006.
† The security is purchased with the cash collateral received from securities on loan (Note 1).
§ Schedule of Restricted and Illiquid Securities (as of December 31, 2006)
| Acquisition Date | Acquisition Cost | Value | Value as % of Net Assets | ||||||||||||||||
| Janus Aspen Growth and Income Portfolio | |||||||||||||||||||
| Allegro Investment Corporation S.A. convertible, (Apple Computer, Inc.), 9.08% (144A) | 11/7/06 | $ | 678,028 | $ | 692,504 | 0.8 | % | ||||||||||||
| Allegro Investment Corporation S.A. convertible, (Corning, Inc.), 20.10% (144A) | 8/7/06 | 694,305 | 715,590 | 0.9 | % | ||||||||||||||
| Deutsche Bank A.G. convertible, (Suncor Energy, Inc.), 20.53% (144A) | 8/11/06 | 579,342 | 556,867 | 0.7 | % | ||||||||||||||
| Goldman Sachs Group, Inc. convertible, (NVIDIA Corp.), 24.20% (144A) | 7/27/06 | 687,980 | 787,731 | 0.9 | % | ||||||||||||||
| Goldman Sachs Group, Inc. convertible, (Peabody Energy Corp., Celgene Corp., NVIDIA Corp.), 46.75% (144A) | 8/16/06 | 580,000 | 528,537 | 0.6 | % | ||||||||||||||
| Lehman Brothers Holdings, Inc. convertible, (QUALCOMM, Inc., Lennar Corp., Suntech Power Holdings Co., Ltd.), 41.26% (144A) | 12/8/06 | 694,000 | 699,344 | 0.8 | % | ||||||||||||||
| Morgan Stanley Co. convertible, (QUALCOMM, Inc.), 10.01% (144A) | 11/14/06 | 698,638 | 714,683 | 0.9 | % | ||||||||||||||
| Morgan Stanley Co. convertible, (Sirius Satellite Radio, Inc.), 14.00% (144A) | 1/11/06 | 420,812 | 245,755 | 0.3 | % | ||||||||||||||
| $ | 5,033,105 | $ | 4,941,011 | 5.9 | % | ||||||||||||||
The Portfolio has registration rights for certain restricted securities held as of December 31, 2006. The issuer incurs all registration costs.
Aggregate collateral segregated to cover margin or segregation requirements on open futures contracts, forward currency contracts, options contracts, short sales and/or securities with extended settlement dates as of December 31, 2006 are noted below.
| Portfolio | Aggregate Value | ||||||
| Janus Aspen Growth and Income Portfolio | $ | 6,679,540 | |||||
Janus Aspen Series December 31, 2006 13
Notes to Financial Statements
The following section describes the organization and significant accounting policies and provides more detailed information about the schedules and tables that appear throughout this report. In addition, the Notes to Financial Statements explain the methods used in preparing and presenting this report.
1. ORGANIZATION AND SIGNIFICANT ACCOUNTING POLICIES
Janus Aspen Growth and Income Portfolio (the "Portfolio") is a series fund. The Portfolio is part of Janus Aspen Series (the "Trust"), which is organized as a Delaware statutory trust and is registered under the Investment Company Act of 1940 (the "1940 Act") as an open-end management investment company. The Trust offers seventeen Portfolios, which include multiple series of shares, with differing investment objectives and policies. The Portfolio invests primarily in equity securities. The Portfolio is classified as diversified, as defined in the 1940 Act. The Portfolio is a no-load investment.
The Portfolio currently offers two classes of shares: Institutional Shares and Service Shares. Institutional Shares are offered only in connection with investment in and payments under variable insurance contracts and to qualified retirement plans. Service Shares are offered only in connection with investment in and payments under variable insurance contracts and to qualified retirement plans that require a fee from Portfolio assets to procure distribution and administrative services to contract owners and plan participants.
The following accounting policies have been consistently followed by the Portfolio and are in conformity with accounting principles generally accepted in the United States of America in the investment company industry.
Investment Valuation
Securities are valued at the last sales price or the official closing price for securities traded on a principal securities exchange (U.S. or foreign) and on the NASDAQ National Market. Securities traded on over-the-counter markets and listed securities for which no sales are reported are valued at the latest bid price (or yield equivalent thereof) obtained from one or more dealers transacting in a market for such securities or by a pricing service approved by the Portfolio's Trustees. Short-term securities with maturities of 60 days or less may be valued at amortized cost, which approximates market value. Debt securities with a remaining maturity of greater than 60 days are valued in accordance with the evaluated bid price supplied by the pricing service. The evaluated bid price supplied by the pricing service is an evaluation that reflects such factors as security prices, yields, maturities and ratings. Foreign securities and currencies ar e converted to U.S. dollars using the applicable exchange rate in effect as of the daily close of the New York Stock Exchange ("NYSE"). When market quotations are not readily available or deemed unreliable, or events or circumstances that may affect the value of portfolio securities held by the Portfolio are identified between the closing of their principal markets and the time the net asset value ("NAV") is determined, securities may be valued at fair value as determined in good faith under procedures established by and under the supervision of the Portfolio's Trustees. The Portfolio may use a systematic fair valuation model provided by an independent third party to value international equity securities in order to adjust for stale pricing, which may occur between the close of certain foreign exchanges and the NYSE.
Investment Transactions and Investment Income
Investment transactions are accounted for as of the date purchased or sold (trade date). Dividend income is recorded on the ex-dividend date. Certain dividends from foreign securities will be recorded as soon as the Trust is informed of the dividend if such information is obtained subsequent to the ex-dividend date and may be subject to withholding taxes in these jurisdictions. Interest income is recorded on the accrual basis and includes amortization of premiums and accretion of discounts. Gains and losses are determined on the identified cost basis, which is the same basis used for federal income tax purposes. Income, as well as gains and losses, both realized and unrealized, are allocated daily to each class of shares based upon the ratio of net assets represented by each class as a percentage of total net assets.
Expenses
The Portfolio bears expenses incurred specifically on its behalf as well as a portion of general expenses. Each class of shares bears expenses incurred specifically on its behalf and, in addition, each class bears a portion of general expenses, which may be based upon relative net assets of each class. Expenses are allocated daily to each class of shares based upon the ratio of net assets represented by each class as a percentage of total net assets. Expenses directly attributable to a specific class of shares are charged against the operations of such class.
Securities Lending
Under procedures adopted by the Trustees, the Portfolio may lend securities to qualified parties (typically brokers or other financial institutions) who need to borrow securities in order to complete certain transactions such as covering short sales, avoiding failures to deliver securities or completing arbitrage activities. The Portfolio may seek to earn additional income through securities lending. There is the risk of delay in recovering a loaned security or the risk of loss in collateral rights if the borrower fails financially. In addition, Janus Capital Management LLC ("Janus Capital") makes efforts to balance the benefits and risks from granting such loans.
The Portfolio does not have the right to vote on securities while they are being lent; however, the Portfolio may attempt to call back the loan and vote the proxy. All loans will be continuously secured by collateral which may consist of cash, U.S. Government securities, domestic and foreign short-term debt instruments, letters of credit, money market mutual funds or
14 Janus Aspen Series December 31, 2006
other money market accounts, or such other collateral permitted by the Securities and Exchange Commission "(SEC"). Cash collateral may be invested in affiliated money market funds or other accounts advised by Janus Capital to the extent consistent with exemptive relief obtained from the SEC or as permitted by the 1940 Act and rules promulgated thereunder. Cash collateral may also be invested in unaffiliated money market funds or other accounts advised by Janus Capital to the extent consistent with exemptive relief obtained from the SEC or as permitted by the 1940 Act and rules promulgated thereunder. Cash collateral may also be invested in unaffiliated money market funds or other accounts.
State Street Bank and Trust Company (the "Lending Agent") may also invest the cash collateral in the State Street Navigator Securities Lending Prime Portfolio or investments in unaffiliated money market funds or accounts, mutually agreed to by the Portfolio and the Lending Agent, that comply with Rule 2a-7 under the 1940 Act relating to money market funds.
As of December 31, 2006, the Portfolio had on loan securities valued as indicated:
| Portfolio | Value at December 31, 2006 | ||||||
| Janus Aspen Growth and Income Portfolio | $ | 6,178,419 | |||||
As of December 31, 2006, the Portfolio received cash collateral for securities lending activity as indicated:
| Portfolio | Cash Collateral at December 31, 2006 | ||||||
| Janus Aspen Growth and Income Portfolio | $ | 6,357,746 | |||||
As of December 31, 2006, all cash collateral received by the Portfolio was invested in the State Street Navigator Securities Lending Prime Portfolio.
The value of the collateral must be at least 102% of the market value of the loaned securities that are denominated in U.S. dollars and 105% of the market value of the loaned securities that are not denominated in U.S. dollars. Loaned securities and related collateral are marked-to-market each business day based upon the market value of the respective securities at the close of business, employing the most recent available pricing information. Collateral levels are then adjusted based upon this mark-to-market evaluation.
The borrower pays fees at the Portfolio's direction to its Lending Agent. The Lending Agent may retain a portion of the interest earned. The cash collateral invested by the Lending Agent is disclosed in the Schedule of Investments. The lending fees and the Portfolio's portion of the interest income earned on cash collateral are included on the Statement of Operations (if applicable).
Interfund Lending
Pursuant to an exemptive order received from the SEC, the Portfolio may be party to an interfund lending agreement between the Portfolio and other Janus Capital sponsored mutual funds, which permits it to borrow or lend cash at a rate beneficial to both the borrowing and lending funds. Outstanding borrowings from all sources totaling 10% or more of the borrowing Portfolio's total assets must be collateralized at 102% of the outstanding principal value of the loan; loans of less than 10% may be unsecured. During the fiscal year ended December 31, 2006, there were no outstanding interfund borrowing or lending arrangements for the Portfolio.
Forward Currency Transactions
The Portfolio may enter into forward currency contracts in order to reduce its exposure to changes in foreign currency exchange rates on its foreign portfolio holdings and to lock in the U.S. dollar cost of firm purchase and sale commitments for securities denominated in or exposed to foreign currencies. A forward currency exchange contract is a commitment to purchase or sell a foreign currency at a future date at a negotiated rate. The gain or loss arising from the difference between the U.S. dollar cost of the original contract and the value of the foreign currency in U.S. dollars upon closing a contract is included in "Net realized gain/(loss) from foreign currency transactions" on the Statement of Operations (if applicable).
Forward currency contracts held by the Portfolio are fully collateralized by other securities, which are denoted in the accompanying Schedule of Investments (if applicable). The collateral is evaluated daily to ensure its market value equals or exceeds the current market value of the corresponding forward currency contracts.
Futures Contracts
The Portfolio may enter into futures contracts. The Portfolio intends to use such derivative instruments primarily to hedge or protect from adverse movements in securities prices, currency rates or interest rates. The use of futures contracts may involve risks such as the possibility of illiquid markets or imperfect correlation between the value of the contracts and the underlying securities, or that the counterparty will fail to perform its obligations.
Futures contracts are marked-to-market daily, and the daily variation margin is recorded as a receivable or payable on the Statement of Assets and Liabilities (if applicable). When a contract is closed, a realized gain or loss is recorded on the Statement of Operations equal to the difference between the opening and closing value of the contract. Generally, futures contracts are marked-to-market (i.e., treated as realized and subject to distribution) for federal income tax purposes at fiscal year end. Securities designated as collateral for market
Janus Aspen Series December 31, 2006 15
Notes to Financial Statements (continued)
value on futures contracts are noted in the Schedule of Investments. Such collateral is in the possession of the Portfolio's custodian. As of December 31, 2006, the Portfolio was not invested in futures contracts.
Options Contracts
The Portfolio may purchase or write put and call options on futures contracts or foreign currencies in a manner similar to that in which futures or forward contracts on foreign currencies will be utilized, and on portfolio securities for hedging purposes or as a substitute for an investment. The Portfolio generally invests in options to hedge against adverse movements in the value of portfolio holdings.
When an option is written, the Portfolio receives a premium and becomes obligated to sell or purchase the underlying security at a fixed price, upon exercise of the option. In writing an option, the Portfolio bears the market risk of an unfavorable change in the price of the security underlying the written option. Exercise of an option written by the Portfolio could result in the Portfolio buying or selling a security at a price different from the current market value.
When an option is exercised, the proceeds on sales for a written call option, the purchase cost for a written put option, or the cost of the security for a purchased put or call option is adjusted by the amount of premium received or paid.
Holdings designated to cover outstanding written options are noted in the Schedule of Investments (if applicable). Options written are reported as a liability on the Statement of Assets and Liabilities (if applicable). Realized gains and losses are reported on the Statement of Operations (if applicable). The Portfolio did not recognize any realized gains and/or losses during the fiscal year ended December 31, 2006.
The risk in writing a call option is that the Portfolio gives up the opportunity for profit if the market price of the security increases and the option is exercised. The risk in writing a put option is that the Portfolio may incur a loss if the market price of the security decreases and the option is exercised. The risk in buying an option is that the Portfolio pays a premium whether or not the option is exercised. The use of such instruments may involve certain additional risks as a result of unanticipated movement in the market. A lack of correlation between the value of an instrument underlying an option and the asset being hedged, or unexpected adverse price movements, could render the Portfolio's hedging strategy unsuccessful. In addition, there can be no assurance that a liquid secondary market will exist for any option purchased or sold. There is no limit to the loss that the Portfolio may recognize due to written call options.
Written option activity for the fiscal year ended December 31, 2006 was as follows:
| Put Options | Number of Options Contracts | Premiums Received | |||||||||
| Janus Aspen Growth and Income Portfolio | |||||||||||
| Options outstanding at January 1, 2006 | – | – | |||||||||
| Options written | 116 | $ | 16,824 | ||||||||
| Options closed | – | – | |||||||||
| Options expired | – | – | |||||||||
| Options exercised | – | – | |||||||||
| Options outstanding at December 31, 2006 | 116 | $ | 16,824 | ||||||||
Short Sales
The Portfolio may engage in "short sales against the box." Short sales against the box involve selling either a security that the Portfolio owns, or a security equivalent in kind and amount to the security sold short that the Portfolio has the right to obtain, for delivery at a specified date in the future. The Portfolio may enter into a short sale against the box to hedge against anticipated declines in the market price of portfolio securities. If the value of the securities sold short increases prior to the scheduled delivery date, the Portfolio loses the opportunity to participate in the gain.
The Portfolio may also engage in "naked" short sales. Naked short sales involve the Portfolio selling a security it does not own to a purchaser at a specified price. To complete the transaction, the Portfolio must borrow the security to deliver it to the purchaser and buy that same security in the market to return it to the lender. Although the potential for gain is limited to the difference between the price at which the Portfolio sold the security short and the cost of borrowing the security, its potential for loss could be unlimited because there is no limit to the replacement cost of the borrowed security. There is no assurance that the Portfolio will be able to close out a short position at any particular time or at an acceptable price. A gain or a loss will be recognized upon termination of a short sale. There is no limit on the size of any loss that the Portfolio may recognize upon termination of a short sale. Short sales held by the Portfolio are fully collateralized by other securities, which are denoted in the accompanying Schedule of Investments (if applicable). As of December 31, 2006, the Portfolio was not invested in short sales.
Foreign Currency Translations
The Portfolio does not isolate that portion of the results of operations resulting from changes in foreign exchange rates on investments from the fluctuations arising from changes in market prices of securities held at the date of the financial statements. Net unrealized appreciation or depreciation on investments and foreign currency translation arise from changes in the value of assets and liabilities, including investments in securities held at the date of the financial statements, resulting from changes in the exchange rates and changes in market prices of securities held.
16 Janus Aspen Series December 31, 2006
Currency gains and losses are also calculated on payables and receivables that are denominated in foreign currencies. The payables and receivables are generally related to security transactions and income.
Foreign currency-denominated assets and forward currency contracts may involve more risks than domestic transactions, including currency risk, political and economic risk, regulatory risk and market risk. Risks may arise from the potential inability of a counterparty to meet the terms of a contract and from unanticipated movements in the value of foreign currencies relative to the U.S. dollar.
When-issued Securities
The Portfolio may purchase or sell securities on a when-issued or forward commitment basis. The price of the underlying securities and date when the securities will be delivered and paid for are fixed at the time the transaction is negotiated. Losses may arise due to changes in the market value of the securities or from the inability of counterparties to meet the terms of the contract. In connection with such purchases, the Portfolio may hold liquid assets as collateral with the Portfolio's custodian sufficient to cover the purchase price. As of December 31, 2006, the Portfolio was not invested in when-issued securities.
Equity-Linked Structured Notes
The Portfolio may invest in equity-linked structured notes. Equity-linked structured notes are derivative securities which are specially designed to combine the characteristics of one or more underlying securities and their equity derivatives in a single note form. The return and/or yield or income component may be based on the performance of the underlying equity securities, an equity index, and/or option positions. Equity-linked structured notes are typically offered in limited transactions by financial institutions in either registered or nonregistered form. An investment in equity-linked structured notes creates exposure to the credit risk of the issuing financial institution, as well as to the market risk of the underlying securities. There is no guaranteed return of principal with these securities and the appreciation potential of these securities may be limited by a maximum payment or call right. In certain cases, equity-linked struct ured notes may be more volatile and less liquid than less complex securities or other types of fixed-income securities. Such securities may exhibit price behavior that does not correlate with other fixed-income securities.
Initial Public Offerings
The Portfolio may invest in initial public offerings ("IPOs"). IPOs and other investment techniques may have a magnified performance impact on a fund with a small asset base. The Portfolio may not experience similar performance as its assets grow.
Additional Investment Risk
The Portfolio may be invested in lower-rated debt securities that have a higher risk of default or loss of value since these securities may be sensitive to economic changes, political changes or adverse developments specific to the issuer.
Restricted Security Transactions
Restricted securities held by the Portfolio may not be sold except in exempt transactions or in a public offering registered under the Securities Act of 1933. The risk of investing in such securities is generally greater than the risk of investing in the securities of widely held, publicly traded companies. Lack of a secondary market and resale restrictions may result in the inability of the Portfolio to sell a security at a fair price and may substantially delay the sale of the security. In addition, these securities may exhibit greater price volatility than securities for which secondary markets exist.
Restricted Cash
As of December 31, 2006, the Portfolio had restricted cash in the amount of $700,350. The restricted cash represents funds in relation to options contracts invested by the Portfolio at December 31, 2006. The restricted cash is held at the Portfolio's custodian, State Street Bank and Trust Company. The carrying value of the restricted cash approximates fair value.
Dividend Distributions
The Portfolio generally makes semiannual distributions of substantially all of its investment income and an annual distribution of its net realized capital gains (if any). The majority of dividends and net realized capital gains distributions from the Portfolio may be automatically reinvested into additional shares of the Portfolio, based upon the discretion of the shareholder.
Estimates
The preparation of financial statements in conformity with accounting principles generally accepted in the United States of America requires management to make estimates and assumptions that affect the reported amount of assets and liabilities and disclosure of contingent assets and liabilities at the date of the financial statements and the reported amounts of income and expenses during the reporting period. Actual results could differ from those estimates.
Federal Income Taxes
No provision for income taxes is included in the accompanying financial statements, as the Portfolio intends to distribute to shareholders all taxable investment income and realized gains and otherwise comply with Subchapter M of the Internal Revenue Code applicable to regulated investment companies.
New Accounting Pronouncements
In July 2006, the Financial Accounting Standards Board ("FASB") issued Interpretation No. 48, "Accounting for
Janus Aspen Series December 31, 2006 17
Notes to Financial Statements (continued)
Uncertainty in Income Taxes – an Interpretation of FASB Statement No. 109" (the "Interpretation"). The Interpretation establishes for all entities, including pass-through entities such as the Portfolio, a minimum threshold for financial statement recognition of the benefit of positions taken in filing tax returns (including whether an entity is taxable in a particular jurisdiction), and requires certain expanded tax disclosures. A calendar year open-end or closed-end fund would implement the Interpretation no later than June 29, 2007 (the last business day of the semi-annual reporting period) and will also apply to all open tax years as of the date of effectiveness. Management has recently begun to evaluate the application of the Interpretation to the Portfolio, and is not in a position at this time to estimate the significance of its impact, if any, on the Portfolio's financial statements.
In September 2006, the FASB issued Statement of Financial Accounting Standards No. 157, "Fair Value Measurements" ("SFAS No. 157"), which defines fair value, establishes a framework for measuring fair value in generally accepted accounting principles, and expands disclosures about fair value measurements. SFAS No. 157 does not require new fair value measurements, but is applied to the extent that other accounting pronouncements require or permit fair value measurements. SFAS No. 157 emphasizes that fair value is a market-based measurement that should be determined based on the assumptions that market participants would use in pricing an asset or liability. Companies will be required to disclose the extent to which fair value is used to measure assets and liabilities, the inputs used to develop the measurements, and the effect for fiscal years beginning after November 15, 2007. Management is currently evaluating the potential impact the adopt ion of SFAS No. 157 will have on the Portfolio's financial condition and results of operations.
2. INVESTMENT ADVISORY AGREEMENTS AND OTHER TRANSACTIONS WITH AFFILIATES
The Portfolio pays a monthly advisory fee to Janus Capital based upon average daily net assets and calculated at the annual rate of 0.62%.
Janus Services LLC ("Janus Services"), a wholly-owned subsidiary of Janus Capital, is the Portfolio's transfer agent. Janus Services receives certain out-of-pocket expenses for transfer agent services.
Certain officers of the Portfolio may also be officers and/or directors of Janus Capital. Such officers receive no compensation from the Portfolio, except for the Portfolio's Chief Compliance Officer. Effective January 1, 2006, the Portfolio began reimbursing the adviser for a portion of the compensation paid to the Chief Compliance Officer of the Trust. Total compensation of $140 was paid by the Portfolio during the fiscal year ended December 31, 2006. The Portfolio's portion is reported as part of "Other Expenses" on the Statement of Operations.
The Board of Trustees has adopted a deferred compensation plan (the "Deferred Plan") for independent Trustees to elect to defer receipt of all or a portion of the annual compensation they are entitled to receive from the Portfolio. All deferred fees are credited to an account established in the name of the Trustees. The amounts credited to the account then increase or decrease, as the case may be, in accordance with the performance of one or more of the Janus funds that are selected by the Trustees. The account balance continues to fluctuate in accordance with the performance of the selected fund or funds until final payment of all amounts credited to the account. Trustees are allowed to change their designation of mutual funds from time to time. Amounts will be deferred until distributed in accordance to the Deferred Plan. No deferred fees were paid to any Trustee under the Deferred Plan during the fiscal year ended December 31, 2006.
For the fiscal year ended December 31, 2006, Janus Capital assumed $21,288 of legal, consulting and Trustee costs and fees incurred by the funds in Janus Investment Fund, Janus Aspen Series and Janus Adviser Series (the "Funds") in connection with the regulatory and civil litigation matters discussed in Note 6. These non-recurring costs were allocated to all Funds based upon the Funds' respective net assets as of July 31, 2004. Additionally, all future non-recurring costs will be allocated based upon the Funds' respective net assets on July 31, 2004. These non-recurring costs and costs assumed by Janus Capital are shown on the Statement of Operations.
During the fiscal year ended December 31, 2006, Janus Capital reimbursed the Portfolio $1 for Institutional Shares as a result of dilutions caused by certain trading and/or pricing errors. Reimbursements are included in "Payment from affiliate" on the Statements of Changes in Net Assets.
During the fiscal year ended December 31, 2005, Janus Capital reimbursed the Portfolio $23,304 for Service Shares as a result of dilutions caused by certain trading and/or pricing errors. Reimbursements are included in "Payment from affiliate" on the Statements of Changes in Net Assets.
Janus Distributors LLC, a wholly-owned subsidiary of Janus Capital, is a distributor of the Portfolio. Service Shares have adopted a Distribution and Shareholder Servicing Plan (the "Plan") pursuant to Rule 12b-1 under The 1940 Act. The Plan authorizes payments by the Portfolio in connection with the distribution of Service Shares at an annual rate of up to 0.25% of Service Shares' average daily net assets.
The Portfolio's expenses may be reduced by expense offsets from an unaffiliated custodian and/or transfer agent. Such credits or offsets are included in Expense and Fee Offset on the Statement of Operations. The transfer agent fee offsets received during the period reduce Transfer Agent Fees and Expenses. Custodian offsets received reduce Custodian Fees. The Portfolio could have employed the assets used by the custodian and/or transfer agent to produce income if it had not entered into an expense offset arrangement.
18 Janus Aspen Series December 31, 2006
The Portfolio may invest in money market funds, including funds managed by Janus Capital. During the fiscal year ended December 31, 2006, the Portfolio recorded distributions from affiliated investment companies as affiliated dividend income, and had the following affiliated purchases and sales:
| Purchases Shares/Cost | Sales Shares/Cost | Dividend Income | Value at 12/31/06 | ||||||||||||||||
| Janus Aspen Growth and Income Portfolio | |||||||||||||||||||
| Janus Government Money Market Fund | $ | 1,071,221 | $ | 1,071,221 | $ | 872 | $ | – | |||||||||||
| Janus Institutional Cash Reserves Fund | 8,741,121 | 8,681,121 | 27,947 | 60,000 | |||||||||||||||
| Janus Money Market Fund | 7,699,342 | 5,680,658 | 52,395 | 2,018,684 | |||||||||||||||
| $ | 17,511,684 | $ | 15,433,000 | $ | 81,214 | $ | 2,078,684 | ||||||||||||
3. FEDERAL INCOME TAX
The tax components of capital shown in the table below represent: (1) distribution requirements the Portfolio must satisfy under the income tax regulations; (2) losses or deductions the Portfolio may be able to offset against income and gains realized in future years; and (3) unrealized appreciation or depreciation of investments for federal income tax purposes (reduced by foreign tax liability).
Other book to tax differences in the current year primarily consist of foreign currency contract adjustments. The Portfolio has elected to treat gains and losses on forward foreign currency contracts as capital gains and losses. Other foreign currency gains and losses on debt instruments are treated as ordinary income for federal income tax purposes pursuant to Section 988 of the Internal Revenue Code.
Accumulated capital losses noted below represent net capital loss carryovers, as of December 31, 2006, that may be available to offset future realized capital gains and thereby reduce future taxable gains distributions.
| Portfolio | Undistributed Ordinary Income | Undistributed Long–Term Gains | Accumulated Capital Losses | Post-October Deferral | Other Book to Tax Differences | Net Tax Appreciation/ (Depreciation) | |||||||||||||||||||||
| Janus Aspen Growth and Income Portfolio(1) | $ | 162,794 | $ | – | $ | (53,113,347 | ) | $ | – | $ | 7,250 | $ | 14,472,890 | ||||||||||||||
(1) Capital loss carryover is subject to annual limitations.
The table below shows the expiration dates of the carryovers.
Capital Loss Carryover Expiration Schedule
For the year ended December 31, 2006
| Portfolio | December 31, 2008 | December 31, 2009 | December 31, 2010 | December 31, 2011 | |||||||||||||||
| Janus Aspen Growth and Income Portfolio(1) | $ | (1,032,784 | ) | $ | (5,793,408 | ) | $ | (30,545,851 | ) | $ | (15,741,304 | ) | |||||||
(1) Capital loss carryover is subject to annual limitations.
During the year ended December 31, 2006, the following capital loss carryover was utilized by the Portfolio as indicated in the table below.
| Portfolio | Capital Loss Carryover Utilized | ||||||
| Janus Aspen Growth and Income Portfolio | $ | 11,137,340 | |||||
Janus Aspen Series December 31, 2006 19
Notes to Financial Statements (continued)
The aggregate cost of investments and the composition of unrealized appreciation and depreciation of investment securities for federal income tax purposes as of December 31, 2006 are noted below.
Unrealized appreciation and unrealized depreciation in the table below exclude appreciation/depreciation on foreign currency translations. The primary difference between book and tax appreciation or depreciation of investments is wash sale loss deferrals.
| Portfolio | Federal Tax Cost | Unrealized Appreciation | Unrealized (Depreciation) | ||||||||||||
| Janus Aspen Growth and Income Portfolio | $ | 74,630,790 | $ | 16,955,913 | $ | (2,471,958 | ) | ||||||||
Income and capital gains distributions are determined in accordance with income tax regulations that may differ from accounting principles generally accepted in the United States of America. These differences are due to differing treatments for items such as net short-term gains, deferral of wash sale losses, foreign currency transactions, net investment losses and capital loss carryovers. Certain permanent differences such as tax returns of capital and net investment losses noted below have been reclassified to paid-in capital.
| For the fiscal year ended December 31, 2006 | Distributions | ||||||||||||||||||
| Portfolio | From Ordinary Income | From Long-Term Capital Gains | Tax Return of Capital | Net Investment Loss | |||||||||||||||
| Janus Aspen Growth and Income Portfolio | $ | 1,269,497 | $ | – | $ | – | $ | – | |||||||||||
| For the fiscal year ended December 31, 2005 | Distributions | ||||||||||||||||||
| Portfolio | From Ordinary Income | From Long-Term Capital Gains | Tax Return of Capital | Net Investment Loss | |||||||||||||||
| Janus Aspen Growth and Income Portfolio | $ | 408,094 | $ | – | $ | – | $ | – | |||||||||||
4. CAPITAL SHARE TRANSACTIONS
| Janus Aspen Growth and | |||||||||||
| For the fiscal year ended December 31 | Income Portfolio | ||||||||||
| (all numbers are in thousands) | 2006 | 2005 | |||||||||
| Transactions in Portfolio Shares – Institutional Shares | |||||||||||
| Shares sold | 994 | 827 | |||||||||
| Reinvested dividends and distributions | 42 | 13 | |||||||||
| Shares repurchased | (712 | ) | (439 | ) | |||||||
| Net Increase (Decrease) in Portfolio Shares | 324 | 401 | |||||||||
| Shares Outstanding, Beginning of Period | 2,171 | 1,770 | |||||||||
| Shares Outstanding, End of Period | 2,495 | 2,171 | |||||||||
| Transactions in Portfolio Shares – Service Shares | |||||||||||
| Shares sold | 261 | 409 | |||||||||
| Reinvested dividends and distributions | 28 | 12 | |||||||||
| Shares repurchased | (1,456 | ) | (801 | ) | |||||||
| Net Increase (Decrease) in Portfolio Shares | (1,167 | ) | (380 | ) | |||||||
| Shares Outstanding, Beginning of Period | 3,146 | 3,526 | |||||||||
| Shares Outstanding, End of Period | 1,979 | 3,146 | |||||||||
20 Janus Aspen Series December 31, 2006
5. PURCHASES AND SALES OF INVESTMENT SECURITIES
For the fiscal year ended December 31, 2006, the aggregate cost of purchases and proceeds from sales of investment securities (excluding short-term securities) were as follows:
| Portfolio | Purchases of Securities | Proceeds from Sales of Securities | Purchases of Long-Term U.S. Government Obligations | Proceeds from Sales of Long-Term U.S. Government Obligations | |||||||||||||||
| Janus Aspen Growth and Income Portfolio | $ | 49,685,041 | $ | 65,289,159 | $ | – | $ | – | |||||||||||
6. PENDING LEGAL MATTERS
In the fall of 2003, the Securities and Exchange Commission ("SEC"), the Office of the New York State Attorney General ("NYAG"), the Colorado Attorney General ("COAG"), and the Colorado Division of Securities ("CDS") announced that they were investigating alleged frequent trading practices in the mutual fund industry. On August 18, 2004, Janus Capital announced that it had reached final settlements with the SEC, the NYAG, the COAG, and the CDS related to such regulators' investigations into Janus Capital's frequent trading arrangements.
A number of civil lawsuits were brought against Janus Capital and certain of its affiliates, the Janus funds, and related entities and individuals based on allegations similar to those announced by the above regulators and were filed in several state and federal jurisdictions. Such lawsuits alleged a variety of theories for recovery including, but not limited to, the federal securities laws, other federal statutes (including ERISA), and various common law doctrines. The Judicial Panel on Multidistrict Litigation transferred these actions to the U.S. District Court for the District of Maryland (the "Court") for coordinated proceedings. On September 29, 2004, five consolidated amended complaints were filed with the Court that generally include: (i) claims by a putative class of investors in certain Janus funds asserting claims on behalf of the investor class (Marini, et al. v. Janus Investment Fund, et al., U.S. District Court, District of Maryland, Case No. 04-CV-00497); (ii) derivative claims by investors in certain Janus funds ostensibly on behalf of such funds (Steinberg et al. v. Janus Capital Management, LLC et al., U.S. District Court, District of Maryland, Case No. 04-CV-00518); (iii) claims on behalf of participants in the Janus 401(k) plan (Wangberger v. Janus Capital Group Inc., 401(k) Advisory Committee, et al., U.S. District Court, District of Maryland, Case No. JFM-05-2711); (iv) claims brought on behalf of shareholders of Janus Capital Group Inc. ("JCGI") on a derivative basis against the Board of Directors of JCGI (Chasen v. Whiston, et al., U.S. District Court, District of Maryland, Case No. 04-MD-00855); and (v) claims by a putative class of shareholders of JCGI asserting claims on behalf of the shareholders (Wiggins, et al. v. Janus Capital Group, Inc., et al., U.S. District Court, District of Maryland, Case No. 04-CV-00818). In addition, the following were also named as defendants in one or more of the actions: Janus Investment Fund ("JIF"), Janus Aspen Series ("JAS"), Janus Adviser Series ("JAD"), Janus Distributors LLC, Enhanced Inves tment Technologies, LLC ("INTECH"), Bay Isle Financial LLC ("Bay Isle"), Perkins, Wolf, McDonnell and Company, LLC ("Perkins"), the Advisory Committee of the Janus 401(k) plan, and the current or former directors of JCGI.
On August 25, 2005, the Court entered orders dismissing most of the claims asserted against Janus Capital and its affiliates by fund investors (actions (i) and (ii) described above), except certain claims under Section 10(b) of the Securities Exchange Act of 1934 and under Section 36(b) of the Investment Company Act of 1940, as amended (the "1940 Act"). On August 15, 2006, the complaint in the 401(k) plan class action (action (iii) described above) was dismissed by the district court with prejudice; the plaintiff has appealed that dismissal decision to the United States Court of Appeals for the Fourth Circuit. The Court also dismissed the action against JCGI's Board of Directors without leave to amend (action (iv) described above). Finally, a Motion to Dismiss the action brought by JCGI shareholders (action (v) described above) is fully briefed and pending before the Court.
In addition to the lawsuits described above, the Auditor of the State of West Virginia ("Auditor"), in his capacity as securities commissioner, has initiated administrative proceedings against many of the defendants in the market timing cases (including JCGI and Janus Capital) and, as a part of its relief, is seeking disgorgement and other monetary relief based on similar market timing allegations (In the Matter of Janus Capital Group Inc. et al., Before the Securities Commissioner, State of West Virginia, Summary Order No. 05-1320). The respondents in these proceedings collectively sought a Writ of Prohibition in state court, which was denied. Their subsequent Petition for Appeal was also denied. Consequently, in September 2006, JCGI and Janus Capital filed their answer to the A uditor's summary order instituting proceedings and requested a hearing. JCGI and Janus Capital, as well as other similarly
Janus Aspen Series December 31, 2006 21
Notes to Financial Statements (continued)
situated defendants, continue to challenge the statutory authority of the Auditor to bring such an action. No further proceedings are currently scheduled.
In addition to the "market timing" actions described above, Janus Capital is a defendant in a consolidated lawsuit in the U.S. District Court for the District of Colorado challenging the investment advisory fees charged by Janus Capital to certain Janus funds (Walter Sins, et al. v. Janus Capital Management LLC, U.S. District Court, District of Colorado, Case No. 04-CV-01647-WDM-MEH; Michael Fleisher, et al. v. Janus Capital Management, LLC, 04-CV-02395-MSK-CBS). The action was filed in 2004 by fund investors asserting breach of fiduciary duty under Section 36(b) of the 1940 Act. The plaintiffs seek declaratory and injunctive relief and an unspecified amount of damages. The trial is scheduled to commence on May 21, 2007.
In 2001, Janus Capital's predecessor was also named as a defendant in a class action suit in the U.S. District Court for the Southern District of New York, alleging that certain underwriting firms and institutional investors violated antitrust laws in connection with initial public offerings (Pfeiffer v. Credit Suisse First Boston aka In re Initial Public Offering Antitrust Litigation, U.S. District Court, Southern District of New York, Case No. 01-CV-2014). The U.S. District Court dismissed the plaintiff's antitrust claims in November 2003; however, the U.S. Court of Appeals vacated that decision and remanded it for further proceedings. In March 2006, the defendants, including Janus Capital, filed a Petition for a Writ of Certiorari with the U.S. Supreme Court to review the decision of the U.S. Court of Appeals. In June 2006, the U.S. Supreme Court invited the U.S. Solicitor General to file a brief expressing the view of the United States, and in November 2006, the Solicitor General filed a brief expressing its view on the matter. The U.S. Supreme Court has granted the Petition for a Writ of Certiorari and the parties are in the process of briefing the matter for the U.S. Supreme Court.
Additional lawsuits may be filed against certain of the Janus funds, Janus Capital, and related parties in the future. Janus Capital does not currently believe that these pending actions will materially affect its ability to continue providing services it has agreed to provide to the Janus funds.
22 Janus Aspen Series December 31, 2006
Report of Independent Registered Public Accounting Firm
To the Trustees and Shareholders
of Janus Aspen Growth and Income Portfolio
In our opinion, the accompanying statement of assets and liabilities, including the schedule of investments, and the related statements of operations and of changes in net assets and the financial highlights present fairly, in all material respects, the financial position of Janus Aspen Growth and Income Portfolio (one of the portfolios constituting Janus Aspen Series, hereafter referred to as the "Portfolio") at December 31, 2006, the results of its operations for the year then ended, the changes in its net assets for each of the two years in the period then ended, and the financial highlights for each of the five years in the period then ended, in conformity with accounting principles generally accepted in the United States of America. These financial statements and financial highlights (hereafter referred to as "financial statements") are the responsibility of the Portfolio's management; our responsibility is to express an opinion on thes e financial statements based on our audits. We conducted our audits of these financial statements in accordance with the standards of the Public Company Accounting Oversight Board (United States). Those standards require that we plan and perform the audit to obtain reasonable assurance about whether the financial statements are free of material misstatement. An audit includes examining, on a test basis, evidence supporting the amounts and disclosures in the financial statements, assessing the accounting principles used and significant estimates made by management, and evaluating the overall financial statement presentation. We believe that our audits, which included confirmation of securities at December 31, 2006 by correspondence with the custodian, transfer agent and brokers, and the application of alternative auditing procedures where securities purchased had not been received, provide a reasonable basis for our opinion.

PricewaterhouseCoopers LLP
Denver, Colorado
February 12, 2007
Janus Aspen Series December 31, 2006 23
Additional Information (unaudited)
PROXY VOTING POLICIES AND VOTING RECORD
A description of the policies and procedures that the Portfolio uses to determine how to vote proxies relating to its portfolio securities is available: (i) without charge, upon request, by calling 1-800-525-0020 (toll free); (ii) on the Portfolio's website at www.janus.com/proxyvoting; and (iii) on the SEC's website at http://www.sec.gov. Additionally, information regarding the Portfolio's proxy voting record for the most recent twelve-month period ended June 30 is also available, free of charge, through www.janus.com/proxyvoting and from the SEC's website at http://www.sec.gov.
APPROVAL OF ADVISORY AGREEMENTS DURING THE PERIOD
The Trustees of Janus Aspen Series, more than eighty-five percent of whom have never been affiliated with the Adviser ("Independent Trustees"), oversee the management of each of the Portfolios and, as required by law, determine annually whether to continue the investment advisory agreement for each Portfolio and the subadvisory agreements for the three Portfolios that utilize subadvisers.
In connection with their most recent consideration of those agreements for each of the Portfolios, the Trustees received and reviewed a substantial amount of information provided by Janus Capital (the "Adviser") and the respective subadvisers in response to requests of the Independent Trustees and their independent legal counsel. They also received and reviewed a considerable amount of information and analysis provided to the Trustees by their independent fee consultant. Throughout their consideration of the agreements the Independent Trustees were advised by their independent legal counsel. The Independent Trustees met on two separate occasions with management to consider the agreements, and at each of those meetings they also met separately in executive session with their independent legal counsel.
At a meeting held on December 20, 2006, based on their evaluation of the information provided by the Adviser, the subadvisers and the independent fee consultant and other information, the Trustees determined that the overall arrangements between each Portfolio and the Adviser were fair and reasonable in light of the nature, extent and quality of the services provided by the Adviser, its affiliates and the subadvisers, the fees charged for those services, and other matters that the Trustees considered relevant in the exercise of their business judgment. At that meeting all of the Trustees unanimously approved the continuation of the investment advisory agreement for each Portfolio, and the subadvisory agreement for each subadvised Portfolio, for the period from February 1, 2007 through February 1, 2008, subject to earlier termination as provided in each agreement.
In considering the continuation of those agreements, the Trustees reviewed and analyzed various factors that they determined were relevant, including the factors described below, none of which by itself was considered dispositive. However, the material factors and conclusions that formed basis for the Trustees' determination to approve the continuation of the agreements are discussed separately below.
Nature, Extent and Quality of Services
The Trustees reviewed the nature, extent and quality of the services of Janus Capital and the subadvisers to the Funds, taking into account the investment objective and strategy of each Portfolio and the knowledge the Trustees gained from their regular meetings with management on at least a quarterly basis and their ongoing review of information related to the Funds. In addition, the Trustees reviewed the resources and key personnel of Janus Capital and each subadviser, especially those who provide investment management services to the Portfolios. The Trustees also considered other services provided to the Portfolios by Janus Capital or the subadvisers, such as managing the execution of portfolio transactions and the selection of broker-dealers for those transactions, serving as the Portfolios' administrator, monitoring adherence to the Portfolios' investment restrictions, producing shareholder reports, providing support services for the Tru stees and Trustee committees, communicating with shareholders and overseeing the activities of other service providers, including monitoring compliance with various policies and procedures of the Portfolios and with applicable securities laws and regulations.
The Trustees concluded that: the nature, extent and quality of the services provided by Janus Capital or the subadviser to each Portfolio were appropriate and consistent with the terms of the respective advisory and subadvisory agreements; that, taking into account steps taken to address a small portion of the Portfolios whose performance lagged that of their peers for certain periods, the quality of those services had been consistent with or superior to quality norms in the industry; and that the Portfolios were likely to benefit from the continued provision of those services. They also concluded that each of Janus Capital and each subadviser had sufficient personnel, with the appropriate education and experience, to serve the Portfolios effectively and had demonstrated its continuing ability to attract and retain well-qualified personnel.
Performance of the Funds
The Trustees considered the performance results of each Portfolio over various time periods. They reviewed information comparing each Portfolio's performance with the performance of comparable funds and peer groups identified by Lipper Inc., an independent provider of investment company data, and with the Portfolio's benchmark. They concluded that the performance of most Portfolios was good
24 Janus Aspen Series December 31, 2006
to very good. Although the performance of some Portfolios lagged that of their peers for certain periods, the Trustees also concluded that Janus Capital had taken appropriate steps to address those instances of under-performance and that the more recent performance of most of those Portfolios had been improving.
Costs of Services Provided
The Trustees examined information on the fees and expenses of each Portfolio in comparison to similar information for other comparable funds as provided by Lipper. They also reviewed an analysis of that information provided by their independent fee consultant and noted that the rate of management (investment advisory and administrative) fees for most of the Portfolios, after contractual expense limitations, was below the mean management fee rate of the respective peer group of funds selected by Lipper.
The Trustees considered the methodology used by Janus Capital and each subadviser in determining compensation payable to portfolio managers, the competitive environment for investment management talent and the competitive market for mutual funds in different distribution channels. They concluded that the compensation methodology provided a good alignment of the interests of the portfolio managers with the interests of Portfolio shareholders.
The Trustees also reviewed management fees charged by Janus Capital to its separate account clients and to its subadvised funds (for which Janus Capital provides only portfolio management services). Although in most instances subadvisory and separate account fee rates for various investment strategies were lower than management fees for Portfolios having a similar strategy, the Trustees noted that Janus Capital performs significant additional services for the Portfolios that it does not provide to those other clients, including administrative services, oversight of the Portfolios' other service providers, trustee support, regulatory compliance and numerous other services, and that, in serving the Portfolios, Janus Capital assumes many legal risks that it does not assume in servicing its other clients. Moreover, they noted that the spread between the average fees charged to the Portfolios and the fees that Janus Capital charged to its separat e account clients was significantly smaller than the average spread for such fees of other advisers, based on publicly available data and research conducted by their independent fee consultant.
In considering the fees charged by Janus Capital, the Trustees had previously negotiated with Janus Capital a temporary contingent waiver of a portion the investment advisory fee paid by Janus Aspen Worldwide Growth Portfolio to Janus Capital to provide for a possible reduction in the rate of advisory fee payable by the Portfolio for the period July 1, 2006 through January 31, 2007 if the investment performance of the Fund should lag that of its benchmark performance over the applicable performance measurement period. Commencing in February 2007, the previously approved performance-based fee schedule will become operative.
The Trustees reviewed information on the profitability of Janus Capital and its affiliates of their relationships with each Portfolio, as well as an explanation of the methodology utilized in allocating various expenses among the Portfolios and other clients. The Trustees also reviewed the financial statements of Janus Capital's parent company and its corporate structure. In their review, the Trustees considered whether Janus Capital and each subadviser receive adequate incentives to manage the Portfolios effectively. The Trustees recognized that profitability comparisons among fund managers are difficult because very little comparative information is publicly available and profitability of any manager is affected by numerous factors, including the organizational structure of the particular manager, the types of funds and other accounts it manages, possible other lines of business, the methodology for allocating expenses and the manager's ca pital structure and cost of capital. However, based on the information available and taking those factors into account, the Trustees concluded that Janus Capital's profitability with respect to each Portfolio in relation to the services rendered was not unreasonable.
The Trustees concluded that the management fees and other compensation payable by each Fund to Janus Capital and its affiliates, as well as the fees paid by Janus Capital to the subadvisers of subadvised Portfolios, were reasonable in relation to the nature and quality of the services provided, taking into account the fees charged by other advisers for managing comparable mutual funds with similar strategies and the fees Janus Capital and the subadviser charges to other clients. The Trustees also concluded that the overall expense ratio of each Portfolio was reasonable, taking into account the size of the Portfolio, the quality of services provided by Janus Capital and any subadviser, the investment performance of the Portfolio and any expense limitations agreed to by Janus Capital.
Economies of Scale
The Trustees considered information about the potential for Janus Capital to realize economies of scale as the assets of the Portfolios increase. They noted that, although most Portfolios pay advisory fees at a fixed rate as a percentage of net assets, without any breakpoints, the management fee paid by each Portfolio, after any contractual expense limitations, was below the mean management fee rate of the Portfolio's peer group selected by Lipper; and, for those Portfolios whose expenses are being reduced by the contractual expense limitations of Janus Capital, Janus Capital is subsidizing the Portfolios because they have not reached adequate scale. Moreover, as the assets of many of the Portfolios have declined in the past few years, the Portfolios have benefited from having advisory
Janus Aspen Series December 31, 2006 25
Additional Information (unaudited) (continued)
fee rates that have remained constant rather than increasing as assets decline. In addition, performance fee structures have been implemented for several Portfolios that will cause the effective rate of advisory fees payable by such a Portfolio to vary depending on the investment performance of the Portfolio relative to its benchmark; and a few Portfolios have fee schedules with breakpoints and reduced fee rates above certain asset levels. The Trustees also noted that the Portfolios share directly in economies of scale through lower charges of third-party service providers based on the combined scale of all of the Portfolios. Based on all of the information they reviewed, the Trustees concluded that the current fee structure of each Portfolio was reasonable and that the current rates of fees do reflect a sharing between Janus Capital and the Portfolio of economies of scale at the current asset level of the Portfolio.
Other Benefits to Janus Capital
The Trustees also considered benefits that accrue to Janus Capital and its affiliates from their relationships with the Portfolios. They recognized that two affiliates of Janus Capital separately serve the Portfolios as transfer agent and distributor, respectively, and that the transfer agent receives compensation from the non-money market Portfolios for services provided. The Trustees also considered Janus Capital's use of commissions paid by Portfolios on their portfolio brokerage transactions to obtain proprietary research products and services benefiting the Portfolios and/or other clients of Janus Capital, as well as Janus Capital's agreement not to use any Portfolio's brokerage transactions to obtain third party research products or services. The Trustees concluded that Janus Capital's use of "soft" commission dollars to obtain proprietary research products and ser vices was consistent with regulatory requirements and guidelines and was likely to benefit each Portfolio. The Trustees also concluded that, other than the services provided by Janus Capital and its affiliates pursuant to the agreements and the fees to be paid by each Portfolio therefor, the Portfolios and Janus Capital may potentially benefit from their relationship with each other in other ways. They concluded that Janus Capital benefits from the receipt of proprietary research products and services acquired through commissions paid on portfolio transactions of the Portfolios and that the Portfolios benefit from Janus Capital's receipt of those products and services as well as research products and services acquired through commissions paid by other clients of Janus Capital. They further concluded that success of any Portfolio could attract other business to Janus Capital or other Janus Funds and that the success of Janus Capital could enhance Janus Capital's ability to serve the Portfolios.
After full consideration of the above factors as well as other factors, all of the Trustees, including all of the Independent Trustees, concluded that the proposed continuation of the investment advisory agreement for each applicable Portfolio were in the best interest of the respective Portfolios and their shareholders.
26 Janus Aspen Series December 31, 2006
Explanations of Charts, Tables and
Financial Statements (unaudited)
1. PERFORMANCE OVERVIEWS
The performance overview graph compares the performance of a hypothetical $10,000 investment in the Portfolio with one or more widely used market indices. The hypothetical example does not represent the returns of any particular investment.
When comparing the performance of the Portfolio with an index, keep in mind that market indices do not include brokerage commissions that would be incurred if you purchased the individual securities in the index. They also do not include taxes payable on dividends and interest or operating expenses incurred if you maintained a Portfolio invested in the index.
Average annual total returns are quoted for each class of the Portfolio. Average annual total return is calculated by taking the growth or decline in value of an investment over a period of time, including reinvestment of any dividends, distributions and capital gains, then calculating the annual compounded percentage rate that would have produced the same result had the rate of growth been constant throughout the period. Average annual total return does not reflect the deduction of taxes that a shareholder would pay on Portfolio distributions or redemptions of Portfolio shares.
2. SCHEDULE OF INVESTMENTS
Following the performance overview section is the Portfolio's Schedule of Investments. This schedule reports the industry concentrations and types of securities held in the Portfolio on the last day of the reporting period. Securities are usually listed by type (common stock, corporate bonds, U.S. Government obligations, etc.) and by industry classification (banking, communications, insurance, etc.). Holdings are subject to change without notice.
The value of each security is quoted as of the last day of the reporting period. The value of securities denominated in foreign currencies is converted into U.S. dollars. Certain short-term investments maturing within 60 days are valued at amortized cost, which approximates market value.
A summary of investments by country is provided if the Portfolio invested in foreign securities. This summary reports the Portfolio's exposure to different countries by providing the percentage of securities invested in each country. The country of each security represents the country in which the company is incorporated.
2A. FORWARD CURRENCY CONTRACTS
A table listing forward currency contracts follows the Portfolio's Schedule of Investments (if applicable). Forward currency contracts are agreements to deliver or receive a preset amount of currency at a future date. Forward currency contracts are used to hedge against foreign currency risk in the Portfolio's long-term holdings. The table provides the name of the foreign currency, the settlement date of the contract, the amount of the contract, the value of the currency in U.S. dollars and the amount of unrealized gain or loss. The amount of unrealized gain or loss reflects the change in currency exchange rates from the time the contract was opened to the last day of the reporting period.
2B. FUTURES
A table listing futures contracts follows the Portfolio's Schedule of Investments (if applicable). Futures contracts are contracts that obligate the buyer to receive and the seller to deliver an instrument or money at a specified price on a specified date. Futures are used to hedge against adverse movements in securities prices, currency risk or interest rates.
The table provides the name of the contract, number of contracts held, the expiration date, the principal amount, value and the amount of unrealized gain or loss. The amount of unrealized gain or loss reflects the marked-to-market amount for the last day of the reporting period.
2C. OPTIONS
A table listing option contracts follows the Portfolio's Schedule of Investments (if applicable). Option contracts are contracts that obligate the Portfolio to sell or purchase an underlying security at a fixed price, upon exercise of the option. Options are used to hedge against adverse movements in securities prices, currency risk or interest risk.
The table provides the name of the contract, number of contracts held, the expiration date, exercise price, value and premiums received.
3. STATEMENT OF ASSETS AND LIABILITIES
This statement is often referred to as the "balance sheet." It lists the assets and liabilities of the Portfolio on the last day of the reporting period.
The Portfolio's assets are calculated by adding the value of the securities owned, the receivable for securities sold but not yet settled, the receivable for dividends declared but not yet received on stocks owned and the receivable for Portfolio shares sold to investors but not yet settled. The Portfolio's liabilities include payables for securities purchased but not yet settled, Portfolio shares redeemed but not yet paid and expenses owed but not yet paid. Additionally, there may be other assets and liabilities such as unrealized gain or loss on forward currency contracts.
The section entitled "Net Assets Consist of" breaks down the components of the Portfolio's net assets. Because the Portfolio must distribute substantially all earnings, you will notice that a significant portion of net assets is shareholder capital.
Janus Aspen Series December 31, 2006 27
Explanations of Charts, Tables and
Financial Statements (unaudited) (continued)
The last section of this statement reports the net asset value ("NAV") per share on the last day of the reporting period for each class of the Portfolio. The NAV is calculated by dividing the Portfolio's net assets (assets minus liabilities) by the number of shares outstanding.
4. STATEMENT OF OPERATIONS
This statement details the Portfolio's income, expenses, gains and losses on securities and currency transactions, and appreciation or depreciation of current Portfolio holdings.
The first section in this statement, entitled "Investment Income," reports the dividends earned from stocks and interest earned from interest-bearing securities in the Portfolio.
The next section reports the expenses and expense offsets incurred by the Portfolio, including the advisory fee paid to the investment adviser and transfer agent fees and expenses, and printing and postage for mailing statements, financial reports and prospectuses. Expense offsets, if any, are also shown.
The last section lists the increase or decrease in the value of securities held in the Portfolio. The Portfolio realizes a gain (or loss) when it sells its position in a particular security. An unrealized gain (or loss) refers to the change in net appreciation or depreciation of the Portfolio during the reporting period. "Net Realized and Unrealized Gain/(Loss) on Investments" is affected both by changes in the market value of Portfolio holdings and by gains (or losses) realized during the reporting period.
5. STATEMENT OF CHANGES IN NET ASSETS
This statement reports the increase or decrease in the Portfolio's net assets during the reporting period. Changes in the Portfolio's net assets are attributable to investment operations, dividends, distributions and capital share transactions. This is important to investors because it shows exactly what caused the Portfolio's net asset size to change during the period.
The first section summarizes the information from the Statement of Operations regarding changes in net assets due to the Portfolio's investment performance. The Portfolio's net assets may also change as a result of dividend and capital gains distributions to investors. If investors receive their dividends in cash, money is taken out of the Portfolio to pay the distribution. If investors reinvest their dividends, the Portfolio's net assets will not be affected. If you compare the Portfolio's "Net Decrease from Dividends and Distributions" to the "Reinvested dividends and distributions," you will notice that dividend distributions had little effect on the Portfolio's net assets. This is because the majority of Janus investors reinvest their distributions.
The reinvestment of dividends is included under "Capital Share Transactions." "Capital Shares" refers to the money investors contribute to the Portfolio through purchases or withdraw via redemptions. The Portfolio's net assets will increase and decrease in value as investors purchase and redeem shares from the Portfolio.
6. FINANCIAL HIGHLIGHTS
This schedule provides a per-share breakdown of the components that affect the Portfolio's NAV for current and past reporting periods for each class of the Portfolio. Not only does this table provide you with total return, it also reports total distributions, asset size, expense ratios and portfolio turnover rate.
The first line in the table reflects the NAV per share at the beginning of the reporting period. The next line reports the net investment income per share, which comprises dividends and interest income earned on securities held by the Portfolio. Following is the total of gains/(losses), realized and unrealized. Dividends and distributions are then subtracted to arrive at the NAV per share at the end of the period. The next line reflects the average annual total return reported the last day of the period.
Also included are the expense ratios, or the percentage of net assets that are used to cover operating expenses during the period. Expense ratios vary for a number of reasons, including the differences in management fees, the average shareholder account size and the extent of foreign investments, which entail greater transaction costs.
The Portfolio's expenses may be reduced through expense reduction arrangements. These arrangements may include the use of balance credits or transfer agent fee offsets. The Statement of Operations reflects total expenses before any such offset, the amount of offset and the net expenses. The expense ratios listed in the Financial Highlights reflect total expenses prior to any expense offsets (gross expense ratio) and after the expense offsets (net expense ratio). Both expense ratios reflect expenses after waivers (reimbursements), if applicable.
The ratio of net investment income/(loss) summarizes the income earned less expenses, divided by the average net assets of the Portfolio during the reporting period. Don't confuse this ratio with the Portfolio's yield. The net investment income ratio is not a true measure of the Portfolio's yield because it doesn't take into account the dividends distributed to the Portfolio's investors.
The next ratio is the portfolio turnover rate, which measures the buying and selling activity in a Portfolio. Portfolio turnover is affected by market conditions, changes in the asset size of a Portfolio, the nature of the Portfolio's investments and the investment style of the portfolio manager. A 100% rate implies that an amount equal to the value of the entire portfolio is turned over in a year; a 50% rate means that an amount equal to the value of half the portfolio is traded in a year; and a 200% rate means that an amount equal to the value of the portfolio is traded every six months.
28 Janus Aspen Series December 31, 2006
Designation Requirements (unaudited)
For federal income tax purposes, the Portfolio designated the following for the year ended December 31, 2006:
Dividends Received Deduction Percentage
| Fund | |||||||
| Janus Aspen Growth and Income Portfolio | 63 | % | |||||
Janus Aspen Series December 31, 2006 29
Trustees and Officers (unaudited)
The Portfolio's Statement of Additional Information includes additional information about the Trustees and officers and is available, without charge, by calling 1-800-525-0020.
The following are the Trustees and officers of the Trust, together with a brief description of their principal occupations during the last five years (principal occupations for certain Trustees may include periods over five years).
Each Trustee has served in that capacity since he or she was originally elected or appointed. The Trustees do not serve a specified term of office. Each Trustee will hold office until the termination of the Trust or his or her earlier death, resignation, retirement, incapacity or removal. The retirement age for Trustees is 72. The Portfolio's Nominating and Governance Committee will consider nominees for the position of Trustee recommended by shareholders. Shareholders may submit the name of a candidate for consideration by the Committee by submitting their recommendations to the Trust's Secretary. Each Trustee is currently a Trustee of two other registered investment companies advised by Janus Capital: Janus Investment Fund and Janus Adviser Series. As of the date of this report, collectively, these three registered investment companies consist of 69 series or funds.
The Trust's officers are elected annually by the Trustees for a one-year term. Certain officers also serve as officers of Janus Investment Fund and Janus Adviser Series. Certain officers of the Portfolio may also be officers and/or directors of Janus Capital. Portfolio officers receive no compensation from the Portfolio, except for the Portfolio's Chief Compliance Officer, as authorized by the Trustees.
Trustees
| Name, Age and Address | Positions Held with Portfolio | Length of Time Served | Principal Occupations During the Past Five Years | Number of Portfolios in Fund Complex Overseen by Trustee | Other Directorships Held by Trustee | ||||||||||||||||||
| Independent Trustees | |||||||||||||||||||||||
| Dennis B. Mullen 151 Detroit Street Denver, CO 80206 Age 63 | Chairman Trustee | 3/04-Present 9/93-Present | Chief Executive Officer of Red Robin Gourmet Burgers, Inc. (since 2005). Formerly, private investor. | 69 | * | Chairman of the Board (since 2005) and Director of Red Robin Gourmet Burgers, Inc.; and Director of Janus Capital Funds Plc (Dublin-based, non-U.S. funds). | |||||||||||||||||
| Jerome S. Contro 151 Detroit Street Denver, CO 80206 Age 50 | Trustee | 12/05-Present | Partner of Tango Group, a private investment firm (since 1999). | 69 | Trustee and Chairman of RS Investment Trust (since 2001); Director of IZZE Beverages and MyFamily.com, Inc. (genealogical research website). | ||||||||||||||||||
| William F. McCalpin 151 Detroit Street Denver, CO 80206 Age 49 | Trustee | 6/02-Present | Private Investor. Formerly, Vice President of Asian Cultural Council and Executive Vice President and Chief Operating Officer of The Rockefeller Brothers Fund (a private family foundation). | 69 | Director of the F.B. Heron Foundation (a private grantmaking foundation). | ||||||||||||||||||
| John W. McCarter, Jr. 151 Detroit Street Denver, CO 80206 Age 68 | Trustee | 6/02-Present | President and Chief Executive Officer of The Field Museum of Natural History (Chicago, IL). | 69 | Chairman of the Board and Director of Divergence Inc. (biotechnology firm); Director of W.W. Grainger, Inc. (industrial distributor); and Trustee WTTW (Chicago public television station) and the University of Chicago. | ||||||||||||||||||
30 Janus Aspen Series December 31, 2006
Trustees and Officers (unaudited) (continued)
Trustees (cont.)
| Name, Age and Address | Positions Held with Portfolio | Length of Time Served | Principal Occupations During the Past Five Years | Number of Portfolios in Fund Complex Overseen by Trustee | Other Directorships Held by Trustee | ||||||||||||||||||
| Independent Trustees (cont.) | |||||||||||||||||||||||
| James T. Rothe 151 Detroit Street Denver, CO 80206 Age 63 | Trustee | 1/97-Present | Co-founder and Managing Director of Roaring Fork Capital Management, LLC (private investment in public equity firm); and Professor Emeritus of Business of the University of Colorado, Colorado Springs, CO (since 2004). Formerly, Professor of Business of the University of Colorado (2002-2004); and Distinguished Visiting Professor of Business (2001-2002) of Thunderbird University (American Graduate School of International Management), Glendale, AZ. | 69 | Director of Red Robin Gourmet Burgers, Inc. | ||||||||||||||||||
| William D. Stewart 151 Detroit Street Denver, CO 80206 Age 62 | Trustee | 9/93-Present | Corporate Vice President and General Manager of MKS Instruments – HPS Products, Boulder, CO (a manufacturer of vacuum fittings and valves). | 69 | N/A | ||||||||||||||||||
| Martin H. Waldinger 151 Detroit Street Denver, CO 80206 Age 68 | Trustee | 9/93-Present | Private Investor and Consultant to California Planned Unit Developments. Formerly, CEO and President of Marwal, Inc. (homeowner association management company). | 69 | N/A | ||||||||||||||||||
| Linda S. Wolf 151 Detroit Street Denver, CO 80206 Age 59 | Trustee | 12/05-Present | Retired. Formerly, Chairman and Chief Executive Officer of Leo Burnett (Worldwide) (advertising agency) (2001-2005). | 69 | Director of Wal-Mart, The Field Museum of Natural History (Chicago, IL), Children's Memorial Hospital (Chicago, IL), Chicago Council on Foreign Relations, Economic Club of Chicago, and InnerWorkings (a provider of print procurement solutions). | ||||||||||||||||||
| Interested Trustee | |||||||||||||||||||||||
| Thomas H. Bailey** 151 Detroit Street Denver, CO 80206 Age 69 | Trustee | 5/93-Present | Retired. Formerly, President (1978-2002) and Chief Executive Officer (1994-2002) of Janus Capital or Janus Capital Corporation; Chairman and Director (1978-2002) of Janus Capital Corporation; President and Director (1994-2002) of The Janus Foundation. | 69 | N/A | ||||||||||||||||||
* Mr. Mullen also serves as director of Janus Capital Funds Plc, consisting of 22 funds. Including Janus Capital Funds Plc and the 69 funds comprising the Janus Funds, Mr. Mullen oversees 91 funds.
** The Portfolio is treating Mr. Bailey as an "interested person" of the Trust by virtue of his past positions and continuing relationships with Janus Capital and ownership of shares of Janus Capital's parent company.
Janus Aspen Series December 31, 2006 31
Officers
| Name, Age and Address | Positions Held with Portfolio | Term of Office* and Length of Time Served | Principal Occupations During the Past Five Years | ||||||||||||
| Minyoung Sohn 151 Detroit Street Denver, CO 80206 Age 31 | Executive Vice President and Portfolio Manager Janus Aspen Growth and Income Portfolio | 1/04-Present | Vice President of Janus Capital and Portfolio Manager for other Janus accounts. Formerly, Analyst (1998-2003) for Janus Capital Corporation. | ||||||||||||
| Stephanie Grauerholz-Lofton 151 Detroit Street Denver, CO 80206 Age 36 | Chief Legal Counsel and Secretary Vice President | 1/06-Present 03/06-Present | Assistant Vice President of Janus Capital and Janus Distributors LLC; and Associate Counsel of Janus Capital. Formerly, Associate of Vedder, Price, Kaufman & Kammholz, P.C. (1999-2003). | ||||||||||||
| Kelley Abbott Howes 151 Detroit Street Denver, CO 80206 Age 41 | President and Chief Executive Officer | 1/06-Present | President of Janus Services LLC; Senior Vice President and General Counsel of Janus Capital; and Senior Vice President and Assistant General Counsel of Janus Distributors LLC. Formerly, Vice President (1999-2005) of Janus Distributors LLC; Senior Vice President and General Counsel (2004-2006), Vice President (2000-2004), and Assistant General Counsel (2002-2004) of Janus Services LLC; and Vice President and Assistant General Counsel (1999-2004) of Janus Capital. | ||||||||||||
| David R. Kowalski 151 Detroit Street Denver, CO 80206 Age 49 | Vice President and Chief Compliance Officer | 6/02-Present | Senior Vice President and Chief Compliance Officer of Janus Capital, Janus Distributors LLC, and Janus Services LLC; Chief Compliance Officer of Bay Isle Financial LLC; and Vice President of Enhanced Investment Technologies LLC. Formerly, Chief Compliance Officer of Enhanced Investment Technologies, LLC (2003-2005); Vice President of Janus Capital (2000-2005), Janus Distributors LLC (2000-2001), and Janus Services LLC (2004-2005); and Assistant Vice President of Janus Services LLC (2002-2004). | ||||||||||||
| Jesper Nergaard 151 Detroit Street Denver, CO 80206 Age 44 | Chief Financial Officer Vice President, Treasurer, and Principal Accounting Officer | 3/05-Present 2/05-Present | Vice President of Janus Capital. Formerly, Director of Financial Reporting for OppenheimerFunds, Inc. (2004-2005); Site Manager and First Vice President of Mellon Global Securities Services (2003); and Director of Fund Accounting, Project Development, and Training of INVESCO Funds Group (1994-2003). | ||||||||||||
* Officers are elected at least annually for a one-year term and may also be elected from time to time by the Trustees for an interim period.
32 Janus Aspen Series December 31, 2006
Notes
Janus Aspen Series December 31, 2006 33
Janus provides access to a wide range of investment disciplines.
Growth
Janus growth portfolios focus on companies believed to be the leaders in their respective industries, with solid management teams, expanding market share, margins and efficiencies.
Core
Janus core portfolios seek investments in more stable and predictable companies. These portfolios look for a strategic combination of steady growth and for certain portfolios, some degree of income.
Risk-Managed
Our risk-managed portfolios seek to outperform their respective indices while maintaining a risk profile equal to or lower than the index itself. Managed by INTECH (a Janus subsidiary), these portfolios use a mathematical process in an attempt to build a more "efficient" portfolio than the index.
Value
Janus value portfolios invest in companies they believe are poised for a turnaround or are trading at a significant discount to fair value. The goal is to gain unique insight into a company's true value and identify and evaluate potential catalysts that may unlock shareholder value.
International & Global
Janus international and global portfolios seek to leverage Janus' research capabilities by taking advantage of inefficiencies in foreign markets, where accurate information and analytical insight are often at a premium.
Bond & Money Market
Janus bond portfolios attempt to provide less risk relative to equities while seeking to deliver a competitive total return through high current income and appreciation. Janus money market portfolios seek maximum current income consistent with stability of capital.
For more information about our funds, contact your investment professional or go to www.janus.com/info
Please consider the charges, risks, expenses and investment objectives carefully before investing. For a prospectus containing this and other information, please call Janus at 1-800-525-0020 or download the file from www.janus.com/info. Read it carefully before you invest or send money.
An investment in a money market portfolio is not insured or guaranteed by the Federal Deposit Insurance Corporation or any other government agency. Although the Portfolio seeks to preserve the value of your investment at $1.00 per share, it is possible to lose money by investing in the Portfolio.

151 Detroit Street
Denver, CO 80206
1-800-525-0020
Portfolio distributed by Janus Distributors LLC (1/07)
C-0207-169 109-02-712 01-07
2006 Annual Report
Janus Aspen Series
Janus Aspen INTECH Risk-Managed Core Portfolio
Look Inside. . .
• Portfolio management perspective
• Investment strategy behind your portfolio
• Portfolio performance, characteristics and holdings

Table of Contents
| Useful Information About Your Portfolio Report | 1 | ||||||
| Management Commentary and Schedule of Investments | 2 | ||||||
| Statement of Assets and Liabilities | 10 | ||||||
| Statement of Operations | 11 | ||||||
| Statements of Changes in Net Assets | 12 | ||||||
| Financial Highlights | 13 | ||||||
| Notes to Schedule of Investments | 14 | ||||||
| Notes to Financial Statements | 15 | ||||||
| Report of Independent Registered Public Accounting Firm | 21 | ||||||
| Additional Information | 22 | ||||||
| Explanations of Charts, Tables and Financial Statements | 25 | ||||||
| Designation Requirements | 27 | ||||||
| Trustees and Officers | 28 | ||||||
Please consider the charges, risks, expenses and investment objectives carefully before investing. For a prospectus containing this and other information, please call Janus at 1-800-525-0020 or download the file from www.janus.com/info. Read it carefully before you invest or send money.
Useful Information About Your Portfolio Report
Management Commentary
The Management Commentary in this report includes valuable insight from the Portfolio's managers as well as statistical information to help you understand how your Portfolio's performance and characteristics stack up against those of comparable indices.
Please keep in mind that the opinions expressed by the Portfolio's managers in the Management Commentary are just that: opinions. They are a reflection of the managers' best judgment at the time this report was compiled, which was December 31, 2006. As the investing environment changes, so could the managers' opinions. The views are unique to the managers and aren't necessarily shared by their fellow employees or by Janus in general.
Portfolio Expenses
We believe it's important for our shareholders to have a clear understanding of Portfolio expenses and the impact they have on investment return.
The following is important information regarding the Portfolio's Expense Example, which appears in the Portfolio Management Commentary within this Annual Report. Please refer to this information when reviewing the Expense Example for the Portfolio.
Example
As a shareholder of a Portfolio, you incur two types of costs: (1) transaction costs, including redemption fees (where applicable) (and any related exchange fees) and (2) ongoing costs, including management fees; distribution and shareholder servicing (12b-1) fees (applicable to Service Shares only); administrative services fees (applicable to Service Shares only); and other Portfolio expenses. The example is intended to help you understand your ongoing costs (in dollars) of investing in a Portfolio and to compare these costs with the ongoing costs of investing in other mutual funds. To do so, compare this 5% hypothetical example with the 5% hypothetical examples that appear in the shareholder reports of the other funds. The example is based upon an investment of $1,000 invested at the beginning of the period and held for the six-month period from July 1, 2006 to December 31, 2006.
Actual Expenses
The first line of the table in each example provides information about actual account values and actual expenses. You may use the information in this line, together with the amount you invested, to estimate the expenses that you paid over the period. Simply divide your account value by $1,000 (for example, an $8,600 account value divided by $1,000 = 8.6), then multiply the result by the number in the first line under the heading entitled "Expenses Paid During Period" to estimate the expenses you paid on your account during the period.
Hypothetical Example for Comparison Purposes
The second line of the table in each example provides information about hypothetical account values and hypothetical expenses based upon the Portfolio's actual expense ratio and an assumed rate of return of 5% per year before expenses, which is not the Portfolio's actual return. The hypothetical account values and expenses may not be used to estimate the actual ending account balance or expenses you paid for the period. You may use this information to compare the ongoing costs of investing in the Portfolio and other funds. To do so, compare this 5% hypothetical example with the 5% hypothetical examples that appear in the shareholder reports of the other funds.
Janus Capital Management LLC ("Janus Capital") has contractually agreed to waive the Portfolio's total operating expenses, excluding the distribution and shareholder servicing (12b-1) fees applicable to Service Shares, the administrative services fees applicable to Service Shares, brokerage commissions, interest, taxes and extraordinary expenses to certain limits until at least May 1, 2008. More information regarding the waivers is available in the Portfolio's prospectus.
Please note that the expenses shown in the tables are meant to highlight your ongoing costs only and do not reflect any transaction costs, such as redemption fees (where applicable) and any charges at the separate account level or contract level. Redemption fees are fully described in the prospectus. Therefore, the second line of each table is useful in comparing ongoing costs only, and will not help you determine the relative total costs of owning different funds. In addition, if these transaction costs and separate account or contract level charges were included, your costs would have been higher.
Janus Aspen Series December 31, 2006 1
Janus Aspen INTECH Risk-Managed Core Portfolio
(unaudited)
Managed by INTECH
Portfolio Snapshot
This portfolio uses a mathematically-based investment process that seeks to capitalize on the natural volatility of stock prices. The primary aim of this strategy is to outperform the benchmark index without increasing risk.
Performance Overview
For the 12 months ended December 31, 2006, Janus Aspen INTECH Risk-Managed Core Portfolio's Service Shares returned 10.77%. This compares to a 15.80% return posted by the S&P 500® Index, the Portfolio's benchmark.
Investment Strategy in This Environment
While fundamental analysis does not factor into our management of the Portfolio, fundamentals certainly have a significant impact on the general direction of the market in which we participate. The Portfolio's goal is to produce returns in excess of its benchmark with an equal or lesser amount of risk.
The Portfolio's mathematical investing process seeks to build a more efficient Portfolio than its benchmark, the S&P 500® Index. With a focus on risk management, investment decisions are governed by a mathematical investment process, which aims to deliver return over and above the Index over the long-term without assuming additional risk relative to the benchmark. This process does not attempt to predict the direction of the market, nor does it have a particular view of any company in the Portfolio.
Performance Review
Throughout the period, as stock prices naturally moved, we adjusted each comparable stock's weighting in the Portfolio in an attempt to keep the Portfolio more efficient than the Index, without increasing relative risk. We continued to implement the mathematical process in a disciplined manner during the period. While other factors may influence performance over the short term, we believe that the consistent application of our process will help the Portfolio perform well over the long term.
However, periods of underperformance such as the one we just experienced are inevitable and should be expected from time to time. From our perspective, the key is to keep these periods of underperformance both short in duration and mild in scope. The extent to which we are successful on that score will ultimately govern the longer-term success of the Portfolio.
Investment Strategy and Outlook
INTECH's mathematical, risk-managed investment process seeks to outperform the S&P 500® Index over the long-term, while attempting to control risk. We will continue to implement the process in a disciplined and deliberate manner. As a result, the Portfolio may experience underperformance during shorter time periods, but has a goal of outperformance over a three- to five-year time period. While managing risk will remain essential to our investment process, we will continue to make marginal improvements to the mathematical process, seeking an efficient Portfolio that offers better long-term results than its benchmark regardless of the market's direction.
Thank you for your investment in Janus Aspen INTECH Risk-Managed Core Portfolio.
2 Janus Aspen Series December 31, 2006
(unaudited)
Janus Aspen INTECH Risk-Managed Core Portfolio At a Glance
5 Largest Equity Holdings – (% of Net Assets)
As of December 31, 2006
| BellSouth Corp. Telephone - Integrated | 1.7 | % | |||||
| Merck & Company, Inc. Medical - Drugs | 1.7 | % | |||||
| Archer-Daniels-Midland Co. Agricultural Operations | 1.7 | % | |||||
| AT&T, Inc. Telephone - Integrated | 1.5 | % | |||||
| Procter & Gamble Co. Cosmetics and Toiletries | 1.5 | % | |||||
| 8.1 | % | ||||||
Asset Allocation – (% of Net Assets)
As of December 31, 2006
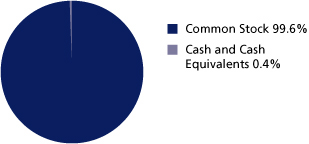
Top Country Allocations – (% of Investment Securities)
| As of December 31, 2006 | As of December 31, 2005 | ||||||
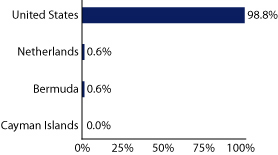 | 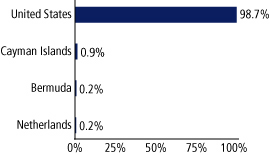 | ||||||
Janus Aspen Series December 31, 2006 3
Janus Aspen INTECH Risk-Managed Core Portfolio
(unaudited)
Performance
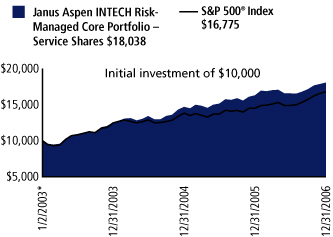
Average Annual Total Return – for the periods ended December 31, 2006
| One Year | Since Inception* | ||||||||||
| Janus Aspen INTECH Risk-Managed Core Portfolio – Service Shares | 10.77 | % | 15.91 | % | |||||||
| S&P 500® Index | 15.80 | % | 13.83 | % | |||||||
| Lipper Quartile – Service Shares | 4 | th | 2 | nd | |||||||
| Lipper Ranking – Service Shares based on total returns for Variable Annuity Multi-Cap Core Funds | 159/196 | 42/138 | |||||||||
Data presented represents past performance, which is no guarantee of future results. Investment results and principal value will fluctuate so that shares, when redeemed, may be worth more or less than their original cost. Due to market volatility, current performance may be higher or lower than the performance shown. Call 877.33JANUS or visit www.janus.com/info for performance current to the most recent month-end.
See Notes to Schedule of Investments for index definitions.
Total return includes reinvestment of dividends from net investment income and distributions from capital gains. The returns shown do not reflect the deduction of taxes that a shareholder would pay on Portfolio distributions or the redemption of Portfolio shares.
These returns do not reflect the charges and expenses of any particular insurance product or qualified plan. Returns shown would have been lower had they included insurance charges.
The weighting of securities within the Portfolio may differ significantly from the weightings within the index. The index is not available for direct investment; therefore its performance does not reflect the expenses associated with the active management of an actual Portfolio.
The proprietary mathematical process used by Enhanced Investment Technologies LLC ("INTECH") may not achieve the desired results. Since the Portfolio is regularly rebalanced, this may result in a higher portfolio turnover rate, higher expenses and potentially higher net taxable gains or losses for investors compared to a "buy and hold" or index portfolio strategy.
There is no assurance that the investment process will consistently lead to successful investing.
INTECH is a subsidiary of Janus Capital Group Inc.
Lipper Inc. - A Reuters Company, is a nationally recognized organization that ranks the performance of mutual funds within a universe of funds that have similar investment objectives. Rankings are historical with capital gains and dividends reinvested.
Janus Capital has contractually agreed to waive each Portfolio's total operating expenses to the levels indicated in the prospectus until at least May 1, 2008. Total returns shown include fee waivers, if any and without such waivers, total returns would have been lower.
Effective May 1, 2006, Janus Aspen Risk-Managed Core Portfolio was renamed Janus Aspen INTECH Risk-Managed Core Portfolio.
See "Explanations of Charts, Tables and Financial Statements."
* The Portfolio's inception date - January 2, 2003
Portfolio Expenses
The example below shows you the ongoing costs (in dollars) of investing in your Portfolio and allows you to compare these costs with those of other mutual funds. Please refer to page 1 for a detailed explanation of the information presented in this chart.
| Expense Example – Service Shares | Beginning Account Value (7/1/06) | Ending Account Value (12/31/06) | Expenses Paid During Period (7/1/06-12/31/06)* | ||||||||||||
| Actual | $ | 1,000.00 | $ | 1,090.50 | $ | 7.64 | |||||||||
| Hypothetical (5% return before expenses) | $ | 1,000.00 | $ | 1,017.90 | $ | 7.37 | |||||||||
*Expenses are equal to the annualized expense ratio of 1.45%, multiplied by the average account value over the period, multiplied by 184/365 (to reflect the one-half year period). Expenses may include effect of contractual waivers by Janus Capital.
4 Janus Aspen Series December 31, 2006
Janus Aspen INTECH Risk-Managed Core Portfolio
Schedule of Investments
As of December 31, 2006
| Shares or Principal Amount | Value | ||||||||||
| Common Stock - 99.6% | |||||||||||
| Advertising Agencies - 0.4% | |||||||||||
| 700 | Omnicom Group, Inc. | $ | 73,178 | ||||||||
| Aerospace and Defense - 4.1% | |||||||||||
| 1,600 | Boeing Co. | 142,144 | |||||||||
| 1,900 | General Dynamics Corp. | 141,265 | |||||||||
| 2,200 | Lockheed Martin Corp. | 202,554 | |||||||||
| 800 | Northrop Grumman Corp. | 54,160 | |||||||||
| 2,000 | Raytheon Co. | 105,600 | |||||||||
| 600 | Rockwell Collins, Inc. | 37,974 | |||||||||
| 683,697 | |||||||||||
| Aerospace and Defense - Equipment - 0.1% | |||||||||||
| 400 | United Technologies Corp. | 25,008 | |||||||||
| Agricultural Chemicals - 0.3% | |||||||||||
| 1,000 | Monsanto Co. | 52,530 | |||||||||
| Agricultural Operations - 1.7% | |||||||||||
| 9,000 | Archer-Daniels-Midland Co. | 287,640 | |||||||||
| Airlines - 0.1% | |||||||||||
| 1,000 | Southwest Airlines Co. | 15,320 | |||||||||
| Apparel Manufacturers - 0.7% | |||||||||||
| 800 | Jones Apparel Group, Inc. | 26,744 | |||||||||
| 100 | Liz Claiborne, Inc. | 4,346 | |||||||||
| 1,100 | V. F. Corp. | 90,288 | |||||||||
| 121,378 | |||||||||||
| Appliances - 0% | |||||||||||
| 56 | Whirlpool Corp. | 4,649 | |||||||||
| Applications Software - 0.7% | |||||||||||
| 1,000 | Citrix Systems, Inc.* | 27,050 | |||||||||
| 2,900 | Intuit, Inc.* | 88,479 | |||||||||
| 115,529 | |||||||||||
| Automotive - Cars and Light Trucks - 0.3% | |||||||||||
| 1,800 | General Motors Corp. | 55,296 | |||||||||
| Automotive - Medium and Heavy Duty Trucks - 0.2% | |||||||||||
| 400 | PACCAR, Inc. | 25,960 | |||||||||
| Automotive - Truck Parts and Equipment - Original - 0.8% | |||||||||||
| 1,500 | Johnson Controls, Inc. | 128,880 | |||||||||
| Beverages - Non-Alcoholic - 1.5% | |||||||||||
| 400 | Coca-Cola Co. | 19,300 | |||||||||
| 300 | Coca-Cola Enterprises, Inc. | 6,126 | |||||||||
| 1,600 | Pepsi Bottling Group, Inc. | 49,456 | |||||||||
| 2,700 | PepsiCo, Inc. | 168,885 | |||||||||
| 243,767 | |||||||||||
| Beverages - Wine and Spirits - 0.4% | |||||||||||
| 800 | Brown-Forman Corp. - Class B | 52,992 | |||||||||
| 200 | Constellation Brands, Inc. - Class A* | 5,804 | |||||||||
| 58,796 | |||||||||||
| Brewery - 0.3% | |||||||||||
| 500 | Anheuser-Busch Companies, Inc. | 24,600 | |||||||||
| 300 | Molson Coors Brewing Co. - Class B | 22,932 | |||||||||
| 47,532 | |||||||||||
| Broadcast Services and Programming - 0% | |||||||||||
| 100 | Clear Channel Communications, Inc. | 3,554 | |||||||||
| Shares or Principal Amount | Value | ||||||||||
| Cable Television - 1.0% | |||||||||||
| 2,500 | Comcast Corp. - Class A* | $ | 105,825 | ||||||||
| 2,400 | DIRECTV Group, Inc.* | 59,856 | |||||||||
| 165,681 | |||||||||||
| Casino Services - 1.2% | |||||||||||
| 4,400 | International Game Technology | 203,280 | |||||||||
| Chemicals - Diversified - 0.2% | |||||||||||
| 1,300 | Hercules, Inc.* | 25,103 | |||||||||
| Chemicals - Specialty - 0.8% | |||||||||||
| 100 | Ashland, Inc. | 6,918 | |||||||||
| 2,300 | Ecolab, Inc. | 103,960 | |||||||||
| 300 | Sigma-Aldrich Corp. | 23,316 | |||||||||
| 134,194 | |||||||||||
| Coal - 0% | |||||||||||
| 200 | Peabody Energy Corp. | 8,082 | |||||||||
| Coatings and Paint Products - 0.3% | |||||||||||
| 700 | Sherwin-Williams Co. | 44,506 | |||||||||
| Commercial Banks - 1.2% | |||||||||||
| 600 | BB&T Corp. | 26,358 | |||||||||
| 100 | Commerce Bancorp, Inc. | 3,527 | |||||||||
| 1,200 | Compass Bancshares, Inc. | 71,580 | |||||||||
| 300 | M&T Bank Corp. | 36,648 | |||||||||
| 1,098 | Regions Financial Corp. | 41,065 | |||||||||
| 300 | Zions Bancorporation | 24,732 | |||||||||
| 203,910 | |||||||||||
| Commercial Services - 0.3% | |||||||||||
| 1,800 | Convergys Corp.* | 42,804 | |||||||||
| Commercial Services - Finance - 0.6% | |||||||||||
| 800 | Moody's Corp. | 55,248 | |||||||||
| 600 | Paychex, Inc. | 23,724 | |||||||||
| 600 | Western Union Co. | 13,452 | |||||||||
| 92,424 | |||||||||||
| Computer Services - 0.2% | |||||||||||
| 500 | Cognizant Technology Solutions Corp.* | 38,580 | |||||||||
| Computers - 1.1% | |||||||||||
| 300 | Apple Computer, Inc.* | 25,452 | |||||||||
| 4,000 | Hewlett-Packard Co. | 164,760 | |||||||||
| 190,212 | |||||||||||
| Computers - Integrated Systems - 0.1% | |||||||||||
| 400 | NCR Corp.* | 17,104 | |||||||||
| Computers - Memory Devices - 0.3% | |||||||||||
| 1,100 | Network Appliance, Inc.* | 43,208 | |||||||||
| Computers - Peripheral Equipment - 0.4% | |||||||||||
| 800 | Lexmark International Group, Inc. - Class A* | 58,560 | |||||||||
| Consumer Products - Miscellaneous - 0.5% | |||||||||||
| 1,100 | Clorox Co. | 70,565 | |||||||||
| 200 | Kimberly-Clark Corp. | 13,590 | |||||||||
| 84,155 | |||||||||||
| Containers - Paper and Plastic - 0.6% | |||||||||||
| 1,200 | Bemis Company, Inc. | 40,776 | |||||||||
| 1,600 | Pactiv Corp.* | 57,104 | |||||||||
| 97,880 | |||||||||||
See Notes to Schedule of Investments and Financial Statements.
Janus Aspen Series December 31, 2006 5
Janus Aspen INTECH Risk-Managed Core Portfolio
Schedule of Investments
As of December 31, 2006
| Shares or Principal Amount | Value | ||||||||||
| Cosmetics and Toiletries - 3.3% | |||||||||||
| 500 | Avon Products, Inc. | $ | 16,520 | ||||||||
| 3,300 | Colgate-Palmolive Co. | 215,292 | |||||||||
| 400 | Estee Lauder Companies, Inc. - Class A | 16,328 | |||||||||
| 900 | International Flavors & Fragrances, Inc. | 44,244 | |||||||||
| 3,927 | Procter & Gamble Co. | 252,388 | |||||||||
| 544,772 | |||||||||||
| Data Processing and Management - 0.5% | |||||||||||
| 1,400 | Automatic Data Processing, Inc. | 68,950 | |||||||||
| 100 | Fidelity National Information Services, Inc. | 4,009 | |||||||||
| 100 | First Data Corp. | 2,552 | |||||||||
| 100 | Fiserv, Inc.* | 5,242 | |||||||||
| 80,753 | |||||||||||
| Disposable Medical Products - 0.2% | |||||||||||
| 500 | C.R. Bard, Inc. | 41,485 | |||||||||
| Diversified Operations - 1.6% | |||||||||||
| 1,000 | Cooper Industries, Ltd. - Class A | 90,430 | |||||||||
| 300 | Danaher Corp. | 21,732 | |||||||||
| 600 | Dover Corp. | 29,412 | |||||||||
| 3,100 | General Electric Co. | 115,351 | |||||||||
| 100 | Leggett & Platt, Inc. | 2,390 | |||||||||
| 100 | PPG Industries, Inc. | 6,421 | |||||||||
| 265,736 | |||||||||||
| E-Commerce/Services - 0.1% | |||||||||||
| 400 | IAC/InterActiveCorp* | 14,864 | |||||||||
| Electric - Generation - 0.7% | |||||||||||
| 5,600 | AES Corp.* | 123,424 | |||||||||
| Electric - Integrated - 3.7% | |||||||||||
| 2,000 | Allegheny Energy, Inc.* | 91,820 | |||||||||
| 1,400 | CenterPoint Energy, Inc. | 23,212 | |||||||||
| 100 | Dominion Resources, Inc. | 8,384 | |||||||||
| 100 | Duke Energy Corp. | 3,321 | |||||||||
| 100 | Edison International | 4,548 | |||||||||
| 300 | Entergy Corp. | 27,696 | |||||||||
| 900 | Exelon Corp. | 55,701 | |||||||||
| 2,300 | FirstEnergy Corp. | 138,690 | |||||||||
| 500 | FPL Group, Inc. | 27,210 | |||||||||
| 2,400 | PG&E Corp. | 113,592 | |||||||||
| 100 | Pinnacle West Capital Corp. | 5,069 | |||||||||
| 100 | PPL Corp. | 3,584 | |||||||||
| 300 | Public Service Enterprise Group, Inc. | 19,914 | |||||||||
| 1,400 | TXU Corp. | 75,894 | |||||||||
| 1,100 | Xcel Energy, Inc. | 25,366 | |||||||||
| 624,001 | |||||||||||
| Electric Products - Miscellaneous - 0.7% | |||||||||||
| 1,500 | Emerson Electric Co. | 66,135 | |||||||||
| 1,500 | Molex, Inc. | 47,445 | |||||||||
| 113,580 | |||||||||||
| Electronic Components - Semiconductors - 0.9% | |||||||||||
| 800 | Micron Technology, Inc.* | 11,168 | |||||||||
| 2,900 | NVIDIA Corp.* | 107,329 | |||||||||
| 1,400 | QLogic Corp.* | 30,688 | |||||||||
| 149,185 | |||||||||||
| Electronic Forms - 0% | |||||||||||
| 100 | Adobe Systems, Inc.* | 4,112 | |||||||||
| Shares or Principal Amount | Value | ||||||||||
| Electronic Measuring Instruments - 0% | |||||||||||
| 100 | Tektronix, Inc. | $ | 2,917 | ||||||||
| Engines - Internal Combustion - 0.5% | |||||||||||
| 700 | Cummins, Inc. | 82,726 | |||||||||
| Enterprise Software/Services - 1.2% | |||||||||||
| 2,400 | BMC Software, Inc.* | 77,280 | |||||||||
| 7,276 | Oracle Corp.* | 124,711 | |||||||||
| 201,991 | |||||||||||
| Fiduciary Banks - 1.4% | |||||||||||
| 800 | Bank of New York Company, Inc. | 31,496 | |||||||||
| 2,300 | Mellon Financial Corp. | 96,945 | |||||||||
| 600 | Northern Trust Corp. | 36,414 | |||||||||
| 1,000 | State Street Corp. | 67,440 | |||||||||
| 232,295 | |||||||||||
| Finance - Commercial - 0% | |||||||||||
| 100 | CIT Group, Inc. | 5,577 | |||||||||
| Finance - Consumer Loans - 0.1% | |||||||||||
| 200 | SLM Corp. | 9,754 | |||||||||
| Finance - Credit Card - 0% | |||||||||||
| 1 | Capital One Financial Corp. | 77 | |||||||||
| Finance - Investment Bankers/Brokers - 4.3% | |||||||||||
| 400 | Bear Stearns Companies, Inc. | 65,112 | |||||||||
| 2,000 | Citigroup, Inc. | 111,400 | |||||||||
| 400 | E*TRADE Financial Corp.* | 8,968 | |||||||||
| 900 | Goldman Sachs Group, Inc. | 179,416 | |||||||||
| 2,400 | JP Morgan Chase & Co. | 115,920 | |||||||||
| 700 | Lehman Brothers Holdings, Inc. | 54,684 | |||||||||
| 1,100 | Merrill Lynch & Company, Inc. | 102,410 | |||||||||
| 900 | Morgan Stanley Co. | 73,287 | |||||||||
| 711,197 | |||||||||||
| Finance - Mortgage Loan Banker - 0% | |||||||||||
| 100 | Fannie Mae | 5,939 | |||||||||
| Finance - Other Services - 0.3% | |||||||||||
| 100 | Chicago Mercantile Exchange Holdings, Inc. | 50,975 | |||||||||
| Financial Guarantee Insurance - 0.4% | |||||||||||
| 700 | Ambac Financial Group, Inc. | 62,349 | |||||||||
| Food - Diversified - 2.7% | |||||||||||
| 2,700 | Campbell Soup Co. | 105,003 | |||||||||
| 1,700 | ConAgra Foods, Inc. | 45,900 | |||||||||
| 1,400 | General Mills, Inc. | 80,640 | |||||||||
| 2,700 | H.J. Heinz Co. | 121,527 | |||||||||
| 800 | Kellogg Co. | 40,048 | |||||||||
| 1,700 | McCormick & Company, Inc. | 65,552 | |||||||||
| 458,670 | |||||||||||
| Food - Retail - 1.6% | |||||||||||
| 5,600 | Kroger Co. | 129,192 | |||||||||
| 4,100 | Safeway, Inc. | 141,696 | |||||||||
| 270,888 | |||||||||||
| Food - Wholesale/Distribution - 0.1% | |||||||||||
| 400 | Sysco Corp. | 14,704 | |||||||||
See Notes to Schedule of Investments and Financial Statements.
6 Janus Aspen Series December 31, 2006
Schedule of Investments
As of December 31, 2006
| Shares or Principal Amount | Value | ||||||||||
| Gas - Distribution - 0.8% | |||||||||||
| 2,100 | KeySpan Corp. | $ | 86,478 | ||||||||
| 100 | Nicor, Inc. | 4,680 | |||||||||
| 100 | NiSource, Inc. | 2,410 | |||||||||
| 400 | Peoples Energy Corp. | 17,828 | |||||||||
| 300 | Sempra Energy Co. | 16,812 | |||||||||
| 128,208 | |||||||||||
| Health Care Cost Containment - 0.2% | |||||||||||
| 600 | McKesson Corp. | 30,420 | |||||||||
| Home Decoration Products - 0.4% | |||||||||||
| 2,500 | Newell Rubbermaid, Inc. | 72,375 | |||||||||
| Hotels and Motels - 0.4% | |||||||||||
| 1,100 | Hilton Hotels Corp. | 38,390 | |||||||||
| 700 | Marriott International, Inc. - Class A | 33,404 | |||||||||
| 71,794 | |||||||||||
| Identification Systems and Devices - 0.1% | |||||||||||
| 1,300 | Symbol Technologies, Inc. | 19,422 | |||||||||
| Instruments - Controls - 0.8% | |||||||||||
| 3,000 | Thermo Electron Corp.* | 135,870 | |||||||||
| Instruments - Scientific - 0.5% | |||||||||||
| 2,200 | Applera Corp. - Applied Biosystems Group | 80,718 | |||||||||
| 100 | Waters Corp.* | 4,897 | |||||||||
| 85,615 | |||||||||||
| Insurance Brokers - 0.3% | |||||||||||
| 1,200 | Aon Corp. | 42,408 | |||||||||
| Internet Security - 0% | |||||||||||
| 200 | Symantec Corp.* | 4,170 | |||||||||
| Investment Management and Advisory Services - 1.0% | |||||||||||
| 900 | Ameriprise Financial, Inc. | 49,050 | |||||||||
| 600 | Franklin Resources, Inc. | 66,102 | |||||||||
| 1,000 | T. Rowe Price Group, Inc. | 43,770 | |||||||||
| 158,922 | |||||||||||
| Life and Health Insurance - 1.4% | |||||||||||
| 200 | AFLAC, Inc. | 9,200 | |||||||||
| 658 | Lincoln National Corp. | 43,691 | |||||||||
| 1,500 | Principal Financial Group, Inc. | 88,050 | |||||||||
| 300 | Prudential Financial, Inc. | 25,758 | |||||||||
| 1,100 | Torchmark Corp. | 70,136 | |||||||||
| 236,835 | |||||||||||
| Machinery - Construction and Mining - 0.2% | |||||||||||
| 200 | Caterpillar, Inc. | 12,266 | |||||||||
| 200 | Terex Corp.* | 12,916 | |||||||||
| 25,182 | |||||||||||
| Machinery - Farm - 0.2% | |||||||||||
| 400 | Deere & Co. | 38,028 | |||||||||
| Medical - Biomedical and Genetic - 0.4% | |||||||||||
| 1,300 | Celgene Corp.* | 74,789 | |||||||||
| Shares or Principal Amount | Value | ||||||||||
| Medical - Drugs - 3.1% | |||||||||||
| 500 | Abbott Laboratories | $ | 24,355 | ||||||||
| 800 | Bristol-Myers Squibb Co. | 21,056 | |||||||||
| 200 | Eli Lilly and Co. | 10,420 | |||||||||
| 1,400 | Forest Laboratories, Inc.* | 70,840 | |||||||||
| 6,600 | Merck & Company, Inc. | 287,760 | |||||||||
| 1,100 | Pfizer, Inc. | 28,490 | |||||||||
| 100 | Schering-Plough Corp. | 2,364 | |||||||||
| 1,400 | Wyeth | 71,288 | |||||||||
| 516,573 | |||||||||||
| Medical - Generic Drugs - 0% | |||||||||||
| 100 | Mylan Laboratories, Inc. | 1,996 | |||||||||
| Medical - HMO - 0.6% | |||||||||||
| 1,700 | Humana, Inc.* | 94,027 | |||||||||
| Medical - Nursing Homes - 0.3% | |||||||||||
| 1,100 | Manor Care, Inc. | 51,612 | |||||||||
| Medical - Wholesale Drug Distributors - 1.0% | |||||||||||
| 2,300 | AmerisourceBergen Corp. | 103,408 | |||||||||
| 1,100 | Cardinal Health, Inc. | 70,873 | |||||||||
| 174,281 | |||||||||||
| Medical Information Systems - 0.1% | |||||||||||
| 400 | IMS Health, Inc. | 10,992 | |||||||||
| Medical Instruments - 0% | |||||||||||
| 100 | Medtronic, Inc. | 5,351 | |||||||||
| Medical Labs and Testing Services - 1.1% | |||||||||||
| 1,700 | Laboratory Corporation of America Holdings* | 124,899 | |||||||||
| 1,000 | Quest Diagnostics, Inc. | 53,000 | |||||||||
| 177,899 | |||||||||||
| Medical Products - 1.0% | |||||||||||
| 1,000 | Baxter International, Inc. | 46,390 | |||||||||
| 600 | Becton, Dickinson and Co. | 42,090 | |||||||||
| 1,300 | Johnson & Johnson | 85,826 | |||||||||
| 174,306 | |||||||||||
| Metal - Copper - 0.8% | |||||||||||
| 1,100 | Phelps Dodge Corp. | 131,692 | |||||||||
| Motorcycle and Motor Scooter Manufacturing - 0.3% | |||||||||||
| 800 | Harley-Davidson, Inc. | 56,376 | |||||||||
| Multi-Line Insurance - 1.7% | |||||||||||
| 100 | Allstate Corp. | 6,511 | |||||||||
| 200 | Cincinnati Financial Corp. | 9,062 | |||||||||
| 600 | Genworth Financial, Inc. - Class A | 20,526 | |||||||||
| 5,100 | Loews Corp. | 211,497 | |||||||||
| 500 | MetLife, Inc. | 29,505 | |||||||||
| 277,101 | |||||||||||
| Multimedia - 2.0% | |||||||||||
| 1,100 | McGraw-Hill Companies, Inc. | 74,822 | |||||||||
| 6,500 | News Corporation, Inc. - Class A | 139,620 | |||||||||
| 200 | Time Warner, Inc. | 4,356 | |||||||||
| 3,500 | Walt Disney Co. | 119,945 | |||||||||
| 338,743 | |||||||||||
| Networking Products - 0.5% | |||||||||||
| 3,000 | Cisco Systems, Inc.* | 81,990 | |||||||||
| Non-Hazardous Waste Disposal - 0.9% | |||||||||||
| 3,100 | Allied Waste Industries, Inc.* | 38,099 | |||||||||
| 3,200 | Waste Management, Inc. | 117,664 | |||||||||
| 155,763 | |||||||||||
See Notes to Schedule of Investments and Financial Statements.
Janus Aspen Series December 31, 2006 7
Janus Aspen INTECH Risk-Managed Core Portfolio
Schedule of Investments
As of December 31, 2006
| Shares or Principal Amount | Value | ||||||||||
| Oil - Field Services - 0.8% | |||||||||||
| 500 | Baker Hughes, Inc. | $ | 37,330 | ||||||||
| 1,500 | Schlumberger, Ltd. (U.S. Shares) | 94,740 | |||||||||
| 100 | Weatherford International, Ltd* | 4,179 | |||||||||
| 136,249 | |||||||||||
| Oil and Gas Drilling - 0% | |||||||||||
| 100 | Transocean, Inc. (U.S. Shares)* | 8,089 | |||||||||
| Oil Companies - Integrated - 1.7% | |||||||||||
| 165 | Chevron Corp. | 12,132 | |||||||||
| 2,500 | Exxon Mobil Corp. | 191,575 | |||||||||
| 870 | Marathon Oil Corp. | 80,475 | |||||||||
| 284,182 | |||||||||||
| Optical Supplies - 0.8% | |||||||||||
| 1,100 | Allergan, Inc. | 131,714 | |||||||||
| Pharmacy Services - 0.7% | |||||||||||
| 300 | Caremark Rx, Inc. | 17,133 | |||||||||
| 200 | Express Scripts, Inc. - Class A* | 14,320 | |||||||||
| 1,517 | Medco Health Solutions, Inc.* | 81,068 | |||||||||
| 112,521 | |||||||||||
| Pipelines - 0.4% | |||||||||||
| 500 | Kinder Morgan, Inc. | 52,875 | |||||||||
| 100 | Questar Corp. | 8,305 | |||||||||
| 61,180 | |||||||||||
| Power Converters and Power Supply Equipment - 0.2% | |||||||||||
| 1,000 | American Power Conversion Corp. | 30,590 | |||||||||
| Property and Casualty Insurance - 0.6% | |||||||||||
| 1,000 | Chubb Corp. | 52,910 | |||||||||
| 900 | Progressive Corp. | 21,798 | |||||||||
| 500 | St. Paul Travelers Companies, Inc. | 26,845 | |||||||||
| 101,553 | |||||||||||
| Real Estate Management/Services - 0.2% | |||||||||||
| 1,100 | CB Richard Ellis Group, Inc.* | 36,520 | |||||||||
| REIT - Apartments - 1.9% | |||||||||||
| 1,300 | Apartment Investment & Management Co. - Class A | 72,826 | |||||||||
| 1,800 | Archstone-Smith Trust, Inc. | 104,778 | |||||||||
| 2,600 | Equity Residential Properties Trust | 131,950 | |||||||||
| 309,554 | |||||||||||
| REIT - Diversified - 0.6% | |||||||||||
| 800 | Vornado Realty Trust | 97,200 | |||||||||
| REIT - Office Property - 1.5% | |||||||||||
| 1,300 | Boston Properties, Inc. | 145,444 | |||||||||
| 2,200 | Equity Office Properties Trust | 105,974 | |||||||||
| 251,418 | |||||||||||
| REIT - Regional Malls - 0.1% | |||||||||||
| 100 | Simon Property Group, Inc. | 10,129 | |||||||||
| REIT - Shopping Centers - 0.5% | |||||||||||
| 1,700 | Kimco Realty Corp. | 76,415 | |||||||||
| REIT - Storage - 0.2% | |||||||||||
| 400 | Public Storage, Inc. | 39,000 | |||||||||
| REIT - Warehouse and Industrial - 0.3% | |||||||||||
| 900 | ProLogis | 54,693 | |||||||||
| Retail - Apparel and Shoe - 0.4% | |||||||||||
| 2,600 | Limited, Inc. | 75,244 | |||||||||
| Shares or Principal Amount | Value | ||||||||||
| Retail - Auto Parts - 0.1% | |||||||||||
| 100 | AutoZone, Inc.* | $ | 11,556 | ||||||||
| Retail - Consumer Electronics - 0.1% | |||||||||||
| 1,300 | Circuit City Stores, Inc. | 24,674 | |||||||||
| Retail - Discount - 1.2% | |||||||||||
| 1,400 | Big Lots, Inc.* | 32,088 | |||||||||
| 1,300 | Costco Wholesale Corp. | 68,731 | |||||||||
| 900 | Family Dollar Stores, Inc. | 26,397 | |||||||||
| 2,400 | TJX Companies, Inc. | 68,448 | |||||||||
| 195,664 | |||||||||||
| Retail - Drug Store - 0.1% | |||||||||||
| 300 | CVS Corp. | 9,273 | |||||||||
| 100 | Walgreen Co. | 4,589 | |||||||||
| 13,862 | |||||||||||
| Retail - Major Department Stores - 1.2% | |||||||||||
| 1,800 | J.C. Penney Company, Inc. | 139,248 | |||||||||
| 400 | Sears Holdings Corp.* | 67,172 | |||||||||
| 206,420 | |||||||||||
| Retail - Office Supplies - 1.2% | |||||||||||
| 3,900 | Office Depot, Inc.* | 148,863 | |||||||||
| 1,000 | OfficeMax, Inc. | 49,650 | |||||||||
| 198,513 | |||||||||||
| Retail - Regional Department Stores - 1.1% | |||||||||||
| 700 | Dillard's, Inc. - Class A | 24,479 | |||||||||
| 604 | Federated Department Stores, Inc. | 23,031 | |||||||||
| 2,000 | Kohl's Corp.* | 136,860 | |||||||||
| 184,370 | |||||||||||
| Retail - Restaurants - 1.6% | |||||||||||
| 500 | Darden Restaurants, Inc. | 20,085 | |||||||||
| 1,400 | McDonald's Corp. | 62,062 | |||||||||
| 3,500 | Starbucks Corp.* | 123,970 | |||||||||
| 1,600 | Wendy's International, Inc. | 52,944 | |||||||||
| 200 | Yum! Brands, Inc. | 11,760 | |||||||||
| 270,821 | |||||||||||
| Savings/Loan/Thrifts - 0% | |||||||||||
| 200 | Sovereign Bancorp, Inc. | 5,078 | |||||||||
| Semiconductor Equipment - 0% | |||||||||||
| 100 | Novellus Systems, Inc.* | 3,442 | |||||||||
| Steel - Producers - 1.2% | |||||||||||
| 3,200 | Nucor Corp. | 174,912 | |||||||||
| 300 | United States Steel Corp. | 21,942 | |||||||||
| 196,854 | |||||||||||
| Steel - Specialty - 0.7% | |||||||||||
| 1,200 | Allegheny Technologies, Inc. | 108,816 | |||||||||
| Super-Regional Banks - 3.1% | |||||||||||
| 3,976 | Bank of America Corp. | 212,278 | |||||||||
| 500 | KeyCorp | 19,015 | |||||||||
| 300 | National City Corp. | 10,968 | |||||||||
| 1,600 | PNC Bank Corp. | 118,464 | |||||||||
| 200 | SunTrust Banks, Inc. | 16,890 | |||||||||
| 1,200 | U.S. Bancorp | 43,428 | |||||||||
| 227 | Wachovia Corp. | 12,928 | |||||||||
| 2,500 | Wells Fargo & Co. | 88,900 | |||||||||
| 522,871 | |||||||||||
| Telecommunication Equipment - Fiber Optics - 0% | |||||||||||
| 200 | Ciena Corp.* | 5,542 | |||||||||
See Notes to Schedule of Investments and Financial Statements.
8 Janus Aspen Series December 31, 2006
Schedule of Investments
As of December 31, 2006
| Shares or Principal Amount | Value | ||||||||||
| Telephone - Integrated - 4.0% | |||||||||||
| 7,157 | AT&T, Inc. | $ | 255,863 | ||||||||
| 6,200 | BellSouth Corp. | 292,082 | |||||||||
| 1,400 | CenturyTel, Inc. | 61,124 | |||||||||
| 900 | Citizens Communications Co. | 12,933 | |||||||||
| 400 | Verizon Communications, Inc. | 14,896 | |||||||||
| 2,413 | Windstream Corp. | 34,313 | |||||||||
| 671,211 | |||||||||||
| Television - 0.7% | |||||||||||
| 300 | CBS Corp. - Class B | 9,354 | |||||||||
| 3,100 | Univision Communications, Inc. - Class A* | 109,802 | |||||||||
| 119,156 | |||||||||||
| Therapeutics - 0.7% | |||||||||||
| 1,700 | Gilead Sciences, Inc.* | 110,381 | |||||||||
| Tobacco - 2.5% | |||||||||||
| 1,600 | Altria Group, Inc. | 137,312 | |||||||||
| 2,400 | Reynolds American, Inc. | 157,128 | |||||||||
| 2,000 | UST, Inc. | 116,400 | |||||||||
| 410,840 | |||||||||||
| Tools - Hand Held - 0.1% | |||||||||||
| 500 | Snap-On, Inc. | 23,820 | |||||||||
| Toys - 0.7% | |||||||||||
| 1,100 | Hasbro, Inc. | 29,975 | |||||||||
| 3,800 | Mattel, Inc. | 86,108 | |||||||||
| 116,083 | |||||||||||
| Transportation - Railroad - 2.1% | |||||||||||
| 1,100 | Burlington Northern Santa Fe Corp. | 81,191 | |||||||||
| 3,400 | CSX Corp. | 117,062 | |||||||||
| 500 | Norfolk Southern Corp. | 25,145 | |||||||||
| 1,400 | Union Pacific Corp. | 128,828 | |||||||||
| 352,226 | |||||||||||
| Transportation - Services - 0.9% | |||||||||||
| 700 | FedEx Corp. | 76,034 | |||||||||
| 800 | Ryder System, Inc. | 40,848 | |||||||||
| 500 | United Parcel Service, Inc. - Class B | 37,490 | |||||||||
| 154,372 | |||||||||||
| Travel Services - 0% | |||||||||||
| 100 | Sabre Group Holdings, Inc. | 3,189 | |||||||||
| Web Portals/Internet Service Providers - 0.6% | |||||||||||
| 200 | Google, Inc. - Class A* | 92,096 | |||||||||
| Total Investments (total cost $14,479,895) – 99.6% | 16,655,216 | ||||||||||
| Cash, Receivables and Other Assets, net of Liabilities – 0.4% | 66,009 | ||||||||||
| Net Assets – 100% | $ | 16,721,225 | |||||||||
Summary of Investments by Country
| Country | Value | % of Investment Securities | |||||||||
| Bermuda | $ | 94,609 | 0.6 | % | |||||||
| Cayman Islands | 8,089 | 0.0 | % | ||||||||
| Netherlands | 94,740 | 0.6 | % | ||||||||
| United States | 16,457,778 | 98.8 | % | ||||||||
| Total | $ | 16,655,216 | 100.0 | % | |||||||
See Notes to Schedule of Investments and Financial Statements.
Janus Aspen Series December 31, 2006 9
Statement of Assets and Liabilities
| As of December 31, 2006 (all numbers in thousands except net asset value per share) | Janus Aspen INTECH Risk-Managed Core Portfolio(1) | ||||||
| Assets: | |||||||
| Investments at cost | $ | 14,480 | |||||
| Investments at value | $ | 16,655 | |||||
| Receivables: | |||||||
| Investments sold | 451 | ||||||
| Portfolio shares sold | 15 | ||||||
| Dividends | 35 | ||||||
| Interest | – | ||||||
| Other assets | – | ||||||
| Total Assets | 17,156 | ||||||
| Liabilities: | |||||||
| Payables: | |||||||
| Due to custodian | 132 | ||||||
| Investments purchased | 230 | ||||||
| Portfolio shares repurchased | 13 | ||||||
| Advisory fees | 6 | ||||||
| Transfer agent fees and expenses | 1 | ||||||
| Distribution fees - Service Shares | 4 | ||||||
| Administrative service fees - Service Shares | 1 | ||||||
| Non-interested Trustees' fees and expenses | 1 | ||||||
| Professional fees | 20 | ||||||
| Printing expenses | 15 | ||||||
| Accrued expenses | 12 | ||||||
| Total Liabilities | 435 | ||||||
| Net Assets | $ | 16,721 | |||||
| Net Assets Consist of: | |||||||
| Capital (par value and paid-in-surplus)* | $ | 14,447 | |||||
| Undistributed net investment income/(loss)* | 12 | ||||||
| Undistributed net realized gain/(loss) from investments and foreign currency transactions* | 87 | ||||||
| Unrealized net appreciation/(depreciation) of investments and foreign currency translations | 2,175 | ||||||
| Total Net Assets | $ | 16,721 | |||||
| Net Assets - Service Shares | $ | 16,721 | |||||
| Shares Outstanding, $0.001 Par Value (unlimited shares authorized) | 1,316 | ||||||
| Net Asset Value Per Share | $ | 12.71 | |||||
* See Note 3 in Notes to Financial Statements.
(1) Formerly named Janus Aspen Risk-Managed Core Portfolio.
See Notes to Financial Statements.
10 Janus Aspen Series December 31, 2006
Statement of Operations
| For the fiscal year ended December 31, 2006 (all numbers in thousands) | Janus Aspen INTECH Risk-Managed Core Portfolio(1) | ||||||
| Investment Income: | |||||||
| Interest | $ | 7 | |||||
| Dividends | 288 | ||||||
| Dividends from affiliates | 2 | ||||||
| Total Investment Income | 297 | ||||||
| Expenses: | |||||||
| Advisory fees | 91 | ||||||
| Transfer agent expenses | 3 | ||||||
| Registration fees | – | ||||||
| Custodian fees | 35 | ||||||
| Professional fees | 28 | ||||||
| Non-interested Trustees' fees and expenses | 4 | ||||||
| Distribution fees - Service Shares | 46 | ||||||
| Administrative service fees - Service Shares | 18 | ||||||
| Printing expenses | 40 | ||||||
| Proxy expense | 20 | ||||||
| System fees | 36 | ||||||
| Legal fees | 12 | ||||||
| Other expenses | 6 | ||||||
| Non-recurring costs (Note 2) | – | ||||||
| Costs assumed by Janus Capital Management LLC (Note 2) | – | ||||||
| Total Expenses | 339 | ||||||
| Expense and Fee Offset | – | ||||||
| Net Expenses | 339 | ||||||
| Less: Excess Expense Reimbursement | (74 | ) | |||||
| Net Expenses after Expense Reimbursement | 265 | ||||||
| Net Investment Income/(Loss) | 32 | ||||||
| Net Realized and Unrealized Gain/(Loss) on Investments: | |||||||
| Net realized gain/(loss) from securities transactions | 1,429 | ||||||
| Change in unrealized net appreciation/(depreciation) of investments and foreign currency translations | 148 | ||||||
| Net Gain/(Loss) on Investments | 1,577 | ||||||
| Net Increase/(Decrease) in Net Assets Resulting from Operations | $ | 1,609 | |||||
(1) Formerly named Janus Aspen Risk-Managed Core Portfolio.
See Notes to Financial Statements.
Janus Aspen Series December 31, 2006 11
Statements of Changes in Net Assets
| For the fiscal year ended December 31 | Janus Aspen INTECH Risk-Managed Core Portfolio(1) | ||||||||||
| (all numbers in thousands) | 2006 | 2005 | |||||||||
| Operations: | |||||||||||
| Net investment income/(loss) | $ | 32 | $ | 80 | |||||||
| Net realized gain/(loss) from investment transactions | 1,429 | 2,585 | |||||||||
| Change in unrealized net appreciation/(depreciation) of investments | 148 | (679 | ) | ||||||||
| Net Increase/(Decrease) in Net Assets Resulting from Operations | 1,609 | 1,986 | |||||||||
| Dividends and Distributions to Shareholders: | |||||||||||
| Net investment income* | |||||||||||
| Service Shares | (20 | ) | (53 | ) | |||||||
| Net realized gain from investment transactions* | |||||||||||
| Service Shares | (1,319 | ) | (3,103 | ) | |||||||
| Tax return of capital* | |||||||||||
| Service Shares | – | (322 | ) | ||||||||
| Net Decrease from Dividends and Distributions | (1,339 | ) | (3,478 | ) | |||||||
| Capital Share Transactions: | |||||||||||
| Shares sold | |||||||||||
| Service Shares | 12,671 | 8,966 | |||||||||
| Reinvested dividends and distributions | |||||||||||
| Service Shares | 1,339 | 3,478 | |||||||||
| Shares repurchased | |||||||||||
| Service Shares | (17,313 | ) | (11,878 | ) | |||||||
| Net Increase/(Decrease) from Capital Share Transactions | (3,303 | ) | 566 | ||||||||
| Net Increase/(Decrease) in Net Assets | (3,033 | ) | (926 | ) | |||||||
| Net Assets: | |||||||||||
| Beginning of period | 19,754 | 20,680 | |||||||||
| End of period | $ | 16,721 | $ | 19,754 | |||||||
| Undistributed net investment income/(loss)* | $ | 12 | $ | – | |||||||
* See Note 3 in Notes to Financial Statements.
(1) Formerly named Janus Aspen Risk-Managed Core Portfolio.
See Notes to Financial Statements.
12 Janus Aspen Series December 31, 2006
Financial Highlights – Service Shares
| For a share outstanding during each fiscal year or period ended December 31 | Janus Aspen INTECH Risk-Managed Core Portfolio(1) | ||||||||||||||||||
| 2006 | 2005 | 2004 | 2003(2) | ||||||||||||||||
| Net Asset Value, Beginning of Period | $ | 12.47 | $ | 13.60 | $12.49 | $ | 10.00 | ||||||||||||
| Income from Investment Operations: | |||||||||||||||||||
| Net investment income/(loss) | .02 | .04 | .02 | – | (3) | ||||||||||||||
| Net gain/(loss) on securities (both realized and unrealized) | 1.33 | 1.43 | 2.16 | 2.50 | |||||||||||||||
| Total from Investment Operations | 1.35 | 1.47 | 2.18 | 2.50 | |||||||||||||||
| Less Distributions: | |||||||||||||||||||
| Dividends (from net investment income)* | (.02 | ) | (.04 | ) | (.01 | ) | – | ||||||||||||
| Distributions (from capital gains)* | (1.09 | ) | (2.35 | ) | (1.06 | ) | (.01 | ) | |||||||||||
| Tax return of capital* | – | (.21 | ) | – | – | ||||||||||||||
| Total Distributions | (1.11 | ) | (2.60 | ) | (1.07 | ) | (.01 | ) | |||||||||||
| Net Asset Value, End of Period | $ | 12.71 | $ | 12.47 | $ | 13.60 | $ | 12.49 | |||||||||||
| Total Return** | 10.77 | % | 10.92 | % | 17.55 | % | 24.99 | % | |||||||||||
| Net Assets, End of Period (in thousands) | $ | 16,721 | $ | 19,754 | $ | 20,680 | $ | 11,337 | |||||||||||
| Average Net Assets for the Period (in thousands) | $ | 18,260 | $ | 19,174 | $ | 15,270 | $ | 8,414 | |||||||||||
| Ratio of Gross Expenses to Average Net Assets***(4) | 1.45 | % | 1.35 | % | 1.43 | % | 1.50 | % | |||||||||||
| Ratio of Net Expenses to Average Net Assets***(4) | 1.45 | % | 1.34 | % | 1.43 | % | 1.50 | % | |||||||||||
| Ratio of Net Investment Income/(Loss) to Average Net Assets*** | 0.17 | % | 0.42 | % | 0.14 | % | 0 | % | |||||||||||
| Portfolio Turnover Rate*** | 141 | % | 109 | % | 84 | % | 61 | % | |||||||||||
* See Note 3 in Notes to Financial Statements.
** Total return not annualized for periods of less than one full year.
*** Annualized for periods of less than one full year.
(1) Formerly named Janus Aspen Risk-Managed Core Portfolio.
(2) Fiscal period from January 2, 2003 (inception date) through December 31, 2003.
(3) Net investment income/(loss) aggregated less than $.01 on a per share basis for the fiscal period ended.
(4) See Note 4 in Notes to Financial Statements.
See Notes to Financial Statements.
Janus Aspen Series December 31, 2006 13
Notes to Schedule of Investments
| Lipper Variable Annuity Multi-Cap Core Funds | Funds that, by portfolio practice, invest in a variety of market capitalization ranges without concentrating 75% of their equity assets in any one market capitalization range over an extended period of time. Multi-cap funds typically have between 25% to 75% of their assets invested in companies with market capitalizations (on a three-year weighted basis) above 300% of the dollar-weighted median market capitalization of the middle 1,000 securities of the S&P SuperComposite 1500® Index. Multi-cap core funds have more latitude in the companies in which they invest. These funds typically have an average price-to-earnings ratio, price-to-book ratio, and three-year sales-per-share growth value, compared to the S&P SuperComposite 1500® Index. | ||||||
| S&P 500® Index | The Standard & Poor's Composite Index of 500 stocks, a widely recognized, unmanaged index of common stock prices. | ||||||
| REIT | Real Estate Investment Trust | ||||||
| U.S. Shares | Securities of foreign companies trading on an American Stock Exchange. | ||||||
*Non-income-producing security.
14 Janus Aspen Series December 31, 2006
Notes to Financial Statements
The following section describes the organization and significant accounting policies and provides more detailed information about the schedules and tables that appear throughout this report. In addition, the Notes to Financial Statements explain the methods used in preparing and presenting this report.
1. ORGANIZATION AND SIGNIFICANT ACCOUNTING POLICIES
Janus Aspen INTECH Risk-Managed Core Portfolio (formerly named Janus Aspen Risk-Managed Core Portfolio) (the "Portfolio") is a series fund. The Portfolio is part of Janus Aspen Series (the "Trust"), which is organized as a Delaware statutory trust and is registered under the Investment Company Act of 1940 (the "1940 Act") as an open-end management investment company. The Trust offers seventeen Portfolios, which include multiple series of shares, with differing investment objectives and policies. The Portfolio invests primarily in equity securities. The Portfolio is classified as diversified, as defined in the 1940 Act. The Portfolio is a no-load investment.
The Portfolio currently offers one class of shares: Service Shares. Service Shares are offered only in connection with investment in and payments under variable insurance contracts and to qualified retirement plans that require a fee from Portfolio assets to procure distribution and administrative services to contract owners and plan participants.
Janus Capital Management LLC ("Janus Capital") invested initial seed capital in the amount of $10,000 for the Portfolio on December 31, 2002. Janus Capital invested additional seed capital in the amount of $7,490,000 for the Portfolio on January 2, 2003. Janus Capital redeemed all seed capital in the Portfolio on February 27, 2006.
The following accounting policies have been consistently followed by the Portfolio and are in conformity with accounting principles generally accepted in the United States of America in the investment company industry.
Investment Valuation
Securities are valued at the last sales price or the official closing price for securities traded on a principal securities exchange (U.S. or foreign) and on the NASDAQ National Market. Securities traded on over-the-counter markets and listed securities for which no sales are reported are valued at the latest bid price (or yield equivalent thereof) obtained from one or more dealers transacting in a market for such securities or by a pricing service approved by the Portfolio's Trustees. Short-term securities with maturities of 60 days or less may be valued at amortized cost, which approximates market value. Debt securities with a remaining maturity of greater than 60 days are valued in accordance with the evaluated bid price supplied by the pricing service. The evaluated bid price supplied by the pricing service is an evaluation that reflects such factors as security prices, yields, maturities and ratings.
Foreign securities and currencies are converted to U.S. dollars using the applicable exchange rate in effect as of the daily close of the New York Stock Exchange ("NYSE"). When market quotations are not readily available or deemed unreliable, or events or circumstances that may affect the value of portfolio securities held by the Portfolio are identified between the closing of their principal markets and the time the net asset value ("NAV") is determined, securities may be valued at fair value as determined in good faith under procedures established by and under the supervision of the Portfolio's Trustees. The Portfolio may use a systematic fair valuation model provided by an independent third party to value international equity securities in order to adjust for stale pricing, which may occur between the close of certain foreign exchanges and the NYSE.
Investment Transactions and Investment Income
Investment transactions are accounted for as of the date purchased or sold (trade date). Dividend income is recorded on the ex-dividend date. Certain dividends from foreign securities will be recorded as soon as the Trust is informed of the dividend if such information is obtained subsequent to the ex-dividend date and may be subject to withholding taxes in these jurisdictions. Interest income is recorded on the accrual basis and includes amortization of premiums and accretion of discounts. Gains and losses are determined on the identified cost basis, which is the same basis used for federal income tax purposes.
Expenses
The Portfolio bears expenses incurred specifically on its behalf as well as a portion of general expenses, which may be allocated pro rata to the Portfolio.
Interfund Lending
Pursuant to an exemptive order received from the SEC, the Portfolio may be party to an interfund lending agreement between the Portfolio and other Janus Capital sponsored mutual funds, which permits it to borrow or lend cash at a rate beneficial to both the borrowing and lending funds. Outstanding borrowings from all sources totaling 10% or more of the borrowing Portfolio's total assets must be collateralized at 102% of the outstanding principal value of the loan; loans of less than 10% may be unsecured. During the fiscal year ended December 31, 2006, there were no outstanding interfund borrowing or lending arrangements for the Portfolio.
Futures Contracts
The Portfolio may enter into futures contracts. The Portfolio intends to use such derivative instruments primarily to hedge or protect from adverse movements in securities prices, currency rates or interest rates. The Portfolio may use futures contracts to gain exposure to the stock market pending investment of cash balances or to meet liquidity needs. The use of futures contracts may involve risks such as the possibility of illiquid markets or imperfect correlation between
Janus Aspen Series December 31, 2006 15
Notes to Financial Statements (continued)
the value of the contracts and the underlying securities, or that the counterparty will fail to perform its obligations.
Futures contracts are marked-to-market daily, and the daily variation margin is recorded as a receivable or payable on the Statement of Assets and Liabilities (if applicable). When a contract is closed, a realized gain or loss is recorded on the Statement of Operations equal to the difference between the opening and closing value of the contract. Generally, futures contracts are marked-to-market (i.e., treated as realized and subject to distribution) for federal income tax purposes at fiscal year end. Securities designated as collateral for market value on futures contracts are noted in the Schedule of Investments. Such collateral is in the possession of the Portfolio's custodian. As of December 31, 2006, the Portfolio was not invested in futures contracts.
Initial Public Offerings
The Portfolio may invest in initial public offerings ("IPOs"). IPOs and other investment techniques may have a magnified performance impact on a fund with a small asset base. The Portfolio may not experience similar performance as its assets grow.
Restricted Security Transactions
Restricted securities held by the Portfolio may not be sold except in exempt transactions or in a public offering registered under the Securities Act of 1933. The risk of investing in such securities is generally greater than the risk of investing in the securities of widely held, publicly traded companies. Lack of a secondary market and resale restrictions may result in the inability of the Portfolio to sell a security at a fair price and may substantially delay the sale of the security. In addition, these securities may exhibit greater price volatility than securities for which secondary markets exist.
Dividend Distributions
The Portfolio generally makes semiannual distributions of substantially all of its investment income and an annual distribution of its net realized capital gains (if any). The majority of dividends and net realized capital gains distributions from the Portfolio may be automatically reinvested into additional shares of the Portfolio, based upon the discretion of the shareholder.
Estimates
The preparation of financial statements in conformity with accounting principles generally accepted in the United States of America requires management to make estimates and assumptions that affect the reported amount of assets and liabilities and disclosure of contingent assets and liabilities at the date of the financial statements and the reported amounts of income and expenses during the reporting period. Actual results could differ from those estimates.
Federal Income Taxes
No provision for income taxes is included in the accompanying financial statements, as the Portfolio intends to distribute to shareholders all taxable investment income and realized gains and otherwise comply with Subchapter M of the Internal Revenue Code applicable to regulated investment companies.
New Accounting Pronouncements
In July 2006, the Financial Accounting Standards Board ("FASB") issued Interpretation No. 48, "Accounting for Uncertainty in Income Taxes – an Interpretation of FASB Statement No. 109" (the "Interpretation"). The Interpretation establishes for all entities, including pass-through entities such as the Portfolio, a minimum threshold for financial statement recognition of the benefit of positions taken in filing tax returns (including whether an entity is taxable in a particular jurisdiction), and requires certain expanded tax disclosures. A calendar year open-end or closed-end fund would implement the Interpretation no later than June 29, 2007 (the last business day of the semi-annual reporting period). Management has recently begun to evaluate the application of the Interpretation to the Portfolio, and is not in a position at this time to estimate the significance of its impact, if any, on the Portfolio's financial statements.
In September 2006, the FASB issued Statement of Financial Accounting Standards No. 157, "Fair Value Measurements" ("SFAS No. 157"), which defines fair value, establishes a framework for measuring fair value in generally accepted accounting principles, and expands disclosures about fair value measurements. SFAS No. 157 does not require new fair value measurements, but is applied to the extent that other accounting pronouncements require or permit fair value measurements. SFAS No. 157 emphasizes that fair value is a market-based measurement that should be determined based on the assumptions that market participants would use in pricing an asset or liability. Companies will be required to disclose the extent to which fair value is used to measure assets and liabilities, the inputs used to develop the measurements, and the effect for fiscal years beginning after November 15, 2007. Management is currently evaluating the potential impact the adopt ion of SFAS No. 157 will have on the Portfolio's financial condition and results of operations.
2. INVESTMENT ADVISORY AGREEMENTS AND OTHER TRANSACTIONS WITH AFFILIATES
The Portfolio pays a monthly advisory fee to Janus Capital based upon average daily net assets and calculated at the annual rate of 0.50%.
Effective January 1, 2006, the investment advisory fee rates changed from a fixed rate to a rate that adjusts upward or downward based upon the Portfolio's performance relative to a selected benchmark index. This change does not impact the current investment advisory fee until one year after the effective date when the performance adjustment takes effect.
Enhanced Investment Technologies LLC ("INTECH") serves as subadviser to the Portfolio. Janus Capital indirectly owns approximately 82.5% of the outstanding voting shares of
16 Janus Aspen Series December 31, 2006
INTECH. Janus Capital pays INTECH a subadvisory fee at the annual rate of 0.26% of average daily net assets from its management fee for managing the Portfolio.
Janus Services LLC ("Janus Services"), a wholly-owned subsidiary of Janus Capital, receives from the Portfolio a fee at an annual rate of up to 0.10% of the average daily net assets of Service Shares of the Portfolio, to compensate Janus Services for providing, or arranging for the provision of record keeping, subaccounting, and administrative services.
Janus Services receives certain out-of-pocket expenses for transfer agent services.
Janus Capital has agreed until at least May 1, 2008 to reimburse the Portfolio by the amount, if any, that the normal operating expenses in any fiscal year, including the investment advisory fee but excluding the distribution and shareholder servicing (12b-1) fees applicable to Service Shares, the administrative services fees applicable to Service Shares, brokerage commissions, interest, taxes and extraordinary expenses, exceed an annual rate of 1.10% of the average daily net assets of the Portfolio. The Portfolio is not required to repay any such waived fees in future years to Janus Capital.
Certain officers of the Portfolio may also be officers and/or directors of Janus Capital. Such officers receive no compensation from the Portfolio, except for the Portfolio's Chief Compliance Officer. Effective January 1, 2006, the Portfolio began reimbursing the adviser for a portion of the compensation paid to the Chief Compliance Officer of the Trust. Total compensation of $28 was paid by the Portfolio during the fiscal year ended December 31, 2006. The Portfolio's portion is reported as part of "Other Expenses" on the Statement of Operations.
The Board of Trustees has adopted a deferred compensation plan (the "Deferred Plan") for independent Trustees to elect to defer receipt of all or a portion of the annual compensation they are entitled to receive from the Portfolio. All deferred fees are credited to an account established in the name of the Trustees. The amounts credited to the account then increase or decrease, as the case may be, in accordance with the performance of one or more of the Janus funds that are selected by the Trustees. The account balance continues to fluctuate in accordance with the performance of the selected fund or funds until final payment of all amounts credited to the account. Trustees are allowed to change their designation of mutual funds from time to time. Amounts will be deferred until distributed in accordance to the Deferred Plan. No deferred fees were paid to any Trustee under the Deferred Plan during the fiscal year ended December 31, 2006.
For the fiscal year ended December 31, 2006, Janus Capital assumed $21,288 of legal, consulting and Trustee costs and fees incurred by the funds in Janus Investment Fund, Janus Aspen Series and Janus Adviser Series (the "Funds") in connection with the regulatory and civil litigation matters discussed in Note 7. These non-recurring costs were allocated to all Funds based upon the Funds' respective net assets as of July 31, 2004. Additionally, all future non-recurring costs will be allocated based upon the Funds' respective net assets on July 31, 2004. These non-recurring costs and costs assumed by Janus Capital are shown on the Statement of Operations.
Janus Distributors LLC, a wholly-owned subsidiary of Janus Capital, is a distributor of the Portfolio. Service Shares have adopted a Distribution and Shareholder Servicing Plan (the "Plan") pursuant to Rule 12b-1 under The 1940 Act. The Plan authorizes payments by the Portfolio in connection with the distribution of Service Shares at an annual rate of up to 0.25% of Service Shares' average daily net assets.
The Portfolio's expenses may be reduced by expense offsets from an unaffiliated custodian and/or transfer agent. Such credits or offsets are included in Expense and Fee Offset on the Statement of Operations. The transfer agent fee offsets received during the period reduce Transfer Agent Fees and Expenses. Custodian offsets received reduce Custodian Fees. The Portfolio could have employed the assets used by the custodian and/or transfer agent to produce income if it had not entered into an expense offset arrangement.
The Portfolio may invest in money market funds, including funds managed by Janus Capital. During the fiscal year ended December 31, 2006, the Portfolio recorded distributions from affiliated investment companies as affiliated dividend income, and had the following affiliated purchases and sales:
| Purchases Shares/Cost | Sales Shares/Cost | Dividend Income | Value at 12/31/06 | ||||||||||||||||
| Janus Aspen INTECH Risk-Managed Core Portfolio(1) | |||||||||||||||||||
| Janus Government Money Market Fund | $ | 34,463 | $ | 34,463 | $ | 14 | $ | – | |||||||||||
| Janus Institutional Cash Reserves Fund | 794,274 | 794,274 | 749 | – | |||||||||||||||
| Janus Money Market Fund | 720,669 | 720,669 | 1,024 | – | |||||||||||||||
| $ | 1,549,406 | $ | 1,549,406 | $ | 1,787 | $ | – | ||||||||||||
(1) Formerly named Janus Aspen Risk-Managed Core Portfolio.
Janus Aspen Series December 31, 2006 17
Notes to Financial Statements (continued)
3. FEDERAL INCOME TAX
The tax components of capital shown in the table below represent: (1) distribution requirements the Portfolio must satisfy under the income tax regulations; (2) losses or deductions the Portfolio may be able to offset against income and gains realized in future years; and (3) unrealized appreciation or depreciation of investments for federal income tax purposes.
Other book to tax differences in the current year primarily consist of foreign currency contract adjustments. The Portfolio has elected to treat gains and losses on forward foreign currency contracts as capital gains and losses. Other foreign currency gains and losses on debt instruments are treated as ordinary income for federal income tax purposes pursuant to Section 988 of the Internal Revenue Code.
| Portfolio | Undistributed Ordinary Income | Undistributed Long-Term Gains | Accumulated Capital Losses | Post October Deferral | Other Book to Tax Differences | Net Tax Appreciation/ (Depreciation) | |||||||||||||||||||||
| Janus Aspen INTECH Risk-Managed Core Portfolio(1) | $ | 11,850 | $ | 151,778 | $ | – | $ | – | $ | – | $ | 2,110,617 | |||||||||||||||
(1) Formerly named Janus Aspen Risk-Managed Core Portfolio.
The aggregate cost of investments and the composition of unrealized appreciation and depreciation of investment securities for federal income tax purposes as of December 31, 2006 are noted below.
Unrealized appreciation and unrealized depreciation in the table below exclude appreciation/depreciation on foreign currency translations. The primary difference between book and tax appreciation or depreciation of investments is wash sale loss deferrals.
| Portfolio | Federal Tax Cost | Unrealized Appreciation | Unrealized (Depreciation) | ||||||||||||
| Janus Aspen INTECH Risk-Managed Core Portfolio(1) | $14,544,599 | $ | 2,245,448 | $ | (134,831 | ) | |||||||||
(1) Formerly named Janus Aspen Risk-Managed Core Portfolio.
Income and capital gains distributions are determined in accordance with income tax regulations that may differ from accounting principles generally accepted in the United States of America. These differences are due to differing treatments for items such as net short-term gains, deferral of wash sale losses, foreign currency transactions, net investment losses and capital loss carryovers. Certain permanent differences such as tax returns of capital and net investment losses noted below have been reclassified to paid-in capital.
| For the fiscal year ended December 31, 2006 | Distributions | ||||||||||||||||||
| Portfolio | From Ordinary Income | From Long-Term Capital Gains | Tax Return of Capital | Net Investment Loss | |||||||||||||||
| Janus Aspen INTECH Risk-Managed Core Portfolio(1) | $ | 19,977 | $ | 1,319,180 | $ | – | $ | – | |||||||||||
(1) Formerly named Janus Aspen Risk-Managed Core Portfolio.
| For the fiscal period ended December 31, 2005 | Distributions | ||||||||||||||||||
| Portfolio | From Ordinary Income | From Long-Term Capital Gains | Tax Return of Capital | Net Investment Loss | |||||||||||||||
| Janus Aspen INTECH Risk-Managed Core Portfolio(1) | $ | 1,124,844 | $ | 2,031,127 | $ | 321,728 | $ | – | |||||||||||
(1) Formerly named Janus Aspen Risk-Managed Core Portfolio.
4. EXPENSE RATIOS
The expense ratios listed in the Financial Highlights reflect expenses prior to any expense offsets (gross expense ratio) and after expense offsets (net expense ratio). Both expense ratios reflect expenses after waivers (reimbursement). Listed below are the gross expense ratios for the Portfolio that would be in effect, absent the waiver of certain fees and offsets.
| For each fiscal year or period ended December 31 | Service Shares | ||||||||||||||||||
| Portfolio | 2006(1) | 2005(1) | 2004(1) | 2003(2) | |||||||||||||||
| Janus Aspen INTECH Risk-Managed Core Portfolio(3) | 1.86 | % | 1.35 | % | 1.43 | % | 2.62 | % | |||||||||||
(1) The effect of non-recurring costs assumed by Janus Capital (Note 2) is included in the ratio of operating expenses to average net assets without waivers and/or expense reimbursements and was less than 0.01%.
(2) Fiscal period from January 2, 2003 (inception date) through December 31, 2003.
(3) Formerly named Janus Aspen Risk-Managed Core Portfolio.
18 Janus Aspen Series December 31, 2006
5. CAPITAL SHARE TRANSACTIONS
| For the fiscal year ended December 31 | Janus Aspen INTECH Risk-Managed Core Portfolio(1) | ||||||||||
| (all numbers are in thousands) | 2006 | 2005 | |||||||||
| Transactions in Portfolio Shares – Service Shares: | |||||||||||
| Shares sold | 974 | 646 | |||||||||
| Reinvested dividends and distributions | 105 | 274 | |||||||||
| Shares repurchased | (1,348 | ) | (856 | ) | |||||||
| Net Increase/(Decrease) in Portfolio Shares | (269 | ) | 64 | ||||||||
| Shares Outstanding, Beginning of Period | 1,585 | 1,521 | |||||||||
| Shares Outstanding, End of Period | 1,316 | 1,585 | |||||||||
(1) Formerly named Janus Aspen Risk-Managed Core Portfolio.
6. PURCHASES AND SALES OF INVESTMENT SECURITIES
For the fiscal year ended December 31, 2006, the aggregate cost of purchases and proceeds from sales of investment securities (excluding short-term securities) were as follows:
| Portfolio | Purchases of Securities | Proceeds from Sales of Securities | Purchases of Long- Term U.S. Government Obligations | Proceeds from Sales of Long-Term U.S. Government Obligations | |||||||||||||||
| Janus Aspen INTECH Risk-Managed Core Portfolio(1) | $ | 25,667,944 | $ | 30,031,307 | $ | – | $ | – | |||||||||||
(1) Formerly named Janus Aspen Risk-Managed Core Portfolio.
7. PENDING LEGAL MATTERS
In the fall of 2003, the Securities and Exchange Commission ("SEC"), the Office of the New York State Attorney General ("NYAG"), the Colorado Attorney General ("COAG"), and the Colorado Division of Securities ("CDS") announced that they were investigating alleged frequent trading practices in the mutual fund industry. On August 18, 2004, Janus Capital announced that it had reached final settlements with the SEC, the NYAG, the COAG, and the CDS related to such regulators' investigations into Janus Capital's frequent trading arrangements.
A number of civil lawsuits were brought against Janus Capital and certain of its affiliates, the Janus funds, and related entities and individuals based on allegations similar to those announced by the above regulators and were filed in several state and federal jurisdictions. Such lawsuits alleged a variety of theories for recovery including, but not limited to, the federal securities laws, other federal statutes (including ERISA), and various common law doctrines. The Judicial Panel on Multidistrict Litigation transferred these actions to the U.S. District Court for the District of Maryland (the "Court") for coordinated proceedings. On September 29, 2004, five consolidated amended complaints were filed with the Court that generally include: (i) claims by a putative class of investors in certain Janus funds asserting claims on behalf of the investor class ( Marini, et al. v. Janus Investment Fund, et al., U.S. District Court, District of Maryland, Case No. 04-CV-00497); (ii) derivative claims by investors in certain Janus funds ostensibly on behalf of such funds (Steinberg et al. v. Janus Capital Management, LLC et al., U.S. District Court, District of Maryland, Case No. 04-CV-00518); (iii) claims on behalf of participants in the Janus 401(k) plan (Wangberger v. Janus Capital Group Inc., 401(k) Advisory Committee, et al., U.S. District Court, District of Maryland, Case No. JFM-05-2711); (iv) claims brought on behalf of shareholders of Janus Capital Group Inc. ("JCGI") on a derivative basis against the Board of Directors of JCGI (Chasen v. Whiston, et al., U.S. District Court, District of Maryland, Case No. 04-MD-00855); and (v) claims by a putative class of shareholders of JCGI asserting claims on behalf of the shareholders (Wiggins, et al. v. Janus Capital Group, Inc., et al., U.S. District Court, District of Maryland, Case No. 04-CV-00818). In addition, the following were also named as defendants in one or more of the actions: Janus Investment Fund ("JIF"), Janus Aspen Series ("JAS"), Janus Adviser Series ("JAD"), Janus Distributors LLC, Enhanced Investment Technologies, LLC ("INTECH"), Bay Isle Financial LLC ("Bay Isle"), Perkins, Wolf, McDonnell and Company, LLC ("Perkins"), the Advisory Committee of the Janus 401(k) plan, and the current or former directors of JCGI.
On August 25, 2005, the Court entered orders dismissing most of the claims asserted against Janus Capital and its affiliates by fund investors (actions (i) and (ii) described above), except certain claims under Section 10(b) of the Securities Exchange Act of 1934 and under Section 36(b) of the Investment Company Act of 1940, as amended (the "1940 Act"). On August 15, 2006, the complaint in the 401(k) plan class action (action (iii) described above) was dismissed by the
Janus Aspen Series December 31, 2006 19
Notes to Financial Statements (continued)
district court with prejudice; the plaintiff has appealed that dismissal decision to the United States Court of Appeals for the Fourth Circuit. The Court also dismissed the action against JCGI's Board of Directors without leave to amend (action (iv) described above). Finally, a Motion to Dismiss the action brought by JCGI shareholders (action (v) described above) is fully briefed and pending before the Court.
In addition to the lawsuits described above, the Auditor of the State of West Virginia ("Auditor"), in his capacity as securities commissioner, has initiated administrative proceedings against many of the defendants in the market timing cases (including JCGI and Janus Capital) and, as a part of its relief, is seeking disgorgement and other monetary relief based on similar market timing allegations (In the Matter of Janus Capital Group Inc. et al., Before the Securities Commissioner, State of West Virginia, Summary Order No. 05-1320). The respondents in these proceedings collectively sought a Writ of Prohibition in state court, which was denied. Their subsequent Petition for Appeal was also denied. Consequently, in September 2006, JCGI and Janus Capital filed their answer t o the Auditor's summary order instituting proceedings and requested a hearing. JCGI and Janus Capital, as well as other similarly situated defendants, continue to challenge the statutory authority of the Auditor to bring such an action. No further proceedings are currently scheduled.
In addition to the "market timing" actions described above, Janus Capital is a defendant in a consolidated lawsuit in the U.S. District Court for the District of Colorado challenging the investment advisory fees charged by Janus Capital to certain Janus funds (Walter Sins, et al. v. Janus Capital Management LLC, U.S. District Court, District of Colorado, Case No. 04-CV-01647-WDM-MEH; Michael Fleisher, et al. v. Janus Capital Management, LLC, 04-CV-02395-MSK-CBS). The action was filed in 2004 by fund investors asserting breach of fiduciary duty under Section 36(b) of the 1940 Act. The plaintiffs seek declaratory and injunctive relief and an unspecified amount of damages. The trial is scheduled to commence on May 21, 2007.
In 2001, Janus Capital's predecessor was also named as a defendant in a class action suit in the U.S. District Court for the Southern District of New York, alleging that certain underwriting firms and institutional investors violated antitrust laws in connection with initial public offerings (Pfeiffer v. Credit Suisse First Boston aka In re Initial Public Offering Antitrust Litigation, U.S. District Court, Southern District of New York, Case No. 01-CV-2014). The U.S. District Court dismissed the plaintiff's antitrust claims in November 2003; however, the U.S. Court of Appeals vacated that decision and remanded it for further proceedings. In March 2006, the defendants, including Janus Capital, filed a Petition for a Writ of Certiorari with the U.S. Supreme Court to review the decision of the U. S. Court of Appeals. In June 2006, the U.S. Supreme Court invited the U.S. Solicitor General to file a brief expressing the view of the United States, and in November 2006, the Solicitor General filed a brief expressing its view on the matter. The U.S. Supreme Court has granted the Petition for a Writ of Certiorari and the parties are in the process of briefing the matter for the U.S. Supreme Court.
Additional lawsuits may be filed against certain of the Janus funds, Janus Capital, and related parties in the future. Janus Capital does not currently believe that these pending actions will materially affect its ability to continue providing services it has agreed to provide to the Janus funds.
20 Janus Aspen Series December 31, 2006
Report of Independent Registered Public Accounting Firm
To the Trustees and Shareholders
of Janus Aspen INTECH Risk-Managed Core Portfolio
In our opinion, the accompanying statement of assets and liabilities, including the schedule of investments, and the related statements of operations and of changes in net assets and the financial highlights present fairly, in all material respects, the financial position of Janus Aspen INTECH Risk-Managed Core Portfolio (formerly Janus Aspen Risk-Managed Core Portfolio) (one of the portfolios constituting Janus Aspen Series, hereafter referred to as the "Portfolio") at December 31, 2006, the results of its operations for the year then ended, the changes in its net assets for each of the two years in the period then ended, and the financial highlights for each of the periods indicated, in conformity with accounting principles generally accepted in the United States of America. These financial statements and financial highlights (hereafter referred to as "financial statements") are the responsibility of the Portfolio's management; our respons ibility is to express an opinion on these financial statements based on our audits. We conducted our audits of these financial statements in accordance with the standards of the Public Company Accounting Oversight Board (United States). Those standards require that we plan and perform the audit to obtain reasonable assurance about whether the financial statements are free of material misstatement. An audit includes examining, on a test basis, evidence supporting the amounts and disclosures in the financial statements, assessing the accounting principles used and significant estimates made by management, and evaluating the overall financial statement presentation. We believe that our audits, which included confirmation of securities at December 31, 2006 by correspondence with the custodian, transfer agent and brokers, and the application of alternative auditing procedures where securities purchased had not been received, provide a reasona ble basis for our opinion.

PricewaterhouseCoopers LLP
Denver, Colorado
February 12, 2007
Janus Aspen Series December 31, 2006 21
Additional Information (unaudited)
PROXY VOTING POLICIES AND VOTING RECORD
A description of the policies and procedures that the Portfolio uses to determine how to vote proxies relating to its portfolio securities is available: (i) without charge, upon request, by calling 1-800-525-0020 (toll free); (ii) on the Portfolio's website at www.janus.com/proxyvoting; and (iii) on the SEC's website at http://www.sec.gov. Additionally, information regarding the Portfolio's proxy voting record for the most recent twelve-month period ended June 30, is also available, free of charge, through www.janus.com/proxyvoting and from the SEC's website at http://www.sec.gov.
QUARTERLY PORTFOLIO HOLDINGS
The Portfolio files its complete portfolio holdings (schedule of investments) with the SEC for the first and third quarters of each fiscal year on Form N-Q within 60 days of the end of such fiscal quarter. The Portfolio's Form N-Q: (i) is available on the SEC's website at http://www.sec.gov; (ii) may be reviewed and copied at the SEC's Public Reference Room in Washington, D.C. (information on the Public Reference Room may be obtained by calling 1-800-SEC-0330); and (iii) is available without charge, upon request, by calling Janus at 1-800-525-0020 (toll free).
APPROVAL OF ADVISORY AGREEMENTS DURING THE PERIOD
The Trustees of Janus Aspen Series, more than eighty-five percent of whom have never been affiliated with the Adviser ("Independent Trustees"), oversee the management of each of the Portfolios and, as required by law, determine annually whether to continue the investment advisory agreement for each Portfolio and the subadvisory agreements for the three Portfolios that utilize subadvisers.
In connection with their most recent consideration of those agreements for each of the Portfolios, the Trustees received and reviewed a substantial amount of information provided by Janus Capital (the "Adviser") and the respective subadvisers in response to requests of the Independent Trustees and their independent legal counsel. They also received and reviewed a considerable amount of information and analysis provided to the Trustees by their independent fee consultant. Throughout their consideration of the agreements the Independent Trustees were advised by their independent legal counsel. The Independent Trustees met on two separate occasions with management to consider the agreements, and at each of those meetings they also met separately in executive session with their independent legal counsel.
At a meeting held on December 20, 2006, based on their evaluation of the information provided by the Adviser, the subadvisers and the independent fee consultant and other information, the Trustees determined that the overall arrangements between each Portfolio and the Adviser were fair and reasonable in light of the nature, extent and quality of the services provided by the Adviser, its affiliates and the subadvisers, the fees charged for those services, and other matters that the Trustees considered relevant in the exercise of their business judgment. At that meeting all of the Trustees unanimously approved the continuation of the investment advisory agreement for each Portfolio, and the subadvisory agreement for each subadvised Portfolio, for the period from February 1, 2007 through February 1, 2008, subject to earlier termination as provided in each agreement.
In considering the continuation of those agreements, the Trustees reviewed and analyzed various factors that they determined were relevant, including the factors described below, none of which by itself was considered dispositive. However, the material factors and conclusions that formed basis for the Trustees' determination to approve the continuation of the agreements are discussed separately below.
Nature, Extent and Quality of Services
The Trustees reviewed the nature, extent and quality of the services of Janus Capital and the subadvisers to the Funds, taking into account the investment objective and strategy of each Portfolio and the knowledge the Trustees gained from their regular meetings with management on at least a quarterly basis and their ongoing review of information related to the Funds. In addition, the Trustees reviewed the resources and key personnel of Janus Capital and each subadviser, especially those who provide investment management services to the Portfolios. The Trustees also considered other services provided to the Portfolios by Janus Capital or the subadvisers, such as managing the execution of portfolio transactions and the selection of broker-dealers for those transactions, serving as the Portfolios' administrator, monitoring adherence to the Portfolios' investment restrictions, producing shareholder reports, providing support services for the Tru stees and Trustee committees, communicating with shareholders and overseeing the activities of other service providers, including monitoring compliance with various policies and procedures of the Portfolios and with applicable securities laws and regulations.
The Trustees concluded that: the nature, extent and quality of the services provided by Janus Capital or the subadviser to each Portfolio were appropriate and consistent with the terms of the respective advisory and subadvisory agreements; that, taking into account steps taken to address a small portion of the Portfolios whose performance lagged that of their peers for certain periods, the quality of those services had been
22 Janus Aspen Series December 31, 2006
consistent with or superior to quality norms in the industry; and that the Portfolios were likely to benefit from the continued provision of those services. They also concluded that each of Janus Capital and each subadviser had sufficient personnel, with the appropriate education and experience, to serve the Portfolios effectively and had demonstrated its continuing ability to attract and retain well-qualified personnel.
Performance of the Funds
The Trustees considered the performance results of each Portfolio over various time periods. They reviewed information comparing each Portfolio's performance with the performance of comparable funds and peer groups identified by Lipper Inc., an independent provider of investment company data, and with the Portfolio's benchmark. They concluded that the performance of most Portfolios was good to very good. Although the performance of some Portfolios lagged that of their peers for certain periods, the Trustees also concluded that Janus Capital had taken appropriate steps to address those instances of under-performance and that the more recent performance of most of those Portfolios had been improving.
Costs of Services Provided
The Trustees examined information on the fees and expenses of each Portfolio in comparison to similar information for other comparable funds as provided by Lipper. They also reviewed an analysis of that information provided by their independent fee consultant and noted that the rate of management (investment advisory and administrative) fees for most of the Portfolios, after contractual expense limitations, was below the mean management fee rate of the respective peer group of funds selected by Lipper.
The Trustees considered the methodology used by Janus Capital and each subadviser in determining compensation payable to portfolio managers, the competitive environment for investment management talent and the competitive market for mutual funds in different distribution channels. They concluded that the compensation methodology provided a good alignment of the interests of the portfolio managers with the interests of Portfolio shareholders.
The Trustees also reviewed management fees charged by Janus Capital to its separate account clients and to its subadvised funds (for which Janus Capital provides only portfolio management services). Although in most instances subadvisory and separate account fee rates for various investment strategies were lower than management fees for Portfolios having a similar strategy, the Trustees noted that Janus Capital performs significant additional services for the Portfolios that it does not provide to those other clients, including administrative services, oversight of the Portfolios' other service providers, trustee support, regulatory compliance and numerous other services, and that, in serving the Portfolios, Janus Capital assumes many legal risks that it does not assume in servicing its other clients. Moreover, they noted that the spread between the average fees charged to the Portfolios and the fees that Janus Capital charged to its separate account clients was significantly smaller than the average spread for such fees of other advisers, based on publicly available data and research conducted by their independent fee consultant.
In considering the fees charged by Janus Capital, the Trustees had previously negotiated with Janus Capital a temporary contingent waiver of a portion the investment advisory fee paid by Janus Aspen Worldwide Growth Portfolio to Janus Capital to provide for a possible reduction in the rate of advisory fee payable by the Portfolio for the period July 1, 2006 through January 31, 2007 if the investment performance of the Fund should lag that of its benchmark performance over the applicable performance measurement period. Commencing in February 2007, the previously approved performance-based fee schedule will become operative.
The Trustees reviewed information on the profitability of Janus Capital and its affiliates of their relationships with each Portfolio, as well as an explanation of the methodology utilized in allocating various expenses among the Portfolios and other clients. The Trustees also reviewed the financial statements of Janus Capital's parent company and its corporate structure. In their review, the Trustees considered whether Janus Capital and each subadviser receive adequate incentives to manage the Portfolios effectively. The Trustees recognized that profitability comparisons among fund managers are difficult because very little comparative information is publicly available and profitability of any manager is affected by numerous factors, including the organizational structure of the particular manager, the types of funds and other accounts it manages, possible other lines of business, the methodology for allocating expenses and the manager's ca pital structure and cost of capital. However, based on the information available and taking those factors into account, the Trustees concluded that Janus Capital's profitability with respect to each Portfolio in relation to the services rendered was not unreasonable.
The Trustees concluded that the management fees and other compensation payable by each Fund to Janus Capital and its affiliates, as well as the fees paid by Janus Capital to the subadvisers of subadvised Portfolios, were reasonable in relation to the nature and quality of the services provided, taking into account the fees charged by other advisers for
Janus Aspen Series December 31, 2006 23
Additional Information (unaudited) (continued)
managing comparable mutual funds with similar strategies and the fees Janus Capital and the subadviser charges to other clients. The Trustees also concluded that the overall expense ratio of each Portfolio was reasonable, taking into account the size of the Portfolio, the quality of services provided by Janus Capital and any subadviser, the investment performance of the Portfolio and any expense limitations agreed to by Janus Capital.
Economies of Scale
The Trustees considered information about the potential for Janus Capital to realize economies of scale as the assets of the Portfolios increase. They noted that, although most Portfolios pay advisory fees at a fixed rate as a percentage of net assets, without any breakpoints, the management fee paid by each Portfolio, after any contractual expense limitations, was below the mean management fee rate of the Portfolio's peer group selected by Lipper; and, for those Portfolios whose expenses are being reduced by the contractual expense limitations of Janus Capital, Janus Capital is subsidizing the Portfolios because they have not reached adequate scale. Moreover, as the assets of many of the Portfolios have declined in the past few years, the Portfolios have benefited from having advisory fee rates that have remained constant rather than increasing as assets decline. In addition, performance fee structures have been implemented for several Port folios that will cause the effective rate of advisory fees payable by such a Portfolio to vary depending on the investment performance of the Portfolio relative to its benchmark; and a few Portfolios have fee schedules with breakpoints and reduced fee rates above certain asset levels. The Trustees also noted that the Portfolios share directly in economies of scale through lower charges of third-party service providers based on the combined scale of all of the Portfolios. Based on all of the information they reviewed, the Trustees concluded that the current fee structure of each Portfolio was reasonable and that the current rates of fees do reflect a sharing between Janus Capital and the Portfolio of economies of scale at the current asset level of the Portfolio.
Other Benefits to Janus Capital
The Trustees also considered benefits that accrue to Janus Capital and its affiliates from their relationships with the Portfolios. They recognized that two affiliates of Janus Capital separately serve the Portfolios as transfer agent and distributor, respectively, and that the transfer agent receives compensation from the non-money market Portfolios for services provided. The Trustees also considered Janus Capital's use of commissions paid by Portfolios on their portfolio brokerage transactions to obtain proprietary research products and services benefiting the Portfolios and/or other clients of Janus Capital, as well as Janus Capital's agreement not to use any Portfolio's brokerage transactions to obtain third party research products or services. The Trustees concluded that Janus Capital's use of "soft" commission dollars to obtain proprietary research products and services was consistent with regulatory requirements and guidelines and was likely to benefit each Portfolio. The Trustees also concluded that, other than the services provided by Janus Capital and its affiliates pursuant to the agreements and the fees to be paid by each Portfolio therefor, the Portfolios and Janus Capital may potentially benefit from their relationship with each other in other ways. They concluded that Janus Capital benefits from the receipt of proprietary research products and services acquired through commissions paid on portfolio transactions of the Portfolios and that the Portfolios benefit from Janus Capital's receipt of those products and services as well as research products and services acquired through commissions paid by other clients of Janus Capital. They further concluded that success of any Portfolio could attract other business to Janus Capital or other Janus Funds and that the success of Janus Capital could enhance Janus Capital's ability to serve the Portfolios.
After full consideration of the above factors as well as other factors, all of the Trustees, including all of the Independent Trustees, concluded that the proposed continuation of the investment advisory agreement for each applicable Portfolio were in the best interest of the respective Portfolios and their shareholders.
24 Janus Aspen Series December 31, 2006
Explanations of Charts, Tables and
Financial Statements (unaudited)
1. PERFORMANCE OVERVIEWS
The performance overview graph compares the performance of a hypothetical $10,000 investment in the Portfolio with one or more widely used market indices. The hypothetical example does not represent the returns of any particular investment.
When comparing the performance of the Portfolio with an index, keep in mind that market indices do not include brokerage commissions that would be incurred if you purchased the individual securities in the index. They also do not include taxes payable on dividends and interest or operating expenses incurred if you maintained a Portfolio invested in the index.
Average annual total return is calculated by taking the growth or decline in value of an investment over a period of time, including reinvestment of any dividends, distributions and capital gains, then calculating the annual compounded percentage rate that would have produced the same result had the rate of growth been constant throughout the period. Average annual total return does not reflect the deduction of taxes that a shareholder would pay on Portfolio distributions or redemptions of Portfolio shares.
2. SCHEDULE OF INVESTMENTS
Following the performance overview section is the Portfolio's Schedule of Investments. This schedule reports the industry concentrations and types of securities held in the Portfolio on the last day of the reporting period. Securities are usually listed by type (common stock, corporate bonds, U.S. Government obligations, etc.) and by industry classification (banking, communications, insurance, etc.). Holdings are subject to change without notice.
The value of each security is quoted as of the last day of the reporting period. The value of securities denominated in foreign currencies is converted into U.S. dollars. Certain short-term investments maturing within 60 days are valued at amortized cost, which approximates market value.
A summary of investments by country is provided if the Portfolio invested in foreign securities. This summary reports the Portfolio's exposure to different countries by providing the percentage of securities invested in each country. The country of each security represents the country in which the company is incorporated.
2A. FORWARD CURRENCY CONTRACTS
A table listing forward currency contracts follows the Portfolio's Schedule of Investments (if applicable). Forward currency contracts are agreements to deliver or receive a preset amount of currency at a future date. Forward currency contracts are used to hedge against foreign currency risk in the Portfolio's long-term holdings. The table provides the name of the foreign currency, the settlement date of the contract, the amount of the contract, the value of the currency in U.S. dollars and the amount of unrealized gain or loss. The amount of unrealized gain or loss reflects the change in currency exchange rates from the time the contract was opened to the last day of the reporting period.
2B. FUTURES
A table listing futures contracts follows the Portfolio's Schedule of Investments (if applicable). Futures contracts are contracts that obligate the buyer to receive and the seller to deliver an instrument or money at a specified price on a specified date. Futures are used to hedge against adverse movements in securities prices, currency risk or interest rates.
The table provides the name of the contract, number of contracts held, the expiration date, the principal amount, value and the amount of unrealized gain or loss. The amount of unrealized gain or loss reflects the marked-to-market amount for the last day of the reporting period.
3. STATEMENT OF ASSETS AND LIABILITIES
This statement is often referred to as the "balance sheet." It lists the assets and liabilities of the Portfolio on the last day of the reporting period.
The Portfolio's assets are calculated by adding the value of the securities owned, the receivable for securities sold but not yet settled, the receivable for dividends declared but not yet received on stocks owned and the receivable for Portfolio shares sold to investors but not yet settled. The Portfolio's liabilities include payables for securities purchased but not yet settled, Portfolio shares redeemed but not yet paid and expenses owed but not yet paid. Additionally, there may be other assets and liabilities such as unrealized gain or loss on forward currency contracts.
The section entitled "Net Assets Consist of" breaks down the components of the Portfolio's net assets. Because the Portfolio must distribute substantially all earnings, you will notice that a significant portion of net assets is shareholder capital.
The last line of this statement reports the net asset value ("NAV") per share on the last day of the reporting period for each class of the Portfolio. The NAV is calculated by dividing the Portfolio's net assets (assets minus liabilities) by the number of shares outstanding.
4. STATEMENT OF OPERATIONS
This statement details the Portfolio's income, expenses, gains and losses on securities and currency transactions, and appreciation or depreciation of current Portfolio holdings.
Janus Aspen Series December 31, 2006 25
Explanations of Charts, Tables and
Financial Statements (unaudited) (continued)
The first section in this statement, entitled "Investment Income," reports the dividends earned from stocks and interest earned from interest-bearing securities in the Portfolio.
The next section reports the expenses and expense offsets incurred by the Portfolio, including the advisory fee paid to the investment adviser and transfer agent fees and expenses, and printing and postage for mailing statements, financial reports and prospectuses. Expense offsets, if any, are also shown.
The last section lists the increase or decrease in the value of securities held in the Portfolio. The Portfolio realizes a gain (or loss) when it sells its position in a particular security. An unrealized gain (or loss) refers to the change in net appreciation or depreciation of the Portfolio during the reporting period. "Net Realized and Unrealized Gain/(Loss) on Investments" is affected both by changes in the market value of Portfolio holdings and by gains (or losses) realized during the reporting period.
5. STATEMENT OF CHANGES IN NET ASSETS
This statement reports the increase or decrease in the Portfolio's net assets during the reporting period. Changes in the Portfolio's net assets are attributable to investment operations, dividends, distributions and capital share transactions. This is important to investors because it shows exactly what caused the Portfolio's net asset size to change during the period.
The first section summarizes the information from the Statement of Operations regarding changes in net assets due to the Portfolio's investment performance. The Portfolio's net assets may also change as a result of dividend and capital gains distributions to investors. If investors receive their dividends in cash, money is taken out of the Portfolio to pay the distribution. If investors reinvest their dividends, the Portfolio's net assets will not be affected. If you compare the Portfolio's "Net Decrease from Dividends and Distributions" to the "Reinvested dividends and distributions," you will notice that dividend distributions had little effect on the Portfolio's net assets. This is because the majority of Janus investors reinvest their distributions.
The reinvestment of dividends is included under "Capital Share Transactions." "Capital Shares" refers to the money investors contribute to the Portfolio through purchases or withdraw via redemptions. The Portfolio's net assets will increase and decrease in value as investors purchase and redeem shares from the Portfolio.
6. FINANCIAL HIGHLIGHTS
This schedule provides a per-share breakdown of the components that affect the Portfolio's NAV for current and past reporting periods of the Portfolio. Not only does this table provide you with total return, it also reports total distributions, asset size, expense ratios and portfolio turnover rate.
The first line in the table reflects the NAV per share at the beginning of the reporting period. The next line reports the net investment income per share, which comprises dividends and interest income earned on securities held by the Portfolio. Following is the total of gains/(losses), realized and unrealized. Dividends and distributions are then subtracted to arrive at the NAV per share at the end of the period. The next line reflects the average annual total return reported the last day of the period.
Also included are the expense ratios, or the percentage of net assets that are used to cover operating expenses during the period. Expense ratios vary for a number of reasons, including the differences in management fees, the average shareholder account size and the extent of foreign investments, which entail greater transaction costs.
The Portfolio's expenses may be reduced through expense reduction arrangements. These arrangements may include the use of balance credits or transfer agent fee offsets. The Statement of Operations reflects total expenses before any such offset, the amount of offset and the net expenses. The expense ratios listed in the Financial Highlights reflect total expenses prior to any expense offsets (gross expense ratio) and after the expense offsets (net expense ratio). Both expense ratios reflect expenses after waivers (reimbursements), if applicable.
The ratio of net investment income/(loss) summarizes the income earned less expenses, divided by the average net assets of the Portfolio during the reporting period. Don't confuse this ratio with the Portfolio's yield. The net investment income ratio is not a true measure of the Portfolio's yield because it doesn't take into account the dividends distributed to the Portfolio's investors.
The next ratio is the portfolio turnover rate, which measures the buying and selling activity in a Portfolio. Portfolio turnover is affected by market conditions, changes in the asset size of a Portfolio, the nature of the Portfolio's investments and the investment style of the portfolio manager. A 100% rate implies that an amount equal to the value of the entire portfolio is turned over in a year; a 50% rate means that an amount equal to the value of half the portfolio is traded in a year; and a 200% rate means that an amount equal to the value of the portfolio is traded every six months.
26 Janus Aspen Series December 31, 2006
Designation Requirements (unaudited)
For federal income tax purposes, the Portfolio designated the following for the year ended December 31, 2006:
Capital Gain Distributions
| Portfolio | |||||||
| Janus Aspen INTECH Risk-Managed Core Portfolio(1) | $ | 1,319,180 | |||||
(1) Formerly named Janus Aspen Risk-Managed Core Portfolio
Dividends Received Deduction Percentage
| Portfolio | |||||||
| Janus Aspen INTECH Risk-Managed Core Portfolio(1) | 100 | % | |||||
(1) Formerly named Janus Aspen Risk-Managed Core Portfolio
Janus Aspen Series December 31, 2006 27
Trustees and Officers (unaudited)
The Portfolio's Statement of Additional Information includes additional information about the Trustees and officers and is available, without charge, by calling 1-800-525-0020.
The following are the Trustees and officers of the Trust, together with a brief description of their principal occupations during the last five years (principal occupations for certain Trustees may include periods over five years).
Each Trustee has served in that capacity since he or she was originally elected or appointed. The Trustees do not serve a specified term of office. Each Trustee will hold office until the termination of the Trust or his or her earlier death, resignation, retirement, incapacity or removal. The retirement age for Trustees is 72. The Portfolio's Nominating and Governance Committee will consider nominees for the position of Trustee recommended by shareholders. Shareholders may submit the name of a candidate for consideration by the Committee by submitting their recommendations to the Trust's Secretary. Each Trustee is currently a Trustee of two other registered investment companies advised by Janus Capital: Janus Investment Fund and Janus Adviser Series. As of the date of this report, collectively, these three registered investment companies consist of 69 series or funds.
The Trust's officers are elected annually by the Trustees for a one-year term. Certain officers also serve as officers of Janus Investment Fund and Janus Adviser Series. Certain officers of the Portfolio may also be officers and/or directors of Janus Capital. Portfolio officers receive no compensation from the Portfolio, except for the Portfolio's Chief Compliance Officer, as authorized by the Trustees.
Trustees
| Name, Age and Address | Positions Held with Portfolio | Length of Time Served | Principal Occupations During the Past Five Years | Number of Portfolios in Fund Complex Overseen by Trustee | Other Directorships Held by Trustee | ||||||||||||||||||
| Independent Trustees | |||||||||||||||||||||||
| Dennis B. Mullen 151 Detroit Street Denver, CO 80206 Age 63 | Chairman Trustee | 3/04-Present 9/93-Present | Chief Executive Officer of Red Robin Gourmet Burgers, Inc. (since 2005). Formerly, private investor. | 69 | * | Chairman of the Board (since 2005) and Director of Red Robin Gourmet Burgers, Inc.; and Director of Janus Capital Funds Plc (Dublin-based, non-U.S. funds). | |||||||||||||||||
| Jerome S. Contro 151 Detroit Street Denver, CO 80206 Age 50 | Trustee | 12/05-Present | Partner of Tango Group, a private investment firm (since 1999). | 69 | Trustee and Chairman of RS Investment Trust (since 2001); Director of IZZE Beverages and MyFamily.com, Inc. (genealogical research website). | ||||||||||||||||||
| William F. McCalpin 151 Detroit Street Denver, CO 80206 Age 49 | Trustee | 6/02-Present | Private Investor. Formerly, Vice President of Asian Cultural Council and Executive Vice President and Chief Operating Officer of The Rockefeller Brothers Fund (a private family foundation). | 69 | Director of the F.B. Heron Foundation (a private grantmaking foundation). | ||||||||||||||||||
| John W. McCarter, Jr. 151 Detroit Street Denver, CO 80206 Age 68 | Trustee | 6/02-Present | President and Chief Executive Officer of The Field Museum of Natural History (Chicago, IL). | 69 | Chairman of the Board and Director of Divergence Inc. (biotechnology firm); Director of W.W. Grainger, Inc. (industrial distributor); WTTW (Chicago public television station) and the University of Chicago. | ||||||||||||||||||
28 Janus Aspen Series December 31, 2006
Trustees (cont.)
| Name, Age and Address | Positions Held with Portfolio | Length of Time Served | Principal Occupations During the Past Five Years | Number of Portfolios in Fund Complex Overseen by Trustee | Other Directorships Held by Trustee | ||||||||||||||||||
| Independent Trustees (cont.) | |||||||||||||||||||||||
| James T. Rothe 151 Detroit Street Denver, CO 80206 Age 63 | Trustee | 1/97-Present | Co-founder and Managing Director of Roaring Fork Capital Management, LLC (private investment in public equity firm); and Professor Emeritus of Business of the University of Colorado, Colorado Springs, CO (since 2004). Formerly, Professor of Business of the University of Colorado (2002-2004); and Distinguished Visiting Professor of Business (2001-2002) of Thunderbird University (American Graduate School of International Management), Glendale, AZ. | 69 | Director of Red Robin Gourmet Burgers, Inc. | ||||||||||||||||||
| William D. Stewart 151 Detroit Street Denver, CO 80206 Age 62 | Trustee | 9/93-Present | Corporate Vice President and General Manager of MKS Instruments – HPS Products, Boulder, CO (a manufacturer of vacuum fittings and valves). | 69 | N/A | ||||||||||||||||||
| Martin H. Waldinger 151 Detroit Street Denver, CO 80206 Age 68 | Trustee | 9/93-Present | Private Investor and Consultant to California Planned Unit Developments. Formerly, CEO and President of Marwal, Inc. (homeowner association management company). | 69 | N/A | ||||||||||||||||||
| Linda S. Wolf 151 Detroit Street Denver, CO 80206 Age 59 | Trustee | 12/05-Present | Retired. Formerly, Chairman and Chief Executive Officer of Leo Burnett (Worldwide) (advertising agency) (2001-2005). | 69 | Director of Wal-Mart, The Field Museum of Natural History (Chicago, IL), Children's Memorial Hospital (Chicago, IL), Chicago Council on Foreign Relations, Economic Club of Chicago, and InnerWorkings (a provider of print procurement solutions). | ||||||||||||||||||
| Interested Trustee | |||||||||||||||||||||||
| Thomas H. Bailey** 151 Detroit Street Denver, CO 80206 Age 69 | Trustee | 5/93-Present | Retired. Formerly, President (1978-2002) and Chief Executive Officer (1994-2002) of Janus Capital or Janus Capital Corporation; Chairman and Director (1978-2002) of Janus Capital Corporation; President and Director (1994-2002) of The Janus Foundation. | 69 | N/A | ||||||||||||||||||
* Mr. Mullen also serves as director of Janus Capital Funds Plc, consisting of 22 funds. Including Janus Capital Funds Plc and the 69 funds comprising the Janus Funds, Mr. Mullen oversees 91 funds.
** The Portfolio is treating Mr. Bailey as an "interested person" of the Trust by virtue of his past positions and continuing relationships with Janus Capital and ownership of shares of Janus Capital's parent company.
Janus Aspen Series December 31, 2006 29
Trustees and Officers (unaudited) (continued)
Officers
| Name, Age and Address | Positions Held with Portfolio | Term of Office* and Length of Time Served | Principal Occupations During the Past Five Years | ||||||||||||
| Stephanie Grauerholz-Lofton 151 Detroit Street Denver, CO 80206 Age 36 | Chief Legal Counsel and Secretary Vice President | 1/06-Present 03/06 - Present | Assistant Vice President of Janus Capital and Janus Distributors LLC; and Associate Counsel of Janus Capital. Formerly, Associate of Vedder, Price, Kaufman & Kammholz, P.C. (1999-2003). | ||||||||||||
| Kelley Abbott Howes 151 Detroit Street Denver, CO 80206 Age 41 | President and Chief Executive Officer | 1/06-Present | President of Janus Services LLC; Senior Vice President and General Counsel of Janus Capital; and Senior Vice President and Assistant General Counsel of Janus Distributors LLC. Formerly, Vice President (1999-2005) of Janus Distributors LLC; Senior Vice President and General Counsel (2004-2006), Vice President (2000-2004), and Assistant General Counsel (2002-2004) of Janus Services LLC; and Vice President and Assistant General Counsel (1999-2004) of Janus Capital. | ||||||||||||
| David R. Kowalski 151 Detroit Street Denver, CO 80206 Age 49 | Vice President and Chief Compliance Officer | 6/02-Present | Senior Vice President and Chief Compliance Officer of Janus Capital, Janus Distributors LLC, and Janus Services LLC; Chief Compliance Officer of Bay Isle Financial LLC; and Vice President of Enhanced Investment Technologies LLC. Formerly, Chief Compliance Officer of Enhanced Investment Technologies, LLC (2003-2005); Vice President of Janus Capital (2000-2005), Janus Distributors LLC (2000-2001), and Janus Services LLC (2004-2005); and Assistant Vice President of Janus Services LLC (2002-2004). | ||||||||||||
| Jesper Nergaard 151 Detroit Street Denver, CO 80206 Age 44 | Chief Financial Officer Vice President, Treasurer, and Principal Accounting Officer | 3/05-Present 2/05-Present | Vice President of Janus Capital. Formerly, Director of Financial Reporting for OppenheimerFunds, Inc. (2004-2005); Site Manager and First Vice President of Mellon Global Securities Services (2003); and Director of Fund Accounting, Project Development, and Training of INVESCO Funds Group (1994-2003). | ||||||||||||
* Officers are elected at least annually for a one-year term and may also be elected from time to time by the Trustees for an interim period.
30 Janus Aspen Series December 31, 2006
Notes
Janus Aspen Series December 31, 2006 31
Notes
32 Janus Aspen Series December 31, 2006
Notes
Janus Aspen Series December 31, 2006 33
Janus provides access to a wide range of investment disciplines.
Growth
Janus growth portfolios focus on companies believed to be the leaders in their respective industries, with solid management teams, expanding market share, margins and efficiencies.
Core
Janus core portfolios seek investments in more stable and predictable companies. These portfolios look for a strategic combination of steady growth and for certain portfolios, some degree of income.
Risk-Managed
Our risk-managed portfolios seek to outperform their respective indices while maintaining a risk profile equal to or lower than the index itself. Managed by INTECH (a Janus subsidiary), these portfolios use a mathematical process in an attempt to build a more "efficient" portfolio than the index.
Value
Janus value portfolios invest in companies they believe are poised for a turnaround or are trading at a significant discount to fair value. The goal is to gain unique insight into a company's true value and identify and evaluate potential catalysts that may unlock
shareholder value.
International & Global
Janus international and global portfolios seek to leverage Janus' research capabilities by taking advantage of inefficiencies in foreign markets, where accurate information and analytical insight are often at a premium.
Bond & Money Market
Janus bond portfolios attempt to provide less risk relative to equities while seeking to deliver a competitive total return through high current income and appreciation. Janus money market portfolios seek maximum current income consistent with stability of capital.
For more information about our funds, contact your investment professional or go to www.janus.com/info
Please consider the charges, risks, expenses and investment objectives carefully before investing. For a prospectus containing this and other information, please call Janus at 1-800-525-0020 or download the file from www.janus.com/info. Read it carefully before you invest or send money.
An investment in a money market portfolio is not insured or guaranteed by the Federal Deposit Insurance Corporation or any other government agency. Although the Portfolio seeks to preserve the value of your investment at $1.00 per share, it is possible to lose money by investing in the Portfolio.

151 Detroit Street
Denver, CO 80206
1-800-525-0020
Portfolio distributed by Janus Distributors LLC (1/07)
C-0207-169 109-02-718 01-07
2006 Annual Report
Janus Aspen Series
Janus Aspen INTECH Risk-Managed Growth Portfolio
Look Inside. . .
• Portfolio management perspective
• Investment strategy behind your portfolio
• Portfolio performance, characteristics and holdings

Table of Contents
| Useful Information About Your Portfolio Report | 1 | ||||||
| Management Commentary and Schedule of Investments | 2 | ||||||
| Statement of Assets and Liabilities | 11 | ||||||
| Statement of Operations | 12 | ||||||
| Statements of Changes in Net Assets | 13 | ||||||
| Financial Highlights | 14 | ||||||
| Notes to Schedule of Investments | 15 | ||||||
| Notes to Financial Statements | 16 | ||||||
| Report of Independent Registered Public Accounting Firm | 22 | ||||||
| Additional Information | 23 | ||||||
| Explanations of Charts, Tables and Financial Statements | 26 | ||||||
| Designation Requirements | 28 | ||||||
| Trustees and Officers | 29 | ||||||
Please consider the charges, risks, expenses and investment objectives carefully before investing. For a prospectus containing this and other information, please call Janus at 1-800-525-0020 or download the file from www.janus.com/info. Read it carefully before you invest or send money.
Useful Information About Your Portfolio Report
Management Commentary
The portfolio Management Commentary in this report includes valuable insight from the Portfolio's managers as well as statistical information to help you understand how your Portfolio's performance and characteristics stack up against those of comparable indices.
Please keep in mind that the opinions expressed by the Portfolio's managers in the Management Commentary are just that: opinions. They are a reflection of the managers' best judgment at the time this report was compiled, which was December 31, 2006. As the investing environment changes, so could the managers' opinions. The views are unique to the managers and aren't necessarily shared by their fellow employees or by Janus in general.
Portfolio Expenses
We believe it's important for our shareholders to have a clear understanding of Portfolio expenses and the impact they have on investment return.
The following is important information regarding the Portfolio's Expense Example, which appears in the Management Commentary within this Annual Report. Please refer to this information when reviewing the Expense Example for the Portfolio.
Example
As a shareholder of a Portfolio, you incur two types of costs: (1) transaction costs, including redemption fees (where applicable) (and any related exchange fees) and (2) ongoing costs, including management fees; distribution and shareholder servicing (12b-1) fees (applicable to Service Shares only); administrative services fees (applicable to Service Shares only); and other Portfolio expenses. The example is intended to help you understand your ongoing costs (in dollars) of investing in a Portfolio and to compare these costs with the ongoing costs of investing in other mutual funds. To do so, compare this 5% hypothetical example with the 5% hypothetical examples that appear in the shareholder reports of the other funds. The example is based upon an investment of $1,000 invested at the beginning of the period and held for the six-month period from July 1, 2006 to December 31, 2006.
Actual Expenses
The first line of the table in each example provides information about actual account values and actual expenses. You may use the information in this line, together with the amount you invested, to estimate the expenses that you paid over the period. Simply divide your account value by $1,000 (for example, an $8,600 account value divided by $1,000 = 8.6), then multiply the result by the number in the first line under the heading entitled "Expenses Paid During Period" to estimate the expenses you paid on your account during the period.
Hypothetical Example for Comparison Purposes
The second line of the table in each example provides information about hypothetical account values and hypothetical expenses based upon the Portfolio's actual expense ratio and an assumed rate of return of 5% per year before expenses, which is not the Portfolio's actual return. The hypothetical account values and expenses may not be used to estimate the actual ending account balance or expenses you paid for the period. You may use this information to compare the ongoing costs of investing in the Portfolio and other funds. To do so, compare this 5% hypothetical example with the 5% hypothetical examples that appear in the shareholder reports of the other funds.
Janus Capital Management LLC ("Janus Capital") has contractually agreed to waive the Portfolio's total operating expenses, excluding the distribution and shareholder servicing (12b-1) fees applicable to Service Shares, the administrative services fees applicable to Service Shares, brokerage commissions, interest, taxes and extraordinary expenses to certain limits until at least May 1, 2008. Expenses in the examples reflect application of these waivers. Had the waivers not been in effect, your expenses would have been higher. More information regarding the waivers is available in the Portfolio's prospectus.
Please note that the expenses shown in the tables are meant to highlight your ongoing costs only and do not reflect any transaction costs, such as redemption fees (where applicable) and any charges at the separate account level or contract level. Redemption fees are fully described in the prospectus. Therefore, the second line of each table is useful in comparing ongoing costs only, and will not help you determine the relative total costs of owning different funds. In addition, if these transaction costs and separate account or contract level charges were included, your costs would have been higher.
Janus Aspen Series December 31, 2006 1
Janus Aspen INTECH Risk-Managed Growth Portfolio
(unaudited)
Portfolio Snapshot
This portfolio uses a mathematically-based investment process that seeks to capitalize on the natural volatility of stock prices. The primary aim of this strategy is to outperform the benchmark index without increasing risk.
Performance Overview
For the 12 months ended December 31, 2006, Janus Aspen INTECH Risk-Managed Growth Portfolio's Service Shares returned 6.22%. This compares to a 9.07% gain posted by the Russell 1000® Growth Index, the Portfolio's benchmark.
Investment Strategy in This Environment
While fundamental analysis does not factor into our management of the Portfolio, fundamentals certainly have a significant impact on the general direction of the market in which we participate. The Portfolio's goal is to produce returns in excess of its benchmark with an equal or lesser amount of risk.
The Portfolio's mathematical investing process seeks to build a more efficient Portfolio than its benchmark, the Russell 1000® Growth Index. With a focus on risk management, investment decisions are governed by a mathematical investment process, which aims to deliver return over and above the Index over the long-term without assuming additional risk relative to the benchmark. This process does not attempt to predict the direction of the market, nor does it have a particular view of any company in the Portfolio.
Performance Review
Throughout the period, as stock prices naturally moved, we adjusted each comparable stock's weighting in the Portfolio in an attempt to keep the Portfolio more efficient than the Index, without increasing relative risk. We continued to implement the mathematical process in a disciplined manner during the period. While other factors may influence performance over the short term, we believe that the consistent application of our process will help the Portfolio perform well over the long term.
However, periods of underperformance such as the one we just experienced are inevitable and should be expected from time to time. From our perspective, the key is to keep these periods of underperformance both short in duration and mild in scope. The extent to which we are successful on that score will ultimately govern the longer-term success of the Portfolio.
Investment Strategy and Outlook
INTECH's mathematical, risk-managed investment process seeks to outperform the Russell 1000® Growth Index over the long-term, while attempting to control risk. We will continue to implement the process in a disciplined and deliberate manner. As a result, the Portfolio may experience underperformance during shorter time periods, but has a goal of outperformance over a three- to five-year time period. While managing risk will remain essential to our investment process, we will continue to make marginal improvements to the mathematical process, seeking an efficient Portfolio that offers better long-term results than its benchmark regardless of the market's direction.
Thank you for your investment in Janus Aspen INTECH Risk-Managed Growth Portfolio.
2 Janus Aspen Series December 31, 2006
Janus Aspen INTECH Risk-Managed Growth Portfolio
(unaudited)
Janus Aspen INTECH Risk-Managed Growth Portfolio At a Glance
5 Largest Equity Holdings – (% of Net Assets)
As of December 31, 2006
| General Electric Co. Diversified Operations | 2.2 | % | |||||
| Procter & Gamble Co. Cosmetics and Toiletries | 2.0 | % | |||||
| Merck & Company, Inc. Medical - Drugs | 1.4 | % | |||||
| Google, Inc. - Class A Web Portals/Internet Service Providers | 1.3 | % | |||||
| Colgate-Palmolive Co. Cosmetics and Toiletries | 1.3 | % | |||||
| 8.2 | % | ||||||
Asset Allocation – (% of Net Assets)
| As of December 31, 2006 | |||
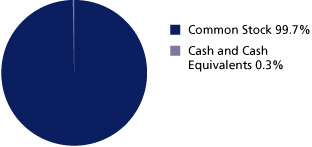
Top Country Allocations – (% of Investment Securities)
| As of December 31, 2006 | As of December 31, 2005 | ||||||
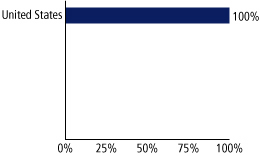 |  | ||||||
Janus Aspen Series December 31, 2006 3
Janus Aspen INTECH Risk-Managed Growth Portfolio
(unaudited)
Performance

Average Annual Total Return – for the periods ended December 31, 2006
| One Year | Since Inception* | ||||||||||
| Janus Aspen INTECH Risk-Managed Growth Portfolio – Service Shares | 6.22 | % | 12.39 | % | |||||||
| Russell 1000® Growth Index | 9.07 | % | 11.25 | % | |||||||
| Lipper Quartile | 3 | rd | 3 | rd | |||||||
| Lipper Ranking based on total returns for Variable Annuity Mid-Cap Growth Funds | 101/157 | 78/110 | |||||||||
Data presented represents past performance, which is no guarantee of future results. Investment results and principal value will fluctuate so that shares, when redeemed, may be worth more or less than their original cost. Due to market volatility, current performance may be higher or lower than the performance shown. Call 877.33JANUS or visit www.janus.com/info for performance current to the most recent month-end.
See Notes to Schedule of Investments for index definitions.
Total return includes reinvestment of dividends from net investment income and distributions from capital gains. The returns shown do not reflect the deduction of taxes that a shareholder would pay on Portfolio distributions or the redemption of Portfolio shares.
These returns do not reflect the charges and expenses of any particular insurance product or qualified plan. Returns shown would have been lower had they included insurance charges.
The weighting of securities within the Portfolio may differ significantly from the weightings within the index. The index is not available for direct investment; therefore its performance does not reflect the expenses associated with the active management of an actual Portfolio.
The proprietary mathematical process used by Enhanced Investment Technologies LLC ("INTECH") may not achieve the desired results. Since the Portfolio is regularly rebalanced, this may result in a higher portfolio turnover rate, higher expenses and potentially higher net taxable gains or losses for investors compared to a "buy and hold" or index portfolio strategy.
There is no assurance that the investment process will consistently lead to successful investing.
Janus Capital has contractually agreed to waive the Portfolio's total operating expenses to the levels indicated in the prospectus until at least May 1, 2008. Without such waivers total returns would have been lower.
INTECH is a subsidiary of Janus Capital Group Inc.
Lipper Inc. - A Reuters Company, is a nationally recognized organization that ranks the performance of mutual funds within a universe of funds that have similar investment objectives. Rankings are historical with capital gains and dividends reinvested.
Effective May 1, 2006, Janus Aspen Risk-Managed Growth Portfolio was renamed to Janus Aspen INTECH Risk-Managed Growth Portfolio.
See "Explanations of Charts, Tables and Financial Statements."
* The Portfolio's inception date – January 2, 2003
Portfolio Expenses
The example below shows you the ongoing costs (in dollars) of investing in your Portfolio and allows you to compare these costs with those of other mutual funds. Please refer to page 1 for a detailed explanation of the information presented in this chart.
| Expense Example - Service Shares | Beginning Account Value (7/1/06) | Ending Account Value (12/31/06) | Expenses Paid During Period (7/1/06-12/31/06)* | ||||||||||||
| Actual | $ | 1,000.00 | $ | 1,032.50 | $ | 7.43 | |||||||||
| Hypothetical (5% return before expenses) | $ | 1,000.00 | $ | 1,017.90 | $ | 7.37 | |||||||||
*Expenses are equal to the annualized expense ratio of 1.45%, multiplied by the average account value over the period, multiplied by 184/365 (to reflect the one-half year period). Expenses may include effect of contractual waivers by Janus Capital.
4 Janus Aspen Series December 31, 2006
Janus Aspen INTECH Risk-Managed Growth Portfolio
Schedule of Investments
As of December 31, 2006
| Shares or Principal Amount | Value | ||||||||||
| Common Stock - 99.7% | |||||||||||
| Advertising Agencies - 0.5% | |||||||||||
| 500 | Omnicom Group, Inc. | $ | 52,270 | ||||||||
| Advertising Sales - 0.3% | |||||||||||
| 500 | Lamar Advertising Co.* | 32,695 | |||||||||
| Aerospace and Defense - 2.0% | |||||||||||
| 700 | Boeing Co. | 62,188 | |||||||||
| 800 | Lockheed Martin Corp. | 73,656 | |||||||||
| 300 | Northrop Grumman Corp. | 20,310 | |||||||||
| 600 | Raytheon Co. | 31,680 | |||||||||
| 300 | Rockwell Collins, Inc. | 18,987 | |||||||||
| 206,821 | |||||||||||
| Aerospace and Defense - Equipment - 0.3% | |||||||||||
| 500 | United Technologies Corp. | 31,260 | |||||||||
| Agricultural Chemicals - 0.2% | |||||||||||
| 300 | Monsanto Co. | 15,759 | |||||||||
| Airlines - 1.1% | |||||||||||
| 700 | AMR Corp.* | 21,161 | |||||||||
| 1,100 | Continental Airlines, Inc. - Class B* | 45,375 | |||||||||
| 2,100 | Southwest Airlines Co. | 32,172 | |||||||||
| 200 | US Airways Group, Inc.* | 10,770 | |||||||||
| 109,478 | |||||||||||
| Applications Software - 1.8% | |||||||||||
| 200 | Citrix Systems, Inc.* | 5,410 | |||||||||
| 1,500 | Intuit, Inc.* | 45,765 | |||||||||
| 4,300 | Microsoft Corp. | 128,398 | |||||||||
| 200 | Red Hat, Inc.* | 4,600 | |||||||||
| 184,173 | |||||||||||
| Audio and Video Products - 0.1% | |||||||||||
| 100 | Harman International Industries, Inc. | 9,991 | |||||||||
| Automotive - Medium and Heavy Duty Trucks - 0.3% | |||||||||||
| 600 | Oshkosh Truck Corp. | 29,052 | |||||||||
| 100 | PACCAR, Inc. | 6,490 | |||||||||
| 35,542 | |||||||||||
| Automotive - Truck Parts and Equipment - Original - 0.5% | |||||||||||
| 600 | Johnson Controls, Inc. | 51,552 | |||||||||
| Batteries and Battery Systems - 0.4% | |||||||||||
| 600 | Energizer Holdings, Inc.* | 42,594 | |||||||||
| Beverages - Non-Alcoholic - 1.7% | |||||||||||
| 500 | Coca-Cola Co. | 24,125 | |||||||||
| 400 | Hansen Natural Corp.* | 13,472 | |||||||||
| 900 | Pepsi Bottling Group, Inc. | 27,819 | |||||||||
| 1,800 | PepsiCo, Inc. | 112,590 | |||||||||
| 178,006 | |||||||||||
| Beverages - Wine and Spirits - 0.7% | |||||||||||
| 1,000 | Brown-Forman Corp. - Class B | 66,240 | |||||||||
| 100 | Constellation Brands, Inc. - Class A* | 2,902 | |||||||||
| 69,142 | |||||||||||
| Brewery - 0.3% | |||||||||||
| 600 | Anheuser-Busch Companies, Inc. | 29,520 | |||||||||
| Broadcast Services and Programming - 0.5% | |||||||||||
| 100 | Discovery Holding Co. - Class A* | 1,609 | |||||||||
| 800 | Liberty Global, Inc. - Class A* | 23,320 | |||||||||
| 1,000 | Liberty Media Holding Corp.* | 21,570 | |||||||||
| 46,499 | |||||||||||
| Shares or Principal Amount | Value | ||||||||||
| Building - Mobile Home and Manufactured Homes - 0% | |||||||||||
| 100 | Thor Industries, Inc. | $ | 4,399 | ||||||||
| Cable Television - 1.8% | |||||||||||
| 1,400 | Cablevision Systems New York Group - Class A | 39,872 | |||||||||
| 1,300 | Comcast Corp. - Class A* | 55,029 | |||||||||
| 3,100 | DIRECTV Group, Inc.* | 77,314 | |||||||||
| 500 | EchoStar Communications Corp. - Class A* | 19,015 | |||||||||
| 191,230 | |||||||||||
| Casino Hotels - 0.8% | |||||||||||
| 400 | Las Vegas Sands Corp.* | 35,792 | |||||||||
| 100 | MGM Mirage* | 5,735 | |||||||||
| 400 | Wynn Resorts, Ltd. | 37,540 | |||||||||
| 79,067 | |||||||||||
| Casino Services - 1.2% | |||||||||||
| 2,700 | International Game Technology | 124,740 | |||||||||
| Cellular Telecommunications - 0.1% | |||||||||||
| 200 | Leap Wireless International, Inc.* | 11,894 | |||||||||
| Chemicals - Diversified - 0.2% | |||||||||||
| 400 | E.I. du Pont de Nemours and Co. | 19,484 | |||||||||
| 100 | Rohm & Haas Co. | 5,112 | |||||||||
| 24,596 | |||||||||||
| Chemicals - Specialty - 0.6% | |||||||||||
| 1,300 | Ecolab, Inc. | 58,760 | |||||||||
| 100 | Sigma-Aldrich Corp. | 7,772 | |||||||||
| 66,532 | |||||||||||
| Coatings and Paint Products - 0.1% | |||||||||||
| 200 | Sherwin-Williams Co. | 12,716 | |||||||||
| Commercial Banks - 0.3% | |||||||||||
| 300 | Commerce Bancorp, Inc. | 10,581 | |||||||||
| 100 | Cullen/Frost Bankers, Inc. | 5,582 | |||||||||
| 400 | East West Bancorp, Inc. | 14,168 | |||||||||
| 30,331 | |||||||||||
| Commercial Services - 0.7% | |||||||||||
| 1,000 | Alliance Data Systems Corp.* | 62,470 | |||||||||
| 100 | Convergys Corp.* | 2,378 | |||||||||
| 200 | Iron Mountain, Inc.* | 8,268 | |||||||||
| 73,116 | |||||||||||
| Commercial Services - Finance - 1.2% | |||||||||||
| 1,100 | Moody's Corp. | 75,966 | |||||||||
| 800 | Paychex, Inc. | 31,632 | |||||||||
| 900 | Western Union Co. | 20,178 | |||||||||
| 127,776 | |||||||||||
| Computer Services - 1.1% | |||||||||||
| 200 | Ceridian Corp.* | 5,596 | |||||||||
| 600 | Cognizant Technology Solutions Corp.* | 46,296 | |||||||||
| 500 | DST Systems, Inc.* | 31,315 | |||||||||
| 400 | Electronic Data Systems Corp. | 11,020 | |||||||||
| 300 | FactSet Research Systems, Inc. | 16,944 | |||||||||
| 111,171 | |||||||||||
| Computers - 1.4% | |||||||||||
| 300 | Apple Computer, Inc.* | 25,452 | |||||||||
| 2,200 | Hewlett-Packard Co. | 90,618 | |||||||||
| 300 | IBM Corp. | 29,145 | |||||||||
| 145,215 | |||||||||||
See Notes to Schedule of Investments and Financial Statements.
Janus Aspen Series December 31, 2006 5
Janus Aspen INTECH Risk-Managed Growth Portfolio
Schedule of Investments
As of December 31, 2006
| Shares or Principal Amount | Value | ||||||||||
| Computers - Integrated Systems - 0.3% | |||||||||||
| 400 | Diebold, Inc. | $ | 18,640 | ||||||||
| 300 | NCR Corp.* | 12,828 | |||||||||
| 31,468 | |||||||||||
| Computers - Memory Devices - 0.3% | |||||||||||
| 700 | Network Appliance, Inc.* | 27,496 | |||||||||
| 100 | SanDisk Corp.* | 4,303 | |||||||||
| 100 | Western Digital Corp.* | 2,046 | |||||||||
| 33,845 | |||||||||||
| Computers - Peripheral Equipment - 0.3% | |||||||||||
| 400 | Lexmark International Group, Inc. - Class A* | 29,280 | |||||||||
| Consulting Services - 0.4% | |||||||||||
| 500 | Corporate Executive Board Co. | 43,850 | |||||||||
| Consumer Products - Miscellaneous - 0.1% | |||||||||||
| 200 | Kimberly-Clark Corp. | 13,590 | |||||||||
| Containers - Paper and Plastic - 0.5% | |||||||||||
| 100 | Packaging Corporation of America | 2,210 | |||||||||
| 1,500 | Pactiv Corp.* | 53,535 | |||||||||
| 55,745 | |||||||||||
| Cosmetics and Toiletries - 4.0% | |||||||||||
| 200 | Alberto-Culver Co. | 4,290 | |||||||||
| 600 | Avon Products, Inc. | 19,824 | |||||||||
| 2,100 | Colgate-Palmolive Co. | 137,004 | |||||||||
| 300 | Estee Lauder Companies, Inc. - Class A | 12,246 | |||||||||
| 800 | International Flavors & Fragrances, Inc. | 39,328 | |||||||||
| 3,242 | Procter & Gamble Co. | 208,363 | |||||||||
| 421,055 | |||||||||||
| Data Processing and Management - 1.4% | |||||||||||
| 400 | Acxiom Corp. | 10,260 | |||||||||
| 1,000 | Automatic Data Processing, Inc. | 49,250 | |||||||||
| 100 | Dun & Bradstreet Corp.* | 8,279 | |||||||||
| 100 | Fidelity National Information Services, Inc. | 4,009 | |||||||||
| 800 | First Data Corp. | 20,416 | |||||||||
| 100 | Global Payments, Inc. | 4,630 | |||||||||
| 100 | MasterCard, Inc. - Class A | 9,849 | |||||||||
| 400 | MoneyGram International, Inc. | 12,544 | |||||||||
| 400 | SEI Investments Co. | 23,824 | |||||||||
| 143,061 | |||||||||||
| Dental Supplies and Equipment - 0.2% | |||||||||||
| 600 | Dentsply International, Inc. | 17,910 | |||||||||
| Diagnostic Kits - 0.3% | |||||||||||
| 400 | IDEXX Laboratories, Inc.* | 31,720 | |||||||||
| Dialysis Centers - 0% | |||||||||||
| 50 | Davita, Inc.* | 2,844 | |||||||||
| Disposable Medical Products - 0.2% | |||||||||||
| 300 | C.R. Bard, Inc. | 24,891 | |||||||||
| Distribution/Wholesale - 0.2% | |||||||||||
| 100 | Fastenal Co. | 3,588 | |||||||||
| 200 | WESCO International, Inc.* | 11,762 | |||||||||
| 15,350 | |||||||||||
| Diversified Operations - 4.3% | |||||||||||
| 400 | Brink's Co. | 25,568 | |||||||||
| 400 | Carlisle Companies, Inc. | 31,400 | |||||||||
| 400 | Danaher Corp. | 28,976 | |||||||||
| 1,000 | Dover Corp. | 49,020 | |||||||||
| 6,200 | General Electric Co. | 230,701 | |||||||||
| Shares or Principal Amount | Value | ||||||||||
| Diversified Operations - (continued) | |||||||||||
| 100 | Honeywell International, Inc. | $ | 4,524 | ||||||||
| 300 | Leggett & Platt, Inc. | 7,170 | |||||||||
| 500 | Parker Hannifin Corp. | 38,440 | |||||||||
| 200 | PPG Industries, Inc. | 12,842 | |||||||||
| 200 | Textron, Inc. | 18,754 | |||||||||
| 447,395 | |||||||||||
| Diversified Operations - Commercial Services - 0.5% | |||||||||||
| 1,600 | ARAMARK Corp.- Class B | 53,520 | |||||||||
| E-Commerce/Products - 0.3% | |||||||||||
| 500 | Nutri/Syestem, Inc.* | 31,695 | |||||||||
| E-Commerce/Services - 0.2% | |||||||||||
| 1,500 | Emdeon Corp.* | 18,585 | |||||||||
| 100 | IAC/InterActiveCorp* | 3,716 | |||||||||
| 22,301 | |||||||||||
| Electric - Generation - 0.4% | |||||||||||
| 1,900 | AES Corp.* | 41,876 | |||||||||
| Electric - Integrated - 1.2% | |||||||||||
| 1,000 | Allegheny Energy, Inc.* | 45,910 | |||||||||
| 100 | Constellation Energy Group, Inc. | 6,887 | |||||||||
| 100 | DPL, Inc. | 2,778 | |||||||||
| 900 | Exelon Corp. | 55,701 | |||||||||
| 300 | TXU Corp. | 16,263 | |||||||||
| 127,539 | |||||||||||
| Electric Products - Miscellaneous - 1.4% | |||||||||||
| 2,200 | Emerson Electric Co. | 96,998 | |||||||||
| 1,600 | Molex, Inc. | 50,608 | |||||||||
| 147,606 | |||||||||||
| Electronic Components - Semiconductors - 1.0% | |||||||||||
| 1,500 | Agere Systems, Inc.* | 28,755 | |||||||||
| 500 | Micron Technology, Inc.* | 6,980 | |||||||||
| 700 | NVIDIA Corp.* | 25,907 | |||||||||
| 2,100 | QLogic Corp.* | 46,032 | |||||||||
| 107,674 | |||||||||||
| Electronic Connectors - 0.4% | |||||||||||
| 500 | Amphenol Corp. - Class A | 31,040 | |||||||||
| 300 | Thomas & Betts Corp.* | 14,184 | |||||||||
| 45,224 | |||||||||||
| Electronic Forms - 0.1% | |||||||||||
| 280 | Adobe Systems, Inc.* | 11,514 | |||||||||
| Electronic Measuring Instruments - 0.3% | |||||||||||
| 100 | Agilent Technologies, Inc.* | 3,485 | |||||||||
| 300 | Tektronix, Inc. | 8,751 | |||||||||
| 300 | Trimble Navigation, Ltd.* | 15,219 | |||||||||
| 27,455 | |||||||||||
| Energy - Alternate Sources - 0.2% | |||||||||||
| 900 | Covanta Holding Corp.* | 19,836 | |||||||||
| Engines - Internal Combustion - 0.3% | |||||||||||
| 300 | Cummins, Inc. | 35,454 | |||||||||
| Enterprise Software/Services - 1.3% | |||||||||||
| 3,900 | BEA Systems, Inc.* | 49,062 | |||||||||
| 1,100 | BMC Software, Inc.* | 35,420 | |||||||||
| 3,057 | Oracle Corp.* | 52,397 | |||||||||
| 136,879 | |||||||||||
See Notes to Schedule of Investments and Financial Statements.
6 Janus Aspen Series December 31, 2006
Schedule of Investments
As of December 31, 2006
| Shares or Principal Amount | Value | ||||||||||
| Fiduciary Banks - 1.1% | |||||||||||
| 100 | Bank of New York Company, Inc. | $ | 3,937 | ||||||||
| 300 | Mellon Financial Corp. | 12,645 | |||||||||
| 800 | Northern Trust Corp. | 48,552 | |||||||||
| 700 | State Street Corp. | 47,208 | |||||||||
| 112,342 | |||||||||||
| Finance - Consumer Loans - 0.5% | |||||||||||
| 600 | First Marblehead Corp. | 32,790 | |||||||||
| 400 | SLM Corp. | 19,508 | |||||||||
| 52,298 | |||||||||||
| Finance - Credit Card - 0.1% | |||||||||||
| 200 | American Express Co. | 12,134 | |||||||||
| Finance - Investment Bankers/Brokers - 2.3% | |||||||||||
| 100 | Charles Schwab Corp. | 1,934 | |||||||||
| 600 | Goldman Sachs Group, Inc. | 119,610 | |||||||||
| 600 | Merrill Lynch & Company, Inc. | 55,860 | |||||||||
| 700 | Morgan Stanley Co. | 57,001 | |||||||||
| 234,405 | |||||||||||
| Finance - Mortgage Loan Banker - 0.2% | |||||||||||
| 300 | Freddie Mac | 20,370 | |||||||||
| Finance - Other Services - 1.3% | |||||||||||
| 100 | CBOT Holdings, Inc. - Class A* | 15,147 | |||||||||
| 200 | Chicago Mercantile Exchange Holdings, Inc. | 101,950 | |||||||||
| 200 | IntercontinentalExchange, Inc.* | 21,580 | |||||||||
| 138,677 | |||||||||||
| Financial Guarantee Insurance - 0.1% | |||||||||||
| 100 | Ambac Financial Group, Inc. | 8,907 | |||||||||
| Food - Diversified - 2.1% | |||||||||||
| 1,300 | Campbell Soup Co. | 50,557 | |||||||||
| 600 | General Mills, Inc. | 34,560 | |||||||||
| 1,300 | H.J. Heinz Co. | 58,513 | |||||||||
| 500 | Kellogg Co. | 25,030 | |||||||||
| 1,200 | McCormick & Company, Inc. | 46,272 | |||||||||
| 214,932 | |||||||||||
| Food - Retail - 0.1% | |||||||||||
| 400 | Kroger Co. | 9,228 | |||||||||
| Food - Wholesale/Distribution - 0.2% | |||||||||||
| 600 | Sysco Corp. | 22,056 | |||||||||
| Garden Products - 0.1% | |||||||||||
| 200 | Toro Co. | 9,326 | |||||||||
| Gold Mining - 0% | |||||||||||
| 100 | Newmont Mining Corp. | 4,515 | |||||||||
| Hazardous Waste Disposal - 0.2% | |||||||||||
| 300 | Stericycle, Inc.* | 22,650 | |||||||||
| Health Care Cost Containment - 0.3% | |||||||||||
| 600 | McKesson Corp. | 30,420 | |||||||||
| Home Decoration Products - 0.2% | |||||||||||
| 600 | Newell Rubbermaid, Inc. | 17,370 | |||||||||
| Hospital Beds and Equipment - 0.2% | |||||||||||
| 400 | Hillenbrand Industries, Inc. | 22,772 | |||||||||
| Hotels and Motels - 0.3% | |||||||||||
| 500 | Hilton Hotels Corp. | 17,450 | |||||||||
| 300 | Marriott International, Inc. - Class A | 14,316 | |||||||||
| 31,766 | |||||||||||
| Shares or Principal Amount | Value | ||||||||||
| Human Resources - 0.5% | |||||||||||
| 700 | Manpower, Inc. | $ | 52,451 | ||||||||
| 100 | Robert Half International, Inc. | 3,712 | |||||||||
| 56,163 | |||||||||||
| Identification Systems and Devices - 0.1% | |||||||||||
| 600 | Symbol Technologies, Inc. | 8,964 | |||||||||
| Industrial Automation and Robotics - 0.1% | |||||||||||
| 100 | Rockwell Automation, Inc. | 6,108 | |||||||||
| Industrial Gases - 0.1% | |||||||||||
| 200 | Air Products and Chemicals, Inc. | 14,056 | |||||||||
| Instruments - Controls - 0.7% | |||||||||||
| 300 | Mettler-Toledo International, Inc.* | 23,655 | |||||||||
| 1,100 | Thermo Electron Corp.* | 49,819 | |||||||||
| 73,474 | |||||||||||
| Instruments - Scientific - 0.5% | |||||||||||
| 1,400 | Applera Corp. - Applied Biosystems Group | 51,366 | |||||||||
| Insurance Brokers - 0.3% | |||||||||||
| 1,000 | Brown & Brown, Inc. | 28,210 | |||||||||
| Internet Infrastructure Software - 1.0% | |||||||||||
| 2,000 | Akamai Technologies, Inc.* | 106,240 | |||||||||
| Internet Security - 0.1% | |||||||||||
| 100 | McAfee, Inc.* | 2,838 | |||||||||
| 300 | Symantec Corp.* | 6,255 | |||||||||
| 9,093 | |||||||||||
| Investment Management and Advisory Services - 2.0% | |||||||||||
| 300 | Affiliated Managers Group, Inc.* | 31,539 | |||||||||
| 300 | BlackRock, Inc. | 45,570 | |||||||||
| 100 | Eaton Vance Corp. | 3,301 | |||||||||
| 400 | Franklin Resources, Inc. | 44,068 | |||||||||
| 150 | Legg Mason, Inc. | 14,258 | |||||||||
| 700 | Nuveen Investments - Class A | 36,316 | |||||||||
| 700 | T. Rowe Price Group, Inc. | 30,639 | |||||||||
| 205,691 | |||||||||||
| Life and Health Insurance - 0.4% | |||||||||||
| 800 | AFLAC, Inc. | 36,800 | |||||||||
| 100 | Prudential Financial, Inc. | 8,586 | |||||||||
| 45,386 | |||||||||||
| Machine Tools and Related Products - 0.2% | |||||||||||
| 400 | Lincoln Electric Holdings, Inc. | 24,168 | |||||||||
| Machinery - Construction and Mining - 0.3% | |||||||||||
| 300 | Caterpillar, Inc. | 18,399 | |||||||||
| 200 | Terex Corp.* | 12,916 | |||||||||
| 31,315 | |||||||||||
| Machinery - Farm - 0% | |||||||||||
| 100 | AGCO Corp.* | 3,094 | |||||||||
| Machinery - General Industrial - 0.5% | |||||||||||
| 500 | Gardner Denver Machinery, Inc.* | 18,655 | |||||||||
| 500 | Manitowoc Company, Inc. | 29,715 | |||||||||
| 48,370 | |||||||||||
| Medical - Biomedical and Genetic - 0.9% | |||||||||||
| 35 | Amgen, Inc.* | 2,391 | |||||||||
| 1,400 | Celgene Corp.* | 80,542 | |||||||||
| 100 | Genentech, Inc.* | 8,113 | |||||||||
| 91,046 | |||||||||||
See Notes to Schedule of Investments and Financial Statements.
Janus Aspen Series December 31, 2006 7
Janus Aspen INTECH Risk-Managed Growth Portfolio
Schedule of Investments
As of December 31, 2006
| Shares or Principal Amount | Value | ||||||||||
| Medical - Drugs - 3.4% | |||||||||||
| 500 | Abbott Laboratories | $ | 24,355 | ||||||||
| 600 | Bristol-Myers Squibb Co. | 15,792 | |||||||||
| 400 | Cephalon, Inc.* | 28,164 | |||||||||
| 300 | Eli Lilly and Co. | 15,630 | |||||||||
| 1,000 | Forest Laboratories, Inc.* | 50,600 | |||||||||
| 3,400 | Merck & Company, Inc. | 148,240 | |||||||||
| 800 | Schering-Plough Corp. | 18,912 | |||||||||
| 1,000 | Wyeth | 50,920 | |||||||||
| 352,613 | |||||||||||
| Medical - Generic Drugs - 0.4% | |||||||||||
| 600 | Barr Pharmaceuticals, Inc.* | 30,072 | |||||||||
| 600 | Mylan Laboratories, Inc. | 11,976 | |||||||||
| 42,048 | |||||||||||
| Medical - HMO - 1.2% | |||||||||||
| 700 | Humana, Inc.* | 38,717 | |||||||||
| 300 | Sierra Health Services, Inc.* | 10,812 | |||||||||
| 460 | UnitedHealth Group, Inc. | 24,716 | |||||||||
| 500 | WellCare Health Plans, Inc.* | 34,450 | |||||||||
| 155 | WellPoint, Inc.* | 12,197 | |||||||||
| 120,892 | |||||||||||
| Medical - Hospitals - 0.1% | |||||||||||
| 200 | Universal Health Services, Inc. - Class B | 11,086 | |||||||||
| Medical - Nursing Homes - 0.5% | |||||||||||
| 1,100 | Manor Care, Inc. | 51,612 | |||||||||
| Medical - Wholesale Drug Distributors - 0.7% | |||||||||||
| 100 | AmerisourceBergen Corp. | 4,496 | |||||||||
| 1,100 | Cardinal Health, Inc. | 70,873 | |||||||||
| 75,369 | |||||||||||
| Medical Information Systems - 0.1% | |||||||||||
| 400 | IMS Health, Inc. | 10,992 | |||||||||
| Medical Instruments - 0.3% | |||||||||||
| 200 | Edwards Lifesciences Corp.* | 9,408 | |||||||||
| 400 | Medtronic, Inc. | 21,404 | |||||||||
| 30,812 | |||||||||||
| Medical Labs and Testing Services - 1.5% | |||||||||||
| 700 | Covance, Inc.* | 41,237 | |||||||||
| 1,300 | Laboratory Corporation of America Holdings* | 95,511 | |||||||||
| 400 | Quest Diagnostics, Inc. | 21,200 | |||||||||
| 157,948 | |||||||||||
| Medical Products - 1.9% | |||||||||||
| 900 | Baxter International, Inc. | 41,751 | |||||||||
| 500 | Becton, Dickinson and Co. | 35,075 | |||||||||
| 500 | Henry Schein, Inc.* | 24,490 | |||||||||
| 1,100 | Johnson & Johnson | 72,622 | |||||||||
| 100 | Stryker Corp. | 5,511 | |||||||||
| 100 | Varian Medical Systems, Inc.* | 4,757 | |||||||||
| 100 | Zimmer Holdings, Inc.* | 7,838 | |||||||||
| 192,044 | |||||||||||
| Metal - Aluminum - 0.1% | |||||||||||
| 200 | Alcoa, Inc. | 6,002 | |||||||||
| Metal Processors and Fabricators - 0.1% | |||||||||||
| 100 | Precision Castparts Corp. | 7,828 | |||||||||
| Motorcycle and Motor Scooter Manufacturing - 0.3% | |||||||||||
| 500 | Harley-Davidson, Inc. | 35,235 | |||||||||
| Shares or Principal Amount | Value | ||||||||||
| Multi-Line Insurance - 0.3% | |||||||||||
| 400 | American International Group, Inc. | $ | 28,664 | ||||||||
| 100 | HCC Insurance Holdings, Inc. | 3,209 | |||||||||
| 31,873 | |||||||||||
| Multimedia - 2.3% | |||||||||||
| 900 | McGraw-Hill Companies, Inc. | 61,218 | |||||||||
| 200 | Meredith Corp. | 11,270 | |||||||||
| 3,500 | News Corporation, Inc. - Class A | 75,180 | |||||||||
| 500 | Time Warner, Inc. | 10,890 | |||||||||
| 2,330 | Walt Disney Co. | 79,849 | |||||||||
| 238,407 | |||||||||||
| Music - 0.1% | |||||||||||
| 600 | Warner Music Group Corp. | 13,770 | |||||||||
| Networking Products - 0.4% | |||||||||||
| 1,600 | Cisco Systems, Inc.* | 43,728 | |||||||||
| Non-Ferrous Metals - 0.1% | |||||||||||
| 400 | Titanium Metals Corp.* | 11,804 | |||||||||
| Non-Hazardous Waste Disposal - 0.8% | |||||||||||
| 100 | Allied Waste Industries, Inc.* | 1,229 | |||||||||
| 200 | Republic Services, Inc. | 8,134 | |||||||||
| 1,900 | Waste Management, Inc. | 69,863 | |||||||||
| 79,226 | |||||||||||
| Oil - Field Services - 0.6% | |||||||||||
| 500 | Baker Hughes, Inc. | 37,330 | |||||||||
| 400 | Oceaneering International, Inc.* | 15,880 | |||||||||
| 400 | TETRA Technologies, Inc.* | 10,232 | |||||||||
| 63,442 | |||||||||||
| Oil Companies - Integrated - 0.3% | |||||||||||
| 400 | Exxon Mobil Corp. | 30,652 | |||||||||
| Oil Field Machinery and Equipment - 0.5% | |||||||||||
| 300 | Cameron International Corp.* | 15,915 | |||||||||
| 500 | FMC Technologies, Inc.* | 30,815 | |||||||||
| 46,730 | |||||||||||
| Oil Refining and Marketing - 0.3% | |||||||||||
| 300 | Frontier Oil Corp. | 8,622 | |||||||||
| 500 | Holly Corp. | 25,700 | |||||||||
| 34,322 | |||||||||||
| Optical Supplies - 1.1% | |||||||||||
| 946 | Allergan, Inc. | 113,274 | |||||||||
| Pharmacy Services - 1.2% | |||||||||||
| 341 | Caremark Rx, Inc. | 19,475 | |||||||||
| 500 | Express Scripts, Inc. - Class A* | 35,800 | |||||||||
| 1,325 | Medco Health Solutions, Inc.* | 70,808 | |||||||||
| 126,083 | |||||||||||
| Pipelines - 0.2% | |||||||||||
| 200 | El Paso Corp. | 3,056 | |||||||||
| 200 | Kinder Morgan, Inc. | 21,150 | |||||||||
| 24,206 | |||||||||||
| Power Converters and Power Supply Equipment - 0.2% | |||||||||||
| 500 | American Power Conversion Corp. | 15,295 | |||||||||
| Private Corrections - 0.3% | |||||||||||
| 600 | Corrections Corporation of America* | 27,138 | |||||||||
| Property and Casualty Insurance - 0.4% | |||||||||||
| 300 | Philadelphia Consolidated Holding Corp.* | 13,368 | |||||||||
| 800 | Progressive Corp. | 19,376 | |||||||||
| 250 | W. R. Berkley Corp. | 8,627 | |||||||||
| 41,371 | |||||||||||
See Notes to Schedule of Investments and Financial Statements.
8 Janus Aspen Series December 31, 2006
Schedule of Investments
As of December 31, 2006
| Shares or Principal Amount | Value | ||||||||||
| Publishing - Newspapers - 0% | |||||||||||
| 100 | Dow Jones & Company, Inc. | $ | 3,800 | ||||||||
| Real Estate Management/Services - 1.1% | |||||||||||
| 2,000 | CB Richard Ellis Group, Inc.* | 66,400 | |||||||||
| 500 | Jones Lang LaSalle, Inc. | 46,085 | |||||||||
| 112,485 | |||||||||||
| Real Estate Operating/Development - 0.6% | |||||||||||
| 1,000 | Forest City Enterprises, Inc. - Class A | 58,400 | |||||||||
| REIT - Apartments - 0.4% | |||||||||||
| 100 | Essex Property Trust, Inc. | 12,925 | |||||||||
| 900 | United Dominion Realty Trust, Inc. | 28,611 | |||||||||
| 41,536 | |||||||||||
| REIT - Health Care - 0.1% | |||||||||||
| 200 | Ventas, Inc. | 8,464 | |||||||||
| REIT - Mortgages - 0.2% | |||||||||||
| 800 | CapitalSource, Inc. | 21,848 | |||||||||
| REIT - Office Property - 0.9% | |||||||||||
| 200 | Kilroy Realty Corp. | 15,600 | |||||||||
| 600 | SL Green Realty Corp. | 79,668 | |||||||||
| 95,268 | |||||||||||
| REIT - Regional Malls - 0.1% | |||||||||||
| 100 | Taubman Centers, Inc. | 5,086 | |||||||||
| REIT - Shopping Centers - 0.1% | |||||||||||
| 200 | Developers Diversified Realty Corp. | 12,590 | |||||||||
| REIT - Storage - 0.1% | |||||||||||
| 100 | Public Storage, Inc. | 9,750 | |||||||||
| Research and Development - 0.2% | |||||||||||
| 700 | Pharmaceutical Product Development, Inc. | 22,554 | |||||||||
| Respiratory Products - 0.1% | |||||||||||
| 200 | ResMed, Inc.* | 9,844 | |||||||||
| Retail - Apparel and Shoe - 1.6% | |||||||||||
| 2,100 | American Eagle Outfitters, Inc. | 65,541 | |||||||||
| 900 | AnnTaylor Stores Corp.* | 29,556 | |||||||||
| 200 | Claire's Stores, Inc. | 6,628 | |||||||||
| 200 | Foot Locker, Inc. | 4,386 | |||||||||
| 100 | Gap, Inc. | 1,950 | |||||||||
| 1,200 | Limited, Inc. | 34,728 | |||||||||
| 700 | Ross Stores, Inc. | 20,510 | |||||||||
| 163,299 | |||||||||||
| Retail - Auto Parts - 0.1% | |||||||||||
| 100 | AutoZone, Inc.* | 11,556 | |||||||||
| Retail - Automobile - 0.4% | |||||||||||
| 500 | CarMax, Inc.* | 26,815 | |||||||||
| 400 | Copart, Inc.* | 12,000 | |||||||||
| 38,815 | |||||||||||
| Retail - Computer Equipment - 0.2% | |||||||||||
| 300 | GameStop Corp. - Class A* | 16,533 | |||||||||
| Retail - Consumer Electronics - 0.2% | |||||||||||
| 1,300 | Circuit City Stores, Inc. | 24,674 | |||||||||
| Retail - Discount - 1.1% | |||||||||||
| 500 | Costco Wholesale Corp. | 26,435 | |||||||||
| 200 | Dollar Tree Stores, Inc.* | 6,020 | |||||||||
| 1,100 | Family Dollar Stores, Inc. | 32,263 | |||||||||
| 1,600 | TJX Companies, Inc. | 45,632 | |||||||||
| 110,350 | |||||||||||
| Shares or Principal Amount | Value | ||||||||||
| Retail - Drug Store - 0.1% | |||||||||||
| 300 | CVS Corp. | $ | 9,273 | ||||||||
| 100 | Walgreen Co. | 4,589 | |||||||||
| 13,862 | |||||||||||
| Retail - Hair Salons - 0% | |||||||||||
| 200 | Sally Beauty Holdings, Inc.* | 1,560 | |||||||||
| Retail - Major Department Stores - 0.4% | |||||||||||
| 500 | J.C. Penney Company, Inc. | 38,680 | |||||||||
| Retail - Office Supplies - 0.3% | |||||||||||
| 900 | Office Depot, Inc.* | 34,353 | |||||||||
| Retail - Regional Department Stores - 0.6% | |||||||||||
| 300 | Federated Department Stores, Inc. | 11,439 | |||||||||
| 800 | Kohl's Corp.* | 54,744 | |||||||||
| 66,183 | |||||||||||
| Retail - Restaurants - 1.0% | |||||||||||
| 100 | Brinker International, Inc. | 3,016 | |||||||||
| 100 | Darden Restaurants, Inc. | 4,017 | |||||||||
| 1,600 | Starbucks Corp.* | 56,672 | |||||||||
| 406 | Tim Hortons, Inc. | 11,758 | |||||||||
| 700 | Wendy's International, Inc. | 23,163 | |||||||||
| 100 | Yum! Brands, Inc. | 5,880 | |||||||||
| 104,506 | |||||||||||
| Retail - Sporting Goods - 0.1% | |||||||||||
| 300 | Dick's Sporting Goods, Inc.* | 14,697 | |||||||||
| Savings/Loan/Thrifts - 0.8% | |||||||||||
| 4,200 | Hudson City Bancorp, Inc. | 58,296 | |||||||||
| 600 | People's Bank | 26,772 | |||||||||
| 85,068 | |||||||||||
| Schools - 0.4% | |||||||||||
| 600 | ITT Educational Services, Inc.* | 39,822 | |||||||||
| Semiconductor Components/Integrated Circuits - 0.2% | |||||||||||
| 1,300 | Integrated Device Technology, Inc.* | 20,124 | |||||||||
| Semiconductor Equipment - 0.3% | |||||||||||
| 600 | Lam Research Corp.* | 30,372 | |||||||||
| 100 | Novellus Systems, Inc.* | 3,442 | |||||||||
| 33,814 | |||||||||||
| Soap and Cleaning Preparations - 0.1% | |||||||||||
| 200 | Church & Dwight Company, Inc. | 8,530 | |||||||||
| Steel - Producers - 0.1% | |||||||||||
| 100 | Carpenter Technology Corp. | 10,252 | |||||||||
| Steel - Specialty - 0.4% | |||||||||||
| 500 | Allegheny Technologies, Inc. | 45,340 | |||||||||
| Super-Regional Banks - 0.4% | |||||||||||
| 110 | Wachovia Corp. | 6,265 | |||||||||
| 1,000 | Wells Fargo & Co. | 35,560 | |||||||||
| 41,825 | |||||||||||
| Telephone - Integrated - 0.2% | |||||||||||
| 200 | Citizens Communications Co. | 2,874 | |||||||||
| 400 | Telephone and Data Systems, Inc. | 21,732 | |||||||||
| 24,606 | |||||||||||
| Television - 0.6% | |||||||||||
| 1,600 | Univision Communications, Inc. - Class A* | 56,672 | |||||||||
| Therapeutics - 0.5% | |||||||||||
| 100 | Amylin Pharmaceuticals, Inc.* | 3,607 | |||||||||
| 700 | Gilead Sciences, Inc.* | 45,451 | |||||||||
| 49,058 | |||||||||||
See Notes to Schedule of Investments and Financial Statements.
Janus Aspen Series December 31, 2006 9
Janus Aspen INTECH Risk-Managed Growth Portfolio
Schedule of Investments
As of December 31, 2006
| Shares or Principal Amount | Value | ||||||||||
| Tobacco - 1.8% | |||||||||||
| 1,400 | Altria Group, Inc. | $ | 120,148 | ||||||||
| 1,200 | UST, Inc. | 69,840 | |||||||||
| 189,988 | |||||||||||
| Tools - Hand Held - 0.1% | |||||||||||
| 100 | Snap-On, Inc. | 4,764 | |||||||||
| Transportation - Railroad - 1.3% | |||||||||||
| 400 | Burlington Northern Santa Fe Corp. | 29,524 | |||||||||
| 1,000 | CSX Corp. | 34,430 | |||||||||
| 500 | Norfolk Southern Corp. | 25,145 | |||||||||
| 500 | Union Pacific Corp. | 46,010 | |||||||||
| 135,109 | |||||||||||
| Transportation - Services - 2.6% | |||||||||||
| 1,700 | C.H. Robinson Worldwide, Inc. | 69,513 | |||||||||
| 1,500 | Expeditors International of Washington, Inc. | 60,750 | |||||||||
| 700 | FedEx Corp. | 76,034 | |||||||||
| 900 | United Parcel Service, Inc. - Class B | 67,482 | |||||||||
| 273,779 | |||||||||||
| Veterinary Diagnostics - 0.4% | |||||||||||
| 1,300 | VCA Antech, Inc.* | 41,847 | |||||||||
| Web Portals/Internet Service Providers - 1.3% | |||||||||||
| 300 | Google, Inc. - Class A* | 138,144 | |||||||||
| Wireless Equipment - 1.2% | |||||||||||
| 1,130 | American Tower Corp. - Class A* | 42,126 | |||||||||
| 2,300 | Crown Castle International Corp.* | 74,290 | |||||||||
| 100 | SBA Communications Corp. - Class A* | 2,750 | |||||||||
| 119,166 | |||||||||||
| Total Common Stock (cost $9,033,739) | 10,379,977 | ||||||||||
| Money Market - 0.5% | |||||||||||
| 8,500 | Janus Institutional Cash Reserves Fund, 5.29% | 8,500 | |||||||||
| 46,625 | Janus Money Market Fund, 5.24% | 46,625 | |||||||||
| Total Money Market (cost $55,125) | 55,125 | ||||||||||
| Total Investments (total cost $9,088,864) – 100.2% | 10,435,102 | ||||||||||
| Liabilities, net of Cash, Receivables and Other Assets – (0.2)% | (25,604 | ) | |||||||||
| Net Assets – 100% | $ | 10,409,498 | |||||||||
Summary of Investments by Country
| Country | Value | % of Investment Securities | |||||||||
| United States†† | $ | 10,435,102 | 100.0 | % | |||||||
| Total | $ | 10,435,102 | 100.0 | % | |||||||
††Includes Short-Term Securities (99.5% excluding Short-Term Securities)
See Notes to Schedule of Investments and Financial Statements.
10 Janus Aspen Series December 31, 2006
Statement of Assets and Liabilities
| As of December 31, 2006 (all numbers in thousands except net asset value per share) | Janus Aspen INTECH Risk-Managed Growth Portfolio(1) | ||||||
| Assets: | |||||||
| Investments at cost | $ | 9,089 | |||||
| Investments at value | $ | 10,435 | |||||
| Cash | 25 | ||||||
| Receivables: | |||||||
| Investments sold | 160 | ||||||
| Dividends | 13 | ||||||
| Interest | – | ||||||
| Due from adviser | 5 | ||||||
| Other assets | 1 | ||||||
| Total Assets | 10,639 | ||||||
| Liabilities: | |||||||
| Payables: | |||||||
| Investments purchased | 180 | ||||||
| Portfolio shares repurchased | – | ||||||
| Advisory fees | 4 | ||||||
| Professional Fees | 20 | ||||||
| Transfer agent fees and expenses | 1 | ||||||
| Distribution fees - Service Shares | 2 | ||||||
| System Fees | 5 | ||||||
| Legal Fees | 5 | ||||||
| Administrative services fees - Service Shares | 1 | ||||||
| Non-interested Trustees' fees and expenses | 1 | ||||||
| Accrued expenses | 11 | ||||||
| Total Liabilities | 230 | ||||||
| Net Assets | $ | 10,409 | |||||
| Net Assets Consist of: | |||||||
| Capital (par value and paid-in-surplus)* | $ | 9,034 | |||||
| Undistributed net investment income/(loss)* | – | ||||||
| Undistributed net realized gain/(loss) from investments and foreign currency transactions* | 29 | ||||||
| Unrealized net appreciation/(depreciation) of investments and foreign currency translations | 1,346 | ||||||
| Total Net Assets | $ | 10,409 | |||||
| Net Assets – Service Shares | $ | 10,409 | |||||
| Shares Outstanding, $0.001 Par Value (unlimited shares authorized) | 886 | ||||||
| Net Asset Value Per Share | $ | 11.75 | |||||
*See Note 3 in Notes to Financial Statements.
(1) Formerly named Janus Aspen Risk-Managed Growth Portfolio.
See Notes to Financial Statements.
Janus Aspen Series December 31, 2006 11
Statement of Operations
| For the fiscal year ended December 31, 2006 (all numbers in thousands) | Janus Aspen INTECH Risk-Managed Growth Portfolio(1) | ||||||
| Investment Income: | |||||||
| Interest | $ | – | |||||
| Dividends | 126 | ||||||
| Dividends from affiliates | 2 | ||||||
| Total Investment Income | 128 | ||||||
| Expenses: | |||||||
| Advisory fees | 52 | ||||||
| Transfer agent expenses | 3 | ||||||
| Custodian fees | 24 | ||||||
| Professional fees | 28 | ||||||
| Non-interested Trustees' fees and expenses | 3 | ||||||
| Distribution fees - Service Shares | 26 | ||||||
| Administrative services fees - Service Shares | 10 | ||||||
| System fees | 36 | ||||||
| Legal Fees | 12 | ||||||
| Printing expenses | 26 | ||||||
| Other expenses | 11 | ||||||
| Non-recurring costs (Note 2) | – | ||||||
| Costs assumed by Janus Capital Management LLC (Note 2) | – | ||||||
| Total Expenses | 231 | ||||||
| Expense and Fee Offset | – | ||||||
| Net Expenses | 231 | ||||||
| Less: Excess Expense Reimbursement | (81 | ) | |||||
| Net Expenses after Expense Reimbursement | 150 | ||||||
| Net Investment Income/(Loss) | (22 | ) | |||||
| Net Realized and Unrealized Gain/(Loss) on Investments: | |||||||
| Net realized gain/(loss) from securities transactions | 485 | ||||||
| Change in unrealized net appreciation/(depreciation) of investments and foreign currency translations | 169 | ||||||
| Net Gain/(Loss) on Investments | 654 | ||||||
| Net Increase/(Decrease) in Net Assets Resulting from Operations | $ | 632 | |||||
(1) Formerly named Janus Aspen Risk-Managed Growth Portfolio.
See Notes to Financial Statements.
12 Janus Aspen Series December 31, 2006
Statements of Changes in Net Assets
| For the fiscal year ended December 31 | Janus Aspen INTECH Risk-Managed Growth Portfolio(1) | ||||||||||
| (all numbers in thousands) | 2006 | 2005 | |||||||||
| Operations: | |||||||||||
| Net investment income/(loss) | $ | (22 | ) | $ | (57 | ) | |||||
| Net realized gain/(loss) from investment transactions | 485 | 985 | |||||||||
| Change in unrealized net appreciation/(depreciation) of investments foreign currency translations | 169 | (207 | ) | ||||||||
| Net Increase/(Decrease) in Net Assets Resulting from Operations | 632 | 721 | |||||||||
| Dividends and Distributions to Shareholders: | |||||||||||
| Net investment income* | |||||||||||
| Service Shares | – | – | |||||||||
| Net realized gain from investment transactions* | |||||||||||
| Service Shares | (442 | ) | (1,156 | ) | |||||||
| Tax return of capital* | |||||||||||
| Service Shares | – | (93 | ) | ||||||||
| Net Decrease from Dividends and Distributions | (442 | ) | (1,249 | ) | |||||||
| Capital Share Transactions: | |||||||||||
| Shares sold | |||||||||||
| Service Shares | 24 | – | |||||||||
| Reinvested dividends and distributions | |||||||||||
| Service Shares | 442 | 1,249 | |||||||||
| Shares repurchased | |||||||||||
| Service Shares | (1,500 | ) | – | ||||||||
| Net Increase/(Decrease) from Capital Share Transactions | (1,034 | ) | 1,249 | ||||||||
| Net Increase/(Decrease) in Net Assets | (844 | ) | 721 | ||||||||
| Net Assets: | |||||||||||
| Beginning of period | 11,253 | 10,532 | |||||||||
| End of period | $ | 10,409 | $ | 11,253 | |||||||
| Undistributed net investment income/(loss)* | $ | – | $ | – | |||||||
*See Note 3 in Notes to Financial Statements.
(1) Formerly named Janus Aspen Risk-Managed Growth Portfolio.
See Notes to Financial Statements.
Janus Aspen Series December 31, 2006 13
Financial Highlights - Service Shares
| Janus Aspen INTECH Risk-Managed Growth Portfolio(1) | |||||||||||||||||||
| For a share outstanding during each fiscal year or period ended December 31 | 2006 | 2005 | 2004 | 2003(2) | |||||||||||||||
| Net Asset Value, Beginning of Period | $ | 11.55 | $ | 12.14 | $ | 12.44 | $ | 10.00 | |||||||||||
| Income from Investment Operations: | |||||||||||||||||||
| Net investment income/(loss) | – | (3) | – | (3) | – | (3) | – | (3) | |||||||||||
| Net gain/(loss) on securities (both realized and unrealized) | .72 | .83 | 1.48 | 2.54 | |||||||||||||||
| Total from Investment Operations | .72 | .83 | 1.48 | 2.54 | |||||||||||||||
| Less Distributions: | |||||||||||||||||||
| Dividends (from net investment income)* | – | – | – | – | |||||||||||||||
| Distributions (from capital gains)* | (.52 | ) | (1.32 | ) | (1.78 | ) | (.10 | ) | |||||||||||
| Tax return of capital* | – | (.10 | ) | – | – | ||||||||||||||
| Total Distributions | (.52 | ) | (1.42 | ) | (1.78 | ) | (.10 | ) | |||||||||||
| Net Asset Value, End of Period | $ | 11.75 | $ | 11.55 | $ | 12.14 | $ | 12.44 | |||||||||||
| Total Return** | 6.22 | % | 6.89 | % | 12.00 | % | 25.38 | % | |||||||||||
| Net Assets, End of Period (in thousands) | $ | 10,409 | $ | 11,253 | $ | 10,532 | $ | 9,401 | |||||||||||
| Average Net Assets for the Period (in thousands) | $ | 10,314 | $ | 10,600 | $ | 9,724 | $ | 8,135 | |||||||||||
| Ratio of Gross Expenses to Average Net Assets***(4) | 1.45 | % | 1.45 | % | 1.43 | % | 1.50 | % | |||||||||||
| Ratio of Net Expenses to Average Net Assets***(4) | 1.45 | % | 1.45 | % | 1.42 | % | 1.50 | % | |||||||||||
| Ratio of Net Investment Income/(Loss) to Average Net Assets*** | (0.21 | )% | (0.54 | )% | (0.34 | )% | (0.67 | )% | |||||||||||
| Portfolio Turnover Rate*** | 120 | % | 126 | % | 110 | % | 65 | % | |||||||||||
*See Note 3 in Notes to Financial Statements.
**Total return not annualized for periods of less than one full year.
***Annualized for periods of less than one full year.
(1) Formerly named Janus Aspen Risk-Managed Growth Portfolio.
(2) Fiscal period from January 2, 2003 (inception date) through December 31, 2003.
(3) Net investment income/(loss) aggregated less than $.01 on a per share basis for the fiscal year or period ended.
(4) See Note 4 in Notes to Financial Statements.
See Notes to Financial Statements.
14 Janus Aspen Series December 31, 2006
Notes to Schedule of Investments
| Lipper Variable Annuity Mid-Cap Growth Funds | Funds that, by portfolio practice, invest at least 75% of their equity assets in companies with market capitalizations (on a three-year weighted basis) less than 300% of the dollar-weighted median market capitalization of the middle 1,000 securities of the S&P SuperComposite 1500 Index. Mid-cap growth funds typically have an above-average price-to-earnings ratio, price-to-book ratio, and three-year sales-per-share growth value, compared to the S&P MidCap 400 Index. | ||||||
| Russell 1000® Growth Index | Contains those securities in the Russell 1000® Index with a greater-then-average growth orientation. Companies in this index tend to exhibit higher price-to-book and price-earnings ratios, lower dividend yields and higher forecasted growth values. | ||||||
| REIT | Real Estate Investment Trust | ||||||
* Non-income-producing security.
Janus Aspen Series December 31, 2006 15
Notes to Financial Statements
The following section describes the organization and significant accounting policies and provides more detailed information about the schedules and tables that appear throughout this report. In addition, the Notes to Financial Statements explain the methods used in preparing and presenting this report.
1. ORGANIZATION AND SIGNIFICANT ACCOUNTING POLICIES
Janus Aspen INTECH Risk-Managed Growth Portfolio (formerly named Janus Aspen Risk-Managed Growth Portfolio) (the "Portfolio") is a series fund. The Portfolio is part of Janus Aspen Series (the "Trust"), which is organized as a Delaware statutory trust and is registered under the Investment Company Act of 1940 (the "1940 Act") as an open-end management investment company. The Trust offers seventeen Portfolios, which include multiple series of shares, with differing investment objectives and policies. The Portfolio invests primarily in equity securities. The Portfolio is classified as diversified, as defined in the 1940 Act. The Portfolio is a no-load investment.
The Portfolio currently offers one class of shares: Service Shares. Service Shares are offered only in connection with investment in and payments under variable insurance contracts and to qualified retirement plans that require a fee from Portfolio assets to procure distribution and administrative services to contract owners and plan participants.
Janus Capital Management LLC ("Janus Capital") invested initial seed capital in the amount of $10,000 for the Portfolio on December 31, 2002. Janus Capital invested additional seed capital in the amount of $7,490,000 for the Portfolio on January 2, 2003. Janus Capital redeemed $1,500,000 of seed capital on April 11, 2006.
The following accounting policies have been consistently followed by the Portfolio and are in conformity with accounting principles generally accepted in the United States of America in the investment company industry.
Investment Valuation
Securities are valued at the last sales price or the official closing price for securities traded on a principal securities exchange (U.S. or foreign) and on the NASDAQ National Market. Securities traded on over-the-counter markets and listed securities for which no sales are reported are valued at the latest bid price (or yield equivalent thereof) obtained from one or more dealers transacting in a market for such securities or by a pricing service approved by the Portfolio's Trustees. Short-term securities with maturities of 60 days or less may be valued at amortized cost, which approximates market value. Debt securities with a remaining maturity of greater than 60 days are valued in accordance with the evaluated bid price supplied by the pricing service. The evaluated bid price supplied by the pricing service is an evaluation that reflects such factors as security prices, yields, maturities and ratings. Foreign securities and currencies ar e converted to U.S. dollars using the applicable exchange rate in effect as of the daily close of the New York Stock Exchange ("NYSE"). When market quotations are not readily available or deemed unreliable, or events or circumstances that may affect the value of portfolio securities held by the Portfolio are identified between the closing of their principal markets and the time the net asset value ("NAV") is determined, securities may be valued at fair value as determined in good faith under procedures established by and under the supervision of the Portfolio's Trustees. The Portfolio may use a systematic fair valuation model provided by an independent third party to value international equity securities in order to adjust for stale pricing, which may occur between the close of certain foreign exchanges and the NYSE.
Investment Transactions and Investment Income
Investment transactions are accounted for as of the date purchased or sold (trade date). Dividend income is recorded on the ex-dividend date. Certain dividends from foreign securities will be recorded as soon as the Trust is informed of the dividend if such information is obtained subsequent to the ex-dividend date and may be subject to withholding taxes in these jurisdictions. Interest income is recorded on the accrual basis and includes amortization of premiums and accretion of discounts. Gains and losses are determined on the identified cost basis, which is the same basis used for federal income tax purposes.
Expenses
The Portfolio bears expenses incurred specifically on its behalf as well as a portion of general expenses, which may be allocated pro rata to the Portfolio.
Interfund Lending
Pursuant to an exemptive order received from the SEC, the Portfolio may be party to an interfund lending agreement between the Portfolio and other Janus Capital sponsored mutual funds, which permits it to borrow or lend cash at a rate beneficial to both the borrowing and lending funds. Outstanding borrowings from all sources totaling 10% or more of the borrowing Portfolio's total assets must be collateralized at 102% of the outstanding principal value of the loan; loans of less than 10% may be unsecured. During the fiscal year ended December 31, 2006, there were no outstanding interfund borrowing or lending arrangements for the Portfolio.
Futures Contracts
The Portfolio may enter into futures contracts. The Portfolio intends to use such derivative instruments primarily to hedge or protect from adverse movements in securities prices, currency rates or interest rates. The Portfolio may use futures contracts to gain exposure to the stock market pending investment of cash balances or to meet liquidity needs. The use of futures contracts may involve risks such as the possibility of illiquid markets or imperfect correlation between the value of the contracts and the underlying securities, or that the counterparty will fail to perform its obligations.
16 Janus Aspen Series December 31, 2006
Futures contracts are marked-to-market daily, and the daily variation margin is recorded as a receivable or payable on the Statement of Assets and Liabilities (if applicable). When a contract is closed, a realized gain or loss is recorded on the Statement of Operations equal to the difference between the opening and closing value of the contract. Generally, futures contracts are marked-to-market (i.e., treated as realized and subject to distribution) for federal income tax purposes at fiscal year end. Securities designated as collateral for market value on futures contracts are noted in the Schedule of Investments. Such collateral is in the possession of the Portfolio's custodian. As of December 31, 2006, the Portfolio was not invested in futures contracts.
Initial Public Offerings
The Portfolio may invest in initial public offerings ("IPOs"). IPOs and other investment techniques may have a magnified performance impact on a fund with a small asset base. The Portfolio may not experience similar performance as its assets grow.
Restricted Security Transactions
Restricted securities held by the Portfolio may not be sold except in exempt transactions or in a public offering registered under the Securities Act of 1933. The risk of investing in such securities is generally greater than the risk of investing in the securities of widely held, publicly traded companies. Lack of a secondary market and resale restrictions may result in the inability of the Portfolio to sell a security at a fair price and may substantially delay the sale of the security. In addition, these securities may exhibit greater price volatility than securities for which secondary markets exist.
Dividend Distributions
The Portfolio generally makes semiannual distributions of substantially all of its investment income and an annual distribution of its net realized capital gains (if any). The majority of dividends and net realized capital gains distributions from the Portfolio may be automatically reinvested into additional shares of the Portfolio, based upon the discretion of the shareholder.
Estimates
The preparation of financial statements in conformity with accounting principles generally accepted in the United States of America requires management to make estimates and assumptions that affect the reported amount of assets and liabilities and disclosure of contingent assets and liabilities at the date of the financial statements and the reported amounts of income and expenses during the reporting period. Actual results could differ from those estimates.
Federal Income Taxes
No provision for income taxes is included in the accompanying financial statements, as the Portfolio intends to distribute to shareholders all taxable investment income and realized gains and otherwise comply with Subchapter M of the Internal Revenue Code applicable to regulated investment companies.
New Accounting Pronouncements
In July 2006, the Financial Accounting Standards Board ("FASB") issued Interpretation No. 48, "Accounting for Uncertainty in Income Taxes – an Interpretation of FASB Statement No. 109" (the "Interpretation"). The Interpretation establishes for all entities, including pass-through entities such as the Portfolio, a minimum threshold for financial statement recognition of the benefit of positions taken in filing tax returns (including whether an entity is taxable in a particular jurisdiction), and requires certain expanded tax disclosures. A calendar year open-end or closed-end fund would implement the Interpretation no later than June 29, 2007 (the last business day of the semi-annual reporting period) and will also apply to all open tax years as of the date of effectiveness. Management has recently begun to evaluate the application of the Interpretation to the Portfolio, and is not in a position at this time to estimate the significance of its impact, if any, on the Portfolio's financial statements.
In September 2006, the FASB issued Statement of Financial Accounting Standards No. 157, "Fair Value Measurements" ("SFAS No. 157"), which defines fair value, establishes a framework for measuring fair value in generally accepted accounting principles, and expands disclosures about fair value measurements. SFAS No. 157 does not require new fair value measurements, but is applied to the extent that other accounting pronouncements require or permit fair value measurements. SFAS No. 157 emphasizes that fair value is a market-based measurement that should be determined based on the assumptions that market participants would use in pricing an asset or liability. Companies will be required to disclose the extent to which fair value is used to measure assets and liabilities, the inputs used to develop the measurements, and the effect for fiscal years beginning after November 15, 2007. Management is currently evaluating the potential impact the adopt ion of SFAS No. 157 will have on the Portfolio's financial condition and results of operations.
2. INVESTMENT ADVISORY AGREEMENTS AND TRANSACTIONS WITH AFFILIATES
The Portfolio pays a monthly advisory fee to Janus Capital based upon average daily net assets and calculated at the annual rate of 0.50%.
Enhanced Investment Technologies LLC ("INTECH") serves as subadviser to the Portfolio. Janus Capital indirectly owns approximately 82.5% of the outstanding voting shares of INTECH. Janus Capital pays INTECH a subadvisory fee at the annual rate of 0.26% of average daily net assets from its management fee for managing the Portfolio.
Janus Aspen Series December 31, 2006 17
Notes to Financial Statements (continued)
Janus Services LLC ("Janus Services"), a wholly-owned subsidiary of Janus Capital, receives from the Portfolio a fee at an annual rate of up to 0.10% of the average daily net assets of Service Shares of the Portfolio, to compensate Janus Services for providing, or arranging for the provision of record keeping, subaccounting, and administrative services.
Janus Services receives certain out-of-pocket expenses for transfer agent services.
Janus Capital has agreed until at least May 1, 2008 to reimburse the Portfolio by the amount, if any, that the normal operating expenses in any fiscal year, including the investment advisory fee but excluding the distribution and shareholder servicing (12b-1) fees applicable to Service Shares, the administrative services fees applicable to Service Shares, brokerage commissions, interest, taxes and extraordinary expenses, exceed an annual rate of 1.10% of the average daily net assets of the Portfolio. The Portfolio is not required to repay any such waived fees in future years to Janus Capital.
Certain officers of the Portfolio may also be officers and/or directors of Janus Capital. Such officers receive no compensation from the Portfolio, except for the Portfolio's Chief Compliance Officer. Effective January 1, 2006, the Portfolio began reimbursing the adviser for a portion of the compensation paid to the Chief Compliance Officer of the Trust. Total compensation of $17 was paid by the Portfolio during the fiscal year ended December 31, 2006. The Portfolio's portion is reported as part of "Other Expenses" on the Statement of Operations.
The Board of Trustees has adopted a deferred compensation plan (the "Deferred Plan") for independent Trustees to elect to defer receipt of all or a portion of the annual compensation they are entitled to receive from the Portfolio. All deferred fees are credited to an account established in the name of the Trustees. The amounts credited to the account then increase or decrease, as the case may be, in accordance with the performance of one or more of the Janus funds that are selected by the Trustees. The account balance continues to fluctuate in accordance with the performance of the selected fund or funds until final payment of all amounts credited to the account. Trustees are allowed to change their designation of mutual funds from time to time. Amounts will be deferred until distributed in accordance to the Deferred Plan. No deferred fees were paid to any Trustee under the Deferred Plan during the fiscal year ended December 31, 2006.
For the fiscal year ended December 31, 2006, Janus Capital assumed $21,288 of legal, consulting and Trustee costs and fees incurred by the funds in Janus Investment Fund, Janus Aspen Series and Janus Adviser Series (the "Funds") in connection with the regulatory and civil litigation matters discussed in Note 7. These non-recurring costs were allocated to all Funds based upon the Funds' respective net assets as of July 31, 2004. Additionally, all future non-recurring costs will be allocated based upon the Funds' respective net assets on July 31, 2004. These non-recurring costs and costs assumed by Janus Capital are shown on the Statement of Operations.
Janus Distributors LLC, a wholly-owned subsidiary of Janus Capital, is a distributor of the Portfolio. Service Shares have adopted a Distribution and Shareholder Servicing Plan (the "Plan") pursuant to Rule 12b-1 under The 1940 Act. The Plan authorizes payments by the Portfolio in connection with the distribution of Service Shares at an annual rate of up to 0.25% of Service Shares' average daily net assets.
The Portfolio's expenses may be reduced by expense offsets from an unaffiliated custodian and/or transfer agent. Such credits or offsets are included in Expense and Fee Offset on the Statement of Operations. The transfer agent fee offsets received during the period reduce Transfer Agent Fees and Expenses. Custodian offsets received reduce Custodian Fees. The Portfolio could have employed the assets used by the custodian and/or transfer agent to produce income if it had not entered into an expense offset arrangement.
The Portfolio may invest in money market funds, including funds managed by Janus Capital. During the fiscal year ended December 31, 2006, the Portfolio recorded distributions from affiliated investment companies as affiliated dividend income, and had the following affiliated purchases and sales:
| Purchases Shares/Cost | Sales Shares/Cost | Dividend Income | Value at 12/31/06 | ||||||||||||||||
| Janus Aspen INTECH Risk-Managed Growth Portfolio(1) | |||||||||||||||||||
| Janus Government Money Market Fund | $ | 17,237 | $ | 17,237 | $ | 22 | $ | – | |||||||||||
| Janus Institutional Cash Reserves Fund | 153,827 | 145,327 | 376 | 8,500 | |||||||||||||||
| Janus Money Market Fund | 135,061 | 88,436 | 1,103 | 46,625 | |||||||||||||||
| $ | 306,125 | $ | 251,000 | $ | 1,501 | $ | 55,125 | ||||||||||||
(1) Formerly named Janus Aspen Risk-Managed Growth Portfolio
18 Janus Aspen Series December 31, 2006
3. FEDERAL INCOME TAX
The tax components of capital shown in the table below represent: (1) distribution requirements the Portfolio must satisfy under the income tax regulations; (2) losses or deductions the Portfolio may be able to offset against income and gains realized in future years; and (3) unrealized appreciation or depreciation of investments for federal income tax purposes.
Other book to tax differences in the current year primarily consist of foreign currency contract adjustments. The Portfolio has elected to treat gains and losses on forward foreign currency contracts as capital gains and losses. Other foreign currency gains and losses on debt instruments are treated as ordinary income for federal income tax purposes pursuant to Section 988 of the Internal Revenue Code.
| Portfolio | Undistributed Ordinary Income | Undistributed Long-Term Gains | Accumulated Capital Losses | Post October Deferral | Other Book to Tax Differences | Net Tax Appreciation/ (Depreciation) | |||||||||||||||||||||
| Janus Aspen INTECH Risk-Managed Growth Portfolio(1) | $ | – | $ | 48,555 | $ | – | $ | – | $ | – | $ | 1,327,039 | |||||||||||||||
(1) Formerly named Janus Aspen Risk-Managed Growth Portfolio
The aggregate cost of investments and the composition of unrealized appreciation and depreciation of investment securities for federal income tax purposes as of December 31, 2006 are noted below.
Unrealized appreciation and unrealized depreciation in the table below exclude appreciation/depreciation on foreign currency translations. The primary difference between book and tax appreciation or depreciation of investments is wash sale loss deferrals.
| Portfolio | Federal Tax Cost | Unrealized Appreciation | Unrealized (Depreciation) | ||||||||||||
| Janus Aspen INTECH Risk-Managed Growth Portfolio(1) | $ | 9,108,063 | $ | 1,432,397 | $ | (105,358 | ) | ||||||||
(1) Formerly named Janus Aspen Risk-Managed Growth Portfolio
Income and capital gains distributions are determined in accordance with income tax regulations that may differ from accounting principles generally accepted in the United States of America. These differences are due to differing treatments for items such as net short-term gains, deferral of wash sale losses, foreign currency transactions, net investment losses and capital loss carryovers. Certain permanent differences such as tax returns of capital and net investment losses noted below have been reclassified to paid-in capital.
| For the fiscal year ended December 31, 2006 | Distributions | ||||||||||||||||||
| Portfolio | From Ordinary Income | From Long-Term Capital Gains | Tax Return of Capital | Net Investment Loss | |||||||||||||||
| Janus Aspen INTECH Risk-Managed Growth Portfolio(1) | $ | – | $ | 442,094 | $ | – | $ | (21,511 | ) | ||||||||||
(1) Formerly named Janus Aspen Risk-Managed Growth Portfolio
| For the fiscal period ended December 31, 2005 | Distributions | ||||||||||||||||||
| Portfolio | From Ordinary Income | From Long-Term Capital Gains | Tax Return of Capital | Net Investment Loss | |||||||||||||||
| Janus Aspen INTECH Risk-Managed Growth Portfolio(1) | $ | 393,799 | $ | 761,993 | $ | 93,638 | $ | – | |||||||||||
(1) Formerly named Janus Aspen Risk-Managed Growth Portfolio
4. EXPENSE RATIOS
The expense ratios listed in the Financial Highlights reflect expenses prior to any expense offsets (gross expense ratio) and after expense offsets (net expense ratio). Both expense ratios reflect expenses after waivers (reimbursement). Listed below are the gross expense ratios for the Portfolio that would be in effect, absent the waiver of certain fees and offsets.
| For each fiscal year or period ended December 31 | Service Shares | ||||||||||||||||||
| Portfolio | 2006(1) | 2005(1) | 2004(1) | 2003(2) | |||||||||||||||
| Janus Aspen INTECH Risk-Managed Growth Portfolio(3) | 2.23 | % | 1.68 | % | 1.73 | % | 2.58 | % | |||||||||||
(1) The effect of non-recurring costs assumed by Janus Capital (Note 2) is included in the ratio of operating expenses to average net assets without waivers and/or expense reimbursements and was less than 0.01%.
(2) Fiscal period from January 2, 2003 (inception date) through December 31, 2003.
(3) Formerly named Janus Aspen Risk-Managed Growth Portfolio.
Janus Aspen Series December 31, 2006 19
Notes to Financial Statements (continued)
5. CAPITAL SHARE TRANSACTIONS
| For the fiscal year ended December 31 | Janus Aspen INTECH Risk-Managed Growth Portfolio(1) | ||||||||||
| (all numbers are in thousands) | 2006 | 2005 | |||||||||
| Transactions in Portfolio Shares – Service Shares: | |||||||||||
| Shares sold | 2 | – | |||||||||
| Reinvested dividends and distributions | 37 | 107 | |||||||||
| Shares repurchased | (128 | ) | – | ||||||||
| Net Increase/(Decrease) in Portfolio Shares | (89 | ) | 107 | ||||||||
| Shares Outstanding, Beginning of Period | 975 | 868 | |||||||||
| Shares Outstanding, End of Period | 886 | 975 | |||||||||
(1) Formerly named Janus Aspen Risk-Managed Growth Portfolio.
6. PURCHASES AND SALES OF INVESTMENT SECURITIES
For the fiscal year ended December 31, 2006, the aggregate cost of purchases and proceeds from sales of investment securities (excluding short-term securities) were as follows:
| Portfolio | Purchases of Securities | Proceeds from Sales of Securities | Purchases of Long- Term U.S. Government Obligations | Proceeds from Sales of Long-Term U.S. Government Obligations | |||||||||||||||
| Janus Aspen INTECH Risk-Managed Growth Portfolio(1) | $ | 12,387,280 | $ | 13,869,728 | $ | – | $ | – | |||||||||||
(1) Formerly named Janus Aspen Risk-Managed Growth Portfolio.
7. PENDING LEGAL MATTERS
In the fall of 2003, the Securities and Exchange Commission ("SEC"), the Office of the New York State Attorney General ("NYAG"), the Colorado Attorney General ("COAG"), and the Colorado Division of Securities ("CDS") announced that they were investigating alleged frequent trading practices in the mutual fund industry. On August 18, 2004, Janus Capital announced that it had reached final settlements with the SEC, the NYAG, the COAG, and the CDS related to such regulators' investigations into Janus Capital's frequent trading arrangements.
A number of civil lawsuits were brought against Janus Capital and certain of its affiliates, the Janus funds, and related entities and individuals based on allegations similar to those announced by the above regulators and were filed in several state and federal jurisdictions. Such lawsuits alleged a variety of theories for recovery including, but not limited to, the federal securities laws, other federal statutes (including ERISA), and various common law doctrines. The Judicial Panel on Multidistrict Litigation transferred these actions to the U.S. District Court for the District of Maryland (the "Court") for coordinated proceedings. On September 29, 2004, five consolidated amended complaints were filed with the Court that generally include: (i) claims by a putative class of investors in certain Janus funds asserting claims on behalf of the investor class (Marini, et al. v. Janus Investment Fund, et al., U.S. District Court, District of Maryland, Case No. 04-CV-00497); (ii) derivative claims by investors in certain Janus funds ostensibly on behalf of such funds (Steinberg et al. v. Janus Capital Management, LLC et al., U.S. District Court, District of Maryland, Case No. 04-CV00518); (iii) claims on behalf of participants in the Janu s 401(k) plan (Wangberger v. Janus Capital Group Inc., 401(k) Advisory Committee, et al., U.S. District Court, District of Maryland, Case No. JFM-05-2711); (iv) claims brought on behalf of shareholders of Janus Capital Group Inc. ("JCGI") on a derivative basis against the Board of Directors of JCGI (Chasen v. Whiston, et al., U.S. District Court, District of Maryland, Case No. 04-MD-00855); and (v) claims by a putative class of shareholders of JCGI asserting claims on behalf of the shareholders (Wiggins, et al. v. Janus Capital Group, Inc., et al., U.S. District Court, District of Maryland, Case No. 04-CV-00818). In addition, the following were also named as defendants in one or more of the actions: Janus Investment Fund ("JIF"), Janus Aspen Series ("JAS"), Janus Adviser Series ("JAD"), Janus Distributors LLC, Enhanced Investment Technologies, LLC ("INTECH"), Bay Isle Financial LLC ("Bay Isle "), Perkins, Wolf, McDonnell and Company, LLC ("Perkins"), the Advisory Committee of the Janus 401(k) plan, and the current or former directors of JCGI.
On August 25, 2005, the Court entered orders dismissing most of the claims asserted against Janus Capital and its
20 Janus Aspen Series December 31, 2006
affiliates by fund investors (actions (i) and (ii) described above), except certain claims under Section 10(b) of the Securities Exchange Act of 1934 and under Section 36(b) of the Investment Company Act of 1940, as amended (the "1940 Act"). On August 15, 2006, the complaint in the 401(k) plan class action (action (iii) described above) was dismissed by the district court with prejudice; the plaintiff has appealed that dismissal decision to the United States Court of Appeals for the Fourth Circuit. The Court also dismissed the action against JCGI's Board of Directors without leave to amend (action (iv) described above). Finally, a Motion to Dismiss the action brought by JCGI shareholders (action (v) described above) is fully briefed and pending before the Court.
In addition to the lawsuits described above, the Auditor of the State of West Virginia ("Auditor"), in his capacity as securities commissioner, has initiated administrative proceedings against many of the defendants in the market timing cases (including JCGI and Janus Capital) and, as a part of its relief, is seeking disgorgement and other monetary relief based on similar market timing allegations (In the Matter of Janus Capital Group Inc. et al., Before the Securities Commissioner, State of West Virginia, Summary Order No. 05-1320). The respondents in these proceedings collectively sought a Writ of Prohibition in state court, which was denied. Their subsequent Petition for Appeal was also denied. Consequently, in September 2006, JCGI and Janus Capital filed their answer to the Auditor's summary order instituting proceedings and requested a hearing. JCGI and Janus Capital, as well as other similarly situated defendants, continue to challenge the statutory authority of the Auditor to bring such an action. No further proceedings are currently scheduled.
In addition to the "market timing" actions described above, Janus Capital is a defendant in a consolidated lawsuit in the U.S. District Court for the District of Colorado challenging the investment advisory fees charged by Janus Capital to certain Janus funds (Walter Sins, et al. v. Janus Capital Management LLC, U.S. District Court, District of Colorado, Case No. 04-CV-01647-WDM-MEH; Michael Fleisher, et al. v. Janus Capital Management, LLC, 04-CV-02395 - -MSK-CBS). The action was filed in 2004 by fund investors asserting breach of fiduciary duty under Section 36(b) of the 1940 Act. The plaintiffs seek declaratory and injunctive relief and an unspecified amount of damages. The trial is scheduled to commence on May 21, 2007.
In 2001, Janus Capital's predecessor was also named as a defendant in a class action suit in the U.S. District Court for the Southern District of New York, alleging that certain underwriting firms and institutional investors violated antitrust laws in connection with initial public offerings (Pfeiffer v. Credit Suisse First Boston aka In re Initial Public Offering Antitrust Litigation, U.S. District Court, Southern District of New York, Case No. 01-CV-2014). The U.S. District Court dismissed the p laintiff's antitrust claims in November 2003; however, the U.S. Court of Appeals vacated that decision and remanded it for further proceedings. In March 2006, the defendants, including Janus Capital, filed a Petition for a Writ of Certiorari with the U.S. Supreme Court to review the decision of the U.S. Court of Appeals. In June 2006, the U.S. Supreme Court invited the U.S. Solicitor General to file a brief expressing the view of the United States, and in November 2006, the Solicitor General filed a brief expressing its view on the matter. The U.S. Supreme Court has granted the Petition for a Writ of Certiorari and the parties are in the process of briefing the matter for the U.S. Supreme Court.
Additional lawsuits may be filed against certain of the Janus funds, Janus Capital, and related parties in the future. Janus Capital does not currently believe that these pending actions will materially affect its ability to continue providing services it has agreed to provide to the Janus funds.
Janus Aspen Series December 31, 2006 21
Report of Independent Registered Public Accounting Firm
To the Trustees and Shareholders
of Janus Aspen INTECH Risk-Managed Growth Portfolio
In our opinion, the accompanying statement of assets and liabilities, including the schedule of investments, and the related statements of operations and of changes in net assets and the financial highlights present fairly, in all material respects, the financial position of Janus Aspen INTECH Risk-Managed Growth Portfolio (formerly Janus Aspen Risk-Managed Growth Portfolio) (one of the portfolios constituting Janus Aspen Series, hereafter referred to as the "Portfolio") at December 31, 2006, the results of its operations for the year then ended, the changes in its net assets for each of the two years in the period then ended, and the financial highlights for each of the periods indicated, in conformity with accounting principles generally accepted in the United States of America. These financial statements and financial highlights (hereafter referred to as "financial statements") are the responsibility of the Portfolio's management; our res ponsibility is to express an opinion on these financial statements based on our audits. We conducted our audits of these financial statements in accordance with the standards of the Public Company Accounting Oversight Board (United States). Those standards require that we plan and perform the audit to obtain reasonable assurance about whether the financial statements are free of material misstatement. An audit includes examining, on a test basis, evidence supporting the amounts and disclosures in the financial statements, assessing the accounting principles used and significant estimates made by management, and evaluating the overall financial statement presentation. We believe that our audits, which included confirmation of securities at December 31, 2006 by correspondence with the custodian, transfer agent and brokers, and the application of alternative auditing procedures where securities purchased had not been received, provide a rea sonable basis for our opinion.

PricewaterhouseCoopers LLP
Denver, Colorado
February 12, 2007
22 Janus Aspen Series December 31, 2006
Additional Information (unaudited)
PROXY VOTING POLICIES AND VOTING RECORD
A description of the policies and procedures that the Portfolio uses to determine how to vote proxies relating to its portfolio securities is available: (i) without charge, upon request, by calling 1-800-525-0020 (toll free); (ii) on the Portfolio's website at www.janus.com/proxyvoting; and (iii) on the SEC's website at http://www.sec.gov. Additionally, information regarding the Portfolio's proxy voting record for the most recent twelve-month period ended June 30 is also available, free of charge, through www.janus.com/proxyvoting and from the SEC's website at http://www.sec.gov.
QUARTERLY PORTFOLIO HOLDINGS
The Portfolio files its complete portfolio holdings (schedule of investments) with the SEC for the first and third quarters of each fiscal year on Form N-Q within 60 days of the end of such fiscal quarter. The Portfolio's Form N-Q: (i) is available on the SEC's website at http://www.sec.gov; (ii) may be reviewed and copied at the SEC's Public Reference Room in Washington, D.C. (information on the Public Reference Room may be obtained by calling 1-800-SEC-0330); and (iii) is available without charge, upon request, by calling Janus at 1-800-525-0020 (toll free).
APPROVAL OF ADVISORY AGREEMENTS DURING THE PERIOD
The Trustees of Janus Aspen Series, more than eighty-five percent of whom have never been affiliated with the Adviser ("Independent Trustees"), oversee the management of each of the Portfolios and, as required by law, determine annually whether to continue the investment advisory agreement for each Portfolio and the subadvisory agreements for the three Portfolios that utilize subadvisers.
In connection with their most recent consideration of those agreements for each of the Portfolios, the Trustees received and reviewed a substantial amount of information provided by Janus Capital (the "Adviser") and the respective subadvisers in response to requests of the Independent Trustees and their independent legal counsel. They also received and reviewed a considerable amount of information and analysis provided to the Trustees by their independent fee consultant. Throughout their consideration of the agreements the Independent Trustees were advised by their independent legal counsel. The Independent Trustees met on two separate occasions with management to consider the agreements, and at each of those meetings they also met separately in executive session with their independent legal counsel.
At a meeting held on December 20, 2006, based on their evaluation of the information provided by the Adviser, the subadvisers and the independent fee consultant and other information, the Trustees determined that the overall arrangements between each Portfolio and the Adviser were fair and reasonable in light of the nature, extent and quality of the services provided by the Adviser, its affiliates and the subadvisers, the fees charged for those services, and other matters that the Trustees considered relevant in the exercise of their business judgment. At that meeting all of the Trustees unanimously approved the continuation of the investment advisory agreement for each Portfolio, and the subadvisory agreement for each subadvised Portfolio, for the period from February 1, 2007 through February 1, 2008, subject to earlier termination as provided in each agreement.
In considering the continuation of those agreements, the Trustees reviewed and analyzed various factors that they determined were relevant, including the factors described below, none of which by itself was considered dispositive. However, the material factors and conclusions that formed basis for the Trustees' determination to approve the continuation of the agreements are discussed separately below.
Nature, Extent and Quality of Services
The Trustees reviewed the nature, extent and quality of the services of Janus Capital and the subadvisers to the Funds, taking into account the investment objective and strategy of each Portfolio and the knowledge the Trustees gained from their regular meetings with management on at least a quarterly basis and their ongoing review of information related to the Funds. In addition, the Trustees reviewed the resources and key personnel of Janus Capital and each subadviser, especially those who provide investment management services to the Portfolios. The Trustees also considered other services provided to the Portfolios by Janus Capital or the subadvisers, such as managing the execution of portfolio transactions and the selection of broker-dealers for those transactions, serving as the Portfolios' administrator, monitoring adherence to the Portfolios' investment restrictions, producing shareholder reports, providing support services for the Tru stees and Trustee committees, communicating with shareholders and overseeing the activities of other service providers, including monitoring compliance with various policies and procedures of the Portfolios and with applicable securities laws and regulations.
The Trustees concluded that: the nature, extent and quality of the services provided by Janus Capital or the subadviser to each Portfolio were appropriate and consistent with the terms of the respective advisory and subadvisory agreements; that, taking into account steps taken to address a small portion of the Portfolios whose performance lagged that of their peers for certain periods, the quality of those services had been consistent with or superior to quality norms in the industry; and that the Portfolios were likely to benefit from the continued provision of those services. They also concluded that each of Janus Capital and each subadviser had sufficient
Janus Aspen Series December 31, 2006 23
Additional Information (unaudited) (continued)
personnel, with the appropriate education and experience, to serve the Portfolios effectively and had demonstrated its continuing ability to attract and retain well-qualified personnel.
Performance of the Funds
The Trustees considered the performance results of each Portfolio over various time periods. They reviewed information comparing each Portfolio's performance with the performance of comparable funds and peer groups identified by Lipper Inc., an independent provider of investment company data, and with the Portfolio's benchmark. They concluded that the performance of most Portfolios was good to very good. Although the performance of some Portfolios lagged that of their peers for certain periods, the Trustees also concluded that Janus Capital had taken appropriate steps to address those instances of under-performance and that the more recent performance of most of those Portfolios had been improving.
Costs of Services Provided
The Trustees examined information on the fees and expenses of each Portfolio in comparison to similar information for other comparable funds as provided by Lipper. They also reviewed an analysis of that information provided by their independent fee consultant and noted that the rate of management (investment advisory and administrative) fees for most of the Portfolios, after contractual expense limitations, was below the mean management fee rate of the respective peer group of funds selected by Lipper.
The Trustees considered the methodology used by Janus Capital and each subadviser in determining compensation payable to portfolio managers, the competitive environment for investment management talent and the competitive market for mutual funds in different distribution channels. They concluded that the compensation methodology provided a good alignment of the interests of the portfolio managers with the interests of Portfolio shareholders.
The Trustees also reviewed management fees charged by Janus Capital to its separate account clients and to its subadvised funds (for which Janus Capital provides only portfolio management services). Although in most instances subadvisory and separate account fee rates for various investment strategies were lower than management fees for Portfolios having a similar strategy, the Trustees noted that Janus Capital performs significant additional services for the Portfolios that it does not provide to those other clients, including administrative services, oversight of the Portfolios' other service providers, trustee support, regulatory compliance and numerous other services, and that, in serving the Portfolios, Janus Capital assumes many legal risks that it does not assume in servicing its other clients. Moreover, they noted that the spread between the average fees charged to the Portfolios and the fees that Janus Capital charged to its separate account clients was significantly smaller than the average spread for such fees of other advisers, based on publicly available data and research conducted by their independent fee consultant.
In considering the fees charged by Janus Capital, the Trustees had previously negotiated with Janus Capital a temporary contingent waiver of a portion the investment advisory fee paid by Janus Aspen Worldwide Growth Portfolio to Janus Capital to provide for a possible reduction in the rate of advisory fee payable by the Portfolio for the period July 1, 2006 through January 31, 2007 if the investment performance of the Fund should lag that of its benchmark performance over the applicable performance measurement period. Commencing in February 2007, the previously approved performance-based fee schedule will become operative.
The Trustees reviewed information on the profitability of Janus Capital and its affiliates of their relationships with each Portfolio, as well as an explanation of the methodology utilized in allocating various expenses among the Portfolios and other clients. The Trustees also reviewed the financial statements of Janus Capital's parent company and its corporate structure. In their review, the Trustees considered whether Janus Capital and each subadviser receive adequate incentives to manage the Portfolios effectively. The Trustees recognized that profitability comparisons among fund managers are difficult because very little comparative information is publicly available and profitability of any manager is affected by numerous factors, including the organizational structure of the particular manager, the types of funds and other accounts it manages, possible other lines of business, the methodology for allocating expenses and the manager's ca pital structure and cost of capital. However, based on the information available and taking those factors into account, the Trustees concluded that Janus Capital's profitability with respect to each Portfolio in relation to the services rendered was not unreasonable.
The Trustees concluded that the management fees and other compensation payable by each Fund to Janus Capital and its affiliates, as well as the fees paid by Janus Capital to the subadvisers of subadvised Portfolios, were reasonable in relation to the nature and quality of the services provided, taking into account the fees charged by other advisers for managing comparable mutual funds with similar strategies and the fees Janus Capital and the subadviser charges to other clients. The Trustees also concluded that the overall expense ratio of each Portfolio was reasonable, taking into account the size of the Portfolio, the quality of services provided by Janus Capital and any subadviser, the investment performance of the
24 Janus Aspen Series December 31, 2006
Portfolio and any expense limitations agreed to by Janus Capital.
Economies of Scale
The Trustees considered information about the potential for Janus Capital to realize economies of scale as the assets of the Portfolios increase. They noted that, although most Portfolios pay advisory fees at a fixed rate as a percentage of net assets, without any breakpoints, the management fee paid by each Portfolio, after any contractual expense limitations, was below the mean management fee rate of the Portfolio's peer group selected by Lipper; and, for those Portfolios whose expenses are being reduced by the contractual expense limitations of Janus Capital, Janus Capital is subsidizing the Portfolios because they have not reached adequate scale. Moreover, as the assets of many of the Portfolios have declined in the past few years, the Portfolios have benefited from having advisory fee rates that have remained constant rather than increasing as assets decline. In addition, performance fee structures have been implemented for several Port folios that will cause the effective rate of advisory fees payable by such a Portfolio to vary depending on the investment performance of the Portfolio relative to its benchmark; and a few Portfolios have fee schedules with breakpoints and reduced fee rates above certain asset levels. The Trustees also noted that the Portfolios share directly in economies of scale through lower charges of third-party service providers based on the combined scale of all of the Portfolios. Based on all of the information they reviewed, the Trustees concluded that the current fee structure of each Portfolio was reasonable and that the current rates of fees do reflect a sharing between Janus Capital and the Portfolio of economies of scale at the current asset level of the Portfolio.
Other Benefits to Janus Capital
The Trustees also considered benefits that accrue to Janus Capital and its affiliates from their relationships with the Portfolios. They recognized that two affiliates of Janus Capital separately serve the Portfolios as transfer agent and distributor, respectively, and that the transfer agent receives compensation from the non-money market Portfolios for services provided. The Trustees also considered Janus Capital's use of commissions paid by Portfolios on their portfolio brokerage transactions to obtain proprietary research products and services benefiting the Portfolios and/or other clients of Janus Capital, as well as Janus Capital's agreement not to use any Portfolio's brokerage transactions to obtain third party research products or services. The Trustees concluded that Janus Capital's use of "soft" commission dollars to obtain proprietary research products and services was consistent with regulatory requirements and guidelines and was likely to benefit each Portfolio. The Trustees also concluded that, other than the services provided by Janus Capital and its affiliates pursuant to the agreements and the fees to be paid by each Portfolio therefor, the Portfolios and Janus Capital may potentially benefit from their relationship with each other in other ways. They concluded that Janus Capital benefits from the receipt of proprietary research products and services acquired through commissions paid on portfolio transactions of the Portfolios and that the Portfolios benefit from Janus Capital's receipt of those products and services as well as research products and services acquired through commissions paid by other clients of Janus Capital. They further concluded that success of any Portfolio could attract other business to Janus Capital or other Janus Funds and that the success of Janus Capital could enhance Janus Capital's ability to serve the Portfolios.
After full consideration of the above factors as well as other factors, all of the Trustees, including all of the Independent Trustees, concluded that the proposed continuation of the investment advisory agreement for each applicable Portfolio were in the best interest of the respective Portfolios and their shareholders.
Janus Aspen Series December 31, 2006 25
Explanations of Charts, Tables and
Financial Statements (unaudited)
1. PERFORMANCE OVERVIEWS
The performance overview graph compares the performance of a hypothetical $10,000 investment in the Portfolio with one or more widely used market indices. The hypothetical example does not represent the returns of any particular investment.
When comparing the performance of the Portfolio with an index, keep in mind that market indices do not include brokerage commissions that would be incurred if you purchased the individual securities in the index. They also do not include taxes payable on dividends and interest or operating expenses incurred if you maintained a Portfolio invested in the index.
Average annual total return is calculated by taking the growth or decline in value of an investment over a period of time, including reinvestment of any dividends, distributions and capital gains, then calculating the annual compounded percentage rate that would have produced the same result had the rate of growth been constant throughout the period. Average annual total return does not reflect the deduction of taxes that a shareholder would pay on Portfolio distributions or redemptions of Portfolio shares.
2. SCHEDULE OF INVESTMENTS
Following the performance overview section is the Portfolio's Schedule of Investments. This schedule reports the industry concentrations and types of securities held in the Portfolio on the last day of the reporting period. Securities are usually listed by type (common stock, corporate bonds, U.S. Government obligations, etc.) and by industry classification (banking, communications, insurance, etc.). Holdings are subject to change without notice.
The value of each security is quoted as of the last day of the reporting period. The value of securities denominated in foreign currencies is converted into U.S. dollars. Certain short-term investments maturing within 60 days are valued at amortized cost, which approximates market value.
A summary of investments by country is provided if the Portfolio invested in foreign securities. This summary reports the Portfolio's exposure to different countries by providing the percentage of securities invested in each country. The country of each security represents the country in which the company is incorporated.
2A. FORWARD CURRENCY CONTRACTS
A table listing forward currency contracts follows the Portfolio's Schedule of Investments (if applicable). Forward currency contracts are agreements to deliver or receive a preset amount of currency at a future date. Forward currency contracts are used to hedge against foreign currency risk in the Portfolio's long-term holdings. The table provides the name of the foreign currency, the settlement date of the contract, the amount of the contract, the value of the currency in U.S. dollars and the amount of unrealized gain or loss. The amount of unrealized gain or loss reflects the change in currency exchange rates from the time the contract was opened to the last day of the reporting period.
2B. FUTURES
A table listing futures contracts follows the Portfolio's Schedule of Investments (if applicable). Futures contracts are contracts that obligate the buyer to receive and the seller to deliver an instrument or money at a specified price on a specified date. Futures are used to hedge against adverse movements in securities prices, currency risk or interest rates.
The table provides the name of the contract, number of contracts held, the expiration date, the principal amount, value and the amount of unrealized gain or loss. The amount of unrealized gain or loss reflects the marked-to- market amount for the last day of the reporting period.
3. STATEMENT OF ASSETS AND LIABILITIES
This statement is often referred to as the "balance sheet." It lists the assets and liabilities of the Portfolio on the last day of the reporting period.
The Portfolio's assets are calculated by adding the value of the securities owned, the receivable for securities sold but not yet settled, the receivable for dividends declared but not yet received on stocks owned and the receivable for Portfolio shares sold to investors but not yet settled. The Portfolio's liabilities include payables for securities purchased but not yet settled, Portfolio shares redeemed but not yet paid and expenses owed but not yet paid. Additionally, there may be other assets and liabilities such as unrealized gain or loss on forward currency contracts.
The section entitled "Net Assets Consist of" breaks down the components of the Portfolio's net assets. Because the Portfolio must distribute substantially all earnings, you will notice that a significant portion of net assets is shareholder capital.
The last section of this statement reports the net asset value ("NAV") per share on the last day of the reporting period for each class of the Portfolio. The NAV is calculated by dividing the Portfolio's net assets (assets minus liabilities) by the number of shares outstanding.
4. STATEMENT OF OPERATIONS
This statement details the Portfolio's income, expenses, gains and losses on securities and currency transactions, and appreciation or depreciation of current Portfolio holdings.
The first section in this statement, entitled "Investment Income," reports the dividends earned from stocks and interest earned from interest-bearing securities in the Portfolio.
The next section reports the expenses and expense offsets incurred by the Portfolio, including the advisory fee paid to the investment adviser and transfer agent fees and expenses,
26 Janus Aspen Series December 31, 2006
and printing and postage for mailing statements, financial reports and prospectuses. Expense offsets, if any, are also shown.
The last section lists the increase or decrease in the value of securities held in the Portfolio. The Portfolio realizes a gain (or loss) when it sells its position in a particular security. An unrealized gain (or loss) refers to the change in net appreciation or depreciation of the Portfolio during the reporting period. "Net Realized and Unrealized Gain/(Loss) on Investments" is affected both by changes in the market value of Portfolio holdings and by gains (or losses) realized during the reporting period.
5. STATEMENT OF CHANGES IN NET ASSETS
This statement reports the increase or decrease in the Portfolio's net assets during the reporting period. Changes in the Portfolio's net assets are attributable to investment operations, dividends, distributions and capital share transactions. This is important to investors because it shows exactly what caused the Portfolio's net asset size to change during the period.
The first section summarizes the information from the Statement of Operations regarding changes in net assets due to the Portfolio's investment performance. The Portfolio's net assets may also change as a result of dividend and capital gains distributions to investors. If investors receive their dividends in cash, money is taken out of the Portfolio to pay the distribution. If investors reinvest their dividends, the Portfolio's net assets will not be affected. If you compare the Portfolio's "Net Decrease from Dividends and Distributions" to the "Reinvested dividends and distributions," you will notice that dividend distributions had little effect on the Portfolio's net assets. This is because the majority of Janus investors reinvest their distributions.
The reinvestment of dividends is included under "Capital Share Transactions." "Capital Shares" refers to the money investors contribute to the Portfolio through purchases or withdraw via redemptions. The Portfolio's net assets will increase and decrease in value as investors purchase and redeem shares from the Portfolio.
6. FINANCIAL HIGHLIGHTS
This schedule provides a per-share breakdown of the components that affect the Portfolio's NAV for current and past reporting periods. Not only does this table provide you with total return, it also reports total distributions, asset size, expense ratios and portfolio turnover rate.
The first line in the table reflects the NAV per share at the beginning of the reporting period. The next line reports the net investment income per share, which comprises dividends and interest income earned on securities held by the Portfolio. Following is the total of gains/(losses), realized and unrealized. Dividends and distributions are then subtracted to arrive at the NAV per share at the end of the period. The next line reflects the average annual total return reported the last day of the period.
Also included are the expense ratios, or the percentage of net assets that are used to cover operating expenses during the period. Expense ratios vary for a number of reasons, including the differences in management fees, the average shareholder account size and the extent of foreign investments, which entail greater transaction costs.
The Portfolio's expenses may be reduced through expense reduction arrangements. These arrangements may include the use of balance credits or transfer agent fee offsets. The Statement of Operations reflects total expenses before any such offset, the amount of offset and the net expenses. The expense ratios listed in the Financial Highlights reflect total expenses prior to any expense offsets (gross expense ratio) and after the expense offsets (net expense ratio). Both expense ratios reflect expenses after waivers (reimbursements), if applicable.
The ratio of net investment income/(loss) summarizes the income earned less expenses, divided by the average net assets of the Portfolio during the reporting period. Don't confuse this ratio with the Portfolio's yield. The net investment income ratio is not a true measure of the Portfolio's yield because it doesn't take into account the dividends distributed to the Portfolio's investors.
The next ratio is the portfolio turnover rate, which measures the buying and selling activity in a Portfolio. Portfolio turnover is affected by market conditions, changes in the asset size of a Portfolio, the nature of the Portfolio's investments and the investment style of the portfolio manager. A 100% rate implies that an amount equal to the value of the entire portfolio is turned over in a year; a 50% rate means that an amount equal to the value of half the portfolio is traded in a year; and a 200% rate means that an amount equal to the value of the portfolio is traded every six months.
Janus Aspen Series December 31, 2006 27
Designation Requirements (unaudited)
For federal income tax purposes, the Portfolio designated the following for the year ended December 31, 2006:
Capital Gain Distributions
| Portfolio | |||||||
| Janus Aspen INTECH Risk-Managed Growth Portfolio(1) | $ | 442,094 | |||||
(1) Formerly named Janus Aspen Risk-Managed Growth Portfolio
28 Janus Aspen Series December 31, 2006
Trustees and Officers (unaudited)
The Portfolio's Statement of Additional Information includes additional information about the Trustees and officers and is available, without charge, by calling 1-800-525-0020.
The following are the Trustees and officers of the Trust, together with a brief description of their principal occupations during the last five years (principal occupations for certain Trustees may include periods over five years).
Each Trustee has served in that capacity since he or she was originally elected or appointed. The Trustees do not serve a specified term of office. Each Trustee will hold office until the termination of the Trust or his or her earlier death, resignation, retirement, incapacity or removal. The retirement age for Trustees is 72. The Portfolio's Nominating and Governance Committee will consider nominees for the position of Trustee recommended by shareholders. Shareholders may submit the name of a candidate for consideration by the Committee by submitting their recommendations to the Trust's Secretary. Each Trustee is currently a Trustee of two other registered investment companies advised by Janus Capital: Janus Investment Fund and Janus Adviser Series. As of the date of this report, collectively, these three registered investment companies consist of 69 series or funds.
The Trust's officers are elected annually by the Trustees for a one-year term. Certain officers also serve as officers of Janus Investment Fund and Janus Adviser Series. Certain officers of the Portfolio may also be officers and/or directors of Janus Capital. Portfolio officers receive no compensation from the Portfolio, except for the Portfolio's Chief Compliance Officer, as authorized by the Trustees.
Trustees
| Name, Age and Address | Positions Held with Portfolio | Length of Time Served | Principal Occupations During the Past Five Years | Number of Portfolios in Fund Complex Overseen by Trustee | Other Directorships Held by Trustee | ||||||||||||||||||
| Independent Trustees | |||||||||||||||||||||||
| Dennis B. Mullen 151 Detroit Street Denver, CO 80206 Age 63 | Chairman Trustee | 3/04-Present 9/93-Present | Chief Executive Officer of Red Robin Gourmet Burgers, Inc. (since 2005). Formerly, private investor. | 69 | * | Chairman of the Board (since 2005) and Director of Red Robin Gourmet Burgers, Inc.; and Director of Janus Capital Funds Plc (Dublin-based, non-U.S. funds). | |||||||||||||||||
| Jerome S. Contro 151 Detroit Street Denver, CO 80206 Age 50 | Trustee | 12/05-Present | Partner of Tango Group, a private investment firm (since 1999). | 69 | Trustee and Chairman of RS Investment Trust (since 2001); Director of IZZE Beverages and MyFamily.com, Inc. (genealogical research website). | ||||||||||||||||||
| William F. McCalpin 151 Detroit Street Denver, CO 80206 Age 49 | Trustee | 6/02-Present | Private Investor. Formerly, Vice President of Asian Cultural Council and Executive Vice President and Chief Operating Officer of The Rockefeller Brothers Fund (a private family foundation). | 69 | Director of the F.B. Heron Foundation (a private grantmaking foundation). | ||||||||||||||||||
| John W. McCarter, Jr. 151 Detroit Street Denver, CO 80206 Age 68 | Trustee | 6/02-Present | President and Chief Executive Officer of The Field Museum of Natural History (Chicago, IL). | 69 | Chairman of the Board and Director of Divergence Inc. (biotechnology firm); Director of W.W. Grainger, Inc. (industrial distributor); and Trustee of WTTW (Chicago public television station) and the University of Chicago. | ||||||||||||||||||
Janus Aspen Series December 31, 2006 29
Trustees and Officers (unaudited) (continued)
Trustees (cont.)
| Name, Age and Address | Positions Held with Portfolio | Length of Time Served | Principal Occupations During the Past Five Years | Number of Portfolios in Fund Complex Overseen by Trustee | Other Directorships Held by Trustee | ||||||||||||||||||
| Independent Trustees (cont.) | |||||||||||||||||||||||
| James T. Rothe 151 Detroit Street Denver, CO 80206 Age 63 | Trustee | 1/97-Present | Co-founder and Managing Director of Roaring Fork Capital Management, LLC (private investment in public equity firm); and Professor Emeritus of Business of the University of Colorado, Colorado Springs, CO (since 2004). Formerly, Professor of Business of the University of Colorado (2002-2004); and Distinguished Visiting Professor of Business (2001-2002) of Thunderbird University (American Graduate School of International Management), Glendale, AZ. | 69 | Director of Red Robin Gourmet Burgers, Inc. | ||||||||||||||||||
| William D. Stewart 151 Detroit Street Denver, CO 80206 Age 62 | Trustee | 9/93-Present | Corporate Vice President and General Manager of MKS Instruments – HPS Products, Boulder, CO (a manufacturer of vacuum fittings and valves). | 69 | N/A | ||||||||||||||||||
| Martin H. Waldinger 151 Detroit Street Denver, CO 80206 Age 68 | Trustee | 9/93-Present | Private Investor and Consultant to California Planned Unit Developments. Formerly, CEO and President of Marwal, Inc. (homeowner association management company). | 69 | N/A | ||||||||||||||||||
| Linda S. Wolf 151 Detroit Street Denver, CO 80206 Age 59 | Trustee | 12/05-Present | Retired. Formerly, Chairman and Chief Executive Officer of Leo Burnett (Worldwide) (advertising agency) (2001-2005). | 69 | Director of Wal-Mart, The Field Museum of Natural History (Chicago, IL), Children's Memorial Hospital (Chicago, IL), Chicago Council on Foreign Relations, Economic Club of Chicago, and InnerWorkings (a provider of print procurement solutions). | ||||||||||||||||||
| Interested Trustee | |||||||||||||||||||||||
| Thomas H. Bailey** 151 Detroit Street Denver, CO 80206 Age 69 | Trustee | 5/93-Present | Retired. Formerly, President (1978-2002) and Chief Executive Officer (1994-2002) of Janus Capital or Janus Capital Corporation; Chairman and Director (1978-2002) of Janus Capital Corporation; President and Director (1994-2002) of The Janus Foundation. | 69 | N/A | ||||||||||||||||||
* Mr. Mullen also serves as director of Janus Capital Funds Plc, consisting of 22 funds. Including Janus Capital Funds Plc and the 69 funds comprising the Janus Funds, Mr. Mullen oversees 91 funds.
** The Portfolio is treating Mr. Bailey as an "interested person" of the Trust by virtue of his past positions and continuing relationships with Janus Capital and ownership of shares of Janus Capital's parent company.
30 Janus Aspen Series December 31, 2006
Officers
| Name, Age and Address | Positions Held with Portfolio | Term of Office* and Length of Time Served | Principal Occupations During the Past Five Years | ||||||||||||
| Stephanie Grauerholz-Lofton 151 Detroit Street Denver, CO 80206 Age 36 | Chief Legal Counsel and Secretary Vice President | 1/06-Present 03/06-Present | Assistant Vice President of Janus Capital and Janus Distributors LLC; and Associate Counsel of Janus Capital. Formerly, Associate of Vedder, Price, Kaufman & Kammholz, P.C. (1999-2003). | ||||||||||||
| Kelley Abbott Howes 151 Detroit Street Denver, CO 80206 Age 41 | President and Chief Executive Officer | 1/06-Present | President of Janus Services LLC; Senior Vice President and General Counsel of Janus Capital; and Senior Vice President and Assistant General Counsel of Janus Distributors LLC. Formerly, Vice President (1999-2005) of Janus Distributors LLC; Senior Vice President and General Counsel (2004-2006), Vice President (2000-2004), and Assistant General Counsel (2002-2004) of Janus Services LLC; and Vice President and Assistant General Counsel (1999-2004) of Janus Capital. | ||||||||||||
| David R. Kowalski 151 Detroit Street Denver, CO 80206 Age 49 | Vice President and Chief Compliance Officer | 6/02-Present | Senior Vice President and Chief Compliance Officer of Janus Capital, Janus Distributors LLC, and Janus Services LLC; Chief Compliance Officer of Bay Isle Financial LLC; and Vice President of Enhanced Investment Technologies LLC. Formerly, Chief Compliance Officer of Enhanced Investment Technologies, LLC (2003-2005); Vice President of Janus Capital (2000-2005), Janus Distributors LLC (2000-2001), and Janus Services LLC (2004-2005); and Assistant Vice President of Janus Services LLC (2002-2004). | ||||||||||||
| Jesper Nergaard 151 Detroit Street Denver, CO 80206 Age 44 | Chief Financial Officer Vice President, Treasurer, and Principal Accounting Officer | 3/05-Present 2/05-Present | Vice President of Janus Capital. Formerly, Director of Financial Reporting for OppenheimerFunds, Inc. (2004-2005); Site Manager and First Vice President of Mellon Global Securities Services (2003); and Director of Fund Accounting, Project Development, and Training of INVESCO Funds Group (1994-2003). | ||||||||||||
* Officers are elected at least annually for a one-year term and may also be elected from time to time by the Trustees for an interim period.
Janus Aspen Series December 31, 2006 31
Notes
32 Janus Aspen Series December 31, 2006
Notes
Janus Aspen Series December 31, 2006 33
Janus provides access to a wide range of investment disciplines.
Growth
Janus growth portfolios focus on companies believed to be the leaders in their respective industries, with solid management teams, expanding market share, margins and efficiencies.
Core
Janus core portfolios seek investments in more stable and predictable companies. These portfolios look for a strategic combination of steady growth and for certain portfolios, some degree of income.
Risk-Managed
Our risk-managed portfolios seek to outperform their respective indices while maintaining a risk profile equal to or lower than the index itself. Managed by INTECH (a Janus subsidiary), these portfolios use a mathematical process in an attempt to build a more "efficient" portfolio than the index.
Value
Janus value portfolios invest in companies they believe are poised for a turnaround or are trading at a significant discount to fair value. The goal is to gain unique insight into a company's true value and identify and evaluate potential catalysts that may unlock shareholder value.
International & Global
Janus international and global portfolios seek to leverage Janus' research capabilities by taking advantage of inefficiencies in foreign markets, where accurate information and analytical insight are often at a premium.
Bond & Money Market
Janus bond portfolios attempt to provide less risk relative to equities while seeking to deliver a competitive total return through high current income and appreciation. Janus money market portfolios seek maximum current income consistent with stability of capital.
For more information about our funds, contact your investment professional or go to www.janus.com/info
Please consider the charges, risks, expenses and investment objectives carefully before investing. For a prospectus containing this and other information, please call Janus at 1-800-525-0020 or download the file from www.janus.com/info. Read it carefully before you invest or send money.
An investment in a money market portfolio is not insured or guaranteed by the Federal Deposit Insurance Corporation or any other government agency. Although the Portfolio seeks to preserve the value of your investment at $1.00 per share, it is possible to lose money by investing in the Portfolio.

151 Detroit Street
Denver, CO 80206
1-800-525-0020
Portfolios distributed by Janus Distributors LLC (1/07)
C-0207-169 109-02-717 01-07
2006 Annual Report
Janus Aspen Series
Janus Aspen International Growth Portfolio
Look Inside. . .
• Portfolio management perspective
• Investment strategy behind your portfolio
• Portfolio performance, characteristics and holdings

Table of Contents
| Useful Information About Your Portfolio Report | 1 | ||||||
| Management Commentary and Schedule of Investments | 2 | ||||||
| Statement of Assets and Liabilities | 10 | ||||||
| Statement of Operations | 11 | ||||||
| Statements of Changes in Net Assets | 12 | ||||||
| Financial Highlights | 13 | ||||||
| Notes to Schedule of Investments | 15 | ||||||
| Notes to Financial Statements | 16 | ||||||
| Report of Independent Registered Public Accounting Firm | 24 | ||||||
| Additional Information | 25 | ||||||
| Explanations of Charts, Tables and Financial Statements | 28 | ||||||
| Designation Requirements | 30 | ||||||
| Trustees and Officers | 31 | ||||||
Please consider the charges, risks, expenses and investment objectives carefully before investing. For a prospectus containing this and other information, please call Janus at 1-800-525-0020 or download the file from www.janus.com/info. Read it carefully before you invest or send money.
Useful Information About Your Portfolio Report
Management Commentary
The Management Commentary in this report includes valuable insight from the Portfolio's manager as well as statistical information to help you understand how your Portfolio's performance and characteristics stack up against those of comparable indices.
Please keep in mind that the opinions expressed by the Portfolio's manager in the Management Commentary are just that: opinions. They are a reflection of the manager's best judgment at the time this report was compiled, which was December 31, 2006. As the investing environment changes, so could the manager's opinions. The views are unique to the manager and aren't necessarily shared by his fellow employees or by Janus in general.
Portfolio Expenses
We believe it's important for our shareholders to have a clear understanding of Portfolio expenses and the impact they have on investment return.
The following is important information regarding the Portfolio's Expense Example, which appears in the Management Commentary within this Annual Report. Please refer to this information when reviewing the Expense Example for the Portfolio.
Example
As a shareholder of a Portfolio, you incur two types of costs: (1) transaction costs, including redemption fees (where applicable) (and any related exchange fees) and (2) ongoing costs, including management fees; distribution and shareholder servicing (12b-1) fees (applicable to Service Shares and Service II Shares only); and other Portfolio expenses. The example is intended to help you understand your ongoing costs (in dollars) of investing in a Portfolio and to compare these costs with the ongoing costs of investing in other mutual funds. To do so, compare this 5% hypothetical example with the 5% hypothetical examples that appear in the shareholder reports of the other funds. The example is based upon an investment of $1,000 invested at the beginning of the period and held for the six-month period from July 1, 2006 to December 31, 2006.
Actual Expenses
The first line of the table in each example provides information about actual account values and actual expenses. You may use the information in this line, together with the amount you invested, to estimate the expenses that you paid over the period. Simply divide your account value by $1,000 (for example, an $8,600 account value divided by $1,000 = 8.6), then multiply the result by the number in the first line under the heading entitled "Expenses Paid During Period" to estimate the expenses you paid on your account during the period.
Hypothetical Example for Comparison Purposes
The second line of the table in each example provides information about hypothetical account values and hypothetical expenses based upon the Portfolio's actual expense ratio and an assumed rate of return of 5% per year before expenses, which is not the Portfolio's actual return. The hypothetical account values and expenses may not be used to estimate the actual ending account balance or expenses you paid for the period. You may use this information to compare the ongoing costs of investing in the Portfolio and other funds. To do so, compare this 5% hypothetical example with the 5% hypothetical examples that appear in the shareholder reports of the other funds.
Please note that the expenses shown in the tables are meant to highlight your ongoing costs only and do not reflect any transaction costs, such as redemption fees (where applicable) and any charges at the separate account level or contract level. Redemption fees are fully described in the prospectus. Therefore, the second line of each table is useful in comparing ongoing costs only, and will not help you determine the relative total costs of owning different funds. In addition, if these transaction costs and separate account or contract level charges were included, your costs would have been higher.
Janus Aspen Series December 31, 2006 1
Janus Aspen International Growth Portfolio
(unaudited)
Portfolio Snapshot
This growth portfolio invests primarily in companies located outside the U.S. Stocks are selected on their fundamental merits, rather than by geography, economic climate or industry sector.

Brent Lynn
portfolio manager
Performance Overview
During the 12-month period ended December 31, 2006, Janus Aspen International Growth Portfolio's Institutional Shares, Service Shares and Service II Shares returned 46.98%, 46.66% and 46.70%, respectively. The Portfolio's primary benchmark, the Morgan Stanley Capital International (MSCI) EAFE® Index, returned 26.34%, while its secondary benchmarks the MSCI EAFE® Growth Index and the MSCI All Country World ex-U.S. IndexSM returned 22.33% and 26.65%, respectively, for the same period. While I am very pleased with the short-term performance of the Portfolio, I continue to focus on long-term investing and performance. With that in mind, I remain confident in our research process and optimistic about the longer-term prospects for the companies in the Portfolio.
Investment Strategy
In general, global stock markets had a very positive year, driven by an environment of reasonable economic growth combined with still-moderate interest rates and inflation. The U.S. economy continued to demonstrate remarkable resilience in the face of volatile oil prices, higher short-term interest rates and a slowing housing market. The economies of continental Europe and Japan showed signs of moderate growth. China and India continued to be among the fastest-growing large economies in the world, driven by globalization, urbanization and infrastructure development. The Chinese economy has become the key growth engine for the Asian region and one of the key pillars of growth for the world.
Holdings in Hong Kong, Brazil, India and Canada significantly contributed to the Portfolio's performance during the period. On a sector basis, our investments in materials, energy, real estate and retailing companies were positive contributors to performance.
Another factor affecting the Portfolio's absolute performance was currency. During the 12-month period, currency had a positive impact of 4.07% as the Portfolio was unhedged and the dollar depreciated in value versus many global currencies. However, currency negatively affected the Portfolio relative to the benchmark. The Portfolio had significantly less exposure to the United Kingdom and Europe than its benchmark, and the European currencies and the British pound performed strongly versus the dollar during the period.
Our emerging market exposure remained at the high end of historical trends. We continued to find what we believe to be many of the most exciting investment ideas based in Asia and Brazil. We believe that many of our emerging market holdings have a combination of attractive valuations and exciting medium- to long-term growth prospects. We also believe that many emerging market companies have improved their corporate disclosure and allocation of capital.
Global financial markets corrected sharply in May and June as renewed fears about U.S. inflation and concerns over rising U.S. interest rates spread across the world. Potential Chinese austerity measures, a new Federal Reserve (Fed) Chairman and geopolitical instability added to the uncertainty in the markets. Investors responded by reducing risk levels. Some asset classes that had outperformed in recent quarters, such as commodities and emerging markets, were especially hard hit. Holding significant exposure to commodity companies and emerging market companies, the Portfolio declined significantly during the selloff.
Many of our holdings recovered in the third quarter as stocks generally bounced back and rallied through the end of the year. The Fed's mid-year decision to stop raising interest rates contributed to increased stability, as did improved U.S. inflation data and a reasonable global economic growth picture.
Although the year's volatility was unsettling, I don't believe that small moves in short-term U.S. interest rates fundamentally affect the medium- and long-term prospects for most of our companies. As the market sold off during the second quarter, we reviewed the Portfolio stock by stock. In cases where our highest conviction stocks had fallen sharply and valuations looked particularly compelling, I added to some of our existing positions.
To help fund these purchases, I sold some positions that had performed relatively well during the period. While I still believed in the management and long-term growth opportunities of many of the companies I sold, other high-conviction stocks appeared to offer more attractive valuations.
Conglomerate, Fertilizer and Consumer Product Logistics Stocks Performed Well
The leading contributor during the 12-month period was Indian conglomerate Reliance Industries. Detailed industry
2 Janus Aspen Series December 31, 2006
(unaudited)
analysis and numerous company checks by analysts Laurent Saltiel and Geoff Jay gave us confidence in the sustainability of the global petrochemicals cycle and especially the global refining cycle. With world-class assets and a strong position in the fast-growing Indian market, we believe Reliance should be able to maintain higher than industry margins in its petrochemicals and refining businesses. In addition, Geoff's analyses of Reliance's exploration properties offshore of India's east coast indicated the potential for significant increases in the company's oil and gas reserves. Laurent's and Geoff's checks and analysis gave me the confidence to hold a large position in Reliance throughout the period.
Another top performer was Canadian fertilizer company Potash Corporation of Saskatchewan. In analyzing the company, Laurent Saltiel has conducted thorough checks with global fertilizer competitors and leading agriculture logistics providers, as well as key buyers of fertilizer and agricultural commodities. Through this research, Laurent concluded that the medium-term outlook for supply and demand in potash fertilizer was very favorable for price increases, and that the company should disproportionately benefit from increased potash demand due to its strong competitive position and ability to quickly bring incremental capacity onstream at low cost. Recent trends in potash pricing and favorable negotiations with Chinese fertilizer buyers indicate that Laurent's analysis has been correct. Laurent's work on Potash gave me the confidence to significantly increase the Portfolio's position during the period.
Li & Fung, a Hong-Kong based logistics provider for the apparel and consumer product sectors, was another strong contributor to performance. Analyst Dan Kozlowski's meetings with logistics companies and retailers helped us appreciate Li & Fung's competitive advantages and open-ended, long-term growth prospects as more and more U.S. and European retailers outsource non-core areas such as manufacturing logistics for their products. Dan's meetings also helped us understand the potential for margin expansion and the potential for very accretive acquisitions of smaller logistics companies in Asia and in the U.S. Additionally, Dan's analysis gave me the conviction to build a large position in Li & Fung during the period.
Sugar, Software, Insurance and Agricultural Companies Diminished Performance
Indian sugar producers Balrampur Chini Mills, Bajaj Hindusthan and Shree Renuka Sugars were among the detractors to Portfolio performance during the period. These stocks were hit as a result of a sharp fall in global sugar prices and a temporary ban on sugar exports by the Indian government. In hindsight, I had been overly optimistic about the short- and medium-term outlook for sugar prices. However, I held onto these positions during the period because of attractive valuations and very strong sugar capacity expansions at each of these companies.
Japanese parking lot operator Park24 also underperformed during the period. Having liquidated the Portfolio's position early in the year, following a strong 2005 performance, we reestablished a position during the second quarter as profit taking by investors weighed on the shares. Although the underperformance versus our expectations continued, we believe the company runs a solid business and we remain optimistic about the company's plans to expand capacity and grow profits.
Investment Strategy and Outlook
By nature, global stock markets often experience significant volatility. During volatile periods, such as the one we experienced last May and June, the conviction to hold onto existing positions or buy new ones is critical. My conviction comes from the tremendous, in-depth fundamental research our analyst team does on a daily basis. In this letter, I've tried to provide a few examples of the value-added research performed by our team. Laurent, Geoff and Dan and the rest of Janus' investment team travel thousands of miles every year meeting competitors, suppliers and customers of the companies in the Portfolio. These meetings help us understand our companies better and lay the foundation for high-conviction investments in the Portfolio.
During the past 12 months, the markets and the Portfolio performed well. I consider 12 months to be a short length of time, and in future 12-month periods, the performance of the Portfolio may certainly be worse or even negative. Throughout turbulent markets, I have not changed my investment approach. I believe the best way to generate solid long-term returns is to make high-conviction, long-term investments in world-class companies with exciting growth prospects trading at undeservedly low valuations. As manager of the Portfolio, my sole focus is to deliver strong, long-term performance for you. I will perform this job to the best of my ability.
Thank you for your continued investment in Janus Aspen International Growth Portfolio.
Janus Aspen Series December 31, 2006 3
Janus Aspen International Growth Portfolio
(unaudited)
Janus Aspen International Growth Portfolio At a Glance
5 Largest Contributors to Performance – Holdings
| Contribution | |||||||
| Reliance Industries, Ltd. Industrial conglomerate with multiple lines of business - India | 4.33 | % | |||||
| China Overseas Land & Investment, Ltd. Real estate operator and developer – Hong Kong | 3.95 | % | |||||
| Potash Corporation of Saskatchewan, Inc. Agricultural chemical producer – Canada | 3.40 | % | |||||
| Li & Fung, Ltd. Export trading business operator – Bermuda | 2.48 | % | |||||
| All America Latina Logistica (GDR) Railroad transportation provider – Brazil | 2.24 | % | |||||
5 Largest Detractors from Performance – Holdings
| Contribution | |||||||
| Balrampur Chini Mills, Ltd. Sugar producer – India | (0.58 | )% | |||||
| Bajaj Hindusthan, Ltd. Sugar producer – India | (0.39 | )% | |||||
| Park24 Company, Ltd. Commercial services provider – Japan | (0.32 | )% | |||||
| Shree Renuka Sugars, Ltd. Sugar producer – India | (0.18 | )% | |||||
| LG.Philips LCD Company, Ltd. Electronic components distributor – South Korea | (0.18 | )% | |||||
5 Largest Contributors to Performance – Sectors
| Group | Portfolio Contribution | Portfolio Weighting (% of Net Assets) | Morgan Stanley Capital International EAFE® Index Weighting | ||||||||||||
| Materials | 8.22 | % | 10.61 | % | 8.28 | % | |||||||||
| Energy | 6.89 | % | 12.92 | % | 7.88 | % | |||||||||
| Real Estate | 6.04 | % | 7.31 | % | 2.81 | % | |||||||||
| Retailing | 4.90 | % | 7.72 | % | 1.52 | % | |||||||||
| Consumer Services | 2.92 | % | 2.16 | % | 1.11 | % | |||||||||
5 Lowest Contributors/Detractors to Performance – Sectors
| Group | Portfolio Contribution | Portfolio Weighting (% of Net Assets) | Morgan Stanley Capital International EAFE® Index Weighting | ||||||||||||
| Commercial Services & Supplies | (0.31 | )% | 0.98 | % | 1.05 | % | |||||||||
| Other* | (0.17 | )% | 0.39 | % | 0.00 | % | |||||||||
| Food & Staples Retailing | (0.16 | )% | 0.16 | % | 1.94 | % | |||||||||
| Automobiles & Components | 0.24 | % | 1.07 | % | 3.95 | % | |||||||||
| Healthcare Equipment & Services | 0.39 | % | 0.91 | % | 0.82 | % | |||||||||
*Industry not classified by Global Industry Classification Standard.
4 Janus Aspen Series December 31, 2006
(unaudited)
5 Largest Equity Holdings – (% of Net Assets)
As of December 31, 2006
| Reliance Industries, Ltd. Oil Refining and Marketing | 5.1 | % | |||||
| Li & Fung, Ltd. Distribution/Wholesale | 5.0 | % | |||||
| Potash Corporation of Saskatchewan, Inc. Agricultural Chemicals | 4.8 | % | |||||
| Sony Corp. Audio and Video Products | 4.8 | % | |||||
| China Overseas Land & Investment, Ltd. Real Estate Operating/Development | 3.9 | % | |||||
| 23.6 | % | ||||||
Asset Allocation – (% of Net Assets)
As of December 31, 2006
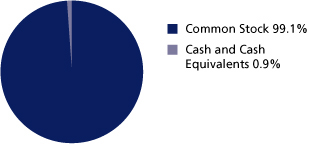
Emerging markets comprised 35.5% of total net assets.
Top Country Allocations – (% of Investment Securities)
| As of December 31, 2006 | As of December 31, 2005 | ||||||
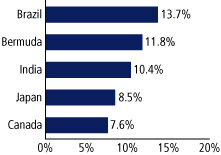 | 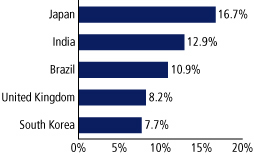 | ||||||
Janus Aspen Series December 31, 2006 5
Janus Aspen International Growth Portfolio
(unaudited)
Performance
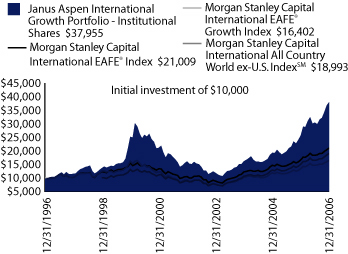
Average Annual Total Return – for the periods ended December 31, 2006
| One Year | Five Year | Ten Year | Since Inception* | ||||||||||||||||
| Janus Aspen International Growth Portfolio - Institutional Shares | 46.98 | % | 18.36 | % | 14.27 | % | 15.38 | % | |||||||||||
| Janus Aspen International Growth Portfolio - Service Shares | 46.66 | % | 18.06 | % | 13.85 | % | 15.32 | % | |||||||||||
| Janus Aspen International Growth Portfolio - Service II Shares | 46.70 | % | 18.17 | % | 13.90 | % | 15.36 | % | |||||||||||
| Morgan Stanley Capital International EAFE® Index | 26.34 | % | 14.98 | % | 7.71 | % | 7.42 | % | |||||||||||
| Morgan Stanley Capital International EAFE® Growth Index | 22.33 | % | 12.27 | % | 5.07 | % | 5.06 | %** | |||||||||||
| Morgan Stanley Capital International All Country World ex-U.S. IndexSM | 26.65 | % | 16.42 | % | N/A | 8.35 | %*** | ||||||||||||
| Lipper Quartile - Institutional Shares | 1 | st | 1 | st | 1 | st | 1 | st | |||||||||||
| Lipper Ranking - Institutional Shares based on total returns for Variable Annuity International Funds | 1/229 | 17/164 | 2/67 | 1/39 | |||||||||||||||
Data presented represents past performance, which is no guarantee of future results. Investment results and principal value will fluctuate so that shares, when redeemed, may be worth more or less than their original cost. Due to market volatility, current performance may be higher or lower than the performance shown. Call 877.33JANUS or visit www.janus.com/info for performance current to the most recent month-end.
See Notes to Schedule of Investments for index definitions.
Total return includes reinvestment of dividends from net investment income and distributions from capital gains. Net dividends reinvested are the dividends that remain to be reinvested after foreign tax obligations have been met. Such obligations vary from country to country. The returns shown do not reflect the deduction of taxes that a shareholder would pay on Portfolio distributions or the redemption of Portfolio shares.
Returns shown for Service Shares and Service II Shares for periods prior to December 31, 1999 and December 31, 2001, respectively, are derived from the historical performance of Institutional Shares, adjusted to reflect the higher operating expenses of Service Shares and Service II Shares.
These returns do not reflect the charges and expenses of any particular insurance product or qualified plan. Returns shown would have been lower had they included insurance charges.
The Portfolio may differ significantly from the securities held in the indices. The indices are not available for direct investment; therefore their performance does not reflect the expenses associated with the active management of an actual Portfolio.
Foreign investing involves special risks such as currency fluctuations and political uncertainty.
There is no assurance that the investment process will consistently lead to successful investing.
This Portfolio may have significant exposure to emerging markets. In general, emerging market investments have historically been subject to significant gains and/or losses. As such, the Fund's returns and NAV may be subject to such volatility.
The Portfolio held approximately 13.7% and 10.4% of its investments in Brazilian and Indian securities, respectively, as of December 31, 2006, and the Portfolio has experienced significant gains due, in part, to its investments in Brazil and India. While holdings are subject to change without notice, the Portfolio's returns and NAV may be affected to a large degree by fluctuations in currency exchange rates or political or economic conditions in Brazil and/or India.
For Service II Shares, a 1% redemption fee may be imposed on shares held for 60 days or less.
Lipper Inc. - A Reuters Company, is a nationally recognized organization that ranks the performance of mutual funds within a universe of funds that have similar investment objectives. Rankings are historical with capital gains and dividends reinvested.
The Portfolio's performance may be affected by risks that include those associated with nondiversification, non-investment grade debt securities, undervalued or overlooked companies, investments in specific industries or countries and potential conflicts of interest with Janus Smart Portfolios. Additional risks to the Portfolio may include those associated with investing in foreign securities, emerging markets, initial public offerings, derivatives and companies with relatively small market capitalizations. Please see a Janus prospectus or www.janus.com/info for more information about risk, fund holdings and details.
The date of the since-inception Lipper ranking is slightly different from when the Portfolio began operations since Lipper provides fund rankings as of the last day of the month or the first Thursday after fund inception.
Ranking is for the Institutional share class only; other classes may have different performance characteristics.
The Portfolio will invest at least 80% of its net assets in the type of securities described by its name.
See "Explanations of Charts, Tables and Financial Statements."
* The Portfolio's inception date – May 2, 1994
** The Morgan Stanley Capital International EAFE® Growth Index since inception returns calculated from April 30, 1994
*** The Morgan Stanley Capital International All Country World ex-U.S. IndexSM since inception returns calculated from December 31, 1998
6 Janus Aspen Series December 31, 2006
(unaudited)
Portfolio Expenses
The example below shows you the ongoing costs (in dollars) of investing in your Portfolio and allows you to compare these costs with those of other mutual funds. Please refer to page 1 for a detailed explanation of the information presented in these charts.
| Expense Example - Institutional Shares | Beginning Account Value (7/1/06) | Ending Account Value (12/31/06) | Expenses Paid During Period (7/1/06-12/31/06)* | ||||||||||||
| Actual | $ | 1,000.00 | $ | 1,244.40 | $ | 3.90 | |||||||||
| Hypothetical (5% return before expenses) | $ | 1,000.00 | $ | 1,021.73 | $ | 3.52 | |||||||||
| Expense Example - Service Shares | Beginning Account Value (7/1/06) | Ending Account Value (12/31/06) | Expenses Paid During Period (7/1/06-12/31/06)* | ||||||||||||
| Actual | $ | 1,000.00 | $ | 1,242.70 | $ | 5.31 | |||||||||
| Hypothetical (5% return before expenses) | $ | 1,000.00 | $ | 1,020.47 | $ | 4.79 | |||||||||
| Expense Example - Service II Shares | Beginning Account Value (7/1/06) | Ending Account Value (12/31/06) | Expenses Paid During Period (7/1/06-12/31/06)* | ||||||||||||
| Actual | $ | 1,000.00 | $ | 1,242.70 | $ | 5.31 | |||||||||
| Hypothetical (5% return before expenses) | $ | 1,000.00 | $ | 1,020.47 | $ | 4.79 | |||||||||
*Expenses are equal to the annualized expense ratio of 0.69% for Institutional Shares, 0.94% for Service Shares and 0.94% for Service II Shares multiplied by the average account value over the period, multiplied by 184/365 (to reflect the one-half year period).
Janus Aspen Series December 31, 2006 7
Janus Aspen International Growth Portfolio
Schedule of Investments
As of December 31, 2006
| Shares or Principal Amount | Value | ||||||||||
| Common Stock - 99.1% | |||||||||||
| Aerospace and Defense - 0.5% | |||||||||||
| 1,206,163 | BAE Systems PLC | $ | 10,054,704 | ||||||||
| Agricultural Chemicals - 4.8% | |||||||||||
| 751,986 | Potash Corporation of Saskatchewan, Inc. | 107,689,115 | |||||||||
| Agricultural Operations - 3.3% | |||||||||||
| 13,000 | BrasilAgro - Companhia Brasileira de Propriedades Agricolas* | 6,084,657 | |||||||||
| 512,860 | Bunge, Ltd.**,# | 37,187,479 | |||||||||
| 46,734,404 | Chaoda Modern Agriculture Holdings, Ltd. | 30,101,611 | |||||||||
| 73,373,747 | |||||||||||
| Audio and Video Products - 4.8% | |||||||||||
| 2,470,100 | Sony Corp. | 105,856,981 | |||||||||
| Automotive - Truck Parts and Equipment - Original - 0% | |||||||||||
| 3,510 | TI Automotive, Ltd.*,ß,oo | 0 | |||||||||
| Broadcast Services and Programming - 0.7% | |||||||||||
| 593,444 | Grupo Televisa S.A. (ADR) | 16,028,922 | |||||||||
| Building - Residential and Commercial - 2.9% | |||||||||||
| 4,122,400 | Cyrela Brazil Realty S.A. | 39,342,726 | |||||||||
| 1,139,170 | Gafisa S.A.* | 17,030,232 | |||||||||
| 666,300 | Rossi Residencial S.A. | 8,513,920 | |||||||||
| 64,886,878 | |||||||||||
| Casino Hotels - 0.2% | |||||||||||
| 219,870 | Melco PBL Entertainment (Macau), Ltd. (ADR)*,# | 4,674,436 | |||||||||
| Cellular Telecommunications - 1.0% | |||||||||||
| 519,700 | Hikari Tsushin, Inc.# | 22,839,637 | |||||||||
| Commercial Banks - 4.1% | |||||||||||
| 569,842 | Anglo Irish Bank Corporation PLC | 11,817,329 | |||||||||
| 716,965 | Banca Generali S.P.A. (144A)*,# | 9,095,154 | |||||||||
| 211,830 | Banco De Oro (GDR)* | 3,976,409 | |||||||||
| 12,074,200 | Banco De Oro* | 11,323,409 | |||||||||
| 776,335 | Banco Macro Bansud S.A. (ADR) | 24,229,414 | |||||||||
| 158,956 | Julius Baer Holding, Ltd. | 17,506,685 | |||||||||
| 1,228,014 | Punjab National Bank, Ltd. | 14,066,948 | |||||||||
| 92,015,348 | |||||||||||
| Commercial Services - 1.3% | |||||||||||
| 2,260,600 | Park24 Company, Ltd. | 28,968,657 | |||||||||
| Computers - Peripheral Equipment - 0.9% | |||||||||||
| 716,966 | Logitech International S.A.* | 20,682,277 | |||||||||
| Cosmetics and Toiletries - 1.8% | |||||||||||
| 307,640 | LG Household & Health Care, Ltd. | 40,853,269 | |||||||||
| Distribution/Wholesale - 7.5% | |||||||||||
| 5,098,000 | Esprit Holdings, Ltd.# | 56,922,631 | |||||||||
| 35,488,970 | Li & Fung, Ltd. | 110,413,983 | |||||||||
| 167,336,614 | |||||||||||
| Diversified Financial Services - 0.1% | |||||||||||
| 211,212 | Reliance Capital, Ltd. | 2,896,888 | |||||||||
| Diversified Minerals - 3.7% | |||||||||||
| 2,732,160 | Companhia Vale do Rio Doce (ADR)# | 81,254,438 | |||||||||
| Diversified Operations - 3.5% | |||||||||||
| 33,571,753 | Polytec Asset Holdings, Ltd.§ | 9,495,373 | |||||||||
| 365,300 | Bradespar S.A. | 17,269,038 | |||||||||
| 21,470,000 | Melco International Development, Ltd. | 50,898,885 | |||||||||
| 77,663,296 | |||||||||||
| Shares or Principal Amount | Value | ||||||||||
| E-Commerce/Products - 1.1% | |||||||||||
| 763,960 | Submarino S.A. | $ | 25,026,707 | ||||||||
| Electric - Distribution - 0.4% | |||||||||||
| 974,800 | Equatorial Energia S.A.* | 8,600,506 | |||||||||
| Electronic Components - Semiconductors - 6.6% | |||||||||||
| 22,499,338 | ARM Holdings PLC# | 55,397,016 | |||||||||
| 72,300 | Samsung Electronics Company, Ltd. | 47,655,807 | |||||||||
| 1,210,370 | Silicon-On-Insulator Technologies (SOITEC)* | 43,059,166 | |||||||||
| 146,111,989 | |||||||||||
| Energy - Alternate Sources - 1.9% | |||||||||||
| 288,010 | SunPower Corp. - Class A*,# | 10,705,332 | |||||||||
| 936,990 | Suntech Power Holdings Company, Ltd. (ADR)*,# | 31,867,030 | |||||||||
| 42,572,362 | |||||||||||
| Engineering - Research and Development Services - 1.1% | |||||||||||
| 1,373,306 | ABB, Ltd. | 24,625,963 | |||||||||
| Finance - Mortgage Loan Banker - 1.0% | |||||||||||
| 593,971 | Housing Development Finance Corporation, Ltd. | 21,833,064 | |||||||||
| Food - Diversified - 0.3% | |||||||||||
| 2,429,715 | FU JI Food & Catering Services# | 6,278,656 | |||||||||
| Gambling - Non-Hotel - 0.8% | |||||||||||
| 41,500 | Great Canadian Gaming Corp.* | 411,744 | |||||||||
| 439,850 | OPAP S.A. | 17,000,604 | |||||||||
| 17,412,348 | |||||||||||
| Internet Connectivity Services - 0.5% | |||||||||||
| 220,875 | NDS Group PLC (ADR)* | 10,670,471 | |||||||||
| Internet Gambling - 1.7% | |||||||||||
| 6,581,392 | IG Group Holdings PLC | 37,434,542 | |||||||||
| Investment Companies - 1.1% | |||||||||||
| 3,807,120 | SM Investments Corp. | 25,225,566 | |||||||||
| Investment Management and Advisory Services - 0.2% | |||||||||||
| 668,048 | Bluebay Asset Management* | 5,127,461 | |||||||||
| Medical - Biomedical and Genetic - 1.3% | |||||||||||
| 505,455 | Celgene Corp.* | 29,078,826 | |||||||||
| Medical - Drugs - 1.5% | |||||||||||
| 184,109 | Roche Holding A.G. | 33,014,211 | |||||||||
| Medical Instruments - 0.8% | |||||||||||
| 824,395 | Elekta AB - Class B# | 17,370,705 | |||||||||
| Multimedia - 2.2% | |||||||||||
| 2,940,611 | Publishing & Broadcasting Ltd. | 49,556,817 | |||||||||
| Non-Hazardous Waste Disposal - 0.4% | |||||||||||
| 22,322,733 | China Water Affairs Group, Ltd.*,oo,§ | 7,841,641 | |||||||||
| Oil - Field Services - 1.5% | |||||||||||
| 480,117 | Technip S.A.# | 32,956,351 | |||||||||
| Oil and Gas Drilling - 2.0% | |||||||||||
| 1,451,390 | Nabors Industries, Ltd.*,# | 43,222,394 | |||||||||
| Oil Companies - Exploration and Production - 2.0% | |||||||||||
| 625,149 | Niko Resources, Ltd. | 44,682,219 | |||||||||
| Oil Companies - Integrated - 3.4% | |||||||||||
| 336,730 | Lukoil (ADR) | 29,430,201 | |||||||||
| 205,820 | Petroleo Brasileiro S.A. (ADR) | 21,197,402 | |||||||||
| 302,975 | Suncor Energy, Inc. | 23,847,769 | |||||||||
| 74,475,372 | |||||||||||
See Notes to Schedule of Investments and Financial Statements.
8 Janus Aspen Series December 31, 2006
Schedule of Investments
As of December 31, 2006
| Shares or Principal Amount | Value | ||||||||||
| Oil Refining and Marketing - 5.6% | |||||||||||
| 161,720 | Petroplus Holdings A.G.* | $ | 9,821,321 | ||||||||
| 3,982,235 | Reliance Industries, Ltd. | 114,280,068 | |||||||||
| 124,101,389 | |||||||||||
| Public Thoroughfares - 1.0% | |||||||||||
| 121,100 | Companhia de Concessoes Rodoviarias | 1,635,261 | |||||||||
| 1,216,800 | Obrascon Huarte Lain Brasil S.A.* | 19,591,818 | |||||||||
| 21,227,079 | |||||||||||
| Real Estate Management/Services - 2.2% | |||||||||||
| 1,551,000 | Mitsubishi Estate Company, Ltd. | 40,141,843 | |||||||||
| 915,800 | Sao Carlos Empreendimentos e Participacoes S.A. | 8,337,145 | |||||||||
| 48,478,988 | |||||||||||
| Real Estate Operating/Development - 5.8% | |||||||||||
| 48,205,400 | Ayala Land, Inc. | 14,987,408 | |||||||||
| 1,573,740 | Brascan Residential Properties SA* | 13,251,384 | |||||||||
| 3,745,000 | CapitaLand, Ltd. | 15,138,712 | |||||||||
| 64,410,000 | China Overseas Land & Investment, Ltd. | 86,450,819 | |||||||||
| 129,828,323 | |||||||||||
| Recreational Centers - 0.7% | |||||||||||
| 2,096,415 | Orascom Hotels & Development* | 15,354,439 | |||||||||
| Semiconductor Components/Integrated Circuits - 2.1% | |||||||||||
| 1,863,735 | Actions Semiconductor Company, Ltd. (ADR)* | 15,469,001 | |||||||||
| 1,355,550 | Marvell Technology Group, Ltd.* | 26,013,004 | |||||||||
| 459,100 | Vimicro International Corp. (ADR)*,# | 4,682,820 | |||||||||
| 46,164,825 | |||||||||||
| Semiconductor Equipment - 1.7% | |||||||||||
| 1,553,559 | ASML Holding N.V.* | 38,636,462 | |||||||||
| Steel - Producers - 1.7% | |||||||||||
| 3,436,647 | Tata Steel, Ltd. | 37,445,165 | |||||||||
| Sugar - 2.9% | |||||||||||
| 2,202,743 | Bajaj Hindusthan, Ltd. | 10,946,528 | |||||||||
| 426,300 | Bajaj Hindusthan, Ltd. (GDR) (144A) | 2,118,498 | |||||||||
| 5,652,175 | Balrampur Chini Mills, Ltd. | 10,771,825 | |||||||||
| 1,894,348 | Cosan S.A. Industria e Comercio* | 39,633,678 | |||||||||
| 188,869 | Shree Renuka Sugars, Ltd. | 1,904,906 | |||||||||
| 65,375,435 | |||||||||||
| Telecommunication Services - 1.9% | |||||||||||
| 429,835 | Amdocs, Ltd. (U.S. Shares)* | 16,656,106 | |||||||||
| 2,309,279 | Reliance Communications, Ltd.* | 24,608,483 | |||||||||
| 41,264,589 | |||||||||||
| Shares or Principal Amount | Value | ||||||||||
| Transportation - Railroad - 0.6% | |||||||||||
| 1,215,314 | All America Latina Logistica (GDR) | $ | 12,611,051 | ||||||||
| Total Common Stock (cost $1,456,643,709) | 2,200,681,123 | ||||||||||
| Money Markets - 0.5% | |||||||||||
| 2,073,000 | Janus Institutional Cash Reserves Fund, 5.29% | 2,073,000 | |||||||||
| 8,889,000 | Janus Money Market Fund, 5.24% | 8,889,000 | |||||||||
| Total Money Markets (cost $10,962,000) | 10,962,000 | ||||||||||
| Other Securities - 5.2% | |||||||||||
| 17,641,506 | Foreign Bonds† | 17,641,506 | |||||||||
| 97,787,856 | State Street Navigator Securities Lending Prime Portfolio† | 97,787,856 | |||||||||
| Total Other Securities (cost $115,429,362) | 115,429,362 | ||||||||||
| Total Investments (total cost $1,583,035,071) – 104.8% | 2,327,072,485 | ||||||||||
| Cash, Receivables and Other Assets, net of Liabilities – (4.8)% | (105,686,835 | ) | |||||||||
| Net Assets – 100% | $ | 2,221,385,650 | |||||||||
Summary of Investments by Country
| Country | Value | % of Investment Securities | |||||||||
| Argentina | $ | 24,229,414 | 1.0 | % | |||||||
| Australia | 49,556,817 | 2.1 | % | ||||||||
| Bermuda | 273,759,491 | 11.8 | % | ||||||||
| Brazil | 319,379,963 | 13.7 | % | ||||||||
| Canada | 176,630,847 | 7.6 | % | ||||||||
| Cayman Islands | 97,894,491 | 4.2 | % | ||||||||
| Egypt | 15,354,439 | 0.7 | % | ||||||||
| France | 76,015,517 | 3.3 | % | ||||||||
| Greece | 17,000,604 | 0.7 | % | ||||||||
| Hong Kong | 149,865,781 | 6.4 | % | ||||||||
| India | 240,872,373 | 10.4 | % | ||||||||
| Ireland | 11,817,329 | 0.5 | % | ||||||||
| Italy | 9,095,154 | 0.4 | % | ||||||||
| Japan | 197,807,118 | 8.5 | % | ||||||||
| Mexico | 16,028,922 | 0.7 | % | ||||||||
| Netherlands | 38,636,462 | 1.7 | % | ||||||||
| Philippines | 55,512,792 | 2.4 | % | ||||||||
| Russia | 29,430,201 | 1.3 | % | ||||||||
| Singapore | 15,138,712 | 0.7 | % | ||||||||
| South Korea | 88,509,076 | 3.8 | % | ||||||||
| Sweden | 17,370,705 | 0.7 | % | ||||||||
| Switzerland | 105,650,457 | 4.5 | % | ||||||||
| United Kingdom | 135,340,300 | 5.8 | % | ||||||||
| United States†† | 166,175,520 | 7.1 | % | ||||||||
| Total | $ | 2,327,072,485 | 100.0 | % | |||||||
††Includes Short-Term Securities and Other Securities (1.7% excluding Short-Term Securities and Other Securities)
See Notes to Schedule of Investments and Financial Statements.
Janus Aspen Series December 31, 2006 9
Statement of Assets and Liabilities
| As of December 31, 2006 (all numbers in thousands except net asset value per share) | Janus Aspen International Growth Portfolio | ||||||
| Assets: | |||||||
| Investments at cost(1) | $ | 1,583,035 | |||||
| Investments at value(1) | $ | 2,327,072 | |||||
| Cash | 645 | ||||||
| Cash denominated in foreign currency (cost $12,072) | 12,091 | ||||||
| Receivables: | |||||||
| Investments sold | 10,919 | ||||||
| Portfolio shares sold | 2,350 | ||||||
| Dividends | 994 | ||||||
| Interest | 72 | ||||||
| Other assets | 39 | ||||||
| Total Assets | 2,354,182 | ||||||
| Liabilities: | |||||||
| Payables: | |||||||
| Collateral for securities loaned (Note 1) | 115,429 | ||||||
| Investments purchased | 11,743 | ||||||
| Portfolio shares repurchased | 2,251 | ||||||
| Dividends | – | ||||||
| Advisory fees | 1,176 | ||||||
| Transfer agent fees and expenses | 1 | ||||||
| Distribution fees - Service Shares | 222 | ||||||
| Distribution fees - Service II Shares | 61 | ||||||
| Non-interested Trustees' fees and expenses | 13 | ||||||
| Foreign tax liability | 1,816 | ||||||
| Accrued expenses | 84 | ||||||
| Total Liabilities | 132,796 | ||||||
| Net Assets | $ | 2,221,386 | |||||
| Net Assets Consist of: | |||||||
| Capital (par value and paid-in-surplus)* | $ | 1,613,669 | |||||
| Undistributed net investment income/(loss)* | (13,232 | ) | |||||
| Undistributed net realized gain/(loss) from investments and foreign currency transactions* | (121,332 | ) | |||||
| Unrealized net appreciation/(depreciation) of investments and foreign currency translations(2) | 742,281 | ||||||
| Total Net Assets | $ | 2,221,386 | |||||
| Net Assets - Institutional Shares | $ | 844,734 | |||||
| Shares Outstanding, $0.001 Par Value (unlimited shares authorized) | 16,496 | ||||||
| Net Asset Value Per Share | $ | 51.21 | |||||
| Net Assets - Service Shares | $ | 1,072,922 | |||||
| Shares Outstanding, $0.001 Par Value (unlimited shares authorized) | 21,197 | ||||||
| Net Asset Value Per Share | $ | 50.62 | |||||
| Net Assets - Service II Shares | $ | 303,730 | |||||
| Shares Outstanding, $0.001 Par Value (unlimited shares authorized) | 5,979 | ||||||
| Net Asset Value Per Share | $ | 50.80 | |||||
*See Note 3 in Notes to Financial Statements.
(1) Investments at cost and value include $110,930,719 of securities loaned for Janus Aspen International Growth Portfolio (Note 1).
(2) Net of foreign taxes on investments of $1,815,612 for Janus Aspen International Growth Portfolio.
See Notes to Financial Statements.
10 Janus Aspen Series December 31, 2006
Statement of Operations
| For the fiscal year ended December 31, 2006 (all numbers in thousands) | Janus Aspen International Growth Portfolio | ||||||
| Investment Income: | |||||||
| Interest | $ | 579 | |||||
| Securities lending income | 324 | ||||||
| Dividends | 41,420 | ||||||
| Dividends from affiliates | 632 | ||||||
| Foreign tax withheld | (1,354 | ) | |||||
| Total Investment Income | 41,601 | ||||||
| Expenses: | |||||||
| Advisory fees | 10,898 | ||||||
| Transfer agent expenses | 6 | ||||||
| Registration fees | 40 | ||||||
| Custodian fees | 567 | ||||||
| Professional fees | 25 | ||||||
| Non-interested Trustees' fees and expenses | 60 | ||||||
| Distribution fees - Service Shares | 2,067 | ||||||
| Distribution fees - Service II Shares | 467 | ||||||
| Interest expense | 12 | ||||||
| Other expenses | 453 | ||||||
| Non-recurring costs (Note 2) | – | ||||||
| Costs assumed by Janus Capital Management LLC (Note 2) | – | ||||||
| Total Expenses | 14,595 | ||||||
| Expense and Fee Offset | (32 | ) | |||||
| Net Expenses | 14,563 | ||||||
| Net Investment Income/(Loss) | 27,038 | ||||||
| Net Realized and Unrealized Gain/(Loss) on Investments: | |||||||
| Net realized gain/(loss) from securities transactions | 308,330 | ||||||
| Net realized gain/(loss) from foreign currency transactions | (4,171 | ) | |||||
| Change in unrealized net appreciation/(depreciation) of investments and foreign currency translations(1) | 324,983 | ||||||
| Payment from affiliate (Note 2) | 9 | ||||||
| Net Gain/(Loss) on Investments | 629,151 | ||||||
| Net Increase/(Decrease) in Net Assets Resulting from Operations | $ | 656,189 | |||||
(1) Net of foreign taxes on investments of $1,815,612 for Janus Aspen International Growth Portfolio.
See Notes to Financial Statements.
Janus Aspen Series December 31, 2006 11
Statements of Changes in Net Assets
| For the fiscal year ended December 31 | Janus Aspen International Growth Portfolio | ||||||||||
| (all numbers in thousands) | 2006 | 2005 | |||||||||
| Operations: | |||||||||||
| Net investment income/(loss) | $ | 27,038 | $ | 9,652 | |||||||
| Net realized gain/(loss) from investment and foreign currency transactions | 304,159 | 166,539 | |||||||||
| Change in unrealized net appreciation/(depreciation) of investments and foreign currency translations | 324,983 | 137,982 | |||||||||
| Payment from affiliate (Note 2) | 9 | 1 | |||||||||
| Net Increase/(Decrease) in Net Assets Resulting from Operations | 656,189 | 314,174 | |||||||||
| Dividends and Distributions to Shareholders: | |||||||||||
| Net investment income* | |||||||||||
| Institutional Shares | (13,793 | ) | (5,705 | ) | |||||||
| Service Shares | (15,757 | ) | (5,683 | ) | |||||||
| Service II Shares | (4,335 | ) | (996 | ) | |||||||
| Net realized gain from investment transactions* | |||||||||||
| Institutional Shares | – | – | |||||||||
| Service Shares | – | – | |||||||||
| Service II Shares | – | – | |||||||||
| Net Decrease from Dividends and Distributions | (33,885 | ) | (12,384 | ) | |||||||
| Capital Share Transactions: | |||||||||||
| Shares sold | |||||||||||
| Institutional Shares | 233,326 | 105,176 | |||||||||
| Service Shares | 236,692 | 90,022 | |||||||||
| Service II Shares | 151,658 | 30,659 | |||||||||
| Redemption fees | |||||||||||
| Service II Shares | 69 | 12 | |||||||||
| Reinvested dividends and distributions | |||||||||||
| Institutional Shares | 13,793 | 5,705 | |||||||||
| Service Shares | 15,757 | 5,683 | |||||||||
| Service II Shares | 4,335 | 996 | |||||||||
| Shares repurchased | |||||||||||
| Institutional Shares | (204,513 | ) | (156,400 | ) | |||||||
| Service Shares | (116,835 | ) | (106,767 | ) | |||||||
| Service II Shares | (33,625 | ) | (14,435 | ) | |||||||
| Net Increase/(Decrease) from Capital Share Transactions | 300,657 | (39,349 | ) | ||||||||
| Net Increase/(Decrease) in Net Assets | 922,961 | 262,441 | |||||||||
| Net Assets: | |||||||||||
| Beginning of period | 1,298,425 | 1,035,984 | |||||||||
| End of period | $ | 2,221,386 | $ | 1,298,425 | |||||||
| Undistributed net investment income/(loss)* | $ | (13,232 | ) | $ | 1,614 | ||||||
* See Note 3 in Notes to Financial Statements.
See Notes to Financial Statements.
12 Janus Aspen Series December 31, 2006
Financial Highlights
| Institutional Shares | |||||||||||||||||||||||
| For a share outstanding during each fiscal year ended December 31 | Janus Aspen International Growth Portfolio | ||||||||||||||||||||||
| 2006 | 2005 | 2004 | 2003 | 2002 | |||||||||||||||||||
| Net Asset Value, Beginning of Period | $ | 35.54 | $ | 27.19 | $ | 23.06 | $ | 17.30 | $ | 23.47 | |||||||||||||
| Income from Investment Operations: | |||||||||||||||||||||||
| Net investment income/(loss) | .56 | .41 | .30 | .24 | .18 | ||||||||||||||||||
| Net gain/(loss) on securities (both realized and unrealized) | 15.97 | 8.30 | 4.05 | 5.75 | (6.17 | ) | |||||||||||||||||
| Total from Investment Operations | 16.53 | 8.71 | 4.35 | 5.99 | (5.99 | ) | |||||||||||||||||
| Less Distributions and Other: | |||||||||||||||||||||||
| Dividends (from net investment income)* | (.86 | ) | (.36 | ) | (.22 | ) | (.23 | ) | (.18 | ) | |||||||||||||
| Distributions from net realized gains | – | – | – | – | – | ||||||||||||||||||
| Distributions (from capital gains)* | – | – | – | – | – | ||||||||||||||||||
| Payment from affiliate | – | (1) | – | – | (1) | – | – | ||||||||||||||||
| Total Distributions and Other | (.86 | ) | (.36 | ) | (.22 | ) | (.23 | ) | (.18 | ) | |||||||||||||
| Net Asset Value, End of Period | $ | 51.21 | $ | 35.54 | $ | 27.19 | $ | 23.06 | $ | 17.30 | |||||||||||||
| Total Return | 46.98 | %(2) | 32.28 | % | 18.99 | %(2) | 34.91 | % | (25.58 | )% | |||||||||||||
| Net Assets, End of Period (in thousands) | $ | 844,734 | $ | 549,948 | $ | 465,055 | $ | 637,918 | $ | 598,972 | |||||||||||||
| Average Net Assets for the Period (in thousands) | $ | 691,150 | $ | 473,781 | $ | 556,677 | $ | 595,791 | $ | 736,907 | |||||||||||||
| Ratio of Gross Expenses to Average Net Assets(3)(4) | 0.71 | % | 0.70 | % | 0.69 | % | 0.76 | % | 0.74 | % | |||||||||||||
| Ratio of Net Expenses to Average Net Assets(4) | 0.71 | % | 0.70 | % | 0.68 | % | 0.76 | % | 0.74 | % | |||||||||||||
| Ratio of Net Investment Income/(Loss) to Average Net Assets | 1.79 | % | 1.05 | % | 1.02 | % | 1.26 | % | 0.90 | % | |||||||||||||
| Portfolio Turnover Rate | 60 | % | 57 | % | 65 | % | 123 | % | 74 | % | |||||||||||||
| Service Shares | |||||||||||||||||||||||
| For a share outstanding during each fiscal year ended December 31 | Janus Aspen International Growth Portfolio | ||||||||||||||||||||||
| 2006 | 2005 | 2004 | 2003 | 2002 | |||||||||||||||||||
| Net Asset Value, Beginning of Period | $ | 35.17 | $ | 26.94 | $ | 22.89 | $ | 17.18 | $ | 23.30 | |||||||||||||
| Income from Investment Operations: | |||||||||||||||||||||||
| Net investment income/(loss) | .46 | .31 | .20 | .18 | .13 | ||||||||||||||||||
| Net gain/(loss) on securities (both realized and unrealized) | 15.79 | 8.24 | 4.05 | 5.71 | (6.12 | ) | |||||||||||||||||
| Total from Investment Operations | 16.25 | 8.55 | 4.25 | 5.89 | (5.99 | ) | |||||||||||||||||
| Less Distributions and Other: | |||||||||||||||||||||||
| Dividends (from net investment income)* | (.80 | ) | (.32 | ) | (.20 | ) | (.18 | ) | (.13 | ) | |||||||||||||
| Distributions from net realized gains | – | – | – | – | – | ||||||||||||||||||
| Distributions (from capital gains)* | – | – | – | – | – | ||||||||||||||||||
| Payment from affiliate | – | (1) | – | (1) | – | (1) | – | – | |||||||||||||||
| Total Distributions and Other | (.80 | ) | (.32 | ) | (.20 | ) | (.18 | ) | (.13 | ) | |||||||||||||
| Net Asset Value, End of Period | $ | 50.62 | $ | 35.17 | $ | 26.94 | $ | 22.89 | $ | 17.18 | |||||||||||||
| Total Return | 46.66 | %(2) | 31.94 | %(2) | 18.69 | %(2) | 34.53 | % | (25.76 | )% | |||||||||||||
| Net Assets, End of Period (in thousands) | $ | 1,072,922 | $ | 635,357 | $ | 498,735 | $ | 457,965 | $ | 380,620 | |||||||||||||
| Average Net Assets for the Period (in thousands) | $ | 826,815 | $ | 523,662 | $ | 457,088 | $ | 391,922 | $ | 477,995 | |||||||||||||
| Ratio of Gross Expenses to Average Net Assets(3)(4) | 0.96 | % | 0.95 | % | 0.94 | % | 1.01 | % | 0.99 | % | |||||||||||||
| Ratio of Net Expenses to Average Net Assets(4) | 0.96 | % | 0.95 | % | 0.93 | % | 1.01 | % | 0.99 | % | |||||||||||||
| Ratio of Net Investment Income/(Loss) to Average Net Assets | 1.49 | % | 0.78 | % | 0.77 | % | 0.99 | % | 0.67 | % | |||||||||||||
| Portfolio Turnover Rate | 60 | % | 57 | % | 65 | % | 123 | % | 74 | % | |||||||||||||
* See Note 3 in Notes to Financial Statements.
(1) Payment from affiliate aggregated less than $.01 on a per share basis for the fiscal year ended.
(2) During the fiscal year ended, Janus Capital and/or Janus Services LLC fully reimbursed the Portfolio for a loss on a transaction resulting from certain trading, pricing and/or shareholder activity errors, which otherwise would have reduced total return by less than 0.01%.
(3) The effect of non-recurring costs assumed by Janus Capital (Note 2) is included in the ratio of gross expenses to average net assets and was less than 0.01%.
(4) See "Explanation of Charts, Tables, and Financial Statements."
See Notes to Financial Statements.
Janus Aspen Series December 31, 2006 13
Financial Highlights (continued)
| Service II Shares | |||||||||||||||||||||||
| For a share outstanding during each fiscal year ended December 31 | Janus Aspen International Growth Portfolio | ||||||||||||||||||||||
| 2006 | 2005 | 2004 | 2003 | 2002(1) | |||||||||||||||||||
| Net Asset Value, Beginning of Period | $ | 35.38 | $ | 27.11 | $ | 23.02 | $ | 17.27 | $ | 23.24 | |||||||||||||
| Income from Investment Operations: | |||||||||||||||||||||||
| Net investment income/(loss) | .49 | .30 | .20 | .17 | .04 | ||||||||||||||||||
| Net gain/(loss) on securities (both realized and unrealized) | 15.85 | 8.31 | 4.08 | 5.75 | (6.01 | ) | |||||||||||||||||
| Total from Investment Operations | 16.34 | 8.61 | 4.28 | 5.92 | (5.97 | ) | |||||||||||||||||
| Distributions and Other: | |||||||||||||||||||||||
| Dividends (from net investment income)* | (.94 | ) | (.34 | ) | (.20 | ) | (.18 | ) | (.04 | ) | |||||||||||||
| Distributions from net realized gains | – | – | – | – | – | ||||||||||||||||||
| Distributions (from capital gains)* | – | – | – | – | – | ||||||||||||||||||
| Redemption fees | .02 | – | (2) | .01 | .01 | .04 | |||||||||||||||||
| Payment from affiliate | – | (3) | – | (3) | – | (3) | – | – | |||||||||||||||
| Total Distributions and Other | (.92 | ) | (.34 | ) | (.19 | ) | (.17 | ) | – | ||||||||||||||
| Net Asset Value, End of Period | $ | 50.80 | $ | 35.38 | $ | 27.11 | $ | 23.02 | $ | 17.27 | |||||||||||||
| Total Return | 46.70 | %(4) | 31.97 | %(4) | 18.75 | %(4) | 34.55 | % | (25.51 | )% | |||||||||||||
| Net Assets, End of Period (in thousands) | $ | 303,730 | $ | 113,120 | $ | 72,194 | $ | 60,206 | $ | 35,742 | |||||||||||||
| Average Net Assets for the Period (in thousands) | $ | 186,734 | $ | 82,746 | $ | 63,943 | $ | 47,299 | $ | 15,892 | |||||||||||||
| Ratio of Gross Expenses to Average Net Assets(5)(6) | 0.96 | % | 0.95 | % | 0.94 | % | 1.01 | % | 1.01 | % | |||||||||||||
| Ratio of Net Expenses to Average Net Assets(6) | 0.95 | % | 0.95 | % | 0.93 | % | 1.01 | % | 1.01 | % | |||||||||||||
| Ratio of Net Investment Income/(Loss) to Average Net Assets | 1.26 | % | 0.78 | % | 0.79 | % | 0.98 | % | 0.47 | % | |||||||||||||
| Portfolio Turnover Rate | 60 | % | 57 | % | 65 | % | 123 | % | 74 | % | |||||||||||||
* See Note 3 in Notes to Financial Statements.
(1) Certain amounts have been reclassified from the original presentation to conform to current year presentation.
(2) Redemption fees aggregated less than $.01 on a per share basis for the fiscal year ended.
(3) Payment from affiliate aggregated less than $.01 on a per share basis for the fiscal year ended.
(4) During the fiscal year ended, Janus Capital and/or Janus Services LLC fully reimbursed the Portfolio for a loss on a transaction resulting from certain trading, pricing and/or shareholder activity errors, which otherwise would have reduced total return by less than 0.01%.
(5) The effect of non-recurring costs assumed by Janus Capital (Note 2) is included in the ratio of gross expenses to average net assets and was less than 0.01%
(6) See "Explanation of Charts, Tables, and Financial Statements."
See Notes to Financial Statements.
14 Janus Aspen Series December 31, 2006
Notes to Schedule of Investments
| Lipper Variable Annuity International Funds | Funds that invest their assets in securities with primary trading markets outside of the United States. | ||||||
| Morgan Stanley Capital International All Country World ex-U.S. IndexSM | Is an unmanaged, free float-adjusted, market capitalization weighted index composed of stocks of companies located in countries throughout the world, excluding the United States. It is designed to measure equity market performance in global developed and emerging markets outside the United States. | ||||||
| Morgan Stanley Capital International EAFE® Index | Is a market capitalization weighted index composed of companies representative of the market structure of Developed Market countries in Europe, Australasia and the Far East. | ||||||
| Morgan Stanley Capital International EAFE® Growth Index | Is a subset of the Morgan Stanley Capital International EAFE® Index and contains constituents of the Morgan Stanley Capital International EAFE® Index which are categorized as growth securities. | ||||||
| 144 | A | Securities sold under Rule 144A of the Securities Act of 1933 are subject to legal and/or contractual restrictions on resale and may not be publicly sold without registration under the 1933 Act. | |||||
| ADR | American Depositary Receipt | ||||||
| GDR | Global Depositary Receipt | ||||||
| PLC | Public Limited Company | ||||||
| U.S. Shares | Securities of foreign companies trading on an American Stock Exchange | ||||||
* Non-income-producing security.
** A portion of this security has been segregated by the custodian to cover margin or segregation requirements on open futures contracts, forward currency contracts, options contracts, short sales and/or securities with extended settlement dates.
ß Security is illiquid.
# Loaned security; a portion or all of the security is on loan at December 31, 2006.
† The security is purchased with the cash collateral received from securities on loan (Note 1).
ºº Schedule of Fair Valued Securities (as of December 31, 2006)
| Value | Value as a % of Net Assets | ||||||||||
| Janus Aspen International Growth Portfolio | |||||||||||
| China Water Affairs Group, Ltd. | $ | 7,841,641 | 0.4 | % | |||||||
| TI Automotive, Ltd. | – | 0.0 | % | ||||||||
| $ | 7,841,641 | 0.4 | % | ||||||||
Securities are valued at "fair value" pursuant to procedures adopted by the Portfolio's Trustees. The Schedule of Fair Valued Securities does not include international activities fair valued pursuant to a systematic fair valuation model.
§ Schedule of Restricted and Illiquid Securities (as of December 31, 2006)
| Acquisition Date | Acquisition Cost | Value | Value as % of Net Assets | ||||||||||||||||
| Janus Aspen International Growth Portfolio | |||||||||||||||||||
| China Water Affairs Group, Ltd.ºº | 12/15/06 | $ | 7,843,728 | $ | 7,841,641 | 0.4 | % | ||||||||||||
| Polytec Asset Holdings, Ltd. | 5/5/06 | 8,663,678 | 9,495,373 | 0.4 | % | ||||||||||||||
| $ | 16,507,406 | $ | 17,337,014 | 0.8 | % | ||||||||||||||
The Portfolio has registration rights for certain restricted securities held as of December 31, 2006. The issuer incurs all registration costs.
Aggregate collateral segregated to cover margin or segregation requirements on open futures contracts, forward currency contracts, option contracts, short sales and/or securities with extended settlement dates as of December 31, 2006 are noted below.
| Portfolio | Aggregate Value | ||||||
| Janus Aspen International Growth Portfolio | $ | 7,838,331 | |||||
Janus Aspen Series December 31, 2006 15
Notes to Financial Statements
The following section describes the organization and significant accounting policies and provides more detailed information about the schedules and tables that appear throughout this report. In addition, the Notes to Financial Statements explain the methods used in preparing and presenting this report.
1. ORGANIZATION AND SIGNIFICANT ACCOUNTING POLICIES
Janus Aspen International Growth Portfolio (the "Portfolio") is a series fund. The Portfolio is part of Janus Aspen Series (the "Trust"), which is organized as a Delaware statutory trust and is registered under the Investment Company Act of 1940 (the "1940 Act") as an open-end management investment company. The Trust offers seventeen Portfolios, which include multiple series of shares, with differing investment objectives and policies. The Portfolio invests primarily in equity securities. The Portfolio is classified as diversified, as defined in the 1940 Act. The Portfolio is a no-load investment.
The Portfolio currently offers three classes of shares: Institutional Shares, Service Shares and Service II Shares. Institutional Shares are offered only in connection with investment in and payments under variable insurance contracts and to qualified retirement plans. Service Shares and Service II Shares are offered only in connection with investment in and payments under variable insurance contracts and to qualified retirement plans that require a fee from Portfolio assets to procure distribution and administrative services to contract owners and plan participants. For Service II Shares, a redemption fee may be imposed on interests in separate accounts or plans held 60 days or less.
The following accounting policies have been consistently followed by the Portfolio and are in conformity with accounting principles generally accepted in the United States of America in the investment company industry.
Investment Valuation
Securities are valued at the last sales price or the official closing price for securities traded on a principal securities exchange (U.S. or foreign) and on the NASDAQ National Market. Securities traded on over-the-counter markets and listed securities for which no sales are reported are valued at the latest bid price (or yield equivalent thereof) obtained from one or more dealers transacting in a market for such securities or by a pricing service approved by the Portfolio's Trustees. Short-term securities with maturities of 60 days or less may be valued at amortized cost, which approximates market value. Debt securities with a remaining maturity of greater than 60 days are valued in accordance with the evaluated bid price supplied by the pricing service. The evaluated bid price supplied by the pricing service is an evaluation that reflects such factors as security prices, yields, maturities and ratings. Foreign securities and currencies ar e converted to U.S. dollars using the applicable exchange rate in effect as of the daily close of the New York Stock Exchange ("NYSE"). When market quotations are not readily available or deemed unreliable, or events or circumstances that may affect the value of portfolio securities held by the Portfolio are identified between the closing of their principal markets and the time the net asset value ("NAV") is determined, securities may be valued at fair value as determined in good faith under procedures established by and under the supervision of the Portfolio's Trustees. The Portfolio may use a systematic fair valuation model provided by an independent third party to value international equity securities in order to adjust for stale pricing, which may occur between the close of certain foreign exchanges and the NYSE.
Investment Transactions and Investment Income
Investment transactions are accounted for as of the date purchased or sold (trade date). Dividend income is recorded on the ex-dividend date. Certain dividends from foreign securities will be recorded as soon as the Trust is informed of the dividend if such information is obtained subsequent to the ex-dividend date and may be subject to withholding taxes in these jurisdictions. Interest income is recorded on the accrual basis and includes amortization of premiums and accretion of discounts. Gains and losses are determined on the identified cost basis, which is the same basis used for federal income tax purposes. Income, as well as gains and losses, both realized and unrealized, are allocated daily to each class of shares based upon the ratio of net assets represented by each class as a percentage of total net assets.
Expenses
The Portfolio bears expenses incurred specifically on its behalf as well as a portion of general expenses. Each class of shares bears expenses incurred specifically on its behalf and, in addition, each class bears a portion of general expenses, which may be based upon relative net assets of each class. Expenses are allocated daily to each class of shares based upon the ratio of net assets represented by each class as a percentage of total net assets. Expenses directly attributable to a specific class of shares are charged against the operations of such class.
Securities Lending
Under procedures adopted by the Trustees, the Portfolio may lend securities to qualified parties (typically brokers or other financial institutions) who need to borrow securities in order to complete certain transactions such as covering short sales, avoiding failures to deliver securities or completing arbitrage activities. The Portfolio may seek to earn additional income through securities lending. There is the risk of delay in recovering a loaned security or the risk of loss in collateral rights if the borrower fails financially. In addition, Janus Capital Management LLC ("Janus Capital") makes efforts to balance the benefits and risks from granting such loans.
The Portfolio does not have the right to vote on securities while they are being lent; however, the Portfolio may attempt to call
16 Janus Aspen Series December 31, 2006
back the loan and vote the proxy. All loans will be continuously secured by collateral which may consist of cash, U.S. Government securities, domestic and foreign short-term debt instruments, letters of credit, money market mutual funds or other money market accounts, or such other collateral permitted by the Securities and Exchange Commission ("SEC"). Cash collateral may be invested in affiliated money market funds or other accounts advised by Janus Capital to the extent consistent with exemptive relief obtained from the SEC or as permitted by the 1940 Act and rules promulgated thereunder. Cash collateral may also be invested in unaffiliated money market funds or other accounts advised by Janus Capital to the extent consistent with exemptive relief obtained from the SEC or as permitted by the 1940 Act and rules promulgated thereunder. Cash collateral may also be invested in unaffiliated money market funds or other accounts.
State Street Bank and Trust Company (the "Lending Agent") may also invest the cash collateral in the State Street Navigator Securities Lending Prime Portfolio or investments in unaffiliated money market funds or accounts, mutually agreed to by the Portfolio and the Lending Agent, that comply with Rule 2a-7 under the 1940 Act relating to money market funds.
As of December 31, 2006, the Portfolio had on loan securities valued as indicated:
| Portfolio | Value at December 31, 2006 | ||||||
| Janus Aspen International Growth Portfolio | $ | 110,930,719 | |||||
As of December 31, 2006, the Portfolio received cash collateral for securities lending activity as indicated:
| Portfolio | Cash Collateral at December 31, 2006 | ||||||
| Janus Aspen International Growth Portfolio | $ | 115,429,362 | |||||
As of December 31, 2006, all cash collateral received by the Portfolio was invested in the State Street Navigator Securities Lending Prime Portfolio, except for $17,641,506 which was invested in foreign bonds.
The value of the collateral must be at least 102% of the market value of the loaned securities that are denominated in U.S. dollars and 105% of the market value of the loaned securities that are not denominated in U.S. dollars. Loaned securities and related collateral are marked-to-market each business day based upon the market value of the respective securities at the close of business, employing the most recent available pricing information. Collateral levels are then adjusted based upon this mark-to-market evaluation.
The borrower pays fees at the Portfolio's direction to its Lending Agent. The Lending Agent may retain a portion of the interest earned. The cash collateral invested by the Lending Agent is disclosed in the Schedule of Investments. The lending fees and the Portfolio's portion of the interest income earned on cash collateral are included on the Statement of Operations (if applicable).
Interfund Lending
Pursuant to an exemptive order received from the SEC, the Portfolio may be party to an interfund lending agreement between the Portfolio and other Janus Capital sponsored mutual funds, which permits it to borrow or lend cash at a rate beneficial to both the borrowing and lending funds. Outstanding borrowings from all sources totaling 10% or more of the borrowing Portfolio's total assets must be collateralized at 102% of the outstanding principal value of the loan; loans of less than 10% may be unsecured. During the fiscal year ended December 31, 2006, there were no outstanding interfund borrowing or lending arrangements for the Portfolio.
Forward Currency Transactions
The Portfolio may enter into forward currency contracts in order to reduce its exposure to changes in foreign currency exchange rates on its foreign portfolio holdings and to lock in the U.S. dollar cost of firm purchase and sale commitments for securities denominated in or exposed to foreign currencies. A forward currency exchange contract is a commitment to purchase or sell a foreign currency at a future date at a negotiated rate. The gain or loss arising from the difference between the U.S. dollar cost of the original contract and the value of the foreign currency in U.S. dollars upon closing a contract is included in "Net realized gain/(loss) from foreign currency transactions" on the Statement of Operations (if applicable).
Forward currency contracts held by the Portfolio are fully collateralized by other securities, which are denoted in the accompanying Schedule of Investments (if applicable). The collateral is evaluated daily to ensure its market value equals or exceeds the current market value of the corresponding forward currency contracts. As of December 31, 2006, the Portfolio was not invested in forward currency contracts.
Futures Contracts
The Portfolio may enter into futures contracts. The Portfolio intends to use such derivative instruments primarily to hedge or protect from adverse movements in securities prices, currency rates or interest rates. The use of futures contracts may involve risks such as the possibility of illiquid markets or imperfect correlation between the value of the contracts and the underlying securities, or that the counterparty will fail to perform its obligations.
Futures contracts are marked-to-market daily, and the daily variation margin is recorded as a receivable or payable on the Statement of Assets and Liabilities (if applicable). When a contract is closed, a realized gain or loss is recorded on the Statement of Operations equal to the difference between the opening and closing value of the contract. Generally, futures contracts are marked-to-market (i.e., treated as realized and
Janus Aspen Series December 31, 2006 17
Notes to Financial Statements (continued)
subject to distribution) for federal income tax purposes at fiscal year end. Securities designated as collateral for market value on futures contracts are noted in the Schedule of Investments. Such collateral is in the possession of the Portfolio's custodian. As of December 31, 2006, the Portfolio was not invested in futures contracts.
Short Sales
The Portfolio may engage in "short sales against the box." Short sales against the box involve selling either a security that the Portfolio owns, or a security equivalent in kind and amount to the security sold short that the Portfolio has the right to obtain, for delivery at a specified date in the future. The Portfolio may enter into a short sale against the box to hedge against anticipated declines in the market price of portfolio securities. If the value of the securities sold short increases prior to the scheduled delivery date, the Portfolio loses the opportunity to participate in the gain.
The Portfolio may also engage in "naked" short sales. Naked short sales involve the Portfolio selling a security it does not own to a purchaser at a specified price. To complete the transaction, the Portfolio must borrow the security to deliver it to the purchaser and buy that same security in the market to return it to the lender. Although the potential for gain is limited to the difference between the price at which the Portfolio sold the security short and the cost of borrowing the security, its potential for loss could be unlimited because there is no limit to the replacement cost of the borrowed security. There is no assurance that the Portfolio will be able to close out a short position at any particular time or at an acceptable price. A gain or a loss will be recognized upon termination of a short sale. There is no limit on the size of any loss that the Portfolio may recognize upon termination of a short sale. Short sales held by the Portfolio are fully collateralized by other securities, which are denoted in the accompanying Schedule of Investments (if applicable). As of December 31, 2006, the Portfolio was not invested in short sales.
Foreign Currency Translations
The Portfolio does not isolate that portion of the results of operations resulting from changes in foreign exchange rates on investments from the fluctuations arising from changes in market prices of securities held at the date of the financial statements. Net unrealized appreciation or depreciation on investments and foreign currency translation arise from changes in the value of assets and liabilities, including investments in securities held at the date of the financial statements, resulting from changes in the exchange rates and changes in market prices of securities held.
Currency gains and losses are also calculated on payables and receivables that are denominated in foreign currencies. The payables and receivables are generally related to security transactions and income.
Foreign-denominated assets and forward currency contracts may involve more risks than domestic transactions, including currency risk, political and economic risk, regulatory risk and market risk. Risks may arise from the potential inability of a counterparty to meet the terms of a contract and from unanticipated movements in the value of foreign currencies relative to the U.S. dollar.
When-issued Securities
The Portfolio may purchase or sell securities on a when-issued or forward commitment basis. The price of the underlying securities and date when the securities will be delivered and paid for are fixed at the time the transaction is negotiated. Losses may arise due to changes in the market value of the securities or from the inability of counterparties to meet the terms of the contract. In connection with such purchases, the Portfolio may hold liquid assets as collateral with the Portfolio's custodian sufficient to cover the purchase price. As of December 31, 2006, the Portfolio was not invested in when-issued securities.
Equity-Linked Structured Notes
The Portfolio may invest in equity-linked structured notes. Equity-linked structured notes are derivative securities which are specially designed to combine the characteristics of one or more underlying securities and their equity derivatives in a single note form. The return and/or yield or income component may be based on the performance of the underlying equity securities, an equity index, and/or option positions. Equity-linked structured notes are typically offered in limited transactions by financial institutions in either registered or nonregistered form. An investment in equity-linked structured notes creates exposure to the credit risk of the issuing financial institution, as well as to the market risk of the underlying securities. There is no guaranteed return of principal with these securities and the appreciation potential of these securities may be limited by a maximum payment or call right. In certain cases, equity-linked struct ured notes may be more volatile and less liquid than less complex securities or other types of fixed-income securities. Such securities may exhibit price behavior that does not correlate with other fixed-income securities. As of December 31, 2006, the Portfolio was not invested in equity-linked structured notes.
Initial Public Offerings
The Portfolio may invest in initial public offerings ("IPOs"). IPOs and other investment techniques may have a magnified performance impact on a fund with a small asset base. The Portfolio may not experience similar performance as its assets grow.
Additional Investment Risk
The Portfolio may be invested in lower-rated debt securities that have a higher risk of default or loss of value since these securities may be sensitive to economic changes, political changes or adverse developments specific to the issuer.
18 Janus Aspen Series December 31, 2006
Restricted Security Transactions
Restricted securities held by the Portfolio may not be sold except in exempt transactions or in a public offering registered under the Securities Act of 1933. The risk of investing in such securities is generally greater than the risk of investing in the securities of widely held, publicly traded companies. Lack of a secondary market and resale restrictions may result in the inability of the Portfolio to sell a security at a fair price and may substantially delay the sale of the security. In addition, these securities may exhibit greater price volatility than securities for which secondary markets exist.
Dividend Distributions
The Portfolio generally makes semiannual distributions of substantially all of its investment income and an annual distribution of its net realized capital gains (if any). The majority of dividends and net realized capital gains distributions from the Portfolio may be automatically reinvested into additional shares of the Portfolio, based upon the discretion of the shareholder.
Estimates
The preparation of financial statements in conformity with accounting principles generally accepted in the United States of America requires management to make estimates and assumptions that affect the reported amount of assets and liabilities and disclosure of contingent assets and liabilities at the date of the financial statements and the reported amounts of income and expenses during the reporting period. Actual results could differ from those estimates.
Federal Income Taxes
No provision for income taxes is included in the accompanying financial statements, as the Portfolio intends to distribute to shareholders all taxable investment income and realized gains and otherwise comply with Subchapter M of the Internal Revenue Code applicable to regulated investment companies.
New Accounting Pronouncements
In July 2006, the Financial Accounting Standards Board ("FASB") issued Interpretation No. 48, "Accounting for Uncertainty in Income Taxes – an Interpretation of FASB Statement No. 109" (the "Interpretation"). The Interpretation establishes for all entities, including pass-through entities such as the Portfolio, a minimum threshold for financial statement recognition of the benefit of positions taken in filing tax returns (including whether an entity is taxable in a particular jurisdiction), and requires certain expanded tax disclosures. A calendar year open-end or closed-end fund would implement the Interpretation no later than June 29, 2007 (the last business day of the semi-annual reporting period) and will also apply to all open tax years as of the date of effectiveness. Management has recently begun to evaluate the application of the Interpretation to the Portfolio, and is not in a position at this time to estimate the significance of its impact, if any, on the Portfolio's financial statements.
In September 2006, the FASB issued Statement of Financial Accounting Standards No. 157, "Fair Value Measurements" ("SFAS No. 157"), which defines fair value, establishes a framework for measuring fair value in generally accepted accounting principles, and expands disclosures about fair value measurements. SFAS No. 157 does not require new fair value measurements, but is applied to the extent that other accounting pronouncements require or permit fair value measurements. SFAS No. 157 emphasizes that fair value is a market-based measurement that should be determined based on the assumptions that market participants would use in pricing an asset or liability. Companies will be required to disclose the extent to which fair value is used to measure assets and liabilities, the inputs used to develop the measurements, and the effect for fiscal years beginning after November 15, 2007. Management is currently evaluating the potential impact the adopt ion of SFAS No. 157 will have on the Portfolio's financial condition and results of operations.
2. INVESTMENT ADVISORY AGREEMENTS AND OTHER TRANSACTIONS WITH AFFILIATES
The Portfolio pays a monthly advisory fee to Janus Capital based upon average daily net assets and calculated at the annual rate of 0.64%.
Janus Services LLC ("Janus Services"), a wholly-owned subsidiary of Janus Capital, is the Portfolio's transfer agent. Janus Services receives certain out-of-pocket expenses for transfer agent services.
Certain officers of the Portfolio may also be officers and/or directors of Janus Capital. Such officers receive no compensation from the Portfolio, except for the Portfolio's Chief Compliance Officer. Effective January 1, 2006, the Portfolio began reimbursing the adviser for a portion of the compensation paid to the Chief Compliance Officer of the Trust. Total compensation of $3,718 was paid by the Portfolio during the fiscal year ended December 31, 2006. The Portfolio's portion is reported as part of "Other Expenses" on the Statement of Operations.
The Board of Trustees has adopted a deferred compensation plan (the "Deferred Plan") for independent Trustees to elect to defer receipt of all or a portion of the annual compensation they are entitled to receive from the Portfolio. All deferred fees are credited to an account established in the name of the Trustees. The amounts credited to the account then increase or decrease, as the case may be, in accordance with the performance of one or more of the Janus funds that are selected by the Trustees. The account balance continues to fluctuate in accordance with the performance of the selected fund or funds until final payment of all amounts credited to the account. Trustees are allowed to change their designation of mutual funds from time to time. Amounts will be deferred until distributed in accordance to the Deferred Plan. No
Janus Aspen Series December 31, 2006 19
Notes to Financial Statements (continued)
deferred fees were paid to any Trustee under the Deferred Plan during the fiscal year ended December 31, 2006.
A 1.00% redemption fee may be imposed on Service II Shares of the Portfolio held for 60 days or less. This fee is paid to the Portfolio rather than Janus Capital, and is designed to deter excessive short-term trading and to offset the brokerage commissions, market impact, and other costs associated with changes in the Portfolio's asset level and cash flow due to short-term money movements in and out of the Portfolio. The redemption fee is accounted for as an addition to Paid-in Capital. Total redemption fees received by the Portfolio were $69,155 for the fiscal year ended December 31, 2006.
For the fiscal year ended December 31, 2006, Janus Capital assumed $21,288 of legal, consulting and Trustee costs and fees incurred by the funds in Janus Investment Fund, Janus Aspen Series and Janus Adviser Series (the "Funds") in connection with the regulatory and civil litigation matters discussed in Note 6. These non-recurring costs were allocated to all Funds based upon the Funds' respective net assets as of July 31, 2004. Additionally, all future non-recurring costs will be allocated based upon the Funds' respective net assets on July 31, 2004. These non-recurring costs and costs assumed by Janus Capital are shown on the Statement of Operations.
During the fiscal year ended December 31, 2006, Janus Services reimbursed the Portfolio $605 for Institutional Shares, $5,520 for Service Shares and $887 for Service II Shares, as a result of dilutions caused by incorrectly processed shareholder activity. Reimbursements are included in "Payment from affiliate" on the Statements of Changes in Net Assets.
During the fiscal year ended December 31, 2006, Janus Capital reimbursed the Portfolio $847 for Institutional Shares, $988 for Service Shares and $196 for Service II Shares, as a result of dilutions caused by certain trading and/or pricing errors. Reimbursements are included in "Payment from affiliate" on the Statements of Changes in Net Assets.
During the fiscal year ended December 31, 2005, Janus Services reimbursed the Portfolio $887 for Service II Shares as a result of dilutions caused by incorrectly processed shareholder activity. Reimbursements are included in "Payment from affiliate" on the Statements of Changes in Net Assets.
During the fiscal year ended December 31, 2005, Janus Capital reimbursed the Portfolio $33 for Service Shares as a result of dilutions caused by certain trading and/or pricing errors. Reimbursements are included in "Payment from affiliate" on the Statements of Changes in Net Assets.
Janus Distributors LLC, a wholly-owned subsidiary of Janus Capital, is a distributor of the Portfolio. Service Shares and Service II Shares have adopted a Distribution and Shareholder Servicing Plan (the "Plan") pursuant to Rule 12b-1 under The 1940 Act. The Plan authorizes payments by the Portfolio in connection with the distribution of Service Shares and Service II Shares at an annual rate of up to 0.25% of Service Shares' average daily net assets.
The Portfolio's expenses may be reduced by expense offsets from an unaffiliated custodian and/or transfer agent. Such credits or offsets are included in Expense and Fee Offset on the Statement of Operations. The transfer agent fee offsets received during the period reduce Transfer Agent Fees and Expenses. Custodian offsets received reduce Custodian Fees. The Portfolio could have employed the assets used by the custodian and/or transfer agent to produce income if it had not entered into an expense offset arrangement.
The Portfolio may invest in money market funds, including funds managed by Janus Capital. During the fiscal year ended December 31, 2006, the Portfolio recorded distributions from affiliated investment companies as affiliated dividend income, and had the following affiliated purchases and sales:
| Purchases Shares/Cost | Sales Shares/Cost | Dividend Income | Value at 12/31/06 | ||||||||||||||||
| Janus Aspen International Growth Portfolio | |||||||||||||||||||
| Janus Government Money Market Fund | $ | 13,216,122 | $ | 13,216,122 | $ | 9,414 | $ | – | |||||||||||
| Janus Institutional Cash Reserves Fund | 121,519,315 | 119,446,315 | 343,822 | 2,073,000 | |||||||||||||||
| Janus Money Market Fund | 125,909,030 | 117,020,030 | 278,367 | 8,889,000 | |||||||||||||||
| $ | 260,644,467 | $ | 249,682,467 | $ | 631,603 | $ | 10,962,000 | ||||||||||||
3. FEDERAL INCOME TAX
The tax components of capital shown in the table on the next page represent: (1) distribution requirements the Portfolio must satisfy under the income tax regulations; (2) losses or deductions the Portfolio may be able to offset against income and gains realized in future years; and (3) unrealized appreciation or depreciation of investments for federal income tax purposes (reduced by foreign tax liability).
In 2006, the Portfolio incurred "Post-October" losses during the period from November 1, 2006 through December 31, 2006. These losses will be deferred for tax purposes and recognized in 2007.
Other book to tax differences in the current year primarily consist of foreign currency contract adjustments. The Portfolio has elected to treat gains and losses on forward foreign
20 Janus Aspen Series December 31, 2006
currency contracts as capital gains and losses. Other foreign currency gains and losses on debt instruments are treated as ordinary income for federal income tax purposes pursuant to Section 988 of the Internal Revenue Code.
Accumulated capital losses noted below represent net capital loss carryovers, as of December 31, 2006, that may be available to offset future realized capital gains and thereby reduce future taxable gains distributions.
| Portfolio | Undistributed Ordinary Income | Undistributed Long–Term Gains | Accumulated Capital Losses | Post-October Deferral | Other Book to Tax Differences | Net Tax Appreciation/ (Depreciation) | |||||||||||||||||||||
| Janus Aspen International Growth Portfolio(1) | $ | 666,833 | $ | – | $ | (114,274,267 | ) | $ | (168,641 | ) | $ | 112,894 | $ | 721,379,796 | |||||||||||||
(1) Capital loss carryover is subject to annual limitations.
The table below shows the expiration dates of the carryovers.
Capital Loss Carryover Expiration Schedule
For the year ended December 31, 2006
| Portfolio | December 31, 2009 | December 31, 2010 | December 31, 2011 | ||||||||||||
| Janus Aspen International Growth Portfolio(1) | $ | (399,260 | ) | $ | (72,007,451 | ) | $ | (41,867,556 | ) | ||||||
(1) Capital loss carryover is subject to annual limitations.
During the year ended December 31, 2006, the following capital loss carryover was utilized by the Portfolio as indicated in the table below.
| Portfolio | Capital Loss Carryover Utilized | ||||||
| Janus Aspen International Growth Portfolio | $ | 307,907,110 | |||||
The aggregate cost of investments and the composition of unrealized appreciation and depreciation of investment securities for federal income tax purposes as of December 31, 2006, are noted below.
Unrealized appreciation and unrealized depreciation in the table below exclude appreciation/depreciation on foreign currency translations. The primary difference between book and tax appreciation or depreciation of investments is wash sale loss deferrals.
| Portfolio | Federal Tax Cost | Unrealized Appreciation | Unrealized (Depreciation) | ||||||||||||
| Janus Aspen International Growth Portfolio | $ | 1,603,877,077 | $ | 755,044,404 | $ | (31,848,996 | ) | ||||||||
Income and capital gains distributions are determined in accordance with income tax regulations that may differ from accounting principles generally accepted in the United States of America. These differences are due to differing treatments for items such as net short-term gains, deferral of wash sale losses, foreign currency transactions, net investment losses and capital loss carryovers. Certain permanent differences such as tax returns of capital and net investment losses noted below have been reclassified to paid-in capital.
| For the fiscal year ended December 31, 2006 | Distributions | ||||||||||||||||||
| Portfolio | From Ordinary Income | From Long-Term Capital Gains | Tax Return of Capital | Net Investment Loss | |||||||||||||||
| Janus Aspen International Growth Portfolio | $ | 33,885,214 | $ | – | $ | – | $ | – | |||||||||||
| For the fiscal year ended December 31, 2005 | Distributions | ||||||||||||||||||
| Portfolio | From Ordinary Income | From Long-Term Capital Gains | Tax Return of Capital | Net Investment Loss | |||||||||||||||
| Janus Aspen International Growth Portfolio | $ | 12,382,967 | $ | – | $ | – | $ | – | |||||||||||
Janus Aspen Series December 31, 2006 21
Notes to Financial Statements (unaudited) (continued)
4. CAPITAL SHARE TRANSACTIONS
| For the fiscal year ended December 31 | Janus Aspen International Growth Portfolio | ||||||||||
| (all numbers are in thousands) | 2006 | 2005 | |||||||||
| Transactions in Portfolio Shares – Institutional Shares | |||||||||||
| Shares sold | 5,510 | 3,438 | |||||||||
| Reinvested dividends and distributions | 321 | 190 | |||||||||
| Shares repurchased | (4,811 | ) | (5,258 | ) | |||||||
| Net Increase (Decrease) in Portfolio Shares | 1,020 | (1,630 | ) | ||||||||
| Shares Outstanding, Beginning of Period | 15,476 | 17,106 | |||||||||
| Shares Outstanding, End of Period | 16,496 | 15,476 | |||||||||
| Transactions in Portfolio Shares – Service Shares | |||||||||||
| Shares sold | 5,523 | 3,048 | |||||||||
| Reinvested dividends and distributions | 370 | 190 | |||||||||
| Shares repurchased | (2,759 | ) | (3,687 | ) | |||||||
| Net Increase (Decrease) in Portfolio Shares | 3,134 | (449 | ) | ||||||||
| Shares Outstanding, Beginning of Period | 18,063 | 18,512 | |||||||||
| Shares Outstanding, End of Period | 21,197 | 18,063 | |||||||||
| Transactions in Portfolio Shares – Service II Shares | |||||||||||
| Shares sold | 3,502 | 1,006 | |||||||||
| Reinvested dividends and distributions | 97 | 32 | |||||||||
| Shares repurchased | (817 | ) | (504 | ) | |||||||
| Net Increase (Decrease) in Portfolio Shares | 2,782 | 534 | |||||||||
| Shares Outstanding, Beginning of Period | 3,197 | 2,663 | |||||||||
| Shares Outstanding, End of Period | 5,979 | 3,197 | |||||||||
5. PURCHASES AND SALES OF INVESTMENT SECURITIES
For the fiscal year ended December 31, 2006, the aggregate cost of purchases and proceeds from sales of investment securities (excluding short-term securities) were as follows:
| Portfolio | Purchases of Securities | Proceeds from Sales of Securities | Purchases of Long-Term U.S. Government Obligations | Proceeds from Sales of Long-Term U.S. Government Obligations | |||||||||||||||
| Janus Aspen International Growth Portfolio | $ | 1,327,548,937 | $ | 1,020,679,513 | $ | – | $ | – | |||||||||||
6. PENDING LEGAL MATTERS
In the fall of 2003, the Securities and Exchange Commission ("SEC"), the Office of the New York State Attorney General ("NYAG"), the Colorado Attorney General ("COAG"), and the Colorado Division of Securities ("CDS") announced that they were investigating alleged frequent trading practices in the mutual fund industry. On August 18, 2004, Janus Capital announced that it had reached final settlements with the SEC, the NYAG, the COAG, and the CDS related to such regulators' investigations into Janus Capital's frequent trading arrangements.
A number of civil lawsuits were brought against Janus Capital and certain of its affiliates, the Janus funds, and related entities and individuals based on allegations similar to those announced by the above regulators and were filed in several state and federal jurisdictions. Such lawsuits alleged a variety of theories for recovery including, but not limited to, the federal securities laws, other federal statutes (including ERISA), and various common law doctrines. The Judicial Panel on Multidistrict Litigation transferred these actions to the U.S. District Court for the District of Maryland (the "Court") for coordinated proceedings. On September 29, 2004, five consolidated amended complaints were filed with the Court that generally include: (i) claims by a putative class of investors in certain Janus funds asserting claims on behalf of the investor class (Marini, et al. v. Janus Investment Fund, et al., U.S. District Court, District of Maryland, Case No. 04-CV-00497); (ii) derivative claims by investors in certain Janus funds ostensibly on behalf of such funds (Steinberg et al. v. Janus Capital Management, LLC et al., U.S. District Court, District of Maryland, Case No. 04-CV-00518); (iii) claims on behalf of participants in the Janus 401(k) plan (Wangberger v. Janus Capital Group Inc., 401(k) Advisory Committee, et al., U.S. District Court, District of Maryland, Case No. JFM-05-2711); (iv) claims brought on behalf of shareholders of Janus Capital Group Inc. ("JCGI") on a derivative basis against the Board of
22 Janus Aspen Series December 31, 2006
Directors of JCGI (Chasen v. Whiston, et al., U.S. District Court, District of Maryland, Case No. 04-MD-00855); and (v) claims by a putative class of shareholders of JCGI asserting claims on behalf of the shareholders (Wiggins, et al. v. Janus Capital Group, Inc., et al., U.S. District Court, District of Maryland, Case No. 04-CV-00818) . In addition, the following were also named as defendants in one or more of the actions: Janus Investment Fund ("JIF"), Janus Aspen Series ("JAS"), Janus Adviser Series ("JAD"), Janus Distributors LLC, Enhanced Investment Technologies, LLC ("INTECH"), Bay Isle Financial LLC ("Bay Isle"), Perkins, Wolf, McDonnell and Company, LLC ("Perkins"), the Advisory Committee of the Janus 401(k) plan, and the current or former directors of JCGI.
On August 25, 2005, the Court entered orders dismissing most of the claims asserted against Janus Capital and its affiliates by fund investors (actions (i) and (ii) described above), except certain claims under Section 10(b) of the Securities Exchange Act of 1934 and under Section 36(b) of the Investment Company Act of 1940, as amended (the "1940 Act"). On August 15, 2006, the complaint in the 401(k) plan class action (action (iii) described above) was dismissed by the district court with prejudice; the plaintiff has appealed that dismissal decision to the United States Court of Appeals for the Fourth Circuit. The Court also dismissed the action against JCGI's Board of Directors without leave to amend (action (iv) described above). Finally, a Motion to Dismiss the action brought by JCGI shareholders (action (v) described above) is fully briefed and pending before the Court.
In addition to the lawsuits described above, the Auditor of the State of West Virginia ("Auditor"), in his capacity as securities commissioner, has initiated administrative proceedings against many of the defendants in the market timing cases (including JCGI and Janus Capital) and, as a part of its relief, is seeking disgorgement and other monetary relief based on similar market timing allegations (In the Matter of Janus Capital Group Inc. et al., Before the Securities Commissioner, State of West Virginia, Summary Order No. 05-1320). The respondents in these proceedings collectively sought a Writ of Prohibition in state court, which was denied. Their subsequent Petition for Appeal was also denied. Consequently, in September 2006, JCGI and Janus Capital filed their answer t o the Auditor's summary order instituting proceedings and requested a hearing. JCGI and Janus Capital, as well as other similarly situated defendants, continue to challenge the statutory authority of the Auditor to bring such an action. No further proceedings are currently scheduled.
In addition to the "market timing" actions described above, Janus Capital is a defendant in a consolidated lawsuit in the U.S. District Court for the District of Colorado challenging the investment advisory fees charged by Janus Capital to certain Janus funds (Walter Sins, et al. v. Janus Capital Management LLC, U.S. District Court, District of Colorado, Case No. 04-CV-01647-WDM-MEH; Michael Fleisher, et al. v. Janus Capital Management, LLC, 04-CV-02395-MSK-CBS). The action was filed in 2004 by fund investors asserting breach of fiduciary duty under Section 36(b) of the 1940 Act. The plaintiffs seek declaratory and injunctive relief and an unspecified amount of damages. The trial is scheduled to commence on May 21, 2007.
In 2001, Janus Capital's predecessor was also named as a defendant in a class action suit in the U.S. District Court for the Southern District of New York, alleging that certain underwriting firms and institutional investors violated antitrust laws in connection with initial public offerings (Pfeiffer v. Credit Suisse First Boston aka In re Initial Public Offering Antitrust Litigation, U.S. District Court, Southern District of New York, Case No. 01-CV-2014). The U.S. District Court dismissed the plaintiff's antitrust claims in November 2003; however, the U.S. Court of Appeals vacated that decision and remanded it for further proceedings. In March 2006, the defendants, including Janus Capital, filed a Petition for a Writ of Certiorari with the U.S. Supreme Court to review the decision of the U. S. Court of Appeals. In June 2006, the U.S. Supreme Court invited the U.S. Solicitor General to file a brief expressing the view of the United States, and in November 2006, the Solicitor General filed a brief expressing its view on the matter. The U.S. Supreme Court has granted the Petition for a Writ of Certiorari and the parties are in the process of briefing the matter for the U.S. Supreme Court.
Additional lawsuits may be filed against certain of the Janus funds, Janus Capital, and related parties in the future. Janus Capital does not currently believe that these pending actions will materially affect its ability to continue providing services it has agreed to provide to the Janus funds.
Janus Aspen Series December 31, 2006 23
Report of Independent Registered Public Accounting Firm
To the Trustees and Shareholders
of Janus Aspen International Growth Portfolio
In our opinion, the accompanying statement of assets and liabilities, including the schedule of investments, and the related statements of operations and of changes in net assets and the financial highlights present fairly, in all material respects, the financial position of Janus Aspen International Growth Portfolio (one of the portfolios constituting Janus Aspen Series, hereafter referred to as the "Portfolio") at December 31, 2006, the results of its operations for the year then ended, the changes in its net assets for each of the two years in the period then ended, and the financial highlights for each of the five years in the period then ended, in conformity with accounting principles generally accepted in the United States of America. These financial statements and financial highlights (hereafter referred to as "financial statements") are the responsibility of the Portfolio's management; our responsibility is to express an opinion on t hese financial statements based on our audits. We conducted our audits of these financial statements in accordance with the standards of the Public Company Accounting Oversight Board (United States). Those standards require that we plan and perform the audit to obtain reasonable assurance about whether the financial statements are free of material misstatement. An audit includes examining, on a test basis, evidence supporting the amounts and disclosures in the financial statements, assessing the accounting principles used and significant estimates made by management, and evaluating the overall financial statement presentation. We believe that our audits, which included confirmation of securities at December 31, 2006 by correspondence with the custodian, transfer agent and brokers, and the application of alternative auditing procedures where securities purchased had not been received, provide a reasonable basis for our opinion.

PricewaterhouseCoopers LLP
Denver, Colorado
February 12, 2007
24 Janus Aspen Series December 31, 2006
Additional Information (unaudited)
PROXY VOTING POLICIES AND VOTING RECORD
A description of the policies and procedures that the Portfolio uses to determine how to vote proxies relating to its portfolio securities is available: (i) without charge, upon request, by calling 1-800-525-0020 (toll free); (ii) on the Portfolio's website at www.janus.com/proxyvoting; and (iii) on the SEC's website at http://www.sec.gov. Additionally, information regarding the Portfolio's proxy voting record for the most recent twelve-month period ended June 30 is also available, free of charge, through www.janus.com/proxyvoting and from the SEC's website at http://www.sec.gov.
QUARTERLY PORTFOLIO HOLDINGS
The Portfolio files its complete portfolio holdings (schedule of investments) with the SEC for the first and third quarters of each fiscal year on Form N-Q within 60 days of the end of such fiscal quarter. The Portfolio's Form N-Q: (i) is available on the SEC's website at http://www.sec.gov; (ii) may be reviewed and copied at the SEC's Public Reference Room in Washington, D.C. (information on the Public Reference Room may be obtained by calling 1-800-SEC-0330); and (iii) is available without charge, upon request, by calling Janus at 1-800-525-0020 (toll free).
APPROVAL OF ADVISORY AGREEMENTS DURING THE PERIOD
The Trustees of Janus Aspen Series, more than eighty-five percent of whom have never been affiliated with the Adviser ("Independent Trustees"), oversee the management of each of the Portfolios and, as required by law, determine annually whether to continue the investment advisory agreement for each Portfolio and the subadvisory agreements for the three Portfolios that utilize subadvisers.
In connection with their most recent consideration of those agreements for each of the Portfolios, the Trustees received and reviewed a substantial amount of information provided by Janus Capital (the "Adviser") and the respective subadvisers in response to requests of the Independent Trustees and their independent legal counsel. They also received and reviewed a considerable amount of information and analysis provided to the Trustees by their independent fee consultant. Throughout their consideration of the agreements the Independent Trustees were advised by their independent legal counsel. The Independent Trustees met on two separate occasions with management to consider the agreements, and at each of those meetings they also met separately in executive session with their independent legal counsel.
At a meeting held on December 20, 2006, based on their evaluation of the information provided by the Adviser, the subadvisers and the independent fee consultant and other information, the Trustees determined that the overall arrangements between each Portfolio and the Adviser were fair and reasonable in light of the nature, extent and quality of the services provided by the Adviser, its affiliates and the subadvisers, the fees charged for those services, and other matters that the Trustees considered relevant in the exercise of their business judgment. At that meeting all of the Trustees unanimously approved the continuation of the investment advisory agreement for each Portfolio, and the subadvisory agreement for each subadvised Portfolio, for the period from February 1, 2007 through February 1, 2008, subject to earlier termination as provided in each agreement.
In considering the continuation of those agreements, the Trustees reviewed and analyzed various factors that they determined were relevant, including the factors described below, none of which by itself was considered dispositive. However, the material factors and conclusions that formed basis for the Trustees' determination to approve the continuation of the agreements are discussed separately below.
Nature, Extent and Quality of Services
The Trustees reviewed the nature, extent and quality of the services of Janus Capital and the subadvisers to the Funds, taking into account the investment objective and strategy of each Portfolio and the knowledge the Trustees gained from their regular meetings with management on at least a quarterly basis and their ongoing review of information related to the Funds. In addition, the Trustees reviewed the resources and key personnel of Janus Capital and each subadviser, especially those who provide investment management services to the Portfolios. The Trustees also considered other services provided to the Portfolios by Janus Capital or the subadvisers, such as managing the execution of portfolio transactions and the selection of broker-dealers for those transactions, serving as the Portfolios' administrator, monitoring adherence to the Portfolios' investment restrictions, producing shareholder reports, providing support services for the Tru stees and Trustee committees, communicating with shareholders and overseeing the activities of other service providers, including monitoring compliance with various policies and procedures of the Portfolios and with applicable securities laws and regulations.
The Trustees concluded that: the nature, extent and quality of the services provided by Janus Capital or the subadviser to each Portfolio were appropriate and consistent with the terms of the respective advisory and subadvisory agreements; that, taking into account steps taken to address a small portion of the Portfolios whose performance lagged that of their peers for certain periods, the quality of those services had been consistent with or superior to quality norms in the industry; and that the Portfolios were likely to benefit from the continued provision of those services. They also concluded that each of Janus Capital and each subadviser had sufficient personnel, with the appropriate education and experience, to
Janus Aspen Series December 31, 2006 25
Additional Information (unaudited) (continued)
serve the Portfolios effectively and had demonstrated its continuing ability to attract and retain well-qualified personnel.
Performance of the Funds
The Trustees considered the performance results of each Portfolio over various time periods. They reviewed information comparing each Portfolio's performance with the performance of comparable funds and peer groups identified by Lipper Inc., an independent provider of investment company data, and with the Portfolio's benchmark. They concluded that the performance of most Portfolios was good to very good. Although the performance of some Portfolios lagged that of their peers for certain periods, the Trustees also concluded that Janus Capital had taken appropriate steps to address those instances of under-performance and that the more recent performance of most of those Portfolios had been improving.
Costs of Services Provided
The Trustees examined information on the fees and expenses of each Portfolio in comparison to similar information for other comparable funds as provided by Lipper. They also reviewed an analysis of that information provided by their independent fee consultant and noted that the rate of management (investment advisory and administrative) fees for most of the Portfolios, after contractual expense limitations, was below the mean management fee rate of the respective peer group of funds selected by Lipper.
The Trustees considered the methodology used by Janus Capital and each subadviser in determining compensation payable to portfolio managers, the competitive environment for investment management talent and the competitive market for mutual funds in different distribution channels. They concluded that the compensation methodology provided a good alignment of the interests of the portfolio managers with the interests of Portfolio shareholders.
The Trustees also reviewed management fees charged by Janus Capital to its separate account clients and to its subadvised funds (for which Janus Capital provides only portfolio management services). Although in most instances subadvisory and separate account fee rates for various investment strategies were lower than management fees for Portfolios having a similar strategy, the Trustees noted that Janus Capital performs significant additional services for the Portfolios that it does not provide to those other clients, including administrative services, oversight of the Portfolios' other service providers, trustee support, regulatory compliance and numerous other services, and that, in serving the Portfolios, Janus Capital assumes many legal risks that it does not assume in servicing its other clients. Moreover, they noted that the spread between the average fees charged to the Portfolios and the fees that Janus Capital charged to its separate account clients was significantly smaller than the average spread for such fees of other advisers, based on publicly available data and research conducted by their independent fee consultant.
In considering the fees charged by Janus Capital, the Trustees had previously negotiated with Janus Capital a temporary contingent waiver of a portion the investment advisory fee paid by Janus Aspen Worldwide Growth Portfolio to Janus Capital to provide for a possible reduction in the rate of advisory fee payable by the Portfolio for the period July 1, 2006 through January 31, 2007 if the investment performance of the Fund should lag that of its benchmark performance over the applicable performance measurement period. Commencing in February 2007, the previously approved performance-based fee schedule will become operative.
The Trustees reviewed information on the profitability of Janus Capital and its affiliates of their relationships with each Portfolio, as well as an explanation of the methodology utilized in allocating various expenses among the Portfolios and other clients. The Trustees also reviewed the financial statements of Janus Capital's parent company and its corporate structure. In their review, the Trustees considered whether Janus Capital and each subadviser receive adequate incentives to manage the Portfolios effectively. The Trustees recognized that profitability comparisons among fund managers are difficult because very little comparative information is publicly available and profitability of any manager is affected by numerous factors, including the organizational structure of the particular manager, the types of funds and other accounts it manages, possible other lines of business, the methodology for allocating expenses and the manager's ca pital structure and cost of capital. However, based on the information available and taking those factors into account, the Trustees concluded that Janus Capital's profitability with respect to each Portfolio in relation to the services rendered was not unreasonable.
The Trustees concluded that the management fees and other compensation payable by each Fund to Janus Capital and its affiliates, as well as the fees paid by Janus Capital to the subadvisers of subadvised Portfolios, were reasonable in relation to the nature and quality of the services provided, taking into account the fees charged by other advisers for managing comparable mutual funds with similar strategies and the fees Janus Capital and the subadviser charges to other clients. The Trustees also concluded that the overall expense ratio of each Portfolio was reasonable, taking into account the size of the Portfolio, the quality of services provided by Janus Capital and any subadviser, the investment performance of the
26 Janus Aspen Series December 31, 2006
Portfolio and any expense limitations agreed to by Janus Capital.
Economies of Scale
The Trustees considered information about the potential for Janus Capital to realize economies of scale as the assets of the Portfolios increase. They noted that, although most Portfolios pay advisory fees at a fixed rate as a percentage of net assets, without any breakpoints, the management fee paid by each Portfolio, after any contractual expense limitations, was below the mean management fee rate of the Portfolio's peer group selected by Lipper; and, for those Portfolios whose expenses are being reduced by the contractual expense limitations of Janus Capital, Janus Capital is subsidizing the Portfolios because they have not reached adequate scale. Moreover, as the assets of many of the Portfolios have declined in the past few years, the Portfolios have benefited from having advisory fee rates that have remained constant rather than increasing as assets decline. In addition, performance fee structures have been implemented for several Port folios that will cause the effective rate of advisory fees payable by such a Portfolio to vary depending on the investment performance of the Portfolio relative to its benchmark; and a few Portfolios have fee schedules with breakpoints and reduced fee rates above certain asset levels. The Trustees also noted that the Portfolios share directly in economies of scale through lower charges of third-party service providers based on the combined scale of all of the Portfolios. Based on all of the information they reviewed, the Trustees concluded that the current fee structure of each Portfolio was reasonable and that the current rates of fees do reflect a sharing between Janus Capital and the Portfolio of economies of scale at the current asset level of the Portfolio.
Other Benefits to Janus Capital
The Trustees also considered benefits that accrue to Janus Capital and its affiliates from their relationships with the Portfolios. They recognized that two affiliates of Janus Capital separately serve the Portfolios as transfer agent and distributor, respectively, and that the transfer agent receives compensation from the non-money market Portfolios for services provided. The Trustees also considered Janus Capital's use of commissions paid by Portfolios on their portfolio brokerage transactions to obtain proprietary research products and services benefiting the Portfolios and/or other clients of Janus Capital, as well as Janus Capital's agreement not to use any Portfolio's brokerage transactions to obtain third party research products or services. The Trustees concluded that Janus Capital's use of "soft" commission dollars to obtain proprietary research products and services was consistent with regulatory requirements and guidelines and was likely to benefit each Portfolio. The Trustees also concluded that, other than the services provided by Janus Capital and its affiliates pursuant to the agreements and the fees to be paid by each Portfolio therefor, the Portfolios and Janus Capital may potentially benefit from their relationship with each other in other ways. They concluded that Janus Capital benefits from the receipt of proprietary research products and services acquired through commissions paid on portfolio transactions of the Portfolios and that the Portfolios benefit from Janus Capital's receipt of those products and services as well as research products and services acquired through commissions paid by other clients of Janus Capital. They further concluded that success of any Portfolio could attract other business to Janus Capital or other Janus Funds and that the success of Janus Capital could enhance Janus Capital's ability to serve the Portfolios.
After full consideration of the above factors as well as other factors, all of the Trustees, including all of the Independent Trustees, concluded that the proposed continuation of the investment advisory agreement for each applicable Portfolio were in the best interest of the respective Portfolios and their shareholders.
Janus Aspen Series December 31, 2006 27
Explanations of Charts, Tables and
Financial Statements (unaudited)
1. PERFORMANCE OVERVIEWS
The performance overview graph compares the performance of a hypothetical $10,000 investment in the Portfolio with one or more widely used market indices. The hypothetical example does not represent the returns of any particular investment.
When comparing the performance of the Portfolio with an index, keep in mind that market indices do not include brokerage commissions that would be incurred if you purchased the individual securities in the index. They also do not include taxes payable on dividends and interest or operating expenses incurred if you maintained a Portfolio invested in the index.
Average annual total returns are quoted for each class of the Portfolio. Average annual total return is calculated by taking the growth or decline in value of an investment over a period of time, including reinvestment of any dividends, distributions and capital gains, then calculating the annual compounded percentage rate that would have produced the same result had the rate of growth been constant throughout the period. Average annual total return does not reflect the deduction of taxes that a shareholder would pay on Portfolio distributions or redemptions of Portfolio shares.
2. SCHEDULE OF INVESTMENTS
Following the performance overview section is the Portfolio's Schedule of Investments. This schedule reports the industry concentrations and types of securities held in the Portfolio on the last day of the reporting period. Securities are usually listed by type (common stock, corporate bonds, U.S. Government obligations, etc.) and by industry classification (banking, communications, insurance, etc.). Holdings are subject to change without notice.
The value of each security is quoted as of the last day of the reporting period. The value of securities denominated in foreign currencies is converted into U.S. dollars. Certain short-term investments maturing within 60 days are valued at amortized cost, which approximates market value.
A summary of investments by country is provided if the Portfolio invested in foreign securities. This summary reports the Portfolio's exposure to different countries by providing the percentage of securities invested in each country. The country of each security represents the country in which the company is incorporated.
2A. FORWARD CURRENCY CONTRACTS
A table listing forward currency contracts follows the Portfolio's Schedule of Investments (if applicable). Forward currency contracts are agreements to deliver or receive a preset amount of currency at a future date. Forward currency contracts are used to hedge against foreign currency risk in the Portfolio's long-term holdings. The table provides the name of the foreign currency, the settlement date of the contract, the amount of the contract, the value of the currency in U.S. dollars and the amount of unrealized gain or loss. The amount of unrealized gain or loss reflects the change in currency exchange rates from the time the contract was opened to the last day of the reporting period.
2B. FUTURES
A table listing futures contracts follows the Portfolio's Schedule of Investments (if applicable). Futures contracts are contracts that obligate the buyer to receive and the seller to deliver an instrument or money at a specified price on a specified date. Futures are used to hedge against adverse movements in securities prices, currency risk or interest rates.
The table provides the name of the contract, number of contracts held, the expiration date, the principal amount, value and the amount of unrealized gain or loss. The amount of unrealized gain or loss reflects the marked-to- market amount for the last day of the reporting period.
3. STATEMENT OF ASSETS AND LIABILITIES
This statement is often referred to as the "balance sheet." It lists the assets and liabilities of the Portfolio on the last day of the reporting period.
The Portfolio's assets are calculated by adding the value of the securities owned, the receivable for securities sold but not yet settled, the receivable for dividends declared but not yet received on stocks owned and the receivable for Portfolio shares sold to investors but not yet settled. The Portfolio's liabilities include payables for securities purchased but not yet settled, Portfolio shares redeemed but not yet paid and expenses owed but not yet paid. Additionally, there may be other assets and liabilities such as unrealized gain or loss on forward currency contracts.
The section entitled "Net Assets Consist of" breaks down the components of the Portfolio's net assets. Because the Portfolio must distribute substantially all earnings, you will notice that a significant portion of net assets is shareholder capital.
The last section of this statement reports the net asset value ("NAV") per share on the last day of the reporting period for each class of the Portfolio. The NAV is calculated by dividing the Portfolio's net assets (assets minus liabilities) by the number of shares outstanding.
4. STATEMENT OF OPERATIONS
This statement details the Portfolio's income, expenses, gains and losses on securities and currency transactions, and appreciation or depreciation of current Portfolio holdings.
The first section in this statement, entitled "Investment Income," reports the dividends earned from stocks and interest earned from interest-bearing securities in the Portfolio.
The next section reports the expenses and expense offsets incurred by the Portfolio, including the advisory fee paid to
28 Janus Aspen Series December 31, 2006
the investment adviser and transfer agent fees and expenses, and printing and postage for mailing statements, financial reports and prospectuses. Expense offsets, if any, are also shown.
The last section lists the increase or decrease in the value of securities held in the Portfolio. The Portfolio realizes a gain (or loss) when it sells its position in a particular security. An unrealized gain (or loss) refers to the change in net appreciation or depreciation of the Portfolio during the reporting period. "Net Realized and Unrealized Gain/(Loss) on Investments" is affected both by changes in the market value of Portfolio holdings and by gains (or losses) realized during the reporting period.
5. STATEMENT OF CHANGES IN NET ASSETS
This statement reports the increase or decrease in the Portfolio's net assets during the reporting period. Changes in the Portfolio's net assets are attributable to investment operations, dividends, distributions and capital share transactions. This is important to investors because it shows exactly what caused the Portfolio's net asset size to change during the period.
The first section summarizes the information from the Statement of Operations regarding changes in net assets due to the Portfolio's investment performance. The Portfolio's net assets may also change as a result of dividend and capital gains distributions to investors. If investors receive their dividends in cash, money is taken out of the Portfolio to pay the distribution. If investors reinvest their dividends, the Portfolio's net assets will not be affected. If you compare the Portfolio's "Net Decrease from Dividends and Distributions" to the "Reinvested dividends and distributions," you will notice that dividend distributions had little effect on the Portfolio's net assets. This is because the majority of Janus investors reinvest their distributions.
The reinvestment of dividends is included under "Capital Share Transactions." "Capital Shares" refers to the money investors contribute to the Portfolio through purchases or withdraw via redemptions. The "Redemption Fees" refers to the fee paid to the Portfolio for shares held for three months or less by a shareholder. The Portfolio's net assets will increase and decrease in value as investors purchase and redeem shares from the Portfolio.
6. FINANCIAL HIGHLIGHTS
This schedule provides a per-share breakdown of the components that affect the Portfolio's NAV for current and past reporting periods for each class of the Portfolio. Not only does this table provide you with total return, it also reports total distributions, asset size, expense ratios and portfolio turnover rate.
The first line in the table reflects the NAV per share at the beginning of the reporting period. The next line reports the net investment income per share, which comprises dividends and interest income earned on securities held by the Portfolio. Following is the total of gains/(losses), realized and unrealized. Dividends and distributions are then subtracted to arrive at the NAV per share at the end of the period. The next line reflects the average annual total return reported the last day of the period.
Also included are the expense ratios, or the percentage of net assets that are used to cover operating expenses during the period. Expense ratios vary for a number of reasons, including the differences in management fees, the average shareholder account size and the extent of foreign investments, which entail greater transaction costs.
The Portfolio's expenses may be reduced through expense reduction arrangements. These arrangements may include the use of balance credits or transfer agent fee offsets. The Statement of Operations reflects total expenses before any such offset, the amount of offset and the net expenses. The expense ratios listed in the Financial Highlights reflect total expenses prior to any expense offsets (gross expense ratio) and after the expense offsets (net expense ratio). Both expense ratios reflect expenses after waivers (reimbursements), if applicable.
The ratio of net investment income/(loss) summarizes the income earned less expenses, divided by the average net assets of the Portfolio during the reporting period. Don't confuse this ratio with the Portfolio's yield. The net investment income ratio is not a true measure of the Portfolio's yield because it doesn't take into account the dividends distributed to the Portfolio's investors.
The next ratio is the portfolio turnover rate, which measures the buying and selling activity in a Portfolio. Portfolio turnover is affected by market conditions, changes in the asset size of a Portfolio, the nature of the Portfolio's investments and the investment style of the portfolio manager. A 100% rate implies that an amount equal to the value of the entire portfolio is turned over in a year; a 50% rate means that an amount equal to the value of half the portfolio is traded in a year; and a 200% rate means that an amount equal to the value of the portfolio is traded every six months.
Janus Aspen Series December 31, 2006 29
Designation Requirements (unaudited)
For federal income tax purposes, the Portfolio designated the following for the year ended December 31, 2006:
Foreign Taxes Paid and Foreign Source Income
| Portfolio | Foreign Taxes Paid | Foreign Source Income | |||||||||
| Janus Aspen International Growth Portfolio | $ | 892,279 | $ | 38,588,077 | |||||||
30 Janus Aspen Series December 31, 2006
Trustees and Officers (unaudited)
The Portfolio's Statement of Additional Information includes additional information about the Trustees and officers and is available, without charge, by calling 1-800-525-0020.
The following are the Trustees and officers of the Trust, together with a brief description of their principal occupations during the last five years (principal occupations for certain Trustees may include periods over five years).
Each Trustee has served in that capacity since he or she was originally elected or appointed. The Trustees do not serve a specified term of office. Each Trustee will hold office until the termination of the Trust or his or her earlier death, resignation, retirement, incapacity or removal. The retirement age for Trustees is 72. The Portfolio's Nominating and Governance Committee will consider nominees for the position of Trustee recommended by shareholders. Shareholders may submit the name of a candidate for consideration by the Committee by submitting their recommendations to the Trust's Secretary. Each Trustee is currently a Trustee of two other registered investment companies advised by Janus Capital: Janus Investment Fund and Janus Adviser Series. As of the date of this report, collectively, these three registered investment companies consist of 69 series or funds.
The Trust's officers are elected annually by the Trustees for a one-year term. Certain officers also serve as officers of Janus Investment Fund and Janus Adviser Series. Certain officers of the Portfolio may also be officers and/or directors of Janus Capital. Portfolio officers receive no compensation from the Portfolio, except for the Portfolio's Chief Compliance Officer, as authorized by the Trustees.
Trustees
| Name, Age and Address | Positions Held with Portfolio | Length of Time Served | Principal Occupations During the Past Five Years | Number of Portfolios in Fund Complex Overseen by Trustee | Other Directorships Held by Trustee | ||||||||||||||||||
| Independent Trustees | |||||||||||||||||||||||
| Dennis B. Mullen 151 Detroit Street Denver, CO 80206 Age 63 | Chairman Trustee | 3/04-Present 9/93-Present | Chief Executive Officer of Red Robin Gourmet Burgers, Inc. (since 2005). Formerly, private investor. | 69 | * | Chairman of the Board (since 2005) and Director of Red Robin Gourmet Burgers, Inc.; and Director of Janus Capital Funds Plc (Dublin-based, non-U.S. funds). | |||||||||||||||||
| Jerome S. Contro 151 Detroit Street Denver, CO 80206 Age 50 | Trustee | 12/05-Present | Partner of Tango Group, a private investment firm (since 1999). | 69 | Trustee and Chairman of RS Investment Trust (since 2001); Director of IZZE Beverages and MyFamily.com, Inc. (genealogical research website). | ||||||||||||||||||
| William F. McCalpin 151 Detroit Street Denver, CO 80206 Age 49 | Trustee | 6/02-Present | Private Investor. Formerly, Vice President of Asian Cultural Council and Executive Vice President and Chief Operating Officer of The Rockefeller Brothers Fund (a private family foundation). | 69 | Director of the F.B. Heron Foundation (a private grantmaking foundation). | ||||||||||||||||||
| John W. McCarter, Jr. 151 Detroit Street Denver, CO 80206 Age 68 | Trustee | 6/02-Present | President and Chief Executive Officer of The Field Museum of Natural History (Chicago, IL). | 69 | Chairman of the Board and Director of Divergence Inc. (biotechnology firm); Director of W.W. Grainger, Inc. (industrial distributor); and Trustee of WTTW (Chicago public television station) and the University of Chicago. | ||||||||||||||||||
Janus Aspen Series December 31, 2006 31
Trustees and Officers (unaudited) (continued)
Trustees (cont.)
| Name, Age and Address | Positions Held with Portfolio | Length of Time Served | Principal Occupations During the Past Five Years | Number of Portfolios in Fund Complex Overseen by Trustee | Other Directorships Held by Trustee | ||||||||||||||||||
| Independent Trustees (cont.) | |||||||||||||||||||||||
| James T. Rothe 151 Detroit Street Denver, CO 80206 Age 63 | Trustee | 1/97-Present | Co-founder and Managing Director of Roaring Fork Capital Partners Management, LLC (private investment in public equity firm); and Professor Emeritus of Business of the University of Colorado, Colorado Springs, CO (since 2004).Formerly, Professor of Business of the University of Colorado (2002-2004); and Distinguished Visiting Professor of Business (2001-2002) of Thunderbird University (American Graduate School of International Management), Glendale, AZ. | 69 | Director of Red Robin Gourmet Burgers, Inc. | ||||||||||||||||||
| William D. Stewart 151 Detroit Street Denver, CO 80206 Age 62 | Trustee | 9/93-Present | Corporate Vice President and General Manager of MKS Instruments – HPS Products, Boulder, CO (a manufacturer of vacuum fittings and valves). | 69 | N/A | ||||||||||||||||||
| Martin H. Waldinger 151 Detroit Street Denver, CO 80206 Age 68 | Trustee | 9/93-Present | Private Investor and Consultant to California Planned Unit Developments. Formerly, CEO and President of Marwal, Inc. (homeowner association management company). | 69 | N/A | ||||||||||||||||||
| Linda S. Wolf 151 Detroit Street Denver, CO 80206 Age 59 | Trustee | 12/05-Present | Retired. Formerly, Chairman and Chief Executive Officer of Leo Burnett (Worldwide) (advertising agency) (2001-2005). | 69 | Director of Wal-Mart, The Field Museum of Natural History (Chicago, IL), Children's Memorial Hospital (Chicago, IL), Chicago Council on Foreign Relations, Economic Club of Chicago, and InnerWorkings (a provider of print procurement solutions). | ||||||||||||||||||
| Interested Trustee | |||||||||||||||||||||||
| Thomas H. Bailey** 151 Detroit Street Denver, CO 80206 Age 69 | Trustee | 5/93-Present | Retired. Formerly, President (1978-2002) and Chief Executive Officer (1994-2002) of Janus Capital or Janus Capital Corporation; Chairman and Director (1978-2002) of Janus Capital Corporation; President and Director (1994-2002) of The Janus Foundation. | 69 | N/A | ||||||||||||||||||
* Mr. Mullen also serves as director of Janus Capital Funds Plc, consisting of 22 funds. Including Janus Capital Funds Plc and the 69 funds comprising the Janus Funds, Mr. Mullen oversees 91 funds.
** The Portfolio is treating Mr. Bailey as an "interested person" of the Trust by virtue of his past positions and continuing relationships with Janus Capital and ownership of shares of Janus Capital's parent company.
32 Janus Aspen Series December 31, 2006
Officers
| Name, Age and Address | Positions Held with Portfolio | Term of Office* and Length of Time Served | Principal Occupations During the Past Five Years | ||||||||||||
| Brent A. Lynn 151 Detroit Street Denver, CO 80206 Age 42 | Executive Vice President and Portfolio Manager Janus Aspen International Growth Portfolio | 1/01-Present | Vice President of Janus Capital and Portfolio Manager for other Janus accounts. | ||||||||||||
| Stephanie Grauerholz-Lofton 151 Detroit Street Denver, CO 80206 Age 36 | Chief Legal Counsel and Secretary Vice President | 1/06-Present 3/06-Present | Assistant Vice President of Janus Capital and Janus Distributors LLC; and Associate Counsel of Janus Capital. Formerly, Associate of Vedder, Price, Kaufman & Kammholz, P.C. (1999-2003). | ||||||||||||
| Kelley Abbott Howes 151 Detroit Street Denver, CO 80206 Age 41 | President and Chief Executive Officer | 1/06-Present | President of Janus Services, LLC; Senior Vice President and General Counsel of Janus Capital; and Senior Vice President and Assistant General Counsel of Janus Distributors LLC. Formerly, Vice President (1999-2005) of Janus Distributors LLC; Senior Vice President and General Counsel (2004-2006), Vice President (2000-2004), and Assistant General Counsel (2002-2004) of Janus Services LLC; and Vice President and Assistant General Counsel (1999-2004) of Janus Capital. | ||||||||||||
| David R. Kowalski 151 Detroit Street Denver, CO 80206 Age 49 | Vice President and Chief Compliance Officer | 6/02-Present | Senior Vice President and Chief Compliance Officer of Janus Capital, Janus Distributors LLC, and Janus Services LLC; Chief Compliance Officer of Bay Isle Financial LLC; and Vice President of Enhanced Investment Technologies LLC. Formerly, Chief Compliance Officer of Enhanced Investment Technologies, LLC (2003-2005); Vice President of Janus Capital (2000-2005), Janus Distributors LLC (2000-2001), and Janus Services LLC (2004-2005); and Assistant Vice President of Janus Services LLC (2002-2004). | ||||||||||||
| Jesper Nergaard 151 Detroit Street Denver, CO 80206 Age 44 | Chief Financial Officer Vice President, Treasurer, and Principal Accounting Officer | 3/05-Present 2/05-Present | Vice President of Janus Capital. Formerly, Director of Financial Reporting for OppenheimerFunds, Inc. (2004-2005); Site Manager and First Vice President of Mellon Global Securities Services (2003); and Director of Fund Accounting, Project Development, and Training of INVESCO Funds Group (1994-2003). | ||||||||||||
* Officers are elected at least annually for a one-year term and may also be elected from time to time by the Trustees for an interim period.
Janus Aspen Series December 31, 2006 33
Janus provides access to a wide range of investment disciplines.
Growth
Janus growth portfolios focus on companies believed to be the leaders in their respective industries, with solid management teams, expanding market share, margins and efficiencies.
Core
Janus core portfolios seek investments in more stable and predictable companies. These portfolios look for a strategic combination of steady growth and for certain portfolios, some degree of income.
Risk-Managed
Our risk-managed portfolios seek to outperform their respective indices while maintaining a risk profile equal to or lower than the index itself. Managed by INTECH (a Janus subsidiary), these portfolios use a mathematical process in an attempt to build a more "efficient" portfolio than the index.
Value
Janus value portfolios invest in companies they believe are poised for a turnaround or are trading at a significant discount to fair value. The goal is to gain unique insight into a company's true value and identify and evaluate potential catalysts that may unlock shareholder value.
International & Global
Janus international and global portfolios seek to leverage Janus' research capabilities by taking advantage of inefficiencies in foreign markets, where accurate information and analytical insight are often at a premium.
Bond & Money Market
Janus bond portfolios attempt to provide less risk relative to equities while seeking to deliver a competitive total return through high current income and appreciation. Janus money market portfolios seek maximum current income consistent with stability of capital.
For more information about our funds, contact your investment professional or go to www.janus.com/info
Please consider the charges, risks, expenses and investment objectives carefully before investing. For a prospectus containing this and other information, please call Janus at 1-800-525-0020 or download the file from www.janus.com/info. Read it carefully before you invest or send money.
An investment in a money market portfolio is not insured or guaranteed by the Federal Deposit Insurance Corporation or any other government agency. Although the Portfolio seeks to preserve the value of your investment at $1.00 per share, it is possible to lose money by investing in the Portfolio.

151 Detroit Street
Denver, CO 80206
1-800-525-0020
Portfolio distributed by Janus Distributors LLC (1/07)
C-0207-169 109-02-707 01-07
2006 Annual Report
Janus Aspen Series
Janus Aspen Large Cap Growth Portfolio
Look Inside. . .
• Portfolio management perspective
• Investment strategy behind your portfolio
• Portfolio performance, characteristics and holdings

Table of Contents
| Useful Information About Your Portfolio Report | 1 | ||||||
| Management Commentary and Schedule of Investments | 2 | ||||||
| Statement of Assets and Liabilities | 10 | ||||||
| Statement of Operations | 11 | ||||||
| Statements of Changes in Net Assets | 12 | ||||||
| Financial Highlights | 13 | ||||||
| Notes to Schedule of Investments | 14 | ||||||
| Notes to Financial Statements | 15 | ||||||
| Report of Independent Registered Public Accounting Firm | 23 | ||||||
| Additional Information | 24 | ||||||
| Explanations of Charts, Tables and Financial Statements | 27 | ||||||
| Designation Requirements | 29 | ||||||
| Trustees and Officers | 30 | ||||||
Please consider the charges, risks, expenses and investment objectives carefully before investing. For a prospectus containing this and other information, please call Janus at 1-800-525-0020 or download the file from www.janus.com/info. Read it carefully before you invest or send money.
Useful Information About Your Portfolio Report
Management Commentary
The Management Commentary in this report includes valuable insight from the Portfolio's manager as well as statistical information to help you understand how your Portfolio's performance and characteristics stack up against those of comparable indices.
Please keep in mind that the opinions expressed by the Portfolio's manager in the Management Commentary are just that: opinions. They are a reflection of the manager's best judgment at the time this report was compiled, which was December 31, 2006. As the investing environment changes, so could the manager's opinions. The views are unique to the manager and aren't necessarily shared by his fellow employees or by Janus in general.
Portfolio Expenses
We believe it's important for our shareholders to have a clear understanding of Portfolio expenses and the impact they have on investment return.
The following is important information regarding the Portfolio's Expense Example, which appears in the Management Commentary within this Annual Report. Please refer to this information when reviewing the Expense Example for the Portfolio.
Example
As a shareholder of a Portfolio, you incur two types of costs: (1) transaction costs, including redemption fees (where applicable) (and any related exchange fees) and (2) ongoing costs, including management fees; distribution and shareholder servicing (12b-1) fees (applicable to Service Shares only); and other Portfolio expenses. The example is intended to help you understand your ongoing costs (in dollars) of investing in a Portfolio and to compare these costs with the ongoing costs of investing in other mutual funds. To do so, compare this 5% hypothetical example with the 5% hypothetical examples that appear in the shareholder reports of the other funds. The example is based upon an investment of $1,000 invested at the beginning of the period and held for the six-month period from July 1, 2006 to December 31, 2006.
Actual Expenses
The first line of the table in each example provides information about actual account values and actual expenses. You may use the information in this line, together with the amount you invested, to estimate the expenses that you paid over the period. Simply divide your account value by $1,000 (for example, an $8,600 account value divided by $1,000 = 8.6), then multiply the result by the number in the first line under the heading entitled "Expenses Paid During Period" to estimate the expenses you paid on your account during the period.
Hypothetical Example for Comparison Purposes
The second line of the table in each example provides information about hypothetical account values and hypothetical expenses based upon the Portfolio's actual expense ratio and an assumed rate of return of 5% per year before expenses, which is not the Portfolio's actual return. The hypothetical account values and expenses may not be used to estimate the actual ending account balance or expenses you paid for the period. You may use this information to compare the ongoing costs of investing in the Portfolio and other funds. To do so, compare this 5% hypothetical example with the 5% hypothetical examples that appear in the shareholder reports of the other funds.
Please note that the expenses shown in the tables are meant to highlight your ongoing costs only and do not reflect any transaction costs, such as redemption fees (where applicable) and any charges at the separate account level or contract level. Redemption fees are fully described in the prospectus. Therefore, the second line of each table is useful in comparing ongoing costs only, and will not help you determine the relative total costs of owning different funds. In addition, if these transaction costs and separate account or contract level charges were included, your costs would have been higher.
Janus Aspen Series December 31, 2006 1
Janus Aspen Large Cap Growth Portfolio (unaudited)
Portfolio Snapshot
This portfolio invests primarily in common stocks of larger, more established companies singled out for their growth potential. In addition, part of the portfolio is invested in small- and mid-cap companies from a diverse collection of businesses representing nearly every sector of the economy.

David Corkins
portfolio manager
The goal of this letter is to discuss my investment process and strategy, and to detail a few specific investment moves and other important changes that I have made since taking over management of the Portfolio on February 1, 2006. I also would like to review the Portfolio's performance during its fiscal year ended December 31, 2006 and share my outlook going forward.
Year-to-Date Repositioning
Throughout the year, I continued my efforts to consolidate the Portfolio, with the goal of owning 70 to 90 individual holdings that earn our highest conviction. This level allows our team to better assess the risks, potential rewards and leverage points of the businesses we invest in, while allowing us to provide diversification for the overall Portfolio.
The second significant change has been to leverage the efforts of our entire research team to build a portfolio of our best ideas. During the year I significantly raised the percentage of assets that are internally rated "buy" and "strong-buy" to 88% of the overall Portfolio. I have a high degree of confidence in our analysts' work, still considering myself an analyst as well as a portfolio manager. Moreover, I believe that, as long as we maintain our historical focus on quality fundamental research, our shareholders will be rewarded.
The last major change was to rebalance the Portfolio across the various market sectors. The Portfolio is more diversified across industries than it was at the beginning of the period, and I expect the focus going forward to be much more on individual company fundamentals than on relative sector concentrations.
In short, the Portfolio today is more concentrated in terms of companies, more diverse in terms of industries, and is populated with the best efforts of our entire research team. My prospective goal is to lower turnover within the Portfolio and compound returns, alongside the companies within the Portfolio.
Performance Review
As mentioned in our semiannual letter, our goal with the Portfolio is to seek superior long-term returns for shareholders. In practice, these returns are measured by positive absolute performance and consistent execution in both up and down markets.
For the 12 months ended December 31, 2006, Janus Aspen Large Cap Growth Portfolio's Institutional Shares and Service Shares advanced 11.38% and 11.08%, respectively, outperforming the Portfolio's primary benchmark, the Russell 1000® Growth Index, which gained 9.07%. Our secondary benchmark, the S&P 500® Index, returned 15.80%. The Portfolio's Institutional and Service Shares also outperformed 89% and 88%, respectively, of all VA Large-Cap Growth funds as measured by Lipper.
| Lipper Quartile1 As of 12/31/06 | One Year | Three Years | Five Years | Ten Years | |||||||||||||||
| Institutional Shares | 1st | 3rd | 2nd | 2nd | |||||||||||||||
| (21 out of 193) | (107 out of 177) | (40 out of 130) | (21 out of 41) | ||||||||||||||||
| Service Shares | 1st | 3rd | 2nd | N/A2 | |||||||||||||||
| (22 out of 193) | (115 out of 177) | (48 out of 130) | N/A2 | ||||||||||||||||
Data presented reflects past performance, which is no guarantee of future results. Investment results and principal value will fluctuate so that shares, when redeemed, may be worth more or less than their original cost. Due to market volatility, current performance may be higher or lower than the performance shown. Call 800-525-0020 or visit www.janus.com/info for performance current to the most recent month-end.
Total return includes reinvestment of dividends and capital gains.
1Rank based on total returns for the VA Lipper Large-Cap Growth funds category.
2The ten-year Lipper ranking for the Portfolio's Service Shares is not available.
The Investment Environment
Concerns over elevated commodity prices and uncertainty over Federal Reserve (Fed) monetary policy heavily influenced equity markets during the fiscal period. As surging energy prices fueled inflationary fears in the spring and early summer, the Fed continued to tighten credit conditions. The Fed raised the overnight lending rate four times, for 100 basis points, through June of 2006 – adding to the 325 basis points of tightening instituted by the central bank since June 2004. Nonetheless, by late summer, retreating energy prices and evidence of a softening economy helped to persuade Fed policymakers to hold rates unchanged at 5.25% at its August, September, October and December meetings. Some investors took this pause as an indication that the Fed may be finished with near-term rate hikes, and might even cut rates in the foreseeable future. However, policymakers co ntinued to warn of underlying inflationary pressures and tight resource capacity.
2 Janus Aspen Series December 31, 2006
(unaudited)
What Went Right
The Portfolio's broadly diversified approach served it well in this volatile period, as companies from a variety of sectors contributed notably. Stock selection proved especially valuable in the capital goods, retail, energy and pharmaceuticals sectors.
One of the top performing individual stocks for the year was Boeing. The aircraft manufacturer provides an excellent example of what I look for in a stock: strong competitive positioning, attractive industry dynamics, rising returns on capital and free cash flow, and a management focus on shareholder value. The company is currently capitalizing on vigorous demand from international carriers, as well as from greater interest in more fuel-efficient planes. While company fundamentals are strong and backlog continues to grow, the stock has also been lifted by negative developments at competitor Airbus, which faced delays in the development of its A380 superjumbo jet and turmoil at the executive level. In December, Boeing received a $5 billion order from Deutsche Lufthansa A.G. in a deal that strengthened its market position relative to Airbus. While I remain optimistic about future order growth and margin potential at Boeing, I elected to take s ome profits during the period given the significant returns over the last year.
We made significant investments in the financial sector during the year given what we believed to be attractive risk/potential reward characteristics. Earlier in the year, many financial stocks were heavily discounted, due in part to perceptions of a slowing economy, weak consumer spending and an inverted yield curve. I took advantage of this pessimism to build meaningful positions in financial stocks such as JPMorgan Chase and American Express. In general, we believed that valuations on these shares overly discounted macroeconomic concerns, and we were attracted to the high levels of free cash flow generation, rising returns and strong management teams at these franchises. Among our financial holdings, JPMorgan Chase was a significant contributor to the Portfolio's performance, returning 29.90% as revenue accelerated in its wholesale businesses, costs declined amidst a restructuring, and credit costs remained modest. Furthermore, we remain optimistic that new management at the firm will continue to invest in the business and drive increased returns on invested capital.
Strong performers in the pharmaceuticals and biotechnology sector included Celgene and Roche Holding. Celgene climbed steadily as its Revlimid and Thalomid treatments for blood-borne cancers fueled a 77.56% year-over-year increase in revenues for the period. Meanwhile, Swiss drug maker Roche reported a 21.10% increase in sales for the period. The company has enjoyed robust sales of its cancer drugs, as well as its flu vaccine, Tamiflu. Management also remains committed to lowering the cost structure of the business by divesting non-core assets and simplifying its balance sheet. Encouraged by the company's prospects, I increased the Portfolio's exposure to the stock.
The Portfolio's household and personal products stocks also outperformed the broader market. One of the largest holdings, consumer products giant Procter & Gamble, continued to impress investors with its strong financial performance and market positioning. Its integration of former rival Gillette appears to be proceeding ahead of schedule, creating new revenue streams and cost synergies. Meanwhile, I initiated a new investment in consumer products company Kimberly-Clark, which I believe is well positioned to benefit from easing commodity prices and its own restructuring efforts.
What Went Wrong
Unfortunately, a handful of individual holdings hurt overall results. One of the biggest detractors for the period was Internet search and media provider Yahoo! While I believe Yahoo! is positioned to capitalize on a shift in advertising dollars from television to the Internet, it continues to face brisk competitive challenges from rivals such as Google (another Portfolio holding). In the second half of the year, the company suffered a setback when it was forced to delay the launch of its highly anticipated new Project Panama advertising management system. Nonetheless, by year-end, the company successfully launched the Panama technology and expanded its availability to all U.S. consumers. We have done extensive research into the potential of the Panama platform and believe it could provide additional revenue opportunities for the company, thereby improving returns going forward.
Select healthcare stocks also suffered during the period. Notably, generic drug maker Teva Pharmaceuticals lost ground as it struggled to digest the recently acquired Ivax, a one-time rival. Teva continues to win Food and Drug Administration approval to market generic versions of several big-name drugs and reported strong growth in sales of its Copaxone treatment for multiple sclerosis. Despite these successes, future pipeline opportunities in the generic space became unclear. In light of this uncertainty, I liquidated the Portfolio's investment in the company.
Market volatility also took a toll on a number of the Portfolio's technology shares. Chipmaker Advanced Micro Devices (AMD) retreated as revenues sagged and margins tightened amid increased competition and pricing pressures from Intel. Nonetheless, I remain constructive on AMD's market position and long-term potential, due in part to its inherent architectural advantages over Intel, which could drive higher gross margins throughout the upcoming product cycle. Consequently, I took advantage of this price weakness to add to the Portfolio's investment.
I was less reassured by prospects for technology equipment manufacturer Juniper Networks, which I completely liquidated after taking over management of the Portfolio. This decision reflected our concerns over the company's dramatic sales-force turnover, management departures and poor execution in its core router business. Although the stock provided a net drag on performance, our decision to liquidate the investment early in the year helped to limit the overall impact on Portfolio results.
Janus Aspen Series December 31, 2006 3
Janus Aspen Large Cap Growth Portfolio (unaudited)
Looking Forward
Recent market gains have received a boost from expectations for more neutral to accommodative monetary policy going forward, and a lower interest rate environment. At the same time, investors have been heartened by generally healthy corporate balance sheets and relatively low levels of corporate leverage. Indeed, one recent study suggested that the S&P 500® Index could use debt to immediately repurchase 26% of its outstanding shares and simply return to average historical debt-to-equity levels. Dramatically higher levels of domestic, private equity fundraising also tend to add a floor to domestic valuations. The result is significant market liquidity that could help to support underlying market gains.
Nonetheless, I would caution that uncertainty over the strength of the economy and the outlook for commodity price inflation could contribute to increased market volatility in the coming year. Moreover, I remain concerned about the prospects for the U.S. dollar and the long-term implications from higher commodity prices. Foreign investors have provided critical support to domestic markets, but their continued interest in U.S. securities could be dampened by sustained dollar weakness.
Despite these risks, I have confidence in the individual stocks within the Portfolio. Our intensive research efforts will continue to seek companies that offer high free cash flow, rising returns on capital and management teams that are focused on shareholder value creation. This is the same process I have used over the last 10 years during my tenure as portfolio manager of two retail funds – Janus Growth and Income Fund (8/97 - 12/03) and Janus Mercury Fund (2/03 - 1/06) – and now Janus Aspen Large Cap Growth Portfolio and the retail version of the fund – Janus Fund. I believe this disciplined, research-driven investment process will deliver solid long-term returns for investors.
Thank you for your investment in Janus Aspen Large Cap Growth Portfolio.
Janus Aspen Large Cap Growth Portfolio At a Glance
5 Largest Contributors to Performance – Holdings
| Contribution | |||||||
| Exxon Mobil Corp. Petroleum and petrochemical business operator – U.S. | 0.90 | % | |||||
| Boeing Co. Aerospace and defense company – U.S. | 0.82 | % | |||||
| JP Morgan Chase & Co. Financial products and services provider – U.S. | 0.73 | % | |||||
| Merck & Company Inc. Global pharmaceutical company – U.S. | 0.66 | % | |||||
| Precision Castparts Corp. Aerospace and defense company – U.S. | 0.63 | % | |||||
5 Largest Detractors from Performance – Holdings
| Contribution | |||||||
| Yahoo!, Inc. Global Internet media company – U.S. | (1.20 | )% | |||||
| Advanced Micro Devices, Inc. Integrated circuits provider – U.S. | (0.75 | )% | |||||
| UnitedHealth Group, Inc. Organized health systems company – U.S. | (0.63 | )% | |||||
| Whole Foods Market Inc. Owner and operator of a chain of natural food supermarkets – U.S. | (0.49 | )% | |||||
| Teva Pharmaceutical Developer, manufacturer and marketer of pharmaceuticals – Israel | (0.29 | )% | |||||
5 Largest Contributors to Performance – Sectors
| Group | Portfolio Contribution | Portfolio Weighting (% of Net Assets) | Russell 1000® Growth Index Weighting | ||||||||||||
| Capital Goods | 2.52 | % | 10.29 | % | 11.14 | % | |||||||||
| Diversified Financials | 1.93 | % | 9.48 | % | 4.48 | % | |||||||||
| Materials | 1.60 | % | 4.73 | % | 2.40 | % | |||||||||
| Retailing | 1.55 | % | 5.45 | % | 6.24 | % | |||||||||
| Pharmaceuticals & Biotechnology | 1.50 | % | 10.36 | % | 10.24 | % | |||||||||
5 Largest Detractors from Performance – Sectors
| Group | Portfolio Contribution | Portfolio Weighting (% of Net Assets) | Russell 1000® Growth Index Weighting | ||||||||||||
| Healthcare Equipment & Services | (1.64 | )% | 8.00 | % | 8.19 | % | |||||||||
| Semiconductors & Semiconductor Equipment | (0.92 | )% | 4.22 | % | 5.15 | % | |||||||||
| Software & Services | (0.58 | )% | 11.09 | % | 10.53 | % | |||||||||
| Food & Staples Retailing | (0.42 | )% | 1.78 | % | 3.44 | % | |||||||||
| Consumer Durables & Apparel | (0.02 | )% | 0.82 | % | 1.42 | % | |||||||||
4 Janus Aspen Series December 31, 2006
(unaudited)
5 Largest Equity Holdings – (% of Net Assets)
As of December 31, 2006
| Boeing Co. Aerospace and Defense | 3.8 | % | |||||
| Procter & Gamble Co. Cosmetics and Toiletries | 3.6 | % | |||||
| JP Morgan Chase & Co. Finance - Investment Bankers/Brokers | 3.3 | % | |||||
| Exxon Mobil Corp. Oil Companies - Integrated | 3.0 | % | |||||
| Roche Holding A.G. Medical - Drugs | 3.0 | % | |||||
| 16.7 | % | ||||||
Asset Allocation – (% of Net Assets)
As of December 31, 2006

Emerging markets comprised 1.6% of total net assets.
Top Country Allocations – (% of Investment Securities)
| As of December 31, 2006 | As of December 31, 2005 | ||||||
 |  | ||||||
Janus Aspen Series December 31, 2006 5
Janus Aspen Large Cap Growth Portfolio (unaudited)
Performance
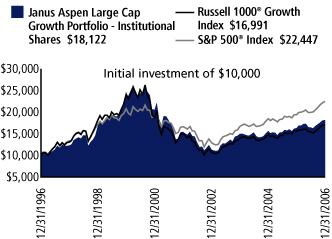
Average Annual Total Return – for the periods ended December 31, 2006
| One Year | Five Year | Ten Year | Since Inception* | ||||||||||||||||
| Janus Aspen Large Cap Growth Portfolio - Institutional Shares | 11.38 | % | 3.28 | % | 6.13 | % | 8.54 | % | |||||||||||
| Janus Aspen Large Cap Growth Portfolio - Service Shares | 11.08 | % | 3.02 | % | 5.85 | % | 8.23 | % | |||||||||||
| Russell 1000® Growth Index | 9.07 | % | 2.69 | % | 5.44 | % | 8.80 | % | |||||||||||
| S&P 500® Index | 15.80 | % | 6.19 | % | 8.42 | % | 10.81 | % | |||||||||||
| Lipper Quartile - Institutional Shares | 1 | st | 2 | nd | 2 | nd | 2 | nd | |||||||||||
| Lipper Ranking - Institutional Shares based on total returns for Variable Annuity Large-Cap Growth Funds | 21/193 | 40/130 | 21/41 | 12/23 | |||||||||||||||
Data presented represents past performance, which is no guarantee of future results. Investment results and principal value will fluctuate so that shares, when redeemed, may be worth more or less than their original cost. Due to market volatility, current performance may be higher or lower than the performance shown. Call 877.33JANUS or visit www.janus.com/info for performance current to the most recent month-end.
See Notes to Schedule of Investments for index definitions.
Total return includes reinvestment of dividends from net investment income and distributions from capital gains. The returns shown do not reflect the deduction of taxes that a shareholder would pay on Portfolio distributions or the redemption of Portfolio shares.
Returns shown for Service Shares for periods prior to December 31, 1999 are derived from the historical performance of Institutional Shares, adjusted to reflect the higher operating expenses of Service Shares.
These returns do not reflect the charges and expenses of any particular insurance product or qualified plan. Returns shown would have been lower had they included insurance charges.
The Portfolio may differ significantly from the securities held in the indices. The indices are not available for direct investment; therefore their performance does not reflect the expenses associated with the active management of an actual Portfolio.
There is no assurance that the investment process will consistently lead to successful investing.
Lipper Inc. - A Reuters Company, is a nationally recognized organization that ranks the performance of mutual funds within a universe of funds that have similar investment objectives. Rankings are historical with capital gains and dividends reinvested.
The Portfolio's performance may be affected by risks that include those associated with nondiversification, non-investment grade debt securities, undervalued or overlooked companies, investments in specific industries or countries and potential conflicts of interest with Janus Smart Portfolios. Additional risks to the Portfolio may include those associated with investing in foreign securities, emerging markets, initial public offerings, derivatives and companies with relatively small market capitalizations. Please see a Janus prospectus or www.janus.com/info for more information about risk, fund holdings and details.
The date of the since-inception Lipper ranking is slightly different from when the Portfolio began operations since Lipper provides fund rankings as of the last day of the month or the first Thursday after fund inception.
Ranking is for the Institutional share class only; other classes may have different performance characteristics.
The Portfolio will invest at least 80% of its net assets in the type of securities described by its name.
Effective February 1, 2006, Blaine Rollins is no longer the manager of Janus Aspen Large Cap Growth Portfolio, and David Corkins is now the Portfolio's manager.
See "Explanations of Charts, Tables and Financial Statements."
*The Portfolio's inception date - September 13, 1993
Portfolio Expenses
The example below shows you the ongoing costs (in dollars) of investing in your Portfolio and allows you to compare these costs with those of other mutual funds. Please refer to page 1 for a detailed explanation of the information presented in these charts.
| Expense Example – Institutional Shares | Beginning Account Value (7/1/06) | Ending Account Value (12/31/06) | Expenses Paid During Period (7/1/06-12/31/06)* | ||||||||||||
| Actual | $ | 1,000.00 | $ | 1,101.70 | $ | 3.55 | |||||||||
| Hypothetical (5% return before expenses) | $ | 1,000.00 | $ | 1,021.83 | $ | 3.41 | |||||||||
| Expense Example – Service Shares | Beginning Account Value (7/1/06) | Ending Account Value (12/31/06) | Expenses Paid During Period (7/1/06-12/31/06)* | ||||||||||||
| Actual | $ | 1,000.00 | $ | 1,100.40 | $ | 4.87 | |||||||||
| Hypothetical (5% return before expenses) | $ | 1,000.00 | $ | 1,020.57 | $ | 4.69 | |||||||||
*Expenses are equal to the annualized expense ratio of 0.67% for Institutional Shares and 0.92% for Service Shares, multiplied by the average account value over the period, multiplied by 184/365 (to reflect the one-half year period).
6 Janus Aspen Series December 31, 2006
Janus Aspen Large Cap Growth Portfolio
Schedule of Investments
As of December 31, 2006
| Shares or Principal Amount | Value | ||||||||||
| Common Stock - 98.4% | |||||||||||
| Aerospace and Defense - 5.4% | |||||||||||
| 583,709 | BAE Systems PLC** | $ | 4,865,861 | ||||||||
| 349,879 | Boeing Co. | 31,083,250 | |||||||||
| 98,535 | Lockheed Martin Corp. | 9,072,117 | |||||||||
| 45,021,228 | |||||||||||
| Agricultural Chemicals - 2.8% | |||||||||||
| 218,830 | Monsanto Co. | 11,495,140 | |||||||||
| 61,922 | Syngenta A.G.* | 11,520,490 | |||||||||
| 23,015,630 | |||||||||||
| Agricultural Operations - 0.6% | |||||||||||
| 152,655 | Archer-Daniels-Midland Co. | 4,878,854 | |||||||||
| Automotive - Cars and Light Trucks - 1.1% | |||||||||||
| 159,920 | BMW A.G.** | 9,204,029 | |||||||||
| Building - Residential and Commercial - 0.3% | |||||||||||
| 4,543 | NVR, Inc.*,# | 2,930,235 | |||||||||
| Building Products - Cement and Aggregate - 0.7% | |||||||||||
| 171,136 | Cemex S.A. de C.V. (ADR)* | 5,798,088 | |||||||||
| Casino Hotels - 1.9% | |||||||||||
| 108,585 | Harrah's Entertainment, Inc. | 8,982,151 | |||||||||
| 82,965 | Station Casinos, Inc. | 6,775,752 | |||||||||
| 15,757,903 | |||||||||||
| Cellular Telecommunications - 0.9% | |||||||||||
| 168,670 | America Movil S.A. de C.V. - Series L (ADR) | 7,627,257 | |||||||||
| Chemicals - Diversified - 0.7% | |||||||||||
| 83,900 | Shin-Etsu Chemical Company, Ltd.** | 5,618,949 | |||||||||
| Commercial Services - Finance - 1.5% | |||||||||||
| 59,965 | Moody's Corp. | 4,141,183 | |||||||||
| 173,806 | Paychex, Inc. | 6,872,289 | |||||||||
| 78,335 | Western Union Co. | 1,756,271 | |||||||||
| 12,769,743 | |||||||||||
| Computers - 2.1% | |||||||||||
| 156,230 | Apple Computer, Inc.*,** | 13,254,553 | |||||||||
| 30,397 | Research In Motion, Ltd. (U.S. Shares)*,** | 3,884,129 | |||||||||
| 17,138,682 | |||||||||||
| Computers - Memory Devices - 2.0% | |||||||||||
| 1,051,445 | EMC Corp.*,# | 13,879,074 | |||||||||
| 69,955 | SanDisk Corp.*,# | 3,010,164 | |||||||||
| 16,889,238 | |||||||||||
| Consumer Products - Miscellaneous - 0.9% | |||||||||||
| 112,175 | Kimberly-Clark Corp. | 7,622,291 | |||||||||
| Containers - Metal and Glass - 0.7% | |||||||||||
| 138,116 | Ball Corp. | 6,021,858 | |||||||||
| Cosmetics and Toiletries - 3.6% | |||||||||||
| 461,776 | Procter & Gamble Co. | 29,678,344 | |||||||||
| Distribution/Wholesale - 0.8% | |||||||||||
| 558,002 | Esprit Holdings, Ltd. | 6,230,471 | |||||||||
| Diversified Operations - 3.0% | |||||||||||
| 655,845 | General Electric Co. | 24,403,992 | |||||||||
| E-Commerce/Services - 1.8% | |||||||||||
| 206,760 | eBay, Inc.* | 6,217,273 | |||||||||
| 226,865 | IAC/InterActiveCorp*,# | 8,430,304 | |||||||||
| 14,647,577 | |||||||||||
| Shares or Principal Amount | Value | ||||||||||
| Electric - Generation - 0.5% | |||||||||||
| 187,602 | AES Corp.* | $ | 4,134,748 | ||||||||
| Electric - Integrated - 1.3% | |||||||||||
| 201,535 | TXU Corp.# | 10,925,212 | |||||||||
| Electric Products - Miscellaneous - 0.5% | |||||||||||
| 96,150 | Emerson Electric Co. | 4,239,254 | |||||||||
| Electronic Components - Semiconductors - 3.1% | |||||||||||
| 554,405 | Advanced Micro Devices, Inc.* | 11,282,142 | |||||||||
| 509,725 | Texas Instruments, Inc. | 14,680,080 | |||||||||
| 25,962,222 | |||||||||||
| Electronic Forms - 0.8% | |||||||||||
| 152,767 | Adobe Systems, Inc.* | 6,281,779 | |||||||||
| Enterprise Software/Services - 1.9% | |||||||||||
| 450,830 | Oracle Corp.* | 7,727,226 | |||||||||
| 157,640 | SAP A.G. (ADR)#,** | 8,370,684 | |||||||||
| 16,097,910 | |||||||||||
| Entertainment Software - 1.4% | |||||||||||
| 231,445 | Electronic Arts, Inc.* | 11,655,570 | |||||||||
| Finance - Credit Card - 1.6% | |||||||||||
| 186,040 | American Express Co. | 11,287,046 | |||||||||
| 53,400 | Credit Saison Company, Ltd.** | 1,839,755 | |||||||||
| 13,126,801 | |||||||||||
| Finance - Investment Bankers/Brokers - 7.1% | |||||||||||
| 572,265 | JP Morgan Chase & Co. | 27,640,399 | |||||||||
| 139,382 | Merrill Lynch & Company, Inc. | 12,976,464 | |||||||||
| 168,092 | UBS A.G. | 10,215,193 | |||||||||
| 130,476 | UBS A.G. (U.S. Shares) | 7,871,617 | |||||||||
| 58,703,673 | |||||||||||
| Finance - Mortgage Loan Banker - 1.6% | |||||||||||
| 216,795 | Fannie Mae | 12,875,455 | |||||||||
| Finance - Other Services - 0.6% | |||||||||||
| 10,245 | Chicago Mercantile Exchange Holdings, Inc. | 5,222,389 | |||||||||
| Food - Retail - 0.8% | |||||||||||
| 142,003 | Whole Foods Market, Inc. | 6,664,201 | |||||||||
| Food - Wholesale/Distribution - 0.6% | |||||||||||
| 145,915 | Sysco Corp. | 5,363,835 | |||||||||
| Independent Power Producer - 2.0% | |||||||||||
| 288,985 | NRG Energy, Inc.*,# | 16,186,050 | |||||||||
| Industrial Automation and Robotics - 0.9% | |||||||||||
| 117,565 | Rockwell Automation, Inc. | 7,180,870 | |||||||||
| Insurance Brokers - 0.8% | |||||||||||
| 218,390 | Marsh & McLennan Companies, Inc.# | 6,695,837 | |||||||||
| Internet Infrastructure Software - 0.6% | |||||||||||
| 88,425 | Akamai Technologies, Inc.*,**,# | 4,697,136 | |||||||||
| Investment Management and Advisory Services - 0.8% | |||||||||||
| 68,725 | Legg Mason, Inc. | 6,532,311 | |||||||||
| Medical - Biomedical and Genetic - 1.5% | |||||||||||
| 149,036 | Celgene Corp.*,** | 8,574,041 | |||||||||
| 49,335 | Genentech, Inc.* | 4,002,549 | |||||||||
| 12,576,590 | |||||||||||
| Medical - Drugs - 4.4% | |||||||||||
| 270,200 | Merck & Company, Inc. | 11,780,720 | |||||||||
| 136,207 | Roche Holding A.G. | 24,424,480 | |||||||||
| 36,205,200 | |||||||||||
See Notes to Schedules of Investments and Financial Statements.
Janus Aspen Series December 31, 2006 7
Janus Aspen Large Cap Growth Portfolio
Schedule of Investments
As of December 31, 2006
| Shares or Principal Amount | Value | ||||||||||
| Medical - HMO - 1.8% | |||||||||||
| 296,420 | Coventry Health Care, Inc.* | $ | 14,835,821 | ||||||||
| Medical - Wholesale Drug Distributors - 1.0% | |||||||||||
| 128,725 | Cardinal Health, Inc. | 8,293,752 | |||||||||
| Medical Instruments - 0.4% | |||||||||||
| 35,155 | Intuitive Surgical, Inc.* | 3,371,365 | |||||||||
| Medical Products - 0.5% | |||||||||||
| 81,666 | Varian Medical Systems, Inc.* | 3,884,852 | |||||||||
| Metal Processors and Fabricators - 1.8% | |||||||||||
| 185,845 | Precision Castparts Corp.# | 14,547,947 | |||||||||
| Networking Products - 0.6% | |||||||||||
| 179,267 | Cisco Systems, Inc.* | 4,899,367 | |||||||||
| Oil and Gas Drilling - 0.6% | |||||||||||
| 174,715 | Nabors Industries, Ltd.*,# | 5,203,013 | |||||||||
| Oil Companies - Exploration and Production - 1.0% | |||||||||||
| 66,399 | Apache Corp. | 4,416,197 | |||||||||
| 90,890 | EnCana Corp. (U.S. Shares) | 4,176,396 | |||||||||
| 8,592,593 | |||||||||||
| Oil Companies - Integrated - 3.8% | |||||||||||
| 324,004 | Exxon Mobil Corp.** | 24,828,426 | |||||||||
| 91,860 | Hess Corp. | 4,553,500 | |||||||||
| 29,125 | Suncor Energy, Inc. (U.S. Shares) | 2,298,254 | |||||||||
| 31,680,180 | |||||||||||
| Oil Refining and Marketing - 0.6% | |||||||||||
| 92,070 | Valero Energy Corp. | 4,710,301 | |||||||||
| Pharmacy Services - 1.3% | |||||||||||
| 188,786 | Caremark Rx, Inc. | 10,781,568 | |||||||||
| Reinsurance - 1.0% | |||||||||||
| 2,176 | Berkshire Hathaway, Inc. - Class B*,# | 7,977,216 | |||||||||
| Retail - Apparel and Shoe - 2.6% | |||||||||||
| 161,634 | Industria de Diseno Textil S.A.** | 8,707,390 | |||||||||
| 253,125 | Nordstrom, Inc.# | 12,489,188 | |||||||||
| 21,196,578 | |||||||||||
| Retail - Building Products - 0.6% | |||||||||||
| 172,928 | Lowe's Companies, Inc. | 5,386,707 | |||||||||
| Retail - Consumer Electronics - 0.3% | |||||||||||
| 46,055 | Best Buy Company, Inc. | 2,265,445 | |||||||||
| Retail - Drug Store - 0.4% | |||||||||||
| 116,915 | CVS Corp. | 3,613,843 | |||||||||
| Retail - Office Supplies - 1.4% | |||||||||||
| 428,148 | Staples, Inc. | 11,431,552 | |||||||||
| Savings/Loan/Thrifts - 0.8% | |||||||||||
| 223,980 | Hudson City Bancorp, Inc. | 3,108,842 | |||||||||
| 225,875 | NewAlliance Bancshares, Inc.# | 3,704,350 | |||||||||
| 6,813,192 | |||||||||||
| Semiconductor Components/Integrated Circuits - 0.4% | |||||||||||
| 161,690 | Marvell Technology Group, Ltd.* | 3,102,831 | |||||||||
| Soap and Cleaning Preparations - 1.2% | |||||||||||
| 224,051 | Reckitt Benckiser PLC** | 10,238,972 | |||||||||
| Telecommunication Services - 0.7% | |||||||||||
| 166,785 | NeuStar, Inc. - Class A* | 5,410,505 | |||||||||
| Telephone - Integrated - 0.7% | |||||||||||
| 988,050 | Level 3 Communications, Inc.*,**,# | 5,533,080 | |||||||||
| Shares or Principal Amount | Value | ||||||||||
| Therapeutics - 1.6% | |||||||||||
| 133,835 | Amylin Pharmaceuticals, Inc.* | $ | 4,827,428 | ||||||||
| 127,213 | Gilead Sciences, Inc.* | 8,259,941 | |||||||||
| 13,087,369 | |||||||||||
| Tobacco - 0.5% | |||||||||||
| 52,095 | Altria Group, Inc. | 4,470,793 | |||||||||
| Transportation - Railroad - 1.3% | |||||||||||
| 144,440 | Canadian National Railway Co. (U.S. Shares) | 6,215,254 | |||||||||
| 44,915 | Union Pacific Corp. | 4,133,078 | |||||||||
| 10,348,332 | |||||||||||
| Transportation - Services - 1.9% | |||||||||||
| 194,645 | C.H. Robinson Worldwide, Inc. | 7,959,034 | |||||||||
| 107,642 | United Parcel Service, Inc. - Class B | 8,070,997 | |||||||||
| 16,030,031 | |||||||||||
| Web Portals/Internet Service Providers - 3.3% | |||||||||||
| 23,300 | Google, Inc. - Class A*,** | 10,729,184 | |||||||||
| 651,424 | Yahoo!, Inc.* | 16,637,369 | |||||||||
| 27,366,553 | |||||||||||
| Wireless Equipment - 2.7% | |||||||||||
| 181,230 | Crown Castle International Corp.* | 5,853,729 | |||||||||
| 309,902 | Nokia Oyj (ADR)** | 6,297,209 | |||||||||
| 269,880 | QUALCOMM, Inc. | 10,198,765 | |||||||||
| 22,349,703 | |||||||||||
| Total Common Stock (cost $646,322,970) | 814,004,873 | ||||||||||
| Equity-Linked Structured Notes - 0.4% | |||||||||||
| Finance - Investment Bankers/Brokers - 0.4% | |||||||||||
| Morgan Stanley Co: | |||||||||||
| 35,530 | convertible, (Celgene Corp.), 0% (144A)§ | 2,004,958 | |||||||||
| 35,530 | convertible, (Celgene Corp.), 0% (144A)§ | 2,004,958 | |||||||||
| Total Equity-Linked Structured Notes (cost $3,349,768) | 4,009,916 | ||||||||||
| U.S. Treasury Notes - 0.7% | |||||||||||
| U.S. Treasury Notes: | |||||||||||
| $ | 2,567,000 | 3.125%, due 1/31/07** | 2,563,290 | ||||||||
| 901,000 | 6.25%, due 2/15/07** | 902,232 | |||||||||
| 2,530,000 | 3.375%, due 2/28/07** | 2,523,478 | |||||||||
| Total U.S. Treasury Notes (cost $5,989,153) | 5,989,000 | ||||||||||
| Money Markets - 0.2% | |||||||||||
| 1,440,000 | Janus Money Market Fund, 5.24% (cost $1,440,000) | 1,440,000 | |||||||||
| Other Securities - 6.0% | |||||||||||
| 48,941,717 | State Street Navigator Securities Lending Prime Portfolio† (cost $48,941,717) | 48,941,717 | |||||||||
| Total Investments (total cost $706,043,608) – 105.7% | 874,385,506 | ||||||||||
| Liabilities, net of Cash, Receivables and Other Assets – (5.7)% | (47,378,954 | ) | |||||||||
| Net Assets – 100.0% | $ | 827,006,552 | |||||||||
See Notes to Schedules of Investments and Financial Statements.
8 Janus Aspen Series December 31, 2006
Schedule of Investments
As of December 31, 2006
Summary of Investments by Country
| Country | Value | % of Investment Securities | |||||||||
| Bermuda | $ | 14,536,315 | 1.7 | % | |||||||
| Canada | 16,574,033 | 1.9 | % | ||||||||
| Finland | 6,297,209 | 0.7 | % | ||||||||
| Germany | 17,574,713 | 2.0 | % | ||||||||
| Japan | 7,458,704 | 0.9 | % | ||||||||
| Mexico | 13,425,345 | 1.5 | % | ||||||||
| Spain | 8,707,390 | 1.0 | % | ||||||||
| Switzerland | 54,031,780 | 6.2 | % | ||||||||
| United Kingdom | 15,104,833 | 1.7 | % | ||||||||
| United States†† | 720,675,184 | 82.4 | % | ||||||||
| Total | $ | 874,385,506 | 100.0 | % | |||||||
††Includes Short-Term Securities and Other Securities (76.7% excluding Short-Term Securities and Other Securities)
Forward Currency Contracts, Open
| Currency Sold and Settlement Date | Currency Units Sold | Currency Value in $ U.S. | Unrealized Gain/(Loss) | ||||||||||||
| British Pound 3/15/07 | 1,515,000 | $ | 2,966,721 | $ | (138,655 | ) | |||||||||
| Euro 1/11/07 | 5,050,000 | 6,670,351 | (231,601 | ) | |||||||||||
| Euro 4/18/07 | 900,000 | 1,193,545 | (20,728 | ) | |||||||||||
| Japanese Yen 4/18/07 | 230,000,000 | 1,961,023 | 105,603 | ||||||||||||
| Total | $ | 12,791,640 | $ | (285,381 | ) | ||||||||||
| Schedule of Written Options - Calls | Value | ||||||
| Akamai Technologies, Inc. expires January 2007 169 contracts exercise price $55.00 | $ | (19,435 | ) | ||||
| Akamai Technologies, Inc. expires January 2007 95 contracts exercise price $60.00 | (1,900 | ) | |||||
| Akamai Technologies, Inc. expires January 2007 96 contracts exercise price $65.00 | (480 | ) | |||||
| Akamai Technologies, Inc. expires February 2007 96 contracts exercise price $65.00 | (3,840 | ) | |||||
| Apple Computer, Inc. expires January 2007 156 contracts exercise price $110.00 | (1,560 | ) | |||||
| Apple Computer, Inc. expires January 2007 156 contracts exercise price $115.00 | (1,092 | ) | |||||
| Apple Computer, Inc. expires January 2007 156 contracts exercise price $120.00 | (156 | ) | |||||
| Apple Computer, Inc. expires April 2007 156 contracts exercise price $120.00 | (12,480 | ) | |||||
| Value | |||||||
| Celgene Corp. expires January 2007 19 contracts exercise price $65.00 | $ | (285 | ) | ||||
| Exxon Mobil Corp. expires January 2007 343 contracts exercise price $85.00 | (1,715 | ) | |||||
| Google, Inc. expires January 2007 23 contracts exercise price $570.00 | (115 | ) | |||||
| Level 3 Communications, Inc. expires January 2007 816 contracts exercise price $6.50 | (2,140 | ) | |||||
| Research In Motion Limited expires January 2007 29 contracts exercise price $160.00 | (232 | ) | |||||
| Research In Motion Limited expires January 2007 29 contracts exercise price $165.00 | (145 | ) | |||||
| Total Written Options - Calls | |||||||
| 2,339 Contracts (Premiums received $134,199) | $(45,575) | ||||||
| Schedule of Written Options - Puts | |||||||
| Best Buy Company, Inc. expires January 2007 542 contracts exercise price $45.00 | $ | (10,840 | ) | ||||
| Best Buy Company, Inc. expires February 2007 405 contracts exercise price $42.50 | (10,125 | ) | |||||
| Nabors Industries, Ltd. expires February 2007 300 contracts exercise price $27.50 | (15,000 | ) | |||||
| TXU Corp. expires February 2007 144 contracts exercise price $47.50 | (3,600 | ) | |||||
| Total Written Options - Puts | |||||||
| 1,391 Contracts (Premiums received $57,032) | $(39,565) | ||||||
See Notes to Schedules of Investments and Financial Statements.
Janus Aspen Series December 31, 2006 9
Statement of Assets and Liabilities
| As of December 31, 2006 (all numbers in thousands except net asset value per share) | Janus Aspen Large Cap Growth Portfolio | ||||||
| Assets: | |||||||
| Investments at cost(1) | $ | 706,044 | |||||
| Investments at value(1) | $ | 874,386 | |||||
| Cash | 186 | ||||||
| Receivables: | |||||||
| Investments sold | 2,715 | ||||||
| Portfolio shares sold | 61 | ||||||
| Dividends | 710 | ||||||
| Interest | 90 | ||||||
| Other assets | 21 | ||||||
| Forward currency contracts | 106 | ||||||
| Total Assets | 878,275 | ||||||
| Liabilities: | |||||||
| Payables: | |||||||
| Options Written, at value (premiums received of $191) | 85 | ||||||
| Collateral for securities loaned (Note 1) | 48,942 | ||||||
| Investments purchased | 680 | ||||||
| Portfolio shares repurchased | 610 | ||||||
| Advisory fees | 454 | ||||||
| Transfer agent fees and expenses | 1 | ||||||
| Distribution fees – Service Shares | 32 | ||||||
| Non-interested Trustees' fees and expenses | 7 | ||||||
| Accrued expenses | 66 | ||||||
| Forward currency contracts | 391 | ||||||
| Total Liabilities | 51,268 | ||||||
| Net Assets | $ | 827,007 | |||||
| Net Assets Consist of: | |||||||
| Capital (par value and paid-in-surplus)* | $ | 1,823,676 | |||||
| Undistributed net investment income/(loss)* | 377 | ||||||
| Undistributed net realized gain/(loss) from investments and foreign currency transactions* | (1,165,209 | ) | |||||
| Unrealized net appreciation/(depreciation) of investments and foreign currency translations | 168,163 | ||||||
| Total Net Assets | $ | 827,007 | |||||
| Net Assets – Institutional Shares | $ | 677,289 | |||||
| Shares Outstanding, $0.001 Par Value (unlimited shares authorized) | 29,291 | ||||||
| Net Asset Value Per Share | $ | 23.12 | |||||
| Net Assets – Service Shares | $ | 149,718 | |||||
| Shares Outstanding, $0.001 Par Value (unlimited shares authorized) | 6,555 | ||||||
| Net Asset Value Per Share | $ | 22.84 | |||||
* See Note 3 in Notes to Financial Statements.
(1) Investments at cost and value include $47,833,196 of securities loaned for Janus Aspen Large Cap Growth Portfolio (Note 1).
See Notes to Financial Statements.
10 Janus Aspen Series December 31, 2006
Statement of Operations
| For the fiscal year ended December 31, 2006 (all numbers in thousands) | Janus Aspen Large Cap Growth Portfolio | ||||||
| Investment Income: | |||||||
| Interest | $ | 227 | |||||
| Securities lending income | 99 | ||||||
| Dividends | 9,661 | ||||||
| Dividends from affiliates | 191 | ||||||
| Foreign tax withheld | (242 | ) | |||||
| Total Investment Income | 9,936 | ||||||
| Expenses: | |||||||
| Advisory fees | 5,389 | ||||||
| Transfer agent expenses | 5 | ||||||
| Registration fees | 30 | ||||||
| Custodian fees | 52 | ||||||
| Professional fees | 28 | ||||||
| Non-interested Trustees' fees and expenses | 32 | ||||||
| Distribution fees – Service Shares | 372 | ||||||
| Other expenses | 260 | ||||||
| Non-recurring costs (Note 2) | – | ||||||
| Costs assumed by Janus Capital Management LLC (Note 2) | – | ||||||
| Total Expenses | 6,168 | ||||||
| Expense and Fee Offset | (8 | ) | |||||
| Net Expenses | 6,160 | ||||||
| Net Investment Income/(Loss) | 3,776 | ||||||
| Net Realized and Unrealized Gain/(Loss) on Investments: | |||||||
| Net realized gain/(loss) from securities transactions | 86,906 | ||||||
| Net realized gain/(loss) from foreign currency transactions | (385 | ) | |||||
| Net realized gain/(loss) from options | 118 | ||||||
| Change in unrealized net appreciation/(depreciation) of investments and foreign currency translations | (471 | ) | |||||
| Net Gain/(Loss) on Investments | 86,168 | ||||||
| Net Increase/(Decrease) in Net Assets Resulting from Operations | $ | 89,944 | |||||
See Notes to Financial Statements.
Janus Aspen Series December 31, 2006 11
Statements of Changes in Net Assets
| For the fiscal year ended December 31 | Janus Aspen Large Cap Growth Portfolio | ||||||||||
| (all numbers in thousands) | 2006 | 2005 | |||||||||
| Operations: | |||||||||||
| Net investment income/(loss) | $ | 3,776 | $ | 2,724 | |||||||
| Net realized gain/(loss) from investment and foreign currency transactions | 86,521 | 106,912 | |||||||||
| Net realized gain/loss from options | 118 | – | |||||||||
| Change in unrealized net appreciation/(depreciation) of investments and foreign currency translations | (471 | ) | (95,439 | ) | |||||||
| Net Increase/(Decrease) in Net Assets Resulting from Operations | 89,944 | 14,197 | |||||||||
| Dividends and Distributions to Shareholders: | |||||||||||
| Net investment income* | |||||||||||
| Institutional Shares | (3,301 | ) | (2,520 | ) | |||||||
| Service Shares | (412 | ) | (204 | ) | |||||||
| Net realized gain from investment transactions* | |||||||||||
| Institutional Shares | – | – | |||||||||
| Service Shares | – | – | |||||||||
| Net Decrease from Dividends and Distributions | (3,713 | ) | (2,724 | ) | |||||||
| Capital Share Transactions: | |||||||||||
| Shares sold | |||||||||||
| Institutional Shares | 24,118 | 27,071 | |||||||||
| Service Shares | 10,859 | 7,591 | |||||||||
| Reinvested dividends and distributions | |||||||||||
| Institutional Shares | 3,301 | 2,520 | |||||||||
| Service Shares | 412 | 204 | |||||||||
| Shares repurchased(1) | |||||||||||
| Institutional Shares | (151,386 | ) | (482,533 | ) | |||||||
| Service Shares | (33,943 | ) | (39,084 | ) | |||||||
| Net Increase/(Decrease) from Capital Share Transactions | (146,639 | ) | (484,231 | ) | |||||||
| Net Increase/(Decrease) in Net Assets | (60,408 | ) | (472,758 | ) | |||||||
| Net Assets: | |||||||||||
| Beginning of period | 887,415 | 1,360,173 | |||||||||
| End of period | $ | 827,007 | $ | 887,415 | |||||||
| Undistributed net investment income/(loss)* | $ | 377 | $ | 306 | |||||||
* See Note 3 in Notes to Financial Statements.
(1) During the fiscal year ended December 31, 2005, Janus Aspen Large Cap Growth Portfolio disbursed to a redeeming shareholder portfolio securities and cash valued at $267,997,880, on the date of redemption.
See Notes to Financial Statements.
12 Janus Aspen Series December 31, 2006
Financial Highlights
Institutional Shares
| For a share outstanding during each fiscal year ended December 31 | |||||||||||||||||||||||
| Janus Aspen Large Cap Growth Portfolio | |||||||||||||||||||||||
| 2006 | 2005 | 2004 | 2003 | 2002 | |||||||||||||||||||
| Net Asset Value, Beginning of Period | $ | 20.86 | $ | 20.08 | $ | 19.23 | $ | 14.61 | $ | 19.89 | |||||||||||||
| Income from Investment Operations: | |||||||||||||||||||||||
| Net investment income/(loss) | .12 | .09 | .04 | .02 | .01 | ||||||||||||||||||
| Net gain/(loss) on securities (both realized and unrealized) | 2.25 | .76 | .84 | 4.62 | (5.29 | ) | |||||||||||||||||
| Total from Investment Operations | 2.37 | .85 | .88 | 4.64 | (5.28 | ) | |||||||||||||||||
| Less Distributions: | |||||||||||||||||||||||
| Dividends (from net investment income)* | (.11 | ) | (.07 | ) | (.03 | ) | (.02 | ) | – | ||||||||||||||
| Distributions (from capital gains)* | – | – | – | – | – | ||||||||||||||||||
| Total Distributions | (.11 | ) | (.07 | ) | (.03 | ) | (.02 | ) | – | ||||||||||||||
| Net Asset Value, End of Period | $ | 23.12 | $ | 20.86 | $ | 20.08 | $ | 19.23 | $ | 14.61 | |||||||||||||
| Total Return | 11.38 | % | 4.23 | % | 4.57 | % | 31.73 | % | (26.51 | )% | |||||||||||||
| Net Assets, End of Period (in thousands) | $ | 677,289 | $ | 730,374 | $ | 1,177,145 | $ | 1,666,317 | $ | 1,484,889 | |||||||||||||
| Average Net Assets for the Period (in thousands) | $ | 693,731 | $ | 857,660 | $ | 1,462,102 | $ | 1,533,995 | $ | 1,967,021 | |||||||||||||
| Ratio of Gross Expenses to Average Net Assets(1)(2) | 0.69 | % | 0.66 | % | 0.67 | % | 0.67 | % | 0.67 | % | |||||||||||||
| Ratio of Net Expenses to Average Net Assets(2) | 0.69 | % | 0.66 | % | 0.66 | % | 0.67 | % | 0.67 | % | |||||||||||||
| Ratio of Net Investment Income/(Loss) to Average Net Assets | 0.49 | % | 0.31 | % | 0.14 | % | 0.12 | % | (0.08 | )% | |||||||||||||
| Portfolio Turnover Rate | 54 | % | 87 | % | 33 | % | 24 | % | 36 | % | |||||||||||||
Service Shares
| For a share outstanding during each fiscal year ended December 31 | |||||||||||||||||||||||
| Janus Aspen Large Cap Growth Portfolio | |||||||||||||||||||||||
| 2006 | 2005 | 2004 | 2003 | 2002 | |||||||||||||||||||
| Net Asset Value, Beginning of Period | $ | 20.62 | $ | 19.85 | $ | 19.04 | $ | 14.48 | $ | 19.76 | |||||||||||||
| Income from Investment Operations: | |||||||||||||||||||||||
| Net investment income/(loss) | .02 | (.02 | ) | (.04 | ) | (.03 | ) | (.04 | ) | ||||||||||||||
| Net gain/(loss) on securities (both realized and unrealized) | 2.26 | .82 | .85 | 4.59 | (5.24 | ) | |||||||||||||||||
| Total from Investment Operations | 2.28 | .80 | .81 | 4.56 | (5.28 | ) | |||||||||||||||||
| Less Distributions: | |||||||||||||||||||||||
| Dividends (from net investment income)* | (.06 | ) | (.03 | ) | – | – | – | ||||||||||||||||
| Distributions (from capital gains)* | – | – | – | – | – | ||||||||||||||||||
| Total Distributions | (.06 | ) | (.03 | ) | – | – | – | ||||||||||||||||
| Net Asset Value, End of Period | $ | 22.84 | $ | 20.62 | $ | 19.85 | $ | 19.04 | $ | 14.48 | |||||||||||||
| Total Return | 11.08 | % | 4.01 | % | 4.25 | % | 31.49 | % | (26.72 | )% | |||||||||||||
| Net Assets, End of Period (in thousands) | $ | 149,718 | $ | 157,041 | $ | 183,028 | $ | 211,100 | $ | 177,327 | |||||||||||||
| Average Net Assets for the Period (in thousands) | $ | 148,875 | $ | 163,753 | $ | 191,544 | $ | 188,994 | $ | 219,594 | |||||||||||||
| Ratio of Gross Expenses to Average Net Assets(1)(2) | 0.94 | % | 0.91 | % | 0.92 | % | 0.92 | % | 0.92 | % | |||||||||||||
| Ratio of Net Expenses to Average Net Assets(2) | 0.94 | % | 0.91 | % | 0.91 | % | 0.92 | % | 0.92 | % | |||||||||||||
| Ratio of Net Investment Income/(Loss) to Average Net Assets | 0.24 | % | 0.06 | % | (0.11 | )% | (0.13 | )% | (0.33 | )% | |||||||||||||
| Portfolio Turnover Rate | 54 | % | 87 | % | 33 | % | 24 | % | 36 | % | |||||||||||||
* See Note 3 in Notes to Financial Statements.
(1) The effect of non-recurring costs assumed by Janus Capital (Note 2) is included in the ratio of gross expenses to average net assets and was less than 0.01%.
(2) See "Explanation of Charts, Tables, and Financial Statements."
See Notes to Financial Statements.
Janus Aspen Series December 31, 2006 13
Notes to Schedule of Investments
| Lipper Variable Annuity Large-Cap Growth Funds | Funds that, by portfolio practice, invest at least 75% of their equity assets in companies with market capitalizations (on a three-year weighted basis) greater than 300% of the dollar-weighted median market capitalization of the middle 1,000 securities of the S&P SuperComposite 1500® Index. Large-cap growth funds typically have an above-average price-to-earnings ratio, price-to-book ratio, and three-year sales-per-share growth value, compared to the S&P 500® Index. | ||||||
| Russell 1000® Growth Index | Contains those securities in the Russell 1000® Index with a greater-than-average growth orientation. Companies in the index tend to exhibit higher price-to-book and price-earnings ratios, lower dividend yields and higher forecasted growth values. | ||||||
| S&P 500® Index | The Standard & Poor's Composite Index of 500 stocks, a widely recognized, unmanaged index of common stock prices. | ||||||
| ADR | American Depositary Receipt | ||||||
| PLC | Public Limited Company | ||||||
| U.S. Shares | Securities of foreign companies trading on an American Stock Exchange. | ||||||
| 144 | A | Securities sold under Rule 144A of the Securities Act of 1933 are subject to legal and/or contractual restrictions on resale and may not be publicly sold without registration under the 1933 Act. | |||||
* Non-income-producing security.
** A portion of this security has been segregated by the custodian to cover margin or segregation requirements on open futures contracts, forward currency contracts, options contracts, short sales and/or securities with extended settlement dates.
# Loaned security; a portion or all of the security is on loan at December 31, 2006.
† The security is purchased with the cash collateral received from securities on loan (Note 1).
§ Schedule of Restricted and Illiquid Securities (as of December 31, 2006)
| Acquisition Date | Acquisition Cost | Value | Value as % of Net Assets | ||||||||||||||||
| Janus Aspen Large Cap Growth Portfolio | |||||||||||||||||||
| Morgan Stanley Co. convertible, (Celgene Corp.), 0% (144A) | 7/24/06 | $ | 1,674,884 | $ | 2,004,958 | 0.2 | % | ||||||||||||
| Morgan Stanley Co. convertible, (Celgene Corp.), 0% (144A) | 7/24/06 | 1,674,884 | 2,004,958 | 0.2 | % | ||||||||||||||
| $ | 3,349,768 | $ | 4,009,916 | 0.4 | % | ||||||||||||||
| The Portfolio has registration rights for certain restricted securities held as of December 31, 2006. The issuer incurs all registration costs. | |||||||||||||||||||
Aggregate collateral segregated to cover margin or segregation requirements on open futures contracts, forward currency contracts, options contracts, short sales and/or securities with extended settlement dates as of December 31, 2006 are noted below.
| Portfolio | Aggregate Value | ||||||
| Janus Aspen Large Cap Growth Portfolio | $ | 73,419,862 | |||||
14 Janus Aspen Series December 31, 2006
Notes to Financial Statements
The following section describes the organization and significant accounting policies and provides more detailed information about the schedules and tables that appear throughout this report. In addition, the Notes to Financial Statements explain the methods used in preparing and presenting this report.
1. ORGANIZATION AND SIGNIFICANT ACCOUNTING POLICIES
Janus Aspen Large Cap Growth Portfolio (the "Portfolio") is a series fund. The Portfolio is part of Janus Aspen Series (the "Trust"), which is organized as a Delaware statutory trust and is registered under the Investment Company Act of 1940 (the "1940 Act") as an open-end management investment company. The Trust offers seventeen Portfolios, which include multiple series of shares, with differing investment objectives and policies. The Portfolio invests primarily in equity securities. The Portfolio is classified as diversified, as defined in the 1940 Act. The Portfolio is a no-load investment.
The Portfolio currently offers two classes of shares: Institutional Shares and Service Shares. Institutional Shares are offered only in connection with investment in and payments under variable insurance contracts and to qualified retirement plans. Service Shares are offered only in connection with investment in and payments under variable insurance contracts and to qualified retirement plans that require a fee from Portfolio assets to procure distribution and administrative services to contract owners and plan participants.
The following accounting policies have been consistently followed by the Portfolio and are in conformity with accounting principles generally accepted in the United States of America in the investment company industry.
Investment Valuation
Securities are valued at the last sales price or the official closing price for securities traded on a principal securities exchange (U.S. or foreign) and on the NASDAQ National Market. Securities traded on over-the-counter markets and listed securities for which no sales are reported are valued at the latest bid price (or yield equivalent thereof) obtained from one or more dealers transacting in a market for such securities or by a pricing service approved by the Portfolio's Trustees. Short-term securities with maturities of 60 days or less may be valued at amortized cost, which approximates market value. Debt securities with a remaining maturity of greater than 60 days are valued in accordance with the evaluated bid price supplied by the pricing service. The evaluated bid price supplied by the pricing service is an evaluation that reflects such factors as security prices, yields, maturities and ratings. Foreign securities and currencies ar e converted to U.S. dollars using the applicable exchange rate in effect as of the daily close of the New York Stock Exchange ("NYSE"). When market quotations are not readily available or deemed unreliable, or events or circumstances that may affect the value of portfolio securities held by the Portfolio are identified between the closing of their principal markets and the time the net asset value ("NAV") is determined, securities may be valued at fair value as determined in good faith under procedures established by and under the supervision of the Portfolio's Trustees. The Portfolio may use a systematic fair valuation model provided by an independent third party to value international equity securities in order to adjust for stale pricing, which may occur between the close of certain foreign exchanges and the NYSE.
Investment Transactions and Investment Income
Investment transactions are accounted for as of the date purchased or sold (trade date). Dividend income is recorded on the ex-dividend date. Certain dividends from foreign securities will be recorded as soon as the Trust is informed of the dividend if such information is obtained subsequent to the ex-dividend date and may be subject to withholding taxes in these jurisdictions. Interest income is recorded on the accrual basis and includes amortization of premiums and accretion of discounts. Gains and losses are determined on the identified cost basis, which is the same basis used for federal income tax purposes. Income, as well as gains and losses, both realized and unrealized, are allocated daily to each class of shares based upon the ratio of net assets represented by each class as a percentage of total net assets.
Expenses
The Portfolio bears expenses incurred specifically on its behalf as well as a portion of general expenses. Each class of shares bears expenses incurred specifically on its behalf and, in addition, each class bears a portion of general expenses, which may be based upon relative net assets of each class. Expenses are allocated daily to each class of shares based upon the ratio of net assets represented by each class as a percentage of total net assets. Expenses directly attributable to a specific class of shares are charged against the operations of such class.
Securities Lending
Under procedures adopted by the Trustees, the Portfolio may lend securities to qualified parties (typically brokers or other financial institutions) who need to borrow securities in order to complete certain transactions such as covering short sales, avoiding failures to deliver securities or completing arbitrage activities. The Portfolio may seek to earn additional income through securities lending. There is the risk of delay in recovering a loaned security or the risk of loss in collateral rights if the borrower fails financially. In addition, Janus Capital Management LLC ("Janus Capital") makes efforts to balance the benefits and risks from granting such loans.
The Portfolio does not have the right to vote on securities while they are being lent; however, the Portfolio may attempt to call back the loan and vote the proxy. All loans will be continuously secured by collateral which may consist of cash,
Janus Aspen Series December 31, 2006 15
Notes to Financial Statements (continued)
U.S. Government securities, domestic and foreign short-term debt instruments, letters of credit, money market mutual funds or other money market accounts, or such other collateral permitted by the Securities and Exchange Commission ("SEC"). Cash collateral may be invested in affiliated money market funds or other accounts advised by Janus Capital to the extent consistent with exemptive relief obtained from the SEC or as permitted by the 1940 Act and rules promulgated thereunder. Cash collateral may also be invested in unaffiliated money market funds or other accounts advised by Janus Capital to the extent consistent with exemptive relief obtained from the SEC or as permitted by the 1940 Act and rules promulgated thereunder. Cash collateral may also be invested in unaffiliated money market funds or other accounts.
State Street Bank and Trust Company (the "Lending Agent") may also invest the cash collateral in the State Street Navigator Securities Lending Prime Portfolio or investments in unaffiliated money market funds or accounts, mutually agreed to by the Portfolio and the Lending Agent, that comply with Rule 2a-7 under the 1940 Act relating to money market funds.
As of December 31, 2006, the Portfolio had on loan securities valued as indicated:
| Portfolio | Value at December 31, 2006 | ||||||
| Janus Aspen Large Cap Growth Portfolio | $ | 47,833,196 | |||||
As of December 31, 2006, the Portfolio received cash collateral for securities lending activity as indicated:
| Portfolio | Cash Collateral at December 31, 2006 | ||||||
| Janus Aspen Large Cap Growth Portfolio | $ | 48,941,717 | |||||
As of December 31, 2006, all cash collateral received by the Portfolio was invested in the State Street Navigator Securities Lending Prime Portfolio.
The value of the collateral must be at least 102% of the market value of the loaned securities that are denominated in U.S. dollars and 105% of the market value of the loaned securities that are not denominated in U.S. dollars. Loaned securities and related collateral are marked-to-market each business day based upon the market value of the respective securities at the close of business, employing the most recent available pricing information. Collateral levels are then adjusted based upon this mark-to-market evaluation.
The borrower pays fees at the Portfolio's direction to its Lending Agent. The Lending Agent may retain a portion of the interest earned. The cash collateral invested by the Lending Agent is disclosed in the Schedule of Investments. The lending fees and the Portfolio's portion of the interest income earned on cash collateral are included on the Statement of Operations (if applicable).
Interfund Lending
Pursuant to an exemptive order received from the SEC, the Portfolio may be party to an interfund lending agreement between the Portfolio and other Janus Capital sponsored mutual funds, which permits it to borrow or lend cash at a rate beneficial to both the borrowing and lending funds. Outstanding borrowings from all sources totaling 10% or more of the borrowing Portfolio's total assets must be collateralized at 102% of the outstanding principal value of the loan; loans of less than 10% may be unsecured. During the fiscal year ended December 31, 2006, there were no outstanding interfund borrowing or lending arrangements for the Portfolio.
Forward Currency Transactions
The Portfolio may enter into forward currency contracts in order to reduce its exposure to changes in foreign currency exchange rates on its foreign portfolio holdings and to lock in the U.S. dollar cost of firm purchase and sale commitments for securities denominated in or exposed to foreign currencies. A forward currency exchange contract is a commitment to purchase or sell a foreign currency at a future date at a negotiated rate. The gain or loss arising from the difference between the U.S. dollar cost of the original contract and the value of the foreign currency in U.S. dollars upon closing a contract is included in "Net realized gain/(loss) from foreign currency transactions" on the Statement of Operations (if applicable).
Forward currency contracts held by the Portfolio are fully collateralized by other securities, which are denoted in the accompanying Schedule of Investments (if applicable). The collateral is evaluated daily to ensure its market value equals or exceeds the current market value of the corresponding forward currency contracts.
Futures Contracts
The Portfolio may enter into futures contracts. The Portfolio intends to use such derivative instruments primarily to hedge or protect from adverse movements in securities prices, currency rates or interest rates. The use of futures contracts may involve risks such as the possibility of illiquid markets or imperfect correlation between the value of the contracts and the underlying securities, or that the counterparty will fail to perform its obligations.
Futures contracts are marked-to-market daily, and the daily variation margin is recorded as a receivable or payable on the Statement of Assets and Liabilities (if applicable). When a contract is closed, a realized gain or loss is recorded on the Statement of Operations equal to the difference between the opening and closing value of the contract. Generally, futures contracts are marked-to-market (i.e., treated as realized and subject to distribution) for federal income tax purposes at fiscal year end. Securities designated as collateral for market
16 Janus Aspen Series December 31, 2006
value on futures contracts are noted in the Schedule of Investments. Such collateral is in the possession of the Portfolio's custodian. As of December 31, 2006, the Portfolio was not invested in futures contracts.
Options Contracts
The Portfolio may purchase or write put and call options on futures contracts or foreign currencies in a manner similar to that in which futures or forward contracts on foreign currencies will be utilized, and on portfolio securities for hedging purposes or as a substitute for an investment. The Portfolio generally invests in options to hedge against adverse movements in the value of portfolio holdings.
When an option is written, the Portfolio receives a premium and becomes obligated to sell or purchase the underlying security at a fixed price, upon exercise of the option. In writing an option, the Portfolio bears the market risk of an unfavorable change in the price of the security underlying the written option. Exercise of an option written by the Portfolio could result in the Portfolio buying or selling a security at a price different from the current market value.
When an option is exercised, the proceeds on sales for a written call option, the purchase cost for a written put option, or the cost of the security for a purchased put or call option is adjusted by the amount of premium received or paid.
Holdings designated to cover outstanding written options are noted in the Schedule of Investments (if applicable). Options written are reported as a liability on the Statement of Assets and Liabilities (if applicable). Realized gains and losses are reported on the Statement of Operations (if applicable). The Portfolio recognized realized gains of $118,327 for written options during the fiscal year ended December 31, 2006.
The risk in writing a call option is that the Portfolio gives up the opportunity for profit if the market price of the security increases and the option is exercised. The risk in writing a put option is that the Portfolio may incur a loss if the market price of the security decreases and the option is exercised. The risk in buying an option is that the Portfolio pays a premium whether or not the option is exercised. The use of such instruments may involve certain additional risks as a result of unanticipated movement in the market. A lack of correlation between the value of an instrument underlying an option and the asset being hedged, or unexpected adverse price movements, could render the Portfolio's hedging strategy unsuccessful. In addition, there can be no assurance that a liquid secondary market will exist for any option purchased or sold. There is no limit to the loss that the Portfolio may recognize due to written call options.
Written option activity for the fiscal year ended December 31, 2006 was as follows:
| Call Options | Number of Options Contracts | Premiums Received | |||||||||
| Janus Aspen Large Cap Growth Portfolio | |||||||||||
| Options Outstanding at January 1, 2006 | – | – | |||||||||
| Options Written | 4,824 | $ | 255,903 | ||||||||
| Options Closed | (36 | ) | (1,041 | ) | |||||||
| Options Expired | (2,401 | ) | (118,327 | ) | |||||||
| Options Exercised | (48 | ) | (2,336 | ) | |||||||
| Options outstanding at December 31, 2006 | 2,339 | $ | 134,199 | ||||||||
| Put Options | Number of Options Contracts | Premiums Received | |||||||||
| Janus Aspen Large Cap Growth Portfolio | |||||||||||
| Options Outstanding at January 1, 2006 | – | – | |||||||||
| Options Written | 1,391 | $ | 57,032 | ||||||||
| Options Closed | – | – | |||||||||
| Options Expired | – | – | |||||||||
| Options Exercised | – | – | |||||||||
| Options outstanding at December 31, 2006 | 1,391 | $ | 57,032 | ||||||||
Short Sales
The Portfolio may engage in "short sales against the box." Short sales against the box involve selling either a security that the Portfolio owns, or a security equivalent in kind and amount to the security sold short that the Portfolio has the right to obtain, for delivery at a specified date in the future. The Portfolio may enter into a short sale against the box to hedge against anticipated declines in the market price of portfolio securities. If the value of the securities sold short increases prior to the scheduled delivery date, the Portfolio loses the opportunity to participate in the gain.
The Portfolio may also engage in "naked" short sales. Naked short sales involve the Portfolio selling a security it does not own to a purchaser at a specified price. To complete the transaction, the Portfolio must borrow the security to deliver it to the purchaser and buy that same security in the market to return it to the lender. Although the potential for gain is limited to the difference between the price at which the Portfolio sold the security short and the cost of borrowing the security, its potential for loss could be unlimited because there is no limit to the replacement cost of the borrowed security. There is no assurance that the Portfolio will be able to close out a short position at any particular time or at an acceptable price. A gain or a loss will be recognized upon termination of a short sale. There is no limit on the size of any loss that the Portfolio may recognize upon termination of a short sale. Short sales held by the Portfolio are fully collateralized by other securities, which are denoted in the accompanying Schedule of Investments (if applicable). As of December 31, 2006, the Portfolio was not invested in short sales.
Janus Aspen Series December 31, 2006 17
Notes to Financial Statements (continued)
Foreign Currency Translations
The Portfolio does not isolate that portion of the results of operations resulting from changes in foreign exchange rates on investments from the fluctuations arising from changes in market prices of securities held at the date of the financial statements. Net unrealized appreciation or depreciation on investments and foreign currency translation arise from changes in the value of assets and liabilities, including investments in securities held at the date of the financial statements, resulting from changes in the exchange rates and changes in market prices of securities held.
Currency gains and losses are also calculated on payables and receivables that are denominated in foreign currencies. The payables and receivables are generally related to security transactions and income.
Foreign currency-denominated assets and forward currency contracts may involve more risks than domestic transactions, including currency risk, political and economic risk, regulatory risk and market risk. Risks may arise from the potential inability of a counterparty to meet the terms of a contract and from unanticipated movements in the value of foreign currencies relative to the U.S. dollar.
When-issued Securities
The Portfolio may purchase or sell securities on a when-issued or forward commitment basis. The price of the underlying securities and date when the securities will be delivered and paid for are fixed at the time the transaction is negotiated. Losses may arise due to changes in the market value of the securities or from the inability of counterparties to meet the terms of the contract. In connection with such purchases, the Portfolio may hold liquid assets as collateral with the Portfolio's custodian sufficient to cover the purchase price. As of December 31, 2006, the Portfolio was not invested in when-issued securities.
Equity-Linked Structured Notes
The Portfolio may invest in equity-linked structured notes. Equity-linked structured notes are derivative securities which are specially designed to combine the characteristics of one or more underlying securities and their equity derivatives in a single note form. The return and/or yield or income component may be based on the performance of the underlying equity securities, an equity index, and/or option positions. Equity-linked structured notes are typically offered in limited transactions by financial institutions in either registered or nonregistered form. An investment in equity-linked structured notes creates exposure to the credit risk of the issuing financial institution, as well as to the market risk of the underlying securities. There is no guaranteed return of principal with these securities and the appreciation potential of these securities may be limited by a maximum payment or call right. In certain cases, equity-linked struct ured notes may be more volatile and less liquid than less complex securities or other types of fixed-income securities. Such securities may exhibit price behavior that does not correlate with other fixed-income securities.
Initial Public Offerings
The Portfolio may invest in initial public offerings ("IPOs"). IPOs and other investment techniques may have a magnified performance impact on a fund with a small asset base. The Portfolio may not experience similar performance as its assets grow.
Additional Investment Risk
The Portfolio may be invested in lower-rated debt securities that have a higher risk of default or loss of value since these securities may be sensitive to economic changes, political changes or adverse developments specific to the issuer.
Restricted Security Transactions
Restricted securities held by the Portfolio may not be sold except in exempt transactions or in a public offering registered under the Securities Act of 1933. The risk of investing in such securities is generally greater than the risk of investing in the securities of widely held, publicly traded companies. Lack of a secondary market and resale restrictions may result in the inability of the Portfolio to sell a security at a fair price and may substantially delay the sale of the security. In addition, these securities may exhibit greater price volatility than securities for which secondary markets exist.
Dividend Distributions
The Portfolio generally makes semiannual distributions of substantially all of its investment income and an annual distribution of its net realized capital gains (if any). The majority of dividends and net realized capital gains distributions from the Portfolio may be automatically reinvested into additional shares of the Portfolio, based upon the discretion of the shareholder.
Estimates
The preparation of financial statements in conformity with accounting principles generally accepted in the United States of America requires management to make estimates and assumptions that affect the reported amount of assets and liabilities and disclosure of contingent assets and liabilities at the date of the financial statements and the reported amounts of income and expenses during the reporting period. Actual results could differ from those estimates.
Federal Income Taxes
No provision for income taxes is included in the accompanying financial statements, as the Portfolio intends to distribute to shareholders all taxable investment income and realized gains and otherwise comply with Subchapter M of the Internal Revenue Code applicable to regulated investment companies.
New Accounting Pronouncements
In July 2006, the Financial Accounting Standards Board ("FASB") issued Interpretation No. 48, "Accounting for Uncertainty in Income Taxes – an Interpretation of FASB Statement No. 109" (the "Interpretation"). The Interpretation establishes for all entities, including pass-through entities such as the Portfolio, a minimum threshold for financial statement recognition of the benefit of positions taken in filing tax returns (including whether an entity is taxable in a particular jurisdiction), and requires certain expanded tax disclosures. A
18 Janus Aspen Series December 31, 2006
calendar year open-end or closed-end fund would implement the Interpretation no later than June 29, 2007 (the last business day of the semi-annual reporting period) and will also apply to all open tax years as of the date of effectiveness. Management has recently begun to evaluate the application of the Interpretation to the Portfolio, and is not in a position at this time to estimate the significance of its impact, if any, on the Portfolio's financial statements.
In September 2006, the FASB issued Statement of Financial Accounting Standards No. 157, "Fair Value Measurements" ("SFAS No. 157"), which defines fair value, establishes a framework for measuring fair value in generally accepted accounting principles, and expands disclosures about fair value measurements. SFAS No. 157 does not require new fair value measurements, but is applied to the extent that other accounting pronouncements require or permit fair value measurements. SFAS No. 157 emphasizes that fair value is a market-based measurement that should be determined based on the assumptions that market participants would use in pricing an asset or liability. Companies will be required to disclose the extent to which fair value is used to measure assets and liabilities, the inputs used to develop the measurements, and the effect for fiscal years beginning after November 15, 2007. Management is currently evaluating the potential impact the adopt ion of SFAS No. 157 will have on the Portfolio's financial condition and results of operations.
2. INVESTMENT ADVISORY AGREEMENTS AND OTHER TRANSACTIONS WITH AFFILIATES
The Portfolio pays a monthly advisory fee to Janus Capital based upon average daily net assets and calculated at the annual rate of 0.64%.
Janus Services LLC ("Janus Services"), a wholly-owned subsidiary of Janus Capital, is the Portfolio's transfer agent. Janus Services receives certain out-of-pocket expenses for transfer agent services.
Certain officers of the Portfolio may also be officers and/or directors of Janus Capital. Such officers receive no compensation from the Portfolio, except for the Portfolio's Chief Compliance Officer. Effective January 1, 2006, the Portfolio began reimbursing the adviser for a portion of the compensation paid to the Chief Compliance Officer of the Trust. Total compensation of $1,385 was paid by the Portfolio during the fiscal year ended December 31, 2006. The Portfolio's portion is reported as part of "Other Expenses" on the Statement of Operations.
The Board of Trustees has adopted a deferred compensation plan (the "Deferred Plan") for independent Trustees to elect to defer receipt of all or a portion of the annual compensation they are entitled to receive from the Portfolio. All deferred fees are credited to an account established in the name of the Trustees. The amounts credited to the account then increase or decrease, as the case may be, in accordance with the performance of one or more of the Janus funds that are selected by the Trustees. The account balance continues to fluctuate in accordance with the performance of the selected fund or funds until final payment of all amounts credited to the account. Trustees are allowed to change their designation of mutual funds from time to time. Amounts will be deferred until distributed in accordance to the Deferred Plan. No deferred fees were paid to any Trustee under the Deferred Plan during the fiscal year ended December 31, 2006.
For the fiscal year ended December 31, 2006, Janus Capital assumed $21,288 of legal, consulting and Trustee costs and fees incurred by the funds in Janus Investment Fund, Janus Aspen Series and Janus Adviser Series (the "Funds") in connection with the regulatory and civil litigation matters discussed in Note 6. These non-recurring costs were allocated to all Funds based upon the Funds' respective net assets as of July 31, 2004. Additionally, all future non-recurring costs will be allocated based upon the Funds' respective net assets on July 31, 2004. These non-recurring costs and costs assumed by Janus Capital are shown on the Statement of Operations.
Janus Distributors LLC, a wholly-owned subsidiary of Janus Capital, is a distributor of the Portfolio. Service Shares have adopted a Distribution and Shareholder Servicing Plan (the "Plan") pursuant to Rule 12b-1 under the 1940 Act. The Plan authorizes payments by the Portfolio in connection with the distribution of Service Shares at an annual rate of up to 0.25% of Service Shares' average daily net assets.
The Portfolio's expenses may be reduced by expense offsets from an unaffiliated custodian and/or transfer agent. Such credits or offsets are included in Expense and Fee Offset on the Statement of Operations. The transfer agent fee offsets received during the period reduce Transfer Agent Fees and Expenses. Custodian offsets received reduce Custodian Fees. The Portfolio could have employed the assets used by the custodian and/or transfer agent to produce income if it had not entered into an expense offset arrangement.
The Portfolio may invest in money market funds, including funds managed by Janus Capital. During the fiscal year ended December 31, 2006, the Portfolio recorded distributions from affiliated investment companies as affiliated dividend income, and had the following affiliated purchases and sales:
| Purchases Shares/Cost | Sales Shares/Cost | Dividend Income | Value at 12/31/06 | ||||||||||||||||
| Janus Aspen Large Cap Growth Portfolio | |||||||||||||||||||
| Janus Government Money Market Fund | $ | 2,644,048 | $ | 2,644,048 | $ | 1,778 | $ | – | |||||||||||
| Janus Institutional Cash Reserves Fund | 30,475,120 | 30,475,120 | 66,797 | – | |||||||||||||||
| Janus Money Market Fund | 33,684,462 | 32,244,462 | 122,180 | 1,440,000 | |||||||||||||||
| $ | 66,803,630 | $ | 65,363,630 | $ | 190,755 | $ | 1,440,000 | ||||||||||||
Janus Aspen Series December 31, 2006 19
Notes to Financial Statements (continued)
3. FEDERAL INCOME TAX
The tax components of capital shown in the table below represent: (1) distribution requirements the Portfolio must satisfy under the income tax regulations; (2) losses or deductions the Portfolio may be able to offset against income and gains realized in future years; and (3) unrealized appreciation or depreciation of investments for federal income tax purposes.
Other book to tax differences in the current year primarily consist of foreign currency contract adjustments. The Portfolio has elected to treat gains and losses on forward foreign currency contracts as capital gains and losses. Other foreign currency gains and losses on debt instruments are treated as ordinary income for federal income tax purposes pursuant to Section 988 of the Internal Revenue Code.
Accumulated capital losses noted below represent net capital loss carryovers, as of December 31, 2006, that may be available to offset future realized capital gains and thereby reduce future taxable gain distributions.
| Portfolio | Undistributed Ordinary Income | Undistributed Long–Term Gains | Accumulated Capital Losses | Post-October Deferral | Other Book to Tax Differences | Net Tax Appreciation/ (Depreciation) | |||||||||||||||||||||
| Janus Aspen Large Cap Growth Portfolio(1) | $ | 378,907 | $ | – | $ | (1,164,320,697 | ) | $ | – | $ | 105,490 | $ | 167,167,380 | ||||||||||||||
(1) Capital loss carryover is subject to annual limitations.
The table below shows the expiration dates of the carryovers.
Capital Loss Carryover Expiration Schedule
For the year ended December 31, 2006
| Portfolio | December 31, 2008 | December 31, 2009 | December 31, 2010 | December 31, 2011 | |||||||||||||||
| Janus Aspen Large Cap Growth Portfolio(1) | $ | (343,953 | ) | $ | (660,733,851 | ) | $ | (374,579,329 | ) | $ | (128,663,564 | ) | |||||||
(1) Capital loss carryover is subject to annual limitations.
During the year ended December 31, 2006, the following capital loss carryover was utilized by the Portfolio as indicated in the table below.
| Portfolio | Capital Loss Carryover Utilized | ||||||
| Janus Aspen Large Cap Growth Portfolio | $ | 85,571,416 | |||||
The aggregate cost of investments and the composition of unrealized appreciation and depreciation of investment securities for federal income tax purposes as of December 31, 2006 are noted below.
Unrealized appreciation and unrealized depreciation in the table below exclude appreciation/depreciation on foreign currency translations. The primary difference between book and tax appreciation or depreciation of investments is wash sale loss deferrals.
| Portfolio | Federal Tax Cost | Unrealized Appreciation | Unrealized (Depreciation) | ||||||||||||
| Janus Aspen Large Cap Growth Portfolio | $ | 707,218,126 | $ | 187,856,150 | $ | (20,688,770 | ) | ||||||||
Income and capital gains distributions are determined in accordance with income tax regulations that may differ from accounting principles generally accepted in the United States of America. These differences are due to differing treatments for items such as net short-term gains, deferral of wash sale losses, foreign currency transactions, net investment losses and capital loss carryovers. Certain permanent differences such as tax returns of capital and net investment losses noted on the next page have been reclassified to paid-in capital.
20 Janus Aspen Series December 31, 2006
| For the fiscal year ended December 31, 2006 | Distributions | ||||||||||||||||||
| Portfolio | From Ordinary Income | From Long-Term Capital Gains | Tax Return of Capital | Net Investment Loss | |||||||||||||||
| Janus Aspen Large Cap Growth Portfolio | $ | 3,712,528 | $ | – | $ | – | $ | – | |||||||||||
| For the fiscal year ended December 31, 2005 | Distributions | ||||||||||||||||||
| Portfolio | From Ordinary Income | From Long-Term Capital Gains | Tax Return of Capital | Net Investment Loss | |||||||||||||||
| Janus Aspen Large Cap Growth Portfolio | $ | 2,723,575 | $ | – | $ | – | $ | – | |||||||||||
4. CAPITAL SHARE TRANSACTIONS
| For the fiscal year ended December 31 | Janus Aspen Large Cap Growth Portfolio | ||||||||||
| (all numbers in thousands) | 2006 | 2005 | |||||||||
| Transactions in Portfolio Shares – Institutional Shares | |||||||||||
| Shares sold | 1,106 | 1,361 | |||||||||
| Reinvested dividends and distributions | 150 | 125 | |||||||||
| Shares repurchased | (6,979 | ) | (25,104 | ) | |||||||
| Net Increase (Decrease) in Portfolio Shares | (5,723 | ) | (23,618 | ) | |||||||
| Shares Outstanding, Beginning of Period | 35,014 | 58,632 | |||||||||
| Shares Outstanding, End of Period | 29,291 | 35,014 | |||||||||
| Transactions in Portfolio Shares – Service Shares | |||||||||||
| Shares sold | 502 | 384 | |||||||||
| Reinvested dividends and distributions | 19 | 10 | |||||||||
| Shares repurchased | (1,584 | ) | (1,997 | ) | |||||||
| Net Increase (Decrease) in Portfolio Shares | (1,063 | ) | (1,603 | ) | |||||||
| Shares Outstanding, Beginning of Period | 7,618 | 9,221 | |||||||||
| Shares Outstanding, End of Period | 6,555 | 7,618 | |||||||||
5. PURCHASES AND SALES OF INVESTMENT SECURITIES
For the fiscal year ended December 31, 2006, the aggregate cost of purchases and proceeds from sales of investment securities (excluding short-term securities) were as follows:
| Portfolio | Purchases of Securities | Proceeds from Sales of Securities | Purchases of Long-Term U.S. Government Obligations | Proceeds from Sales of Long-Term U.S. Government Obligations | |||||||||||||||
| Janus Aspen Large Cap Growth Portfolio | $ | 447,350,453 | $ | 566,287,376 | $ | 5,987,187 | $ | – | |||||||||||
6. PENDING LEGAL MATTERS
In the fall of 2003, the Securities and Exchange Commission ("SEC"), the Office of the New York State Attorney General ("NYAG"), the Colorado Attorney General ("COAG"), and the Colorado Division of Securities ("CDS") announced that they were investigating alleged frequent trading practices in the mutual fund industry. On August 18, 2004, Janus Capital announced that it had reached final settlements with the SEC, the NYAG, the COAG, and the CDS related to such regulators' investigations into Janus Capital's frequent trading arrangements.
A number of civil lawsuits were brought against Janus Capital and certain of its affiliates, the Janus funds, and related entities and individuals based on allegations similar to those announced by the above regulators and were filed in several
Janus Aspen Series December 31, 2006 21
Notes to Financial Statements (continued)
state and federal jurisdictions. Such lawsuits alleged a variety of theories for recovery including, but not limited to, the federal securities laws, other federal statutes (including ERISA), and various common law doctrines. The Judicial Panel on Multidistrict Litigation transferred these actions to the U.S. District Court for the District of Maryland (the "Court") for coordinated proceedings. On September 29, 2004, five consolidated amended complaints were filed with the Court that generally include: (i) claims by a putative class of investors in certain Janus funds asserting claims on behalf of the investor class (Marini, et al. v. Janus Investment Fund, et al., U.S. District Court, District of Maryland, Case No. 04-CV-00497); (ii) derivative claims by investors in certain Jan us funds ostensibly on behalf of such funds (Steinberg et al. v. Janus Capital Management, LLC et al., U.S. District Court, District of Maryland, Case No. 04-CV-00518); (iii) claims on behalf of participants in the Janus 401(k) plan (Wangberger v. Janus Capital Group Inc., 401(k) Advisory Committee, et al., U.S. District Court, District of Maryland, Case No. JFM-05-2711); (iv) claims brought on behalf of shareholders of Janus Capital Group Inc. ("JCGI") on a derivative basis against the Board of Directors of JCGI (Chasen v. Whiston, et al., U.S. District Court, District of Maryland, Case No . 04-MD-00855); and (v) claims by a putative class of shareholders of JCGI asserting claims on behalf of the shareholders (Wiggins, et al. v. Janus Capital Group, Inc., et al., U.S. District Court, District of Maryland, Case No. 04-CV-00818). In addition, the following were also named as defendants in one or more of the actions: Janus Investment Fund ("JIF"), Janus Aspen Series ("JAS"), Janus Adviser Series ("JAD"), Janus Distributors LLC, Enhanced Investment Technologies, LLC ("INTECH"), Bay Isle Financial LLC ("Bay Isle"), Perkins, Wolf, McDonnell and Company, LLC ("Perkins"), the Advisory Committee of the Janus 401(k) plan, and the current or former directors of JCGI.
On August 25, 2005, the Court entered orders dismissing most of the claims asserted against Janus Capital and its affiliates by fund investors (actions (i) and (ii) described above), except certain claims under Section 10(b) of the Securities Exchange Act of 1934 and under Section 36(b) of the Investment Company Act of 1940, as amended (the "1940 Act"). On August 15, 2006, the complaint in the 401(k) plan class action (action (iii) described above) was dismissed by the district court with prejudice; the plaintiff has appealed that dismissal decision to the United States Court of Appeals for the Fourth Circuit. The Court also dismissed the action against JCGI's Board of Directors without leave to amend (action (iv) described above). Finally, a Motion to Dismiss the action brought by JCGI shareholders (action (v) described above) is fully briefed and pending before the Court.
In addition to the lawsuits described above, the Auditor of the State of West Virginia ("Auditor"), in his capacity as securities commissioner, has initiated administrative proceedings against many of the defendants in the market timing cases (including JCGI and Janus Capital) and, as a part of its relief, is seeking disgorgement and other monetary relief based on similar market timing allegations (In the Matter of Janus Capital Group Inc. et al., Before the Securities Commissioner, State of West Virginia, Summary Order No. 05-1320). The respondents in these proceedings collectively sought a Writ of Prohibition in state court, which was denied. Their subsequent Petition for Appeal was also denied. Consequentl y, in September 2006, JCGI and Janus Capital filed their answer to the Auditor's summary order instituting proceedings and requested a hearing. JCGI and Janus Capital, as well as other similarly situated defendants, continue to challenge the statutory authority of the Auditor to bring such an action. No further proceedings are currently scheduled.
In addition to the "market timing" actions described above, Janus Capital is a defendant in a consolidated lawsuit in the U.S. District Court for the District of Colorado challenging the investment advisory fees charged by Janus Capital to certain Janus funds (Walter Sins, et al. v. Janus Capital Management LLC, U.S. District Court, District of Colorado, Case No. 04-CV-01647-WDM-MEH; Michael Fleisher, et al. v. Janus Capital Management, LLC, 04-CV-02395-MSK-CBS). The action was filed in 2004 by fund investors asserting breach of fiduciary duty under Section 36(b) of the 1940 Act. The plaintiffs seek declaratory and injunctive relief and an unspecified amount of damages. The trial is scheduled to commence on May 21, 2007.
In 2001, Janus Capital's predecessor was also named as a defendant in a class action suit in the U.S. District Court for the Southern District of New York, alleging that certain underwriting firms and institutional investors violated antitrust laws in connection with initial public offerings (Pfeiffer v. Credit Suisse First Boston aka In re Initial Public Offering Antitrust Litigation, U.S. District Court, Southern District of New York, Case No. 01-CV-2014). The U.S. District Court dismissed the plaintiff's antitrust claims in November 2003; however, the U.S. Court of Appeals vacated that decision and remanded it for further proceedings. In March 2006, the defendants, including Janus Capital, filed a Petition for a Writ of Certiorari with the U.S. Supreme Court to review the decision of the U. S. Court of Appeals. In June 2006, the U.S. Supreme Court invited the U.S. Solicitor General to file a brief expressing the view of the United States, and in November 2006, the Solicitor General filed a brief expressing its view on the matter. The U.S. Supreme Court has granted the Petition for a Writ of Certiorari and the parties are in the process of briefing the matter for the U.S. Supreme Court.
Additional lawsuits may be filed against certain of the Janus funds, Janus Capital, and related parties in the future. Janus Capital does not currently believe that these pending actions will materially affect its ability to continue providing services it has agreed to provide to the Janus funds.
22 Janus Aspen Series December 31, 2006
Report of Independent Registered Public Accounting Firm
To the Trustees and Shareholders
of Janus Aspen Large Cap Growth Portfolio
In our opinion, the accompanying statement of assets and liabilities, including the schedule of investments, and the related statements of operations and of changes in net assets and the financial highlights present fairly, in all material respects, the financial position of Janus Aspen Large Cap Growth Portfolio (one of the portfolios constituting Janus Aspen Series, hereafter referred to as the "Portfolio") at December 31, 2006, the results of its operations for the year then ended, the changes in its net assets for each of the two years in the period then ended, and the financial highlights for each of the five years in the period then ended, in conformity with accounting principles generally accepted in the United States of America. These financial statements and financial highlights (hereafter referred to as "financial statements") are the responsibility of the Portfolio's management; our responsibility is to express an opinion on these financial statements based on our audits. We conducted our audits of these financial statements in accordance with the standards of the Public Company Accounting Oversight Board (United States). Those standards require that we plan and perform the audit to obtain reasonable assurance about whether the financial statements are free of material misstatement. An audit includes examining, on a test basis, evidence supporting the amounts and disclosures in the financial statements, assessing the accounting principles used and significant estimates made by management, and evaluating the overall financial statement presentation. We believe that our audits, which included confirmation of securities at December 31, 2006 by correspondence with the custodian, transfer agent and brokers, and the application of alternative auditing procedures where securities purchased had not been received, provide a reasonable basis for our opinion.

PricewaterhouseCoopers LLP
Denver, Colorado
February 12, 2007
Janus Aspen Series December 31, 2006 23
Additional Information (unaudited)
PROXY VOTING POLICIES AND VOTING RECORD
A description of the policies and procedures that the Portfolio uses to determine how to vote proxies relating to its portfolio securities is available: (i) without charge, upon request, by calling 1-800-525-0020 (toll free); (ii) on the Portfolio's website at www.janus.com/proxyvoting; and (iii) on the SEC's website at http://www.sec.gov. Additionally, information regarding the Portfolio's proxy voting record for the most recent twelve- month period ended June 30 is also available, free of charge, through www.janus.com/proxyvoting and from the SEC's website at http://www.sec.gov.
QUARTERLY PORTFOLIO HOLDINGS
The Portfolio files its complete portfolio holdings (schedule of investments) with the SEC for the first and third quarters of each fiscal year on Form N-Q within 60 days of the end of such fiscal quarter. The Portfolio's Form N-Q: (i) is available on the SEC's website at http://www.sec.gov; (ii) may be reviewed and copied at the SEC's Public Reference Room in Washington, D.C. (information on the Public Reference Room may be obtained by calling 1-800-SEC-0330); and (iii) is available without charge, upon request, by calling Janus at 1-800-525-0020 (toll free).
APPROVAL OF ADVISORY AGREEMENTS DURING THE PERIOD
The Trustees of Janus Aspen Series, more than eighty-five percent of whom have never been affiliated with the Adviser ("Independent Trustees"), oversee the management of each of the Portfolios and, as required by law, determine annually whether to continue the investment advisory agreement for each Portfolio and the subadvisory agreements for the three Portfolios that utilize subadvisers.
In connection with their most recent consideration of those agreements for each of the Portfolios, the Trustees received and reviewed a substantial amount of information provided by Janus Capital (the "Adviser") and the respective subadvisers in response to requests of the Independent Trustees and their independent legal counsel. They also received and reviewed a considerable amount of information and analysis provided to the Trustees by their independent fee consultant. Throughout their consideration of the agreements the Independent Trustees were advised by their independent legal counsel. The Independent Trustees met on two separate occasions with management to consider the agreements, and at each of those meetings they also met separately in executive session with their independent legal counsel.
At a meeting held on December 20, 2006, based on their evaluation of the information provided by the Adviser, the subadvisers and the independent fee consultant and other information, the Trustees determined that the overall arrangements between each Portfolio and the Adviser were fair and reasonable in light of the nature, extent and quality of the services provided by the Adviser, its affiliates and the subadvisers, the fees charged for those services, and other matters that the Trustees considered relevant in the exercise of their business judgment. At that meeting all of the Trustees unanimously approved the continuation of the investment advisory agreement for each Portfolio, and the subadvisory agreement for each subadvised Portfolio, for the period from February 1, 2007 through February 1, 2008, subject to earlier termination as provided in each agreement.
In considering the continuation of those agreements, the Trustees reviewed and analyzed various factors that they determined were relevant, including the factors described below, none of which by itself was considered dispositive. However, the material factors and conclusions that formed basis for the Trustees' determination to approve the continuation of the agreements are discussed separately below.
Nature, Extent and Quality of Services
The Trustees reviewed the nature, extent and quality of the services of Janus Capital and the subadvisers to the Funds, taking into account the investment objective and strategy of each Portfolio and the knowledge the Trustees gained from their regular meetings with management on at least a quarterly basis and their ongoing review of information related to the Funds. In addition, the Trustees reviewed the resources and key personnel of Janus Capital and each subadviser, especially those who provide investment management services to the Portfolios. The Trustees also considered other services provided to the Portfolios by Janus Capital or the subadvisers, such as managing the execution of portfolio transactions and the selection of broker-dealers for those transactions, serving as the Portfolios' administrator, monitoring adherence to the Portfolios' investment restrictions, producing shareholder reports, providing support services for the Tru stees and Trustee committees, communicating with shareholders and overseeing the activities of other service providers, including monitoring compliance with various policies and procedures of the Portfolios and with applicable securities laws and regulations.
The Trustees concluded that: the nature, extent and quality of the services provided by Janus Capital or the subadviser to each Portfolio were appropriate and consistent with the terms of the respective advisory and subadvisory agreements; that, taking into account steps taken to address a small portion of the Portfolios whose performance lagged that of their peers for certain periods, the quality of those services had been consistent with or superior to quality norms in the industry; and that the Portfolios were likely to benefit from the continued provision of those services. They also concluded that each of Janus Capital and each subadviser had sufficient personnel, with the appropriate education and experience, to
24 Janus Aspen Series December 31, 2006
serve the Portfolios effectively and had demonstrated its continuing ability to attract and retain well-qualified personnel.
Performance of the Funds
The Trustees considered the performance results of each Portfolio over various time periods. They reviewed information comparing each Portfolio's performance with the performance of comparable funds and peer groups identified by Lipper Inc., an independent provider of investment company data, and with the Portfolio's benchmark. They concluded that the performance of most Portfolios was good to very good. Although the performance of some Portfolios lagged that of their peers for certain periods, the Trustees also concluded that Janus Capital had taken appropriate steps to address those instances of under-performance and that the more recent performance of most of those Portfolios had been improving.
Costs of Services Provided
The Trustees examined information on the fees and expenses of each Portfolio in comparison to similar information for other comparable funds as provided by Lipper. They also reviewed an analysis of that information provided by their independent fee consultant and noted that the rate of management (investment advisory and administrative) fees for most of the Portfolios, after contractual expense limitations, was below the mean management fee rate of the respective peer group of funds selected by Lipper.
The Trustees considered the methodology used by Janus Capital and each subadviser in determining compensation payable to portfolio managers, the competitive environment for investment management talent and the competitive market for mutual funds in different distribution channels. They concluded that the compensation methodology provided a good alignment of the interests of the portfolio managers with the interests of Portfolio shareholders.
The Trustees also reviewed management fees charged by Janus Capital to its separate account clients and to its subadvised funds (for which Janus Capital provides only portfolio management services). Although in most instances subadvisory and separate account fee rates for various investment strategies were lower than management fees for Portfolios having a similar strategy, the Trustees noted that Janus Capital performs significant additional services for the Portfolios that it does not provide to those other clients, including administrative services, oversight of the Portfolios' other service providers, trustee support, regulatory compliance and numerous other services, and that, in serving the Portfolios, Janus Capital assumes many legal risks that it does not assume in servicing its other clients. Moreover, they noted that the spread between the average fees charged to the Portfolios and the fees that Janus Capital charged to its separate account clients was significantly smaller than the average spread for such fees of other advisers, based on publicly available data and research conducted by their independent fee consultant.
In considering the fees charged by Janus Capital, the Trustees had previously negotiated with Janus Capital a temporary contingent waiver of a portion the investment advisory fee paid by Janus Aspen Worldwide Growth Portfolio to Janus Capital to provide for a possible reduction in the rate of advisory fee payable by the Portfolio for the period July 1, 2006 through January 31, 2007 if the investment performance of the Fund should lag that of its benchmark performance over the applicable performance measurement period. Commencing in February 2007, the previously approved performance-based fee schedule will become operative.
The Trustees reviewed information on the profitability of Janus Capital and its affiliates of their relationships with each Portfolio, as well as an explanation of the methodology utilized in allocating various expenses among the Portfolios and other clients. The Trustees also reviewed the financial statements of Janus Capital's parent company and its corporate structure. In their review, the Trustees considered whether Janus Capital and each subadviser receive adequate incentives to manage the Portfolios effectively. The Trustees recognized that profitability comparisons among fund managers are difficult because very little comparative information is publicly available and profitability of any manager is affected by numerous factors, including the organizational structure of the particular manager, the types of funds and other accounts it manages, possible other lines of business, the methodology for allocating expenses and the manager's ca pital structure and cost of capital. However, based on the information available and taking those factors into account, the Trustees concluded that Janus Capital's profitability with respect to each Portfolio in relation to the services rendered was not unreasonable.
The Trustees concluded that the management fees and other compensation payable by each Fund to Janus Capital and its affiliates, as well as the fees paid by Janus Capital to the subadvisers of subadvised Portfolios, were reasonable in relation to the nature and quality of the services provided, taking into account the fees charged by other advisers for managing comparable mutual funds with similar strategies and the fees Janus Capital and the subadviser charges to other clients. The Trustees also concluded that the overall expense ratio of each Portfolio was reasonable, taking into account the size of the Portfolio, the quality of services provided by Janus Capital and any subadviser, the investment performance of the Portfolio and any expense limitations agreed to by Janus Capital.
Janus Aspen Series December 31, 2006 25
Additional Information (unaudited) (continued)
Economies of Scale
The Trustees considered information about the potential for Janus Capital to realize economies of scale as the assets of the Portfolios increase. They noted that, although most Portfolios pay advisory fees at a fixed rate as a percentage of net assets, without any breakpoints, the management fee paid by each Portfolio, after any contractual expense limitations, was below the mean management fee rate of the Portfolio's peer group selected by Lipper; and, for those Portfolios whose expenses are being reduced by the contractual expense limitations of Janus Capital, Janus Capital is subsidizing the Portfolios because they have not reached adequate scale. Moreover, as the assets of many of the Portfolios have declined in the past few years, the Portfolios have benefited from having advisory fee rates that have remained constant rather than increasing as assets decline. In addition, performance fee structures have been implemented for several Port folios that will cause the effective rate of advisory fees payable by such a Portfolio to vary depending on the investment performance of the Portfolio relative to its benchmark; and a few Portfolios have fee schedules with breakpoints and reduced fee rates above certain asset levels. The Trustees also noted that the Portfolios share directly in economies of scale through lower charges of third-party service providers based on the combined scale of all of the Portfolios. Based on all of the information they reviewed, the Trustees concluded that the current fee structure of each Portfolio was reasonable and that the current rates of fees do reflect a sharing between Janus Capital and the Portfolio of economies of scale at the current asset level of the Portfolio.
Other Benefits to Janus Capital
The Trustees also considered benefits that accrue to Janus Capital and its affiliates from their relationships with the Portfolios. They recognized that two affiliates of Janus Capital separately serve the Portfolios as transfer agent and distributor, respectively, and that the transfer agent receives compensation from the non-money market Portfolios for services provided. The Trustees also considered Janus Capital's use of commissions paid by Portfolios on their portfolio brokerage transactions to obtain proprietary research products and services benefiting the Portfolios and/or other clients of Janus Capital, as well as Janus Capital's agreement not to use any Portfolio's brokerage transactions to obtain third party research products or services. The Trustees concluded that Janus Capital's use of "soft" commission dollars to obtain proprietary research products and services was consistent with regulatory requirements and guidelines and was likely to benefit each Portfolio. The Trustees also concluded that, other than the services provided by Janus Capital and its affiliates pursuant to the agreements and the fees to be paid by each Portfolio therefor, the Portfolios and Janus Capital may potentially benefit from their relationship with each other in other ways. They concluded that Janus Capital benefits from the receipt of proprietary research products and services acquired through commissions paid on portfolio transactions of the Portfolios and that the Portfolios benefit from Janus Capital's receipt of those products and services as well as research products and services acquired through commissions paid by other clients of Janus Capital. They further concluded that success of any Portfolio could attract other business to Janus Capital or other Janus Funds and that the success of Janus Capital could enhance Janus Capital's ability to serve the Portfolios.
After full consideration of the above factors as well as other factors, all of the Trustees, including all of the Independent Trustees, concluded that the proposed continuation of the investment advisory agreement for each applicable Portfolio were in the best interest of the respective Portfolios and their shareholders.
26 Janus Aspen Series December 31, 2006
Explanations of Charts, Tables and
Financial Statements (unaudited)
1. PERFORMANCE OVERVIEWS
The performance overview graph compares the performance of a hypothetical $10,000 investment in the Portfolio with one or more widely used market indices. The hypothetical example does not represent the returns of any particular investment.
When comparing the performance of the Portfolio with an index, keep in mind that market indices do not include brokerage commissions that would be incurred if you purchased the individual securities in the index. They also do not include taxes payable on dividends and interest or operating expenses incurred if you maintained a Portfolio invested in the index.
Average annual total returns are quoted for each class of the Portfolio. Average annual total return is calculated by taking the growth or decline in value of an investment over a period of time, including reinvestment of any dividends, distributions and capital gains, then calculating the annual compounded percentage rate that would have produced the same result had the rate of growth been constant throughout the period. Average annual total return does not reflect the deduction of taxes that a shareholder would pay on Portfolio distributions or redemptions of Portfolio shares.
2. SCHEDULE OF INVESTMENTS
Following the performance overview section is the Portfolio's Schedule of Investments. This schedule reports the industry concentrations and types of securities held in the Portfolio on the last day of the reporting period. Securities are usually listed by type (common stock, corporate bonds, U.S. Government obligations, etc.) and by industry classification (banking, communications, insurance, etc.). Holdings are subject to change without notice.
The value of each security is quoted as of the last day of the reporting period. The value of securities denominated in foreign currencies is converted into U.S. dollars. Certain short-term investments maturing within 60 days are valued at amortized cost, which approximates market value.
A summary of investments by country is provided if the Portfolio invested in foreign securities. This summary reports the Portfolio's exposure to different countries by providing the percentage of securities invested in each country. The country of each security represents the country in which the company is incorporated.
2A. FORWARD CURRENCY CONTRACTS
A table listing forward currency contracts follows the Portfolio's Schedule of Investments (if applicable). Forward currency contracts are agreements to deliver or receive a preset amount of currency at a future date. Forward currency contracts are used to hedge against foreign currency risk in the Portfolio's long-term holdings. The table provides the name of the foreign currency, the settlement date of the contract, the amount of the contract, the value of the currency in U.S. dollars and the amount of unrealized gain or loss. The amount of unrealized gain or loss reflects the change in currency exchange rates from the time the contract was opened to the last day of the reporting period.
2B. FUTURES
A table listing futures contracts follows the Portfolio's Schedule of Investments (if applicable). Futures contracts are contracts that obligate the buyer to receive and the seller to deliver an instrument or money at a specified price on a specified date. Futures are used to hedge against adverse movements in securities prices, currency risk or interest rates.
The table provides the name of the contract, number of contracts held, the expiration date, the principal amount, value and the amount of unrealized gain or loss. The amount of unrealized gain or loss reflects the marked-to-market amount for the last day of the reporting period.
2C. OPTIONS
A table listing option contracts follows the Portfolio's Schedule of Investments (if applicable). Option contracts are contracts that obligate the Portfolio to sell or purchase an underlying security at a fixed price, upon exercise of the option. Options are used to hedge against adverse movements in securities prices, currency risk or interest rates.
The table provides the name of the contract, number of contracts held, the expiration date, exercise price, value and premiums received.
3. STATEMENT OF ASSETS AND LIABILITIES
This statement is often referred to as the "balance sheet." It lists the assets and liabilities of the Portfolio on the last day of the reporting period.
The Portfolio's assets are calculated by adding the value of the securities owned, the receivable for securities sold but not yet settled, the receivable for dividends declared but not yet received on stocks owned and the receivable for Portfolio shares sold to investors but not yet settled. The Portfolio's liabilities include payables for securities purchased but not yet settled, Portfolio shares redeemed but not yet paid and expenses owed but not yet paid. Additionally, there may be other assets and liabilities such as unrealized gain or loss on forward currency contracts.
The section entitled "Net Assets Consist of" breaks down the components of the Portfolio's net assets. Because the Portfolio must distribute substantially all earnings, you will notice that a significant portion of net assets is shareholder capital.
Janus Aspen Series December 31, 2006 27
Explanations of Charts, Tables and
Financial Statements (unaudited) (continued)
The last section of this statement reports the net asset value ("NAV") per share on the last day of the reporting period for each class of the Portfolio. The NAV is calculated by dividing the Portfolio's net assets (assets minus liabilities) by the number of shares outstanding.
4. STATEMENT OF OPERATIONS
This statement details the Portfolio's income, expenses, gains and losses on securities and currency transactions, and appreciation or depreciation of current Portfolio holdings.
The first section in this statement, entitled "Investment Income," reports the dividends earned from stocks and interest earned from interest-bearing securities in the Portfolio.
The next section reports the expenses and expense offsets incurred by the Portfolio, including the advisory fee paid to the investment adviser and transfer agent fees and expenses, and printing and postage for mailing statements, financial reports and prospectuses. Expense offsets, if any, are also reported.
The last section lists the increase or decrease in the value of securities held in the Portfolio. The Portfolio realizes a gain (or loss) when it sells its position in a particular security. An unrealized gain (or loss) refers to the change in net appreciation or depreciation of the Portfolio during the reporting period. "Net Realized and Unrealized Gain/(Loss) on Investments" is affected both by changes in the market value of Portfolio holdings and by gains (or losses) realized during the reporting period.
5. STATEMENT OF CHANGES IN NET ASSETS
This statement reports the increase or decrease in the Portfolio's net assets during the reporting period. Changes in the Portfolio's net assets are attributable to investment operations, dividends, distributions and capital share transactions. This is important to investors because it shows exactly what caused the Portfolio's net asset size to change during the period.
The first section summarizes the information from the Statement of Operations regarding changes in net assets due to the Portfolio's investment performance. The Portfolio's net assets may also change as a result of dividend and capital gains distributions to investors. If investors receive their dividends in cash, money is taken out of the Portfolio to pay the distribution. If investors reinvest their dividends, the Portfolio's net assets will not be affected. If you compare the Portfolio's "Net Decrease from Dividends and Distributions" to the "Reinvested dividends and distributions," you will notice that dividend distributions had little effect on the Portfolio's net assets. This is because the majority of Janus investors reinvest their distributions.
The reinvestment of dividends is included under "Capital Share Transactions." "Capital Shares" refers to the money investors contribute to the Portfolio through purchases or withdraw via redemptions. The Portfolio's net assets will increase and decrease in value as investors purchase and redeem shares from the Portfolio.
6. FINANCIAL HIGHLIGHTS
This schedule provides a per-share breakdown of the components that affect the Portfolio's NAV for current and past reporting periods for each class of the Portfolio. Not only does this table provide you with total return, it also reports total distributions, asset size, expense ratios and portfolio turnover rate.
The first line in the table reflects the NAV per share at the beginning of the reporting period. The next line reports the net investment income per share, which comprises dividends and interest income earned on securities held by the Portfolio. Following is the total of gains/(losses), realized and unrealized. Dividends and distributions are then subtracted to arrive at the NAV per share at the end of the period. The next line reflects the average annual total return reported the last day of the period.
Also included are the expense ratios, or the percentage of net assets that are used to cover operating expenses during the period. Expense ratios vary for a number of reasons, including the differences in management fees, the average shareholder account size and the extent of foreign investments, which entail greater transaction costs.
The Portfolio's expenses may be reduced through expense reduction arrangements. These arrangements may include the use of balance credits or transfer agent fee offsets. The Statement of Operations reflects total expenses before any such offset, the amount of offset and the net expenses. The expense ratios listed in the Financial Highlights reflect total expenses prior to any expense offsets (gross expense ratio) and after the expense offsets (net expense ratio). Both expense ratios reflect expenses after waivers (reimbursements), if applicable.
The ratio of net investment income/(loss) summarizes the income earned less expenses, divided by the average net assets of the Portfolio during the reporting period. Don't confuse this ratio with the Portfolio's yield. The net investment income ratio is not a true measure of the Portfolio's yield because it doesn't take into account the dividends distributed to the Portfolio's investors.
The next ratio is the portfolio turnover rate, which measures the buying and selling activity in a Portfolio. Portfolio turnover is affected by market conditions, changes in the asset size of a Portfolio, the nature of the Portfolio's investments and the investment style of the portfolio manager. A 100% rate implies that an amount equal to the value of the entire portfolio is turned over in a year; a 50% rate means that an amount equal to the value of half the portfolio is traded in a year; and a 200% rate means that an amount equal to the value of the portfolio is traded every six months.
28 Janus Aspen Series December 31, 2006
Designation Requirements (unaudited)
For federal income tax purposes, the Portfolio designated the following for the year ended December 31, 2006:
Dividends Received Deduction Percentage
| Portfolio | |||||||
| Janus Aspen Large Cap Growth Portfolio | 100 | % | |||||
Janus Aspen Series December 31, 2006 29
Trustees and Officers (unaudited)
The Portfolio's Statement of Additional Information includes additional information about the Trustees and officers and is available, without charge, by calling 1-800-525-0020.
The following are the Trustees and officers of the Trust, together with a brief description of their principal occupations during the last five years (principal occupations for certain Trustees may include periods over five years).
Each Trustee has served in that capacity since he or she was originally elected or appointed. The Trustees do not serve a specified term of office. Each Trustee will hold office until the termination of the Trust or his or her earlier death, resignation, retirement, incapacity or removal. The retirement age for Trustees is 72. The Portfolio's Nominating and Governance Committee will consider nominees for the position of Trustee recommended by shareholders. Shareholders may submit the name of a candidate for consideration by the Committee by submitting their recommendations to the Trust's Secretary. Each Trustee is currently a Trustee of two other registered investment companies advised by Janus Capital: Janus Investment Fund and Janus Adviser Series. As of the date of this report, collectively, these three registered investment companies consist of 69 series or funds.
The Trust's officers are elected annually by the Trustees for a one-year term. Certain officers also serve as officers of Janus Investment Fund and Janus Adviser Series. Certain officers of the Portfolio may also be officers and/or directors of Janus Capital. Portfolio officers receive no compensation from the Portfolio, except for the Portfolio's Chief Compliance Officer, as authorized by the Trustees.
Trustees
| Name, Age and Address | Positions Held with Portfolio | Length of Time Served | Principal Occupations During the Past Five Years | Number of Portfolios in Fund Complex Overseen by Trustee | Other Directorships Held by Trustee | ||||||||||||||||||
| Independent Trustees | |||||||||||||||||||||||
| Dennis B. Mullen 151 Detroit Street Denver, CO 80206 Age 63 | Chairman Trustee | 3/04-Present 9/93-Present | Chief Executive Officer of Red Robin Gourmet Burgers, Inc. (since 2005). Formerly, private investor. | 69 | * | Chairman of the Board (since 2005) and Director of Red Robin Gourmet Burgers, Inc.; and Director of Janus Capital Funds Plc (Dublin-based, non-U.S. funds). | |||||||||||||||||
| Jerome S. Contro 151 Detroit Street Denver, CO 80206 Age 50 | Trustee | 12/05-Present | Partner of Tango Group, a private investment firm (since 1999). | 69 | Trustee and Chairman of RS Investment Trust (since 2001); Director of IZZE Beverages and MyFamily.com, Inc. (genealogical research website). | ||||||||||||||||||
| William F. McCalpin 151 Detroit Street Denver, CO 80206 Age 49 | Trustee | 6/02-Present | Private Investor. Formerly, Vice President of Asian Cultural Council and Executive Vice President and Chief Operating Officer of The Rockefeller Brothers Fund (a private family foundation). | 69 | Director of the F.B. Heron Foundation (a private grantmaking foundation). | ||||||||||||||||||
30 Janus Aspen Series December 31, 2006
Trustees (cont.)
| Name, Age and Address | Positions Held with Portfolio | Length of Time Served | Principal Occupations During the Past Five Years | Number of Portfolios in Fund Complex Overseen by Trustee | Other Directorships Held by Trustee | ||||||||||||||||||
| Independent Trustees (cont.) | |||||||||||||||||||||||
| John W. McCarter, Jr. 151 Detroit Street Denver, CO 80206 Age 68 | Trustee | 6/02-Present | President and Chief Executive Officer of The Field Museum of Natural History (Chicago, IL). | 69 | Chairman of the Board and Director of Divergence Inc. (biotechnology firm); Director of W.W. Grainger, Inc. (industrial distributor); and Trustee of WTTW (Chicago public television station) and the University of Chicago. | ||||||||||||||||||
| James T. Rothe 151 Detroit Street Denver, CO 80206 Age 63 | Trustee | 1/97-Present | Co-founder and Managing Director of Roaring Fork Capital Management, LLC (private investment in public equity firm); and Professor Emeritus of Business of the University of Colorado, Colorado Springs, CO (since 2004). Formerly, Professor of Business of the University of Colorado (2002-2004); and Distinguished Visiting Professor of Business (2001-2002) of Thunderbird University (American Graduate School of International Management), Glendale, AZ. | 69 | Director of Red Robin Gourmet Burgers, Inc. | ||||||||||||||||||
| William D. Stewart 151 Detroit Street Denver, CO 80206 Age 62 | Trustee | 9/93-Present | Corporate Vice President and General Manager of MKS Instruments – HPS Products, Boulder, CO (a manufacturer of vacuum fittings and valves). | 69 | N/A | ||||||||||||||||||
| Martin H. Waldinger 151 Detroit Street Denver, CO 80206 Age 68 | Trustee | 9/93-Present | Private Investor and Consultant to California Planned Unit Developments. Formerly, CEO and President of Marwal, Inc. (homeowner association management company). | 69 | N/A | ||||||||||||||||||
| Linda S. Wolf 151 Detroit Street Denver, CO 80206 Age 59 | Trustee | 12/05-Present | Retired. Formerly, Chairman and Chief Executive Officer of Leo Burnett (Worldwide) (advertising agency) (2001-2005). | 69 | Director of Wal-Mart, The Field Museum of Natural History (Chicago, IL), Children's Memorial Hospital (Chicago, IL), Chicago Council on Foreign Relations, Economic Club of Chicago, and InnerWorkings (a provider of print procurement solutions). | ||||||||||||||||||
Janus Aspen Series December 31, 2006 31
Trustees and Officers (unaudited) (continued)
Trustees (cont.)
| Name, Age and Address | Positions Held with Portfolio | Length of Time Served | Principal Occupations During the Past Five Years | Number of Portfolios in Fund Complex Overseen by Trustee | Other Directorships Held by Trustee | ||||||||||||||||||
| Interested Trustee | |||||||||||||||||||||||
| Thomas H. Bailey** 151 Detroit Street Denver, CO 80206 Age 69 | Trustee | 5/93-Present | Retired. Formerly, President (1978-2002) and Chief Executive Officer (1994-2002) of Janus Capital or Janus Capital Corporation; Chairman and Director (1978-2002) of Janus Capital Corporation; President and Director (1994-2002) of The Janus Foundation. | 69 | N/A | ||||||||||||||||||
* Mr. Mullen also serves as director of Janus Capital Funds Plc, consisting of 22 funds. Including Janus Capital Funds Plc and the 69 funds comprising the Janus Funds, Mr. Mullen oversees 91 funds.
** The Portfolio is treating Mr. Bailey as an "interested person" of the Trust by virtue of his past positions and continuing relationships with Janus Capital and ownership of shares of Janus Capital's parent company.
Officers
| Name, Age and Address | Positions Held with Portfolio | Term of Office* and Length of Time Served | Principal Occupations During the Past Five Years | ||||||||||||
| David J. Corkins 151 Detroit Street Denver, CO 80206 Age 40 | Executive Vice President and Portfolio Manager Janus Aspen Large Cap Growth Portfolio | 2/06-Present | Vice President of Janus Capital and Portfolio Manager for other Janus accounts. Formerly, Portfolio Manager (2003-2006) for Janus Mercury Fund, and Portfolio Manager (1997-2003) for Janus Growth and Income Fund. | ||||||||||||
| Stephanie Grauerholz-Lofton 151 Detroit Street Denver, CO 80206 Age 36 | Chief Legal Counsel and Secretary Vice President | 1/06-Present 3/06-Present | Assistant Vice President of Janus Capital and Janus Distributors LLC; and Associate Counsel of Janus Capital. Formerly, Associate of Vedder, Price, Kaufman & Kammholz, P.C. (1999-2003). | ||||||||||||
| Kelley Abbott Howes 151 Detroit Street Denver, CO 80206 Age 41 | President and Chief Executive Officer | 1/06-Present | President of Janus Services LLC; Senior Vice President and General Counsel of Janus Capital; and Senior Vice President and Assistant General Counsel of Janus Distributors LLC. Formerly, Vice President (1999-2005) of Janus Distributors LLC; Senior Vice President and General Counsel (2004-2006), Vice President (2000-2004), and Assistant General Counsel (2002-2004) of Janus Services LLC; and Vice President and Assistant General Counsel (1999-2004) of Janus Capital. | ||||||||||||
* Officers are elected at least annually for a one-year term and may also be elected from time to time by the Trustees for an interim period.
32 Janus Aspen Series December 31, 2006
Officers (cont.)
| Name, Age and Address | Positions Held with Portfolio | Term of Office* and Length of Time Served | Principal Occupations During the Past Five Years | ||||||||||||
| David R. Kowalski 151 Detroit Street Denver, CO 80206 Age 49 | Vice President and Chief Compliance Officer | 6/02-Present | Senior Vice President and Chief Compliance Officer of Janus Capital, Janus Distributors LLC, and Janus Services LLC; Chief Compliance Officer of Bay Isle Financial LLC; and Vice President of Enhanced Investment Technologies LLC. Formerly, Chief Compliance Officer of Enhanced Investment Technologies, LLC (2003-2005); Vice President of Janus Capital (2000-2005), Janus Distributors LLC (2000-2001), and Janus Services LLC (2004-2005); and Assistant Vice President of Janus Services LLC (2002-2004). | ||||||||||||
| Jesper Nergaard 151 Detroit Street Denver, CO 80206 Age 44 | Chief Financial Officer Vice President, Treasurer, and Principal Accounting Officer | 3/05-Present 2/05-Present | Vice President of Janus Capital. Formerly, Director of Financial Reporting for OppenheimerFunds, Inc. (2004-2005); Site Manager and First Vice President of Mellon Global Securities Services (2003); and Director of Fund Accounting, Project Development, and Training of INVESCO Funds Group (1994-2003). | ||||||||||||
* Officers are elected at least annually for a one-year term and may also be elected from time to time by the Trustees for an interim period.
Janus Aspen Series December 31, 2006 33
Janus provides access to a wide range of investment disciplines.
Growth
Janus growth portfolios focus on companies believed to be the leaders in their respective industries, with solid management teams, expanding market share, margins and efficiencies.
Core
Janus core portfolios seek investments in more stable and predictable companies. These portfolios look for a strategic combination of steady growth and for certain portfolios, some degree of income.
Risk-Managed
Our risk-managed portfolios seek to outperform their respective indices while maintaining a risk profile equal to or lower than the index itself. Managed by INTECH (a Janus subsidiary), these portfolios use a mathematical process in an attempt to build a more "efficient" portfolio than the index.
Value
Janus value portfolios invest in companies they believe are poised for a turnaround or
are trading at a significant discount to fair value. The goal is to gain unique insight into a company's true value and identify and evaluate potential catalysts that may unlock
shareholder value.
International & Global
Janus international and global portfolios seek to leverage Janus' research capabilities by taking advantage of inefficiencies in foreign markets, where accurate information and analytical insight are often at a premium.
Bond & Money Market
Janus bond portfolios attempt to provide less risk relative to equities while seeking to deliver a competitive total return through high current income and appreciation. Janus money market portfolios seek maximum current income consistent with stability of capital.
For more information about our funds, contact your investment professional or go to www.janus.com/info
Please consider the charges, risks, expenses and investment objectives carefully before investing. For a prospectus containing this and other information, please call Janus at 1-800-525-0020 or download the file from www.janus.com/info. Read it carefully before you invest or send money.
An investment in a money market portfolio is not insured or guaranteed by the Federal Deposit Insurance Corporation or any other government agency. Although the Portfolio seeks to preserve the value of your investment at $1.00 per share, it is possible to lose money by investing in the Portfolio.

151 Detroit Street
Denver, CO 80206
1-800-525-0020
Portfolio distributed by Janus Distributors LLC (1/07)
C-0207-169 109-02-701 01-07
2006 Annual Report
Janus Aspen Series
Janus Aspen Mid Cap Growth Portfolio
Look Inside. . .
• Portfolio management perspective
• Investment strategy behind your portfolio
• Portfolio performance, characteristics and holdings

Table of Contents
| Useful Information About Your Portfolio Report | 1 | ||||||
| Management Commentary and Schedule of Investments | 2 | ||||||
| Statement of Assets and Liabilities | 10 | ||||||
| Statement of Operations | 11 | ||||||
| Statements of Changes in Net Assets | 12 | ||||||
| Financial Highlights | 13 | ||||||
| Notes to Schedule of Investments | 14 | ||||||
| Notes to Financial Statements | 15 | ||||||
| Report of Independent Registered Public Accounting Firm | 22 | ||||||
| Additional Information | 23 | ||||||
| Explanation of Charts, Tables and Financial Statements | 26 | ||||||
| Trustees and Officers | 28 | ||||||
Please consider the charges, risks, expenses and investment objectives carefully before investing. For a prospectus containing this and other information, please call Janus at 1-800-525-0020 or download the file from www.janus.com/info. Read it carefully before you invest or send money.
Useful Information About Your Portfolio Report
Management Commentary
The Management Commentary in this report includes valuable insight from the Portfolio's manager as well as statistical information to help you understand how your Portfolio's performance and characteristics stack up against those of comparable indices.
Please keep in mind that the opinions expressed by the Portfolio's manager in the Management Commentary are just that: opinions. They are a reflection of the manager's best judgment at the time this report was compiled, which was December 31, 2006. As the investing environment changes, so could the manager's opinions. The views are unique to the manager and aren't necessarily shared by his fellow employees or by Janus in general.
Portfolio Expenses
We believe it's important for our shareholders to have a clear understanding of Portfolio expenses and the impact they have on investment return.
The following is important information regarding the Portfolio's Expense Example, which appears in the Management Commentary within this Annual Report. Please refer to this information when reviewing the Expense Example for the Portfolio.
Example
As a shareholder of a Portfolio, you incur two types of costs: (1) transaction costs, including redemption fees (where applicable) (and any related exchange fees) and (2) ongoing costs, including management fees; distribution and shareholder servicing (12b-1) fees (applicable to Service Shares only); and other Portfolio expenses. The example is intended to help you understand your ongoing costs (in dollars) of investing in a Portfolio and to compare these costs with the ongoing costs of investing in other mutual funds. To do so, compare this 5% hypothetical example with the 5% hypothetical examples that appear in the shareholder reports of the other funds. The example is based upon an investment of $1,000 invested at the beginning of the period and held for the six-month period from July 1, 2006 to December 31, 2006.
Actual Expenses
The first line of the table in each example provides information about actual account values and actual expenses. You may use the information in this line, together with the amount you invested, to estimate the expenses that you paid over the period. Simply divide your account value by $1,000 (for example, an $8,600 account value divided by $1,000 = 8.6), then multiply the result by the number in the first line under the heading entitled "Expenses Paid During Period" to estimate the expenses you paid on your account during the period.
Hypothetical Example for Comparison Purposes
The second line of the table in each example provides information about hypothetical account values and hypothetical expenses based upon the Portfolio's actual expense ratio and an assumed rate of return of 5% per year before expenses, which is not the Portfolio's actual return. The hypothetical account values and expenses may not be used to estimate the actual ending account balance or expenses you paid for the period. You may use this information to compare the ongoing costs of investing in the Portfolio and other funds. To do so, compare this 5% hypothetical example with the 5% hypothetical examples that appear in the shareholder reports of the other funds.
Please note that the expenses shown in the tables are meant to highlight your ongoing costs only and do not reflect any transaction costs, such as redemption fees (where applicable) and any charges at the separate account level or contract level. Redemption fees are fully described in the prospectus. Therefore, the second line of each table is useful in comparing ongoing costs only, and will not help you determine the relative total costs of owning different funds. In addition, if these transaction costs and separate account or contract level charges were included, your costs would have been higher.
Janus Aspen Series December 31, 2006 1
Janus Aspen Mid Cap Growth Portfolio (unaudited)
Portfolio Snapshot
This portfolio invests in medium-sized companies believed to have moved beyond their emerging growth phase but that still may have room to expand their businesses and grow.

Jonathan Coleman
portfolio manager
Investment Philosophy
One of my goals in writing this letter every year is to provide you with some insight into how I manage the Portfolio. In past letters, I have written about consistency of process, which I believe to be fundamental to strong investment results over an extended period of time. When looking at individual securities for the Portfolio I seek out companies I believe have strong competitive barriers to entry, diverse and predictable revenue streams, an ability to expand profit margins over time, a strong stewardship of investors' capital and appropriate valuations which I believe provide a reasonable risk and reward tradeoff.
Consistency of process can be measured in various ways. Because I place such a strong emphasis on the predictability of revenues a company can generate, I look at the Portfolio's volatility as a way to measure consistency. One measure of volatility is to look at the standard deviation of returns relative to the Portfolio's benchmark index. Since I started managing the Portfolio in February 2002, the standard deviation of the Institutional Shares was 12.82 and the Service Shares was 12.81, and has been 22% below that of the Russell Midcap® Growth Index (standard deviation of 15.66). While volatility over the last 12 months has been below that of recent years, the Portfolio's standard deviation for the Institutional Shares was 10.11 and the Service Shares was 10.10, and was still modestly below that of the 10.60 posted by the Index.
Volatility can be a good thing when it is exclusively to the upside; however, as we all know from recent experience, markets do not exclusively go up. As I have learned throughout my career, significant volatility in down markets is a very painful experience. I seek to control volatility through the portfolio construction process. I try to do that by focusing our largest investments in the Portfolio in more predictable, rather than less predictable, business models. Thus, you will find that many, but not all, of the larger positions in the Portfolio have recurring revenue streams that are I feel are unlikely to experience significant upside or downside volatility. Ultimately, I want you, as a shareholder, to have confidence that your manager seeks to control risks and reduce volatility. I feel this provides the Portfolio with the best opportunity to perform well in all types of markets.
Performance Overview
During the 12 months ended December 31, 2006, Janus Aspen Mid Cap Growth Portfolio's Institutional Shares and Service Shares gained 13.61% and 13.31%, respectively. By comparison, the Portfolio's primary benchmark, the Russell Midcap® Growth Index, returned 10.66% and its secondary benchmark, the Standard & Poor's MidCap 400 Index, returned 10.32%.
The last 12 months in the stock market have been marked with contrasts. The first portion of the year was characterized by a very narrow market as a few sectors, notably energy, industrials and basic materials, spurred a significant rally. This was followed by a retrenchment and broadening of the market in the second quarter as concerns about the sustainability of economic growth proliferated. In fact, some of the sectors that were strongest initially performed poorest during the early summer slump. Over much of the second half of the year, investors cheered the Federal Reserve's (Fed) decision to pause its two-year-long campaign of raising interest rates and consumer stocks rallied as energy prices retreated from their highs. I believe the resiliency of consumer spending is likely to spur decent economic growth in 2007 and could lead to a constructive environment for the stock market. Again, my goal is to perform well across an entire marke t cycle and there may be periods of underperformance as a result. Not surprisingly, our diverse portfolio construction comprising of stocks from many sectors hurt us in the first half of the year; conversely, we performed better in the second half.
Now I'd like to discuss the Portfolio's performance over the last 12 months in greater detail, giving you some specific examples of stock picks that both helped and hurt performance. Effective stock selection in the media and capital goods sectors helped performance during the period. Stock selection was poor in the semiconductors and healthcare equipment/services sectors, and select holdings contributed to some of our worst performance.
Celgene and T. Rowe Price Contributed to Performance
Biotechnology concern Celgene was an exceptionally strong performer during the period. Between its Thalomid and Revlimid treatments, Celgene is emerging as the standard bearer for treating multiple myeloma, a cancer of the bone
2 Janus Aspen Series December 31, 2006
(unaudited)
marrow. Revlimid has also proven effective in treating myelodysplastic syndromes (MDS), a blood-borne cancer. Although we started to harvest some gains in the stock, we still believe the long-term outlook for Celgene is positive, as Revlimid is being tested in further indications and the company has a number of promising pipeline drugs addressing sickle cell anemia and stem cell uses. Our analyst Tony Yao deserves great credit for his exceptional work on this long-time holding.
Mutual fund provider T. Rowe Price, covered by our analyst Gabe Bodhi, was another significant contributor to the Portfolio's performance. As a competitor, I have tremendous respect for the investment professionals at T. Rowe. Their mutual funds have strong historical performance in both bull and bear markets across a variety of investment disciplines. With strong investment performance and steady inflows of new assets, the company solidly increased net revenues and assets under management during 2006. The business model is quite predictable because the company generates revenues from fees collected on its large base of assets under management. In short, it has many of the attributes I look for in an attractive, long-term investment.
Neurocrine Biosciences and Apollo Group Detracted from Results
As is inevitable when picking stocks and constructing portfolios, I made some mistakes. This year, I made a particularly bad mistake with our investment in biotechnology company Neurocrine Biosciences, which I discussed in my semiannual report in June. Although we exited the position quickly after the Food and Drug Administration issued a non-approval letter for the company's sleep-disorder treatment Indiplon, the loss proved a painful lesson that it's essential to focus biotechnology investments only on companies developing truly differentiated drugs.
Longtime holding and for-profit education provider Apollo Group was another detractor from performance over the past 12 months. The company faced slowing student enrollment and, as a result, slowing profit growth over the last several years. Arguably, the company is a victim of its own success; with more than 300,000 students, it is increasingly difficult to grow at meaningful rates off that large base. In retrospect, I was too patient with the stock in light of these challenges. Additionally, I was disappointed to hear of the company's mishandling of stock options in prior periods. I chose to reduce the position for the reasons listed above; however, in securities analysis one has to look at the expectations for future cash flows embedded in current prices. On this metric I have decided to continue holding a reduced position for now.
Outlook
Since it takes time for one Fed rate hike to completely work its way through the economy, one must ask how robust the economic environment will soon be after enduring 17 quarter-point increases between June 2004 and June 2006. Of course, as long as expectations for inflation remain under control and energy prices continue to decline, there's a natural buffer for stronger economic growth. In general, many see this type of buffer as a positive for the stock market.
That said, I feel the Portfolio remains well-diversified with a healthy balance of defensive and economically sensitive stocks. Although the inflation outlook has improved and the Fed seems to have adopted a less aggressive monetary policy, we've frankly prepared for a more subdued growth environment.
Ultimately, macro-economic conditions merely provide a backdrop for our primary charge, which is to find great companies at good valuations from across the investment spectrum.
Thank you for your investment in Janus Aspen Mid Cap Growth Portfolio.
Janus Aspen Series December 31, 2006 3
Janus Aspen Mid Cap Growth Portfolio (unaudited)
Janus Aspen Mid Cap Growth Portfolio At a Glance
5 Largest Contributors to Performance – Holdings
| Contribution | |||||||
| Celgene Corp. Biopharmaceutical company - U.S. | 1.89% | ||||||
| Potash Corporation of Saskatchewan, Inc. (U.S. Shares) Agricultural chemical producer - Canada | 1.39% | ||||||
| Lamar Advertising Co. Outdoor advertising company - U.S. | 1.33% | ||||||
| Marvel Entertainment, Inc. Character licensing, publishing, and toy manufacturing operations company - U.S. | 0.74% | ||||||
| Terex Corp. Construction and mining machinery manufacturer - U.S. | 0.70% | ||||||
5 Largest Detractors from Performance – Holdings
| Contribution | |||||||
| Neurocrine Biosciences, Inc. Biotechnology company - U.S. | (1.22)% | ||||||
| Marvell Technology Group, Ltd. Communication-related integrated circuits provider - Bermuda | (0.51)% | ||||||
| EOG Resources, Inc. Oil and gas company - U.S. | (0.50)% | ||||||
| Advanced Micro Devices, Inc. Integrated circuits provider - U.S. | (0.40)% | ||||||
| St. Jude Medical, Inc. Cardiovascular medical devices developer, manufacturer and distributor - U.S. | (0.36)% | ||||||
5 Largest Contributors to Performance – Sectors
| Group | Fund Contribution | Fund Weighting (% of Net Assets) | Russell Midcap® Growth Index Weighting | ||||||||||||
| Materials | 1.80 | % | 5.30 | % | 3.44 | % | |||||||||
| Capital Goods | 1.50 | % | 4.18 | % | 8.26 | % | |||||||||
| Diversified Financials | 1.33 | % | 7.19 | % | 4.63 | % | |||||||||
| Media | 1.29 | % | 4.68 | % | 3.15 | % | |||||||||
| Software & Services | 1.24 | % | 8.62 | % | 7.58 | % | |||||||||
5 Largest Detractors from Performance – Sectors
| Group | Fund Contribution | Fund Weighting (% of Net Assets) | Russell Midcap® Growth Index Weighting | ||||||||||||
| Semiconductors & Semiconductor Equipment | (0.81 | )% | 6.23 | % | 6.77 | % | |||||||||
| Energy | (0.42 | )% | 6.41 | % | 9.20 | % | |||||||||
| Healthcare Equipment & Services | (0.26 | )% | 10.23 | % | 9.48 | % | |||||||||
| Food & Staples Retailing | (0.09 | )% | 0.15 | % | 0.49 | % | |||||||||
| Banks | (0.08 | )% | 0.60 | % | 1.40 | % | |||||||||
4 Janus Aspen Series December 31, 2006
(unaudited)
5 Largest Equity Holdings – (% of Net Assets)
| As of December 31, 2006 | |||
| Lamar Advertising Co. Advertising Sales | 3.8 | % | |||||
| T. Rowe Price Group, Inc. Investment Management and Advisory Services | 2.7 | % | |||||
| EOG Resources, Inc. Oil Companies - Exploration and Production | 2.7 | % | |||||
| Celgene Corp. Medical - Biomedical and Genetic | 2.7 | % | |||||
| Ball Corp. Containers - Metal and Glass | 2.6 | % | |||||
| 14.5 | % | ||||||
Asset Allocation – (% of Net Assets)
| As of December 31, 2006 | |||
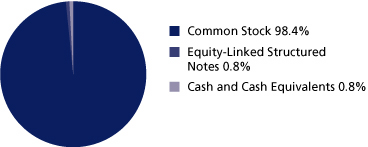
Emerging markets comprised 0.6% of total net assets.
Top Country Allocations – (% of Investment Securities)
| As of December 31, 2006 | As of December 31, 2005 | ||||||
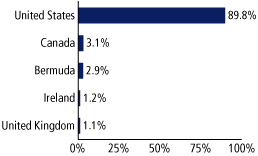 |  | ||||||
Janus Aspen Series December 31, 2006 5
Janus Aspen Mid Cap Growth Portfolio (unaudited)
Performance

Average Annual Total Return – for the periods ended December 31, 2006
| One Year | Five Year | Ten Year | Since Inception* | ||||||||||||||||
| Janus Aspen Mid Cap Growth Portfolio - Institutional Shares | 13.61 | % | 8.45 | % | 7.76 | % | 10.97 | % | |||||||||||
| Janus Aspen Mid Cap Growth Portfolio - Service Shares | 13.31 | % | 8.18 | % | 7.48 | % | 10.68 | % | |||||||||||
| Russell Midcap® Growth Index | 10.66 | % | 8.22 | % | 8.62 | % | 10.28 | % | |||||||||||
| S&P MidCap 400 Index | 10.32 | % | 10.89 | % | 13.47 | % | 13.80 | % | |||||||||||
| Lipper Quartile - Institutional Shares | 1 | st | 1 | st | 3 | rd | 1 | st | |||||||||||
| Lipper Ranking - Institutional Shares based on total returns for Variable Annuity Mid-Cap Growth Funds | 16/144 | 25/102 | 13/23 | 3/13 | |||||||||||||||
Data presented represents past performance, which is no guarantee of future results. Investment results and principal value will fluctuate so that shares, when redeemed, may be worth more or less than their original cost. Due to market volatility, current performance may be higher or lower than the performance shown. Call 877.33JANUS or visit www.janus.com/info for performance current to the most recent month-end.
See Notes to Schedule of Investments for index definitions.
Total return includes reinvestment of dividends from net investment income and distributions from capital gains. The returns shown do not reflect the deduction of taxes that a shareholder would pay on Portfolio distributions or the redemption of Portfolio shares.
Returns shown for Service Shares for periods prior to December 31, 1999 are derived from the historical performance of Institutional Shares, adjusted to reflect the higher operating expenses of Service Shares.
These returns do not reflect the charges and expenses of any particular insurance product or qualified plan. Returns shown would have been lower had they included insurance charges.
The Portfolio may differ significantly from the securities held in the indices. The indices are not available for direct investment; therefore their performance does not reflect the expenses associated with the active management of an actual Portfolio.
There is no assurance that the investment process will consistently lead to successful investing.
A Portfolio that emphasizes investments in smaller companies may experience greater price volatility.
The Portfolio's performance may be affected by risks that include those associated with nondiversification, non-investment grade debt securities, undervalued or overlooked companies, investments in specific industries or countries and potential conflicts of interest with Janus Smart Portfolios. Additional risks to the Portfolio may include those associated with investing in foreign securities, emerging markets, initial public offerings, derivatives and companies with relatively small market capitalizations. Please see a Janus prospectus or www.janus.com/info for more information about risk, fund holdings and details.
Lipper Inc. - A Reuters Company, is a nationally recognized organization that ranks the performance of mutual funds within a universe of funds that have similar investment objectives. Rankings are historical with capital gains and dividends reinvested.
The date of the since-inception Lipper ranking is slightly different from when the Portfolio began operations since Lipper provides fund rankings as of the last day of the month or the first Thursday after fund inception.
Ranking is for the Institutional share class only; other classes may have different performance characteristics.
The Portfolio will invest at least 80% of its net assets in the type of securities described by its name.
See "Explanations of Charts, Tables and Financial Statements."
* The Portfolio's inception date – September 13, 1993
Portfolio Expenses
The example below shows you the ongoing costs (in dollars) of investing in your Portfolio and allows you to compare these costs with those of other mutual funds. Please refer to page 1 for a detailed explanation of the information presented in these charts.
| Expense Example - Institutional Shares | Beginning Account Value (7/1/06) | Ending Account Value (12/31/06) | Expenses Paid During Period (7/1/06-12/31/06)* | ||||||||||||
| Actual | $ | 1,000.00 | $ | 1,107.50 | $ | 3.61 | |||||||||
| Hypothetical (5% return before expenses) | $ | 1,000.00 | $ | 1,021.78 | $ | 3.47 | |||||||||
| Expense Example - Service Shares | Beginning Account Value (7/1/06) | Ending Account Value (12/31/06) | Expenses Paid During Period (7/1/06-12/31/06)* | ||||||||||||
| Actual | $ | 1,000.00 | $ | 1,106.20 | $ | 4.94 | |||||||||
| Hypothetical (5% return before expenses) | $ | 1,000.00 | $ | 1,020.52 | $ | 4.74 | |||||||||
*Expenses are equal to the annualized expense ratio of 0.68% for Institutional Shares and 0.93% for Service Shares, multiplied by the average account value over the period, multiplied by 184/365 (to reflect the one-half year period).
6 Janus Aspen Series December 31, 2006
Janus Aspen Mid Cap Growth Portfolio
Schedule of Investments
As of December 31, 2006
| Shares or Principal Amount | Value | ||||||||||
| Common Stock - 98.4% | |||||||||||
| Advertising Sales - 3.8% | |||||||||||
| 455,131 | Lamar Advertising Co.* | $ | 29,761,016 | ||||||||
| Aerospace and Defense - 1.3% | |||||||||||
| 299,490 | Spirit Aerosystems Holdings, Inc.* | 10,023,930 | |||||||||
| Agricultural Chemicals - 2.4% | |||||||||||
| 129,375 | Potash Corporation of Saskatchewan, Inc. (U.S. Shares) | 18,562,725 | |||||||||
| Airlines - 1.3% | |||||||||||
| 127,309 | Ryanair Holdings PLC (ADR)*,# | 10,375,684 | |||||||||
| Batteries and Battery Systems - 0.6% | |||||||||||
| 61,860 | Energizer Holdings, Inc.* | 4,391,441 | |||||||||
| Building - Residential and Commercial - 0.9% | |||||||||||
| 10,640 | NVR, Inc.* | 6,862,800 | |||||||||
| Casino Hotels - 2.2% | |||||||||||
| 35,700 | Boyd Gaming Corp. | 1,617,567 | |||||||||
| 345,555 | Melco PBL Entertainment (Macau), Ltd. (ADR)*,# | 7,346,499 | |||||||||
| 103,925 | Station Casinos, Inc. | 8,487,555 | |||||||||
| 17,451,621 | |||||||||||
| Casino Services - 1.3% | |||||||||||
| 345,513 | Scientific Games Corp. - Class A*,# | 10,444,858 | |||||||||
| Cellular Telecommunications - 1.2% | |||||||||||
| 139,295 | N.I.I. Holdings, Inc.*,# | 8,976,170 | |||||||||
| Commercial Banks - 0.7% | |||||||||||
| 50,650 | Commerce Bancorp, Inc.# | 1,786,426 | |||||||||
| 80,860 | SVB Financial Group*,# | 3,769,693 | |||||||||
| 5,556,119 | |||||||||||
| Commercial Services - 1.0% | |||||||||||
| 193,752 | Iron Mountain, Inc.* | 8,009,708 | |||||||||
| Commercial Services - Finance - 3.4% | |||||||||||
| 191,984 | Jackson Hewitt Tax Service, Inc. | 6,521,696 | |||||||||
| 158,876 | Moody's Corp. | 10,971,977 | |||||||||
| 226,360 | Paychex, Inc. | 8,950,274 | |||||||||
| 26,443,947 | |||||||||||
| Computer Services - 2.4% | |||||||||||
| 370,535 | Ceridian Corp.* | 10,367,569 | |||||||||
| 203,320 | IHS, Inc. - Class A* | 8,027,074 | |||||||||
| 18,394,643 | |||||||||||
| Computers - 1.1% | |||||||||||
| 100,104 | Apple Computer, Inc.* | 8,492,823 | |||||||||
| Computers - Memory Devices - 0.4% | |||||||||||
| 69,550 | SanDisk Corp.* | 2,992,737 | |||||||||
| Consulting Services - 1.1% | |||||||||||
| 40,910 | Corporate Executive Board Co. | 3,587,807 | |||||||||
| 258,560 | Gartner Group, Inc.*,# | 5,116,902 | |||||||||
| 8,704,709 | |||||||||||
| Containers - Metal and Glass - 4.2% | |||||||||||
| 457,346 | Ball Corp. | 19,940,286 | |||||||||
| 676,852 | Owens-Illinois, Inc.* | 12,487,919 | |||||||||
| 32,428,205 | |||||||||||
| Data Processing and Management - 0.7% | |||||||||||
| 151,169 | NAVTEQ Corp.*,# | 5,286,380 | |||||||||
| Shares or Principal Amount | Value | ||||||||||
| Dental Supplies and Equipment - 1.5% | |||||||||||
| 170,140 | Patterson Companies, Inc.*,# | $ | 6,041,671 | ||||||||
| 151,290 | Sirona Dental Systems, Inc.,# | 5,826,178 | |||||||||
| 11,867,849 | |||||||||||
| Diagnostic Kits - 1.6% | |||||||||||
| 304,405 | Dade Behring Holdings, Inc. | 12,118,363 | |||||||||
| Distribution/Wholesale - 1.0% | |||||||||||
| 390,500 | Esprit Holdings, Ltd. | 4,360,197 | |||||||||
| 1,177,000 | Li & Fung, Ltd. | 3,661,906 | |||||||||
| 8,022,103 | |||||||||||
| Diversified Operations - 0.6% | |||||||||||
| 15,530,207 | Polytec Asset Holdings, Ltd.§ | 4,392,535 | |||||||||
| E-Commerce/Products - 0.6% | |||||||||||
| 65,800 | Submarino S.A. (GDR) (144A) | 4,314,138 | |||||||||
| E-Commerce/Services - 0.9% | |||||||||||
| 175,740 | IAC/InterActiveCorp*,# | 6,530,498 | |||||||||
| Electric Products - Miscellaneous - 1.1% | |||||||||||
| 266,125 | AMETEK, Inc. | 8,473,420 | |||||||||
| Electronic Components - Semiconductors - 2.1% | |||||||||||
| 322,465 | Advanced Micro Devices, Inc.* | 6,562,163 | |||||||||
| 195,914 | International Rectifier Corp.* | 7,548,566 | |||||||||
| 86,150 | SiRF Technology Holdings, Inc.* | 2,198,548 | |||||||||
| 16,309,277 | |||||||||||
| Electronic Measuring Instruments - 1.0% | |||||||||||
| 149,315 | Trimble Navigation, Ltd.* | 7,574,750 | |||||||||
| Entertainment Software - 1.9% | |||||||||||
| 595,515 | Activision, Inc.*,# | 10,266,678 | |||||||||
| 85,435 | Electronic Arts, Inc.* | 4,302,507 | |||||||||
| 14,569,185 | |||||||||||
| Fiduciary Banks - 1.0% | |||||||||||
| 128,953 | Northern Trust Corp.# | 7,826,158 | |||||||||
| Finance - Investment Bankers/Brokers - 0.4% | |||||||||||
| 122,605 | optionsXpress Holdings, Inc. | 2,781,907 | |||||||||
| Finance - Other Services - 1.6% | |||||||||||
| 24,268 | Chicago Mercantile Exchange Holdings, Inc. | 12,370,613 | |||||||||
| Food - Canned - 1.0% | |||||||||||
| 258,890 | TreeHouse Foods, Inc.* | 8,077,368 | |||||||||
| Food - Retail - 0.2% | |||||||||||
| 35,340 | Whole Foods Market, Inc.# | 1,658,506 | |||||||||
| Hotels and Motels - 0.6% | |||||||||||
| 70,646 | Starwood Hotels & Resorts Worldwide, Inc. | 4,415,375 | |||||||||
| Independent Power Producer - 0.6% | |||||||||||
| 87,415 | NRG Energy, Inc.* | 4,896,114 | |||||||||
| Industrial Automation and Robotics - 0.5% | |||||||||||
| 65,986 | Rockwell Automation, Inc. | 4,030,425 | |||||||||
| Instruments - Controls - 1.8% | |||||||||||
| 51,005 | Mettler-Toledo International, Inc.* | 4,021,744 | |||||||||
| 223,276 | Thermo Electron Corp.* | 10,112,170 | |||||||||
| 14,133,914 | |||||||||||
| Insurance Brokers - 0.5% | |||||||||||
| 98,255 | Willis Group Holdings, Ltd.# | 3,901,706 | |||||||||
See Notes to Schedule of Investments and Financial Statements.
Janus Aspen Series December 31, 2006 7
Janus Aspen Mid Cap Growth Portfolio
Schedule of Investments
As of December 31, 2006
| Shares or Principal Amount | Value | ||||||||||
| Investment Management and Advisory Services - 3.1% | |||||||||||
| 78,945 | National Financial Partners Corp. | $ | 3,471,212 | ||||||||
| 479,251 | T. Rowe Price Group, Inc. | 20,976,816 | |||||||||
| 24,448,028 | |||||||||||
| Machinery - Pumps - 0.6% | |||||||||||
| 112,135 | Graco, Inc. | 4,442,789 | |||||||||
| Medical - Biomedical and Genetic - 3.5% | |||||||||||
| 358,381 | Celgene Corp.* | 20,617,659 | |||||||||
| 112,035 | Invitrogen Corp.*,# | 6,340,061 | |||||||||
| 26,957,720 | |||||||||||
| Medical - HMO - 1.8% | |||||||||||
| 281,381 | Coventry Health Care, Inc.* | 14,083,119 | |||||||||
| Medical - Nursing Homes - 1.0% | |||||||||||
| 165,900 | Manor Care, Inc. | 7,784,028 | |||||||||
| Medical Instruments - 1.0% | |||||||||||
| 35,357 | Intuitive Surgical, Inc.* | 3,390,736 | |||||||||
| 110,860 | Kyphon, Inc.*,# | 4,478,744 | |||||||||
| 7,869,480 | |||||||||||
| Medical Labs and Testing Services - 0.4% | |||||||||||
| 57,305 | Covance, Inc.* | 3,375,838 | |||||||||
| Medical Products - 1.0% | |||||||||||
| 159,233 | Varian Medical Systems, Inc.* | 7,574,714 | |||||||||
| Metal Processors and Fabricators - 1.3% | |||||||||||
| 130,780 | Precision Castparts Corp. | 10,237,458 | |||||||||
| Multi-Line Insurance - 1.3% | |||||||||||
| 189,251 | Assurant, Inc. | 10,456,118 | |||||||||
| Networking Products - 0.4% | |||||||||||
| 176,645 | Juniper Networks, Inc.* | 3,345,656 | |||||||||
| Oil and Gas Drilling - 0.7% | |||||||||||
| 168,705 | Nabors Industries, Ltd.* | 5,024,035 | |||||||||
| Oil Companies - Exploration and Production - 3.5% | |||||||||||
| 111,795 | Chesapeake Energy Corp.# | 3,247,645 | |||||||||
| 334,419 | EOG Resources, Inc. | 20,884,467 | |||||||||
| 92,390 | Forest Oil Corp.* | 3,019,305 | |||||||||
| 27,151,417 | |||||||||||
| Physician Practice Management - 0.7% | |||||||||||
| 114,500 | Pediatrix Medical Group, Inc.* | 5,599,050 | |||||||||
| Power Converters and Power Supply Equipment - 0.3% | |||||||||||
| 45,485 | Hubbell, Inc. | 2,056,377 | |||||||||
| Property and Casualty Insurance - 0.7% | |||||||||||
| 152,983 | W. R. Berkley Corp. | 5,279,443 | |||||||||
| Real Estate Management/Services - 0.7% | |||||||||||
| 170,225 | CB Richard Ellis Group, Inc.* | 5,651,470 | |||||||||
| Real Estate Operating/Development - 0.5% | |||||||||||
| 77,510 | St. Joe Co.# | 4,152,211 | |||||||||
| Recreational Vehicles - 0.6% | |||||||||||
| 102,288 | Polaris Industries, Inc.# | 4,790,147 | |||||||||
| Reinsurance - 2.0% | |||||||||||
| 4,244 | Berkshire Hathaway, Inc. - Class B*,# | 15,558,504 | |||||||||
| REIT - Mortgages - 1.3% | |||||||||||
| 360,251 | CapitalSource, Inc.# | 9,838,455 | |||||||||
| Rental Auto/Equipment - 0.2% | |||||||||||
| 85,815 | Hertz Global Holdings, Inc.* | 1,492,323 | |||||||||
| Shares or Principal Amount | Value | ||||||||||
| Respiratory Products - 1.5% | |||||||||||
| 317,404 | Respironics, Inc.* | $ | 11,982,001 | ||||||||
| Retail - Apparel and Shoe - 1.7% | |||||||||||
| 131,950 | Abercrombie & Fitch Co. - Class A# | 9,187,679 | |||||||||
| 83,295 | Nordstrom, Inc. | 4,109,775 | |||||||||
| 13,297,454 | |||||||||||
| Retail - Gardening Products - 0.6% | |||||||||||
| 107,910 | Tractor Supply Co.*,# | 4,824,656 | |||||||||
| Retail - Office Supplies - 2.4% | |||||||||||
| 132,845 | Office Depot, Inc.* | 5,070,694 | |||||||||
| 500,760 | Staples, Inc. | 13,370,292 | |||||||||
| 18,440,986 | |||||||||||
| Schools - 0.3% | |||||||||||
| 68,609 | Apollo Group, Inc. - Class A*,# | 2,673,693 | |||||||||
| Semiconductor Components/Integrated Circuits - 2.6% | |||||||||||
| 692,160 | Cypress Semiconductor Corp.*,# | 11,676,739 | |||||||||
| 441,548 | Marvell Technology Group, Ltd.* | 8,473,306 | |||||||||
| 20,150,045 | |||||||||||
| Telecommunication Equipment - 0.3% | |||||||||||
| 68,410 | CommScope, Inc.* | 2,085,137 | |||||||||
| Telecommunication Services - 2.0% | |||||||||||
| 254,532 | Amdocs, Ltd. (U.S. Shares)* | 9,863,115 | |||||||||
| 273,455 | Time Warner Telecom, Inc. - Class A* | 5,449,958 | |||||||||
| 15,313,073 | |||||||||||
| Therapeutics - 2.1% | |||||||||||
| 167,541 | Gilead Sciences, Inc.* | 10,878,437 | |||||||||
| 207,040 | Mannkind Corp.* | 3,414,090 | |||||||||
| 40,960 | United Therapeutics Corp.* | 2,226,995 | |||||||||
| 16,519,522 | |||||||||||
| Toys - 0.8% | |||||||||||
| 232,420 | Marvel Entertainment, Inc.*,# | 6,254,422 | |||||||||
| Transportation - Equipment and Leasing - 0.4% | |||||||||||
| 74,540 | GATX Corp.# | 3,229,818 | |||||||||
| Transportation - Marine - 0.6% | |||||||||||
| 97,643 | Alexander & Baldwin, Inc.# | 4,329,491 | |||||||||
| Transportation - Railroad - 1.0% | |||||||||||
| 182,055 | Canadian National Railway Co. (U.S. Shares) | 7,833,827 | |||||||||
| Transportation - Services - 1.5% | |||||||||||
| 151,735 | C.H. Robinson Worldwide, Inc.# | 6,204,444 | |||||||||
| 142,802 | Expeditors International of Washington, Inc. | 5,783,481 | |||||||||
| 11,987,925 | |||||||||||
| Transportation - Truck - 0.7% | |||||||||||
| 143,280 | Landstar System, Inc. | 5,470,430 | |||||||||
| Web Hosting/Design - 1.3% | |||||||||||
| 130,423 | Equinix, Inc.* | 9,862,587 | |||||||||
| Wireless Equipment - 1.5% | |||||||||||
| 368,525 | Crown Castle International Corp.*,# | 11,903,358 | |||||||||
| Total Common Stock (cost $511,718,411) | 764,750,525 | ||||||||||
See Notes to Schedule of Investments and Financial Statements.
8 Janus Aspen Series December 31, 2006
Schedule of Investments
As of December 31, 2006
| Shares or Principal Amount | Value | ||||||||||
| Equity-Linked Structured Notes - 0.8% | |||||||||||
| Finance - Investment Bankers/Brokers - 0.8% | |||||||||||
| Morgan Stanley Co.: | |||||||||||
| 62,205 | convertible, (Celgene Corp.), 0% (144A)§ | $ | 3,510,228 | ||||||||
| 62,205 | convertible, (Celgene Corp.), 0% (144A)§ | 3,510,228 | |||||||||
| Total Equity-Linked Structured Notes (cost $5,864,688) | 7,020,456 | ||||||||||
| Money Market - 0.4% | |||||||||||
| 3,197,829 | Janus Institutional Cash Reserves Fund, 5.29% (cost $3,197,829) | 3,197,829 | |||||||||
| Other Securities - 11.2% | |||||||||||
| 87,176,659 | State Street Navigator Securities Lending Prime Portfolio† (cost $87,176,659) | 87,176,659 | |||||||||
| Total Investments (total cost $607,957,587) – 110.8% | 862,145,469 | ||||||||||
| Liabilities, net of Cash, Receivables and Other Assets – (10.8)% | (84,488,306 | ) | |||||||||
| Net Assets – 100% | $ | 777,657,163 | |||||||||
Summary of Investments by Country
| Country | Value | % of Investment Securities | |||||||||
| Bermuda | $ | 25,421,150 | 2.9 | % | |||||||
| Brazil | 4,314,138 | 0.5 | % | ||||||||
| Canada | 26,396,552 | 3.1 | % | ||||||||
| Cayman Islands | 4,392,535 | 0.5 | % | ||||||||
| Hong Kong | 7,346,499 | 0.9 | % | ||||||||
| Ireland | 10,375,684 | 1.2 | % | ||||||||
| United Kingdom | 9,863,115 | 1.1 | % | ||||||||
| United States†† | 774,035,796 | 89.8 | % | ||||||||
| Total | $ | 862,145,469 | 100.0 | % | |||||||
†† Includes Short-Term Securities and Other Securities (79.3% excluding Short-Term Securities and Other Securities)
See Notes to Schedule of Investments and Financial Statements.
Janus Aspen Series December 31, 2006 9
Statement of Assets and Liabilities
| As of December 31, 2006 (all numbers in thousands except net asset value per share) | Janus Aspen Mid Cap Growth Portfolio | ||||||
| Assets: | |||||||
| Investments at cost(1) | $ | 607,958 | |||||
| Investments at value(1) | $ | 862,145 | |||||
| Receivables: | |||||||
| Investments sold | 4,274 | ||||||
| Portfolio shares sold | 178 | ||||||
| Dividends | 307 | ||||||
| Interest | 45 | ||||||
| Other assets | 20 | ||||||
| Total Assets | 866,969 | ||||||
| Liabilities: | |||||||
| Payables: | |||||||
| Collateral for securities loaned (Note 1) | 87,177 | ||||||
| Due to custodian | 2 | ||||||
| Portfolio shares repurchased | 1,566 | ||||||
| Advisory fees | 428 | ||||||
| Transfer agent fees and expenses | 1 | ||||||
| Distribution fees - Service Shares | 55 | ||||||
| Non-interested Trustees' fees and expenses | 6 | ||||||
| Accrued expenses | 77 | ||||||
| Total Liabilities | 89,312 | ||||||
| Net Assets | $ | 777,657 | |||||
| Net Assets Consist of: | |||||||
| Capital (par value and paid-in-surplus)* | $ | 896,499 | |||||
| Undistributed net investment income/(loss)* | (385 | ) | |||||
| Undistributed net realized gain/(loss) from investments and foreign currency transactions* | (372,644 | ) | |||||
| Unrealized net appreciation/(depreciation) of investments and foreign currency translations | 254,187 | ||||||
| Total Net Assets | $ | 777,657 | |||||
| Net Assets - Institutional Shares | $ | 523,173 | |||||
| Shares Outstanding, $0.001 Par Value (unlimited shares authorized) | 15,867 | ||||||
| Net Asset Value Per Share | $ | 32.97 | |||||
| Net Assets - Service Shares | $ | 254,484 | |||||
| Shares Outstanding, $0.001 Par Value (unlimited shares authorized) | 7,905 | ||||||
| Net Asset Value Per Share | $ | 32.19 | |||||
* See Note 3 in Notes to Financial Statements.
(1) Investments at cost and value include $85,201,089 of securities loaned for Janus Aspen Mid Cap Growth Portfolio (Note 1).
See Notes to Financial Statements.
10 Janus Aspen Series December 31, 2006
Statement of Operations
| For the fiscal year ended December 31, 2006 (all numbers in thousands) | Janus Aspen Mid Cap Growth Portfolio | ||||||
| Investment Income: | |||||||
| Interest | $ | 251 | |||||
| Securities lending income | 132 | ||||||
| Dividends | 4,557 | ||||||
| Dividends from affiliates | 243 | ||||||
| Foreign tax withheld | (40 | ) | |||||
| Total Investment Income | 5,143 | ||||||
| Expenses: | |||||||
| Advisory fees | 4,981 | ||||||
| Transfer agent expenses | 5 | ||||||
| Registration fees | 60 | ||||||
| Custodian fees | 22 | ||||||
| Professional fees | 28 | ||||||
| Non-interested Trustees' fees and expenses | 28 | ||||||
| Distribution fees - Service Shares | 634 | ||||||
| Other expenses | 280 | ||||||
| Non-recurring costs (Note 2) | – | ||||||
| Costs assumed by Janus Capital Management LLC (Note 2) | – | ||||||
| Total Expenses | 6,038 | ||||||
| Expense and Fee Offset | (5 | ) | |||||
| Net Expenses | 6,033 | ||||||
| Net Investment Income/(Loss) | (890 | ) | |||||
| Net Realized and Unrealized Gain/(Loss) on Investments: | |||||||
| Net realized gain/(loss) from securities transactions | 125,721 | ||||||
| Net realized gain/(loss) from foreign currency transactions | 6 | ||||||
| Change in unrealized net appreciation/(depreciation) of investments and foreign currency translations | (27,369 | ) | |||||
| Net Gain/(Loss) on Investments | 98,358 | ||||||
| Net Increase/(Decrease) in Net Assets Resulting from Operations | $ | 97,468 | |||||
See Notes to Financial Statements.
Janus Aspen Series December 31, 2006 11
Statements of Changes in Net Assets
| For the fiscal year ended December 31 | Janus Aspen Mid Cap Growth Portfolio | ||||||||||
| (all numbers in thousands) | 2006 | 2005 | |||||||||
| Operations: | |||||||||||
| Net investment income/(loss) | $ | (890 | ) | $ | (622 | ) | |||||
| Net realized gain/(loss) from investment and foreign currency transactions | 125,727 | 249,016 | |||||||||
| Change in unrealized net appreciation/(depreciation) of investments and foreign currency translations | (27,369 | ) | (202,680 | ) | |||||||
| Payment from affiliate (Note 2) | – | 11 | |||||||||
| Net Increase/(Decrease) in Net Assets Resulting from Operations | 97,468 | 45,725 | |||||||||
| Dividends and Distributions to Shareholders: | |||||||||||
| Net investment income* | |||||||||||
| Institutional Shares | – | – | |||||||||
| Service Shares | – | – | |||||||||
| Net realized gain from investment transactions* | |||||||||||
| Institutional Shares | – | – | |||||||||
| Service Shares | – | – | |||||||||
| Net Decrease from Dividends and Distributions | – | – | |||||||||
| Capital Share Transactions: | |||||||||||
| Shares sold | |||||||||||
| Institutional Shares | 42,627 | 46,429 | |||||||||
| Service Shares | 25,071 | 45,107 | |||||||||
| Reinvested dividends and distributions | |||||||||||
| Institutional Shares | – | – | |||||||||
| Service Shares | – | – | |||||||||
| Shares repurchased(1) | |||||||||||
| Institutional Shares | (117,860 | ) | (738,113 | ) | |||||||
| Service Shares | (57,959 | ) | (57,069 | ) | |||||||
| Net Increase/(Decrease) from Capital Share Transactions | (108,121 | ) | (703,646 | ) | |||||||
| Net Increase/(Decrease) in Net Assets | (10,653 | ) | (657,921 | ) | |||||||
| Net Assets: | |||||||||||
| Beginning of period | 788,310 | 1,446,231 | |||||||||
| End of period | $ | 777,657 | $ | 788,310 | |||||||
| Undistributed net investment income/(loss)* | $ | (385 | ) | $ | (13 | ) | |||||
* See Note 3 in Notes to Financial Statements.
(1) During the fiscal year ended December 31, 2005, Janus Aspen Mid Cap Growth Portfolio disbursed to a redeeming shareholder portfolio securities and cash valued at $548,227,740 on the date of redemption.
See Notes to Financial Statements.
12 Janus Aspen Series December 31, 2006
Financial Highlights
| Institutional Shares For a share outstanding during each fiscal year ended December 31 | Janus Aspen Mid Cap Growth Portfolio | ||||||||||||||||||||||
| 2006 | 2005 | 2004 | 2003 | 2002 | |||||||||||||||||||
| Net Asset Value, Beginning of Period | $ | 29.02 | $ | 25.84 | $ | 21.40 | $ | 15.84 | $ | 21.98 | |||||||||||||
| Income from Investment Operations: | |||||||||||||||||||||||
| Net investment income/(loss) | .03 | .08 | .02 | .01 | (.01 | ) | |||||||||||||||||
| Net gain/(loss) on securities (both realized and unrealized) | 3.92 | 3.10 | 4.42 | 5.55 | (6.13 | ) | |||||||||||||||||
| Total from Investment Operations | 3.95 | 3.18 | 4.44 | 5.56 | (6.14 | ) | |||||||||||||||||
| Less Distributions and Other: | |||||||||||||||||||||||
| Dividends (from net investment income)* | – | – | – | – | – | ||||||||||||||||||
| Distributions (from capital gains)* | – | – | – | – | – | ||||||||||||||||||
| Payment from affiliate | – | – | (1) | – | – | – | |||||||||||||||||
| Total Distributions and Other | – | – | – | – | – | ||||||||||||||||||
| Net Asset Value, End of Period | $ | 32.97 | $ | 29.02 | $ | 25.84 | $ | 21.40 | $ | 15.84 | |||||||||||||
| Total Return | 13.61 | % | 12.31 | %(2) | 20.75 | % | 35.10 | % | (27.93 | )% | |||||||||||||
| Net Assets, End of Period (in thousands) | $ | 523,173 | $ | 532,085 | $ | 1,205,813 | $ | 1,649,423 | $ | 1,324,273 | |||||||||||||
| Average Net Assets for the Period (in thousands) | $ | 525,467 | $ | 706,963 | $ | 1,579,383 | $ | 1,461,491 | $ | 1,609,280 | |||||||||||||
| Ratio of Gross Expenses to Average Net Assets(3)(4) | 0.69 | % | 0.67 | % | 0.66 | % | 0.67 | % | 0.67 | % | |||||||||||||
| Ratio of Net Expenses to Average Net Assets(4) | 0.69 | % | 0.67 | % | 0.66 | % | 0.67 | % | 0.67 | % | |||||||||||||
| Ratio of Net Investment Income/(Loss) to Average Net Assets | (0.03 | )% | (0.01 | )% | (0.05 | )% | (0.11 | )% | (0.07 | )% | |||||||||||||
| Portfolio Turnover Rate | 41 | % | 32 | % | 25 | % | 36 | % | 63 | % | |||||||||||||
| Service Shares For a share outstanding during each fiscal year ended December 31 | Janus Aspen Mid Cap Growth Portfolio | ||||||||||||||||||||||
| 2006 | 2005 | 2004 | 2003 | 2002 | |||||||||||||||||||
| Net Asset Value, Beginning of Period | $ | 28.41 | $ | 25.36 | $ | 21.05 | $ | 15.62 | $ | 21.73 | |||||||||||||
| Income from Investment Operations: | |||||||||||||||||||||||
| Net investment income/(loss) | (.09 | ) | (.05 | ) | (.05 | ) | (.03 | ) | (.04 | ) | |||||||||||||
| Net gain/(loss) on securities (both realized and unrealized) | 3.87 | 3.10 | 4.36 | 5.46 | (6.07 | ) | |||||||||||||||||
| Total from Investment Operations | 3.78 | 3.05 | 4.31 | 5.43 | (6.11 | ) | |||||||||||||||||
| Less Distributions and Other: | |||||||||||||||||||||||
| Dividends (from net investment income)* | – | – | – | – | – | ||||||||||||||||||
| Distributions (from capital gains)* | – | – | – | – | – | ||||||||||||||||||
| Payment from affiliate | – | – | (1) | – | – | – | |||||||||||||||||
| Total Distributions and Other | – | – | – | – | – | ||||||||||||||||||
| Net Asset Value, End of Period | $ | 32.19 | $ | 28.41 | $ | 25.36 | $ | 21.05 | $ | 15.62 | |||||||||||||
| Total Return | 13.31 | % | 12.03 | %(2) | 20.48 | % | 34.76 | % | (28.12 | )% | |||||||||||||
| Net Assets, End of Period (in thousands) | $ | 254,484 | $ | 256,225 | $ | 240,418 | $ | 204,838 | $ | 137,089 | |||||||||||||
| Average Net Assets for the Period (in thousands) | $ | 253,611 | $ | 244,487 | $ | 211,792 | $ | 167,689 | $ | 149,682 | |||||||||||||
| Ratio of Gross Expenses to Average Net Assets(3)(4) | 0.94 | % | 0.92 | % | 0.91 | % | 0.92 | % | 0.92 | % | |||||||||||||
| Ratio of Net Expenses to Average Net Assets(4) | 0.94 | % | 0.92 | % | 0.91 | % | 0.92 | % | 0.92 | % | |||||||||||||
| Ratio of Net Investment Income/(Loss) to Average Net Assets | (0.28 | )% | (0.23 | )% | (0.28 | )% | (0.35 | )% | (0.32 | )% | |||||||||||||
| Portfolio Turnover Rate | 41 | % | 32 | % | 25 | % | 36 | % | 63 | % | |||||||||||||
* See Note 3 in Notes to Financial Statements.
(1) Payment from affiliate aggregated less than $.01 on a per share basis for the fiscal year ended.
(2) During the fiscal year ended, Janus Capital and/or Janus Services LLC fully reimbursed the Portfolio for a loss on a transaction resulting from certain trading, pricing and/or shareholder activity errors, which otherwise would have reduced total return by less than 0.01%.
(3) The effect of non-recurring costs assumed by Janus Capital (Note 2) is included in the ratio of gross expenses to average net assets and was less than 0.01%.
(4) See "Explanations of Charts, Tables and Financial Statements."
See Notes to Financial Statements.
Janus Aspen Series December 31, 2006 13
Notes to Schedule of Investments
| Lipper Variable Annuity Mid-Cap Growth Funds | Funds that, by portfolio practice, invest at least 75% of their equity assets in companies with market capitalizations (on a three-year weighted basis) less than 300% of the dollar-weighted median market capitalization of the middle 1,000 securities of the S&P SuperComposite 1500® Index. Mid-cap growth funds typically have an above-average price-to-earnings ratio, price-to-book ratio, and three-year sales-per-share growth value, compared to the S&P MidCap 400® Index. | ||||||
| Russell Midcap® Growth Index | Consists of stocks from the Russell MidCap® Index with a greater-than-average growth orientation. The Russell MidCap® Index consists of the smallest 800 companies in the Russell 1000® Index, as ranked by total market capitalization. | ||||||
| S&P MidCap 400 Index | Is an unmanaged group of 400 domestic stocks chosen for their market size, liquidity and industry group representation. | ||||||
| 144A | Securities sold under Rule 144A of the Securities Act of 1933 are subject to legal and/or contractual restrictions on resale and may not be publicly sold without registration under the 1933 Act. | ||||||
| ADR | American Depositary Receipt | ||||||
| GDR | Global Depositary Receipt | ||||||
| PLC | Public Limited Company | ||||||
| REIT | Real Estate Investment Trust | ||||||
| U.S. Shares | Securities of foreign companies trading on an American Stock Exchange. | ||||||
* Non-income-producing security.
# Loaned security; a portion or all of the security is on loan at December 31, 2006.
† The security is purchased with the cash collateral received from securities on loan (Note 1).
§ Schedule of Restricted and Illiquid Securities (as of December 31, 2006)
| Acquisition Date | Acquisition Cost | Value | Value as % of Net Assets | ||||||||||||||||
| Janus Aspen Mid Cap Growth Portfolio | |||||||||||||||||||
| Morgan Stanley Co. convertible, (Celgene Corp.), 0%, (144A) | 7/24/06 | $ | 2,932,344 | $ | 3,510,228 | 0.4 | % | ||||||||||||
| Morgan Stanley Co. convertible, (Celgene Corp.), 0%, (144A) | 7/24/06 | 2,932,344 | 3,510,228 | 0.4 | % | ||||||||||||||
| Polytec Asset Holdings, Ltd. | 5/5/06 | 4,007,795 | 4,392,535 | 0.6 | % | ||||||||||||||
| $ | 9,872,483 | $ | 11,412,991 | 1.4 | % | ||||||||||||||
| The Portfolio has registration rights for certain restricted securities held as of December 31, 2006. The issuer incurs all registration costs. | |||||||||||||||||||
14 Janus Aspen Series December 31, 2006
Notes to Financial Statements
The following section describes the organization and significant accounting policies and provides more detailed information about the schedules and tables that appear throughout this report. In addition, the Notes to Financial Statements explain the methods used in preparing and presenting this report.
1. ORGANIZATION AND SIGNIFICANT ACCOUNTING POLICIES
Janus Aspen Mid Cap Growth Portfolio (the "Portfolio") is a series fund. The Portfolio is part of Janus Aspen Series (the "Trust"), which is organized as a Delaware statutory trust and is registered under the Investment Company Act of 1940 (the "1940 Act") as an open-end management investment company. The Trust offers seventeen Portfolios, which include multiple series of shares, with differing investment objectives and policies. The Portfolio invests primarily in equity securities. The Portfolio is classified as diversified, as defined in the 1940 Act. The Portfolio is a no-load investment.
The Portfolio currently offers two classes of shares: Institutional Shares and Service Shares. Institutional Shares are offered only in connection with investment in and payments under variable insurance contracts and to qualified retirement plans. Service Shares are offered only in connection with investment in and payments under variable insurance contracts and to qualified retirement plans that require a fee from Portfolio assets to procure distribution and administrative services to contract owners and plan participants.
The following accounting policies have been consistently followed by the Portfolio and are in conformity with accounting principles generally accepted in the United States of America in the investment company industry.
Investment Valuation
Securities are valued at the last sales price or the official closing price for securities traded on a principal securities exchange (U.S. or foreign) and on the NASDAQ National Market. Securities traded on over-the-counter markets and listed securities for which no sales are reported are valued at the latest bid price (or yield equivalent thereof) obtained from one or more dealers transacting in a market for such securities or by a pricing service approved by the Portfolio's Trustees. Short-term securities with maturities of 60 days or less may be valued at amortized cost, which approximates market value. Debt securities with a remaining maturity of greater than 60 days are valued in accordance with the evaluated bid price supplied by the pricing service. The evaluated bid price supplied by the pricing service is an evaluation that reflects such factors as security prices, yields, maturities and ratings. Foreign securities and currencies ar e converted to U.S. dollars using the applicable exchange rate in effect as of the daily close of the New York Stock Exchange ("NYSE"). When market quotations are not readily available or deemed unreliable, or events or circumstances that may affect the value of portfolio securities held by the Portfolio are identified between the closing of their principal markets and the time the net asset value ("NAV") is determined, securities may be valued at fair value as determined in good faith under procedures established by and under the supervision of the Portfolio's Trustees. The Portfolio may use a systematic fair valuation model provided by an independent third party to value international equity securities in order to adjust for stale pricing, which may occur between the close of certain foreign exchanges and the NYSE.
Investment Transactions and Investment Income
Investment transactions are accounted for as of the date purchased or sold (trade date). Dividend income is recorded on the ex-dividend date. Certain dividends from foreign securities will be recorded as soon as the Trust is informed of the dividend if such information is obtained subsequent to the ex-dividend date and may be subject to withholding taxes in these jurisdictions. Interest income is recorded on the accrual basis and includes amortization of premiums and accretion of discounts. Gains and losses are determined on the identified cost basis, which is the same basis used for federal income tax purposes. Income, as well as gains and losses, both realized and unrealized, are allocated daily to each class of shares based upon the ratio of net assets represented by each class as a percentage of total net assets.
Expenses
The Portfolio bears expenses incurred specifically on its behalf as well as a portion of general expenses. Each class of shares bears expenses incurred specifically on its behalf and, in addition, each class bears a portion of general expenses, which may be based upon relative net assets of each class. Expenses are allocated daily to each class of shares based upon the ratio of net assets represented by each class as a percentage of total net assets. Expenses directly attributable to a specific class of shares are charged against the operations of such class.
Securities Lending
Under procedures adopted by the Trustees, the Portfolio may lend securities to qualified parties (typically brokers or other financial institutions) who need to borrow securities in order to complete certain transactions such as covering short sales, avoiding failures to deliver securities or completing arbitrage activities. The Portfolio may seek to earn additional income through securities lending. There is the risk of delay in recovering a loaned security or the risk of loss in collateral rights if the borrower fails financially. In addition, Janus Capital Management LLC ("Janus Capital") makes efforts to balance the benefits and risks from granting such loans.
The Portfolio does not have the right to vote on securities while they are being lent; however, the Portfolio may attempt
Janus Aspen Series December 31, 2006 15
Notes to Financial Statements (continued)
to call back the loan and vote the proxy. All loans will be continuously secured by collateral which may consist of cash, U.S. Government securities, domestic and foreign short-term debt instruments, letters of credit, money market mutual funds or other money market accounts, or such other collateral permitted by the Securities and Exchange Commission ("SEC") Cash collateral may be invested in affiliated money market funds or other accounts advised by Janus Capital to the extent consistent with exemptive relief obtained from the SEC or as permitted by the 1940 Act and rules promulgated thereunder. Cash collateral may also be invested in unaffiliated money market funds or other accounts advised by Janus Capital to the extent consistent with exemptive relief obtained from the SEC or as permitted by the 1940 Act and rules promulgated thereunder. Cash collateral may also be invested in unaffiliated money market funds or other accounts.
State Street Bank and Trust Company (the "Lending Agent") may also invest the cash collateral in the State Street Navigator Securities Lending Prime Portfolio or investments in unaffiliated money market funds or accounts, mutually agreed to by the Portfolio and the Lending Agent, that comply with Rule 2a-7 under the 1940 Act relating to money market funds.
As of December 31, 2006, the Portfolio had on loan securities valued as indicated:
| Portfolio | Value at December 31, 2006 | ||||||
| Janus Aspen Mid Cap Growth Portfolio | $ | 85,201,089 | |||||
As of December 31, 2006, the Portfolio received cash collateral for securities lending activity as indicated:
| Portfolio | Cash Collateral at December 31, 2006 | ||||||
| Janus Aspen Mid Cap Growth Portfolio | $ | 87,176,659 | |||||
As of December 31, 2006, all cash collateral received by the Portfolio was invested in the State Street Navigator Securities Lending Prime Portfolio.
The value of the collateral must be at least 102% of the market value of the loaned securities that are denominated in U.S. dollars and 105% of the market value of the loaned securities that are not denominated in U.S. dollars. Loaned securities and related collateral are marked-to-market each business day based upon the market value of the respective securities at the close of business, employing the most recent available pricing information. Collateral levels are then adjusted based upon this mark-to-market evaluation.
The borrower pays fees at the Portfolio's direction to its Lending Agent. The Lending Agent may retain a portion of the interest earned. The cash collateral invested by the Lending Agent is disclosed in the Schedule of Investments. The lending fees and the Portfolio's portion of the interest income earned on cash collateral are included on the Statement of Operations (if applicable).
Interfund Lending
Pursuant to an exemptive order received from the SEC, the Portfolio may be party to an interfund lending agreement between the Portfolio and other Janus Capital sponsored mutual funds, which permits it to borrow or lend cash at a rate beneficial to both the borrowing and lending funds. Outstanding borrowings from all sources totaling 10% or more of the borrowing Portfolio's total assets must be collateralized at 102% of the outstanding principal value of the loan; loans of less than 10% may be unsecured. During the fiscal year ended December 31, there were no outstanding interfund borrowing or lending arrangements for the Portfolio.
Forward Currency Transactions
The Portfolio may enter into forward currency contracts in order to reduce its exposure to changes in foreign currency exchange rates on its foreign portfolio holdings and to lock in the U.S. dollar cost of firm purchase and sale commitments for securities denominated in or exposed to foreign currencies. A forward currency exchange contract is a commitment to purchase or sell a foreign currency at a future date at a negotiated rate. The gain or loss arising from the difference between the U.S. dollar cost of the original contract and the value of the foreign currency in U.S. dollars upon closing a contract is included in "Net realized gain/(loss) from foreign currency transactions" on the Statement of Operations (if applicable).
Forward currency contracts held by the Portfolio are fully collateralized by other securities, which are denoted in the accompanying Schedule of Investments (if applicable). The collateral is evaluated daily to ensure its market value equals or exceeds the current market value of the corresponding forward currency contracts. As of December 31, 2006, the Portfolio was not invested in forward currency contracts.
Futures Contracts
The Portfolio may enter into futures contracts. The Portfolio intends to use such derivative instruments primarily to hedge or protect from adverse movements in securities prices, currency rates or interest rates. The use of futures contracts may involve risks such as the possibility of illiquid markets or imperfect correlation between the value of the contracts and the underlying securities, or that the counterparty will fail to perform its obligations.
Futures contracts are marked-to-market daily, and the daily variation margin is recorded as a receivable or payable on the Statement of Assets and Liabilities (if applicable). When a contract is closed, a realized gain or loss is recorded on the Statement of Operations equal to the difference between the opening and closing value of the contract. Generally, futures contracts are marked-to-market (i.e., treated as realized and subject to distribution) for federal income tax purposes at fiscal year end. Securities designated as collateral for market value on futures contracts are noted in the Schedule of Investments Such collateral is in the possession of the
16 Janus Aspen Series December 31, 2006
Portfolio's custodian. As of December 31, 2006, the Portfolio was not invested in futures contracts.
Short Sales
The Portfolio may engage in "short sales against the box." Short sales against the box involve selling either a security that the Portfolio owns, or a security equivalent in kind and amount to the security sold short that the Portfolio has the right to obtain, for delivery at a specified date in the future. The Portfolio may enter into a short sale against the box to hedge against anticipated declines in the market price of portfolio securities. If the value of the securities sold short increases prior to the scheduled delivery date, the Portfolio loses the opportunity to participate in the gain.
The Portfolio may also engage in "naked" short sales. Naked short sales involve the Portfolio selling a security it does not own to a purchaser at a specified price. To complete the transaction, the Portfolio must borrow the security to deliver it to the purchaser and buy that same security in the market to return it to the lender. Although the potential for gain is limited to the difference between the price at which the Portfolio sold the security short and the cost of borrowing the security, its potential for loss could be unlimited because there is no limit to the replacement cost of the borrowed security. There is no assurance that the Portfolio will be able to close out a short position at any particular time or at an acceptable price. A gain or a loss will be recognized upon termination of a short sale. There is no limit on the size of any loss that the Portfolio may recognize upon termination of a short sale. Short sales held by the Portfolio are fully collateralized by other securities, which are denoted in the accompanying Schedule of Investments (if applicable). As of December 31, 2006, the Portfolio was not invested in short sales.
Foreign Currency Translations
The Portfolio does not isolate that portion of the results of operations resulting from changes in foreign exchange rates on investments from the fluctuations arising from changes in market prices of securities held at the date of the financial statements. Net unrealized appreciation or depreciation on investments and foreign currency translation arise from changes in the value of assets and liabilities, including investments in securities held at the date of the financial statements, resulting from changes in the exchange rates and changes in market prices of securities held.
Currency gains and losses are also calculated on payables and receivables that are denominated in foreign currencies. The payables and receivables are generally related to security transactions and income.
Foreign-denominated assets and forward currency contracts may involve more risks than domestic transactions, including currency risk, political and economic risk, regulatory risk and market risk. Risks may arise from the potential inability of a counterparty to meet the terms of a contract and from unanticipated movements in the value of foreign currencies relative to the U.S. dollar.
When-issued Securities
The Portfolio may purchase or sell securities on a when-issued or forward commitment basis. The price of the underlying securities and date when the securities will be delivered and paid for are fixed at the time the transaction is negotiated. Losses may arise due to changes in the market value of the securities or from the inability of counterparties to meet the terms of the contract. In connection with such purchases, the Portfolio may hold liquid assets as collateral with the Portfolio's custodian sufficient to cover the purchase price. As of December 31, 2006, the Portfolio was not invested in when-issued securities.
Equity-Linked Structured Notes
The Portfolio may invest in equity-linked structured notes. Equity-linked structured notes are derivative securities which are specially designed to combine the characteristics of one or more underlying securities and their equity derivatives in a single note form. The return and/or yield or income component may be based on the performance of the underlying equity securities, an equity index, and/or option positions. Equity-linked structured notes are typically offered in limited transactions by financial institutions in either registered or nonregistered form. An investment in equity-linked structured notes creates exposure to the credit risk of the issuing financial institution, as well as to the market risk of the underlying securities. There is no guaranteed return of principal with these securities and the appreciation potential of these securities may be limited by a maximum payment or call right. In certain cases, equity-linked struct ured notes may be more volatile and less liquid than less complex securities or other types of fixed-income securities. Such securities may exhibit price behavior that does not correlate with other fixed-income securities.
Initial Public Offerings
The Portfolio may invest in initial public offerings ("IPOs"). IPOs and other investment techniques may have a magnified performance impact on a fund with a small asset base. The Portfolio may not experience similar performance as its assets grow.
Additional Investment Risk
The Portfolio may be invested in lower-rated debt securities that have a higher risk of default or loss of value since these securities may be sensitive to economic changes, political changes or adverse developments specific to the issuer.
Restricted Security Transactions
Restricted securities held by the Portfolio may not be sold except in exempt transactions or in a public offering registered under the Securities Act of 1933. The risk of investing in such securities is generally greater than the risk of investing in the securities of widely held, publicly traded companies. Lack of a secondary market and resale restrictions may result in the inability of the Portfolio to sell a security at a fair price and may substantially delay the sale of the security. In addition, these securities may exhibit greater price volatility than securities for which secondary markets exist.
Janus Aspen Series December 31, 2006 17
Notes to Financial Statements (continued)
Dividend Distributions
The Portfolio generally makes semiannual distributions of substantially all of its investment income and an annual distribution of its net realized capital gains (if any). The majority of dividends and net realized capital gains distributions from the Portfolio may be automatically reinvested into additional shares of the Portfolio, based upon the discretion of the shareholder.
Estimates
The preparation of financial statements in conformity with accounting principles generally accepted in the United States of America requires management to make estimates and assumptions that affect the reported amount of assets and liabilities and disclosure of contingent assets and liabilities at the date of the financial statements and the reported amounts of income and expenses during the reporting period. Actual results could differ from those estimates.
Federal Income Taxes
No provision for income taxes is included in the accompanying financial statements, as the Portfolio intends to distribute to shareholders all taxable investment income and realized gains and otherwise comply with Subchapter M of the Internal Revenue Code applicable to regulated investment companies.
New Accounting Pronouncements
In July 2006, the Financial Accounting Standards Board ("FASB") issued interpretation No. 48, "Accounting for Uncertainty in Income Taxes – an Interpretation of FASB Statement No. 109" (the "Interpretation"). The Interpretation establishes for all entities, including pass-through entities such as the Portfolio, a minimum threshold for financial statement recognition of the benefit of positions taken in filing tax returns (including whether an entity is taxable in a particular jurisdiction), and requires certain expanded tax disclosures. A calendar year open-end or closed-end fund would implement the Interpretation no later than June 20, 2007 (the last business day of the semi-annual reporting period) and will also apply to all open tax years as of the date of effectiveness. Management has recently begun to evaluate the application of the Interpretation to the Portfolio, and is not in a position at this time to estimate the significance of its impact, if any, on the Portfolio's financial statements.
In September 2006, the FASB issued Statement of Financial Accounting Standards No. 157, "Fair Value Measurements" ("SFAS No. 157"), which defines fair value, establishes a framework for measuring fair value in generally accepted accounting principles, and expands disclosures about fair value measurements. SFAS No. 157 does not require new fair value measurements, but is applied to the extent that other accounting pronouncements require or permit fair value measurements. SFAS No. 157 emphasizes that fair value is a market-based measurement that should be determined based on the assumptions that market participants would use in pricing an asset or liability. Companies will be required to disclose the extent to which fair value is used to measure assets and liabilities, the inputs used to develop the measurements, and the effect for fiscal years beginning after November 15, 2007. Management is currently evaluating the potential impact the adoption of SFAS No. 157 will have on the Portfolio's financial condition and results of operations.
2. INVESTMENT ADVISORY AGREEMENTS AND OTHER TRANSACTIONS WITH AFFILIATES
The Portfolio pays a monthly advisory fee to Janus Capital based upon average daily net assets and calculated at the annual rate of 0.64%.
Janus Services LLC ("Janus Services"), a wholly-owned subsidiary of Janus Capital, is the Portfolio's transfer agent. Janus Services receives certain out-of-pocket expenses for transfer agent services.
Certain officers of the Portfolio may also be officers and/or directors of Janus Capital. Such officers receive no compensation from the Portfolio, except for the Portfolio's Chief Compliance Officer. Effective January 1, 2006, the Portfolio began reimbursing the adviser for a portion of the compensation paid to the Chief Compliance Officer of the Trust. Total compensation of $1,304 was paid by the Portfolio during the fiscal year ended December 31, 2006. The Portfolio's portion is reported as part of "Other Expenses" on the Statement of Operations.
The Board of Trustees has adopted a deferred compensation plan (the "Deferred Plan") for independent Trustees to elect to defer receipt of all or a portion of the annual compensation they are entitled to receive from the Portfolio. All deferred fees are credited to an account established in the name of the Trustees. The amounts credited to the account then increase or decrease, as the case may be, in accordance with the performance of one or more of the Janus funds that are selected by the Trustees. The account balance continues to fluctuate in accordance with the performance of the selected fund or funds until final payment of all amounts credited to the account. Trustees are allowed to change their designation of mutual funds from time to time. Amounts will be deferred until distributed in accordance to the Deferred Plan. No deferred fees were paid to any Trustee under the Deferred Plan during the fiscal year ended December 31, 2006.
During the fiscal year ended December 31, 2005, Janus Capital reimbursed the Portfolio $7,570 for Institutional Shares and $3,118 for Service Shares, as a result of dilutions caused by certain trading and/or pricing errors. Reimbursements are included in "Payment from affiliate" on the Statements of Changes in Net Assets.
During the fiscal year ended December 31, 2005, Janus Services reimbursed the Portfolio $2 for Service Shares, as a result of dilutions caused by incorrectly processed shareholder activity. Reimbursements are included in "Payment from affiliate" on the Statements of Changes in Net Assets.
For the fiscal year ended December 31, 2006, Janus Capital assumed $21,288 of legal, consulting and Trustee costs and fees incurred by the funds in Janus Investment Fund, Janus Aspen Series and Janus Adviser Series (the "Funds") in connection with the regulatory and civil litigation matters discussed in Note 6. These non-recurring costs were allocated to all Funds based upon the Funds' respective net assets as of July 31, 2004. Additionally, all future non-recurring costs will be allocated
18 Janus Aspen Series December 31, 2006
based upon the Funds' respective net assets on July 31, 2004. These non-recurring costs and costs assumed by Janus Capital are shown on the Statement of Operations.
Janus Distributors LLC, a wholly-owned subsidiary of Janus Capital, is a distributor of the Portfolio. Service Shares have adopted a Distribution and Shareholder Servicing Plan (the "Plan") pursuant to Rule 12b-1 under The 1940 Act. The Plan authorizes payments by the Portfolio in connection with the distribution of Service Shares at an annual rate of up to 0.25% of Service Shares' average daily net assets.
The Portfolio's expenses may be reduced by expense offsets from an unaffiliated custodian and/or transfer agent. Such credits or offsets are included in Expense and Fee Offset on the Statement of Operations. The transfer agent fee offsets received during the period reduce Transfer Agent Fees and Expenses. Custodian offsets received reduce Custodian Fees. The Portfolio could have employed the assets used by the custodian and/or transfer agent to produce income if it had not entered into an expense offset arrangement.
The Portfolio may invest in money market funds, including funds managed by Janus Capital. During the fiscal year ended December 31, 2006, the Portfolio recorded distributions from affiliated investment companies as affiliated dividend income, and had the following purchases and sales:
| Purchases Shares/Cost | Sales Shares/Cost | Dividend Income | Value at 12/31/06 | ||||||||||||||||
| Janus Aspen Mid Cap Growth Portfolio | |||||||||||||||||||
| Janus Government Money Market Fund | $ | 4,245,440 | $ | 4,245,440 | $ | 2,686 | $ | – | |||||||||||
| Janus Institutional Cash Reserves Fund | 47,472,391 | 44,274,562 | 71,271 | 3,197,829 | |||||||||||||||
| Janus Money Market Fund | 47,409,020 | 47,409,020 | 169,276 | – | |||||||||||||||
| $ | 99,126,851 | $ | 95,929,022 | $ | 243,233 | $ | 3,197,829 | ||||||||||||
3. FEDERAL INCOME TAX
The tax components of capital shown in the table below represent: (1) distribution requirements the Portfolio must satisfy under the income tax regulations; (2) losses or deductions the Portfolio may be able to offset against income and gains realized in future years; and (3) unrealized appreciation or depreciation of investments for federal income tax purposes.
In 2006, the Portfolio incurred "Post-October" losses during the period from November 1, 2006 through December 31, 2006. These losses will be deferred for tax purposes and recognized in 2007.Other book to tax differences in the current year primarily consist of foreign currency contract adjustments. The Portfolio has elected to treat gains and losses on forward foreign currency contracts as capital gains and losses. Other foreign currency gains and losses on debt instruments are treated as ordinary income for federal income tax purposes pursuant to Section 988 of the Internal Revenue Code.
Accumulated capital losses noted below represent net capital loss carryovers, as of December 31, 2006, that may be available to offset future realized capital gains and thereby reduce future taxable gains distributions.
| Portfolio | Undistributed Ordinary Income | Undistributed Long-Term Gains | Accumulated Capital Losses | Post October Deferral | Other Book to Tax Differences | Net Tax Appreciation/ (Depreciation) | |||||||||||||||||||||
| Janus Aspen Mid Cap Growth Portfolio(1) | $ | – | $ | 4,554,551 | $ | (377,109,157 | ) | $ | (391 | ) | $ | – | $ | 253,713,380 | |||||||||||||
(1) Capital Loss Carryover is subject to annual limitations.
The table below shows the expiration dates of the carryovers.
Capital Loss Carryover Expiration Schedule
For the year ended December 31, 2006
| Portfolio | December 31, 2009 | December 31, 2010 | December 31, 2011 | ||||||||||||
| Janus Aspen Mid Cap Growth Portfolio(1) | $ | (299,853,441 | ) | $ | (53,089,575 | ) | $ | (24,166,141 | ) | ||||||
(1) Capital Loss Carryover is subject to annual limitations.
During the year ended December 31, 2006, the following capital loss carryover was utilized by the Portfolio as indicated in the table below.
| Portfolio | Capital Loss Carryover Utilized | ||||||
| Janus Aspen Mid Cap Growth Portfolio | $ | 121,136,366 | |||||
Janus Aspen Series December 31, 2006 19
Notes to Financial Statements (continued)
The aggregate cost of investments and the composition of unrealized appreciation and depreciation of investment securities for federal income tax purposes as of December 31, 2006 are noted below.
Unrealized appreciation and unrealized depreciation in the table below exclude appreciation/depreciation on foreign currency translations. The primary difference between book and tax appreciation or depreciation of investments is wash sale loss deferrals.
| Portfolio | Federal Tax Cost | Unrealized Appreciation | Unrealized (Depreciation) | ||||||||||||
| Janus Aspen Mid Cap Growth Portfolio | $ | 608,432,089 | $ | 266,617,252 | $ | (12,903,872 | ) | ||||||||
Income and capital gains distributions are determined in accordance with income tax regulations that may differ from accounting principles generally accepted in the United States of America. These differences are due to differing treatments for items such as net short-term gains, deferral of wash sale losses, foreign currency transactions, net investment losses and capital loss carryovers. Certain permanent differences such as tax returns of capital and net investment losses noted below have been reclassified to paid-in capital.
| For the fiscal year ended December 31, 2006 | Distributions | ||||||||||||||||||
| Portfolio | From Ordinary Income | From Long-Term Capital Gains | Tax Return of Capital | Net Investment Loss | |||||||||||||||
| Janus Aspen Mid Cap Growth Portfolio | $ | – | $ | – | $ | – | $ | (511,307 | ) | ||||||||||
| For the fiscal year ended December 31, 2005 | Distributions | ||||||||||||||||||
| Portfolio | From Ordinary Income | From Long-Term Capital Gains | Tax Return of Capital | Net Investment Loss | |||||||||||||||
| Janus Aspen Mid Cap Growth Portfolio | $ | – | $ | – | $ | – | $ | (612,343 | ) | ||||||||||
4. CAPITAL SHARE TRANSACTIONS
| For the fiscal year ended December 31 | Janus Aspen Mid Cap Growth Portfolio | ||||||||||
| (all numbers are in thousands) | 2006 | 2005 | |||||||||
| Transactions in Portfolio Shares – Institutional Shares | |||||||||||
| Shares sold | 1,390 | 1,755 | |||||||||
| Reinvested dividends and distributions | – | – | |||||||||
| Shares repurchased | (3,855 | ) | (30,080 | ) | |||||||
| Net Increase/(Decrease) in Portfolio Shares | (2,465 | ) | (28,325 | ) | |||||||
| Shares Outstanding, Beginning of Period | 18,332 | 46,657 | |||||||||
| Shares Outstanding, End of Period | 15,867 | 18,332 | |||||||||
| Transactions in Portfolio Shares – Service Shares: | |||||||||||
| Shares sold | 831 | 1,762 | |||||||||
| Reinvested dividends and distributions | – | – | |||||||||
| Shares repurchased | (1,946 | ) | (2,222 | ) | |||||||
| Net Increase/(Decrease) in Portfolio Shares | (1,115 | ) | (460 | ) | |||||||
| Shares Outstanding, Beginning of Period | 9,020 | 9,480 | |||||||||
| Shares Outstanding, End of Period | 7,905 | 9,020 | |||||||||
5. PURCHASES AND SALES OF INVESTMENT SECURITIES
For the fiscal year ended December 31, 2006, the aggregate cost of purchases and proceeds from sales of investment securities (excluding short-term securities) were as follows:
| Portfolio | Purchases of Securities | Proceeds from Sales of Securities | Purchases of Long- Term U.S. Government Obligations | Proceeds from Sales of Long-Term U.S. Government Obligations | |||||||||||||||
| Janus Aspen Mid Cap Growth Portfolio | $ | 317,509,522 | $ | 424,869,282 | $ | – | $ | – | |||||||||||
20 Janus Aspen Series December 31, 2006
6. PENDING LEGAL MATTERS
In the fall of 2003, the Securities and Exchange Commission ("SEC"), the Office of the New York State Attorney General ("NYAG"), the Colorado Attorney General ("COAG"), and the Colorado Division of Securities ("CDS") announced that they were investigating alleged frequent trading practices in the mutual fund industry. On August 18, 2004, Janus Capital announced that it had reached final settlements with the SEC, the NYAG, the COAG, and the CDS related to such regulators' investigations into Janus Capital's frequent trading arrangements.
A number of civil lawsuits were brought against Janus Capital and certain of its affiliates, the Janus funds, and related entities and individuals based on allegations similar to those announced by the above regulators and were filed in several state and federal jurisdictions. Such lawsuits alleged a variety of theories for recovery including, but not limited to, the federal securities laws, other federal statutes (including ERISA), and various common law doctrines. The Judicial Panel on Multidistrict Litigation transferred these actions to the U.S. District Court for the District of Maryland (the "Court") for coordinated proceedings. On September 29, 2004, five consolidated amended complaints were filed with the Court that generally include: (i) claims by a putative class of investors in certain Janus funds asserting claims on behalf of the investor class (Marini, et al. v. Janus Investment Fund, et al., U.S. District Court, District of Maryland, Case No. 04-CV-00497); (ii) derivative claims by investors in certain Janus funds ostensibly on behalf of such funds (Steinberg et al. v. Janus Capital Management, LLC et al., U.S. District Court, District of Maryland, Case No. 04-CV-00518); (iii) claims on behalf of participants in the Janus 401(k) plan (Wangberger v. Janus Capital Group Inc., 401(k) Advisory Committee, et al., U.S. District Court, District of Maryland, Case No. JFM-05-2711); (iv) claims brought on behalf of shareholders of Janus Capital Group Inc. ("JCGI") on a derivative basis against the Board of Directors of JCGI (Chasen v. Whiston, et al., U.S. District Court, District of Maryland, Case No. 04-MD-00855); and (v) claims by a putative class of shareholders of JCGI asserting claims on behalf of the shareholders (Wiggins, et al. v. Janus Capital Group Inc., et al., U.S. District Court, District of Maryland, Case No. 04-CV-00818). In addition, the following were also named as defendants in one or more of the actions: Janus Investment Fund ("JIF"), Janus Aspen Series ("JAS"), Janus Adviser Series ("JAD"), Janus Distributors LLC, Enhanced Investment Technologies, LLC ("INTECH"), Bay Isle Financial LLC ("Bay Isle"), Perkins, Wolf, McDonnell and Company, LLC ("Perkins"), the Advisory Committee of the Janus 401(k) plan, and the current or former directors of JCGI.
On August 25, 2005, the Court entered orders dismissing most of the claims asserted against Janus Capital and its affiliates by fund investors (actions (i) and (ii) described above), except certain claims under Section 10(b) of the Securities Exchange Act of 1934 and under Section 36(b) of the Investment Company Act of 1940, as amended (the "1940 Act"). On August 15, 2006, the complaint in the 401(k) plan class action (action (iii) described above) was dismissed by the district court with prejudice; the plaintiff has appealed that dismissal decision to the United States Court of Appeals for the Fourth Circuit. The Court also dismissed the action against JCGI's Board of Directors without leave to amend (action (iv) described above). Finally, a Motion to Dismiss the action brought by JCGI shareholders (action (v) described above) is fully briefed and pending before the Cou rt.
In addition to the lawsuits described above, the Auditor of the State of West Virginia ("Auditor"), in his capacity as securities commissioner, has initiated administrative proceedings against many of the defendants in the market timing cases (including JCGI and Janus Capital) and, as a part of its relief, is seeking disgorgement and other monetary relief based on similar market timing allegations (In the Matter of Janus Capital Group Inc. et al., Before the Securities Commissioner, State of West Virginia, Summary Order No. 05-1320). The respondents in these proceedings collectively sought a Writ of Prohibition in state court, which was denied. Their subsequent Petition for Appeal was also denied. Consequently, in September 2006, JCGI and Janus Capital filed their answer to the Auditor's summa ry order instituting proceedings and requested a hearing. JCGI and Janus Capital, as well as other similarly situated defendants, continue to challenge the statutory authority of the Auditor to bring such an action. No further proceedings are currently scheduled.
In addition to the "market timing" actions described above, Janus Capital is a defendant in a consolidated lawsuit in the U.S. District Court for the District of Colorado challenging the investment advisory fees charged by Janus Capital to certain Janus funds (Walter Sins, et al. v. Janus Capital Management, LLC, U.S. District Court, District of Colorado, Case No. 04-CV-01647-WDM-MEH; Michael Fleisher, et al. v. Janus Capital Management LLC, 04-CV-02395-MSK-CBS). The action was filed in 2004 by fund investors asserting breach of fiduciary duty under Section 36(b) of the 1940 Act. The plaintiffs seek declaratory and injunctive relief and an unspecified amount of damages. The trial is scheduled to commence on May 21, 2007.
In 2001, Janus Capital's predecessor was also named as a defendant in a class action suit in the U.S. District Court for the Southern District of New York, alleging that certain underwriting firms and institutional investors violated antitrust laws in connection with initial public offerings (Pfeiffer v. Credit Suisse First Boston aka In re Initial Public Offering Antitrust Litigation, U.S. District Court, Southern District of New York, Case No. 01-CV-2014). The U.S. District Court dismissed the plaintiff's antitrust claims in November 2003; however, the U.S. Court of Appeals vacated that decision and remanded it for further proceedings. In March 2006, the defendants, including Janus Capital, filed a Petition for a Writ of Certiorari with the U.S. Supreme Court to review the deci sion of the U.S. Court of Appeals. In June 2006, the U.S. Supreme Court invited the U.S. Solicitor General to file a brief expressing the view of the United States, and in November 2006, the Solicitor General filed a brief expressing its view on the matter. The U.S. Supreme Court has granted the Petition for a Writ of Certiorari and the parties are in the process of briefing the matter for the U.S. Supreme Court.
Additional lawsuits may be filed against certain of the Janus funds, Janus Capital, and related parties in the future. Janus Capital does not currently believe that these pending actions will materially affect its ability to continue providing services it has agreed to provide to the Janus funds.
Janus Aspen Series December 31, 2006 21
Report of Independent Registered Public Accounting Firm
To the Trustees and Shareholders
of Janus Aspen Mid Cap Growth Portfolio
In our opinion, the accompanying statement of assets and liabilities, including the schedule of investments, and the related statements of operations and of changes in net assets and the financial highlights present fairly, in all material respects, the financial position of Janus Aspen Mid Cap Growth Portfolio (one of the portfolios constituting Janus Aspen Series, hereafter referred to as the "Portfolio") at December 31, 2006, the results of its operations for the year then ended, the changes in its net assets for each of the two years in the period then ended, and the financial highlights for the each of the five years in the period then ended, in conformity with accounting principles generally accepted in the United States of America. These financial statements and financial highlights (hereafter referred to as "financial statements") are the responsibility of the Portfolio's management; our responsibility is to express an opinion on the se financial statements based on our audits. We conducted our audits of these financial statements in accordance with the standards of the Public Company Accounting Oversight Board (United States). Those standards require that we plan and perform the audit to obtain reasonable assurance about whether the financial statements are free of material misstatement. An audit includes examining, on a test basis, evidence supporting the amounts and disclosures in the financial statements, assessing the accounting principles used and significant estimates made by management, and evaluating the overall financial statement presentation. We believe that our audits, which included confirmation of securities at December 31, 2006 by correspondence with the custodian, transfer agent and brokers, and the application of alternative auditing procedures where securities purchased had not been received, provide a reasonable basis for our opinion.

PricewaterhouseCoopers LLP
Denver, Colorado
February 12, 2007
22 Janus Aspen Series December 31, 2006
Additional Information (unaudited)
PROXY VOTING POLICIES AND VOTING RECORD
A description of the policies and procedures that the Portfolio uses to determine how to vote proxies relating to its portfolio securities is available: (i) without charge, upon request, by calling 1-800-525-0020 (toll free); (ii) on the Portfolio's website at www.janus.com/proxyvoting; and (iii) on the SEC's website at http://www.sec.gov. Additionally, information regarding the Portfolio's proxy voting record for the most recent twelve-month period ended June 30 is also available, free of charge, through www.janus.com/proxyvoting and from the SEC's website at http://www.sec.gov.
QUARTERLY PORTFOLIO HOLDINGS
The Portfolio files its complete portfolio holdings (schedule of investments) with the SEC for the first and third quarters of each fiscal year on Form N-Q within 60 days of the end of such fiscal quarter. The Portfolio's Form N-Q: (i) is available on the SEC's website at http://www.sec.gov; (ii) may be reviewed and copied at the SEC's Public Reference Room in Washington, D.C. (information on the Public Reference Room may be obtained by calling 1-800-SEC-0330); and (iii) is available without charge, upon request, by calling Janus at 1-800-525-0020 (toll free).
APPROVAL OF ADVISORY AGREEMENTS DURING THE PERIOD
The Trustees of Janus Aspen Series, more than eighty-five percent of whom have never been affiliated with the Adviser ("Independent Trustees"), oversee the management of each of the Portfolios and, as required by law, determine annually whether to continue the investment advisory agreement for each Portfolio and the subadvisory agreements for the three Portfolios that utilize subadvisers.
In connection with their most recent consideration of those agreements for each of the Portfolios, the Trustees received and reviewed a substantial amount of information provided by Janus Capital (the "Adviser") and the respective subadvisers in response to requests of the Independent Trustees and their independent legal counsel. They also received and reviewed a considerable amount of information and analysis provided to the Trustees by their independent fee consultant. Throughout their consideration of the agreements the Independent Trustees were advised by their independent legal counsel. The Independent Trustees met on two separate occasions with management to consider the agreements, and at each of those meetings they also met separately in executive session with their independent legal counsel.
At a meeting held on December 20, 2006, based on their evaluation of the information provided by the Adviser, the subadvisers and the independent fee consultant and other information, the Trustees determined that the overall arrangements between each Portfolio and the Adviser were fair and reasonable in light of the nature, extent and quality of the services provided by the Adviser, its affiliates and the subadvisers, the fees charged for those services, and other matters that the Trustees considered relevant in the exercise of their business judgment. At that meeting all of the Trustees unanimously approved the continuation of the investment advisory agreement for each Portfolio, and the subadvisory agreement for each subadvised Portfolio, for the period from February 1, 2007 through February 1, 2008, subject to earlier termination as provided in each agreement.
In considering the continuation of those agreements, the Trustees reviewed and analyzed various factors that they determined were relevant, including the factors described below, none of which by itself was considered dispositive. However, the material factors and conclusions that formed basis for the Trustees' determination to approve the continuation of the agreements are discussed separately below.
Nature, Extent and Quality of Services
The Trustees reviewed the nature, extent and quality of the services of Janus Capital and the subadvisers to the Funds, taking into account the investment objective and strategy of each Portfolio and the knowledge the Trustees gained from their regular meetings with management on at least a quarterly basis and their ongoing review of information related to the Funds. In addition, the Trustees reviewed the resources and key personnel of Janus Capital and each subadviser, especially those who provide investment management services to the Portfolios. The Trustees also considered other services provided to the Portfolios by Janus Capital or the subadvisers, such as managing the execution of portfolio transactions and the selection of broker-dealers for those transactions, serving as the Portfolios' administrator, monitoring adherence to the Portfolios' investment restrictions, producing shareholder reports, providing support services for the Tru stees and Trustee committees, communicating with shareholders and overseeing the activities of other service providers, including monitoring compliance with various policies and procedures of the Portfolios and with applicable securities laws and regulations.
The Trustees concluded that: the nature, extent and quality of the services provided by Janus Capital or the subadviser to each Portfolio were appropriate and consistent with the terms of the respective advisory and subadvisory agreements; that, taking into account steps taken to address a small portion of the Portfolios whose performance lagged that of their peers for certain periods, the quality of those services had been consistent with or superior to quality norms in the industry; and that the Portfolios were likely to benefit from the continued provision of those services. They also concluded
Janus Aspen Series December 31, 2006 23
Additional Information (unaudited) (continued)
that each of Janus Capital and each subadviser had sufficient personnel, with the appropriate education and experience, to serve the Portfolios effectively and had demonstrated its continuing ability to attract and retain well-qualified personnel.
Performance of the Funds
The Trustees considered the performance results of each Portfolio over various time periods. They reviewed information comparing each Portfolio's performance with the performance of comparable funds and peer groups identified by Lipper Inc., an independent provider of investment company data, and with the Portfolio's benchmark. They concluded that the performance of most Portfolios was good to very good. Although the performance of some Portfolios lagged that of their peers for certain periods, the Trustees also concluded that Janus Capital had taken appropriate steps to address those instances of under-performance and that the more recent performance of most of those Portfolios had been improving.
Costs of Services Provided
The Trustees examined information on the fees and expenses of each Portfolio in comparison to similar information for other comparable funds as provided by Lipper. They also reviewed an analysis of that information provided by their independent fee consultant and noted that the rate of management (investment advisory and administrative) fees for most of the Portfolios, after contractual expense limitations, was below the mean management fee rate of the respective peer group of funds selected by Lipper.
The Trustees considered the methodology used by Janus Capital and each subadviser in determining compensation payable to portfolio managers, the competitive environment for investment management talent and the competitive market for mutual funds in different distribution channels. They concluded that the compensation methodology provided a good alignment of the interests of the portfolio managers with the interests of Portfolio shareholders.
The Trustees also reviewed management fees charged by Janus Capital to its separate account clients and to its subadvised funds (for which Janus Capital provides only portfolio management services). Although in most instances subadvisory and separate account fee rates for various investment strategies were lower than management fees for Portfolios having a similar strategy, the Trustees noted that Janus Capital performs significant additional services for the Portfolios that it does not provide to those other clients, including administrative services, oversight of the Portfolios' other service providers, trustee support, regulatory compliance and numerous other services, and that, in serving the Portfolios, Janus Capital assumes many legal risks that it does not assume in servicing its other clients. Moreover, they noted that the spread between the average fees charged to the Portfolios and the fees that Janus Capital charged to its separate account clients was significantly smaller than the average spread for such fees of other advisers, based on publicly available data and research conducted by their independent fee consultant.
In considering the fees charged by Janus Capital, the Trustees had previously negotiated with Janus Capital a temporary contingent waiver of a portion the investment advisory fee paid by Janus Aspen Worldwide Growth Portfolio to Janus Capital to provide for a possible reduction in the rate of advisory fee payable by the Portfolio for the period July 1, 2006 through January 31, 2007 if the investment performance of the Fund should lag that of its benchmark performance over the applicable performance measurement period. Commencing in February 2007, the previously approved performance-based fee schedule will become operative.
The Trustees reviewed information on the profitability of Janus Capital and its affiliates of their relationships with each Portfolio, as well as an explanation of the methodology utilized in allocating various expenses among the Portfolios and other clients. The Trustees also reviewed the financial statements of Janus Capital's parent company and its corporate structure. In their review, the Trustees considered whether Janus Capital and each subadviser receive adequate incentives to manage the Portfolios effectively. The Trustees recognized that profitability comparisons among fund managers are difficult because very little comparative information is publicly available and profitability of any manager is affected by numerous factors, including the organizational structure of the particular manager, the types of funds and other accounts it manages, possible other lines of business, the methodology for allocating expenses and the manager's ca pital structure and cost of capital. However, based on the information available and taking those factors into account, the Trustees concluded that Janus Capital's profitability with respect to each Portfolio in relation to the services rendered was not unreasonable.
The Trustees concluded that the management fees and other compensation payable by each Fund to Janus Capital and its affiliates, as well as the fees paid by Janus Capital to the subadvisers of subadvised Portfolios, were reasonable in relation to the nature and quality of the services provided, taking into account the fees charged by other advisers for managing comparable mutual funds with similar strategies and the fees Janus Capital and the subadviser charges to other clients. The Trustees also concluded that the overall expense ratio of each Portfolio was reasonable, taking into account the size of the Portfolio, the quality of services provided by Janus Capital and any subadviser, the investment performance of the Portfolio and any expense limitations agreed to by Janus Capital.
24 Janus Aspen Series December 31, 2006
Economies of Scale
The Trustees considered information about the potential for Janus Capital to realize economies of scale as the assets of the Portfolios increase. They noted that, although most Portfolios pay advisory fees at a fixed rate as a percentage of net assets, without any breakpoints, the management fee paid by each Portfolio, after any contractual expense limitations, was below the mean management fee rate of the Portfolio's peer group selected by Lipper; and, for those Portfolios whose expenses are being reduced by the contractual expense limitations of Janus Capital, Janus Capital is subsidizing the Portfolios because they have not reached adequate scale. Moreover, as the assets of many of the Portfolios have declined in the past few years, the Portfolios have benefited from having advisory fee rates that have remained constant rather than increasing as assets decline. In addition, performance fee structures have been implemented for several Port folios that will cause the effective rate of advisory fees payable by such a Portfolio to vary depending on the investment performance of the Portfolio relative to its benchmark; and a few Portfolios have fee schedules with breakpoints and reduced fee rates above certain asset levels. The Trustees also noted that the Portfolios share directly in economies of scale through lower charges of third-party service providers based on the combined scale of all of the Portfolios. Based on all of the information they reviewed, the Trustees concluded that the current fee structure of each Portfolio was reasonable and that the current rates of fees do reflect a sharing between Janus Capital and the Portfolio of economies of scale at the current asset level of the Portfolio.
Other Benefits to Janus Capital
The Trustees also considered benefits that accrue to Janus Capital and its affiliates from their relationships with the Portfolios. They recognized that two affiliates of Janus Capital separately serve the Portfolios as transfer agent and distributor, respectively, and that the transfer agent receives compensation from the non-money market Portfolios for services provided. The Trustees also considered Janus Capital's use of commissions paid by Portfolios on their portfolio brokerage transactions to obtain proprietary research products and services benefiting the Portfolios and/or other clients of Janus Capital, as well as Janus Capital's agreement not to use any Portfolio's brokerage transactions to obtain third party research products or services. The Trustees concluded that Janus Capital's use of "soft" commission dollars to obtain proprietary research products and services was consistent with regulatory requirements and guidelines and was likely to benefit each Portfolio. The Trustees also concluded that, other than the services provided by Janus Capital and its affiliates pursuant to the agreements and the fees to be paid by each Portfolio therefor, the Portfolios and Janus Capital may potentially benefit from their relationship with each other in other ways. They concluded that Janus Capital benefits from the receipt of proprietary research products and services acquired through commissions paid on portfolio transactions of the Portfolios and that the Portfolios benefit from Janus Capital's receipt of those products and services as well as research products and services acquired through commissions paid by other clients of Janus Capital. They further concluded that success of any Portfolio could attract other business to Janus Capital or other Janus Funds and that the success of Janus Capital could enhance Janus Capital's ability to serve the Portfolios.
After full consideration of the above factors as well as other factors, all of the Trustees, including all of the Independent Trustees, concluded that the proposed continuation of the investment advisory agreement for each applicable Portfolio were in the best interest of the respective Portfolios and their shareholders.
Janus Aspen Series December 31, 2006 25
Explanations of Charts, Tables and
Financial Statements (unaudited)
1. PERFORMANCE OVERVIEWS
The performance overview graph compares the performance of a hypothetical $10,000 investment in the Portfolio with one or more widely used market indices. The hypothetical example does not represent the returns of any particular investment.
When comparing the performance of the Portfolio with an index, keep in mind that market indices do not include brokerage commissions that would be incurred if you purchased the individual securities in the index. They also do not include taxes payable on dividends and interest or operating expenses incurred if you maintained a Portfolio invested in the index.
Average annual total returns are quoted for each class of the Portfolio. Average annual total return is calculated by taking the growth or decline in value of an investment over a period of time, including reinvestment of any dividends, distributions and capital gains, then calculating the annual compounded percentage rate that would have produced the same result had the rate of growth been constant throughout the period. Average annual total return does not reflect the deduction of taxes that a shareholder would pay on Portfolio distributions or redemptions of Portfolio shares.
2. SCHEDULE OF INVESTMENTS
Following the performance overview section is the Portfolio's Schedule of Investments. This schedule reports the industry concentrations and types of securities held in the Portfolio on the last day of the reporting period. Securities are usually listed by type (common stock, corporate bonds, U.S. Government obligations, etc.) and by industry classification (banking, communications, insurance, etc.). Holdings are subject to change without notice.
The value of each security is quoted as of the last day of the reporting period. The values of securities denominated in foreign currencies are converted into U.S. dollars. Certain short-term investments maturing within 60 days are valued at amortized cost, which approximates market value.
A summary of investments by country is provided if the Portfolio invested in foreign securities. This summary reports the Portfolio's exposure to different countries by providing the percentage of securities invested in each country. The country of each security represents the country in which the company is incorporated.
2A. FORWARD CURRENCY CONTRACTS
A table listing forward currency contracts follows the Portfolio's Schedule of Investments (if applicable). Forward currency contracts are agreements to deliver or receive a preset amount of currency at a future date. Forward currency contracts are used to hedge against foreign currency risk in the Portfolio's long-term holdings. The table provides the name of the foreign currency, the settlement date of the contract, the amount of the contract, the value of the currency in U.S. dollars and the amount of unrealized gain or loss. The amount of unrealized gain or loss reflects the change in currency exchange rates from the time the contract was opened to the last day of the reporting period.
2B. FUTURES
A table listing futures contracts follows the Portfolio's Schedule of Investments (if applicable). Futures contracts are contracts that obligate the buyer to receive and the seller to deliver an instrument or money at a specified price on a specified date. Futures are used to hedge against adverse movements in securities prices, currency risk or interest rates.
The table provides the name of the contract, number of contracts held, the expiration date, the principal amount, value and the amount of unrealized gain or loss. The amount of unrealized gain or loss reflects the marked-to-market amount for the last day of the reporting period.
3. STATEMENT OF ASSETS AND LIABILITIES
This statement is often referred to as the "balance sheet." It lists the assets and liabilities of the Portfolio on the last day of the reporting period.
The Portfolio's assets are calculated by adding the value of the securities owned, the receivable for securities sold but not yet settled, the receivable for dividends declared but not yet received on stocks owned and the receivable for Portfolio shares sold to investors but not yet settled. The Portfolio's liabilities include payables for securities purchased but not yet settled, Portfolio shares redeemed but not yet paid and expenses owed but not yet paid. Additionally, there may be other assets and liabilities such as unrealized gain or loss on forward currency contracts.
The section entitled "Net Assets Consist of" breaks down the components of the Portfolio's net assets. Because the Portfolio must distribute substantially all earnings, you will notice that a significant portion of net assets is shareholder capital.
The last section of this statement reports the net asset value ("NAV") per share on the last day of the reporting period for each class of the Portfolio. The NAV is calculated by dividing the Portfolio's net assets (assets minus liabilities) by the number of shares outstanding.
4. STATEMENT OF OPERATIONS
This statement details the Portfolio's income, expenses, gains and losses on securities and currency transactions, and appreciation or depreciation of current Portfolio holdings. The first section in this statement, entitled "Investment Income," reports the dividends earned from stocks and interest earned from interest-bearing securities in the Portfolio.
26 Janus Aspen Series December 31, 2006
The next section reports the expenses and expense offsets incurred by the Portfolio, including the advisory fee paid to the investment adviser, transfer agent fees and expenses, and printing and postage for mailing statements, financial reports and prospectuses. Expense offsets, if any, are also shown.
The last section lists the increase or decrease in the value of securities held in the Portfolio. The Portfolio realizes a gain (or loss) when it sells its position in a particular security. An unrealized gain (or loss) refers to the change in net appreciation or depreciation of the Portfolio during the reporting period. "Net Realized and Unrealized Gain/(Loss) on Investments" is affected both by changes in the market value of Portfolio holdings and by gains (or losses) realized during the reporting period.
5. STATEMENT OF CHANGES IN NET ASSETS
This statement reports the increase or decrease in the Portfolio's net assets during the reporting period. Changes in the Portfolio's net assets are attributable to investment operations, dividends, distributions and capital share transactions. This is important to investors because it shows exactly what caused the Portfolio's net asset size to change during the period.
The first section summarizes the information from the Statement of Operations regarding changes in net assets due to the Portfolio's investment performance. The Portfolio's net assets may also change as a result of dividend and capital gains distributions to investors. If investors receive their dividends in cash, money is taken out of the Portfolio to pay the distribution. If investors reinvest their dividends, the Portfolio's net assets will not be affected. If you compare the Portfolio's "Net Decrease from Dividends and Distributions" to the "Reinvested dividends and distributions," you will notice that dividend distributions had little effect on the Portfolio's net assets. This is because the majority of Janus investors reinvest their distributions.
The reinvestment of dividends is included under "Capital Share Transactions." "Capital Shares" refers to the money investors contribute to the Portfolio through purchases or withdraw via redemptions. The Portfolio's net assets will increase and decrease in value as investors purchase and redeem shares from the Portfolio.
6. FINANCIAL HIGHLIGHTS
This schedule provides a per-share breakdown of the components that affect the Portfolio's NAV for current and past reporting periods for each class of the Portfolio. Not only does this table provide you with total return, it also reports total distributions, asset size, expense ratios and portfolio turnover rate.
The first line in the table reflects the NAV per share at the beginning of the reporting period. The next line reports the net investment income per share, which comprises dividends and interest income earned on securities held by the Portfolio. Following is the total of gains/(losses), realized and unrealized. Dividends and distributions are then subtracted to arrive at the NAV per share at the end of the period. The next line reflects the average annual total return reported the last day of the period.
Also included are the expense ratios, or the percentage of net assets that are used to cover operating expenses during the period. Expense ratios vary for a number of reasons, including the differences in management fees, the average shareholder account size and the extent of foreign investments, which entail greater transaction costs.
The Portfolio's expenses may be reduced through expense reduction arrangements. These arrangements may include the use of balance credits or transfer agent fee offsets. The Statement of Operations reflects total expenses before any such offset, the amount of offset and the net expenses. The expense ratios listed in the Financial Highlights reflect total expenses prior to any expense offsets (gross expense ratio) and after the expense offsets (net expense ratio). Both expense ratios reflect expenses after waivers (reimbursements), if applicable.
The ratio of net investment income/(loss) summarizes the income earned less expenses, divided by the average net assets of the Portfolio during the reporting period. Don't confuse this ratio with the Portfolio's yield. The net investment income ratio is not a true measure of the Portfolio's yield because it doesn't take into account the dividends distributed to the Portfolio's investors.
The next ratio is the portfolio turnover rate, which measures the buying and selling activity in a Portfolio. Portfolio turnover is affected by market conditions, changes in the asset size of a Portfolio, the nature of the Portfolio's investments and the investment style of the portfolio manager. A 100% rate implies that an amount equal to the value of the entire portfolio is turned over in a year; a 50% rate means that an amount equal to the value of half the portfolio is traded in a year; and a 200% rate means that an amount equal to the value of the portfolio is traded every six months.
Janus Aspen Series December 31, 2006 27
Trustees and Officers (unaudited)
The Portfolio's Statement of Additional Information includes additional information about the Trustees and officers and is available, without charge, by calling 1-800-525-0020.
The following are the Trustees and officers of the Trust, together with a brief description of their principal occupations during the last five years (principal occupations for certain Trustees may include periods over five years).
Each Trustee has served in that capacity since he or she was originally elected or appointed. The Trustees do not serve a specified term of office. Each Trustee will hold office until the termination of the Trust or his or her earlier death, resignation, retirement, incapacity or removal. The retirement age for Trustees is 72. The Portfolio's Nominating and Governance Committee will consider nominees for the position of Trustee recommended by shareholders. Shareholders may submit the name of a candidate for consideration by the Committee by submitting their recommendations to the Trust's Secretary. Each Trustee is currently a Trustee of two other registered investment companies advised by Janus Capital: Janus Investment Fund and Janus Adviser Series. As of the date of this report, collectively, these three registered investment companies consist of 69 series or funds.
The Trust's officers are elected annually by the Trustees for a one-year term. Certain officers also serve as officers of Janus Investment Fund and Janus Adviser Series. Certain officers of the Portfolio may also be officers and/or directors of Janus Capital. Portfolio officers receive no compensation from the Portfolio, except for the Portfolio's Chief Compliance Officer, as authorized by the Trustees.
Trustees
| Name, Age and Address | Positions Held with Portfolio | Length of Time Served | Principal Occupations During the Past Five Years | Number of Portfolios in Fund Complex Overseen by Trustee | Other Directorships Held by Trustee | ||||||||||||||||||
| Independent Trustees | |||||||||||||||||||||||
| Dennis B. Mullen 151 Detroit Street Denver, CO 80206 Age 63 | Chairman Trustee | 3/04-Present 9/93-Present | Chief Executive Officer of Red Robin Gourmet Burgers, Inc. (since 2005). Formerly, private investor. | 69 | * | Chairman of the Board (since 2005) and Director of Red Robin Gourmet Burgers, Inc.; and Director of Janus Capital Funds Plc (Dublin-based, non-U.S. funds). | |||||||||||||||||
| Jerome S. Contro 151 Detroit Street Denver, CO 80206 Age 50 | Trustee | 12/05-Present | Partner of Tango Group, a private investment firm (since 1999). | 69 | Trustee and Chairman of RS Investment Trust (since 2001); Director of IZZE Beverages and MyFamily.com, Inc. (genealogical research website). | ||||||||||||||||||
| William F. McCalpin 151 Detroit Street Denver, CO 80206 Age 49 | Trustee | 6/02-Present | Private Investor. Formerly, Vice President of Asian Cultural Council and Executive Vice President and Chief Operating Officer of The Rockefeller Brothers Fund (a private family foundation). | 69 | Director of the F.B. Heron Foundation (a private grantmaking foundation). | ||||||||||||||||||
| John W. McCarter, Jr. 151 Detroit Street Denver, CO 80206 Age 68 | Trustee | 6/02-Present | President and Chief Executive Officer of The Field Museum of Natural History (Chicago, IL). | 69 | Chairman of the Board and Director of Divergence Inc. (biotechnology firm); Director of W.W. Grainger, Inc. (industrial distributor); and Trustee of WTTW (Chicago public television station) and the University of Chicago. | ||||||||||||||||||
28 Janus Aspen Series December 31, 2006
Trustees (cont.)
| Name, Age and Address | Positions Held with Portfolio | Length of Time Served | Principal Occupations During the Past Five Years | Number of Portfolios in Fund Complex Overseen by Trustee | Other Directorships Held by Trustee | ||||||||||||||||||
| Independent Trustees (cont.) | |||||||||||||||||||||||
| James T. Rothe 151 Detroit Street Denver, CO 80206 Age 63 | Trustee | 1/97-Present | Co-founder and Managing Director of Roaring Fork Capital Management, LLC (private investment in public equity firm); and Professor Emeritus of Business of the University of Colorado, Colorado Springs, CO (since 2004). Formerly, Professor of Business of the University of Colorado (2002-2004); and Distinguished Visiting Professor of Business (2001-2002) of Thunderbird University (American Graduate School of International Management), Glendale, AZ. | 69 | Director of Red Robin Gourmet Burgers, Inc. | ||||||||||||||||||
| William D. Stewart 151 Detroit Street Denver, CO 80206 Age 62 | Trustee | 9/93-Present | Corporate Vice President and General Manager of MKS Instruments – HPS Products, Boulder, CO (a manufacturer of vacuum fittings and valves). | 69 | N/A | ||||||||||||||||||
| Martin H. Waldinger 151 Detroit Street Denver, CO 80206 Age 68 | Trustee | 9/93-Present | Private Investor and Consultant to California Planned Unit Developments. Formerly, CEO and President of Marwal, Inc. (homeowner association management company). | 69 | N/A | ||||||||||||||||||
| Linda S. Wolf 151 Detroit Street Denver, CO 80206 Age 59 | Trustee | 12/05-Present | Retired. Formerly, Chairman and Chief Executive Officer of Leo Burnett (Worldwide) (advertising agency) (2001-2005). | 69 | Director of Wal-Mart, The Field Museum of Natural History (Chicago, IL), Children's Memorial Hospital (Chicago, IL), Chicago Council on Foreign Relations, Economic Club of Chicago, and InnerWorkings (a provider of print procurement solutions). | ||||||||||||||||||
| Interested Trustee | |||||||||||||||||||||||
| Thomas H. Bailey** 151 Detroit Street Denver, CO 80206 Age 69 | Trustee | 5/93-Present | Retired. Formerly, President (1978-2002) and Chief Executive Officer (1994-2002) of Janus Capital or Janus Capital Corporation; Chairman and Director (1978-2002) of Janus Capital Corporation; President and Director (1994-2002) of The Janus Foundation. | 69 | N/A | ||||||||||||||||||
* Mr. Mullen also serves as director of Janus Capital Funds Plc, consisting of 22 funds. Including Janus Capital Funds Plc and the 69 funds comprising the Janus Funds, Mr. Mullen oversees 91 funds.
** The Portfolio is treating Mr. Bailey as an "interested person" of the Trust by virtue of his past positions and continuing relationships with Janus Capital and ownership of shares of Janus Capital's parent company.
Janus Aspen Series December 31, 2006 29
Trustees and Officers (unaudited) (continued)
Officers
| Name, Age and Address | Positions Held with Portfolio | Term of Office* and Length of Time Served | Principal Occupations During the Past Five Years | ||||||||||||
| Jonathan D. Coleman 151 Detroit Street Denver, CO 80206 Age 35 | Executive Vice President and Portfolio Manager Janus Aspen Mid Cap Growth Portfolio | 2/06-Present | Co-Chief Investment Officer and Executive Vice President of Janus Capital, and Portfolio Manager for other Janus accounts. Formerly, Analyst (2000-2002) for Janus Capital Corporation. | ||||||||||||
| Stephanie Grauerholz-Lofton 151 Detroit Street Denver, CO 80206 Age 36 | Chief Legal Counsel and Secretary Vice President | 1/06-Present 3/06-Present | Assistant Vice President of Janus Capital and Janus Distributors LLC; and Associate Counsel of Janus Capital. Formerly, Associate of Vedder, Price, Kaufman & Kammholz, P.C. (1999-2003). | ||||||||||||
| Kelley Abbott Howes 151 Detroit Street Denver, CO 80206 Age 41 | President and Chief Executive Officer | 1/06-Present | President of Janus Services LLC; Senior Vice President and General Counsel of Janus Capital; and Senior Vice President and Assistant General Counsel of Janus Distributors LLC. Formerly, Vice President (1999-2005) of Janus Distributors LLC; Senior Vice President and General Counsel (2004-2006), Vice President (2000-2004), and Assistant General Counsel (2002-2004) of Janus Services LLC; and Vice President and Assistant General Counsel (1999-2004) of Janus Capital. | ||||||||||||
| David R. Kowalski 151 Detroit Street Denver, CO 80206 Age 49 | Vice President and Chief Compliance Officer | 6/02-Present | Senior Vice President and Chief Compliance Officer of Janus Capital, Janus Distributors LLC, and Janus Services LLC; Chief Compliance Officer of Bay Isle Financial LLC; and Vice President of Enhanced Investment Technologies LLC. Formerly, Chief Compliance Officer of Enhanced Investment Technologies, LLC (2003-2005); Vice President of Janus Capital (2000-2005), Janus Distributors LLC (2000-2001), and Janus Services LLC (2004-2005); and Assistant Vice President of Janus Services LLC (2002-2004). | ||||||||||||
| Jesper Nergaard 151 Detroit Street Denver, CO 80206 Age 44 | Chief Financial Officer Vice President, Treasurer, and Principal Accounting Officer | 3/05-Present 2/05-Present | Vice President of Janus Capital. Formerly, Director of Financial Reporting for OppenheimerFunds, Inc. (2004-2005); Site Manager and First Vice President of Mellon Global Securities Services (2003); and Director of Fund Accounting, Project Development, and Training of INVESCO Funds Group (1994-2003). | ||||||||||||
* Officers are elected at least annually for a one-year term and may also be elected from time to time by the Trustees for an interim period.
30 Janus Aspen Series December 31, 2006
Notes
Janus Aspen Series December 31, 2006 31
Notes
32 Janus Aspen Series December 31, 2006
Notes
Janus Aspen Series December 31, 2006 33
Janus provides access to a wide range of investment disciplines.
Growth
Janus growth portfolios focus on companies believed to be the leaders in their respective industries, with solid management teams, expanding market share, margins and efficiencies.
Core
Janus core portfolios seek investments in more stable and predictable companies. These portfolios look for a strategic combination of steady growth and for certain portfolios, some degree of income.
Risk-Managed
Our risk-managed portfolios seek to outperform their respective indices while maintaining a risk profile equal to or lower than the index itself. Managed by INTECH (a Janus subsidiary), these portfolios use a mathematical process in an attempt to build a more "efficient" portfolio than the index.
Value
Janus value portfolios invest in companies they believe are poised for a turnaround or are trading at a significant discount to fair value. The goal is to gain unique insight into a company's true value and identify and evaluate potential catalysts that may unlock shareholder value.
International & Global
Janus international and global portfolios seek to leverage Janus' research capabilities by taking advantage of inefficiencies in foreign markets, where accurate information and analytical insight are often at a premium.
Bond & Money Market
Janus bond portfolios attempt to provide less risk relative to equities while seeking to deliver a competitive total return through high current income and appreciation. Janus money market portfolios seek maximum current income consistent with stability of capital.
For more information about our funds, contact your investment professional or go to www.janus.com/info
Please consider the charges, risks, expenses and investment objectives carefully before investing. For a prospectus containing this and other information, please call Janus at 1-800-525-0020 or download the file from www.janus.com/info. Read it carefully before you invest or send money.
An investment in a money market portfolio is not insured or guaranteed by the Federal Deposit Insurance Corporation or any other government agency. Although the Portfolio seeks to preserve the value of your investment at $1.00 per share, it is possible to lose money by investing in the Portfolio.

151 Detroit Street
Denver, CO 80206
1-800-525-0020
Portfolio distributed by Janus Distributors LLC (1/07)
C-0207-169 109-02-702 01-07
2006 Annual Report
Janus Aspen Series
Janus Aspen Mid Cap Value Portfolio
Look Inside. . .
• Portfolio management perspective
• Investment strategy behind your portfolio
• Portfolio performance, characteristics and holdings

Table of Contents
| Useful Information About Your Portfolio Report | 1 | ||||||
| Management Commentary and Schedule of Investments | 2 | ||||||
| Statement of Assets and Liabilities | 10 | ||||||
| Statement of Operations | 11 | ||||||
| Statements of Changes in Net Assets | 12 | ||||||
| Financial Highlights | 13 | ||||||
| Notes to Schedule of Investments | 14 | ||||||
| Notes to Financial Statements | 15 | ||||||
| Report of Independent Registered Public Accounting Firm | 22 | ||||||
| Additional Information | 23 | ||||||
| Explanations of Charts, Tables and Financial Statements | 26 | ||||||
| Designation Requirements | 28 | ||||||
| Trustees and Officers | 29 | ||||||
Please consider the charges, risks, expenses and investment objectives carefully before investing. For a prospectus containing this and other information, please call Janus at 1-800-525-0020 or download the file from www.janus.com/info. Read it carefully before you invest or send money.
Useful Information About Your Portfolio Report
Management Commentary
The Management Commentary in this report includes valuable insight from the Portfolio's managers as well as statistical information to help you understand how your Portfolio's performance and characteristics stack up against those of comparable indices.
Please keep in mind that the opinions expressed by the Portfolio's managers in the Management Commentary are just that: opinions. They are a reflection of the managers' best judgment at the time this report was compiled, which was December 31, 2006. As the investing environment changes, so could the managers' opinions. The views are unique to the managers and aren't necessarily shared by their fellow employees or by Janus in general.
Portfolio Expenses
We believe it's important for our shareholders to have a clear understanding of Portfolio expenses and the impact they have on investment return.
The following is important information regarding the Portfolio's Expense Example, which appears in the Management Commentary within this Annual Report. Please refer to this information when reviewing the Expense Example for the Portfolio.
Example
As a shareholder of a Portfolio, you incur two types of costs: (1) transaction costs, including redemption fees (where applicable) (and any related exchange fees) and (2) ongoing costs, including management fees; distribution and shareholder servicing (12b-1) fees (applicable to Service Shares only); administrative services fees (applicable to Service Shares only); and other Portfolio expenses. The example is intended to help you understand your ongoing costs (in dollars) of investing in a Portfolio and to compare these costs with the ongoing costs of investing in other mutual funds. To do so, compare this 5% hypothetical example with the 5% hypothetical examples that appear in the shareholder reports of the other funds. The example is based upon an investment of $1,000 invested at the beginning of the period and held for the six-month period from July 1, 2006 to December 31, 2006.
Actual Expenses
The first line of the table in each example provides information about actual account values and actual expenses. You may use the information in this line, together with the amount you invested, to estimate the expenses that you paid over the period. Simply divide your account value by $1,000 (for example, an $8,600 account value divided by $1,000 = 8.6), then multiply the result by the number in the first line under the heading entitled "Expenses Paid During Period" to estimate the expenses you paid on your account during the period.
Hypothetical Example for Comparison Purposes
The second line of the table in each example provides information about hypothetical account values and hypothetical expenses based upon the Portfolio's actual expense ratio and an assumed rate of return of 5% per year before expenses, which is not the Portfolio's actual return. The hypothetical account values and expenses may not be used to estimate the actual ending account balance or expenses you paid for the period. You may use this information to compare the ongoing costs of investing in the Portfolio and other funds. To do so, compare this 5% hypothetical example with the 5% hypothetical examples that appear in the shareholder reports of the other funds.
Janus Capital Management LLC ("Janus Capital") has contractually agreed to waive the Portfolio's total operating expenses, excluding the distribution and shareholder servicing (12b-1) fees applicable to Service Shares, the administrative services fees applicable to Service Shares, brokerage commissions, interest, taxes and extraordinary expenses to certain limits until at least May 1, 2008. More information regarding the waivers is available in the Portfolio's prospectus.
Please note that the expenses shown in the tables are meant to highlight your ongoing costs only and do not reflect any transaction costs, such as redemption fees (where applicable) and any charges at the separate account level or contract level. Redemption fees are fully described in the prospectus. Therefore, the second line of each table is useful in comparing ongoing costs only, and will not help you determine the relative total costs of owning different funds. In addition, if these transaction costs and separate account or contract level charges were included, your costs would have been higher.
Janus Aspen Series December 31, 2006 1
Janus Aspen Mid Cap Value Portfolio (unaudited)
Performance Overview
During the 12 months ended December 31, 2006, Janus Aspen Mid Cap Value Portfolio's Institutional Shares appreciated 15.42% and the Portfolio's Service Shares gained 15.06%. In the same period the Portfolio's benchmark, the Russell Midcap® Value Index, returned 20.22%. The S&P MidCap 400 Index was up 10.32% and the S&P 500® Index advanced 15.80% for the period.
Portfolio Snapshot
This portfolio seeks to uncover fundamentally strong mid-sized companies with a catalyst for growth not yet recognized by the market.
Managed by Perkins, Wolf, McDonnell and Company, LLC
Sector and Related Holdings Performance
Overall our stock selection in the various sectors was positive, but our group weightings as well as our cash position penalized us. In terms of sector weightings, our overweighting in energy hindered performance for the first time in several years. We have always recognized that energy prices will be volatile in the short run, and we continue to believe that the secular trend in prices is up. Moreover we think that energy producers' stock prices reflect commodity prices well below current levels and that acquisitions will continue to be consummated at higher stock prices. Our normal underweighting in the utilities sector also hurt performance. Holdings within this sector do not fit our investment criteria of strong balance sheets and free cash flow. Over the long term our underweighting has benefited us.
We underperformed the benchmark Index in the materials sector, as we had no exposure to the extremely strong steel stocks. In earlier years, we took substantial gains in International Steel, Nucor and Steel Dynamics, but underestimated the continuing strength of demand and pricing. Chemtura, a specialty chemical company, was a short-term disappointment as earnings shortfalls continued longer than expected. We retained our position as the company's balance sheet and cash flow are healthy and we expect a good earnings rebound in 2007. Perhaps our largest detractor to performance was healthcare supplier Omnicare which has had near term earnings disappointments. However, the loss was mitigated as we had partially reduced the position at higher prices.
Financials have always been our heaviest exposure, but we continue to be underweighted relative to the benchmark. For the past few years, this lower relative exposure is entirely due to our lesser investment in Real Estate Investment Trusts (REITs). Not coincidentally, this is a result of REITs having been the market's best performers in the past five years and consequently reaching historically high valuations. As of December 31, 2006, industry dividend yields are below 4% and REIT stocks sell at high valuations relative to their underlying assets. Because of their relative high valuation, our discipline has led us to be much more selective and the Portfolio's position has remained stable at about 7%. In the meantime, the benchmark's REIT weighting has skyrocketed to over 11%.
Although we were underweight in REITs, our overall return in the financial sector was stronger than that of the Index. This was due in part to the above average performance of two of the Portfolio's largest holdings – AllianceBernstein and Berkshire Hathaway – and the buyout of Mercantile Bankshares at a price over 25% above our cost.
As has been the case each year, other than 2002, takeover activity was a significant contributor to our results. In the fourth quarter, other mergers and acquisitions were announced including Abbott Laboratories purchase of Kos Pharmaceuticals, Biomet's takeout by a group of private equity firms, the Bank of New York and Mellon Bank's merger and Clear Channel Communications' buyout by private equity investors. Earlier in the year we purchased some of the companies involved in recent deals after their prices had declined because of near-term earnings disappointments. This provides an example of our contrarian philosophy of buying strong long-term franchises at a time when investor expectations are low and more focused on short-term reports rather than a firm's intrinsic value. We expect merger and acquisition activity to be a continuing benefit to the Portfolio.
In our June 30, 2006 report we commented on the well-above average valuation of small-and mid-cap stocks relative to large-cap stocks. Similarly, after six years of underperformance, we believe growth stocks are reasonably priced relative to value stocks. Thus, for the past several quarters we have found increasing opportunities in the larger end of our capitalization spectrum and in some out-of-favor
2 Janus Aspen Series December 31, 2006
(unaudited)
growth companies. This increased investment in reasonably valued growth is reflected in the fact that for the first time in several years we are overweight in technology as compared to the Index. Some of our larger-cap stocks have been among our best performers in recent years. This year is no exception as AllianceBernstein, Berkshire Hathaway, Marathon Oil, Norfolk Southern, Waste Management, Deere and CVS have provided above-average returns. Our success with these large-cap stocks indicates that our investment process is applicable throughout the capitalization spectrum.
Market Outlook
Our market outlook continues to be relatively neutral. Valuations, especially for large-cap companies, have fallen to more normal levels as earnings continue to be strong, in our opinion. However, that earnings momentum is subsiding and it is unclear where interest rates and the economy are headed. The yield curve is inverted, housing is in a steep decline and the effect on the consumer is uncertain. Liquidity is high, but investors' complacency is susceptible to negative surprises. The market has gone an unusually long time without a 10% correction. Thus, we believe the market's risk/reward relationship is generally in balance.
In the past two years, as small- and mid-cap value stocks have become expensive relative to the rest of the market, our absolute performance has been above long-term expectations of 8% to 10%. However, this period has been challenging to our relative performance, as our discipline keeps us from staying in investments such as REITs whose momentum has taken them to overvalued levels. Rather than retaining stocks that have reached our reasonable price targets, we have maintained our sell discipline and have sacrificed some relative returns in our attempts to reduce risk and enhance consistent long-term results. Over the past several years, we generally have not found sufficient risk/reward opportunities in which to reinvest, so we have retained higher than normal cash levels, which has contributed to our recent relative underperformance.
There have been a few times during the past several years that we have availed ourselves of opportunities to reduce cash as more attractive risk/reward opportunities have surfaced. In that same vein, in recent months our cash level has declined as we have found more stocks that, despite having favorable long-term prospects, have not fully participated in the last two years of market strength. This is consistent with our disciplined approach and although it is not a guarantee of future performance, it has allowed us to achieve steady, above-average, long-term relative returns on both an absolute and relative basis.
Thank you for joining us in our investment in Janus Aspen Mid Cap Value Portfolio.
Janus Aspen Series December 31, 2006 3
Janus Aspen Mid Cap Value Portfolio
(unaudited)
Janus Aspen Mid Cap Value Portfolio At a Glance
5 Largest Contributors to Performance – Holdings
| Contribution | |||||||
| AllianceBernstein Holding L.P. Investment management firm – U.S. | 1.29 | % | |||||
| Kos Pharmaceuticals, Inc. Pharmaceutical company – U.S. | 0.49 | % | |||||
| Berkshire Hathaway, Inc. - Class B Holding company – U.S. | 0.46 | % | |||||
| Mercantile Bankshares Corp. Multi-bank holding company – U.S. | 0.43 | % | |||||
| Home Properties, Inc. Real Estate Investment Trust – U.S. | 0.40 | % | |||||
5 Largest Detractors from Performance – Holdings
| Contribution | |||||||
| Omnicare, Inc. Pharmacy services provider – U.S. | (0.29 | )% | |||||
| Invitrogen Corp. Biotechnology products provider – U.S. | (0.17 | )% | |||||
| Westwood One, Inc. Radio & television information services & programming provider – U.S. | (0.15 | )% | |||||
| Smurfit-Stone Container Corp. Paper recycler and integrated manufacturer of paper and paper-based packaging – U.S. | (0.15 | )% | |||||
| Talbots, Inc. Specialty retailer and cataloger of apparel and shoes – U.S. | (0.15 | )% | |||||
5 Largest Contributors to Performance – Sectors
| Group | Portfolio Contribution | Portfolio Weighting (% of Net Assets) | Russell Midcap® Value Index Weighting | ||||||||||||
| Diversified Financials | 2.10 | % | 6.95 | % | 4.22 | % | |||||||||
| Real Estate | 1.89 | % | 7.57 | % | 11.39 | % | |||||||||
| Banks | 1.81 | % | 7.63 | % | 10.20 | % | |||||||||
| Technology Hardware & Equipment | 1.37 | % | 5.64 | % | 3.65 | % | |||||||||
| Materials | �� | 1.05 | % | 7.72 | % | 6.74 | % | ||||||||
5 Largest Detractors from Performance – Sectors
| Group | Portfolio Contribution | Portfolio Weighting (% of Net Assets) | Russell Midcap® Value Index Weighting | ||||||||||||
| Household & Personal Products | (0.26 | )% | 1.17 | % | 0.67 | % | |||||||||
| Consumer Durables & Apparel | (0.21 | )% | 1.32 | % | 4.47 | % | |||||||||
| Semiconductors & Semiconductor Equipment | (0.02 | )% | 0.63 | % | 1.52 | % | |||||||||
| Automobiles & Components | (0.02 | )% | 1.37 | % | 1.20 | % | |||||||||
| Other* | (0.01 | )% | 0.00 | % | 0.00 | % | |||||||||
*Industry not classified by Global Industry Classification Standard.
4 Janus Aspen Series December 31, 2006
(unaudited)
5 Largest Equity Holdings – (% of Net Assets)
| As of December 31, 2006 | |||||||
| AllianceBernstein Holding L.P. Investment Management and Advisory Services | 2.6 | % | |||||
| Berkshire Hathaway, Inc. - Class B Reinsurance | 1.5 | % | |||||
| Old Republic International Corp. Multi-Line Insurance | 1.4 | % | |||||
| SunTrust Banks, Inc. Super-Regional Banks | 1.3 | % | |||||
| Mercantile Bankshares Corp. Commercial Banks | 1.3 | % | |||||
| 8.1 | % | ||||||
Asset Allocation – (% of Net Assets)
As of December 31, 2006
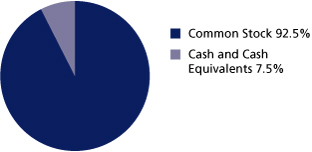
Emerging markets comprised 0.3% of total net assets.
Top Country Allocations – (% of Investment Securities)
| As of December 31, 2006 | As of December 31, 2005 | ||||||
 | 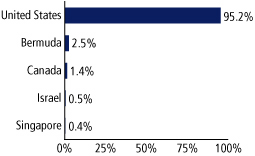 | ||||||
Janus Aspen Series December 31, 2006 5
Janus Aspen Mid Cap Value Portfolio
(unaudited)
Performance
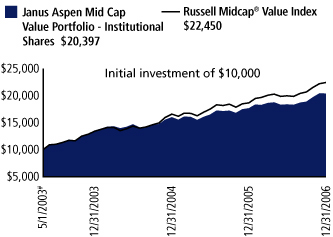
Average Annual Total Return – for the periods ended December 31, 2006
| One Year | Since Inception | ||||||||||
| Janus Aspen Mid Cap Value Portfolio - Institutional Shares# | 15.42 | % | 21.45 | % | |||||||
| Janus Aspen Mid Cap Value Portfolio - Service Shares* | 15.06 | % | 19.36 | % | |||||||
| Russell Midcap® Value Index | 20.22 | % | 24.66 | % | |||||||
| Lipper Quartile - Institutional Shares | 2 | nd | 2 | nd | |||||||
| Lipper Ranking - Institutional Shares based on total returns for Variable Annuity Mid-Cap Value Funds | 22/65 | 20/55 | |||||||||
Data presented represents past performance, which is no guarantee of future results. Investment results and principal value will fluctuate so that shares, when redeemed, may be worth more or less than their original cost. Due to market volatility, current performance may be higher or lower than the performance shown. Call 877.33JANUS or visit www.janus.com/info for performance current to the most recent month-end.
See Notes to Schedule of Investments for index definitions.
Total return includes reinvestment of dividends from net investment income and distributions from capital gains. The returns shown do not reflect the deduction of taxes that a shareholder would pay on Portfolio distributions or the redemption of Portfolio shares.
These returns do not reflect the charges and expenses of any particular insurance product or qualified plan. Returns shown would have been lower had they included insurance charges.
The Portfolio may differ significantly from the securities held in the index. The index is not available for direct investment; therefore its performance does not reflect the expenses associated with the active management of an actual Portfolio.
Janus Capital Group Inc. has a 30% ownership stake in the investment advisory business of Perkins, Wolf, McDonnell and Company, LLC.
There is no assurance that the investment process will consistently lead to successful investing.
This Portfolio has a performance-based management fee that adjusts upward or downward based on the Portfolio's performance relative to an approved benchmark index over a performance measurement period. See the Portfolio's Prospectus or Statement of Additional Information for more details.
The Portfolio's performance may be affected by risks that include those associated with nondiversification, non-investment grade debt securities, undervalued or overlooked companies, investments in specific industries or countries and potential conflicts of interest with Janus Smart Portfolios. Additional risks to the Portfolio may include those associated with investing in foreign securities, emerging markets, initial public offerings, derivatives and companies with relatively small market capitalizations. Please see a Janus prospectus or www.janus.com/info for more information about risk, fund holdings and details.
Lipper Inc. - A Reuters Company, is a nationally recognized organization that ranks the performance of mutual funds within a universe of funds that have similar investment objectives. Rankings are historical with capital gains and dividends reinvested.
The date of the since-inception Lipper ranking is slightly different from when the Portfolio began operations since Lipper provides fund rankings as of the last day of the month or the first Thursday after fund inception.
Ranking is for the Institutional share class only; other classes may have different performance characteristics.
The Portfolio will invest at least 80% of its net assets in the type of securities described by its name.
Janus Capital has contractually agreed to waive each Portfolio's total operating expenses to the levels indicated in the prospectus until at least May 1, 2008. Total returns shown include fee waivers, if any and without such waivers, total returns would have been lower.
See "Explanations of Charts, Tables and Financial Statements."
* Service Shares inception date – December 31, 2002
# Institutional Shares inception date – May 1, 2003
Portfolio Expenses
The example below shows you the ongoing costs (in dollars) of investing in your Portfolio and allows you to compare these costs with those of other mutual funds. Please refer to page 1 for a detailed explanation of the information presented in these charts.
| Expense Example - Institutional Shares | Beginning Account Value (7/1/06) | Ending Account Value (12/31/06) | Expenses Paid During Period (7/1/06-12/31/06)* | ||||||||||||
| Actual | $ | 1,000.00 | $ | 1,108.90 | $ | 4.78 | |||||||||
| Hypothetical (5% return before expenses) | $ | 1,000.00 | $ | 1,020.67 | $ | 4.58 | |||||||||
| Expense Example - Service Shares | Beginning Account Value (7/1/06) | Ending Account Value (12/31/06) | Expenses Paid During Period (7/1/06-12/31/06)* | ||||||||||||
| Actual | $ | 1,000.00 | $ | 1,106.80 | $ | 6.64 | |||||||||
| Hypothetical (5% return before expenses) | $ | 1,000.00 | $ | 1,018.90 | $ | 6.36 | |||||||||
*Expenses are equal to the annualized expense ratio of 0.90% for Institutional Shares and 1.25% for Service Shares, multiplied by the average account value over the period, multiplied by 184/365 (to reflect the one-half year period). Expenses may include effect of contractual waivers by Janus Capital.
6 Janus Aspen Series December 31, 2006
Janus Aspen Mid Cap Value Portfolio
Schedule of Investments
As of December 31, 2006
| Shares or Principal Amount | Value | ||||||||||
| Common Stock - 92.5% | |||||||||||
| Agricultural Chemicals - 1.2% | |||||||||||
| 17,300 | Agrium, Inc. (U.S. Shares) | $ | 544,777 | ||||||||
| 21,600 | Mosaic Co.* | 461,376 | |||||||||
| 1,006,153 | |||||||||||
| Airlines - 1.0% | |||||||||||
| 53,600 | Southwest Airlines Co. | 821,152 | |||||||||
| Apparel Manufacturers - 0.3% | |||||||||||
| 5,500 | Liz Claiborne, Inc. | 239,030 | |||||||||
| Automotive - Truck Parts and Equipment - Original - 0.5% | |||||||||||
| 5,300 | Magna International, Inc. - Class A (U.S. Shares) | 426,915 | |||||||||
| Beverages - Non-Alcoholic - 0.7% | |||||||||||
| 8,500 | PepsiCo, Inc. | 531,675 | |||||||||
| Brewery - 0.6% | |||||||||||
| 6,000 | Molson Coors Brewing Co. - Class B | 458,640 | |||||||||
| Broadcast Services and Programming - 0.6% | |||||||||||
| 13,000 | Clear Channel Communications, Inc. | 462,020 | |||||||||
| Building - Residential and Commercial - 0.8% | |||||||||||
| 14,700 | D.R. Horton, Inc. | 389,403 | |||||||||
| 7,600 | Toll Brothers, Inc.* | 244,948 | |||||||||
| 634,351 | |||||||||||
| Chemicals - Diversified - 1.2% | |||||||||||
| 6,500 | E.I. du Pont de Nemours and Co. | 316,615 | |||||||||
| 32,700 | Huntsman Corp.* | 620,319 | |||||||||
| 936,934 | |||||||||||
| Chemicals - Specialty - 1.4% | |||||||||||
| 56,300 | Chemtura Corp. | 542,169 | |||||||||
| 12,600 | Lubrizol Corp. | 631,638 | |||||||||
| 1,173,807 | |||||||||||
| Coal - 0.4% | |||||||||||
| 10,700 | Arch Coal, Inc. | 321,321 | |||||||||
| Commercial Banks - 4.8% | |||||||||||
| 14,600 | Bank of Hawaii Corp. | 787,670 | |||||||||
| 15,300 | Colonial BancGroup, Inc. | 393,822 | |||||||||
| 21,600 | Mercantile Bankshares Corp. | 1,010,664 | |||||||||
| 30,500 | Synovus Financial Corp. | 940,315 | |||||||||
| 28,400 | Valley National Bancorp | 752,884 | |||||||||
| 3,885,355 | |||||||||||
| Computers - Integrated Systems - 1.1% | |||||||||||
| 18,800 | Diebold, Inc. | 876,080 | |||||||||
| Consumer Products - Miscellaneous - 0.5% | |||||||||||
| 5,700 | Kimberly-Clark Corp. | 387,315 | |||||||||
| Containers - Metal and Glass - 1.1% | |||||||||||
| 20,000 | Ball Corp. | 872,000 | |||||||||
| Cosmetics and Toiletries - 1.6% | |||||||||||
| 14,300 | International Flavors & Fragrances, Inc. | 702,988 | |||||||||
| 8,600 | Procter & Gamble Co. | 552,722 | |||||||||
| 1,255,710 | |||||||||||
| Data Processing and Management - 1.6% | |||||||||||
| 27,600 | First Data Corp. | 704,352 | |||||||||
| 10,500 | Fiserv, Inc.* | 550,410 | |||||||||
| 1,254,762 | |||||||||||
| Diagnostic Equipment - 0.4% | |||||||||||
| 12,500 | Cytyc Corp.* | 353,750 | |||||||||
| Shares or Principal Amount | Value | ||||||||||
| Distribution/Wholesale - 2.4% | |||||||||||
| 16,600 | Genuine Parts Co. | $ | 787,338 | ||||||||
| 13,400 | Tech Data Corp.* | 507,458 | |||||||||
| 8,800 | W.W. Grainger, Inc. | 615,472 | |||||||||
| 1,910,268 | |||||||||||
| Diversified Operations - 2.1% | |||||||||||
| 17,100 | General Electric Co. | 636,291 | |||||||||
| 10,900 | Illinois Tool Works, Inc. | 503,471 | |||||||||
| 17,900 | Tyco International, Ltd. (U.S. Shares) | 544,160 | |||||||||
| 1,683,922 | |||||||||||
| Electric - Integrated - 1.8% | |||||||||||
| 29,500 | DPL, Inc. | 819,510 | |||||||||
| 16,900 | PPL Corp. | 605,696 | |||||||||
| 1,425,206 | |||||||||||
| Electronic Components - Miscellaneous - 0.6% | |||||||||||
| 35,600 | Vishay Intertechnology, Inc.* | 482,024 | |||||||||
| Electronic Components - Semiconductors - 1.3% | |||||||||||
| 27,800 | OmniVision Technologies, Inc.* | 379,470 | |||||||||
| 14,900 | QLogic Corp.* | 326,608 | |||||||||
| 14,500 | Xilinx, Inc. | 345,245 | |||||||||
| 1,051,323 | |||||||||||
| Engineering - Research and Development Services - 1.0% | |||||||||||
| 19,400 | URS Corp.* | 831,290 | |||||||||
| Engines - Internal Combustion - 0.6% | |||||||||||
| 17,400 | Briggs & Stratton Corp. | 468,930 | |||||||||
| Enterprise Software/Services - 0.3% | |||||||||||
| 7,800 | Hyperion Solutions Corp.* | 280,332 | |||||||||
| E-Services/Consulting - 0.6% | |||||||||||
| 20,200 | Websense, Inc.* | 461,166 | |||||||||
| Fiduciary Banks - 0.8% | |||||||||||
| 5,900 | Bank of New York Company, Inc. | 232,283 | |||||||||
| 9,200 | Mellon Financial Corp. | 387,780 | |||||||||
| 620,063 | |||||||||||
| Food - Confectionary - 1.3% | |||||||||||
| 10,800 | Hershey Foods Corp. | 537,840 | |||||||||
| 11,200 | J.M. Smucker Co. | 542,864 | |||||||||
| 1,080,704 | |||||||||||
| Food - Diversified - 0.3% | |||||||||||
| 4,800 | H.J. Heinz Co. | 216,048 | |||||||||
| Food - Wholesale/Distribution - 0.1% | |||||||||||
| 2,300 | Supervalu, Inc. | 82,225 | |||||||||
| Gas - Distribution - 0.5% | |||||||||||
| 16,100 | Southern Union Co. | 449,995 | |||||||||
| Gold Mining - 0.5% | |||||||||||
| 8,400 | Newmont Mining Corp. | 379,260 | |||||||||
| Hotels and Motels - 1.3% | |||||||||||
| 18,200 | Hilton Hotels Corp. | 635,180 | |||||||||
| 6,200 | Starwood Hotels & Resorts Worldwide, Inc. | 387,500 | |||||||||
| 1,022,680 | |||||||||||
| Instruments - Controls - 0.7% | |||||||||||
| 11,800 | Thermo Electron Corp.* | 534,422 | |||||||||
| Instruments - Scientific - 0.9% | |||||||||||
| 32,100 | PerkinElmer, Inc. | 713,583 | |||||||||
See Notes to Schedule of Investments and Financial Statements.
Janus Aspen Series December 31, 2006 7
Janus Aspen Mid Cap Value Portfolio
Schedule of Investments
As of December 31, 2006
| Shares or Principal Amount | Value | ||||||||||
| Internet Infrastructure Equipment - 0.8% | |||||||||||
| 19,200 | Avocent Corp.* | $ | 649,920 | ||||||||
| Internet Security - 0.3% | |||||||||||
| 10,600 | Check Point Software Technologies, Ltd. (U.S. Shares)* | 232,352 | |||||||||
| Investment Management and Advisory Services - 4.4% | |||||||||||
| 25,800 | AllianceBernstein Holding L.P. | 2,074,320 | |||||||||
| 9,600 | Legg Mason, Inc. | 912,480 | |||||||||
| 20,000 | Waddell & Reed Financial, Inc. - Class A | 547,200 | |||||||||
| 3,534,000 | |||||||||||
| Life and Health Insurance - 1.4% | |||||||||||
| 12,300 | AFLAC, Inc. | 565,800 | |||||||||
| 11,700 | Protective Life Corp. | 555,750 | |||||||||
| 1,121,550 | |||||||||||
| Machinery - Farm - 0.9% | |||||||||||
| 8,000 | Deere & Co. | 760,560 | |||||||||
| Medical - Biomedical and Genetic - 1.4% | |||||||||||
| 8,600 | Charles River Laboratories International, Inc.* | 371,950 | |||||||||
| 13,100 | Invitrogen Corp.* | 741,329 | |||||||||
| 1,113,279 | |||||||||||
| Medical - Drugs - 0.9% | |||||||||||
| 12,600 | Endo Pharmaceuticals Holdings, Inc.* | 347,508 | |||||||||
| 7,300 | Wyeth | 371,716 | |||||||||
| 719,224 | |||||||||||
| Medical - Generic Drugs - 0.4% | |||||||||||
| 20,100 | Perrigo Co. | 347,730 | |||||||||
| Medical - HMO - 0.5% | |||||||||||
| 7,900 | Health Net, Inc.* | 384,414 | |||||||||
| Medical - Hospitals - 0.7% | |||||||||||
| 28,400 | Health Management Associates, Inc. - Class A | 599,524 | |||||||||
| Medical Instruments - 1.0% | |||||||||||
| 7,500 | Beckman Coulter, Inc. | 448,500 | |||||||||
| 10,800 | St. Jude Medical, Inc.* | 394,848 | |||||||||
| 843,348 | |||||||||||
| Medical Labs and Testing Services - 0.6% | |||||||||||
| 6,300 | Laboratory Corporation of America Holdings* | 462,861 | |||||||||
| Medical Products - 0.8% | |||||||||||
| 9,300 | Biomet, Inc. | 383,811 | |||||||||
| 6,100 | Cooper Companies, Inc. | 271,450 | |||||||||
| 655,261 | |||||||||||
| Metal - Aluminum - 0.4% | |||||||||||
| 10,900 | Alcoa, Inc. | 327,109 | |||||||||
| Multi-Line Insurance - 1.4% | |||||||||||
| 48,200 | Old Republic International Corp. | 1,122,096 | |||||||||
| Multimedia - 0.5% | |||||||||||
| 6,100 | McGraw-Hill Companies, Inc. | 414,922 | |||||||||
| Networking Products - 0.6% | |||||||||||
| 15,400 | Foundry Networks, Inc.* | 230,692 | |||||||||
| 14,000 | Juniper Networks, Inc.* | 265,160 | |||||||||
| 495,852 | |||||||||||
| Non-Hazardous Waste Disposal - 1.4% | |||||||||||
| 13,300 | Republic Services, Inc. | 540,911 | |||||||||
| 17,000 | Waste Management, Inc. | 625,090 | |||||||||
| 1,166,001 | |||||||||||
| Shares or Principal Amount | Value | ||||||||||
| Office Automation and Equipment - 1.5% | |||||||||||
| �� | 16,100 | Pitney Bowes, Inc. | $ | 743,659 | |||||||
| 27,100 | Xerox Corp.* | 459,345 | |||||||||
| 1,203,004 | |||||||||||
| Oil - Field Services - 0.5% | |||||||||||
| 13,200 | BJ Services Co. | 387,024 | |||||||||
| Oil and Gas Drilling - 0.7% | |||||||||||
| 18,300 | Nabors Industries, Ltd.* | 544,974 | |||||||||
| Oil Companies - Exploration and Production - 7.1% | |||||||||||
| 19,600 | Anadarko Petroleum Corp. | 852,992 | |||||||||
| 15,800 | Bill Barrett Corp.* | 429,918 | |||||||||
| 5,600 | Devon Energy Corp. | 375,648 | |||||||||
| 14,900 | Encore Acquisition Co.* | 365,497 | |||||||||
| 28,000 | Forest Oil Corp.* | 915,040 | |||||||||
| 4,400 | Murphy Oil Corp. | 223,740 | |||||||||
| 20,700 | Newfield Exploration Co.* | 951,164 | |||||||||
| 12,118 | Noble Energy, Inc. | 594,630 | |||||||||
| 13,200 | Southwestern Energy Co.* | 462,660 | |||||||||
| 14,600 | St. Mary Land & Exploration Co. | 537,864 | |||||||||
| 5,709,153 | |||||||||||
| Oil Companies - Integrated - 0.8% | |||||||||||
| 7,200 | Hess Corp. | 356,904 | |||||||||
| 3,300 | Marathon Oil Corp. | 305,250 | |||||||||
| 662,154 | |||||||||||
| Paper and Related Products - 3.0% | |||||||||||
| 15,500 | Potlatch Corp. | 679,210 | |||||||||
| 13,500 | Rayonier, Inc. | 554,175 | |||||||||
| 35,200 | Smurfit-Stone Container Corp.* | 371,712 | |||||||||
| 18,200 | Temple-Inland, Inc. | 837,746 | |||||||||
| 2,442,843 | |||||||||||
| Pharmacy Services - 0.8% | |||||||||||
| 17,700 | Omnicare, Inc. | 683,751 | |||||||||
| Pipelines - 1.4% | |||||||||||
| 15,900 | Kinder Morgan Energy Partners L.P. | 761,610 | |||||||||
| 7,900 | Plains All American Pipeline, L.P. | 404,480 | |||||||||
| 1,166,090 | |||||||||||
| Property and Casualty Insurance - 1.1% | |||||||||||
| 9,400 | Mercury General Corp. | 495,662 | |||||||||
| 15,300 | Progressive Corp. | 370,566 | |||||||||
| 866,228 | |||||||||||
| Reinsurance - 2.3% | |||||||||||
| 319 | Berkshire Hathaway, Inc. - Class B* | 1,169,454 | |||||||||
| 7,000 | Everest Re Group, Ltd. | 686,770 | |||||||||
| 1,856,224 | |||||||||||
| REIT - Apartments - 0.5% | |||||||||||
| 6,500 | Archstone-Smith Trust, Inc. | 378,365 | |||||||||
| REIT - Diversified - 0.7% | |||||||||||
| 16,400 | Crescent Real Estate Equities, Inc. | 323,900 | |||||||||
| 4,700 | Liberty Property Trust | 230,958 | |||||||||
| 554,858 | |||||||||||
| REIT - Office Property - 1.0% | |||||||||||
| 3,300 | Alexandria Real Estate Equities, Inc. | 331,320 | |||||||||
| 9,396 | Douglas Emmett, Inc. | 249,840 | |||||||||
| 3,900 | Mack-Cali Realty Corp. | 198,900 | |||||||||
| 780,060 | |||||||||||
See Notes to Schedule of Investments and Financial Statements.
8 Janus Aspen Series December 31, 2006
Schedule of Investments
As of December 31, 2006
| Shares or Principal Amount | Value | ||||||||||
| REIT - Regional Malls - 0.4% | |||||||||||
| 3,800 | Macerich Co. | $ | 328,966 | ||||||||
| REIT - Shopping Centers - 0.7% | |||||||||||
| 11,700 | Weingarten Realty Investors | 539,487 | |||||||||
| REIT - Warehouse and Industrial - 0.8% | |||||||||||
| 10,700 | ProLogis | 650,239 | |||||||||
| Retail - Apparel and Shoe - 2.2% | |||||||||||
| 20,000 | Chico's FAS, Inc.* | 413,800 | |||||||||
| 28,100 | Foot Locker, Inc. | 616,233 | |||||||||
| 12,000 | Ross Stores, Inc. | 351,600 | |||||||||
| 16,700 | Urban Outfitters, Inc.* | 384,601 | |||||||||
| 1,766,234 | |||||||||||
| Retail - Auto Parts - 0.9% | |||||||||||
| 11,000 | Advance Auto Parts, Inc. | 391,160 | |||||||||
| 2,800 | AutoZone, Inc.* | 323,568 | |||||||||
| 714,728 | |||||||||||
| Retail - Drug Store - 0.7% | |||||||||||
| 18,110 | CVS Corp. | 559,780 | |||||||||
| Retail - Mail Order - 0.5% | |||||||||||
| 11,900 | Williams-Sonoma, Inc. | 374,136 | |||||||||
| Savings/Loan/Thrifts - 0.9% | |||||||||||
| 23,530 | Astoria Financial Corp. | 709,665 | |||||||||
| Semiconductor Components/Integrated Circuits - 0.2% | |||||||||||
| 6,900 | Linear Technology Corp. | 209,208 | |||||||||
| Semiconductor Equipment - 0.5% | |||||||||||
| 27,500 | Teradyne, Inc.* | 411,400 | |||||||||
| Super-Regional Banks - 2.8% | |||||||||||
| 7,200 | PNC Bank Corp. | 533,088 | |||||||||
| 11,968 | SunTrust Banks, Inc. | 1,010,698 | |||||||||
| 19,500 | U.S. Bancorp | 705,705 | |||||||||
| 2,249,491 | |||||||||||
| Telecommunication Equipment - 0.3% | |||||||||||
| 17,800 | Avaya, Inc.* | 248,844 | |||||||||
| Telecommunication Equipment - Fiber Optics - 0.4% | |||||||||||
| 16,000 | Corning, Inc.* | 299,360 | |||||||||
| Telephone - Integrated - 1.5% | |||||||||||
| 7,700 | ALLTEL Corp. | 465,696 | |||||||||
| 6,600 | CenturyTel, Inc. | 288,156 | |||||||||
| 23,400 | Sprint Nextel Corp. | 442,026 | |||||||||
| 1,195,878 | |||||||||||
| Transportation - Railroad - 1.9% | |||||||||||
| 12,600 | CSX Corp. | 433,818 | |||||||||
| 24,700 | Kansas City Southern* | 715,806 | |||||||||
| 7,700 | Norfolk Southern Corp. | 387,233 | |||||||||
| 1,536,857 | |||||||||||
| Transportation - Services - 0.4% | |||||||||||
| 10,500 | Laidlaw International, Inc. | 319,515 | |||||||||
| Transportation - Truck - 0.7% | |||||||||||
| 26,800 | J.B. Hunt Transport Services, Inc. | 556,636 | |||||||||
| Total Common Stock (cost $64,218,421) | 74,445,566 | ||||||||||
| Shares or Principal Amount | Value | ||||||||||
| Money Markets - 8.3% | |||||||||||
| 528,600 | Janus Institutional Cash Reserves Fund, 5.29% | $ | 528,600 | ||||||||
| 6,153,705 | Janus Money Market Fund, 5.24% | 6,153,705 | |||||||||
| Total Money Markets (cost $6,682,305) | 6,682,305 | ||||||||||
| Total Investments (total cost $70,900,726) – 100.8% | 81,127,871 | ||||||||||
| Liabilities, net of Cash, Receivables and Other Assets – (0.8)% | (683,762 | ) | |||||||||
| Net Assets – 100% | $ | 80,444,109 | |||||||||
Summary of Investments by Country
| Country | Value | % of Investment Securities | |||||||||
| Bermuda | $ | 1,775,904 | 2.2 | % | |||||||
| Canada | 971,692 | 1.2 | % | ||||||||
| Israel | 232,352 | 0.3 | % | ||||||||
| United States†† | 78,147,923 | 96.3 | % | ||||||||
| Total | $ | 81,127,871 | 100 | % | |||||||
†† Includes Short-Term Securities (88.1% excluding Short-Term Securities)
See Notes to Schedule of Investments and Financial Statements.
Janus Aspen Series December 31, 2006 9
Statement of Assets and Liabilities
| As of December 31, 2006 (all numbers in thousands except net asset value per share) | Janus Aspen Mid Cap Value Portfolio | ||||||
| Assets: | |||||||
| Investments at cost | $ | 70,901 | |||||
| Investments at value | $ | 81,128 | |||||
| Cash | 390 | ||||||
| Receivables: | |||||||
| Investments sold | 1,277 | ||||||
| Portfolio shares sold | 2 | ||||||
| Dividends | 76 | ||||||
| Interest | 13 | ||||||
| Other assets | 2 | ||||||
| Total Assets | 82,888 | ||||||
| Liabilities: | |||||||
| Payables: | |||||||
| Investments purchased | 840 | ||||||
| Portfolio shares repurchased | 1,501 | ||||||
| Dividends | 3 | ||||||
| Advisory fees | 42 | ||||||
| Transfer agent fees and expenses | 1 | ||||||
| Distribution fees - Service Shares | 14 | ||||||
| Administrative service fees - Service Shares | 6 | ||||||
| Non-interested Trustees' fees and expenses | 2 | ||||||
| Accrued expenses | 35 | ||||||
| Total Liabilities | 2,444 | ||||||
| Net Assets | $ | 80,444 | |||||
| Net Assets Consist of: | |||||||
| Capital (par value and paid-in-surplus)* | $ | 68,737 | |||||
| Undistributed net investment income/(loss)* | – | ||||||
| Undistributed net realized gain/(loss) from investments and foreign currency transactions* | 1,480 | ||||||
| Unrealized net appreciation/(depreciation) of investments and foreign currency translations | 10,227 | ||||||
| Total Net Assets | $ | 80,444 | |||||
| Net Assets - Institutional Shares | $ | 11,227 | |||||
| Shares Outstanding, $0.001 Par Value (unlimited shares authorized) | 675 | ||||||
| Net Asset Value Per Share | $ | 16.64 | |||||
| Net Assets - Service Shares | $ | 69,217 | |||||
| Shares Outstanding, $0.001 Par Value (unlimited shares authorized) | 4,181 | ||||||
| Net Asset Value Per Share | $ | 16.56 | |||||
* See Note 3 in Notes to Financial Statements.
See Notes to Financial Statements.
10 Janus Aspen Series December 31, 2006
Statement of Operations
| For the fiscal year ended December 31, 2006 (all numbers in thousands) | Janus Aspen Mid Cap Value Portfolio | ||||||
| Investment Income: | |||||||
| Interest | $ | 171 | |||||
| Dividends | 1,334 | ||||||
| Dividends from affiliates | 119 | ||||||
| Foreign tax withheld | (4 | ) | |||||
| Total Investment Income | 1,620 | ||||||
| Expenses: | |||||||
| Advisory fees | 433 | ||||||
| Transfer agent expenses | 4 | ||||||
| Registration fees | 23 | ||||||
| Custodian fees | 23 | ||||||
| Professional fees | 28 | ||||||
| Non-interested Trustees' fees and expenses | 5 | ||||||
| Distribution fees - Service Shares | 147 | ||||||
| Administrative service fees - Service Shares | 59 | ||||||
| Other expenses | 129 | ||||||
| Non-recurring costs (Note 2) | - | ||||||
| Costs assumed by Janus Capital Management LLC (Note 2) | - | ||||||
| Total Expenses | 851 | ||||||
| Expense and Fee Offset | (1 | ) | |||||
| Net Expenses | 850 | ||||||
| Net Investment Income/(Loss) | 770 | ||||||
| Net Realized and Unrealized Gain/(Loss) on Investments: | |||||||
| Net realized gain/(loss) from securities transactions | 4,749 | ||||||
| Net realized gain/(loss) from foreign currency transactions | - | ||||||
| Net realized gain/(loss) from futures contracts | (81 | ) | |||||
| Change in unrealized net appreciation/(depreciation) of investments and foreign currency translations | 4,084 | ||||||
| Net Gain/(Loss) on Investments | 8,752 | ||||||
| Net Increase/(Decrease) in Net Assets Resulting from Operations | $ | 9,522 | |||||
See Notes to Financial Statements.
Janus Aspen Series December 31, 2006 11
Statements of Changes in Net Assets
| For the fiscal year ended December 31 | Janus Aspen Mid Cap Value Portfolio | ||||||||||
| (all numbers in thousands) | 2006 | 2005 | |||||||||
| Operations: | |||||||||||
| Net investment income/(loss) | $ | 770 | $ | 431 | |||||||
| Net realized gain/(loss) from investment and foreign currency transactions | 4,749 | 3,826 | |||||||||
| Net realized gain/(loss) from futures contracts | (81 | ) | 55 | ||||||||
| Change in unrealized net appreciation/(depreciation) of investments and foreign currency translations | 4,084 | 386 | |||||||||
| Payment from affiliate (Note 2) | – | 8 | |||||||||
| Net Increase/(Decrease) in Net Assets Resulting from Operations | 9,522 | 4,706 | |||||||||
| Dividends and Distributions to Shareholders: | |||||||||||
| Net investment income* | |||||||||||
| Institutional Shares | (117 | ) | (84 | ) | |||||||
| Service Shares | (638 | ) | (283 | ) | |||||||
| Net realized gain from investment transactions* | |||||||||||
| Institutional Shares | (432 | ) | (985 | ) | |||||||
| Service Shares | (2,842 | ) | (3,623 | ) | |||||||
| Net Decrease from Dividends and Distributions | (4,029 | ) | (4,975 | ) | |||||||
| Capital Share Transactions: | |||||||||||
| Shares sold | |||||||||||
| Institutional Shares | 4,879 | 2,564 | |||||||||
| Service Shares | 22,610 | 15,948 | |||||||||
| Reinvested dividends and distributions | |||||||||||
| Institutional Shares | 549 | 1,069 | |||||||||
| Service Shares | 3,476 | 3,906 | |||||||||
| Shares repurchased | |||||||||||
| Institutional Shares | (4,946 | ) | (3,744 | ) | |||||||
| Service Shares | (7,933 | ) | (4,722 | ) | |||||||
| Net Increase/(Decrease) from Capital Share Transactions | 18,635 | 15,021 | |||||||||
| Net Increase/(Decrease) in Net Assets | 24,128 | 14,752 | |||||||||
| Net Assets: | |||||||||||
| Beginning of period | 56,316 | 41,564 | |||||||||
| End of period | $ | 80,444 | $ | 56,316 | |||||||
| Undistributed net investment income/(loss)* | $ | – | $ | 77 | |||||||
*See Note 3 in Notes to Financial Statements.
See Notes to Financial Statements.
12 Janus Aspen Series December 31, 2006
Financial Highlights
Institutional Shares
| For a share outstanding during each fiscal year or period ended December 31 | Janus Aspen Mid Cap Value Portfolio | ||||||||||||||||||
| 2006 | 2005 | 2004 | 2003(1) | ||||||||||||||||
| Net Asset Value, Beginning of Period | $ | 15.32 | $ | 15.54 | $ | 13.61 | $ | 10.07 | |||||||||||
| Income from Investment Operations: | |||||||||||||||||||
| Net investment income/(loss) | .20 | .19 | .04 | .03 | |||||||||||||||
| Net gain/(loss) on securities (both realized and unrealized) | 2.06 | 1.31 | 2.39 | 3.54 | |||||||||||||||
| Total from Investment Operations | 2.26 | 1.50 | 2.43 | 3.57 | |||||||||||||||
| Less Distributions and Other: | |||||||||||||||||||
| Dividends (from net investment income)* | (.20 | ) | (.13 | ) | (.04 | ) | (0.3 | ) | |||||||||||
| Distributions (from capital gains)* | (.74 | ) | (1.59 | ) | (.46 | ) | – | ||||||||||||
| Payment from affiliate | – | – | (2) | – | – | ||||||||||||||
| Total Distributions and Other | (.94 | ) | (1.72 | ) | (.50 | ) | (.03 | ) | |||||||||||
| Net Asset Value, End of Period | $ | 16.64 | $ | 15.32 | $ | 15.54 | $ | 13.61 | |||||||||||
| Total Return** | 15.42 | % | 10.43 | %(3) | 18.19 | % | 35.41 | % | |||||||||||
| Net Assets, End of Period (in thousands) | $ | 11,227 | $ | 9,922 | $ | 10,099 | $ | 6,070 | |||||||||||
| Average Net Assets for the Period (in thousands) | $ | 9,223 | $ | 10,160 | $ | 8,108 | $ | 4,457 | |||||||||||
| Ratio of Gross Expenses to Average Net Assets***(4) | .94 | % | 0.87 | % | 1.01 | % | 1.25 | % | |||||||||||
| Ratio of Net Expenses to Average Net Assets***(4) | .94 | % | 0.86 | % | 1.01 | % | 1.25 | % | |||||||||||
| Ratio of Net Investment Income/(Loss) to Average Net Assets*** | 1.45 | % | 1.16 | % | 0.31 | % | 0.46 | % | |||||||||||
| Portfolio Turnover Rate*** | 89 | % | 74 | % | 92 | % | 120 | % | |||||||||||
Service Shares
| For a share outstanding during each fiscal year ended December 31 | Janus Aspen Mid Cap Value Portfolio | ||||||||||||||||||
| 2006 | 2005 | 2004 | 2003 | ||||||||||||||||
| Net Asset Value, Beginning of Period | $ | 15.26 | $ | 15.52 | $ | 13.61 | $ | 10.00 | |||||||||||
| Income from Investment Operations: | |||||||||||||||||||
| Net investment income/(loss) | .14 | .11 | – | (5) | .02 | ||||||||||||||
| Net gain/(loss) on securities (both realized and unrealized) | 2.06 | 1.32 | 2.37 | 3.60 | |||||||||||||||
| Total from Investment Operations | 2.20 | 1.43 | 2.37 | 3.62 | |||||||||||||||
| Less Distributions and Other: | |||||||||||||||||||
| Dividends (from net investment income)* | (.16 | ) | (.10 | ) | – | (5) | (.01 | ) | |||||||||||
| Distributions (from capital gains)* | (.74 | ) | (1.59 | ) | (.46 | ) | – | ||||||||||||
| Payment from affiliate | – | – | (2) | – | – | ||||||||||||||
| Total Distributions and Other | (.90 | ) | (1.69 | ) | (.46 | ) | (.01 | ) | |||||||||||
| Net Asset Value, End of Period | $ | 16.56 | $ | 15.26 | $ | 15.52 | $ | 13.61 | |||||||||||
| Total Return | 15.06 | % | 9.93 | %(3) | 17.79 | % | 36.24 | % | |||||||||||
| Net Assets, End of Period (in thousands) | $ | 69,217 | $ | 46,394 | $ | 31,465 | $ | 23,628 | |||||||||||
| Average Net Assets for the Period (in thousands) | $ | 58,793 | $ | 36,590 | $ | 25,782 | $ | 14,025 | |||||||||||
| Ratio of Gross Expenses to Average Net Assets(4) | 1.30 | % | 1.22 | % | 1.36 | % | 1.50 | % | |||||||||||
| Ratio of Net Expenses to Average Net Assets(4) | 1.30 | % | 1.22 | % | 1.36 | % | 1.50 | % | |||||||||||
| Ratio of Net Investment Income/(Loss) to Average Net Assets | 1.08 | % | 0.86 | % | (0.05 | )% | 0.20 | % | |||||||||||
| Portfolio Turnover Rate | 89 | % | 74 | % | 92 | % | 120 | % | |||||||||||
* See Note 3 in Notes to Financial Statements.
** Total return not annualized for periods of less than one full year.
*** Annualized for periods of less than one full year.
(1) Fiscal period from May 1, 2003 (inception date) through December 31, 2003.
(2) Payment from affiliate aggregated less than $.01 on a per share basis for the fiscal year ended.
(3) During the fiscal year ended, Janus Capital and/or Janus Services LLC fully reimbursed the Portfolio for a loss on a transaction resulting from certain trading, pricing and/or shareholder activity errors, which otherwise would have reduced total return by 0.02%.
(4) See Note 4 in Notes to Financial Statements.
(5) Net investment income/(loss) and dividends (from net investment income) aggregated less than $.01 on a per share basis for the fiscal year ended.
See Notes to Financial Statements.
Janus Aspen Series December 31, 2006 13
Notes to Schedule of Investments
| Lipper Variable Annuity Mid-Cap Value Funds | Funds that, by portfolio practice, invest at least 75% of their equity assets in companies with market capitalizations (on a three-year weighted basis) less than 300% of the dollar-weighted median market capitalization of the middle 1,000 securities of the S&P SuperComposite 1500 Index. Mid-cap value funds typically have a below-average price-to-earnings ratio, price-to-book ratio, and three-year sales-per-share growth value, compared to the S&P MidCap 400 Index. | ||||||
| Russell Midcap® Value Index | Measures the performance of those Russell MidCap companies with lower price-to-book ratios and lower forecasted growth values. The stocks are also members of the Russell 1000® Value Index. | ||||||
| S&P 500® Index | The Standard & Poor's Composite Index of 500 stocks, a widely recognized, unmanaged index of common stock prices. | ||||||
| S&P MidCap 400 Index | An unmanaged group of 400 domestic stocks chosen for their market size, liquidity and industry group representation. | ||||||
| REIT | Real Estate Investment Trust | ||||||
| U.S. Shares | Securities of foreign companies trading on an American Stock Exchange. | ||||||
* Non-income-producing security.
14 Janus Aspen Series December 31, 2006
Notes to Financial Statements
The following section describes the organization and significant accounting policies and provides more detailed information about the schedules and tables that appear throughout this report. In addition, the Notes to Financial Statements explain the methods used in preparing and presenting this report.
1. ORGANIZATION AND SIGNIFICANT ACCOUNTING POLICIES
Janus Aspen Mid Cap Value Portfolio (the "Portfolio") is a series fund. The Portfolio is part of Janus Aspen Series (the "Trust"), which is organized as a Delaware statutory trust and is registered under the Investment Company Act of 1940 (the "1940 Act") as an open-end management investment company. The Trust offers seventeen Portfolios, which include multiple series of shares, with differing investment objectives and policies. The Portfolio invests primarily in equity securities. The Portfolio is classified as diversified, as defined in the 1940 Act. The Portfolio is a no-load investment.
The Portfolio currently offers two classes of shares: Institutional Shares and Service Shares, which commenced operations on May 1, 2003 and December 31, 2002, respectively. Institutional Shares are offered only in connection with investment in and payments under variable insurance contracts and to qualified retirement plans. Service Shares are offered only in connection with investment in and payments under variable insurance contracts and to qualified retirement plans that require a fee from Portfolio assets to procure distribution and administrative services to contract owners and plan participants.
The following accounting policies have been consistently followed by the Portfolio and are in conformity with accounting principles generally accepted in the United States of America in the investment company industry.
Investment Valuation
Securities are valued at the last sales price or the official closing price for securities traded on a principal securities exchange (U.S. or foreign) and on the NASDAQ National Market. Securities traded on over-the-counter markets and listed securities for which no sales are reported are valued at the latest bid price (or yield equivalent thereof) obtained from one or more dealers transacting in a market for such securities or by a pricing service approved by the Portfolio's Trustees. Short-term securities with maturities of 60 days or less may be valued at amortized cost, which approximates market value. Debt securities with a remaining maturity of greater than 60 days are valued in accordance with the evaluated bid price supplied by the pricing service. The evaluated bid price supplied by the pricing service is an evaluation that reflects such factors as security prices, yields, maturities and ratings. Foreign securities and currencies ar e converted to U.S. dollars using the applicable exchange rate in effect as of the daily close of the New York Stock Exchange ("NYSE"). When market quotations are not readily available or deemed unreliable, or events or circumstances that may affect the value of portfolio securities held by the Portfolio are identified between the closing of their principal markets and the time the net asset value ("NAV") is determined, securities may be valued at fair value as determined in good faith under procedures established by and under the supervision of the Portfolio's Trustees. The Portfolio may use a systematic fair valuation model provided by an independent third party to value international equity securities in order to adjust for stale pricing, which may occur between the close of certain foreign exchanges and the NYSE.
Investment Transactions and Investment Income
Investment transactions are accounted for as of the date purchased or sold (trade date). Dividend income is recorded on the ex-dividend date. Certain dividends from foreign securities will be recorded as soon as the Trust is informed of the dividend if such information is obtained subsequent to the ex-dividend date and may be subject to withholding taxes in these jurisdictions. Interest income is recorded on the accrual basis and includes amortization of premiums and accretion of discounts. Gains and losses are determined on the identified cost basis, which is the same basis used for federal income tax purposes. Income, as well as gains and losses, both realized and unrealized, are allocated daily to each class of shares based upon the ratio of net assets represented by each class as a percentage of total net assets.
Expenses
The Portfolio bears expenses incurred specifically on its behalf as well as a portion of general expenses. Each class of shares bears expenses incurred specifically on its behalf and, in addition, each class bears a portion of general expenses, which may be based upon relative net assets of each class. Expenses are allocated daily to each class of shares based upon the ratio of net assets represented by each class as a percentage of total net assets. Expenses directly attributable to a specific class of shares are charged against the operations of such class.
Interfund Lending
Pursuant to an exemptive order received from the SEC, the Portfolio may be party to an interfund lending agreement between the Portfolio and other Janus Capital Management LLC ("Janus Capital") sponsored mutual funds, which permits it to borrow or lend cash at a rate beneficial to both the borrowing and lending funds. Outstanding borrowings from all sources totaling 10% or more of the borrowing Portfolio's total assets must be collateralized at 102% of the outstanding principal value of the loan; loans of less than 10% may be unsecured. During the fiscal year ended December 31, 2006, there were no outstanding interfund borrowing or lending arrangements for the Portfolio.
Forward Currency Transactions
The Portfolio may enter into forward currency contracts in order to reduce its exposure to changes in foreign currency exchange rates on its foreign portfolio holdings and to lock in the U.S. dollar cost of firm purchase and sale commitments for securities denominated in or exposed to foreign currencies. A
Janus Aspen Series December 31, 2006 15
Notes to Financial Statements (continued)
forward currency exchange contract is a commitment to purchase or sell a foreign currency at a future date at a negotiated rate. The gain or loss arising from the difference between the U.S. dollar cost of the original contract and the value of the foreign currency in U.S. dollars upon closing a contract is included in "Net realized gain/(loss) from foreign currency transactions" on the Statement of Operations (if applicable).
Forward currency contracts held by the Portfolio are fully collateralized by other securities, which are denoted in the accompanying Schedule of Investments (if applicable). The collateral is evaluated daily to ensure its market value equals or exceeds the current market value of the corresponding forward currency contracts. As of December 31, 2006, the Portfolio was not invested in forward currency contracts.
Futures Contracts
The Portfolio may enter into futures contracts. The Portfolio intends to use such derivative instruments primarily to hedge or protect from adverse movements in securities prices, currency rates or interest rates. The use of futures contracts may involve risks such as the possibility of illiquid markets or imperfect correlation between the value of the contracts and the underlying securities, or that the counterparty will fail to perform its obligations.
Futures contracts are marked-to-market daily, and the daily variation margin is recorded as a receivable or payable on the Statement of Assets and Liabilities (if applicable). When a contract is closed, a realized gain or loss is recorded on the Statement of Operations equal to the difference between the opening and closing value of the contract. Generally, futures contracts are marked-to-market (i.e., treated as realized and subject to distribution) for federal income tax purposes at fiscal year end. Securities designated as collateral for market value on futures contracts are noted in the Schedule of Investments. Such collateral is in the possession of the Portfolio's custodian. As of December 31, 2006, the Portfolio was not invested in futures contracts.
Short Sales
The Portfolio may engage in "short sales against the box." Short sales against the box involve selling either a security that the Portfolio owns, or a security equivalent in kind and amount to the security sold short that the Portfolio has the right to obtain, for delivery at a specified date in the future. The Portfolio may enter into a short sale against the box to hedge against anticipated declines in the market price of portfolio securities. If the value of the securities sold short increases prior to the scheduled delivery date, the Portfolio loses the opportunity to participate in the gain.
The Portfolio may also engage in "naked" short sales. Naked short sales involve the Portfolio selling a security it does not own to a purchaser at a specified price. To complete the transaction, the Portfolio must borrow the security to deliver it to the purchaser and buy that same security in the market to return it to the lender. Although the potential for gain is limited to the difference between the price at which the Portfolio sold the security short and the cost of borrowing the security, its potential for loss could be unlimited because there is no limit to the replacement cost of the borrowed security. There is no assurance that the Portfolio will be able to close out a short position at any particular time or at an acceptable price. A gain or a loss will be recognized upon termination of a short sale. There is no limit on the size of any loss that the Portfolio may recognize upon termination of a short sale. Short sales held by the Portfolio are fully collateralized by other securities, which are denoted in the accompanying Schedule of Investments (if applicable). As of December 31, 2006, the Portfolio was not invested in short sales.
Foreign Currency Translations
The Portfolio does not isolate that portion of the results of operations resulting from changes in foreign exchange rates on investments from the fluctuations arising from changes in market prices of securities held at the date of the financial statements. Net unrealized appreciation or depreciation on investments and foreign currency translation arise from changes in the value of assets and liabilities, including investments in securities held at the date of the financial statements, resulting from changes in the exchange rates and changes in market prices of securities held.
Currency gains and losses are also calculated on payables and receivables that are denominated in foreign currencies. The payables and receivables are generally related to security transactions and income.
Foreign-denominated assets and forward currency contracts may involve more risks than domestic transactions, including currency risk, political and economic risk, regulatory risk and market risk. Risks may arise from the potential inability of a counterparty to meet the terms of a contract and from unanticipated movements in the value of foreign currencies relative to the U.S. dollar.
When-issued Securities
The Portfolio may purchase or sell securities on a when-issued or forward commitment basis. The price of the underlying securities and date when the securities will be delivered and paid for are fixed at the time the transaction is negotiated. Losses may arise due to changes in the market value of the securities or from the inability of counterparties to meet the terms of the contract. In connection with such purchases, the Portfolio may hold liquid assets as collateral with the Portfolio's custodian sufficient to cover the purchase price. As of December 31, 2006, the Portfolio was not invested in when-issued securities.
Equity-Linked Structured Notes
The Portfolio may invest in equity-linked structured notes. Equity-linked structured notes are derivative securities which
16 Janus Aspen Series December 31, 2006
are specially designed to combine the characteristics of one or more underlying securities and their equity derivatives in a single note form. The return and/or yield or income component may be based on the performance of the underlying equity securities, an equity index, and/or option positions. Equity-linked structured notes are typically offered in limited transactions by financial institutions in either registered or nonregistered form. An investment in equity-linked structured notes creates exposure to the credit risk of the issuing financial institution, as well as to the market risk of the underlying securities. There is no guaranteed return of principal with these securities and the appreciation potential of these securities may be limited by a maximum payment or call right. In certain cases, equity-linked structured notes may be more volatile and less liquid than less complex securities or other types of fixed-income securities. Suc h securities may exhibit price behavior that does not correlate with other fixed-income securities. As of December 31, 2006, the Portfolio was not invested in equity-linked structured notes.
Initial Public Offerings
The Portfolio may invest in initial public offerings ("IPOs"). IPOs and other investment techniques may have a magnified performance impact on a fund with a small asset base. The Portfolio may not experience similar performance as its assets grow.
Additional Investment Risk
The Portfolio may be invested in lower-rated debt securities that have a higher risk of default or loss of value since these securities may be sensitive to economic changes, political changes or adverse developments specific to the issuer.
Restricted Security Transactions
Restricted securities held by the Portfolio may not be sold except in exempt transactions or in a public offering registered under the Securities Act of 1933. The risk of investing in such securities is generally greater than the risk of investing in the securities of widely held, publicly traded companies. Lack of a secondary market and resale restrictions may result in the inability of the Portfolio to sell a security at a fair price and may substantially delay the sale of the security. In addition, these securities may exhibit greater price volatility than securities for which secondary markets exist.
Dividend Distributions
The Portfolio generally makes semiannual distributions of substantially all of its investment income and an annual distribution of its net realized capital gains (if any). The majority of dividends and net realized capital gains distributions from the Portfolio may be automatically reinvested into additional shares of the Portfolio, based upon the discretion of the shareholder.
Estimates
The preparation of financial statements in conformity with accounting principles generally accepted in the United States of America requires management to make estimates and assumptions that affect the reported amount of assets and liabilities and disclosure of contingent assets and liabilities at the date of the financial statements and the reported amounts of income and expenses during the reporting period. Actual results could differ from those estimates.
Federal Income Taxes
No provision for income taxes is included in the accompanying financial statements, as the Portfolio intends to distribute to shareholders all taxable investment income and realized gains and otherwise comply with Subchapter M of the Internal Revenue Code applicable to regulated investment companies.
New Accounting Pronouncements
In July 2006, the Financial Accounting Standards Board ("FASB") issued Interpretation No. 48, "Accounting for Uncertainty in Income Taxes – an Interpretation of FASB Statement No. 109" (the "Interpretation"). The Interpretation establishes for all entities, including pass-through entities such as the Portfolio, a minimum threshold for financial statement recognition of the benefit of positions taken in filing tax returns (including whether an entity is taxable in a particular jurisdiction), and requires certain expanded tax disclosures. A calendar year open-end or closed-end fund would implement the interpretation no later than June 29, 2007 (the last business day of the semi-annual reporting period), and will also apply to all open tax years as of the date of effectiveness. Management has recently begun to evaluate the application of the Interpretation to the Portfolio, and is not in a position at this time to estimate the significance of its impact, if any, on the Portfolio's financial statements.
In September 2006, the FASB issued Statement of Financial Accounting Standards No. 157, "Fair Value Measurements" ("SFAS No. 157"), which defines fair value, establishes a framework for measuring fair value in generally accepted accounting principles, and expands disclosures about fair value measurements. SFAS No. 157 does not require new fair value measurements, but is applied to the extent that other accounting pronouncements require or permit fair value measurements. SFAS No. 157 emphasizes that fair value is a market-based measurement that should be determined based on the assumptions that market participants would use in pricing an asset or liability. Companies will be required to disclose the extent to which fair value is used to measure assets and liabilities, the inputs used to develop the measurements, and the effect for fiscal years beginning after November 15, 2007. Management is currently evaluating the potential impact the adopt ion of SFAS No. 157 will have on the Portfolio's financial condition and results of operations.
2. INVESTMENT ADVISORY AGREEMENTS AND OTHER TRANSACTIONS WITH AFFILIATES
The Portfolio pays a monthly advisory fee to Janus Capital based upon average daily net assets and calculated at the annual rate of 0.64%.
Effective February 1, 2006, the investment advisory fee rates changed from a fixed rate to a rate that adjusts upward or downward based upon the Portfolio's performance relative to a selected benchmark index. This change does not impact the current investment advisory fee until one year after the effective date when the performance adjustment takes effect.
Janus Aspen Series December 31, 2006 17
Notes to Financial Statements (continued)
Perkins, Wolf, McDonnell and Company, LLC. ("Perkins") serves as subadviser to the Portfolio. As compensation for its services, Perkins receives directly a fee equal to 50% of Janus Capital's management fee (net of any reimbursement of expense incurred or fees waived by Janus Capital). Janus Capital has a 30% ownership stake in Perkins' investment advisory business.
Janus Capital has agreed until at least May 1, 2008 to reimburse the Portfolio by the amount, if any, that the normal operating expenses in any fiscal year, including the investment advisory fee but excluding the distribution and shareholder servicing (12b-1) fees applicable to Service Shares, the administrative services fees applicable to Service Shares, brokerage commissions, interest, taxes and extraordinary expenses, exceed an annual rate of 1.24% of the average daily net assets of the Portfolio. The Portfolio is not required to repay any such waived fees in future years to Janus Capital.
Janus Services LLC ("Janus Services"), a wholly-owned subsidiary of Janus Capital, is the Portfolio's transfer agent. Janus Services receives from the Portfolio a fee at an annual rate of up to 10% of the average daily net assets of Service Shares of the Portfolio, to compensate Janus Services for providing, or arranging for the provision of record keeping, subaccounting and administrative services.
Janus Services receives certain out-of-pocket expenses for transfer agent services.
Certain officers of the Portfolio may also be officers and/or directors of Janus Capital. Such officers receive no compensation from the Portfolio, except for the Portfolio's Chief Compliance Officer. Effective January 1, 2006, the Portfolio began reimbursing the adviser for a portion of the compensation paid to the Chief Compliance Officer of the Trust. Total compensation of $137 was paid by the Portfolio during the fiscal year ended December 31, 2006. The Portfolio's portion is reported as part of "Other Expenses" on the Statement of Operations.
The Board of Trustees has adopted a deferred compensation plan (the "Deferred Plan") for independent Trustees to elect to defer receipt of all or a portion of the annual compensation they are entitled to receive from the Portfolio. All deferred fees are credited to an account established in the name of the Trustees. The amounts credited to the account then increase or decrease, as the case may be, in accordance with the performance of one or more of the Janus funds that are selected by the Trustees. The account balance continues to fluctuate in accordance with the performance of the selected fund or funds until final payment of all amounts credited to the account. Trustees are allowed to change their designation of mutual funds from time to time. Amounts will be deferred until distributed in accordance to the Deferred Plan. No deferred fees were paid to any Trustee under the Deferred Plan during the fiscal year ended December 31, 2006.
During the fiscal year ended December 31, 2005, Janus Capital reimbursed the Portfolio $1,554 for Institutional Shares and $6,300 for Service Shares as a result of dilutions caused by certain trading and/or pricing errors. Reimbursements are included in "Payment from affiliate" on the Statements of Changes in Net Assets.
For the fiscal year ended December 31, 2006, Janus Capital assumed $21,288 of legal, consulting and Trustee costs and fees incurred by the funds in Janus Investment Fund, Janus Aspen Series and Janus Adviser Series (the "Funds") in connection with the regulatory and civil litigation matters discussed in Note 7. These non-recurring costs were allocated to all Funds based upon the Funds' respective net assets as of July 31, 2004. Additionally, all future non-recurring costs will be allocated based upon the Funds' respective net assets on July 31, 2004. These non-recurring costs and costs assumed by Janus Capital are shown on the Statement of Operations.
Janus Distributors LLC, a wholly-owned subsidiary of Janus Capital, is a distributor of the Portfolio. Service Shares have adopted a Distribution and Shareholder Servicing Plan (the "Plan") pursuant to Rule 12b-1 under The 1940 Act. The Plan authorizes payments by the Portfolio in connection with the distribution of Service Shares at an annual rate of up to 0.25% of Service Shares' average daily net assets.
The Portfolio's expenses may be reduced by expense offsets from an unaffiliated custodian and/or transfer agent. Such credits or offsets are included in Expense and Fee Offset on the Statement of Operations. The transfer agent fee offsets received during the period reduce Transfer Agent Fees and Expenses. Custodian offsets received reduce Custodian Fees. The Portfolio could have employed the assets used by the custodian and/or transfer agent to produce income if it had not entered into an expense offset arrangement.
The Portfolio may invest in money market funds, including funds managed by Janus Capital. During the fiscal year ended December 31, 2006, the Portfolio recorded distributions from affiliated investment companies as affiliated dividend income, and had the following affiliated purchases and sales:
| Purchases Shares/Cost | Sales Shares/Cost | Dividend Income | Value at 12/31/06 | ||||||||||||||||
| Janus Aspen Mid Cap Value Portfolio | |||||||||||||||||||
| Janus Government Money Market Fund | $ | 1,075,441 | $ | 1,075,441 | $ | 1,947 | $ | – | |||||||||||
| Janus Institutional Cash Reserves Fund | 8,945,931 | 8,417,331 | 49,424 | 528,600 | |||||||||||||||
| Janus Money Market Fund | 10,768,933 | 4,615,228 | 67,475 | 6,153,705 | |||||||||||||||
| $ | 20,790,305 | $ | 14,108,000 | $ | 118,846 | $ | 6,682,305 | ||||||||||||
18 Janus Aspen Series December 31, 2006
3. FEDERAL INCOME TAX
The tax components of capital shown in the table below represent: (1) distribution requirements the Portfolio must satisfy under the income tax regulations; (2) losses or deductions the Portfolio may be able to offset against income and gains realized in future years; and (3) unrealized appreciation or depreciation of investments for federal income tax purposes.
In 2006, the Portfolio incurred "Post-October" losses during the period from November 1, 2006 through December 31, 2006. These losses will be deferred for tax purposes and recognized in 2007.
Other book to tax differences in the current year primarily consist of foreign currency contract adjustments. The Portfolio has elected to treat gains and losses on forward foreign currency contracts as capital gains and losses. Other foreign currency gains and losses on debt instruments are treated as ordinary income for federal income tax purposes pursuant to Section 988 of the Internal Revenue Code.
Accumulated capital losses noted below represent net capital loss carryovers, as of December 31, 2006, that may be available to offset future realized capital gains and thereby reduce future taxable gains distributions.
| Portfolio | Undistributed Ordinary Income | Undistributed Long–Term Gains | Accumulated Capital Losses | Post October Deferral | Other Book to Tax Differences | Net Tax Appreciation/ (Depreciation) | |||||||||||||||||||||
| Janus Aspen Mid Cap Value Portfolio(1) | $ | 1,511,426 | $ | 2,665,394 | $ | (2,560,168 | ) | $ | (33 | ) | $ | – | $ | 10,090,364 | |||||||||||||
(1) Capital loss carryover is subject to annual limitations.
The table below shows the expiration dates of the carryovers.
Capital Loss Carryover Expiration Schedule
For the year ended December 31, 2006
| Portfolio | December 31, 2009 | December 31, 2010 | |||||||||
| Janus Aspen Mid Cap Value Portfolio(1) | $ | (1,920,126 | ) | $ | (640,042 | ) | |||||
(1) Capital loss carryover is subject to annual limitations.
During the year ended December 31, 2006, the following capital loss carryover was utilized by the Portfolio as indicated in the table below.
| Portfolio | Capital Loss Carryover Utilized | ||||||
| Janus Aspen Mid Cap Value Portfolio | $ | 640,042 | |||||
The aggregate cost of investments and the composition of unrealized appreciation and depreciation of investment securities for federal income tax purposes as of December 31, 2006 are noted below.
Unrealized appreciation and unrealized depreciation in the table below exclude appreciation/depreciation on foreign currency translations. The primary difference between book and tax appreciation or depreciation of investments is wash sale loss deferrals.
| Portfolio Federal Tax | Unrealized Cost | Unrealized Appreciation | (Depreciation) | ||||||||||||
| Janus Aspen Mid Cap Value Portfolio | $ | 71,037,507 | $ | 11,166,803 | $ | (1,076,439 | ) | ||||||||
Income and capital gains distributions are determined in accordance with income tax regulations that may differ from accounting principles generally accepted in the United States of America. These differences are due to differing treatments for items such as net short-term gains, deferral of wash sale losses, foreign currency transactions, net investment losses and capital loss carryovers. Certain permanent differences such as tax returns of capital and net investment losses noted on the next page have been reclassified to paid-in capital.
Janus Aspen Series December 31, 2006 19
Notes to Financial Statements (continued)
| Distributions | |||||||||||||||||||
| For the fiscal year ended December 31, 2006 Portfolio | From Ordinary Income | From Long-Term Capital Gains | Tax Return of Capital | Net Investment Loss | |||||||||||||||
| Janus Aspen Mid Cap Value Portfolio | $ | 1,943,535 | $ | 2,085,845 | $ | – | $ | – | |||||||||||
| Distributions | |||||||||||||||||||
| For the fiscal year ended December 31, 2005 Portfolio | From Ordinary Income | From Long-Term Capital Gains | Tax Return of Capital | Net Investment Loss | |||||||||||||||
| Janus Aspen Mid Cap Value Portfolio | $ | 3,187,635 | $ | 1,787,477 | $ | – | $ | – | |||||||||||
4. EXPENSE RATIOS
The expense ratios listed in the Financial Highlights reflect expenses prior to any expense offsets (gross expense ratio) and after expense offsets (net expense ratio). Both expense ratios reflect expenses after waivers (reimbursement). Listed below are the gross expense ratios for the Portfolio that would be in effect, absent the waiver of certain fees and offsets.
| For each fiscal year or period ended December 31 | Institutional Shares | Service Shares | |||||||||||||||||||||||||||||||||
| Portfolio | 2006(1) | 2005(1) | 2004(1) | 2003(2) | 2006(1) | 2005(1) | 2004(1) | 2003 | |||||||||||||||||||||||||||
| Janus Aspen Mid Cap Value Portfolio | 0.94 | % | 0.87 | % | 1.01 | % | 1.36 | % | 1.30 | % | 1.22 | % | 1.36 | % | 1.90 | % | |||||||||||||||||||
(1) The effect of non-recurring costs assumed by Janus Capital (Note 2) is included in the ratio of operating expenses to average net assets without waivers and/or expense reimbursements and was less than 0.01%.
(2) Fiscal period from May 1, 2003 (inception date) through December 31, 2003.
5. CAPITAL SHARE TRANSACTIONS
| For the fiscal year ended December 31 | Janus Aspen Mid Cap Value Portfolio | ||||||||||
| (all numbers in thousands) | 2006 | 2005 | |||||||||
| Transactions in Portfolio Shares – Institutional Shares: | |||||||||||
| Shares sold | 304 | 169 | |||||||||
| Reinvested dividends and distributions | 36 | 74 | |||||||||
| Shares repurchased | (313 | ) | (245 | ) | |||||||
| Net Increase/(Decrease) in Portfolio Shares | 27 | (2 | ) | ||||||||
| Shares Outstanding, Beginning of Period | 648 | 650 | |||||||||
| Shares Outstanding, End of Period | 675 | 648 | |||||||||
| Transactions in Portfolio Shares – Service Shares: | |||||||||||
| Shares sold | 1,413 | 1,054 | |||||||||
| Reinvested dividends and distributions | 230 | 271 | |||||||||
| Shares repurchased | (502 | ) | (313 | ) | |||||||
| Net Increase/(Decrease) in Portfolio Shares | 1,141 | 1,012 | |||||||||
| Shares Outstanding, Beginning of Period | 3,040 | 2,028 | |||||||||
| Shares Outstanding, End of Period | 4,181 | 3,040 | |||||||||
6. PURCHASES AND SALES OF INVESTMENT SECURITIES
For the fiscal year ended December 31, 2006, the aggregate cost of purchases and proceeds from sales of investment securities (excluding short-term securities) were as follows:
| Portfolio | Purchases of Securities | Proceeds from Sales of Securities | Purchases of Long- Term U.S. Government Obligations | Proceeds from Sales of Long-Term U.S. Government Obligations | |||||||||||||||
| Janus Aspen Mid Cap Value Portfolio | $ | 70,794,665 | $ | 55,629,523 | $ | – | $ | – | |||||||||||
20 Janus Aspen Series December 31, 2006
7. PENDING LEGAL MATTERS
In the fall of 2003, the Securities and Exchange Commission ("SEC"), the Office of the New York State Attorney General ("NYAG"), the Colorado Attorney General ("COAG"), and the Colorado Division of Securities ("CDS") announced that they were investigating alleged frequent trading practices in the mutual fund industry. On August 18, 2004, Janus Capital announced that it had reached final settlements with the SEC, the NYAG, the COAG, and the CDS related to such regulators' investigations into Janus Capital's frequent trading arrangements.
A number of civil lawsuits were brought against Janus Capital and certain of its affiliates, the Janus funds, and related entities and individuals based on allegations similar to those announced by the above regulators and were filed in several state and federal jurisdictions. Such lawsuits alleged a variety of theories for recovery including, but not limited to, the federal securities laws, other federal statutes (including ERISA), and various common law doctrines. The Judicial Panel on Multidistrict Litigation transferred these actions to the U.S. District Court for the District of Maryland (the "Court") for coordinated proceedings. On September 29, 2004, five consolidated amended complaints were filed with the Court that generally include: (i) claims by a putative class of investors in certain Janus funds asserting claims on behalf of the investor class (Marini, et al. v. Janus Investment Fund, et al., U.S. District Court, District of Maryland, Case No. 04-CV-00497); (ii) derivative claims by investors in certain Janus funds ostensibly on behalf of such funds (Steinberg et al. v. Janus Capital Management, LLC et al., U.S. District Court, District of Maryland, Case No. 04-CV-00518); (iii) claims on behalf of participants in the Janus 401(k) plan (Wangberger v. Janus Capital Group Inc., 401(k) Advisory Committee, et al., U.S. District Court, District of Maryland, Case No. JFM-05-2711); (iv) claims brought on behalf of shareholders of Janus Capital Group Inc. ("JCGI") on a derivative basis against the Board of Directors of JCGI (Chasen v. Whiston, et al., U.S. District Court, District of Maryland, Case No. 04-MD-00855); and (v) claims by a putative class of shareholders of JCGI asserting claims on behalf of the shareholders (Wiggins, et al. v. Janus Capital Group, Inc., et al., U.S. District Court, District of Maryland, Case No. 04-CV-00818). In addition, the following were also named as defendants in one or more of the actions: Janus Investment Fund ("JIF"), Janus Aspen Series ("JAS"), Janus Adviser Series ("JAD"), Janus Distributors LLC, Enhanced Investment Technologies, LLC ("INTECH"), Bay Isle Financial LLC ("Bay Isle"), Perkins, Wolf , McDonnell and Company, LLC ("Perkins"), the Advisory Committee of the Janus 401(k) plan, and the current or former directors of JCGI.
On August 25, 2005, the Court entered orders dismissing most of the claims asserted against Janus Capital and its affiliates by fund investors (actions (i) and (ii) described above), except certain claims under Section 10(b) of the Securities Exchange Act of 1934 and under Section 36(b) of the Investment Company Act of 1940, as amended (the "1940 Act"). On August 15, 2006, the complaint in the 401(k) plan class action (action (iii) described above) was dismissed by the district court with prejudice; the plaintiff has appealed that dismissal decision to the United States Court of Appeals for the Fourth Circuit. The Court also dismissed the action against JCGI's Board of Directors without leave to amend (action (iv) described above). Finally, a Motion to Dismiss the action brought by JCGI shareholders (action (v) described above) is fully briefed and pending before the Cou rt.
In addition to the lawsuits described above, the Auditor of the State of West Virginia ("Auditor"), in his capacity as securities commissioner, has initiated administrative proceedings against many of the defendants in the market timing cases (including JCGI and Janus Capital) and, as a part of its relief, is seeking disgorgement and other monetary relief based on similar market timing allegations (In the Matter of Janus Capital Group Inc. et al., Before the Securities Commissioner, State of West Virginia, Summary Order No. 05-1320). The respondents in these proceedings collectively sought a Writ of Prohibition in state court, which was denied. Their subsequent Petition for Appeal was also denied. Consequently, in September 2006, JCGI and Janus Capital filed their answer to the A uditor's summary order instituting proceedings and requested a hearing. JCGI and Janus Capital, as well as other similarly situated defendants, continue to challenge the statutory authority of the Auditor to bring such an action. No further proceedings are currently scheduled.
In addition to the "market timing" actions described above, Janus Capital is a defendant in a consolidated lawsuit in the U.S. District Court for the District of Colorado challenging the investment advisory fees charged by Janus Capital to certain Janus funds (Walter Sins, et al. v. Janus Capital Management LLC, U.S. District Court, District of Colorado, Case No. 04-CV-01647-WDM-MEH; Michael Fleisher, et al. v. Janus Capital Management, LLC, 04-CV-02395-MSK-CBS). The action was filed in 2004 by fund investors asserting breach of fiduciary duty under Section 36(b) of the 1940 Act. The plaintiffs seek declaratory and injunctive relief and an unspecified amount of damages. The trial is scheduled to commence on May 21, 2007.
In 2001, Janus Capital's predecessor was also named as a defendant in a class action suit in the U.S. District Court for the Southern District of New York, alleging that certain underwriting firms and institutional investors violated antitrust laws in connection with initial public offerings (Pfeiffer v. Credit Suisse First Boston aka In re Initial Public Offering Antitrust Litigation, U.S. District Court, Southern District of New York, Case No. 01-CV-2014). The U.S. District Court dismissed the plaintiff's antitrust claims in November 2003; however, the U.S. Court of Appeals vacated that decision and remanded it for further proceedings. In March 2006, the defendants, including Janus Capital, filed a Petition for a Writ of Certiorari with the U.S. Supreme Court to review the decision of the U. S. Court of Appeals. In June 2006, the U.S. Supreme Court invited the U.S. Solicitor General to file a brief expressing the view of the United States, and in November 2006, the Solicitor General filed a brief expressing its view on the matter. The U.S. Supreme Court has granted the Petition for a Writ of Certiorari and the parties are in the process of briefing the matter for the U.S. Supreme Court.
Additional lawsuits may be filed against certain of the Janus funds, Janus Capital, and related parties in the future. Janus Capital does not currently believe that these pending actions will materially affect its ability to continue providing services it has agreed to provide to the Janus funds.
Janus Aspen Series December 31, 2006 21
Report of Independent Registered Public Accounting Firm
To the Trustees and Shareholders of
Janus Aspen Mid Cap Value Portfolio
In our opinion, the accompanying statement of assets and liabilities, including the schedule of investments, and the related statements of operations and of changes in net assets and the financial highlights present fairly, in all material respects, the financial position of Janus Aspen Mid Cap Value Portfolio (one of the portfolios constituting Janus Aspen Series, hereafter referred to as the "Portfolio") at December 31, 2006, the results of its operations for the year then ended, the changes in its net assets for each of the two years in the period then ended, and the financial highlights for each of the periods indicated, in conformity with accounting principles generally accepted in the United States of America. These financial statements and financial highlights (hereafter referred to as "financial statements") are the responsibility of the Portfolio's management; our responsibility is to express an opinion on these financial statements based on our audits. We conducted our audits of these financial statements in accordance with the standards of the Public Company Accounting Oversight Board (United States). Those standards require that we plan and perform the audit to obtain reasonable assurance about whether the financial statements are free of material misstatement. An audit includes examining, on a test basis, evidence supporting the amounts and disclosures in the financial statements, assessing the accounting principles used and significant estimates made by management, and evaluating the overall financial statement presentation. We believe that our audits, which included confirmation of securities at December 31, 2006 by correspondence with the custodian, transfer agent and brokers, and the application of alternative auditing procedures where securities purchased had not been received, provide a reasonable basis for our opinion.

PricewaterhouseCoopers LLP
Denver, Colorado
February 12, 2007
22 Janus Aspen Series December 31, 2006
Additional Information (unaudited)
PROXY VOTING POLICIES AND VOTING RECORD
A description of the policies and procedures that the Portfolio uses to determine how to vote proxies relating to its portfolio securities is available: (i) without charge, upon request, by calling 1-800-525-0020 (toll free); (ii) on the Portfolio's website at www.janus.com/proxyvoting; and (iii) on the SEC's website at http://www.sec.gov. Additionally, information regarding the Portfolio's proxy voting record for the most recent twelve-month period ended June 30 is also available, free of charge, through www.janus.com/proxyvoting and from the SEC's website at http://www.sec.gov.
QUARTERLY PORTFOLIO HOLDINGS
The Portfolio files its complete portfolio holdings (schedule of investments) with the SEC for the first and third quarters of each fiscal year on Form N-Q within 60 days of the end of such fiscal quarter. The Portfolio's Form N-Q: (i) is available on the SEC's website at http://www.sec.gov; (ii) may be reviewed and copied at the SEC's Public Reference Room in Washington, D.C. (information on the Public Reference Room may be obtained by calling 1-800-SEC-0330); and (iii) is available without charge, upon request, by calling Janus at 1-800-525-0020 (toll free).
APPROVAL OF ADVISORY AGREEMENTS DURING THE PERIOD
The Trustees of Janus Aspen Series, more than eighty-five percent of whom have never been affiliated with the Adviser ("Independent Trustees"), oversee the management of each of the Portfolios and, as required by law, determine annually whether to continue the investment advisory agreement for each Portfolio and the subadvisory agreements for the three Portfolios that utilize subadvisers.
In connection with their most recent consideration of those agreements for each of the Portfolios, the Trustees received and reviewed a substantial amount of information provided by Janus Capital (the "Adviser") and the respective subadvisers in response to requests of the Independent Trustees and their independent legal counsel. They also received and reviewed a considerable amount of information and analysis provided to the Trustees by their independent fee consultant. Throughout their consideration of the agreements the Independent Trustees were advised by their independent legal counsel. The Independent Trustees met on two separate occasions with management to consider the agreements, and at each of those meetings they also met separately in executive session with their independent legal counsel.
At a meeting held on December 20, 2006, based on their evaluation of the information provided by the Adviser, the subadvisers and the independent fee consultant and other information, the Trustees determined that the overall arrangements between each Portfolio and the Adviser were fair and reasonable in light of the nature, extent and quality of the services provided by the Adviser, its affiliates and the subadvisers, the fees charged for those services, and other matters that the Trustees considered relevant in the exercise of their business judgment. At that meeting all of the Trustees unanimously approved the continuation of the investment advisory agreement for each Portfolio, and the subadvisory agreement for each subadvised Portfolio, for the period from February 1, 2007 through February 1, 2008, subject to earlier termination as provided in each agreement.
In considering the continuation of those agreements, the Trustees reviewed and analyzed various factors that they determined were relevant, including the factors described below, none of which by itself was considered dispositive. However, the material factors and conclusions that formed basis for the Trustees' determination to approve the continuation of the agreements are discussed separately below.
Nature, Extent and Quality of Services
The Trustees reviewed the nature, extent and quality of the services of Janus Capital and the subadvisers to the Funds, taking into account the investment objective and strategy of each Portfolio and the knowledge the Trustees gained from their regular meetings with management on at least a quarterly basis and their ongoing review of information related to the Funds. In addition, the Trustees reviewed the resources and key personnel of Janus Capital and each subadviser, especially those who provide investment management services to the Portfolios. The Trustees also considered other services provided to the Portfolios by Janus Capital or the subadvisers, such as managing the execution of portfolio transactions and the selection of broker-dealers for those transactions, serving as the Portfolios' administrator, monitoring adherence to the Portfolios' investment restrictions, producing shareholder reports, providing support services for the Tru stees and Trustee committees, communicating with shareholders and overseeing the activities of other service providers, including monitoring compliance with various policies and procedures of the Portfolios and with applicable securities laws and regulations.
The Trustees concluded that: the nature, extent and quality of the services provided by Janus Capital or the subadviser to each Portfolio were appropriate and consistent with the terms of the respective advisory and subadvisory agreements; that, taking into account steps taken to address a small portion of the Portfolios whose performance lagged that of their peers for certain periods, the quality of those services had been consistent with or superior to quality norms in the industry; and that the Portfolios were likely to benefit from the continued provision of those services. They also concluded that each of Janus Capital and each subadviser had sufficient
Janus Aspen Series December 31, 2006 23
Additional Information (unaudited) (continued)
personnel, with the appropriate education and experience, to serve the Portfolios effectively and had demonstrated its continuing ability to attract and retain well-qualified personnel.
Performance of the Funds
The Trustees considered the performance results of each Portfolio over various time periods. They reviewed information comparing each Portfolio's performance with the performance of comparable funds and peer groups identified by Lipper Inc., an independent provider of investment company data, and with the Portfolio's benchmark. They concluded that the performance of most Portfolios was good to very good. Although the performance of some Portfolios lagged that of their peers for certain periods, the Trustees also concluded that Janus Capital had taken appropriate steps to address those instances of under-performance and that the more recent performance of most of those Portfolios had been improving.
Costs of Services Provided
The Trustees examined information on the fees and expenses of each Portfolio in comparison to similar information for other comparable funds as provided by Lipper. They also reviewed an analysis of that information provided by their independent fee consultant and noted that the rate of management (investment advisory and administrative) fees for most of the Portfolios, after contractual expense limitations, was below the mean management fee rate of the respective peer group of funds selected by Lipper.
The Trustees considered the methodology used by Janus Capital and each subadviser in determining compensation payable to portfolio managers, the competitive environment for investment management talent and the competitive market for mutual funds in different distribution channels. They concluded that the compensation methodology provided a good alignment of the interests of the portfolio managers with the interests of Portfolio shareholders.
The Trustees also reviewed management fees charged by Janus Capital to its separate account clients and to its subadvised funds (for which Janus Capital provides only portfolio management services). Although in most instances subadvisory and separate account fee rates for various investment strategies were lower than management fees for Portfolios having a similar strategy, the Trustees noted that Janus Capital performs significant additional services for the Portfolios that it does not provide to those other clients, including administrative services, oversight of the Portfolios' other service providers, trustee support, regulatory compliance and numerous other services, and that, in serving the Portfolios, Janus Capital assumes many legal risks that it does not assume in servicing its other clients. Moreover, they noted that the spread between the average fees charged to the Portfolios and the fees that Janus Capital charged to its separate account clients was significantly smaller than the average spread for such fees of other advisers, based on publicly available data and research conducted by their independent fee consultant.
In considering the fees charged by Janus Capital, the Trustees had previously negotiated with Janus Capital a temporary contingent waiver of a portion the investment advisory fee paid by Janus Aspen Worldwide Growth Portfolio to Janus Capital to provide for a possible reduction in the rate of advisory fee payable by the Portfolio for the period July 1, 2006 through January 31, 2007 if the investment performance of the Fund should lag that of its benchmark performance over the applicable performance measurement period. Commencing in February 2007, the previously approved performance-based fee schedule will become operative.
The Trustees reviewed information on the profitability of Janus Capital and its affiliates of their relationships with each Portfolio, as well as an explanation of the methodology utilized in allocating various expenses among the Portfolios and other clients. The Trustees also reviewed the financial statements of Janus Capital's parent company and its corporate structure. In their review, the Trustees considered whether Janus Capital and each subadviser receive adequate incentives to manage the Portfolios effectively. The Trustees recognized that profitability comparisons among fund managers are difficult because very little comparative information is publicly available and profitability of any manager is affected by numerous factors, including the organizational structure of the particular manager, the types of funds and other accounts it manages, possible other lines of business, the methodology for allocating expenses and the manager's ca pital structure and cost of capital. However, based on the information available and taking those factors into account, the Trustees concluded that Janus Capital's profitability with respect to each Portfolio in relation to the services rendered was not unreasonable.
The Trustees concluded that the management fees and other compensation payable by each Fund to Janus Capital and its affiliates, as well as the fees paid by Janus Capital to the subadvisers of subadvised Portfolios, were reasonable in relation to the nature and quality of the services provided, taking into account the fees charged by other advisers for managing comparable mutual funds with similar strategies and the fees Janus Capital and the subadviser charges to other clients. The Trustees also concluded that the overall expense ratio of each Portfolio was reasonable, taking into account the size of the Portfolio, the quality of services provided by Janus Capital and any subadviser, the
24 Janus Aspen Series December 31, 2006
investment performance of the Portfolio and any expense limitations agreed to by Janus Capital.
Economies of Scale
The Trustees considered information about the potential for Janus Capital to realize economies of scale as the assets of the Portfolios increase. They noted that, although most Portfolios pay advisory fees at a fixed rate as a percentage of net assets, without any breakpoints, the management fee paid by each Portfolio, after any contractual expense limitations, was below the mean management fee rate of the Portfolio's peer group selected by Lipper; and, for those Portfolios whose expenses are being reduced by the contractual expense limitations of Janus Capital, Janus Capital is subsidizing the Portfolios because they have not reached adequate scale. Moreover, as the assets of many of the Portfolios have declined in the past few years, the Portfolios have benefited from having advisory fee rates that have remained constant rather than increasing as assets decline. In addition, performance fee structures have been implemented for several Port folios that will cause the effective rate of advisory fees payable by such a Portfolio to vary depending on the investment performance of the Portfolio relative to its benchmark; and a few Portfolios have fee schedules with breakpoints and reduced fee rates above certain asset levels. The Trustees also noted that the Portfolios share directly in economies of scale through lower charges of third-party service providers based on the combined scale of all of the Portfolios. Based on all of the information they reviewed, the Trustees concluded that the current fee structure of each Portfolio was reasonable and that the current rates of fees do reflect a sharing between Janus Capital and the Portfolio of economies of scale at the current asset level of the Portfolio.
Other Benefits to Janus Capital
The Trustees also considered benefits that accrue to Janus Capital and its affiliates from their relationships with the Portfolios. They recognized that two affiliates of Janus Capital separately serve the Portfolios as transfer agent and distributor, respectively, and that the transfer agent receives compensation from the non-money market Portfolios for services provided. The Trustees also considered Janus Capital's use of commissions paid by Portfolios on their portfolio brokerage transactions to obtain proprietary research products and services benefiting the Portfolios and/or other clients of Janus Capital, as well as Janus Capital's agreement not to use any Portfolio's brokerage transactions to obtain third party research products or services. The Trustees concluded that Janus Capital's use of "soft" commission dollars to obtain proprietary research products and services was consistent with regulatory requirements and guidelines and was likely to benefit each Portfolio. The Trustees also concluded that, other than the services provided by Janus Capital and its affiliates pursuant to the agreements and the fees to be paid by each Portfolio therefor, the Portfolios and Janus Capital may potentially benefit from their relationship with each other in other ways. They concluded that Janus Capital benefits from the receipt of proprietary research products and services acquired through commissions paid on portfolio transactions of the Portfolios and that the Portfolios benefit from Janus Capital's receipt of those products and services as well as research products and services acquired through commissions paid by other clients of Janus Capital. They further concluded that success of any Portfolio could attract other business to Janus Capital or other Janus Funds and that the success of Janus Capital could enhance Janus Capital's ability to serve the Portfolios.
After full consideration of the above factors as well as other factors, all of the Trustees, including all of the Independent Trustees, concluded that the proposed continuation of the investment advisory agreement for each applicable Portfolio were in the best interest of the respective Portfolios and their shareholders.
Janus Aspen Series December 31, 2006 25
Explanations of Charts, Tables and
Financial Statements (unaudited)
1. PERFORMANCE OVERVIEWS
The performance overview graph compares the performance of a hypothetical $10,000 investment in the Portfolio with one or more widely used market indices. The hypothetical example does not represent the returns of any particular investment.
When comparing the performance of the Portfolio with an index, keep in mind that market indices do not include brokerage commissions that would be incurred if you purchased the individual securities in the index. They also do not include taxes payable on dividends and interest or operating expenses incurred if you maintained a Portfolio invested in the index.
Average annual total returns are quoted for each class of the Portfolio. Average annual total return is calculated by taking the growth or decline in value of an investment over a period of time, including reinvestment of any dividends, distributions and capital gains, then calculating the annual compounded percentage rate that would have produced the same result had the rate of growth been constant throughout the period. Average annual total return does not reflect the deduction of taxes that a shareholder would pay on Portfolio distributions or redemptions of Portfolio shares.
2. SCHEDULE OF INVESTMENTS
Following the performance overview section is the Portfolio's Schedule of Investments. This schedule reports the industry concentrations and types of securities held in the Portfolio on the last day of the reporting period. Securities are usually listed by type (common stock, corporate bonds, U.S. Government obligations, etc.) and by industry classification (banking, communications, insurance, etc.). Holdings are subject to change without notice.
The value of each security is quoted as of the last day of the reporting period. The value of securities denominated in foreign currencies is converted into U.S. dollars. Certain short-term investments maturing within 60 days are valued at amortized cost, which approximates market value.
A summary of investments by country is provided if the Portfolio invested in foreign securities. This summary reports the Portfolio's exposure to different countries by providing the percentage of securities invested in each country. The country of each security represents the country in which the company is incorporated.
2A. FORWARD CURRENCY CONTRACTS
A table listing forward currency contracts follows the Portfolio's Schedule of Investments (if applicable). Forward currency contracts are agreements to deliver or receive a preset amount of currency at a future date. Forward currency contracts are used to hedge against foreign currency risk in the Portfolio's long-term holdings. The table provides the name of the foreign currency, the settlement date of the contract, the amount of the contract, the value of the currency in U.S. dollars and the amount of unrealized gain or loss. The amount of unrealized gain or loss reflects the change in currency exchange rates from the time the contract was opened to the last day of the reporting period.
2B. FUTURES
A table listing futures contracts follows the Portfolio's Schedule of Investments (if applicable). Futures contracts are contracts that obligate the buyer to receive and the seller to deliver an instrument or money at a specified price on a specified date. Futures are used to hedge against adverse movements in securities prices, currency risk or interest rates.
The table provides the name of the contract, number of contracts held, the expiration date, the principal amount, value and the amount of unrealized gain or loss. The amount of unrealized gain or loss reflects the marked-to-market amount for the last day of the reporting period.
3. STATEMENT OF ASSETS AND LIABILITIES
This statement is often referred to as the "balance sheet." It lists the assets and liabilities of the Portfolio on the last day of the reporting period.
The Portfolio's assets are calculated by adding the value of the securities owned, the receivable for securities sold but not yet settled, the receivable for dividends declared but not yet received on stocks owned and the receivable for Portfolio shares sold to investors but not yet settled. The Portfolio's liabilities include payables for securities purchased but not yet settled, Portfolio shares redeemed but not yet paid and expenses owed but not yet paid. Additionally, there may be other assets and liabilities such as unrealized gain or loss on forward currency contracts.
The section entitled "Net Assets Consist of" breaks down the components of the Portfolio's net assets. Because the Portfolio must distribute substantially all earnings, you will notice that a significant portion of net assets is shareholder capital.
The last section of this statement reports the net asset value ("NAV") per share on the last day of the reporting period for each class of the Portfolio. The NAV is calculated by dividing the Portfolio's net assets (assets minus liabilities) by the number of shares outstanding.
4. STATEMENT OF OPERATIONS
This statement details the Portfolio's income, expenses, gains and losses on securities and currency transactions, and appreciation or depreciation of current Portfolio holdings.
26 Janus Aspen Series December 31, 2006
The first section in this statement, entitled "Investment Income," reports the dividends earned from stocks and interest earned from interest-bearing securities in the Portfolio.
The next section reports the expenses and expense offsets incurred by the Portfolio, including the advisory fee paid to the investment adviser and transfer agent fees and expenses, and printing and postage for mailing statements, financial reports and prospectuses. Expense offsets, if any, are also shown.
The last section lists the increase or decrease in the value of securities held in the Portfolio. The Portfolio realizes a gain (or loss) when it sells its position in a particular security. An unrealized gain (or loss) refers to the change in net appreciation or depreciation of the Portfolio during the reporting period. "Net Realized and Unrealized Gain/(Loss) on Investments" is affected both by changes in the market value of Portfolio holdings and by gains (or losses) realized during the reporting period.
5. STATEMENT OF CHANGES IN NET ASSETS
This statement reports the increase or decrease in the Portfolio's net assets during the reporting period. Changes in the Portfolio's net assets are attributable to investment operations, dividends, distributions and capital share transactions. This is important to investors because it shows exactly what caused the Portfolio's net asset size to change during the period.
The first section summarizes the information from the Statement of Operations regarding changes in net assets due to the Portfolio's investment performance. The Portfolio's net assets may also change as a result of dividend and capital gains distributions to investors. If investors receive their dividends in cash, money is taken out of the Portfolio to pay the distribution. If investors reinvest their dividends, the Portfolio's net assets will not be affected. If you compare the Portfolio's "Net Decrease from Dividends and Distributions" to the "Reinvested dividends and distributions," you will notice that dividend distributions had little effect on the Portfolio's net assets. This is because the majority of Janus investors reinvest their distributions.
The reinvestment of dividends is included under "Capital Share Transactions." "Capital Shares" refers to the money investors contribute to the Portfolio through purchases or withdraw via redemptions. The Portfolio's net assets will increase and decrease in value as investors purchase and redeem shares from the Portfolio.
6. FINANCIAL HIGHLIGHTS
This schedule provides a per-share breakdown of the components that affect the Portfolio's NAV for current and past reporting periods for each class of the Portfolio. Not only does this table provide you with total return, it also reports total distributions, asset size, expense ratios and portfolio turnover rate.
The first line in the table reflects the NAV per share at the beginning of the reporting period. The next line reports the net investment income per share, which comprises dividends and interest income earned on securities held by the Portfolio. Following is the total of gains, realized and unrealized. Dividends and distributions are then subtracted to arrive at the NAV per share at the end of the period. The next line reflects the average annual total return reported the last day of the period.
Also included are the expense ratios, or the percentage of net assets that is used to cover operating expenses during the period. Expense ratios vary for a number of reasons, including the differences in management fees, the average shareholder account size and the extent of foreign investments, which entail greater transaction costs.
The Portfolio's expenses may be reduced through expense reduction arrangements. These arrangements may include the use of balance credits or transfer agent fee offsets. The Statement of Operations reflects total expenses before any such offset, the amount of offset and the net expenses. The expense ratios listed in the Financial Highlights reflect total expenses prior to any expense offsets (gross expense ratio) and after the expense offsets (net expense ratio). Both expense ratios reflect expenses after waivers (reimbursements), if applicable.
The ratio of net investment income/(loss) summarizes the income earned less expenses, divided by the average net assets of the Portfolio during the reporting period. Don't confuse this ratio with the Portfolio's yield. The net investment income ratio is not a true measure of the Portfolio's yield because it doesn't take into account the dividends distributed to the Portfolio's investors.
The next ratio is the portfolio turnover rate, which measures the buying and selling activity in a Portfolio. Portfolio turnover is affected by market conditions, changes in the asset size of a Portfolio, the nature of the Portfolio's investments and the investment style of the portfolio manager. A 100% rate implies that an amount equal to the value of the entire portfolio is turned over in a year; a 50% rate means that an amount equal to the value of half the portfolio is traded in a year; and a 200% rate means that an amount equal to the value of the portfolio is traded every six months.
Janus Aspen Series December 31, 2006 27
Designation Requirements (unaudited)
For federal income tax purposes, the Portfolio designated the following for the year ended December 31, 2006:
Capital Gain Distributions
| Portfolio | |||||||
| Janus Aspen Mid Cap Value Portfolio | $ | 2,085,845 | |||||
Dividends Received Deduction Percentage
| Portfolio | |||||||
| Janus Aspen Mid Cap Value Portfolio | 37 | % | |||||
28 Janus Aspen Series December 31, 2006
Trustees and Officers (unaudited)
The Portfolio's Statement of Additional Information includes additional information about the Trustees and officers and is available, without charge, by calling 1-800-525-0020.
The following are the Trustees and officers of the Trust, together with a brief description of their principal occupations during the last five years (principal occupations for certain Trustees may include periods over five years).
Each Trustee has served in that capacity since he or she was originally elected or appointed. The Trustees do not serve a specified term of office. Each Trustee will hold office until the termination of the Trust or his or her earlier death, resignation, retirement, incapacity or removal. The retirement age for Trustees is 72. The Portfolio's Nominating and Governance Committee will consider nominees for the position of Trustee recommended by shareholders. Shareholders may submit the name of a candidate for consideration by the Committee by submitting their recommendations to the Trust's Secretary. Each Trustee is currently a Trustee of two other registered investment companies advised by Janus Capital: Janus Investment Fund and Janus Adviser Series. As of the date of this report, collectively, these three registered investment companies consist of 69 series or funds.
The Trust's officers are elected annually by the Trustees for a one-year term. Certain officers also serve as officers of Janus Investment Fund and Janus Adviser Series. Certain officers of the Portfolio may also be officers and/or directors of Janus Capital. Portfolio officers receive no compensation from the Portfolio, except for the Portfolio's Chief Compliance Officer, as authorized by the Trustees.
Trustees
| Name, Age and Address | Positions Held with Portfolio | Length of Time Served | Principal Occupations During the Past Five Years | Number of Portfolios in Fund Complex Overseen by Trustee | Other Directorships Held by Trustee | ||||||||||||||||||
| Independent Trustees | |||||||||||||||||||||||
| Dennis B. Mullen 151 Detroit Street Denver, CO 80206 Age 63 | Chairman Trustee | 3/04-Present 9/93-Present | Chief Executive Officer of Red Robin Gourmet Burgers, Inc. (since 2005). Formerly, private investor. | 69 | * | Chairman of the Board (since 2005) and Director of Red Robin Gourmet Burgers, Inc.; and Director of Janus Capital Funds Plc (Dublin-based, non-U.S. funds). | |||||||||||||||||
| Jerome S. Contro 151 Detroit Street Denver, CO 80206 Age 50 | Trustee | 12/05-Present | Partner of Tango Group, a private investment firm (since 1999). | 69 | Trustee and Chairman of RS Investment Trust (since 2001); Director of IZZE Beverages and MyFamily.com, Inc. (genealogical research website). | ||||||||||||||||||
| William F. McCalpin 151 Detroit Street Denver, CO 80206 Age 49 | Trustee | 6/02-Present | Private Investor. Formerly, Vice President of Asian Cultural Council and Executive Vice President and Chief Operating Officer of The Rockefeller Brothers Fund (a private family foundation). | 69 | Director of the F.B. Heron Foundation (a private grantmaking foundation). | ||||||||||||||||||
| John W. McCarter, Jr. 151 Detroit Street Denver, CO 80206 Age 68 | Trustee | 6/02-Present | President and Chief Executive Officer of The Field Museum of Natural History (Chicago, IL). | 69 | Chairman of the Board and Director of Divergence Inc. (biotechnology firm); Director of W.W. Grainger, Inc. (industrial distributor); and Trustee of WTTW (Chicago public television station) and the University of Chicago. | ||||||||||||||||||
Janus Aspen Series December 31, 2006 29
Trustees and Officers (unaudited) (continued)
Trustees (cont.)
| Name, Age and Address | Positions Held with Portfolio | Length of Time Served | Principal Occupations During the Past Five Years | Number of Portfolios in Fund Complex Overseen by Trustee | Other Directorships Held by Trustee | ||||||||||||||||||
| Independent Trustees (cont.) | |||||||||||||||||||||||
| James T. Rothe 151 Detroit Street Denver, CO 80206 Age 63 | Trustee | 1/97-Present | Co-founder and Managing Director of Roaring Fork Capital Management, LLC (private investment in public equity firm); and Professor Emeritus of Business of the University of Colorado, Colorado Springs, CO (since 2004). Formerly, Professor of Business of the University of Colorado (2002-2004); and Distinguished Visiting Professor of Business (2001-2002) of Thunderbird University (American Graduate School of International Management), Glendale, AZ. | 69 | Director of Red Robin Gourmet Burgers, Inc. | ||||||||||||||||||
| William D. Stewart 151 Detroit Street Denver, CO 80206 Age 62 | Trustee | 9/93-Present | Corporate Vice President and General Manager of MKS Instruments – HPS Products, Boulder, CO (a manufacturer of vacuum fittings and valves). | 69 | N/A | ||||||||||||||||||
| Martin H. Waldinger 151 Detroit Street Denver, CO 80206 Age 68 | Trustee | 9/93-Present | Private Investor and Consultant to California Planned Unit Developments. Formerly, CEO and President of Marwal, Inc. (homeowner association management company). | 69 | N/A | ||||||||||||||||||
| Linda S. Wolf 151 Detroit Street Denver, CO 80206 Age 59 | Trustee | 12/05-Present | Retired. Formerly, Chairman and Chief Executive Officer of Leo Burnett (Worldwide) (advertising agency) (2001-2005). | 69 | Director of Wal-Mart, The Field Museum of Natural History (Chicago, IL), Children's Memorial Hospital (Chicago, IL), Chicago Council on Foreign Relations, Economic Club of Chicago, and InnerWorkings (a provider of print procurement solutions). | ||||||||||||||||||
| Interested Trustee | |||||||||||||||||||||||
| Thomas H. Bailey** 151 Detroit Street Denver, CO 80206 Age 69 | Trustee | 5/93-Present | Retired. Formerly, President (1978-2002) and Chief Executive Officer (1994-2002) of Janus Capital or Janus Capital Corporation; Chairman and Director (1978-2002) of Janus Capital Corporation; President and Director (1994-2002) of The Janus Foundation. | 69 | N/A | ||||||||||||||||||
* Mr. Mullen also serves as director of Janus Capital Funds Plc, consisting of 22 funds. Including Janus Capital Funds Plc and the 69 funds comprising the Janus Funds, Mr. Mullen oversees 91 funds.
** The Portfolio is treating Mr. Bailey as an "interested person" of the Trust by virtue of his past positions and continuing relationships with Janus Capital and ownership of shares of Janus Capital's parent company.
30 Janus Aspen Series December 31, 2006
Officers
| Name, Age and Address | Positions Held with Portfolio | Term of Office* and Length of Time Served | Principal Occupations During the Past Five Years | ||||||||||||
| Stephanie Grauerholz-Lofton 151 Detroit Street Denver, CO 80206 Age 36 | Chief Legal Counsel and Secretary Vice President | 1/06-Present 3/06-Present | Associate Counsel of Janus Capital. Formerly, Associate of Vedder, Price, Kaufman & Kammholz, P.C. (1999-2003). | ||||||||||||
| Kelley Abbott Howes 151 Detroit Street Denver, CO 80206 Age 41 | President and Chief Executive Officer | 1/06-Present | President of Janus Services LLC; Senior Vice President and General Counsel of Janus Capital; and Senior Vice President and Assistant General Counsel of Janus Distributors LLC. Formerly, Vice President (1999-2005) of Janus Distributors LLC; Senior Vice President and General Counsel (2004-2006), Vice President (2000-2004), and Assistant General Counsel (2002-2004) of Janus Services LLC; and Vice President and Assistant General Counsel (1999-2004) of Janus Capital. | ||||||||||||
| David R. Kowalski 151 Detroit Street Denver, CO 80206 Age 49 | Vice President and Chief Compliance Officer | 6/02-Present | Senior Vice President and Chief Compliance Officer of Janus Capital, Janus Distributors LLC, and Janus Services LLC; Chief Compliance Officer of Bay Isle Financial LLC; and Vice President of Enhanced Investment Technologies LLC. Formerly, Chief Compliance Officer of Enhanced Investment Technologies, LLC (2003-2005); Vice President of Janus Capital (2000-2005), Janus Distributors LLC (2000-2001), and Janus Services LLC (2004-2005); and Assistant Vice President of Janus Services LLC (2002-2004). | ||||||||||||
| Jesper Nergaard 151 Detroit Street Denver, CO 80206 Age 44 | Chief Financial Officer Vice President, Treasurer, and Principal Accounting Officer | 3/05-Present 2/05-Present | Vice President of Janus Capital. Formerly, Director of Financial Reporting for OppenheimerFunds, Inc. (2004-2005); Site Manager and First Vice President of Mellon Global Securities Services (2003); and Director of Fund Accounting, Project Development, and Training of INVESCO Funds Group (1994-2003). | ||||||||||||
* Officers are elected at least annually for a one-year term and may also be elected from time to time by the Trustees for an interim period.
Janus Aspen Series December 31, 2006 31
Notes
32 Janus Aspen Series December 31, 2006
Notes
Janus Aspen Series December 31, 2006 33
Janus provides access to a wide range of investment disciplines.
Growth
Janus growth portfolios focus on companies believed to be the leaders in their respective industries, with solid management teams, expanding market share, margins and efficiencies.
Core
Janus core portfolios seek investments in more stable and predictable companies. These portfolios look for a strategic combination of steady growth and for certain portfolios, some degree of income.
Risk-Managed
Our risk-managed portfolios seek to outperform their respective indices while maintaining a risk profile equal to or lower than the index itself. Managed by INTECH (a Janus subsidiary), these portfolios use a mathematical process in an attempt to build a more "efficient" portfolio than the index.
Value
Janus value portfolios invest in companies they believe are poised for a turnaround or are trading at a significant discount to fair value. The goal is to gain unique insight into a company's true value and identify and evaluate potential catalysts that may unlock shareholder value.
International & Global
Janus international and global portfolios seek to leverage Janus' research capabilities by taking advantage of inefficiencies in foreign markets, where accurate information and analytical insight are often at a premium.
Bond & Money Market
Janus bond portfolios attempt to provide less risk relative to equities while seeking to deliver a competitive total return through high current income and appreciation. Janus money market portfolios seek maximum current income consistent with stability of capital.
For more information about our funds, contact your investment professional or go to www.janus.com/info
Please consider the charges, risks, expenses and investment objectives carefully before investing. For a prospectus containing this and other information, please call Janus at 1-800-525-0020 or download the file from www.janus.com/info. Read it carefully before you invest or send money.
An investment in a money market portfolio is not insured or guaranteed by the Federal Deposit Insurance Corporation or any other government agency. Although the Portfolio seeks to preserve the value of your investment at $1.00 per share, it is possible to lose money by investing in the Portfolio.

151 Detroit Street
Denver, CO 80206
1-800-525-0020
Portfolio distributed by Janus Distributors LLC (1/07)
C-0207-169 109-02-719 01-07
2006 Annual Report
Janus Aspen Series
Janus Aspen Money Market Portfolio
Look Inside. . .
• Investment strategy behind your portfolio
• Portfolio performance, characteristics and holdings

Table of Contents
| Useful Information About Your Portfolio Report | 1 | ||||||
| Schedule of Investments | 2 | ||||||
| Statement of Assets and Liabilities | 4 | ||||||
| Statement of Operations | 5 | ||||||
| Statements of Changes in Net Assets | 6 | ||||||
| Financial Highlights | 7 | ||||||
| Notes to Schedule of Investments | 8 | ||||||
| Notes to Financial Statements | 9 | ||||||
| Report of Independent Registered Public Accounting Firm | 14 | ||||||
| Additional Information | 15 | ||||||
| Explanations of Charts, Tables and Financial Statements | 18 | ||||||
| Trustees and Officers | 20 | ||||||
Please consider the charges, risks, expenses and investment objectives carefully before investing. For a prospectus containing this and other information, please call Janus at 1-800-525-0020 or download the file from www.janus.com/info. Read it carefully before you invest or send money.
An investment in a money market fund is not insured or guaranteed by the Federal Deposit Insurance Corporation or any other government agency. Although the Portfolio seeks to preserve the value of your investment at $1.00 per share, it is possible to lose money by investing in the Portfolio.
Useful Information About Your Portfolio Report
Portfolio Expenses
We believe it's important for our shareholders to have a clear understanding of Portfolio expenses and the impact they have on investment return.
The following is important information regarding the Portfolio's Expense Example, which appears on page 2 of this Annual Report. Please refer to this information when reviewing the Expense Example for the Portfolio.
Example
As a shareholder of a Portfolio, you incur two types of costs: (1) transaction costs, including redemption fees (where applicable) (and any related exchange fees) and (2) ongoing costs, including management fees and other Portfolio expenses. The example is intended to help you understand your ongoing costs (in dollars) of investing in a Portfolio and to compare these costs with the ongoing costs of investing in other mutual funds. To do so, compare this 5% hypothetical example with the 5% hypothetical examples that appear in the shareholder reports of the other funds. The example is based upon an investment of $1,000 invested at the beginning of the period and held for the six-month period from July 1, 2006 to December 31, 2006.
Actual Expenses
The first line of the table in each example provides information about actual account values and actual expenses. You may use the information in this line, together with the amount you invested, to estimate the expenses that you paid over the period. Simply divide your account value by $1,000 (for example, an $8,600 account value divided by $1,000 = 8.6), then multiply the result by the number in the first line under the heading entitled "Expenses Paid During Period" to estimate the expenses you paid on your account during the period.
Hypothetical Example for Comparison Purposes
The second line of the table in each example provides information about hypothetical account values and hypothetical expenses based upon the Portfolio's actual expense ratio and an assumed rate of return of 5% per year before expenses, which is not the Portfolio's actual return. The hypothetical account values and expenses may not be used to estimate the actual ending account balance or expenses you paid for the period. You may use this information to compare the ongoing costs of investing in the Portfolio and other funds. To do so, compare this 5% hypothetical example with the 5% hypothetical examples that appear in the shareholder reports of the other funds.
Janus Capital Management LLC ("Janus Capital") has agreed to waive one-half of its advisory fee for the Portfolio. Such waiver is voluntary and could change or be terminated at any time at the discretion of Janus Capital. Expenses in the examples reflect application of these waivers. Had the waivers not been in effect, your expenses would have been higher. More information regarding the waivers is available in the Portfolio's prospectus.
Please note that the expenses shown in the tables are meant to highlight your ongoing costs only and do not reflect any transaction costs, such as redemption fees (where applicable) and any charges at the separate account level or contract level. Redemption fees are fully described in the prospectus. Therefore, the second line of each table is useful in comparing ongoing costs only, and will not help you determine the relative total costs of owning different funds. In addition, if these transaction costs and separate account or contract level charges were included, your costs would have been higher.
Janus Aspen Series December 31, 2006 1
Janus Aspen Money Market
Portfolio (unaudited)
Eric Thorderson
portfolio manager
Average Annual Total Return
For the periods ended December 31, 2006
| Institutional Shares | |||||||
| 1 Year | 4.73 | % | |||||
| 5 Year | 2.24 | % | |||||
| 10 Year | 3.71 | % | |||||
| Since Inception (May 1, 1995) | 3.92 | % | |||||
| Seven-Day Current Yield Institutional Shares: | |||||||
| With Reimbursement | 4.90 | % | |||||
| Without Reimbursement | 4.15 | % | |||||
Data presented represents past performance, which is no guarantee of future results. Current performance may be higher or lower than the performance shown. Call 877.33JANUS or visit www.janus.com/info for performance current to the most recent month-end.
An investment in a money market fund is not insured or guaranteed by the Federal Deposit Insurance Corporation or any other government agency. Although the Portfolio seeks to preserve the value of your investment at $1.00 per share, it is possible to lose money by investing in the Portfolio.
These returns do not reflect the charges and expenses of any particular insurance product or qualified plan. Returns shown would have been lower had they included insurance charges.
Total return includes reinvestment of dividends from net investment income and distributions from capital gains.
See "Explanations of Charts, Tables and Financial Statements."
The yield more closely reflects the current earnings of Janus Aspen Money Market Portfolio than the total return.
Janus Capital Management LLC has agreed to waive one-half of its advisory fee. Such waiver is voluntary and could change or be terminated at any time at the discretion of Janus Capital. Total returns shown include fee waivers, if any, and without such waivers, the Portfolio's yields and total returns would have been lower.
Portfolio Expenses
The examples below show you the ongoing costs (in dollars) of investing in your Portfolio and allow you to compare these costs with those of other mutual funds. Please refer to page 1 for a detailed explanation of the information presented in this chart.
| Expense Example - Institutional Shares | Beginning Account Value (7/1/06) | Ending Account Value (12/31/06) | Expenses Paid During Period (7/1/06-12/31/06)* | ||||||||||||
| Actual | $ | 1,000.00 | $ | 1,024.90 | $ | 2.55 | |||||||||
| Hypothetical (5% return before expenses) | $ | 1,000.00 | $ | 1,022.68 | $ | 2.55 | |||||||||
*Expenses are equal to the annualized expense ratio of 0.50% for Institutional Shares multiplied by the average account value over the period, multiplied by 184/365 (to reflect the one-half year period). Expenses may include the effect of contractual waivers by Janus Capital.
See Notes to Schedule of Investments and Financial Statements.
2 Janus Aspen Series December 31, 2006
Janus Aspen Money Market Portfolio
Schedule of Investments
As of December 31, 2006
| Principal Amount | Value | ||||||||||
| Commercial Paper - 47.6% | |||||||||||
| $ | 350,000 | Atlantic Asset Securitization Corp. 5.27%, 1/16/07 (Section 4(2)) | $ | 349,232 | |||||||
| 350,000 | Banco Bilbao 5.27%, 1/16/07 (Section 4(2)) | 349,231 | |||||||||
| 350,000 | Bavaria TRR Corp. 5.32%, 1/8/07 (Section 4(2)) | 349,638 | |||||||||
| 350,000 | Bryant Park Funding LLC 5.26%, 1/18/07 (Section 4(2)) | 349,131 | |||||||||
| 400,000 | Check Point Charlie, Inc. 5.28%, 2/15/07 (Section 4(2)) | 397,360 | |||||||||
| 350,000 | G Street Finance Corp. 5.30%, 1/24/07 (Section 4(2)) | 348,815 | |||||||||
| 350,000 | Galleon Capital LLC 5.25%, 1/24/07 (Section 4(2))§ | 348,826 | |||||||||
| 301,000 | Gotham Funding Corp. 5.26%, 1/25/07 (Section 4(2)) | 299,944 | |||||||||
| 350,000 | Harrier Finance Funding LLC 5.28%, 1/12/07 (144A) | 349,435 | |||||||||
| 400,000 | K2 (USA) LLC 5.27%, 1/25/07 (Section 4(2)) | 398,595 | |||||||||
| 350,000 | PB Finance (Delaware), Inc. 5.26%, 2/14/07 (Section 4(2)) | 347,750 | |||||||||
| 250,000 | Scaldis Capital LLC 5.30%, 1/8/07 (Section 4(2)) | 249,742 | |||||||||
| 350,000 | Sedna Finance, Inc. 5.28%, 1/10/07 (144A) | 349,538 | |||||||||
| 400,000 | Stanfield Victoria LLC 5.24%, 1/3/07 (144A) | 399,883 | |||||||||
| 350,000 | Thames Asset Global Securitization No. 1, Inc. 5.25%, 1/22/07 (Section 4(2)) | 348,928 | |||||||||
| 350,000 | Victory Receivables Corp. 5.30%, 1/24/07 (Section 4(2)) | 348,815 | |||||||||
| 350,000 | Whistlejacket Capital, Ltd. 5.29%, 1/30/07 (144A) | 348,509 | |||||||||
| Total Commercial Paper (cost $5,933,372) | 5,933,372 | ||||||||||
| Repurchase Agreements - 30.5% | |||||||||||
| 700,000 | Lehman Brothers, Inc., 5.31% dated 12/29/06, maturing 1/3/07 to be repurchased at $700,516 collateralized by $922,921 in U.S. Government Agencies 5.50%, 5/1/35 with a value of $714,012 | 700,000 | |||||||||
| 3,100,000 | UBS Financial Services, Inc., 5.30% dated 12/29/06, maturing 1/3/07 to be repurchased at $3,102,282 collateralized by $5,816,439 in U.S. Government Agencies 5.00% - 5.50%, 3/1/33 - 3/1/34 with a value of $3,162,027 | 3,100,000 | |||||||||
| Total Repurchase Agreements (cost $3,800,000) | 3,800,000 | ||||||||||
| Taxable Variable Rate Demand Notes - 14.0% | |||||||||||
| 300,000 | Anaheim California Housing Authority Multifamily Housing Revenue (Cobblestone), 5.42%, 3/15/33 | 300,000 | |||||||||
| 630,000 | Arapahoe County, Colorado Industrial Development Revenue (Cottrell), Series B, 5.47%, 10/1/19 | 630,000 | |||||||||
| Principal Amount | Value | ||||||||||
| $ | 810,000 | Medical Properties, Inc., North Dakota (Dakota Clinic Project), 5.33%, 12/22/24 | $ | 810,000 | |||||||
| Total Taxable Variable Rate Demand Notes (cost $1,740,000) | 1,740,000 | ||||||||||
| U.S. Government Agency Notes - 8.0% | |||||||||||
| 1,000,000 | Freddie Mac 5.14%, 1/23/07 (cost $996,859) | 996,859 | |||||||||
| Total Investments (total cost $12,470,231) – 100.1% | 12,470,231 | ||||||||||
| Liabilities, net of Cash, Receivables and Other Assets – (0.1)% | (14,524 | ) | |||||||||
| Net Assets – 100% | $ | 12,455,707 | |||||||||
See Notes to Schedule of Investments and Financial Statements.
Janus Aspen Series December 31, 2006 3
Statement of Assets and Liabilities
| As of December 31, 2006 (all numbers in thousands except net asset value per share) | Janus Aspen Money Market Portfolio | ||||||
| Assets: | |||||||
| Investments at cost | $ | 12,470 | |||||
| Investments at value | 8,670 | ||||||
| Repurchase agreements | 3,800 | ||||||
| Cash | 17 | ||||||
| Receivables: | |||||||
| Interest | 14 | ||||||
| Due from adviser | 8 | ||||||
| Other assets | 1 | ||||||
| Total Assets | 12,510 | ||||||
| Liabilities: | |||||||
| Payables: | |||||||
| Portfolio shares repurchased | 12 | ||||||
| Dividends | 2 | ||||||
| Advisory fees | 3 | ||||||
| Transfer agent fees and expenses | – | ||||||
| Non-interested Trustees' fees and expenses | – | ||||||
| Registration fees | 6 | ||||||
| Printing expenses | 8 | ||||||
| Legal fees | 5 | ||||||
| System fees | 4 | ||||||
| Professional fees | 12 | ||||||
| Accrued expenses | 2 | ||||||
| Total Liabilities | 54 | ||||||
| Net Assets | $ | 12,456 | |||||
| Net Assets Consist of: | |||||||
| Capital (par value and paid-in-surplus)* | $ | 12,456 | |||||
| Undistributed net investment income/(loss)* | – | ||||||
| Undistributed net realized gain/(loss) from investments* | – | ||||||
| Total Net Assets | $ | 12,456 | |||||
| Net Assets - Institutional Shares | $ | 12,456 | |||||
| Shares Outstanding, $0.001 Par Value (unlimited shares authorized) | 12,456 | ||||||
| Net Asset Value Per Share | $ | 1.00 | |||||
*See Note 3 in Notes to Financial Statements.
See Notes to Financial Statements.
4 Janus Aspen Series December 31, 2006
Statement of Operations
| For the fiscal year ended December 31, 2006 (all numbers in thousands) | Janus Aspen Money Market Portfolio | ||||||
| Investment Income: | |||||||
| Interest | $ | 634 | |||||
| Total Investment Income | 634 | ||||||
| Expenses: | |||||||
| Advisory fees | 31 | ||||||
| Transfer agent expenses | 3 | ||||||
| Registration fees | 21 | ||||||
| Custodian fees | 8 | ||||||
| Professional fees | 17 | ||||||
| Non-interested Trustees' fees and expenses | 2 | ||||||
| Printing expenses | 29 | ||||||
| Proxy expenses | 5 | ||||||
| Legal fees | 12 | ||||||
| System fees | 32 | ||||||
| Other expenses | 5 | ||||||
| Non-recurring costs (Note 2) | – | ||||||
| Costs assumed by Janus Capital Management LLC (Note 2) | – | ||||||
| Total Expenses | 165 | ||||||
| Expense and Fee Offset | – | ||||||
| Net Expenses | 165 | ||||||
| Less: Excess Expense Reimbursement | (104 | ) | |||||
| Net Expenses after Expense Reimbursement | 61 | ||||||
| Net Investment Income/(Loss) | 573 | ||||||
| Net Realized Gain/(Loss) on Investments: | |||||||
| Net realized gain/(loss) from securities transactions | – | ||||||
| Net Gain/(Loss) on Investments | – | ||||||
| Net Increase/(Decrease) in Net Assets Resulting from Operations | $ | 573 | |||||
See Notes to Financial Statements.
Janus Aspen Series December 31, 2006 5
Statements of Changes in Net Assets
| For the fiscal year ended December 31 | Janus Aspen Money Market Portfolio | ||||||||||
| (all numbers in thousands) | 2006 | 2005(1) | |||||||||
| Operations: | |||||||||||
| Net investment income/(loss) | $ | 573 | $ | 347 | |||||||
| Net realized gain/(loss) from investment | – | – | |||||||||
| Net Increase/(Decrease) in Net Assets Resulting from Operations | 573 | 347 | |||||||||
| Dividends and Distributions to Shareholders: | |||||||||||
| Net investment income* | |||||||||||
| Institutional Shares | (573 | ) | (347 | ) | |||||||
| Service Shares | N/A | – | |||||||||
| Net realized gain from investment transactions* | |||||||||||
| Institutional Shares | – | – | |||||||||
| Service Shares | N/A | – | |||||||||
| Net Decrease from Dividends and Distributions | (573 | ) | (347 | ) | |||||||
| Capital Share Transactions: | |||||||||||
| Shares sold | |||||||||||
| Institutional Shares | 10,535 | 7,319 | |||||||||
| Service Shares | N/A | – | |||||||||
| Reinvested dividends and distributions | |||||||||||
| Institutional Shares | 571 | 347 | |||||||||
| Service Shares | N/A | – | |||||||||
| Shares repurchased | |||||||||||
| Institutional Shares | (9,010 | ) | (9,444 | ) | |||||||
| Service Shares | N/A | (11 | ) | ||||||||
| Net Increase/(Decrease) from Capital Share Transactions | 2,096 | (1,789 | ) | ||||||||
| Net Increase/(Decrease) in Net Assets | 2,096 | (1,789 | ) | ||||||||
| Net Assets: | |||||||||||
| Beginning of period | 10,360 | 12,149 | |||||||||
| End of period | $ | 12,456 | $ | 10,360 | |||||||
| Undistributed net investment income/(loss)* | $ | – | $ | – | |||||||
*See Note 3 in Notes to Financial Statements.
(1) Period January 1, 2005 to March 28, 2005 for Service Shares (Note 1).
See Notes to Financial Statements.
6 Janus Aspen Series December 31, 2006
Financial Highlights
Institutional Shares
| Janus Aspen Money Market Portfolio | |||||||||||||||||||||||
| For a share outstanding during each fiscal year ended December 31 | 2006 | 2005 | 2004 | 2003 | 2002 | ||||||||||||||||||
| Net Asset Value, Beginning of Period | $ | 1.00 | $ | 1.00 | $ | 1.00 | $ | 1.00 | $ | 1.00 | |||||||||||||
| Income from Investment Operations: | |||||||||||||||||||||||
| Net investment income/(loss) | .05 | .03 | .01 | .01 | .02 | ||||||||||||||||||
| Net gain/(loss) on securities | – | (1) | – | (1) | – | (1) | – | (1) | – | ||||||||||||||
| Total from Investment Operations | .05 | .03 | .01 | .01 | .02 | ||||||||||||||||||
| Less Distributions: | |||||||||||||||||||||||
| Dividends (from net investment income)* | (.05 | ) | (.03 | ) | (.01 | ) | (.01 | ) | (.02 | ) | |||||||||||||
| Distributions (from capital gains)* | – | – | – | (1) | – | (1) | – | ||||||||||||||||
| Total Distributions | (.05 | ) | (.03 | ) | (.01 | ) | (.01 | ) | (.02 | ) | |||||||||||||
| Net Asset Value, End of Period | $ | 1.00 | $ | 1.00 | $ | 1.00 | $ | 1.00 | $ | 1.00 | |||||||||||||
| Total Return | 4.73 | % | 2.94 | % | 1.09 | % | 0.86 | % | 1.63 | % | |||||||||||||
| Net Assets, End of Period (in thousands) | $ | 12,456 | $ | 10,360 | $ | 12,138 | $ | 20,761 | $ | 73,402 | |||||||||||||
| Average Net Assets for the Period (in thousands) | $ | 12,305 | $ | 12,086 | $ | 14,396 | $ | 31,124 | $ | 93,310 | |||||||||||||
| Ratio of Gross Expenses to Average Net Assets(2) | 0.50 | % | 0.50 | % | 0.50 | % | 0.50 | % | 0.39 | % | |||||||||||||
| Ratio of Net Expenses to Average Net Assets(2) | 0.50 | % | 0.50 | % | 0.50 | % | 0.50 | % | 0.39 | % | |||||||||||||
| Ratio of Net Investment Income/(Loss) to Average Net Assets | 4.65 | % | 2.87 | % | 1.04 | % | 0.87 | % | 1.63 | % | |||||||||||||
* See Note 3 in Notes to Financial Statements.
(1) Net gain/(loss) on securities and/or distributions (from capital gains) aggregated less than $.01 on a per share basis for the fiscal year ended.
(2) See Note 4 in Notes to Financial Statements.
See Notes to Financial Statements.
Janus Aspen Series December 31, 2006 7
Notes to Schedule of Investments
| 144 | A | Securities sold under Rule 144A of the Securities Act of 1933 are subject to legal and/or contractual restrictions on resale and may not be publicly sold without registration under the 1933 Act. | |||||
| Section 4(2) | Securities subject to legal and/or contractual restrictions on resale and may not be publicly sold without registration under the Securities Act of 1933. | ||||||
§ Schedule of Restricted and Illiquid Securities (as of December 31, 2006)
| Acquisition Date | Acquisition Cost | Value | Value as % of Net Assets | ||||||||||||||||
| Janus Aspen Money Market Portfolio | |||||||||||||||||||
| Galleon Capital LLC 5.25%, 1/24/07 (Section 4(2)) | 11/14/06 | $ | 346,376 | $ | 348,826 | 2.8 | % | ||||||||||||
The Portfolio has registration rights for certain restricted securities held as of December 31, 2006. The issuer incurs all registration costs.
The interest rate for variable rate notes is based on an index or market interest rates and is subject to change. Rates in the security description are as of December 31, 2006.
Money market portfolios may hold securities with stated maturities of greater than 397 days when those securities have features that allow a Portfolio to "put" back the security to the issuer or to a third party within 397 days of acquisition. The maturity dates shown in the security descriptions are the stated maturity dates.
Repurchase agreements held by a Portfolio are fully collateralized, and such collateral is in the possession of the Portfolio's custodian or subcustodian. The collateral is evaluated daily to ensure its market value equals or exceeds the current market value of the repurchase agreements, including accrued interest. In the event of default on the obligation to repurchase, the Portfolio has the right to liquidate the collateral and apply the proceeds in satisfaction of the obligation. In the event of default or bankruptcy by the other party to the agreement, realization and/or retention of the collateral or proceeds may be subject to legal proceedings.
8 Janus Aspen Series December 31, 2006
Notes to Financial Statements
The following section describes the organization and significant accounting policies and provides more detailed information about the schedules and tables that appear throughout this report. In addition, the Notes to Financial Statements explain the methods used in preparing and presenting this report.
1. ORGANIZATION AND SIGNIFICANT ACCOUNTING POLICIES
Janus Aspen Money Market Portfolio (the "Portfolio") is a series fund. The Portfolio is part of Janus Aspen Series (the "Trust"), which is organized as a Delaware statutory trust and is registered under the Investment Company Act of 1940 (the "1940 Act") as an open-end management investment company. The Trust offers seventeen Portfolios, which include multiple series of shares, with differing investment objectives and policies. The Portfolio invests in short-term money market securities. The Portfolio is classified as diversified, as defined in the 1940 Act. The Portfolio is a no-load investment.
The Portfolio currently offers one class of shares: Institutional Shares. Institutional Shares are offered only in connection with investment in and payments under variable insurance contracts and to qualified retirement plans.
On March 22, 2005, the Board of Trustees of Janus Aspen Series approved the liquidation of the Service Shares class of Janus Aspen Money Market Portfolio. The sole shareholder holding Service Shares of the Portfolio subsequently redeemed its holdings. Accordingly, Janus Aspen Money Market Portfolio – Service Shares are no longer offered for sale to the public.
The following accounting policies have been consistently followed by the Portfolio and are in conformity with accounting principles generally accepted in the United States of America in the investment company industry.
Investment Valuation
Investments held by the Portfolio with maturities over 60 days are valued at market value. Short-term securities with maturities of 60 days or less are valued utilizing the amortized cost method of valuation permitted in accordance with Rule 2a-7 under the 1940 Act and certain conditions therein. Under the amortized cost method, an instrument is initially valued at its cost and thereafter assumes a constant accretion/amortization to maturity of any discount or premium.
Investment Transactions and Investment Income
Investment transactions are accounted for as of the date purchased or sold (trade date). Dividend income is recorded on the ex-dividend date. Certain dividends from foreign securities will be recorded as soon as the Trust is informed of the dividend if such information is obtained subsequent to the ex-dividend date and may be subject to withholding taxes in these jurisdictions. Interest income is recorded on the accrual basis and includes amortization of premiums and accretion of discounts. Gains and losses are determined on the identified cost basis, which is the same basis used for federal income tax purposes.
Expenses
The Portfolio bears expenses incurred specifically on its behalf as well as a portion of general expenses, which may be allocated pro rata to the Portfolio.
Interfund Lending
Pursuant to an exemptive order received from the SEC, the Portfolio may be party to an interfund lending agreement between the Portfolio and other Janus Capital Management LLC ("Janus Capital") sponsored mutual funds, which permits it to borrow or lend cash at a rate beneficial to both the borrowing and lending funds. Outstanding borrowings from all sources totaling 10% or more of the borrowing Portfolio's total assets must be collateralized at 102% of the outstanding principal value of the loan; loans of less than 10% may be unsecured. During the fiscal year ended December 31, 2006, there were no outstanding interfund borrowing or lending arrangements for the Portfolio.
When-issued Securities
The Portfolio may purchase or sell securities on a when-issued or forward commitment basis. The price of the underlying securities and date when the securities will be delivered and paid for are fixed at the time the transaction is negotiated. Losses may arise due to changes in the market value of the securities or from the inability of counterparties to meet the terms of the contract. In connection with such purchases, the Portfolio may hold liquid assets as collateral with the Portfolio's custodian sufficient to cover the purchase price. As of December 31, 2006, the Portfolio was not invested in when-issued securities.
Restricted Security Transactions
Restricted securities held by the Portfolio may not be sold except in exempt transactions or in a public offering registered under the Securities Act of 1933. The risk of investing in such securities is generally greater than the risk of investing in the securities of widely held, publicly traded companies. Lack of a secondary market and resale restrictions may result in the inability of the Portfolio to sell a security at a fair price and may substantially delay the sale of the security. In addition, these securities may exhibit greater price volatility than securities for which secondary markets exist.
Janus Aspen Series December 31, 2006 9
Notes to Financial Statements (continued)
Dividend Distributions
Dividends representing substantially all of the net investment income and any net realized capital gains on sales of securities are declared daily and distributed monthly. The majority of dividends and capital gains distributions from the Portfolio will be automatically reinvested into additional shares of the Portfolio, based upon the discretion of the shareholder.
Estimates
The preparation of financial statements in conformity with accounting principles generally accepted in the United States of America requires management to make estimates and assumptions that affect the reported amount of assets and liabilities and disclosure of contingent assets and liabilities at the date of the financial statements and the reported amounts of income and expenses during the reporting period. Actual results could differ from those estimates.
Federal Income Taxes
No provision for income taxes is included in the accompanying financial statements, as the Portfolio intends to distribute to shareholders all taxable investment income and realized gains and otherwise comply with Subchapter M of the Internal Revenue Code applicable to regulated investment companies.
New Accounting Pronouncements
In July 2006, the Financial Accounting Standards Board ("FASB") issued Interpretation No. 48, "Accounting for Uncertainty in Income Taxes – an Interpretation of FASB Statement No. 109" (the "Interpretation"). The Interpretation establishes for all entities, including pass-through entities such as the Portfolio, a minimum threshold for financial statement recognition of the benefit of positions taken in filing tax returns (including whether an entity is taxable in a particular jurisdiction), and requires certain expanded tax disclosures. A calendar year open-end or closed-end fund would implement the Interpretation no later than June 29, 2007 (the last business day of the semi-annual reporting period) and will also apply to all open tax years as of the date of effectiveness. Management has recently begun to evaluate the application of the Interpretation to the Portfolio, and is not in a position at this time to estimate the significance of its impact, if any, on the Portfolio's financial statements.
In September 2006, the FASB issued Statement of Financial Accounting Standards No. 157, "Fair Value Measurements" ("SFAS No. 157"), which defines fair value, establishes a framework for measuring fair value in generally accepted accounting principles, and expands disclosures about fair value measurements. SFAS No. 157 does not require new fair value measurements, but is applied to the extent that other accounting pronouncements require or permit fair value measurements. SFAS No. 157 emphasizes that fair value is a market-based measurement that should be determined based on the assumptions that market participants would use in pricing an asset or liability. Companies will be required to disclose the extent to which fair value is used to measure assets and liabilities, the inputs used to develop the measurements, and the effect for fiscal years beginning after November 15, 2007. Management is currently evaluating the potential impact the adoption of SFAS No. 157 will have on the Portfolio's financial condition and results of operations.
2. INVESTMENT ADVISORY AGREEMENTS AND OTHER TRANSACTIONS WITH AFFILIATES
The Portfolio pays a monthly advisory fee to Janus Capital based upon average daily net assets and calculated at the annual rate of 0.25%.
Janus Capital has agreed to waive one-half of its advisory fee. Such waiver is voluntary and could change or be terminated at any time at the discretion of Janus Capital. The Portfolio is not required to repay any such waived fees in future years to Janus Capital.
Janus Services LLC ("Janus Services"), a wholly-owned subsidiary of Janus Capital, is the Portfolio's transfer agent. Janus Services receives certain out-of-pocket expenses for transfer agent services.
Certain officers of the Portfolio may also be officers and/or directors of Janus Capital. Such officers receive no compensation from the Portfolio, except for the Portfolio's Chief Compliance Officer. Effective January 1, 2006, the Portfolio began reimbursing the adviser for a portion of the compensation paid to the Chief Compliance Officer of the Trust. Total compensation of $21 was paid by the Portfolio during the fiscal year ended December 31, 2006. The Portfolio's portion is reported as part of "Other Expenses" on the Statement of Operations.
The Board of Trustees has adopted a deferred compensation plan (the "Deferred Plan") for independent Trustees to elect to defer receipt of all or a portion of the annual compensation they are entitled to receive from the Portfolio. All deferred fees are credited to an account established in the name of the Trustees. The amounts credited to the account then increase or decrease, as the case may be, in accordance with the performance of one or more of the Janus funds that are selected by the Trustees. The account balance continues to fluctuate in accordance with the performance of the selected fund or funds until final payment of all amounts credited to the account. Trustees are allowed to change their designation of mutual funds from time to time. Amounts will be deferred until distributed in accordance to the Deferred Plan. No deferred fees were paid to any Trustee under the Deferred Plan during the fiscal year ended December 31, 2006.
For the fiscal year ended December 31, 2006, Janus Capital assumed $21,288 of legal, consulting and Trustee costs and fees incurred by the funds in Janus Investment Fund, Janus Aspen Series and Janus Adviser Series (the "Funds") in
10 Janus Aspen Series December 31, 2006
connection with the regulatory and civil litigation matters discussed in Note 6. These non-recurring costs were allocated to all Funds based upon the Funds' respective net assets as of July 31, 2004. Additionally, all future non-recurring costs will be allocated based upon the Funds' respective net assets on July 31, 2004. These non-recurring costs and costs assumed by Janus Capital are shown on the Statement of Operations.
Janus Distributors LLC, a wholly-owned subsidiary of Janus Capital, is a distributor of the Portfolio.
The Portfolio's expenses may be reduced by expense offsets from an unaffiliated transfer agent. Such credits or offsets are included in Expense and Fee Offset on the Statement of Operations. The transfer agent fee offsets received during the period reduce Transfer Agent Fees and Expenses. The Portfolio could have employed the assets used by the transfer agent to produce income if it had not entered into an expense offset arrangement.
3. FEDERAL INCOME TAX
Income and capital gains distributions are determined in accordance with income tax regulations that may differ from accounting principles generally accepted in the United States
of America. These differences are due to differing treatments for items such as net short-term gains.
| Undistributed Ordinary Income | Undistributed Long-Term Gains | Accumulated Capital Losses | Other Book to Tax Differences | Net Tax Appreciation/ (Depreciation) | |||||||||||||||
| Janus Aspen Money Market Portfolio $– | $ | – | $ | – | $ | – | $ | – | |||||||||||
| For the fiscal year ended December 31, 2006 | Distributions | ||||||||||||||||||
| From Ordinary Income | From Long-Term Capital Gains | Tax Return of Capital | Net Investment Loss | ||||||||||||||||
| Janus Aspen Money Market Portfolio | $ | 570,866 | $ | – | $ | – | $ | – | |||||||||||
| For the fiscal year ended December 31, 2005 | Distributions | ||||||||||||||||||
| From Ordinary Income | From Long-Term Capital Gains | Tax Return of Capital | Net Investment Loss | ||||||||||||||||
| Janus Aspen Money Market Portfolio | $ | 346,528 | $ | – | $ | – | $ | – | |||||||||||
4. EXPENSE RATIOS
The expense ratios listed in the Financial Highlights reflect expenses prior to any expense offsets (gross expense ratio) and after expense offsets (net expense ratio). Both expense ratios reflect expenses after waivers (reimbursement). Listed below are the gross expense ratios for the Portfolio that would be in effect, absent the waiver of certain fees and offsets.
| For the fiscal year ended December 31 | Institutional Shares | ||||||||||||||||||||||
| Portfolio | 2006(1) | 2005(1) | 2004(1) | 2003 | 2002 | ||||||||||||||||||
| Janus Aspen Money Market Portfolio | 1.34 | % | 0.86 | % | 0.98 | % | 0.78 | % | 0.39 | % | |||||||||||||
(1) The effect of non-recurring costs assumed by Janus Capital (Note 2) is included in the ratio of operating expenses to average net assets without waivers and/or expense reimbursements and was less than 0.01%.
Janus Aspen Series December 31, 2006 11
Notes to Financial Statements (continued)
5. CAPITAL SHARE TRANSACTIONS
| For the fiscal year ended December 31 (all numbers are in thousands) | Janus Aspen Money Market Portfolio | ||||||||||
| 2006 | 2005 | ||||||||||
| Transactions in Portfolio Shares - Institutional Shares | |||||||||||
| Shares sold | 10,535 | 7,319 | |||||||||
| Reinvested dividends and distributions | 571 | 347 | |||||||||
| Shares repurchased | (9,010 | ) | (9,444 | ) | |||||||
| Net Increase/(Decrease) in Capital Share Transactions | 2,096 | (1,778 | ) | ||||||||
| Shares Outstanding, Beginning of Period | 10,360 | 12,138 | |||||||||
| Shares Outstanding, End of Period | 12,456 | 10,360 | |||||||||
| Transactions in Portfolio Shares - Service Shares(1) | |||||||||||
| Shares sold | N/A | – | |||||||||
| Reinvested dividends and distributions | N/A | – | |||||||||
| Shares repurchased | N/A | (11 | ) | ||||||||
| Net Increase/(Decrease) in Capital Share Transactions | N/A | (11 | ) | ||||||||
| Shares Outstanding, Beginning of Period | N/A | 11 | |||||||||
| Shares Outstanding, End of Period | N/A | – | |||||||||
(1) Period from January 1, 2005 through March 28, 2005 for Service Shares (Note 1).
6. PENDING LEGAL MATTERS
In the fall of 2003, the Securities and Exchange Commission ("SEC"), the Office of the New York State Attorney General ("NYAG"), the Colorado Attorney General ("COAG"), and the Colorado Division of Securities ("CDS") announced that they were investigating alleged frequent trading practices in the mutual fund industry. On August 18, 2004, Janus Capital announced that it had reached final settlements with the SEC, the NYAG, the COAG, and the CDS related to such regulators' investigations into Janus Capital's frequent trading arrangements.
A number of civil lawsuits were brought against Janus Capital and certain of its affiliates, the Janus funds, and related entities and individuals based on allegations similar to those announced by the above regulators and were filed in several state and federal jurisdictions. Such lawsuits alleged a variety of theories for recovery including, but not limited to, the federal securities laws, other federal statutes (including ERISA), and various common law doctrines. The Judicial Panel on Multidistrict Litigation transferred these actions to the U.S. District Court for the District of Maryland (the "Court") for coordinated proceedings. On September 29, 2004, five consolidated amended complaints were filed with the Court that generally include: (i) claims by a putative class of investors in certain Janus funds asserting claims on behalf of the investor class (Marini, et al. v. Janus Investment Fund, et al., U.S. District Court, District of Maryland, Case No. 04-CV-00497); (ii) derivative claims by investors in certain Janus funds ostensibly on behalf of such funds (Steinberg et al. v. Janus Capital Management, LLC et al., U.S. District Court, District of Maryland, Case No. 04-CV-00518); (iii) claims on behalf of participants in the Janus 401(k) plan (Wangberger v. Janus Capital Group Inc., 401(k) Advisory Committee, et al., U.S. District Court, District of Maryland, Case No. JFM-05-2711); (iv) claims brought on behalf of shareholders of Janus Capital Group Inc. ("JCGI") on a derivative basis against the Board of Directors of JCGI (Chasen v. Whiston, et al., U.S. District Court, District of Maryland, Case No. 04-MD-00855); and (v) claims by a putative class of shareholders of JCGI asserting claims on behalf of the shareholders (Wiggins, et al. v. Janus Capital Group, Inc., et al., U.S. District Court, District of Maryland, Case No. 04-CV-00818). In addition, the following were also named as defendants in one or more of the actions: Janus Investment Fund ("JIF"), Janus Aspen Series ("JAS"), Janus Adviser Series ("JAD"), Janus Distributors LLC, Enhanced Investment T echnologies, LLC ("INTECH"), Bay Isle Financial LLC ("Bay Isle"), Perkins, Wolf, McDonnell and Company, LLC ("Perkins"), the Advisory Committee of the Janus 401(k) plan, and the current or former directors of JCGI.
On August 25, 2005, the Court entered orders dismissing most of the claims asserted against Janus Capital and its affiliates by fund investors (actions (i) and (ii) described above), except certain claims under Section 10(b) of the Securities Exchange Act of 1934 and under Section 36(b) of the Investment Company Act of 1940, as amended (the "1940 Act"). On August 15, 2006, the complaint in the 401(k) plan class action (action (iii) described above) was dismissed by the district court with prejudice; the plaintiff has appealed that dismissal decision to the United States Court of Appeals for the Fourth Circuit. The Court also dismissed the action against JCGI's Board of Directors without leave to amend (action (iv) described above). Finally, a Motion to Dismiss the action brought by JCGI shareholders (action (v) described above) is fully briefed and pending before the Court.
12 Janus Aspen Series December 31, 2006
In addition to the lawsuits described above, the Auditor of the State of West Virginia ("Auditor"), in his capacity as securities commissioner, has initiated administrative proceedings against many of the defendants in the market timing cases (including JCGI and Janus Capital) and, as a part of its relief, is seeking disgorgement and other monetary relief based on similar market timing allegations (In the Matter of Janus Capital Group Inc. et al., Before the Securities Commissioner, State of West Virginia, Summary Order No. 05-1320). The respondents in these proceedings collectively sought a Writ of Prohibition in state court, which was denied. Their subsequent Petition for Appeal was also denied. Consequently, in September 2006, JCGI and Janus Capital filed their answer to the A uditor's summary order instituting proceedings and requested a hearing. JCGI and Janus Capital, as well as other similarly situated defendants, continue to challenge the statutory authority of the Auditor to bring such an action. No further proceedings are currently scheduled.
In addition to the "market timing" actions described above, Janus Capital is a defendant in a consolidated lawsuit in the U.S. District Court for the District of Colorado challenging the investment advisory fees charged by Janus Capital to certain Janus funds (Walter Sins, et al. v. Janus Capital Management LLC, U.S. District Court, District of Colorado, Case No. 04-CV-01647-WDM-MEH; Michael Fleisher, et al. v. Janus Capital Management, LLC, 04-CV-02395-MSK-CBS). The action was filed in 2004 by fund investors asserting breach of fiduciary duty under Section 36(b) of the 1940 Act. The plaintiffs seek declaratory and injunctive relief and an unspecified amount of damages. The trial is sched uled to commence on May 21, 2007.
In 2001, Janus Capital's predecessor was also named as a defendant in a class action suit in the U.S. District Court for the Southern District of New York, alleging that certain underwriting firms and institutional investors violated antitrust laws in connection with initial public offerings (Pfeiffer v. Credit Suisse First Boston aka In re Initial Public Offering Antitrust Litigation, U.S. District Court, Southern District of New York, Case No. 01-CV-2014). The U.S. District Court dismissed the plaintiff's antitrust claims in November 2003; however, the U.S. Court of Appeals vacated that decision and remanded it for further proceedings. In March 2006, the defendants, including Janus Capital, filed a Petition for a Writ of Certiorari with the U.S. Supreme Court to review the decision of the U. S. Court of Appeals. In June 2006, the U.S. Supreme Court invited the U.S. Solicitor General to file a brief expressing the view of the United States, and in November 2006, the Solicitor General filed a brief expressing its view on the matter. The U.S. Supreme Court has granted the Petition for a Writ of Certiorari and the parties are in the process of briefing the matter for the U.S. Supreme Court.
Additional lawsuits may be filed against certain of the Janus funds, Janus Capital, and related parties in the future. Janus Capital does not currently believe that these pending actions will materially affect its ability to continue providing services it has agreed to provide to the Janus funds.
Janus Aspen Series December 31, 2006 13
Report of Independent Registered Public Accounting Firm
To the Trustees and Shareholders
of Janus Aspen Money Market Portfolio
In our opinion, the accompanying statement of assets and liabilities, including the schedule of investments, and the related statements of operations and of changes in net assets and the financial highlights present fairly, in all material respects, the financial position of Janus Aspen Money Market Portfolio (one of the portfolios constituting Janus Aspen Series, hereafter referred to as the "Portfolio") at December 31, 2006, the results of its operations for the year then ended, the changes in its net assets for each of the two years in the period then ended, and the financial highlights for each of the five years in the period then ended, in conformity with accounting principles generally accepted in the United States of America. These financial statements and financial highlights (hereafter referred to as "financial statements") are the responsibility of the Portfolio's management; our responsibility is to express an opinion on these fin ancial statements based on our audits. We conducted our audits of these financial statements in accordance with the standards of the Public Company Accounting Oversight Board (United States). Those standards require that we plan and perform the audit to obtain reasonable assurance about whether the financial statements are free of material misstatement. An audit includes examining, on a test basis, evidence supporting the amounts and disclosures in the financial statements, assessing the accounting principles used and significant estimates made by management, and evaluating the overall financial statement presentation. We believe that our audits, which included confirmation of securities at December 31, 2006 by correspondence with the custodian, transfer agent and brokers, and the application of alternative auditing procedures where securities purchased had not been received, provide a reasonable basis for our opinion.

PricewaterhouseCoopers LLP
Denver, Colorado
February 12, 2007
14 Janus Aspen Series December 31, 2006
Additional Information (unaudited)
PROXY VOTING POLICIES AND VOTING RECORD
A description of the policies and procedures that the Portfolio uses to determine how to vote proxies relating to its portfolio securities is available: (i) without charge, upon request, by calling 1-800-525-0020 (toll free); (ii) on the Portfolio's website at www.janus.com/proxyvoting; and (iii) on the SEC's website at http://www.sec.gov. Additionally, information regarding the Portfolio's proxy voting record for the most recent twelve-month period ended June 30 is also available, free of charge, through www.janus.com/proxyvoting and from the SEC's website at http://www.sec.gov.
QUARTERLY PORTFOLIO HOLDINGS
The Portfolio files its complete portfolio holdings (schedule of investments) with the SEC for the first and third quarters of each fiscal year on Form N-Q within 60 days of the end of such fiscal quarter. The Portfolio's Form N-Q: (i) is available on the SEC's website at http://www.sec.gov; (ii) may be reviewed and copied at the SEC's Public Reference Room in Washington, D.C. (information on the Public Reference Room may be obtained by calling 1-800-SEC-0330); and (iii) is available without charge, upon request, by calling Janus at 1-800-525-0020 (toll free).
APPROVAL OF ADVISORY AGREEMENTS DURING THE PERIOD
The Trustees of Janus Aspen Series, more than eighty-five percent of whom have never been affiliated with the Adviser ("Independent Trustees"), oversee the management of each of the Portfolios and, as required by law, determine annually whether to continue the investment advisory agreement for each Portfolio and the subadvisory agreements for the three Portfolios that utilize subadvisers.
In connection with their most recent consideration of those agreements for each of the Portfolios, the Trustees received and reviewed a substantial amount of information provided by Janus Capital (the "Adviser") and the respective subadvisers in response to requests of the Independent Trustees and their independent legal counsel. They also received and reviewed a considerable amount of information and analysis provided to the Trustees by their independent fee consultant. Throughout their consideration of the agreements the Independent Trustees were advised by their independent legal counsel. The Independent Trustees met on two separate occasions with management to consider the agreements, and at each of those meetings they also met separately in executive session with their independent legal counsel.
At a meeting held on December 20, 2006, based on their evaluation of the information provided by the Adviser, the subadvisers and the independent fee consultant and other information, the Trustees determined that the overall arrangements between each Portfolio and the Adviser were fair and reasonable in light of the nature, extent and quality of the services provided by the Adviser, its affiliates and the subadvisers, the fees charged for those services, and other matters that the Trustees considered relevant in the exercise of their business judgment. At that meeting all of the Trustees unanimously approved the continuation of the investment advisory agreement for each Portfolio, and the subadvisory agreement for each subadvised Portfolio, for the period from February 1, 2007 through February 1, 2008, subject to earlier termination as provided in each agreement.
In considering the continuation of those agreements, the Trustees reviewed and analyzed various factors that they determined were relevant, including the factors described below, none of which by itself was considered dispositive. However, the material factors and conclusions that formed basis for the Trustees' determination to approve the continuation of the agreements are discussed separately below.
Nature, Extent and Quality of Services
The Trustees reviewed the nature, extent and quality of the services of Janus Capital and the subadvisers to the Funds, taking into account the investment objective and strategy of each Portfolio and the knowledge the Trustees gained from their regular meetings with management on at least a quarterly basis and their ongoing review of information related to the Funds. In addition, the Trustees reviewed the resources and key personnel of Janus Capital and each subadviser, especially those who provide investment management services to the Portfolios. The Trustees also considered other services provided to the Portfolios by Janus Capital or the subadvisers, such as managing the execution of portfolio transactions and the selection of broker-dealers for those transactions, serving as the Portfolios' administrator, monitoring adherence to the Portfolios' investment restrictions, producing shareholder reports, providing support services for the Tru stees and Trustee committees, communicating with shareholders and overseeing the activities of other service providers, including monitoring compliance with various policies and procedures of the Portfolios and with applicable securities laws and regulations.
The Trustees concluded that: the nature, extent and quality of the services provided by Janus Capital or the subadviser to each Portfolio were appropriate and consistent with the terms of the respective advisory and subadvisory agreements; that, taking into account steps taken to address a small portion of the Portfolios whose performance lagged that of their peers for certain periods, the quality of those services had been consistent with or superior to quality norms in the industry; and that the Portfolios were likely to benefit from the continued provision of those services. They also concluded that each of Janus Capital and each subadviser had sufficient personnel, with the appropriate education and experience, to serve the Portfolios effectively
Janus Aspen Series December 31, 2006 15
Additional Information (unaudited) (continued)
and had demonstrated its continuing ability to attract and retain well-qualified personnel.
Performance of the Funds
The Trustees considered the performance results of each Portfolio over various time periods. They reviewed information comparing each Portfolio's performance with the performance of comparable funds and peer groups identified by Lipper Inc., an independent provider of investment company data, and with the Portfolio's benchmark. They concluded that the performance of most Portfolios was good to very good. Although the performance of some Portfolios lagged that of their peers for certain periods, the Trustees also concluded that Janus Capital had taken appropriate steps to address those instances of under-performance and that the more recent performance of most of those Portfolios had been improving.
Costs of Services Provided
The Trustees examined information on the fees and expenses of each Portfolio in comparison to similar information for other comparable funds as provided by Lipper. They also reviewed an analysis of that information provided by their independent fee consultant and noted that the rate of management (investment advisory and administrative) fees for most of the Portfolios, after contractual expense limitations, was below the mean management fee rate of the respective peer group of funds selected by Lipper.
The Trustees considered the methodology used by Janus Capital and each subadviser in determining compensation payable to portfolio managers, the competitive environment for investment management talent and the competitive market for mutual funds in different distribution channels. They concluded that the compensation methodology provided a good alignment of the interests of the portfolio managers with the interests of Portfolio shareholders.
The Trustees also reviewed management fees charged by Janus Capital to its separate account clients and to its subadvised funds (for which Janus Capital provides only portfolio management services). Although in most instances subadvisory and separate account fee rates for various investment strategies were lower than management fees for Portfolios having a similar strategy, the Trustees noted that Janus Capital performs significant additional services for the Portfolios that it does not provide to those other clients, including administrative services, oversight of the Portfolios' other service providers, trustee support, regulatory compliance and numerous other services, and that, in serving the Portfolios, Janus Capital assumes many legal risks that it does not assume in servicing its other clients. Moreover, they noted that the spread between the average fees charged to the Portfolios and the fees that Janus Capital charged to its separate account clients was significantly smaller than the average spread for such fees of other advisers, based on publicly available data and research conducted by their independent fee consultant.
In considering the fees charged by Janus Capital, the Trustees had previously negotiated with Janus Capital a temporary contingent waiver of a portion the investment advisory fee paid by Janus Aspen Worldwide Growth Portfolio to Janus Capital to provide for a possible reduction in the rate of advisory fee payable by the Portfolio for the period July 1, 2006 through January 31, 2007 if the investment performance of the Fund should lag that of its benchmark performance over the applicable performance measurement period. Commencing in February 2007, the previously approved performance-based fee schedule will become operative.
The Trustees reviewed information on the profitability of Janus Capital and its affiliates of their relationships with each Portfolio, as well as an explanation of the methodology utilized in allocating various expenses among the Portfolios and other clients. The Trustees also reviewed the financial statements of Janus Capital's parent company and its corporate structure. In their review, the Trustees considered whether Janus Capital and each subadviser receive adequate incentives to manage the Portfolios effectively. The Trustees recognized that profitability comparisons among fund managers are difficult because very little comparative information is publicly available and profitability of any manager is affected by numerous factors, including the organizational structure of the particular manager, the types of funds and other accounts it manages, possible other lines of business, the methodology for allocating expenses and the manager's ca pital structure and cost of capital. However, based on the information available and taking those factors into account, the Trustees concluded that Janus Capital's profitability with respect to each Portfolio in relation to the services rendered was not unreasonable.
The Trustees concluded that the management fees and other compensation payable by each Fund to Janus Capital and its affiliates, as well as the fees paid by Janus Capital to the subadvisers of subadvised Portfolios, were reasonable in relation to the nature and quality of the services provided, taking into account the fees charged by other advisers for managing comparable mutual funds with similar strategies and the fees Janus Capital and the subadviser charges to other clients. The Trustees also concluded that the overall expense ratio of each Portfolio was reasonable, taking into account the size of the Portfolio, the quality of services provided by Janus Capital and any subadviser, the investment performance of the Portfolio and any expense limitations agreed to by Janus Capital.
16 Janus Aspen Series December 31, 2006
Economies of Scale
The Trustees considered information about the potential for Janus Capital to realize economies of scale as the assets of the Portfolios increase. They noted that, although most Portfolios pay advisory fees at a fixed rate as a percentage of net assets, without any breakpoints, the management fee paid by each Portfolio, after any contractual expense limitations, was below the mean management fee rate of the Portfolio's peer group selected by Lipper; and, for those Portfolios whose expenses are being reduced by the contractual expense limitations of Janus Capital, Janus Capital is subsidizing the Portfolios because they have not reached adequate scale. Moreover, as the assets of many of the Portfolios have declined in the past few years, the Portfolios have benefited from having advisory fee rates that have remained constant rather than increasing as assets decline. In addition, performance fee structures have been implemented for several Port folios that will cause the effective rate of advisory fees payable by such a Portfolio to vary depending on the investment performance of the Portfolio relative to its benchmark; and a few Portfolios have fee schedules with breakpoints and reduced fee rates above certain asset levels. The Trustees also noted that the Portfolios share directly in economies of scale through lower charges of third-party service providers based on the combined scale of all of the Portfolios. Based on all of the information they reviewed, the Trustees concluded that the current fee structure of each Portfolio was reasonable and that the current rates of fees do reflect a sharing between Janus Capital and the Portfolio of economies of scale at the current asset level of the Portfolio.
Other Benefits to Janus Capital
The Trustees also considered benefits that accrue to Janus Capital and its affiliates from their relationships with the Portfolios. They recognized that two affiliates of Janus Capital separately serve the Portfolios as transfer agent and distributor, respectively, and that the transfer agent receives compensation from the non-money market Portfolios for services provided. The Trustees also considered Janus Capital's use of commissions paid by Portfolios on their portfolio brokerage transactions to obtain proprietary research products and services benefiting the Portfolios and/or other clients of Janus Capital, as well as Janus Capital's agreement not to use any Portfolio's brokerage transactions to obtain third party research products or services. The Trustees concluded that Janus Capital's use of "soft" commission dollars to obtain proprietary research products and services was consistent with regulatory requirements and guidelines and was likely to benefit each Portfolio. The Trustees also concluded that, other than the services provided by Janus Capital and its affiliates pursuant to the agreements and the fees to be paid by each Portfolio therefor, the Portfolios and Janus Capital may potentially benefit from their relationship with each other in other ways. They concluded that Janus Capital benefits from the receipt of proprietary research products and services acquired through commissions paid on portfolio transactions of the Portfolios and that the Portfolios benefit from Janus Capital's receipt of those products and services as well as research products and services acquired through commissions paid by other clients of Janus Capital. They further concluded that success of any Portfolio could attract other business to Janus Capital or other Janus Funds and that the success of Janus Capital could enhance Janus Capital's ability to serve the Portfolios.
After full consideration of the above factors as well as other factors, all of the Trustees, including all of the Independent Trustees, concluded that the proposed continuation of the investment advisory agreement for each applicable Portfolio were in the best interest of the respective Portfolios and their shareholders.
Janus Aspen Series December 31, 2006 17
Explanations of Charts, Tables and
Financial Statements (unaudited)
1. PERFORMANCE OVERVIEWS
Average annual total returns are quoted for each class of the Portfolio. Average annual total return is calculated by taking the growth or decline in value of an investment over a period of time, including reinvestment of dividends and distributions, then calculating the annual compounded percentage rate that would have produced the same result had the rate of growth been constant throughout the period. Average annual total return does not reflect the deduction of taxes that a shareholder would pay on Portfolio distributions or redemption of Portfolio shares.
2. SCHEDULE OF INVESTMENTS
Following the performance overview section is the Portfolio's Schedule of Investments. This schedule reports the industry concentrations and types of securities held in the Portfolio on the last day of the reporting period. Securities are usually listed by type (commercial paper, demand notes, U.S. Government notes, etc.). Holdings are subject to change without notice.
The value of each security is quoted as of the last day of the reporting period. Investments held by the Portfolio with maturities over 60 days are valued at market value. Short-term investments maturing within 60 days are valued utilizing the amortized cost method of valuation permitted in accordance with Rule 2a-7 under the 1940 Act and certain conditions therein.
3. STATEMENT OF ASSETS AND LIABILITIES
This statement is often referred to as the "balance sheet." It lists the assets and liabilities of the Portfolio on the last day of the reporting period.
The Portfolio's assets are calculated by adding the value of the securities owned, the receivable for securities sold but not yet settled and the receivable for Portfolio shares sold to investors but not yet settled. The Portfolio's liabilities include payables for securities purchased but not yet settled, Portfolio shares redeemed but not yet paid and expenses owed but not yet paid.
The section entitled "Net Assets Consist of" breaks down the components of the Portfolio's net assets. Because the Portfolio must distribute substantially all earnings, you will notice that a significant portion of net assets is shareholder capital. The last line of this statement reports the Portfolio's net asset value ("NAV") per share on the last day of the reporting period for each class of the Portfolio. The NAV is calculated by dividing the Portfolio's net assets (assets minus liabilities) by the number of shares outstanding.
4. STATEMENT OF OPERATIONS
This statement details the Portfolio's income, expenses and gains and losses on securities.
The first section in this statement, entitled "Investment Income," reports the interest earned from interest-bearing securities in the Portfolio.
The next section reports the expenses and expense offsets incurred by the Portfolio, including the advisory fee paid to the investment adviser and transfer agent fees.
The last section lists the increase or decrease in the value of securities held in the Portfolio. The Portfolio realizes a gain (or loss) when it sells its position in a particular security.
5. STATEMENT OF CHANGES IN NET ASSETS
This statement reports the increase or decrease in the Portfolio's net assets during the reporting period. Changes in the Portfolio's net assets are attributable to investment operations, dividends, distributions and capital share transactions. This is important to investors because it shows exactly what caused the Portfolio's net asset size to change during the period.
The first section summarizes the information from the Statement of Operations regarding changes in net assets due to the Portfolio's investment performance. The Portfolio's net assets may also change as a result of dividend and capital gains distributions to investors. If investors receive their dividends in cash, money is taken out of the Portfolio to pay the distribution. If investors reinvest their dividends, the Portfolio's net assets will not be affected. If you compare the Portfolio's "Net Decrease from Dividends and Distributions" to the "Reinvested dividends and distributions," you will notice that dividend distributions had little effect on the Portfolio's net assets. This is because the majority of Janus investors reinvest their distributions.
The reinvestment of dividends is included under "Capital Share Transactions." "Capital Shares" refers to the money investors contribute to the Portfolio through purchases or withdraw via redemptions. The Portfolio's net assets will increase and decrease in value as investors purchase and redeem shares from the Portfolio.
6. FINANCIAL HIGHLIGHTS
This schedule provides a per-share breakdown of the components that affect the Portfolio's NAV for current and past reporting periods. Not only does this table provide you with total return, it also reports total distributions, asset size and expense ratios.
18 Janus Aspen Series December 31, 2006
The first line in the table reflects the NAV per share at the beginning of the reporting period. The next line reports the net investment income per share, which comprises interest income earned on securities held by the Portfolio. Following is the total of realized gains. Dividends and distributions are then subtracted to arrive at the NAV per share at the end of the period. The next line reflects the average annual total return reported the last day of the period.
Also included are the expense ratios, or the percentage of net assets that was used to cover operating expenses during the period.
The Portfolio's expenses may be reduced through expense reduction arrangements. These arrangements may include the use of balance credits or transfer agent fee offsets. The Statement of Operations reflects total expenses before any such offset, the amount of offset and the net expenses. The expense ratios listed in the Financial Highlights reflect total expenses prior to any expense offset (gross expense ratio) and after the expense offsets (net expense ratio). Both expense ratios reflect expenses after waivers (reimbursements), if applicable. The ratio of net investment income/(loss) summarizes the income earned less expenses divided by the average net assets of the Portfolio during the reporting period. Don't confuse this ratio with the Portfolio's yield. The net investment income ratio is not a true measure of the Portfolio's yield because it doesn't take into account the dividends distributed to the Portfolio's investors.
Janus Aspen Series December 31, 2006 19
Trustees and Officers (unaudited)
The Portfolio's Statement of Additional Information includes additional information about the Trustees and officers and is available, without charge, by calling 1-800-525-0020.
The following are the Trustees and officers of the Trust, together with a brief description of their principal occupations during the last five years (principal occupations for certain Trustees may include periods over five years).
Each Trustee has served in that capacity since he or she was originally elected or appointed. The Trustees do not serve a specified term of office. Each Trustee will hold office until the termination of the Trust or his or her earlier death, resignation, retirement, incapacity or removal. The retirement age for Trustees is 72. The Portfolio's Nominating and Governance Committee will consider nominees for the position of Trustee recommended by shareholders. Shareholders may submit the name of a candidate for consideration by the Committee by submitting their recommendations to the Trust's Secretary. Each Trustee is currently a Trustee of two other registered investment companies advised by Janus Capital: Janus Investment Fund and Janus Adviser Series. As of the date of this report, collectively, these three registered investment companies consist of 69 series or funds.
The Trust's officers are elected annually by the Trustees for a one-year term. Certain officers also serve as officers of Janus Investment Fund and Janus Adviser Series. Certain officers of the Portfolio may also be officers and/or directors of Janus Capital. Portfolio officers receive no compensation from the Portfolio, except for the Portfolio's Chief Compliance Officer, as authorized by the Trustees.
Trustees
| Name, Age and Address | Positions Held with Portfolio | Length of Time Served | Principal Occupations During the Past Five Years | Number of Portfolios in Fund Complex Overseen by Trustee | Other Directorships Held by Trustee | ||||||||||||||||||
| Independent Trustees | |||||||||||||||||||||||
| Dennis B. Mullen 151 Detroit Street Denver, CO 80206 Age 63 | Chairman Trustee | 3/04-Present 9/93-Present | Chief Executive Officer of Red Robin Gourmet Burgers, Inc. (since 2005). Formerly, private investor. | 69 | * | Chairman of the Board (since 2005) and Director of Red Robin Gourmet Burgers, Inc.; and Director of Janus Capital Funds Plc (Dublin-based, non-U.S. funds). | |||||||||||||||||
| Jerome S. Contro 151 Detroit Street Denver, CO 80206 Age 50 | Trustee | 12/05-Present | Partner of Tango Group, a private investment firm (since 1999). | 69 | Trustee and Chairman of RS Investment Trust (since 2001); Director of IZZE Beverages and MyFamily.com, Inc. (genealogical research website). | ||||||||||||||||||
| William F. McCalpin 151 Detroit Street Denver, CO 80206 Age 49 | Trustee | 6/02-Present | Private Investor. Formerly, Vice President of Asian Cultural Council and Executive Vice President and Chief Operating Officer of The Rockefeller Brothers Fund (a private family foundation). | 69 | Director of the F.B. Heron Foundation (a private grantmaking foundation). | ||||||||||||||||||
| John W. McCarter, Jr. 151 Detroit Street Denver, CO 80206 Age 68 | Trustee | 6/02-Present | President and Chief Executive Officer of The Field Museum of Natural History (Chicago, IL). | 69 | Chairman of the Board and Director of Divergence Inc. (biotechnology firm); Director of W.W. Grainger, Inc. (industrial distributor); and Trustee of WTTW (Chicago public television station) and the University of Chicago. | ||||||||||||||||||
20 Janus Aspen Series December 31, 2006
Trustees (cont.)
| Name, Age and Address | Positions Held with Portfolio | Length of Time Served | Principal Occupations During the Past Five Years | Number of Portfolios in Fund Complex Overseen by Trustee | Other Directorships Held by Trustee | ||||||||||||||||||
| Independent Trustees (cont.) | |||||||||||||||||||||||
| James T. Rothe 151 Detroit Street Denver, CO 80206 Age 63 | Trustee | 1/97-Present | Co-founder and Managing Director of Roaring Fork Capital Management, LLC (private investment in public equity firm); and Professor Emeritus of Business of the University of Colorado, Colorado Springs, CO (since 2004). Formerly, Professor of Business of the University of Colorado (2002-2004); and Distinguished Visiting Professor of Business (2001-2002) of Thunderbird University (American Graduate School of International Management), Glendale, AZ. | 69 | Director of Red Robin Gourmet Burgers, Inc. | ||||||||||||||||||
| William D. Stewart 151 Detroit Street Denver, CO 80206 Age 62 | Trustee | 9/93-Present | Corporate Vice President and General Manager of MKS Instruments – HPS Products, Boulder, CO (a manufacturer of vacuum fittings and valves). | 69 | N/A | ||||||||||||||||||
| Martin H. Waldinger 151 Detroit Street Denver, CO 80206 Age 68 | Trustee | 9/93-Present | Private Investor and Consultant to California Planned Unit Developments. Formerly, CEO and President of Marwal, Inc. (homeowner association management company). | 69 | N/A | ||||||||||||||||||
| Linda S. Wolf 151 Detroit Street Denver, CO 80206 Age 59 | Trustee | 12/05-Present | Retired. Formerly, Chairman and Chief Executive Officer of Leo Burnett (Worldwide) (advertising agency) (2001-2005). | 69 | Director of Wal-Mart, The Field Museum of Natural History (Chicago, IL), Children's Memorial Hospital (Chicago, IL), Chicago Council on Foreign Relations, Economic Club of Chicago, and InnerWorkings (a provider of print procurement solutions). | ||||||||||||||||||
| Interested Trustee | |||||||||||||||||||||||
| Thomas H. Bailey** 151 Detroit Street Denver, CO 80206 Age 69 | Trustee | 5/93-Present | Retired. Formerly, President (1978-2002) and Chief Executive Officer (1994-2002) of Janus Capital or Janus Capital Corporation; Chairman and Director (1978-2002) of Janus Capital Corporation; President and Director (1994-2002) of The Janus Foundation. | 69 | N/A | ||||||||||||||||||
* Mr. Mullen also serves as director of Janus Capital Funds Plc, consisting of 22 funds. Including Janus Capital Funds Plc and the 69 funds comprising the Janus Funds, Mr. Mullen oversees 91 funds.
** The Portfolio is treating Mr. Bailey as an "interested person" of the Trust by virtue of his past positions and continuing relationships with Janus Capital and ownership of shares of Janus Capital's parent company.
Janus Aspen Series December 31, 2006 21
Trustees and Officers (unaudited) (continued)
Officers
| Name, Age and Address | Positions Held with Portfolio | Term of Office* and Length of Time Served | Principal Occupations During the Past Five Years | ||||||||||||
| J. Eric Thorderson 151 Detroit Street Denver, CO 80206 Age 45 | Executive Vice President and Portfolio Manager Janus Aspen Money Market Portfolio | 1/01-Present | Vice President of Janus Capital and Portfolio Manager for other Janus accounts. | ||||||||||||
| Stephanie Grauerholz-Lofton 151 Detroit Street Denver, CO 80206 Age 36 | Chief Legal Counsel and Secretary Vice President | 1/06-Present 3/06-Present | Assistant Vice President of Janus Capital and Janus Distributors LLC; and Associate Counsel of Janus Capital. Formerly, Associate of Vedder, Price, Kaufman & Kammholz, P.C. (1999-2003). | ||||||||||||
| Kelley Abbott Howes 151 Detroit Street Denver, CO 80206 Age 41 | President and Chief Executive Officer | 1/06-Present | President of Janus Services LLC; Senior Vice President and General Counsel of Janus Capital; and Senior Vice President and Assistant General Counsel of Janus Distributors LLC. Formerly, Vice President (1999-2005) of Janus Distributors LLC; Senior Vice President and General Counsel (2004-2006), Vice President (2000-2004), and Assistant General Counsel (2002-2004) of Janus Services LLC; and Vice President and Assistant General Counsel (1999-2004) of Janus Capital. | ||||||||||||
| David R. Kowalski 151 Detroit Street Denver, CO 80206 Age 49 | Vice President and Chief Compliance Officer | 6/02-Present | Senior Vice President and Chief Compliance Officer of Janus Capital, Janus Distributors LLC, and Janus Services LLC; Chief Compliance Officer of Bay Isle Financial LLC; and Vice President of Enhanced Investment Technologies LLC. Formerly, Chief Compliance Officer of Enhanced Investment Technologies, LLC (2003-2005); Vice President of Janus Capital (2000-2005), Janus Distributors LLC (2000-2001), and Janus Services LLC (2004-2005); and Assistant Vice President of Janus Services LLC (2002-2004). | ||||||||||||
| Jesper Nergaard 151 Detroit Street Denver, CO 80206 Age 44 | Chief Financial Officer Vice President, Treasurer, and Principal Accounting Officer | 3/05-Present 2/05-Present | Vice President of Janus Capital. Formerly, Director of Financial Reporting for OppenheimerFunds, Inc. (2004-2005); Site Manager and First Vice President of Mellon Global Securities Services (2003); and Director of Fund Accounting, Project Development, and Training of INVESCO Funds Group (1994-2003). | ||||||||||||
* Officers are elected at least annually for a one-year term and may also be elected from time to time by the Trustees for an interim period.
22 Janus Aspen Series December 31, 2006
Notes
Janus Aspen Series December 31, 2006 23
Notes
24 Janus Aspen Series December 31, 2006
Notes
Janus Aspen Series December 31, 2006 25
Janus provides access to a wide range of investment disciplines.
Growth
Janus growth portfolios focus on companies believed to be the leaders in their respective industries, with solid management teams, expanding market share, margins and efficiencies.
Core
Janus core portfolios seek investments in more stable and predictable companies. These portfolios look for a strategic combination of steady growth and for certain portfolios, some degree of income.
Risk-Managed
Our risk-managed portfolios seek to outperform their respective indices while maintaining a risk profile equal to or lower than the index itself. Managed by INTECH (a Janus subsidiary), these portfolios use a mathematical process in an attempt to build a more "efficient" portfolio than the index.
Value
Janus value portfolios invest in companies they believe are poised for a turnaround or are trading at a significant discount to fair value. The goal is to gain unique insight into a company's true value and identify and evaluate potential catalysts that may unlock shareholder value.
International & Global
Janus international and global portfolios seek to leverage Janus' research capabilities by taking advantage of inefficiencies in foreign markets, where accurate information and analytical insight are often at a premium.
Bond & Money Market
Janus bond portfolios attempt to provide less risk relative to equities while seeking to deliver a competitive total return through high current income and appreciation. Janus money market portfolios seek maximum current income consistent with stability of capital.
For more information about our funds, contact your investment professional or go to www.janus.com/info
Please consider the charges, risks, expenses and investment objectives carefully before investing. For a prospectus containing this and other information, please call Janus at 1-800-525-0020 or download the file from www.janus.com/info. Read it carefully before you invest or send money.
An investment in a money market portfolio is not insured or guaranteed by the Federal Deposit Insurance Corporation or any other government agency. Although the Portfolio seeks to preserve the value of your investment at $1.00 per share, it is possible to lose money by investing in the Portfolio.

151 Detroit Street
Denver, CO 80206
1-800-525-0020
Portfolio distributed by Janus Distributors LLC (1/07)
C-0207-169 109-02-708 01-07
2006 Annual Report
Janus Aspen Series
Janus Aspen Small Company Value Portfolio
Look Inside. . .
• Portfolio management perspective
• Investment strategy behind your portfolio
• Portfolio performance, characteristics and holdings

Table of Contents
| Useful Information About Your Portfolio Report | 1 | ||||||
| Portfolio Management Commentary and Schedule of Investments | 2 | ||||||
| Statement of Assets and Liabilities | 8 | ||||||
| Statement of Operations | 9 | ||||||
| Statements of Changes in Net Assets | 10 | ||||||
| Financial Highlights | 11 | ||||||
| Notes to Schedule of Investments | 12 | ||||||
| Notes to Financial Statements | 13 | ||||||
| Report of Independent Registered Public Accounting Firm | 20 | ||||||
| Additional Information | 21 | ||||||
| Explanations of Charts, Tables and Financial Statements | 24 | ||||||
| Designation Requirements | 26 | ||||||
| Trustees and Officers | 27 | ||||||
Please consider the charges, risks, expenses and investment objectives carefully before investing. For a prospectus containing this and other information, please call Janus at 1-800-525-0020 or download the file from www.janus.com/info. Read it carefully before you invest or send money.
Useful Information About Your Portfolio Report
Management Commentary
The Management Commentary in this report includes valuable insight from the Portfolio's manager as well as statistical information to help you understand how your Portfolio's performance and characteristics stack up against those of comparable indices.
Please keep in mind that the opinions expressed by the Portfolio's manager in the Management Commentary are just that: opinions. They are a reflection of the manager's best judgment at the time this report was compiled, which was December 31, 2006. As the investing environment changes, so could the manager's opinions. The views are unique to the manager and aren't necessarily shared by his fellow employees or by Janus in general.
Portfolio Expenses
We believe it's important for our shareholders to have a clear understanding of Portfolio expenses and the impact they have on investment return.
The following is important information regarding the Portfolio's Expense Example, which appears in the Portfolio Management Commentary within this Annual Report. Please refer to this information when reviewing the Expense Example for the Portfolio.
Example
As a shareholder of a Portfolio, you incur two types of costs: (1) transaction costs, including redemption fees (where applicable) (and any related exchange fees) and (2) ongoing costs, including management fees; distribution and shareholder servicing (12b-1) fees (applicable to Service Shares only); administrative services fees (applicable to Service Shares only); and other Portfolio expenses. The example is intended to help you understand your ongoing costs (in dollars) of investing in a Portfolio and to compare these costs with the ongoing costs of investing in other mutual funds. To do so, compare this 5% hypothetical example with the 5% hypothetical examples that appear in the shareholder reports of the other funds. The example is based upon an investment of $1,000 invested at the beginning of the period and held for the six-month period from July 1, 2006 to December 31, 2006.
Actual Expenses
The first line of the table in each example provides information about actual account values and actual expenses. You may use the information in this line, together with the amount you invested, to estimate the expenses that you paid over the period. Simply divide your account value by $1,000 (for example, an $8,600 account value divided by $1,000 = 8.6), then multiply the result by the number in the first line under the heading entitled "Expenses Paid During Period" to estimate the expenses you paid on your account during the period.
Hypothetical Example for Comparison Purposes
The second line of the table in each example provides information about hypothetical account values and hypothetical expenses based upon the Portfolio's actual expense ratio and an assumed rate of return of 5% per year before expenses, which is not the Portfolio's actual return. The hypothetical account values and expenses may not be used to estimate the actual ending account balance or expenses you paid for the period. You may use this information to compare the ongoing costs of investing in the Portfolio and other funds. To do so, compare this 5% hypothetical example with the 5% hypothetical examples that appear in the shareholder reports of the other funds.
Janus Capital Management LLC ("Janus Capital") has contractually agreed to waive the Portfolio's total operating expenses, excluding the distribution and shareholder servicing (12b-1) fees applicable to Service Shares, the administrative services fees applicable to Service Shares, brokerage commissions, interest, taxes and extraordinary expenses to certain limits until at least May 1, 2008. Expenses in the examples reflect application of these waivers. Had the waivers not been in effect, your expenses would have been higher. More information regarding the waivers is available in the Portfolio's prospectus.
Please note that the expenses shown in the tables are meant to highlight your ongoing costs only and do not reflect any transaction costs, such as redemption fees (where applicable) and any charges at the separate account level or contract level. Redemption fees are fully described in the prospectus. Therefore, the second line of each table is useful in comparing ongoing costs only, and will not help you determine the relative total costs of owning different funds. In addition, if these transaction costs and separate account or contract level charges were included, your costs would have been higher.
Janus Aspen Series December 31, 2006 1
Janus Aspen Small Company Value
Portfolio (unaudited)
Portfolio Snapshot
This portfolio searches for small, out-of-favor companies misunderstood by the broader investment community.

Jakob Holm
portfolio manager
Performance Overview
Equity markets were volatile during the 12-month period ended December 31, 2006. A late spring sell-off, prompted by spiking oil prices and increasing short-term interest rates, erased gains posted through the first three months of the year, especially among more speculative names. The market reversed course in July, and despite a few bumps in the road during the second half, finished the year on an up note.
Despite an up-and-down year in the markets, Janus Aspen Small Company Value Portfolio's Service Shares posted positive returns of 21.80%, slightly underperforming the Portfolio's benchmark, the Russell 2000® Value Index, which returned 23.48%. With nearly 80 holdings and a median market capitalization of approximately $1.4 billion, the Portfolio offers relatively strong diversification across the small-cap universe – a trait that has been beneficial during these volatile times.
Detractors During the Period
Elsewhere, holding returns back was the Mills Corporation, a retail mall real estate investment trust (REIT) that we purchased late last year after it lagged the REIT industry and appeared to be undervalued. Unfortunately, since then the company has continued to struggle, and it is currently facing a formal investigation by the Securities and Exchange Commission. In light of this development – and given that Mills may have trouble selling its malls if its financials aren't deemed reliable – we eliminated our entire position following the company's poor showing in the first quarter. This move was in keeping with our decision to cut back our overall weighting in REITs. Many names in this area have been increasing in value since 2000, and we believe that the industry could be peaking.
Another detractor was Fleetwood, a top producer of recreational vehicles (RVs) and manufactured homes. The company's stock fell following a negative earnings pre-announcement in which Fleetwood described soft markets for both motor and factory homes. We believe that part of this softness can be traced to a falloff in hurricane relief. After Hurricanes Katrina and Rita, the Federal Emergency Management Agency (FEMA) became a key buyer of Fleetwood homes. This spate of buying has since abated. In addition, Fleetwood's current line-up of motor homes has failed to attract consumers' attention, resulting in a loss of market share to competitors like Thor Industries (another Portfolio holding). As a result, we liquidated the holding.
Ligand Pharmaceuticals, which markets a drug called AVINZA used to treat chronic pain, also disappointed. While the product seemed promising, the company failed to market the drug well. We retained Ligand in the Portfolio through the first half as an attractive takeout candidate, thinking we could realize a significant gain if the right buyer stepped in at the right time. Eventually, Ligand was sold but the price did not command the expected premium.
Standouts During the Period
The highest returns during the period came from TETRA Technologies, which is one of the Portfolio's largest holdings. TETRA supplies chemicals used by the oil and gas industry to facilitate the drilling and servicing of wells. On strong drilling activity during the year, the company turned in outstanding quarterly results throughout the period.
RTI International Metals also performed exceptionally well, as commodity metals have gained tremendous ground over the past several months. Stewart & Stevenson, a manufacturer of vehicles for the defense industry, also boosted returns. The company's announcement in February that it would be acquired by Armor Holdings, another defense contractor, sent Stewart & Stevenson's stock soaring.
Maverick Tube, which makes welded steel tubes and line pipe products used in the oil fields, also contributed during the period. While demand was up earlier in the year due to a shortage of Maverick's products in the market, the real catalyst behind the company's sharp gain was its merger with fellow pipe producer Tenaris S.A. Tenaris announced the acquisition of Maverick in June, sending Maverick's stock significantly higher. We believe this event exemplifies an ongoing development in the small- and mid-cap markets. With so much excess liquidity in the form of both private and corporate equity, acquisitions have been occurring on a regular basis.
2 Janus Aspen Series December 31, 2006
(unaudited)
Looking Forward
While the housing market cooled off, it did not take the nosedive that many had feared. In fact, the economy has proved to be resilient. Despite these and other positive economic signs, there is still uncertainty in the market, and investor wariness in the second half of 2006 led to a movement toward blue chip stocks, as small-cap stocks became expensive relative to the rest of the market. In 2007 we will be monitoring these elements with great care. However, we believe that by applying a disciplined, bottom-up approach, we will continue to uncover undervalued small-cap stocks.
Thank you for your investment in Janus Aspen Small Company Value Portfolio.
Janus Aspen Small Company Value Portfolio At a Glance
5 Largest Contributors to Performance - Holdings
| Contribution | |||||||
| TETRA Technologies, Inc. Energy services company - U.S. | 1.68 | % | |||||
| RTI International Metals, Inc. Manufacturer and distributor of titanium and specialty metal mill products - U.S. | 1.40 | % | |||||
| Centene Corp. Medicaid and Medicaid-related programs provider - U.S. | 1.35 | % | |||||
| Stewart & Stevenson Services, Inc. Tactical vehicles designer, manufacturer and services for United States Army - U.S. | 1.08 | % | |||||
| SL Green Realty Corp. Real Estate Investment Trust - U.S. | 1.01 | % | |||||
5 Largest Detractors from Performance - Holdings
| Contribution | |||||||
| Adolor Corp. Therapeutic-based biopharmaceutical company - U.S. | (0.95 | )% | |||||
| Mills Corp. Real Estate Investment Trust - Office property - U.S. | (0.67 | )% | |||||
| Spherion Corp. Workforce management services provider - U.S. | (0.53 | )% | |||||
| National Financial Partners Corp. Independent distributor of financial services products - U.S. | (0.50 | )% | |||||
| Fleetwood Enterprises, Inc. Manufactured housing producer and retailer - U.S. | (0.44 | )% | |||||
5 Largest Contributors to Performance - Sectors
| Group | Portfolio Contribution | Portfolio Weighting (% of Net Assets) | Russell 2000® Value Index Weighting | ||||||||||||
| Capital Goods | 3.98 | % | 9.29 | % | 8.84 | % | |||||||||
| Banks | 3.86 | % | 18.17 | % | 15.77 | % | |||||||||
| Real Estate | 3.27 | % | 10.93 | % | 11.40 | % | |||||||||
| Energy | 2.99 | % | 9.34 | % | 4.70 | % | |||||||||
| Software & Services | 2.26 | % | 5.98 | % | 4.17 | % | |||||||||
5 Lowest Contributors/Detractors to Performance – Sectors
| Group | Portfolio Contribution | Portfolio Weighting (% of Net Assets) | Russell 2000® Value Index Weighting | ||||||||||||
| Commercial Services & Supplies | (0.87 | )% | 4.97 | % | 3.21 | % | |||||||||
| Pharmaceuticals & Biotechnology | (0.61 | )% | 3.40 | % | 1.97 | % | |||||||||
| Automobiles & Components | (0.10 | )% | 1.46 | % | 1.36 | % | |||||||||
| Transportation | 0.00 | % | 0.00 | % | 1.58 | % | |||||||||
| Media | 0.00 | % | 0.00 | % | 2.20 | % | |||||||||
Janus Aspen Series December 31, 2006 3
Janus Aspen Small Company Value Portfolio (unaudited)
5 Largest Equity Holdings – (% of Net Assets)
As of December 31, 2006
| Applied Industrial Technologies, Inc. Machinery - General Industrial | 2.6 | % | |||||
| Genlyte Group, Inc. Building Products - Lighting Fixtures | 2.5 | % | |||||
| American Financial Group, Inc. Multi-Line Insurance | 2.5 | % | |||||
| RTI International Metals, Inc. Non-Ferrous Metals | 2.3 | % | |||||
| Arris Group, Inc. Telecommunication Equipment | 2.2 | % | |||||
| 12.1 | % | ||||||
Asset Allocation – (% of Net Assets)
As of December 31, 2006

Top Country Allocations – (% of Investment Securities)
| As of December 31, 2006 | As of December 31, 2005 | ||||||
 |  | ||||||
4 Janus Aspen Series December 31, 2006
(unaudited)
Performance
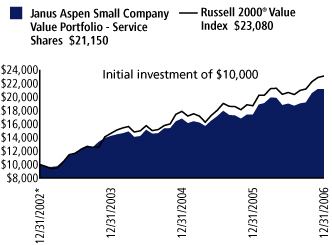
Average Annual Total Return – for the periods ended December 31, 2006
| One Year | Since Inception* | ||||||||||
| Janus Aspen Small Company Value Portfolio - Service Shares | 21.80 | % | 20.59 | % | |||||||
| Russell 2000® Value Index | 23.48 | % | 23.26 | % | |||||||
| Lipper Quartile - Service Shares | 1 | st | 1 | st | |||||||
| Lipper Ranking - Service Shares based on total returns for Variable Annuity Small-Cap Core Funds | 6/127 | 20/100 | |||||||||
Data presented represents past performance, which is no guarantee of future results. Investment results and principal value will fluctuate so that shares, when redeemed, may be worth more or less than their original cost. Due to market volatility, current performance may be higher or lower than the performance shown. Call 877.33JANUS or visit www.janus.com/info for performance current to the most recent month-end.
See Notes to Schedule of Investments for index definitions.
Total return includes reinvestment of dividends from net investment income and distributions from capital gains. The returns shown do not reflect the deduction of taxes that a shareholder would pay on Portfolio distributions or the redemption of Portfolio shares.
These returns do not reflect the charges and expenses of any particular insurance product or qualified plan. Returns shown would have been lower had they included insurance charges.
The Portfolio may differ significantly from the securities held in the index. The index is not available for direct investment; therefore its performance does not reflect the expenses associated with the active management of an actual Portfolio.
There is no assurance that the investment process will consistently lead to successful investing.
Portfolios that invest in REITs may be subject to a higher degree of market risk because of concentration in a specific industry, sector or geographic region. REITs may be subject to risks including, but not limited to, decline in the value of real estate, risks related to general and economic conditions, changes in the value of the underlying property owned by the trust and defaults by borrowers.
Janus Capital has contractually agreed to waive the Portfolio's total operating expenses to the levels indicated in the prospectus until at least May 1, 2008. Without such waivers total returns would have been lower.
The Portfolio's performance may be affected by risks that include those associated with nondiversification, non-investment grade debt securities, undervalued or overlooked companies, investments in specific industries or countries and potential conflicts of interest with Janus Smart Portfolios. Additional risks to the Portfolio may include those associated with investing in foreign securities, emerging markets, initial public offerings, derivatives and companies with relatively small market capitalizations. Please see a Janus prospectus or www.janus.com/info for more information about risk, fund holdings and details.
Lipper Inc. - A Reuters Company, is a nationally recognized organization that ranks the performance of mutual funds within a universe of funds that have similar investment objectives. Rankings are historical with capital gains and dividends reinvested.
The Portfolio will invest at least 80% of its net assets in the type of securities described by its name.
See Explanations of Charts, Tables and Financial Statements
* The Portfolio's inception date – December 31, 2002
Portfolio Expenses
The example below shows you the ongoing costs (in dollars) of investing in your Portfolio and allows you to compare these costs with those of other mutual funds. Please refer to page 1 for a detailed explanation of the information presented in this chart.
| Expense Example - Service Shares | Beginning Account Value (7/1/06) | Ending Account Value (12/31/06) | Expenses Paid During Period (7/1/06-12/31/06)* | ||||||||||||
| Actual | $ | 1,000.00 | $ | 1,113.10 | $ | 9.00 | |||||||||
| Hypothetical (5% return before expenses) | $ | 1,000.00 | $ | 1,016.69 | $ | 8.59 | |||||||||
*Expenses are equal to the annualized expense ratio of 1.69%, multiplied by the average account value over the period, multiplied by 184/365 (to reflect the one-half year period). Expenses may include effect of contractual waivers by Janus Capital.
Janus Aspen Series December 31, 2006 5
Janus Aspen Small Company Value Portfolio
Schedule of Investments
As of December 31, 2006
| Shares or Principal Amount | Value | ||||||||||
| Common Stock - 99.8% | |||||||||||
| Advanced Materials/Products - 1.6% | |||||||||||
| 4,695 | Ceradyne, Inc.* | $ | 265,268 | ||||||||
| Applications Software - 0.9% | |||||||||||
| 10,786 | Quest Software, Inc.* | 158,015 | |||||||||
| Building - Mobile Home and Manufactured Homes - 1.0% | |||||||||||
| 3,890 | Thor Industries, Inc. | 171,121 | |||||||||
| Building - Residential and Commercial - 1.5% | |||||||||||
| 13,210 | WCI Communities, Inc.* | 253,368 | |||||||||
| Building and Construction - Miscellaneous - 1.3% | |||||||||||
| 10,117 | Dycom Industries, Inc.* | 213,671 | |||||||||
| Building Products - Lighting Fixtures - 2.5% | |||||||||||
| 5,362 | Genlyte Group, Inc.* | 418,826 | |||||||||
| Chemicals - Diversified - 1.1% | |||||||||||
| 2,507 | FMC Corp. | 191,911 | |||||||||
| Chemicals - Specialty - 1.1% | |||||||||||
| 4,265 | Cabot Corp. | 185,826 | |||||||||
| Collectibles - 1.7% | |||||||||||
| 6,582 | RC2 Corp.* | 289,608 | |||||||||
| Commercial Banks - 13.7% | |||||||||||
| 6,208 | 1st Source Corp. | 199,463 | |||||||||
| 5,784 | BancFirst Corp. | 312,335 | |||||||||
| 5,831 | Camden National Corp. | 268,925 | |||||||||
| 8,825 | Community Bank System, Inc. | 202,975 | |||||||||
| 1,240 | First Citizens BancShares, Inc. - Class A | 251,274 | |||||||||
| 7,603 | First Commonwealth Financial Corp. | 102,108 | |||||||||
| 4,762 | Omega Financial Corp. | 152,003 | |||||||||
| 2,833 | Peoples Bancorp, Inc. | 84,140 | |||||||||
| 5,992 | Simmons First National Corp. - Class A | 189,048 | |||||||||
| 5,904 | TriCo Bancshares | 160,648 | |||||||||
| 4,656 | UMB Financial Corp. | 169,991 | |||||||||
| 7,183 | Washington Trust Bancorp, Inc. | 200,334 | |||||||||
| 2,293,244 | |||||||||||
| Commercial Services - 2.1% | |||||||||||
| 7,786 | Steiner Leisure, Ltd.* | 354,263 | |||||||||
| Commercial Services - Finance - 1.0% | |||||||||||
| 6,975 | Deluxe Corp. | 175,770 | |||||||||
| Computer Services - 0.9% | |||||||||||
| 2,696 | CACI International, Inc.* | 152,324 | |||||||||
| Computers - Voice Recognition - 1.4% | |||||||||||
| 8,530 | TALX Corp. | 234,149 | |||||||||
| Consulting Services - 1.7% | |||||||||||
| 10,100 | FTI Consulting, Inc.* | 281,689 | |||||||||
| Containers - Metal and Glass - 1.5% | |||||||||||
| 13,935 | Owens-Illinois, Inc.* | 257,101 | |||||||||
| Diversified Operations - 0.4% | |||||||||||
| 241,259 | Polytec Asset Holdings, Ltd.§ | 68,237 | |||||||||
| Electric - Integrated - 0.8% | |||||||||||
| 4,100 | Otter Tail Corp. | 127,756 | |||||||||
| Electronic Components - Semiconductors - 5.1% | |||||||||||
| 6,650 | International Rectifier Corp.* | 256,225 | |||||||||
| 17,800 | Microsemi Corp.* | 349,769 | |||||||||
| 16,101 | MIPS Technologies, Inc.* | 133,638 | |||||||||
| 8,581 | Zoran Corp.* | 125,111 | |||||||||
| 864,743 | |||||||||||
| Shares or Principal Amount | Value | ||||||||||
| Electronic Measuring Instruments - 1.3% | |||||||||||
| 4,409 | Trimble Navigation, Ltd.* | $ | 223,669 | ||||||||
| Food - Canned - 0.9% | |||||||||||
| 14,018 | Del Monte Foods Co. | 154,619 | |||||||||
| Food - Diversified - 1.2% | |||||||||||
| 4,800 | J & J Snack Foods Corp. | 198,720 | |||||||||
| Food - Retail - 2.0% | |||||||||||
| 5,118 | Ruddick Corp. | 142,025 | |||||||||
| 4,874 | Weis Markets, Inc. | 195,496 | |||||||||
| 337,521 | |||||||||||
| Gas - Distribution - 1.2% | |||||||||||
| 2,972 | Atmos Energy Corp. | 94,837 | |||||||||
| 3,907 | Piedmont Natural Gas Company, Inc. | 104,512 | |||||||||
| 199,349 | |||||||||||
| Internet Applications Software - 1.4% | |||||||||||
| 16,641 | Interwoven, Inc.* | 244,123 | |||||||||
| Internet Infrastructure Equipment - 1.5% | |||||||||||
| 7,540 | Avocent Corp.* | 255,229 | |||||||||
| Investment Management and Advisory Services - 1.0% | |||||||||||
| 3,748 | National Financial Partners Corp. | 164,800 | |||||||||
| Machinery - Electrical - 1.7% | |||||||||||
| 5,375 | Regal-Beloit Corp. | 282,241 | |||||||||
| Machinery - Farm - 1.0% | |||||||||||
| 6,930 | Alamo Group, Inc. | 162,578 | |||||||||
| Machinery - General Industrial - 2.6% | |||||||||||
| 16,336 | Applied Industrial Technologies, Inc. | 429,800 | |||||||||
| Medical - Drugs - 0.9% | |||||||||||
| 20,385 | Adolor Corp.* | 153,295 | |||||||||
| Medical - HMO - 2.0% | |||||||||||
| 13,740 | Centene Corp.* | 337,592 | |||||||||
| Medical Instruments - 1.8% | |||||||||||
| 12,957 | CONMED Corp.* | 299,566 | |||||||||
| Medical Labs and Testing Services - 0.7% | |||||||||||
| 2,122 | Covance, Inc.* | 125,007 | |||||||||
| Multi-Line Insurance - 2.5% | |||||||||||
| 11,595 | American Financial Group, Inc. | 416,376 | |||||||||
| Non-Ferrous Metals - 2.3% | |||||||||||
| 4,910 | RTI International Metals, Inc.* | 384,060 | |||||||||
| Oil - Field Services - 2.0% | |||||||||||
| 13,266 | TETRA Technologies, Inc.* | 339,344 | |||||||||
| Oil and Gas Drilling - 0.9% | |||||||||||
| 3,056 | Atwood Oceanics, Inc.* | 149,652 | |||||||||
| Oil Companies - Exploration and Production - 5.5% | |||||||||||
| 10,006 | Forest Oil Corp.* | 326,995 | |||||||||
| 7,906 | Mariner Energy, Inc.* | 154,958 | |||||||||
| 4,785 | Plains Exploration & Production Co.* | 227,431 | |||||||||
| 5,551 | St. Mary Land & Exploration Co. | 204,499 | |||||||||
| 913,883 | |||||||||||
| Physical Therapy and Rehabilitation Centers - 0.9% | |||||||||||
| 6,356 | HEALTHSOUTH Corp.* | 143,963 | |||||||||
| Recreational Vehicles - 1.0% | |||||||||||
| 3,760 | Polaris Industries, Inc. | 176,081 | |||||||||
| REIT - Health Care - 1.7% | |||||||||||
| 9,475 | Nationwide Health Properties, Inc. | 286,335 | |||||||||
See Notes to Schedule of Investments and Financial Statements.
6 Janus Aspen Series December 31, 2006
Schedule of Investments
As of December 31, 2006
| Shares or Principal Amount | Value | ||||||||||
| REIT - Office Property - 4.6% | |||||||||||
| 1,695 | Alexandria Real Estate Equities, Inc. | $ | 170,178 | ||||||||
| 13,945 | Douglas Emmett, Inc. | 370,797 | |||||||||
| 2,900 | Kilroy Realty Corp. | 226,200 | |||||||||
| 767,175 | |||||||||||
| REIT - Regional Malls - 2.1% | |||||||||||
| 7,105 | Taubman Centers, Inc. | 361,360 | |||||||||
| REIT - Shopping Centers - 1.1% | |||||||||||
| 7,490 | Acadia Realty Trust | 187,400 | |||||||||
| REIT - Warehouse and Industrial - 1.3% | |||||||||||
| 7,342 | First Potomac Realty Trust | 213,726 | |||||||||
| Rental Auto/Equipment - 1.5% | |||||||||||
| 10,095 | United Rentals, Inc.* | 256,716 | |||||||||
| Savings/Loan/Thrifts - 3.3% | |||||||||||
| 2,918 | First Defiance Financial Corp. | 88,415 | |||||||||
| 4,214 | FirstFed Financial Corp.* | 282,211 | |||||||||
| 6,183 | Provident Financial Holdings, Inc. | 188,520 | |||||||||
| 559,146 | |||||||||||
| Telecommunication Equipment - 2.2% | |||||||||||
| 30,059 | Arris Group, Inc.* | 376,038 | |||||||||
| Telephone - Integrated - 1.7% | |||||||||||
| 6,055 | Golden Telecom, Inc. | 283,616 | |||||||||
| Water - 1.0% | |||||||||||
| 4,517 | American States Water Co. | 174,447 | |||||||||
| Wire and Cable Products - 1.7% | |||||||||||
| 7,474 | Belden CDT, Inc. | 292,159 | |||||||||
| Total Common Stock (cost $14,059,771) | 16,806,476 | ||||||||||
| Money Markets - 0.4% | |||||||||||
| 71,475 | Janus Institutional Cash Reserves Fund 5.29% (cost $71,475) | 71,475 | |||||||||
| Total Investments (total cost $14,131,246) – 100.2% | 16,877,951 | ||||||||||
| Liabilities, net of Cash, Receivables and Other Assets – (0.2)% | (33,318 | ) | |||||||||
| Net Assets – 100% | $ | 16,844,633 | |||||||||
Summary of Investments by Country
| Country | Value | % of Investment Securities | |||||||||
| Cayman Islands | $ | 68,237 | 0.4 | % | |||||||
| United States†† | 16,809,714 | 99.6 | % | ||||||||
| Total | $ | 16,877,951 | 100.0 | % | |||||||
†† Includes Short-Term Securities (99.2% excluding Short-Term Securities)
See Notes to Schedule of Investments and Financial Statements.
Janus Aspen Series December 31, 2006 7
Statement of Assets and Liabilities
| As of December 31, 2006 (all numbers in thousands except net asset value per share) | Janus Aspen Small Company Value Portfolio | ||||||
| Assets: | |||||||
| Investments at cost | $ | 14,131 | |||||
| Investments at value | $ | 16,878 | |||||
| Cash | 1,118 | ||||||
| Receivables: | |||||||
| Investments sold | 286 | ||||||
| Portfolio shares sold | 2 | ||||||
| Dividends | 23 | ||||||
| Interest | 1 | ||||||
| Other assets | – | ||||||
| Total Assets | 18,308 | ||||||
| Liabilities: | |||||||
| Payables: | |||||||
| Investments purchased | 1,157 | ||||||
| Portfolio shares repurchased | 246 | ||||||
| Advisory fees | 12 | ||||||
| Transfer agent fees and expenses | – | ||||||
| Administrative services fees - Service Shares | 1 | ||||||
| Non-interested Trustees' fees and expenses | – | ||||||
| Accrued expenses | 47 | ||||||
| Total Liabilities | 1,463 | ||||||
| Net Assets | $ | 16,845 | |||||
| Net Assets Consist of: | |||||||
| Capital (par value and paid-in-surplus)* | $ | 13,718 | |||||
| Undistributed net investment income/(loss)* | (6 | ) | |||||
| Undistributed net realized gain/(loss) from investments and foreign currency transactions* | 386 | ||||||
| Unrealized net appreciation/(depreciation) of investments and foreign currency translations | 2,747 | ||||||
| Total Net Assets | $ | 16,845 | |||||
| Net Assets - Service Shares | $ | 16,845 | |||||
| Shares Outstanding, $0.001 Par Value (unlimited shares authorized) | 847 | ||||||
| Net Asset Value Per Share | $ | 19.89 | |||||
*See Note 3 in Notes to Financial Statements.
See Notes to Financial Statements.
8 Janus Aspen Series December 31, 2006
Statement of Operations
| For the fiscal year ended December 31, 2006 (all numbers in thousands) | Janus Aspen Small Company Value Portfolio | ||||||
| Investment Income: | |||||||
| Interest | $ | 11 | |||||
| Dividends | 155 | ||||||
| Dividends from affiliates | 14 | ||||||
| Total Investment Income | 180 | ||||||
| Expenses: | |||||||
| Advisory fees | 97 | ||||||
| Transfer agent expenses | 3 | ||||||
| Registration fees | – | ||||||
| Custodian fees | 13 | ||||||
| Professional fees | 28 | ||||||
| Non-interested Trustees' fees and expenses | 3 | ||||||
| Distribution fees - Service Shares | 33 | ||||||
| Administrative services fees - Service Shares | 13 | ||||||
| Legal fees | 12 | ||||||
| Printing expenses | 32 | ||||||
| Proxy expenses | 12 | ||||||
| System fees | 36 | ||||||
| Other expenses | 5 | ||||||
| Non-recurring costs (Note 2) | – | ||||||
| Costs assumed by Janus Capital Management LLC (Note 2) | – | ||||||
| Total Expenses | 287 | ||||||
| Expense and Fee Offset | – | ||||||
| Net Expenses | 287 | ||||||
| Less: Excess Expense Reimbursement | (66 | ) | |||||
| Net Expenses after Expense Reimbursement | 221 | ||||||
| Net Investment Income/(Loss) | (41 | ) | |||||
| Net Realized and Unrealized Gain/(Loss) on Investments: | |||||||
| Net realized gain/(loss) from securities transactions | 689 | ||||||
| Net realized gain/(loss) from foreign currency transactions | – | ||||||
| Change in unrealized net appreciation/(depreciation) of investments and foreign currency translations | 1,878 | ||||||
| Net Gain/(Loss) on Investments | 2,567 | ||||||
| Net Increase/(Decrease) in Net Assets Resulting from Operations | $ | 2,526 | |||||
See Notes to Financial Statements.
Janus Aspen Series December 31, 2006 9
Statements of Changes in Net Assets
| For the fiscal year ended December 31 | Janus Aspen Small Company Value Portfolio | ||||||||||
| (all numbers in thousands) | 2006 | 2005 | |||||||||
| Operations: | |||||||||||
| Net investment income/(loss) | $ | (41 | ) | $ | (13 | ) | |||||
| Net realized gain/(loss) from investment and foreign currency transactions | 689 | (142 | ) | ||||||||
| Change in unrealized net appreciation/(depreciation) of investments and foreign currency translations | 1,878 | 311 | |||||||||
| Net Increase/(Decrease) in Net Assets Resulting from Operations | 2,526 | 156 | |||||||||
| Dividends and Distributions to Shareholders: | |||||||||||
| Net investment income* | |||||||||||
| Service Shares | – | – | |||||||||
| Net realized gain from investment transactions* | |||||||||||
| Service Shares | (125 | ) | (1 | ) | |||||||
| Net Decrease from Dividends and Distributions | (125 | ) | (1 | ) | |||||||
| Capital Share Transactions: | |||||||||||
| Shares sold | |||||||||||
| Service Shares | 8,319 | 7,097 | |||||||||
| Reinvested dividends and distributions | |||||||||||
| Service Shares | 125 | 1 | |||||||||
| Shares repurchased | |||||||||||
| Service Shares | (3,013 | ) | (995 | ) | |||||||
| Net Increase/(Decrease) from Capital Share Transactions | 5,431 | 6,103 | |||||||||
| Net Increase/(Decrease) in Net Assets | 7,832 | 6,258 | |||||||||
| Net Assets: | |||||||||||
| Beginning of period | 9,013 | 2,755 | |||||||||
| End of period | $ | 16,845 | $ | 9,013 | |||||||
| Undistributed net investment income/(loss)* | $ | (6 | ) | $ | – | ||||||
*See Note 3 in Notes to Financial Statements.
See Notes to Financial Statements.
10 Janus Aspen Series December 31, 2006
Financial Highlights - Service Shares
| For a share outstanding during each fiscal year or period ended December 31 | Janus Aspen Small Company Value Portfolio | ||||||||||||||||||||||
| 2006 | 2005 | 2004 | 2003 | 2002(1) | |||||||||||||||||||
| Net Asset Value, Beginning of Period | $ | 16.45 | $ | 15.90 | $ | 14.20 | $ | 9.92 | $ | 10.00 | |||||||||||||
| Income from Investment Operations: | |||||||||||||||||||||||
| Net investment income/(loss) | (.01 | ) | – | (2) | .01 | .02 | – | (2) | |||||||||||||||
| Net gain/(loss) on securities (both realized and unrealized) | 3.60 | .55 | 2.51 | 4.26 | (.08 | ) | |||||||||||||||||
| Total from Investment Operations | 3.59 | .55 | 2.52 | 4.28 | (.08 | ) | |||||||||||||||||
| Less Distributions: | |||||||||||||||||||||||
| Dividends (from net investment income)* | – | – | (.02 | ) | – | – | |||||||||||||||||
| Distributions (from capital gains)* | (.15 | ) | – | (3) | (.80 | ) | – | – | |||||||||||||||
| Total Distributions | (.15 | ) | – | (.82 | ) | – | – | ||||||||||||||||
| Net Asset Value, End of Period | $ | 19.89 | $ | 16.45 | $ | 15.90 | $ | 14.20 | $ | 9.92 | |||||||||||||
| Total Return** | 21.80 | % | 3.49 | % | 18.16 | % | 43.15 | % | (0.80 | )% | |||||||||||||
| Net Assets, End of Period (in thousands) | $ | 16,845 | $ | 9,013 | $ | 2,755 | $ | 1,626 | $ | 496 | |||||||||||||
| Average Net Assets for the Period (in thousands) | $ | 13,106 | $ | 5,120 | $ | 2,062 | $ | 856 | $ | – | |||||||||||||
| Ratio of Gross Expenses to Average Net Assets***(4) | 1.69 | % | 1.69 | % | 1.60 | % | 1.60 | % | N/A | ||||||||||||||
| Ratio of Net Expenses to Average Net Assets***(4) | 1.69 | % | 1.69 | % | 1.59 | % | 1.60 | % | N/A | ||||||||||||||
| Ratio of Net Investment Income/(Loss) to Average Net Assets*** | (0.32 | )% | (0.25 | )% | (0.05 | )% | 0.14 | % | N/A | ||||||||||||||
| Portfolio Turnover Rate*** | 59 | % | 53 | % | 43 | % | 50 | % | 0 | % | |||||||||||||
* See Note 3 in Notes to Financial Statements.
** Total return not annualized for periods of less than one full year.
*** Annualized for periods of less than one full year.
(1) Portfolio commenced operations on December 31, 2002 (inception date).
(2) Net investment income/(loss) aggregated less than $.01 on a per share basis for the fiscal year or period ended.
(3) Distributions (from capital gains) aggregated less than $.01 on a per share basis for the fiscal year ended.
(4) See Note 4 in Notes to Financial Statements.
See Notes to Financial Statements.
Janus Aspen Series December 31, 2006 11
Notes to Schedule of Investments
| Lipper Variable Annuity Small-Cap Core Funds | Funds that, by portfolio practice, invest at least 75% of their equity assets in companies with market capitalizations (on a three-year weighted basis) less than 250% of the dollar-weighted median of the smallest 500 of the middle 1,000 securities of the S&P SuperComposite 1500® Index. Small-cap core funds have more latitude in the companies in which they invest. These funds typically have an average price-to-earnings ratio, price-to-book ratio, and three-year sales-per-share growth value, compared to the S&P SmallCap 600® Index. | ||||||
| Russell 2000® Value Index | Is an unmanaged index which measures the performance of those Russell 2000® Index companies with lower price-to-book and price-to-earnings ratios. It is a generally recognized indicator to measure overall small company value-stock performance. | ||||||
| REIT | Real Estate Investment Trust | ||||||
* Non-income-producing security.
§Schedule of Restricted and Illiquid Securities (as of December 31, 2006)
| Acquisition Date | Acquisition Cost | Value | Value as % of Net Assets | ||||||||||||||||
| Janus Aspen Small Company Value Portfolio | |||||||||||||||||||
| Polytec Asset Holdings, Ltd. | 5/5/06 | $ | 62,260 | $ | 68,237 | 0.4 | % | ||||||||||||
The Portfolio has registration rights for certain restricted securities held as of December 31, 2006. The issuer incurs all registration costs.
12 Janus Aspen Series December 31, 2006
Notes to Financial Statements
The following section describes the organization and significant accounting policies and provides more detailed information about the schedules and tables that appear throughout this report. In addition, the Notes to Financial Statements explain the methods used in preparing and presenting this report.
1. ORGANIZATION AND SIGNIFICANT ACCOUNTING POLICIES
Janus Aspen Small Company Value Portfolio (the "Portfolio") is a series fund. The Portfolio is part of Janus Aspen Series (the "Trust"), which is organized as a Delaware statutory trust and is registered under the Investment Company Act of 1940 (the "1940 Act") as an open-end management investment company. The Trust offers seventeen Portfolios, which include multiple series of shares, with differing investment objectives and policies. The Portfolio invests primarily in equity securities. The Portfolio is classified as diversified, as defined in the 1940 Act. The Portfolio is a no-load investment.
The Portfolio currently offers one class of shares: Service Shares. Service Shares are offered only in connection with investment in and payments under variable insurance contracts and to qualified retirement plans that require a fee from Portfolio assets to procure distribution and administrative services to contract owners and plan participants.
Janus Capital Management, LLC ("Janus Capital") invested initial seed capital in the amount of $500,000 for the Portfolio on December 31, 2002.
The following accounting policies have been consistently followed by the Portfolio and are in conformity with accounting principles generally accepted in the United States of America in the investment company industry.
Investment Valuation
Securities are valued at the last sales price or the official closing price for securities traded on a principal securities exchange (U.S. or foreign) and on the NASDAQ National Market. Securities traded on over-the-counter markets and listed securities for which no sales are reported are valued at the latest bid price (or yield equivalent thereof) obtained from one or more dealers transacting in a market for such securities or by a pricing service approved by the Portfolio's Trustees. Short-term securities with maturities of 60 days or less may be valued at amortized cost, which approximates market value. Debt securities with a remaining maturity of greater than 60 days are valued in accordance with the evaluated bid price supplied by the pricing service. The evaluated bid price supplied by the pricing service is an evaluation that reflects such factors as security prices, yields, maturities and ratings. Foreign securities and currencies ar e converted to U.S. dollars using the applicable exchange rate in effect as of the daily close of the New York Stock Exchange ("NYSE"). When market quotations are not readily available or deemed unreliable, or events or circumstances that may affect the value of portfolio securities held by the Portfolio are identified between the closing of their principal markets and the time the net asset value ("NAV") is determined, securities may be valued at fair value as determined in good faith under procedures established by and under the supervision of the Portfolio's Trustees. The Portfolio may use a systematic fair valuation model provided by an independent third party to value international equity securities in order to adjust for stale pricing, which may occur between the close of certain foreign exchanges and the NYSE.
Investment Transactions and Investment Income
Investment transactions are accounted for as of the date purchased or sold (trade date). Dividend income is recorded on the ex-dividend date. Certain dividends from foreign securities will be recorded as soon as the Trust is informed of the dividend if such information is obtained subsequent to the ex-dividend date and may be subject to withholding taxes in these jurisdictions. Interest income is recorded on the accrual basis and includes amortization of premiums and accretion of discounts. Gains and losses are determined on the identified cost basis, which is the same basis used for federal income tax purposes.
Expenses
The Portfolio bears expenses incurred specifically on its behalf as well as a portion of general expenses, which may be allocated pro rata to the Portfolio.
Interfund Lending
Pursuant to an exemptive order received from the SEC, the Portfolio may be party to an interfund lending agreement between the Portfolio and other Janus Capital sponsored mutual funds, which permits it to borrow or lend cash at a rate beneficial to both the borrowing and lending funds. Outstanding borrowings from all sources totaling 10% or more of the borrowing Portfolio's total assets must be collateralized at 102% of the outstanding principal value of the loan; loans of less than 10% may be unsecured. During the fiscal year ended December 31, 2006 there were no outstanding interfund borrowing or lending arrangements for the Portfolio.
Forward Currency Transactions
The Portfolio may enter into forward currency contracts in order to reduce its exposure to changes in foreign currency exchange rates on its foreign portfolio holdings and to lock in the U.S. dollar cost of firm purchase and sale commitments for securities denominated in or exposed to foreign currencies. A forward currency exchange contract is a commitment to purchase or sell a foreign currency at a future date at a negotiated rate. The gain or loss arising from the difference
Janus Aspen Series December 31, 2006 13
Notes to Financial Statements (continued)
between the U.S. dollar cost of the original contract and the value of the foreign currency in U.S. dollars upon closing a contract is included in "Net realized gain/(loss) from foreign currency transactions" on the Statement of Operations (if applicable).
Forward currency contracts held by the Portfolio are fully collateralized by other securities, which are denoted in the accompanying Schedule of Investments (if applicable). The collateral is evaluated daily to ensure its market value equals or exceeds the current market value of the corresponding forward currency contracts. As of December 31, 2006, the Portfolio was not invested in forward currency contracts.
Futures Contracts
The Portfolio may enter into futures contracts. The Portfolio intends to use such derivative instruments primarily to hedge or protect from adverse movements in securities prices, currency rates or interest rates. The use of futures contracts may involve risks such as the possibility of illiquid markets or imperfect correlation between the value of the contracts and the underlying securities, or that the counterparty will fail to perform its obligations.
Futures contracts are marked-to-market daily, and the daily variation margin is recorded as a receivable or payable on the Statement of Assets and Liabilities (if applicable). When a contract is closed, a realized gain or loss is recorded on the Statement of Operations equal to the difference between the opening and closing value of the contract. Generally, futures contracts are marked-to-market (i.e., treated as realized and subject to distribution) for federal income tax purposes at fiscal year end. Securities designated as collateral for market value on futures contracts are noted in the Schedule of Investments. Such collateral is in the possession of the Portfolio's custodian. As of December 31, 2006, the Portfolio was not invested in futures contracts.
Short Sales
The Portfolio may engage in "short sales against the box." Short sales against the box involve selling either a security that the Portfolio owns, or a security equivalent in kind and amount to the security sold short that the Portfolio has the right to obtain, for delivery at a specified date in the future. The Portfolio may enter into a short sale against the box to hedge against anticipated declines in the market price of portfolio securities. If the value of the securities sold short increases prior to the scheduled delivery date, the Portfolio loses the opportunity to participate in the gain.
The Portfolio may also engage in "naked" short sales. Naked short sales involve the Portfolio selling a security it does not own to a purchaser at a specified price. To complete the transaction, the Portfolio must borrow the security to deliver it to the purchaser and buy that same security in the market to return it to the lender. Although the potential for gain is limited to the difference between the price at which the Portfolio sold the security short and the cost of borrowing the security, its potential for loss could be unlimited because there is no limit to the replacement cost of the borrowed security. There is no assurance that the Portfolio will be able to close out a short position at any particular time or at an acceptable price. A gain or a loss will be recognized upon termination of a short sale. There is no limit on the size of any loss that the Portfolio may recognize upon termination of a short sale. Short sales held by the Portfolio are fully collateralized by other securities, which are denoted in the accompanying Schedule of Investments (if applicable). As of December 31, 2006, the Portfolio was not invested in short sales.
Foreign Currency Translations
The Portfolio does not isolate that portion of the results of operations resulting from changes in foreign exchange rates on investments from the fluctuations arising from changes in market prices of securities held at the date of the financial statements. Net unrealized appreciation or depreciation on investments and foreign currency translation arise from changes in the value of assets and liabilities, including investments in securities held at the date of the financial statements, resulting from changes in the exchange rates and changes in market prices of securities held.
Currency gains and losses are also calculated on payables and receivables that are denominated in foreign currencies. The payables and receivables are generally related to security transactions and income.
Foreign currency-denominated assets and forward currency contracts may involve more risks than domestic transactions, including currency risk, political and economic risk, regulatory risk and market risk. Risks may arise from the potential inability of a counterparty to meet the terms of a contract and from unanticipated movements in the value of foreign currencies relative to the U.S. dollar.
When-issued Securities
The Portfolio may purchase or sell securities on a when-issued or forward commitment basis. The price of the underlying securities and date when the securities will be delivered and paid for are fixed at the time the transaction is negotiated. Losses may arise due to changes in the market value of the securities or from the inability of counterparties to meet the terms of the contract. In connection with such purchases, the Portfolio may hold liquid assets as collateral with the Portfolio's custodian sufficient to cover the purchase price. As of December 31, 2006, the Portfolio was not invested in when-issued securities.
Equity-Linked Structured Notes
The Portfolio may invest in equity-linked structured notes. Equity-linked structured notes are derivative securities which are specially designed to combine the characteristics of one or more underlying securities and their equity derivatives in a
14 Janus Aspen Series December 31, 2006
single note form. The return and/or yield or income component may be based on the performance of the underlying equity securities, an equity index, and/or option positions. Equity-linked structured notes are typically offered in limited transactions by financial institutions in either registered or nonregistered form. An investment in equity-linked structured notes creates exposure to the credit risk of the issuing financial institution, as well as to the market risk of the underlying securities. There is no guaranteed return of principal with these securities and the appreciation potential of these securities may be limited by a maximum payment or call right. In certain cases, equity-linked structured notes may be more volatile and less liquid than less complex securities or other types of fixed-income securities. Such securities may exhibit price behavior that does not correlate with other fixed-income securities. As of December 31, 2006, the Portfolio was not invested in equity-linked structured notes.
Initial Public Offerings
The Portfolio may invest in initial public offerings ("IPOs"). IPOs and other investment techniques may have a magnified performance impact on a fund with a small asset base. The Portfolio may not experience similar performance as its assets grow.
Additional Investment Risk
The Portfolio may be invested in lower-rated debt securities that have a higher risk of default or loss of value since these securities may be sensitive to economic changes, political changes or adverse developments specific to the issuer.
Restricted Security Transactions
Restricted securities held by the Portfolio may not be sold except in exempt transactions or in a public offering registered under the Securities Act of 1933. The risk of investing in such securities is generally greater than the risk of investing in the securities of widely held, publicly traded companies. Lack of a secondary market and resale restrictions may result in the inability of the Portfolio to sell a security at a fair price and may substantially delay the sale of the security. In addition, these securities may exhibit greater price volatility than securities for which secondary markets exist.
Dividend Distributions
The Portfolio generally makes semiannual distributions of substantially all of its investment income and an annual distribution of its net realized capital gains (if any). The majority of dividends and net realized capital gains distributions from the Portfolio may be automatically reinvested into additional shares of the Portfolio, based upon the discretion of the shareholder.
Estimates
The preparation of financial statements in conformity with accounting principles generally accepted in the United States of America requires management to make estimates and assumptions that affect the reported amount of assets and liabilities and disclosure of contingent assets and liabilities at the date of the financial statements and the reported amounts of income and expenses during the reporting period. Actual results could differ from those estimates.
Federal Income Taxes
No provision for income taxes is included in the accompanying financial statements, as the Portfolio intends to distribute to shareholders all taxable investment income and realized gains and otherwise comply with Subchapter M of the Internal Revenue Code applicable to regulated investment companies.
New Accounting Pronouncements
In July 2006, the Financial Accounting Standards Board ("FASB") issued interpretation No. 48, "Accounting for Uncertainty in Income Taxes – an Interpretation of FASB Statement No. 109" (the "Interpretation"). The Interpretation establishes for all entities, including pass-through entities such as the Portfolio, a minimum threshold for financial statement recognition of the benefit of positions taken in filing tax returns (including whether an entity is taxable in a particular jurisdiction), and requires certain expanded tax disclosures. A calendar year open-end or closed-end fund would implement the Interpretation no later than June 29, 2007 (the last business day of the semi-annual reporting period) and will also apply to all open tax years as of the date of effectiveness. Management has recently begun to evaluate the application of the Interpretation to the Portfolio, and is not in a position at this time to estimate the significance of its impact, if any, on the Portfolio's financial statements.
In September 2006, the FASB issued Statement of Financial Accounting Standards No. 157, "Fair Value Measurements" ("SFAS No. 157"), which defines fair value, establishes a framework for measuring fair value in generally accepted accounting principles, and expands disclosures about fair value measurements. SFAS No. 157 does not require new fair value measurements, but is applied to the extent that other accounting pronouncements require or permit fair value measurements. SFAS No. 157 emphasizes that fair value is a market-based measurement that should be determined based on the assumptions that market participants would use in pricing an asset or liability. Companies will be required to disclose the extent to which fair value is used to measure assets and liabilities, the inputs used to develop the measurements, and the effect for fiscal years beginning after November 15, 2007. Management is currently evaluating the potential impact the adopt ion of SFAS No. 157 will have on the Portfolio's financial condition and results of operations.
Janus Aspen Series December 31, 2006 15
Notes to Financial Statements (continued)
2. INVESTMENT ADVISORY AGREEMENTS AND OTHER TRANSACTIONS WITH AFFILIATES
The Portfolio pays a monthly advisory fee to Janus Capital based upon average daily net assets and calculated at the annual rate of 0.74%.
Janus Capital has agreed until at least May 1, 2008 to reimburse the Portfolio by the amount, if any, that the normal operating expenses in any fiscal year, including the investment advisory fee but excluding the distribution and shareholder servicing (12b-1) fees applicable to Service Shares, the administrative services fees applicable to Service Shares, brokerage commissions, interest, taxes and extraordinary expenses, exceed an annual rate of 1.34% of the average daily net assets of the Portfolio. The Portfolio is not required to repay any such waived fees in future years to Janus Capital.
Janus Services LLC ("Janus Services"), a wholly-owned subsidiary of Janus Capital, is the Portfolio's transfer agent. Janus Services receives from the Portfolio a fee at an annual rate of up to 10% of the average daily net assets of Service Shares of the Portfolio, to compensate Janus Services for providing, or arranging for the provision of record keeping, subaccounting and administrative services.
Janus Services receives certain out-of-pocket expenses for transfer agent services.
Certain officers of the Portfolio may also be officers and/or directors of Janus Capital. Such officers receive no compensation from the Portfolio, except for the Portfolio's Chief Compliance Officer. Effective January 1, 2006, the Portfolio began reimbursing the adviser for a portion of the compensation paid to the Chief Compliance Officer of the Trust. Total compensation of $29 was paid by the Portfolio during the fiscal year ended December 31, 2006. The Portfolio's portion is reported as part of "Other Expenses" on the Statement of Operations.
The Board of Trustees has adopted a deferred compensation plan (the "Deferred Plan") for independent Trustees to elect to defer receipt of all or a portion of the annual compensation they are entitled to receive from the Portfolio. All deferred fees are credited to an account established in the name of the Trustees. The amounts credited to the account then increase or decrease, as the case may be, in accordance with the performance of one or more of the Janus funds that are selected by the Trustees. The account balance continues to fluctuate in accordance with the performance of the selected fund or funds until final payment of all amounts credited to the account. Trustees are allowed to change their designation of mutual funds from time to time. Amounts will be deferred until distributed in accordance to the Deferred Plan. No deferred fees were paid to any Trustee under the Deferred Plan during the fiscal year ended December 31, 2006.
For the fiscal year ended December 31, 2006, Janus Capital assumed $21,288 of legal, consulting and Trustee costs and fees incurred by the funds in Janus Investment Fund, Janus Aspen Series and Janus Adviser Series (the "Funds") in connection with the regulatory and civil litigation matters discussed in Note 7. These non-recurring costs were allocated to all Funds based upon the Funds' respective net assets as of July 31, 2004. Additionally, all future non-recurring costs will be allocated based upon the Funds' respective net assets on July 31, 2004. These non-recurring costs and costs assumed by Janus Capital are shown on the Statement of Operations.
Janus Distributors LLC, a wholly-owned subsidiary of Janus Capital, is a distributor of the Portfolio. Service Shares have adopted a Distribution and Shareholder Servicing Plan (the "Plan") pursuant to Rule 12b-1 under The 1940 Act. The Plan authorizes payments by the Portfolio in connection with the distribution of Service Shares at an annual rate of up to 0.25% of Service Shares' average daily net assets.
The Portfolio's expenses may be reduced by expense offsets from an unaffiliated custodian and/or transfer agent. Such credits or offsets are included in Expense and Fee Offset on the Statement of Operations. The transfer agent fee offsets received during the period reduce Transfer Agent Fees and Expenses. Custodian offsets received reduce Custodian Fees. The Portfolio could have employed the assets used by the custodian and/or transfer agent to produce income if it had not entered into an expense offset arrangement.
The Portfolio may invest in money market funds, including funds managed by Janus Capital. During the fiscal year ended December 31, 2006, the Portfolio recorded distributions from affiliated investment companies as affiliated dividend income, and had the following affiliated purchases and sales:
| Purchases Shares/Cost | Sales Shares/Cost | Dividend Income | Value at 12/31/06 | ||||||||||||||||
| Janus Aspen Small Company Value Portfolio | |||||||||||||||||||
| Janus Government Money Market Fund | $ | 260,654 | $ | 260,654 | $ | 374 | $ | – | |||||||||||
| Janus Institutional Cash Reserves Fund | 2,232,823 | 2,161,348 | 4,460 | 71,475 | |||||||||||||||
| Janus Money Market Fund | 2,137,774 | 2,137,774 | 8,783 | – | |||||||||||||||
| $ | 4,631,251 | $ | 4,559,776 | $ | 13,617 | $ | 71,475 | ||||||||||||
16 Janus Aspen Series December 31, 2006
3. FEDERAL INCOME TAX
The tax components of capital shown in the table below represent: (1) distribution requirements the Portfolio must satisfy under the income tax regulations; (2) losses or deductions the Portfolio may be able to offset against income and gains realized in future years; and (3) unrealized appreciation or depreciation of investments for federal income tax purposes.
Other book to tax differences in the current year primarily consist of foreign currency contract adjustments. The Portfolio has elected to treat gains and losses on forward foreign currency contracts as capital gains and losses. Other foreign currency gains and losses on debt instruments are treated as ordinary income for federal income tax purposes pursuant to Section 988 of the Internal Revenue Code.
Accumulated capital losses noted below represent net capital loss carryovers, as of December 31, 2006, that may be available to offset future realized capital gains and thereby reduce future taxable gain distributions.
| Portfolio | Undistributed Ordinary Income | Undistributed Long–Term Gains | Accumulated Capital Losses | Post October Deferral | Other Book to Tax Differences | Net Tax Appreciation/ (Depreciation) | |||||||||||||||||||||
| Janus Aspen Small Company Value Portfolio | $ | 189,433 | $ | 218,079 | $ | – | $ | – | $ | – | $ | 2,719,111 | |||||||||||||||
During the year ended December 31, 2006, the following capital loss carryover was utilized by the Portfolio as indicated in the table below.
| Portfolio | Capital Loss Carryover Utilized | ||||||
| Janus Aspen Small Company Value Portfolio | $ | 71,285 | |||||
The aggregate cost of investments and the composition of unrealized appreciation and depreciation of investment securities for federal income tax purposes as of December 31, 2006 are noted below.
Unrealized appreciation and unrealized depreciation in the table below exclude appreciation/depreciation on foreign currency translations. The primary difference between book and tax appreciation or depreciation of investments is wash sale loss deferrals.
| Portfolio | Federal Tax Cost | Unrealized Appreciation | Unrealized (Depreciation) | ||||||||||||
| Janus Aspen Small Company Value Portfolio | $ | 14,158,840 | $ | 2,989,779 | $ | (270,668 | ) | ||||||||
Income and capital gains distributions are determined in accordance with income tax regulations that may differ from accounting principles generally accepted in the United States of America. These differences are due to differing treatments for items such as net short-term gains, deferral of wash sale losses, foreign currency transactions, net investment losses and capital loss carryovers. Certain permanent differences such as tax returns of capital and net investment losses noted below have been reclassified to paid-in capital.
| For the fiscal year ended December 31, 2006 | Distributions | ||||||||||||||||||
| Portfolio | From Ordinary Income | From Long-Term Capital Gains | Tax Return of Capital | Net Investment Loss | |||||||||||||||
| Janus Aspen Small Company Value Portfolio | $ | – | $ | 124,828 | $ | – | $ | – | |||||||||||
| For the fiscal year ended December 31, 2005 | Distributions | ||||||||||||||||||
| Portfolio | From Ordinary Income | From Long-Term Capital Gains | Tax Return of Capital | Net Investment Loss | |||||||||||||||
| Janus Aspen Small Company Value Portfolio | $ | – | $ | 937 | $ | – | $ | (11,464 | ) | ||||||||||
4. EXPENSE RATIOS
The expense ratios listed in the Financial Highlights reflect expenses prior to any expense offsets (gross expense ratio) and after expense offsets (net expense ratio). Both expense ratios reflect expenses after waivers (reimbursement). Listed below are the gross expense ratios for the Portfolio that would be in effect, absent the waiver of certain fees and offsets.
Janus Aspen Series December 31, 2006 17
Notes to Financial Statements (continued)
| For each fiscal year or period ended December 31 | Services Shares | ||||||||||||||||||||||
| Portfolio | 2006(1) | 2005(1) | 2004(1) | 2003 | 2002(2) | ||||||||||||||||||
| Janus Aspen Small Company Value Portfolio | 2.19 | % | 2.79 | % | 4.49 | % | 12.61 | % | N/A | ||||||||||||||
(1) The effect of non-recurring costs assumed by Janus Capital (Note 2) is included in the ratio of operating expenses to average net assets without waivers and/or expense reimbursements and was less than 0.01%.
(2) Portfolio commenced operations on December 31, 2002 (inception date).
5. CAPITAL SHARE TRANSACTIONS
| For the fiscal year ended December 31 | Janus Aspen Small Company Value Portfolio | ||||||||||
| (all numbers are in thousands) | 2006 | 2005 | |||||||||
| Transactions in Portfolio Shares - Service Shares: | |||||||||||
| Shares sold | 456 | 438 | |||||||||
| Reinvested dividends and distributions | 6 | – | |||||||||
| Shares repurchased | (163 | ) | (63 | ) | |||||||
| Net Increase/(Decrease) in Portfolio Shares | 299 | 375 | |||||||||
| Shares Outstanding, Beginning of Period | 548 | 173 | |||||||||
| Shares Outstanding, End of Period | 847 | 548 | |||||||||
6. PURCHASES AND SALES OF INVESTMENT SECURITIES
For the fiscal year ended December 31, 2006, the aggregate cost of purchases and proceeds from sales of investment securities (excluding short-term securities) were as follows:
| Portfolio | Purchases of Securities | Proceeds from Sales of Securities | Purchases of Long- Term U.S. Government Obligations | Proceeds from Sales of Long-Term U.S. Government Obligations | |||||||||||||||
| Janus Aspen Small Company Value Portfolio | $ | 13,243,190 | $ | 7,508,717 | $ | – | $ | – | |||||||||||
7. PENDING LEGAL MATTERS
In the fall of 2003, the Securities and Exchange Commission ("SEC"), the Office of the New York State Attorney General ("NYAG"), the Colorado Attorney General ("COAG"), and the Colorado Division of Securities ("CDS") announced that they were investigating alleged frequent trading practices in the mutual fund industry. On August 18, 2004, Janus Capital announced that it had reached final settlements with the SEC, the NYAG, the COAG, and the CDS related to such regulators' investigations into Janus Capital's frequent trading arrangements.
A number of civil lawsuits were brought against Janus Capital and certain of its affiliates, the Janus funds, and related entities and individuals based on allegations similar to those announced by the above regulators and were filed in several state and federal jurisdictions. Such lawsuits alleged a variety of theories for recovery including, but not limited to, the federal securities laws, other federal statutes (including ERISA), and various common law doctrines. The Judicial Panel on Multidistrict Litigation transferred these actions to the U.S. District Court for the District of Maryland (the "Court") for coordinated proceedings. On September 29, 2004, five consolidated amended complaints were filed with the Court that generally include: (i) claims by a putative class of investors in certain Janus funds asserting claims on behalf of the investor class (Marini, et al. v. Janus Investment Fund, et al., U.S. District Court, District of Maryland, Case No. 04-CV-00497); (ii) derivative claims by investors in certain Janus funds ostensibly on behalf of such funds (Steinberg et al. v. Janus Capital Management, LLC et al., U.S. District Court, District of Maryland, Case No. 04-CV-00518); (iii) claims on behalf of participants in the Janus 401(k) plan (Wangberger v. Janus Capital Group Inc., 401(k) Advisory Committee, et al., U.S. District Court, District of Maryland, Case No. JFM-05-2711); (iv) claims brought on behalf of shareholders of Janus Capital Group Inc. ("JCGI") on a derivative basis against the Board of Directors of JCGI (Chasen v. Whiston, et al., U.S. District Court, District of Maryland, Case No. 04-MD-00855); and (v) claims by a putative class of shareho lders of JCGI asserting claims on behalf of the shareholders (Wiggins, et al. v. Janus Capital Group, Inc., et al., U.S. District Court, District of Maryland, Case No. 04-CV-00818). In addition, the following were also named as defendants in one or more of the actions: Janus Investment Fund ("JIF"), Janus Aspen Series ("JAS"), Janus Adviser Series ("JAD"), Janus Distributors LLC, Enhanced Investment Technologies, LLC ("INTECH"), Bay Isle Financial LLC ("Bay Isle"), Perkins, Wolf, McDonnell and
18 Janus Aspen Series December 31, 2006
Company, LLC ("Perkins"), the Advisory Committee of the Janus 401(k) plan, and the current or former directors of JCGI.
On August 25, 2005, the Court entered orders dismissing most of the claims asserted against Janus Capital and its affiliates by fund investors (actions (i) and (ii) described above), except certain claims under Section 10(b) of the Securities Exchange Act of 1934 and under Section 36(b) of the Investment Company Act of 1940, as amended (the "1940 Act"). On August 15, 2006, the complaint in the 401(k) plan class action (action (iii) described above) was dismissed by the district court with prejudice; the plaintiff has appealed that dismissal decision to the United States Court of Appeals for the Fourth Circuit. The Court also dismissed the action against JCGI's Board of Directors without leave to amend (action (iv) described above). Finally, a Motion to Dismiss the action brought by JCGI shareholders (action (v) described above) is fully briefed and pending before the Court.
In addition to the lawsuits described above, the Auditor of the State of West Virginia ("Auditor"), in his capacity as securities commissioner, has initiated administrative proceedings against many of the defendants in the market timing cases (including JCGI and Janus Capital) and, as a part of its relief, is seeking disgorgement and other monetary relief based on similar market timing allegations (In the Matter of Janus Capital Group Inc. et al., Before the Securities Commissioner, State of West Virginia, Summary Order No. 05-1320). The respondents in these proceedings collectively sought a Writ of Prohibition in state court, which was d enied. Their subsequent Petition for Appeal was also denied. Consequently, in September 2006, JCGI and Janus Capital filed their answer to the Auditor's summary order instituting proceedings and requested a hearing. JCGI and Janus Capital, as well as other similarly situated defendants, continue to challenge the statutory authority of the Auditor to bring such an action. No further proceedings are currently scheduled.
In addition to the "market timing" actions described above, Janus Capital is a defendant in a consolidated lawsuit in the U.S. District Court for the District of Colorado challenging the investment advisory fees charged by Janus Capital to certain Janus funds (Walter Sins, et al. v. Janus Capital Management LLC, U.S. District Court, District of Colorado, Case No. 04-CV-01647-WDM-MEH; Michael Fleisher, et al. v. Janus Capital Management, LLC, 04-CV-02395-MSK-CBS). The action was filed in 2004 by fund investors asserting breach of fiduciary duty under Section 36(b) of the 1940 Act. The plaintiffs seek declaratory and in junctive relief and an unspecified amount of damages. The trial is scheduled to commence on May 21, 2007.
In 2001, Janus Capital's predecessor was also named as a defendant in a class action suit in the U.S. District Court for the Southern District of New York, alleging that certain underwriting firms and institutional investors violated antitrust laws in connection with initial public offerings (Pfeiffer v. Credit Suisse First Boston aka In re Initial Public Offering Antitrust Litigation, U.S. District Court, Southern District of New York, Case No. 01-CV-2014). The U.S. District Court dismissed the plaintiff's antitrust claims in November 2003; however, the U.S. Court of Appeals vacated that decision and remanded it for further proceedings. In March 2006, the defendants, including Janus Capital, filed a Petition for a Writ of Certiorari with the U.S. Supreme Court to review the decision of the U. S. Court of Appeals. In June 2006, the U.S. Supreme Court invited the U.S. Solicitor General to file a brief expressing the view of the United States, and in November 2006, the Solicitor General filed a brief expressing its view on the matter. The U.S. Supreme Court has granted the Petition for a Writ of Certiorari and the parties are in the process of briefing the matter for the U.S. Supreme Court.
Additional lawsuits may be filed against certain of the Janus funds, Janus Capital, and related parties in the future. Janus Capital does not currently believe that these pending actions will materially affect its ability to continue providing services it has agreed to provide to the Janus funds.
Janus Aspen Series December 31, 2006 19
Report of Independent Registered Public Accounting Firm
To the Trustees and Shareholders
of Janus Aspen Small Company Value Portfolio
In our opinion, the accompanying statement of assets and liabilities, including the schedule of investments, and the related statements of operations and of changes in net assets and the financial highlights present fairly, in all material respects, the financial position of Janus Aspen Small Company Value Portfolio (one of the portfolios constituting Janus Aspen Series, hereafter referred to as the "Portfolio") at December 31, 2006, the results of its operations for the year then ended, the changes in its net assets for each of the two years in the period then ended and the financial highlights for each of the periods indicated, in conformity with accounting principles generally accepted in the United States of America. These financial statements and financial highlights (hereafter referred to as "financial statements") are the responsibility of the Portfolio's management; our responsibility is to express an opinion on these financial state ments based on our audits. We conducted our audits of these financial statements in accordance with the standards of the Public Company Accounting Oversight Board (United States). Those standards require that we plan and perform the audit to obtain reasonable assurance about whether the financial statements are free of material misstatement. An audit includes examining, on a test basis, evidence supporting the amounts and disclosures in the financial statements, assessing the accounting principles used and significant estimates made by management, and evaluating the overall financial statement presentation. We believe that our audits, which included confirmation of securities at December 31, 2006 by correspondence with the custodian, transfer agent and brokers, and the application of alternative auditing procedures where securities purchased had not been received, provide a reasonable basis for our opinion.

PricewaterhouseCoopers LLP
Denver, Colorado
February 12, 2007
20 Janus Aspen Series December 31, 2006
Additional Information (unaudited)
PROXY VOTING POLICIES AND VOTING RECORD
A description of the policies and procedures that the Portfolio uses to determine how to vote proxies relating to its portfolio securities is available: (i) without charge, upon request, by calling 1-800-525-0020 (toll free); (ii) on the Portfolio's website at www.janus.com/proxyvoting; and (iii) on the SEC's website at http://www.sec.gov. Additionally, information regarding the Portfolio's proxy voting record for the most recent twelve-month period ended June 30 is also available, free of charge, through www.janus.com/proxyvoting and from the SEC's website at http://www.sec.gov.
QUARTERLY PORTFOLIO HOLDINGS
The Portfolio files its complete portfolio holdings (schedule of investments) with the SEC for the first and third quarters of each fiscal year on Form N-Q within 60 days of the end of such fiscal quarter. The Portfolio's Form N-Q: (i) is available on the SEC's website at http://www.sec.gov; (ii) may be reviewed and copied at the SEC's Public Reference Room in Washington, D.C. (information on the Public Reference Room may be obtained by calling 1-800-SEC-0330); and (iii) is available without charge, upon request, by calling Janus at 1-800-525-0020 (toll free).
APPROVAL OF ADVISORY AGREEMENTS DURING THE PERIOD
The Trustees of Janus Aspen Series, more than eighty-five percent of whom have never been affiliated with the Adviser ("Independent Trustees"), oversee the management of each of the Portfolios and, as required by law, determine annually whether to continue the investment advisory agreement for each Portfolio and the subadvisory agreements for the three Portfolios that utilize subadvisers.
In connection with their most recent consideration of those agreements for each of the Portfolios, the Trustees received and reviewed a substantial amount of information provided by Janus Capital (the "Adviser") and the respective subadvisers in response to requests of the Independent Trustees and their independent legal counsel. They also received and reviewed a considerable amount of information and analysis provided to the Trustees by their independent fee consultant. Throughout their consideration of the agreements the Independent Trustees were advised by their independent legal counsel. The Independent Trustees met on two separate occasions with management to consider the agreements, and at each of those meetings they also met separately in executive session with their independent legal counsel.
At a meeting held on December 20, 2006, based on their evaluation of the information provided by the Adviser, the subadvisers and the independent fee consultant and other information, the Trustees determined that the overall arrangements between each Portfolio and the Adviser were fair and reasonable in light of the nature, extent and quality of the services provided by the Adviser, its affiliates and the subadvisers, the fees charged for those services, and other matters that the Trustees considered relevant in the exercise of their business judgment. At that meeting all of the Trustees unanimously approved the continuation of the investment advisory agreement for each Portfolio, and the subadvisory agreement for each subadvised Portfolio, for the period from February 1, 2007 through February 1, 2008, subject to earlier termination as provided in each agreement.
In considering the continuation of those agreements, the Trustees reviewed and analyzed various factors that they determined were relevant, including the factors described below, none of which by itself was considered dispositive. However, the material factors and conclusions that formed basis for the Trustees' determination to approve the continuation of the agreements are discussed separately below.
Nature, Extent and Quality of Services
The Trustees reviewed the nature, extent and quality of the services of Janus Capital and the subadvisers to the Funds, taking into account the investment objective and strategy of each Portfolio and the knowledge the Trustees gained from their regular meetings with management on at least a quarterly basis and their ongoing review of information related to the Funds. In addition, the Trustees reviewed the resources and key personnel of Janus Capital and each subadviser, especially those who provide investment management services to the Portfolios. The Trustees also considered other services provided to the Portfolios by Janus Capital or the subadvisers, such as managing the execution of portfolio transactions and the selection of broker-dealers for those transactions, serving as the Portfolios' administrator, monitoring adherence to the Portfolios' investment restrictions, producing shareholder reports, providing support services for the Tru stees and Trustee committees, communicating with shareholders and overseeing the activities of other service providers, including monitoring compliance with various policies and procedures of the Portfolios and with applicable securities laws and regulations.
The Trustees concluded that: the nature, extent and quality of the services provided by Janus Capital or the subadviser to each Portfolio were appropriate and consistent with the terms of the respective advisory and subadvisory agreements; that, taking into account steps taken to address a small portion of the Portfolios whose performance lagged that of their peers for certain periods, the quality of those services had been consistent with or superior to quality norms in the industry; and that the Portfolios were likely to benefit from the continued provision of those services. They also concluded that each of Janus Capital and each subadviser had sufficient
Janus Aspen Series December 31, 2006 21
personnel, with the appropriate education and experience, to serve the Portfolios effectively and had demonstrated its continuing ability to attract and retain well-qualified personnel.
Performance of the Funds
The Trustees considered the performance results of each Portfolio over various time periods. They reviewed information comparing each Portfolio's performance with the performance of comparable funds and peer groups identified by Lipper Inc., an independent provider of investment company data, and with the Portfolio's benchmark. They concluded that the performance of most Portfolios was good to very good. Although the performance of some Portfolios lagged that of their peers for certain periods, the Trustees also concluded that Janus Capital had taken appropriate steps to address those instances of under-performance and that the more recent performance of most of those Portfolios had been improving.
Costs of Services Provided
The Trustees examined information on the fees and expenses of each Portfolio in comparison to similar information for other comparable funds as provided by Lipper. They also reviewed an analysis of that information provided by their independent fee consultant and noted that the rate of management (investment advisory and administrative) fees for most of the Portfolios, after contractual expense limitations, was below the mean management fee rate of the respective peer group of funds selected by Lipper.
The Trustees considered the methodology used by Janus Capital and each subadviser in determining compensation payable to portfolio managers, the competitive environment for investment management talent and the competitive market for mutual funds in different distribution channels. They concluded that the compensation methodology provided a good alignment of the interests of the portfolio managers with the interests of Portfolio shareholders.
The Trustees also reviewed management fees charged by Janus Capital to its separate account clients and to its subadvised funds (for which Janus Capital provides only portfolio management services). Although in most instances subadvisory and separate account fee rates for various investment strategies were lower than management fees for Portfolios having a similar strategy, the Trustees noted that Janus Capital performs significant additional services for the Portfolios that it does not provide to those other clients, including administrative services, oversight of the Portfolios' other service providers, trustee support, regulatory compliance and numerous other services, and that, in serving the Portfolios, Janus Capital assumes many legal risks that it does not assume in servicing its other clients. Moreover, they noted that the spread between the average fees charged to the Portfolios and the fees that Janus Capital charged to its separate account clients was significantly smaller than the average spread for such fees of other advisers, based on publicly available data and research conducted by their independent fee consultant.
In considering the fees charged by Janus Capital, the Trustees had previously negotiated with Janus Capital a temporary contingent waiver of a portion the investment advisory fee paid by Janus Aspen Worldwide Growth Portfolio to Janus Capital to provide for a possible reduction in the rate of advisory fee payable by the Portfolio for the period July 1, 2006 through January 31, 2007 if the investment performance of the Fund should lag that of its benchmark performance over the applicable performance measurement period. Commencing in February 2007, the previously approved performance-based fee schedule will become operative.
The Trustees reviewed information on the profitability of Janus Capital and its affiliates of their relationships with each Portfolio, as well as an explanation of the methodology utilized in allocating various expenses among the Portfolios and other clients. The Trustees also reviewed the financial statements of Janus Capital's parent company and its corporate structure. In their review, the Trustees considered whether Janus Capital and each subadviser receive adequate incentives to manage the Portfolios effectively. The Trustees recognized that profitability comparisons among fund managers are difficult because very little comparative information is publicly available and profitability of any manager is affected by numerous factors, including the organizational structure of the particular manager, the types of funds and other accounts it manages, possible other lines of business, the methodology for allocating expenses and the manager's ca pital structure and cost of capital. However, based on the information available and taking those factors into account, the Trustees concluded that Janus Capital's profitability with respect to each Portfolio in relation to the services rendered was not unreasonable.
The Trustees concluded that the management fees and other compensation payable by each Fund to Janus Capital and its affiliates, as well as the fees paid by Janus Capital to the subadvisers of subadvised Portfolios, were reasonable in relation to the nature and quality of the services provided, taking into account the fees charged by other advisers for managing comparable mutual funds with similar strategies and the fees Janus Capital and the subadviser charges to other clients. The Trustees also concluded that the overall expense ratio of each Portfolio was reasonable, taking into account the size of the Portfolio, the quality of services provided by Janus Capital and any subadviser, the investment performance of the
22 Janus Aspen Series December 31, 2006
Additional Information (unaudited) (continued)
Portfolio and any expense limitations agreed to by Janus Capital.
Economies of Scale
The Trustees considered information about the potential for Janus Capital to realize economies of scale as the assets of the Portfolios increase. They noted that, although most Portfolios pay advisory fees at a fixed rate as a percentage of net assets, without any breakpoints, the management fee paid by each Portfolio, after any contractual expense limitations, was below the mean management fee rate of the Portfolio's peer group selected by Lipper; and, for those Portfolios whose expenses are being reduced by the contractual expense limitations of Janus Capital, Janus Capital is subsidizing the Portfolios because they have not reached adequate scale. Moreover, as the assets of many of the Portfolios have declined in the past few years, the Portfolios have benefited from having advisory fee rates that have remained constant rather than increasing as assets decline. In addition, performance fee structures have been implemented for several Port folios that will cause the effective rate of advisory fees payable by such a Portfolio to vary depending on the investment performance of the Portfolio relative to its benchmark; and a few Portfolios have fee schedules with breakpoints and reduced fee rates above certain asset levels. The Trustees also noted that the Portfolios share directly in economies of scale through lower charges of third-party service providers based on the combined scale of all of the Portfolios. Based on all of the information they reviewed, the Trustees concluded that the current fee structure of each Portfolio was reasonable and that the current rates of fees do reflect a sharing between Janus Capital and the Portfolio of economies of scale at the current asset level of the Portfolio.
Other Benefits to Janus Capital
The Trustees also considered benefits that accrue to Janus Capital and its affiliates from their relationships with the Portfolios. They recognized that two affiliates of Janus Capital separately serve the Portfolios as transfer agent and distributor, respectively, and that the transfer agent receives compensation from the non-money market Portfolios for services provided. The Trustees also considered Janus Capital's use of commissions paid by Portfolios on their portfolio brokerage transactions to obtain proprietary research products and services benefiting the Portfolios and/or other clients of Janus Capital, as well as Janus Capital's agreement not to use any Portfolio's brokerage transactions to obtain third party research products or services. The Trustees concluded that Janus Capital's use of "soft" commission dollars to obtain proprietary research products and services was consistent with regulatory requirements and guidelines and was likely to benefit each Portfolio. The Trustees also concluded that, other than the services provided by Janus Capital and its affiliates pursuant to the agreements and the fees to be paid by each Portfolio therefor, the Portfolios and Janus Capital may potentially benefit from their relationship with each other in other ways. They concluded that Janus Capital benefits from the receipt of proprietary research products and services acquired through commissions paid on portfolio transactions of the Portfolios and that the Portfolios benefit from Janus Capital's receipt of those products and services as well as research products and services acquired through commissions paid by other clients of Janus Capital. They further concluded that success of any Portfolio could attract other business to Janus Capital or other Janus Funds and that the success of Janus Capital could enhance Janus Capital's ability to serve the Portfolios.
After full consideration of the above factors as well as other factors, all of the Trustees, including all of the Independent Trustees, concluded that the proposed continuation of the investment advisory agreement for each applicable Portfolio were in the best interest of the respective Portfolios and their shareholders.
Janus Aspen Series December 31, 2006 23
Explanations of Charts, Tables and
Financial Statements (unaudited)
1. PERFORMANCE OVERVIEWS
The performance overview graph compares the performance of a hypothetical $10,000 investment in the Portfolio with one or more widely used market indices. The hypothetical example does not represent the returns of any particular investment.
When comparing the performance of the Portfolio with an index, keep in mind that market indices do not include brokerage commissions that would be incurred if you purchased the individual securities in the index. They also do not include taxes payable on dividends and interest or operating expenses incurred if you maintained a Portfolio invested in the index.
Average annual total return is calculated by taking the growth or decline in value of an investment over a period of time, including reinvestment of any dividends, distributions and capital gains, then calculating the annual compounded percentage rate that would have produced the same result had the rate of growth been constant throughout the period. Average annual total return does not reflect the deduction of taxes that a shareholder would pay on Portfolio distributions or redemptions of Portfolio shares.
2. SCHEDULE OF INVESTMENTS
Following the performance overview section is the Portfolio's Schedule of Investments. This schedule reports the industry concentrations and types of securities held in the Portfolio on the last day of the reporting period. Securities are usually listed by type (common stock, corporate bonds, U.S. Government obligations, etc.) and by industry classification (banking, communications, insurance, etc.). Holdings are subject to change without notice.
The value of each security is quoted as of the last day of the reporting period. The value of securities denominated in foreign currencies is converted into U.S. dollars. Certain short-term investments maturing within 60 days are valued at amortized cost, which approximates market value.
A summary of investments by country is provided if the Portfolio invested in foreign securities. This summary reports the Portfolio's exposure to different countries by providing the percentage of securities invested in each country. The country of each security represents the country in which the company is incorporated.
2A. FORWARD CURRENCY CONTRACTS
A table listing forward currency contracts follows the Portfolio's Schedule of Investments (if applicable). Forward currency contracts are agreements to deliver or receive a preset amount of currency at a future date. Forward currency contracts are used to hedge against foreign currency risk in the Portfolio's long-term holdings. The table provides the name of the foreign currency, the settlement date of the contract, the amount of the contract, the value of the currency in U.S. dollars and the amount of unrealized gain or loss. The amount of unrealized gain or loss reflects the change in currency exchange rates from the time the contract was opened to the last day of the reporting period.
2B. FUTURES
A table listing futures contracts follows the Portfolio's Schedule of Investments (if applicable). Futures contracts are contracts that obligate the buyer to receive and the seller to deliver an instrument or money at a specified price on a specified date. Futures are used to hedge against adverse movements in securities prices, currency risk or interest rates.
The table provides the name of the contract, number of contracts held, the expiration date, the principal amount, value and the amount of unrealized gain or loss. The amount of unrealized gain or loss reflects the marked-to-market amount for the last day of the reporting period.
3. STATEMENT OF ASSETS AND LIABILITIES
This statement is often referred to as the "balance sheet." It lists the assets and liabilities of the Portfolio on the last day of the reporting period.
The Portfolio's assets are calculated by adding the value of the securities owned, the receivable for securities sold but not yet settled, the receivable for dividends declared but not yet received on stocks owned and the receivable for Portfolio shares sold to investors but not yet settled. The Portfolio's liabilities include payables for securities purchased but not yet settled, Portfolio shares redeemed but not yet paid and expenses owed but not yet paid. Additionally, there may be other assets and liabilities such as unrealized gain or loss on forward currency contracts.
The section entitled "Net Assets Consist of" breaks down the components of the Portfolio's net assets. Because the Portfolio must distribute substantially all earnings, you will notice that a significant portion of net assets is shareholder capital.
The last line of this statement reports the net asset value ("NAV") per share on the last day of the reporting period for each class of the Portfolio. The NAV is calculated by dividing the Portfolio's net assets (assets minus liabilities) by the number of shares outstanding.
4. STATEMENT OF OPERATIONS
This statement details the Portfolio's income, expenses, gains and losses on securities and currency transactions, and appreciation or depreciation of current Portfolio holdings.
The first section in this statement, entitled "Investment Income," reports the dividends earned from stocks and interest earned from interest-bearing securities in the Portfolio.
24 Janus Aspen Series December 31, 2006
The next section reports the expenses and expense offsets incurred by the Portfolio, including the advisory fee paid to the investment adviser and transfer agent fees and expenses, and printing and postage for mailing statements, financial reports and prospectuses. Expense offsets, if any, are also shown.
The last section lists the increase or decrease in the value of securities held in the Portfolio. The Portfolio realizes a gain (or loss) when it sells its position in a particular security. An unrealized gain (or loss) refers to the change in net appreciation or depreciation of the Portfolio during the reporting period. "Net Realized and Unrealized Gain/(Loss) on Investments" is affected both by changes in the market value of Portfolio holdings and by gains (or losses) realized during the reporting period.
5. STATEMENT OF CHANGES IN NET ASSETS
This statement reports the increase or decrease in the Portfolio's net assets during the reporting period. Changes in the Portfolio's net assets are attributable to investment operations, dividends, distributions and capital share transactions. This is important to investors because it shows exactly what caused the Portfolio's net asset size to change during the period.
The first section summarizes the information from the Statement of Operations regarding changes in net assets due to the Portfolio's investment performance. The Portfolio's net assets may also change as a result of dividend and capital gains distributions to investors. If investors receive their dividends in cash, money is taken out of the Portfolio to pay the distribution. If investors reinvest their dividends, the Portfolio's net assets will not be affected. If you compare the Portfolio's "Net Decrease from Dividends and Distributions" to the "Reinvested dividends and distributions," you will notice that dividend distributions had little effect on the Portfolio's net assets. This is because the majority of Janus investors reinvest their distributions.
The reinvestment of dividends is included under "Capital Share Transactions." "Capital Shares" refers to the money investors contribute to the Portfolio through purchases or withdraw via redemptions. The Portfolio's net assets will increase and decrease in value as investors purchase and redeem shares from the Portfolio.
6. FINANCIAL HIGHLIGHTS
This schedule provides a per-share breakdown of the components that affect the Portfolio's NAV for current and past reporting periods of the Portfolio. Not only does this table provide you with total return, it also reports total distributions, asset size, expense ratios and portfolio turnover rate.
The first line in the table reflects the NAV per share at the beginning of the reporting period. The next line reports the net investment income per share, which comprises dividends and interest income earned on securities held by the Portfolio. Following is the total of gains/(losses), realized and unrealized. Dividends and distributions are then subtracted to arrive at the NAV per share at the end of the period. The next line reflects the average annual total return reported the last day of the period.
Also included are the expense ratios, or the percentage of net assets that are used to cover operating expenses during the period. Expense ratios vary for a number of reasons, including the differences in management fees, the average shareholder account size and the extent of foreign investments, which entail greater transaction costs.
The Portfolio's expenses may be reduced through expense reduction arrangements. These arrangements may include the use of balance credits or transfer agent fee offsets. The Statement of Operations reflects total expenses before any such offset, the amount of offset and the net expenses. The expense ratios listed in the Financial Highlights reflect total expenses prior to any expense offsets (gross expense ratio) and after the expense offsets (net expense ratio). Both expense ratios reflect expenses after waivers (reimbursements), if applicable.
The ratio of net investment income/(loss) summarizes the income earned less expenses, divided by the average net assets of the Portfolio during the reporting period. Don't confuse this ratio with the Portfolio's yield. The net investment income ratio is not a true measure of the Portfolio's yield because it doesn't take into account the dividends distributed to the Portfolio's investors.
The next ratio is the portfolio turnover rate, which measures the buying and selling activity in a Portfolio. Portfolio turnover is affected by market conditions, changes in the asset size of a Portfolio, the nature of the Portfolio's investments and the investment style of the portfolio manager. A 100% rate implies that an amount equal to the value of the entire portfolio is turned over in a year; a 50% rate means that an amount equal to the value of half the portfolio is traded in a year; and a 200% rate means that an amount equal to the value of the portfolio is traded every six months.
Janus Aspen Series December 31, 2006 25
Designation Requirements (unaudited)
For federal income tax purposes, the Portfolio designated the following for the year ended December 31, 2006:
Capital Gain Distributions
| Portfolio | |||||||
| Janus Aspen Small Company Value Portfolio | $ | 124,828 | |||||
26 Janus Aspen Series December 31, 2006
Trustees and Officers (unaudited)
The Portfolio's Statement of Additional Information includes additional information about the Trustees and officers and is available, without charge, by calling 1-800-525-0020.
The following are the Trustees and officers of the Trust, together with a brief description of their principal occupations during the last five years (principal occupations for certain Trustees may include periods over five years).
Each Trustee has served in that capacity since he or she was originally elected or appointed. The Trustees do not serve a specified term of office. Each Trustee will hold office until the termination of the Trust or his or her earlier death, resignation, retirement, incapacity or removal. The retirement age for Trustees is 72. The Portfolio's Nominating and Governance Committee will consider nominees for the position of Trustee recommended by shareholders. Shareholders may submit the name of a candidate for consideration by the Committee by submitting their recommendations to the Trust's Secretary. Each Trustee is currently a Trustee of two other registered investment companies advised by Janus Capital: Janus Investment Fund and Janus Adviser Series. As of the date of this report, collectively, these three registered investment companies consist of 69 series or funds.
The Trust's officers are elected annually by the Trustees for a one-year term. Certain officers also serve as officers of Janus Investment Fund and Janus Adviser Series. Certain officers of the Portfolio may also be officers and/or directors of Janus Capital. Portfolio officers receive no compensation from the Portfolio, except for the Portfolio's Chief Compliance Officer, as authorized by the Trustees.
Trustees
| Name, Age and Address | Positions Held with Portfolio | Length of Time Served | Principal Occupations During the Past Five Years | Number of Portfolios in Fund Complex Overseen by Trustee | Other Directorships Held by Trustee | ||||||||||||||||||
| Independent Trustees | |||||||||||||||||||||||
| Dennis B. Mullen 151 Detroit Street Denver, CO 80206 Age 63 | Chairman Trustee | 3/04-Present 9/93-Present | Chief Executive Officer of Red Robin Gourmet Burgers, Inc. (since 2005). Formerly, private investor. | 69 | * | Chairman of the Board (since 2005) and Director of Red Robin Gourmet Burgers, Inc.; and Director of Janus Capital Funds Plc (Dublin-based, non-U.S. funds). | |||||||||||||||||
| Jerome S. Contro 151 Detroit Street Denver, CO 80206 Age 50 | Trustee | 12/05-Present | Partner of Tango Group, a private investment firm (since 1999). | 69 | Trustee and Chairman of RS Investment Trust (since 2001); Director of IZZE Beverages and MyFamily.com, Inc. (genealogical research website). | ||||||||||||||||||
| William F. McCalpin 151 Detroit Street Denver, CO 80206 Age 49 | Trustee | 6/02-Present | Private Investor. Formerly, Vice President of Asian Cultural Council and Executive Vice President and Chief Operating Officer of The Rockefeller Brothers Fund (a private family foundation). | 69 | Director of the F.B. Heron Foundation (a private grantmaking foundation). | ||||||||||||||||||
| John W. McCarter, Jr. 151 Detroit Street Denver, CO 80206 Age 68 | Trustee | 6/02-Present | President and Chief Executive Officer of The Field Museum of Natural History (Chicago, IL). | 69 | Chairman of the Board and Director of Divergence Inc. (biotechnology firm); Director of W.W. Grainger, Inc. (industrial distributor); and Trustee of WTTW (Chicago public television station) and the University of Chicago. | ||||||||||||||||||
Janus Aspen Series December 31, 2006 27
Trustees and Officers (unaudited) (continued)
Trustees (cont.)
| Name, Age and Address | Positions Held with Portfolio | Length of Time Served | Principal Occupations During the Past Five Years | Number of Portfolios in Fund Complex Overseen by Trustee | Other Directorships Held by Trustee | ||||||||||||||||||
| Independent Trustees (cont.) | |||||||||||||||||||||||
| James T. Rothe 151 Detroit Street Denver, CO 80206 Age 63 | Trustee | 1/97-Present | Co-founder and Managing Director of Roaring Fork Capital Management, LLC (private investment in public equity firm); and Professor Emeritus of Business of the University of Colorado, Colorado Springs, CO (since 2004). Formerly, Professor of Business of the University of Colorado (2002-2004); and Distinguished Visiting Professor of Business (2001-2002) of Thunderbird University (American Graduate School of International Management), Glendale, AZ. | 69 | Director of Red Robin Gourmet Burgers, Inc. | ||||||||||||||||||
| William D. Stewart 151 Detroit Street Denver, CO 80206 Age 62 | Trustee | 9/93-Present | Corporate Vice President and General Manager of MKS Instruments – HPS Products, Boulder, CO (a manufacturer of vacuum fittings and valves). | 69 | N/A | ||||||||||||||||||
| Martin H. Waldinger 151 Detroit Street Denver, CO 80206 Age 68 | Trustee | 9/93-Present | Private Investor and Consultant to California Planned Unit Developments. Formerly, CEO and President of Marwal, Inc. (homeowner association management company). | 69 | N/A | ||||||||||||||||||
| Linda S. Wolf 151 Detroit Street Denver, CO 80206 Age 59 | Trustee | 12/05-Present | Retired. Formerly, Chairman and Chief Executive Officer of Leo Burnett (Worldwide) (advertising agency) (2001-2005). | 69 | Director of Wal-Mart, The Field Museum of Natural History (Chicago, IL), Children's Memorial Hospital (Chicago, IL), Chicago Council on Foreign Relations, Economic Club of Chicago, and InnerWorkings (a provider of print procurement solutions). | ||||||||||||||||||
| Interested Trustee | |||||||||||||||||||||||
| Thomas H. Bailey** 151 Detroit Street Denver, CO 80206 Age 69 | Trustee | 5/93-Present | Retired. Formerly, President (1978-2002) and Chief Executive Officer (1994-2002) of Janus Capital or Janus Capital Corporation; Chairman and Director (1978-2002) of Janus Capital Corporation; President and Director (1994-2002) of The Janus Foundation. | 69 | N/A | ||||||||||||||||||
* Mr. Mullen also serves as director of Janus Capital Funds Plc, consisting of 22 funds. Including Janus Capital Funds Plc and the 69 funds comprising the Janus Funds, Mr. Mullen oversees 91 funds.
** The Portfolio is treating Mr. Bailey as an "interested person" of the Trust by virtue of his past positions and continuing relationships with Janus Capital and ownership of shares of Janus Capital's parent company.
28 Janus Aspen Series December 31, 2006
Officers
| Name, Age and Address | Positions Held with Portfolio | Term of Office* and Length of Time Served | Principal Occupations During the Past Five Years | ||||||||||||
| Jakob V. Holm 151 Detroit Street Denver, CO 80206 Age 35 | Executive Vice President and Portfolio Manager Janus Aspen Small Company Value Portfolio | 7/05-Present | Portfolio Manager for other Janus accounts. | ||||||||||||
| Stephanie Grauerholz-Lofton 151 Detroit Street Denver, CO 80206 Age 36 | Chief Legal Counsel and Secretary Vice President | 1/06-Present 03/06-Present | Assistant Vice President of Janus Capital and Janus Distributors LLC; and Associate Counsel of Janus Capital. Formerly, Associate of Vedder, Price, Kaufman & Kammholz, P.C. (1999-2003). | ||||||||||||
| Kelley Abbott Howes 151 Detroit Street Denver, CO 80206 Age 41 | President and Chief Executive Officer | 1/06-Present | President of Janus Services LLC; Senior Vice President and General Counsel of Janus Capital: and Senior Vice President and Assistant General Counsel of Janus Distributors LLC. Formerly, Vice President (1999-2005) of Janus Distributors LLC; Senior Vice President and General Counsel (2004-2006), Vice President (2000-2004), and Assistant General Counsel (2002-2004) of Janus Services LLC; and Vice President and Assistant General Counsel (1999-2004) of Janus Capital. | ||||||||||||
| David R. Kowalski 151 Detroit Street Denver, CO 80206 Age 49 | Vice President and Chief Compliance Officer | 6/02-Present | Senior Vice President and Chief Compliance Officer of Janus Capital, Janus Distributors LLC, and Janus Services LLC; Chief Compliance Officer of Bay Isle Financial LLC; and Vice President of Enhanced Investment Technologies LLC. Formerly, Chief Compliance Officer of Enhanced Investment Technologies, LLC (2003-2005); Vice President of Janus Capital (2000-2005), Janus Distributors LLC (2000-2001), and Janus Services LLC (2004-2005); and Assistant Vice President of Janus Services LLC (2002-2004). | ||||||||||||
| Jesper Nergaard 151 Detroit Street Denver, CO 80206 Age 44 | Chief Financial Officer Vice President, Treasurer, and Principal Accounting Officer | 3/05-Present 2/05-Present | Vice President of Janus Capital. Formerly, Director of Financial Reporting for OppenheimerFunds, Inc. (2004-2005); Site Manager and First Vice President of Mellon Global Securities Services (2003); and Director of Fund Accounting, Project Development, and Training of INVESCO Funds Group (1994-2003). | ||||||||||||
* Officers are elected at least annually for a one-year term and may also be elected from time to time by the Trustees for an interim period.
Janus Aspen Series December 31, 2006 29
Janus provides access to a wide range of investment disciplines.
Growth
Janus growth portfolios focus on companies believed to be the leaders in their respective industries, with solid management teams, expanding market share, margins and efficiencies.
Core
Janus core portfolios seek investments in more stable and predictable companies. These portfolios look for a strategic combination of steady growth and for certain portfolios, some degree of income.
Risk-Managed
Our risk-managed portfolios seek to outperform their respective indices while maintaining a risk profile equal to or lower than the index itself. Managed by INTECH (a Janus subsidiary), these portfolios use a mathematical process in an attempt to build a more "efficient" portfolio than the index.
Value
Janus value portfolios invest in companies they believe are poised for a turnaround or are trading at a significant discount to fair value. The goal is to gain unique insight into a company's true value and identify and evaluate potential catalysts that may unlock shareholder value.
International & Global
Janus international and global portfolios seek to leverage Janus' research capabilities by taking advantage of inefficiencies in foreign markets, where accurate information and analytical insight are often at a premium.
Bond & Money Market
Janus bond portfolios attempt to provide less risk relative to equities while seeking to deliver a competitive total return through high current income and appreciation. Janus money market portfolios seek maximum current income consistent with stability of capital.
For more information about our funds, contact your investment professional or go to www.janus.com/info
Please consider the charges, risks, expenses and investment objectives carefully before investing. For a prospectus containing this and other information, please call Janus at 1-800-525-0020 or download the file from www.janus.com/info. Read it carefully before you invest or send money.
An investment in a money market portfolio is not insured or guaranteed by the Federal Deposit Insurance Corporation or any other government agency. Although the Portfolio seeks to preserve the value of your investment at $1.00 per share, it is possible to lose money by investing in the Portfolio.

151 Detroit Street
Denver, CO 80206
1-800-525-0020
Portfolio distributed by Janus Distributors LLC (1/07)
C-0207-169 109-02-720 01-07
2006 Annual Report
Janus Aspen Series
Janus Aspen Worldwide Growth Portfolio
Look Inside. . .
• Portfolio management perspective
• Investment strategy behind your portfolio
• Portfolio performance, characteristics and holdings

Table of Contents
| Useful Information About Your Portfolio Report | 1 | ||||||
| Management Commentary and Schedule of Investments | 2 | ||||||
| Statement of Assets and Liabilities | 9 | ||||||
| Statement of Operations | 10 | ||||||
| Statements of Changes in Net Assets | 11 | ||||||
| Financial Highlights | 12 | ||||||
| Notes to Schedule of Investments | 14 | ||||||
| Notes to Financial Statements | 15 | ||||||
| Report of Independent Registered Public Accounting Firm | 23 | ||||||
| Additional Information | 24 | ||||||
| Explanations of Charts, Tables and Financial Statements | 27 | ||||||
| Designation Requirements | 29 | ||||||
| Trustees and Officers | 30 | ||||||
Please consider the charges, risks, expenses and investment objectives carefully before investing. For a prospectus containing this and other information, please call Janus at 1-800-525-0020 or download the file from www.janus.com/info. Read it carefully before you invest or send money.
Useful Information About Your Portfolio Report
Management Commentary
The Management Commentary in this report includes valuable insight from the Portfolio's manager as well as statistical information to help you understand how your Portfolio's performance and characteristics stack up against those of comparable indices.
Please keep in mind that the opinions expressed by the Portfolio's manager in the Management Commentary are just that: opinions. They are a reflection of the manager's best judgment at the time this report was compiled, which was December 31, 2006. As the investing environment changes, so could the manager's opinions. The views are unique to the manager and aren't necessarily shared by his fellow employees or by Janus in general.
Portfolio Expenses
We believe it's important for our shareholders to have a clear understanding of Portfolio expenses and the impact they have on investment return.
The following is important information regarding the Portfolio's Expense Example, which appears in the Management Commentary within this Annual Report. Please refer to this information when reviewing the Expense Example for the Portfolio.
Example
As a shareholder of a Portfolio, you incur two types of costs: (1) transaction costs, including redemption fees (where applicable) (and any related exchange fees) and (2) ongoing costs, including management fees; distribution and shareholder servicing (12b-1) fees (applicable to Service Shares and Service II Shares only); and other Portfolio expenses. The example is intended to help you understand your ongoing costs (in dollars) of investing in a Portfolio and to compare these costs with the ongoing costs of investing in other mutual funds. To do so, compare this 5% hypothetical example with the 5% hypothetical examples that appear in the shareholder reports of the other funds. The example is based upon an investment of $1,000 invested at the beginning of the period and held for the six-month period from July 1, 2006 to December 31, 2006.
Actual Expenses
The first line of the table in each example provides information about actual account values and actual expenses. You may use the information in this line, together with the amount you invested, to estimate the expenses that you paid over the period. Simply divide your account value by $1,000 (for example, an $8,600 account value divided by $1,000 = 8.6), then multiply the result by the number in the first line under the heading entitled "Expenses Paid During Period" to estimate the expenses you paid on your account during the period.
Hypothetical Example for Comparison Purposes
The second line of the table in each example provides information about hypothetical account values and hypothetical expenses based upon the Portfolio's actual expense ratio and an assumed rate of return of 5% per year before expenses, which is not the Portfolio's actual return. The hypothetical account values and expenses may not be used to estimate the actual ending account balance or expenses you paid for the period. You may use this information to compare the ongoing costs of investing in the Portfolio and other funds. To do so, compare this 5% hypothetical example with the 5% hypothetical examples that appear in the shareholder reports of the other funds.
Please note that the expenses shown in the tables are meant to highlight your ongoing costs only and do not reflect any transaction costs, such as redemption fees (where applicable) and any charges at the separate account level or contract level. Redemption fees are fully described in the prospectus. Therefore, the second line of each table is useful in comparing ongoing costs only, and will not help you determine the relative total costs of owning different funds. In addition, if these transaction costs and separate account or contract level charges were included, your costs would have been higher.
Janus Aspen Series December 31, 2006 1
Janus Aspen Worldwide Growth Portfolio (unaudited)
Portfolio Snapshot
Offering true geographic diversification in a single portfolio, this portfolio seeks to provide investors with exposure to some of the best companies global markets have to offer while typically maintaining a domestic component.

Jason Yee
portfolio manager
Performance Overview
Janus Aspen Worldwide Growth Portfolio's Institutional Shares, Service Shares and Service II Shares advanced 18.24%, 17.97% and 17.92%, respectively, over the 12-month period ended December 31, 2006. While I am pleased with this strong absolute performance, the Portfolio nevertheless did not keep pace with its benchmark, the Morgan Stanley Capital International World IndexSM, which returned 20.07% during the period.
While virtually every shareholder letter starts out with a discussion of returns, very few make even casual mention of the risks undertaken to achieve these returns. Part of the reason behind this is simply that risk is not easily measurable. While the academic world would conveniently equate risk to relative volatility, for most investors the Webster dictionary definition of risk as "possibility of loss or injury" is much more relevant and appropriate in my view. I can assure you that risk management of the Portfolio during my tenure has always focused on the latter definition – that is, minimizing this "possibility of (financial) loss or injury" – rather than hoping to tame volatility.
The lack of easy and precise measurements of risk in a portfolio is belied by the exhaustive quantitative approach traditionally found in the investment industry. In-house risk management experts, or a committee armed with fancy software and statistics galore, dissect portfolios by every factor imaginable. While this approach may be viewed as reasonable, especially in highlighting correlations within a diverse portfolio, the real crux of risk management involves more qualitative study and a common sense approach. As Warren Buffett duly noted, "Just as Justice Stewart found it impossible to formulate a test for obscenity but nevertheless asserted, 'I know it when I see it,' so also can investors – in an inexact but useful way – 'see' the risks inherent in certain investments without reference to complex equations or price histories."
The risks in a portfolio that are most easily measurable seem to be overly emphasized as important factors in explaining both risks and returns. Take geographic exposure, for instance. The fact that the Portfolio holds approximately half of its portfolio in foreign securities (or half in U.S. securities) is not obviously interesting or relevant to a global fund that is designed by charter to invest across the world. After all, what do Yahoo!, a leading U.S. media and Internet company, and Esprit Holdings, a Hong Kong-based apparel retailer, have in common? Different industries, different geographic exposure, different customers, different functional currencies... it is not apparent to me that there is a lot in common, nor should those two businesses be particularly correlated to each another. To be fair, geographic exposure can sometimes become relevant for periods of se cular growth or decline in a country but is generally an overly simplistic risk characteristic, especially for fundamental, bottom-up investing and longer investment time horizons.
The same could be said for risk from general economic conditions, in our view. For any particular period, interest rates, inflation, employment, housing starts, consumer sentiment and other economic indicators may go up or down; how this impacts the net asset value of the Portfolio is apparent only in retrospect and not always causal. And these factors change very quickly. Like most in this profession, I am aware of economic conditions in many different parts of the world, but am generally suspicious of these conditions as the arbiter of financial markets and prices. Some current examples include the following: Are steady interest rates a good or bad indicator for the U.S. economy? Is the U.S. Federal Reserve in front of or behind the curve in terms of keeping inflation under control? How does this U.S. policy impact the economic conditions of other countries around the world? These questions are best left for the commentators and pundits to forecast, and there is certainly no agreement. Furthermore, I am unsure how these conditions (even if one could predict them) are relevant to a discussion of risk or return in the Portfolio. In my opinion, risk management is probably better done from a micro (business model, competition, etc.) perspective versus a macro (geography, economic conditions, etc.) perspective.
Many other professions outside of the investment industry also think of risk in a similar sense. My studies of mechanical engineering during college introduced me to the concept of a "safety factor". If a bridge is built to withstand a certain load, the design is often required to have a safety factor of three (actually to withstand three times this expected load). The safety factor hopes to encompass a certain margin of error and account for unforeseen and unexpected situations, to manage
2 Janus Aspen Series December 31, 2006
(unaudited)
the risk of catastrophic failure. This concept seems quite obvious in engineering, perhaps because the consequences of failure are so high. But perhaps this concept should also be obvious with regard to investing.
Managing risk is one of the most basic concepts in investing – it defines the very nature of being an investment manager. In times of high returns and frothy equity markets, it is tempting to become less vigilant on the risk equation and more focused on reward. After all, if your neighbor is making unbelievable returns in an investment or asset class, why shouldn't you be making those returns too? For many investors, the prospect of being "left behind" is often too great to bear, and unfortunately this leads to ill-timed investments at ill-advised prices. It is exactly this temptation which I hope to avoid by means of a disciplined investment and risk management process. While sometimes this means I reap less reward in any given short-term period, this discipline is more likely to be rewarded when the environment inevitably becomes less favorable. And over time, I believe this strategy should help the Portfolio achieve its goal of solid overall risk-adjusted returns.
My common sense approach to managing risk in the Portfolio manifests itself in a number of ways. First of all, through diligent fundamental research, I strive to understand the forces shaping the business, industry and competitive landscape of the investment and assess the various different potential outcomes. Secondly, I strive to invest in high quality businesses and management teams to hopefully increase the probability of successful outcomes. And finally, I strive to purchase these businesses at attractive, discounted prices in order to manage downside risk, especially if I should be incorrect in my assessments of the future. I believe these three risk management techniques, while imprecise and imperfect in nature, offer the best chances of achieving an adequate balance of risk and return for the Portfolio over the long term.
What are the risks in my investment in Yahoo!, the largest detractor during the period? I believe the primary risk is not predicated on how the price moves up and down on a daily basis (volatility), but how sustainable and competitively advantaged a company's business model turns out to be (business risk). As equity owners in a business, albeit minority shareholders, it seems logical to equate the long-term risk of ownership to the long-term business risk of its operations, economic model, and competitive positioning. Considering Yahoo!'s substantial audience and user base, long term growth prospects, and the relaunch of its advertising platform, I believe these risks to be low (and already discounted in the stock price) and increased the Portfolio's position during the period.
What were the risks involved with Esprit Holdings, the largest contributor to the Portfolio during the period? The fact that it has returned nearly 62% in the past year is very measurable, but the risk is much less quantifiable, even in retrospect. There are more possibilities (almost infinite) than there are actual outcomes (one), so a favorable outcome does not necessarily imply anything about the investment's risk profile. I would like to believe my investment and risk management process of thorough fundamental research, high quality businesses and patience contributed to this successful outcome. This case in particular highlights the importance of patience. Even when the stock price slumped in late 2005 and early 2006 as the company's reemergence in the U.S. marketplace proved challenging, we stood by the company and even increased the Portfolio's stake. As management resolved the underlying issues and got back on track for high double-d igit revenue growth, my conviction was rewarded. Recognizing that Esprit's risk-reward characteristics diminished somewhat with the impressive price runup, I pared back our exposure during the period.
Despite all these complex issues related to risk, risk management and uncertainty in investing, there is reason to be optimistic. By simply recognizing some of the risks and uncertainties associated with investing, I feel I am better prepared to adjust our thinking accordingly to become a better, more successful investor. As famed physicist Richard Feynman so eloquently stated, "The first principle is that you must not fool yourself and you are the easiest person to fool." Or as Feynman put it even more bluntly, "I'm smart enough to know that I'm dumb."
Simply put, recognizing limitations in measuring risk is the first step towards intelligent risk management. By spending a substantial portion of my time examining the risks of specific investments and the Portfolio as a whole, I hope to deliver adequate returns in the Portfolio without incurring excessive risk.
Thank you for your continued investment in Janus Aspen Worldwide Growth Portfolio.
Janus Aspen Series December 31, 2006 3
Janus Aspen Worldwide Growth Portfolio (unaudited)
Janus Aspen Worldwide Growth Portfolio At a Glance
5 Largest Contributors to Performance – Holdings
| Contribution | |||||||
| Esprit Holdings, Ltd. High quality life-style products wholesaler - Hong Kong | 1.74 | % | |||||
| Cisco Systems, Inc. Internet data networking product supplier - U.S. | 1.46 | % | |||||
| British Sky Broadcasting Group PLC Pay television broadcasting services provider - United Kingdom | 1.25 | % | |||||
| IAC/InterActiveCorp Interactive commerce company - U.S. | 1.15 | % | |||||
| Burberry Group PLC Designer, manufacturer and distributor of luxury apparel and accessories - United Kingdom | 1.07 | % | |||||
5 Largest Detractors from Performance – Holdings
| Contribution | |||||||
| Yahoo!, Inc. Global Internet media company - U.S. | (0.42 | )% | |||||
| Expedia, Inc. Online travel services provider - U.S. | (0.40 | )% | |||||
| eBay, Inc. Online marketplace - U.S. | (0.37 | )% | |||||
| Dell, Inc. Worldwide computer systems and services - U.S. | (0.33 | )% | |||||
| UnitedHealth Group, Inc. Organized health systems company - U.S. | (0.30 | )% | |||||
5 Largest Contributors to Performance – Sectors
| Group | Fund Contribution | Fund Weighting (% of Net Assets) | Morgan Stanley Capital International World IndexSM Weighting | ||||||||||||
| Media | 3.30 | % | 11.89 | % | 2.95 | % | |||||||||
| Retailing | 3.18 | % | 13.66 | % | 2.59 | % | |||||||||
| Materials | 2.94 | % | 5.73 | % | 5.87 | % | |||||||||
| Consumer Durables & Apparel | 2.48 | % | 10.69 | % | 2.19 | % | |||||||||
| Insurance | 1.28 | % | 11.23 | % | 4.87 | % | |||||||||
5 Lowest Contributors/Detractors to Performance – Sectors
| Group | Fund Contribution | Fund Weighting (% of Net Assets) | Morgan Stanley Capital International World IndexSM Weighting | ||||||||||||
| Software & Services | (0.87 | )% | 4.04 | % | 3.60 | % | |||||||||
| Healthcare Equipment & Services | (0.45 | )% | 3.05 | % | 2.72 | % | |||||||||
| Commercial Services & Supplies | (0.02 | )% | 0.25 | % | 0.89 | % | |||||||||
| Transportation | 0.02 | % | 1.17 | % | 1.98 | % | |||||||||
| Utilities | 0.06 | % | 0.01 | % | 4.16 | % | |||||||||
4 Janus Aspen Series December 31, 2006
(unaudited)
5 Largest Equity Holdings – (% of Net Assets)
| As of December 31, 2006 | |||||||
| Dell, Inc. Computers | 5.5 | % | |||||
| British Sky Broadcasting Group PLC Television | 5.0 | % | |||||
| Willis Group Holdings, Ltd. Insurance Brokers | 4.4 | % | |||||
| Esprit Holdings, Ltd. Distribution/Wholesale | 3.8 | % | |||||
| Tyco International, Ltd. (U.S. Shares) Diversified Operations | 3.7 | % | |||||
| 22.4 | % | ||||||
Asset Allocation – (% of Net Assets)
As of December 31, 2006
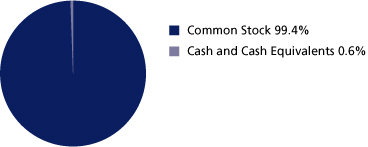
Emerging markets comprised 3.3% of total net assets.
Top Country Allocations – (% of Investment Securities)
| As of December 31, 2006 | As of December 31, 2005 | ||||||
 | 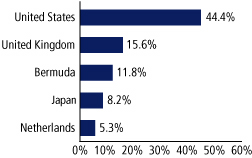 | ||||||
Janus Aspen Series December 31, 2006 5
Janus Aspen Worldwide Growth Portfolio (unaudited)
Performance

Average Annual Total Return – for the periods ended December 31, 2006
| One Year | Five Year | Ten Year | Since Inception* | ||||||||||||||||
| Janus Aspen Worldwide Growth Portfolio - Institutional Shares | 18.24 | % | 3.91 | % | 7.45 | % | 11.15 | % | |||||||||||
| Janus Aspen Worldwide Growth Portfolio - Service Shares | 17.97 | % | 3.64 | % | 7.15 | % | 10.85 | % | |||||||||||
| Janus Aspen Worldwide Growth Portfolio - Service II Shares | 17.92 | % | 3.65 | % | 7.15 | % | 10.85 | % | |||||||||||
| Morgan Stanley Capital International World IndexSM | 20.07 | % | 9.97 | % | 7.64 | % | 8.68 | % | |||||||||||
| Lipper Quartile - Institutional Shares | 3 | rd | 4 | th | 4 | th | 2 | nd | |||||||||||
| Lipper Ranking - Institutional Shares based on total returns for Variable Annuity Global Funds | 52/87 | 55/58 | 16/20 | 3/10 | |||||||||||||||
Data presented represents past performance, which is no guarantee of future results. Investment results and principal value will fluctuate so that shares, when redeemed, may be worth more or less than their original cost. Due to market volatility, current performance may be higher or lower than the performance shown. Call 877.33JANUS or visit www.janus.com/info. for performance current to the most recent month-end.
See Notes to Schedule of Investments for index definitions.
Total return includes reinvestment of dividends from net investment income and distributions from capital gains. Net dividends reinvested are the dividends that remain to be reinvested after foreign tax obligations have been met. Such obligations vary from country to country. The returns shown do not reflect the deduction of taxes that a shareholder would pay on Portfolio distributions or the redemption of Portfolio shares.
Returns shown for Service Shares and Service II Shares for periods prior to December 31, 1999 and December 31, 2001, respectively, are derived from the historical performance of Institutional Shares, adjusted to reflect the higher operating expenses of Service Shares and Service II Shares.
These returns do not reflect the charges and expenses of any particular insurance product or qualified plan. Returns shown would have been lower had they included insurance charges.
The Portfolio may differ significantly from the securities held in the index. The index is not available for direct investment; therefore its performance does not reflect the expenses associated with the active management of an actual Portfolio.
For the period from July 1, 2006 through January 31, 2007, Janus Capital has contractually agreed to waive its right to receive a portion of the management fee, at the annual rate of up to 0.15% of average daily net assets, under certain conditions.
Foreign investing involves special risks such as currency fluctuations and political uncertainty.
For Service II Shares, a 1% redemption fee may be imposed on shares held for 60 days or less.
There is no assurance that the investment process will consistently lead to successful investing.
Ranking is for the Institutional share class only; other classes may have different performance characteristics.
This Portfolio has a performance-based management fee that adjusts upward or downward based on the Portfolio's performance relative to an approved benchmark index over a performance measurement period. See the Portfolio's Prospectus or Statement of Additional Information for more details.
Lipper Inc. - A Reuters Company, is a nationally recognized organization that ranks the performance of mutual funds within a universe of funds that have similar investment objectives. Rankings are historical with capital gains and dividends reinvested.
The Portfolio's performance may be affected by risks that include those associated with nondiversification, non-investment grade debt securities, undervalued or overlooked companies, investments in specific industries or countries and potential conflicts of interest with Janus Smart Portfolios. Additional risks to the Portfolio may include those associated with investing in foreign securities, emerging markets, initial public offerings, derivatives and companies with relatively small market capitalizations. Please see a Janus prospectus or www.janus.com/info. for more information about risk, fund holdings and details.
The date of the since-inception Lipper ranking is slightly different from when the Portfolio began operations since Lipper provides fund rankings as of the last day of the month or the first Thursday after fund inception.
See "Explanations of Charts, Tables and Financial Statements."
* The Portfolio's inception date – September 13, 1993
Portfolio Expenses
The example below shows you the ongoing costs (in dollars) of investing in your Portfolio and allows you to compare these costs with those of other mutual funds. Please refer to page 1 for a detailed explanation of the information presented in these charts.
| Expense Example - Institutional Shares | Beginning Account Value (7/1/06) | Ending Account Value (12/31/06) | Expenses Paid During Period (7/1/06-12/31/06)* | ||||||||||||
| Actual | $ | 1,000.00 | $ | 1,168.70 | $ | 3.12 | |||||||||
| Hypothetical (5% return before expenses) | $ | 1,000.00 | $ | 1,022.33 | $ | 2.91 | |||||||||
| Expense Example - Service Shares | Beginning Account Value (7/1/06) | Ending Account Value (12/31/06) | Expenses Paid During Period (7/1/06-12/31/06)* | ||||||||||||
| Actual | $ | 1,000.00 | $ | 1,167.30 | $ | 4.48 | |||||||||
| Hypothetical (5% return before expenses) | $ | 1,000.00 | $ | 1,021.07 | $ | 4.18 | |||||||||
| Expense Example - Service II Shares | Beginning Account Value (7/1/06) | Ending Account Value (12/31/06) | Expenses Paid During Period (7/1/06-12/31/06)* | ||||||||||||
| Actual | $ | 1,000.00 | $ | 1,166.70 | $ | 4.48 | |||||||||
| Hypothetical (5% return before expenses) | $ | 1,000.00 | $ | 1,021.07 | $ | 4.18 | |||||||||
*Expenses are equal to the annualized expense ratio of 0.57% for Institutional Shares, 0.82% for Service Shares and 0.82% for Service II Shares, multiplied by the average account value over the period, multiplied by 184/365 (to reflect the one-half year period).
6 Janus Aspen Series December 31, 2006
Janus Aspen Worldwide Growth Portfolio
Schedule of Investments
As of December 31, 2006
| Shares or Principal Amount | Value | ||||||||||
| Common Stock - 99.4% | |||||||||||
| Advertising Services - 1.5% | |||||||||||
| 1,625,601 | WPP Group PLC | $ | 21,977,904 | ||||||||
| Aerospace and Defense - 0.3% | |||||||||||
| 437,670 | BAE Systems PLC | 3,648,464 | |||||||||
| Agricultural Chemicals - 3.3% | |||||||||||
| 178,290 | Potash Corporation of Saskatchewan Inc. (U.S. Shares) | 25,581,050 | |||||||||
| 111,118 | Syngenta A.G.* | 20,673,328 | |||||||||
| 46,254,378 | |||||||||||
| Apparel Manufacturers - 1.6% | |||||||||||
| 1,747,743 | Burberry Group PLC | 22,089,325 | |||||||||
| Audio and Video Products - 0.5% | |||||||||||
| 173,400 | Sony Corp. | 7,431,116 | |||||||||
| Automotive - Cars and Light Trucks - 2.4% | |||||||||||
| 306,610 | BMW A.G.# | 17,646,619 | |||||||||
| 81,859 | Hyundai Motor Company, Ltd. | 5,932,577 | |||||||||
| 815,766 | Nissan Motor Company, Ltd. | 9,823,055 | |||||||||
| 33,402,251 | |||||||||||
| Broadcast Services and Programming - 2.0% | |||||||||||
| 740,800 | Liberty Global, Inc. - Class A* | 21,594,320 | |||||||||
| 246,870 | Liberty Global, Inc. - Class C* | 6,912,360 | |||||||||
| 28,506,680 | |||||||||||
| Building - Residential and Commercial - 4.5% | |||||||||||
| 379,725 | Centex Corp. | 21,367,126 | |||||||||
| 403,520 | Lennar Corp. | 21,168,659 | |||||||||
| 633,015 | Pulte Homes, Inc.# | 20,965,457 | |||||||||
| 63,501,242 | |||||||||||
| Casino Hotels - 1.2% | |||||||||||
| 200,745 | Harrah's Entertainment, Inc. | 16,605,626 | |||||||||
| Cellular Telecommunications - 2.1% | |||||||||||
| 83,800 | Hikari Tsushin, Inc. | 3,682,820 | |||||||||
| 9,601,498 | Vodafone Group PLC | 26,601,374 | |||||||||
| 30,284,194 | |||||||||||
| Chemicals - Diversified - 1.5% | |||||||||||
| 314,400 | Shin-Etsu Chemical Company, Ltd. | 21,055,989 | |||||||||
| Commercial Banks - 0.5% | |||||||||||
| 329,718 | ICICI Bank, Ltd. | 6,641,292 | |||||||||
| Computers - 5.5% | |||||||||||
| 3,127,645 | Dell, Inc.* | 78,472,613 | |||||||||
| Computers - Memory Devices - 0.5% | |||||||||||
| 506,340 | EMC Corp.* | 6,683,688 | |||||||||
| Distribution/Wholesale - 4.5% | |||||||||||
| 4,765,000 | Esprit Holdings, Ltd. | 53,204,460 | |||||||||
| 3,534,800 | Li & Fung, Ltd. | 10,997,539 | |||||||||
| 64,201,999 | |||||||||||
| Diversified Minerals - 0.7% | |||||||||||
| 343,926 | Companhia Vale do Rio Doce (ADR) | 10,228,359 | |||||||||
| Diversified Operations - 3.7% | |||||||||||
| 1,713,515 | Tyco International, Ltd. (U.S. Shares) | 52,090,856 | |||||||||
| E-Commerce/Products - 2.5% | |||||||||||
| 898,433 | Amazon.com, Inc.*,# | 35,452,166 | |||||||||
| Shares or Principal Amount | Value | ||||||||||
| E-Commerce/Services - 6.5% | |||||||||||
| 797,950 | eBay, Inc.* | $ | 23,994,357 | ||||||||
| 1,553,505 | Expedia, Inc.*,# | 32,592,535 | |||||||||
| 972,440 | IAC/InterActiveCorp* | 36,135,870 | |||||||||
| 92,722,762 | |||||||||||
| Electronic Components - Miscellaneous - 3.6% | |||||||||||
| 1,359,150 | Koninklijke (Royal) Philips Electronics N.V. | 51,258,551 | |||||||||
| Electronic Components - Semiconductors - 2.4% | |||||||||||
| 3,324,861 | ARM Holdings PLC | 8,186,346 | |||||||||
| 17,435 | Samsung Electronics Company, Ltd. | 11,492,102 | |||||||||
| 491,650 | Texas Instruments, Inc. | 14,159,521 | |||||||||
| 33,837,969 | |||||||||||
| Energy - Alternate Sources - 0.2% | |||||||||||
| 94,975 | Suntech Power Holdings Company, Ltd. (ADR)*,# | 3,230,100 | |||||||||
| Entertainment Software - 0.6% | |||||||||||
| 473,545 | Activision, Inc.* | 8,163,916 | |||||||||
| Finance - Investment Bankers/Brokers - 7.2% | |||||||||||
| 369,394 | Citigroup, Inc. | 20,575,246 | |||||||||
| 1,054,758 | JP Morgan Chase & Co. | 50,944,811 | |||||||||
| 1,002,000 | Mitsubishi UFJ Securities Company, Ltd. | 11,130,995 | |||||||||
| 320,754 | UBS A.G. | 19,492,683 | |||||||||
| 102,143,735 | |||||||||||
| Finance - Mortgage Loan Banker - 1.4% | |||||||||||
| 120,435 | Fannie Mae | 7,152,635 | |||||||||
| 340,867 | Housing Development Finance Corporation, Ltd. | 12,529,519 | |||||||||
| 19,682,154 | |||||||||||
| Food - Retail - 0.5% | |||||||||||
| 107,268 | Metro A.G. | 6,823,635 | |||||||||
| Insurance Brokers - 4.4% | |||||||||||
| 1,558,057 | Willis Group Holdings, Ltd. | 61,870,443 | |||||||||
| Investment Companies - 0.2% | |||||||||||
| 128,641 | RHJ International* | 2,750,953 | |||||||||
| Medical - Drugs - 2.1% | |||||||||||
| 192,915 | Merck & Company, Inc. | 8,411,094 | |||||||||
| 299,490 | Pfizer, Inc. | 7,756,791 | |||||||||
| 72,939 | Roche Holding A.G. | 13,079,336 | |||||||||
| 29,247,221 | |||||||||||
| Medical - HMO - 1.7% | |||||||||||
| 141,345 | Aetna, Inc. | 6,103,277 | |||||||||
| 112,340 | Coventry Health Care, Inc.* | 5,622,617 | |||||||||
| 225,775 | UnitedHealth Group, Inc. | 12,130,891 | |||||||||
| 23,856,785 | |||||||||||
| Medical - Hospitals - 0.6% | |||||||||||
| 392,405 | Health Management Associates, Inc. - Class A | 8,283,670 | |||||||||
| Multimedia - 1.7% | |||||||||||
| 721,670 | Walt Disney Co. | 24,731,631 | |||||||||
| Networking Products - 2.5% | |||||||||||
| 1,289,865 | Cisco Systems, Inc.* | 35,252,010 | |||||||||
| Pharmacy Services - 2.0% | |||||||||||
| 140,305 | Caremark Rx, Inc. | 8,012,819 | |||||||||
| 393,240 | Medco Health Solutions, Inc.* | 21,014,745 | |||||||||
| 29,027,564 | |||||||||||
See Notes to Schedule of Investments and Financial Statements.
Janus Aspen Series December 31, 2006 7
Janus Aspen Worldwide Growth Portfolio
Schedule of Investments
As of December 31, 2006
| Shares or Principal Amount | Value | ||||||||||
| Property and Casualty Insurance - 2.4% | |||||||||||
| 982,300 | Millea Holdings, Inc. | $ | 34,667,955 | ||||||||
| Real Estate Management/Services - 0.8% | |||||||||||
| 454,000 | Mitsubishi Estate Company, Ltd. | 11,750,095 | |||||||||
| Real Estate Operating/Development - 0.9% | |||||||||||
| 3,143,000 | CapitaLand, Ltd. | 12,705,200 | |||||||||
| Reinsurance - 2.6% | |||||||||||
| 10,118 | Berkshire Hathaway, Inc. - Class B* | 37,092,588 | |||||||||
| Retail - Apparel and Shoe - 1.6% | |||||||||||
| 424,614 | Industria de Diseno Textil S.A. | 22,874,394 | |||||||||
| Retail - Consumer Electronics - 0.2% | |||||||||||
| 39,120 | Yamada Denki Company, Ltd. | 3,320,129 | |||||||||
| Schools - 0.3% | |||||||||||
| 125,300 | Apollo Group, Inc. - Class A* | 4,882,941 | |||||||||
| Semiconductor Components/Integrated Circuits - 1.1% | |||||||||||
| 777,180 | Marvell Technology Group, Ltd.* | 14,914,084 | |||||||||
| Semiconductor Equipment - 0.5% | |||||||||||
| 284,585 | ASML Holding N.V.* | 7,077,528 | |||||||||
| Soap and Cleaning Preparations - 1.2% | |||||||||||
| 365,099 | Reckitt Benckiser PLC | 16,684,766 | |||||||||
| Telephone - Integrated - 1.0% | |||||||||||
| 741,100 | Sprint Nextel Corp. | 13,999,379 | |||||||||
| Television - 5.0% | |||||||||||
| 6,906,140 | British Sky Broadcasting Group PLC | 70,585,340 | |||||||||
| Transportation - Services - 1.0% | |||||||||||
| 192,170 | United Parcel Service, Inc. - Class B | 14,408,907 | |||||||||
| Web Portals/Internet Service Providers - 3.4% | |||||||||||
| 1,896,230 | Yahoo!, Inc.* | 48,429,714 | |||||||||
| Wireless Equipment - 1.0% | |||||||||||
| 700,795 | Nokia Oyj | 14,320,252 | |||||||||
| Total Common Stock (cost $1,128,161,050) | 1,409,124,513 | ||||||||||
| Money Markets - 0.7% | |||||||||||
| 9,883,895 | Janus Institutional Cash Reserves Fund 5.29% (cost $9,883,895) | 9,883,895 | |||||||||
| Other Securities - 3.3% | |||||||||||
| 47,464,006 | State Street Navigator Securities Lending Prime Portfolio† (cost $47,464,006) | 47,464,006 | |||||||||
| Total Investments (total cost $1,185,508,951) – 103.4% | 1,466,472,414 | ||||||||||
| Liabilities, net of Cash, Receivables and Other Assets – (3.4)% | (48,354,766 | ) | |||||||||
| Net Assets – 100% | $ | 1,418,117,648 | |||||||||
Summary of Investments by Country
| Country | Value | % of Investment Securities | |||||||||
| Belgium | $ | 2,750,953 | 0.2 | % | |||||||
| Bermuda | 193,077,382 | 13.2 | % | ||||||||
| Brazil | 10,228,359 | 0.7 | % | ||||||||
| Canada | 25,581,050 | 1.7 | % | ||||||||
| Cayman Islands | 3,230,100 | 0.1 | % | ||||||||
| Finland | 14,320,252 | 1.0 | % | ||||||||
| Germany | 24,470,254 | 1.7 | % | ||||||||
| India | 19,170,811 | 1.3 | % | ||||||||
| Japan | 102,862,154 | 7.0 | % | ||||||||
| Netherlands | 58,336,079 | 4.0 | % | ||||||||
| Singapore | 12,705,200 | 0.9 | % | ||||||||
| South Korea | 17,424,679 | 1.2 | % | ||||||||
| Spain | 22,874,394 | 1.6 | % | ||||||||
| Switzerland | 53,245,347 | 3.6 | % | ||||||||
| United Kingdom | 169,773,519 | 11.6 | % | ||||||||
| United States†† | 736,421,881 | 50.2 | % | ||||||||
| Total | $ | 1,466,472,414 | 100.0 | % | |||||||
††Includes Short-Term Securities and Other Securities (46.3% excluding Short-Term Securities and Other Securities)
See Notes to Schedule of Investments and Financial Statements.
8 Janus Aspen Series December 31, 2006
Statement of Assets and Liabilities
| As of December 31, 2006 (all numbers in thousands except net asset value per share) | Janus Aspen Worldwide Growth Portfolio | ||||||
| Assets: | |||||||
| Investments at cost(1) | $ | 1,185,509 | |||||
| Investments at value(1) | $ | 1,466,472 | |||||
| Cash | 787 | ||||||
| Receivables: | |||||||
| Portfolio shares sold | 73 | ||||||
| Dividends | 1,458 | ||||||
| Interest | 35 | ||||||
| Other assets | 35 | ||||||
| Total Assets | 1,468,860 | ||||||
| Liabilities: | |||||||
| Payables: | |||||||
| Collateral for securities loaned (Note 1) | 47,464 | ||||||
| Investments purchased | 768 | ||||||
| Portfolio shares repurchased | 1,625 | ||||||
| Advisory fees | 724 | ||||||
| Transfer agent fees and expenses | 1 | ||||||
| Distribution fees - Service Shares | 44 | ||||||
| Distribution fees - Service II Shares | – | ||||||
| Non-interested Trustees' fees and expenses | 12 | ||||||
| Accrued expenses | 104 | ||||||
| Total Liabilities | 50,742 | ||||||
| Net Assets | $ | 1,418,118 | |||||
| Net Assets Consist of: | |||||||
| Capital (par value and paid-in-surplus)* | $ | 2,932,355 | |||||
| Undistributed net investment income/(loss)* | 2,196 | ||||||
| Undistributed net realized gain/(loss) from investments and foreign currency transactions* | (1,797,411 | ) | |||||
| Unrealized net appreciation/(depreciation) of investments and foreign currency translations | 280,978 | ||||||
| Total Net Assets | $ | 1,418,118 | |||||
| Net Assets - Institutional Shares | $ | 1,208,155 | |||||
| Shares Outstanding, $0.001 Par Value (unlimited shares authorized) | 37,202 | ||||||
| Net Asset Value Per Share | $ | 32.48 | |||||
| Net Assets - Service Shares | $ | 209,951 | |||||
| Shares Outstanding, $0.001 Par Value (unlimited shares authorized) | 6,517 | ||||||
| Net Asset Value Per Share | $ | 32.22 | |||||
| Net Assets - Service II Shares | $ | 12 | |||||
| Shares Outstanding, $0.001 Par Value (unlimited shares authorized)** | 370 | ||||||
| Net Asset Value Per Share | $ | 32.30 | |||||
* See Note 3 in Notes to Financial Statements.
** Shares Outstanding - Service II Shares are not in thousands.
(1) Investments at cost and value include $46,114,818 of securities loaned for Janus Aspen Worldwide Growth Portfolio (Note 1).
See Notes to Financial Statements.
Janus Aspen Series December 31, 2006 9
Statement of Operations
| For the fiscal year ended December 31, 2006 (all numbers in thousands) | Janus Aspen Worldwide Growth Portfolio | ||||||
| Investment Income: | |||||||
| Interest | $ | 1,235 | |||||
| Securities lending income | 149 | ||||||
| Dividends | 31,186 | ||||||
| Dividends from affiliates | 278 | ||||||
| Foreign tax withheld | (710 | ) | |||||
| Total Investment Income | 32,138 | ||||||
| Expenses: | |||||||
| Advisory fees | 8,797 | ||||||
| Transfer agent expenses | 6 | ||||||
| Registration fees | 26 | ||||||
| Custodian fees | 150 | ||||||
| Professional fees | 35 | ||||||
| Non-interested Trustees' fees and expenses | 52 | ||||||
| Distribution fees - Service Shares | 488 | ||||||
| Distribution fees - Service II Shares | – | ||||||
| Other expenses | 395 | ||||||
| Non-recurring costs (Note 2) | 1 | ||||||
| Costs assumed by Janus Capital Management LLC (Note 2) | (1 | ) | |||||
| Total Expenses | 9,949 | ||||||
| Expense and Fee Offset | (28 | ) | |||||
| Net Expenses | 9,921 | ||||||
| Less: Excess Expense Reimbursement | (471 | ) | |||||
| Net Expenses after Expense Reimbursement | 9,450 | ||||||
| Net Investment Income/(Loss) | 22,688 | ||||||
| Net Realized and Unrealized Gain/(Loss) on Investments: | |||||||
| Net realized gain/(loss) from securities transactions | 161,641 | ||||||
| Net realized gain/(loss) from foreign currency transactions | (292 | ) | |||||
| Change in unrealized net appreciation/(depreciation) of investments and foreign currency translations | 48,684 | ||||||
| Payment from affiliate (Note 2) | – | ||||||
| Net Gain/(Loss) on Investments | 210,033 | ||||||
| Net Increase/(Decrease) in Net Assets Resulting from Operations | $ | 232,721 | |||||
See Notes to Financial Statements.
10 Janus Aspen Series December 31, 2006
Statements of Changes in Net Assets
| For the fiscal year ended December 31 | Janus Aspen Worldwide Growth Portfolio | ||||||||||
| (all numbers in thousands) | 2006 | 2005 | |||||||||
| Operations: | |||||||||||
| Net investment income/(loss) | $ | 22,688 | $ | 25,829 | |||||||
| Net realized gain/(loss) from investment and foreign currency transactions | 161,349 | 154,810 | |||||||||
| Change in unrealized net appreciation/(depreciation) of investments and foreign currency translations | 48,684 | (115,615 | ) | ||||||||
| Payment from affiliate (Note 2) | – | 336 | |||||||||
| Net Increase/(Decrease) in Net Assets Resulting from Operations | 232,721 | 65,360 | |||||||||
| Dividends and Distributions to Shareholders: | |||||||||||
| Net investment income* | |||||||||||
| Institutional Shares | (20,570 | ) | (20,780 | ) | |||||||
| Service Shares | (3,143 | ) | (2,398 | ) | |||||||
| Service II Shares | – | – | |||||||||
| Net realized gain from investment transactions* | |||||||||||
| Institutional Shares | – | – | |||||||||
| Service Shares | – | – | |||||||||
| Service II Shares | – | – | |||||||||
| Net Decrease from Dividends and Distributions | (23,713 | ) | (23,178 | ) | |||||||
| Capital Share Transactions: | |||||||||||
| Shares sold | |||||||||||
| Institutional Shares | 25,723 | 25,535 | |||||||||
| Service Shares | 20,086 | 24,258 | |||||||||
| Service II Shares | – | – | |||||||||
| Redemption fees | |||||||||||
| Service II Shares | – | – | |||||||||
| Reinvested dividends and distributions | |||||||||||
| Institutional Shares | 20,570 | 20,780 | |||||||||
| Service Shares | 3,143 | 2,398 | |||||||||
| Service II Shares | – | – | |||||||||
| Shares repurchased(1) | |||||||||||
| Institutional Shares | (482,013 | ) | (1,108,982 | ) | |||||||
| Service Shares | (44,091 | ) | (68,409 | ) | |||||||
| Service II Shares | – | – | |||||||||
| Net Increase/(Decrease) from Capital Share Transactions | (456,582 | ) | (1,104,420 | ) | |||||||
| Net Increase/(Decrease) in Net Assets | (247,574 | ) | (1,062,238 | ) | |||||||
| Net Assets: | |||||||||||
| Beginning of period | 1,665,692 | 2,727,930 | |||||||||
| End of period | $ | 1,418,118 | $ | 1,665,692 | |||||||
| Undistributed net investment income/(loss)* | $ | 2,196 | $ | 3,495 | |||||||
* See Note 3 in Notes to Financial Statements.
(1) During the fiscal year ended December 31, 2005, Janus Aspen Worldwide Growth Portfolio disbursed to a redeeming shareholder portfolio securities and cash valued at $640,063,769 on the date of redemption.
See Notes to Financial Statements.
Janus Aspen Series December 31, 2006 11
Financial Highlights
Institutional Shares
| Janus Aspen Worldwide Growth Portfolio | |||||||||||||||||||||||
| For a share outstanding during each fiscal year ended December 31 | 2006 | 2005 | 2004 | 2003 | 2002 | ||||||||||||||||||
| Net Asset Value, Beginning of Period | $ | 27.96 | $ | 26.78 | $ | 25.82 | $ | 21.05 | $ | 28.54 | |||||||||||||
| Income from Investment Operations: | |||||||||||||||||||||||
| Net investment income/(loss) | .54 | .44 | .28 | .23 | .23 | ||||||||||||||||||
| Net gain/(loss) on securities (both realized and unrealized) | 4.50 | 1.11 | .94 | 4.79 | (7.50 | ) | |||||||||||||||||
| Total from Investment Operations | 5.04 | 1.55 | 1.22 | 5.02 | (7.27 | ) | |||||||||||||||||
| Less Distributions and Other: | |||||||||||||||||||||||
| Dividends (from net investment income)* | (.52 | ) | (.37 | ) | (.26 | ) | (.25 | ) | (.22 | ) | |||||||||||||
| Distributions (from capital gains)* | – | – | – | – | – | ||||||||||||||||||
| Tax return of capital* | – | – | – | – | (1) | – | |||||||||||||||||
| Payment from affiliate | – | (2) | – | (2) | – | (2) | – | – | |||||||||||||||
| Total Distributions and Other | (.52 | ) | (.37 | ) | (.26 | ) | (.25 | ) | (.22 | ) | |||||||||||||
| Net Asset Value, End of Period | $ | 32.48 | $ | 27.96 | $ | 26.78 | $ | 25.82 | $ | 21.05 | |||||||||||||
| Total Return | 18.24 | %(3) | 5.87 | %(4) | 4.78 | %(3) | 23.99 | % | (25.50 | )% | |||||||||||||
| Net Assets, End of Period (in thousands) | $ | 1,208,155 | $ | 1,464,300 | $ | 2,491,921 | $ | 3,743,762 | $ | 3,722,823 | |||||||||||||
| Average Net Assets for the Period (in thousands) | $ | 1,271,755 | $ | 1,767,226 | $ | 3,232,578 | $ | 3,672,695 | $ | 4,703,406 | |||||||||||||
| Ratio of Gross Expenses to Average Net Assets(5) | 0.61 | % | 0.61 | % | 0.66 | % | 0.71 | % | 0.70 | % | |||||||||||||
| Ratio of Net Expenses to Average Net Assets(5) | 0.61 | % | 0.61 | % | 0.66 | % | 0.71 | % | 0.70 | % | |||||||||||||
| Ratio of Net Investment Income/(Loss) to Average Net Assets | 1.59 | % | 1.33 | % | 0.99 | % | 1.08 | % | 0.88 | % | |||||||||||||
| Portfolio Turnover Rate | 46 | % | 41 | % | 120 | % | 126 | % | 73 | % | |||||||||||||
Service Shares
| Janus Aspen Worldwide Growth Portfolio | |||||||||||||||||||||||
| For a share outstanding during each fiscal year ended December 31 | 2006 | 2005 | 2004 | 2003 | 2002 | ||||||||||||||||||
| Net Asset Value, Beginning of Period | $ | 27.76 | $ | 26.62 | $ | 25.70 | $ | 20.95 | $ | 28.38 | |||||||||||||
| Income from Investment Operations: | |||||||||||||||||||||||
| Net investment income/(loss) | .36 | .29 | .17 | .17 | .14 | ||||||||||||||||||
| Net gain/(loss) on securities (both realized and unrealized) | 4.58 | 1.18 | .99 | 4.77 | (7.43 | ) | |||||||||||||||||
| Total from Investment Operations | 4.94 | 1.47 | 1.16 | 4.94 | (7.29 | ) | |||||||||||||||||
| Less Distributions and Other: | |||||||||||||||||||||||
| Dividends (from net investment income)* | (.48 | ) | (.33 | ) | (.24 | ) | (.19 | ) | (.14 | ) | |||||||||||||
| Distributions (from capital gains)* | – | – | – | – | – | ||||||||||||||||||
| Tax return of capital* | – | – | – | – | (1) | – | |||||||||||||||||
| Payment from affiliate | – | – | (2) | – | (2) | – | – | ||||||||||||||||
| Total Distributions and Other | (.48 | ) | (.33 | ) | (.24 | ) | (.19 | ) | (.14 | ) | |||||||||||||
| Net Asset Value, End of Period | $ | 32.22 | $ | 27.76 | $ | 26.62 | $ | 25.70 | $ | 20.95 | |||||||||||||
| Total Return | 17.97 | % | 5.57 | %(4) | 4.53 | %(3) | 23.68 | % | (25.71 | )% | |||||||||||||
| Net Assets, End of Period (in thousands) | $ | 209,951 | $ | 201,382 | $ | 235,999 | $ | 236,991 | $ | 192,629 | |||||||||||||
| Average Net Assets for the Period (in thousands) | $ | 195,343 | $ | 206,310 | $ | 232,280 | $ | 207,451 | $ | 188,639 | |||||||||||||
| Ratio of Gross Expenses to Average Net Assets(5) | 0.86 | % | 0.86 | % | 0.91 | % | 0.96 | % | 0.95 | % | |||||||||||||
| Ratio of Net Expenses to Average Net Assets(5) | 0.86 | % | 0.86 | % | 0.91 | % | 0.96 | % | 0.95 | % | |||||||||||||
| Ratio of Net Investment Income/(Loss) to Average Net Assets | 1.29 | % | 1.11 | % | 0.74 | % | 0.80 | % | 0.64 | % | |||||||||||||
| Portfolio Turnover Rate | 46 | % | 41 | % | 120 | % | 126 | % | 73 | % | |||||||||||||
* See Note 3 in Notes to Financial Statements.
(1) Tax return of capital aggregated less than $.01 on a per share basis for the fiscal year ended.
(2) Payment from affiliate aggregated less than $.01 on a per share basis for the fiscal year ended.
(3) During the fiscal year ended, Janus Capital and/or Janus Services LLC fully reimbursed the Portfolio for a loss on a transaction resulting from certain trading, pricing, and/or shareholder activity errors, which otherwise would have reduced total return by less than 0.01%
(4) During the fiscal year ended, Janus Capital and/or Janus Services LLC fully reimbursed the Portfolio for a loss on a transaction resulting from certain trading, pricing and/or shareholder activity errors, which otherwise would have reduced total return by 0.02%.
(5) See Note 4 in Notes to Financial Statements.
See Notes to Financial Statements.
12 Janus Aspen Series December 31, 2006
Service II Shares
| Janus Aspen Worldwide Growth Portfolio | |||||||||||||||||||||||
| For a share outstanding during each fiscal year ended December 31 | 2006 | 2005 | 2004 | 2003 | 2002 | ||||||||||||||||||
| Net Asset Value, Beginning of Period | $ | 27.85 | $ | 26.70 | $ | 25.79 | $ | 21.02 | $ | 28.49 | |||||||||||||
| Income from Investment Operations: | |||||||||||||||||||||||
| Net investment income/(loss) | .36 | .30 | .17 | .17 | .15 | ||||||||||||||||||
| Net gain/(loss) on securities (both realized and unrealized) | 4.58 | 1.19 | .98 | 4.79 | (7.47 | ) | |||||||||||||||||
| Total from Investment Operations | 4.94 | 1.49 | 1.15 | 4.96 | (7.32 | ) | |||||||||||||||||
| Distributions and Other: | |||||||||||||||||||||||
| Dividends (from net investment income)* | (.49 | ) | (.34 | ) | (.24 | ) | (.19 | ) | (.15 | ) | |||||||||||||
| Distributions (from capital gains)* | – | – | – | – | – | ||||||||||||||||||
| Tax return of capital* | – | – | – | – | (1) | – | |||||||||||||||||
| Redemption fees | – | – | – | – | – | ||||||||||||||||||
| Payment from affiliate | – | – | (2) | – | – | – | |||||||||||||||||
| Total Distributions and Other | (.49 | ) | (.34 | ) | (.24 | ) | (.19 | ) | (.15 | ) | |||||||||||||
| Net Asset Value, End of Period | $ | 32.30 | $ | 27.85 | $ | 26.70 | $ | 25.79 | $ | 21.02 | |||||||||||||
| Total Return | 17.92 | % | 5.63 | %(3) | 4.50 | % | 23.70 | % | (25.71 | )% | |||||||||||||
| Net Assets, End of Period (in thousands) | $ | 12 | $ | 10 | $ | 10 | $ | 9 | $ | 7 | |||||||||||||
| Average Net Assets for the Period (in thousands) | $ | 11 | $ | 10 | $ | 9 | $ | 8 | $ | 9 | |||||||||||||
| Ratio of Gross Expenses to Average Net Assets(4) | 0.86 | % | 0.86 | % | 0.91 | % | 0.96 | % | 0.95 | % | |||||||||||||
| Ratio of Net Expenses to Average Net Assets(4) | 0.86 | % | 0.85 | % | 0.91 | % | 0.96 | % | 0.95 | % | |||||||||||||
| Ratio of Net Investment Income/(Loss) to Average Net Assets | 1.26 | % | 1.12 | % | 0.74 | % | 0.80 | % | 0.64 | % | |||||||||||||
| Portfolio Turnover Rate | 46 | % | 41 | % | 120 | % | 126 | % | 73 | % | |||||||||||||
* See Note 3 in Notes to Financial Statements.
(1) Tax return of capital aggregated less than $.01 on a per share basis for the fiscal year ended.
(2) Payment from affiliate aggregated less than $.01 on a per share basis for the fiscal year ended.
(3) During the fiscal year ended, Janus Capital and/or Janus Services LLC fully reimbursed the Portfolio for a loss on a transaction resulting from certain trading, pricing and/or shareholder activity errors, which otherwise would have reduced total return by 0.02%.
(4) See Note 4 in Notes to Financial Statements.
See Notes to Financial Statements.
Janus Aspen Series December 31, 2006 13
Notes to Schedule of Investments
| Lipper Variable Annuity Global Funds | Funds that invest at least 25% of their portfolio in securities traded outside of the United States and that may own U.S. securities as well. | ||||||
| Morgan Stanley Capital International World IndexSM | Is a market capitalization weighted index composed of companies representative of the market structure of Developed Market countries in North America, Europe and the Asia/Pacific Region. | ||||||
| ADR | American Depositary Receipt | ||||||
| PLC | Public Limited Company | ||||||
| U.S. Shares | Securities of foreign companies trading on an American Stock Exchange. | ||||||
* Non-income-producing security.
# Loaned security; a portion or all of the security is on loan at December 31, 2006.
† The security is purchased with the cash collateral received from securities on loan (Note 1).
14 Janus Aspen Series December 31, 2006
Notes to Financial Statements
The following section describes the organization and significant accounting policies and provides more detailed information about the schedules and tables that appear throughout this report. In addition, the Notes to Financial Statements explain the methods used in preparing and presenting this report.
1. ORGANIZATION AND SIGNIFICANT ACCOUNTING POLICIES
Janus Aspen Worldwide Growth Portfolio (the "Portfolio") is a series fund. The Portfolio is part of Janus Aspen Series (the "Trust"), which is organized as a Delaware statutory trust and is registered under the Investment Company Act of 1940 (the "1940 Act") as an open-end management investment company. The Trust offers seventeen Portfolios, which include multiple series of shares, with differing investment objectives and policies. The Portfolio invests primarily in equity securities. The Portfolio is classified as diversified, as defined in the 1940 Act. The Portfolio is a no-load investment.
The Portfolio currently offers three classes of shares: Institutional Shares, Service Shares and Service II Shares. Institutional Shares are offered only in connection with investment in and payments under variable insurance contracts and to qualified retirement plans. Service Shares and Service II Shares are offered only in connection with investment in and payments under variable insurance contracts and to qualified retirement plans that require a fee from Portfolio assets to procure distribution and administrative services to contract owners and plan participants. For Service II Shares, a redemption fee may be imposed on interests in separate accounts or plans held 60 days or less.
Janus Capital Management LLC ("Janus Capital") invested initial seed capital in the amount of $10,000 for the Portfolio - Service II Shares on December 31, 2001.
The following accounting policies have been consistently followed by the Portfolio and are in conformity with accounting principles generally accepted in the United States of America in the investment company industry.
Investment Valuation
Securities are valued at the last sales price or the official closing price for securities traded on a principal securities exchange (U.S. or foreign) and on the NASDAQ National Market. Securities traded on over-the-counter markets and listed securities for which no sales are reported are valued at the latest bid price (or yield equivalent thereof) obtained from one or more dealers transacting in a market for such securities or by a pricing service approved by the Portfolio's Trustees. Short-term securities with maturities of 60 days or less may be valued at amortized cost, which approximates market value. Debt securities with a remaining maturity of greater than 60 days are valued in accordance with the evaluated bid price supplied by the pricing service. The evaluated bid price supplied by the pricing service is an evaluation that reflects such factors as security pric es, yields, maturities and ratings. Foreign securities and currencies are converted to U.S. dollars using the applicable exchange rate in effect as of the daily close of the New York Stock Exchange ("NYSE"). When market quotations are not readily available or deemed unreliable, or events or circumstances that may affect the value of portfolio securities held by the Portfolio are identified between the closing of their principal markets and the time the net asset value ("NAV") is determined, securities may be valued at fair value as determined in good faith under procedures established by and under the supervision of the Portfolio's Trustees. The Portfolio may use a systematic fair valuation model provided by an independent third party to value international equity securities in order to adjust for stale pricing, which may occur between the close of certain foreign exchanges and the NYSE.
Investment Transactions and Investment Income
Investment transactions are accounted for as of the date purchased or sold (trade date). Dividend income is recorded on the ex-dividend date. Certain dividends from foreign securities will be recorded as soon as the Trust is informed of the dividend if such information is obtained subsequent to the ex-dividend date and may be subject to withholding taxes in these jurisdictions. Interest income is recorded on the accrual basis and includes amortization of premiums and accretion of discounts. Gains and losses are determined on the identified cost basis, which is the same basis used for federal income tax purposes. Income, as well as gains and losses, both realized and unrealized, are allocated daily to each class of shares based upon the ratio of net assets represented by each class as a percentage of total net assets.
Expenses
The Portfolio bears expenses incurred specifically on its behalf as well as a portion of general expenses. Each class of shares bears expenses incurred specifically on its behalf and, in addition, each class bears a portion of general expenses, which may be based upon relative net assets of each class. Expenses are allocated daily to each class of shares based upon the ratio of net assets represented by each class as a percentage of total net assets. Expenses directly attributable to a specific class of shares are charged against the operations of such class.
Securities Lending
Under procedures adopted by the Trustees, the Portfolio may lend securities to qualified parties (typically brokers or other financial institutions) who need to borrow securities in order to complete certain transactions such as covering short sales, avoiding failures to deliver securities or completing arbitrage activities. The Portfolio may seek to earn additional income through securities lending. There is the risk of delay in recovering a loaned security or the risk of loss in collateral
Janus Aspen Series December 31, 2006 15
Notes to Financial Statements (continued)
rights if the borrower fails financially. In addition, Janus Capital makes efforts to balance the benefits and risks from granting such loans.
The Portfolio does not have the right to vote on securities while they are being lent; however, the Portfolio may attempt to call back the loan and vote the proxy. All loans will be continuously secured by collateral which may consist of cash, U.S. Government securities, domestic and foreign short-term debt instruments, letters of credit, money market mutual funds or other money market accounts, or such other collateral permitted by the Securities and Exchange Commission ("SEC"). Cash collateral may be invested in affiliated money market funds or other accounts advised by Janus Capital to the extent consistent with exemptive relief obtained from the SEC or as permitted by the 1940 Act and rules promulgated thereunder. Cash collateral may also be invested in unaffiliated money market funds or other accounts advised by Janus Capital to the extent consistent with exemptive relief obtained from the SEC or as permitted by the 1940 Act and rules p romulgated thereunder. Cash collateral may also be invested in unaffiliated money market funds or other accounts.
State Street Bank and Trust Company (the "Lending Agent") may also invest the cash collateral in the State Street Navigator Securities Lending Prime Portfolio or investments in unaffiliated money market funds or accounts, mutually agreed to by the Portfolio and the Lending Agent, that comply with Rule 2a-7 under the 1940 Act relating to money market funds.
As of December 31, 2006, the Portfolio had on loan securities valued as indicated:
| Portfolio | Value at December 31, 2006 | ||||||
| Janus Aspen Worldwide Growth Portfolio | $ | 46,114,818 | |||||
As of December 31, 2006, the Portfolio received cash collateral for securities lending activity as indicated:
| Portfolio | Cash Collateral at December 31, 2006 | ||||||
| Janus Aspen Worldwide Growth Portfolio | $ | 47,464,006 | |||||
As of December 31, 2006, all cash collateral received by the Portfolio was invested in the State Street Navigator Securities Lending Prime Portfolio.
The value of the collateral must be at least 102% of the market value of the loaned securities that are denominated in U.S. dollars and 105% of the market value of the loaned securities that are not denominated in U.S. dollars. Loaned securities and related collateral are marked-to-market each business day based upon the market value of the respective securities at the close of business, employing the most recent available pricing information. Collateral levels are then adjusted based upon this mark-to-market evaluation.
The borrower pays fees at the Portfolio's direction to its Lending Agent. The Lending Agent may retain a portion of the interest earned. The cash collateral invested by the Lending Agent is disclosed in the Schedule of Investments. The lending fees and the Portfolio's portion of the interest income earned on cash collateral are included on the Statement of Operations (if applicable).
Interfund Lending
Pursuant to an exemptive order received from the SEC, the Portfolio may be party to an interfund lending agreement between the Portfolio and other Janus Capital sponsored mutual funds, which permits it to borrow or lend cash at a rate beneficial to both the borrowing and lending funds. Outstanding borrowings from all sources totaling 10% or more of the borrowing Portfolio's total assets must be collateralized at 102% of the outstanding principal value of the loan; loans of less than 10% may be unsecured. During the fiscal year ended December 31, 2006, there were no outstanding interfund borrowing or lending arrangements for the Portfolio.
Forward Currency Transactions
The Portfolio may enter into forward currency contracts in order to reduce its exposure to changes in foreign currency exchange rates on its foreign portfolio holdings and to lock in the U.S. dollar cost of firm purchase and sale commitments for securities denominated in or exposed to foreign currencies. A forward currency exchange contract is a commitment to purchase or sell a foreign currency at a future date at a negotiated rate. The gain or loss arising from the difference between the U.S. dollar cost of the original contract and the value of the foreign currency in U.S. dollars upon closing a contract is included in "Net realized gain/(loss) from foreign currency transactions" on the Statement of Operations (if applicable).
Forward currency contracts held by the Portfolio are fully collateralized by other securities, which are denoted in the accompanying Schedule of Investments (if applicable). The collateral is evaluated daily to ensure its market value equals or exceeds the current market value of the corresponding forward currency contracts. As of December 31, 2006, the Portfolio was not invested in forward currency contracts.
Futures Contracts
The Portfolio may enter into futures contracts. The Portfolio intends to use such derivative instruments primarily to hedge or protect from adverse movements in securities prices, currency rates or interest rates. The use of futures contracts may involve risks such as the possibility of illiquid markets or imperfect correlation between the value of the contracts and the underlying securities, or that the counterparty will fail to perform its obligations.
16 Janus Aspen Series December 31, 2006
Futures contracts are marked-to-market daily, and the daily variation margin is recorded as a receivable or payable on the Statement of Assets and Liabilities (if applicable). When a contract is closed, a realized gain or loss is recorded on the Statement of Operations equal to the difference between the opening and closing value of the contract. Generally, futures contracts are marked-to-market (i.e., treated as realized and subject to distribution) for federal income tax purposes at fiscal year end. Securities designated as collateral for market value on futures contracts are noted in the Schedule of Investments. Such collateral is in the possession of the Portfolio's custodian. As of December 31, 2006, the Portfolio was not invested in futures contracts.
Short Sales
The Portfolio may engage in "short sales against the box." Short sales against the box involve selling either a security that the Portfolio owns, or a security equivalent in kind and amount to the security sold short that the Portfolio has the right to obtain, for delivery at a specified date in the future. The Portfolio may enter into a short sale against the box to hedge against anticipated declines in the market price of portfolio securities. If the value of the securities sold short increases prior to the scheduled delivery date, the Portfolio loses the opportunity to participate in the gain.
The Portfolio may also engage in "naked" short sales. Naked short sales involve the Portfolio selling a security it does not own to a purchaser at a specified price. To complete the transaction, the Portfolio must borrow the security to deliver it to the purchaser and buy that same security in the market to return it to the lender. Although the potential for gain is limited to the difference between the price at which the Portfolio sold the security short and the cost of borrowing the security, its potential for loss could be unlimited because there is no limit to the replacement cost of the borrowed security. There is no assurance that the Portfolio will be able to close out a short position at any particular time or at an acceptable price. A gain or a loss will be recognized upon termination of a short sale. There is no limit on the size of any loss that the Portfolio may recognize upon termination of a short sale. Short sales held by the Portfolio are fully collateralized by other securities, which are denoted in the accompanying Schedule of Investments (if applicable). As of December 31, 2006, the Portfolio was not invested in short sales.
Foreign Currency Translations
The Portfolio does not isolate that portion of the results of operations resulting from changes in foreign exchange rates on investments from the fluctuations arising from changes in market prices of securities held at the date of the financial statements. Net unrealized appreciation or depreciation on investments and foreign currency translation arise from changes in the value of assets and liabilities, including investments in securities held at the date of the financial statements, resulting from changes in the exchange rates and changes in market prices of securities held.
Currency gains and losses are also calculated on payables and receivables that are denominated in foreign currencies. The payables and receivables are generally related to security transactions and income.
Foreign currency-denominated assets and forward currency contracts may involve more risks than domestic transactions, including currency risk, political and economic risk, regulatory risk and market risk. Risks may arise from the potential inability of a counterparty to meet the terms of a contract and from unanticipated movements in the value of foreign currencies relative to the U.S. dollar.
When-issued Securities
The Portfolio may purchase or sell securities on a when-issued or forward commitment basis. The price of the underlying securities and date when the securities will be delivered and paid for are fixed at the time the transaction is negotiated. Losses may arise due to changes in the market value of the securities or from the inability of counterparties to meet the terms of the contract. In connection with such purchases, the Portfolio may hold liquid assets as collateral with the Portfolio's custodian sufficient to cover the purchase price. As of December 31, 2006, the Portfolio was not invested in when-issued securities.
Equity-Linked Structured Notes
The Portfolio may invest in equity-linked structured notes. Equity-linked structured notes are derivative securities which are specially designed to combine the characteristics of one or more underlying securities and their equity derivatives in a single note form. The return and/or yield or income component may be based on the performance of the underlying equity securities, an equity index, and/or option positions. Equity-linked structured notes are typically offered in limited transactions by financial institutions in either registered or nonregistered form. An investment in equity-linked structured notes creates exposure to the credit risk of the issuing financial institution, as well as to the market risk of the underlying securities. There is no guaranteed return of principal with these securities and the appreciation potential of these securities may be limited by a maximum payment or call right. In certain cases, equity-linked struct ured notes may be more volatile and less liquid than less complex securities or other types of fixed-income securities. Such securities may exhibit price behavior that does not correlate with other fixed-income securities. As of December 31, 2006, the Portfolio was not invested in equity-linked structured notes.
Initial Public Offerings
The Portfolio may invest in initial public offerings ("IPOs"). IPOs and other investment techniques may have a magnified performance impact on a fund with a small asset base. The
Janus Aspen Series December 31, 2006 17
Notes to Financial Statements (continued)
Portfolio may not experience similar performance as its assets grow.
Additional Investment Risk
The Portfolio may be invested in lower-rated debt securities that have a higher risk of default or loss of value since these securities may be sensitive to economic changes, political changes or adverse developments specific to the issuer.
Restricted Security Transactions
Restricted securities held by the Portfolio may not be sold except in exempt transactions or in a public offering registered under the Securities Act of 1933. The risk of investing in such securities is generally greater than the risk of investing in the securities of widely held, publicly traded companies. Lack of a secondary market and resale restrictions may result in the inability of the Portfolio to sell a security at a fair price and may substantially delay the sale of the security. In addition, these securities may exhibit greater price volatility than securities for which secondary markets exist.
Dividend Distributions
The Portfolio generally makes semiannual distributions of substantially all of its investment income and an annual distribution of its net realized capital gains (if any). The majority of dividends and net realized capital gains distributions from the Portfolio may be automatically reinvested into additional shares of the Portfolio, based upon the discretion of the shareholder.
Estimates
The preparation of financial statements in conformity with accounting principles generally accepted in the United States of America requires management to make estimates and assumptions that affect the reported amount of assets and liabilities and disclosure of contingent assets and liabilities at the date of the financial statements and the reported amounts of income and expenses during the reporting period. Actual results could differ from those estimates.
Federal Income Taxes
No provision for income taxes is included in the accompanying financial statements, as the Portfolio intends to distribute to shareholders all taxable investment income and realized gains and otherwise comply with Subchapter M of the Internal Revenue Code applicable to regulated investment companies.
New Accounting Pronouncements
In July 2006, the Financial Accounting Standards Board ("FASB") issued Interpretation No. 48, "Accounting for Uncertainty in Income Taxes – an Interpretation of FASB Statement No. 109" (the "Interpretation"). The Interpretation establishes for all entities, including pass-through entities such as the Portfolio, a minimum threshold for financial statement recognition of the benefit of positions taken in filing tax returns (including whether an entity is taxable in a particular jurisdiction), and requires certain expanded tax disclosures. A calendar year open-end or closed-end fund would implement the Interpretation no later than June 29, 2007 (the last business day of the semi-annual reporting period) and will also apply to all open tax years as of the date of effectiveness. Management has recently begun to evaluate the application of the Interpretation to the Portfo lio, and is not in a position at this time to estimate the significance of its impact, if any, on the Portfolio's financial statements.
In September 2006, the FASB issued Statement of Financial Accounting Standards No. 157, "Fair Value Measurements" ("SFAS No. 157"), which defines fair value, establishes a framework for measuring fair value in generally accepted accounting principles, and expands disclosures about fair value measurements. SFAS No. 157 does not require new fair value measurements, but is applied to the extent that other accounting pronouncements require or permit fair value measurements. SFAS No. 157 emphasizes that fair value is a market-based measurement that should be determined based on the assumptions that market participants would use in pricing an asset or liability. Companies will be required to disclose the extent to which fair value is used to measure assets and liabilities, the inputs used to develop the measurements, and the effect for fiscal years beginning after November 15, 2007. Management is currently evaluating the potential impact the adopt ion of SFAS No. 157 will have on the Portfolio's financial condition and results of operations.
2. INVESTMENT ADVISORY AGREEMENTS AND OTHER TRANSACTIONS WITH AFFILIATES
The Portfolio pays a monthly advisory fee to Janus Capital based upon average daily net assets and calculated at the annual rate of 0.60%.
Effective February 1, 2006, the investment advisory fee rate changed from a fixed rate to a rate that adjusts upward or downward based upon the Portfolio's performance relative to a selected benchmark index. This change does not impact the current investment advisory fee until one year after the effective date when the performance adjustment takes effect.
Effective for the period from July 1, 2006 through January 31, 2007 ("Waiver Period"), Janus Capital has contractually agreed to waive its right to receive a portion of the advisory fee, at the annual rate of up to 0.15% of average daily net assets, under certain conditions. This waiver will apply for any calendar month in the Waiver Period if the Portfolio's performance for the period from February 1, 2006 through the end of the preceding calendar month, calculated as though there had been no waiver of the advisory fee, is less than benchmark performance for that period. The Portfolio is not required to repay any such waived fees in future years to Janus Capital.
Janus Services LLC ("Janus Services"), a wholly-owned subsidiary of Janus Capital, is the Portfolio's transfer agent. Janus Services receives certain out-of-pocket expenses for transfer agent services.
18 Janus Aspen Series December 31, 2006
Certain officers of the Portfolio may also be officers and/or directors of Janus Capital. Such officers receive no compensation from the Portfolio, except for the Portfolio's Chief Compliance Officer. Effective January 1, 2006, the Portfolio began reimbursing the adviser for a portion of the compensation paid to the Chief Compliance Officer of the Trust. Total compensation of $2,376 was paid by the Portfolio during the fiscal year ended December 31, 2006. The Portfolio's portion is reported as part of "Other Expenses" on the Statement of Operations.
The Board of Trustees has adopted a deferred compensation plan (the "Deferred Plan") for independent Trustees to elect to defer receipt of all or a portion of the annual compensation they are entitled to receive from the Portfolio. All deferred fees are credited to an account established in the name of the Trustees. The amounts credited to the account then increase or decrease, as the case may be, in accordance with the performance of one or more of the Janus funds that are selected by the Trustees. The account balance continues to fluctuate in accordance with the performance of the selected fund or funds until final payment of all amounts credited to the account. Trustees are allowed to change their designation of mutual funds from time to time. Amounts will be deferred until distributed in accordance to the Deferred Plan. No deferred fees were paid to any Trustee under the Deferred Plan during the fiscal year ended December 31, 2006.
A 1.00% redemption fee may be imposed on Service II Shares of the Portfolio held for 60 days or less. This fee is paid to the Portfolio rather than Janus Capital, and is designed to deter excessive short-term trading and to offset the brokerage commissions, market impact, and other costs associated with changes in the Portfolio's asset level and cash flow due to short-term money movements in and out of the Portfolio. The redemption fee is accounted for as an addition to Paid-in Capital. No redemption fees were received by the Portfolio for the fiscal year ended December 31, 2006.
During the fiscal year ended December 31, 2006, Janus Services reimbursed the Portfolio $22 for Institutional Shares, as a result of dilutions caused by incorrectly processed shareholder activity. Reimbursements are included in "Payment from affiliate" on the Statements of Changes in Net Assets.
During the fiscal year ended December 31, 2005, Janus Capital reimbursed the Portfolio $298,234 for Institutional Shares, $36,790 for Service Shares and $2 for Service II Shares, as a result of dilutions caused by certain trading and/or pricing errors. Reimbursements are included in "Payment from affiliate" on the Statements of Changes in Net Assets.
During the fiscal year ended December 31, 2005, Janus Services reimbursed the Portfolio $642 for Institutional Shares, as a result of dilutions caused by incorrectly processed shareholder activity. Reimbursements are included in "Payment from affiliate" on the Statements of Changes in Net Assets.
For the fiscal year ended December 31, 2006, Janus Capital assumed $21,288 of legal, consulting and Trustee costs and fees incurred by the funds in Janus Investment Fund, Janus Aspen Series and Janus Adviser Series (the "Funds") in connection with the regulatory and civil litigation matters discussed in Note 7. These non-recurring costs were allocated to all Funds based upon the Funds' respective net assets as of July 31, 2004. Additionally, all future non-recurring costs will be allocated based upon the Funds' respective net assets on July 31, 2004. These non-recurring costs and costs assumed by Janus Capital are shown on the Statement of Operations.
Janus Distributors LLC, a wholly-owned subsidiary of Janus Capital, is a distributor of the Portfolio. Service Shares and Service II Shares have adopted a Distribution and Shareholder Servicing Plan (the "Plan") pursuant to Rule 12b-1 under The 1940 Act. The Plan authorizes payments by the Portfolio in connection with the distribution of Service Shares and Service II Shares at an annual rate of up to 0.25% of Service Shares' average daily net assets.
The Portfolio's expenses may be reduced by expense offsets from an unaffiliated custodian and/or transfer agent. Such credits or offsets are included in Expense and Fee Offset on the Statement of Operations. The transfer agent fee offsets received during the period reduce Transfer Agent Fees and Expenses. Custodian offsets received reduce Custodian Fees. The Portfolio could have employed the assets used by the custodian and/or transfer agent to produce income if it had not entered into an expense offset arrangement.
The Portfolio may invest in money market funds, including funds managed by Janus Capital. During the fiscal year ended December 31, 2006, the Portfolio recorded distributions from affiliated investment companies as affiliated dividend income, and had the following affiliated purchases and sales:
| Purchases Shares/Cost | Sales Shares/Cost | Dividend Income | Value at 12/31/06 | ||||||||||||||||
| Janus Aspen Worldwide Growth Portfolio | |||||||||||||||||||
| Janus Government Money Market Fund | $ | 9,039,860 | $ | 9,039,860 | $ | 3,536 | $ | – | |||||||||||
| Janus Institutional Cash Reserves Fund | 169,422,197 | 159,538,302 | 151,072 | 9,883,895 | |||||||||||||||
| Janus Money Market Fund | 59,256,802 | 59,256,802 | 123,477 | – | |||||||||||||||
| $ | 237,718,859 | $ | 227,834,964 | $ | 278,085 | $ | 9,883,895 | ||||||||||||
Janus Aspen Series December 31, 2006 19
Notes to Financial Statements (continued)
3. FEDERAL INCOME TAX
The tax components of capital shown in the table below represent: (1) distribution requirements the Portfolio must satisfy under the income tax regulations; (2) losses or deductions the Portfolio may be able to offset against income and gains realized in future years; and (3) unrealized appreciation or depreciation of investments for federal income tax purposes.
Other book to tax differences in the current year primarily consist of foreign currency contract adjustments. The Portfolio has elected to treat gains and losses on forward foreign currency contracts as capital gains and losses. Other foreign currency gains and losses on debt instruments are treated as ordinary income for federal income tax purposes pursuant to Section 988 of the Internal Revenue Code.
Accumulated capital losses noted below represent net capital loss carryovers, as of December 31, 2006, that may be available to offset future realized capital gains and thereby reduce future taxable gains distributions.
| Portfolio | Undistributed Ordinary Income | Undistributed Long-Term Gains | Accumulated Capital Losses | Post October Deferral | Other Book to Tax Differences | Net Tax Appreciation/ (Depreciation) | |||||||||||||||||||||
| Janus Aspen Worldwide Growth Portfolio | $ | 2,195,685 | $ | – | $ | (1,786,185,299 | ) | $ | – | $ | 14,177 | $ | 269,738,036 | ||||||||||||||
The table below shows the expiration dates of the carryovers.
Capital Loss Carryover Expiration Schedule
For the year ended December 31, 2006
| Portfolio | December 31, 2009 | December 31, 2010 | December 31, 2011 | ||||||||||||
| Janus Aspen Worldwide Growth Portfolio | $ | (543,535,782 | ) | $ | (989,588,014 | ) | $ | (253,061,503 | ) | ||||||
During the year ended December 31, 2006, the following capital loss carryover was utilized by the Portfolio as indicated in the table below.
| Portfolio | Capital Loss Carryover Utilized | ||||||
| Janus Aspen Worldwide Growth Portfolio | $ | 169,791,339 | |||||
The aggregate cost of investments and the composition of unrealized appreciation and depreciation of investment securities for federal income tax purposes as of December 31, 2006 are noted below.
Unrealized appreciation and unrealized depreciation in the table below exclude appreciation/depreciation on foreign currency translations. The primary difference between book and tax appreciation or depreciation of investments is wash sale loss deferrals.
| Portfolio | Federal Tax Cost | Unrealized Appreciation | Unrealized (Depreciation) | ||||||||||||
| Janus Aspen Worldwide Growth Portfolio | $ | 1,196,734,378 | $ | 306,534,350 | $ | (36,796,314 | ) | ||||||||
Income and capital gains distributions are determined in accordance with income tax regulations that may differ from accounting principles generally accepted in the United States of America. These differences are due to differing treatments for items such as net short-term gains, deferral of wash sale losses, foreign currency transactions, net investment losses and capital loss carryovers. Certain permanent differences such as tax returns of capital and net investment losses noted below have been reclassified to paid-in capital.
| For the fiscal year ended December 31, 2006 | Distributions | ||||||||||||||||||
| Portfolio | From Ordinary Income | From Long-Term Capital Gains | Tax Return of Capital | Net Investment Loss | |||||||||||||||
| Janus Aspen Worldwide Growth Portfolio | $ | 23,712,881 | $ | – | $ | – | $ | – | |||||||||||
| For the fiscal year ended December 31, 2005 | Distributions | ||||||||||||||||||
| Portfolio | From Ordinary Income | From Long-Term Capital Gains | Tax Return of Capital | Net Investment Loss | |||||||||||||||
| Janus Aspen Worldwide Growth Portfolio | $ | 23,178,340 | $ | – | $ | – | $ | – | |||||||||||
20 Janus Aspen Series December 31, 2006
4. EXPENSE RATIOS
The expense ratios listed in the Financial Highlights reflect expenses prior to any expense offsets (gross expense ratio) and after expense offsets (net expense ratio). Both expense ratios reflect expenses after waivers (reimbursement). Listed below are the gross expense ratios for the Portfolio that would be in effect, absent the waiver of certain fees and offsets.
| For the fiscal year ended December 31, 2006 Portfolio | Institutional Shares | Service Shares | Service II Shares | ||||||||||||
| Janus Aspen Worldwide Growth Portfolio | 0.64 | %(1) | 0.90 | %(1) | 0.90 | %(1) | |||||||||
(1) The effect of non-recurring costs assumed by Janus Capital (Note 2) is included in the ratio of operating expenses to average net assets without waivers and/or expense reimbursements and was less than 0.01%.
5. CAPITAL SHARE TRANSACTIONS
| For the fiscal year ended December 31 | Janus Aspen Worldwide Growth Portfolio | ||||||||||
| (all numbers are in thousands) | 2006 | 2005 | |||||||||
| Transactions in Portfolio Shares – Institutional Shares: | |||||||||||
| Shares sold | 884 | 959 | |||||||||
| Reinvested dividends and distributions | 701 | 779 | |||||||||
| Shares repurchased | (16,761 | ) | (42,416 | ) | |||||||
| Net Increase/(Decrease) in Portfolio Shares | (15,176 | ) | (40,678 | ) | |||||||
| Shares Outstanding, Beginning of Period | 52,378 | 93,056 | |||||||||
| Shares Outstanding, End of Period | 37,202 | 52,378 | |||||||||
| Transactions in Portfolio Shares – Service Shares: | |||||||||||
| Shares sold | 683 | 921 | |||||||||
| Reinvested dividends and distributions | 108 | 90 | |||||||||
| Shares repurchased | (1,527 | ) | (2,624 | ) | |||||||
| Net Increase/(Decrease) in Portfolio Shares | (736 | ) | (1,613 | ) | |||||||
| Shares Outstanding, Beginning of Period | 7,253 | 8,866 | |||||||||
| Shares Outstanding, End of Period | 6,517 | 7,253 | |||||||||
| Transactions in Portfolio Shares – Service II Shares(1): | |||||||||||
| Shares sold | – | – | |||||||||
| Reinvested dividends and distributions | 6 | 4 | |||||||||
| Shares repurchased | – | – | |||||||||
| Net Increase/(Decrease) in Portfolio Shares | 6 | 4 | |||||||||
| Shares Outstanding, Beginning of Period | 364 | 360 | |||||||||
| Shares Outstanding, End of Period | 370 | 364 | |||||||||
(1) Transactions in Portfolio Shares - Service II Shares are not in thousands.
6. PURCHASES AND SALES OF INVESTMENT SECURITIES
For the fiscal year ended December 31, 2006, the aggregate cost of purchases and proceeds from sales of investment securities (excluding short-term securities) were as follows:
| Portfolio | Purchases of Securities | Proceeds from Sales of Securities | Purchases of Long-Term U.S. Government Obligations | Proceeds from Sales of Long-Term U.S. Government Obligations | |||||||||||||||
| Janus Aspen Worldwide Growth Portfolio | $ | 660,177,276 | $ | 1,009,930,014 | $ | – | $ | – | |||||||||||
Janus Aspen Series December 31, 2006 21
Notes to Financial Statements (continued)
7. PENDING LEGAL MATTERS
In the fall of 2003, the Securities and Exchange Commission ("SEC"), the Office of the New York State Attorney General ("NYAG"), the Colorado Attorney General ("COAG"), and the Colorado Division of Securities ("CDS") announced that they were investigating alleged frequent trading practices in the mutual fund industry. On August 18, 2004, Janus Capital announced that it had reached final settlements with the SEC, the NYAG, the COAG, and the CDS related to such regulators' investigations into Janus Capital's frequent trading arrangements.
A number of civil lawsuits were brought against Janus Capital and certain of its affiliates, the Janus funds, and related entities and individuals based on allegations similar to those announced by the above regulators and were filed in several state and federal jurisdictions. Such lawsuits alleged a variety of theories for recovery including, but not limited to, the federal securities laws, other federal statutes (including ERISA), and various common law doctrines. The Judicial Panel on Multidistrict Litigation transferred these actions to the U.S. District Court for the District of Maryland (the "Court") for coordinated proceedings. On September 29, 2004, five consolidated amended complaints were filed with the Court that generally include: (i) claims by a putative class of investors in certain Janus funds asserting claims on behalf of the investor class (Marini, et al. v. Janus Investment Fund, et al., U.S. District Court, District of Maryland, Case No. 04-CV-00497); (ii) derivative claims by investors in certain Janus funds ostensibly on behalf of such funds (Steinberg et al. v. Janus Capital Management, LLC et al., U.S. District Court, District of Maryland, Case No. 04-CV-00518); (iii) claims on behalf of participants in the Janus 401(k) plan (Wangberger v. Janus Capital Group Inc., 401(k) Advisory Committee, et al., U.S. District Court, District of Maryland, Case No. JFM-05-2711); (iv) claims brought on behalf of shareholders of Janus Capital Group Inc. ("JCGI") on a derivative basis against the Board of Directors of JCGI (Chasen v. Whiston, et al., U.S. District Court, District of Maryland, Case No. 04-MD-00855); and (v) claims by a putative class of shareholders of JCGI asserting claims on behalf of the shareholders (Wiggins, et al. v. Janus Capital Group, Inc., et al., U.S. District Court, District of Maryland, Case No. 04-CV-00818). In addition, the following were also named as defendants in one or more of the actions: Janus Investment Fund ("JIF"), Janus Aspen Series ("JAS"), Janus Adviser Series ("JAD"), Janus Distributors LLC, Enhanced Investment Technologies, LLC ("INTECH"), Bay Isle Financial LLC ("Bay Isle"), Perkins, Wolf , McDonnell and Company, LLC ("Perkins"), the Advisory Committee of the Janus 401(k) plan, and the current or former directors of JCGI.
On August 25, 2005, the Court entered orders dismissing most of the claims asserted against Janus Capital and its affiliates by fund investors (actions (i) and (ii) described above), except certain claims under Section 10(b) of the Securities Exchange Act of 1934 and under Section 36(b) of the Investment Company Act of 1940, as amended (the "1940 Act"). On August 15, 2006, the complaint in the 401(k) plan class action (action (iii) described above) was dismissed by the district court with prejudice; the plaintiff has appealed that dismissal decision to the United States Court of Appeals for the Fourth Circuit. The Court also dismissed the action against JCGI's Board of Directors without leave to amend (action (iv) described above). Finally, a Motion to Dismiss the action brought by JCGI shareholders (action (v) described above) is fully briefed and pending before the Cou rt.
In addition to the lawsuits described above, the Auditor of the State of West Virginia ("Auditor"), in his capacity as securities commissioner, has initiated administrative proceedings against many of the defendants in the market timing cases (including JCGI and Janus Capital) and, as a part of its relief, is seeking disgorgement and other monetary relief based on similar market timing allegations (In the Matter of Janus Capital Group Inc. et al., Before the Securities Commissioner, State of West Virginia, Summary Order No. 05-1320). The respondents in these proceedings collectively sought a Writ of Prohibition in state court, which was denied. Their subsequent Petition for Appeal was also denied. Consequently, in September 2006, JCGI and Janus Capital filed their answer to the A uditor's summary order instituting proceedings and requested a hearing. JCGI and Janus Capital, as well as other similarly situated defendants, continue to challenge the statutory authority of the Auditor to bring such an action. No further proceedings are currently scheduled.
In addition to the "market timing" actions described above, Janus Capital is a defendant in a consolidated lawsuit in the U.S. District Court for the District of Colorado challenging the investment advisory fees charged by Janus Capital to certain Janus funds (Walter Sins, et al. v. Janus Capital Management LLC, U.S. District Court, District of Colorado, Case No. 04-CV-01647-WDM-MEH; Michael Fleisher, et al. v. Janus Capital Management, LLC, 04-CV-02395-MSK-CBS). The action was filed in 2004 by fund investors asserting breach of fiduciary duty under Section 36(b) of the 1940 Act. The plaintiffs seek declaratory and injunctive relief and an unspecified amount of damages. The trial is scheduled to commence on May 21, 2007.
In 2001, Janus Capital's predecessor was also named as a defendant in a class action suit in the U.S. District Court for the Southern District of New York, alleging that certain underwriting firms and institutional investors violated antitrust laws in connection with initial public offerings (Pfeiffer v. Credit Suisse First Boston aka In re Initial Public Offering Antitrust Litigation, U.S. District Court, Southern District of New York, Case No. 01-CV-2014). The U.S. District Court dismissed the plaintiff's antitrust claims in November 2003; however, the U.S. Court of Appeals vacated that decision and remanded it for further proceedings. In Marc h 2006, the defendants, including Janus Capital, filed a Petition for a Writ of Certiorari with the U.S. Supreme Court to review the decision of the U.S. Court of Appeals. In June 2006, the U.S. Supreme Court invited the U.S. Solicitor General to file a brief expressing the view of the United States, and in November 2006, the Solicitor General filed a brief expressing its view on the matter. The U.S. Supreme Court has granted the Petition for a Writ of Certiorari and the parties are in the process of briefing the matter for the U.S. Supreme Court.
Additional lawsuits may be filed against certain of the Janus funds, Janus Capital, and related parties in the future. Janus Capital does not currently believe that these pending actions will materially affect its ability to continue providing services it has agreed to provide to the Janus funds.
22 Janus Aspen Series December 31, 2006
Report of Independent Registered Public Accounting Firm
To the Trustees and Shareholders
of Janus Aspen Worldwide Growth Portfolio
In our opinion, the accompanying statement of assets and liabilities, including the schedule of investments, and the related statements of operations and of changes in net assets and the financial highlights present fairly, in all material respects, the financial position of Janus Aspen Worldwide Growth Portfolio (one of the portfolios constituting Janus Aspen Series, hereafter referred to as the "Portfolio") at December 31, 2006, the results of its operations for the year then ended, the changes in its net assets for each of the two years in the period then ended, and the financial highlights for each of the five years in the period then ended, in conformity with accounting principles generally accepted in the United States of America. These financial statements and financial highlights (hereafter referred to as "financial statements") are the responsibility of the Portfolio's management; our responsibility is to express an opinion on these financial statements based on our audits. We conducted our audits of these financial statements in accordance with the standards of the Public Company Accounting Oversight Board (United States). Those standards require that we plan and perform the audit to obtain reasonable assurance about whether the financial statements are free of material misstatement. An audit includes examining, on a test basis, evidence supporting the amounts and disclosures in the financial statements, assessing the accounting principles used and significant estimates made by management, and evaluating the overall financial statement presentation. We believe that our audits, which included confirmation of securities at December 31, 2006 by correspondence with the custodian, transfer agent and brokers, and the application of alternative auditing procedures where securities purchased had not been received, provide a reasonable basis for our opinion.

PricewaterhouseCoopers LLP
Denver, Colorado
February 12, 2007
Janus Aspen Series December 31, 2006 23
Additional Information (unaudited)
PROXY VOTING POLICIES AND VOTING RECORD
A description of the policies and procedures that the Portfolio uses to determine how to vote proxies relating to its portfolio securities is available: (i) without charge, upon request, by calling 1-800-525-0020 (toll free); (ii) on the Portfolio's website at www.janus.com/proxyvoting; and (iii) on the SEC's website at http://www.sec.gov. Additionally, information regarding the Portfolio's proxy voting record for the most recent twelve-month period ended June 30 is also available, free of charge, through www.janus.com/proxyvoting and from the SEC's website at http://www.sec.gov.
QUARTERLY PORTFOLIO HOLDINGS
The Portfolio files its complete portfolio holdings (schedule of investments) with the SEC for the first and third quarters of each fiscal year on Form N-Q within 60 days of the end of such fiscal quarter. The Portfolio's Form N-Q: (i) is available on the SEC's website at http://www.sec.gov; (ii) may be reviewed and copied at the SEC's Public Reference Room in Washington, D.C. (information on the Public Reference Room may be obtained by calling 1-800-SEC-0330); and (iii) is available without charge, upon request, by calling Janus at 1-800-525-0020 (toll free).
APPROVAL OF ADVISORY AGREEMENTS DURING THE PERIOD
The Trustees of Janus Aspen Series, more than eighty-five percent of whom have never been affiliated with the Adviser ("Independent Trustees"), oversee the management of each of the Portfolios and, as required by law, determine annually whether to continue the investment advisory agreement for each Portfolio and the subadvisory agreements for the three Portfolios that utilize subadvisers.
In connection with their most recent consideration of those agreements for each of the Portfolios, the Trustees received and reviewed a substantial amount of information provided by Janus Capital (the "Adviser") and the respective subadvisers in response to requests of the Independent Trustees and their independent legal counsel. They also received and reviewed a considerable amount of information and analysis provided to the Trustees by their independent fee consultant. Throughout their consideration of the agreements the Independent Trustees were advised by their independent legal counsel. The Independent Trustees met on two separate occasions with management to consider the agreements, and at each of those meetings they also met separately in executive session with their independent legal counsel.
At a meeting held on December 20, 2006, based on their evaluation of the information provided by the Adviser, the subadvisers and the independent fee consultant and other information, the Trustees determined that the overall arrangements between each Portfolio and the Adviser were fair and reasonable in light of the nature, extent and quality of the services provided by the Adviser, its affiliates and the subadvisers, the fees charged for those services, and other matters that the Trustees considered relevant in the exercise of their business judgment. At that meeting all of the Trustees unanimously approved the continuation of the investment advisory agreement for each Portfolio, and the subadvisory agreement for each subadvised Portfolio, for the period from February 1, 2007 through February 1, 2008, subject to earlier termination as provided in each agreement.
In considering the continuation of those agreements, the Trustees reviewed and analyzed various factors that they determined were relevant, including the factors described below, none of which by itself was considered dispositive. However, the material factors and conclusions that formed basis for the Trustees' determination to approve the continuation of the agreements are discussed separately below.
Nature, Extent and Quality of Services
The Trustees reviewed the nature, extent and quality of the services of Janus Capital and the subadvisers to the Funds, taking into account the investment objective and strategy of each Portfolio and the knowledge the Trustees gained from their regular meetings with management on at least a quarterly basis and their ongoing review of information related to the Funds. In addition, the Trustees reviewed the resources and key personnel of Janus Capital and each subadviser, especially those who provide investment management services to the Portfolios. The Trustees also considered other services provided to the Portfolios by Janus Capital or the subadvisers, such as managing the execution of portfolio transactions and the selection of broker-dealers for those transactions, serving as the Portfolios' administrator, monitoring adherence to the Portfolios' investment restrictions, producing shareholder reports, providing support services for the Tru stees and Trustee committees, communicating with shareholders and overseeing the activities of other service providers, including monitoring compliance with various policies and procedures of the Portfolios and with applicable securities laws and regulations.
24 Janus Aspen Series December 31, 2006
The Trustees concluded that: the nature, extent and quality of the services provided by Janus Capital or the subadviser to each Portfolio were appropriate and consistent with the terms of the respective advisory and subadvisory agreements; that, taking into account steps taken to address a small portion of the Portfolios whose performance lagged that of their peers for certain periods, the quality of those services had been consistent with or superior to quality norms in the industry; and that the Portfolios were likely to benefit from the continued provision of those services. They also concluded that each of Janus Capital and each subadviser had sufficient personnel, with the appropriate education and experience, to serve the Portfolios effectively and had demonstrated its continuing ability to attract and retain well-qualified personnel.
Performance of the Funds
The Trustees considered the performance results of each Portfolio over various time periods. They reviewed information comparing each Portfolio's performance with the performance of comparable funds and peer groups identified by Lipper Inc., an independent provider of investment company data, and with the Portfolio's benchmark. They concluded that the performance of most Portfolios was good to very good. Although the performance of some Portfolios lagged that of their peers for certain periods, the Trustees also concluded that Janus Capital had taken appropriate steps to address those instances of under-performance and that the more recent performance of most of those Portfolios had been improving.
Costs of Services Provided
The Trustees examined information on the fees and expenses of each Portfolio in comparison to similar information for other comparable funds as provided by Lipper. They also reviewed an analysis of that information provided by their independent fee consultant and noted that the rate of management (investment advisory and administrative) fees for most of the Portfolios, after contractual expense limitations, was below the mean management fee rate of the respective peer group of funds selected by Lipper.
The Trustees considered the methodology used by Janus Capital and each subadviser in determining compensation payable to portfolio managers, the competitive environment for investment management talent and the competitive market for mutual funds in different distribution channels. They concluded that the compensation methodology provided a good alignment of the interests of the portfolio managers with the interests of Portfolio shareholders.
The Trustees also reviewed management fees charged by Janus Capital to its separate account clients and to its subadvised funds (for which Janus Capital provides only portfolio management services). Although in most instances subadvisory and separate account fee rates for various investment strategies were lower than management fees for Portfolios having a similar strategy, the Trustees noted that Janus Capital performs significant additional services for the Portfolios that it does not provide to those other clients, including administrative services, oversight of the Portfolios' other service providers, trustee support, regulatory compliance and numerous other services, and that, in serving the Portfolios, Janus Capital assumes many legal risks that it does not assume in servicing its other clients. Moreover, they noted that the spread between the average fees charged to the Portfolios and the fees that Janus Capital charged to its separat e account clients was significantly smaller than the average spread for such fees of other advisers, based on publicly available data and research conducted by their independent fee consultant.
In considering the fees charged by Janus Capital, the Trustees had previously negotiated with Janus Capital a temporary contingent waiver of a portion the investment advisory fee paid by Janus Aspen Worldwide Growth Portfolio to Janus Capital to provide for a possible reduction in the rate of advisory fee payable by the Portfolio for the period July 1, 2006 through January 31, 2007 if the investment performance of the Fund should lag that of its benchmark performance over the applicable performance measurement period. Commencing in February 2007, the previously approved performance-based fee schedule will become operative.
The Trustees reviewed information on the profitability of Janus Capital and its affiliates of their relationships with each Portfolio, as well as an explanation of the methodology utilized in allocating various expenses among the Portfolios and other clients. The Trustees also reviewed the financial statements of Janus Capital's parent company and its corporate structure. In their review, the Trustees considered whether Janus Capital and each subadviser receive adequate incentives to manage the Portfolios effectively. The Trustees recognized that profitability comparisons among fund managers are difficult because very little comparative information is publicly available and profitability of any manager is affected by numerous factors, including the organizational structure of the particular manager, the types of funds and other accounts it manages, possible other lines
Janus Aspen Series December 31, 2006 25
Additional Information (unaudited) (continued)
of business, the methodology for allocating expenses and the manager's capital structure and cost of capital. However, based on the information available and taking those factors into account, the Trustees concluded that Janus Capital's profitability with respect to each Portfolio in relation to the services rendered was not unreasonable.
The Trustees concluded that the management fees and other compensation payable by each Fund to Janus Capital and its affiliates, as well as the fees paid by Janus Capital to the subadvisers of subadvised Portfolios, were reasonable in relation to the nature and quality of the services provided, taking into account the fees charged by other advisers for managing comparable mutual funds with similar strategies and the fees Janus Capital and the subadviser charges to other clients. The Trustees also concluded that the overall expense ratio of each Portfolio was reasonable, taking into account the size of the Portfolio, the quality of services provided by Janus Capital and any subadviser, the investment performance of the Portfolio and any expense limitations agreed to by Janus Capital.
Economies of Scale
The Trustees considered information about the potential for Janus Capital to realize economies of scale as the assets of the Portfolios increase. They noted that, although most Portfolios pay advisory fees at a fixed rate as a percentage of net assets, without any breakpoints, the management fee paid by each Portfolio, after any contractual expense limitations, was below the mean management fee rate of the Portfolio's peer group selected by Lipper; and, for those Portfolios whose expenses are being reduced by the contractual expense limitations of Janus Capital, Janus Capital is subsidizing the Portfolios because they have not reached adequate scale. Moreover, as the assets of many of the Portfolios have declined in the past few years, the Portfolios have benefited from having advisory fee rates that have remained constant rather than increasing as assets decline. In addition, performance fee structures have been implemented for several Port folios that will cause the effective rate of advisory fees payable by such a Portfolio to vary depending on the investment performance of the Portfolio relative to its benchmark; and a few Portfolios have fee schedules with breakpoints and reduced fee rates above certain asset levels. The Trustees also noted that the Portfolios share directly in economies of scale through lower charges of third-party service providers based on the combined scale of all of the Portfolios. Based on all of the information they reviewed, the Trustees concluded that the current fee structure of each Portfolio was reasonable and that the current rates of fees do reflect a sharing between Janus Capital and the Portfolio of economies of scale at the current asset level of the Portfolio.
Other Benefits to Janus Capital
The Trustees also considered benefits that accrue to Janus Capital and its affiliates from their relationships with the Portfolios. They recognized that two affiliates of Janus Capital separately serve the Portfolios as transfer agent and distributor, respectively, and that the transfer agent receives compensation from the non-money market Portfolios for services provided. The Trustees also considered Janus Capital's use of commissions paid by Portfolios on their portfolio brokerage transactions to obtain proprietary research products and services benefiting the Portfolios and/or other clients of Janus Capital, as well as Janus Capital's agreement not to use any Portfolio's brokerage transactions to obtain third party research products or services. The Trustees concluded that Janus Capital's use of "soft" commission dollars to obtain proprietary research products and services was consistent with regulatory requirements and guidelines and was likely to benefit each Portfolio. The Trustees also concluded that, other than the services provided by Janus Capital and its affiliates pursuant to the agreements and the fees to be paid by each Portfolio therefor, the Portfolios and Janus Capital may potentially benefit from their relationship with each other in other ways. They concluded that Janus Capital benefits from the receipt of proprietary research products and services acquired through commissions paid on portfolio transactions of the Portfolios and that the Portfolios benefit from Janus Capital's receipt of those products and services as well as research products and services acquired through commissions paid by other clients of Janus Capital. They further concluded that success of any Portfolio could attract other business to Janus Capital or other Janus Funds and that the success of Janus Capital could enhance Janus Capital's ability to serve the Portfolios.
After full consideration of the above factors as well as other factors, all of the Trustees, including all of the Independent Trustees, concluded that the proposed continuation of the investment advisory agreement for each applicable Portfolio were in the best interest of the respective Portfolios and their shareholders.
26 Janus Aspen Series December 31, 2006
Explanations of Charts, Tables and
Financial Statements (unaudited)
1. PERFORMANCE OVERVIEWS
The performance overview graph compares the performance of a hypothetical $10,000 investment in the Portfolio with one or more widely used market indices. The hypothetical example does not represent the returns of any particular investment.
When comparing the performance of the Portfolio with an index, keep in mind that market indices do not include brokerage commissions that would be incurred if you purchased the individual securities in the index. They also do not include taxes payable on dividends and interest or operating expenses incurred if you maintained a Portfolio invested in the index.
Average annual total returns are quoted for each class of the Portfolio. Average annual total return is calculated by taking the growth or decline in value of an investment over a period of time, including reinvestment of any dividends, distributions and capital gains then calculating the annual compounded percentage rate that would have produced the same result had the rate of growth been constant throughout the period. Average annual total return does not reflect the deduction of taxes that a shareholder would pay on Portfolio distributions or redemptions of Portfolio shares.
2. SCHEDULE OF INVESTMENTS
Following the performance overview section is the Portfolio's Schedule of Investments. This schedule reports the industry concentrations and types of securities held in the Portfolio on the last day of the reporting period. Securities are usually listed by type (common stock, corporate bonds, U.S. Government obligations, etc.) and by industry classification (banking, communications, insurance, etc.). Holdings are subject to change without notice.
The value of each security is quoted as of the last day of the reporting period. The value of securities denominated in foreign currencies is converted into U.S. dollars. Certain short-term investments maturing within 60 days are valued at amortized cost, which approximates market value.
A summary of investments by country is provided if the Portfolio invested in foreign securities. This summary reports the Portfolio's exposure to different countries by providing the percentage of securities invested in each country. The country of each security represents the country in which the company is incorporated.
2A. FORWARD CURRENCY CONTRACTS
A table listing forward currency contracts follows the Portfolio's Schedule of Investments (if applicable). Forward currency contracts are agreements to deliver or receive a preset amount of currency at a future date. Forward currency contracts are used to hedge against foreign currency risk in the Portfolio's long-term holdings. The table provides the name of the foreign currency, the settlement date of the contract, the amount of the contract, the value of the currency in U.S. dollars and the amount of unrealized gain or loss. The amount of unrealized gain or loss reflects the change in currency exchange rates from the time the contract was opened to the last day of the reporting period.
2B. FUTURES
A table listing futures contracts follows the Portfolio's Schedule of Investments (if applicable). Futures contracts are contracts that obligate the buyer to receive and the seller to deliver an instrument or money at a specified price on a specified date. Futures are used to hedge against adverse movements in securities prices, currency risk or interest rates.
The table provides the name of the contract, number of contracts held, the expiration date, the principal amount, value and the amount of unrealized gain or loss. The amount of unrealized gain or loss reflects the marked-to-market amount for the last day of the reporting period.
3. STATEMENT OF ASSETS AND LIABILITIES
This statement is often referred to as the "balance sheet." It lists the assets and liabilities of the Portfolio on the last day of the reporting period.
The Portfolio's assets are calculated by adding the value of the securities owned, the receivable for securities sold but not yet settled, the receivable for dividends declared but not yet received on stocks owned and the receivable for Portfolio shares sold to investors but not yet settled. The Portfolio's liabilities include payables for securities purchased but not yet settled, Portfolio shares redeemed but not yet paid and expenses owed but not yet paid. Additionally, there may be other assets and liabilities such as unrealized gain or loss on forward currency contracts.
The section entitled "Net Assets Consist of" breaks down the components of the Portfolio's net assets. Because the Portfolio must distribute substantially all earnings, you will notice that a significant portion of net assets is shareholder capital.
The last section of this statement reports the net asset value ("NAV") per share on the last day of the reporting period for each class of the Portfolio. The NAV is calculated by dividing the Portfolio's net assets (assets minus liabilities) by the number of shares outstanding.
4. STATEMENT OF OPERATIONS
This statement details the Portfolio's income, expenses, gains and losses on securities and currency transactions, and appreciation or depreciation of current Portfolio holdings.
Janus Aspen Series December 31, 2006 27
Explanations of Charts, Tables and
Financial Statements (unaudited) (continued)
The first section in this statement, entitled "Investment Income," reports the dividends earned from stocks and interest earned from interest-bearing securities in the Portfolio.
The next section reports the expenses and expense offsets incurred by the Portfolio, including the advisory fee paid to the investment adviser and transfer agent fees and expenses, and printing and postage for mailing statements, financial reports and prospectuses. Expense offsets, if any, are also shown.
The last section lists the increase or decrease in the value of securities held in the Portfolio. The Portfolio realizes a gain (or loss) when it sells its position in a particular security. An unrealized gain (or loss) refers to the change in net appreciation or depreciation of the Portfolio during the reporting period. "Net Realized and Unrealized Gain/(Loss) on Investments" is affected both by changes in the market value of Portfolio holdings and by gains (or losses) realized during the reporting period.
5. STATEMENT OF CHANGES IN NET ASSETS
This statement reports the increase or decrease in the Portfolio's net assets during the reporting period. Changes in the Portfolio's net assets are attributable to investment operations, dividends, distributions and capital share transactions. This is important to investors because it shows exactly what caused the Portfolio's net asset size to change during the period.
The first section summarizes the information from the Statement of Operations regarding changes in net assets due to the Portfolio's investment performance. The Portfolio's net assets may also change as a result of dividend and capital gains distributions to investors. If investors receive their dividends in cash, money is taken out of the Portfolio to pay the distribution. If investors reinvest their dividends, the Portfolio's net assets will not be affected. If you compare the Portfolio's "Net Decrease from Dividends and Distributions" to the "Reinvested dividends and distributions," you will notice that dividend distributions had little effect on the Portfolio's net assets. This is because the majority of Janus investors reinvest their distributions.
The reinvestment of dividends is included under "Capital Share Transactions." "Capital Shares" refers to the money investors contribute to the Portfolio through purchases or withdraw via redemptions. The "Redemption Fees" refers to the fee paid to the Portfolio for shares held for three months or less by a shareholder. The Portfolio's net assets will increase and decrease in value as investors purchase and redeem shares from the Portfolio.
6. FINANCIAL HIGHLIGHTS
This schedule provides a per-share breakdown of the components that affect the Portfolio's NAV for current and past reporting periods for each class of the Portfolio. Not only does this table provide you with total return, it also reports total distributions, asset size, expense ratios and portfolio turnover rate.
The first line in the table reflects the NAV per share at the beginning of the reporting period. The next line reports the net investment income per share, which comprises dividends and interest income earned on securities held by the Portfolio. Following is the total of gains/(losses), realized and unrealized. Dividends and distributions are then subtracted to arrive at the NAV per share at the end of the period. The next line reflects the average annual total return reported the last day of the period.
Also included are the expense ratios, or the percentage of net assets that are used to cover operating expenses during the period. Expense ratios vary for a number of reasons, including the differences in management fees, the average shareholder account size and the extent of foreign investments, which entail greater transaction costs.
The Portfolio's expenses may be reduced through expense reduction arrangements. These arrangements may include the use of balance credits or transfer agent fee offsets. The Statement of Operations reflects total expenses before any such offset, the amount of offset and the net expenses. The expense ratios listed in the Financial Highlights reflect total expenses prior to any expense offsets (gross expense ratio) and after the expense offsets (net expense ratio). Both expense ratios reflect expenses after waivers (reimbursements), if applicable.
The ratio of net investment income/(loss) summarizes the income earned less expenses, divided by the average net assets of the Portfolio during the reporting period. Don't confuse this ratio with the Portfolio's yield. The net investment income ratio is not a true measure of the Portfolio's yield because it doesn't take into account the dividends distributed to the Portfolio's investors.
The next ratio is the portfolio turnover rate, which measures the buying and selling activity in a Portfolio. Portfolio turnover is affected by market conditions, changes in the asset size of a Portfolio, the nature of the Portfolio's investments and the investment style of the portfolio manager. A 100% rate implies that an amount equal to the value of the entire portfolio is turned over in a year; a 50% rate means that an amount equal to the value of half the portfolio is traded in a year; and a 200% rate means that an amount equal to the value of the portfolio is traded every six months.
28 Janus Aspen Series December 31, 2006
Designation Requirements (unaudited)
For federal income tax purposes, the Portfolio designated the following for the year ended December 31, 2006:
Dividends Received Deduction Percentage
| Portfolio | |||||||
| Janus Aspen Worldwide Growth Portfolio | 23 | % | |||||
Janus Aspen Series December 31, 2006 29
Trustees and Officers (unaudited)
The Portfolio's Statement of Additional Information includes additional information about the Trustees and officers and is available, without charge, by calling 1-800-525-0020.
The following are the Trustees and officers of the Trust, together with a brief description of their principal occupations during the last five years (principal occupations for certain Trustees may include periods over five years).
Each Trustee has served in that capacity since he or she was originally elected or appointed. The Trustees do not serve a specified term of office. Each Trustee will hold office until the termination of the Trust or his or her earlier death, resignation, retirement, incapacity or removal. The retirement age for Trustees is 72. The Portfolio's Nominating and Governance Committee will consider nominees for the position of Trustee recommended by shareholders. Shareholders may submit the name of a candidate for consideration by the Committee by submitting their recommendations to the Trust's Secretary. Each Trustee is currently a Trustee of two other registered investment companies advised by Janus Capital: Janus Investment Fund and Janus Adviser Series. As of the date of this report, collectively, these three registered investment companies consist of 69 series or funds.
The Trust's officers are elected annually by the Trustees for a one-year term. Certain officers also serve as officers of Janus Investment Fund and Janus Adviser Series. Certain officers of the Portfolio may also be officers and/or directors of Janus Capital. Portfolio officers receive no compensation from the Portfolio, except for the Portfolio's Chief Compliance Officer, as authorized by the Trustees.
Trustees
| Name, Age and Address | Positions Held with Portfolio | Length of Time Served | Principal Occupations During the Past Five Years | Number of Portfolios in Fund Complex Overseen by Trustee | Other Directorships Held by Trustee | ||||||||||||||||||
| Independent Trustees | |||||||||||||||||||||||
| Dennis B. Mullen 151 Detroit Street Denver, CO 80206 Age 63 | Chairman Trustee | 3/04-Present 9/93-Present | Chief Executive Officer of Red Robin Gourmet Burgers, Inc. (since 2005). Formerly, private investor. | 69 | * | Chairman of the Board (since 2005) and Director of Red Robin Gourmet Burgers, Inc.; and Director of Janus Capital Funds Plc (Dublin-based, non-U.S. funds). | |||||||||||||||||
| Jerome S. Contro 151 Detroit Street Denver, CO 80206 Age 50 | Trustee | 12/05-Present | Partner of Tango Group, a private investment firm (since 1999). | 69 | Trustee and Chairman of RS Investment Trust (since 2001); Director of IZZE Beverages and MyFamily.com, Inc. (genealogical research website). | ||||||||||||||||||
| William F. McCalpin 151 Detroit Street Denver, CO 80206 Age 49 | Trustee | 6/02-Present | Private Investor. Formerly, Vice President of Asian Cultural Council and Executive Vice President and Chief Operating Officer of The Rockefeller Brothers Fund (a private family foundation). | 69 | Director of the F.B. Heron Foundation (a private grantmaking foundation). | ||||||||||||||||||
| John W. McCarter, Jr. 151 Detroit Street Denver, CO 80206 Age 68 | Trustee | 6/02-Present | President and Chief Executive Officer of The Field Museum of Natural History (Chicago, IL). | 69 | Chairman of the Board and Director of Divergence Inc. (biotechnology firm); Director of W.W. Grainger, Inc. (industrial distributor); and Trustee of WTTW (Chicago public television station) and the University of Chicago. | ||||||||||||||||||
30 Janus Aspen Series December 31, 2006
Trustees (cont.)
| Name, Age and Address | Positions Held with Portfolio | Length of Time Served | Principal Occupations During the Past Five Years | Number of Portfolios in Fund Complex Overseen by Trustee | Other Directorships Held by Trustee | ||||||||||||||||||
| Independent Trustees (cont.) | |||||||||||||||||||||||
| James T. Rothe 151 Detroit Street Denver, CO 80206 Age 63 | Trustee | 1/97-Present | Co-founder and Managing Director of Roaring Fork Capital Management, LLC (private investment in public equity firm); and Professor Emeritus of Business of the University of Colorado, Colorado Springs, CO (since 2004). Formerly, Professor of Business of the University of Colorado (2002-2004); and Distinguished Visiting Professor of Business (2001-2002) of Thunderbird University (American Graduate School of International Management), Glendale, AZ. | 69 | Director of Red Robin Gourmet Burgers, Inc. | ||||||||||||||||||
| William D. Stewart 151 Detroit Street Denver, CO 80206 Age 62 | Trustee | 9/93-Present | Corporate Vice President and General Manager of MKS Instruments – HPS Products, Boulder, CO (a manufacturer of vacuum fittings and valves). | 69 | N/A | ||||||||||||||||||
| Martin H. Waldinger 151 Detroit Street Denver, CO 80206 Age 68 | Trustee | 9/93-Present | Private Investor and Consultant to California Planned Unit Developments. Formerly, CEO and President of Marwal, Inc. (homeowner association management company). | 69 | N/A | ||||||||||||||||||
| Linda S. Wolf 151 Detroit Street Denver, CO 80206 Age 59 | Trustee | 12/05-Present | Retired. Formerly, Chairman and Chief Executive Officer of Leo Burnett (Worldwide) (advertising agency) (2001-2005). | 69 | Director of Wal-Mart, The Field Museum of Natural History (Chicago, IL), Children's Memorial Hospital (Chicago, IL), Chicago Council on Foreign Relations, Economic Club of Chicago, and InnerWorkings (a provider of print procurement solutions). | ||||||||||||||||||
| Interested Trustee | |||||||||||||||||||||||
| Thomas H. Bailey** 151 Detroit Street Denver, CO 80206 Age 69 | Trustee | 5/93-Present | Retired. Formerly, President (1978-2002) and Chief Executive Officer (1994-2002) of Janus Capital or Janus Capital Corporation; Chairman and Director (1978-2002) of Janus Capital Corporation; President and Director (1994-2002) of The Janus Foundation. | 69 | N/A | ||||||||||||||||||
* Mr. Mullen also serves as director of Janus Capital Funds Plc, consisting of 22 funds. Including Janus Capital Funds Plc and the 69 funds comprising the Janus Funds, Mr. Mullen oversees 91 funds.
** The Portfolio is treating Mr. Bailey as an "interested person" of the Trust by virtue of his past positions and continuing relationships with Janus Capital and ownership of shares of Janus Capital's parent company.
Janus Aspen Series December 31, 2006 31
Trustees and Officers (unaudited) (continued)
Officers
| Name, Age and Address | Positions Held with Portfolio | Term of Office* and Length of Time Served | Principal Occupations During the Past Five Years | ||||||||||||
| Jason P. Yee 151 Detroit Street Denver, CO 80206 Age 37 | Executive Vice President and Portfolio Manager Janus Aspen Worldwide Growth Portfolio | 7/04-Present | Vice President of Janus Capital and Portfolio Manager for other Janus accounts. | ||||||||||||
| Stephanie Grauerholz-Lofton 151 Detroit Street Denver, CO 80206 Age 36 | Chief Legal Counsel and Secretary Vice President | 1/06-Present 03/06 - Present | Assistant Vice President of Janus Capital and Janus Distributors LLC; and Associate Counsel of Janus Capital. Formerly, Associate of Vedder, Price, Kaufman & Kammholz, P.C. (1999-2003). | ||||||||||||
| Kelley Abbott Howes 151 Detroit Street Denver, CO 80206 Age 41 | President and Chief Executive Officer | 1/06-Present | President of Janus Services LLC; Senior Vice President and General Counsel of Janus Capital; and Senior Vice President and Assistant General Counsel of Janus Distributors LLC. Formerly, Vice President (1999-2005) of Janus Distributors LLC; Senior Vice President and General Counsel (2004-2006), Vice President (2000-2004), and Assistant General Counsel (2002-2004) of Janus Services LLC; and Vice President and Assistant General Counsel (1999-2004) of Janus Capital. | ||||||||||||
| David R. Kowalski 151 Detroit Street Denver, CO 80206 Age 49 | Vice President and Chief Compliance Officer | 6/02-Present | Senior Vice President and Chief Compliance Officer of Janus Capital, Janus Distributors LLC, and Janus Services LLC; Chief Compliance Officer of Bay Isle Financial LLC; and Vice President of Enhanced Investment Technologies LLC. Formerly, Chief Compliance Officer of Enhanced Investment Technologies, LLC (2003-2005); Vice President of Janus Capital (2000-2005), Janus Distributors LLC (2000-2001), and Janus Services LLC (2004-2005); and Assistant Vice President of Janus Services LLC (2002-2004). | ||||||||||||
| Jesper Nergaard 151 Detroit Street Denver, CO 80206 Age 44 | Chief Financial Officer Vice President, Treasurer, and Principal Accounting Officer | 3/05-Present 2/05-Present | Vice President of Janus Capital. Formerly, Director of Financial Reporting for OppenheimerFunds, Inc. (2004-2005); Site Manager and First Vice President of Mellon Global Securities Services (2003); and Director of Fund Accounting, Project Development, and Training of INVESCO Funds Group (1994-2003). | ||||||||||||
* Officers are elected at least annually for a one-year term and may also be elected from time to time by the Trustees for an interim period.
32 Janus Aspen Series December 31, 2006
Notes
Janus Aspen Series December 31, 2006 33
Janus provides access to a wide range of investment disciplines.
Growth
Janus growth portfolios focus on companies believed to be the leaders in their respective industries, with solid management teams, expanding market share, margins and efficiencies.
Core
Janus core portfolios seek investments in more stable and predictable companies. These portfolios look for a strategic combination of steady growth and for certain portfolios, some degree of income.
Risk-Managed
Our risk-managed portfolios seek to outperform their respective indices while maintaining a risk profile equal to or lower than the index itself. Managed by INTECH (a Janus subsidiary), these portfolios use a mathematical process in an attempt to build a more "efficient" portfolio than the index.
Value
Janus value portfolios invest in companies they believe are poised for a turnaround or are trading at a significant discount to fair value. The goal is to gain unique insight into a company's true value and identify and evaluate potential catalysts that may unlock shareholder value.
International & Global
Janus international and global portfolios seek to leverage Janus' research capabilities by taking advantage of inefficiencies in foreign markets, where accurate information and analytical insight are often at a premium.
Bond & Money Market
Janus bond portfolios attempt to provide less risk relative to equities while seeking to deliver a competitive total return through high current income and appreciation. Janus money market portfolios seek maximum current income consistent with stability of capital.
For more information about our funds, contact your investment professional or go to www.janus.com/info
Please consider the charges, risks, expenses and investment objectives carefully before investing. For a prospectus containing this and other information, please call Janus at 1-800-525-0020 or download the file from www.janus.com/info. Read it carefully before you invest or send money.
An investment in a money market portfolio is not insured or guaranteed by the Federal Deposit Insurance Corporation or any other government agency. Although the Portfolio seeks to preserve the value of your investment at $1.00 per share, it is possible to lose money by investing in the Portfolio.

151 Detroit Street
Denver, CO 80206
1-800-525-0020
Portfolio distributed by Janus Distributors LLC (1/07)
C-0207-169 109-02-703 01-07
Item 2 - Code of Ethics
As of the end of the period covered by this Form N-CSR, the Registrant has adopted a Code of Ethics (as defined in Item 2(b) of Form N-CSR), which is posted on the Registrant’s website: www.janus.com. Registrant intends to post any amendments to, or waivers from (as defined in Item 2 of Form N-CSR), such code on www.janus.com within five business days following the date of such amendment or waiver.
Item 3 - Audit Committee Financial Expert
Janus Aspen Series’ Board of Trustees has determined that the following members of Janus Aspen Series’ Audit Committee are “audit committee financial experts,” as defined in Item 3 to Form N-CSR: Jerome S. Contro (Chairman), John W. McCarter, Jr. and Dennis B. Mullen who are all “independent” under the standards set forth in Item 3 to Form N-CSR.
Item 4 - Principal Accountant Fees and Services
The following table shows the amount of fees that PricewaterhouseCoopers LLP (“Auditor”), Janus Aspen Series’ (the “Fund”) auditor, billed to the Fund during the Fund’s last two fiscal years. For the reporting periods, the Audit Committee approved in advance all audit services and non-audit services that Auditor provided to the Fund, except for those non-audit services that were subject to the pre-approval exception under Rule 2-01 of Regulation S-X (the “pre-approval exception”). The pre-approval exception for services provided directly to the Fund waives the pre-approval requirement for services other than audit, review or attest services if: (A) the aggregate amount of all such services provided constitutes no more than 5% of the total amount of revenues paid by the Fund to Auditor during the fiscal year in which the services are provided; (B) the Fund did not recognize the services as non-audit services at the time of the engagement; and (C) the services are promptly brought to the Audit Committee’s attention, and the Committee (or its delegate) approves the services before the audit is completed.
Services that the Fund’s Auditor Billed to the Fund
Fiscal Year Ended |
| Audit Fees |
| Audit-Related |
| Tax Fees |
| All Other Fees |
| ||||
December 31 |
| Billed to Fund |
| Fees Billed to Fund |
| Billed to Fund |
| Billed to Fund |
| ||||
|
|
|
|
|
|
|
|
|
| ||||
2006 |
| $ | 229,449 |
| $ | 3,000 |
| $ | 106,221 |
| $ | 0 |
|
|
|
|
|
|
|
|
|
|
| ||||
Percentage approved pursuant to pre-approval exception |
| 0 | % | 0 | % | 0 | % | 0 | % | ||||
|
|
|
|
|
|
|
|
|
| ||||
2005 |
| $ | 218,348 |
| $ | 0 |
| $ | 77,140 |
| $ | 0 |
|
|
|
|
|
|
|
|
|
|
| ||||
Percentage approved pursuant to pre-approval exception |
| 0 | % | 0 | % | 0 | % | 0 | % | ||||
The above “Audit Fees” were billed for amounts related to the audit of the Fund’s financial statements and services normally provided by the accountant in connection with statutory and regulatory filings. The above “Audit-Related Fees” were billed for amounts related to proxy statement review. The above “Tax Fees” were billed for amounts related to
tax compliance, tax planning, and tax advice and corporate actions review.
Services that the Fund’s Auditor Billed to the Adviser and
Affiliated Fund Service Providers
The following table shows the amount of fees billed by Auditor to Janus Capital Management LLC (the “Adviser”), and any entity controlling, controlled by or under common control with the Adviser (“Control Affiliate”) that provides ongoing services to the Fund (“Affiliated Fund Service Provider”), for engagements directly related to the Fund’s operations and financial reporting, during the Fund’s last two fiscal years.
The table also shows the percentage of fees, if any, subject to the pre-approval exception. The pre-approval exception for services provided to Adviser and any Affiliated Fund Service Provider (other than audit, review or attest services) waives the pre-approval requirement if: (A) the aggregate amount of all such services provided constitutes no more than 5% of the total amount of revenues paid to Auditor by the Fund, the Adviser and Affiliated Fund Service Providers during the fiscal year in which the services are provided that would have to be pre-approved by the Audit Committee; (B) the Fund did not recognize the services as non-audit at the time of the engagement; and (C) the services are promptly brought to the Audit Committee’s attention, and the Committee (or its delegate) approves the services before the Fund’s audit is completed.
|
| Audit-Related |
|
|
| All Other Fees |
| |||
|
| Fees Billed to |
| Tax Fees Billed to |
| Billed to Adviser |
| |||
|
| Adviser and |
| Adviser and |
| and Affiliated |
| |||
Fiscal Year Ended |
| Affiliated Fund |
| Affiliated Fund |
| Fund Service |
| |||
December 31 |
| Service Providers |
| Service Providers |
| Providers |
| |||
|
|
|
|
|
|
|
| |||
2006 |
| $ | 129,901 |
| $ | 0 |
| $ | 0 |
|
|
|
|
|
|
|
|
| |||
Percentage approved pursuant to pre-approval exception |
| 0 | % | 0 | % | 0 | % | |||
|
|
|
|
|
|
|
| |||
2005 |
| $ | 100,888 |
| $ | 6,620 |
| $ | 62,714 |
|
|
|
|
|
|
|
|
| |||
Percentage approved pursuant to pre-approval exception |
| 0 | % | 0 | % | 0 | % | |||
The above “Audit-Related Fees” were billed for amounts related to semi-annual financial statement disclosure review and internal control examination. The above “Tax Fees” were billed for amounts related to tax advice related to requests for ruling or technical advice from taxing authorities. “All Other Fees” were billed for amounts related to the due diligence related to market timing allegations, interfund lending program and proxy statement review.
Non-Audit Services
The following table shows the amount of fees that Auditor billed during the Fund’s last two fiscal years for non-audit services. The Audit Committee is required to pre-approve non-audit services that Auditor provides to the Adviser and any Affiliated Fund Service Provider, if the engagement relates directly to the Fund’s operations and financial reporting (except for those subject to the pre-approval exception described above). The Audit Committee requested and received information from Auditor about any non-audit services that Auditor rendered during the Fund’s last fiscal year to the Adviser and any Affiliated Fund Service Provider. The Committee considered this information in evaluating Auditor’s independence.
|
|
|
| Total Non-Audit Fees |
|
|
|
|
| ||||
|
|
|
| billed to Adviser and |
|
|
|
|
| ||||
|
|
|
| Affiliated Fund Service |
| Total Non-Audit |
|
|
| ||||
|
|
|
| Providers (engagements |
| Fees billed to |
|
|
| ||||
|
|
|
| related directly to the |
| Adviser and |
|
|
| ||||
|
| Total |
| operations and |
| Affiliated Fund |
|
|
| ||||
|
| Non-Audit Fees |
| financial reporting of |
| Service Providers |
|
|
| ||||
Fiscal Year Ended |
| Billed to the Fund |
| the Fund) |
| (all other engagements) |
| Total of (A), (B) |
| ||||
December 31 |
| (A) |
| (B) |
| (C) |
| and (C)(1) |
| ||||
|
|
|
|
|
|
|
|
|
| ||||
2006 |
| $ | 0 |
| $ | 0 |
| $ | 0 |
| $ | 0 |
|
|
|
|
|
|
|
|
|
|
| ||||
2005 |
| $ | 0 |
| $ | 40,000 |
| $ | 0 |
| $ | 40,000 |
|
(1). The Audit Committee also considered amounts billed by Auditor to all other Control Affiliates in evaluating Auditor’s independence.
Pre-Approval Policies
The Fund’s Audit Committee Charter requires the Fund’s Audit Committee to pre-approve any engagement of Auditor (i) to provide Audit or Non-Audit Services to the Fund or (ii) to provide non-audit services to Adviser or any Affiliated Fund Service Provider, if the engagement relates directly to the operations and financial reporting of the Fund, except for those non-audit services that were subject to the pre-approval exception under Rule 2-01 of Regulation S-X. The Chairman of the Audit Committee or, if the Chairman is unavailable, another member of the Audit Committee who is an independent Trustee, may grant the pre-approval. All such delegated pre- approvals must be presented to the Audit Committee no later than the next Audit Committee meeting.
Item 5 - | Audit Committee of Listed Registrants |
| Not applicable. |
|
|
Item 6 - | Schedule of Investments |
| Please see Schedule of Investments contained in the Reports to Shareholders included under Item 1 of this Form N-CSR. |
|
|
Item 7 - | Disclosure of Proxy Voting Policies and Procedures for Closed-End Management Investment Companies |
| Not applicable. |
|
|
Item 8 - | Portfolio Managers of Closed-End Management Investment Companies |
| Not applicable. |
|
|
Item 9 - | Purchases of Equity Securities by Closed-End Management Investment Company and Affiliated Purchasers |
| Not applicable. |
|
|
Item 10 - | Submission of Matters to a Vote of Security Holders |
| There have been no material changes to the procedures by which shareholders may recommend nominees to the Registrant’s Board of Directors. |
|
|
Item 11 - | Controls and Procedures |
(a) The Registrant’s Principal Executive Officer and Principal Financial Officer have evaluated the Registrant’s disclosure controls and procedures (as defined in Rule 30a-3(c) under the Investment Company Act of 1940) within 90 days of this filing and have concluded that the Registrant’s disclosure controls and procedures were effective, as of that date.
(b) There was no change in the Registrant’s internal control over financial reporting during Registrant’s second fiscal quarter of the period covered by this report that has materially affected, or is reasonably likely to materially affect, the Registrant’s internal control over financial reporting.
Item 12 - Exhibits
(a)(1) Not applicable because the Registrant has posted its Code of Ethics (as defined in Item 2(b) of Form N-CSR) on its website pursuant to paragraph (f)(2) of Item 2 of Form N-CSR.
(a)(2) Separate certifications for the Registrant’s Principal Executive Officer and Principal Financial Officer, as required by Section 302 of the Sarbanes-Oxley Act of 2002 and Rule 30a-2(a) under the Investment Company Act of 1940, are attached as Ex99.CERT.
(b) A certification for the Registrant’s Principal Executive Officer and Principal Financial Officer, as required by Rule 30a-2(b) under the Investment Company Act of 1940, is attached as Ex99.906CERT. The certification furnished pursuant to this paragraph is not deemed to be “filed” for purposes of Section 18 of the Securities Exchange Act of 1934, or otherwise subject to the liability of that section. Such certification is not deemed to be incorporated by reference into any filing under the Securities Act of 1933 or the Securities Exchange Act of 1934, except to the extent that the Registrant specifically incorporates it by reference.
Signatures
Pursuant to the requirements of the Securities Exchange Act of 1934 and the Investment Company Act of 1940, the Registrant has duly caused this report to be signed on its behalf by the undersigned, thereunto duly authorized.
Janus Aspen Series
By: | /s/ Kelley Abbott Howes |
|
| Kelley Abbott Howes, | |
| President and Chief Executive Officer of Janus Aspen Series (Principal | |
| Executive Officer) | |
Date: February 23, 2007
Pursuant to the requirements of the Securities Exchange Act of 1934 and the Investment Company Act of 1940, this report has been signed below by the following persons on behalf of the Registrant and in the capacities and on the dates indicated.
By: | /s/ Kelley Abbott Howes, |
| ||
| Kelley Abbott Howes, | |||
| President and Chief Executive Officer of Janus Aspen Series (Principal | |||
| Executive Officer) | |||
|
| |||
Date: February 23, 2007 |
| |||
|
| |||
By: | /s/ Jesper Nergaard |
| ||
| Jesper Nergaard, | |||
| Vice President, Chief Financial Officer, Treasurer and Principal | |||
| Accounting Officer of Janus Aspen Series (Principal Accounting | |||
| Officer and Principal Financial Officer) | |||
|
| |||
Date: February 23, 2007 | ||||